🔥 Would you like to save this?
According to the latest Zillow Home Value Index, Montana’s top-tier real estate markets are still riding high. In some towns, home prices have surged by hundreds of thousands over the past decade, driven by outdoor appeal, limited inventory, and a growing influx of out-of-state buyers. This list ranks the 17 most expensive towns across the state as of May 2025, offering a closer look at how values have evolved since 2010—and why these places continue to command a premium, even as market winds shift.
17. Huson – 189% Home Price Increase Since 2011
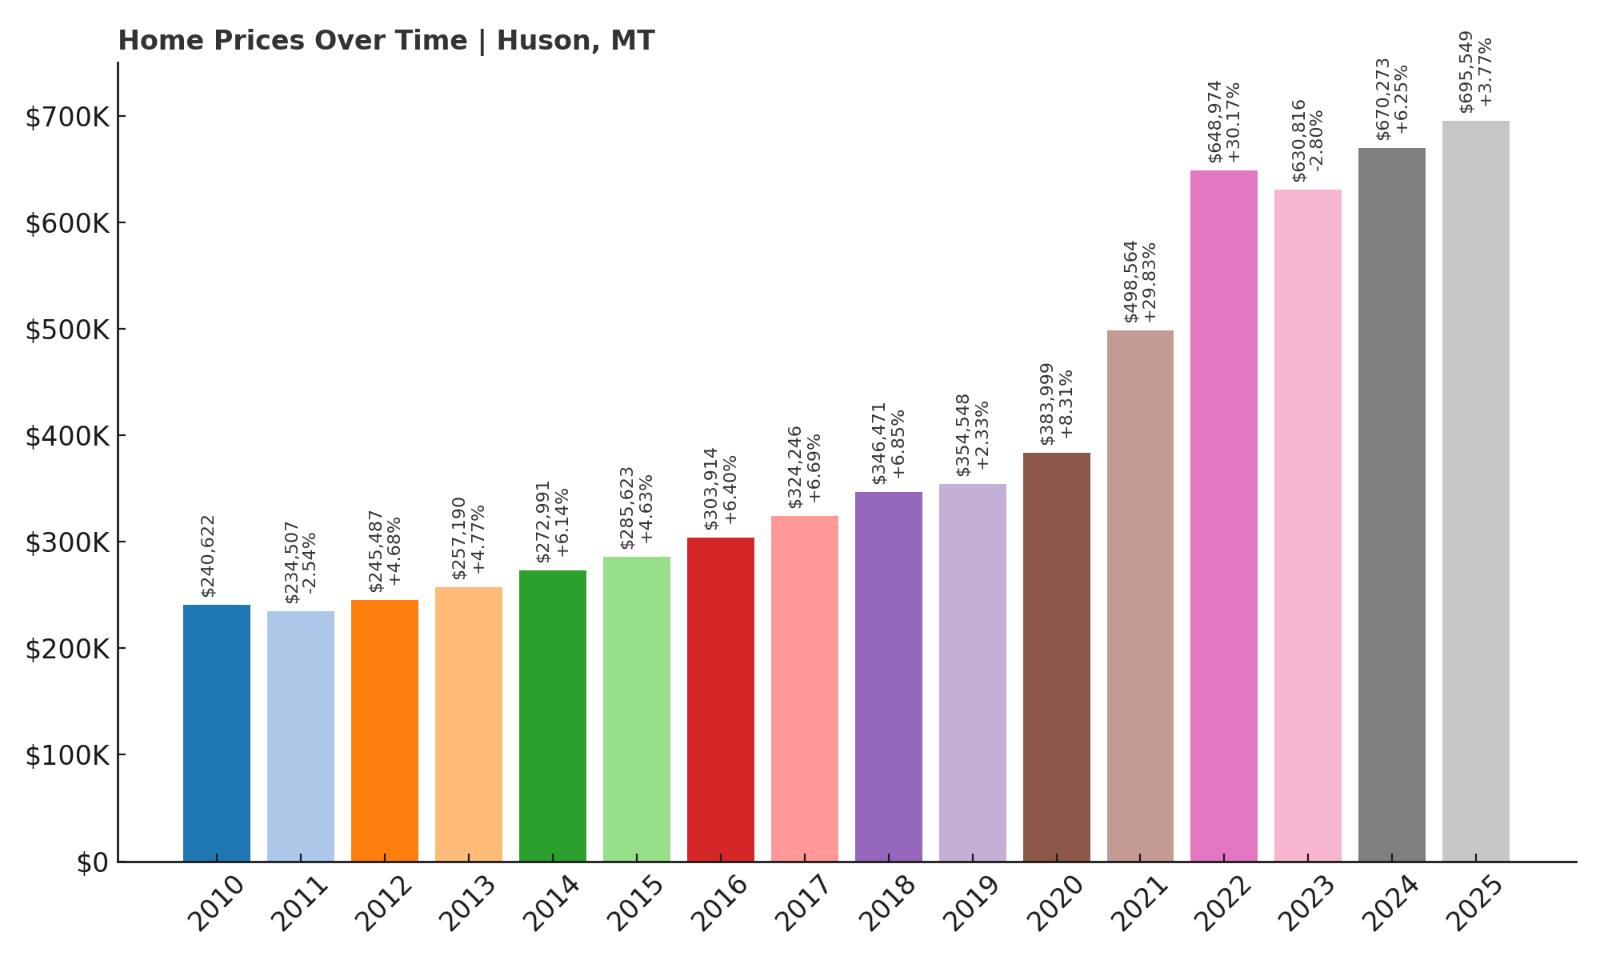
- 2010: $240,622
- 2011: $234,507 ($-6,116, -2.54% from previous year)
- 2012: $245,487 (+$10,980, +4.68% from previous year)
- 2013: $257,190 (+$11,703, +4.77% from previous year)
- 2014: $272,991 (+$15,801, +6.14% from previous year)
- 2015: $285,623 (+$12,632, +4.63% from previous year)
- 2016: $303,914 (+$18,291, +6.40% from previous year)
- 2017: $324,246 (+$20,332, +6.69% from previous year)
- 2018: $346,471 (+$22,225, +6.85% from previous year)
- 2019: $354,548 (+$8,076, +2.33% from previous year)
- 2020: $383,999 (+$29,451, +8.31% from previous year)
- 2021: $498,564 (+$114,566, +29.83% from previous year)
- 2022: $648,974 (+$150,410, +30.17% from previous year)
- 2023: $630,816 ($-18,158, -2.80% from previous year)
- 2024: $670,273 (+$39,457, +6.25% from previous year)
- 2025: $695,549 (+$25,276, +3.77% from previous year)
Huson has seen a striking 189% rise in home prices since 2011, when values dipped to just over $234,000. The surge has been especially sharp in the past five years, with values climbing past $695,000 in 2025. Notable jumps occurred in 2021 and 2022, when home values spiked nearly 30% each year. The slight decline in 2023 was quickly recovered in the following two years. Overall, Huson has shown both resilience and strong long-term appreciation that could appeal to buyers looking for stable, high-value markets.
In order to come up with the very specific design ideas, we create most designs with the assistance of state-of-the-art AI interior design software. Also, assume links that take you off the site are affiliate links such as links to Amazon. this means we may earn a commission if you buy something.
Huson – A Remote Location With Rising Appeal
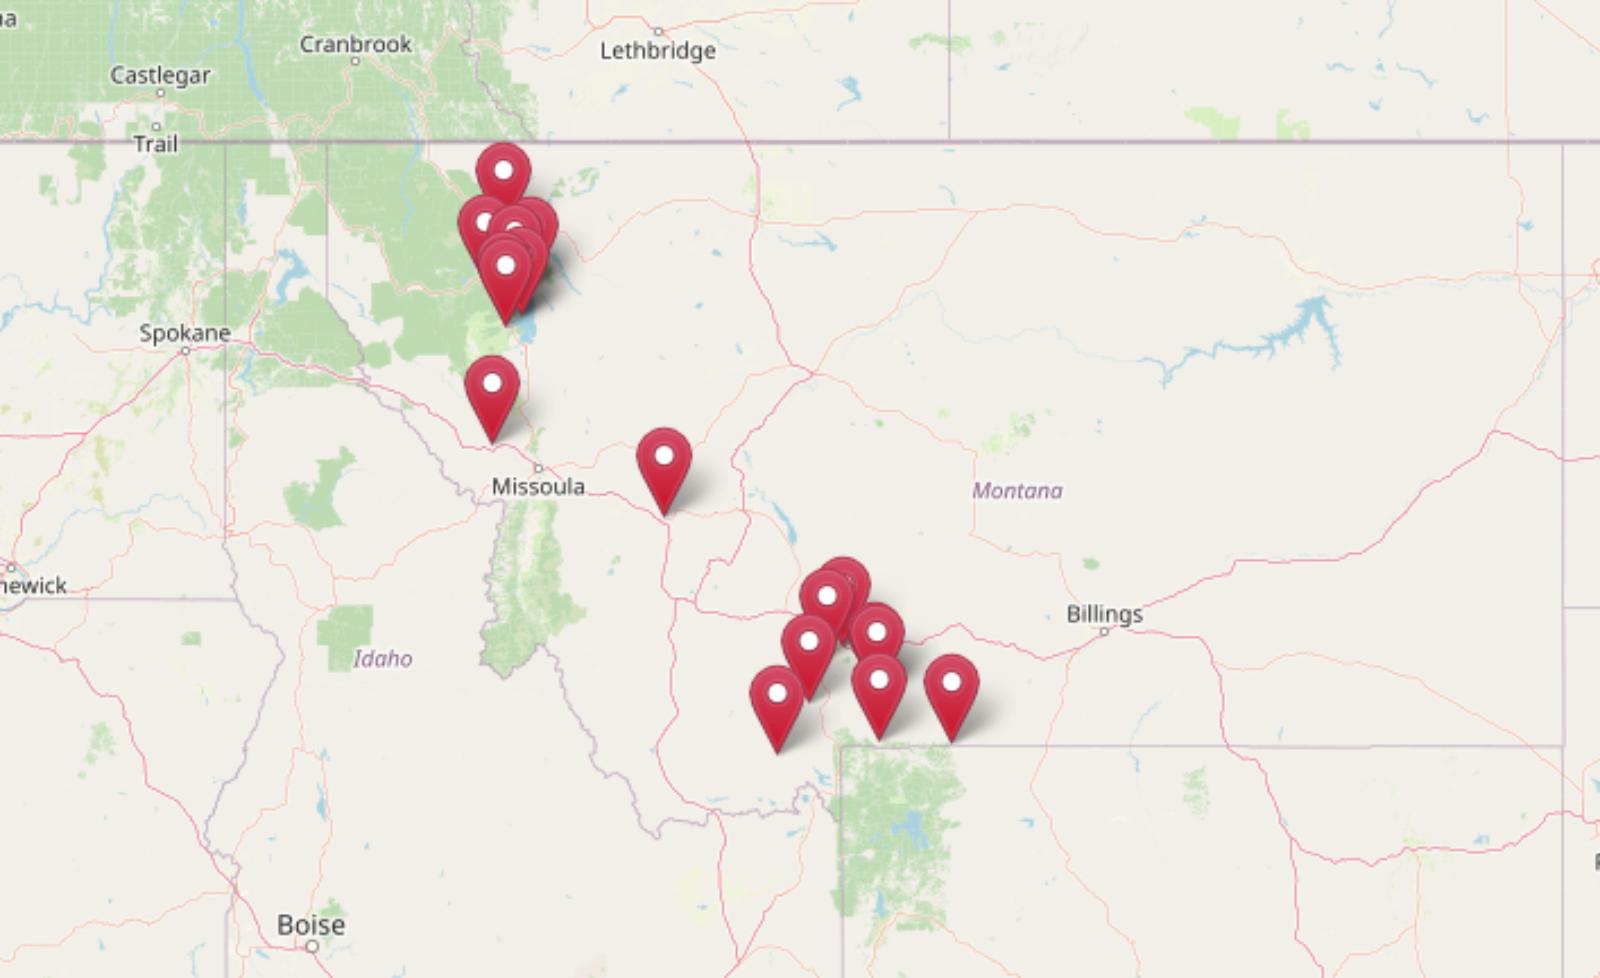
Located about 25 miles west of Missoula, Huson is a quiet, rural town nestled near the northern edge of the Lolo National Forest. Its appeal lies in its scenic surroundings, privacy, and access to outdoor recreation like hiking, fishing, and hunting. Though remote, the area has increasingly drawn interest from homebuyers seeking solitude with proximity to city amenities. The steep price growth reflects increased demand from both retirees and remote workers relocating from more expensive markets.
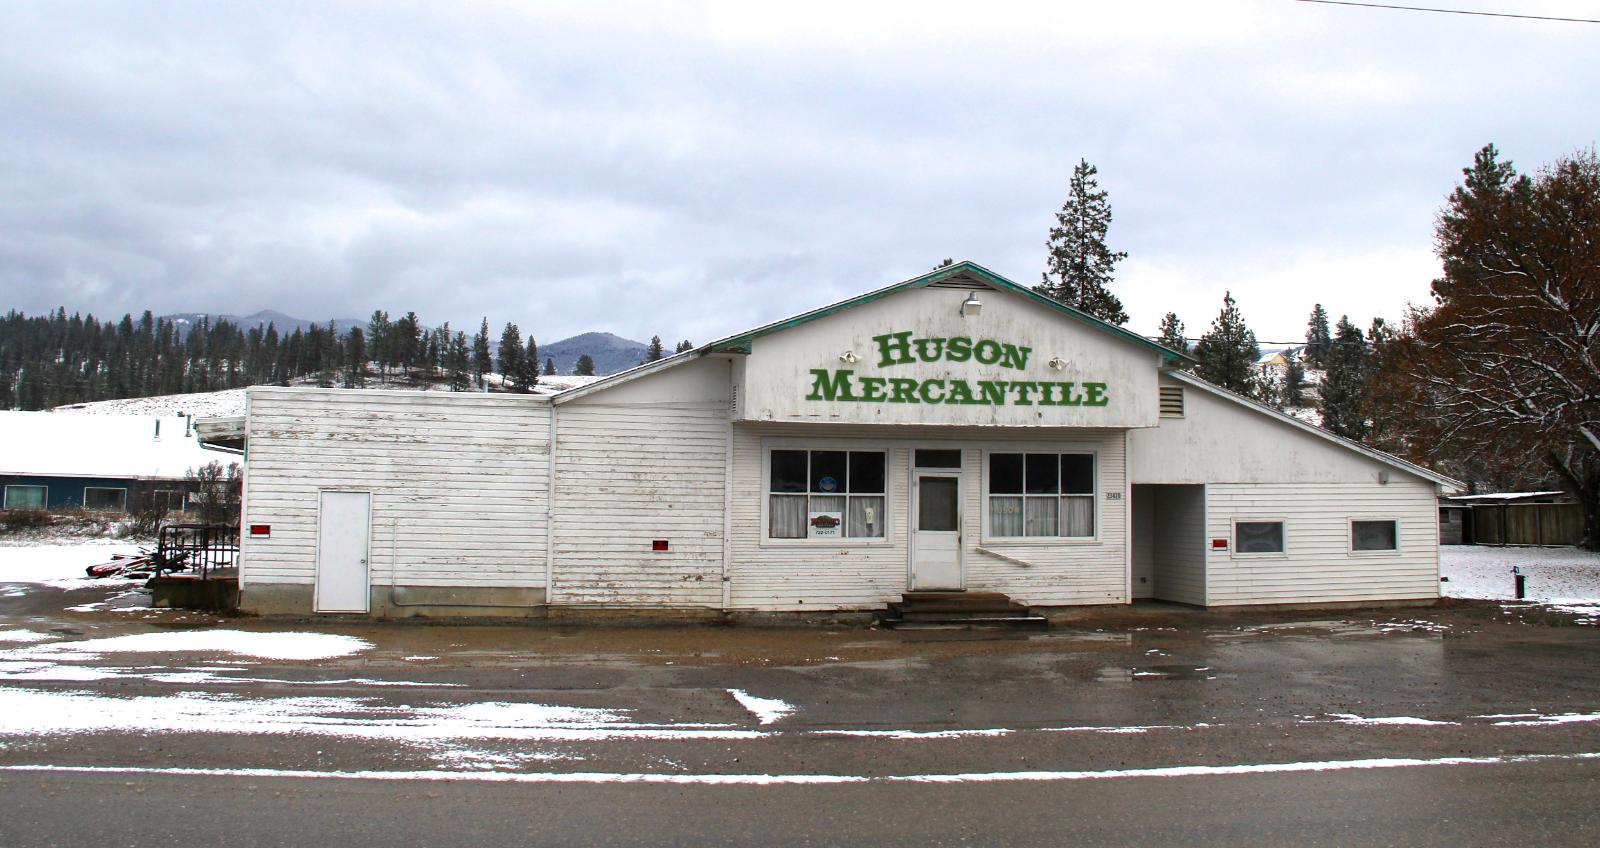
Despite modest infrastructure, Huson’s natural beauty and access to Interstate 90 have made it a desirable retreat. The housing stock is limited, and new construction remains sparse, helping drive up prices as demand outpaces supply. With home values closing in on $700,000, this town continues to gain momentum as a luxury enclave in western Montana.
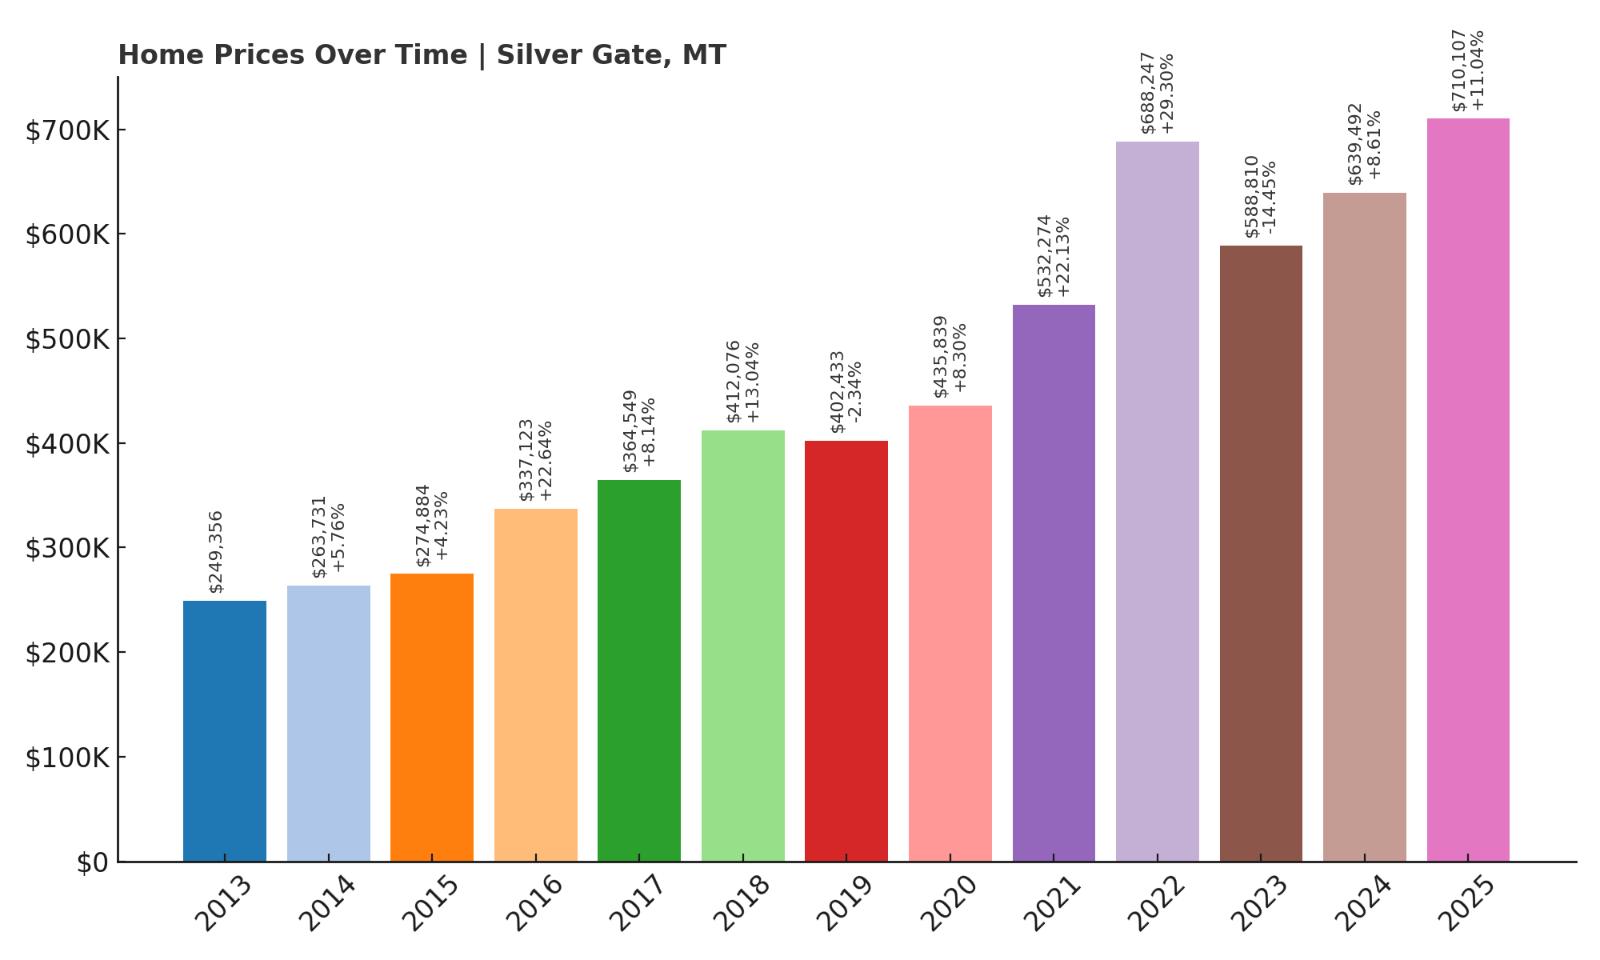
16. Silver Gate – 185% Home Price Increase Since 2013
- 2010: N/A
- 2011: N/A
- 2012: N/A
- 2013: $249,356
- 2014: $263,731 (+$14,375, +5.76% from previous year)
- 2015: $274,884 (+$11,152, +4.23% from previous year)
- 2016: $337,123 (+$62,240, +22.64% from previous year)
- 2017: $364,549 (+$27,426, +8.14% from previous year)
- 2018: $412,076 (+$47,527, +13.04% from previous year)
- 2019: $402,433 ($-9,643, -2.34% from previous year)
- 2020: $435,839 (+$33,406, +8.30% from previous year)
- 2021: $532,274 (+$96,435, +22.13% from previous year)
- 2022: $688,247 (+$155,973, +29.30% from previous year)
- 2023: $588,810 ($-99,437, -14.45% from previous year)
- 2024: $639,492 (+$50,682, +8.61% from previous year)
- 2025: $710,107 (+$70,615, +11.04% from previous year)
Silver Gate home prices have more than doubled since 2013, when values stood just under $250,000. The town reached a peak in 2022 before a sharp 14% drop in 2023. However, that dip appears to have been temporary, as prices rebounded strongly to over $710,000 by 2025. Silver Gate’s market is notably volatile but shows strong long-term appreciation overall, especially considering the town’s seasonal appeal and limited housing stock.
Silver Gate – Gateway to Yellowstone’s Northeast
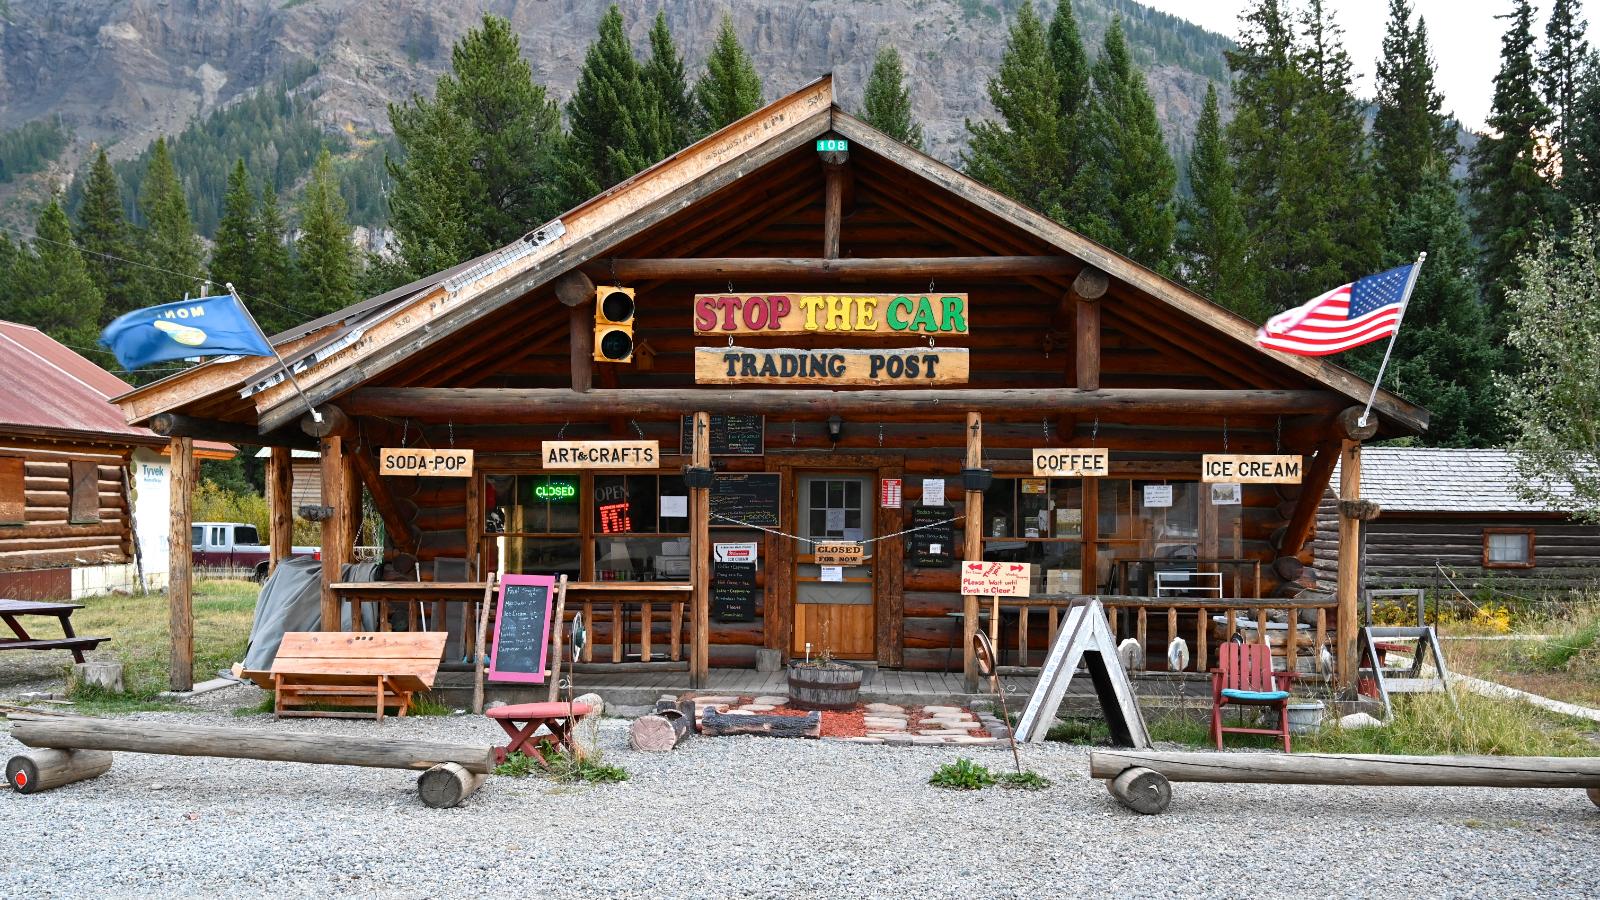
Silver Gate sits just one mile from the northeast entrance of Yellowstone National Park, making it one of the most picturesque and remote communities in Montana. It’s a seasonal town, with tourism peaking in summer and winter months, thanks to nearby hiking, wildlife viewing, and snow sports. The housing market here is influenced heavily by vacation home demand and limited year-round availability.
The steep rise in home prices from 2016 to 2022 was likely driven by post-pandemic remote buying trends and increased interest in vacation rentals. Although the 2023 correction was significant, the town’s proximity to Yellowstone and protected public lands helps support ongoing demand. In 2025, Silver Gate home values are on the upswing again, driven by renewed interest in mountain getaway properties.
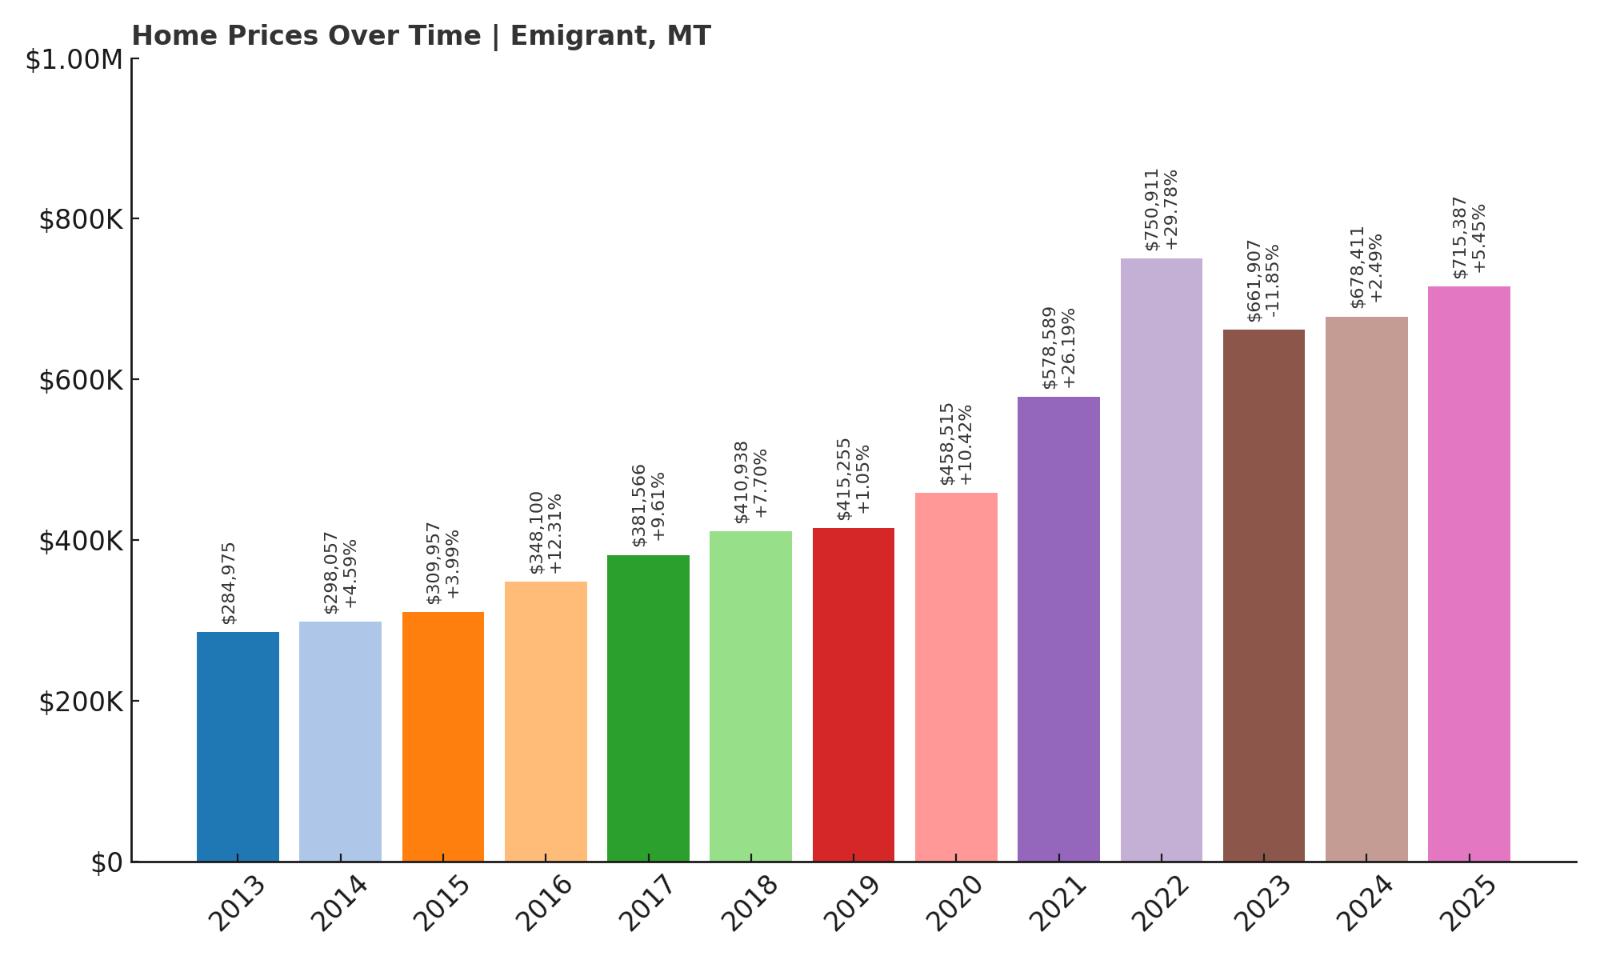
15. Emigrant – 151% Home Price Increase Since 2013
- 2010: N/A
- 2011: N/A
- 2012: N/A
- 2013: $284,975
- 2014: $298,057 (+$13,082, +4.59% from previous year)
- 2015: $309,957 (+$11,900, +3.99% from previous year)
- 2016: $348,100 (+$38,143, +12.31% from previous year)
- 2017: $381,566 (+$33,466, +9.61% from previous year)
- 2018: $410,938 (+$29,372, +7.70% from previous year)
- 2019: $415,255 (+$4,317, +1.05% from previous year)
- 2020: $458,515 (+$43,261, +10.42% from previous year)
- 2021: $578,589 (+$120,073, +26.19% from previous year)
- 2022: $750,911 (+$172,322, +29.78% from previous year)
- 2023: $661,907 ($-89,004, -11.85% from previous year)
- 2024: $678,411 (+$16,503, +2.49% from previous year)
- 2025: $715,387 (+$36,976, +5.45% from previous year)
Emigrant has experienced steady long-term price growth, with values rising over 150% since 2013. The biggest leap came in 2022 when prices jumped nearly 30%, following a major surge the year before. Although 2023 saw a correction, prices are back on the rise, with 2025 values at $715,387. This trend highlights Emigrant’s emerging status as a desirable destination in southwestern Montana.
Emigrant – Paradise Valley’s Rising Star

Set in the scenic Paradise Valley between Livingston and Yellowstone National Park, Emigrant offers some of Montana’s most iconic mountain views. The area draws outdoor enthusiasts and second-home buyers seeking space, solitude, and access to fly-fishing on the Yellowstone River. Despite its small size, the town has seen steady price growth thanks to limited housing inventory and growing regional popularity.
Emigrant’s market cooled briefly in 2023, but demand appears to be rebounding. With proximity to hot springs, local art galleries, and natural beauty, it continues to attract affluent buyers from across the West. The 2025 price tag reflects both scenic premiums and broader trends in Montana’s upmarket rural towns.
14. Kila – 141% Home Price Increase Since 2012
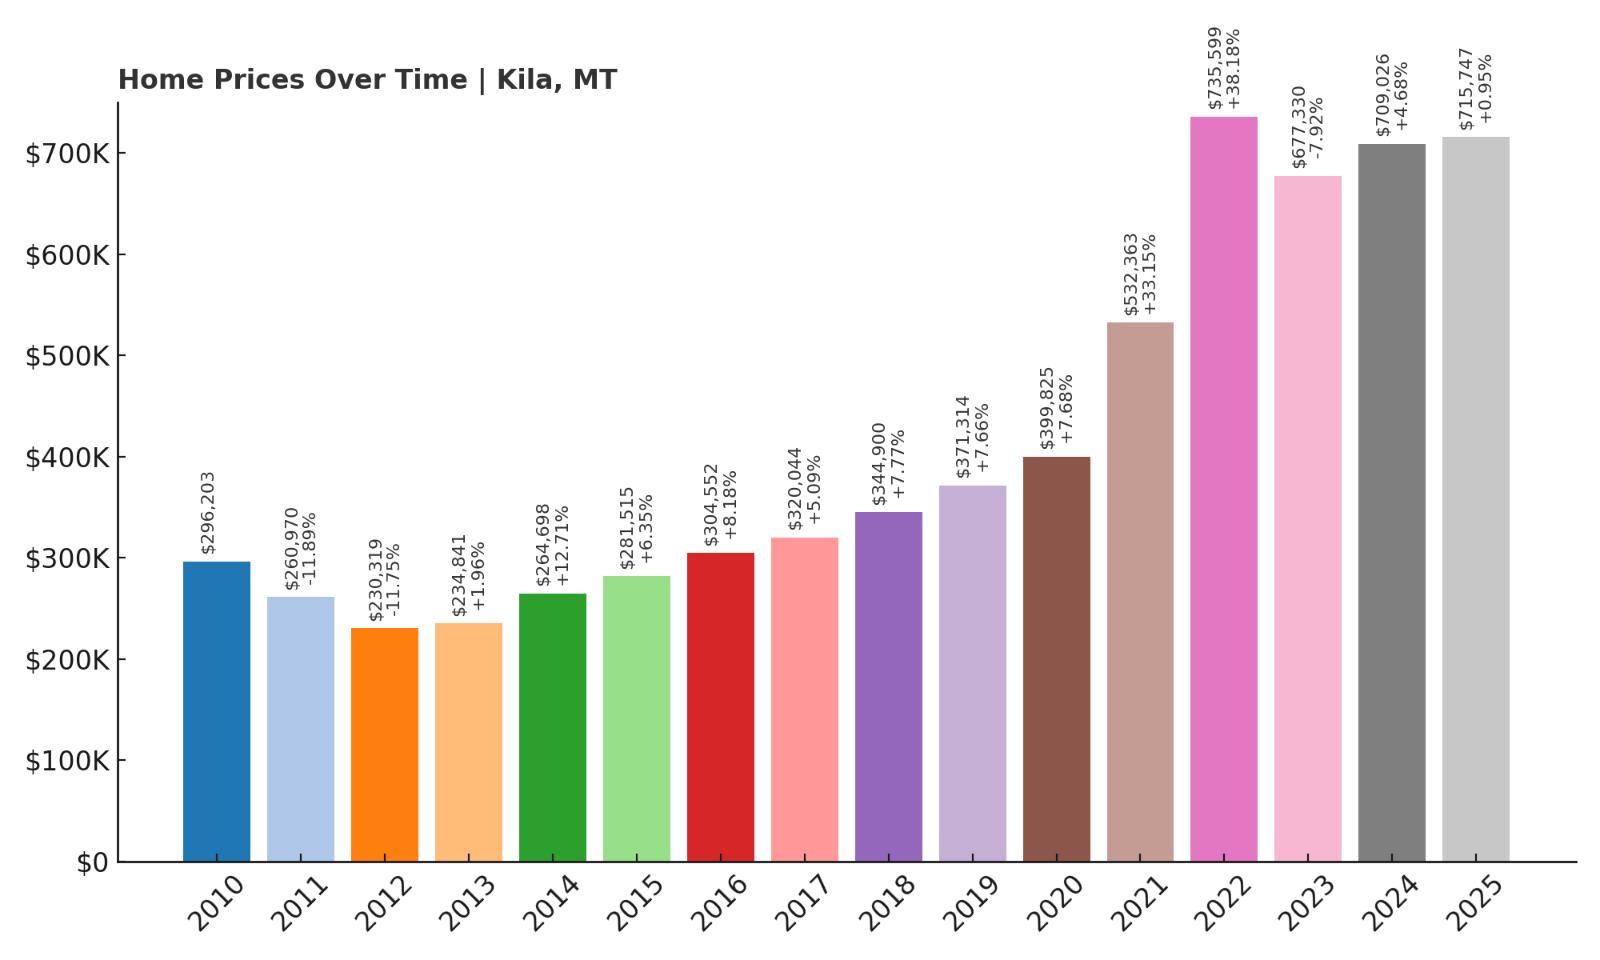
- 2010: $296,203
- 2011: $260,970 ($-35,233, -11.89% from previous year)
- 2012: $230,319 ($-30,651, -11.75% from previous year)
- 2013: $234,841 (+$4,522, +1.96% from previous year)
- 2014: $264,698 (+$29,856, +12.71% from previous year)
- 2015: $281,515 (+$16,817, +6.35% from previous year)
- 2016: $304,552 (+$23,037, +8.18% from previous year)
- 2017: $320,044 (+$15,492, +5.09% from previous year)
- 2018: $344,900 (+$24,856, +7.77% from previous year)
- 2019: $371,314 (+$26,415, +7.66% from previous year)
- 2020: $399,825 (+$28,511, +7.68% from previous year)
- 2021: $532,363 (+$132,538, +33.15% from previous year)
- 2022: $735,599 (+$203,237, +38.18% from previous year)
- 2023: $677,330 ($-58,269, -7.92% from previous year)
- 2024: $709,026 (+$31,696, +4.68% from previous year)
- 2025: $715,747 (+$6,721, +0.95% from previous year)
Kila home values dropped sharply early on but recovered quickly and have grown by over 140% since 2012. The biggest leaps occurred in 2021 and 2022, with home prices increasing more than 70% in just two years. Although there was a dip in 2023, values have since steadied. In 2025, homes in Kila are averaging over $715,000, making it one of the more surprising additions to this high-end list.
Kila – Quiet Living Near Kalispell
Kila is a small, forested town west of Kalispell, offering rural seclusion within driving distance of Flathead Lake and Glacier National Park. It’s become an attractive destination for buyers looking to avoid the higher prices of Kalispell proper while maintaining access to amenities and natural beauty. The area has seen increased investment in recent years, with new builds and land purchases pushing up values.
Despite a cooling period in 2023, demand remains strong among Montanans and out-of-state buyers seeking remote mountain property. Its growth shows how small towns near population centers can benefit from spillover demand and shifting lifestyle priorities post-COVID.
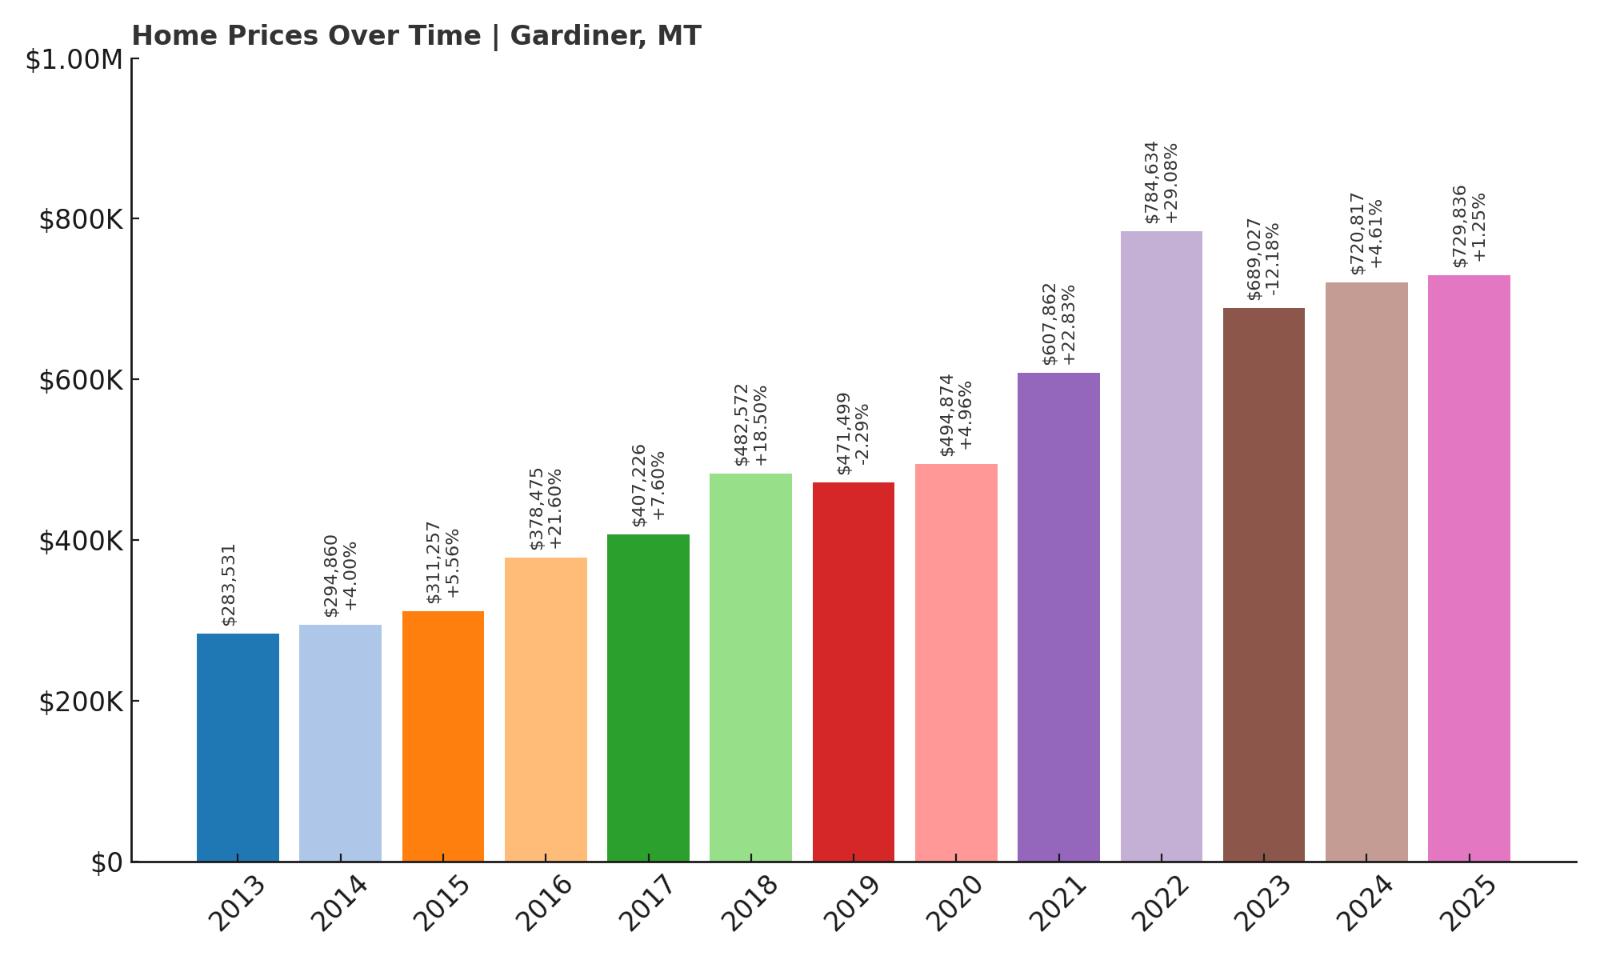
13. Gardiner – 157% Home Price Increase Since 2013
- 2010: N/A
- 2011: N/A
- 2012: N/A
- 2013: $283,531
- 2014: $294,860 (+$11,330, +4.00% from previous year)
- 2015: $311,257 (+$16,396, +5.56% from previous year)
- 2016: $378,475 (+$67,218, +21.60% from previous year)
- 2017: $407,226 (+$28,751, +7.60% from previous year)
- 2018: $482,572 (+$75,346, +18.50% from previous year)
- 2019: $471,499 ($-11,073, -2.29% from previous year)
- 2020: $494,874 (+$23,375, +4.96% from previous year)
- 2021: $607,862 (+$112,987, +22.83% from previous year)
- 2022: $784,634 (+$176,772, +29.08% from previous year)
- 2023: $689,027 ($-95,607, -12.18% from previous year)
- 2024: $720,817 (+$31,790, +4.61% from previous year)
- 2025: $729,836 (+$9,019, +1.25% from previous year)
Gardiner has seen home prices rise by over 150% since 2013. While there was a significant price drop in 2023, values have largely rebounded and are holding strong above $729,000 in 2025. Its market performance underscores how tourism-driven areas can experience steep ups and downs, yet maintain long-term growth.
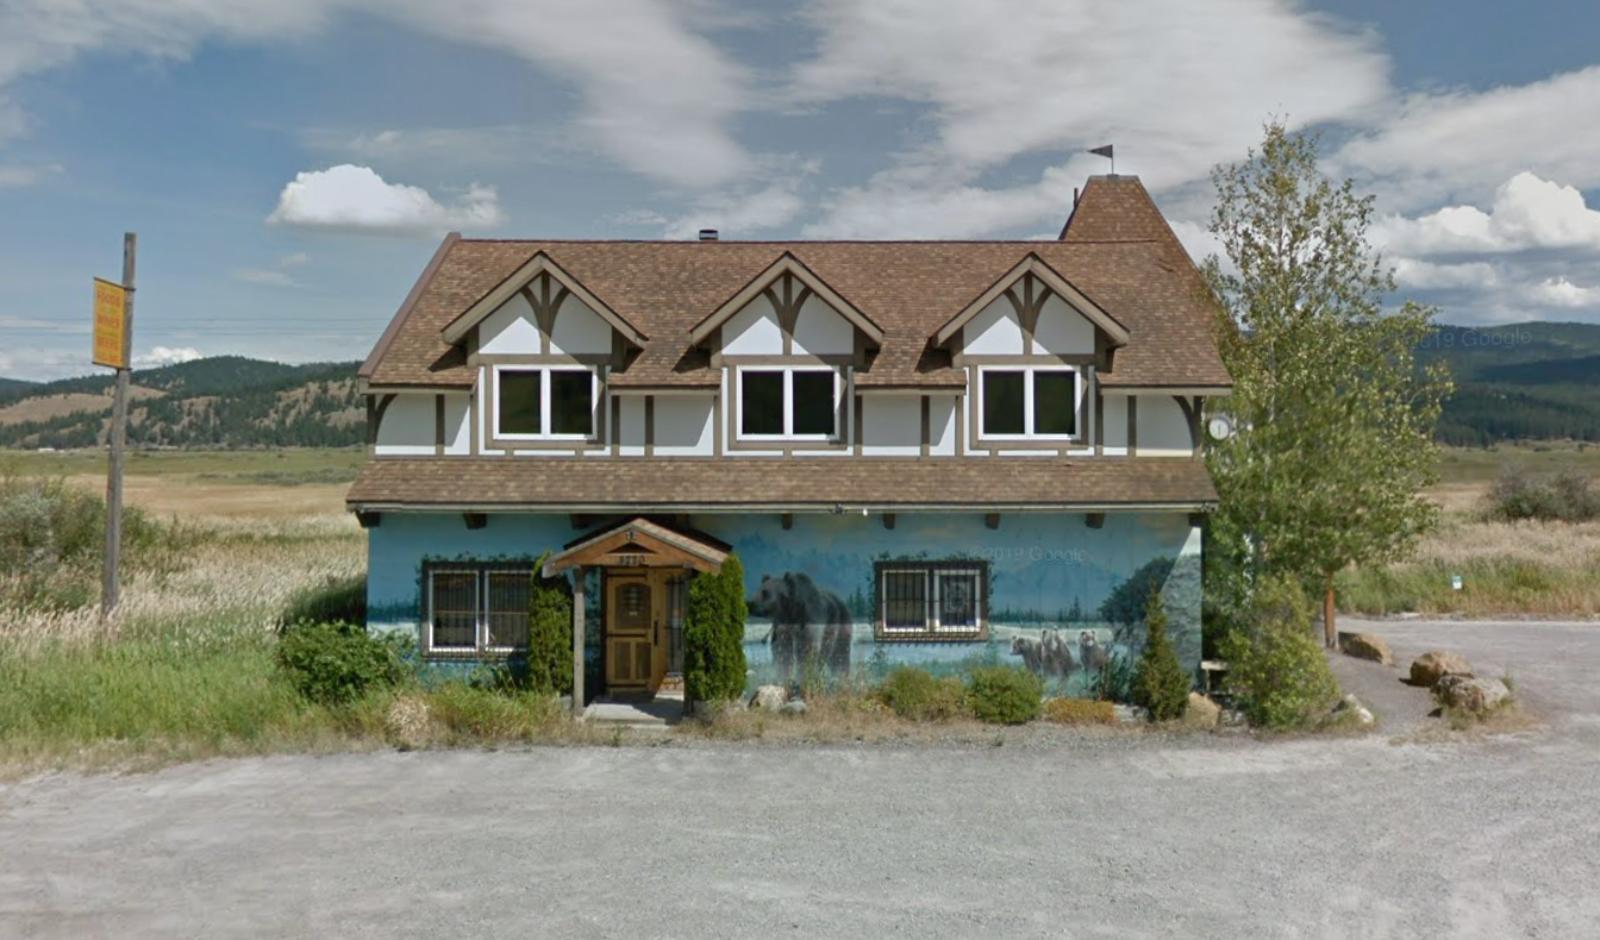
Gardiner – A Tourist Hub at Yellowstone’s Doorstep

Gardiner is famously located at the north entrance to Yellowstone National Park, giving it both scenic and economic advantages. As a year-round tourism hub, the town benefits from consistent rental demand and retail activity. Homes here are often used as vacation rentals, adding pressure to local inventory and pushing prices upward.
The rapid gains seen in 2021 and 2022 reflect heightened investor interest and post-pandemic shifts toward nature-rich living. Although the 2023 price drop was steep, values are already recovering, showing continued confidence in Gardiner’s long-term real estate potential.
12. Bozeman – 183% Home Price Increase Since 2011
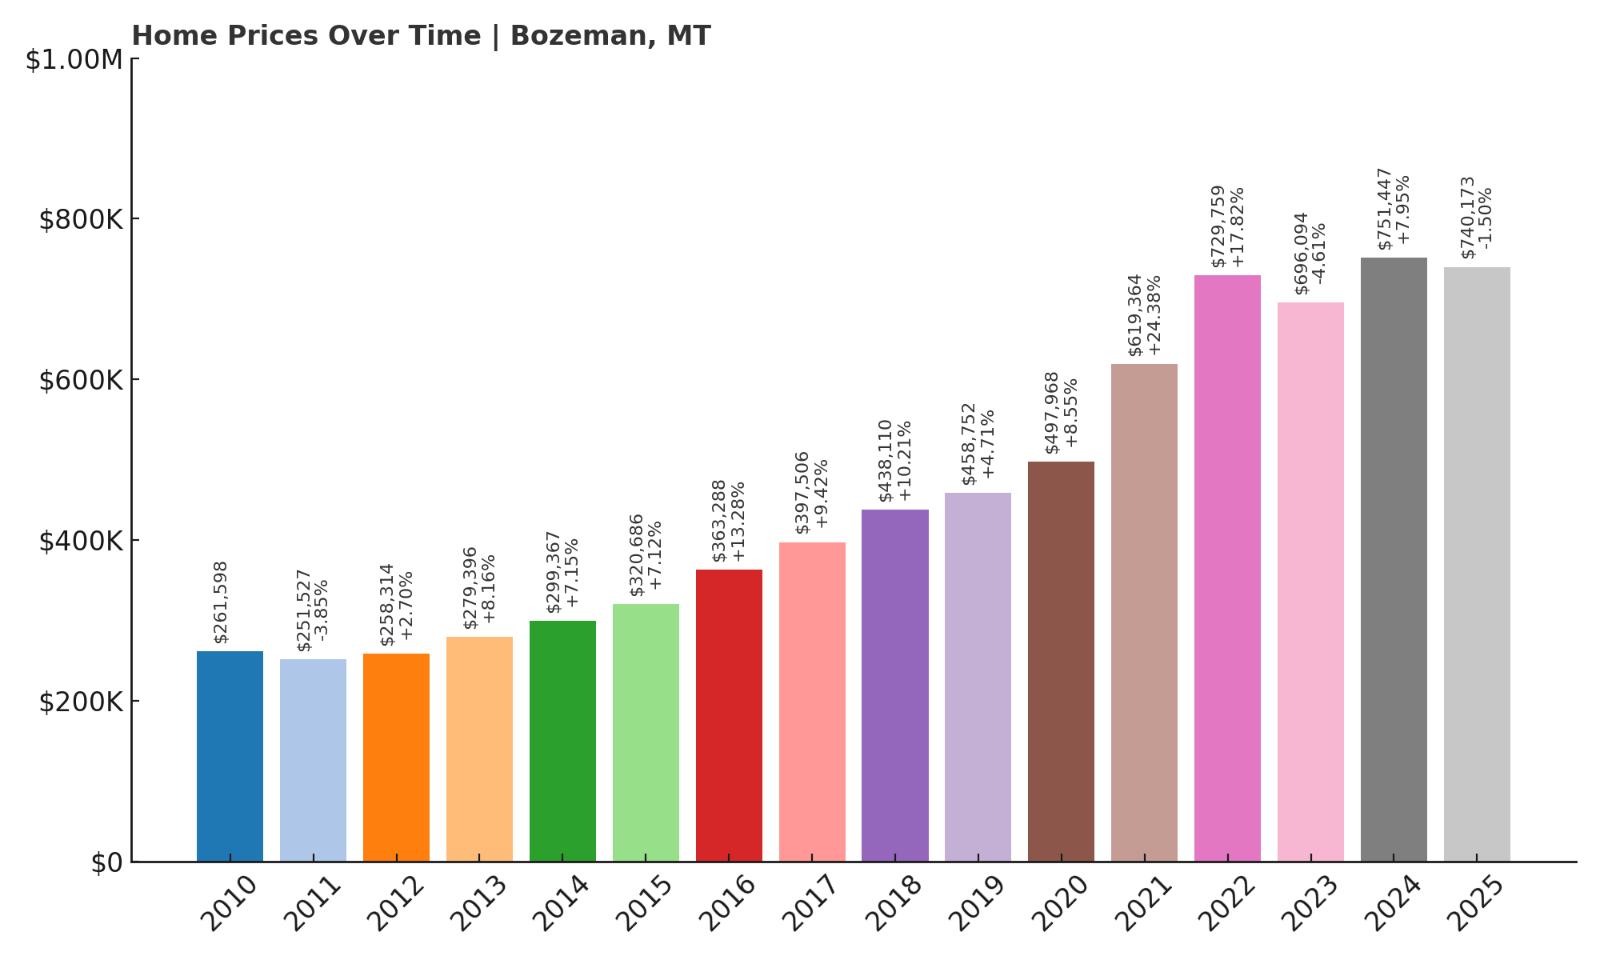
- 2010: $261,598
- 2011: $251,527 ($-10,071, -3.85% from previous year)
- 2012: $258,314 (+$6,787, +2.70% from previous year)
- 2013: $279,396 (+$21,082, +8.16% from previous year)
- 2014: $299,367 (+$19,971, +7.15% from previous year)
- 2015: $320,686 (+$21,319, +7.12% from previous year)
- 2016: $363,288 (+$42,602, +13.28% from previous year)
- 2017: $397,506 (+$34,217, +9.42% from previous year)
- 2018: $438,110 (+$40,605, +10.21% from previous year)
- 2019: $458,752 (+$20,642, +4.71% from previous year)
- 2020: $497,968 (+$39,216, +8.55% from previous year)
- 2021: $619,364 (+$121,396, +24.38% from previous year)
- 2022: $729,759 (+$110,395, +17.82% from previous year)
- 2023: $696,094 ($-33,665, -4.61% from previous year)
- 2024: $751,447 (+$55,353, +7.95% from previous year)
- 2025: $740,173 ($-11,274, -1.50% from previous year)
Bozeman has seen an impressive 183% increase in home values since 2011. The climb has been steady with particularly sharp gains in 2021 and 2022. After a brief dip in 2023, values rebounded, showing strong momentum into 2024 before leveling slightly in 2025. At over $740,000, Bozeman remains one of Montana’s most competitive housing markets.
Bozeman – Montana’s Fastest Growing City

Bozeman has rapidly transformed from a small college town into a bustling economic and cultural hub. Home to Montana State University and a growing tech sector, the city attracts a mix of students, professionals, and remote workers. Its vibrant downtown, airport access, and proximity to skiing and Yellowstone National Park have driven sustained demand.
With new developments pushing outwards and limited space within the city core, housing prices have surged in response. Bozeman’s blend of outdoor access and job opportunities makes it one of Montana’s most dynamic—and expensive—real estate markets. While prices cooled slightly in 2023 and 2025, long-term demand remains strong.
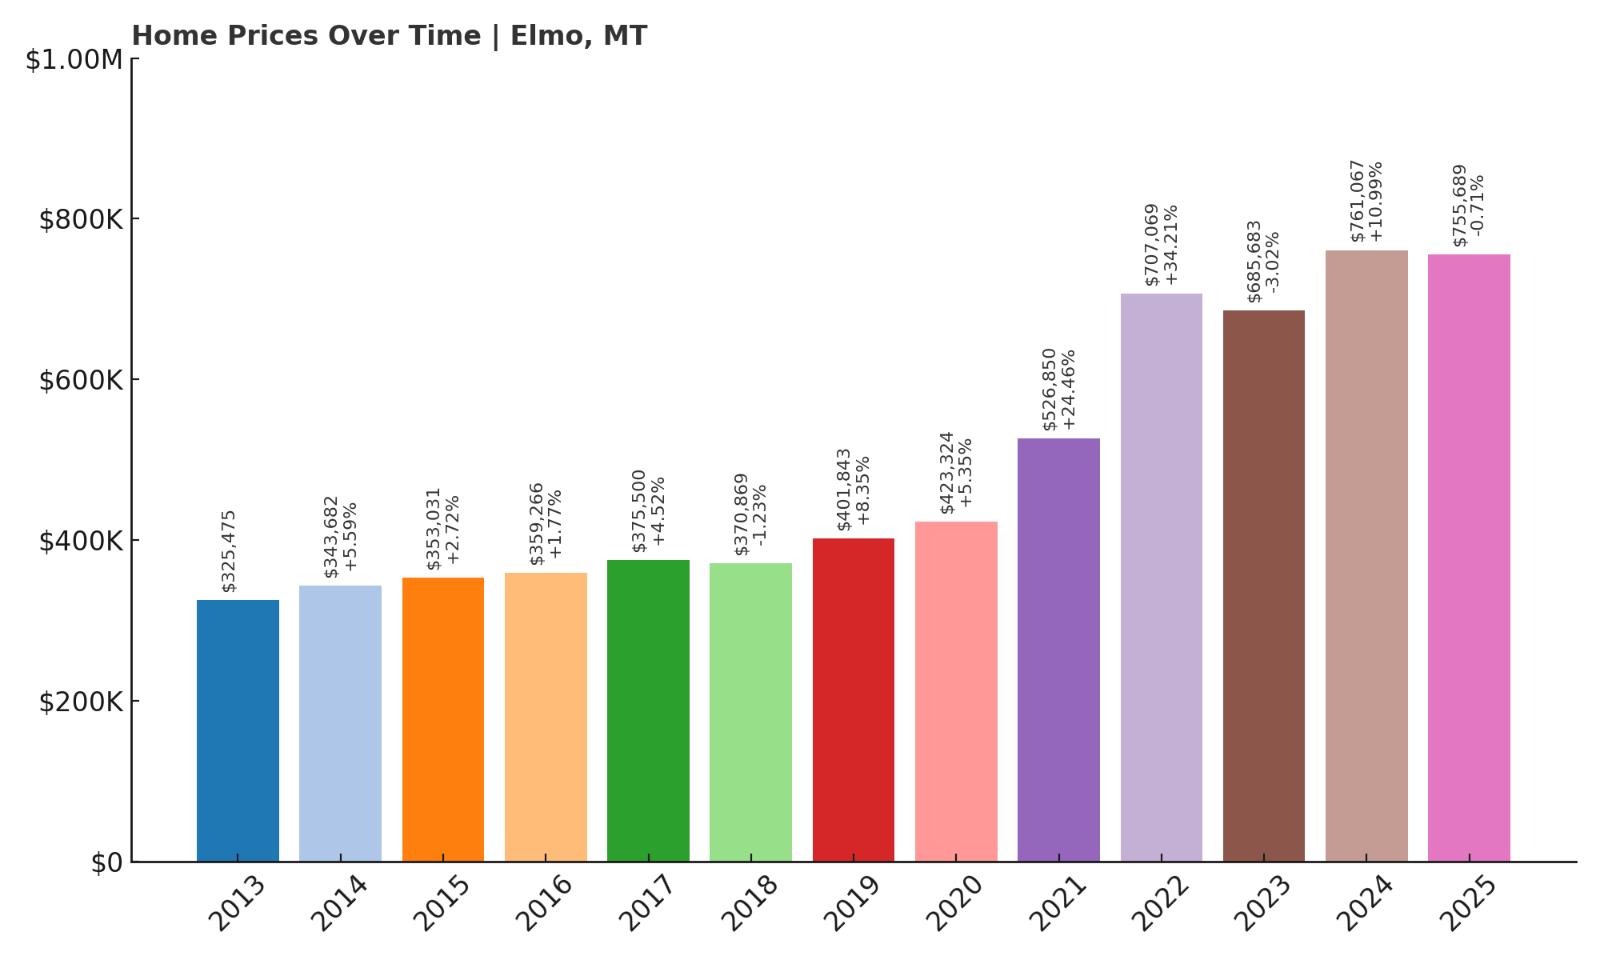
11. Elmo – 132% Home Price Increase Since 2013
🔥 Would you like to save this?
- 2010: N/A
- 2011: N/A
- 2012: N/A
- 2013: $325,475
- 2014: $343,682 (+$18,207, +5.59% from previous year)
- 2015: $353,031 (+$9,348, +2.72% from previous year)
- 2016: $359,266 (+$6,235, +1.77% from previous year)
- 2017: $375,500 (+$16,233, +4.52% from previous year)
- 2018: $370,869 ($-4,630, -1.23% from previous year)
- 2019: $401,843 (+$30,974, +8.35% from previous year)
- 2020: $423,324 (+$21,480, +5.35% from previous year)
- 2021: $526,850 (+$103,526, +24.46% from previous year)
- 2022: $707,069 (+$180,220, +34.21% from previous year)
- 2023: $685,683 ($-21,386, -3.02% from previous year)
- 2024: $761,067 (+$75,384, +10.99% from previous year)
- 2025: $755,689 ($-5,379, -0.71% from previous year)
Since 2013, Elmo has posted a 132% rise in home values, climbing from the low $300,000s to over $750,000 in 2025. The town’s largest growth years came between 2020 and 2022, with two consecutive double-digit percentage increases. Although the market dipped slightly in 2023 and again in 2025, overall appreciation remains strong.
Elmo – Peaceful Lakeside Living

Situated on the western shore of Flathead Lake, Elmo offers waterfront access and sweeping views that appeal to both locals and vacation-home buyers. The area is quiet and largely residential, with much of the demand coming from retirees and seasonal residents. As more buyers seek out lakefront properties, Elmo’s limited inventory has helped drive up home prices.
Its proximity to Polson and natural amenities has made Elmo an attractive alternative to more crowded resort towns. The strong price gains between 2020 and 2022 reflect a surge in interest during the pandemic years, and while appreciation has slowed, values remain historically high.
10. Bigfork – 144% Home Price Increase Since 2012
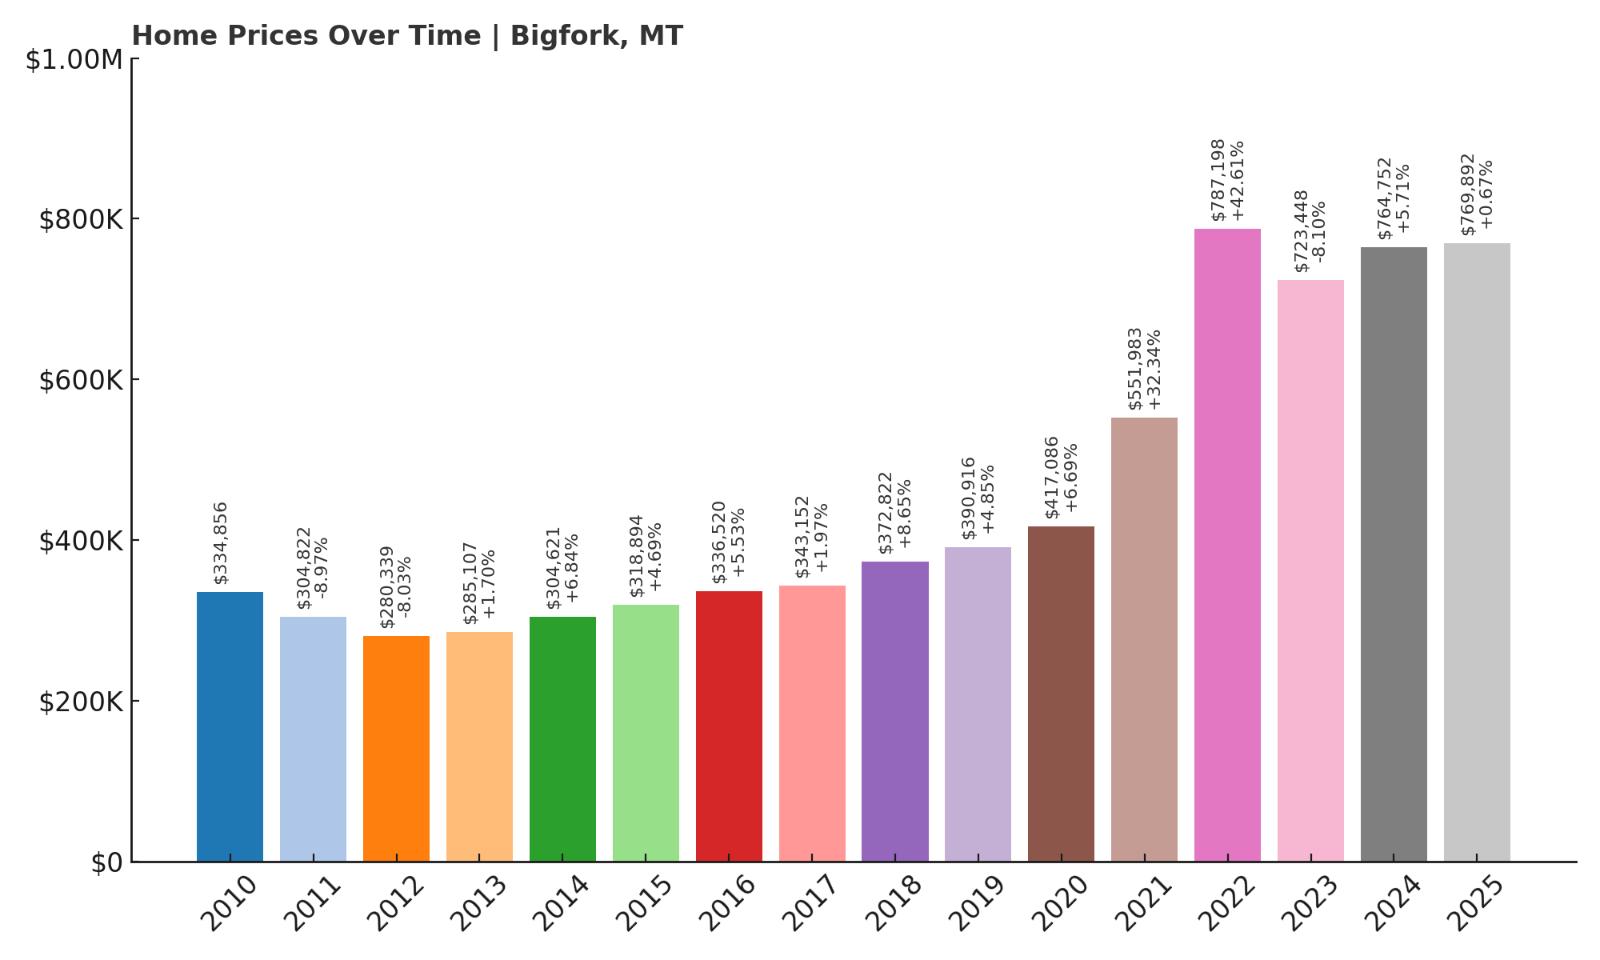
- 2010: $334,856
- 2011: $304,822 ($-30,035, -8.97% from previous year)
- 2012: $280,339 ($-24,482, -8.03% from previous year)
- 2013: $285,107 (+$4,768, +1.70% from previous year)
- 2014: $304,621 (+$19,514, +6.84% from previous year)
- 2015: $318,894 (+$14,273, +4.69% from previous year)
- 2016: $336,520 (+$17,625, +5.53% from previous year)
- 2017: $343,152 (+$6,633, +1.97% from previous year)
- 2018: $372,822 (+$29,670, +8.65% from previous year)
- 2019: $390,916 (+$18,094, +4.85% from previous year)
- 2020: $417,086 (+$26,170, +6.69% from previous year)
- 2021: $551,983 (+$134,898, +32.34% from previous year)
- 2022: $787,198 (+$235,215, +42.61% from previous year)
- 2023: $723,448 ($-63,750, -8.10% from previous year)
- 2024: $764,752 (+$41,304, +5.71% from previous year)
- 2025: $769,892 (+$5,140, +0.67% from previous year)
Bigfork home prices have risen over 140% since 2012, driven by steady gains and two explosive years in 2021 and 2022. Although prices dipped in 2023, they bounced back to nearly $770,000 in 2025. The upward trend reflects growing interest in Bigfork’s scenic charm and lakeside amenities.
Bigfork – Resort Town on Flathead Lake

Bigfork is one of Montana’s most established resort towns, nestled on the northeast shore of Flathead Lake. Known for its galleries, theaters, golf courses, and high-end dining, it’s a magnet for affluent buyers and vacationers. The area has seen steady growth in short-term rental demand and out-of-state investment.
The 42% price jump in 2022 was one of the biggest statewide, marking Bigfork as a major hotspot. Despite slight softening afterward, the town remains one of the priciest in Montana thanks to its combination of recreation, amenities, and limited housing supply.
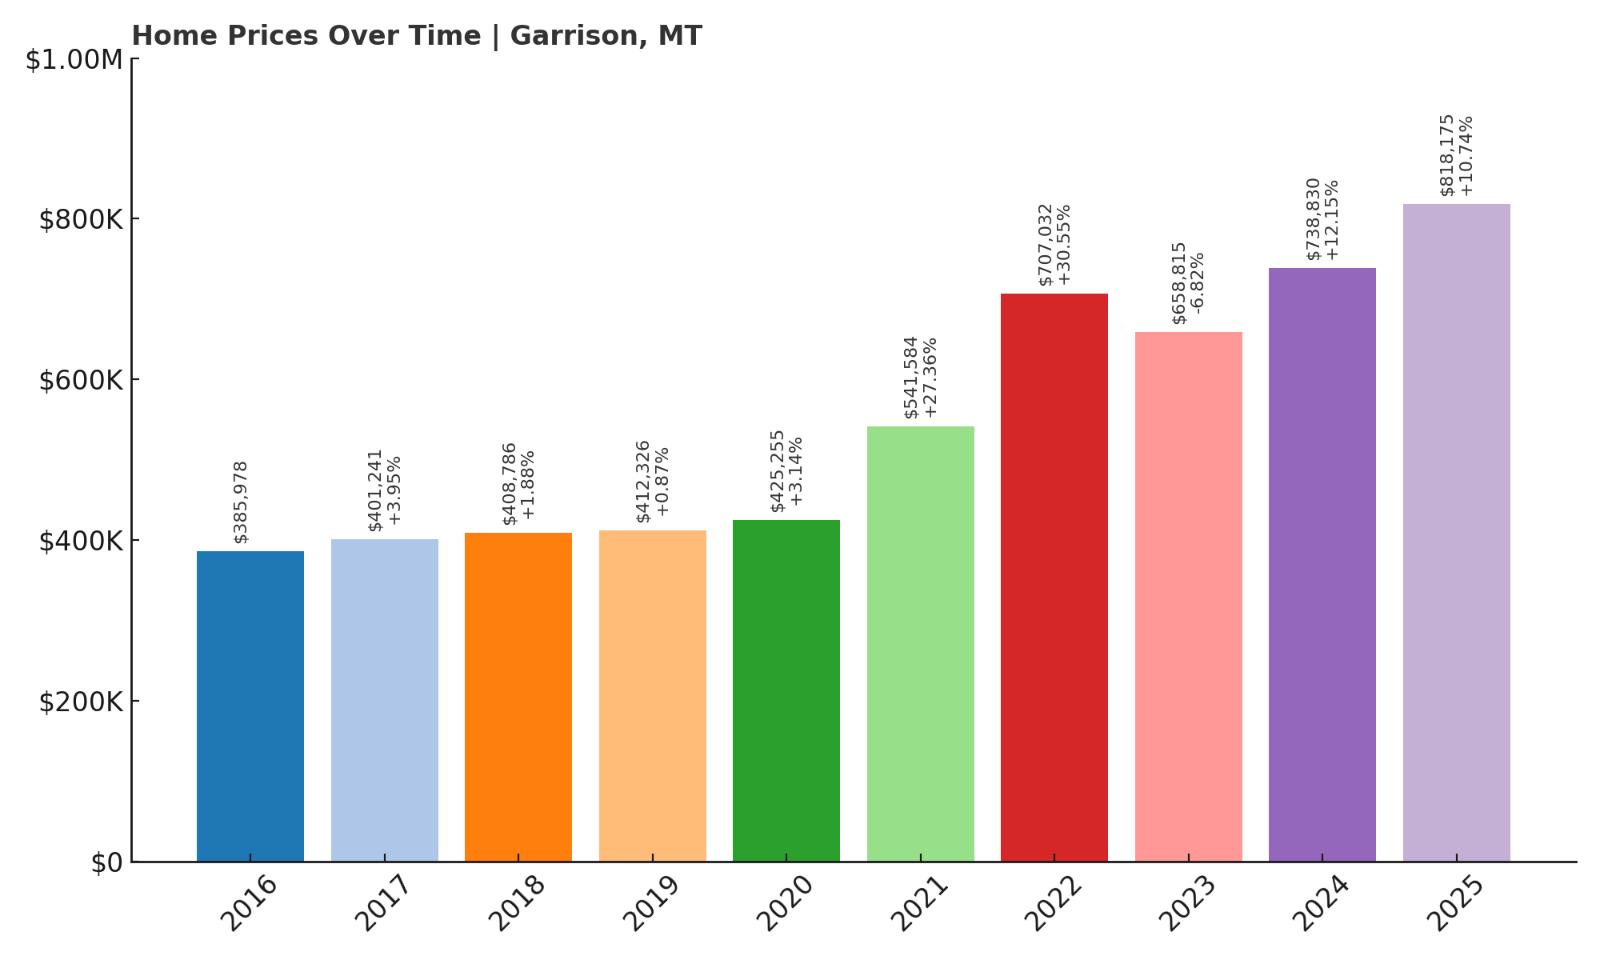
9. Garrison – 112% Home Price Increase Since 2016
- 2010: N/A
- 2011: N/A
- 2012: N/A
- 2013: N/A
- 2014: N/A
- 2015: N/A
- 2016: $385,978
- 2017: $401,241 (+$15,263, +3.95% from previous year)
- 2018: $408,786 (+$7,545, +1.88% from previous year)
- 2019: $412,326 (+$3,540, +0.87% from previous year)
- 2020: $425,255 (+$12,930, +3.14% from previous year)
- 2021: $541,584 (+$116,329, +27.36% from previous year)
- 2022: $707,032 (+$165,448, +30.55% from previous year)
- 2023: $658,815 ($-48,217, -6.82% from previous year)
- 2024: $738,830 (+$80,015, +12.15% from previous year)
- 2025: $818,175 (+$79,345, +10.74% from previous year)
Garrison’s home values have more than doubled since 2016, with an especially steep rise from 2020 to 2022. The slight market dip in 2023 was short-lived, and prices have surged again, reaching over $818,000 in 2025. The trend points to growing interest in this small but increasingly desirable location.
Garrison – Small Town, Big Price Tags

Garrison is a tiny, unincorporated community along Interstate 90 in Powell County. Despite its size, it has become increasingly attractive to buyers seeking land, quiet, and proximity to outdoor opportunities. It’s near Deer Lodge and not far from Helena or Missoula, which makes it a feasible home base for commuters or seasonal residents.
Limited listings and open space are part of the appeal. The spike in prices after 2020 suggests buyers are willing to pay a premium for privacy and a rural lifestyle without sacrificing highway access. Garrison’s market is small but heating up fast.
8. Lakeside – 147% Home Price Increase Since 2012
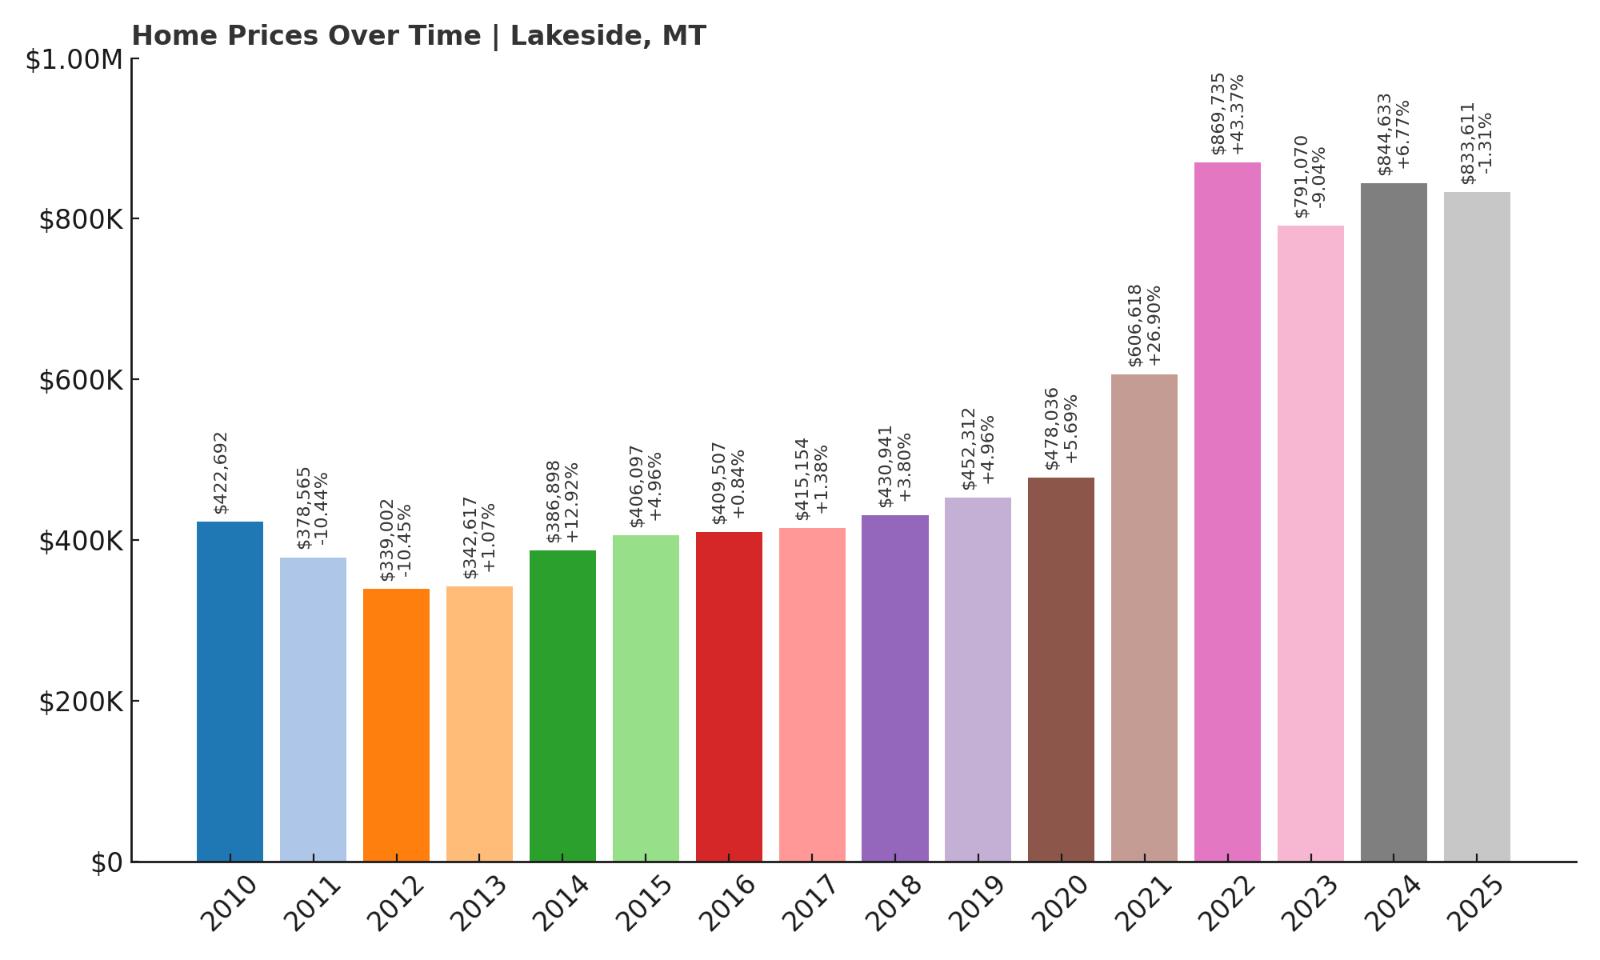
- 2010: $422,692
- 2011: $378,565 ($-44,127, -10.44% from previous year)
- 2012: $339,002 ($-39,564, -10.45% from previous year)
- 2013: $342,617 (+$3,616, +1.07% from previous year)
- 2014: $386,898 (+$44,280, +12.92% from previous year)
- 2015: $406,097 (+$19,200, +4.96% from previous year)
- 2016: $409,507 (+$3,410, +0.84% from previous year)
- 2017: $415,154 (+$5,648, +1.38% from previous year)
- 2018: $430,941 (+$15,787, +3.80% from previous year)
- 2019: $452,312 (+$21,371, +4.96% from previous year)
- 2020: $478,036 (+$25,724, +5.69% from previous year)
- 2021: $606,618 (+$128,582, +26.90% from previous year)
- 2022: $869,735 (+$263,117, +43.37% from previous year)
- 2023: $791,070 ($-78,665, -9.04% from previous year)
- 2024: $844,633 (+$53,564, +6.77% from previous year)
- 2025: $833,611 ($-11,023, -1.31% from previous year)
Lakeside home prices are up 147% since 2012, fueled by strong appreciation from 2020 to 2022. After a slight correction, values have stabilized near $834,000 in 2025. It remains one of the most expensive lakefront communities in Montana.
Lakeside – High Demand on Flathead Lake’s West Shore
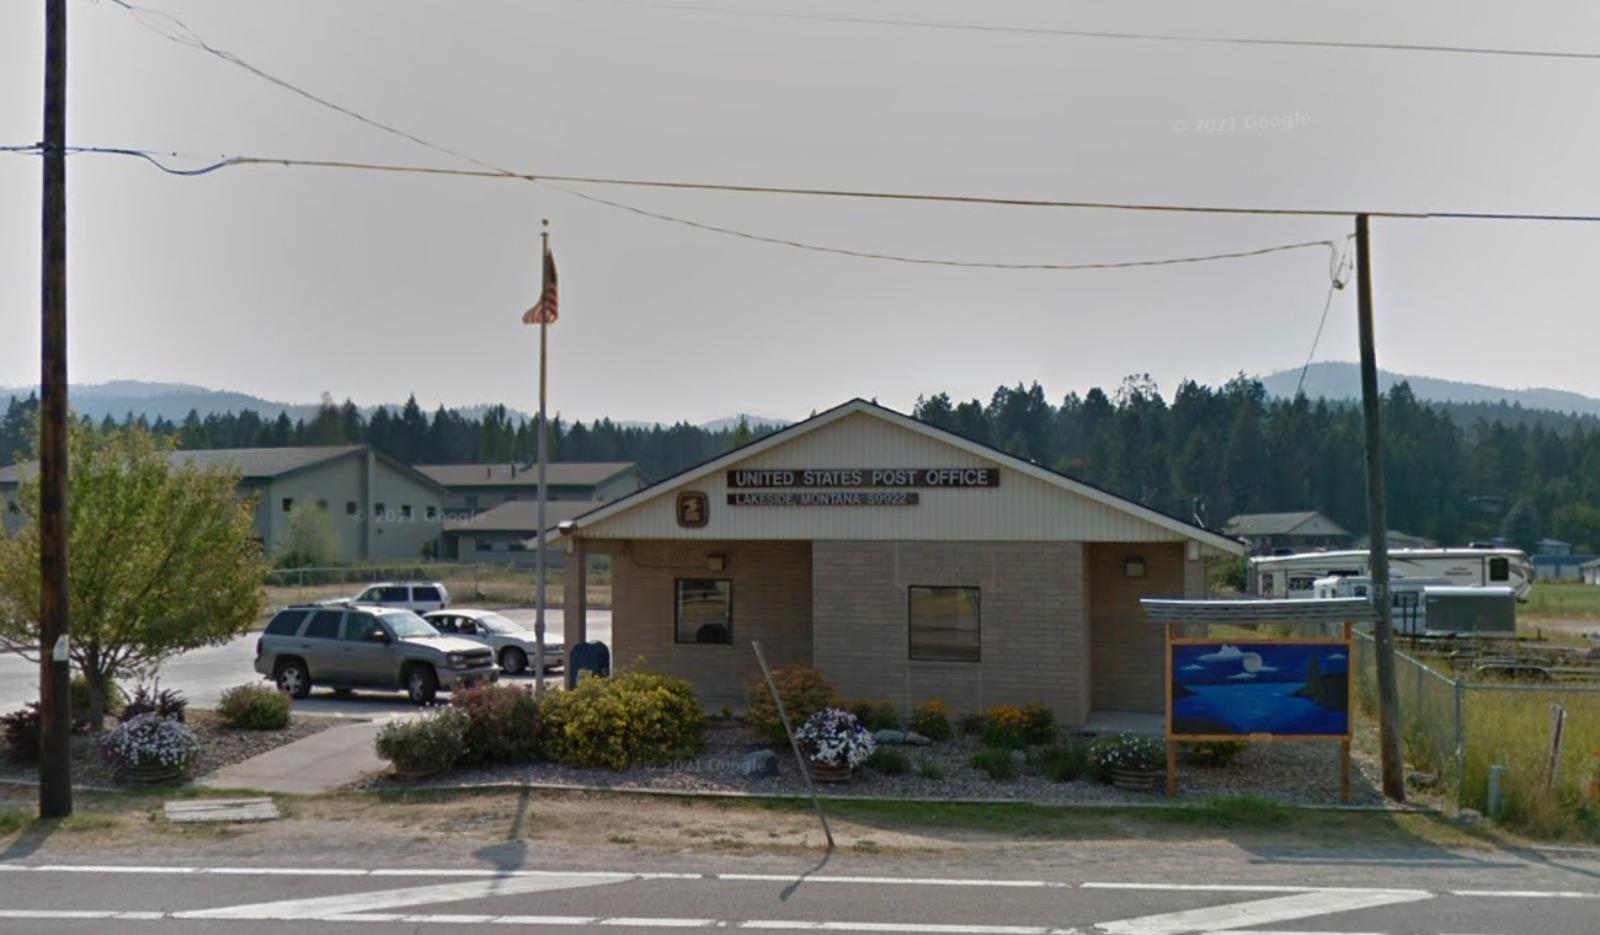
Lakeside sits along the northwest edge of Flathead Lake and is popular for boating, dining, and its marina culture. This town blends luxury real estate with a laid-back atmosphere, attracting buyers from across the country. Properties with lake views or direct access command top dollar.
While 2023 saw a modest decline, the market has mostly recovered. Lakeside’s draw lies in its combination of recreational amenities and upscale homes, making it a go-to spot for seasonal living or full-time retirement in Montana.
7. Whitefish – 191% Home Price Increase Since 2012
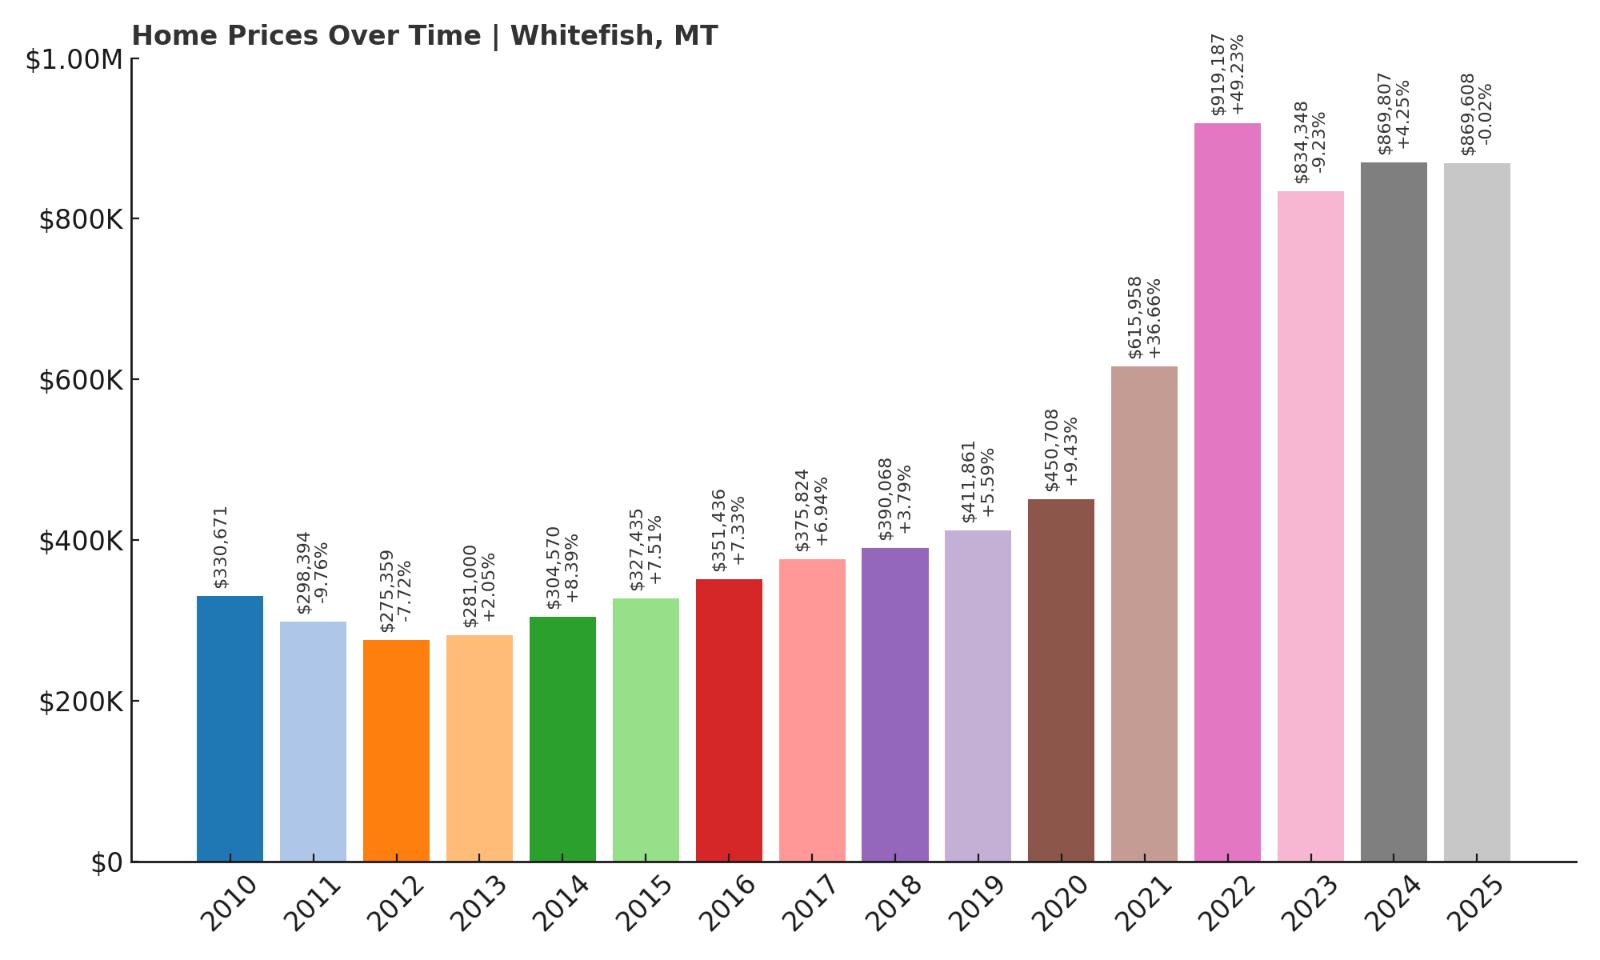
- 2010: $330,671
- 2011: $298,394 ($-32,277, -9.76% from previous year)
- 2012: $275,359 ($-23,034, -7.72% from previous year)
- 2013: $281,000 (+$5,641, +2.05% from previous year)
- 2014: $304,570 (+$23,570, +8.39% from previous year)
- 2015: $327,435 (+$22,865, +7.51% from previous year)
- 2016: $351,436 (+$24,000, +7.33% from previous year)
- 2017: $375,824 (+$24,388, +6.94% from previous year)
- 2018: $390,068 (+$14,244, +3.79% from previous year)
- 2019: $411,861 (+$21,793, +5.59% from previous year)
- 2020: $450,708 (+$38,847, +9.43% from previous year)
- 2021: $615,958 (+$165,250, +36.66% from previous year)
- 2022: $919,187 (+$303,229, +49.23% from previous year)
- 2023: $834,348 ($-84,839, -9.23% from previous year)
- 2024: $869,807 (+$35,459, +4.25% from previous year)
- 2025: $869,608 ($-198, -0.02% from previous year)
Whitefish has experienced a dramatic 191% increase in home values since 2012, making it one of the fastest-growing housing markets in the state. Prices were relatively flat through much of the 2010s but exploded between 2020 and 2022, when values nearly doubled in just two years. The market cooled slightly in 2023, shedding nearly $85,000, but rebounded in 2024 and held steady in 2025. This pattern suggests a strong baseline of demand despite short-term volatility. Buyers looking at Whitefish are clearly paying for location, access to recreation, and exclusivity — and many are still willing to pay a premium, even amid broader market fluctuations.
Whitefish – Luxury and Lifestyle in a Mountain Playground
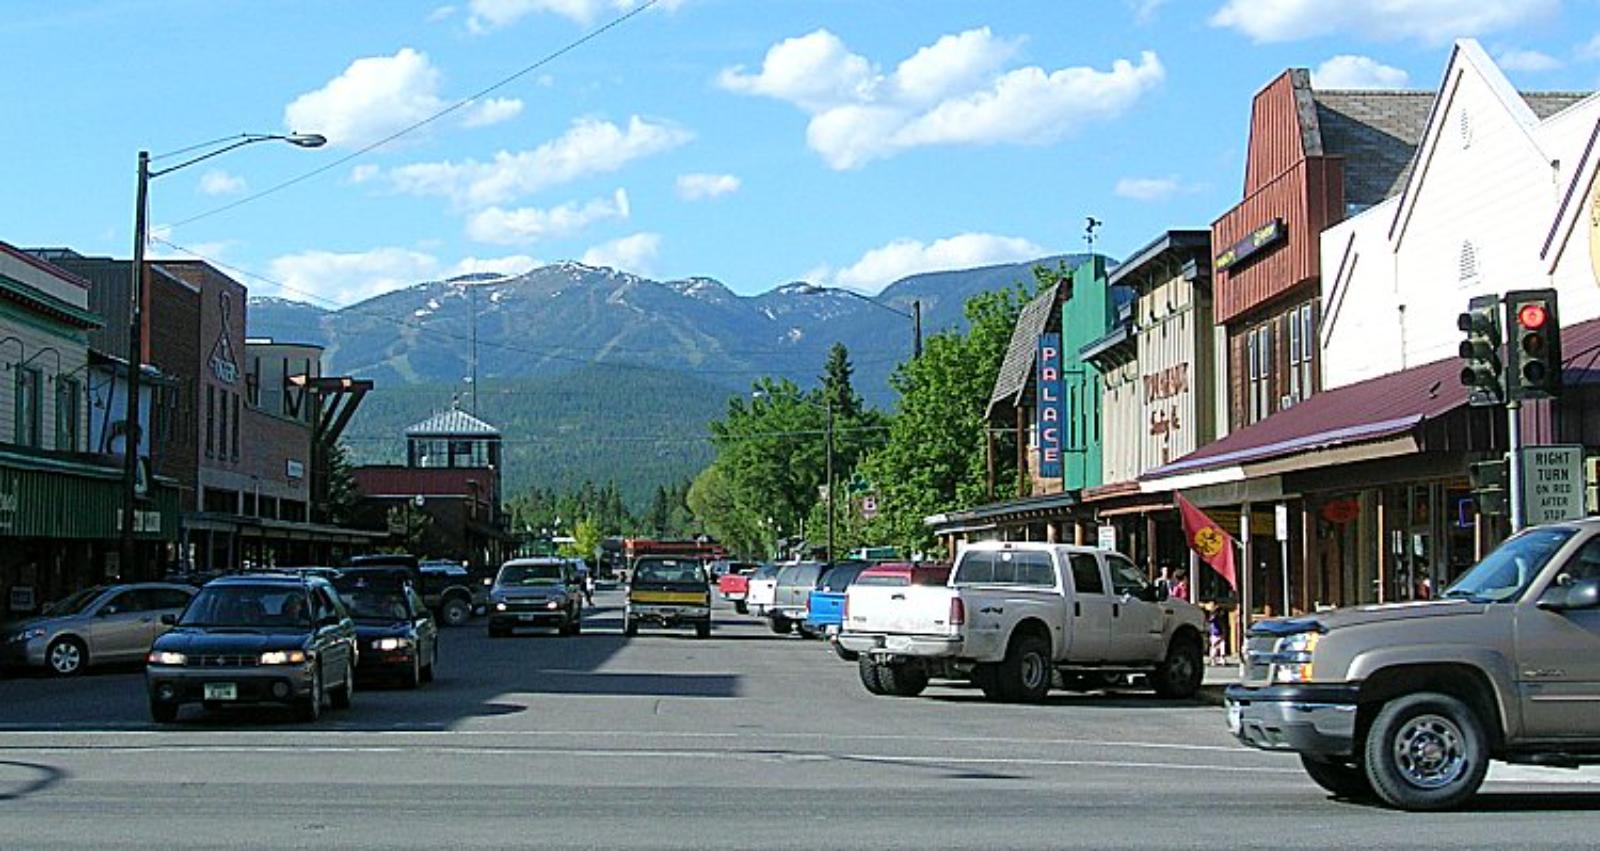
Whitefish is a premier destination in Montana, known for Whitefish Mountain Resort, vibrant downtown shops, and proximity to Glacier National Park. It attracts a mix of wealthy seasonal homeowners, outdoor enthusiasts, and investors seeking upscale short-term rentals. Its housing stock includes custom homes, log cabins, and high-end condos, all contributing to elevated median values. The ski resort economy has also supported steady economic growth and infrastructure improvements, fueling further interest.
In recent years, Whitefish has become a magnet for affluent out-of-state buyers, particularly from the West Coast. This migration, coupled with limited inventory and strict zoning, has added pressure to an already competitive market. Whitefish’s appeal doesn’t appear to be fading anytime soon — even small pullbacks are quickly absorbed by new demand, keeping it firmly in Montana’s top pricing tier.
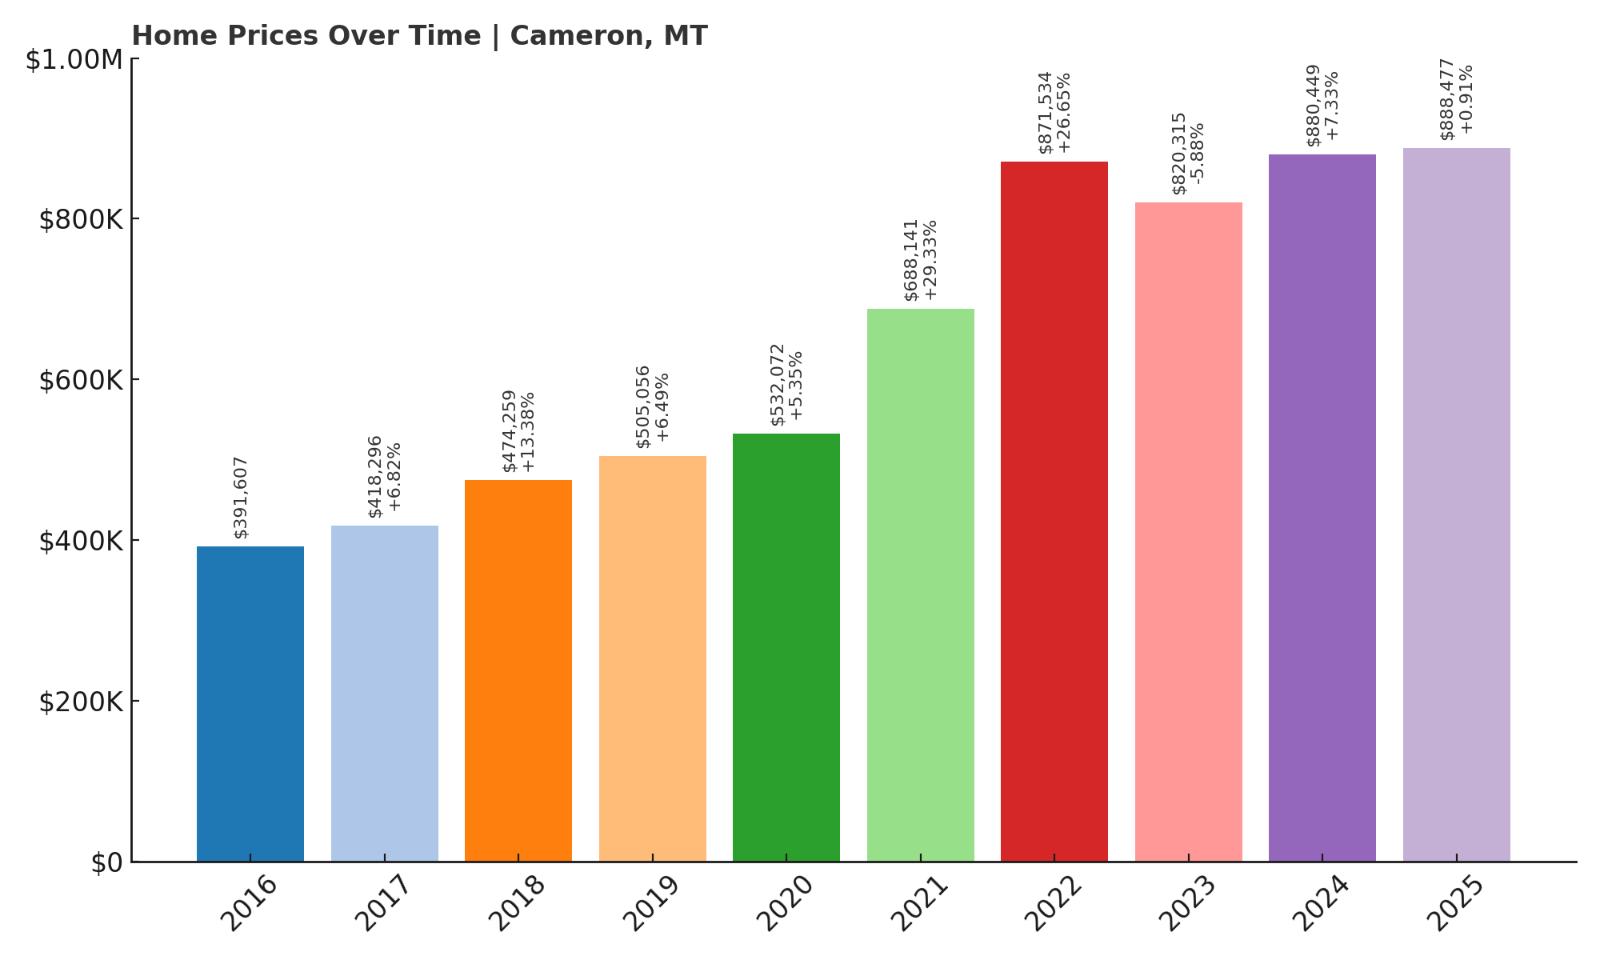
6. Cameron – 127% Home Price Increase Since 2016
- 2010: N/A
- 2011: N/A
- 2012: N/A
- 2013: N/A
- 2014: N/A
- 2015: N/A
- 2016: $391,607
- 2017: $418,296 (+$26,689, +6.82% from previous year)
- 2018: $474,259 (+$55,963, +13.38% from previous year)
- 2019: $505,056 (+$30,797, +6.49% from previous year)
- 2020: $532,072 (+$27,016, +5.35% from previous year)
- 2021: $688,141 (+$156,069, +29.33% from previous year)
- 2022: $871,534 (+$183,393, +26.65% from previous year)
- 2023: $820,315 ($-51,219, -5.88% from previous year)
- 2024: $880,449 (+$60,134, +7.33% from previous year)
- 2025: $888,477 (+$8,028, +0.91% from previous year)
Cameron’s housing market has surged 127% since 2016, riding the broader wave of rural Montana’s real estate boom. Prices have climbed steadily each year, with massive jumps in 2021 and 2022 — the town’s two most aggressive years of appreciation. Despite a brief pullback in 2023, values are again trending upward. In 2025, homes are averaging nearly $890,000, a sharp contrast from their sub-$400,000 price point just nine years ago. This growth highlights Cameron’s emergence as a high-value destination, particularly for buyers drawn to its remote charm and large lot sizes.
Cameron – A Quiet Market With Surging Demand

Cameron sits in Madison County in southwest Montana, not far from the popular tourist town of Ennis. It’s surrounded by expansive public lands, world-class fly fishing on the Madison River, and easy access to Yellowstone’s western gateway. These features have made it increasingly attractive to wealthy outdoor enthusiasts and investors. Unlike more built-up areas, Cameron has retained its rural character — and that’s part of its allure.
Home inventory remains limited, and what is available tends to offer more acreage and privacy. Rising demand from both in-state and out-of-state buyers has pushed prices up considerably, despite modest local development. For those seeking a tranquil location with high-end home potential, Cameron represents a compelling — and increasingly costly — option.
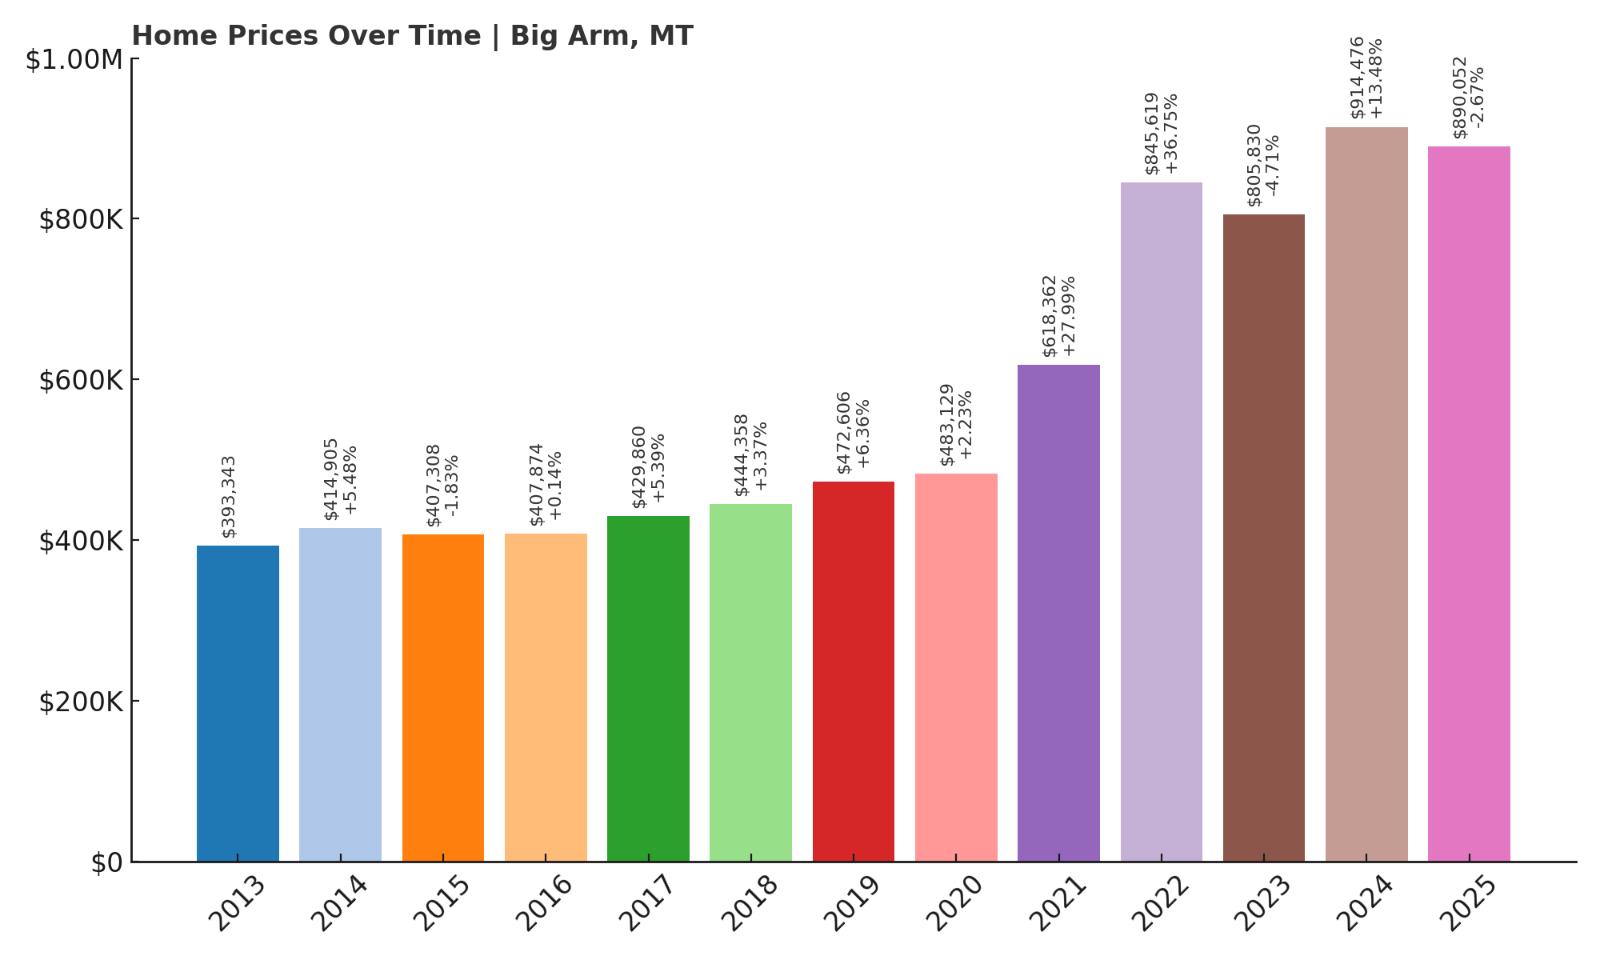
5. Big Arm – 126% Home Price Increase Since 2013
🔥 Would you like to save this?
- 2010: N/A
- 2011: N/A
- 2012: N/A
- 2013: $393,343
- 2014: $414,905 (+$21,561, +5.48% from previous year)
- 2015: $407,308 ($-7,597, -1.83% from previous year)
- 2016: $407,874 (+$567, +0.14% from previous year)
- 2017: $429,860 (+$21,986, +5.39% from previous year)
- 2018: $444,358 (+$14,498, +3.37% from previous year)
- 2019: $472,606 (+$28,248, +6.36% from previous year)
- 2020: $483,129 (+$10,523, +2.23% from previous year)
- 2021: $618,362 (+$135,233, +27.99% from previous year)
- 2022: $845,619 (+$227,257, +36.75% from previous year)
- 2023: $805,830 ($-39,788, -4.71% from previous year)
- 2024: $914,476 (+$108,646, +13.48% from previous year)
- 2025: $890,052 ($-24,424, -2.67% from previous year)
Since 2013, Big Arm has seen home values climb over 126%. The town’s biggest gains came in 2021 and 2022, when home prices shot up nearly 65% in two years. While the market cooled slightly after, 2024 brought a strong recovery. In 2025, prices remain close to $900,000, indicating the town has settled into a new price tier. The mix of lake access, privacy, and demand for spacious properties has helped elevate Big Arm to a prime price point in Montana’s real estate landscape.
Big Arm – On the Rise Along Flathead Lake

Big Arm lies along the southwest edge of Flathead Lake, offering picturesque views and quiet lakefront living. Though smaller and less commercially developed than towns like Polson or Lakeside, it benefits from the same natural beauty. The nearby state park draws in seasonal tourists, while private lots and low-density housing appeal to high-end buyers who prioritize peace and seclusion.
The town’s price growth reflects this rising appeal, particularly among buyers priced out of other lakeside towns. Development has remained limited, helping sustain upward pressure on existing inventory. Big Arm’s value continues to rise as interest in premium waterfront property grows year after year.
4. Pray – 100% Home Price Increase Since 2016
- 2010: N/A
- 2011: N/A
- 2012: N/A
- 2013: N/A
- 2014: N/A
- 2015: N/A
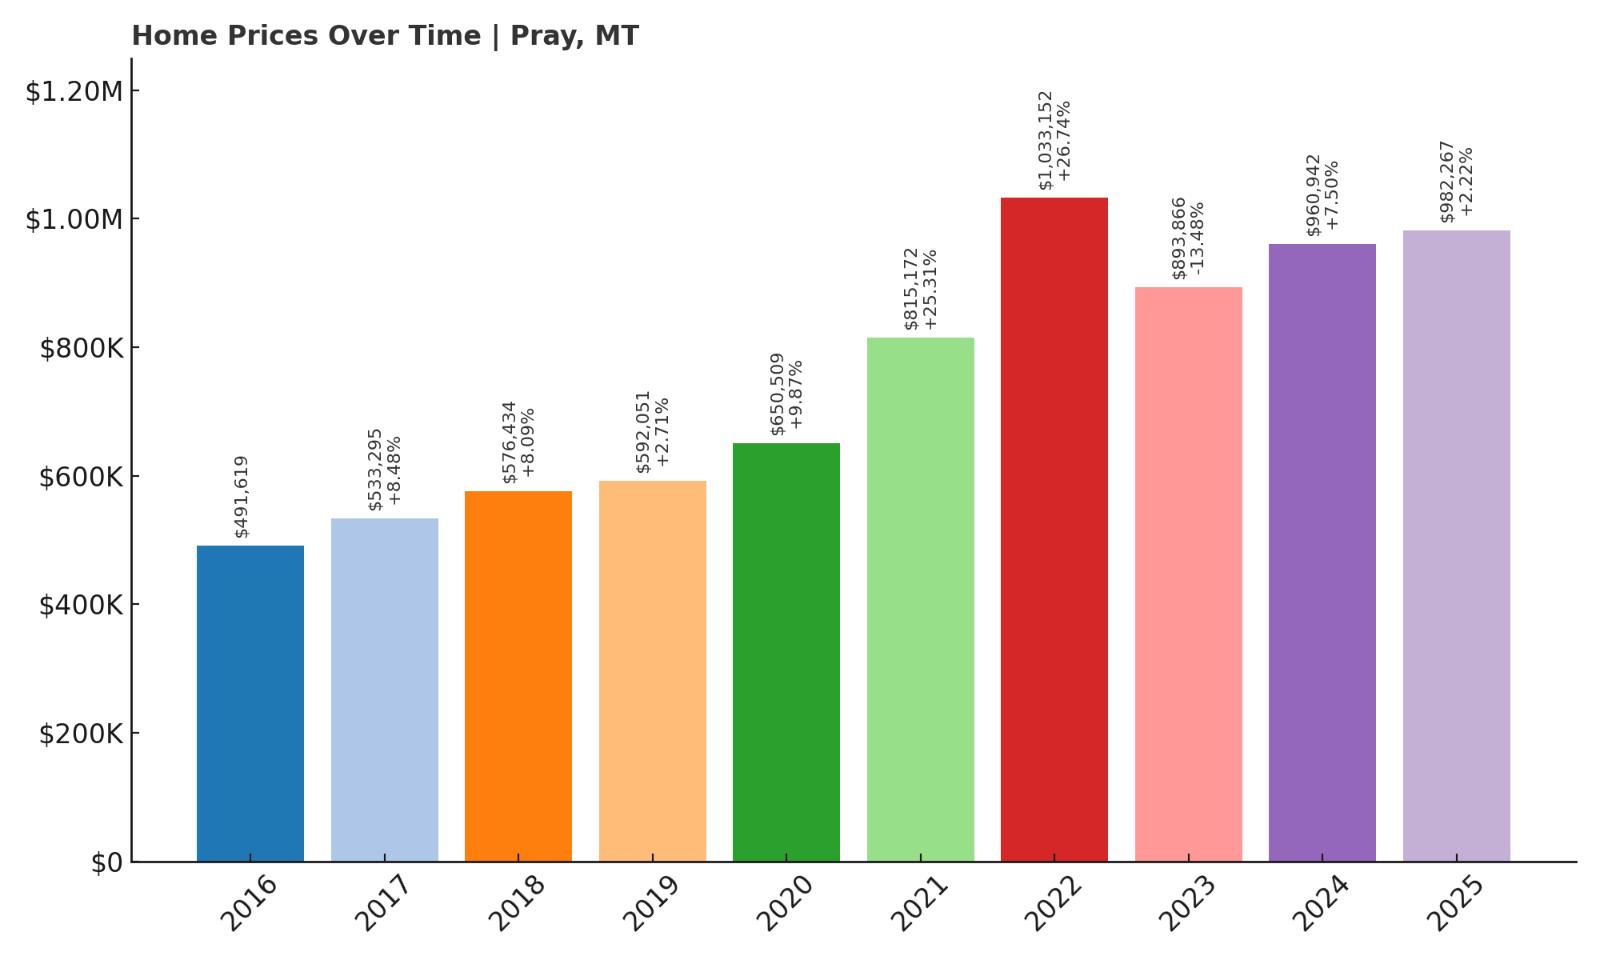
- 2016: $491,619
- 2017: $533,295 (+$41,676, +8.48% from previous year)
- 2018: $576,434 (+$43,139, +8.09% from previous year)
- 2019: $592,051 (+$15,617, +2.71% from previous year)
- 2020: $650,509 (+$58,457, +9.87% from previous year)
- 2021: $815,172 (+$164,664, +25.31% from previous year)
- 2022: $1,033,152 (+$217,980, +26.74% from previous year)
- 2023: $893,866 ($-139,286, -13.48% from previous year)
- 2024: $960,942 (+$67,075, +7.50% from previous year)
- 2025: $982,267 (+$21,325, +2.22% from previous year)
Home values in Pray have exactly doubled since 2016, hitting just over $982,000 in 2025. The most explosive growth happened in 2021 and 2022, with back-to-back years of more than 25% increases. While the town experienced a significant drop in 2023, the following years have seen a recovery that suggests Pray is still in high demand. Its mix of wide-open land, views, and proximity to Yellowstone continue to draw interest from wealthy buyers.
Pray – Wide-Open Spaces in Paradise Valley
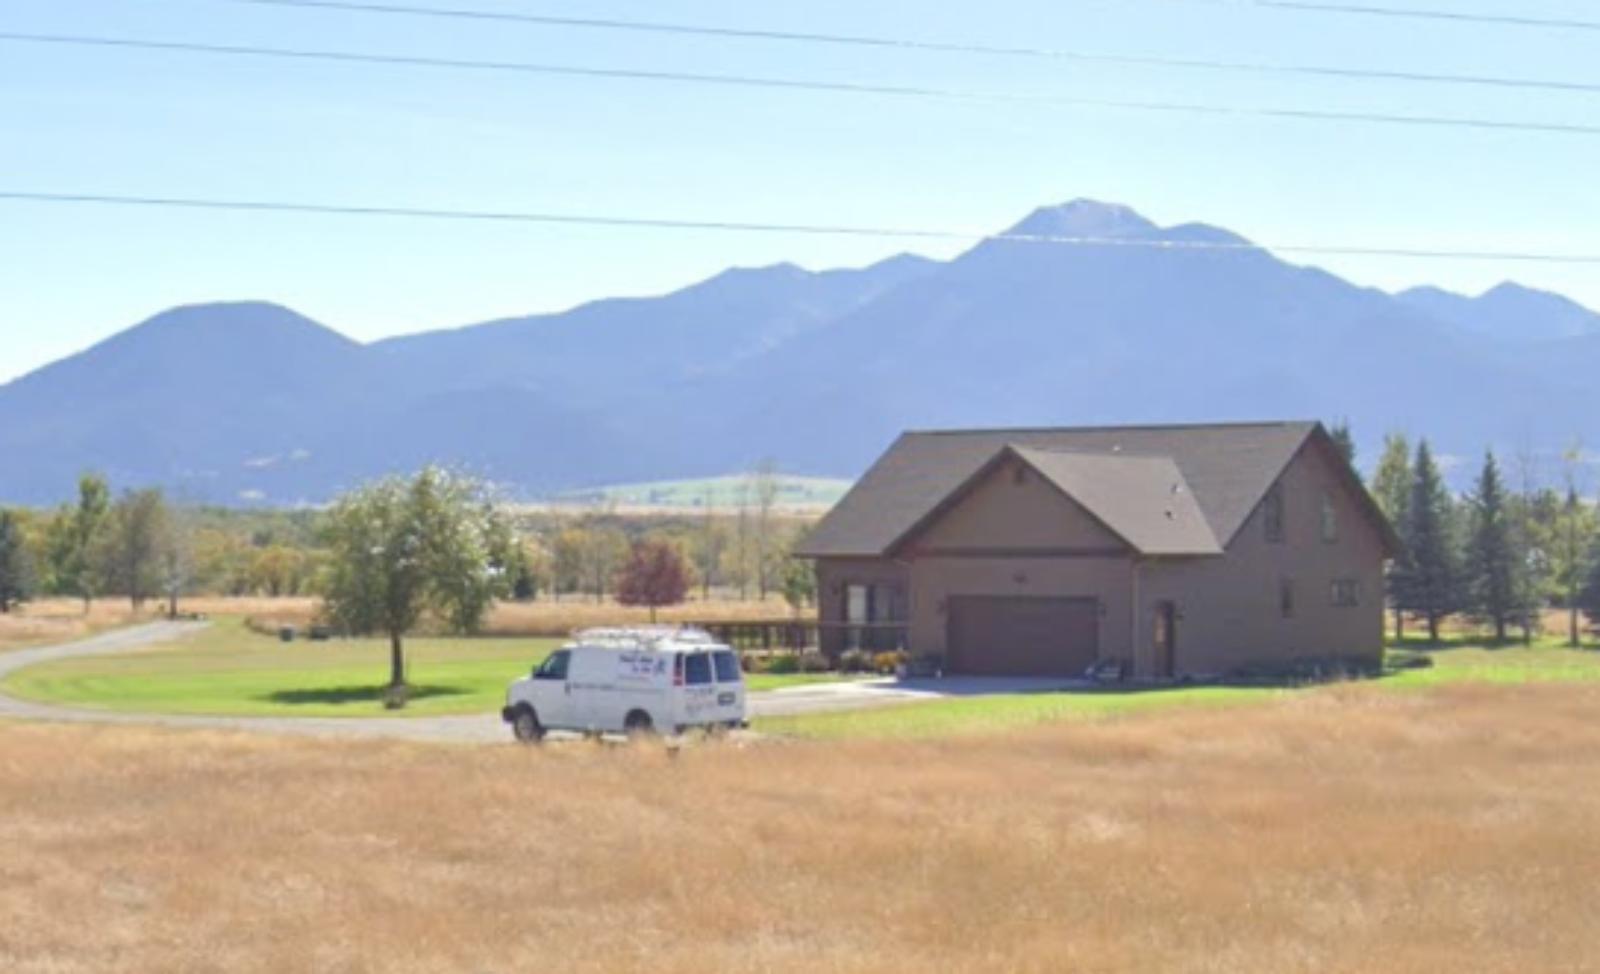
Pray is located in Paradise Valley, one of Montana’s most scenic and sought-after areas. It’s about 30 minutes south of Livingston and not far from the northern entrance of Yellowstone. The community is unincorporated and rural, but it offers access to high-end lodging, hot springs, and pristine hiking areas. The surrounding landscape — snow-capped peaks, grasslands, and river frontage — makes Pray a magnet for luxury buyers seeking privacy and beauty.
Because development is minimal and large-acreage properties dominate the market, supply is limited. Many homes are custom-built or ranch-style estates with million-dollar views. Pray’s steep home price rise reflects this exclusivity, and its 2023 setback appears to have been a short-term correction rather than a long-term shift.
3. Gallatin Gateway – 233% Home Price Increase Since 2012
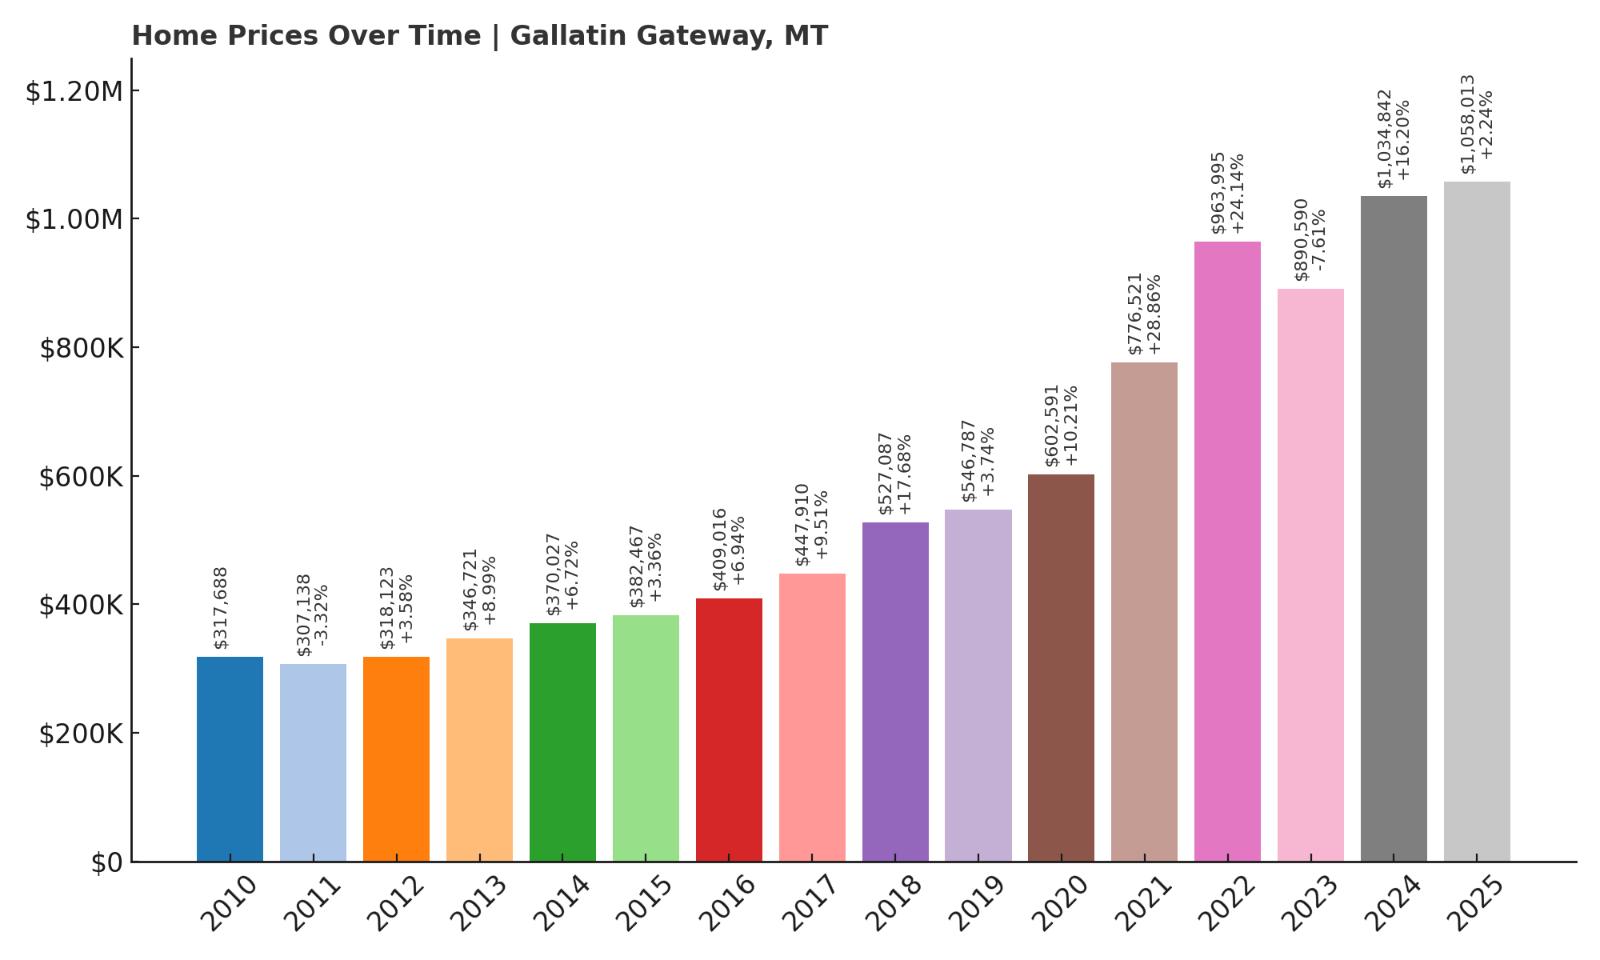
- 2010: $317,688
- 2011: $307,138 ($-10,550, -3.32% from previous year)
- 2012: $318,123 (+$10,985, +3.58% from previous year)
- 2013: $346,721 (+$28,598, +8.99% from previous year)
- 2014: $370,027 (+$23,307, +6.72% from previous year)
- 2015: $382,467 (+$12,440, +3.36% from previous year)
- 2016: $409,016 (+$26,549, +6.94% from previous year)
- 2017: $447,910 (+$38,894, +9.51% from previous year)
- 2018: $527,087 (+$79,177, +17.68% from previous year)
- 2019: $546,787 (+$19,700, +3.74% from previous year)
- 2020: $602,591 (+$55,804, +10.21% from previous year)
- 2021: $776,521 (+$173,930, +28.86% from previous year)
- 2022: $963,995 (+$187,474, +24.14% from previous year)
- 2023: $890,590 ($-73,406, -7.61% from previous year)
- 2024: $1,034,842 (+$144,252, +16.20% from previous year)
- 2025: $1,058,013 (+$23,171, +2.24% from previous year)
Gallatin Gateway has seen a staggering 233% increase in home prices since 2012, placing it among Montana’s most rapidly appreciating communities. With prices climbing from just over $318,000 to more than $1.05 million in 2025, this town has moved firmly into luxury territory. The most aggressive growth occurred between 2020 and 2022, when prices soared by nearly $350,000 in just two years. Though 2023 brought a temporary setback, values bounced back strongly in 2024 and continued rising in 2025. These trends suggest a market driven by serious demand and tight inventory, especially as neighboring Bozeman grows more crowded and expensive.
Gallatin Gateway – Where Luxury Meets Montana’s Wilderness

Gallatin Gateway is located just 15 miles southwest of Bozeman and is often seen as a quieter alternative to the bustling city. It’s a gateway in the truest sense — a scenic stretch of land leading toward Big Sky and Yellowstone. The town offers open land, ranch-style homes, and breathtaking views of the Gallatin Range, all while remaining close to key amenities like schools, hospitals, and the Bozeman Yellowstone International Airport. This balance between wilderness and accessibility has made Gallatin Gateway a favorite among high-income professionals, retirees, and second-home buyers alike.
Its dramatic price surge is no surprise given its location and character. Unlike Bozeman’s increasingly dense developments, Gallatin Gateway offers space, privacy, and a slower pace of life — highly valued traits post-2020. New home construction is limited, and existing homes rarely linger on the market. Outdoor access, including proximity to fly fishing, skiing, and national forest land, continues to fuel premium pricing. It’s a town where luxury is measured not just in finishes but in lifestyle — one that blends rustic elegance with adventure and tranquility.
2. Rollins – 181% Home Price Increase Since 2013
- 2010: N/A
- 2011: N/A
- 2012: N/A
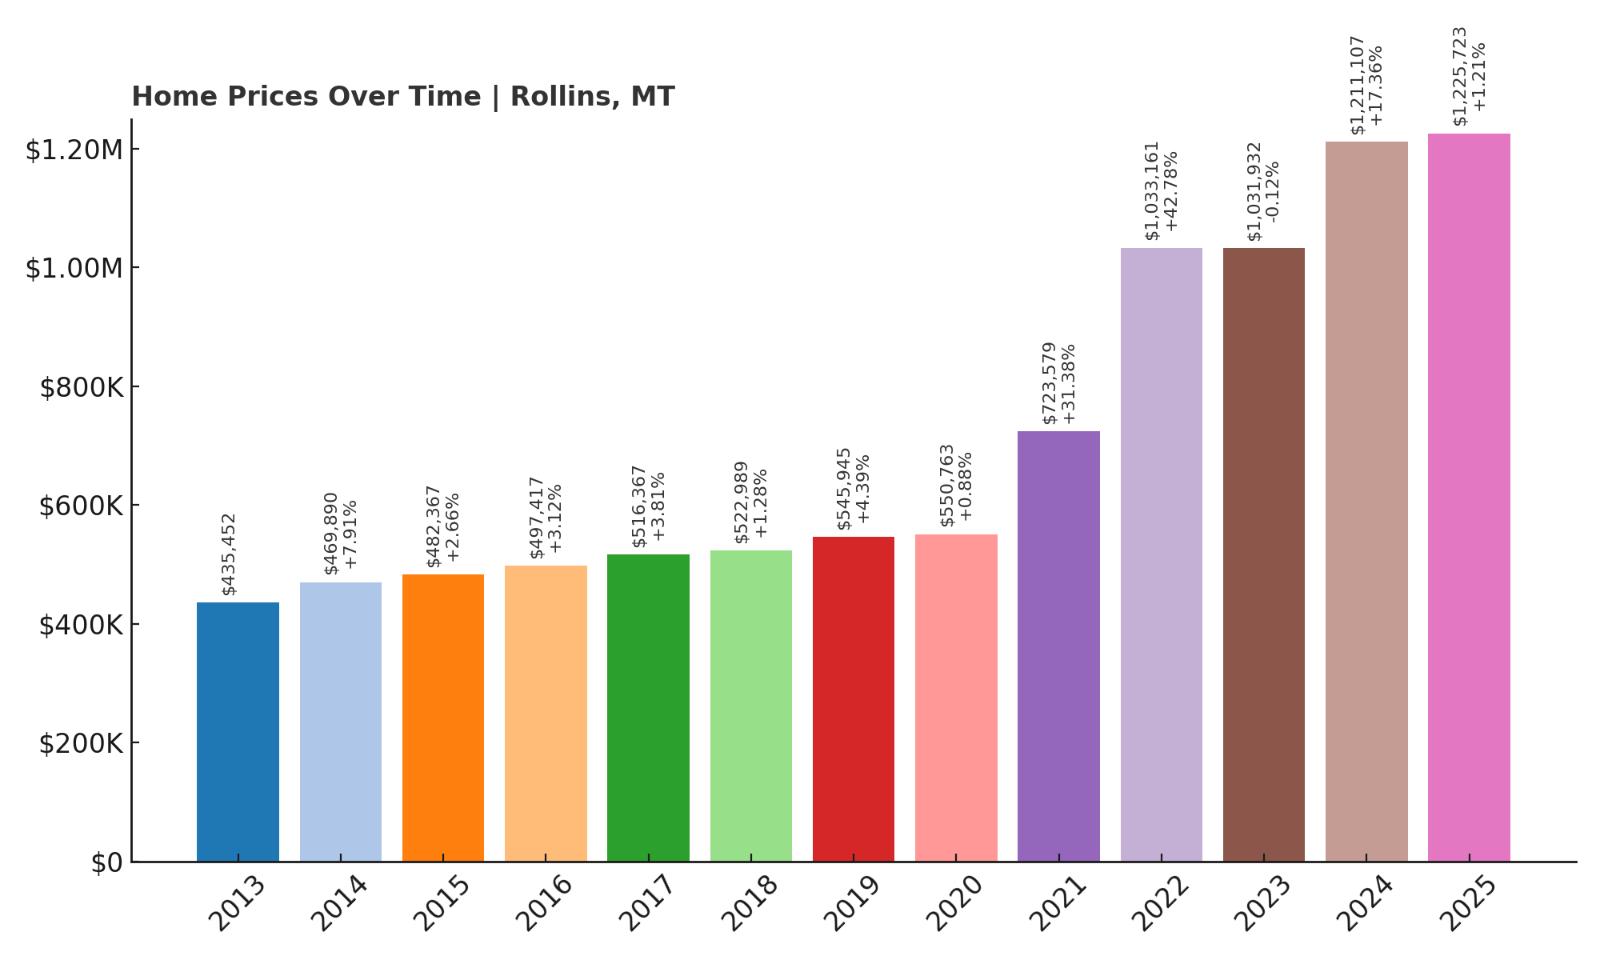
- 2013: $435,452
- 2014: $469,890 (+$34,437, +7.91% from previous year)
- 2015: $482,367 (+$12,477, +2.66% from previous year)
- 2016: $497,417 (+$15,050, +3.12% from previous year)
- 2017: $516,367 (+$18,951, +3.81% from previous year)
- 2018: $522,989 (+$6,622, +1.28% from previous year)
- 2019: $545,945 (+$22,956, +4.39% from previous year)
- 2020: $550,763 (+$4,817, +0.88% from previous year)
- 2021: $723,579 (+$172,816, +31.38% from previous year)
- 2022: $1,033,161 (+$309,582, +42.78% from previous year)
- 2023: $1,031,932 ($-1,229, -0.12% from previous year)
- 2024: $1,211,107 (+$179,176, +17.36% from previous year)
- 2025: $1,225,723 (+$14,616, +1.21% from previous year)
Rollins has posted an enormous 181% increase in home prices since 2013, with the most rapid escalation occurring in 2021 and 2022. Home values jumped from $723,000 to over $1.03 million in that two-year span, an unprecedented surge that reflects the town’s growing popularity. Despite a momentary plateau in 2023, prices resumed climbing in 2024 and 2025, ultimately reaching $1.22 million — a number that puts Rollins firmly in Montana’s luxury home segment. Demand remains strong despite limited infrastructure, showing just how valuable waterfront property on Flathead Lake has become.
Rollins – A Slice of Flathead Lake’s Elite Shoreline

Rollins is a small, unincorporated town nestled along the western shore of Flathead Lake. It offers some of the most uninterrupted lake views in the region, often from hillside properties that feel both private and expansive. What sets Rollins apart is its minimal commercial footprint — there are no big resorts, no bustling tourist crowds. Instead, it appeals to those looking for true solitude with a view, particularly among wealthy retirees, vacation-home owners, and remote professionals. Many properties are custom-built, with high-end finishes and direct lake access, driving up median values.
Rollins’ rise reflects a broader trend in Montana’s lakefront towns: less is more. The town has no real “downtown” to speak of, but that hasn’t stopped buyers from investing. Proximity to larger towns like Polson and Kalispell makes it a feasible home base while still offering a sense of escape. The dramatic price jumps in recent years show that buyers are willing to trade conveniences for space and serenity. With such strong upward momentum and limited building capacity, Rollins is likely to remain one of the state’s most exclusive and expensive housing markets for years to come.
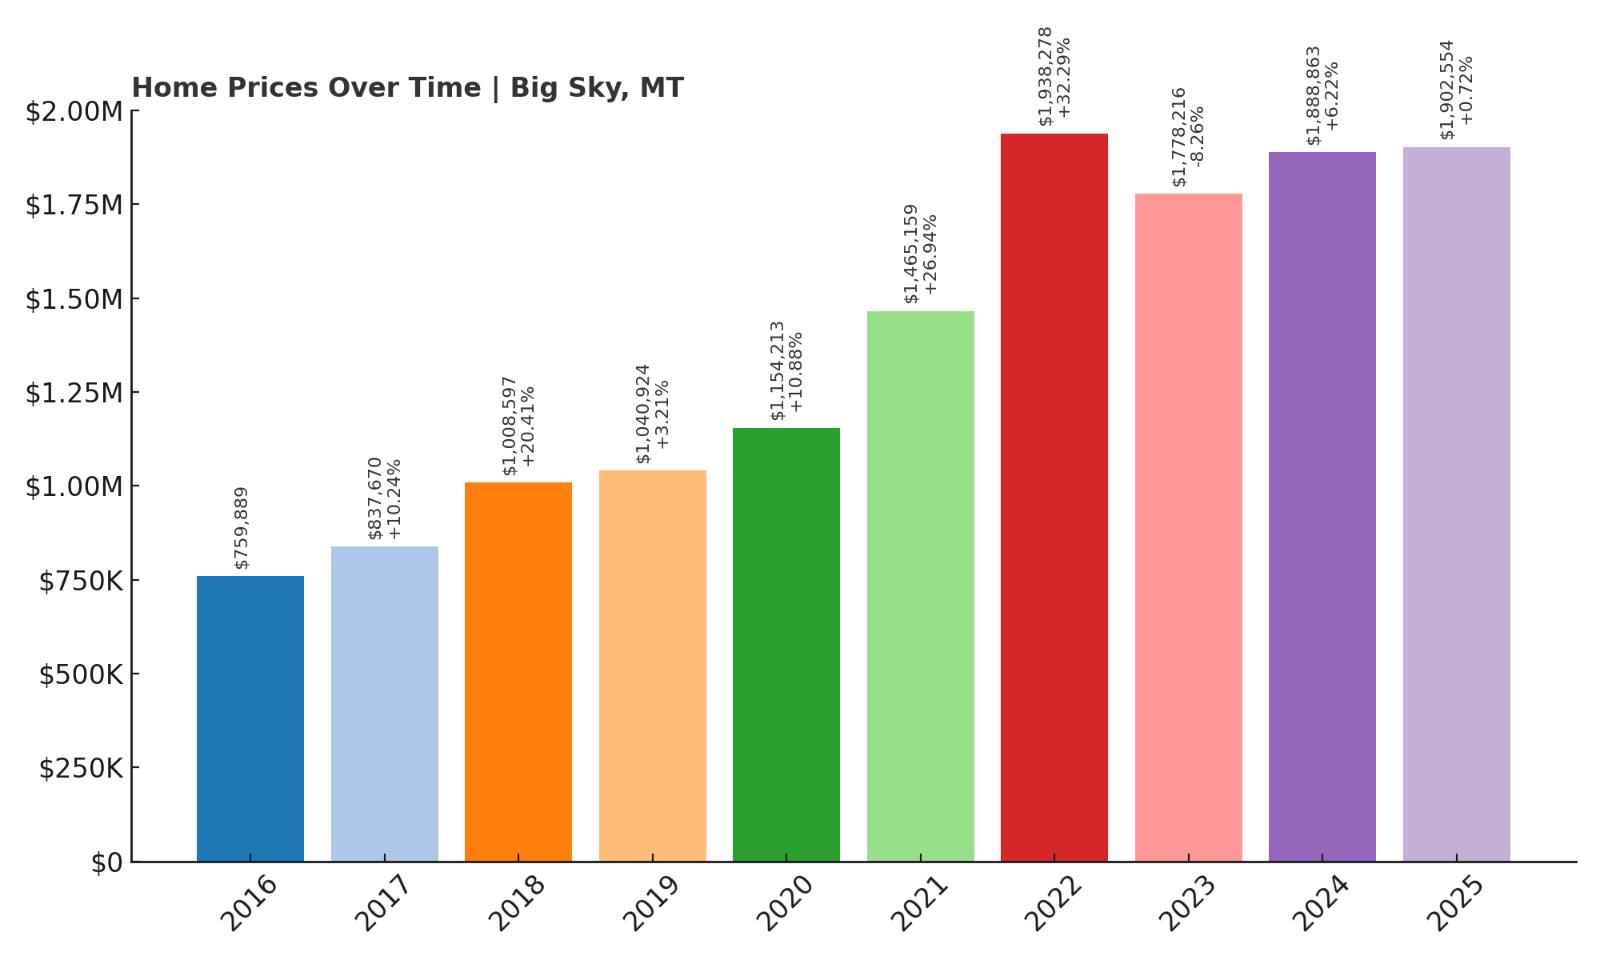
1. Big Sky – 150% Home Price Increase Since 2016
- 2010: N/A
- 2011: N/A
- 2012: N/A
- 2013: N/A
- 2014: N/A
- 2015: N/A
- 2016: $759,889
- 2017: $837,670 (+$77,781, +10.24% from previous year)
- 2018: $1,008,597 (+$170,927, +20.41% from previous year)
- 2019: $1,040,924 (+$32,327, +3.21% from previous year)
- 2020: $1,154,213 (+$113,289, +10.88% from previous year)
- 2021: $1,465,159 (+$310,946, +26.94% from previous year)
- 2022: $1,938,278 (+$473,119, +32.29% from previous year)
- 2023: $1,778,216 ($-160,062, -8.26% from previous year)
- 2024: $1,888,863 (+$110,647, +6.22% from previous year)
- 2025: $1,902,554 (+$13,691, +0.72% from previous year)
Big Sky tops the list with a 150% increase in home values since 2016, reaching nearly $1.9 million in 2025. The most dramatic leaps came in 2021 and 2022, when values rose by over $780,000 across just two years. While there was a slight cooldown in 2023, prices quickly stabilized and began inching upward again, underscoring the strength of demand in this resort town. Big Sky now sits in its own tier, both in price and reputation, as the most luxurious and internationally recognized real estate market in the state.
Big Sky – Montana’s Premier Luxury Destination

🔥 Would you like to save this?
Big Sky has long been known for its ski slopes, luxury resorts, and jaw-dropping mountain vistas. But in the past decade, it has cemented itself as one of the top resort destinations in the country. The area draws in high-net-worth individuals from across the U.S. and beyond, many of whom purchase multimillion-dollar properties as second or third homes. The town has limited inventory and zoning restrictions that keep supply in check, driving up prices as demand shows no signs of slowing. Custom homes, chalets, and condos alike are commanding huge premiums — not just for their square footage but for their proximity to skiing, golf, and national forests.
Unlike other high-end towns, Big Sky has created its own ecosystem of elite living, with fine dining, designer retail, and five-star lodging nestled into a rugged alpine environment. Many residents and investors see it as a safe haven for real estate investment, especially with the rise in luxury travel and remote work. The slight dip in 2023 was likely a natural correction after two record-breaking years, but it has already reversed course. With development carefully controlled and interest unwavering, Big Sky continues to define the pinnacle of Montana real estate in 2025.