🔥 Would you like to save this?
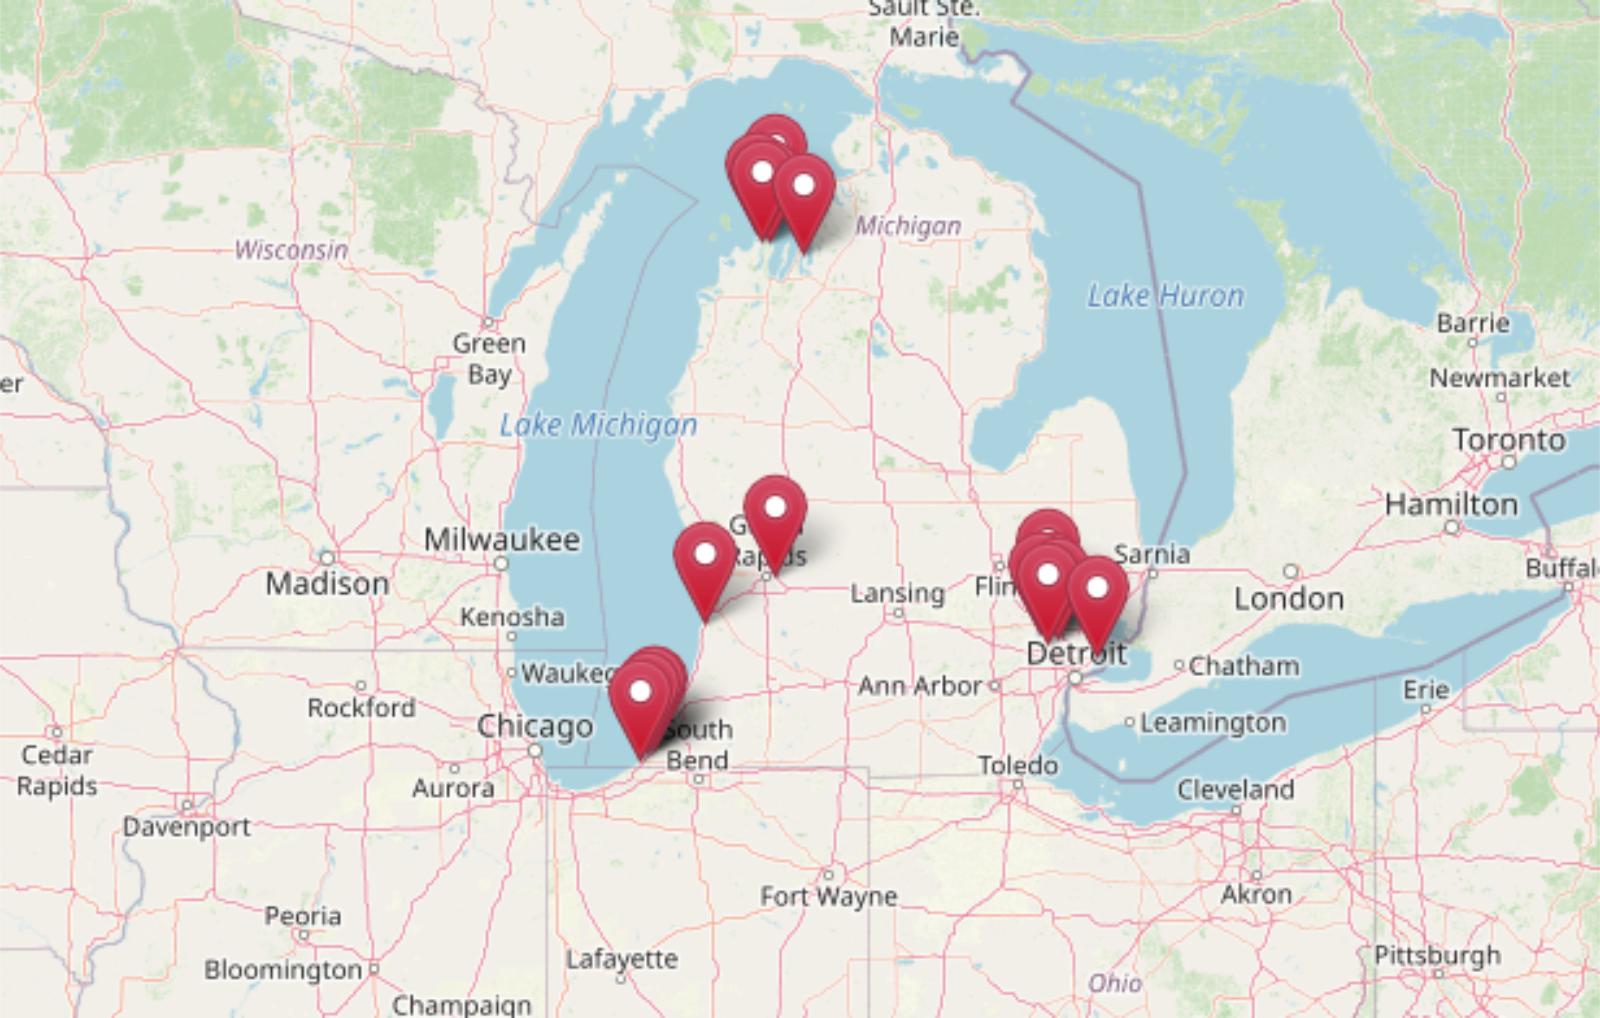
Michigan’s luxury housing markets are on the rise, with several towns hitting new highs in 2025. Based on the latest Zillow Home Value Index, these 17 communities now rank as the most expensive in the state—driven by lakeside views, legacy wealth, and growing demand for upscale living. From million-dollar homes in Lake Angelus to booming vacation spots like Leland, each town on this list shows how—and where—wealth is shaping Michigan’s real estate landscape.
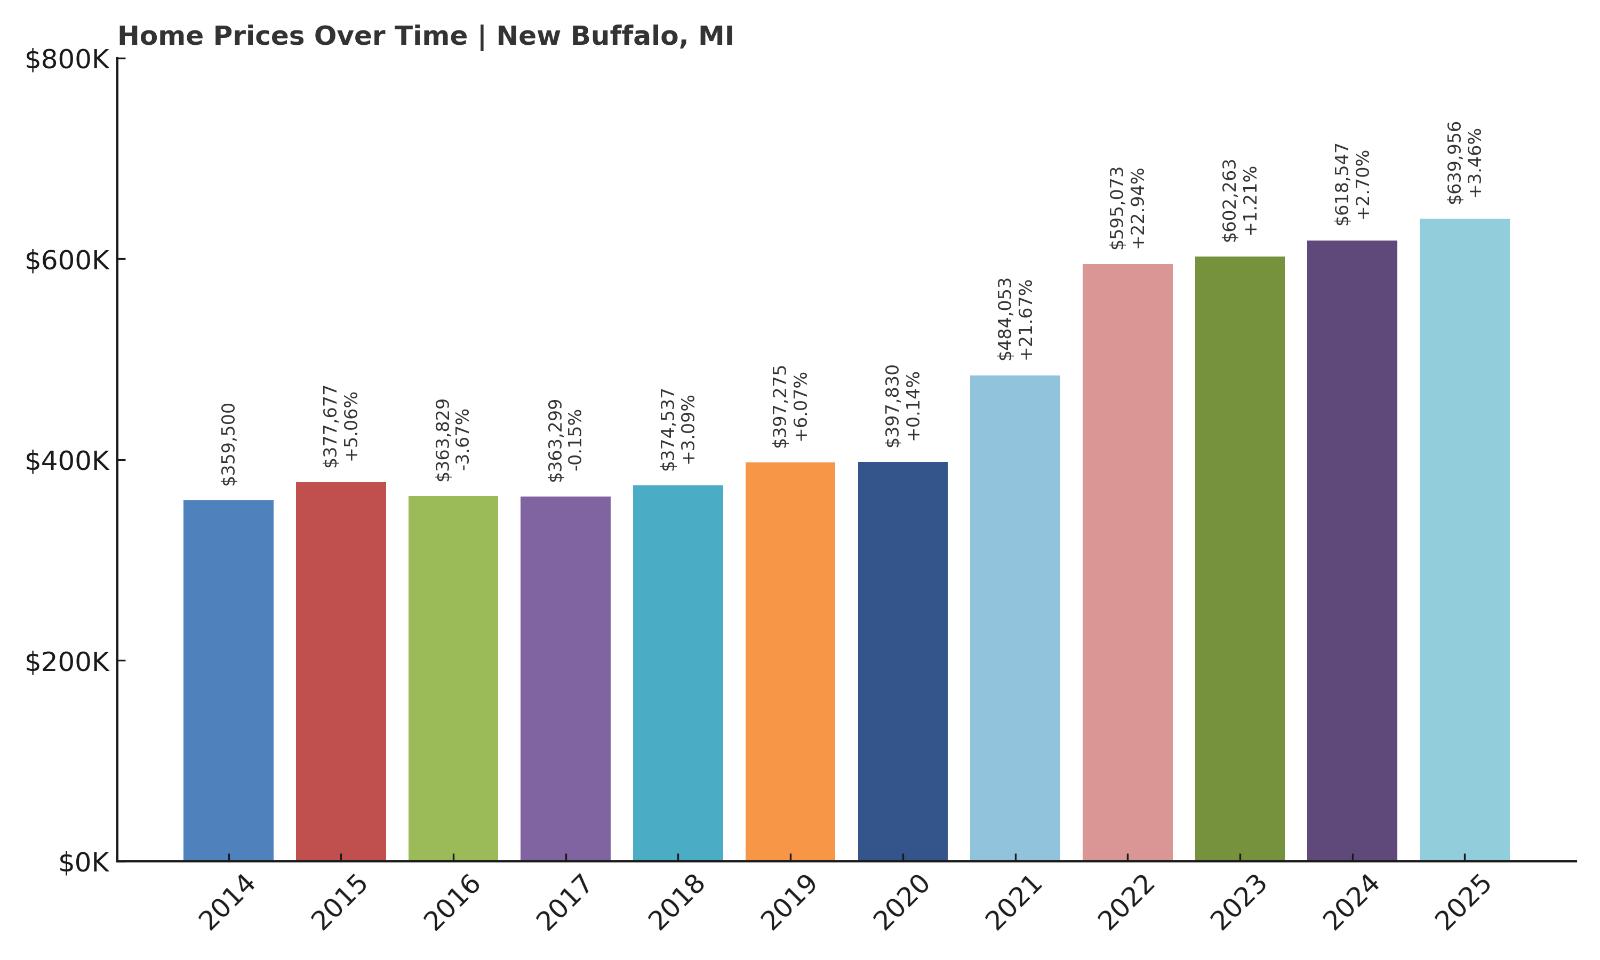
17. New Buffalo – 77.9% Home Price Increase Since 2014
- 2010: N/A
- 2011: N/A
- 2012: N/A
- 2013: N/A
- 2014: $359,500
- 2015: $377,677 (+$18,177, +5.06% from previous year)
- 2016: $363,829 (-$13,849, -3.67% from previous year)
- 2017: $363,299 (-$530, -0.15% from previous year)
- 2018: $374,537 (+$11,238, +3.09% from previous year)
- 2019: $397,275 (+$22,738, +6.07% from previous year)
- 2020: $397,830 (+$555, +0.14% from previous year)
- 2021: $484,053 (+$86,223, +21.67% from previous year)
- 2022: $595,073 (+$111,021, +22.94% from previous year)
- 2023: $602,263 (+$7,190, +1.21% from previous year)
- 2024: $618,547 (+$16,284, +2.70% from previous year)
- 2025: $639,956 (+$21,409, +3.46% from previous year)
New Buffalo’s home prices have surged nearly 78% since 2014, rising from $359,500 to just under $640,000 in 2025. While the early years of the dataset show modest movement—including slight declines in 2016 and 2017—the market turned sharply upward starting in 2021. That year saw a 21.67% increase, followed by an even larger 22.94% jump in 2022. Although the growth slowed in the years after, New Buffalo has maintained positive momentum. The current average price reflects its appeal as a high-end lakeshore market with continued demand. It’s a town that shows no signs of retreating from its newly established price tier.
In order to come up with the very specific design ideas, we create most designs with the assistance of state-of-the-art AI interior design software.
New Buffalo – Lakefront Demand Keeps Prices High
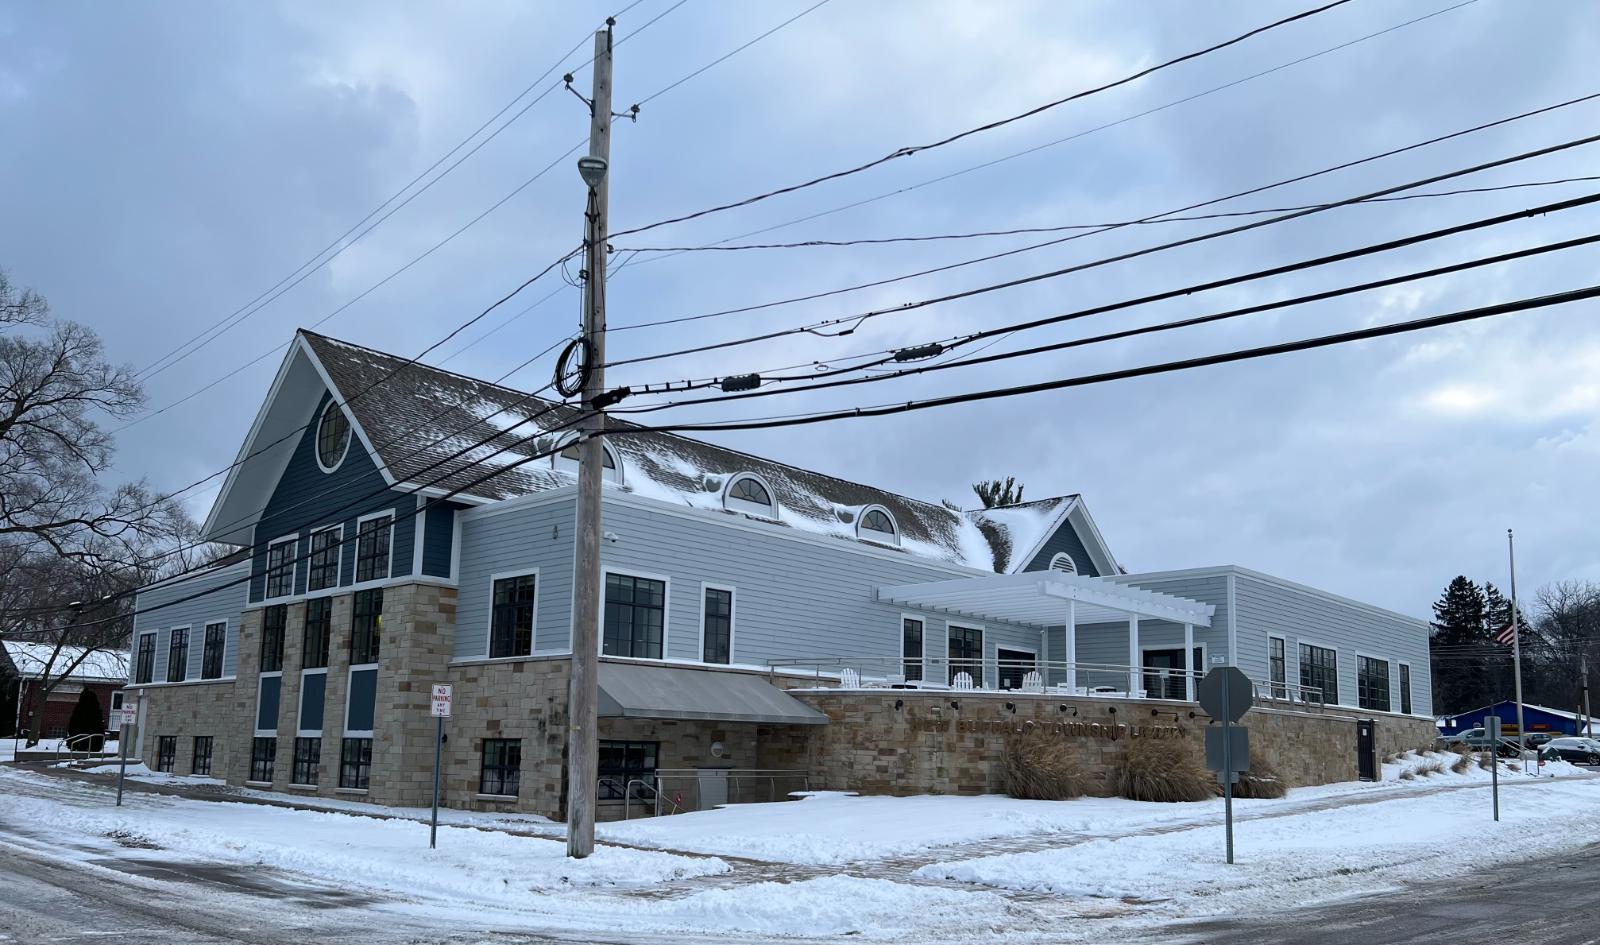
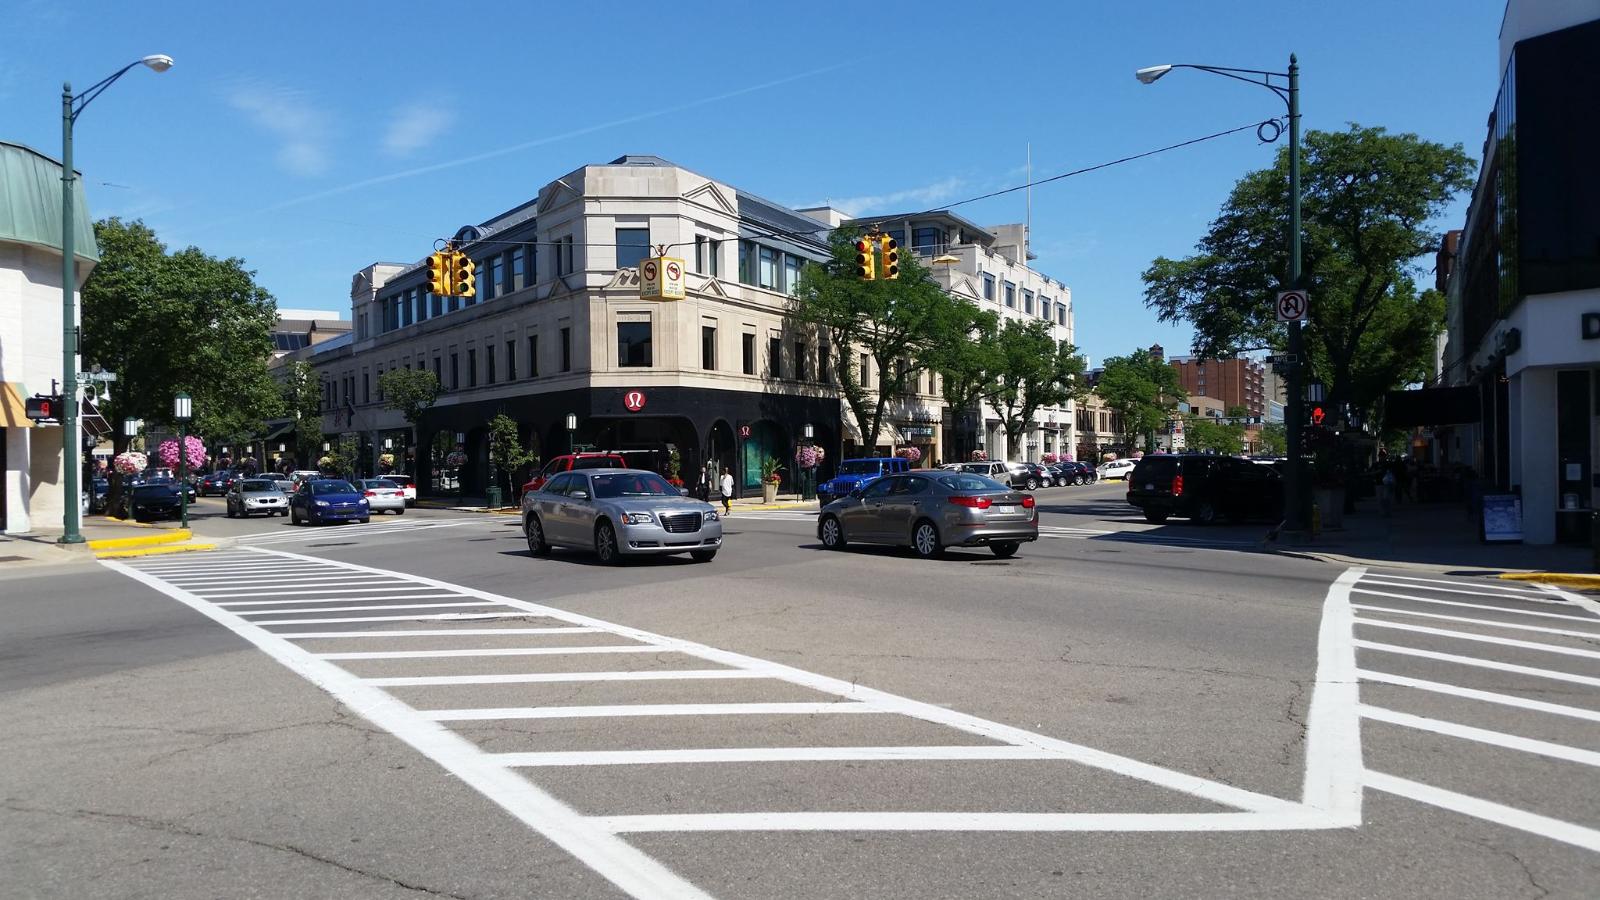
Located in Berrien County along the Lake Michigan shoreline, New Buffalo is a well-known second-home destination for residents of Chicago and Indiana. The town combines a small, walkable downtown with access to marinas, upscale restaurants, and beaches—features that have made it one of the most desirable places to own property in southwest Michigan. Its status as a weekend escape continues to fuel demand even during national housing slowdowns.
Many buyers are willing to pay a premium for the combination of privacy, water access, and boutique amenities. Limited inventory and short-term rental opportunities have also contributed to upward pressure on prices. Although early data in this list is limited, recent years paint a clear picture of sustained value increases driven by consistent outside interest. As long as Chicagoans keep looking east for vacation property, New Buffalo’s housing market will remain firmly in the high-value bracket.
16. Bloomfield Hills – 122.2% Home Price Increase Since 2010
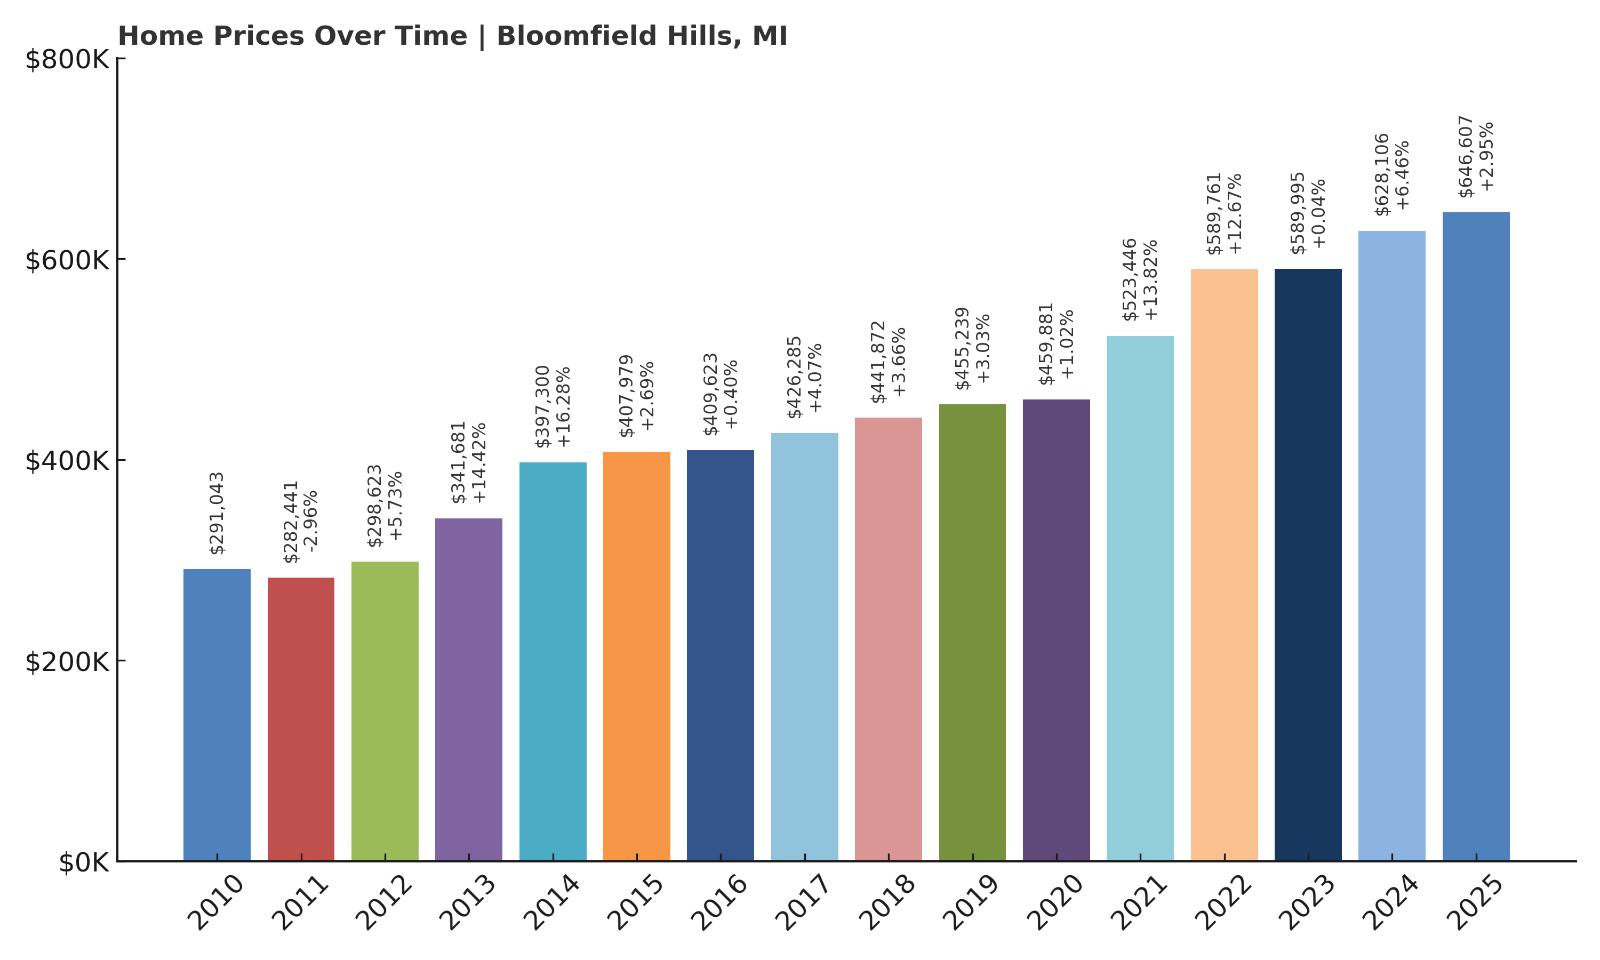
- 2010: $291,043
- 2011: $282,441 (-$8,602, -2.96% from previous year)
- 2012: $298,623 (+$16,182, +5.73% from previous year)
- 2013: $341,681 (+$43,058, +14.42% from previous year)
- 2014: $397,300 (+$55,619, +16.28% from previous year)
- 2015: $407,979 (+$10,680, +2.69% from previous year)
- 2016: $409,623 (+$1,644, +0.40% from previous year)
- 2017: $426,285 (+$16,662, +4.07% from previous year)
- 2018: $441,872 (+$15,587, +3.66% from previous year)
- 2019: $455,239 (+$13,367, +3.03% from previous year)
- 2020: $459,881 (+$4,641, +1.02% from previous year)
- 2021: $523,446 (+$63,566, +13.82% from previous year)
- 2022: $589,761 (+$66,314, +12.67% from previous year)
- 2023: $589,995 (+$234, +0.04% from previous year)
- 2024: $628,106 (+$38,111, +6.46% from previous year)
- 2025: $646,607 (+$18,501, +2.95% from previous year)
Home prices in Bloomfield Hills have more than doubled since 2010, jumping 122% over a 15-year span. Early growth from 2012 to 2014 was especially strong, with two consecutive years of double-digit increases. The market cooled slightly from 2015 to 2020, but a second growth wave began in 2021 with another steep rise. Since then, the town has seen stable annual gains, and prices continue to trend upward, reaching $646,607 in 2025. While recent appreciation isn’t as rapid as the boom years, the consistency points to ongoing buyer confidence in this luxury market.
Bloomfield Hills – Long-Term Value in Metro Detroit
Bloomfield Hills is an affluent suburb north of Detroit known for its spacious estates, exclusive country clubs, and nationally ranked private schools. It’s one of Michigan’s wealthiest communities, often attracting executives, professionals, and legacy families. The area’s strong reputation for safety, zoning that supports large-lot housing, and proximity to downtown Birmingham have helped support high property values.
Unlike some boomtowns that ride temporary demand, Bloomfield Hills has built its pricing power over decades. Its mature housing stock and prestige have given it long-term appeal. Though price gains have slowed somewhat in recent years, the town’s fundamentals remain strong. It’s a classic case of quiet, sustained growth in a blue-chip neighborhood.
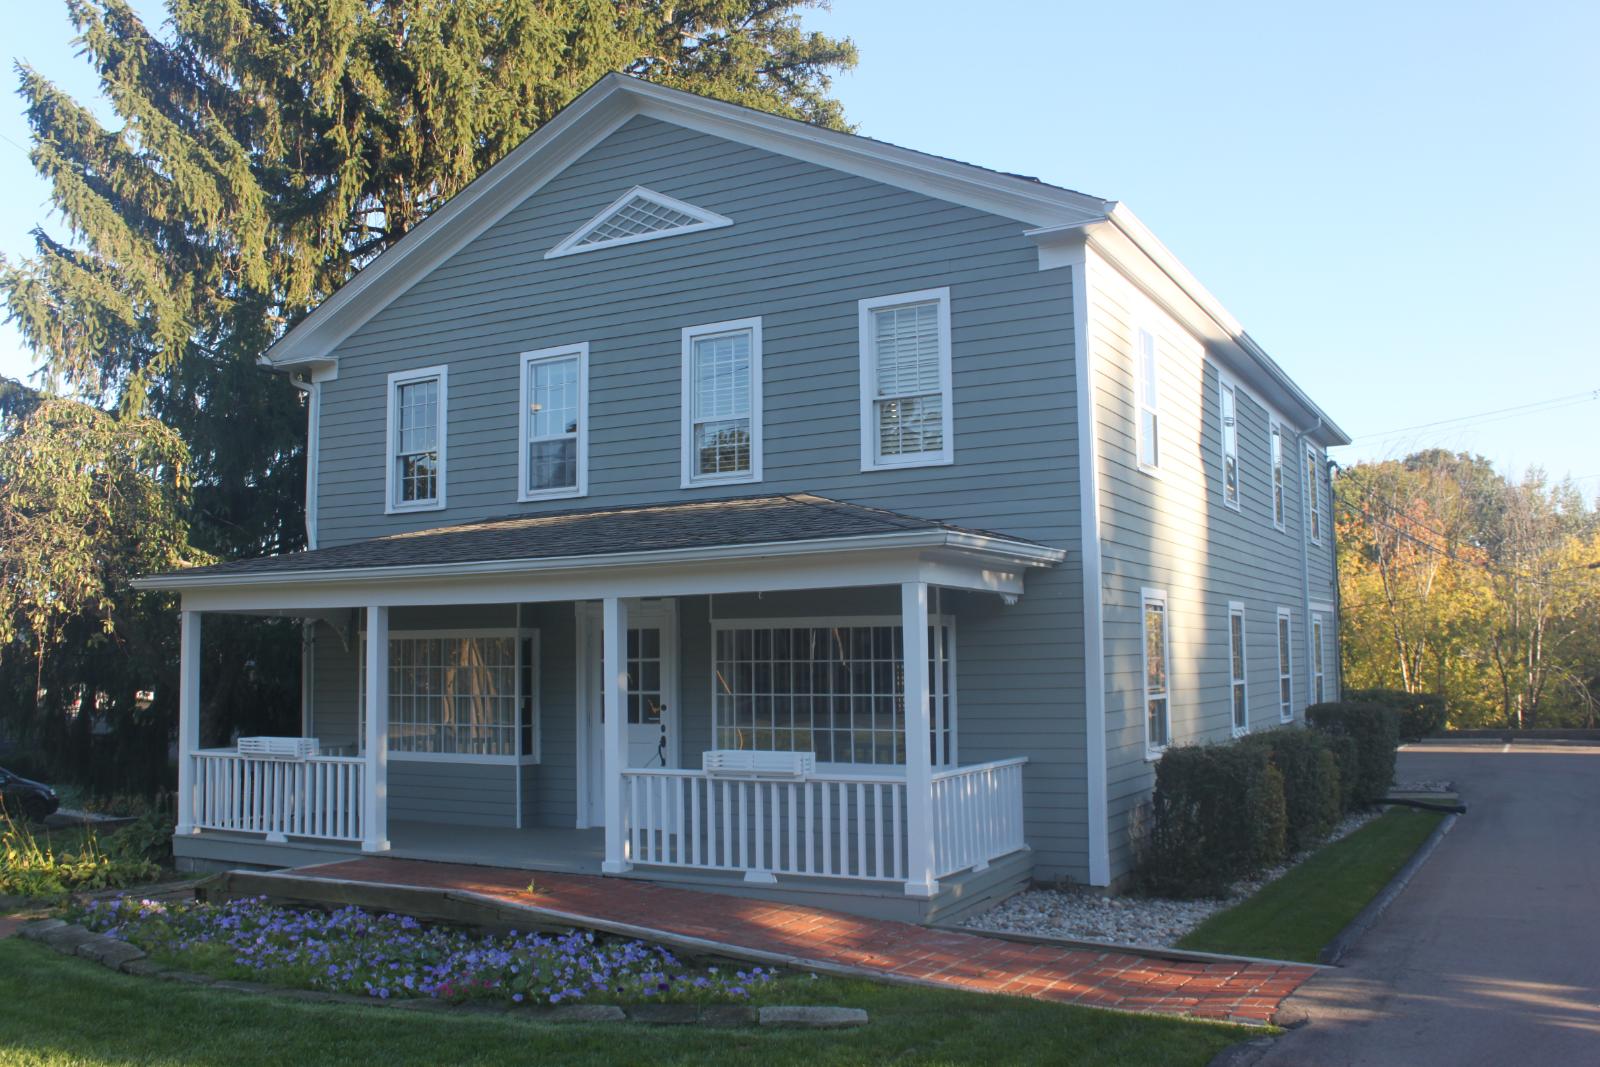
15. Suttons Bay – 136.1% Home Price Increase Since 2010
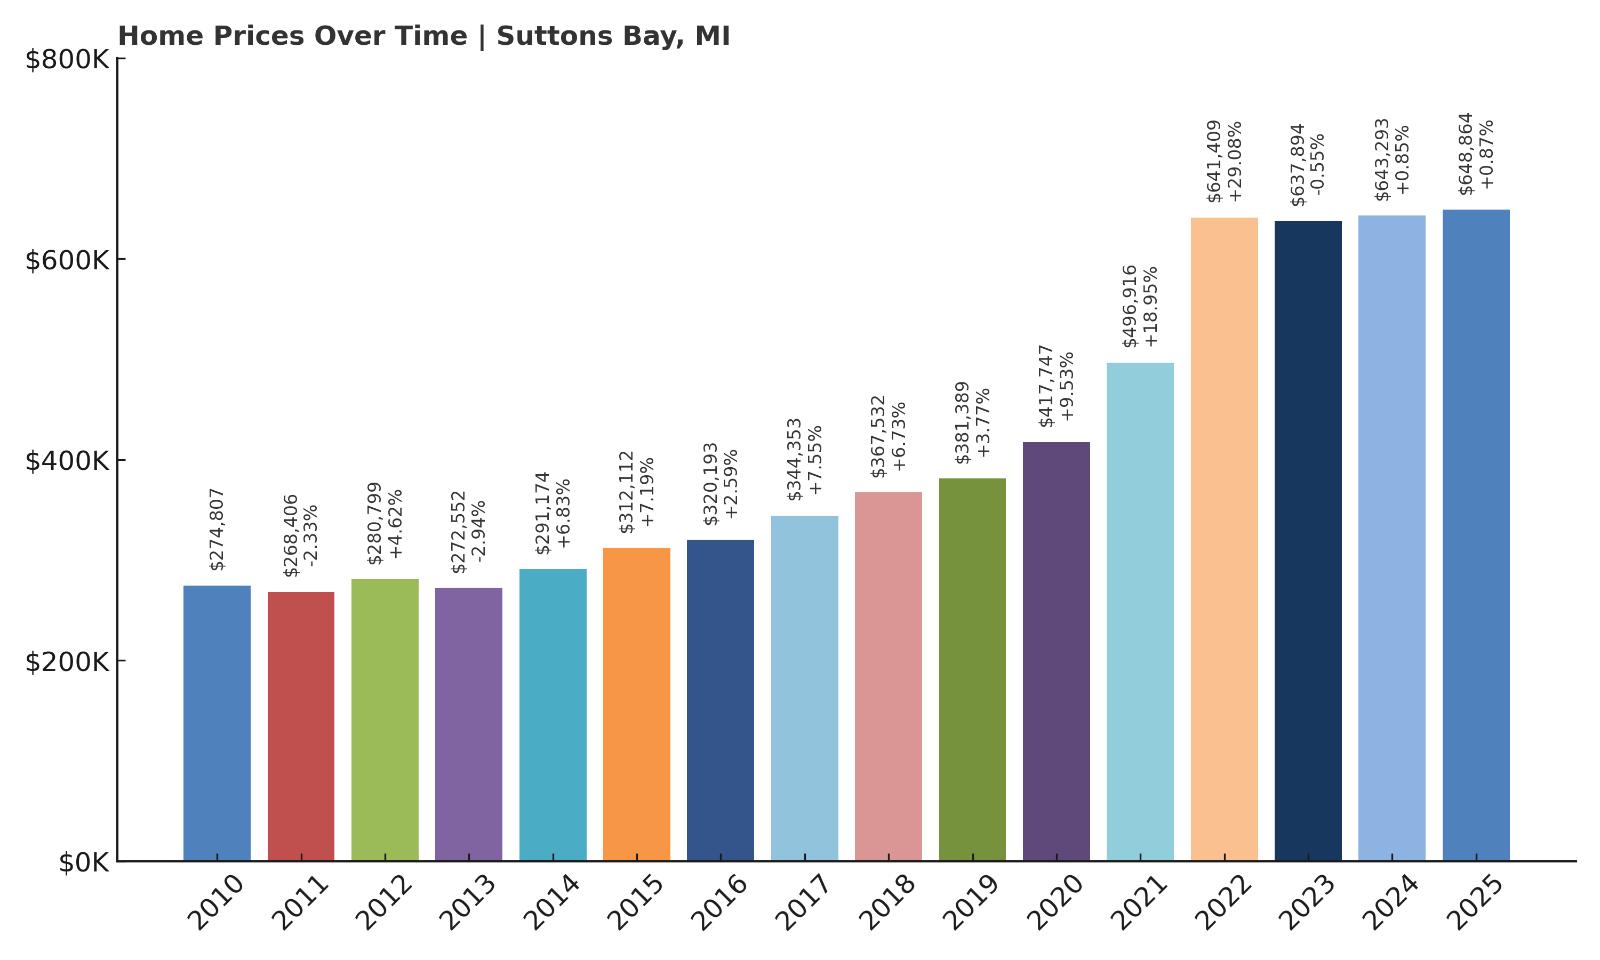
- 2010: $274,807
- 2011: $268,406 (-$6,401, -2.33% from previous year)
- 2012: $280,799 (+$12,393, +4.62% from previous year)
- 2013: $272,552 (-$8,247, -2.94% from previous year)
- 2014: $291,174 (+$18,622, +6.83% from previous year)
- 2015: $312,112 (+$20,938, +7.19% from previous year)
- 2016: $320,193 (+$8,081, +2.59% from previous year)
- 2017: $344,353 (+$24,159, +7.55% from previous year)
- 2018: $367,532 (+$23,180, +6.73% from previous year)
- 2019: $381,389 (+$13,857, +3.77% from previous year)
- 2020: $417,747 (+$36,358, +9.53% from previous year)
- 2021: $496,916 (+$79,169, +18.95% from previous year)
- 2022: $641,409 (+$144,493, +29.08% from previous year)
- 2023: $637,894 (-$3,516, -0.55% from previous year)
- 2024: $643,293 (+$5,399, +0.85% from previous year)
- 2025: $648,864 (+$5,571, +0.87% from previous year)
Suttons Bay has seen its home values rise from $274,807 in 2010 to $648,864 in 2025—an increase of over 136%. The largest leap came in 2022, when values soared nearly 30%. Before and after that, growth has been steadier, but the trend is clearly upward. While 2023 saw a slight dip, prices bounced back modestly in 2024 and 2025. Overall, this market has seen a dramatic climb in the past five years and continues to hold strong, likely driven by both lifestyle appeal and limited supply.
Suttons Bay – Northern Charm with Tourist Appeal
Situated along the Leelanau Peninsula just north of Traverse City, Suttons Bay is a picturesque village with vineyards, cherry orchards, and lakefront views. It’s become increasingly popular as a vacation home destination, with its historic downtown and proximity to Lake Michigan attracting both seasonal and year-round residents. The surrounding countryside and relaxed pace make it a sought-after retreat.
Suttons Bay’s rapid price increase in 2022 suggests a burst of demand, possibly from out-of-state buyers seeking scenic properties post-COVID. Short-term rental potential and limited housing stock may have added to the upward pressure. Although recent years have shown signs of leveling, home values remain among the highest in northern Michigan.
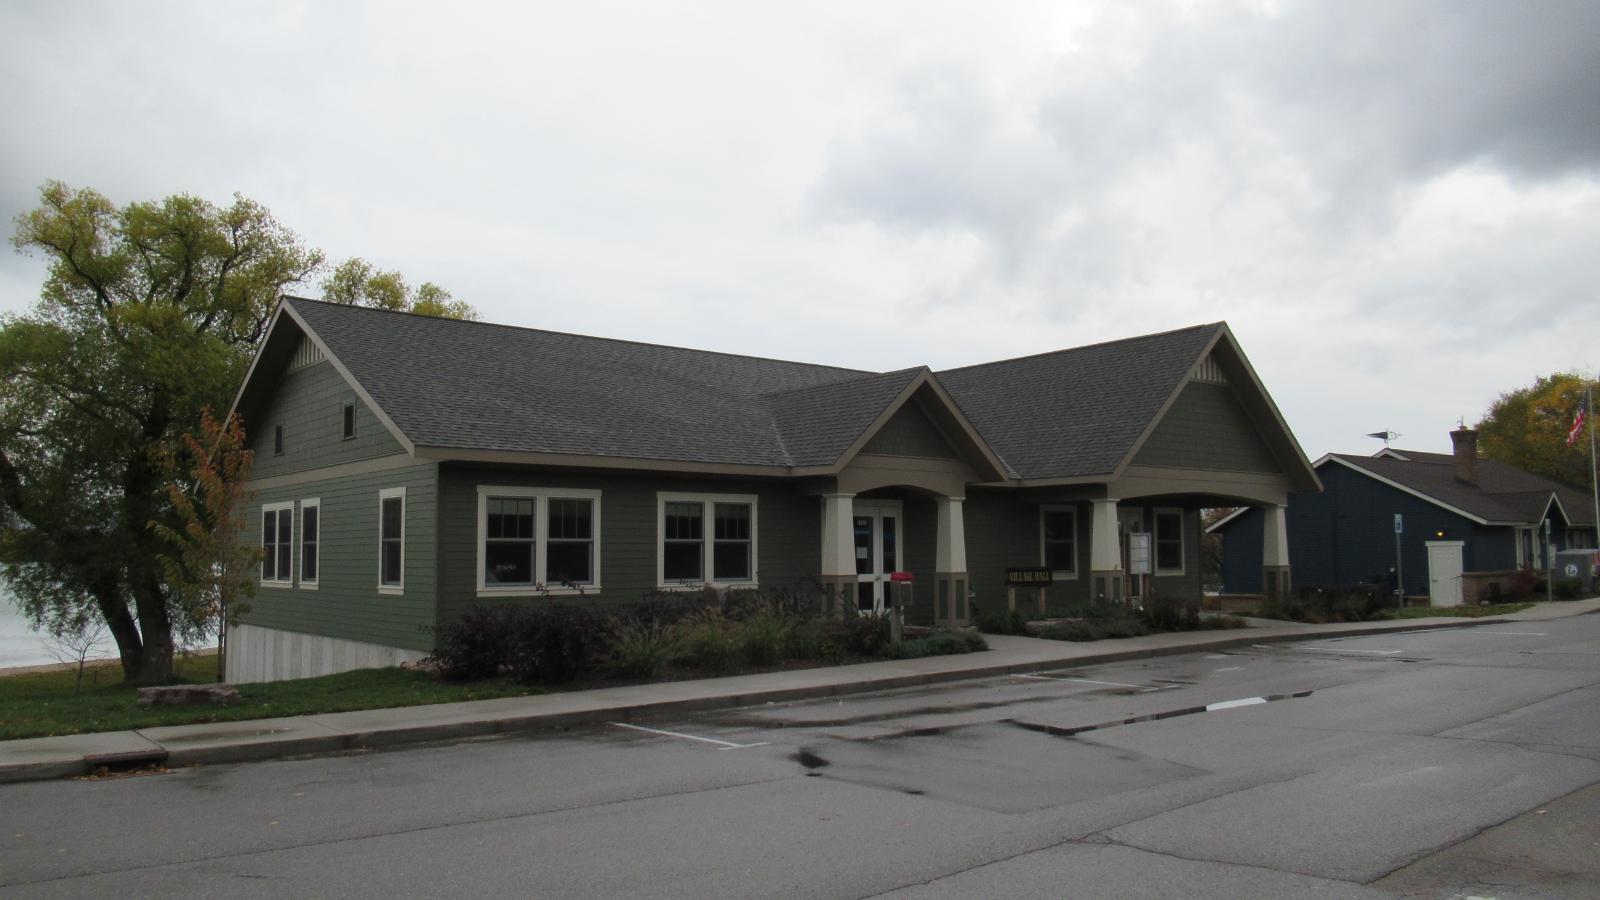
14. Douglas – 125.9% Home Price Increase Since 2010
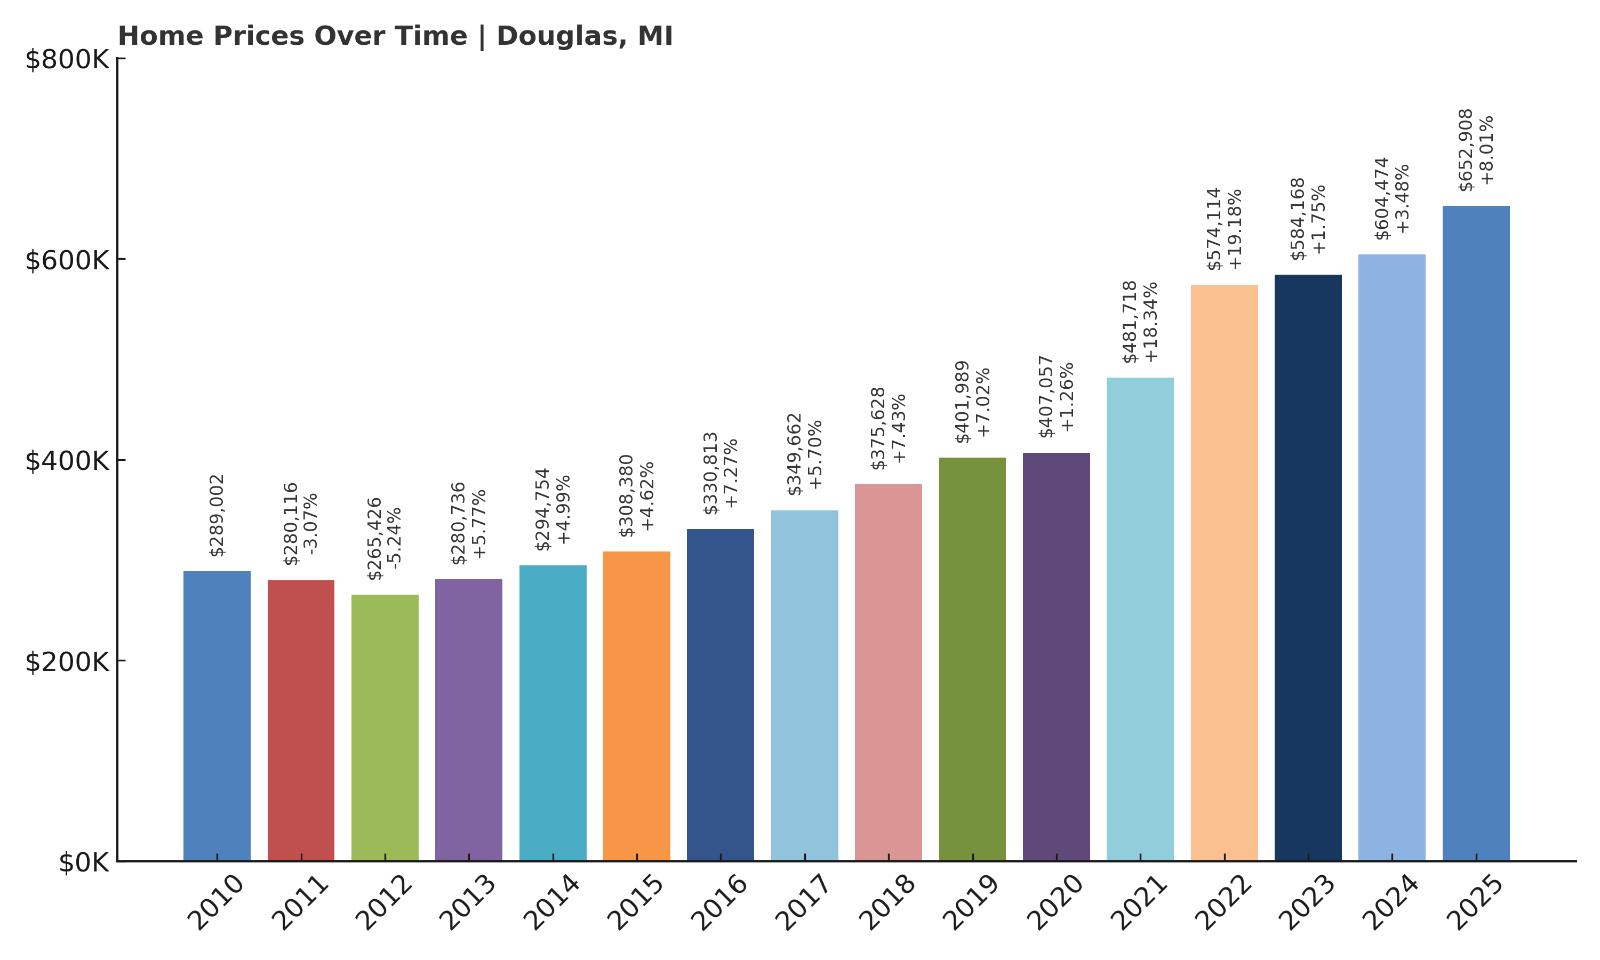
- 2010: $289,002
- 2011: $280,116 (-$8,886, -3.07% from previous year)
- 2012: $265,426 (-$14,691, -5.24% from previous year)
- 2013: $280,736 (+$15,311, +5.77% from previous year)
- 2014: $294,754 (+$14,018, +4.99% from previous year)
- 2015: $308,380 (+$13,626, +4.62% from previous year)
- 2016: $330,813 (+$22,433, +7.27% from previous year)
- 2017: $349,662 (+$18,849, +5.70% from previous year)
- 2018: $375,628 (+$25,967, +7.43% from previous year)
- 2019: $401,989 (+$26,361, +7.02% from previous year)
- 2020: $407,057 (+$5,068, +1.26% from previous year)
- 2021: $481,718 (+$74,661, +18.34% from previous year)
- 2022: $574,114 (+$92,397, +19.18% from previous year)
- 2023: $584,168 (+$10,054, +1.75% from previous year)
- 2024: $604,474 (+$20,306, +3.48% from previous year)
- 2025: $652,908 (+$48,434, +8.01% from previous year)
Douglas home prices have more than doubled over the last 15 years, increasing from $289,002 in 2010 to $652,908 in 2025. While there was a slight decline in the early 2010s, the market rebounded quickly starting in 2013. From there, Douglas experienced a healthy streak of consistent annual gains. In particular, the period from 2020 to 2022 saw rapid appreciation, including a 19.18% surge in 2022 alone. Although price growth has slowed slightly since then, recent years have continued the upward trajectory, ending with an 8% increase in 2025. This long-term price trend reflects steady interest in the town’s lakeside lifestyle and limited housing supply.
Douglas – Creative Culture and Lake Michigan Living
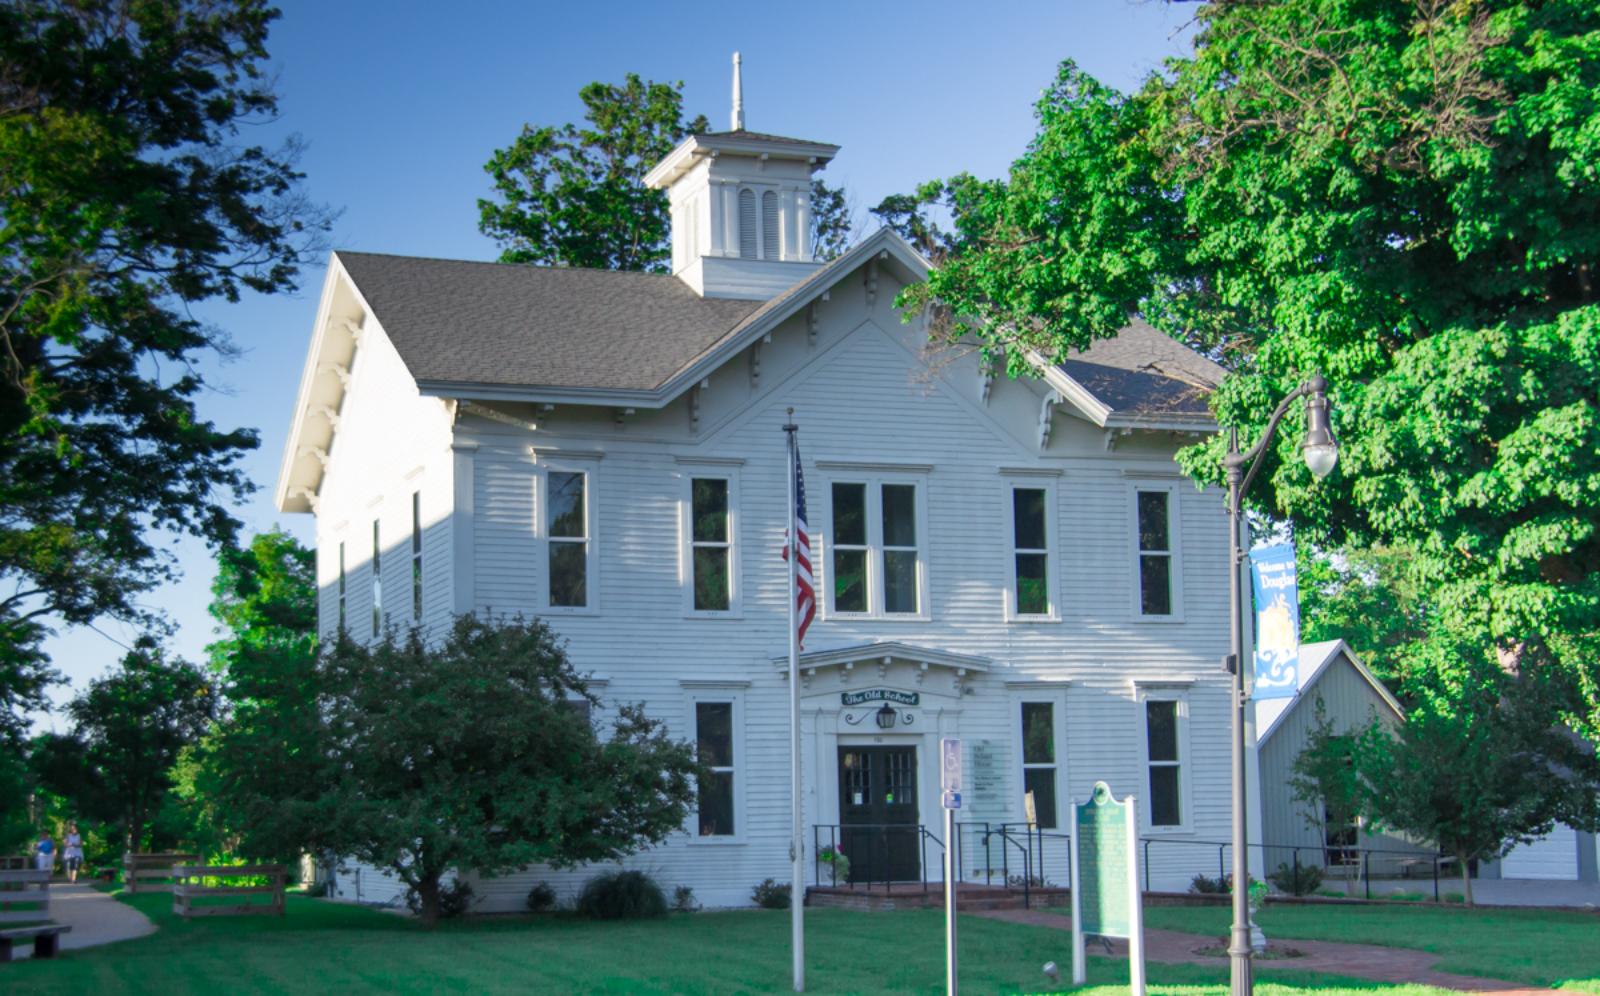
Douglas sits just inland from the Lake Michigan shoreline in Allegan County and is known for its vibrant arts community and relaxed, small-town vibe. Along with neighboring Saugatuck, it forms one of Michigan’s most beloved cultural and resort areas. Douglas offers art galleries, local boutiques, charming inns, and access to the Kalamazoo River and Oval Beach—consistently ranked among the best beaches in the Midwest. Its year-round population is small, but the town swells with visitors in the summer, fueling strong demand for second homes and vacation rentals. Despite its growing popularity, Douglas has managed to avoid overdevelopment, which adds to its exclusive feel and keeps inventory tight.
The post-2020 housing surge in Douglas was fueled by remote workers, retirees, and investors seeking property near the lake that still feels authentic and community-driven. The combination of walkability, natural beauty, and cultural offerings makes it appealing across demographics. Even homes away from the waterfront command premium prices thanks to the area’s aesthetic and lifestyle appeal. The town’s seasonal tourism economy continues to support local businesses and helps justify high property values. With home prices now above $650,000, Douglas has cemented its place as one of Michigan’s top-tier real estate markets. For buyers seeking a creative, beachside retreat with long-term upside, Douglas checks nearly every box.
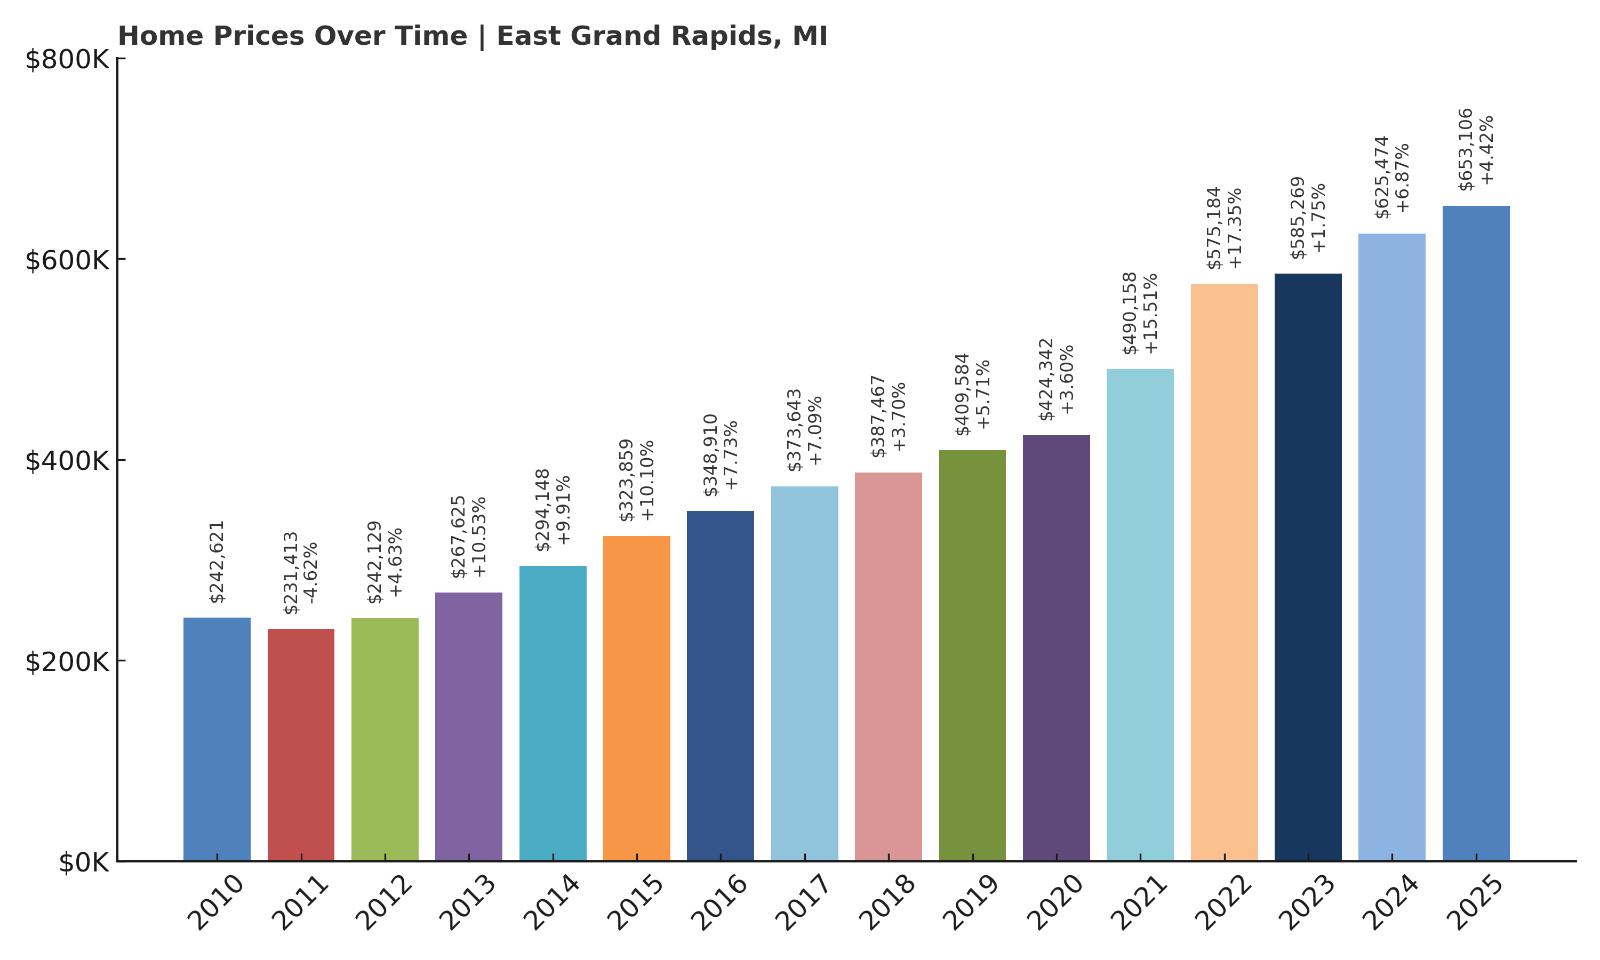
13. East Grand Rapids – 169.3% Home Price Increase Since 2010
- 2010: $242,621
- 2011: $231,413 (-$11,209, -4.62% from previous year)
- 2012: $242,129 (+$10,716, +4.63% from previous year)
- 2013: $267,625 (+$25,495, +10.53% from previous year)
- 2014: $294,148 (+$26,523, +9.91% from previous year)
- 2015: $323,859 (+$29,711, +10.10% from previous year)
- 2016: $348,910 (+$25,050, +7.73% from previous year)
- 2017: $373,643 (+$24,733, +7.09% from previous year)
- 2018: $387,467 (+$13,824, +3.70% from previous year)
- 2019: $409,584 (+$22,117, +5.71% from previous year)
- 2020: $424,342 (+$14,758, +3.60% from previous year)
- 2021: $490,158 (+$65,816, +15.51% from previous year)
- 2022: $575,184 (+$85,027, +17.35% from previous year)
- 2023: $585,269 (+$10,084, +1.75% from previous year)
- 2024: $625,474 (+$40,206, +6.87% from previous year)
- 2025: $653,106 (+$27,631, +4.42% from previous year)
East Grand Rapids has seen remarkable growth in home prices, rising from $242,621 in 2010 to $653,106 in 2025—a nearly 170% increase. Much of this appreciation has been driven by steady gains through the 2010s and a major acceleration between 2020 and 2022. Those two years alone added over $150,000 to the average home value. After a brief cooling period, prices continued upward again in 2024 and 2025. The town’s ability to maintain momentum following rapid growth shows its market strength. With consistent demand, excellent amenities, and a strong reputation, East Grand Rapids remains one of the state’s most competitive housing markets.
East Grand Rapids – Premium Schools and Cityside Appeal
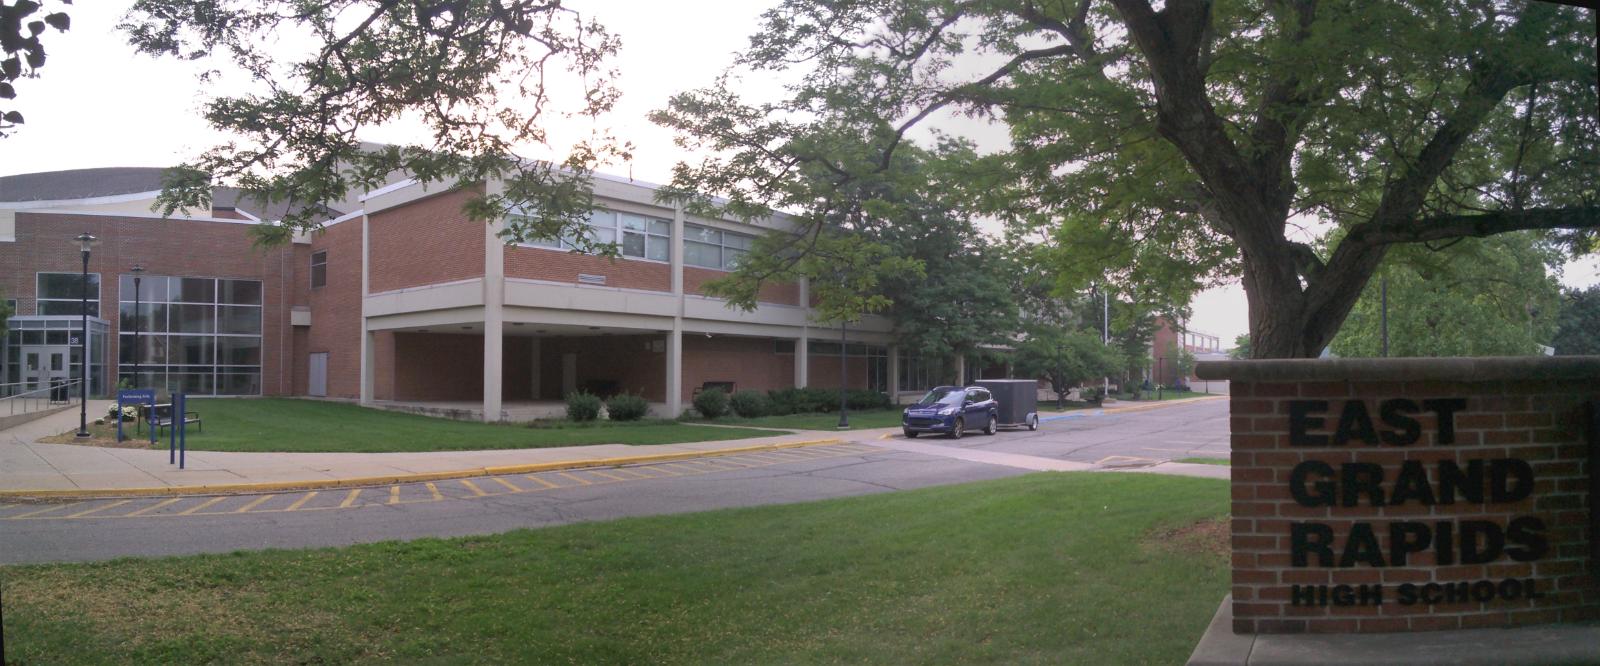
East Grand Rapids is one of the most desirable residential areas in western Michigan. Located just southeast of downtown Grand Rapids, it offers a combination of city proximity and quiet, leafy neighborhoods. The town is especially well-known for its top-ranked public school system, which consistently draws families who are willing to pay a premium to live in the district. Reeds Lake, at the center of the community, adds recreational and aesthetic value, with waterfront properties in high demand. The local business district, Gaslight Village, features upscale dining, shopping, and coffee spots that attract both residents and visitors. Altogether, the town has crafted a winning formula: suburban calm with access to urban excitement.
Real estate in East Grand Rapids benefits from limited inventory and high turnover demand. Many homes sell quickly, often above asking price, and few lots remain for new construction. That scarcity, combined with consistent demand from families and professionals, has fueled long-term price growth. Even during broader economic slowdowns, East Grand Rapids has held its value better than most surrounding areas. The strong post-pandemic price increases were not just a blip—they built on years of momentum and reflected the area’s growing popularity. With home values now in the mid-$600K range, it’s clear this small but powerful market shows no signs of slowing. Buyers continue to treat East Grand Rapids as a safe and attractive bet in West Michigan’s housing landscape.
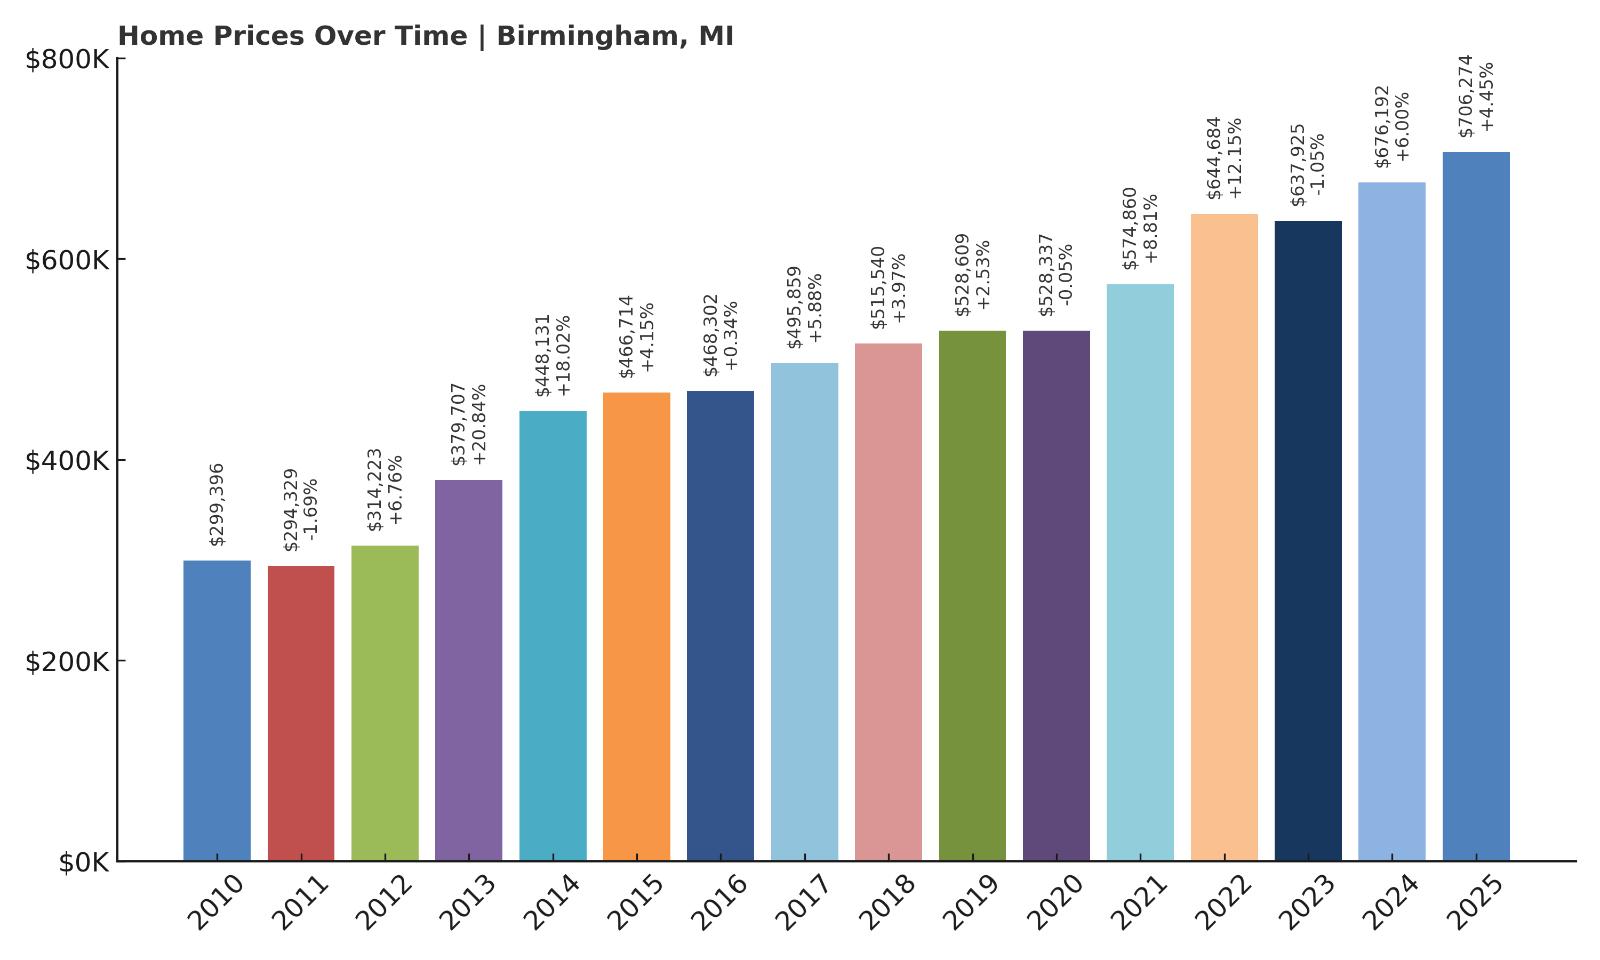
12. Birmingham – 135.9% Home Price Increase Since 2010
- 2010: $299,396
- 2011: $294,329 (-$5,068, -1.69% from previous year)
- 2012: $314,223 (+$19,894, +6.76% from previous year)
- 2013: $379,707 (+$65,484, +20.84% from previous year)
- 2014: $448,131 (+$68,423, +18.02% from previous year)
- 2015: $466,714 (+$18,584, +4.15% from previous year)
- 2016: $468,302 (+$1,588, +0.34% from previous year)
- 2017: $495,859 (+$27,556, +5.88% from previous year)
- 2018: $515,540 (+$19,681, +3.97% from previous year)
- 2019: $528,609 (+$13,069, +2.53% from previous year)
- 2020: $528,337 (-$271, -0.05% from previous year)
- 2021: $574,860 (+$46,523, +8.81% from previous year)
- 2022: $644,684 (+$69,824, +12.15% from previous year)
- 2023: $637,925 (-$6,759, -1.05% from previous year)
- 2024: $676,192 (+$38,267, +6.00% from previous year)
- 2025: $706,274 (+$30,082, +4.45% from previous year)
Home prices in Birmingham have surged from $299,396 in 2010 to over $706,000 in 2025—a 135.9% increase. After a minor dip in 2011, the town saw major jumps in 2013 and 2014, with back-to-back double-digit increases. Growth slowed after that, with smaller but steady gains until 2020. A second wave of acceleration started in 2021, including a 12.15% rise in 2022. Even after a small drop in 2023, the market bounced back, with strong gains in 2024 and 2025. These patterns point to consistent long-term value and resilience, even during periods of broader housing market turbulence.
Birmingham – Suburban Sophistication With Urban Perks
Birmingham sits just 20 miles north of downtown Detroit but feels worlds apart in character and real estate profile. It’s a walkable, upscale suburb that blends boutique shopping, fine dining, and well-kept residential neighborhoods. Home to a vibrant downtown and highly rated public schools, Birmingham offers all the conveniences of city living without sacrificing suburban charm. The area’s tree-lined streets and carefully maintained historic homes contribute to its visual appeal and high property values. Wealthy professionals, young families, and empty nesters alike have made Birmingham one of the most desirable addresses in southeast Michigan. Recent price increases are supported by low inventory, strong demand, and a stream of buyers looking to settle in a place that feels both lively and secure. Even during slower economic periods, Birmingham has proven to be a market where prices hold or recover quickly. Its reputation as a polished, premium suburb helps explain why values continue to trend upward over time.
The jump in prices from 2010 to 2015 was likely driven by a post-recession rebound, but the consistent appreciation since then shows that Birmingham’s housing strength is not a short-term spike. The town’s location between other high-value communities like Bloomfield Hills and Royal Oak also supports its pricing floor. Proximity to major employers, top-tier schools, and cultural institutions gives residents reasons to stay put, further limiting turnover and keeping competition high for available properties. Birmingham’s careful balance of old-money prestige and modern amenities has made it a rare case of sustained growth without overdevelopment. Even as some areas around metro Detroit have seen cooling, Birmingham remains a safe bet for long-term investment. With 2025 prices topping $700,000, it’s clear the town’s trajectory is steady and strong—and very likely to continue.
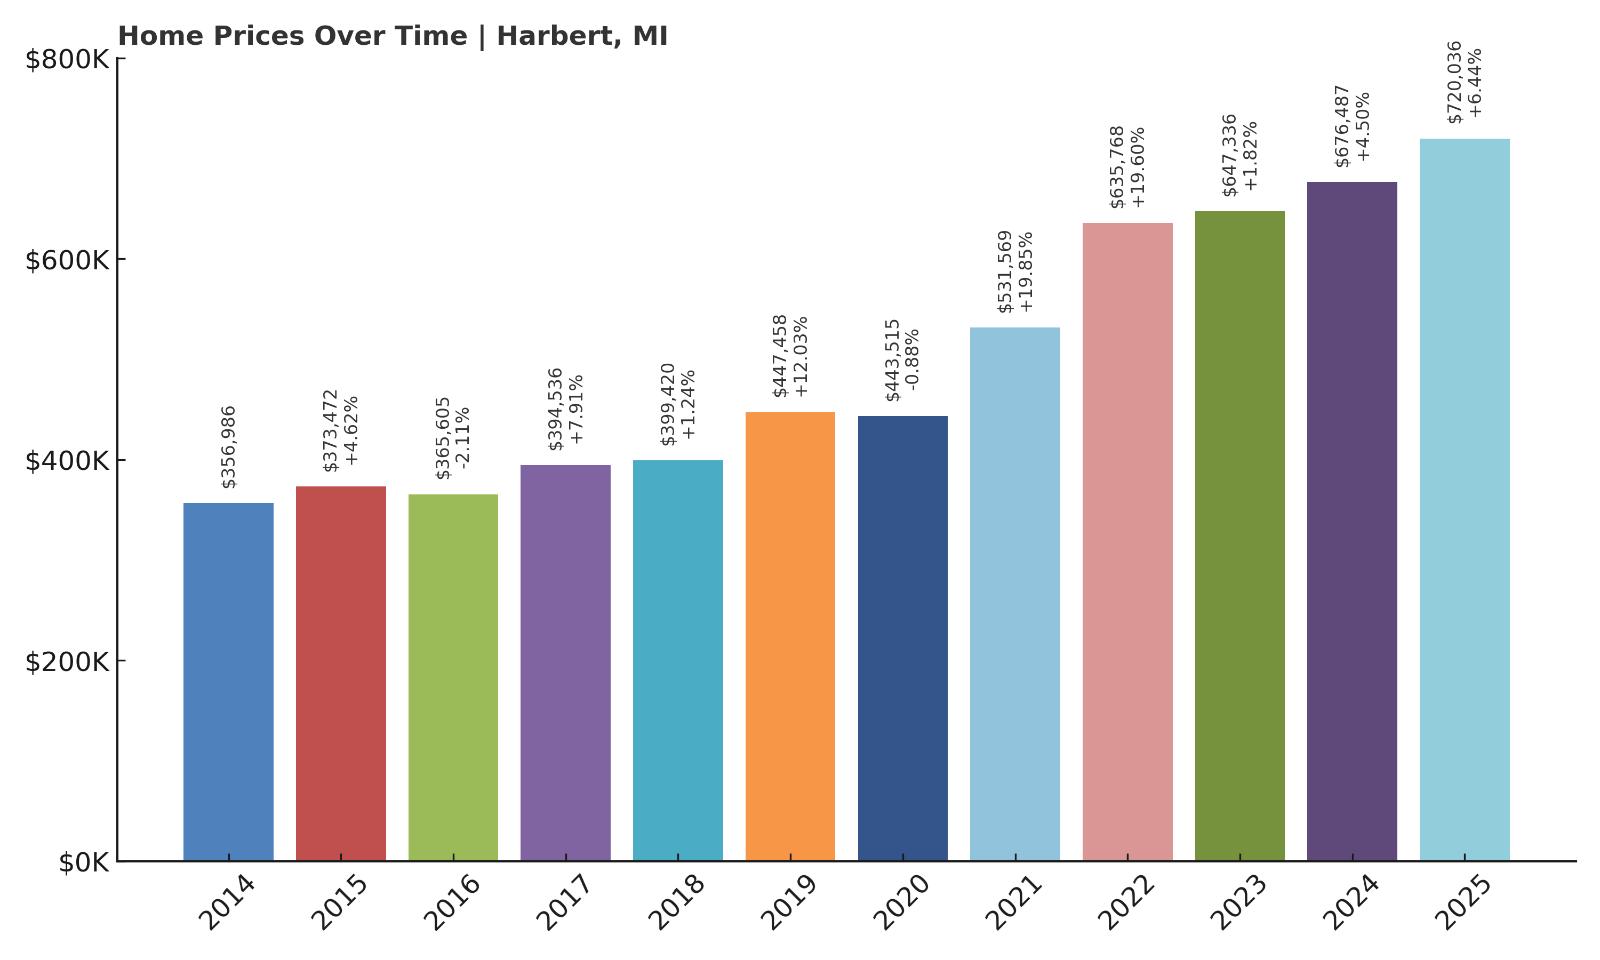
11. Harbert – 101.6% Home Price Increase Since 2014
🔥 Would you like to save this?
- 2010: N/A
- 2011: N/A
- 2012: N/A
- 2013: N/A
- 2014: $356,986
- 2015: $373,472 (+$16,486, +4.62% from previous year)
- 2016: $365,605 (-$7,867, -2.11% from previous year)
- 2017: $394,536 (+$28,931, +7.91% from previous year)
- 2018: $399,420 (+$4,884, +1.24% from previous year)
- 2019: $447,458 (+$48,039, +12.03% from previous year)
- 2020: $443,515 (-$3,943, -0.88% from previous year)
- 2021: $531,569 (+$88,054, +19.85% from previous year)
- 2022: $635,768 (+$104,199, +19.60% from previous year)
- 2023: $647,336 (+$11,568, +1.82% from previous year)
- 2024: $676,487 (+$29,151, +4.50% from previous year)
- 2025: $720,036 (+$43,549, +6.44% from previous year)
Harbert’s home prices have climbed more than 100% since 2014, beginning at $356,986 and reaching $720,036 by 2025. The largest spikes came in 2021 and 2022, when the market saw two back-to-back years of nearly 20% growth. A modest dip in 2020 did little to slow the overall trend, and the last three years have seen steady annual gains. The data suggests strong and rising demand for properties in this area, despite occasional volatility. Harbert’s pricing surge has placed it firmly in the upper tier of Michigan real estate, especially among lakefront communities.
Harbert – Quiet Luxury Near the Shoreline
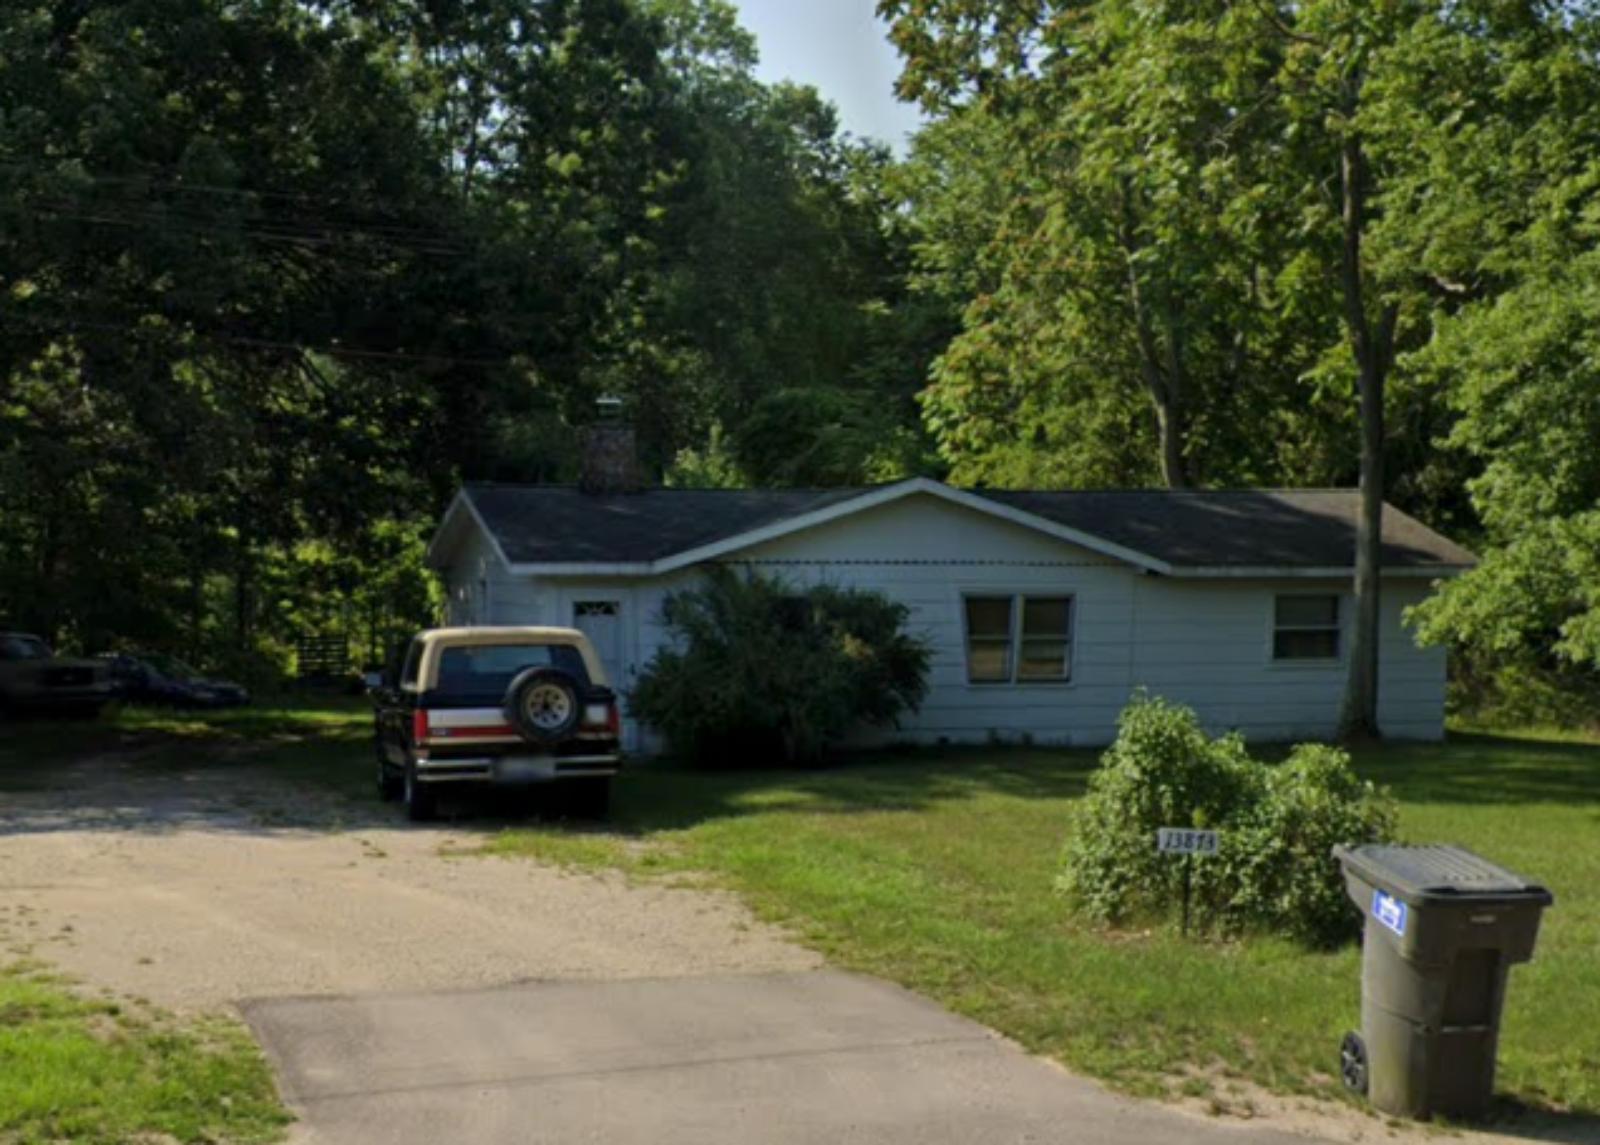
Harbert is a small but upscale unincorporated community in Berrien County, nestled along the Lake Michigan coast. It’s part of what’s known as Harbor Country—a stretch of scenic lakeshore towns favored by Chicagoans looking for peaceful second homes. Harbert doesn’t have a bustling downtown, but that’s exactly the draw for many of its buyers. It offers quiet roads, beachfront access, and a mix of cottages and modern builds tucked behind wooded lots. With limited commercial development, the area maintains a secluded feel while still being close to Sawyer, New Buffalo, and Union Pier. This exclusivity, paired with the region’s natural beauty, helps explain the spike in values—particularly since 2020, when remote work allowed more people to buy vacation homes.
Price appreciation in Harbert has been sharp but not erratic. The double-digit growth seen in 2021 and 2022 reflected a broader trend of lakeside demand skyrocketing during the pandemic housing boom. Yet, unlike more volatile markets, Harbert didn’t crash afterward—it simply transitioned into more moderate growth. That suggests a healthy base of long-term buyers rather than speculative investors. The area’s character, including its art galleries and proximity to Warren Dunes State Park, adds further appeal. While homes don’t change hands often here, when they do, they fetch a premium. As of 2025, crossing the $700K mark puts Harbert among Michigan’s elite home markets, and its low inventory means those prices are unlikely to retreat anytime soon.
10. Grosse Pointe Shores – 156.5% Home Price Increase Since 2010
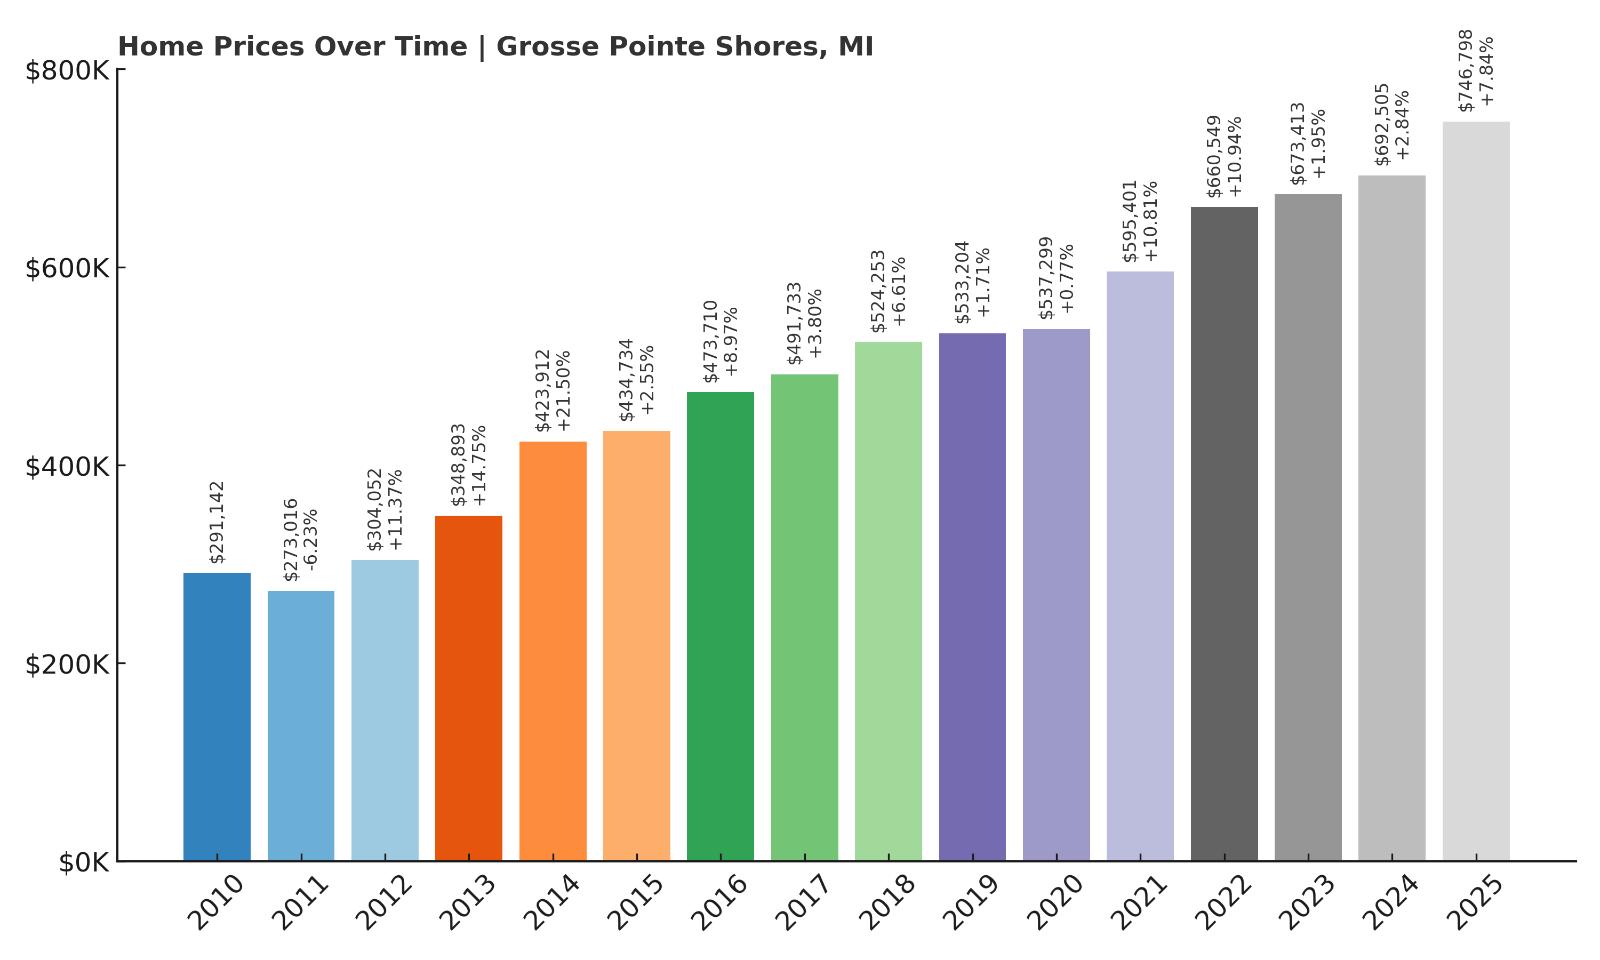
- 2010: $291,142
- 2011: $273,016 (-$18,126, -6.23% from previous year)
- 2012: $304,052 (+$31,036, +11.37% from previous year)
- 2013: $348,893 (+$44,841, +14.75% from previous year)
- 2014: $423,912 (+$75,019, +21.50% from previous year)
- 2015: $434,734 (+$10,822, +2.55% from previous year)
- 2016: $473,710 (+$38,976, +8.97% from previous year)
- 2017: $491,733 (+$18,022, +3.80% from previous year)
- 2018: $524,253 (+$32,520, +6.61% from previous year)
- 2019: $533,204 (+$8,951, +1.71% from previous year)
- 2020: $537,299 (+$4,094, +0.77% from previous year)
- 2021: $595,401 (+$58,102, +10.81% from previous year)
- 2022: $660,549 (+$65,148, +10.94% from previous year)
- 2023: $673,413 (+$12,864, +1.95% from previous year)
- 2024: $692,505 (+$19,092, +2.84% from previous year)
- 2025: $746,798 (+$54,292, +7.84% from previous year)
Home prices in Grosse Pointe Shores have soared by over 156% since 2010, climbing from $291,142 to nearly $747,000 in 2025. The biggest leap came between 2013 and 2014, when values spiked by over 21%. Since then, appreciation has remained steady, with consistent year-over-year growth. The years 2021 and 2022 also saw significant jumps, each exceeding 10% as buyers moved to desirable suburban waterfront locations. Even after those surges, 2023 through 2025 have added further gains, suggesting that demand remains strong. The market reflects a blend of historic affluence and renewed interest in well-established neighborhoods with lake views and proximity to Detroit.
Grosse Pointe Shores – Historic Elegance and Lakefront Prestige
Located along the eastern edge of Wayne County, Grosse Pointe Shores is the most exclusive of the Grosse Pointe communities. With its tree-lined streets, stately waterfront mansions, and the Grosse Pointe Yacht Club anchoring its shoreline, this town represents one of the most traditionally upscale addresses in all of Michigan. Its population is small—under 3,000—but the real estate profile is outsized. Many homes in Grosse Pointe Shores sit directly on Lake St. Clair, offering panoramic water views and private docks. The neighborhood’s old-money charm, excellent schools, and civic pride have made it a mainstay for high-net-worth families. Even homes that aren’t on the water tend to carry premium price tags, thanks to large lots and historic architecture.
Housing turnover is relatively low here, which adds scarcity pressure to an already competitive market. The town’s zoning laws and historic preservation efforts also limit the pace of new construction, helping sustain demand for existing properties. As remote and hybrid work reshaped buyer preferences post-2020, places like Grosse Pointe Shores—with space, privacy, and lifestyle amenities—gained even more appeal. Despite being just a short drive from downtown Detroit, the area feels removed from urban density and congestion. The steady price increases over the past five years indicate a strong market built on deep roots and generational wealth rather than speculative trends. In 2025, average prices closing in on $750,000 confirm the town’s status as one of Michigan’s most valuable places to live.
9. Northport – 134.1% Home Price Increase Since 2010
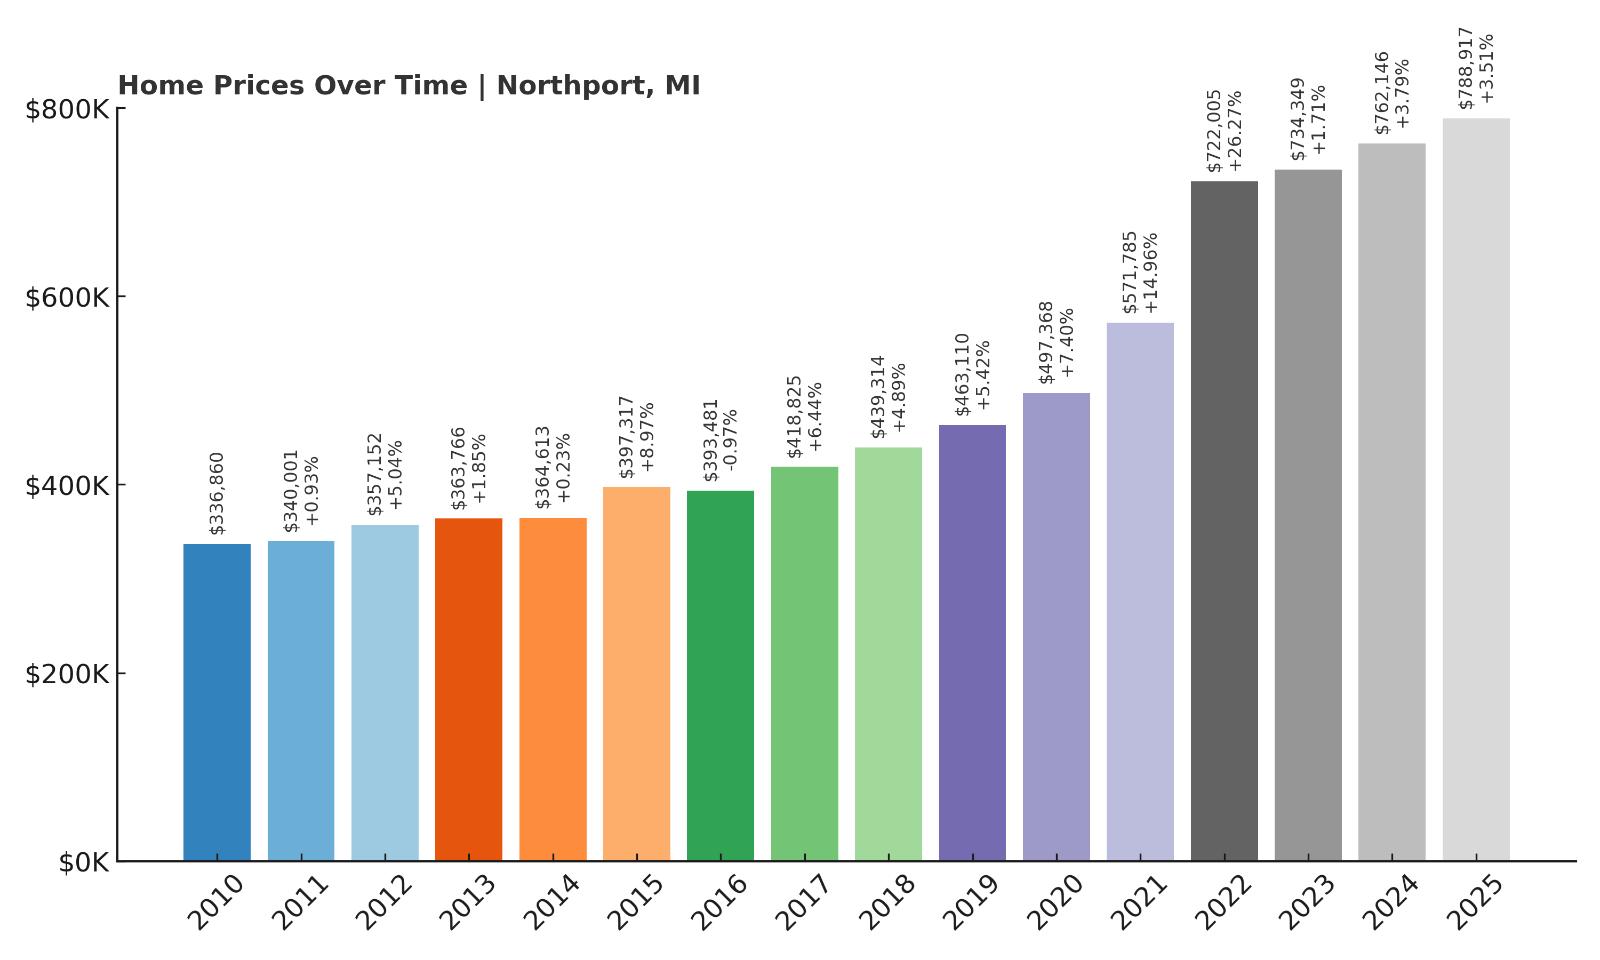
- 2010: $336,860
- 2011: $340,001 (+$3,141, +0.93% from previous year)
- 2012: $357,152 (+$17,151, +5.04% from previous year)
- 2013: $363,766 (+$6,614, +1.85% from previous year)
- 2014: $364,613 (+$847, +0.23% from previous year)
- 2015: $397,317 (+$32,704, +8.97% from previous year)
- 2016: $393,481 (-$3,836, -0.97% from previous year)
- 2017: $418,825 (+$25,344, +6.44% from previous year)
- 2018: $439,314 (+$20,488, +4.89% from previous year)
- 2019: $463,110 (+$23,797, +5.42% from previous year)
- 2020: $497,368 (+$34,258, +7.40% from previous year)
- 2021: $571,785 (+$74,416, +14.96% from previous year)
- 2022: $722,005 (+$150,220, +26.27% from previous year)
- 2023: $734,349 (+$12,344, +1.71% from previous year)
- 2024: $762,146 (+$27,797, +3.79% from previous year)
- 2025: $788,917 (+$26,771, +3.51% from previous year)
Northport’s home prices have climbed from $336,860 in 2010 to $788,917 in 2025—an impressive 134% increase. Much of this growth has been steady, but 2022 marked a breakout year with a massive 26.27% spike. Earlier years saw consistent, modest increases, with occasional small dips. Price appreciation in recent years has stayed strong, with three straight years of gains from 2023 to 2025. The data signals that Northport is now firmly positioned as a top-tier housing market in northern Michigan, especially appealing to those looking for a quieter, scenic lifestyle away from urban centers.
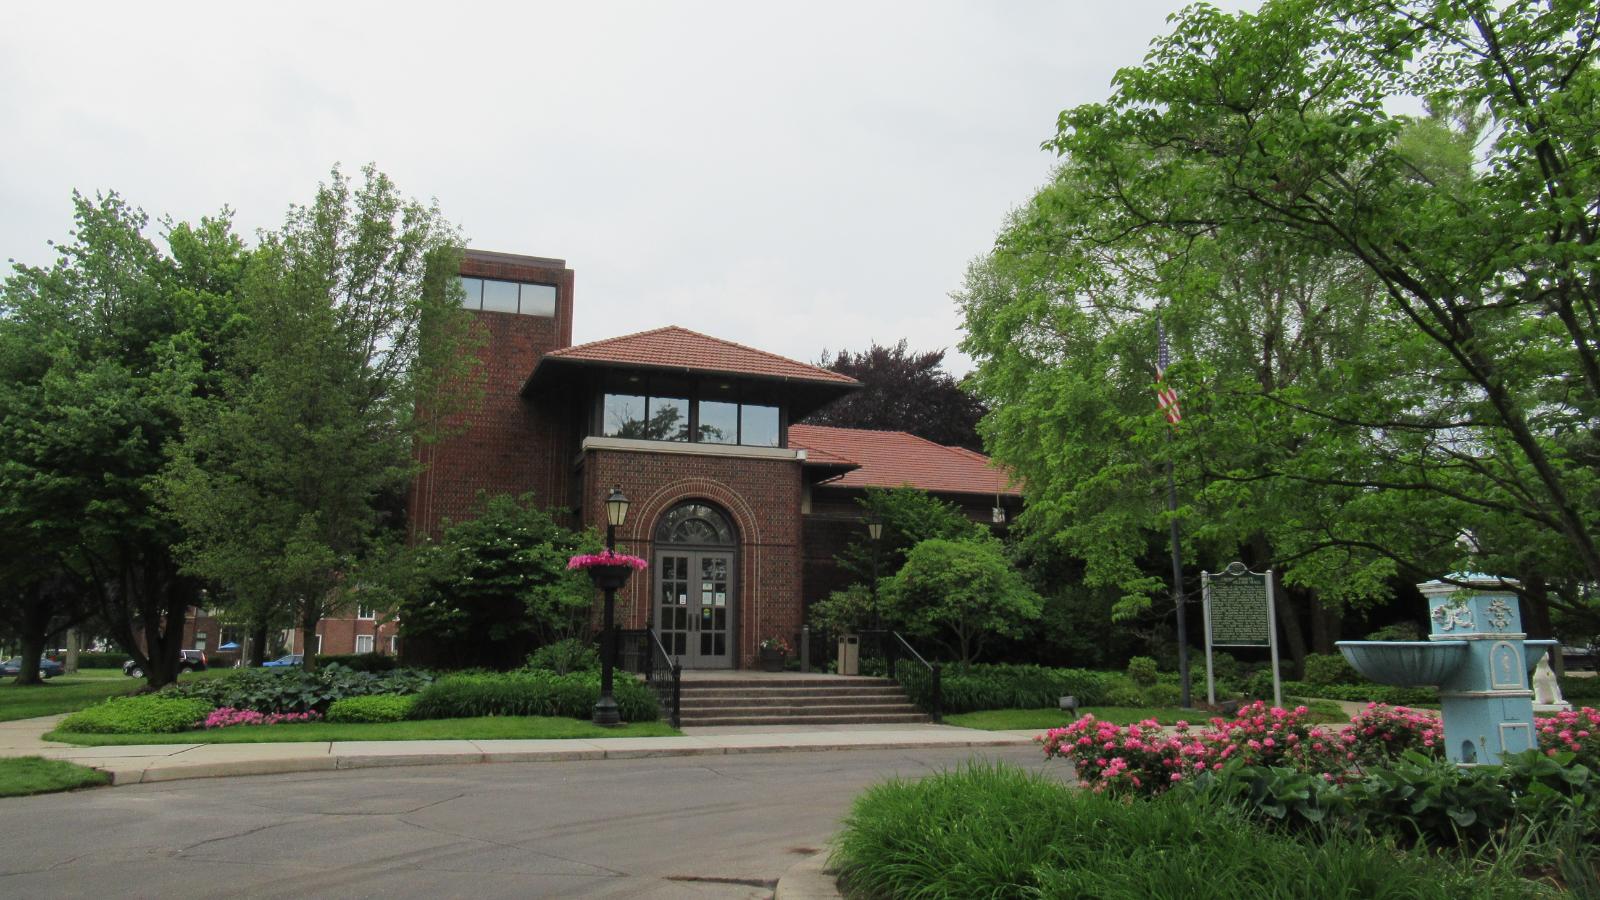
Northport – Quiet Leelanau Living With Steady Growth
Perched at the northern tip of the Leelanau Peninsula, Northport is one of Michigan’s most remote yet charming villages. With a population under 600, the town feels like a well-kept secret, even as its housing prices tell a story of rising visibility and demand. Northport has long been known for its marina, cherry orchards, and the iconic Grand Traverse Lighthouse nearby. What sets it apart is the sense of peace and seclusion it offers—a haven for retirees, seasonal homeowners, and remote workers alike. The area’s natural beauty, small-town community, and slower pace of life make it increasingly attractive as people look to escape busy metro areas. For many buyers, that appeal is well worth the price, and Northport has seen a growing number of high-end homes appear on the market over the past decade.
While the town’s amenities are limited—no large grocery stores or major employers—its proximity to Suttons Bay and Traverse City provides easy access to services without compromising the rural charm. The enormous price spike in 2022 likely reflects a broader trend of migration toward remote, picturesque locations post-COVID. Yet even after that surge, the market has continued to rise in a more controlled way, which suggests the growth was not a temporary bubble. With lakefront properties commanding premiums and few new developments underway, Northport is likely to remain a tight, high-demand housing market. The fact that prices have more than doubled since 2010, with minimal volatility, shows how strong the fundamentals are in this tiny, tranquil town.
8. Union Pier – 100.1% Home Price Increase Since 2010
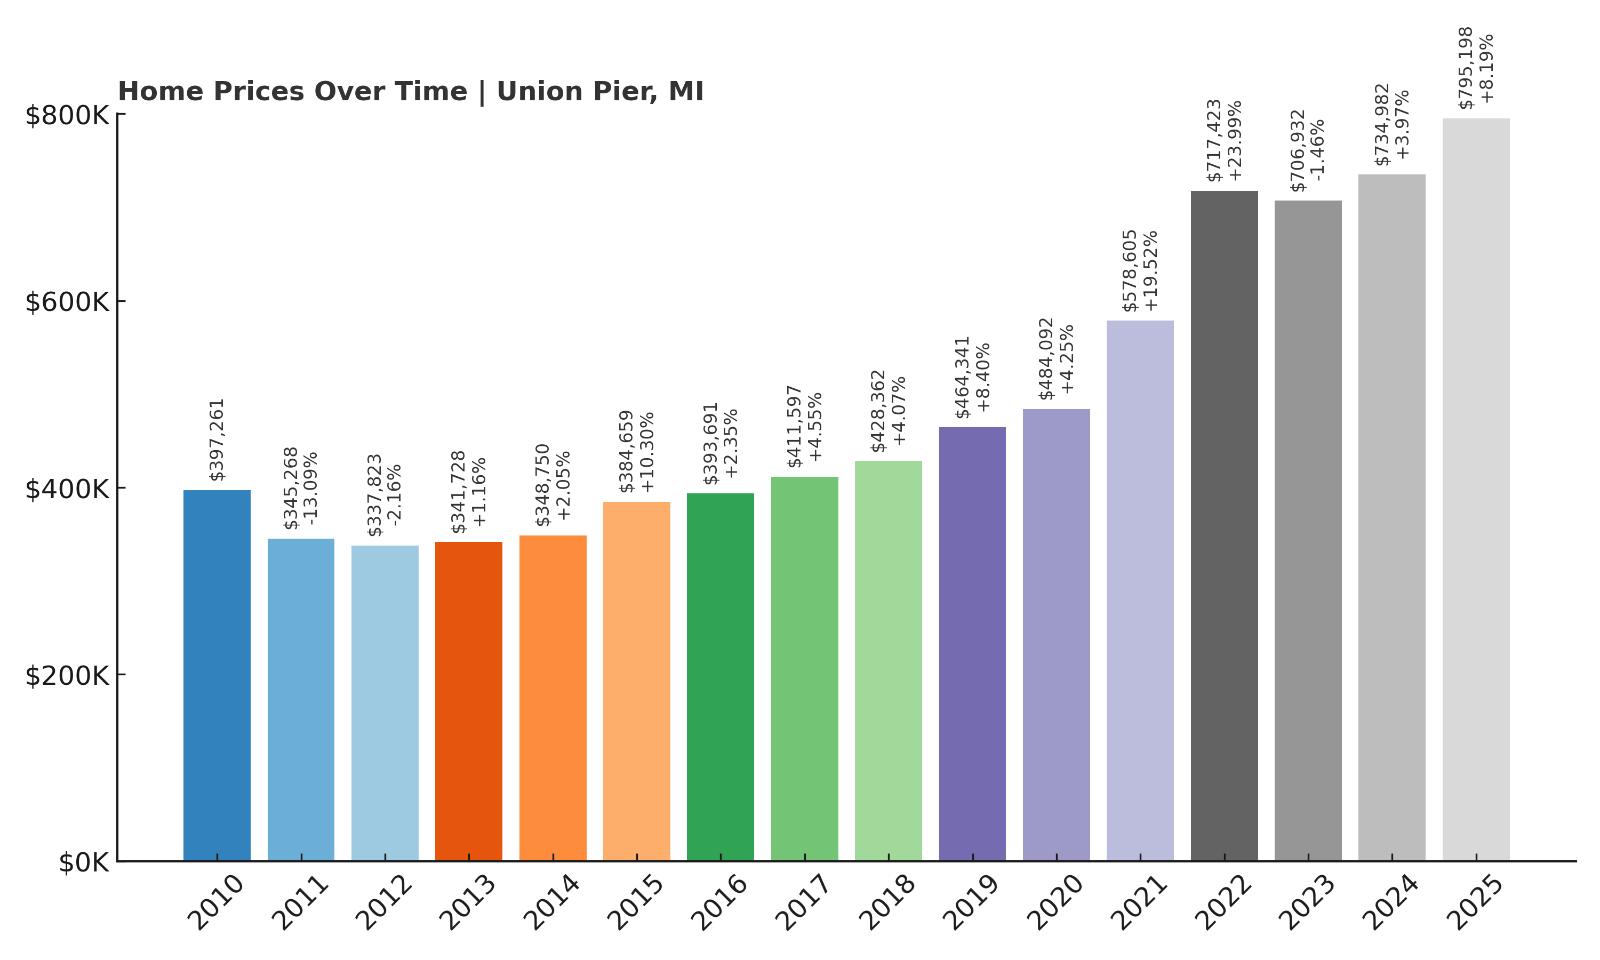
- 2010: $397,261
- 2011: $345,268 (-$51,992, -13.09% from previous year)
- 2012: $337,823 (-$7,445, -2.16% from previous year)
- 2013: $341,728 (+$3,904, +1.16% from previous year)
- 2014: $348,750 (+$7,022, +2.05% from previous year)
- 2015: $384,659 (+$35,909, +10.30% from previous year)
- 2016: $393,691 (+$9,032, +2.35% from previous year)
- 2017: $411,597 (+$17,906, +4.55% from previous year)
- 2018: $428,362 (+$16,764, +4.07% from previous year)
- 2019: $464,341 (+$35,979, +8.40% from previous year)
- 2020: $484,092 (+$19,751, +4.25% from previous year)
- 2021: $578,605 (+$94,513, +19.52% from previous year)
- 2022: $717,423 (+$138,818, +23.99% from previous year)
- 2023: $706,932 (-$10,491, -1.46% from previous year)
- 2024: $734,982 (+$28,050, +3.97% from previous year)
- 2025: $795,198 (+$60,217, +8.19% from previous year)
Union Pier’s housing market has grown steadily over the past 15 years, with prices jumping from $397,261 in 2010 to $795,198 in 2025. After an early decline in 2011 and 2012, the town rebounded and maintained consistent growth for over a decade. Major gains came in 2021 and 2022, with back-to-back increases of 19.5% and 24%. A brief dip in 2023 didn’t last long—prices bounced back with solid growth in 2024 and an even stronger performance in 2025. With a 100% increase since 2010, Union Pier continues to rank among Michigan’s most desirable lake towns.
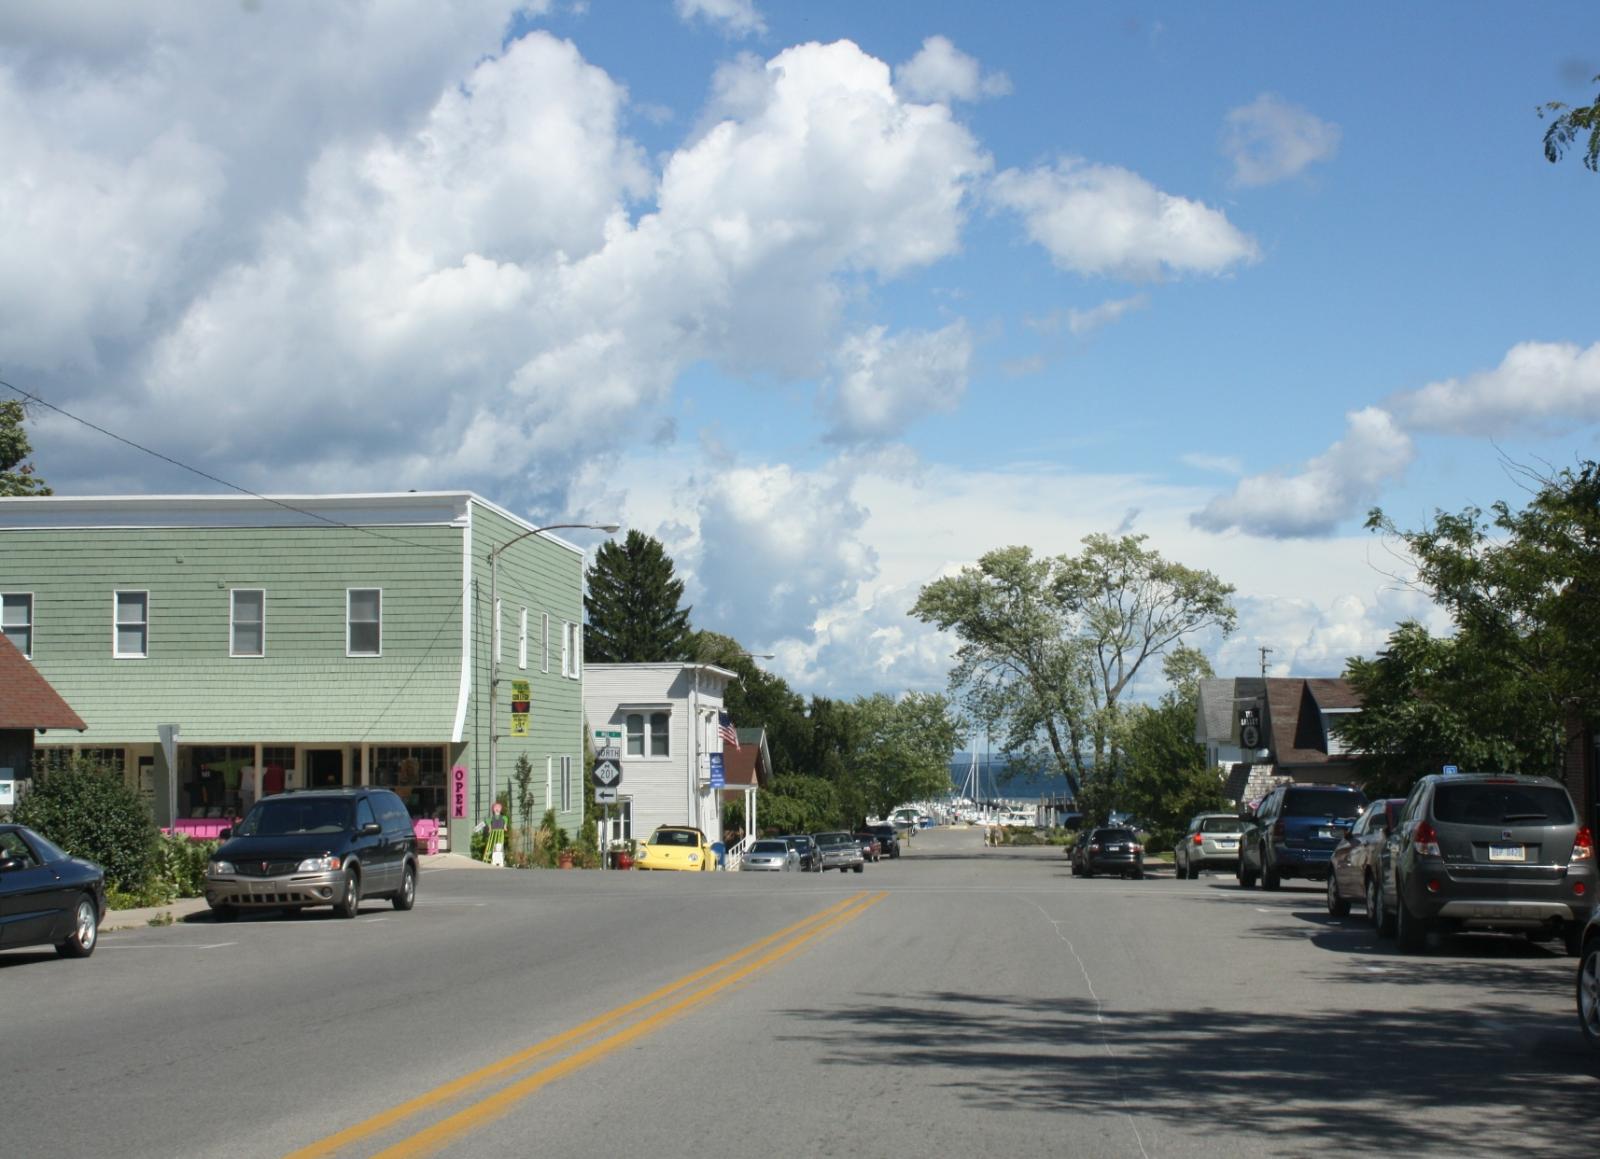
Union Pier – Second-Home Favorite on the Rise
Union Pier is one of the most sought-after communities in southwest Michigan’s Harbor Country. It blends rustic charm with beach-town appeal and draws vacationers from Chicago and beyond. Its location along Lake Michigan and mix of historic cottages and modern lake homes create a strong aesthetic pull. Unlike bigger tourist towns, Union Pier remains relatively quiet, especially during the off-season, which only adds to its appeal. The town has limited commercial development—mostly art galleries, cafes, and boutique inns—which helps preserve its character and desirability. This balance between accessibility and seclusion has helped maintain steady demand over the years. During the housing boom of 2021 and 2022, Union Pier’s appeal spiked, and buyers snapped up inventory quickly.
While prices dipped slightly in 2023, the bounce-back in 2024 and strong 8.19% gain in 2025 indicate that the market remains hot. Many homes in Union Pier are used as vacation rentals, and the town’s short-term rental market has added investment appeal. Lakefront homes and those within walking distance to the beach command significant premiums. With minimal new development, high demand, and limited availability, values are expected to remain high in the foreseeable future. Union Pier may not be as flashy as some resort destinations, but its loyal following and timeless appeal continue to push the market upward. The data confirms what many locals already know—this is one of the most valuable and enduring markets on Michigan’s western coast.
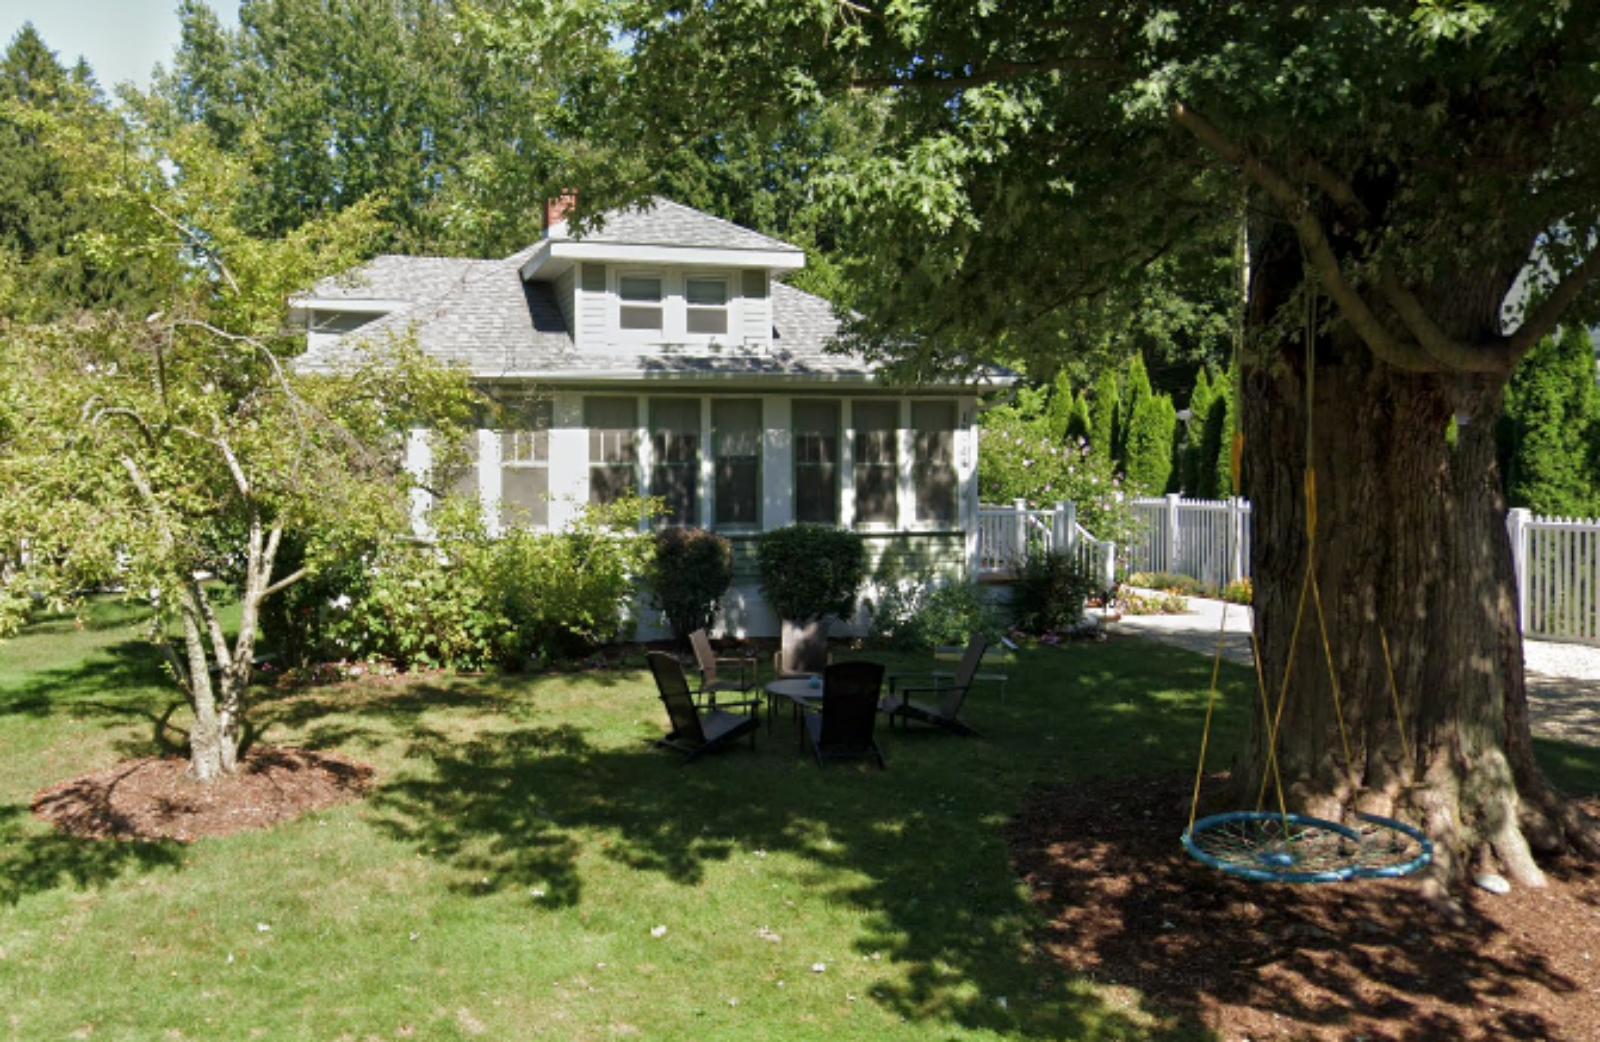
7. Kewadin – 183.6% Home Price Increase Since 2010
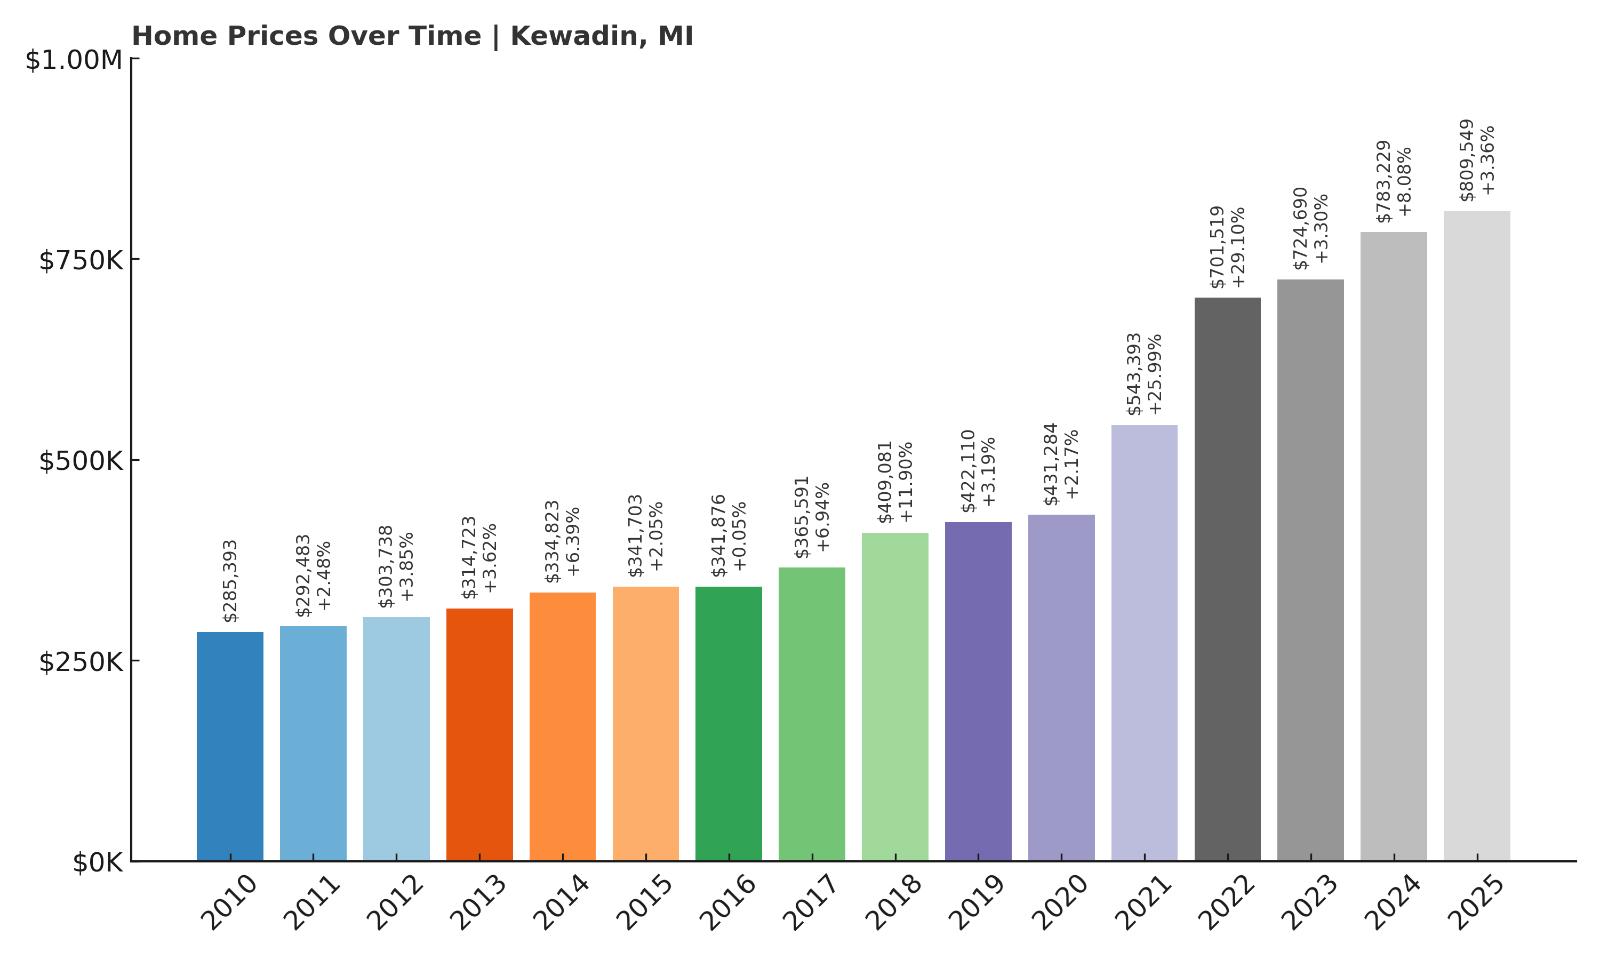
- 2010: $285,393
- 2011: $292,483 (+$7,090, +2.48% from previous year)
- 2012: $303,738 (+$11,256, +3.85% from previous year)
- 2013: $314,723 (+$10,984, +3.62% from previous year)
- 2014: $334,823 (+$20,100, +6.39% from previous year)
- 2015: $341,703 (+$6,881, +2.05% from previous year)
- 2016: $341,876 (+$173, +0.05% from previous year)
- 2017: $365,591 (+$23,715, +6.94% from previous year)
- 2018: $409,081 (+$43,489, +11.90% from previous year)
- 2019: $422,110 (+$13,029, +3.19% from previous year)
- 2020: $431,284 (+$9,174, +2.17% from previous year)
- 2021: $543,393 (+$112,108, +25.99% from previous year)
- 2022: $701,519 (+$158,127, +29.10% from previous year)
- 2023: $724,690 (+$23,171, +3.30% from previous year)
- 2024: $783,229 (+$58,538, +8.08% from previous year)
- 2025: $809,549 (+$26,320, +3.36% from previous year)
Kewadin has seen a dramatic increase in home prices, rising from $285,393 in 2010 to $809,549 in 2025—an increase of nearly 184%. The largest jump came between 2020 and 2022, when values surged over 55% in just two years. Prior to that, the market had shown steady but moderate growth, with consistent annual gains since the early 2010s. Even after the explosive pandemic-era increases, the town’s prices have continued climbing, with solid growth in the last three years. These numbers show strong demand paired with lasting appeal. Kewadin is no longer a sleepy town with budget properties—it’s one of northern Michigan’s most valuable zip codes.
Kewadin – Lakeside Appeal Driving Long-Term Growth
Located on the eastern edge of the Grand Traverse Bay, Kewadin is a small unincorporated community in Antrim County. Though it’s not as widely known as Traverse City or Charlevoix, it’s quickly making a name for itself in Michigan’s luxury home market. Much of that has to do with its location—offering incredible views of Torch Lake, Elk Lake, and Lake Michigan. It’s a quiet town with no central downtown, but that’s part of the attraction for buyers looking for privacy and space. The area is dotted with lakefront homes, cottages, and modern retreats, many of which serve as second homes for downstate buyers or seasonal visitors. With increasing demand and limited inventory, home values have been climbing fast, especially since 2020.
The sharp increases in 2021 and 2022 were fueled by a rush for remote-friendly, natural settings. Buyers priced out of nearby resort towns looked to Kewadin as an alternative, and prices responded quickly. Even after the peak of the housing boom, values have continued to rise. The area benefits from low turnover, and many homeowners hang onto properties for generations. Combined with zoning that limits overdevelopment, that has created a long-term scarcity of homes for sale. Kewadin might not have a shopping district or nightlife, but what it offers—solitude, lake access, and natural beauty—continues to drive up its market value. As of 2025, with prices above $800,000, this once-overlooked community has become a top-tier real estate hotspot in the north.
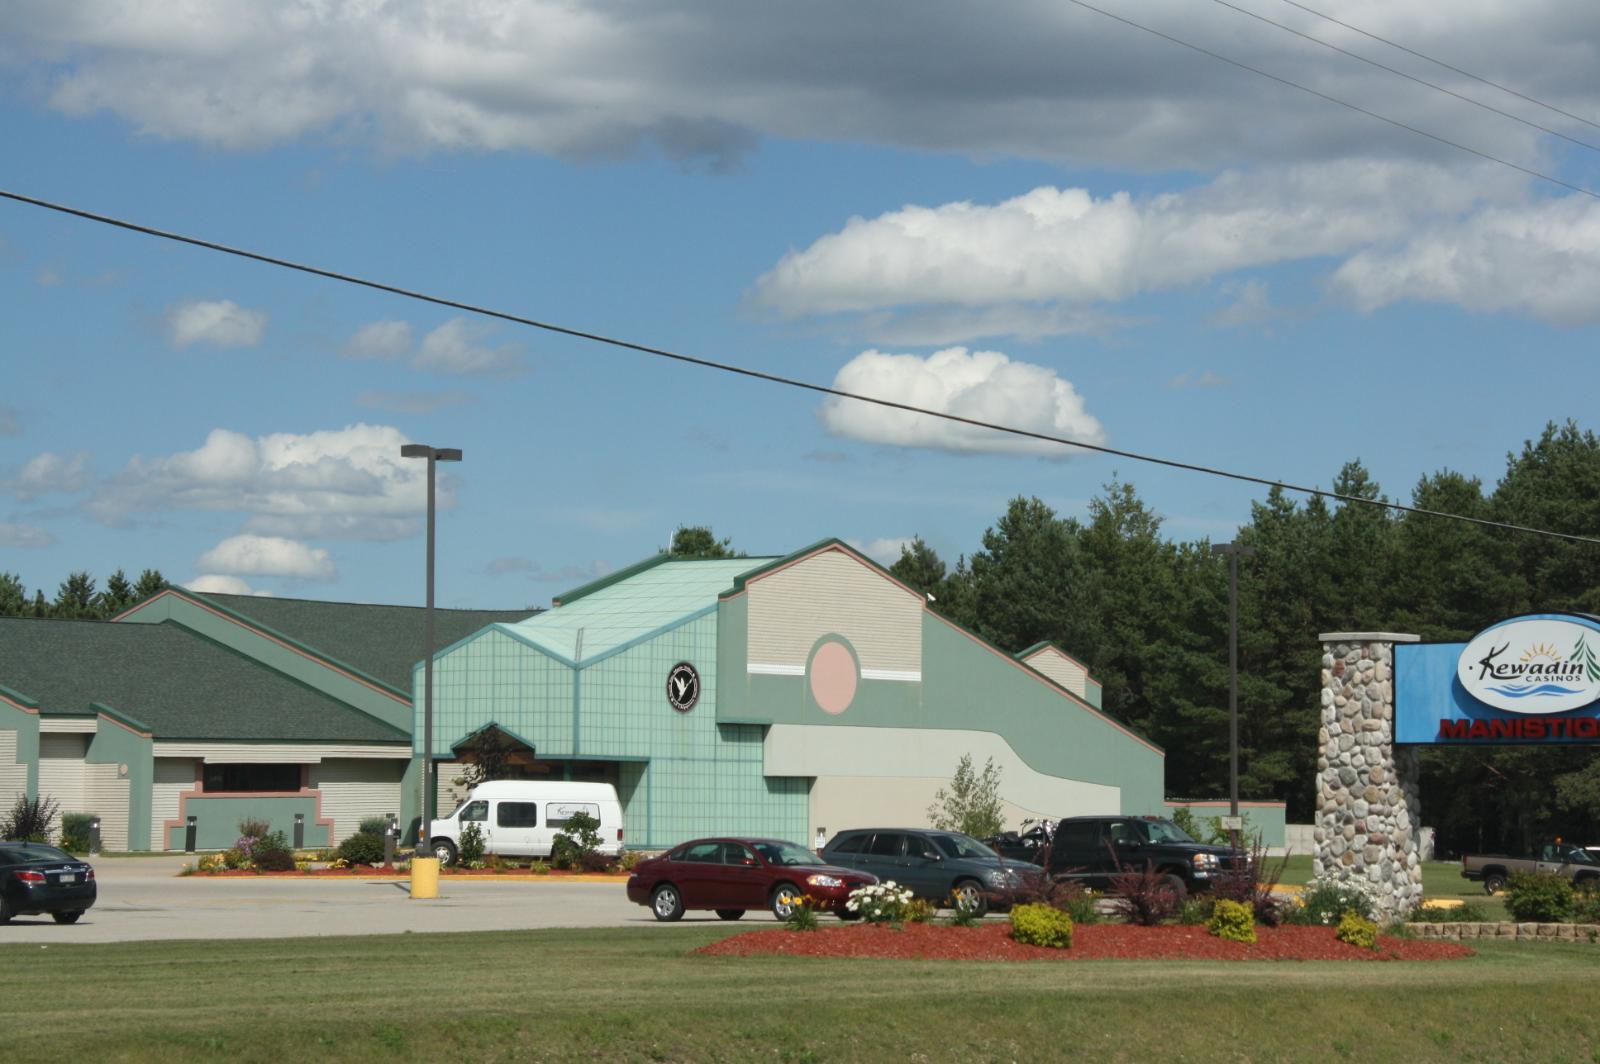
6. Lakeside – 124.0% Home Price Increase Since 2010
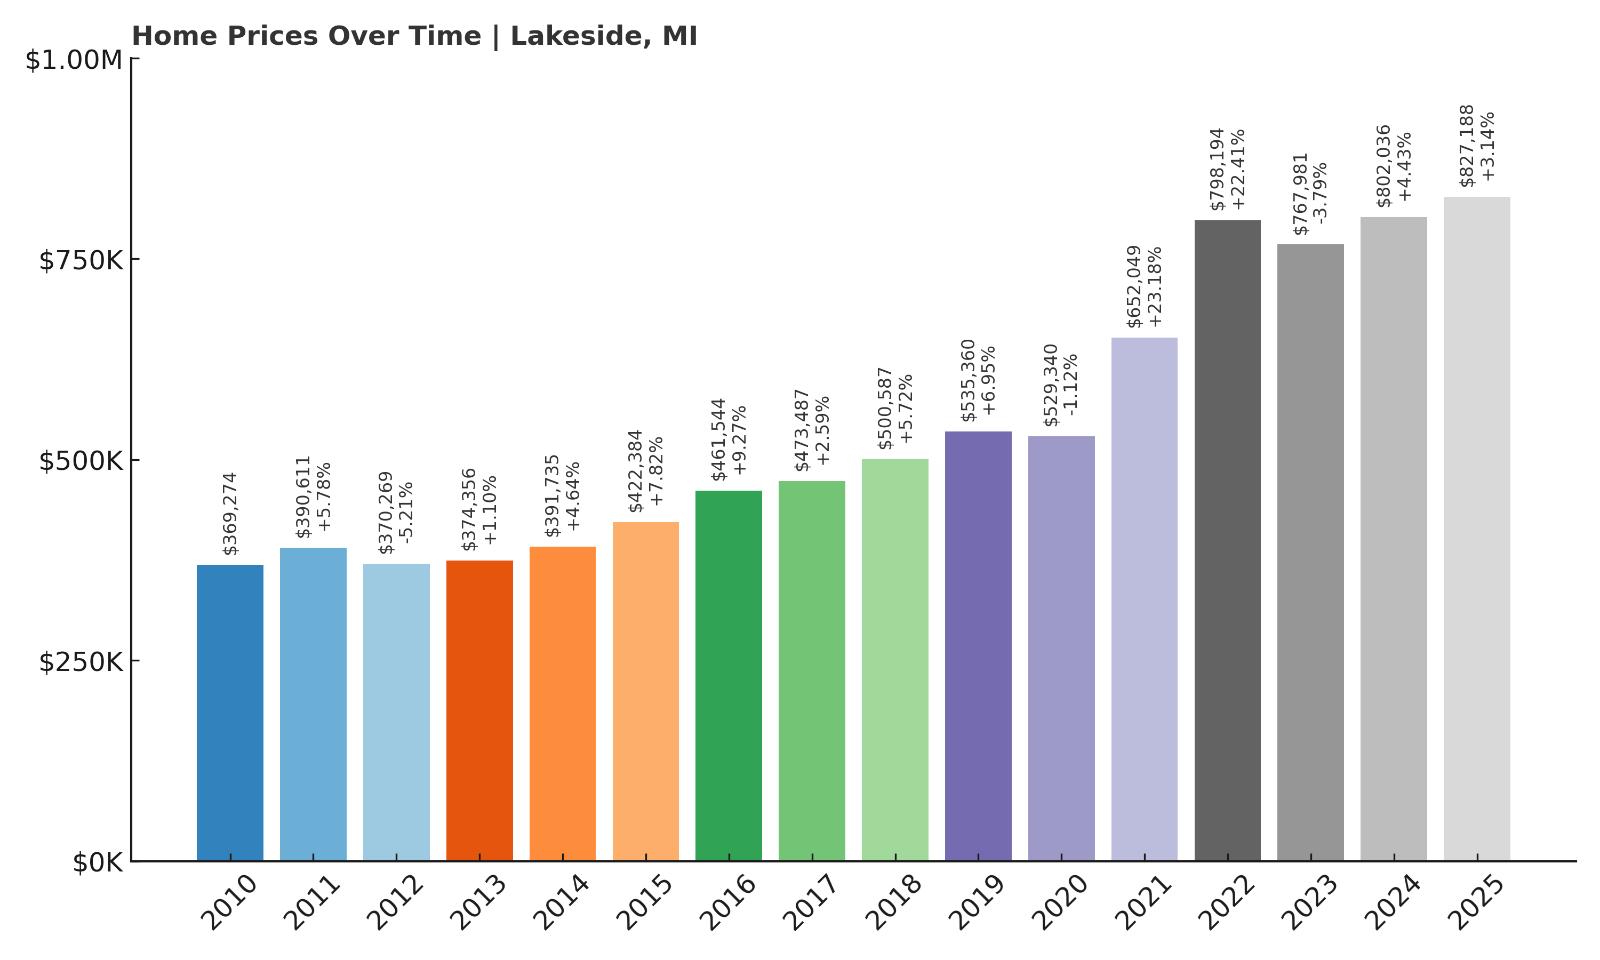
- 2010: $369,274
- 2011: $390,611 (+$21,338, +5.78% from previous year)
- 2012: $370,269 (-$20,342, -5.21% from previous year)
- 2013: $374,356 (+$4,087, +1.10% from previous year)
- 2014: $391,735 (+$17,378, +4.64% from previous year)
- 2015: $422,384 (+$30,650, +7.82% from previous year)
- 2016: $461,544 (+$39,159, +9.27% from previous year)
- 2017: $473,487 (+$11,943, +2.59% from previous year)
- 2018: $500,587 (+$27,101, +5.72% from previous year)
- 2019: $535,360 (+$34,772, +6.95% from previous year)
- 2020: $529,340 (-$6,020, -1.12% from previous year)
- 2021: $652,049 (+$122,709, +23.18% from previous year)
- 2022: $798,194 (+$146,145, +22.41% from previous year)
- 2023: $767,981 (-$30,213, -3.79% from previous year)
- 2024: $802,036 (+$34,054, +4.43% from previous year)
- 2025: $827,188 (+$25,153, +3.14% from previous year)
Lakeside home prices have jumped from $369,274 in 2010 to $827,188 in 2025—a 124% increase. The biggest leaps came in 2021 and 2022, when the average home gained nearly $270,000 in just two years. A minor setback followed in 2023, but prices rebounded quickly and have continued to rise. This level of volatility, followed by resilience, suggests a very competitive market with long-term strength. The post-2020 price surge reflects growing interest in small coastal communities with vacation appeal. Lakeside’s prices now rival or exceed better-known beach towns across the state.
Lakeside – Secluded Beach Town With Skyrocketing Demand
Found along Red Arrow Highway in southwest Michigan’s Berrien County, Lakeside is one of the most desirable—and most exclusive—stops in Harbor Country. It doesn’t have a traditional downtown or business district. Instead, it offers wooded lots, private lakefront properties, and quiet roads where golf carts outnumber cars on summer weekends. Its charm lies in its simplicity and seclusion. Buyers come here for privacy, nature, and lake access—not commercial bustle. Most homes are tucked behind trees or dunes, and many never hit the open market, which helps explain the explosive price growth seen over the last five years. The area’s natural beauty, limited supply, and influx of affluent second-home buyers have made it one of Michigan’s most expensive enclaves.
With proximity to Chicago (just 90 minutes away), Lakeside has become a favorite for buyers seeking a weekend retreat with a timeless feel. Inventory is scarce, and zoning regulations keep new development tightly controlled. The town’s real estate market is largely driven by word-of-mouth and private sales, which limits turnover and further tightens supply. Even modest homes here can sell for premium prices thanks to location alone. When remote work took off in 2020, many part-time residents transitioned to full-time, driving an additional spike in prices. Though the 2023 dip reflected broader market corrections, Lakeside bounced back swiftly, reaffirming its reputation as a safe, high-value investment. In 2025, with prices surpassing $825,000, Lakeside ranks among Michigan’s top-tier real estate markets for those seeking seclusion and luxury.
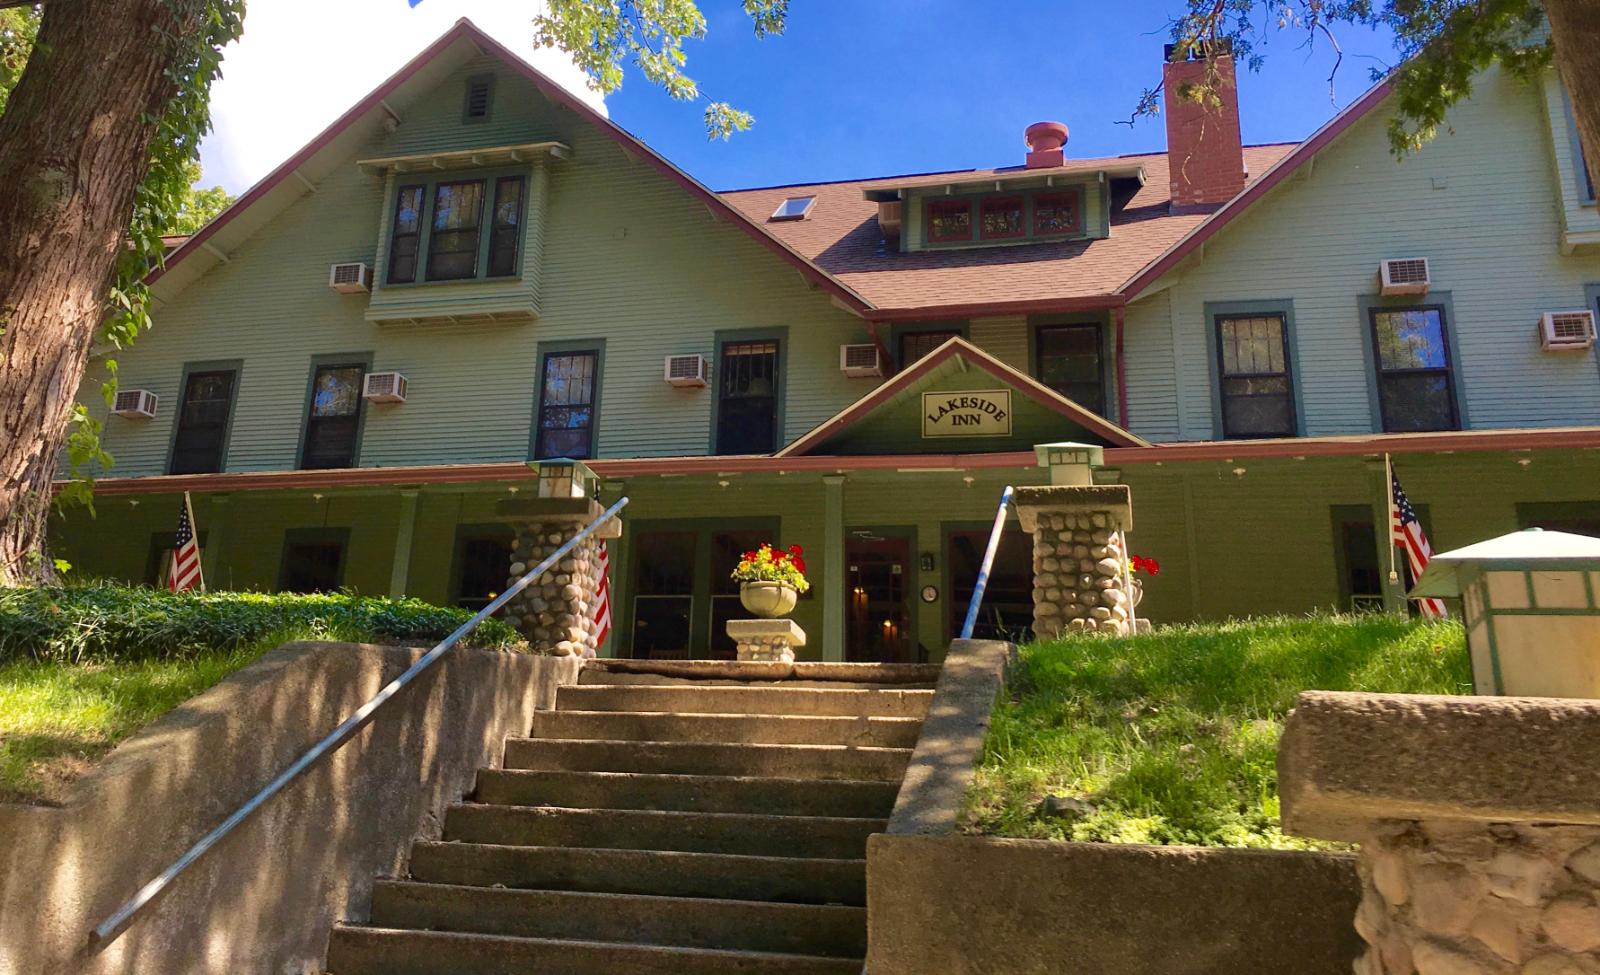
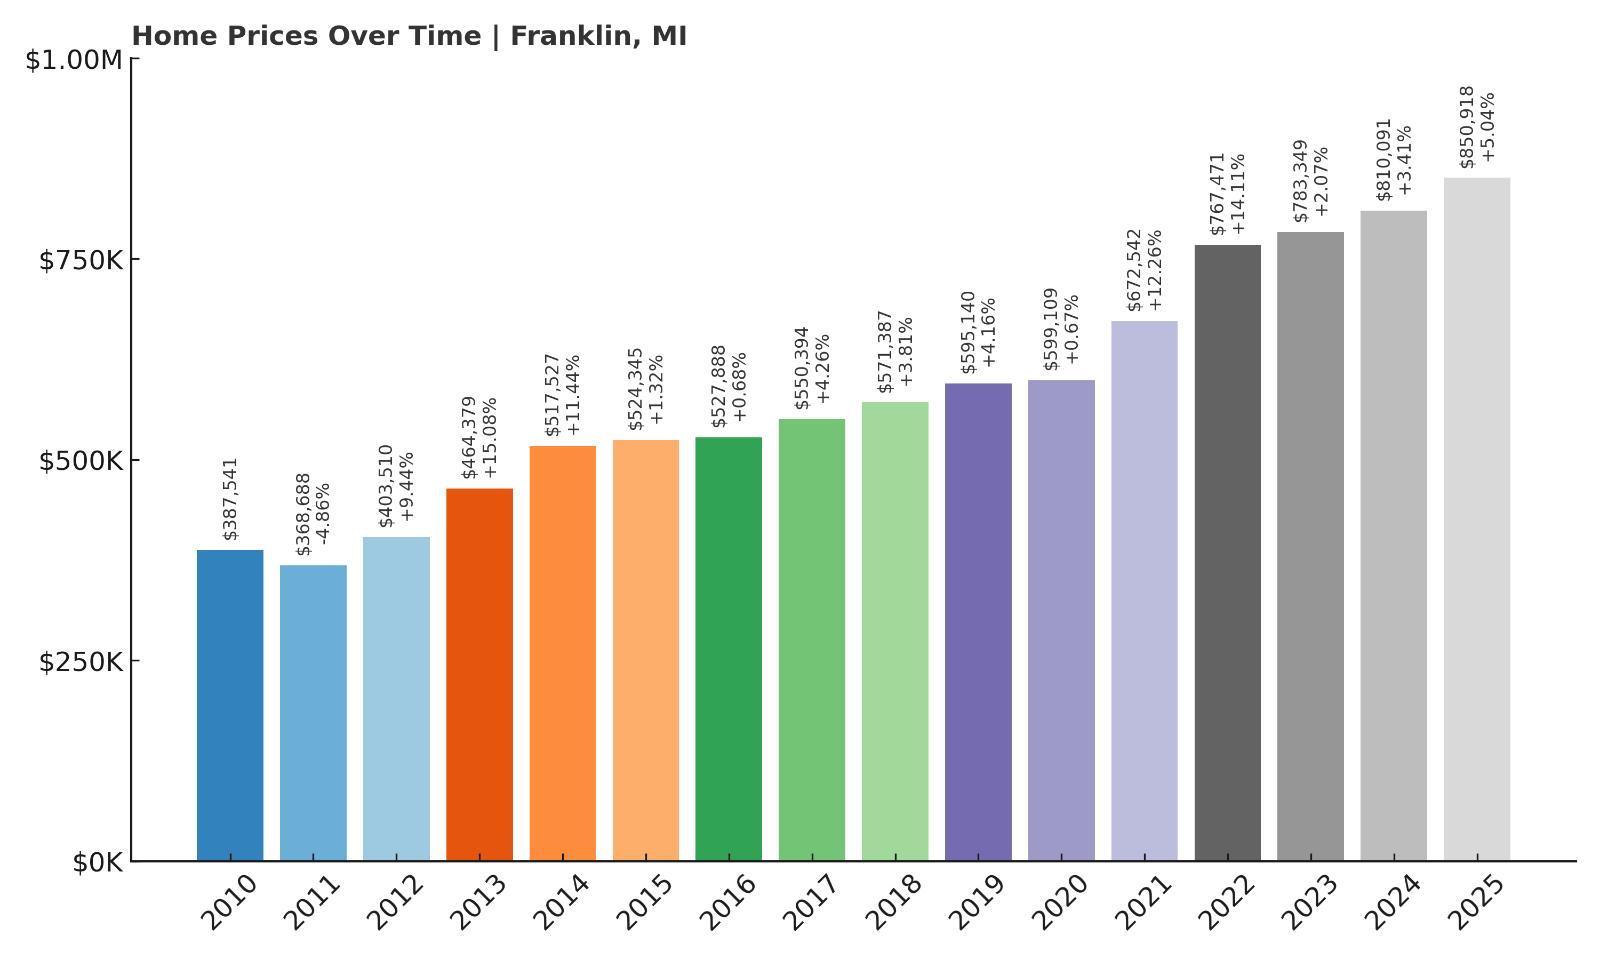
5. Franklin – 119.6% Home Price Increase Since 2010
🔥 Would you like to save this?
- 2010: $387,541
- 2011: $368,688 (-$18,853, -4.86% from previous year)
- 2012: $403,510 (+$34,822, +9.44% from previous year)
- 2013: $464,379 (+$60,869, +15.08% from previous year)
- 2014: $517,527 (+$53,148, +11.44% from previous year)
- 2015: $524,345 (+$6,818, +1.32% from previous year)
- 2016: $527,888 (+$3,543, +0.68% from previous year)
- 2017: $550,394 (+$22,507, +4.26% from previous year)
- 2018: $571,387 (+$20,993, +3.81% from previous year)
- 2019: $595,140 (+$23,753, +4.16% from previous year)
- 2020: $599,109 (+$3,970, +0.67% from previous year)
- 2021: $672,542 (+$73,433, +12.26% from previous year)
- 2022: $767,471 (+$94,929, +14.11% from previous year)
- 2023: $783,349 (+$15,878, +2.07% from previous year)
- 2024: $810,091 (+$26,742, +3.41% from previous year)
- 2025: $850,918 (+$40,826, +5.04% from previous year)
Franklin’s home values have risen steadily over the last 15 years, climbing from $387,541 in 2010 to $850,918 in 2025—an increase of nearly 120%. The largest gains came between 2012 and 2014, followed by a second wave in 2021 and 2022. These periods of rapid appreciation were separated by a stretch of moderate growth. The town has shown resilience even during market slowdowns, and the steady rise in the past three years confirms its long-term appeal. With values now solidly in the $800K range, Franklin is one of southeast Michigan’s most reliable upscale housing markets.
Franklin – Historic Charm and Quiet Affluence
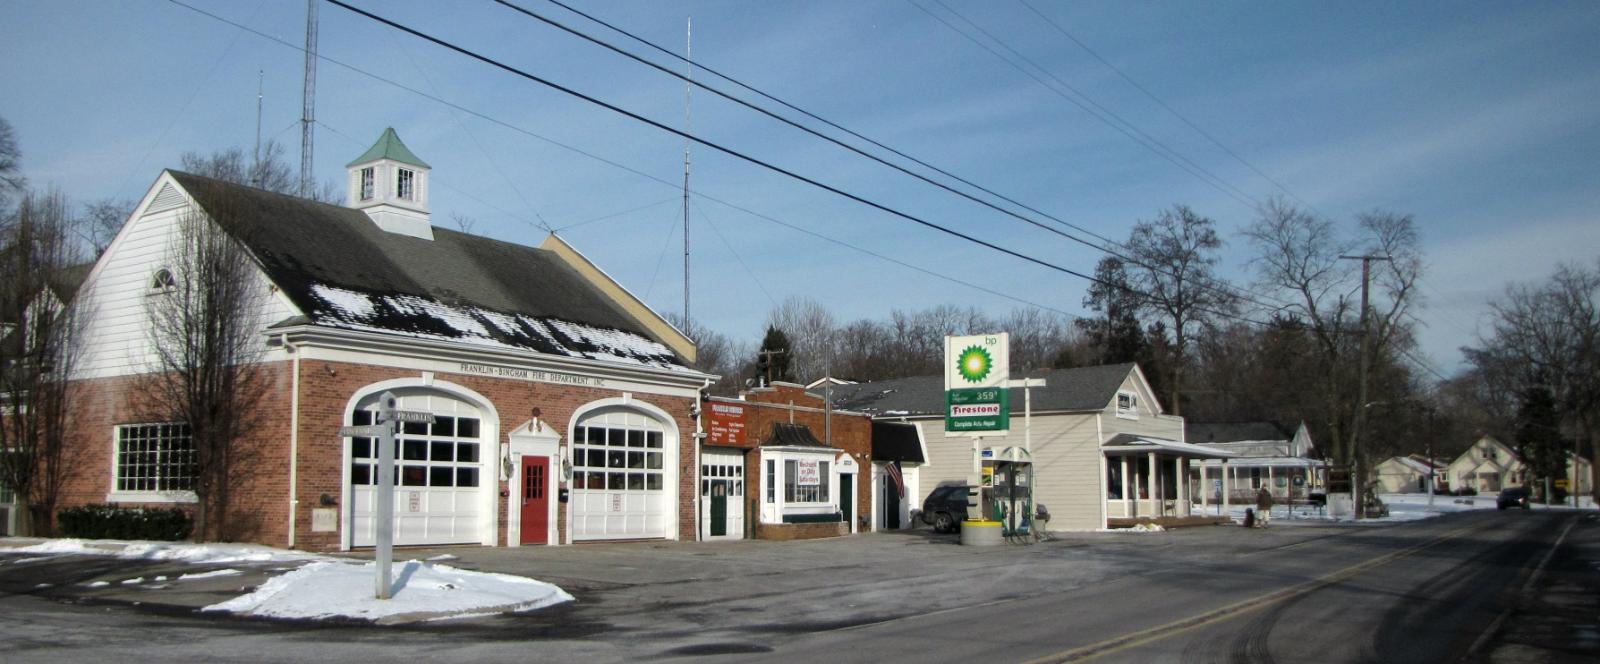
Franklin is a small village in Oakland County, known for its scenic roads, vintage homes, and historic character. Just 20 miles northwest of Detroit, Franklin offers a blend of colonial and farmhouse architecture, tree-lined streets, and a walkable village center that includes a cider mill, library, and a few boutique shops. It feels like a rural hamlet, but it’s right in the heart of one of Michigan’s wealthiest counties. The area’s top-rated schools, low crime, and longstanding zoning restrictions make it a haven for families and retirees looking to escape urban density. Real estate here tends to appreciate gradually but reliably, and most homes are on large lots with privacy and old-growth landscaping.
The housing market in Franklin is tight, and properties tend to be held long-term. That limited turnover, combined with strong demand from local buyers, has helped keep prices elevated. During the pandemic years, Franklin saw renewed interest from buyers looking for space, charm, and a sense of permanence—and its prices reflected that. Unlike flashier markets that rely on tourism or rentals, Franklin’s appeal is quiet and steady, built on generational living and careful preservation. The strong performance in 2025 shows that this pattern is continuing. With a median price nearing $850K, Franklin remains one of Michigan’s most coveted spots for those seeking history, character, and investment-grade housing.
4. Lake Leelanau – 136.7% Home Price Increase Since 2010
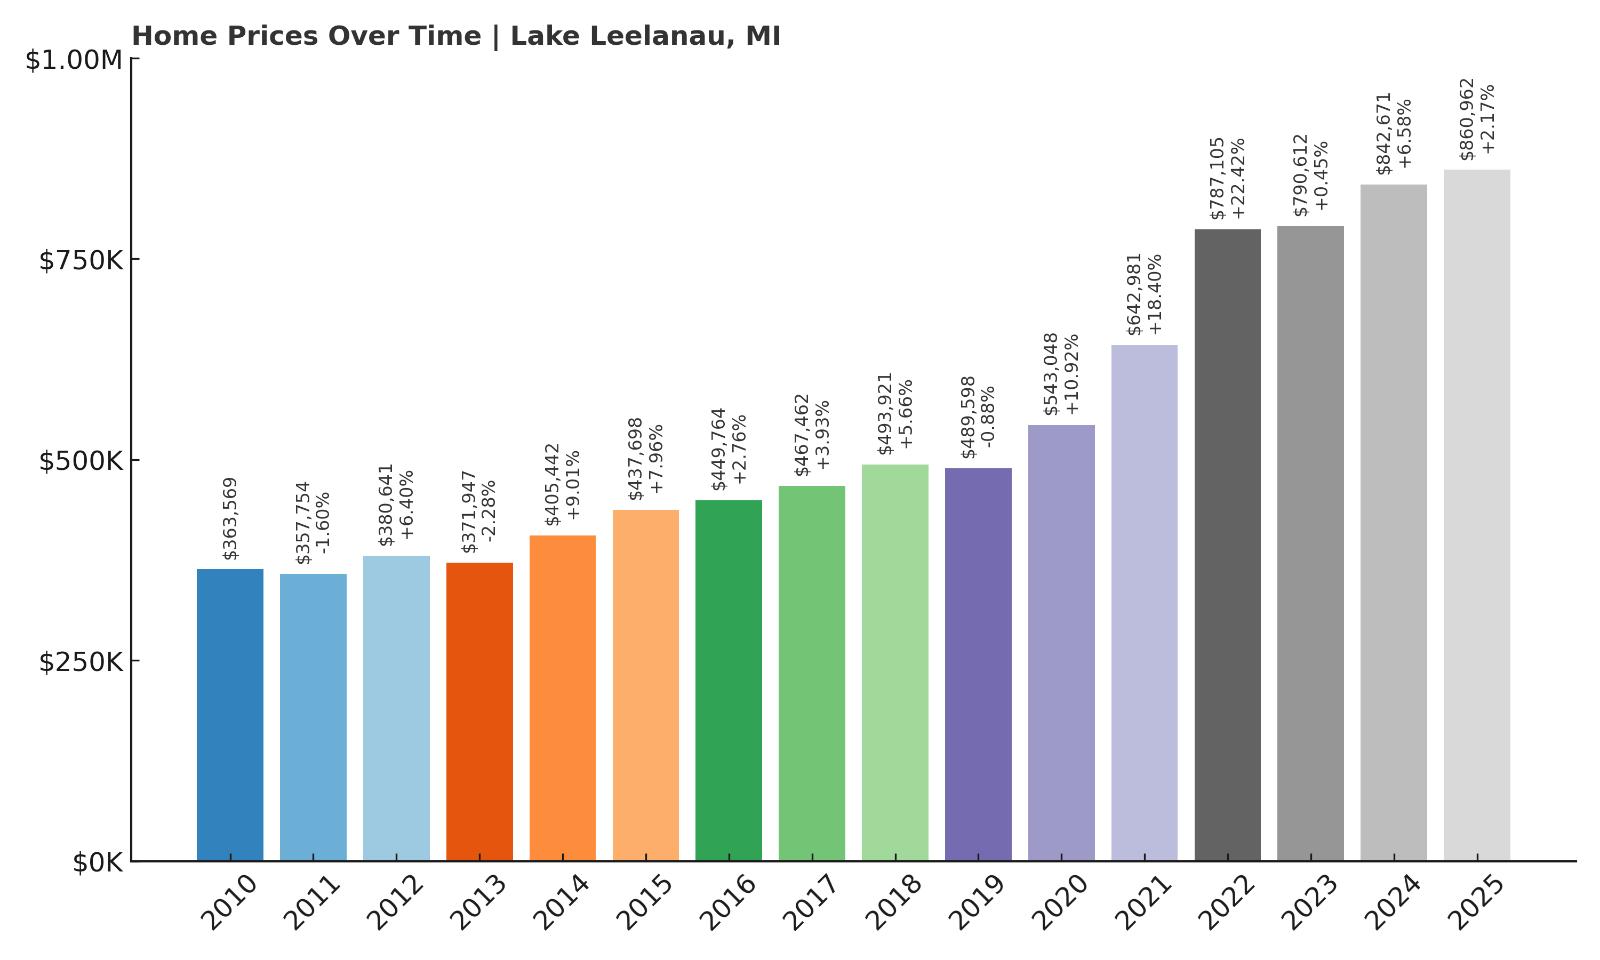
- 2010: $363,569
- 2011: $357,754 (-$5,814, -1.60% from previous year)
- 2012: $380,641 (+$22,887, +6.40% from previous year)
- 2013: $371,947 (-$8,694, -2.28% from previous year)
- 2014: $405,442 (+$33,495, +9.01% from previous year)
- 2015: $437,698 (+$32,255, +7.96% from previous year)
- 2016: $449,764 (+$12,067, +2.76% from previous year)
- 2017: $467,462 (+$17,698, +3.93% from previous year)
- 2018: $493,921 (+$26,459, +5.66% from previous year)
- 2019: $489,598 (-$4,323, -0.88% from previous year)
- 2020: $543,048 (+$53,450, +10.92% from previous year)
- 2021: $642,981 (+$99,932, +18.40% from previous year)
- 2022: $787,105 (+$144,124, +22.42% from previous year)
- 2023: $790,612 (+$3,507, +0.45% from previous year)
- 2024: $842,671 (+$52,060, +6.58% from previous year)
- 2025: $860,962 (+$18,290, +2.17% from previous year)
Lake Leelanau’s home prices have risen from $363,569 in 2010 to $860,962 in 2025—a 136.7% increase over 15 years. The growth hasn’t always been steady, with occasional small dips early on, but the big picture shows a strong upward trend. The largest jumps occurred in 2021 and 2022, when prices rose by over $244,000 in just two years. Even after that surge, the market remained strong, with gains in the following years continuing to push values higher. In 2025, home prices climbed another 2.17%, showing continued demand and confidence. Lake Leelanau has firmly established itself as a luxury housing destination in Michigan’s northwest.
Lake Leelanau – Scenic Wine Country With Lakeside Luxury
Lake Leelanau is one of the most picturesque places in northern Michigan, straddling both the lake and namesake village in Leelanau County. It’s surrounded by rolling vineyards, cherry orchards, and quiet lakefront stretches, giving it an unmistakably upscale rural feel. The area has become a top destination for those seeking vacation homes and full-time retreats with character, charm, and privacy. The lake itself offers boating, fishing, and swimming, and homes along its shores—particularly on the east side—are highly coveted. With a growing number of boutique wineries and local markets nearby, Lake Leelanau offers lifestyle appeal that blends tranquility with sophistication. While not overdeveloped, the area has seen rising demand from both in-state buyers and out-of-state newcomers looking for a scenic alternative to Traverse City.
Inventory remains tight in Lake Leelanau, especially for waterfront property. This has helped keep values high, even as other rural markets have cooled slightly. Many homes are owner-occupied seasonally, which also limits turnover and adds exclusivity to the area. The 2021–2022 surge came as remote work and lifestyle shifts pushed more buyers toward places with outdoor recreation and space. But unlike some vacation markets, Lake Leelanau’s value held firm after the boom, with steady appreciation in 2023, 2024, and 2025. Buyers here are investing in more than real estate—they’re buying into a quality of life rooted in nature, community, and long-term value. With prices now over $860,000, the area sits firmly near the top of Michigan’s residential market.
3. Orchard Lake – 85.2% Home Price Increase Since 2010
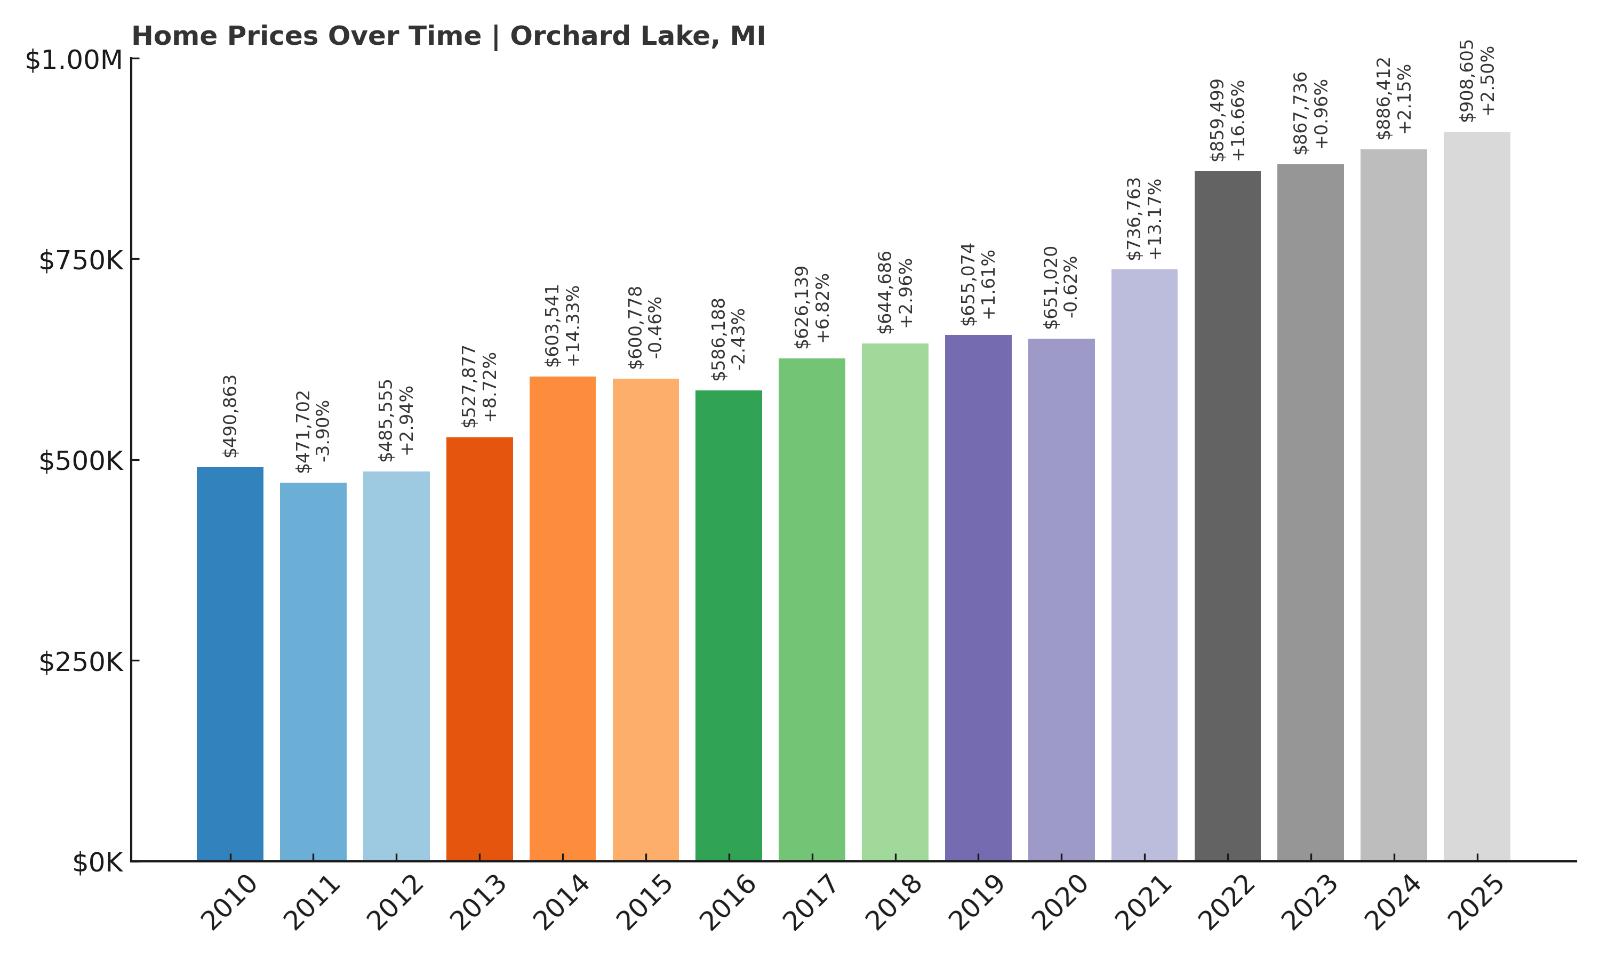
- 2010: $490,863
- 2011: $471,702 (-$19,161, -3.90% from previous year)
- 2012: $485,555 (+$13,853, +2.94% from previous year)
- 2013: $527,877 (+$42,322, +8.72% from previous year)
- 2014: $603,541 (+$75,665, +14.33% from previous year)
- 2015: $600,778 (-$2,763, -0.46% from previous year)
- 2016: $586,188 (-$14,591, -2.43% from previous year)
- 2017: $626,139 (+$39,951, +6.82% from previous year)
- 2018: $644,686 (+$18,547, +2.96% from previous year)
- 2019: $655,074 (+$10,388, +1.61% from previous year)
- 2020: $651,020 (-$4,054, -0.62% from previous year)
- 2021: $736,763 (+$85,743, +13.17% from previous year)
- 2022: $859,499 (+$122,736, +16.66% from previous year)
- 2023: $867,736 (+$8,237, +0.96% from previous year)
- 2024: $886,412 (+$18,676, +2.15% from previous year)
- 2025: $908,605 (+$22,193, +2.50% from previous year)
Orchard Lake’s housing market has appreciated by over 85% since 2010, growing from $490,863 to $908,605 in 2025. While growth has not been entirely linear, the market has experienced several major spikes—including a 14% gain in 2014 and a pair of sharp increases in 2021 and 2022. After the COVID housing boom, the market leveled off with smaller gains, yet prices continued to climb each year. In 2025 alone, Orchard Lake added over $22,000 to its average value. Its consistent post-pandemic growth shows this isn’t a speculative hotspot—it’s a stable, high-demand housing market.
Orchard Lake – Private Living and Waterfront Prestige
Orchard Lake Village, nestled in Oakland County west of Detroit, is known for its serene setting and access to some of the region’s most desirable waterfront property. Orchard Lake itself is the focal point—offering boating, swimming, and striking views. Many of the town’s homes are either on the lake or have deeded access, and the area is dotted with gated drives, custom homes, and meticulously maintained estates. It’s a community built for privacy and affluence, with top-tier schools, low traffic, and a highly residential character. There’s little in the way of commercial clutter, which only enhances its peaceful appeal. For decades, Orchard Lake has ranked among the most prestigious places to live in Southeast Michigan.
What sets Orchard Lake apart is its balance of proximity and seclusion. Residents are within easy driving distance of Bloomfield Hills, Birmingham, and downtown Detroit—but the town itself feels worlds away. This rare blend continues to drive demand, especially among buyers looking for luxury living that doesn’t feel overly built up. Price dips in the mid-2010s did little to shake the market, and the steep increases in 2021 and 2022 reflected renewed interest in lake properties. With inventory always tight and development strictly controlled, home values have remained on a strong upward path. In 2025, with prices over $900,000, Orchard Lake remains a top choice for long-term value and lifestyle excellence.
2. Leland – 171.6% Home Price Increase Since 2011
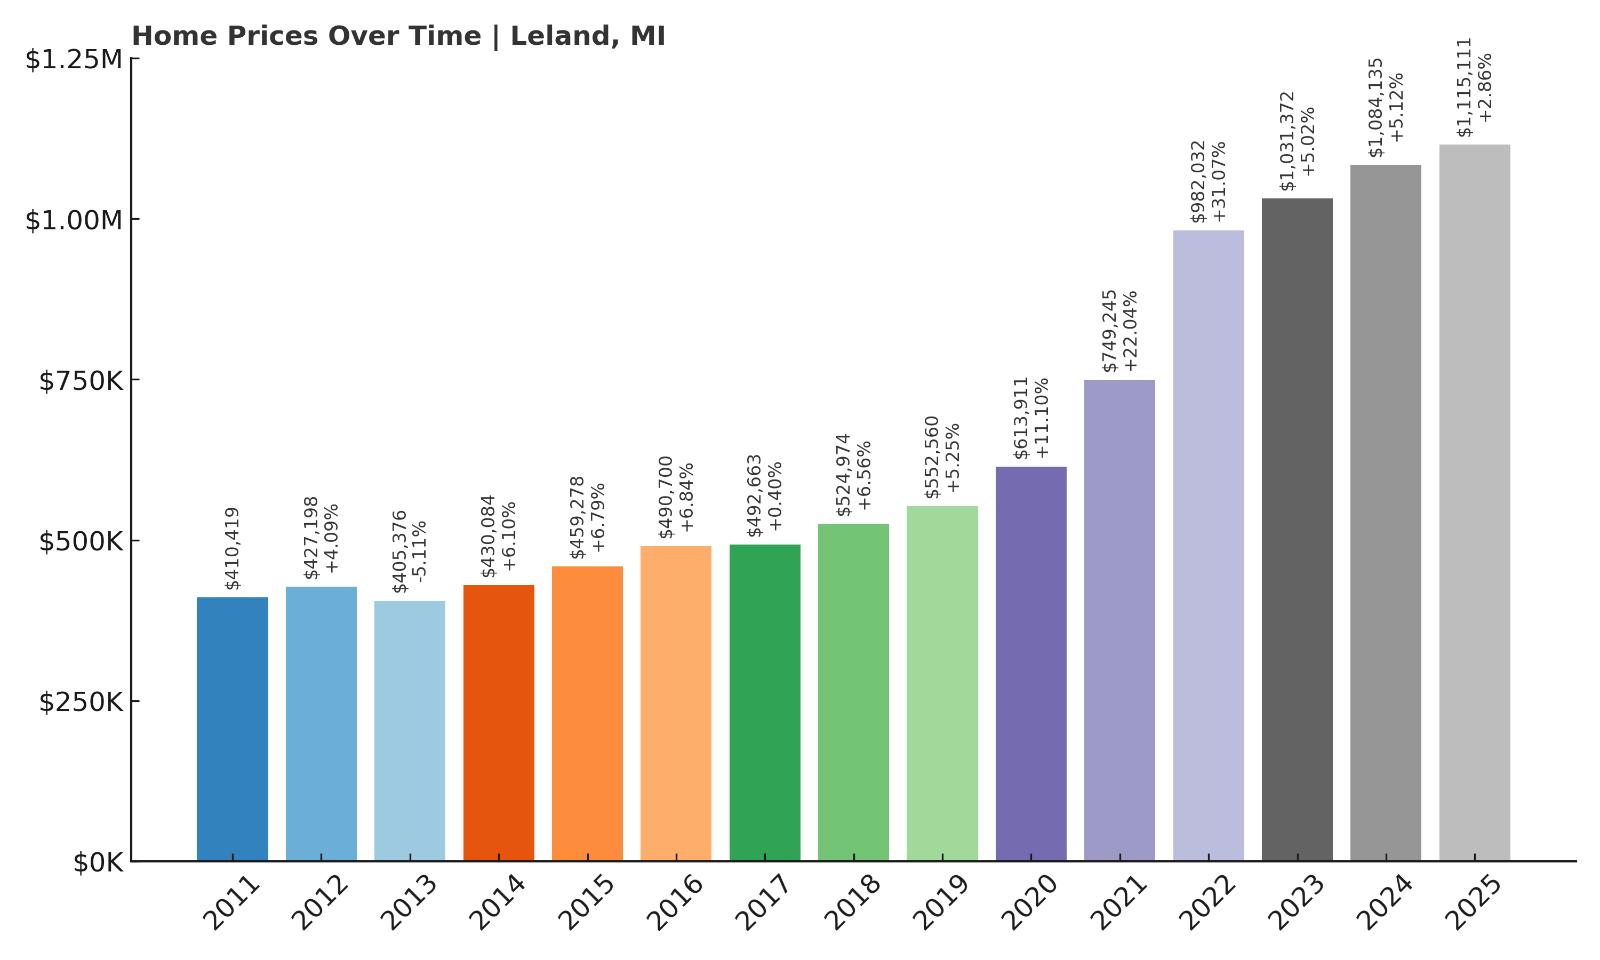
- 2010: N/A
- 2011: $410,419
- 2012: $427,198 (+$16,778, +4.09% from previous year)
- 2013: $405,376 (-$21,822, -5.11% from previous year)
- 2014: $430,084 (+$24,708, +6.10% from previous year)
- 2015: $459,278 (+$29,194, +6.79% from previous year)
- 2016: $490,700 (+$31,421, +6.84% from previous year)
- 2017: $492,663 (+$1,963, +0.40% from previous year)
- 2018: $524,974 (+$32,311, +6.56% from previous year)
- 2019: $552,560 (+$27,585, +5.25% from previous year)
- 2020: $613,911 (+$61,352, +11.10% from previous year)
- 2021: $749,245 (+$135,334, +22.04% from previous year)
- 2022: $982,032 (+$232,788, +31.07% from previous year)
- 2023: $1,031,372 (+$49,339, +5.02% from previous year)
- 2024: $1,084,135 (+$52,763, +5.12% from previous year)
- 2025: $1,115,111 (+$30,977, +2.86% from previous year)
Leland’s home values have skyrocketed 171.6% since 2011, rising from $410,419 to over $1.1 million in 2025. That rise includes an explosive two-year stretch in 2021 and 2022, when values jumped by over $368,000. Even after that sharp increase, prices kept climbing, with consistent 5% gains in 2023 and 2024, and a further 2.86% rise in 2025. These figures reflect a market that has not just peaked—but stabilized at a much higher tier. Leland’s combination of scenic beauty, local charm, and waterfront real estate continues to push it toward the top of Michigan’s most exclusive housing markets.
Leland – Lake Views and Million-Dollar Homes
Set between Lake Michigan and Lake Leelanau, the town of Leland is a stunning pocket of waterfront living in northern Michigan. Known for its historic “Fishtown” district, charming harbor, and panoramic lake views, Leland has long been a favorite destination for vacationers and retirees. But over the last decade, it has evolved into a luxury real estate hotspot, with home values that now routinely exceed $1 million. The town offers a walkable downtown with upscale restaurants, galleries, and cafes, as well as proximity to some of the state’s best outdoor recreation, including Sleeping Bear Dunes and the Leelanau Wine Trail. Buyers are drawn to the area not only for its natural beauty, but for the lifestyle that comes with it—peaceful, premium, and steeped in character.
What makes Leland’s price growth particularly notable is how resilient it has been after major jumps. Many markets that saw steep rises in 2021–2022 cooled significantly afterward, but Leland’s housing values have continued to climb at a steady clip. With limited housing stock and zoning that restricts overdevelopment, new listings are scarce—and that scarcity drives competition. Waterfront properties, especially those along Lake Michigan, are among the most expensive in the state. The appeal of Leland also extends beyond Michigan, as more out-of-state buyers discover the town through travel or word of mouth. With 2025 values averaging over $1.1 million, Leland stands out not just for its scenery, but for its firm hold on long-term luxury demand.
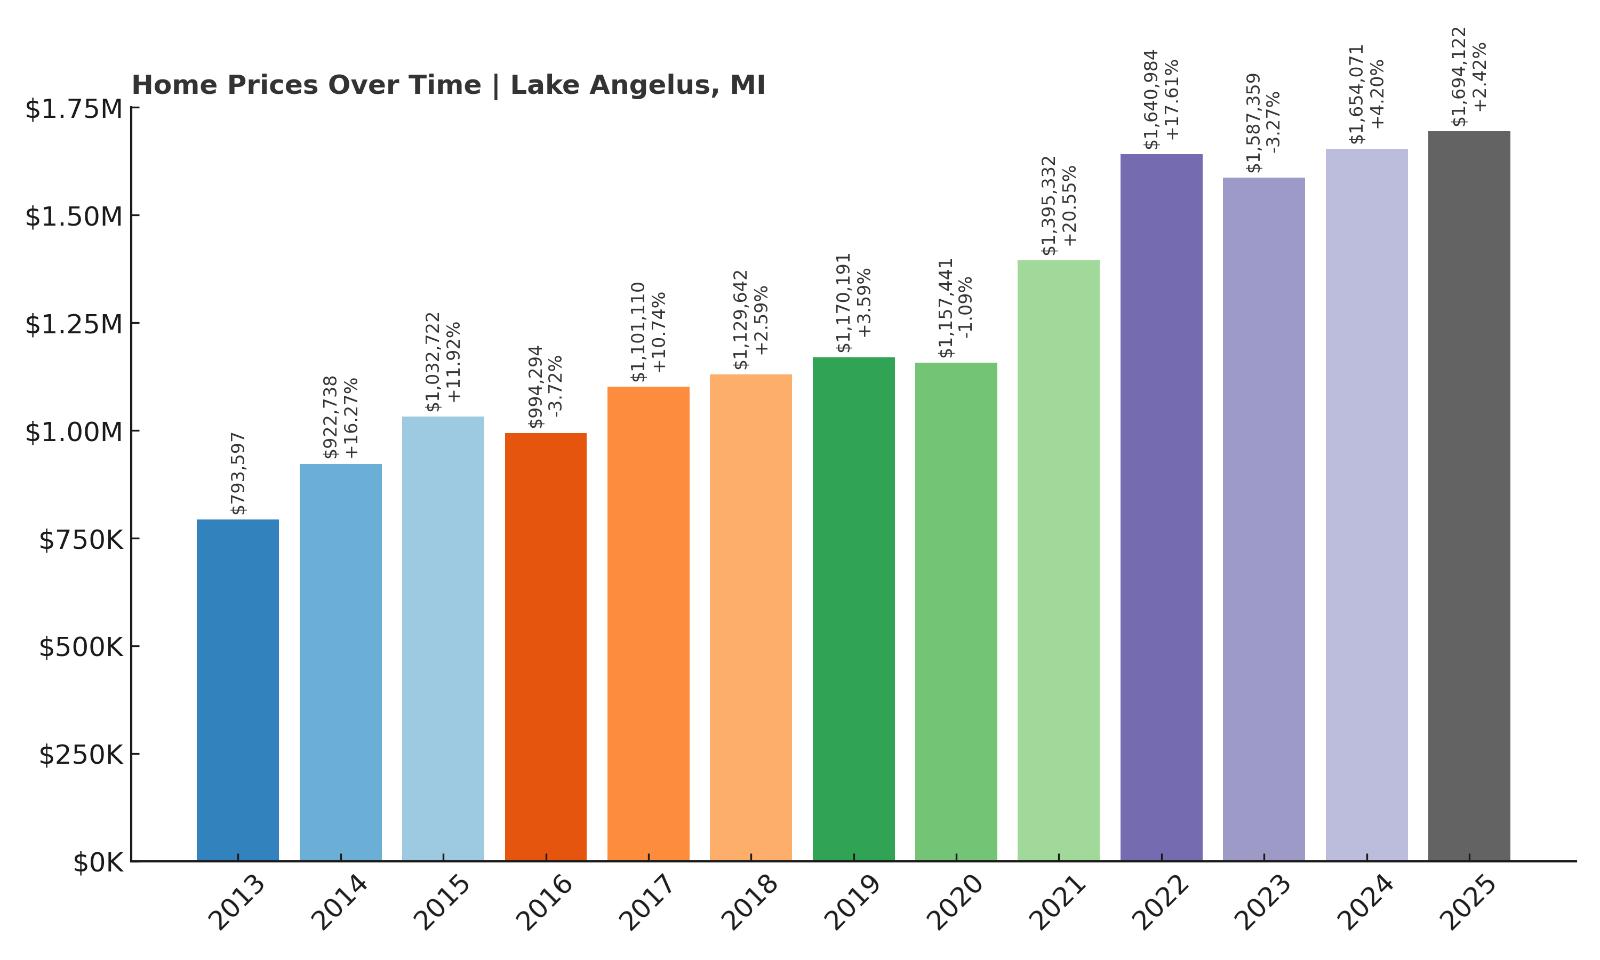
1. Lake Angelus – 113.5% Home Price Increase Since 2013
- 2010: N/A
- 2011: N/A
- 2012: N/A
- 2013: $793,597
- 2014: $922,738 (+$129,142, +16.27% from previous year)
- 2015: $1,032,722 (+$109,984, +11.92% from previous year)
- 2016: $994,294 (-$38,428, -3.72% from previous year)
- 2017: $1,101,110 (+$106,817, +10.74% from previous year)
- 2018: $1,129,642 (+$28,532, +2.59% from previous year)
- 2019: $1,170,191 (+$40,548, +3.59% from previous year)
- 2020: $1,157,441 (-$12,750, -1.09% from previous year)
- 2021: $1,395,332 (+$237,891, +20.55% from previous year)
- 2022: $1,640,984 (+$245,652, +17.61% from previous year)
- 2023: $1,587,359 (-$53,625, -3.27% from previous year)
- 2024: $1,654,071 (+$66,712, +4.20% from previous year)
- 2025: $1,694,122 (+$40,051, +2.42% from previous year)
Lake Angelus tops the list with home values that rose from $793,597 in 2013 to $1,694,122 in 2025—an increase of 113.5%. While the town saw massive price gains in 2021 and 2022, totaling nearly $484,000, it also experienced brief dips in 2016 and 2023. Despite this, the long-term trend is unmistakably upward. The market regained strength in 2024 and 2025, adding over $100,000 in just two years. With 2025 values nearing $1.7 million, Lake Angelus remains the most expensive housing market in Michigan, reflecting sustained demand for ultra-premium lakefront living.
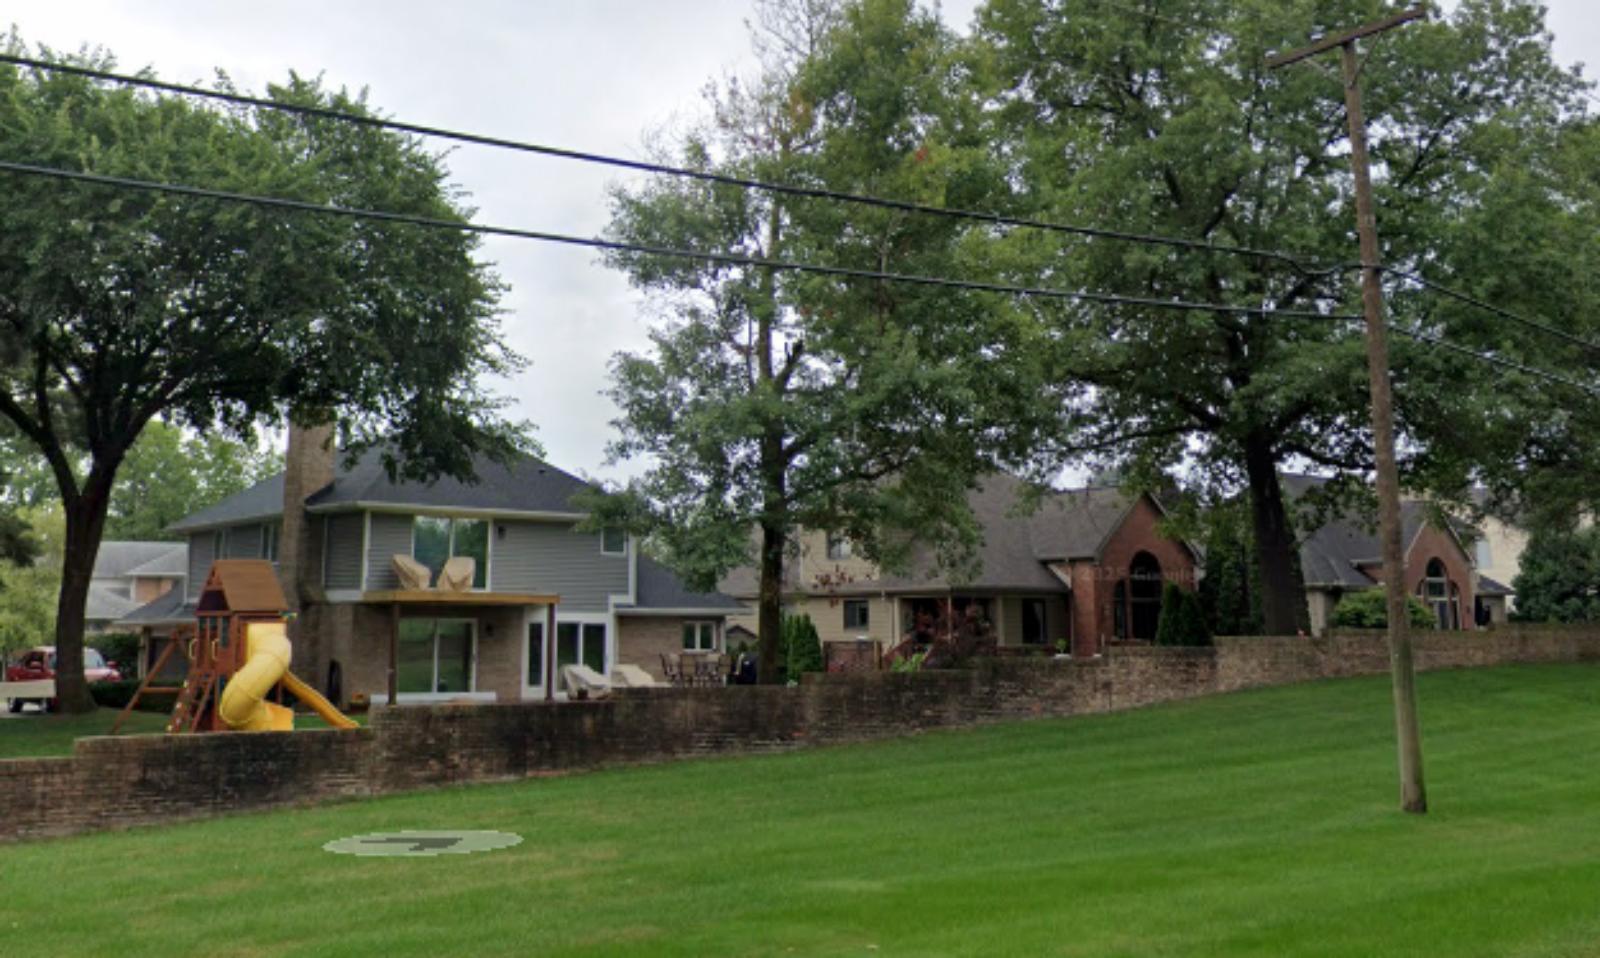
Lake Angelus – Michigan’s Elite Lakefront Market
🔥 Would you like to save this?
Lake Angelus is not just Michigan’s most expensive town—it’s one of its most exclusive. Nestled in Oakland County, this tiny city surrounds a private lake and has a population of fewer than 300 people. Access to the lake is limited to residents only, and the town has no commercial development, no public lake access, and virtually no short-term rentals. That sense of privacy and exclusivity is a major selling point for buyers who value discretion and tranquility. Homes here are often custom-built and come with lake frontage, expansive lots, and amenities like private docks and tennis courts. The town is zoned almost entirely for single-family residences, which preserves its low-density charm and fuels high property values.
Despite its small size, Lake Angelus has consistently posted some of the highest home prices in the Midwest. Its location near Bloomfield Hills and Auburn Hills makes it convenient for executives and professionals, while its complete lack of through-traffic and commercial clutter makes it feel far removed. When remote work took off in 2020, more high-income buyers looked for lakefront luxury, and Lake Angelus responded with two of the biggest price gains in the state. Even after a small correction in 2023, the market quickly recovered and remains extremely strong in 2025. With median values well over $1.6 million, Lake Angelus represents the pinnacle of Michigan real estate—a quiet enclave where prestige, privacy, and lake access come at a premium few can afford.


