🔥 Would you like to save this?
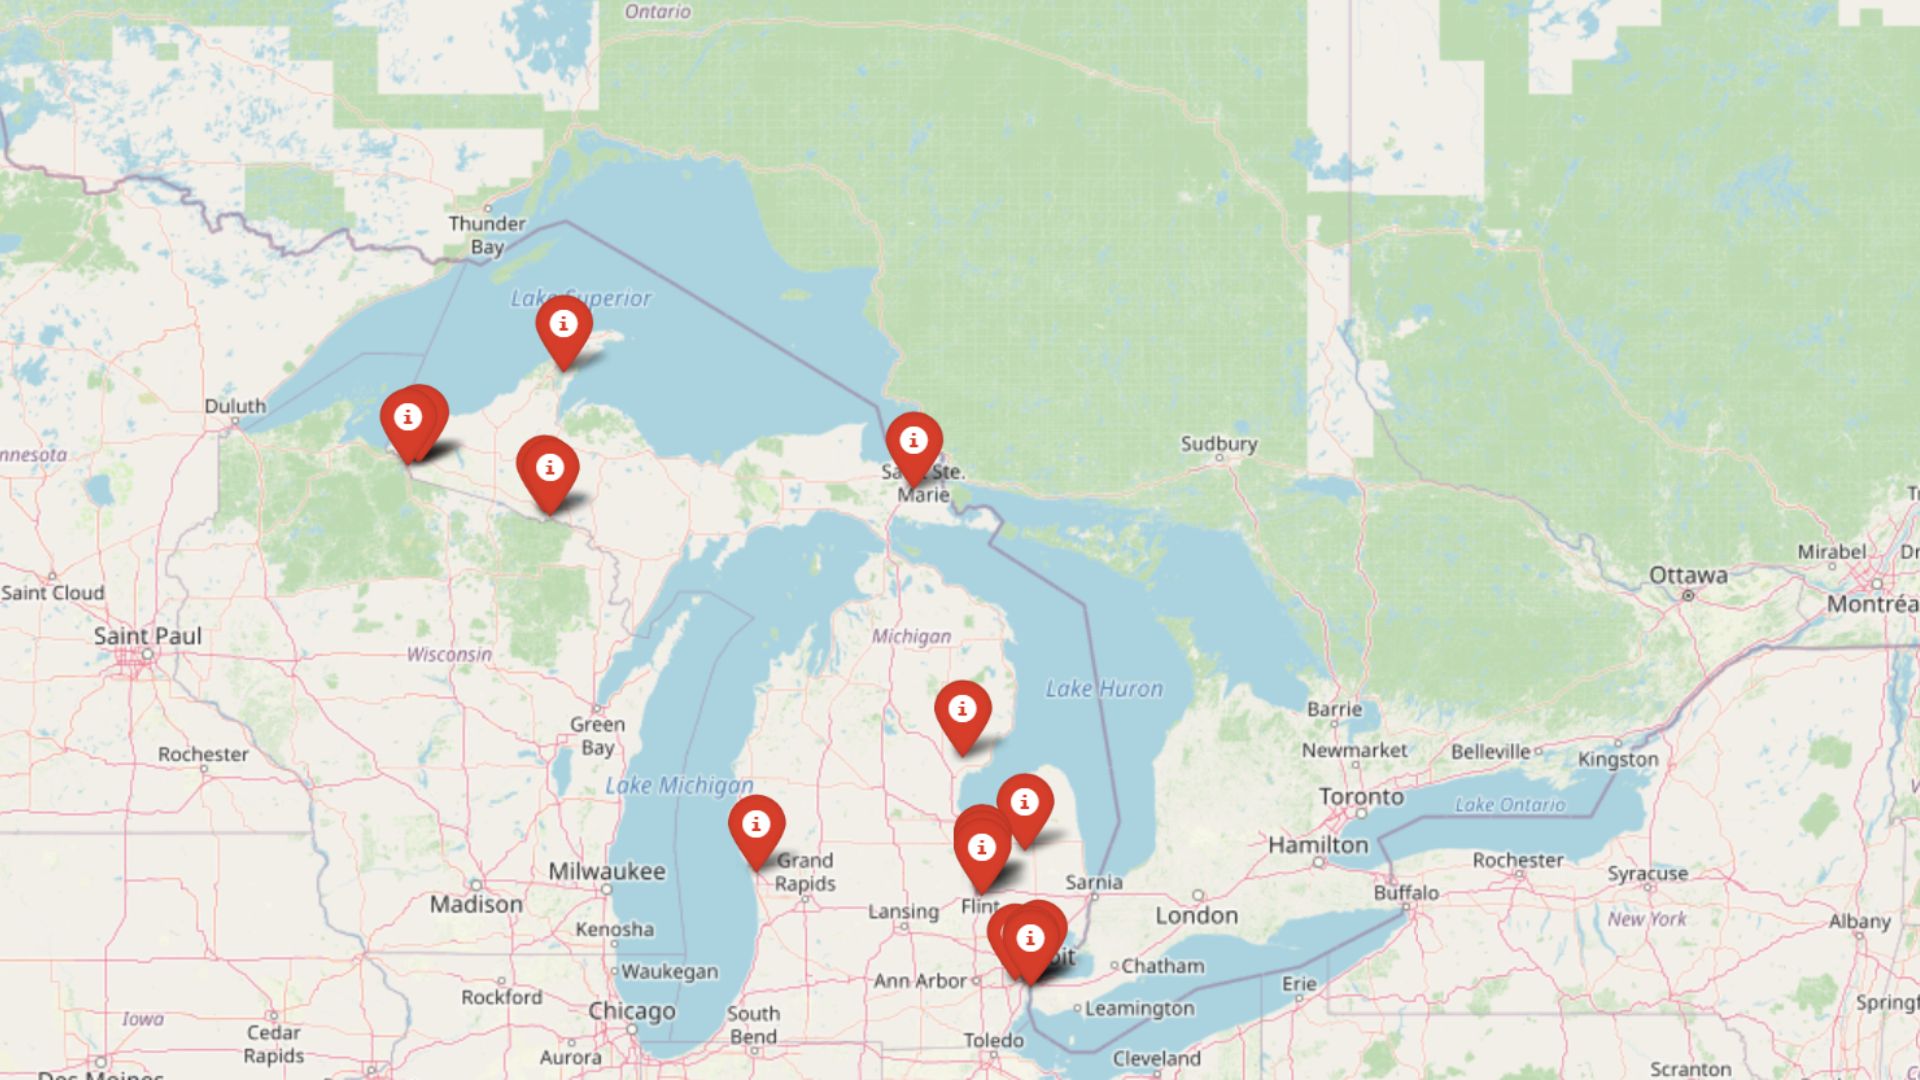
The Zillow Home Value Index puts a spotlight on 18 Michigan towns where homeownership is still within reach in 2025. These places, scattered from rural farmland to old industrial hubs, have kept prices low even as the state’s housing market has shifted. Some are bouncing back after decades of decline; others have quietly stayed affordable while the rest of the state grew more expensive. Together, they offer a glimpse into where value still lives—and what that says about the future of these communities.
18. Mt Morris – 233% Home Price Increase Since 2012
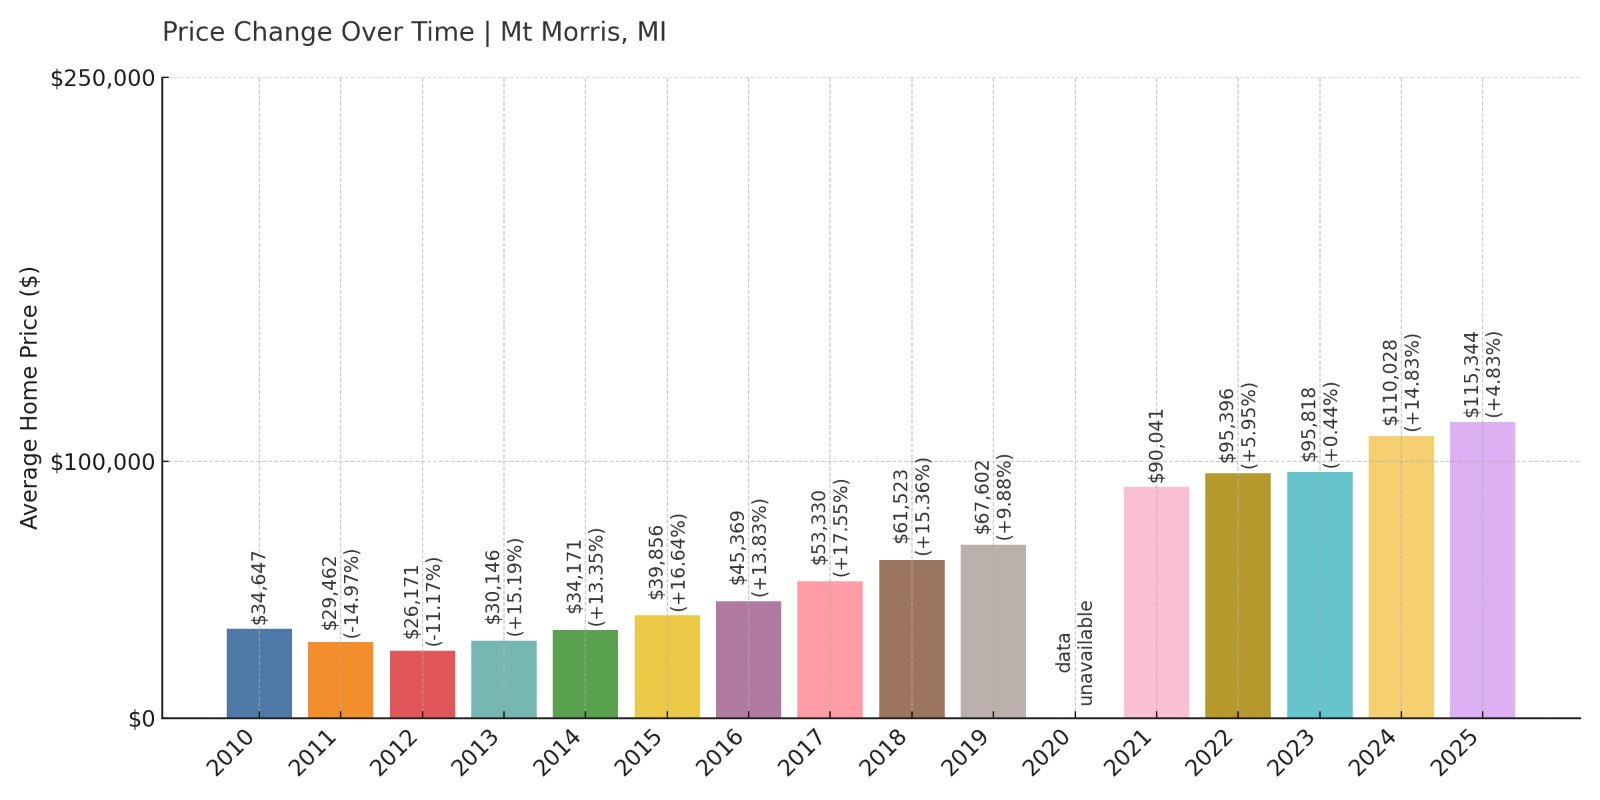
- 2010: $34,647
- 2011: $29,462 (-$5,185, -14.96% from previous year)
- 2012: $26,171 (-$3,291, -11.17% from previous year)
- 2013: $30,146 (+$3,975, +15.19% from previous year)
- 2014: $34,171 (+$4,026, +13.35% from previous year)
- 2015: $39,856 (+$5,685, +16.64% from previous year)
- 2016: $45,369 (+$5,513, +13.83% from previous year)
- 2017: $53,330 (+$7,961, +17.55% from previous year)
- 2018: $61,523 (+$8,193, +15.36% from previous year)
- 2019: $67,602 (+$6,079, +9.88% from previous year)
- 2020: N/A
- 2021: $90,041
- 2022: $95,396 (+$5,355, +5.95% from previous year)
- 2023: $95,818 (+$422, +0.44% from previous year)
- 2024: $110,028 (+$14,211, +14.83% from previous year)
- 2025: $115,344 (+$5,316, +4.83% from previous year)
Mt Morris home prices have risen sharply since 2012, with a total increase of 233% over that span. After a slump in the early 2010s, prices picked up pace year over year, with especially strong gains from 2016 to 2019. The town saw a notable jump again in 2024. Even though prices are still relatively low, the trajectory reflects growing demand.
In order to come up with the very specific design ideas, we create most designs with the assistance of state-of-the-art AI interior design software.
Mt Morris – Steady Growth After Years of Decline
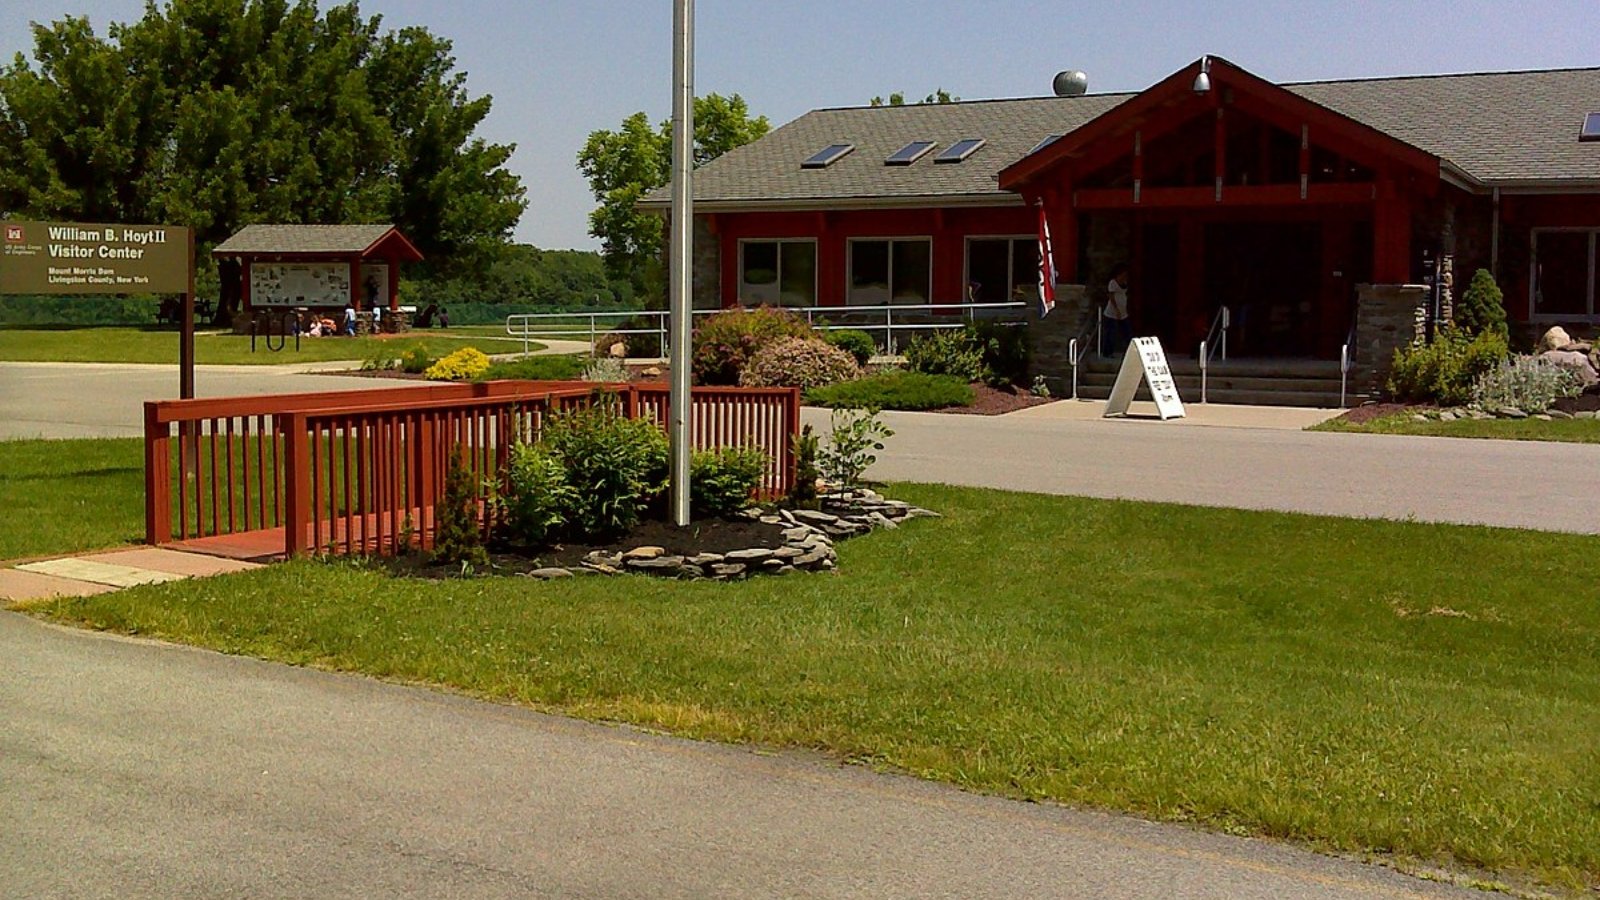
Located just north of Flint in Genesee County, Mt Morris has seen home prices more than triple since 2012. The area has long been considered budget-friendly, but in recent years, rising interest in suburban and exurban living has brought new buyers to town. While the 2020 data is missing, the jump from 2019 to 2021 indicates the pandemic housing surge likely played a major role in the local market.
Mt Morris benefits from its location near major routes like I-475 and I-75, making commuting feasible while keeping home prices low. Local amenities, small-town charm, and affordable housing continue to attract interest. It remains one of the most affordable options in southeastern Michigan, even as values increase steadily.
17. Hubbell – 62% Home Price Increase Since 2018

- 2010: N/A
- 2011: N/A
- 2012: N/A
- 2013: N/A
- 2014: N/A
- 2015: N/A
- 2016: N/A
- 2017: N/A
- 2018: $69,610
- 2019: $74,196 (+$4,586, +6.59% from previous year)
- 2020: N/A
- 2021: $81,317
- 2022: $96,435 (+$15,118, +18.59% from previous year)
- 2023: $96,820 (+$385, +0.40% from previous year)
- 2024: $100,355 (+$3,535, +3.65% from previous year)
- 2025: $112,761 (+$12,405, +12.36% from previous year)
Home prices in Hubbell have increased by 62% since 2018, with particularly strong growth in 2021 and 2022. While prices dipped slightly in 2020, the housing market rebounded with vigor in the years that followed, suggesting growing interest in this remote northern town.
Hubbell – Growth in the Upper Peninsula
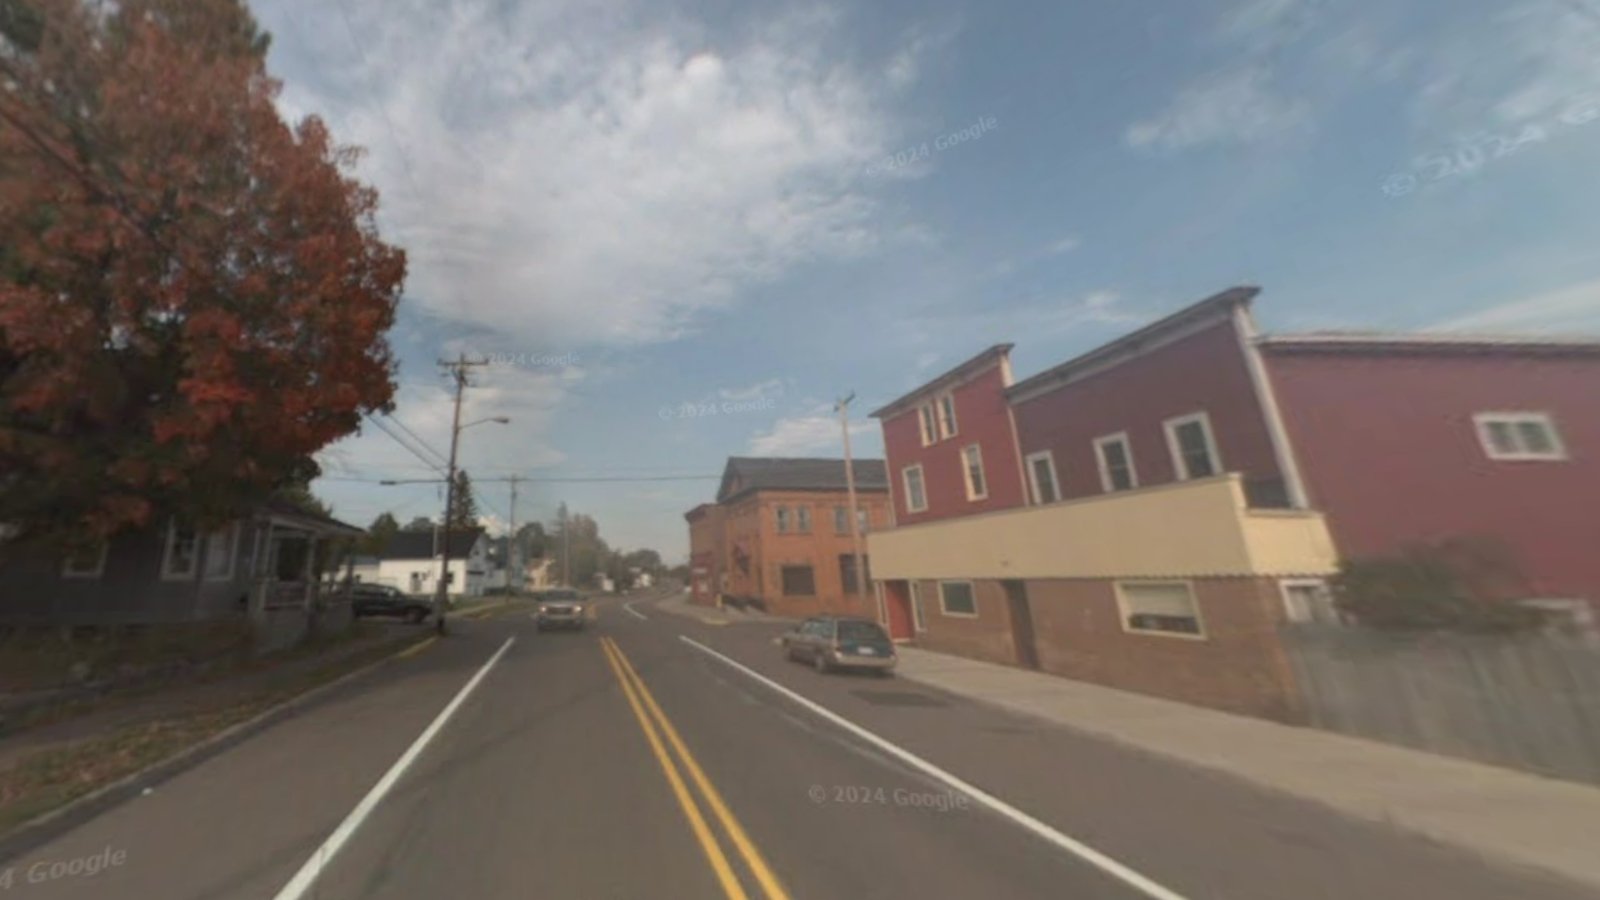
Tucked along the shore of Torch Lake in Michigan’s Keweenaw Peninsula, Hubbell offers scenic beauty and affordability. Its isolation kept prices low for years, but recent interest in small, nature-rich communities has driven up demand. By 2025, prices had climbed to over $112,000—still affordable by state standards, but a clear jump from earlier years.
The area’s mining history and natural features, including nearby trails and lake access, continue to appeal to both full-time residents and remote workers seeking peace and quiet. While growth has been steady, Hubbell remains a budget-friendly option in Michigan’s far north.
16. Inkster – 499% Home Price Increase Since 2012
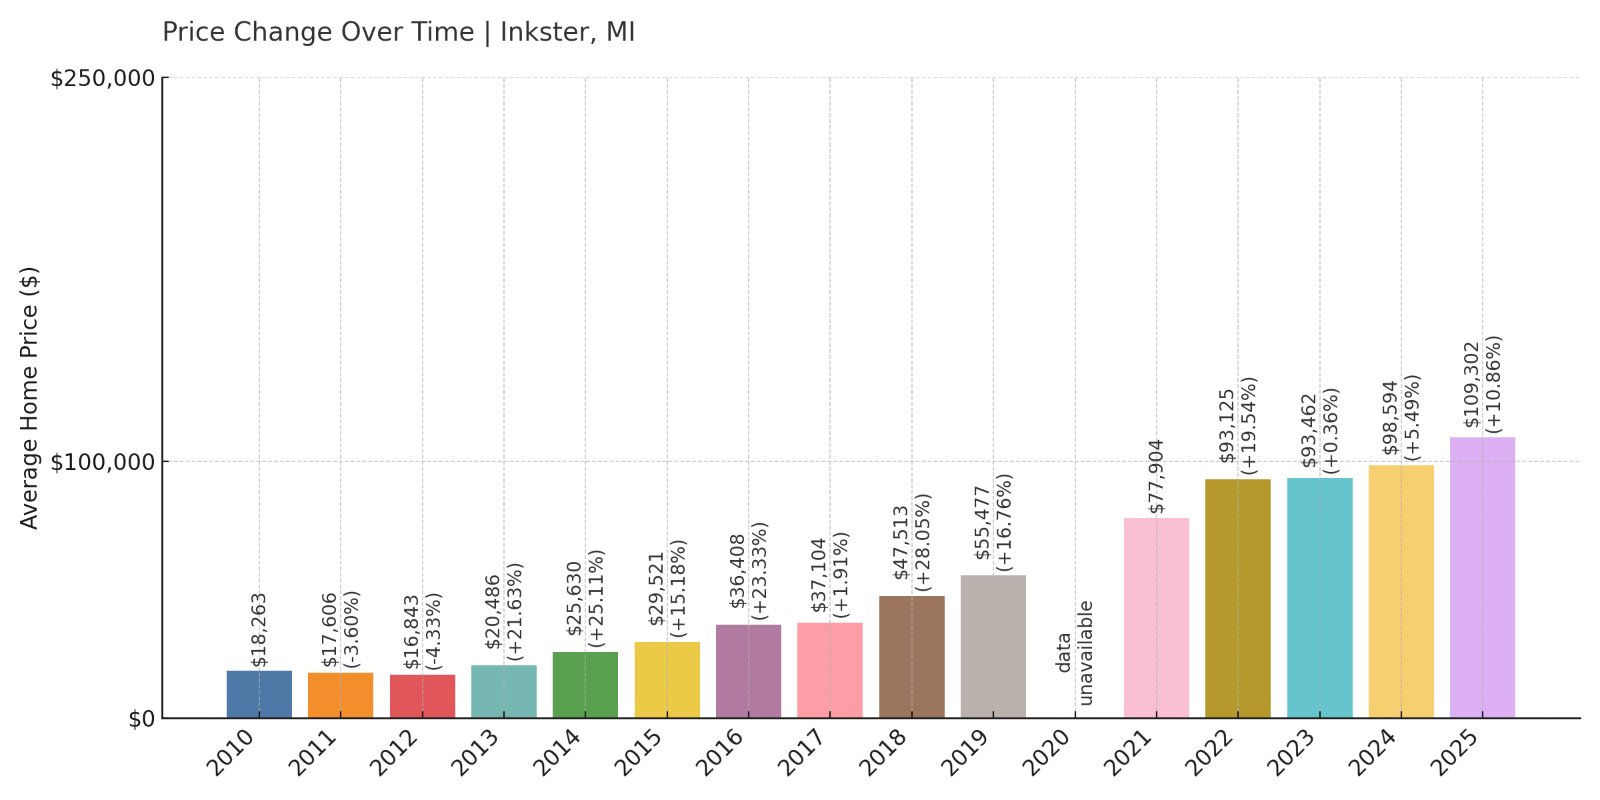
- 2010: $18,263
- 2011: $17,606 (-$657, -3.60% from previous year)
- 2012: $16,843 (-$763, -4.34% from previous year)
- 2013: $20,486 (+$3,643, +21.63% from previous year)
- 2014: $25,630 (+$5,144, +25.11% from previous year)
- 2015: $29,521 (+$3,892, +15.18% from previous year)
- 2016: $36,408 (+$6,887, +23.33% from previous year)
- 2017: $37,104 (+$695, +1.91% from previous year)
- 2018: $47,513 (+$10,410, +28.06% from previous year)
- 2019: $55,477 (+$7,964, +16.76% from previous year)
- 2020: N/A
- 2021: $77,904
- 2022: $93,125 (+$15,221, +19.54% from previous year)
- 2023: $93,462 (+$337, +0.36% from previous year)
- 2024: $98,594 (+$5,132, +5.49% from previous year)
- 2025: $109,302 (+$10,707, +10.86% from previous year)
Inkster has seen one of the most dramatic rises in this roundup, with home values climbing nearly fivefold since 2012. A surge between 2013 and 2016 laid the groundwork for a rebound in this historically undervalued town, and growth has remained steady since 2021.
Inkster – A Comeback Story in Metro Detroit
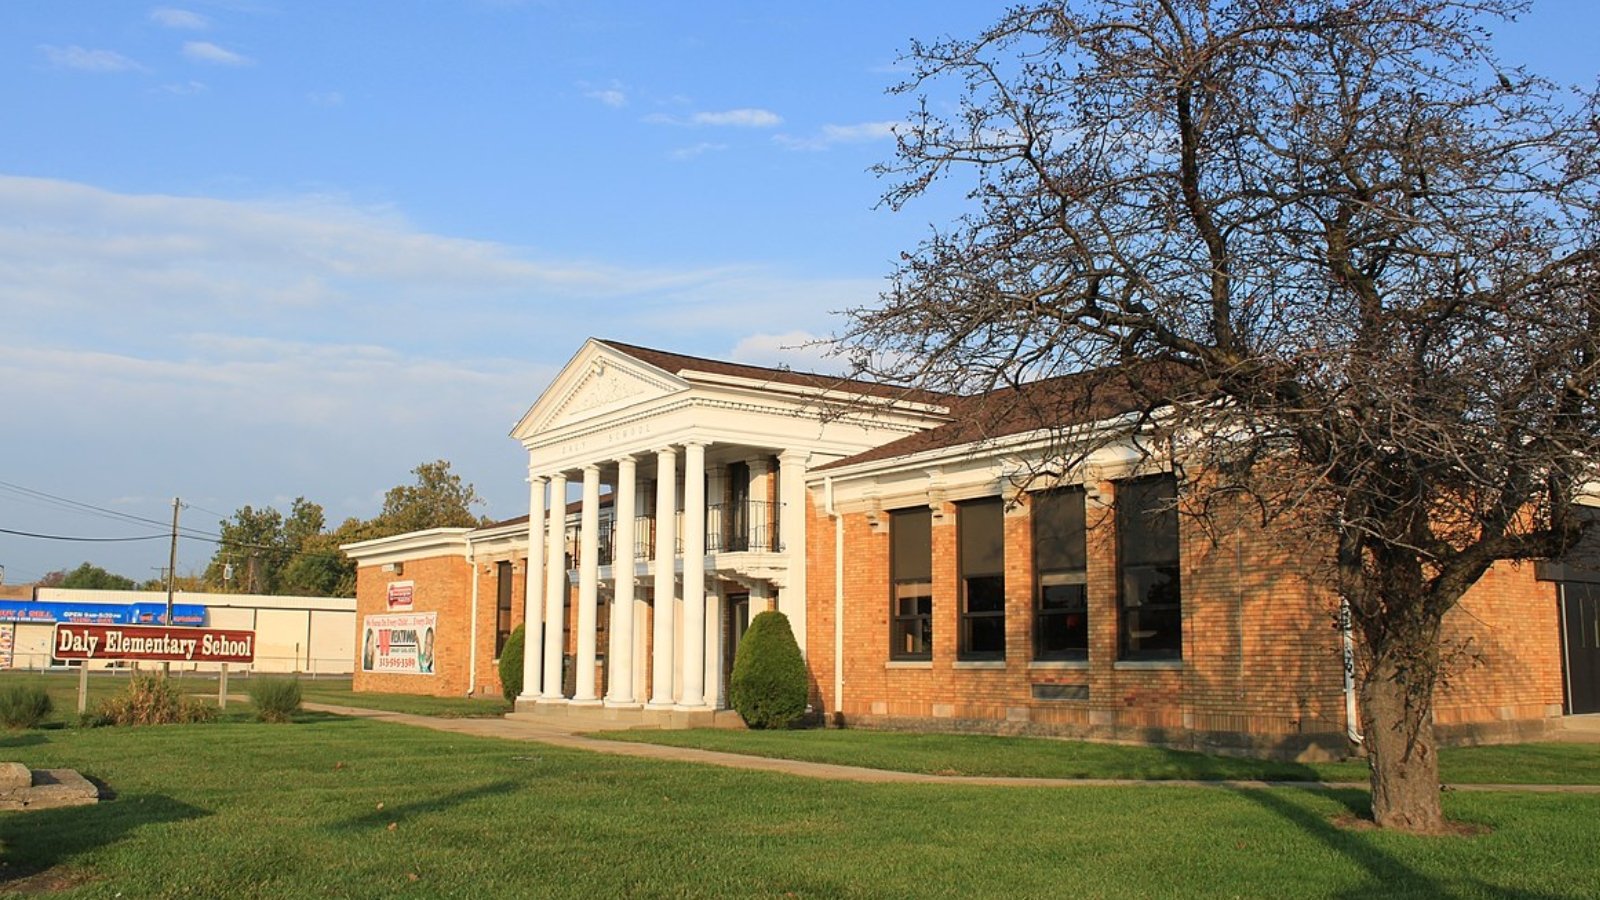
Located in Wayne County just west of Dearborn, Inkster was once overlooked by homebuyers. But affordability and proximity to Detroit’s job centers have made it increasingly attractive. With 2025 prices nearing $110,000, the town is no longer the bargain it once was—but it still ranks among the lowest in the state.
Price growth here reflects broader interest in Metro Detroit suburbs that had been undervalued for decades. The city’s modest size and improved housing stock have helped it steadily gain attention from first-time buyers and investors alike.
15. Bessemer – 142% Home Price Increase Since 2012
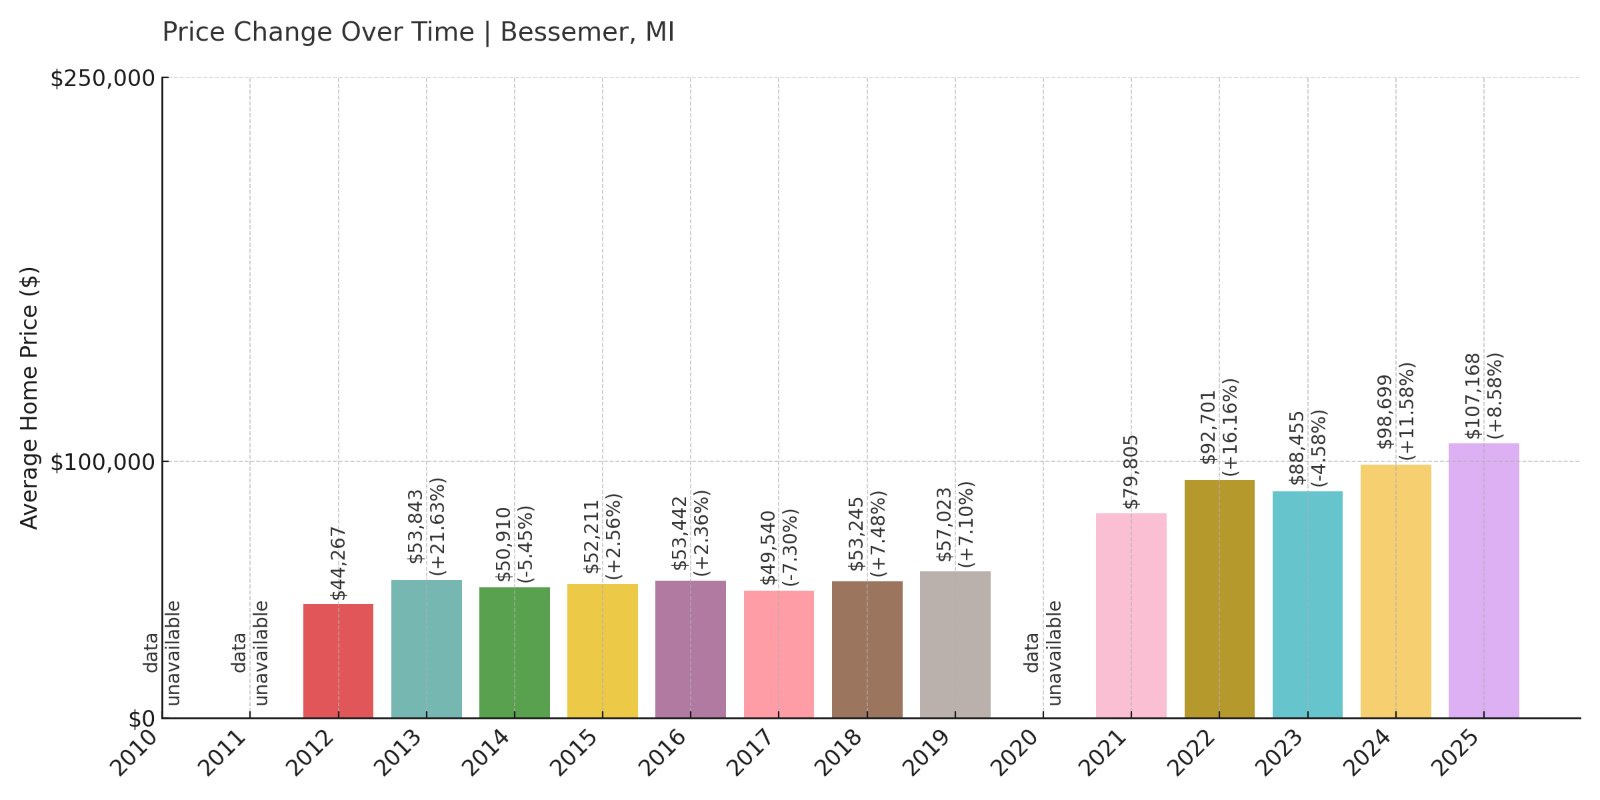
- 2010: N/A
- 2011: N/A
- 2012: $44,267
- 2013: $53,843 (+$9,575, +21.63% from previous year)
- 2014: $50,910 (-$2,933, -5.45% from previous year)
- 2015: $52,211 (+$1,302, +2.56% from previous year)
- 2016: $53,442 (+$1,231, +2.36% from previous year)
- 2017: $49,540 (-$3,903, -7.30% from previous year)
- 2018: $53,245 (+$3,706, +7.48% from previous year)
- 2019: $57,023 (+$3,778, +7.10% from previous year)
- 2020: N/A
- 2021: $79,805
- 2022: $92,701 (+$12,896, +16.16% from previous year)
- 2023: $88,455 (-$4,246, -4.58% from previous year)
- 2024: $98,699 (+$10,244, +11.58% from previous year)
- 2025: $107,168 (+$8,469, +8.58% from previous year)
Since 2012, Bessemer has seen home values more than double. After some early volatility, prices took off post-2020 and have continued rising into 2025. The affordability remains strong, even as interest in the area grows.
Bessemer – Affordable Living in the Western U.P.
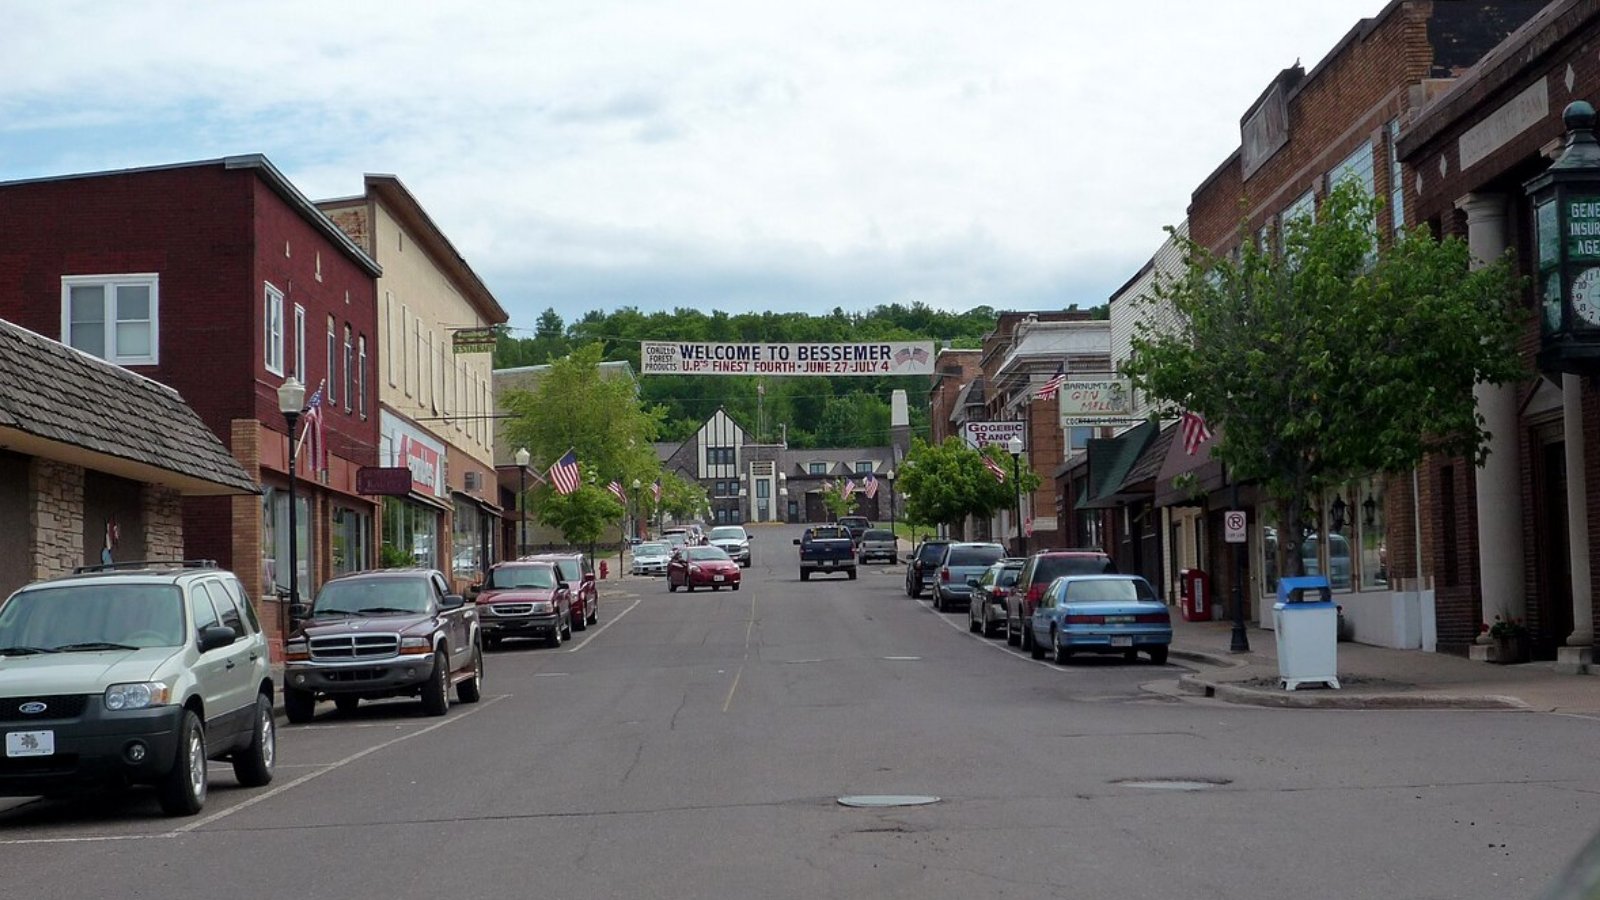
Bessemer lies in Gogebic County, near the Wisconsin border and close to popular skiing destinations like Big Powderhorn Mountain. The area is rich in outdoor recreation, and housing prices remain low by statewide standards. Still, demand has picked up—likely due to the area’s appeal for retirees and remote workers.
With 2025 values averaging just over $107,000, Bessemer is still affordable, but clearly gaining momentum. Its scenic location, relatively low taxes, and tight-knit community continue to draw attention in a state where more accessible housing is in high demand.
14. Mount Morris – 147% Home Price Increase Since 2012
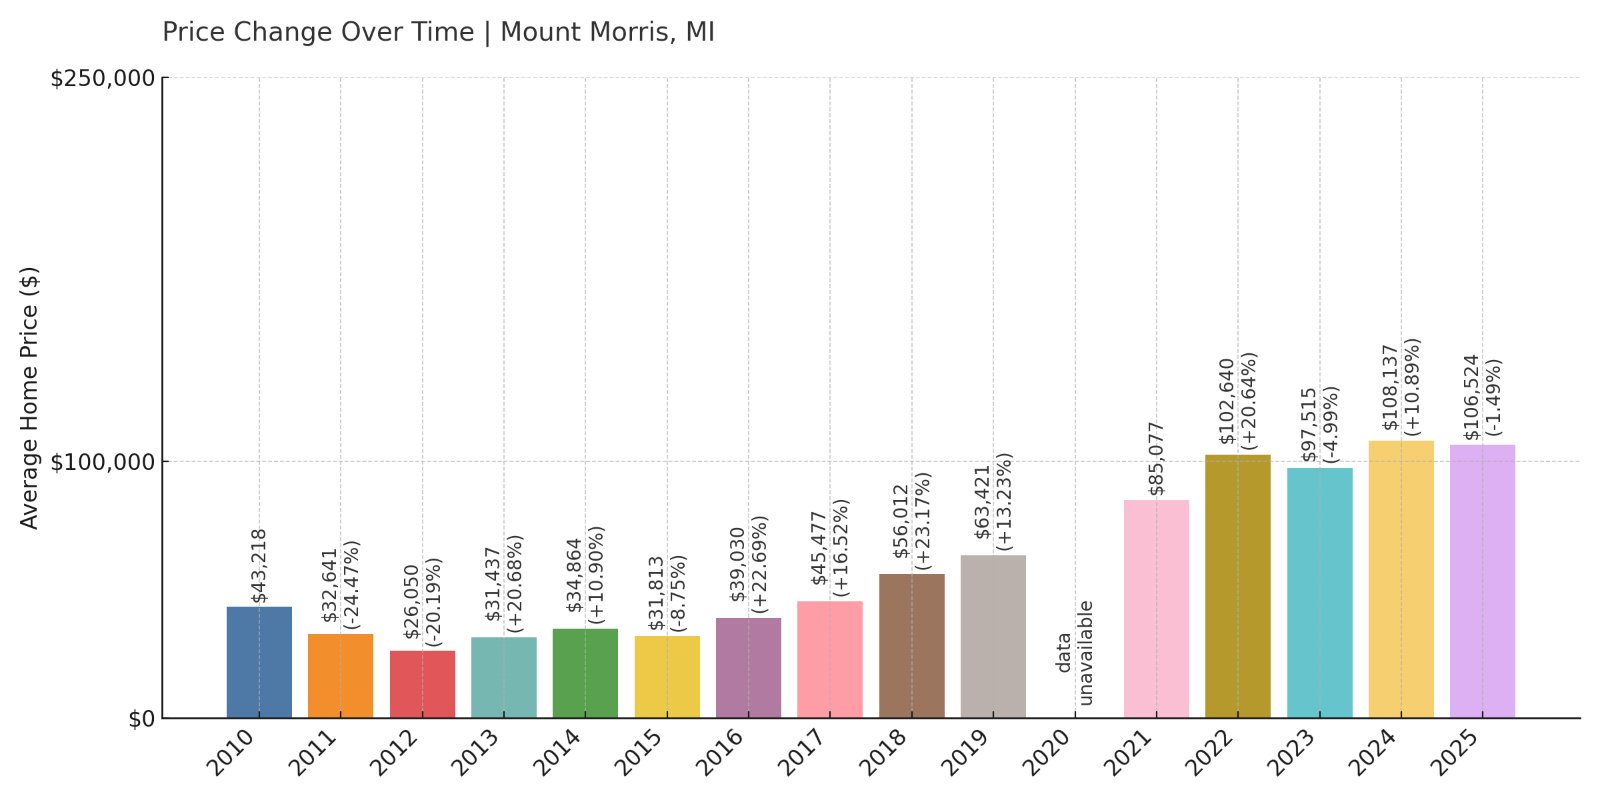
- 2010: $43,218
- 2011: $32,641 (-$10,577, -24.47% from previous year)
- 2012: $26,050 (-$6,592, -20.19% from previous year)
- 2013: $31,437 (+$5,388, +20.68% from previous year)
- 2014: $34,864 (+$3,427, +10.90% from previous year)
- 2015: $31,813 (-$3,051, -8.75% from previous year)
- 2016: $39,030 (+$7,218, +22.69% from previous year)
- 2017: $45,477 (+$6,447, +16.52% from previous year)
- 2018: $56,012 (+$10,535, +23.17% from previous year)
- 2019: $63,421 (+$7,409, +13.23% from previous year)
- 2020: N/A
- 2021: $85,077
- 2022: $102,640 (+$17,562, +20.64% from previous year)
- 2023: $97,515 (-$5,124, -4.99% from previous year)
- 2024: $108,137 (+$10,622, +10.89% from previous year)
- 2025: $106,524 (-$1,612, -1.49% from previous year)
Mount Morris has experienced a 147% rise in home prices since 2012, following a volatile but ultimately upward trend. A huge boost came between 2016 and 2019, and even though 2023 and 2025 saw minor dips, the long-term picture shows remarkable appreciation.
Mount Morris – Small Town, Strong Price Recovery

Mount Morris, not to be confused with nearby Mt Morris, sits in Genesee County near Flint and has seen steady investment and gradual price recovery. After hitting a low point in 2012, the local housing market rebounded strongly, particularly in the years following the pandemic.
With 2025 prices topping $106,000, Mount Morris still ranks as one of the most affordable places in Michigan. The appeal comes from its proximity to Flint’s revitalizing neighborhoods and ease of access to regional highways. Local amenities, including schools and community parks, help it stay attractive for budget-minded homebuyers.
13. Iron River – 88% Home Price Increase Since 2012
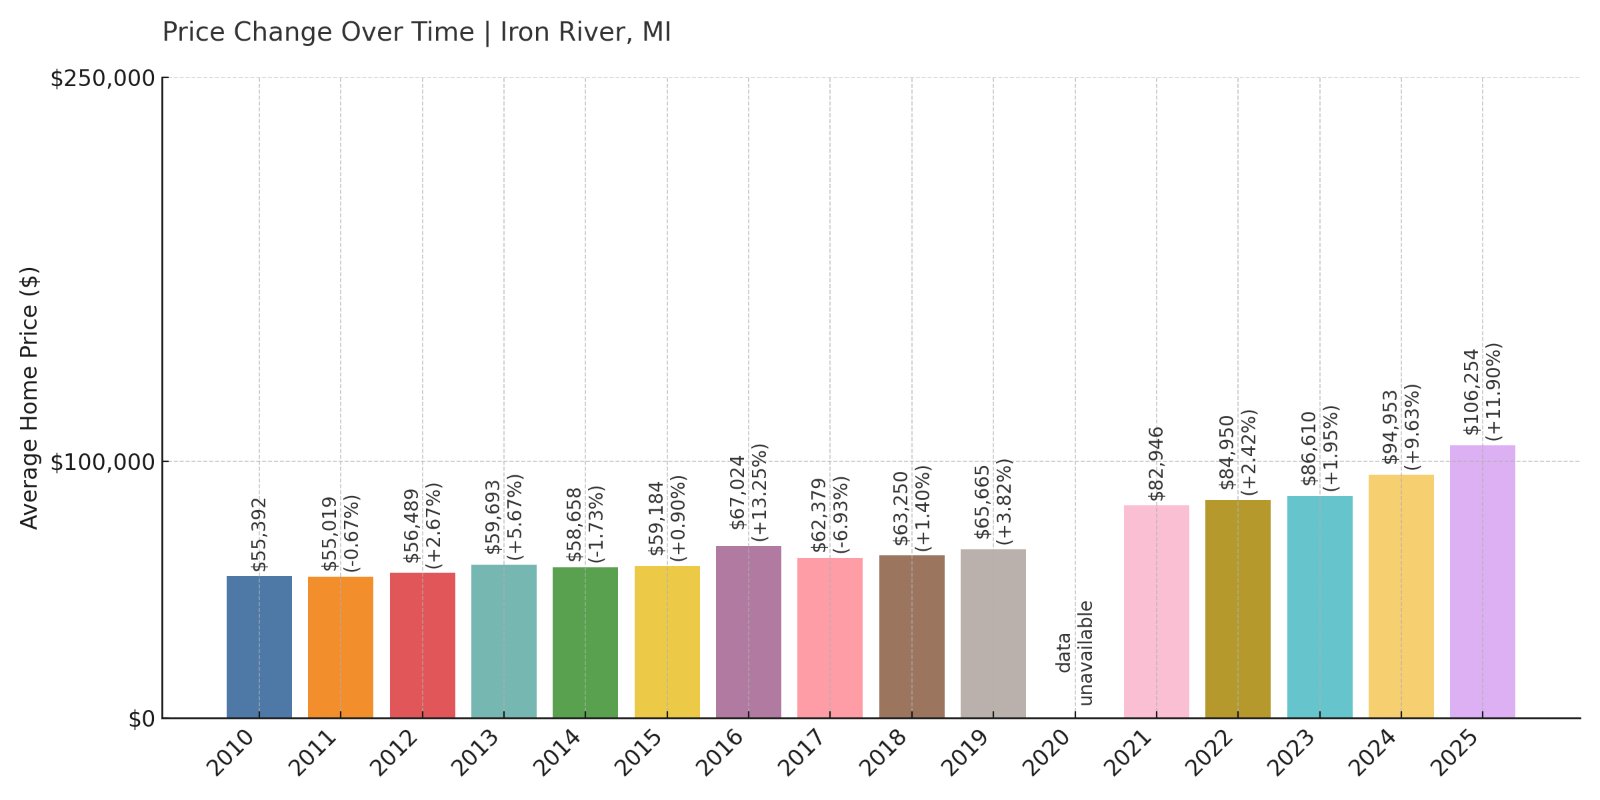
- 2010: $55,392
- 2011: $55,019 (-$373, -0.67% from previous year)
- 2012: $56,489 (+$1,470, +2.67% from previous year)
- 2013: $59,693 (+$3,203, +5.67% from previous year)
- 2014: $58,658 (-$1,034, -1.73% from previous year)
- 2015: $59,184 (+$526, +0.90% from previous year)
- 2016: $67,024 (+$7,840, +13.25% from previous year)
- 2017: $62,379 (-$4,645, -6.93% from previous year)
- 2018: $63,250 (+$871, +1.40% from previous year)
- 2019: $65,665 (+$2,415, +3.82% from previous year)
- 2020: N/A
- 2021: $82,946
- 2022: $84,950 (+$2,003, +2.42% from previous year)
- 2023: $86,610 (+$1,661, +1.95% from previous year)
- 2024: $94,953 (+$8,343, +9.63% from previous year)
- 2025: $106,254 (+$11,301, +11.90% from previous year)
Iron River has seen nearly 90% growth in home values since 2012. Most of this change came after 2020, as rural towns across the U.S. attracted more attention. The recent double-digit increase in 2025 underscores a late-stage surge in demand.
Iron River – Affordable Homes in the Western U.P.
Iron River lies in Michigan’s western Upper Peninsula, not far from the Wisconsin border. Known for outdoor recreation and small-town living, it has gradually become more attractive to retirees, remote workers, and seasonal residents alike. This shift is clearly reflected in recent price trends.
Despite limited growth in the early 2010s, the town saw a strong jump in value after 2021, with consistent year-over-year gains. With a 2025 average of just over $106,000, it remains an accessible option compared to statewide averages, particularly for buyers seeking privacy and natural surroundings.
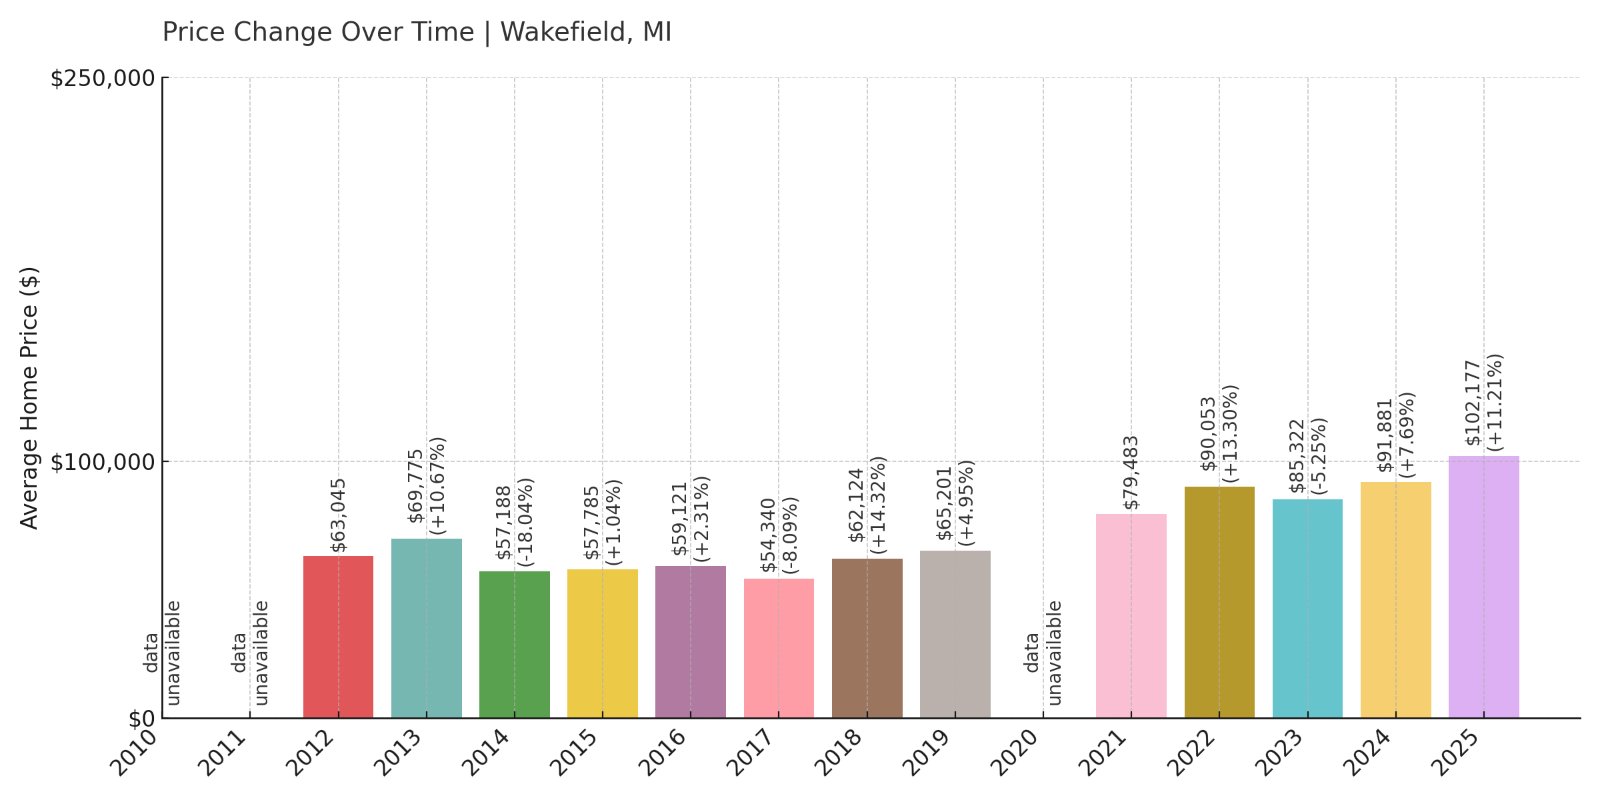
12. Wakefield – 62% Home Price Increase Since 2012
🔥 Would you like to save this?
- 2010: N/A
- 2011: N/A
- 2012: $63,045
- 2013: $69,775 (+$6,730, +10.68% from previous year)
- 2014: $57,188 (-$12,587, -18.04% from previous year)
- 2015: $57,785 (+$597, +1.04% from previous year)
- 2016: $59,121 (+$1,336, +2.31% from previous year)
- 2017: $54,340 (-$4,781, -8.09% from previous year)
- 2018: $62,124 (+$7,783, +14.32% from previous year)
- 2019: $65,201 (+$3,077, +4.95% from previous year)
- 2020: N/A
- 2021: $79,483
- 2022: $90,053 (+$10,570, +13.30% from previous year)
- 2023: $85,322 (-$4,731, -5.25% from previous year)
- 2024: $91,881 (+$6,559, +7.69% from previous year)
- 2025: $102,177 (+$10,296, +11.21% from previous year)
Wakefield’s housing market has grown 62% since 2012, despite some sharp ups and downs along the way. After a 2023 dip, the town regained momentum with solid gains in 2024 and 2025, signaling ongoing buyer interest.
Wakefield – Slow Start, Strong Finish
Located just east of Bessemer in Gogebic County, Wakefield shares the scenic Upper Peninsula setting and affordable housing. Like its neighbor, it saw slow growth in the mid-2010s, followed by more robust appreciation as people began looking for quieter places to settle.
Wakefield’s most recent growth—an 11% jump in 2025—shows its market remains active. The town is known for its proximity to ski hills, hiking trails, and lakes, making it appealing to outdoor enthusiasts and retirees. While still well below statewide price averages, Wakefield’s affordability is narrowing as demand increases.
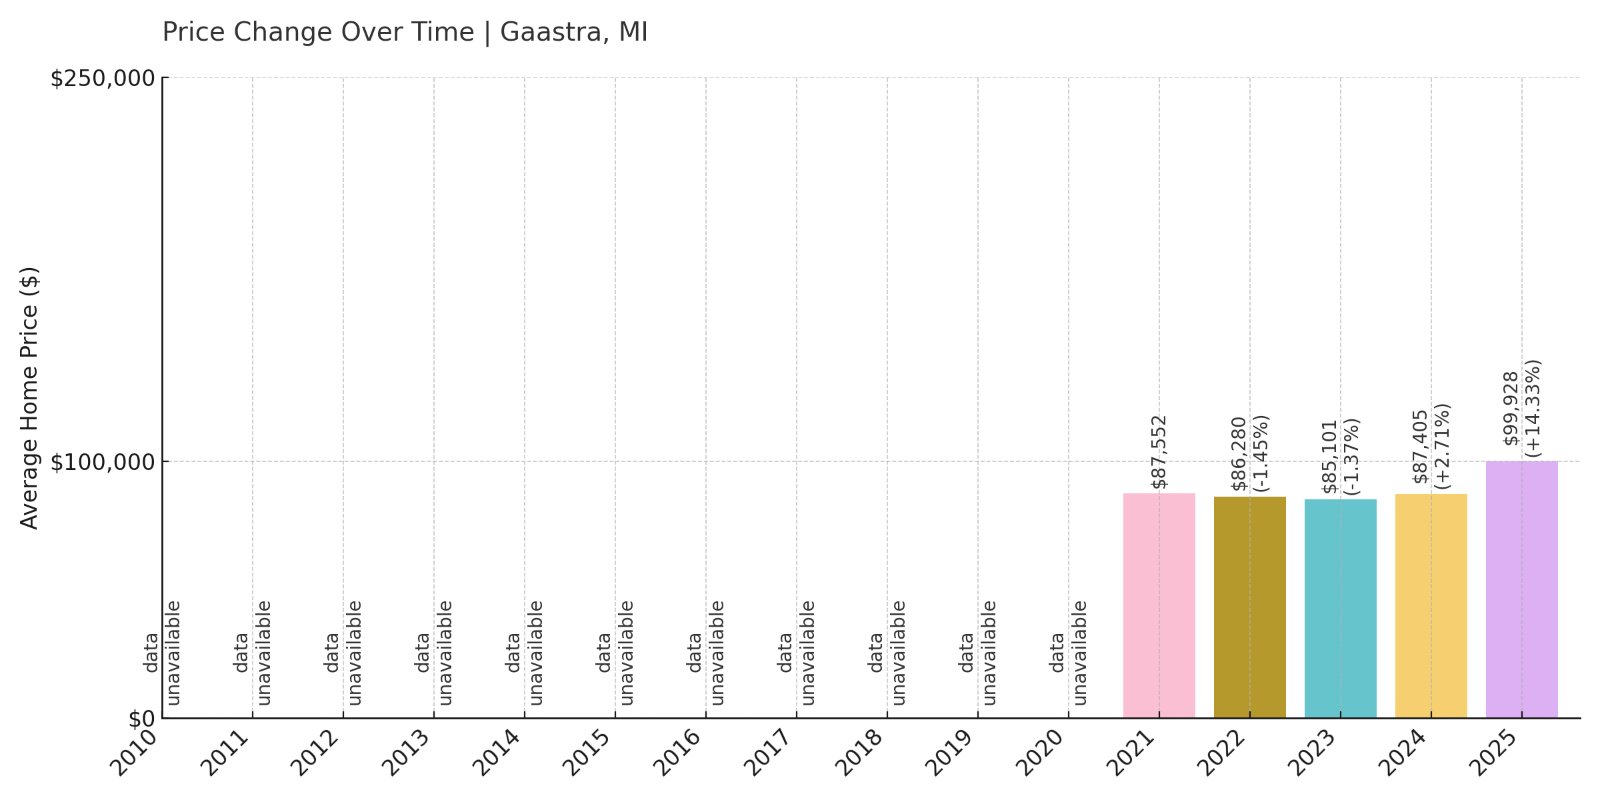
11. Gaastra – 14% Home Price Increase Since 2021
- 2010: N/A
- 2011: N/A
- 2012: N/A
- 2013: N/A
- 2014: N/A
- 2015: N/A
- 2016: N/A
- 2017: N/A
- 2018: N/A
- 2019: N/A
- 2020: N/A
- 2021: $87,552
- 2022: $86,280 (-$1,272, -1.45% from previous year)
- 2023: $85,101 (-$1,179, -1.37% from previous year)
- 2024: $87,405 (+$2,304, +2.71% from previous year)
- 2025: $99,928 (+$12,523, +14.33% from previous year)
Gaastra’s pricing history only goes back to 2021, but even in that short span, the town has posted a 14% gain. The strongest jump came in 2025, when prices leapt over 14% year-over-year, suggesting a late but strong surge in demand.
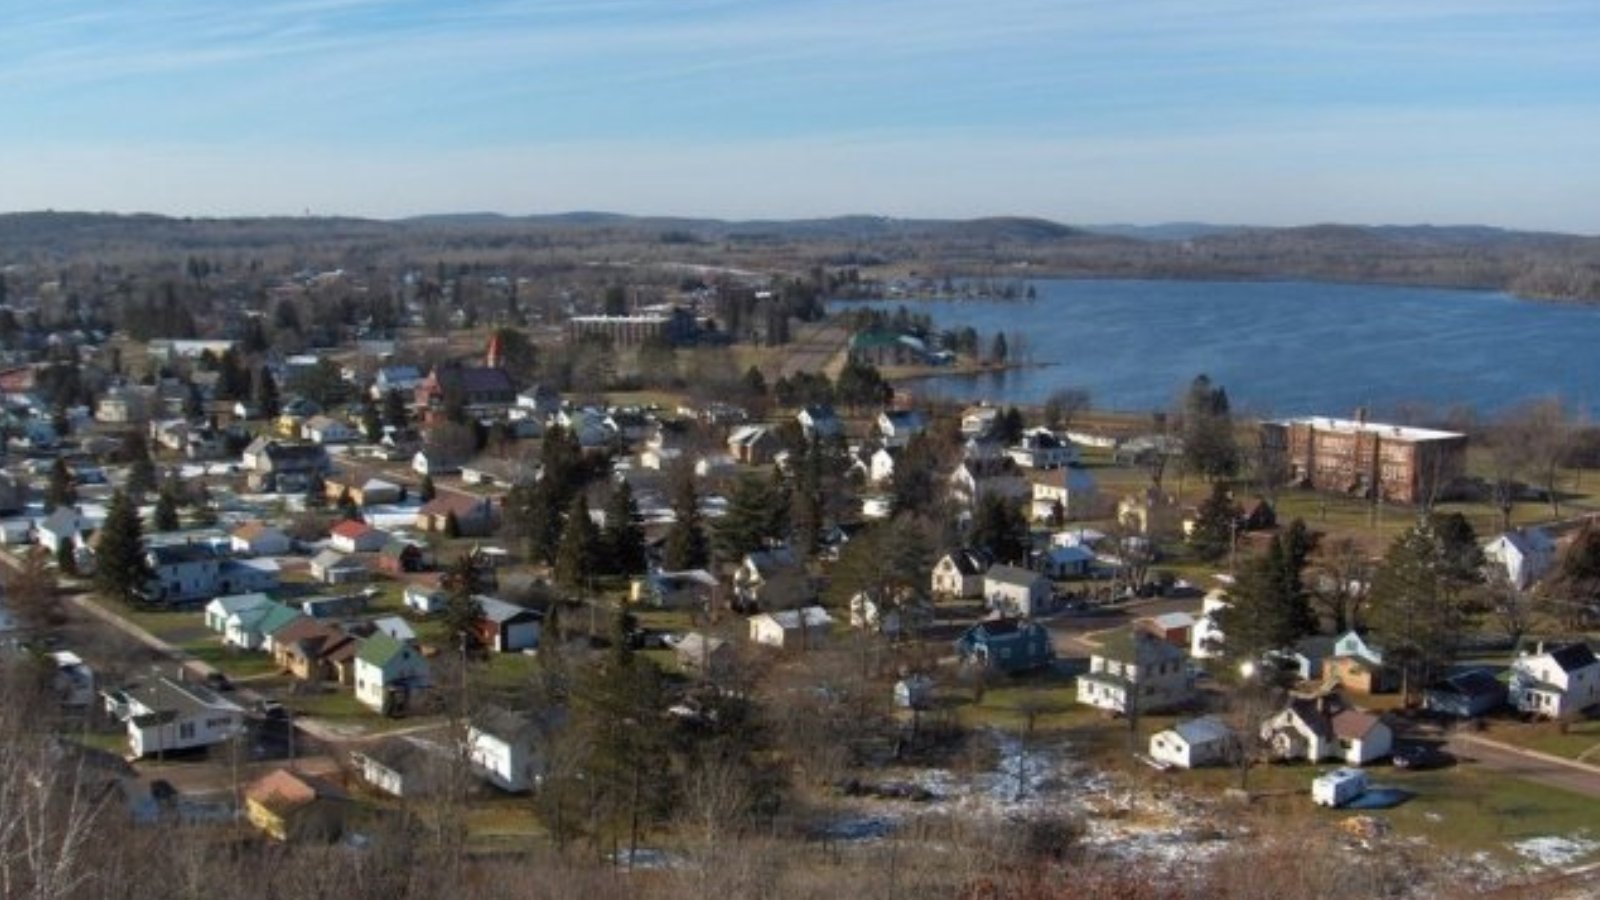
Gaastra – Tiny Town, Big Jump
Gaastra is one of Michigan’s smallest cities, located in Iron County near Iron River. Limited housing stock and local activity have kept prices stable for years, but recent increases suggest renewed interest. The 2025 price spike is especially notable for a place that saw declines just a year or two prior.
With an average price still under $100,000, Gaastra remains very affordable. That said, its jump in value is worth watching. Remote work, low taxes, and proximity to recreation areas likely play a role in this town’s recent pricing momentum.
10. Prescott – 109% Home Price Increase Since 2012
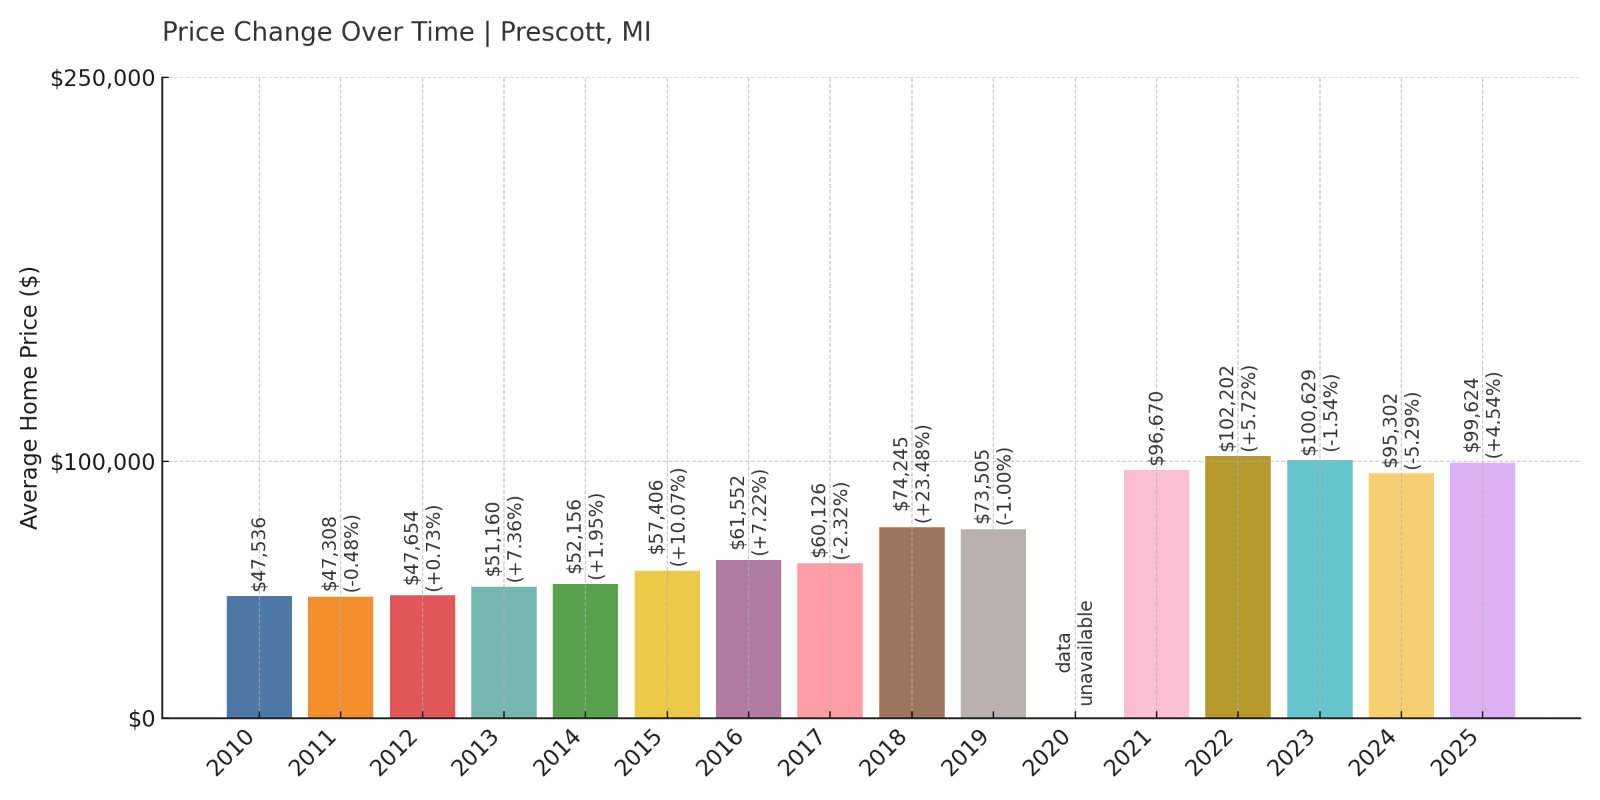
- 2010: $47,536
- 2011: $47,308 (-$228, -0.48% from previous year)
- 2012: $47,654 (+$346, +0.73% from previous year)
- 2013: $51,160 (+$3,506, +7.36% from previous year)
- 2014: $52,156 (+$997, +1.95% from previous year)
- 2015: $57,406 (+$5,250, +10.07% from previous year)
- 2016: $61,552 (+$4,146, +7.22% from previous year)
- 2017: $60,126 (-$1,426, -2.32% from previous year)
- 2018: $74,245 (+$14,119, +23.48% from previous year)
- 2019: $73,505 (-$740, -1.00% from previous year)
- 2020: N/A
- 2021: $96,670
- 2022: $102,202 (+$5,532, +5.72% from previous year)
- 2023: $100,629 (-$1,573, -1.54% from previous year)
- 2024: $95,302 (-$5,327, -5.29% from previous year)
- 2025: $99,624 (+$4,323, +4.54% from previous year)
Prescott has more than doubled in value since 2012, even with recent fluctuations. The biggest spike came in 2018, followed by more modest gains. The past two years were less consistent, but the town’s long-term growth trend remains strong.
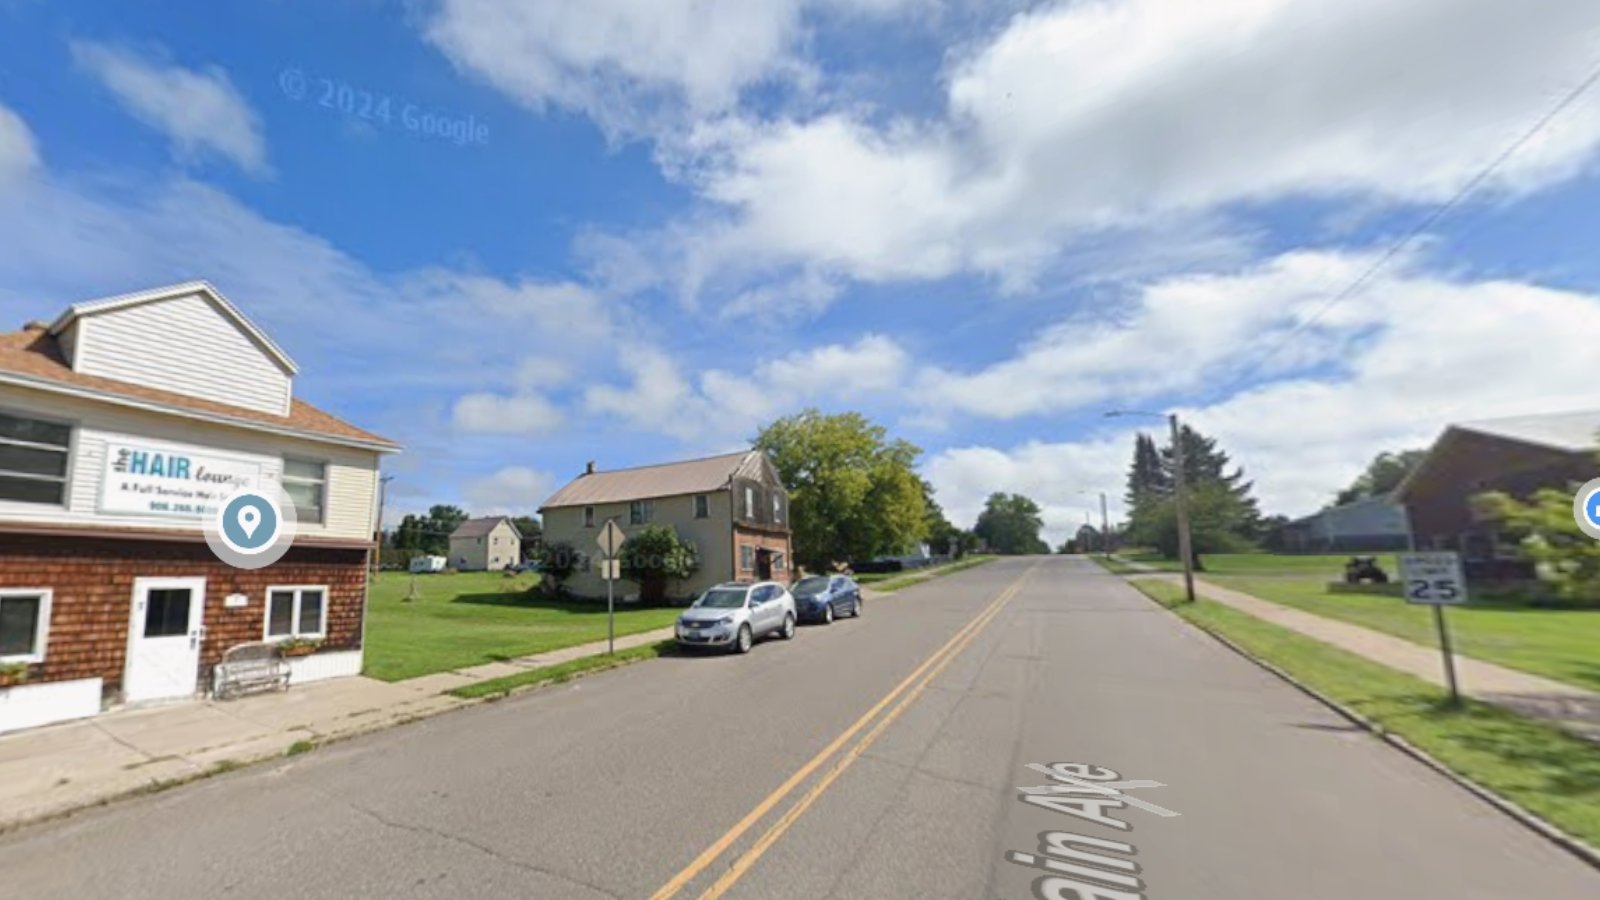
Prescott – Rural Rise with Bumps Along the Way
Prescott is a small rural community in Ogemaw County, located in Michigan’s northeastern Lower Peninsula. Traditionally known for its quiet surroundings and modest housing stock, Prescott saw a significant jump in home prices around 2018, followed by a post-pandemic boom in 2021.
Despite some dips in 2023 and 2024, the rebound in 2025 points to resilience in the local market. At just under $100,000, homes in Prescott are still highly affordable. For buyers seeking peace, woods, and a small-town pace of life, this area continues to hold appeal.
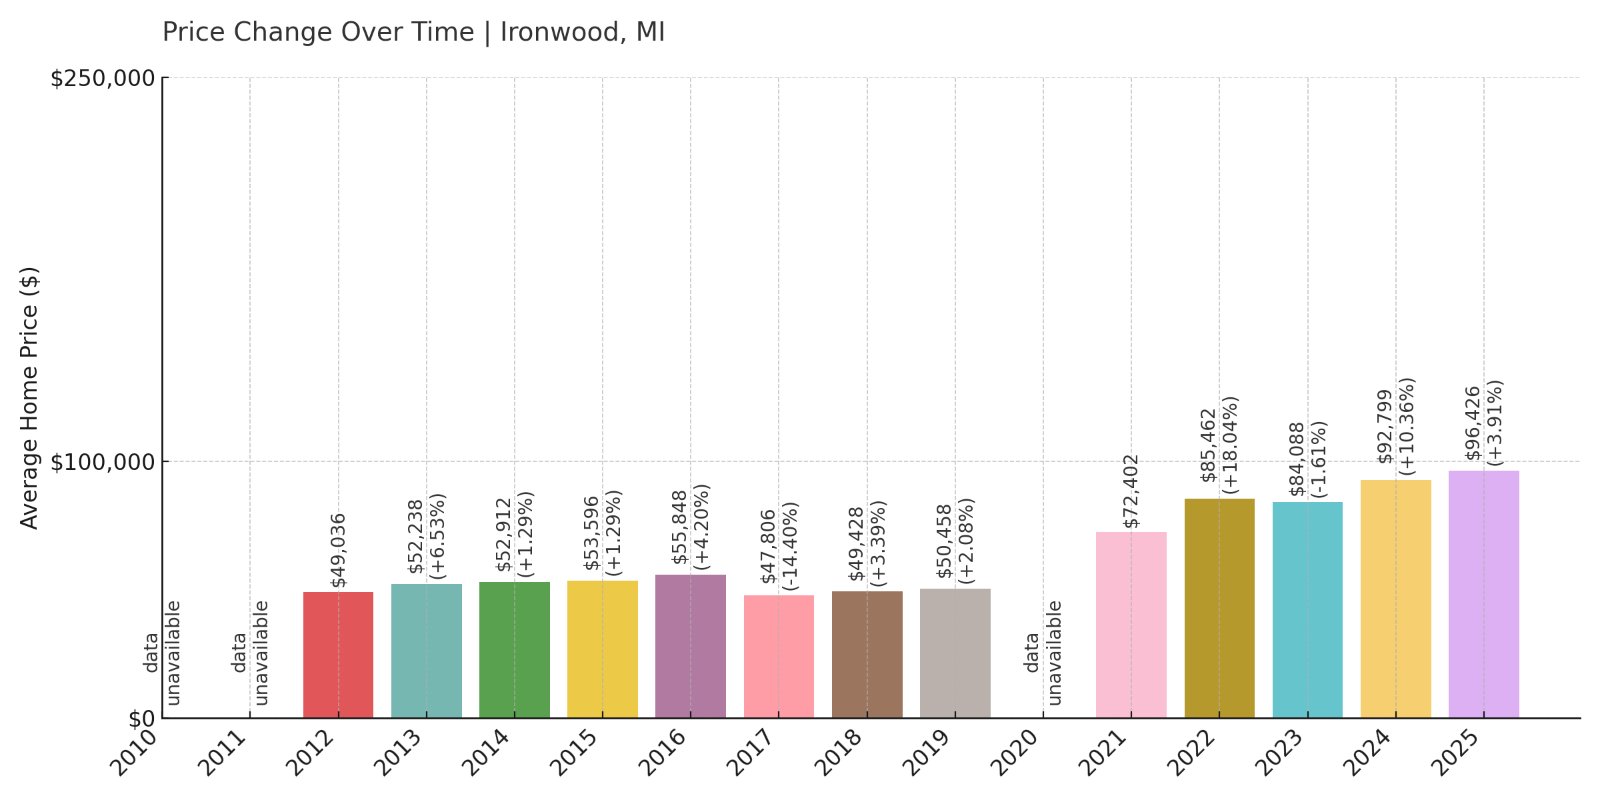
9. Ironwood – 97% Home Price Increase Since 2012
- 2010: N/A
- 2011: N/A
- 2012: $49,036
- 2013: $52,238 (+$3,202, +6.53% from previous year)
- 2014: $52,912 (+$674, +1.29% from previous year)
- 2015: $53,596 (+$684, +1.29% from previous year)
- 2016: $55,848 (+$2,252, +4.20% from previous year)
- 2017: $47,806 (-$8,042, -14.40% from previous year)
- 2018: $49,428 (+$1,621, +3.39% from previous year)
- 2019: $50,458 (+$1,030, +2.08% from previous year)
- 2020: N/A
- 2021: $72,402
- 2022: $85,462 (+$13,060, +18.04% from previous year)
- 2023: $84,088 (-$1,374, -1.61% from previous year)
- 2024: $92,799 (+$8,710, +10.36% from previous year)
- 2025: $96,426 (+$3,628, +3.91% from previous year)
Ironwood’s home prices have grown nearly 100% since 2012. The early years showed gradual increases, with a major uptick beginning in 2021. Despite a slight pullback in 2023, recent years show continued appreciation.
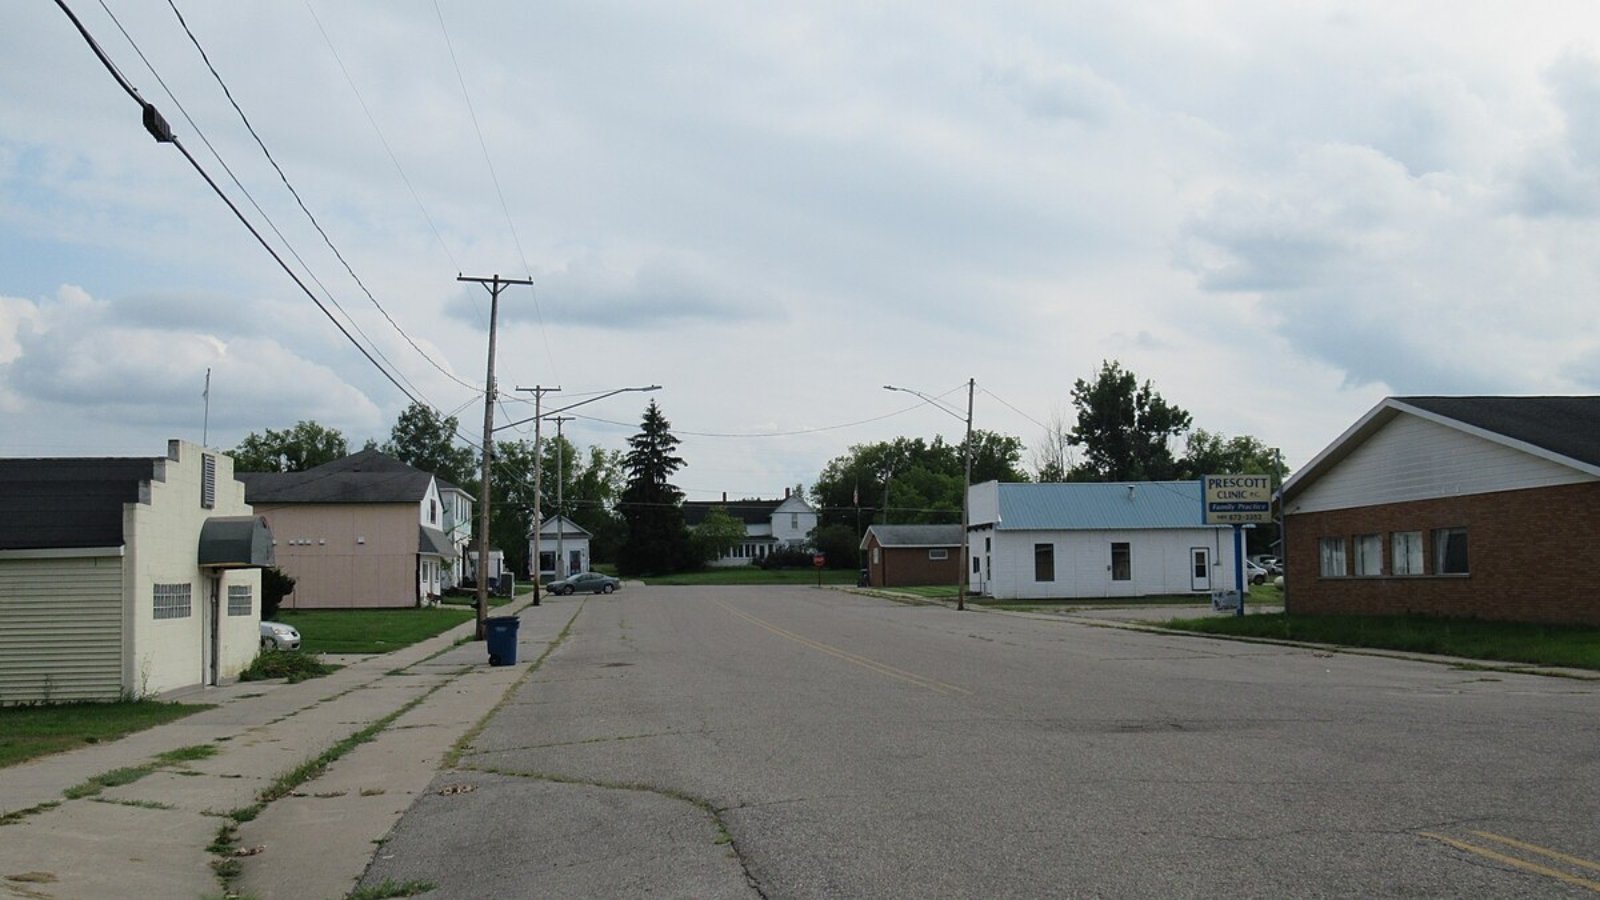
Ironwood – A Gateway to Michigan’s Western Edge
Nestled in the far western edge of the Upper Peninsula, Ironwood offers a unique blend of rugged wilderness and community charm. Its history as a mining and timber town has given way to an economy supported by tourism and local services.
Ironwood’s housing market picked up after 2020, likely fueled by rising interest in outdoor lifestyles and remote work. With average prices still below $100,000 in 2025, it’s drawing buyers looking for value without sacrificing access to amenities like trails, ski resorts, and cultural centers.
8. Kincheloe – 64% Home Price Increase Since 2012
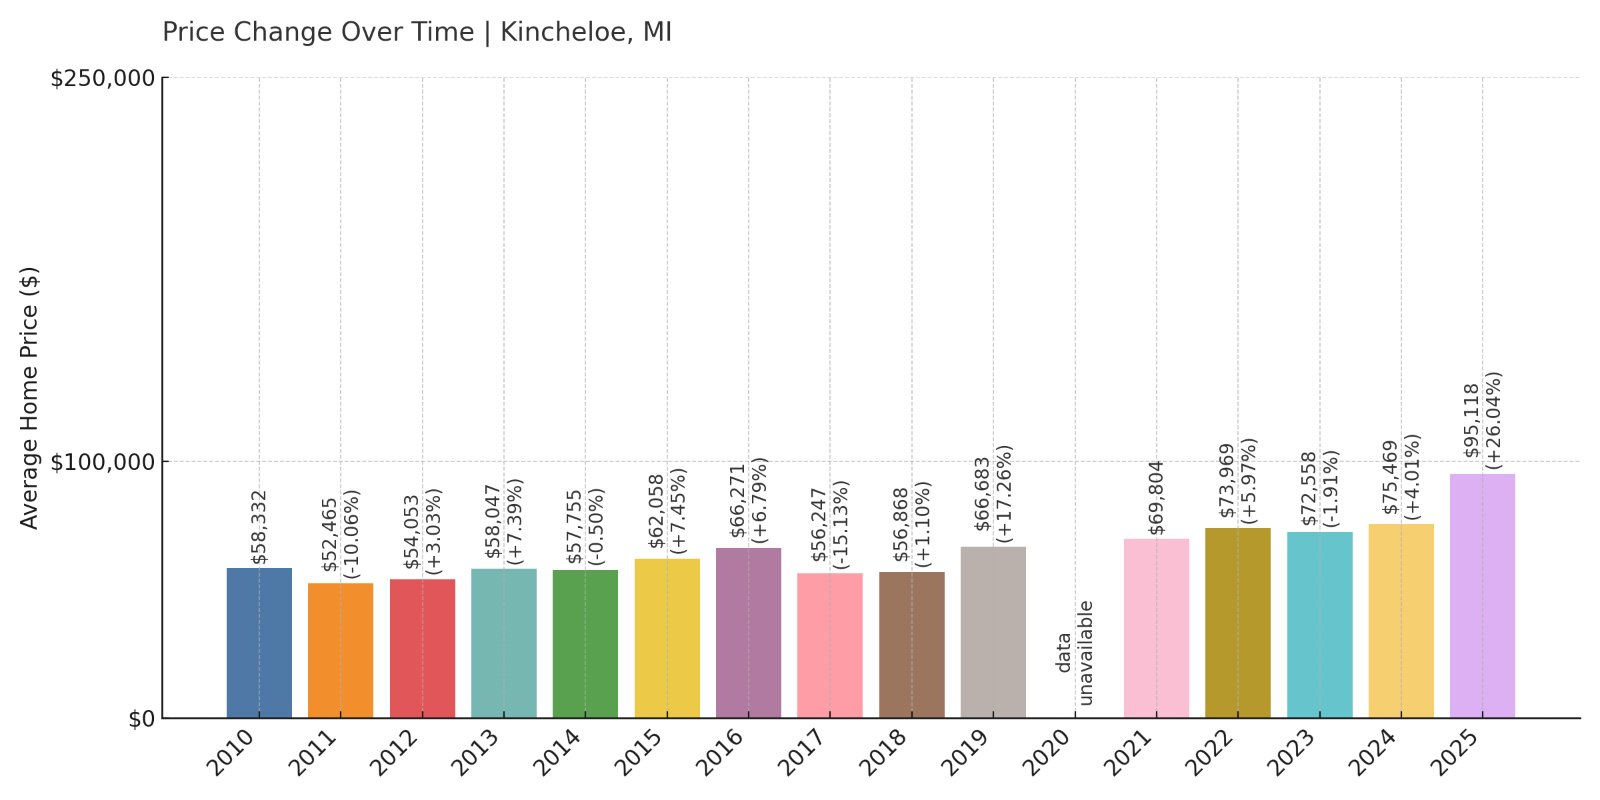
- 2010: $58,332
- 2011: $52,465 (-$5,867, -10.06% from previous year)
- 2012: $54,053 (+$1,587, +3.03% from previous year)
- 2013: $58,047 (+$3,995, +7.39% from previous year)
- 2014: $57,755 (-$293, -0.50% from previous year)
- 2015: $62,058 (+$4,303, +7.45% from previous year)
- 2016: $66,271 (+$4,213, +6.79% from previous year)
- 2017: $56,247 (-$10,024, -15.13% from previous year)
- 2018: $56,868 (+$620, +1.10% from previous year)
- 2019: $66,683 (+$9,816, +17.26% from previous year)
- 2020: N/A
- 2021: $69,804
- 2022: $73,969 (+$4,165, +5.97% from previous year)
- 2023: $72,558 (-$1,411, -1.91% from previous year)
- 2024: $75,469 (+$2,911, +4.01% from previous year)
- 2025: $95,118 (+$19,648, +26.04% from previous year)
Kincheloe’s home prices have climbed 64% since 2012, with its largest increase coming in the most recent year. The 2025 leap of over 26% suggests rising demand in this remote area, after years of smaller movements.
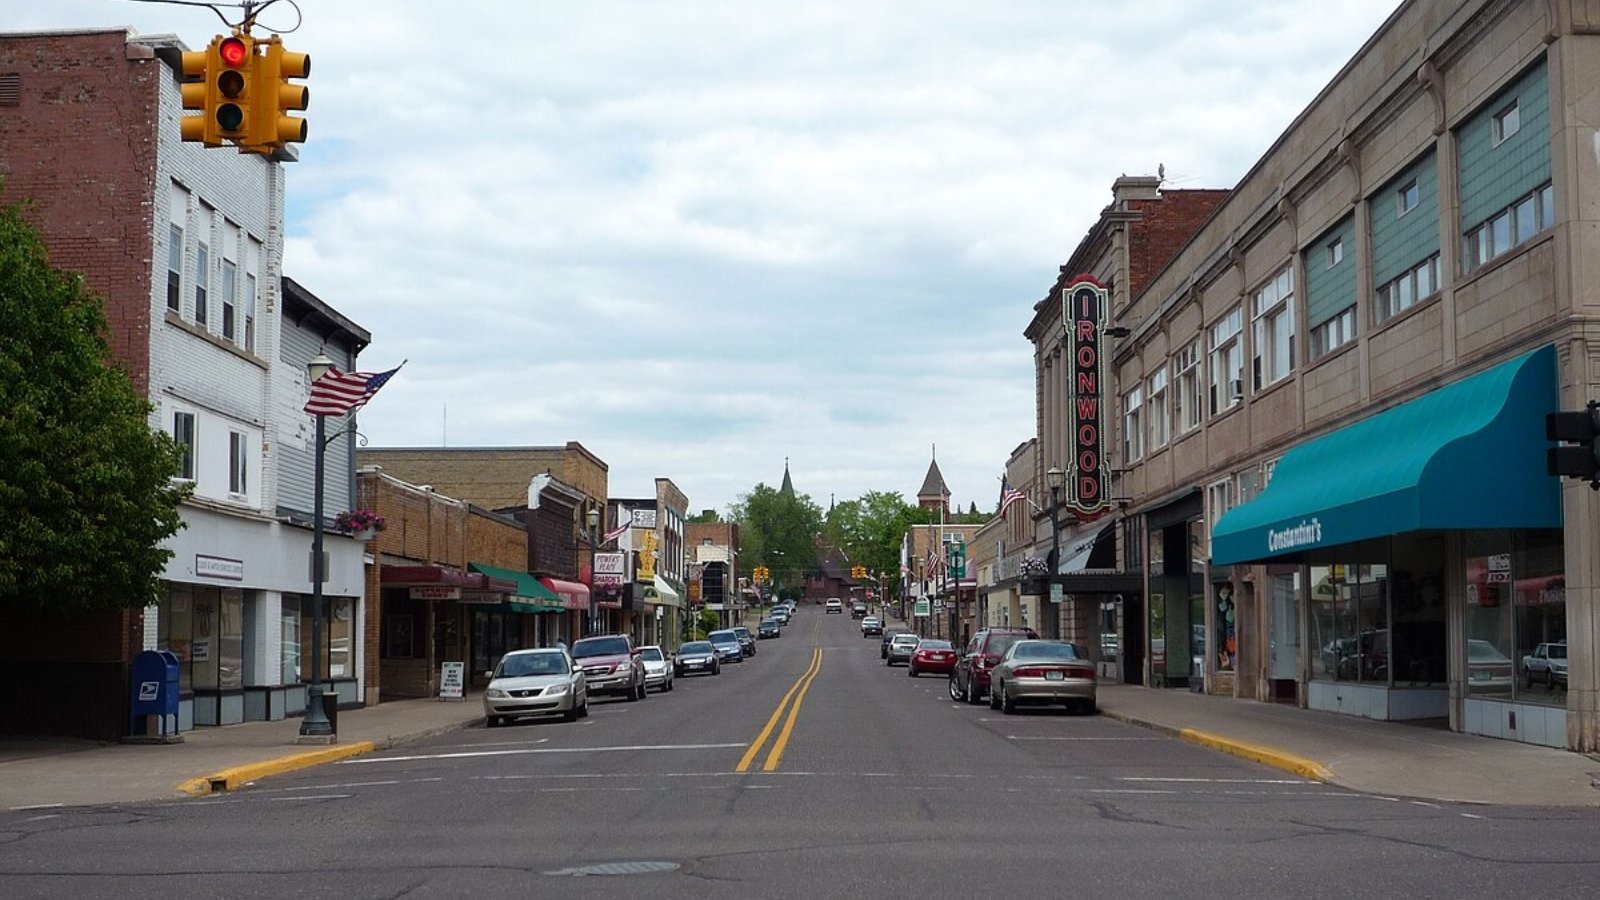
Kincheloe – Quiet Growth in the Eastern U.P.
Kincheloe is a small community in Chippewa County, just south of Sault Ste. Marie. Once the site of a U.S. Air Force base, Kincheloe has been repurposed into a residential area surrounded by forest and farmland. While its housing market remained quiet for years, it’s recently shown signs of robust appreciation.
The 2025 spike could reflect a mix of affordability-driven migration and increased interest in rural living. Even after this sharp jump, average prices in Kincheloe remain under $100,000, making it one of the most accessible towns on this list.
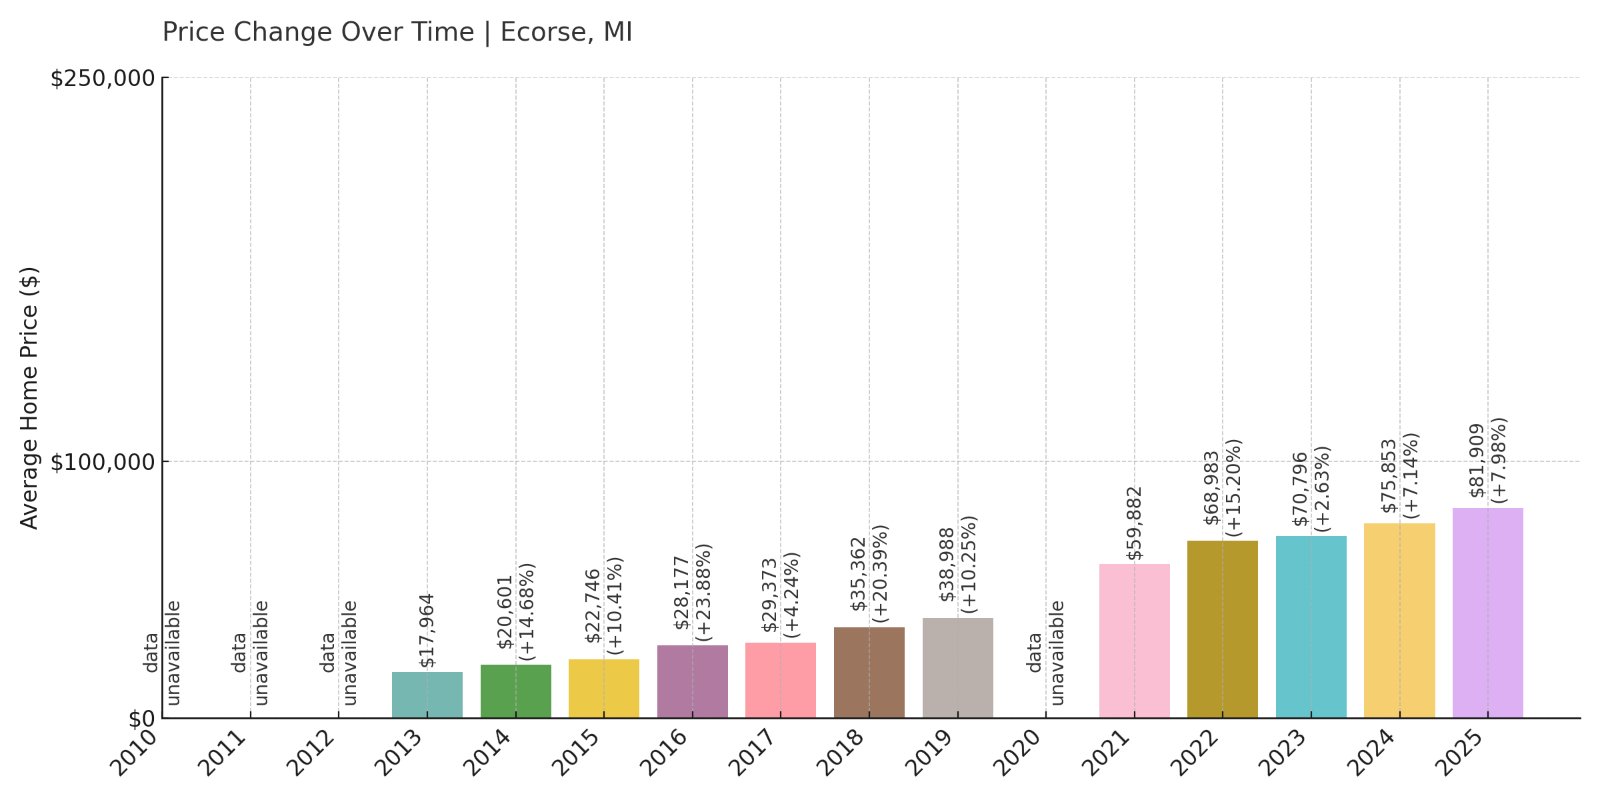
7. Ecorse – 356% Home Price Increase Since 2013
- 2010: N/A
- 2011: N/A
- 2012: N/A
- 2013: $17,964
- 2014: $20,601 (+$2,637, +14.68% from previous year)
- 2015: $22,746 (+$2,145, +10.41% from previous year)
- 2016: $28,177 (+$5,431, +23.88% from previous year)
- 2017: $29,373 (+$1,196, +4.24% from previous year)
- 2018: $35,362 (+$5,989, +20.39% from previous year)
- 2019: $38,988 (+$3,626, +10.25% from previous year)
- 2020: N/A
- 2021: $59,882
- 2022: $68,983 (+$9,101, +15.20% from previous year)
- 2023: $70,796 (+$1,813, +2.63% from previous year)
- 2024: $75,853 (+$5,057, +7.14% from previous year)
- 2025: $81,909 (+$6,056, +7.98% from previous year)
Ecorse’s home prices have surged over 350% since 2013. What started as extremely low values have grown steadily year after year, especially since 2016. The latest data shows continued increases, with 2025 marking another solid gain.
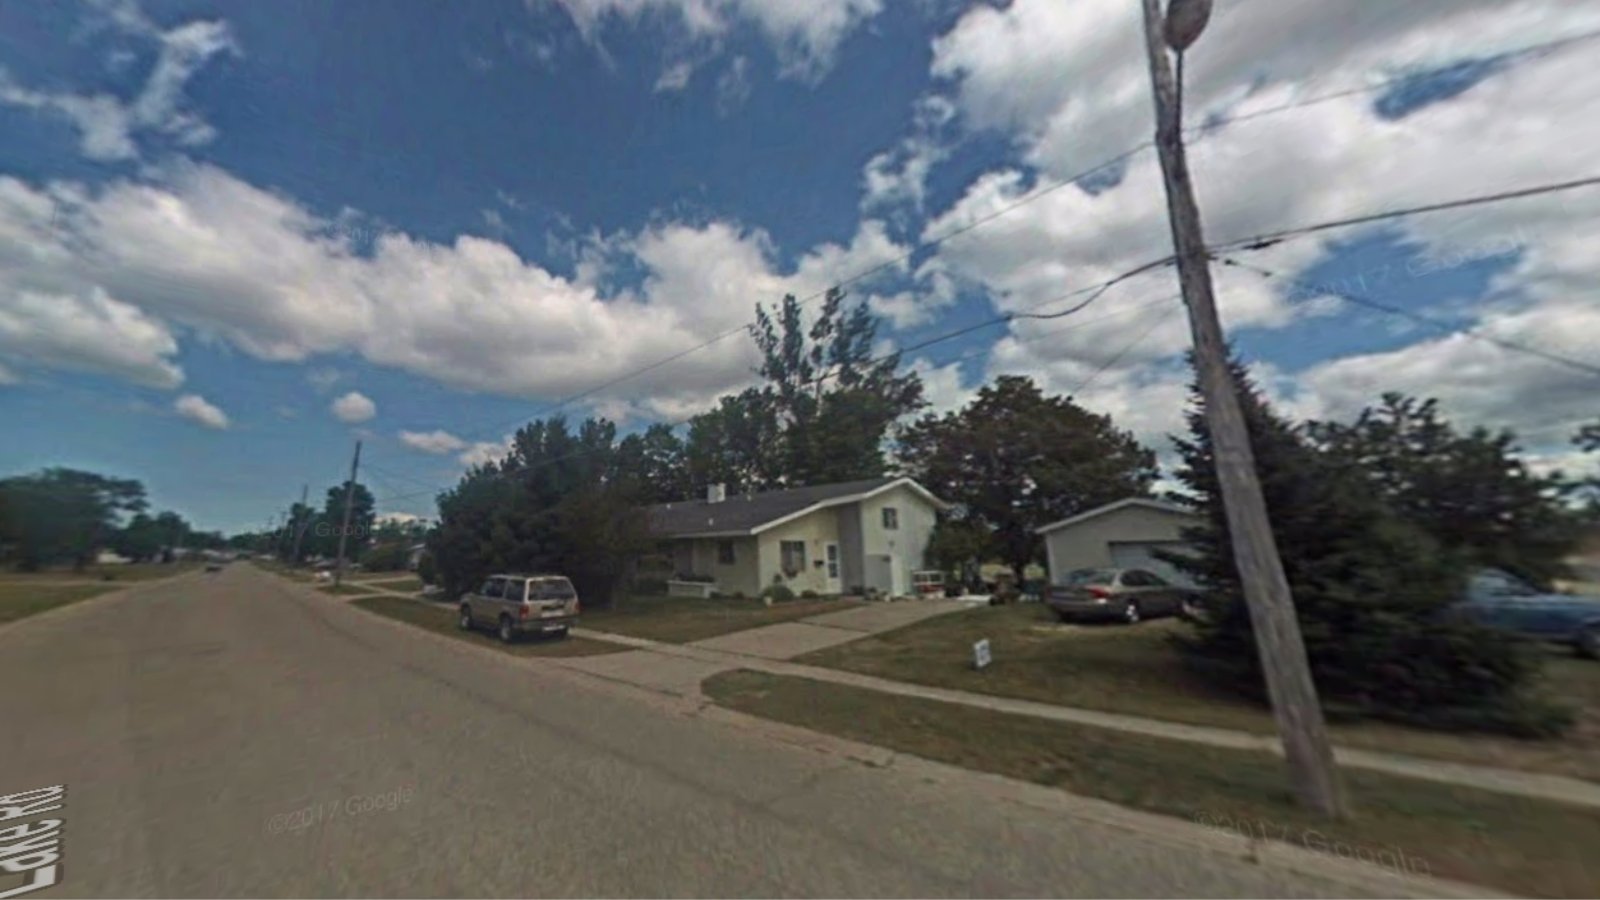
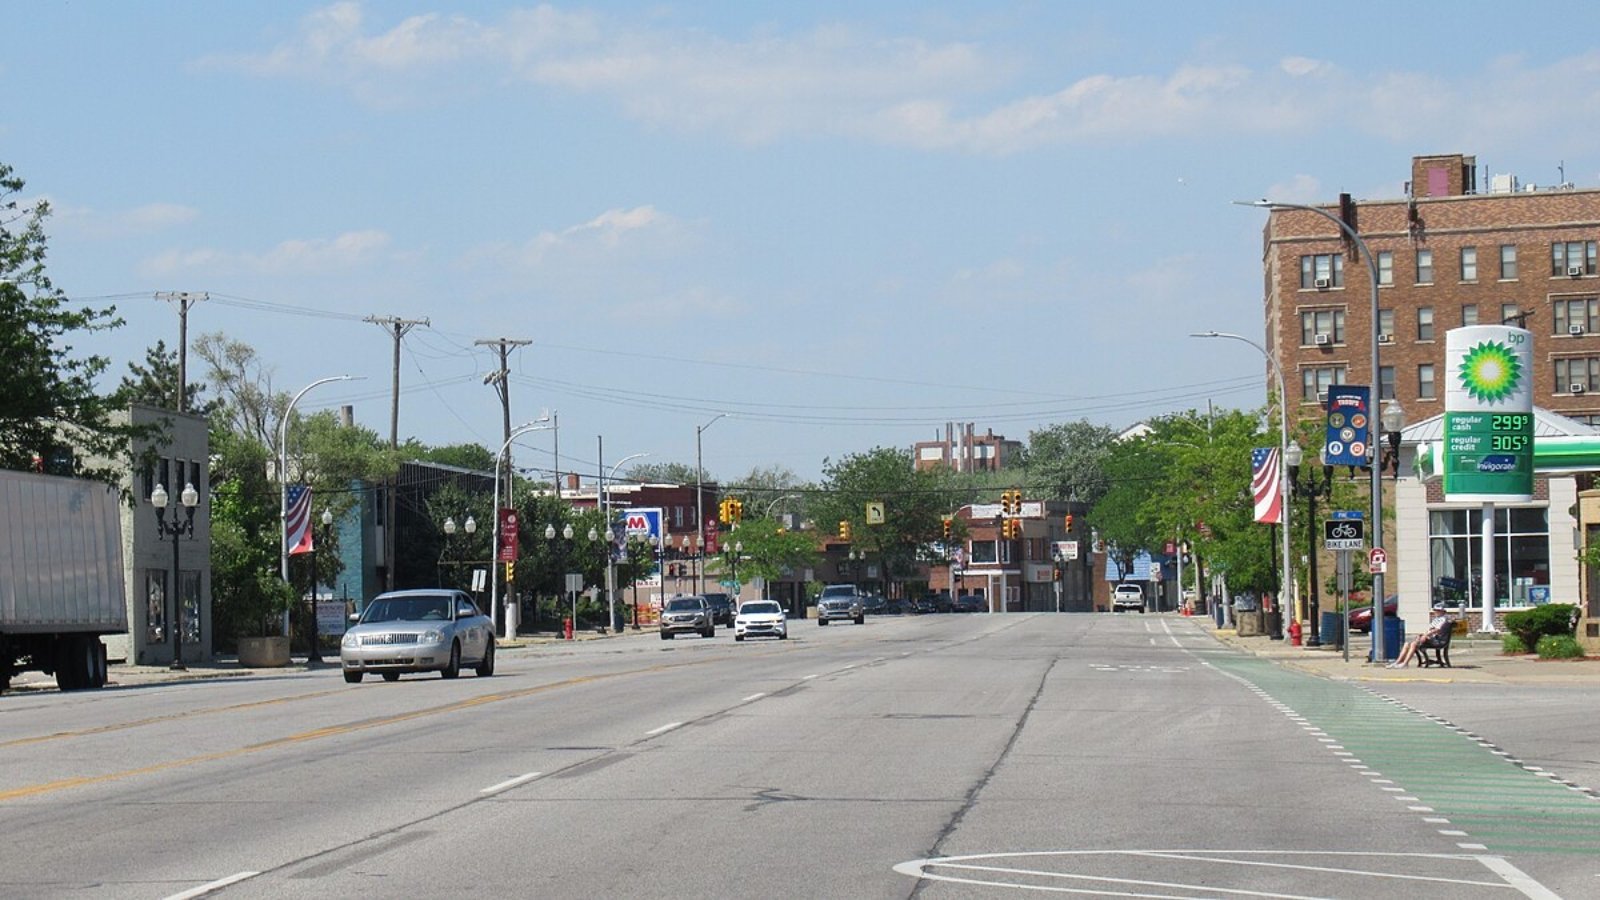
Ecorse – Affordable Living on the Detroit River
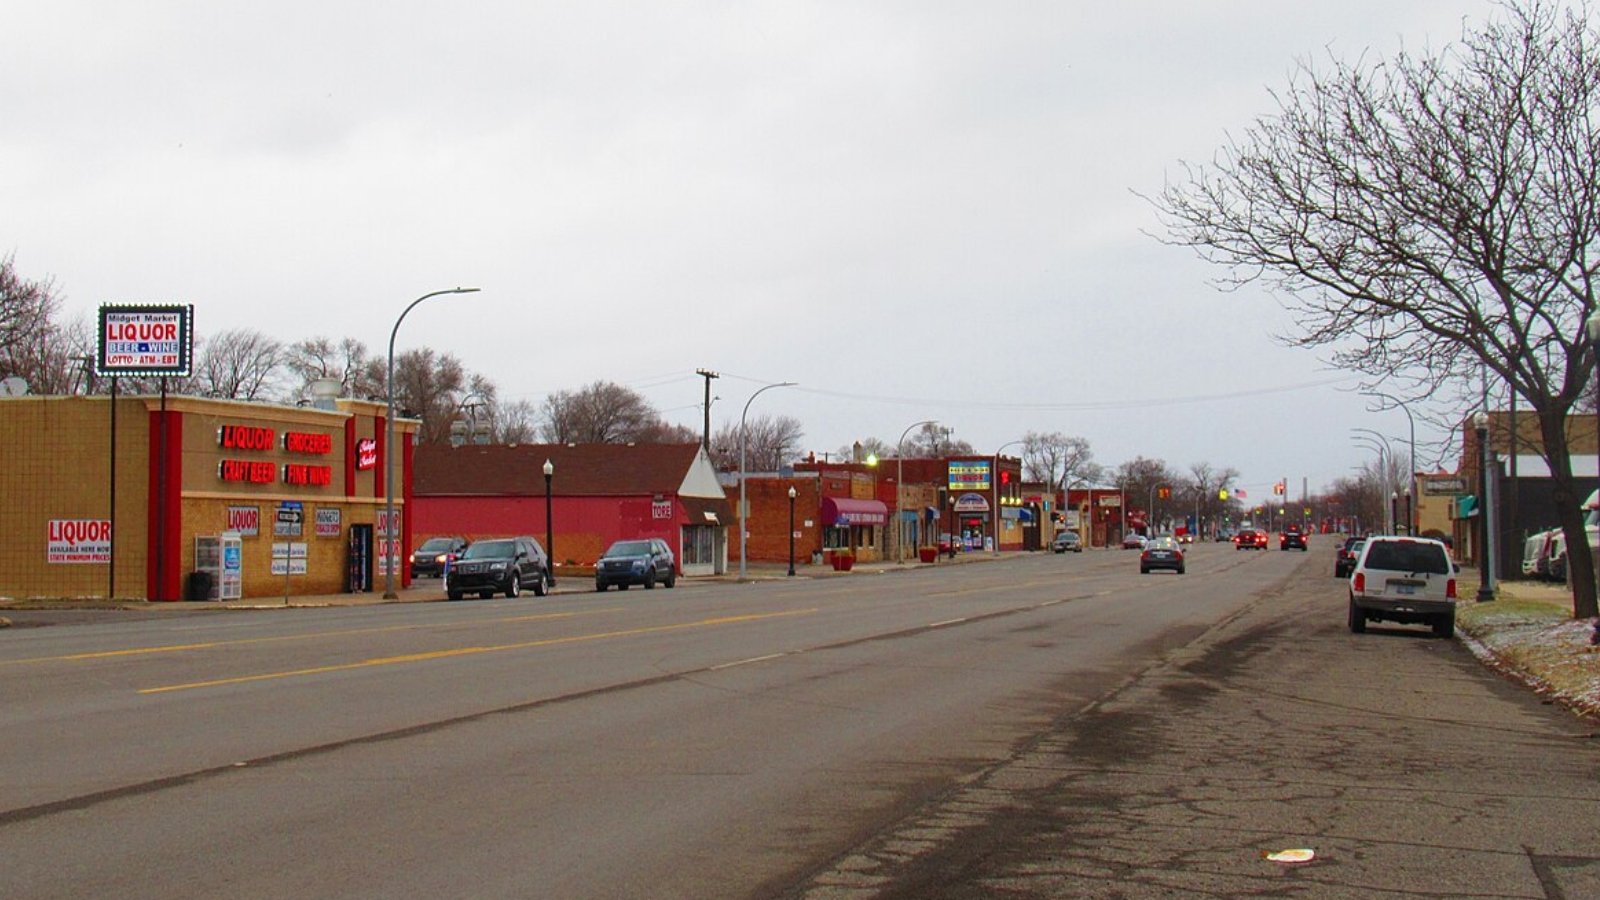
Located along the Detroit River in Wayne County, Ecorse has a rich industrial history and strong ties to the region’s auto legacy. For years, it was one of the most undervalued areas in Metro Detroit, but that has changed dramatically over the past decade.
Prices remain low relative to nearby cities, but Ecorse’s combination of location and accessibility makes it an increasingly desirable choice. While challenges persist, the recent home price trends suggest long-term recovery and renewed investment in the housing market.
6. River Rouge – 337% Home Price Increase Since 2012

🔥 Would you like to save this?
- 2010: $18,194
- 2011: $19,197 (+$1,003, +5.51% from previous year)
- 2012: $16,529 (-$2,668, -13.90% from previous year)
- 2013: $17,532 (+$1,003, +6.07% from previous year)
- 2014: $21,540 (+$4,008, +22.86% from previous year)
- 2015: $22,613 (+$1,073, +4.98% from previous year)
- 2016: $25,166 (+$2,553, +11.29% from previous year)
- 2017: $27,420 (+$2,254, +8.96% from previous year)
- 2018: $32,803 (+$5,382, +19.63% from previous year)
- 2019: $37,003 (+$4,200, +12.80% from previous year)
- 2020: N/A
- 2021: $54,856
- 2022: $68,053 (+$13,197, +24.06% from previous year)
- 2023: $65,924 (-$2,129, -3.13% from previous year)
- 2024: $72,428 (+$6,504, +9.87% from previous year)
- 2025: $79,447 (+$7,019, +9.69% from previous year)
River Rouge’s home prices have jumped 337% since 2012, reflecting one of the strongest increases among Michigan’s affordable towns. While the housing market dipped slightly in 2023, gains resumed and continued into 2025.
River Rouge – Affordable Real Estate Near Downtown Detroit
River Rouge lies just southwest of Detroit’s core, along the Detroit River. Historically rooted in steel and shipping industries, it’s long been a working-class community. That legacy, paired with proximity to major employment hubs, is likely a key driver behind rising home values.
Despite its massive price increase, River Rouge still offers relatively low-cost housing. Buyers priced out of Detroit’s more revitalized neighborhoods may see this city as the next logical choice, making it a standout for both affordability and appreciation.
5. Muskegon Heights – 143% Home Price Increase Since 2012
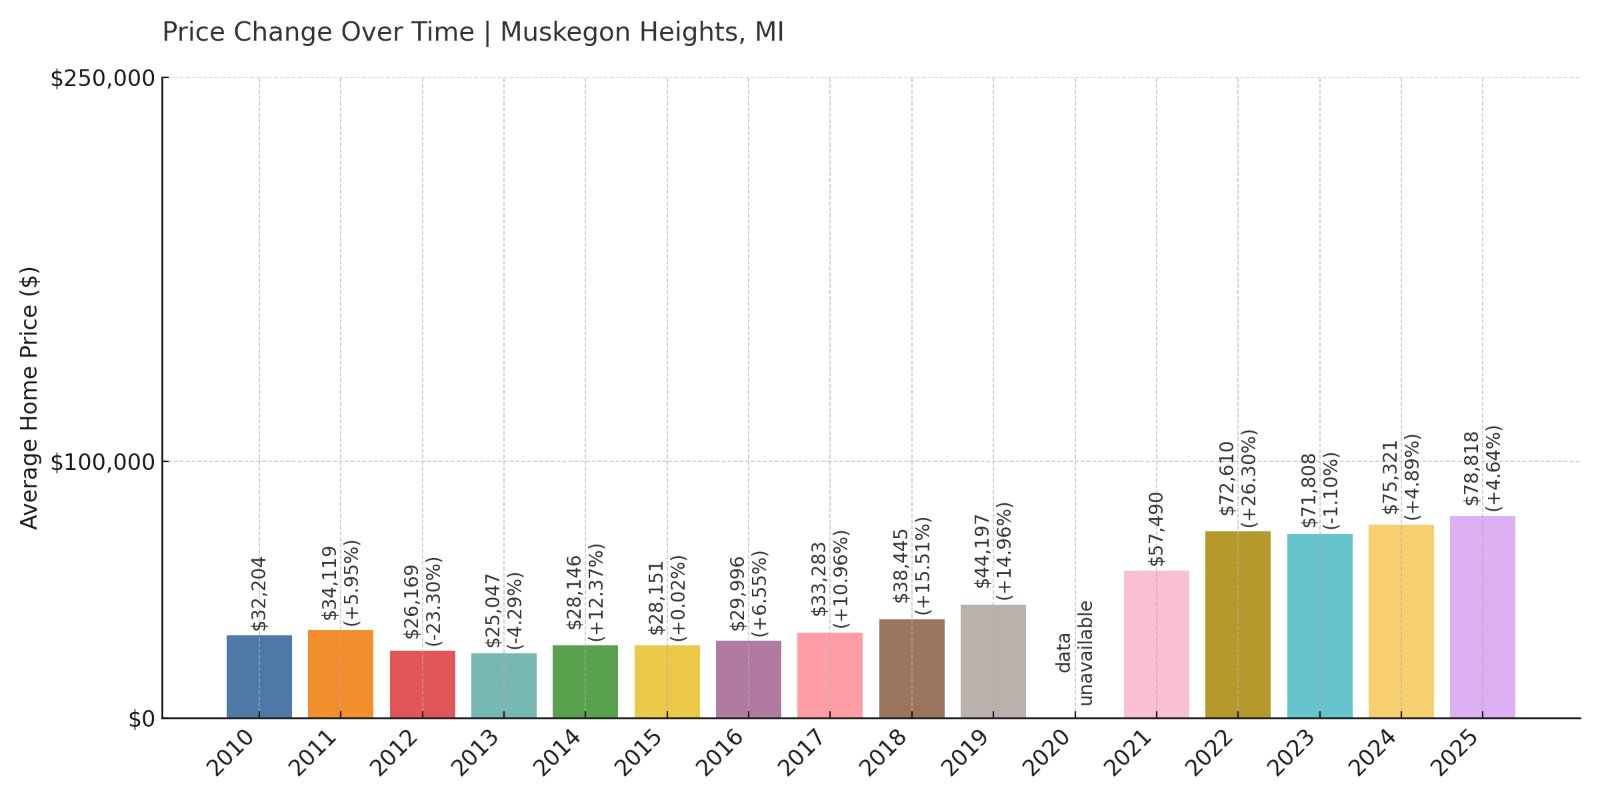
- 2010: $32,204
- 2011: $34,119 (+$1,915, +5.95% from previous year)
- 2012: $26,169 (-$7,950, -23.30% from previous year)
- 2013: $25,047 (-$1,122, -4.29% from previous year)
- 2014: $28,146 (+$3,098, +12.37% from previous year)
- 2015: $28,151 (+$6, +0.02% from previous year)
- 2016: $29,996 (+$1,844, +6.55% from previous year)
- 2017: $33,283 (+$3,288, +10.96% from previous year)
- 2018: $38,445 (+$5,161, +15.51% from previous year)
- 2019: $44,197 (+$5,752, +14.96% from previous year)
- 2020: N/A
- 2021: $57,490
- 2022: $72,610 (+$15,120, +26.30% from previous year)
- 2023: $71,808 (-$802, -1.10% from previous year)
- 2024: $75,321 (+$3,514, +4.89% from previous year)
- 2025: $78,818 (+$3,497, +4.64% from previous year)
Since 2012, home prices in Muskegon Heights have risen by 143%. Much of that growth came after 2020, especially during the strong surge between 2021 and 2022. Though price gains slowed in 2023, the overall trend remains positive.
Muskegon Heights – Western Michigan’s Price Climber
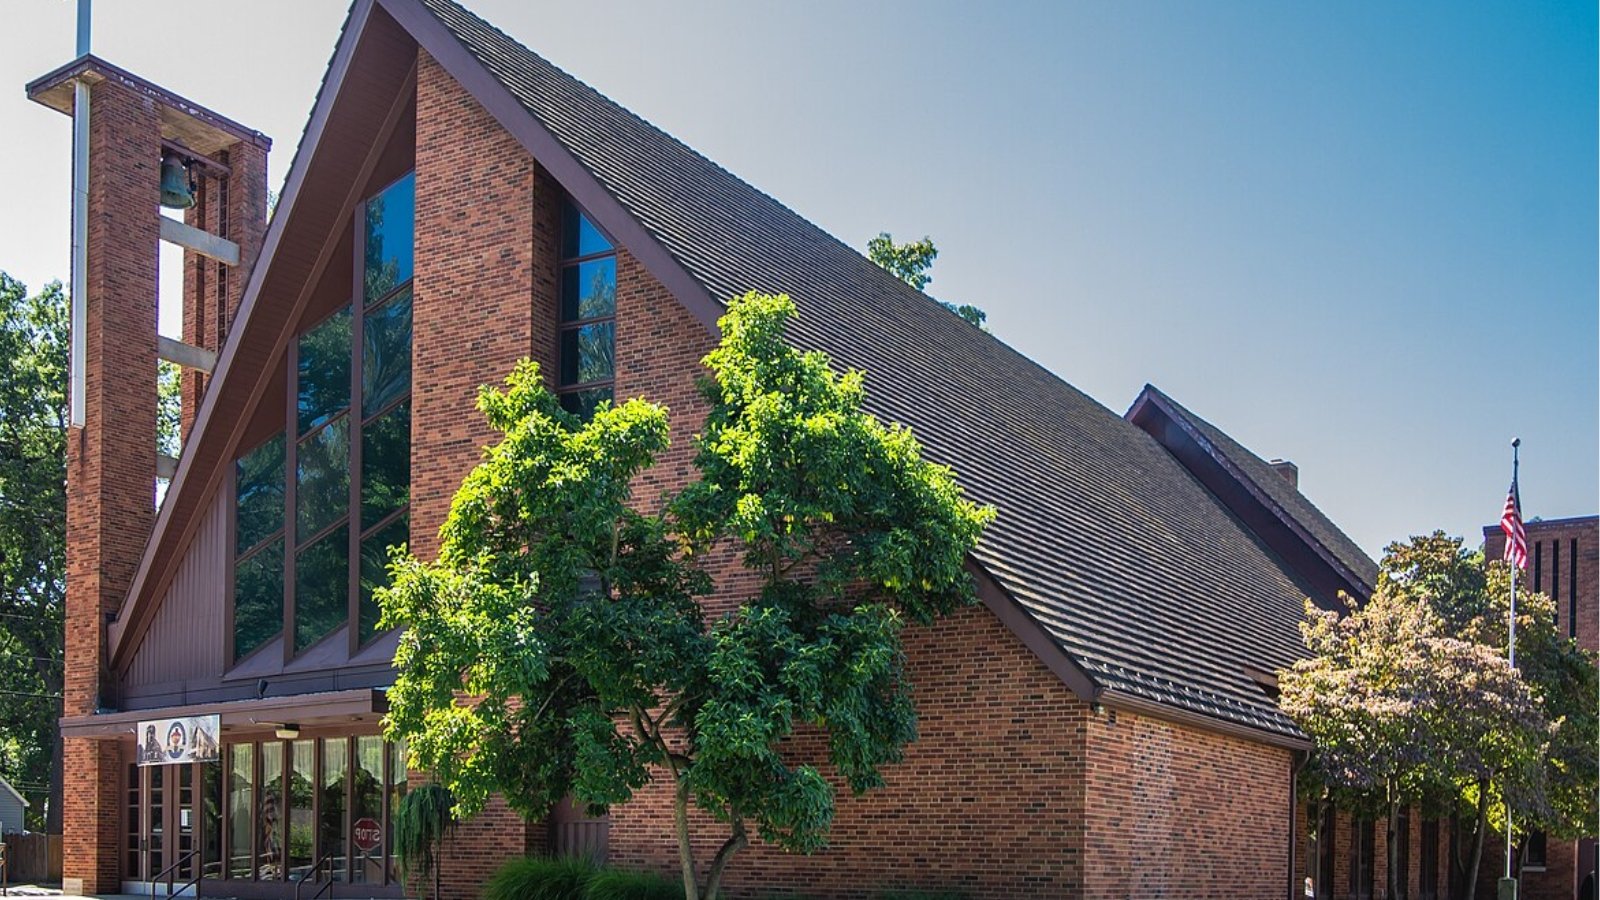
Situated on Lake Michigan’s eastern shore, Muskegon Heights is a city with deep industrial roots. The area has battled economic challenges, but in recent years, home values have surged—likely due to its access to lakefront, nearby beaches, and regional investment.
Prices remain among the lowest in the state, with 2025 values averaging below $80,000. This balance of affordability and recovery potential continues to make Muskegon Heights attractive to budget-conscious buyers and investors alike.
4. Detroit – 206% Home Price Increase Since 2012
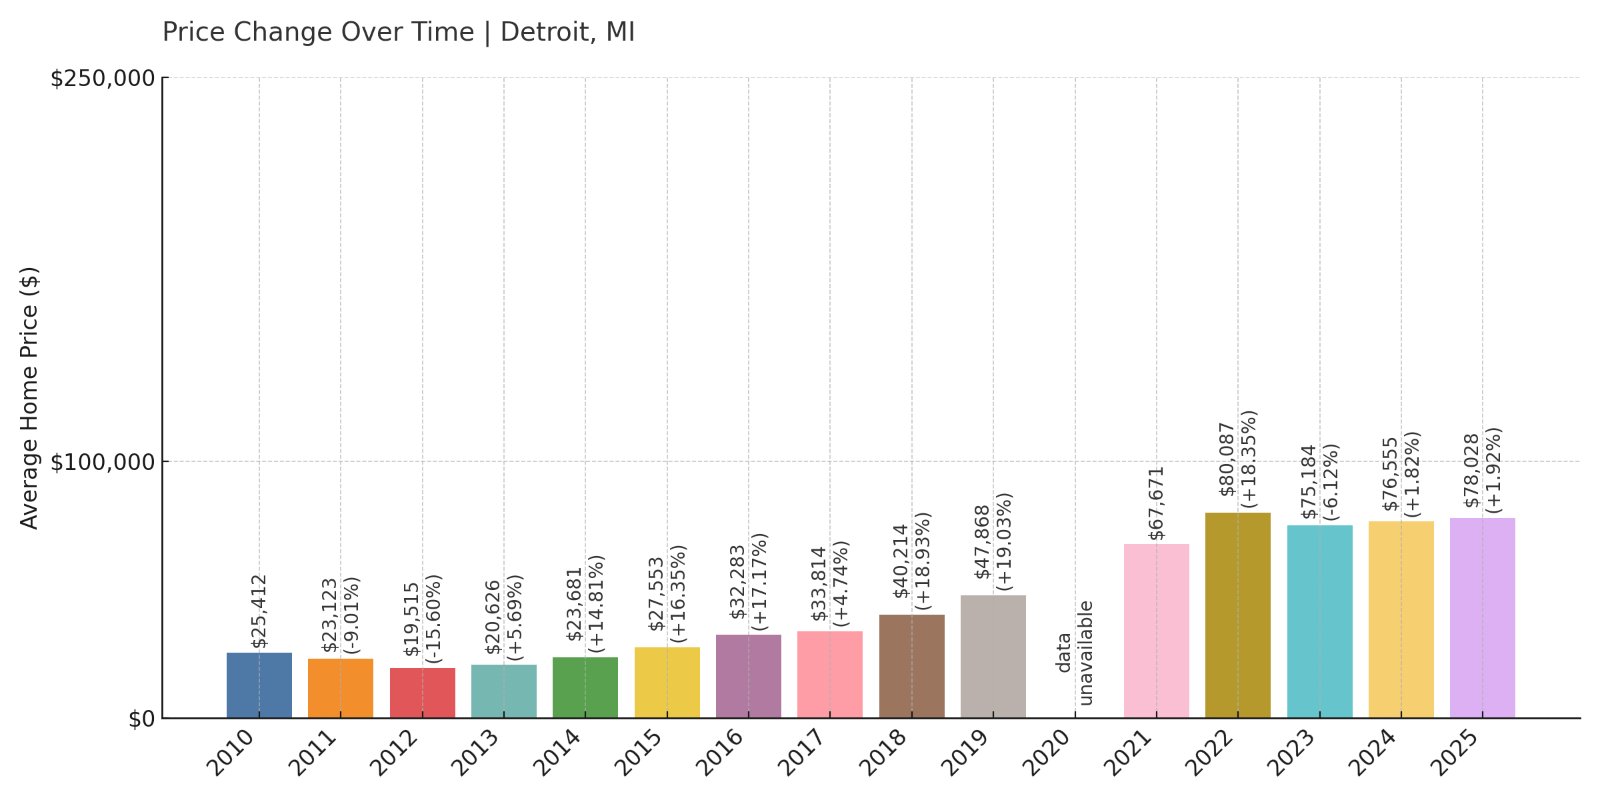
- 2010: $25,412
- 2011: $23,123 (-$2,289, -9.01% from previous year)
- 2012: $19,515 (-$3,608, -15.60% from previous year)
- 2013: $20,626 (+$1,111, +5.69% from previous year)
- 2014: $23,681 (+$3,055, +14.81% from previous year)
- 2015: $27,553 (+$3,872, +16.35% from previous year)
- 2016: $32,283 (+$4,730, +17.17% from previous year)
- 2017: $33,814 (+$1,530, +4.74% from previous year)
- 2018: $40,214 (+$6,400, +18.93% from previous year)
- 2019: $47,868 (+$7,654, +19.03% from previous year)
- 2020: N/A
- 2021: $67,671
- 2022: $80,087 (+$12,416, +18.35% from previous year)
- 2023: $75,184 (-$4,903, -6.12% from previous year)
- 2024: $76,555 (+$1,371, +1.82% from previous year)
- 2025: $78,028 (+$1,473, +1.92% from previous year)
Detroit home prices have increased more than 200% since 2012. While some years showed dramatic gains, recent data points to slower but consistent appreciation. Despite that, the city remains one of Michigan’s most affordable metro areas.
Detroit – A Big City with Budget-Friendly Homes
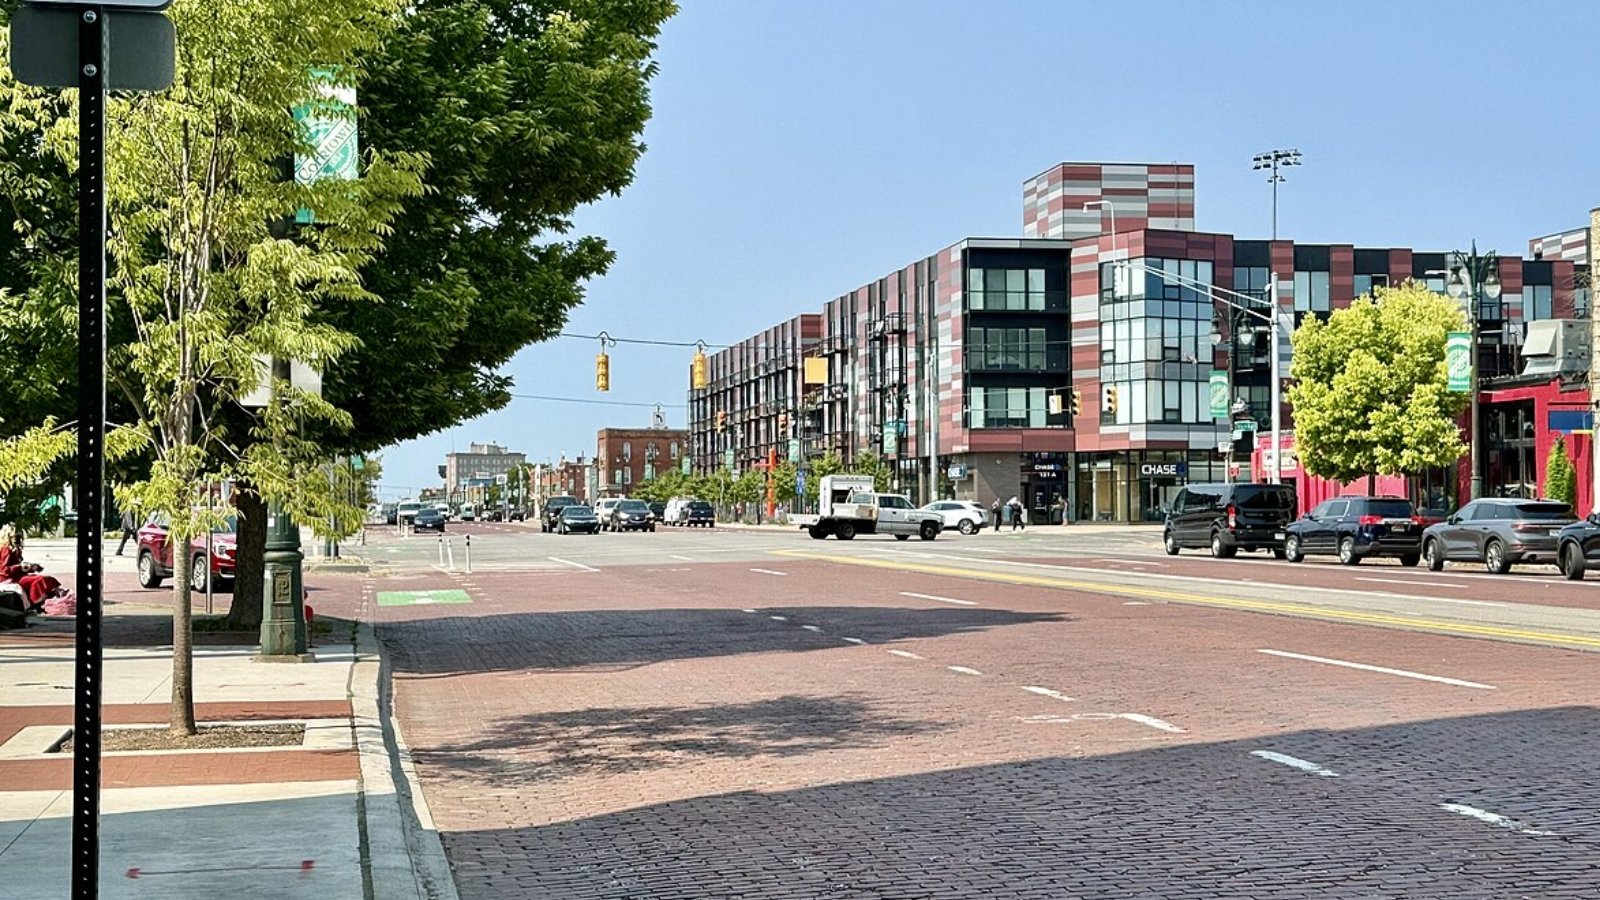
Detroit’s housing market is unique. While some neighborhoods have transformed with new development, others remain economically challenged. Still, prices have steadily risen as demand from investors and residents continues to increase.
With a 2025 average price just over $78,000, Detroit stands out nationally as a major city with low homeownership costs. It continues to be a magnet for budget-minded buyers and those looking for potential long-term value.
3. Silverwood – 59% Home Price Decrease Since 2010
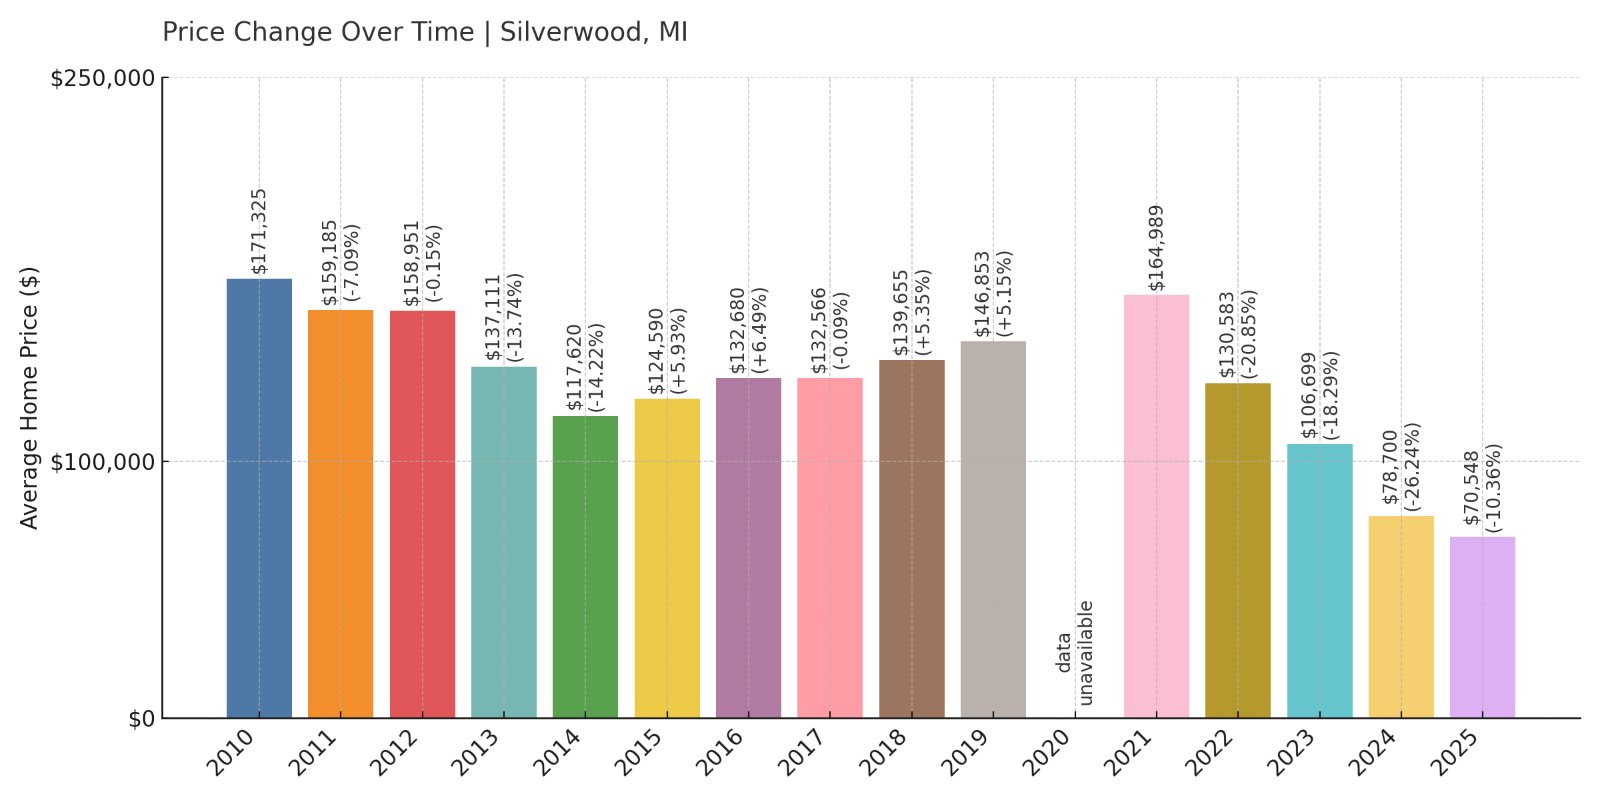
- 2010: $171,325
- 2011: $159,185 (-$12,140, -7.09% from previous year)
- 2012: $158,951 (-$235, -0.15% from previous year)
- 2013: $137,111 (-$21,840, -13.74% from previous year)
- 2014: $117,620 (-$19,491, -14.22% from previous year)
- 2015: $124,590 (+$6,971, +5.93% from previous year)
- 2016: $132,680 (+$8,089, +6.49% from previous year)
- 2017: $132,566 (-$114, -0.09% from previous year)
- 2018: $139,655 (+$7,089, +5.35% from previous year)
- 2019: $146,853 (+$7,198, +5.15% from previous year)
- 2020: N/A
- 2021: $164,989
- 2022: $130,583 (-$34,405, -20.85% from previous year)
- 2023: $106,699 (-$23,884, -18.29% from previous year)
- 2024: $78,700 (-$27,999, -26.24% from previous year)
- 2025: $70,548 (-$8,152, -10.36% from previous year)
Silverwood stands out on this list for a different reason: its home values have fallen by 59% since 2010. After reaching a high in 2021, prices have declined sharply for three straight years, signaling possible overvaluation or market contraction.
Silverwood – Once Expensive, Now a Bargain
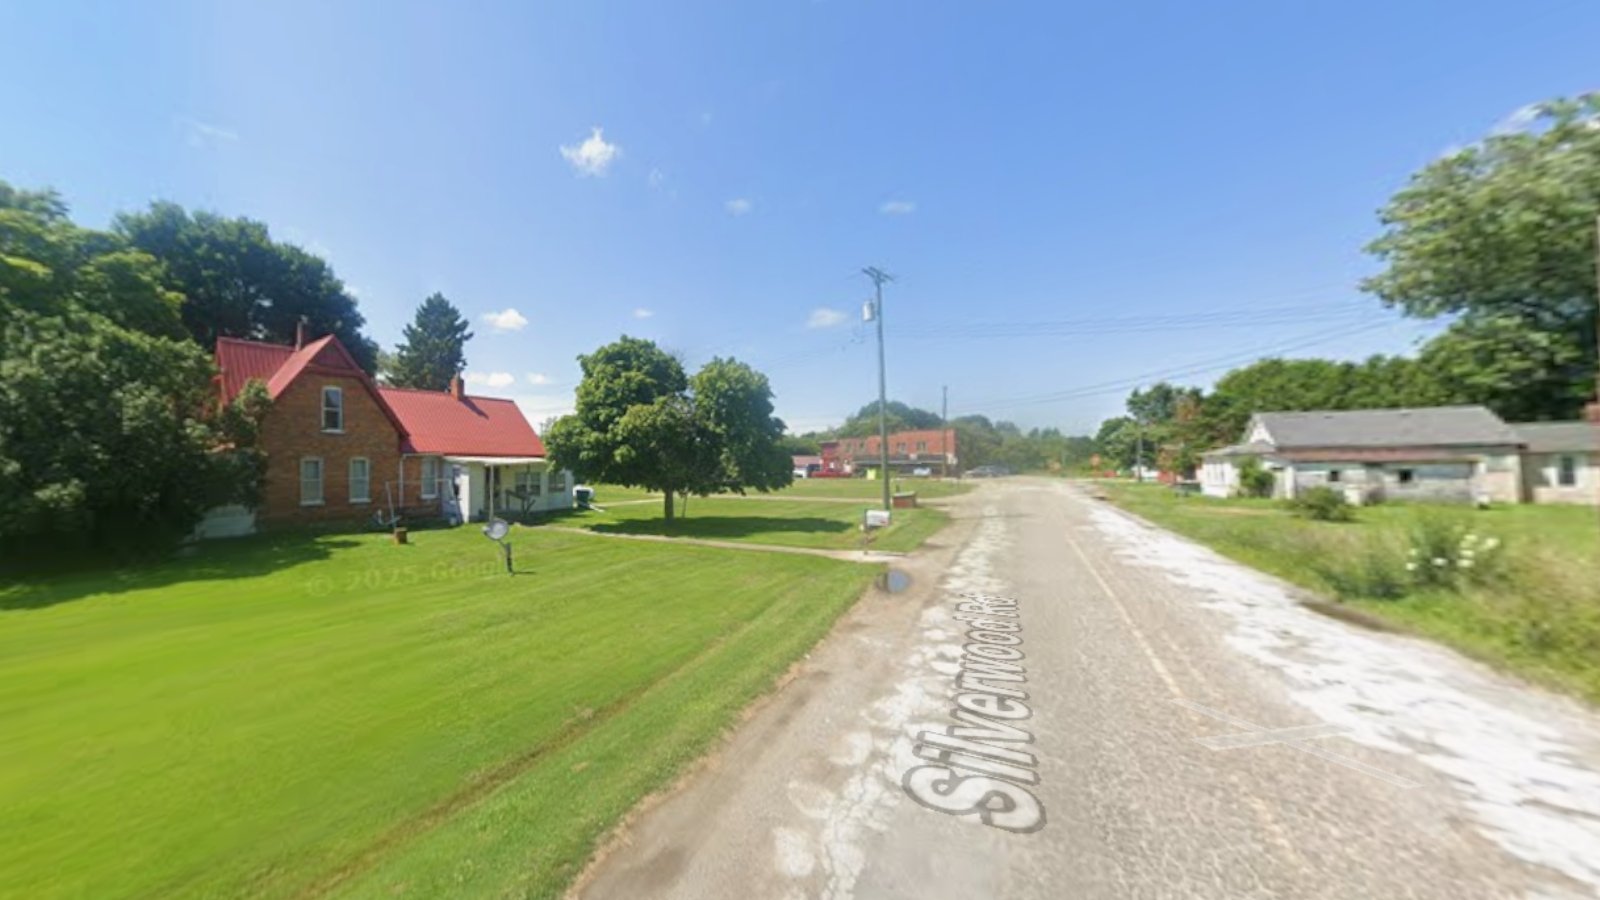
Located in Michigan’s Thumb region, Silverwood is a rural town that once posted surprisingly high home values. That changed dramatically after 2021, with steep year-over-year drops that brought prices down to just over $70,000 by 2025.
These trends may reflect broader shifts in rural housing demand or limited local economic activity. While its affordability now ranks among the best in the state, it also serves as a reminder that not all markets move in one direction.
2. Flint – 108% Home Price Increase Since 2012
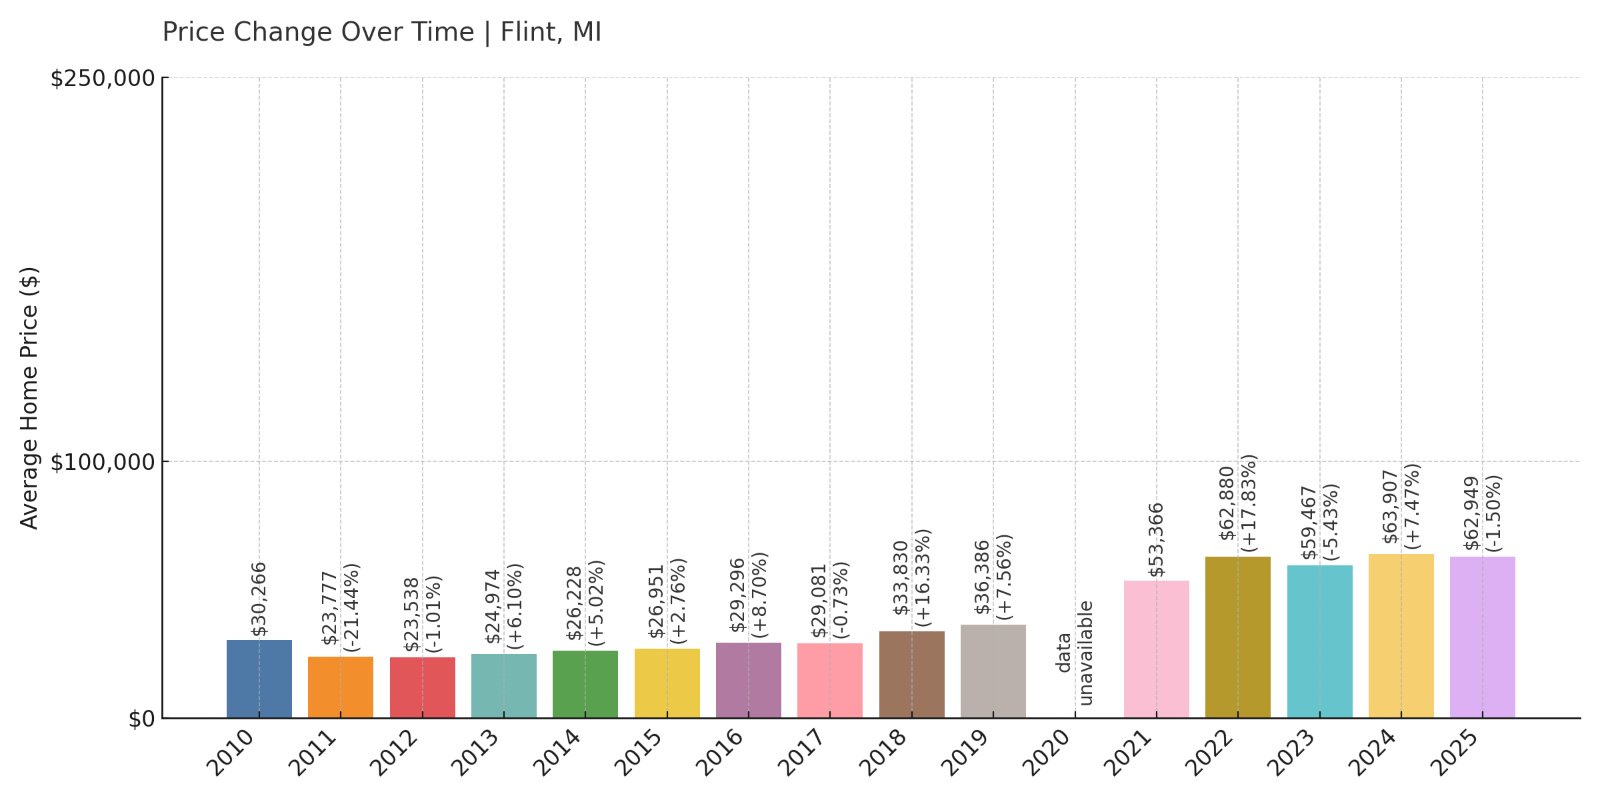
- 2010: $30,266
- 2011: $23,777 (-$6,489, -21.44% from previous year)
- 2012: $23,538 (-$239, -1.00% from previous year)
- 2013: $24,974 (+$1,435, +6.10% from previous year)
- 2014: $26,228 (+$1,255, +5.02% from previous year)
- 2015: $26,951 (+$723, +2.76% from previous year)
- 2016: $29,296 (+$2,345, +8.70% from previous year)
- 2017: $29,081 (-$214, -0.73% from previous year)
- 2018: $33,830 (+$4,749, +16.33% from previous year)
- 2019: $36,386 (+$2,556, +7.56% from previous year)
- 2020: N/A
- 2021: $53,366
- 2022: $62,880 (+$9,514, +17.83% from previous year)
- 2023: $59,467 (-$3,413, -5.43% from previous year)
- 2024: $63,907 (+$4,440, +7.47% from previous year)
- 2025: $62,949 (-$958, -1.50% from previous year)
Flint home prices have more than doubled since 2012. After a strong recovery through 2022, the past few years have been more volatile—but the overall trend remains upward.
Flint – Gradual Recovery in a Challenged Market

🔥 Would you like to save this?
Flint’s housing market has been shaped by decades of economic shifts and recovery efforts. While prices remain among the lowest in the state, recent gains reflect renewed investment and interest from buyers seeking affordable housing.
Despite setbacks in 2023 and 2025, Flint’s long-term trend remains positive. Many homes remain under $65,000, offering an entry point for buyers priced out of other areas.
1. Beecher – 157% Home Price Increase Since 2014
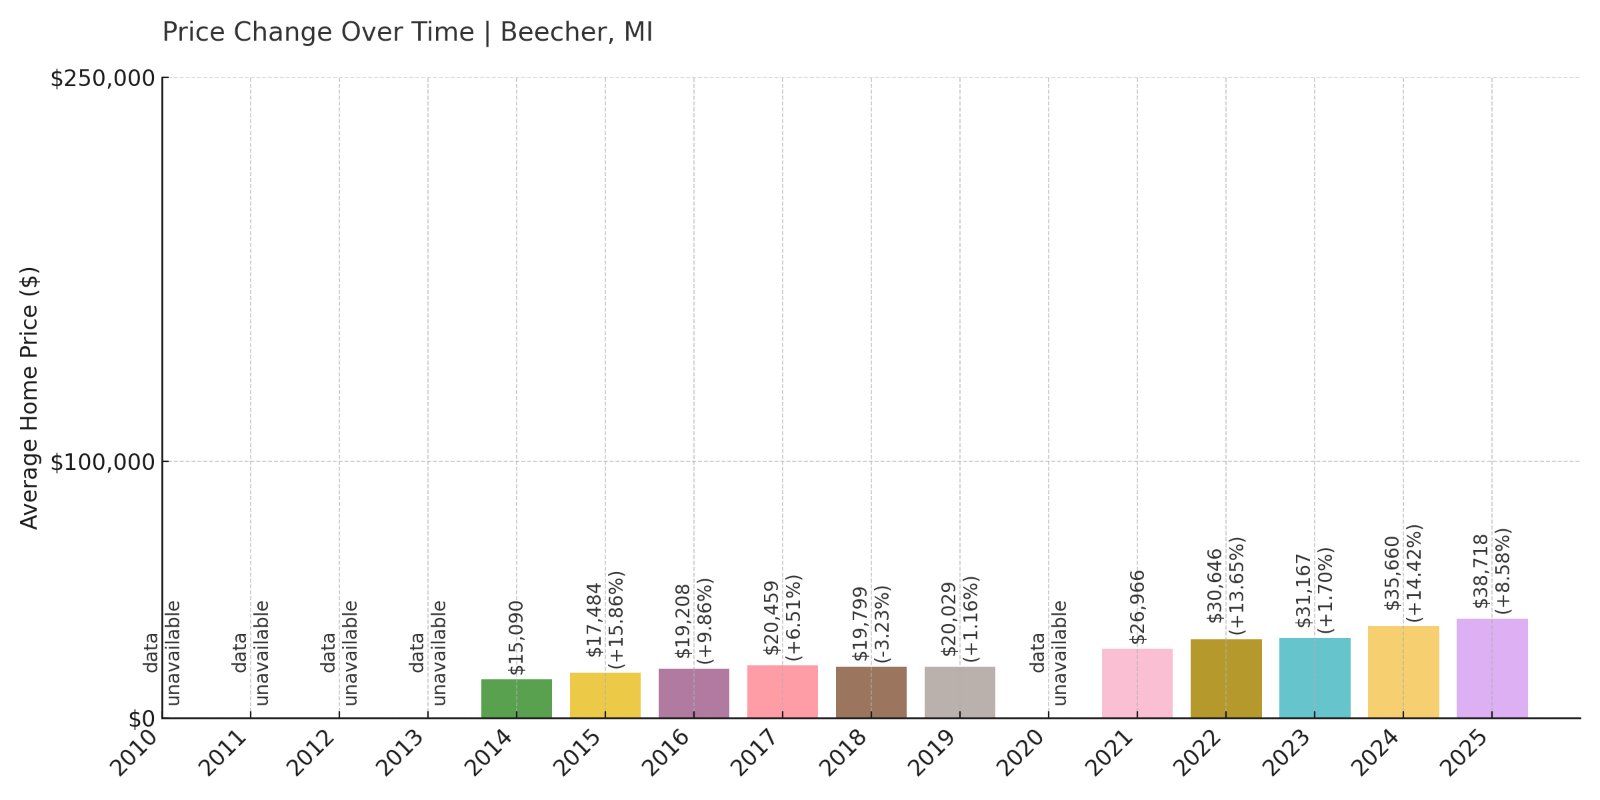
- 2010: N/A
- 2011: N/A
- 2012: N/A
- 2013: N/A
- 2014: $15,090
- 2015: $17,484 (+$2,394, +15.86% from previous year)
- 2016: $19,208 (+$1,724, +9.86% from previous year)
- 2017: $20,459 (+$1,251, +6.51% from previous year)
- 2018: $19,799 (-$660, -3.23% from previous year)
- 2019: $20,029 (+$231, +1.17% from previous year)
- 2020: N/A
- 2021: $26,966
- 2022: $30,646 (+$3,679, +13.64% from previous year)
- 2023: $31,167 (+$521, +1.70% from previous year)
- 2024: $35,660 (+$4,493, +14.42% from previous year)
- 2025: $38,718 (+$3,058, +8.58% from previous year)
Beecher tops the list for affordability in 2025, even after a 157% increase since 2014. Despite consistent gains, it remains one of the lowest-priced housing markets in the state.
Beecher – Michigan’s Most Affordable Housing Market
Located in Genesee County near Flint, Beecher is a census-designated place that has attracted attention for its extremely low housing costs. While prices have climbed steadily, they remain under $40,000 on average in 2025.
As with many of Michigan’s most affordable towns, Beecher offers budget-friendly entry points for first-time buyers, investors, or families seeking low-cost living near urban centers. The consistent rise in prices over the last decade signals slow but steady revitalization.


