
🔥 Would you like to save this?
The Zillow Home Value Index shows that home prices in Illinois have climbed sharply over the past decade—but in some towns, they’ve truly taken off. These 21 communities now rank as the most expensive in the state for 2025, thanks to a mix of long-term value, desirable amenities, and buyer demand that just won’t quit.
From historic suburbs to lakeside enclaves, each town on this list reflects years of price growth—some slow and steady, others fast and dramatic. Ranked by the latest data, this lineup reveals where Illinois homebuyers are paying top dollar, and why these towns continue to lead the market.
In order to come up with the very specific design ideas, we create most designs with the assistance of state-of-the-art AI interior design software.
21. Highland Park – 79% Home Price Increase Since 2012

- 2010: $459,637
- 2011: $422,479 (-$37,157, -8.08% from previous year)
- 2012: $408,103 (-$14,376, -3.40% from previous year)
- 2013: $450,105 (+$42,002, +10.29% from previous year)
- 2014: $509,380 (+$59,276, +13.17% from previous year)
- 2015: $527,603 (+$18,223, +3.58% from previous year)
- 2016: $536,900 (+$9,296, +1.76% from previous year)
- 2017: $529,485 (-$7,415, -1.38% from previous year)
- 2018: $516,418 (-$13,067, -2.47% from previous year)
- 2019: $507,137 (-$9,281, -1.80% from previous year)
- 2020: N/A
- 2021: $524,345
- 2022: $597,608 (+$73,264, +13.97% from previous year)
- 2023: $630,998 (+$33,390, +5.59% from previous year)
- 2024: $674,702 (+$43,704, +6.93% from previous year)
- 2025: $731,195 (+$56,493, +8.37% from previous year)
Home prices in Highland Park have climbed steadily since 2012, rising nearly 80% in just over a decade. The market saw modest gains after the 2008 recession but picked up sharply in 2021 and beyond. The largest single-year jump came in 2022, when prices surged nearly 14%, reflecting renewed demand for North Shore living during and after the pandemic.
Highland Park – Lakefront Appeal and Steady Growth
Located along the shores of Lake Michigan, Highland Park has long been a desirable destination for buyers seeking upscale homes with access to nature, culture, and the city. It’s just 25 miles north of downtown Chicago, with Metra service and scenic parks like Rosewood Beach. The town is known for its architectural diversity—featuring Prairie School homes, modern builds, and historic estates—as well as its vibrant downtown.
The area’s public schools are consistently highly rated, and cultural attractions such as the Ravinia Festival add to the town’s year-round appeal. After a dip in values in the 2010s, renewed interest in suburban living helped push prices to record highs. In 2025, the median price in Highland Park tops $731,000, supported by both long-term residents and new arrivals looking for space, stability, and style.
20. Inverness – 47% Home Price Increase Since 2012
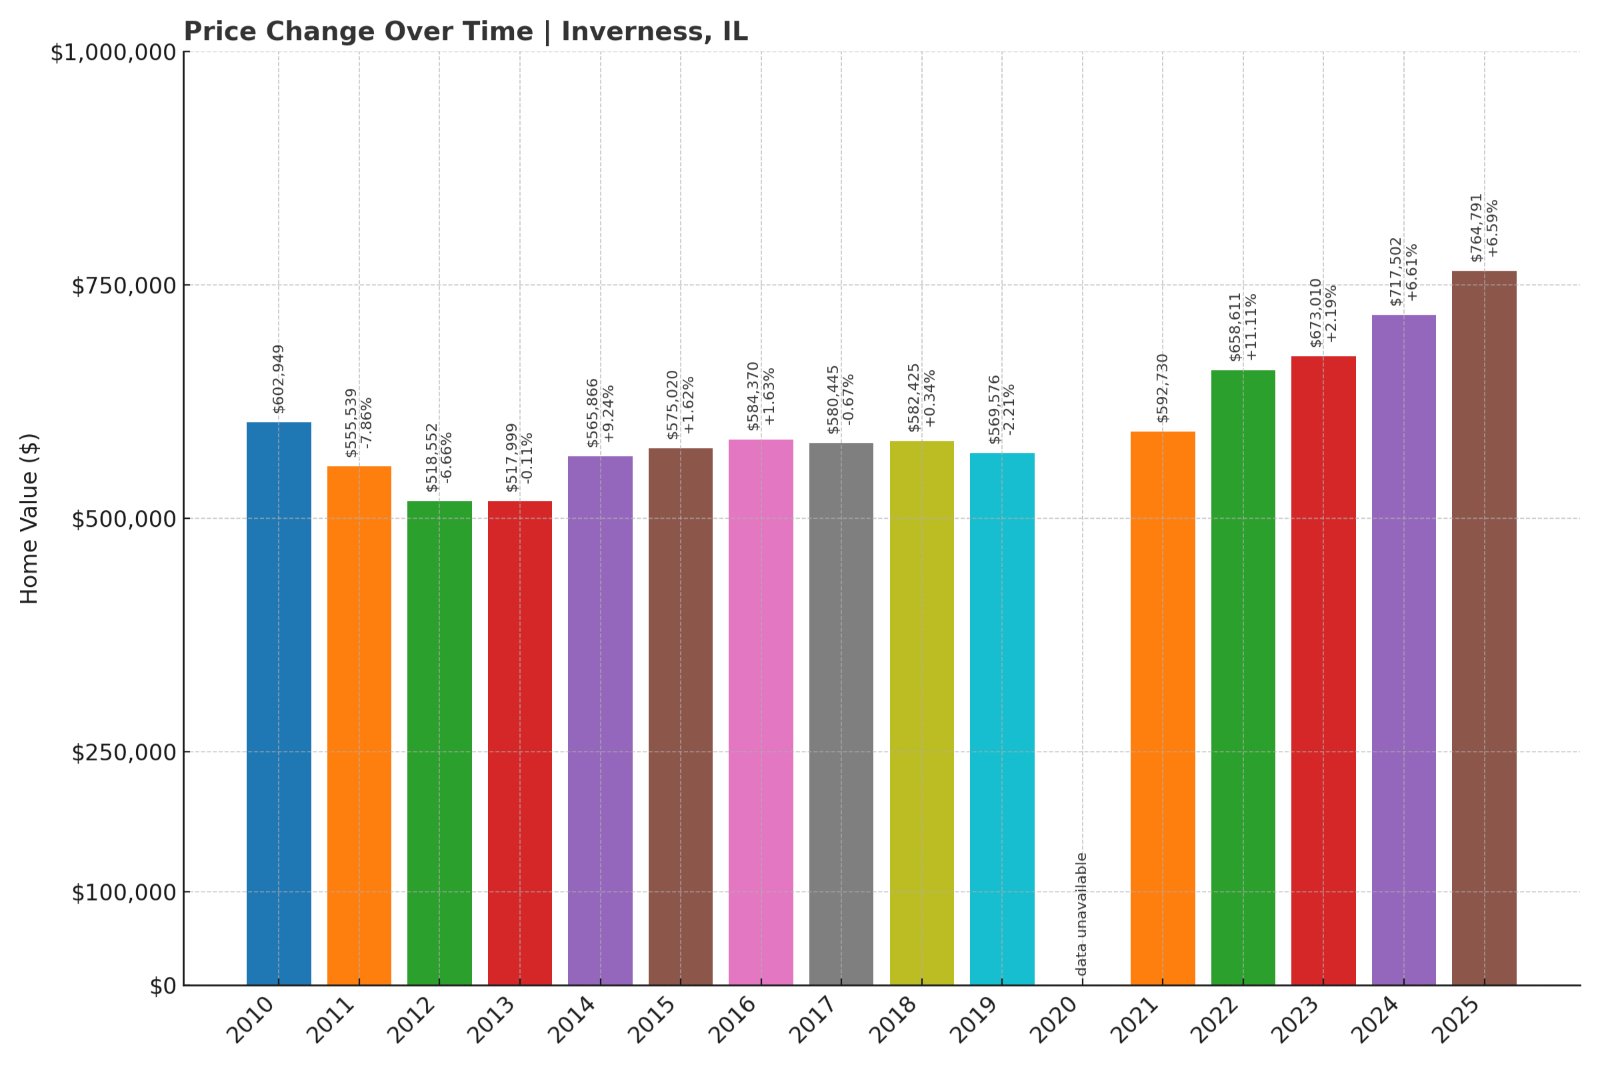
- 2010: $602,949
- 2011: $555,539 (-$47,410, -7.86% from previous year)
- 2012: $518,552 (-$36,987, -6.66% from previous year)
- 2013: $517,999 (-$553, -0.11% from previous year)
- 2014: $565,866 (+$47,867, +9.24% from previous year)
- 2015: $575,020 (+$9,154, +1.62% from previous year)
- 2016: $584,370 (+$9,350, +1.63% from previous year)
- 2017: $580,445 (-$3,924, -0.67% from previous year)
- 2018: $582,425 (+$1,980, +0.34% from previous year)
- 2019: $569,576 (-$12,849, -2.21% from previous year)
- 2020: N/A
- 2021: $592,730
- 2022: $658,611 (+$65,881, +11.11% from previous year)
- 2023: $673,010 (+$14,399, +2.19% from previous year)
- 2024: $717,502 (+$44,493, +6.61% from previous year)
- 2025: $764,791 (+$47,289, +6.59% from previous year)
Inverness saw a substantial rebound in home values starting in 2021, with gains totaling over 47% since 2012. Though prices dropped early in the 2010s, steady demand and limited inventory have pushed median values to over $764,000 in 2025. This quiet resurgence has made Inverness one of the northwest suburbs’ most desirable residential enclaves.
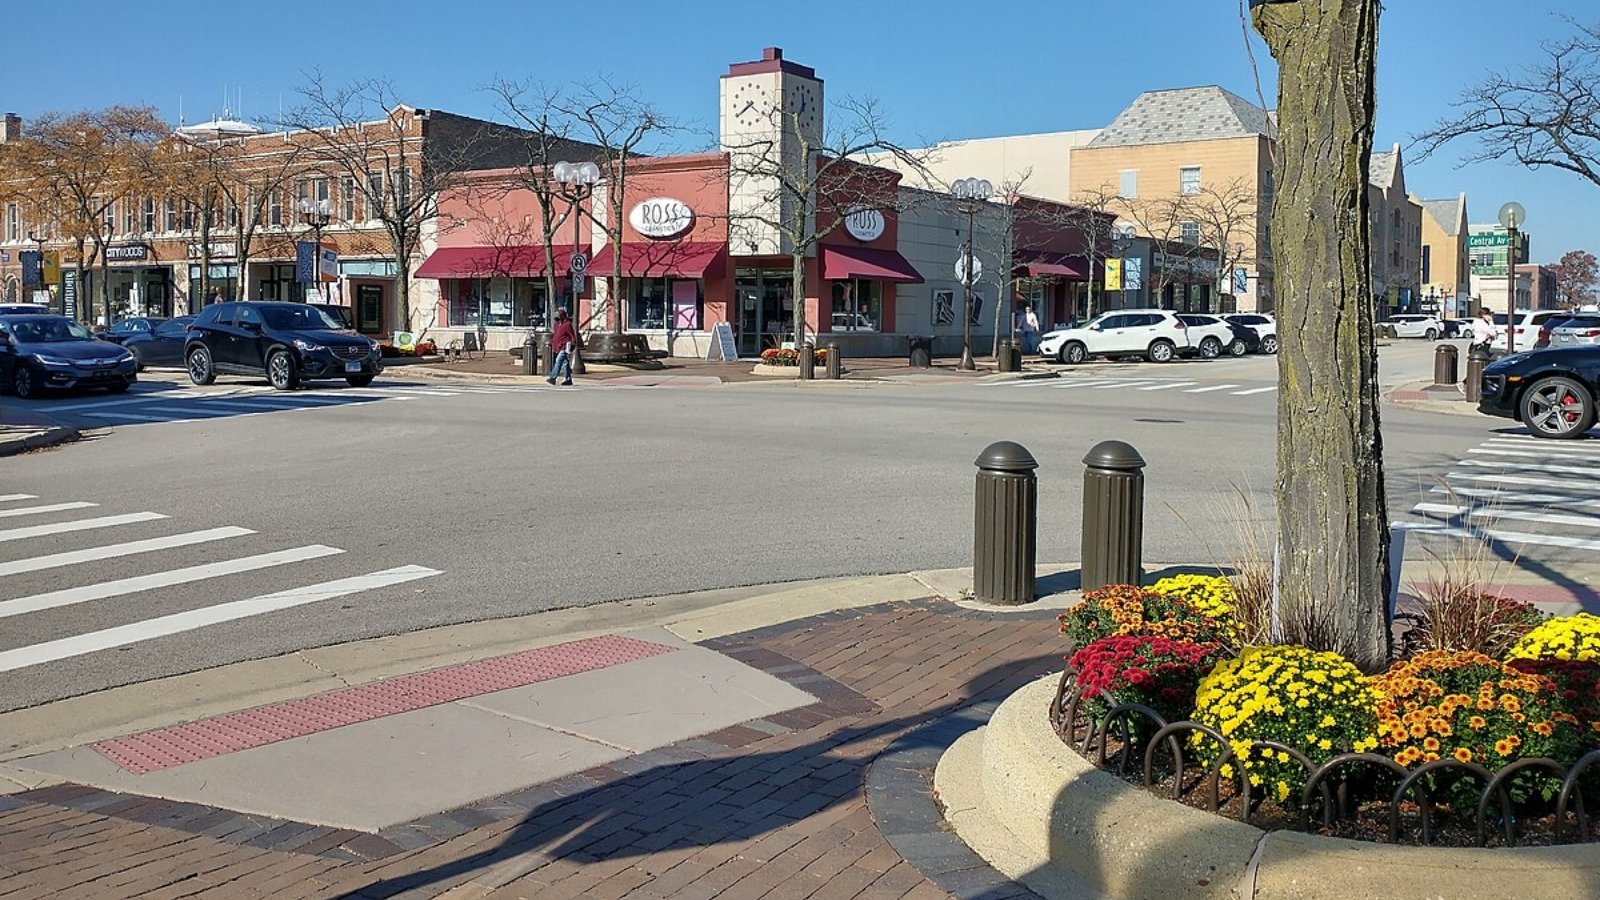
Inverness – Serene Living in the Northwest Suburbs
Inverness is a village defined by spacious lots, winding roads, and a commitment to green space. Located near Palatine and Barrington, it offers a rural feel with suburban convenience. The community is known for luxury custom homes and a strong emphasis on privacy and nature. Despite its quiet profile, Inverness is well-connected by major highways and rail lines, making it a strategic location for commuters.
While the early 2010s brought price declines across much of Chicagoland, Inverness was slower to recover. The shift toward remote work and high-end suburban homes in recent years helped spur renewed demand, with prices steadily rising since 2021. As of 2025, the town’s prestige, space, and tranquility continue to attract buyers looking for a peaceful yet refined lifestyle.
19. Northfield – 57% Home Price Increase Since 2012

- 2010: $576,328
- 2011: $522,089 (-$54,239, -9.41% from previous year)
- 2012: $501,067 (-$21,022, -4.03% from previous year)
- 2013: $527,586 (+$26,519, +5.29% from previous year)
- 2014: $586,112 (+$58,526, +11.09% from previous year)
- 2015: $610,453 (+$24,342, +4.15% from previous year)
- 2016: $623,636 (+$13,183, +2.16% from previous year)
- 2017: $623,928 (+$291, +0.05% from previous year)
- 2018: $637,890 (+$13,962, +2.24% from previous year)
- 2019: $592,040 (-$45,850, -7.19% from previous year)
- 2020: N/A
- 2021: $622,108
- 2022: $692,131 (+$70,024, +11.26% from previous year)
- 2023: $712,047 (+$19,915, +2.88% from previous year)
- 2024: $745,952 (+$33,905, +4.76% from previous year)
- 2025: $786,978 (+$41,025, +5.50% from previous year)
Northfield home values climbed from just over $500,000 in 2012 to nearly $787,000 in 2025. Despite a price dip in 2019, the town quickly recovered, seeing double-digit growth in 2022. With a blend of charm and accessibility, Northfield remains a quiet contender in the high-end market of the North Shore.
Northfield – Quietly Climbing on the North Shore
Northfield may not be as widely recognized as its North Shore neighbors, but its small-town feel and strong community draw in families and professionals alike. Located near Glenview and Winnetka, the village offers access to top-tier schools and leafy residential streets. Commercial areas are minimal, preserving a tranquil setting throughout town.
Recent years have brought more attention to Northfield, especially from buyers seeking lower prices compared to neighboring suburbs like Wilmette or Glencoe. The town’s housing stock includes updated ranch homes and custom new builds, helping sustain interest. In 2025, rising values reflect Northfield’s increasing profile as a refined, low-key place to call home.
18. North Barrington – 57% Home Price Increase Since 2012
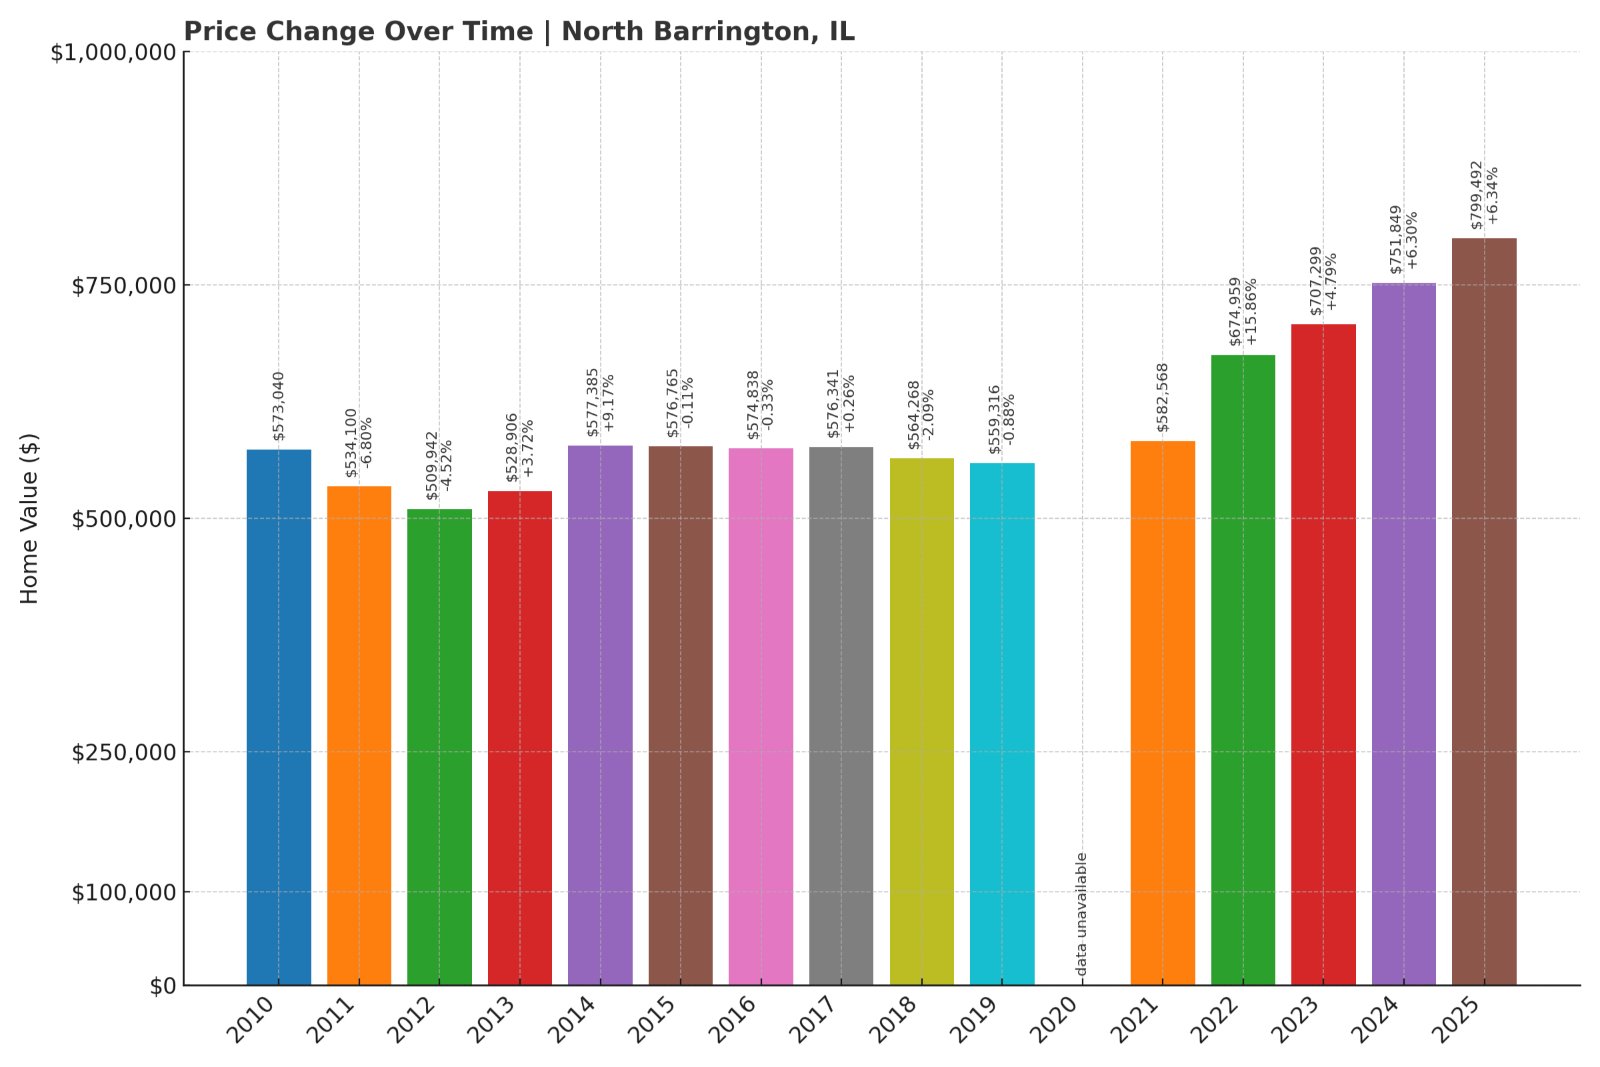
- 2010: $573,040
- 2011: $534,100 (-$38,940, -6.80% from previous year)
- 2012: $509,942 (-$24,158, -4.52% from previous year)
- 2013: $528,906 (+$18,964, +3.72% from previous year)
- 2014: $577,385 (+$48,479, +9.17% from previous year)
- 2015: $576,765 (-$620, -0.11% from previous year)
- 2016: $574,838 (-$1,927, -0.33% from previous year)
- 2017: $576,341 (+$1,503, +0.26% from previous year)
- 2018: $564,268 (-$12,073, -2.09% from previous year)
- 2019: $559,316 (-$4,952, -0.88% from previous year)
- 2020: N/A
- 2021: $582,568
- 2022: $674,959 (+$92,390, +15.86% from previous year)
- 2023: $707,299 (+$32,340, +4.79% from previous year)
- 2024: $751,849 (+$44,550, +6.30% from previous year)
- 2025: $799,492 (+$47,643, +6.34% from previous year)
North Barrington homes rose in value by nearly 57% since 2012, with much of that growth occurring post-2021. The 2022 spike—nearly 16% in a single year—marked a turning point. Buyers have been drawn to this affluent suburb for its seclusion and scenic charm, pushing the 2025 median to nearly $800,000.
North Barrington – Scenic Luxury in the Northwest
Situated around the Flint Creek watershed and home to the Makray Memorial Golf Club, North Barrington blends luxury living with natural beauty. The area is dotted with custom estates, many on large wooded lots, offering seclusion within reach of suburban convenience. It’s a short drive to Barrington’s Metra station and retail core.
The town experienced stable but modest price changes for years until the post-COVID housing surge reignited interest in its upscale properties. Buyers now view North Barrington as a retreat from denser suburbs, contributing to sustained annual increases. In 2025, home values reflect not just the town’s setting, but its growing appeal among discerning buyers.
17. Western Springs – 63% Home Price Increase Since 2012
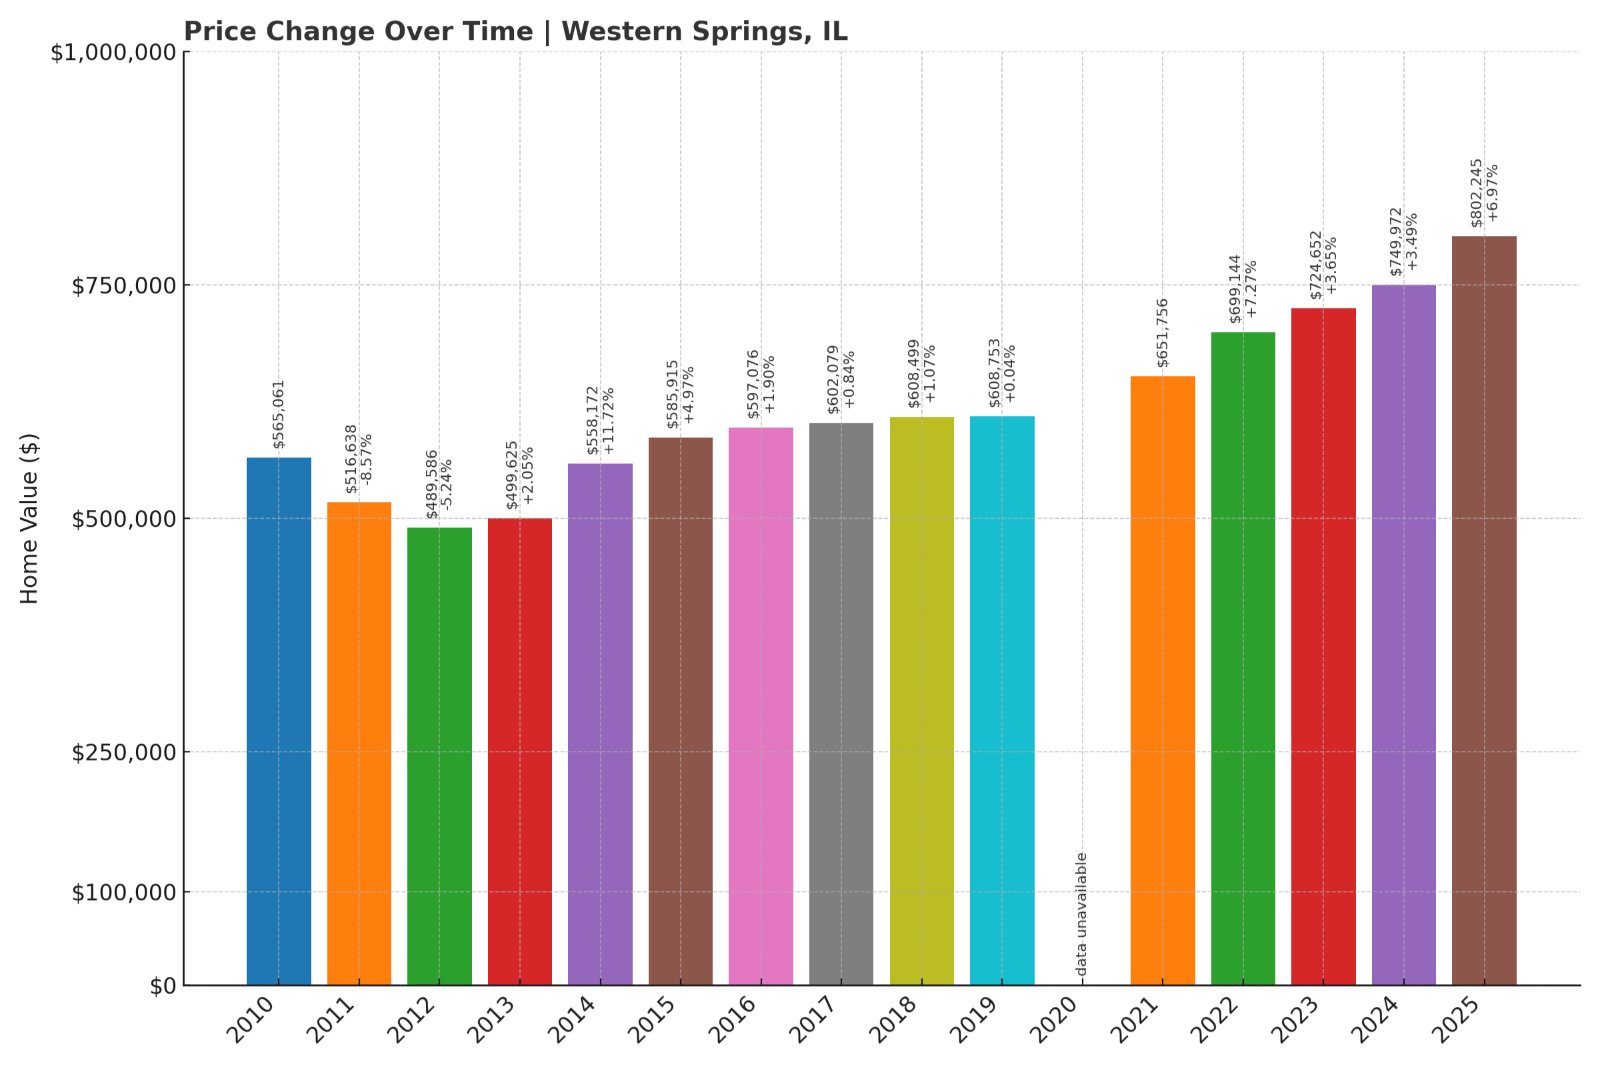
- 2010: $565,061
- 2011: $516,638 (-$48,423, -8.57% from previous year)
- 2012: $489,586 (-$27,053, -5.24% from previous year)
- 2013: $499,625 (+$10,039, +2.05% from previous year)
- 2014: $558,172 (+$58,547, +11.72% from previous year)
- 2015: $585,915 (+$27,743, +4.97% from previous year)
- 2016: $597,076 (+$11,161, +1.90% from previous year)
- 2017: $602,079 (+$5,003, +0.84% from previous year)
- 2018: $608,499 (+$6,420, +1.07% from previous year)
- 2019: $608,753 (+$254, +0.04% from previous year)
- 2020: N/A
- 2021: $651,756
- 2022: $699,144 (+$47,388, +7.27% from previous year)
- 2023: $724,652 (+$25,508, +3.65% from previous year)
- 2024: $749,972 (+$25,319, +3.49% from previous year)
- 2025: $802,245 (+$52,274, +6.97% from previous year)
Western Springs has seen home prices climb by more than 63% since 2012. Growth remained gradual through the 2010s before taking off in 2021 and 2022. The town’s proximity to downtown Chicago, top schools, and classic architecture all contribute to its solid market performance.
Western Springs – Classic Charm and City Access

Located just 15 miles west of Chicago, Western Springs combines a historic downtown, tree-lined neighborhoods, and easy Metra access. It’s a popular choice for families drawn by the highly regarded Lyons Township High School District and a tight-knit community atmosphere. The town also boasts parks, sports facilities, and a walkable layout.
Prices held steady in the mid-$500,000s for years before accelerating with new demand in the early 2020s. In 2025, Western Springs homes average just over $800,000. That price reflects both the quality of life and limited supply in one of the most desirable suburbs west of the city.
16. Burr Ridge – 62% Home Price Increase Since 2012
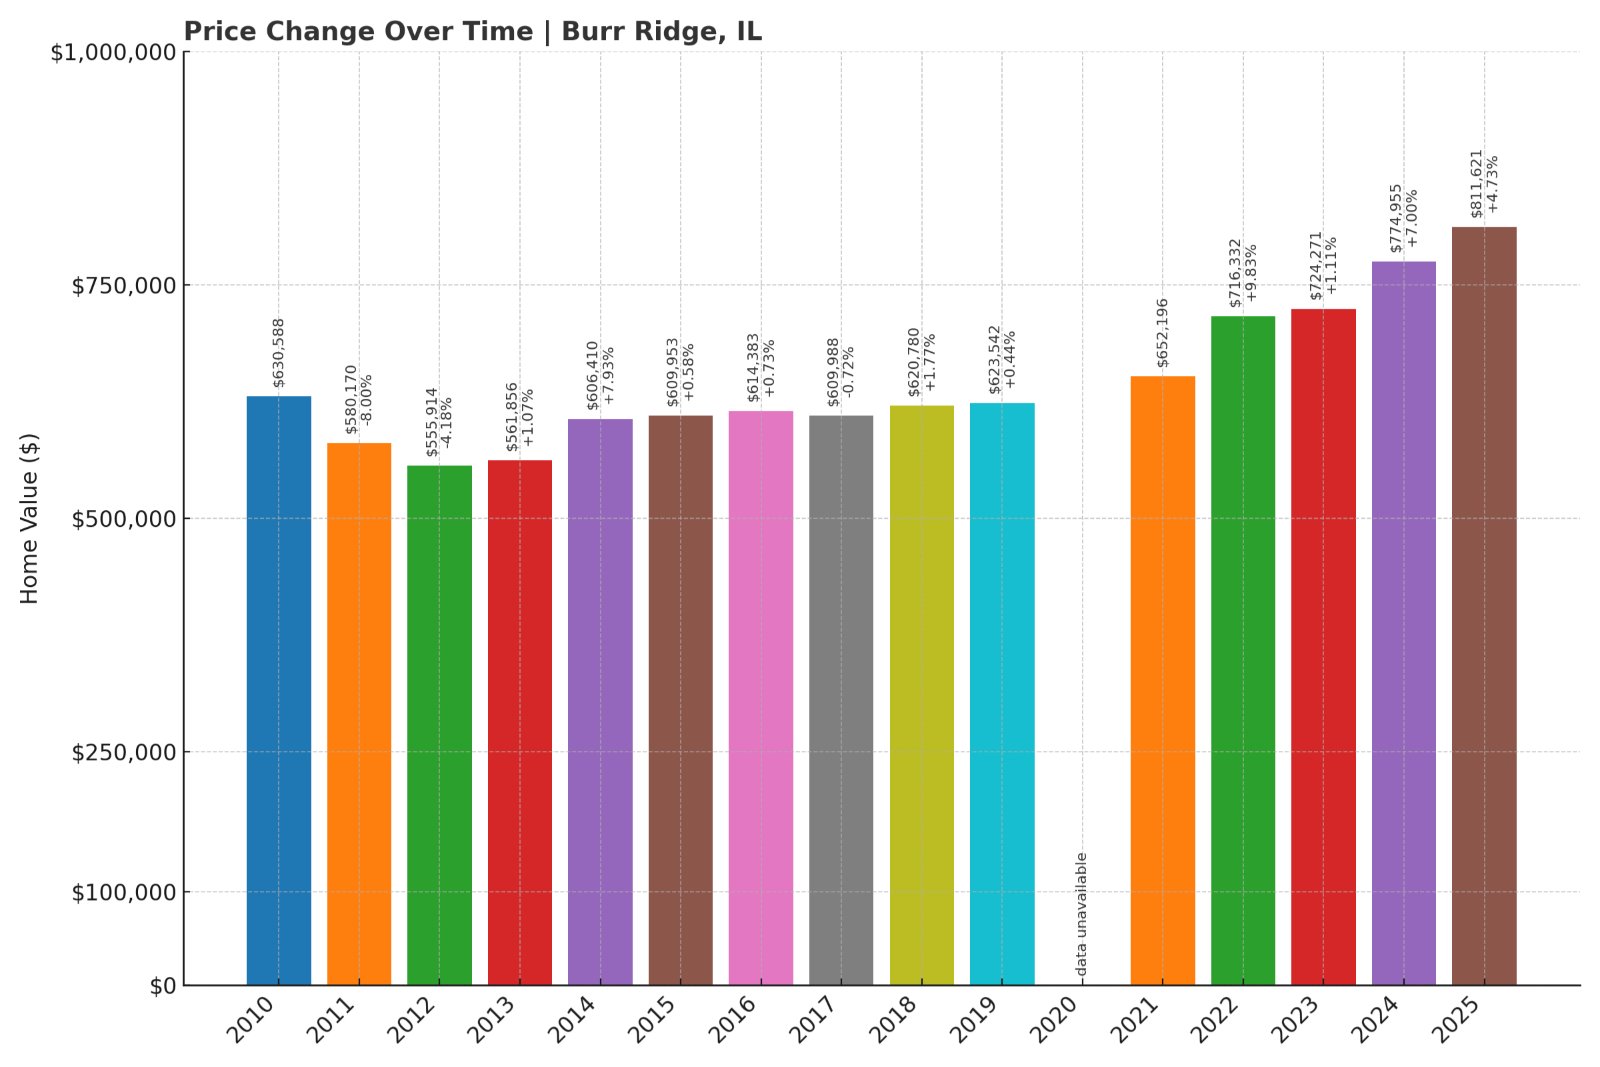
- 2010: $630,588
- 2011: $580,170 (-$50,418, -8.00% from previous year)
- 2012: $555,914 (-$24,256, -4.18% from previous year)
- 2013: $561,856 (+$5,942, +1.07% from previous year)
- 2014: $606,410 (+$44,554, +7.93% from previous year)
- 2015: $609,953 (+$3,543, +0.58% from previous year)
- 2016: $614,383 (+$4,431, +0.73% from previous year)
- 2017: $609,988 (-$4,395, -0.72% from previous year)
- 2018: $620,780 (+$10,792, +1.77% from previous year)
- 2019: $623,542 (+$2,762, +0.44% from previous year)
- 2020: N/A
- 2021: $652,196
- 2022: $716,332 (+$64,136, +9.83% from previous year)
- 2023: $724,271 (+$7,938, +1.11% from previous year)
- 2024: $774,955 (+$50,685, +7.00% from previous year)
- 2025: $811,621 (+$36,666, +4.73% from previous year)
Home prices in Burr Ridge rose by more than 60% since 2012, with a mix of gradual growth and more dramatic increases in recent years. The 2022 bump of nearly 10% reflected growing interest in luxury properties with space and privacy—two things Burr Ridge offers in abundance.
Burr Ridge – Estate Living and Easy Commuting
Burr Ridge is known for its spacious lots, custom-built homes, and gated communities, often set among gently rolling terrain. Located about 20 miles southwest of downtown Chicago, it’s convenient to both I-55 and I-294, making it a practical choice for commuters and professionals.
The village offers a semi-rural feel while also hosting upscale shopping and dining options like the Burr Ridge Village Center. It’s also home to several corporate offices and excellent schools. The balance of luxury, green space, and location helped drive consistent appreciation. In 2025, the median price sits above $811,000, and demand remains strong.
15. Kildeer – 54% Home Price Increase Since 2012
🔥 Would you like to save this?
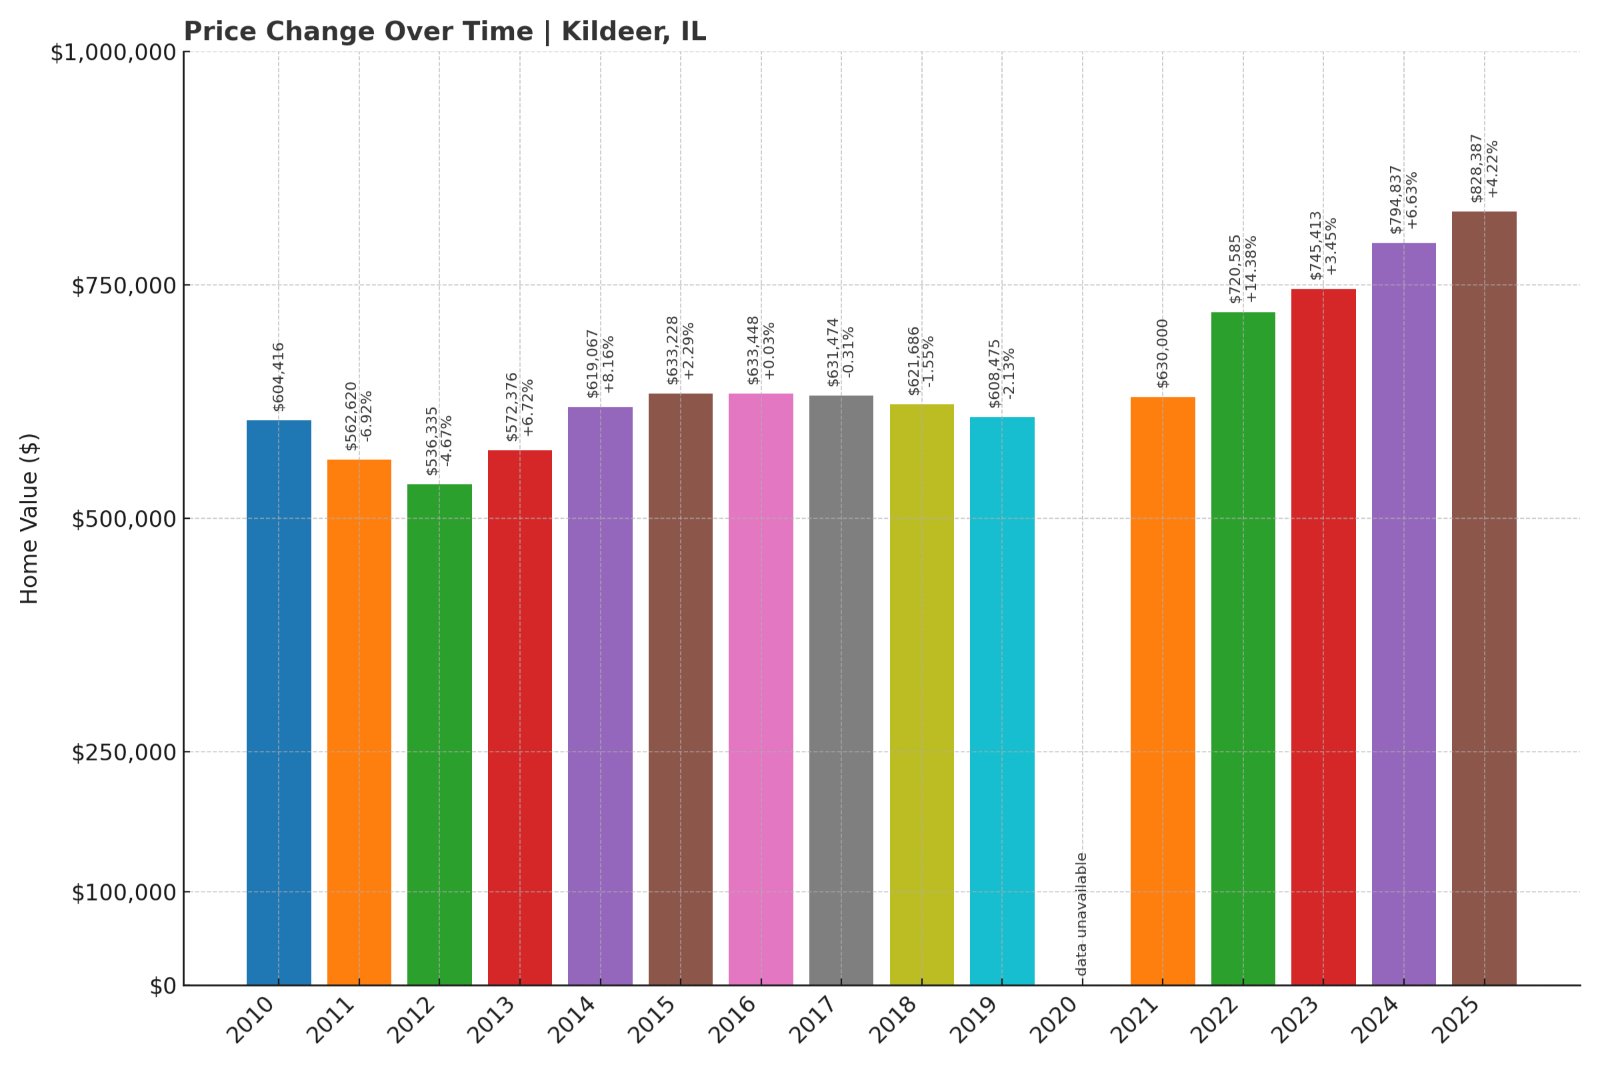
- 2010: $604,416
- 2011: $562,620 (-$41,795, -6.92% from previous year)
- 2012: $536,335 (-$26,286, -4.67% from previous year)
- 2013: $572,376 (+$36,041, +6.72% from previous year)
- 2014: $619,067 (+$46,691, +8.16% from previous year)
- 2015: $633,228 (+$14,161, +2.29% from previous year)
- 2016: $633,448 (+$220, +0.03% from previous year)
- 2017: $631,474 (-$1,974, -0.31% from previous year)
- 2018: $621,686 (-$9,788, -1.55% from previous year)
- 2019: $608,475 (-$13,211, -2.13% from previous year)
- 2020: N/A
- 2021: $630,000
- 2022: $720,585 (+$90,585, +14.38% from previous year)
- 2023: $745,413 (+$24,828, +3.45% from previous year)
- 2024: $794,837 (+$49,424, +6.63% from previous year)
- 2025: $828,387 (+$33,550, +4.22% from previous year)
Kildeer’s home values have climbed steadily since 2012, gaining more than half their value over that time. The biggest jump came in 2022, when median prices shot up by more than 14%. As of 2025, homes here average over $828,000—a reflection of the town’s spacious properties and strong appeal.
Kildeer – Nature, Space, and Prestige
Kildeer is a residential village in Lake County known for its large homes, equestrian properties, and natural surroundings. Zoning restrictions emphasize conservation, helping the area retain its pastoral charm. Most homes sit on one-acre lots or larger, giving residents room to breathe.
Though rural in atmosphere, Kildeer is near major shopping destinations like Deer Park Town Center and minutes from expressways. Its school districts, particularly Lake Zurich CUSD 95, are highly rated. This combination of quiet luxury and accessibility continues to draw affluent buyers, fueling steady price growth over the last decade.
14. Wilmette – 59% Home Price Increase Since 2012
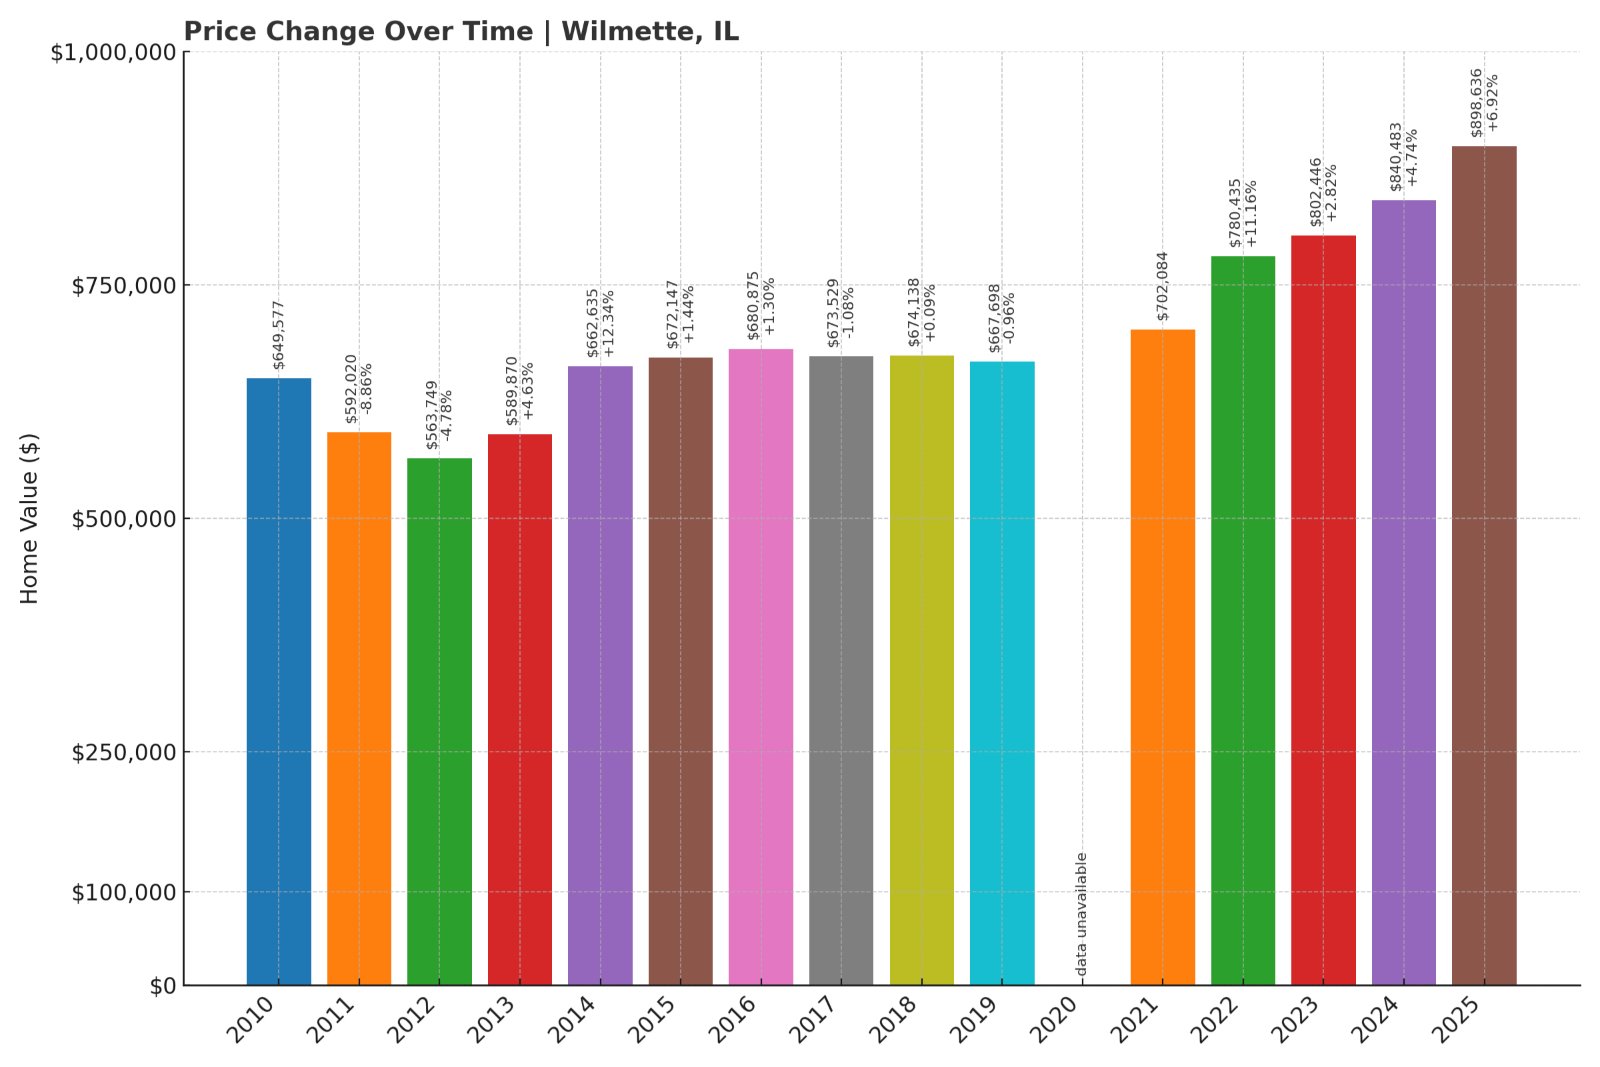
- 2010: $649,577
- 2011: $592,020 (-$57,557, -8.86% from previous year)
- 2012: $563,749 (-$28,271, -4.78% from previous year)
- 2013: $589,870 (+$26,122, +4.63% from previous year)
- 2014: $662,635 (+$72,765, +12.34% from previous year)
- 2015: $672,147 (+$9,512, +1.44% from previous year)
- 2016: $680,875 (+$8,728, +1.30% from previous year)
- 2017: $673,529 (-$7,346, -1.08% from previous year)
- 2018: $674,138 (+$609, +0.09% from previous year)
- 2019: $667,698 (-$6,440, -0.96% from previous year)
- 2020: N/A
- 2021: $702,084
- 2022: $780,435 (+$78,351, +11.16% from previous year)
- 2023: $802,446 (+$22,011, +2.82% from previous year)
- 2024: $840,483 (+$38,036, +4.74% from previous year)
- 2025: $898,636 (+$58,153, +6.92% from previous year)
Wilmette’s housing market has grown by nearly 60% since 2012, with a notable acceleration since 2021. As of 2025, the median home price is just under $900,000, reflecting a premium location and enduring demand for North Shore living.
Wilmette – A North Shore Favorite
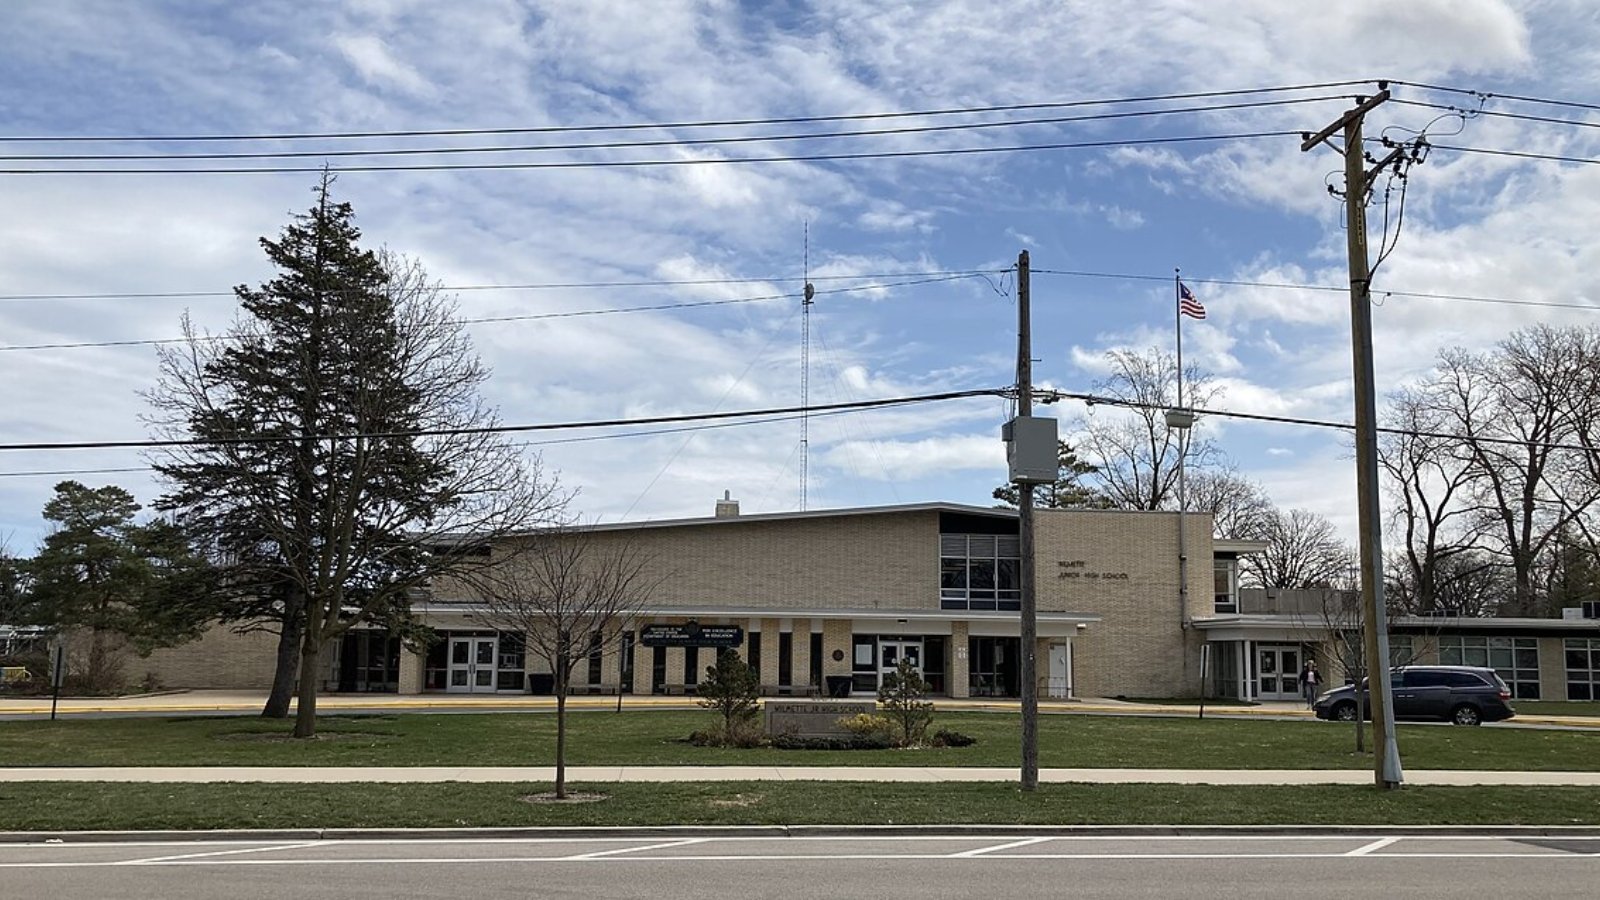
Wilmette is a picturesque village along Lake Michigan just north of Evanston. Its shoreline includes the popular Gillson Park and Beach, while the downtown area blends independent shops, cafes, and classic architecture. The village is served by excellent public schools, including New Trier High School, one of Illinois’ most respected.
Homes range from historic Victorians to modern rebuilds, all situated in tree-lined neighborhoods that attract families and professionals alike. Wilmette’s steady appreciation over the last decade is supported by its community feel, infrastructure, and proximity to Chicago via Metra and CTA Purple Line service.
13. Long Grove – 67% Home Price Increase Since 2012
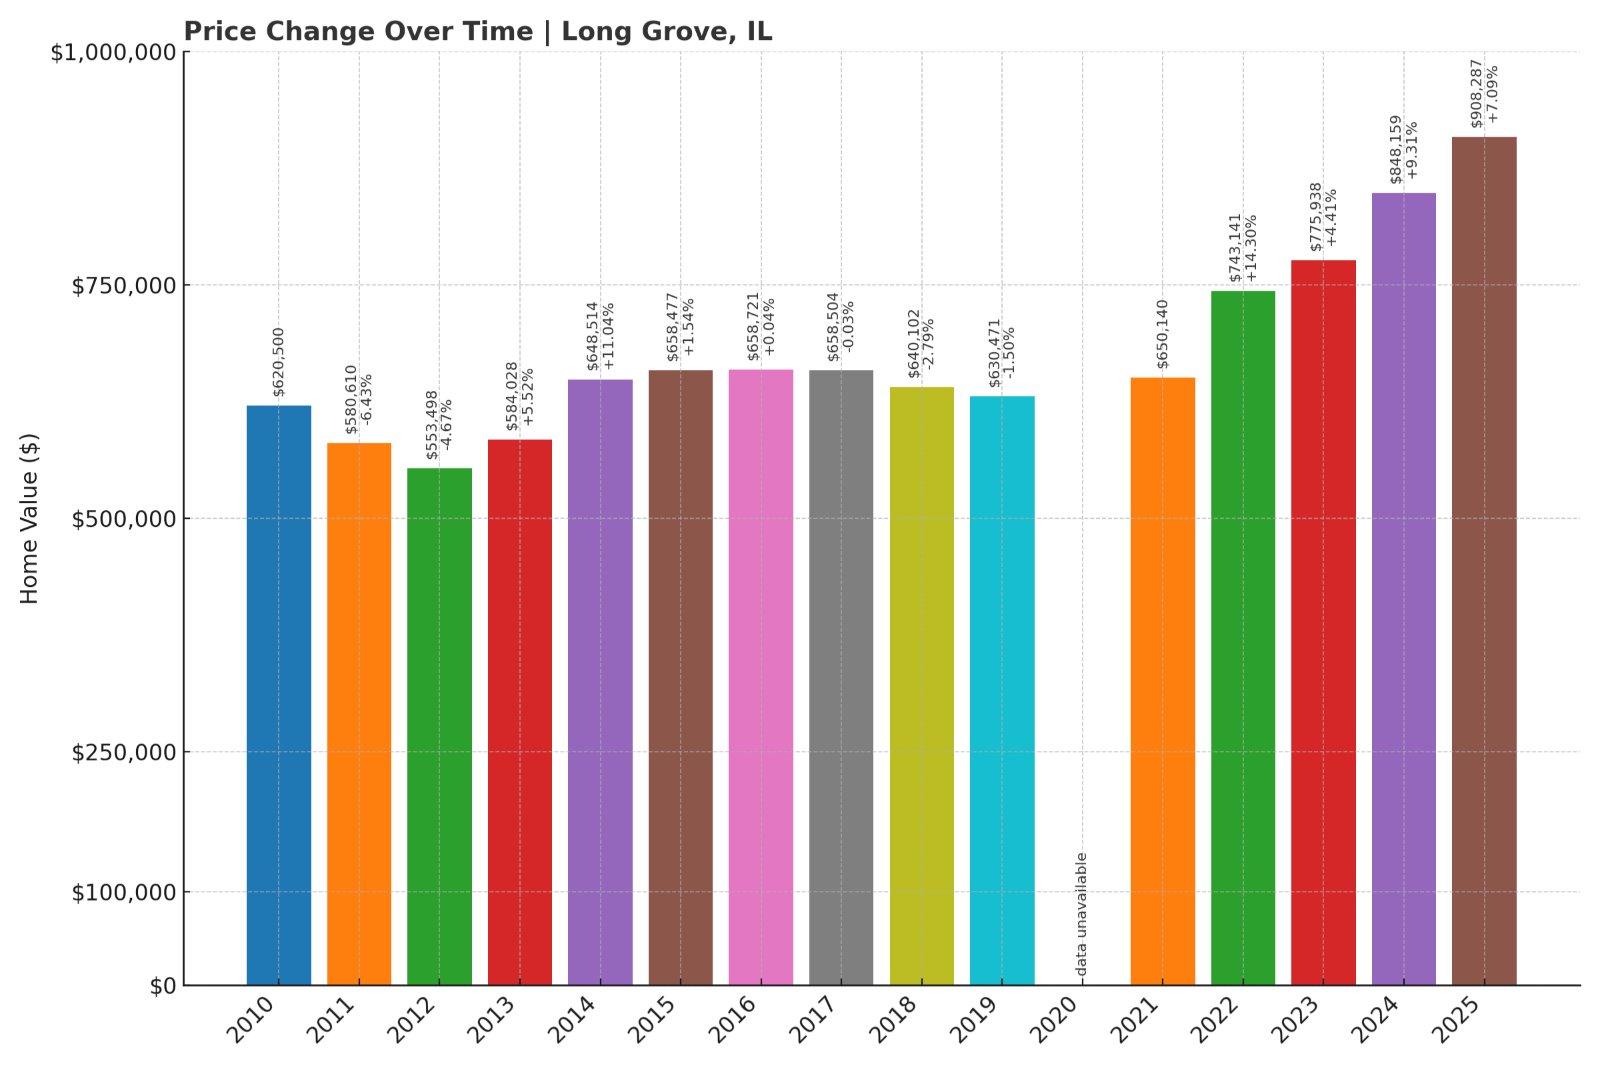
- 2010: $620,500
- 2011: $580,610 (-$39,890, -6.43% from previous year)
- 2012: $553,498 (-$27,112, -4.67% from previous year)
- 2013: $584,028 (+$30,530, +5.52% from previous year)
- 2014: $648,514 (+$64,486, +11.04% from previous year)
- 2015: $658,477 (+$9,962, +1.54% from previous year)
- 2016: $658,721 (+$244, +0.04% from previous year)
- 2017: $658,504 (-$217, -0.03% from previous year)
- 2018: $640,102 (-$18,403, -2.79% from previous year)
- 2019: $630,471 (-$9,631, -1.50% from previous year)
- 2020: N/A
- 2021: $650,140
- 2022: $743,141 (+$93,001, +14.30% from previous year)
- 2023: $775,938 (+$32,798, +4.41% from previous year)
- 2024: $848,159 (+$72,220, +9.31% from previous year)
- 2025: $908,287 (+$60,128, +7.09% from previous year)
Long Grove home values rose by 67% since 2012, with an especially steep increase since 2021. This surge reflects renewed interest in rural-feel suburbs that offer space, charm, and top-tier amenities. By 2025, median prices in Long Grove exceed $900,000.
Long Grove – Rustic Sophistication Near Chicago
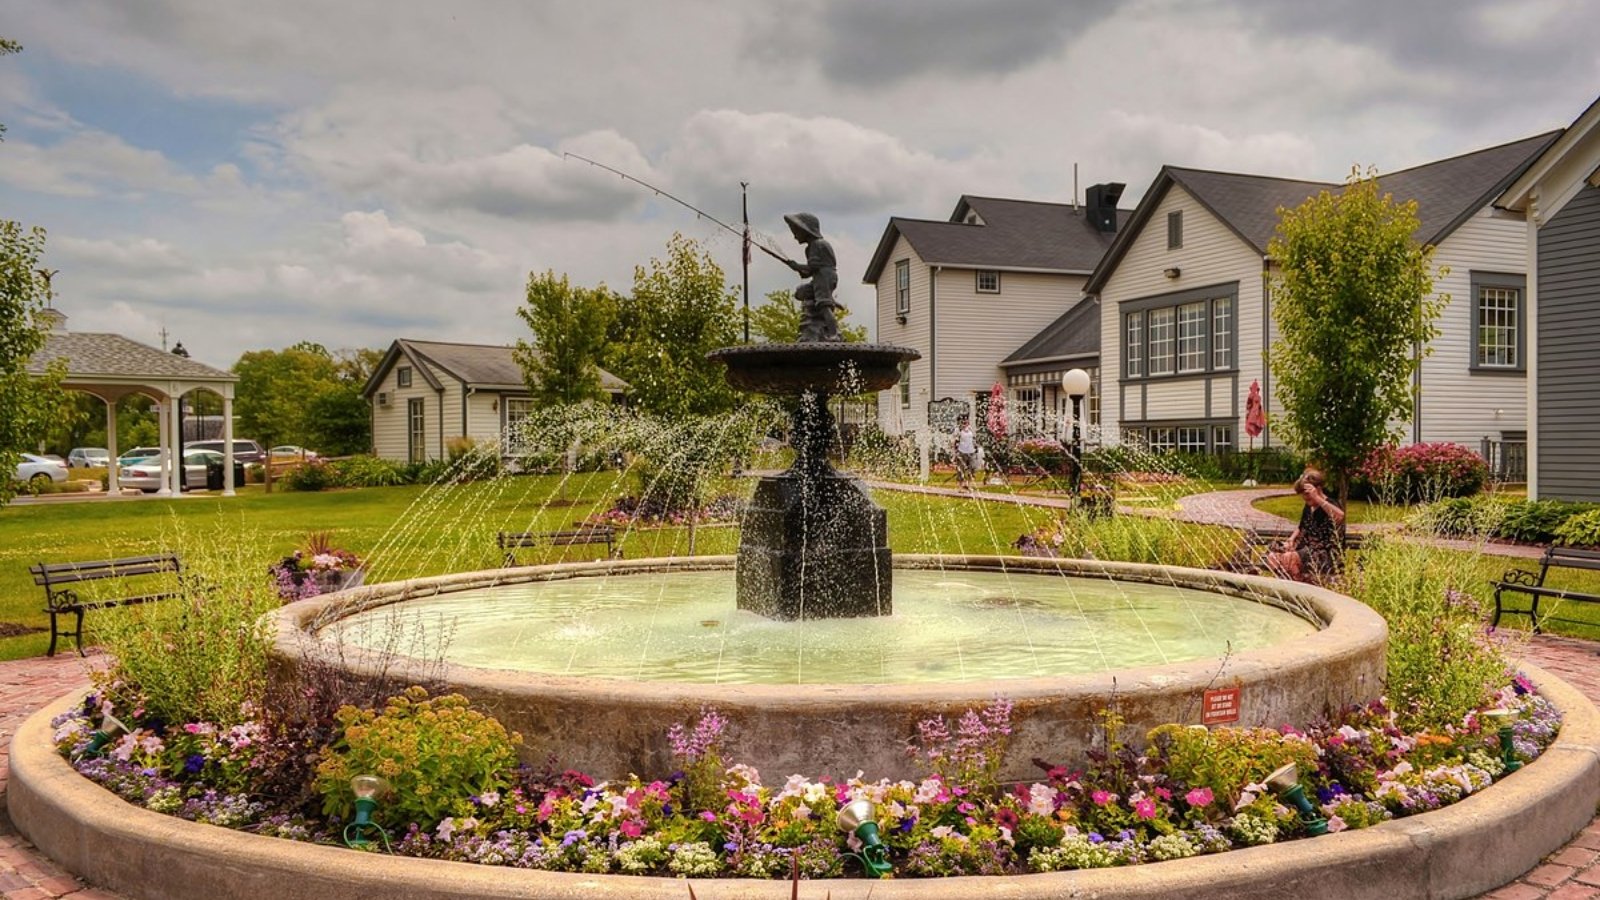
Long Grove is one of Illinois’ most unique and charming villages, known for its historic downtown, covered bridge, and strict preservation laws. These policies have helped the town maintain its rural ambiance while supporting property values through low-density planning and desirable home design.
Homes in Long Grove are typically large, custom-built, and set on spacious wooded lots. The area is also served by award-winning schools in Stevenson High School District 125. This blend of heritage, land, and location continues to attract families and luxury buyers alike.
12. Oak Brook – 57% Home Price Increase Since 2012
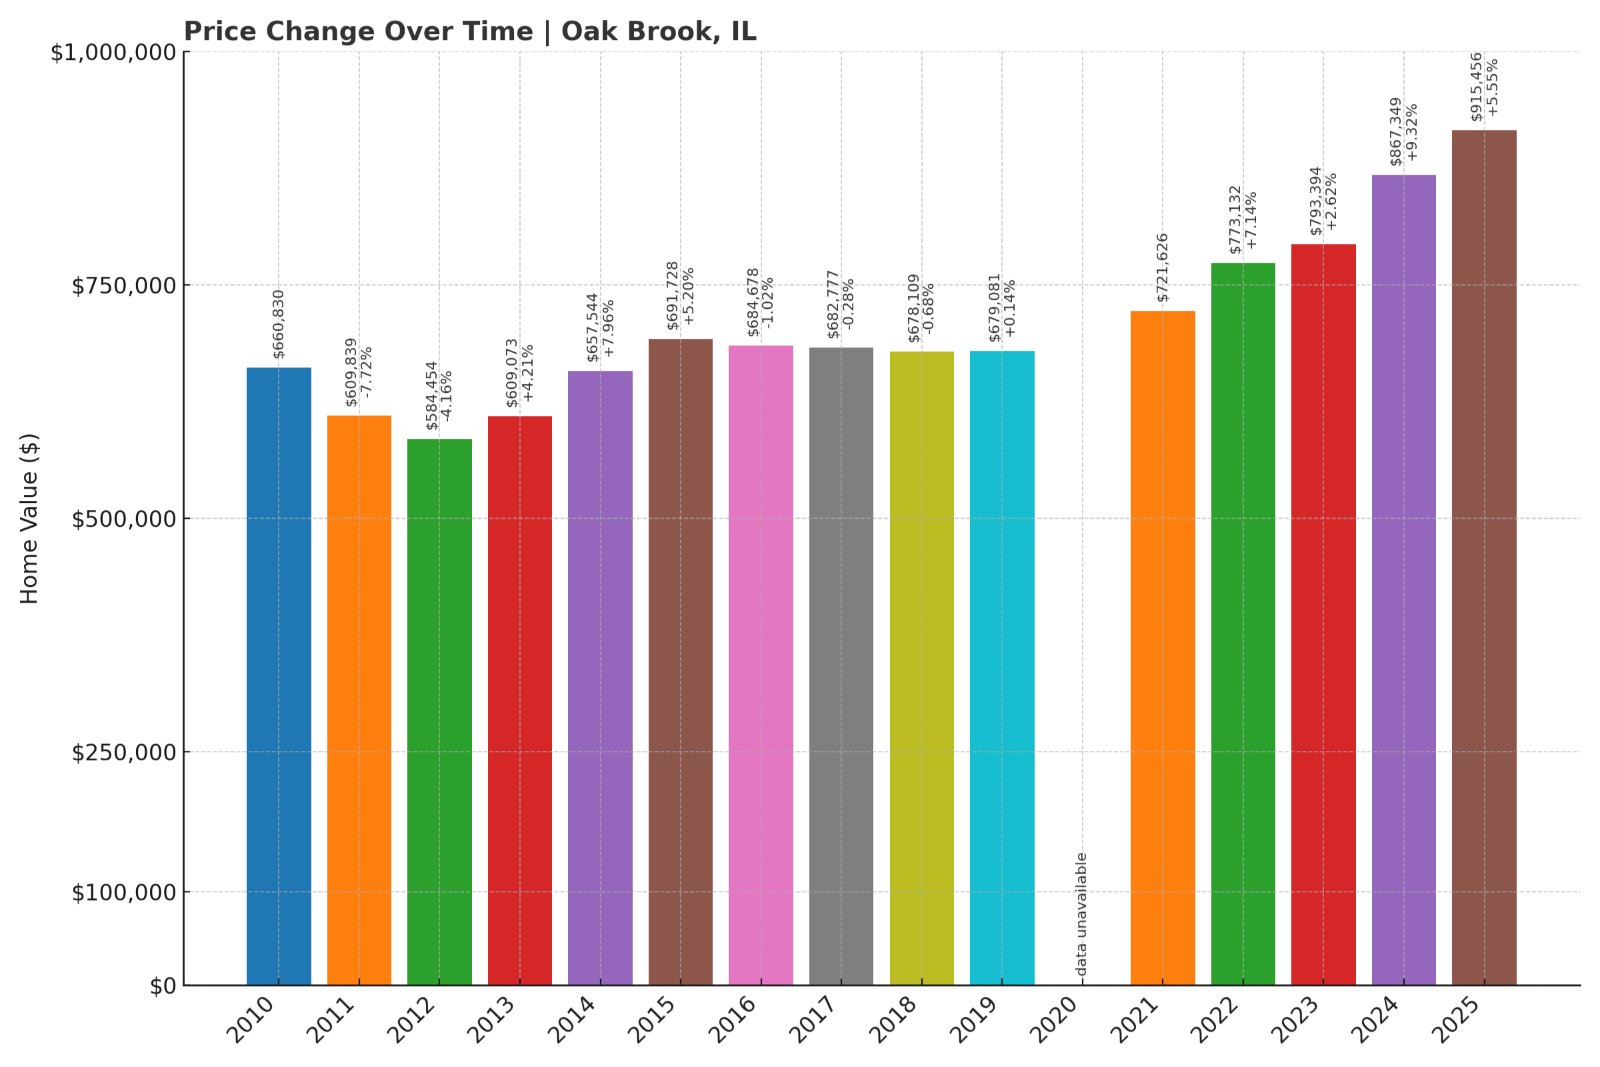
- 2010: $660,830
- 2011: $609,839 (-$50,991, -7.72% from previous year)
- 2012: $584,454 (-$25,385, -4.16% from previous year)
- 2013: $609,073 (+$24,619, +4.21% from previous year)
- 2014: $657,544 (+$48,471, +7.96% from previous year)
- 2015: $691,728 (+$34,184, +5.20% from previous year)
- 2016: $684,678 (-$7,050, -1.02% from previous year)
- 2017: $682,777 (-$1,901, -0.28% from previous year)
- 2018: $678,109 (-$4,668, -0.68% from previous year)
- 2019: $679,081 (+$973, +0.14% from previous year)
- 2020: N/A
- 2021: $721,626
- 2022: $773,132 (+$51,506, +7.14% from previous year)
- 2023: $793,394 (+$20,262, +2.62% from previous year)
- 2024: $867,349 (+$73,955, +9.32% from previous year)
- 2025: $915,456 (+$48,107, +5.55% from previous year)
Oak Brook home prices have increased more than 57% since 2012, driven by steady demand and a significant boost between 2021 and 2024. With 2025 prices now topping $915,000, the village remains one of the most expensive and sought-after suburbs in the state.
Oak Brook – Corporate Hub and Luxury Homes
Oak Brook is a major business and residential center in DuPage County, known for its upscale homes, low property taxes, and proximity to major expressways. Home to the Oakbrook Center mall and a number of corporate headquarters, the village offers a blend of affluence and access.
Buyers are drawn to Oak Brook for its grand homes—many of which sit on large lots—and the ease of commuting into Chicago via I-88 or I-294. The absence of a municipal property tax and the strength of the Hinsdale school districts help sustain property values. In recent years, home prices have surged with renewed interest in premium suburbs close to business centers and retail options.
11. Riverwoods – 60% Home Price Increase Since 2012
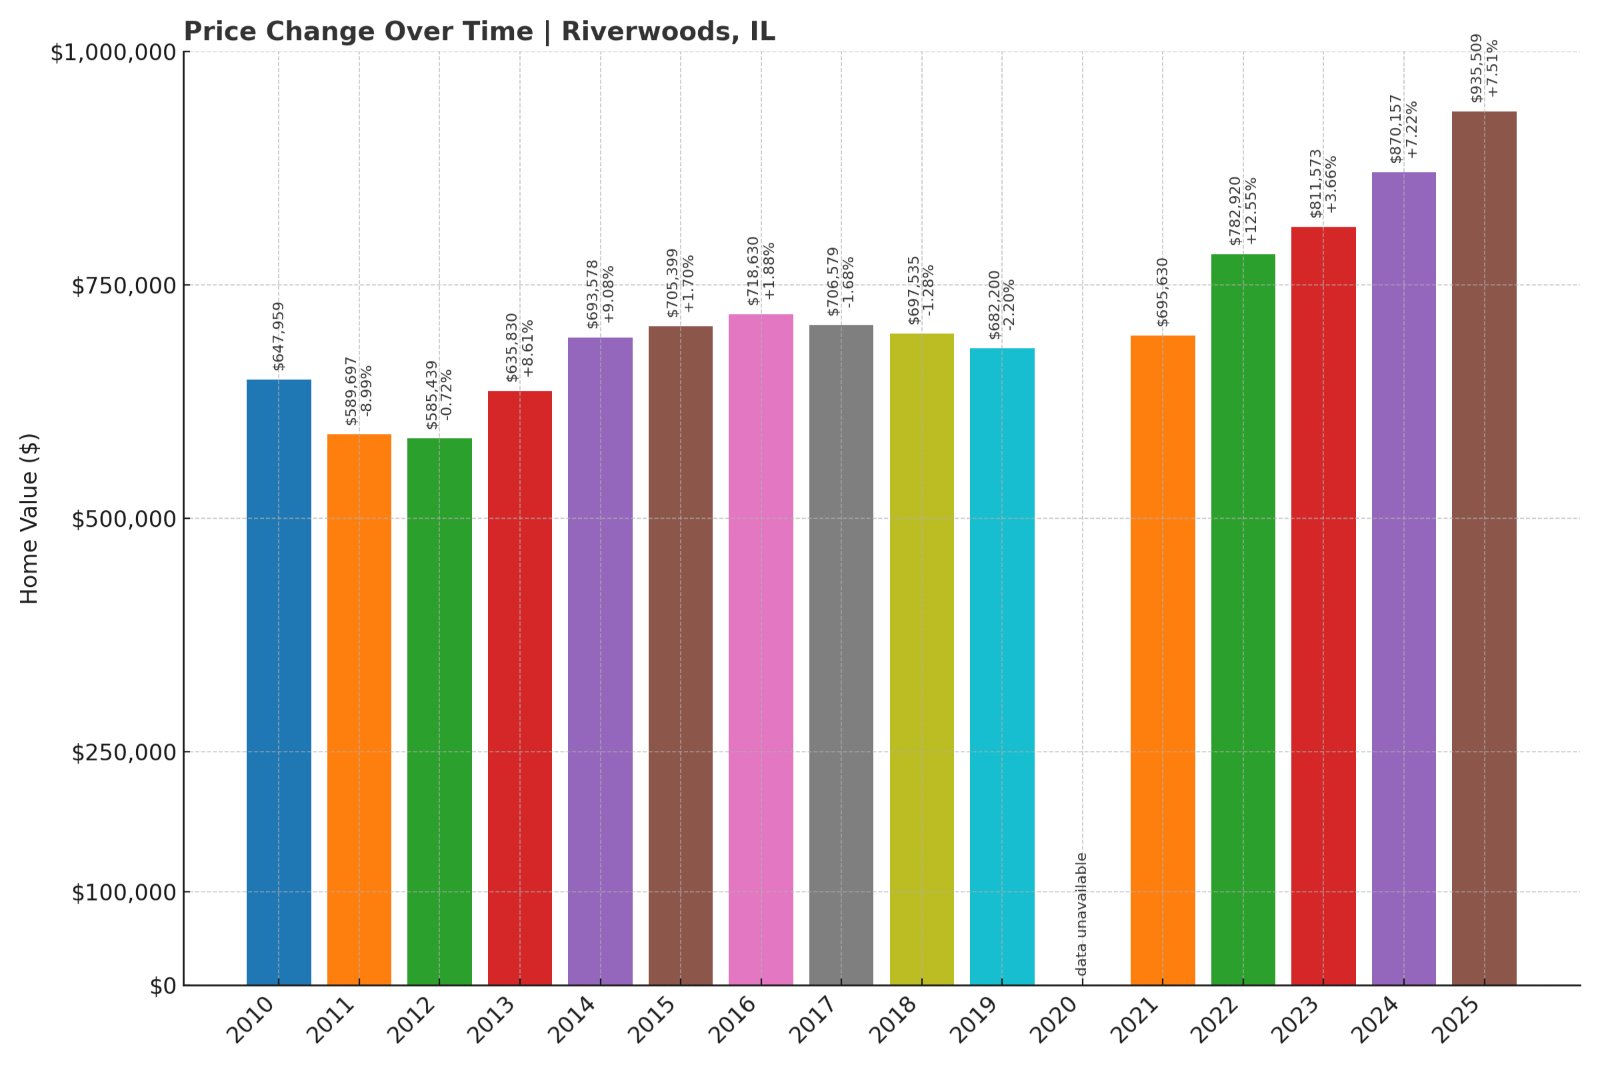
- 2010: $647,959
- 2011: $589,697 (-$58,262, -8.99% from previous year)
- 2012: $585,439 (-$4,258, -0.72% from previous year)
- 2013: $635,830 (+$50,391, +8.61% from previous year)
- 2014: $693,578 (+$57,748, +9.08% from previous year)
- 2015: $705,399 (+$11,821, +1.70% from previous year)
- 2016: $718,630 (+$13,231, +1.88% from previous year)
- 2017: $706,579 (-$12,051, -1.68% from previous year)
- 2018: $697,535 (-$9,044, -1.28% from previous year)
- 2019: $682,200 (-$15,335, -2.20% from previous year)
- 2020: N/A
- 2021: $695,630
- 2022: $782,920 (+$87,290, +12.55% from previous year)
- 2023: $811,573 (+$28,653, +3.66% from previous year)
- 2024: $870,157 (+$58,584, +7.22% from previous year)
- 2025: $935,509 (+$65,352, +7.51% from previous year)
Riverwoods has seen a 60% rise in home values since 2012, bolstered by consistent growth in the 2020s. From mid-$500Ks to over $935,000 in 2025, the appreciation reflects the town’s appeal as a peaceful, wooded retreat within reach of suburban amenities.
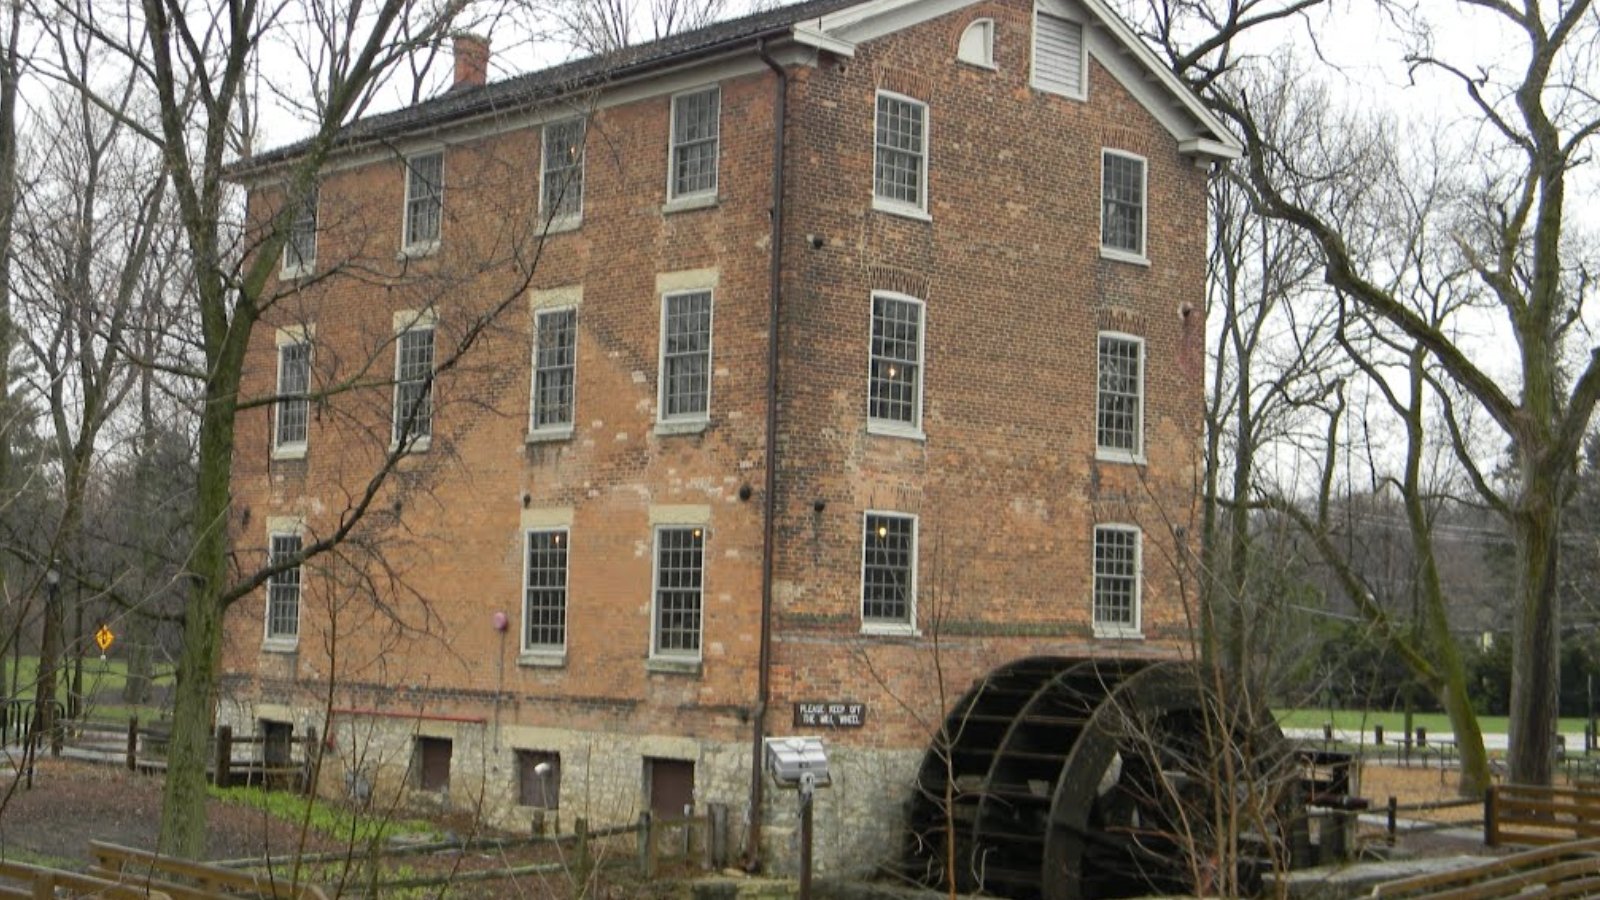
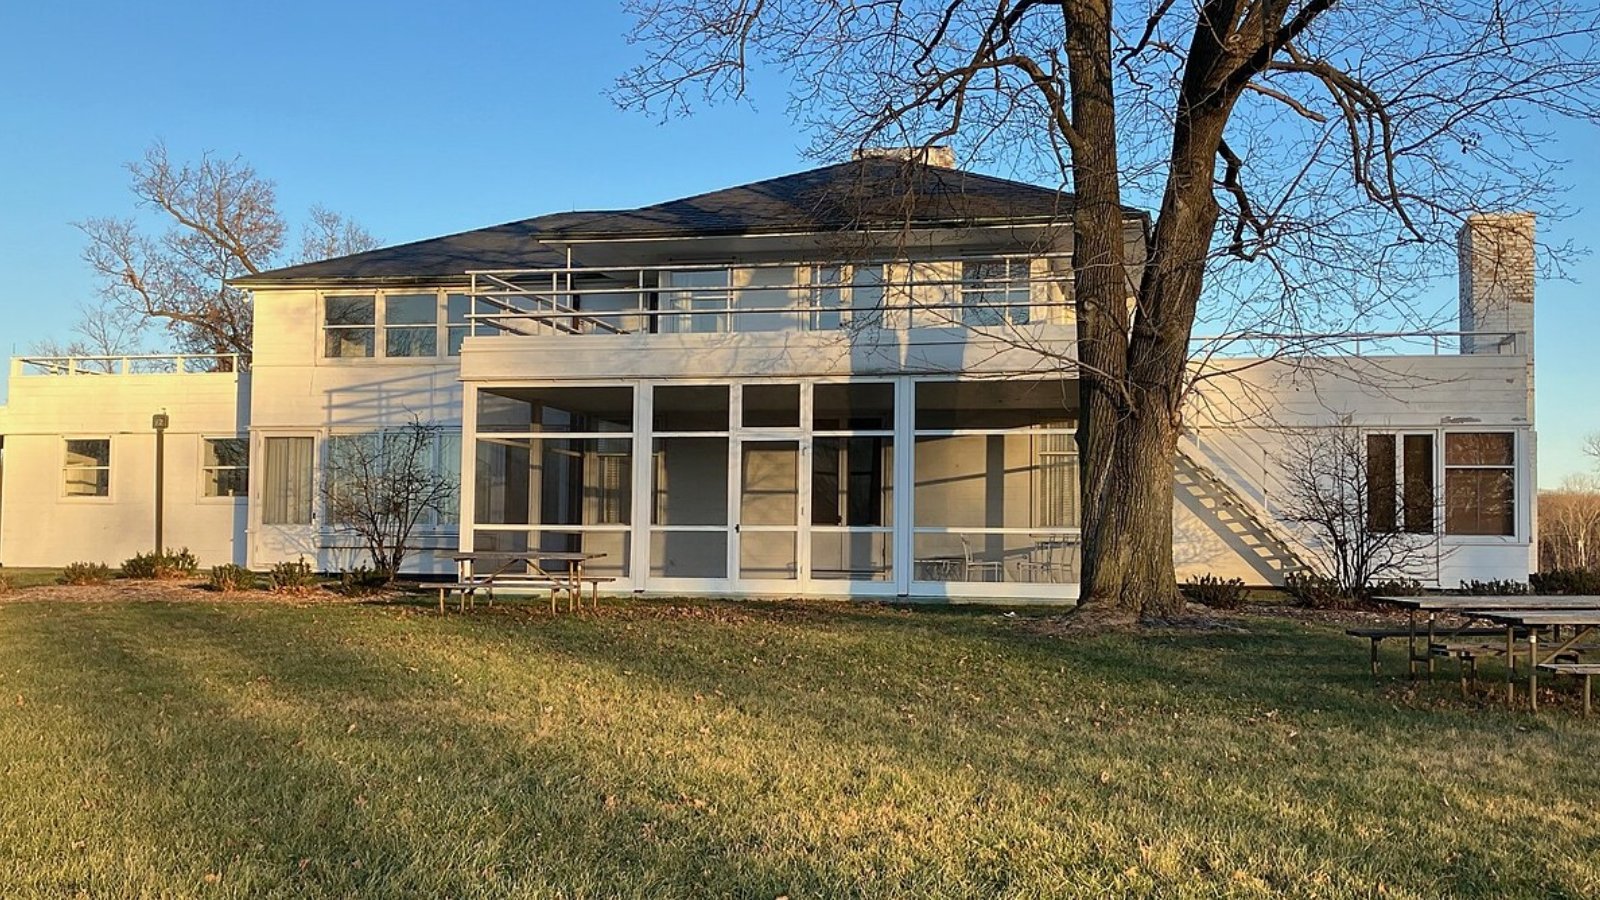
Riverwoods – Private and Wooded Residential Enclaves
Riverwoods is a residential-only community in Lake County that prides itself on forested lots and minimal commercial development. Homes are typically large and surrounded by mature trees, offering exceptional privacy and a natural setting that’s rare in the Chicago suburbs.
Its location near Deerfield and Bannockburn provides access to shopping, dining, and top-ranked schools in the Deerfield District 109 and Township High School District 113. Over the past few years, Riverwoods has attracted buyers seeking quiet luxury, and price increases have reflected that demand. The current median of over $935,000 places it among the most elite markets in Illinois.
10. Mettawa – 68% Home Price Increase Since 2012

- 2010: $629,137
- 2011: $602,046 (-$27,091, -4.31% from previous year)
- 2012: $577,843 (-$24,203, -4.02% from previous year)
- 2013: $606,342 (+$28,498, +4.93% from previous year)
- 2014: $668,810 (+$62,468, +10.30% from previous year)
- 2015: $685,299 (+$16,489, +2.47% from previous year)
- 2016: $691,522 (+$6,224, +0.91% from previous year)
- 2017: $676,755 (-$14,767, -2.14% from previous year)
- 2018: $667,658 (-$9,097, -1.34% from previous year)
- 2019: $657,682 (-$9,976, -1.49% from previous year)
- 2020: N/A
- 2021: $690,906
- 2022: $787,769 (+$96,862, +14.02% from previous year)
- 2023: $808,350 (+$20,581, +2.61% from previous year)
- 2024: $869,284 (+$60,934, +7.54% from previous year)
- 2025: $937,447 (+$68,163, +7.84% from previous year)
Mettawa has seen nearly 70% appreciation since 2012, with steady growth particularly since 2021. Home values crossed the $900,000 threshold in 2025, placing this small, rural village firmly among Illinois’ highest-priced communities.
Mettawa – Quiet Luxury and Equestrian Living
Mettawa is one of Lake County’s most distinctive and exclusive enclaves, known for zoning that protects open land, horse properties, and environmental conservation. Its low density and estate-style homes make it a favorite among those who value privacy and space over commercial access.
Despite its rural feel, Mettawa is just minutes from Libertyville and Vernon Hills, giving residents access to high-end retail, forest preserves, and expressways. With few new developments and a consistent influx of affluent buyers, home prices have steadily climbed. By 2025, Mettawa offers a rare mix of rustic charm and modern luxury.
9. Barrington Hills – 72% Home Price Increase Since 2012
🔥 Would you like to save this?
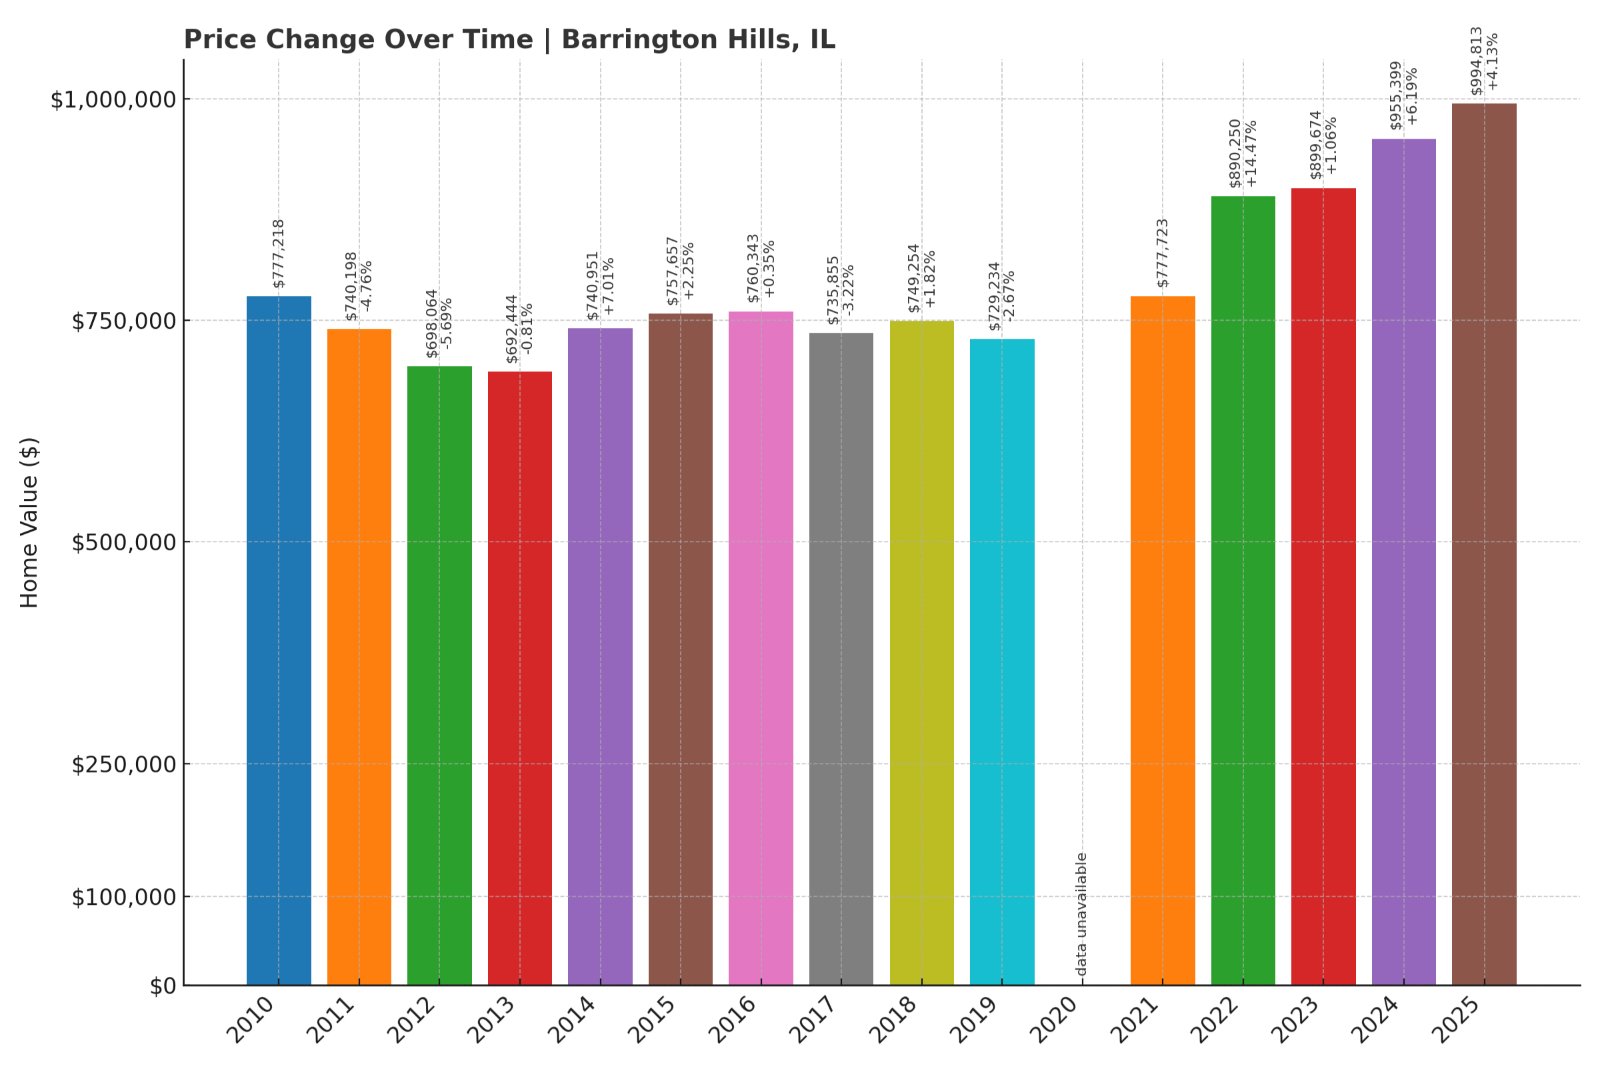
- 2010: $777,218
- 2011: $740,198 (-$37,020, -4.76% from previous year)
- 2012: $698,064 (-$42,134, -5.69% from previous year)
- 2013: $692,444 (-$5,619, -0.81% from previous year)
- 2014: $740,951 (+$48,507, +7.01% from previous year)
- 2015: $757,657 (+$16,706, +2.25% from previous year)
- 2016: $760,343 (+$2,686, +0.35% from previous year)
- 2017: $735,855 (-$24,488, -3.22% from previous year)
- 2018: $749,254 (+$13,399, +1.82% from previous year)
- 2019: $729,234 (-$20,020, -2.67% from previous year)
- 2020: N/A
- 2021: $777,723
- 2022: $890,250 (+$112,527, +14.47% from previous year)
- 2023: $899,674 (+$9,424, +1.06% from previous year)
- 2024: $955,399 (+$55,724, +6.19% from previous year)
- 2025: $994,813 (+$39,415, +4.13% from previous year)
Barrington Hills experienced a 72% rise in home values since 2012. The most significant growth has occurred since 2021, with home prices approaching $1 million by 2025. Long appreciated for its exclusivity, the market here continues to trend upward.
Barrington Hills – Expansive Estates and Equestrian Heritage
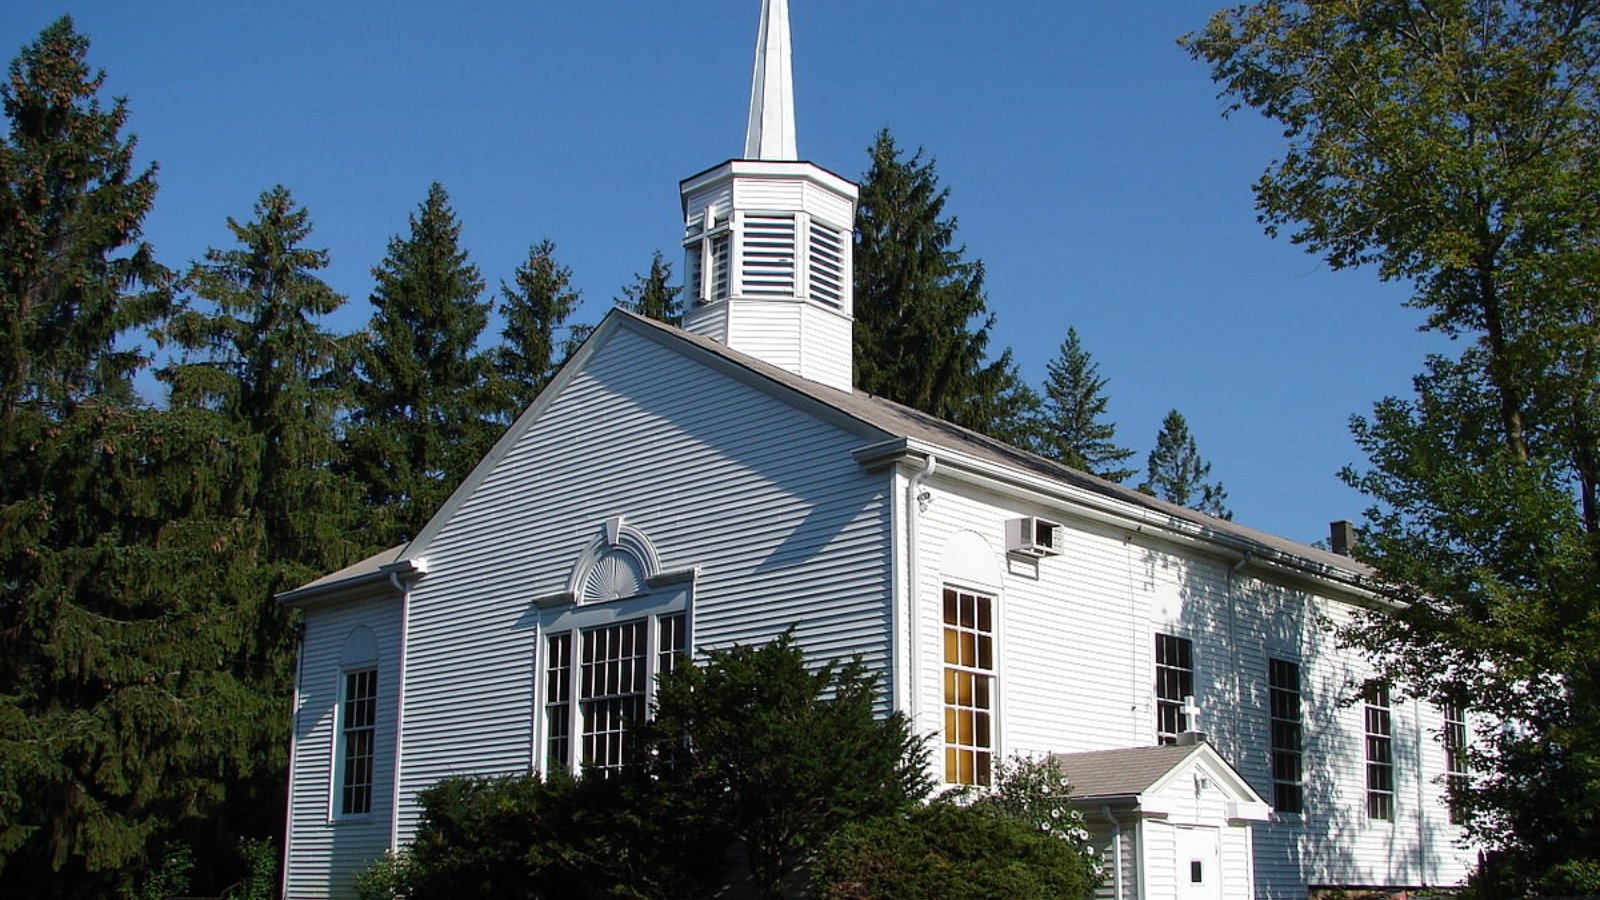
Barrington Hills is a standout for its large-acre zoning, winding roads, and country feel. With homes often sitting on 5-acre lots or more, it caters to equestrian enthusiasts and those seeking maximum privacy. It’s part of the greater Barrington area, with access to commuter rail and top-ranked schools.
Home prices remained relatively flat for years before surging as buyers prioritized space during the pandemic era. Barrington Hills also benefits from limited development and a high barrier to entry. In 2025, homes here are some of the most expensive in Illinois, driven by their size, setting, and exclusivity.
8. South Barrington – 71% Home Price Increase Since 2012

- 2010: $915,879
- 2011: $844,032 (-$71,847, -7.84% from previous year)
- 2012: $792,594 (-$51,438, -6.09% from previous year)
- 2013: $782,341 (-$10,253, -1.29% from previous year)
- 2014: $848,639 (+$66,298, +8.47% from previous year)
- 2015: $851,021 (+$2,382, +0.28% from previous year)
- 2016: $848,234 (-$2,787, -0.33% from previous year)
- 2017: $825,427 (-$22,808, -2.69% from previous year)
- 2018: $833,146 (+$7,719, +0.94% from previous year)
- 2019: $811,278 (-$21,868, -2.62% from previous year)
- 2020: N/A
- 2021: $838,351
- 2022: $954,803 (+$116,452, +13.89% from previous year)
- 2023: $989,686 (+$34,883, +3.65% from previous year)
- 2024: $1,042,632 (+$52,946, +5.35% from previous year)
- 2025: $1,092,463 (+$49,831, +4.78% from previous year)
Since 2012, South Barrington home prices have climbed 71%, breaking into seven figures by 2024. The area’s blend of modern mansions, gated neighborhoods, and proximity to shopping and highways has kept demand strong.
South Barrington – Exclusive Developments and High Demand
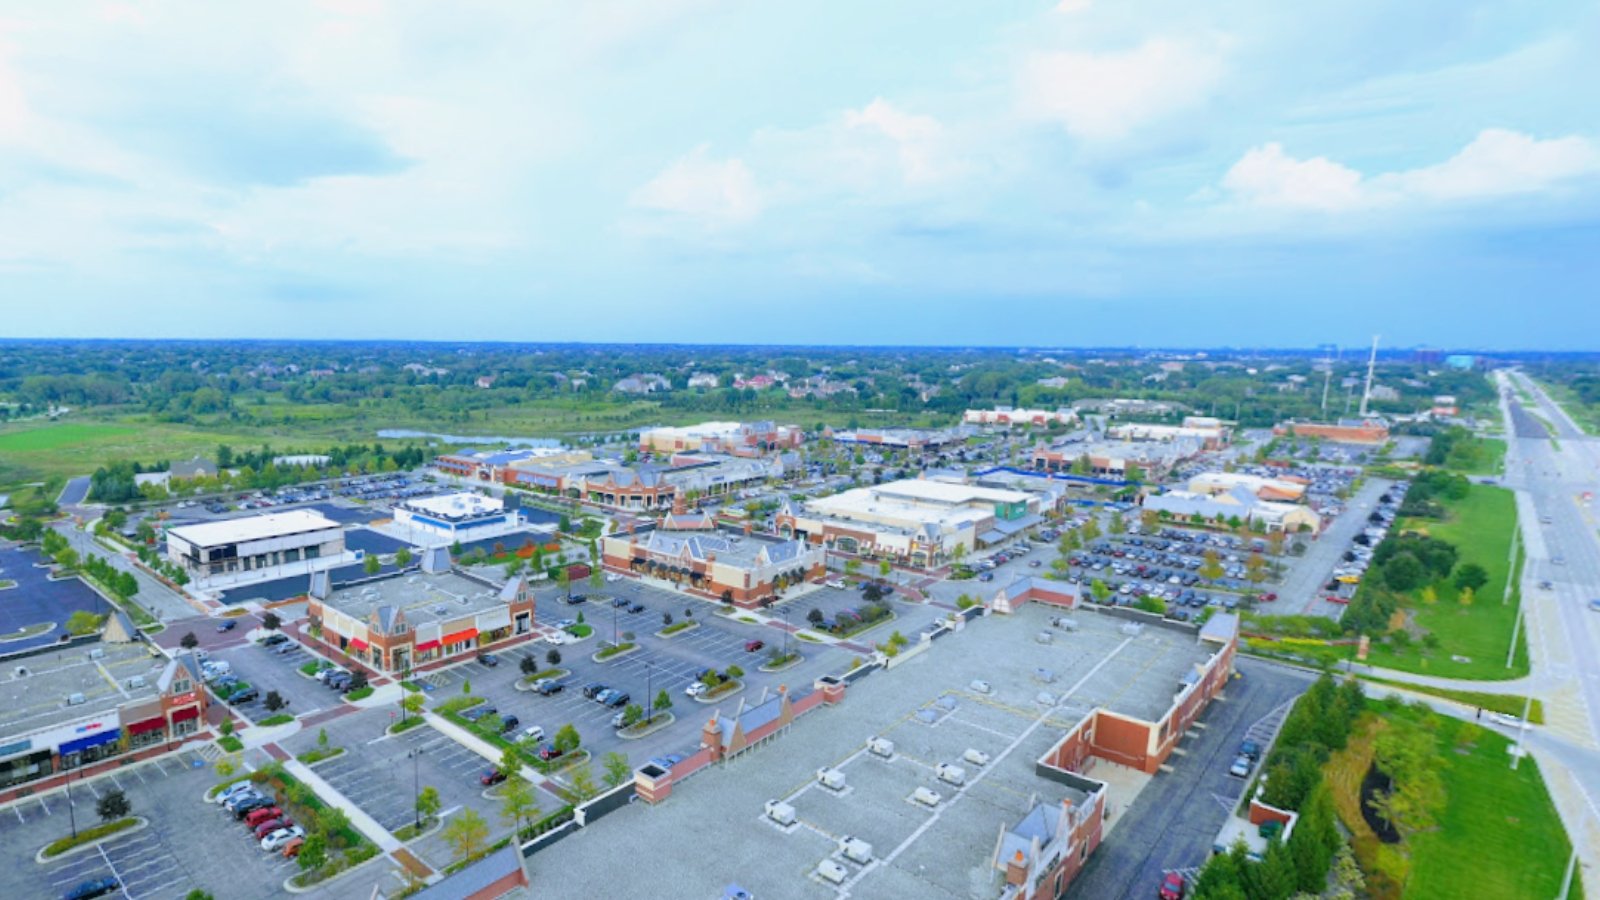
South Barrington stands out for its luxury gated communities like The Woods of South Barrington and Hidden Lakes. It’s also adjacent to The Arboretum lifestyle center and located near I-90, offering easy access to both Chicago and O’Hare Airport.
The area features custom homes on expansive lots, many built within the last 20 years. With strong school districts and prestige appeal, South Barrington remains a magnet for executive-level buyers and upwardly mobile families. By 2025, homes regularly exceed $1 million in value, reflecting the town’s upscale trajectory.
7. Lake Forest – 63% Home Price Increase Since 2012
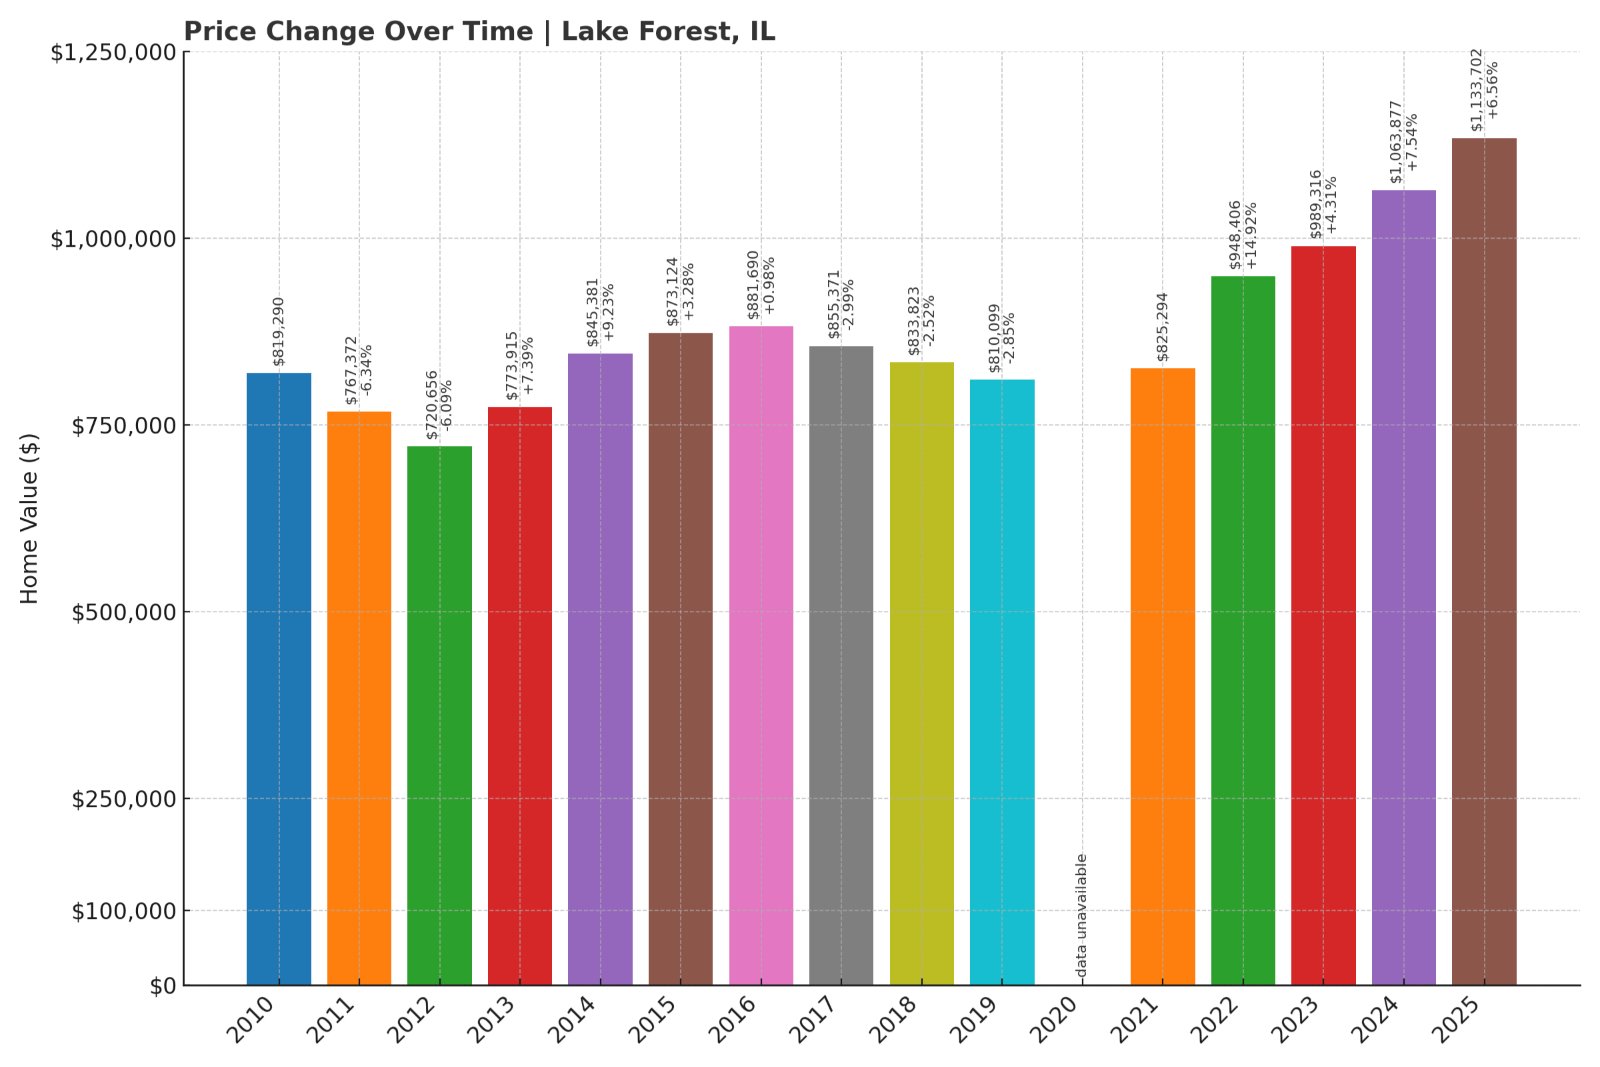
- 2010: $819,290
- 2011: $767,372 (-$51,918, -6.34% from previous year)
- 2012: $720,656 (-$46,716, -6.09% from previous year)
- 2013: $773,915 (+$53,259, +7.39% from previous year)
- 2014: $845,381 (+$71,467, +9.23% from previous year)
- 2015: $873,124 (+$27,743, +3.28% from previous year)
- 2016: $881,690 (+$8,566, +0.98% from previous year)
- 2017: $855,371 (-$26,319, -2.99% from previous year)
- 2018: $833,823 (-$21,548, -2.52% from previous year)
- 2019: $810,099 (-$23,724, -2.85% from previous year)
- 2020: N/A
- 2021: $825,294
- 2022: $948,406 (+$123,112, +14.92% from previous year)
- 2023: $989,316 (+$40,910, +4.31% from previous year)
- 2024: $1,063,877 (+$74,561, +7.54% from previous year)
- 2025: $1,133,702 (+$69,825, +6.56% from previous year)
Lake Forest’s home values have increased by 63% since 2012, with the largest gains coming post-2021. Prices topped $1.1 million in 2025, cementing the town’s place among Illinois’ most elite housing markets.
Lake Forest – Historic Grandeur Meets Coastal Calm

Lake Forest is a jewel of the North Shore, known for its tree-lined streets, historic estates, and dramatic Lake Michigan shoreline. The town is steeped in old money prestige, with gated mansions, prestigious schools like Lake Forest Academy, and cultural landmarks like Market Square.
Lake Forest’s home values dipped in the late 2010s but rebounded strongly as buyers rediscovered its spacious, historic homes and open access to lakefront trails. The town’s Metra service and charming downtown make it highly livable, while its deep roots in Chicago’s industrial past lend it a timeless appeal.
6. Hinsdale – 61% Home Price Increase Since 2012
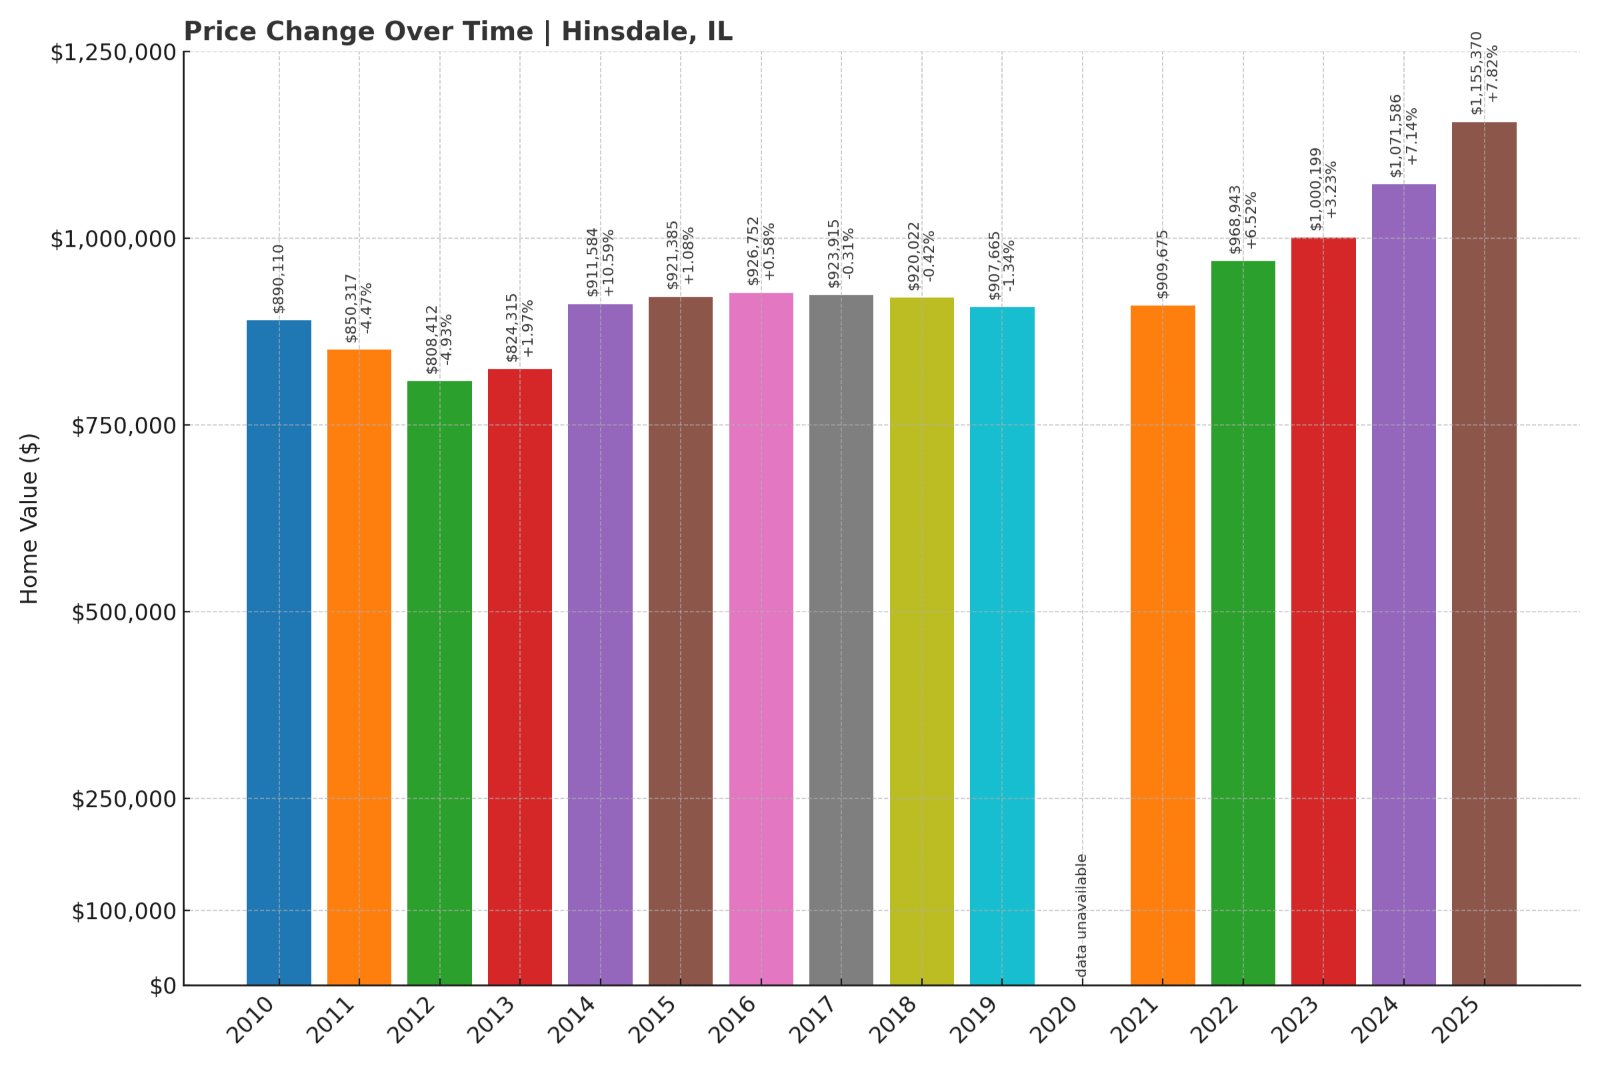
- 2010: $890,110
- 2011: $850,317 (-$39,793, -4.47% from previous year)
- 2012: $808,412 (-$41,905, -4.93% from previous year)
- 2013: $824,315 (+$15,902, +1.97% from previous year)
- 2014: $911,584 (+$87,270, +10.59% from previous year)
- 2015: $921,385 (+$9,801, +1.08% from previous year)
- 2016: $926,752 (+$5,367, +0.58% from previous year)
- 2017: $923,915 (-$2,837, -0.31% from previous year)
- 2018: $920,022 (-$3,893, -0.42% from previous year)
- 2019: $907,665 (-$12,357, -1.34% from previous year)
- 2020: N/A
- 2021: $909,675
- 2022: $968,943 (+$59,267, +6.52% from previous year)
- 2023: $1,000,199 (+$31,256, +3.23% from previous year)
- 2024: $1,071,586 (+$71,387, +7.14% from previous year)
- 2025: $1,155,370 (+$83,784, +7.82% from previous year)
Hinsdale’s home prices rose 61% since 2012, with a particularly strong surge from 2021 through 2025. The town’s mix of excellent schools, walkable downtown, and historic homes continues to drive strong demand.
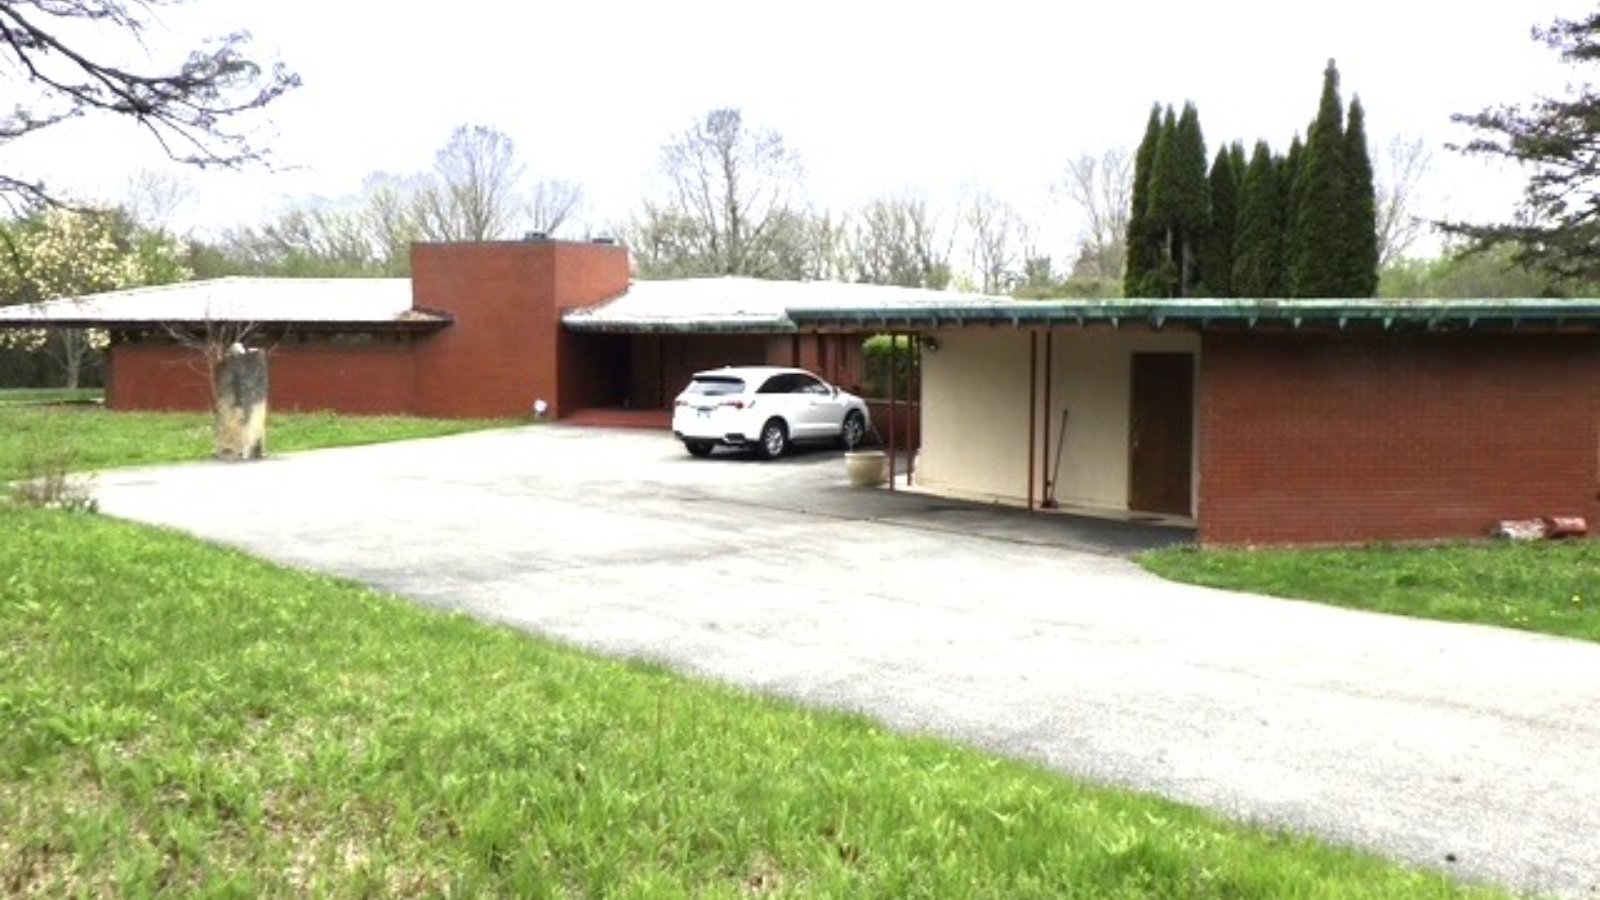
Hinsdale – Top Schools and Timeless Architecture
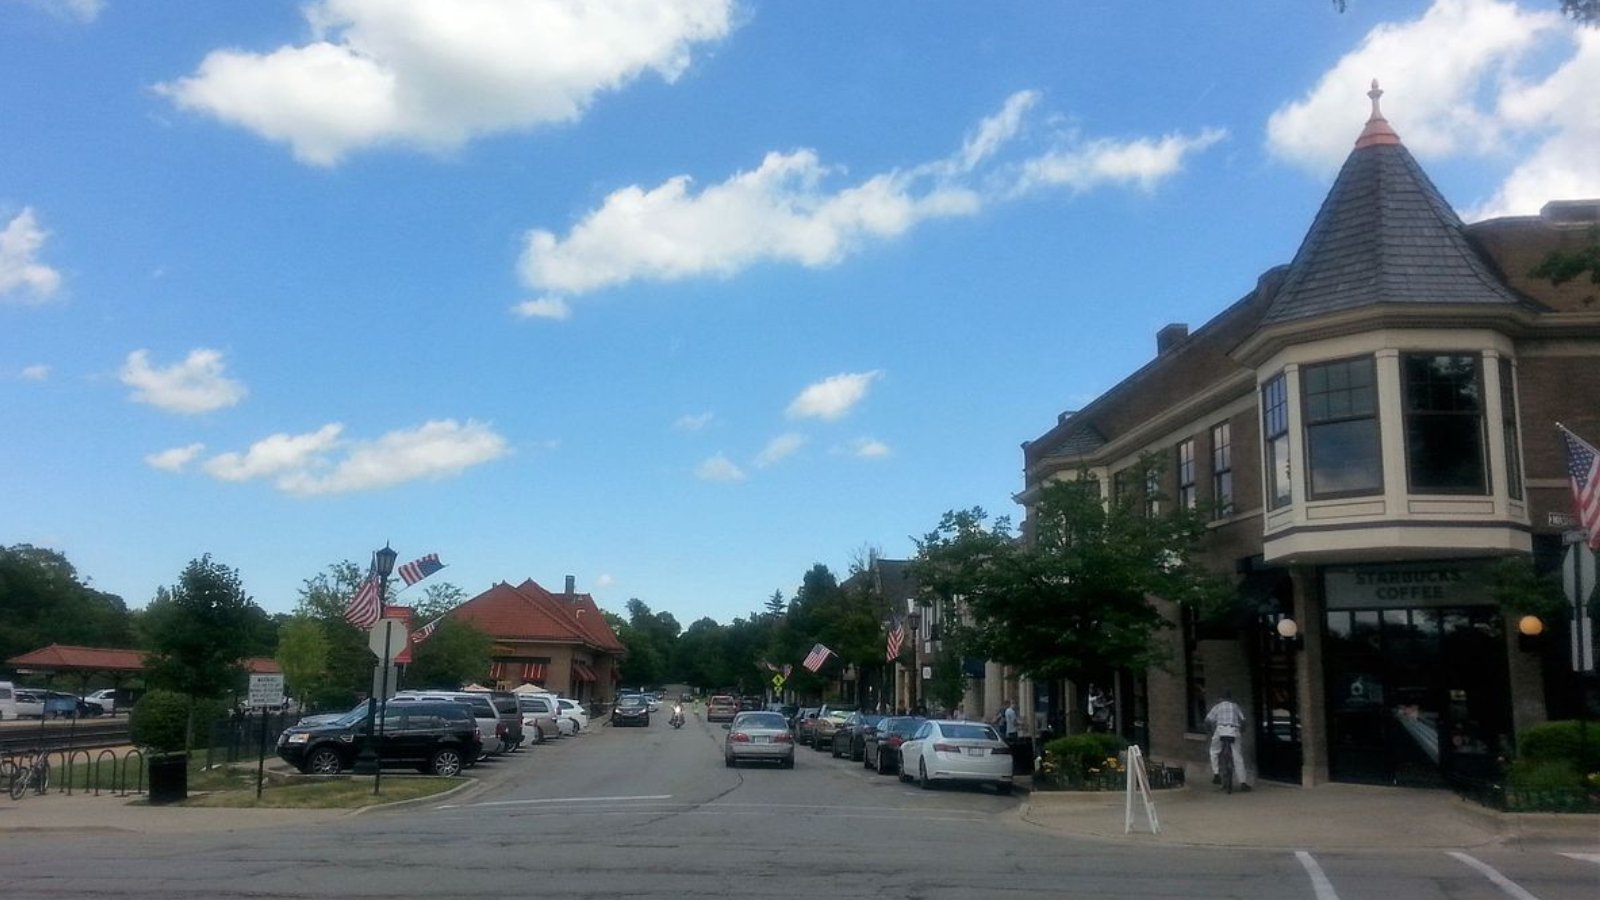
Hinsdale is one of DuPage County’s most prestigious suburbs, known for its charming downtown, stately homes, and consistently high-performing schools. Located on the BNSF Metra line, it’s a preferred location for Chicago commuters seeking a suburban lifestyle with urban convenience.
Homes here range from Queen Anne Victorians to newly built luxury properties, with many situated on quiet, tree-lined streets. The district’s schools rank among the best in Illinois, and the community is known for civic pride and an active social calendar. By 2025, the average price has exceeded $1.15 million.
5. Golf – 78% Home Price Increase Since 2012

- 2010: $767,161
- 2011: $669,464 (-$97,697, -12.73% from previous year)
- 2012: $658,586 (-$10,878, -1.62% from previous year)
- 2013: $719,041 (+$60,455, +9.18% from previous year)
- 2014: $789,748 (+$70,707, +9.83% from previous year)
- 2015: $836,031 (+$46,283, +5.86% from previous year)
- 2016: $830,445 (-$5,586, -0.67% from previous year)
- 2017: $827,349 (-$3,097, -0.37% from previous year)
- 2018: $855,929 (+$28,580, +3.45% from previous year)
- 2019: $848,168 (-$7,761, -0.91% from previous year)
- 2020: N/A
- 2021: $895,011
- 2022: $1,032,664 (+$137,653, +15.38% from previous year)
- 2023: $1,039,026 (+$6,362, +0.62% from previous year)
- 2024: $1,115,953 (+$76,928, +7.40% from previous year)
- 2025: $1,174,798 (+$58,845, +5.27% from previous year)
Golf has seen an impressive 78% increase in home prices since 2012. Though it’s one of the smallest communities in Illinois, the village’s prestige and convenience have consistently fueled property values over the years.
Golf – Tiny Town with Big Value
🔥 Would you like to save this?
With fewer than 600 residents, Golf is an exclusive enclave nestled within the North Shore. It takes its name from the nearby Glen View Club and offers a peaceful, private setting within minutes of major amenities in Glenview and Skokie.
The village is served by top-rated schools, a private police force, and its own Metra station. Its residential zoning and compact layout make Golf one of the most tightly held markets in the state. In 2025, prices reflect that exclusivity—now averaging well over $1.17 million.
4. Bannockburn – 108% Home Price Increase Since 2012

- 2010: $883,171
- 2011: $822,314 (-$60,857, -6.89% from previous year)
- 2012: $800,926 (-$21,388, -2.60% from previous year)
- 2013: $873,187 (+$72,261, +9.02% from previous year)
- 2014: $920,479 (+$47,292, +5.42% from previous year)
- 2015: $930,426 (+$9,948, +1.08% from previous year)
- 2016: $973,056 (+$42,630, +4.58% from previous year)
- 2017: $906,937 (-$66,120, -6.80% from previous year)
- 2018: $869,456 (-$37,481, -4.13% from previous year)
- 2019: $846,027 (-$23,429, -2.69% from previous year)
- 2020: N/A
- 2021: $876,605
- 2022: $976,423 (+$99,818, +11.39% from previous year)
- 2023: $1,028,177 (+$51,754, +5.30% from previous year)
- 2024: $1,115,196 (+$87,019, +8.46% from previous year)
- 2025: $1,211,757 (+$96,561, +8.66% from previous year)
Bannockburn has more than doubled in home value since 2012. Prices accelerated quickly between 2021 and 2025, driven by large-lot homes, exclusivity, and natural beauty. In 2025, prices now average over $1.2 million.
Bannockburn – Elite Estate Living
With a reputation for large homes on even larger lots, Bannockburn is among the most luxurious communities on the North Shore. The village emphasizes a rural aesthetic, with zoning laws that restrict commercial development and preserve natural space.
Located near Deerfield, Bannockburn is served by top-tier public schools and private options like Bannockburn School District 106. The area’s quiet prestige and tight inventory have supported some of the state’s strongest price appreciation over the past decade.
3. Glencoe – 72% Home Price Increase Since 2012
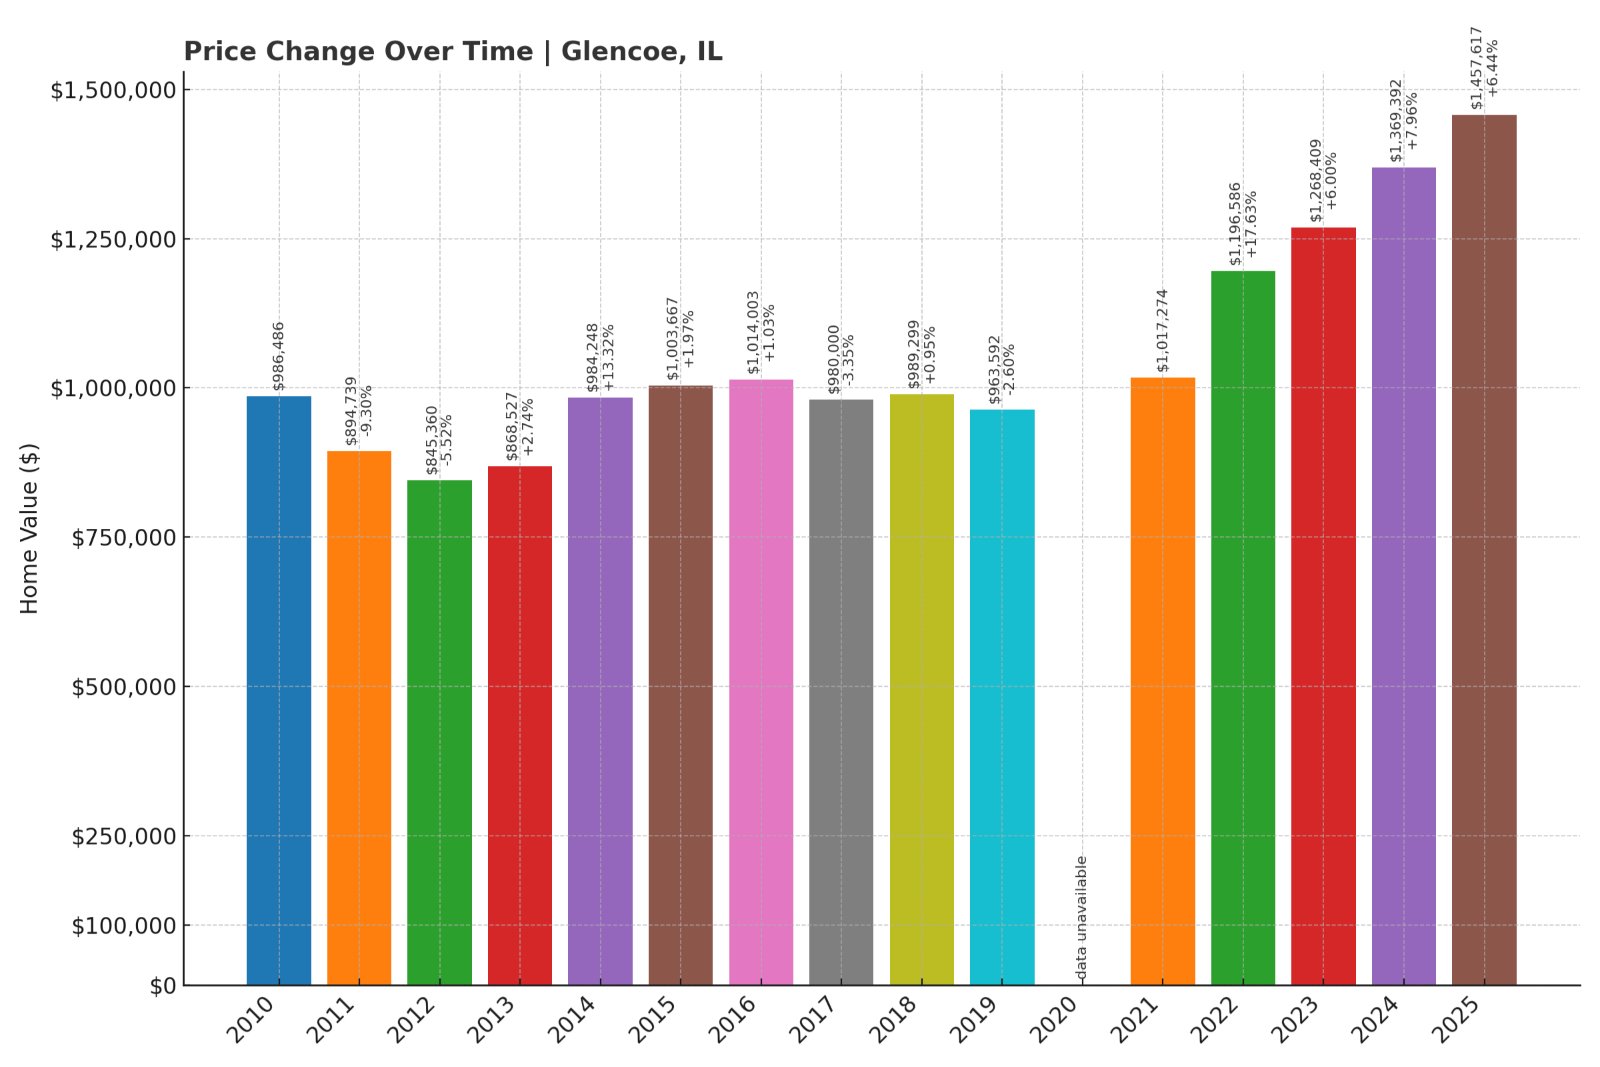
- 2010: $986,486
- 2011: $894,739 (-$91,747, -9.30% from previous year)
- 2012: $845,360 (-$49,379, -5.52% from previous year)
- 2013: $868,527 (+$23,167, +2.74% from previous year)
- 2014: $984,248 (+$115,720, +13.32% from previous year)
- 2015: $1,003,667 (+$19,420, +1.97% from previous year)
- 2016: $1,014,003 (+$10,336, +1.03% from previous year)
- 2017: $980,000 (-$34,004, -3.35% from previous year)
- 2018: $989,299 (+$9,299, +0.95% from previous year)
- 2019: $963,592 (-$25,707, -2.60% from previous year)
- 2020: N/A
- 2021: $1,017,274
- 2022: $1,196,586 (+$179,312, +17.63% from previous year)
- 2023: $1,268,409 (+$71,824, +6.00% from previous year)
- 2024: $1,369,392 (+$100,983, +7.96% from previous year)
- 2025: $1,457,617 (+$88,224, +6.44% from previous year)
Glencoe has seen a 72% increase in home prices since 2012, with consistent growth placing it among the most desirable North Shore towns. Home prices now exceed $1.45 million in 2025.
Glencoe – Prestigious and Beautifully Situated
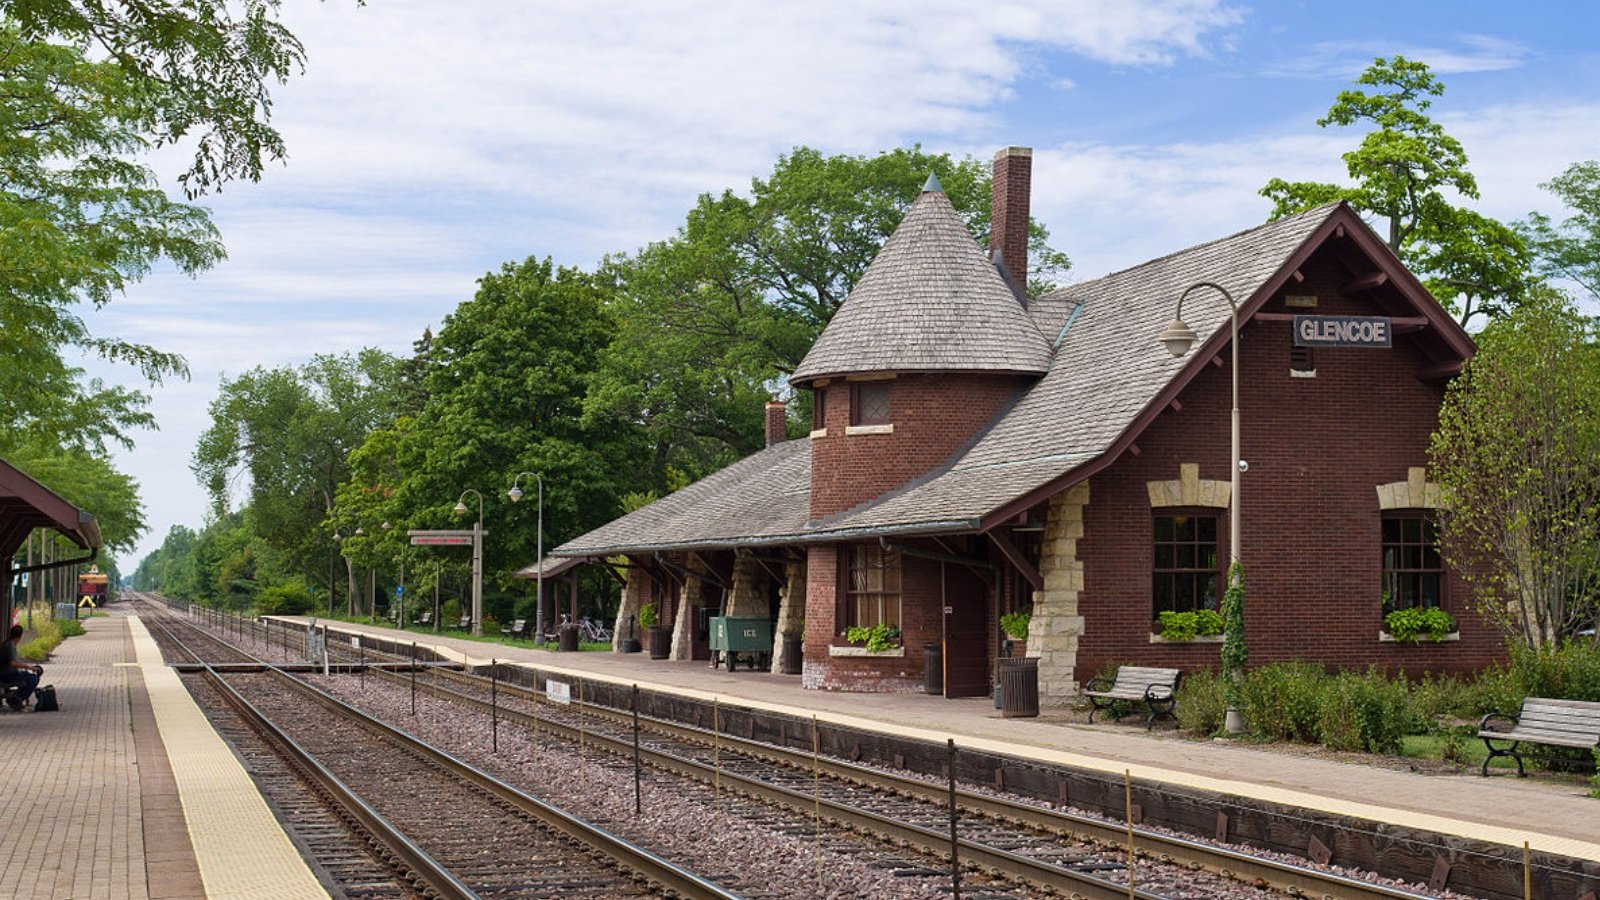
Glencoe is one of the crown jewels of Chicago’s North Shore. Its lakefront location, walkable village center, and outstanding schools make it perennially attractive to luxury buyers. Highlights include Writers Theatre, the Chicago Botanic Garden, and architecturally rich neighborhoods.
Its tight inventory, historic homes, and access to express trains into Chicago have all contributed to steady appreciation. Home values have surged particularly in the past four years, making Glencoe one of the most expensive towns in the Midwest.
2. Winnetka – 59% Home Price Increase Since 2012
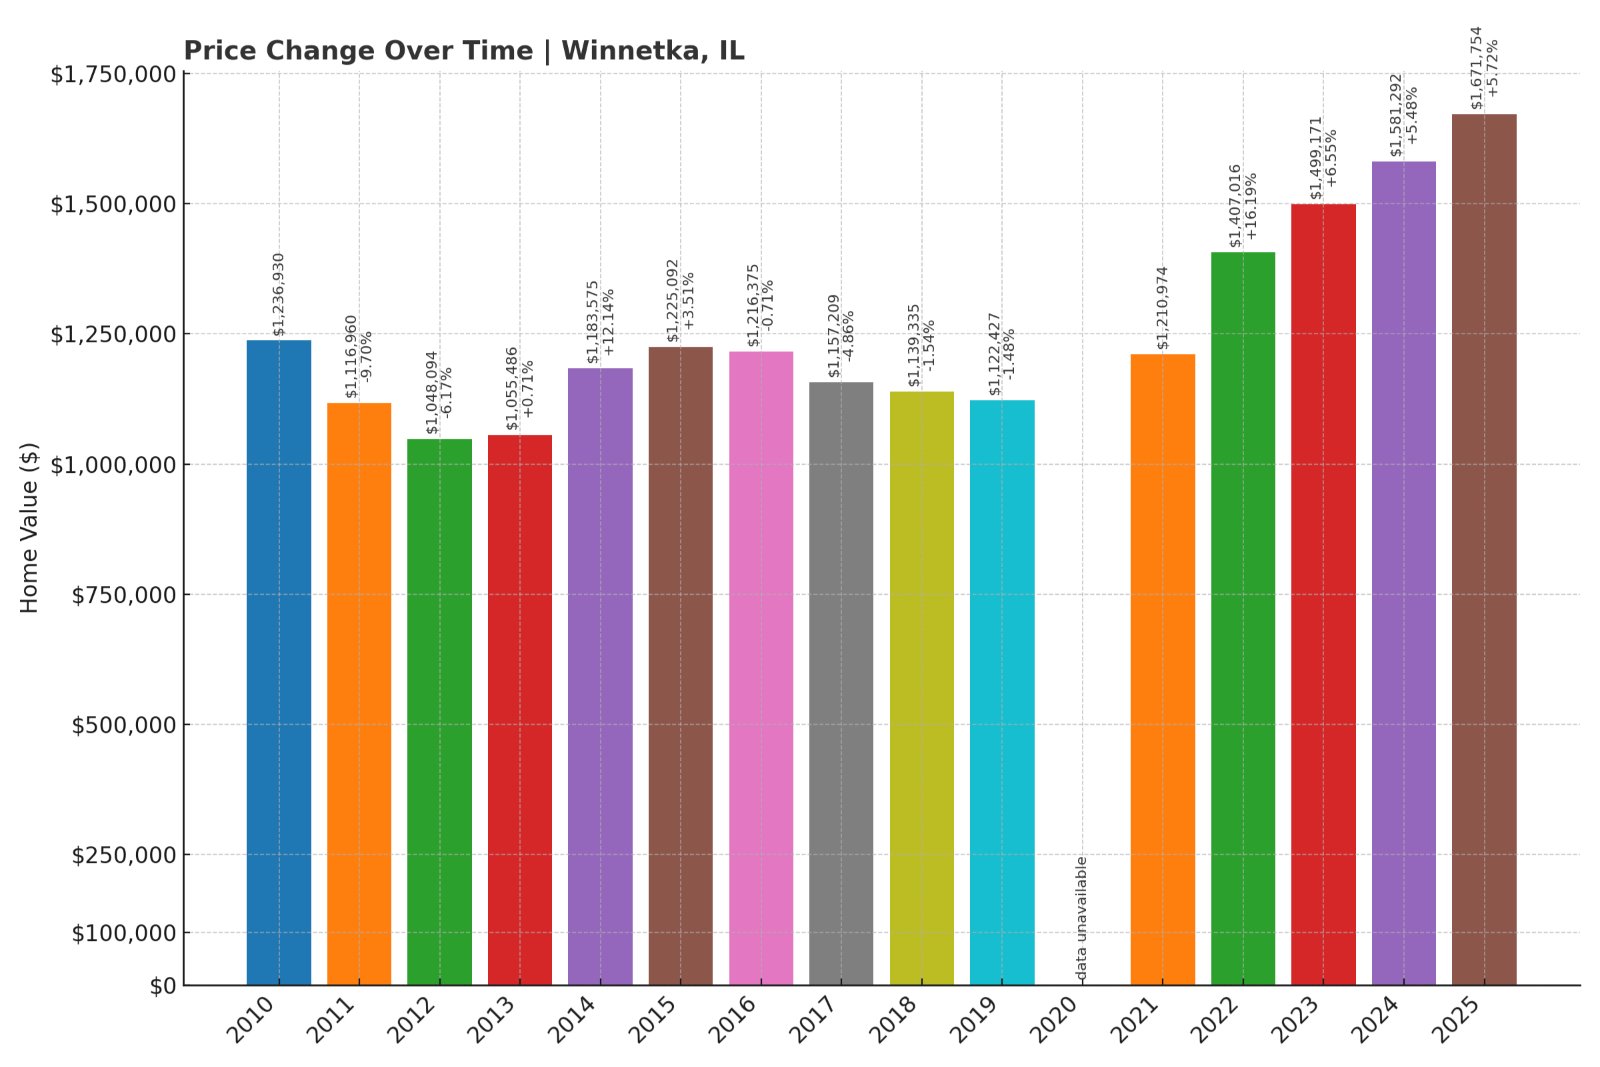
- 2010: $1,236,930
- 2011: $1,116,960 (-$119,970, -9.70% from previous year)
- 2012: $1,048,094 (-$68,866, -6.17% from previous year)
- 2013: $1,055,486 (+$7,392, +0.71% from previous year)
- 2014: $1,183,575 (+$128,089, +12.14% from previous year)
- 2015: $1,225,092 (+$41,517, +3.51% from previous year)
- 2016: $1,216,375 (-$8,717, -0.71% from previous year)
- 2017: $1,157,209 (-$59,166, -4.86% from previous year)
- 2018: $1,139,335 (-$17,874, -1.54% from previous year)
- 2019: $1,122,427 (-$16,908, -1.48% from previous year)
- 2020: N/A
- 2021: $1,210,974
- 2022: $1,407,016 (+$196,041, +16.19% from previous year)
- 2023: $1,499,171 (+$92,156, +6.55% from previous year)
- 2024: $1,581,292 (+$82,121, +5.48% from previous year)
- 2025: $1,671,754 (+$90,461, +5.72% from previous year)
Winnetka’s home prices have grown 59% since 2012, passing $1.67 million in 2025. The town remains a symbol of affluence and architectural charm on the North Shore.
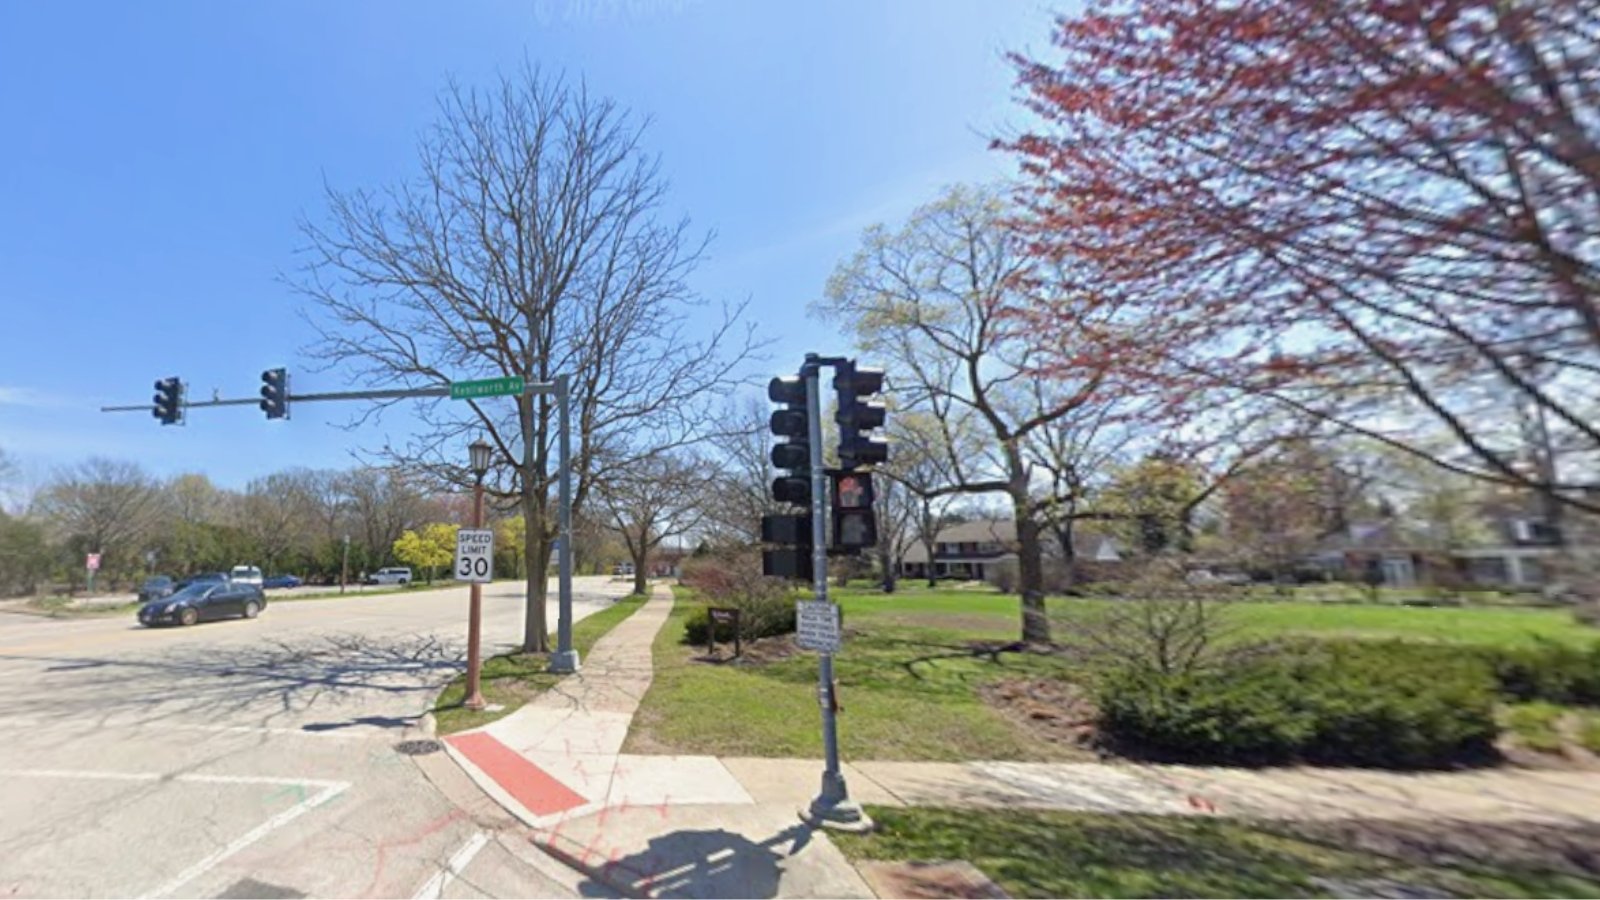
Winnetka – Iconic and Timeless

Few suburbs match Winnetka’s reputation. With grand homes, lakefront parks, and one of the best public high schools in the nation—New Trier—it’s a magnet for Chicago’s wealthiest families. The community is deeply rooted, with preservation ordinances protecting its early 20th-century character.
Winnetka’s elegant homes and manicured landscapes keep demand high. With rising remote work, more buyers have opted for its unmatched lifestyle, pushing home prices ever higher in recent years.
1. Kenilworth – 54% Home Price Increase Since 2012

- 2010: $1,393,542
- 2011: $1,271,541 (-$122,001, -8.75% from previous year)
- 2012: $1,212,010 (-$59,531, -4.68% from previous year)
- 2013: $1,214,681 (+$2,671, +0.22% from previous year)
- 2014: $1,321,000 (+$106,319, +8.75% from previous year)
- 2015: $1,315,618 (-$5,382, -0.41% from previous year)
- 2016: $1,369,473 (+$53,855, +4.09% from previous year)
- 2017: $1,251,212 (-$118,261, -8.64% from previous year)
- 2018: $1,238,652 (-$12,560, -1.00% from previous year)
- 2019: $1,233,423 (-$5,229, -0.42% from previous year)
- 2020: N/A
- 2021: $1,346,840
- 2022: $1,578,698 (+$231,858, +17.21% from previous year)
- 2023: $1,714,944 (+$136,246, +8.63% from previous year)
- 2024: $1,772,267 (+$57,324, +3.34% from previous year)
- 2025: $1,870,360 (+$98,092, +5.53% from previous year)
Kenilworth’s home values have risen by 54% since 2012. With 2025 prices topping $1.87 million, it stands as Illinois’ most expensive town.
Kenilworth – Elite and Unchanging
Kenilworth is one of the smallest and most exclusive towns in Illinois. Just a few streets wide, this lakefront village is known for historic mansions, manicured lawns, and a tight-knit, wealthy community. It also has its own Metra stop and a renowned public school system, including Joseph Sears School.
While the town saw price corrections during the 2010s, demand roared back post-2020. Kenilworth’s limited housing stock and sheer prestige keep prices climbing. In 2025, it comfortably holds the title of Illinois’ priciest housing market.


