🔥 Would you like to save this?
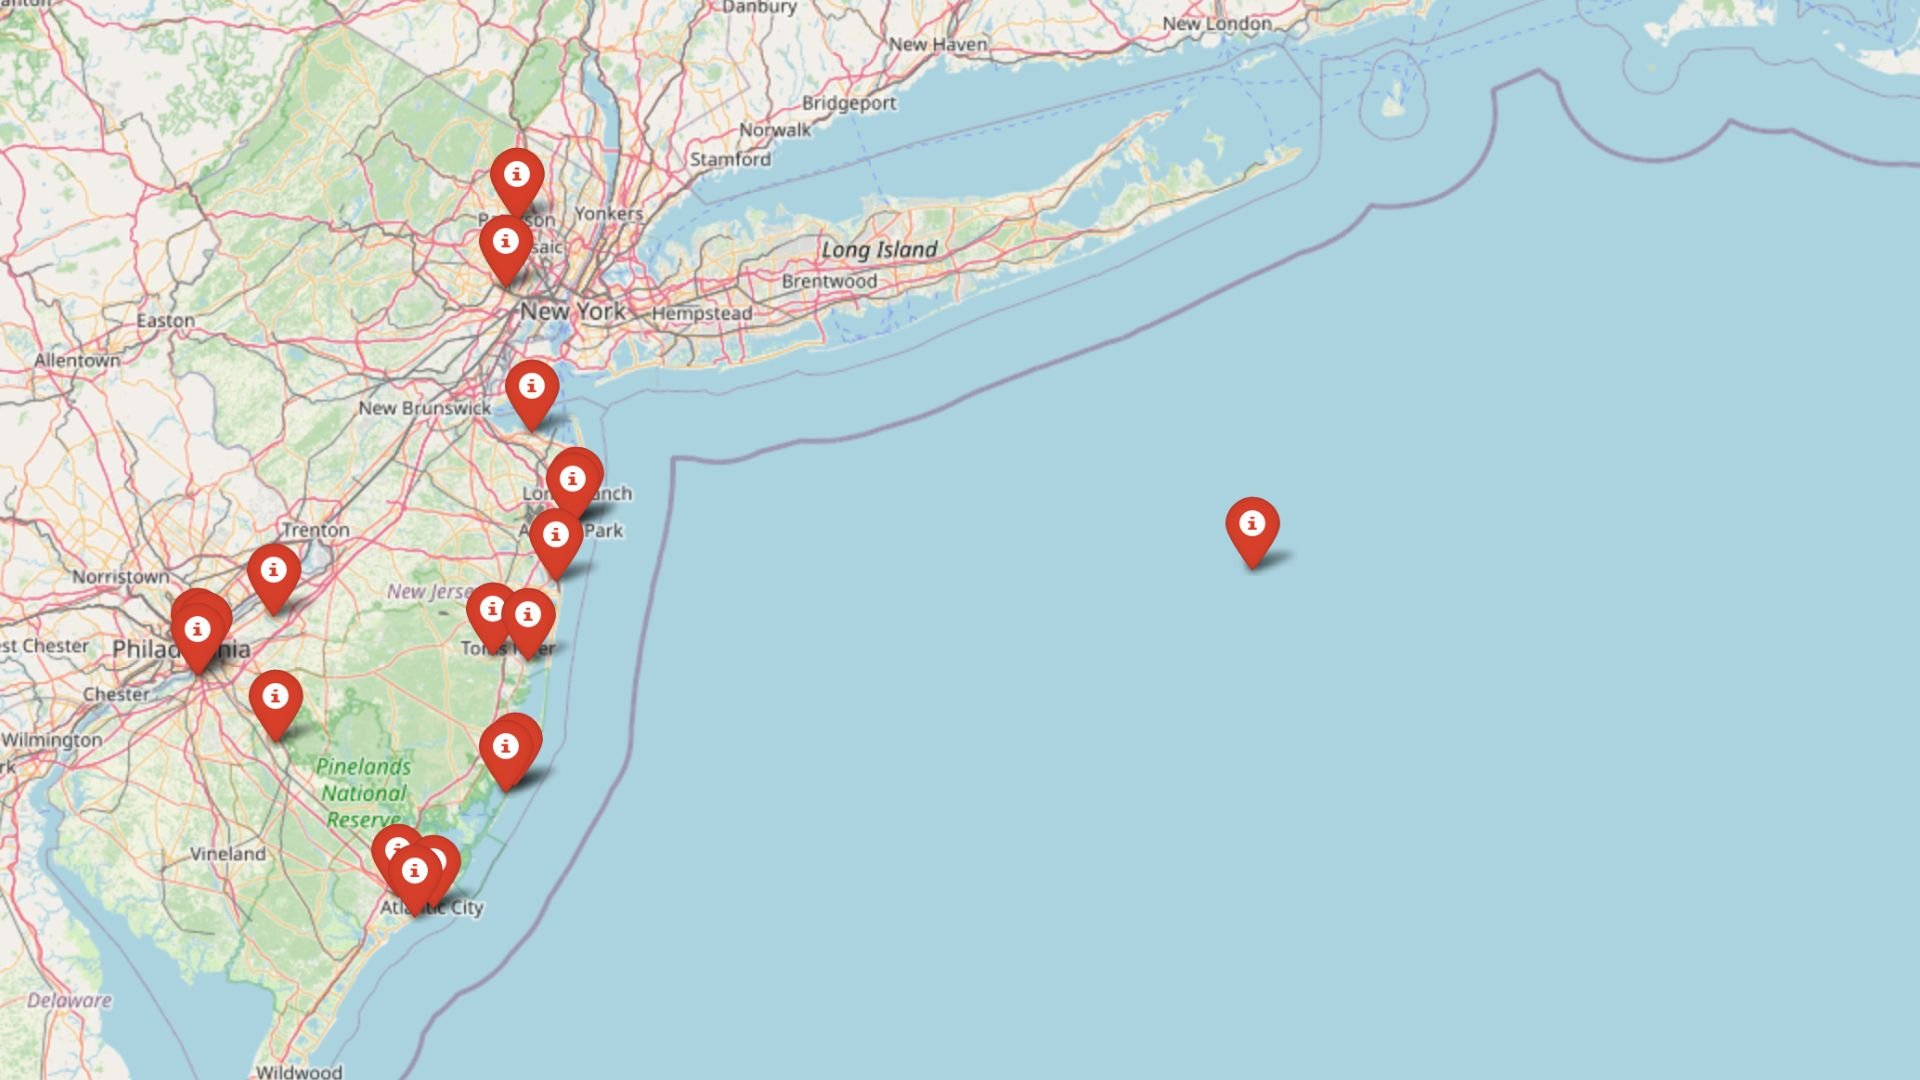
New Jersey’s housing market may still be riding high—but the numbers tell a different story beneath the surface. According to 15 years of Zillow Home Value Index data, 19 towns across the state are showing the same warning signs that have preceded past price crashes: overvaluation, volatility, and momentum loss. Some, like Woodlynne and Deal, are stretched so far beyond historical norms that a correction isn’t just possible—it’s likely. Whether driven by hype, speculation, or blind momentum, these markets may be due for a reckoning.
19. Paterson – Crash Risk Percentage: 84%
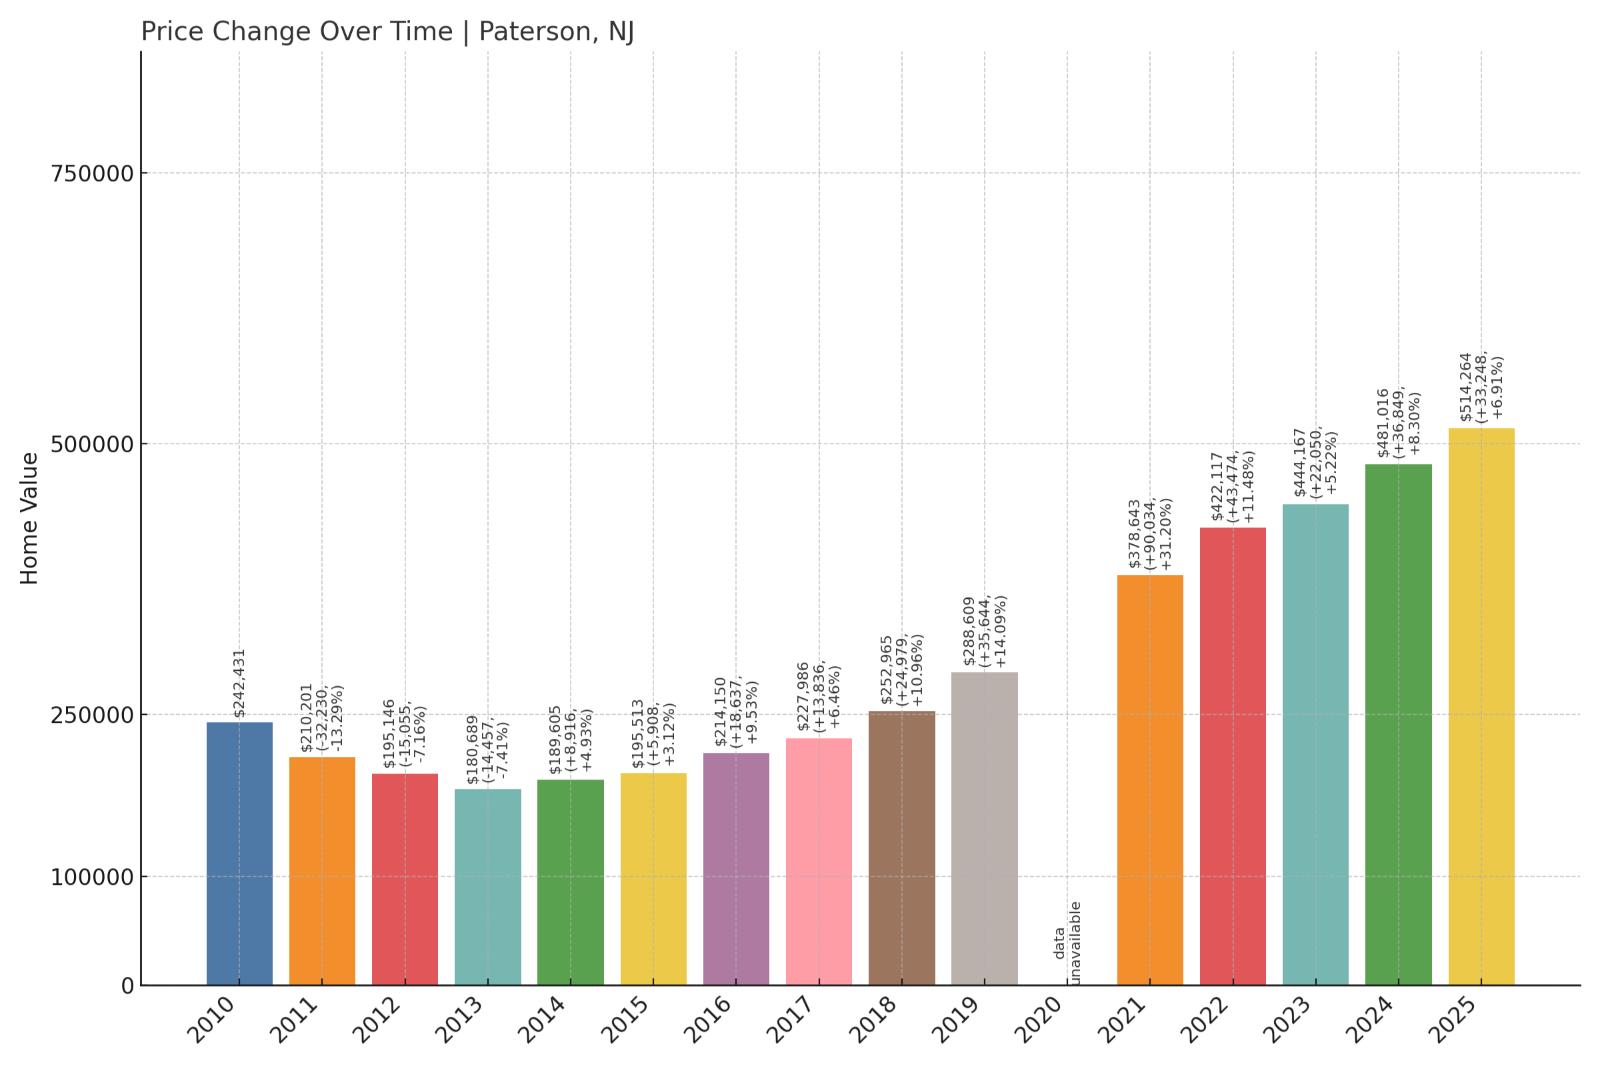
- Crash Risk Percentage: 84%
- Historical crashes (8%+ drops): 3
- Worst historical crash: -14.8% (2009)
- Total price increase since 2000: 254.9%
- Overextended above long-term average: 85.8%
- Price volatility (annual swings): 6.0%
- Current 2025 price: $514,264
Paterson’s crash risk stems from a dangerous combination of historical vulnerability and current overextension. The city has experienced three significant price drops of 8% or more since 2000, including a devastating 14.8% crash during the 2009 financial crisis. Now sitting 85.8% above its long-term pricing average, Paterson shows classic signs of an overheated market primed for correction.
In order to come up with the very specific design ideas, we create most designs with the assistance of state-of-the-art AI interior design software. Also, assume links that take you off the site are affiliate links such as links to Amazon. this means we may earn a commission if you buy something.
Paterson – Industrial Legacy Meets Modern Housing Pressures

Located in Passaic County in northern New Jersey, Paterson represents a complex housing market shaped by its industrial heritage and proximity to New York City. The city’s population of 154,538 has declined by 3% since 2020, creating downward pressure on housing demand even as prices have surged. With a median household income of just $53,766 and a poverty rate of 20.9%, the current median price of $514,264 represents a significant affordability crisis that makes the market vulnerable to correction.
The city’s economic fundamentals raise serious concerns about price sustainability. Paterson’s unemployment rate of 5.6% is more than double the state rate of 2.7%, while residents earn far less than workers commuting into the city from elsewhere. Over 61% of housing units were built before 1960, requiring substantial maintenance costs that strain household budgets. Combined with the city’s history of three major price crashes and current 85.8% overextension above historical norms, Paterson appears mathematically positioned for another significant correction.
18. Long Beach Township – Crash Risk Percentage: 85%
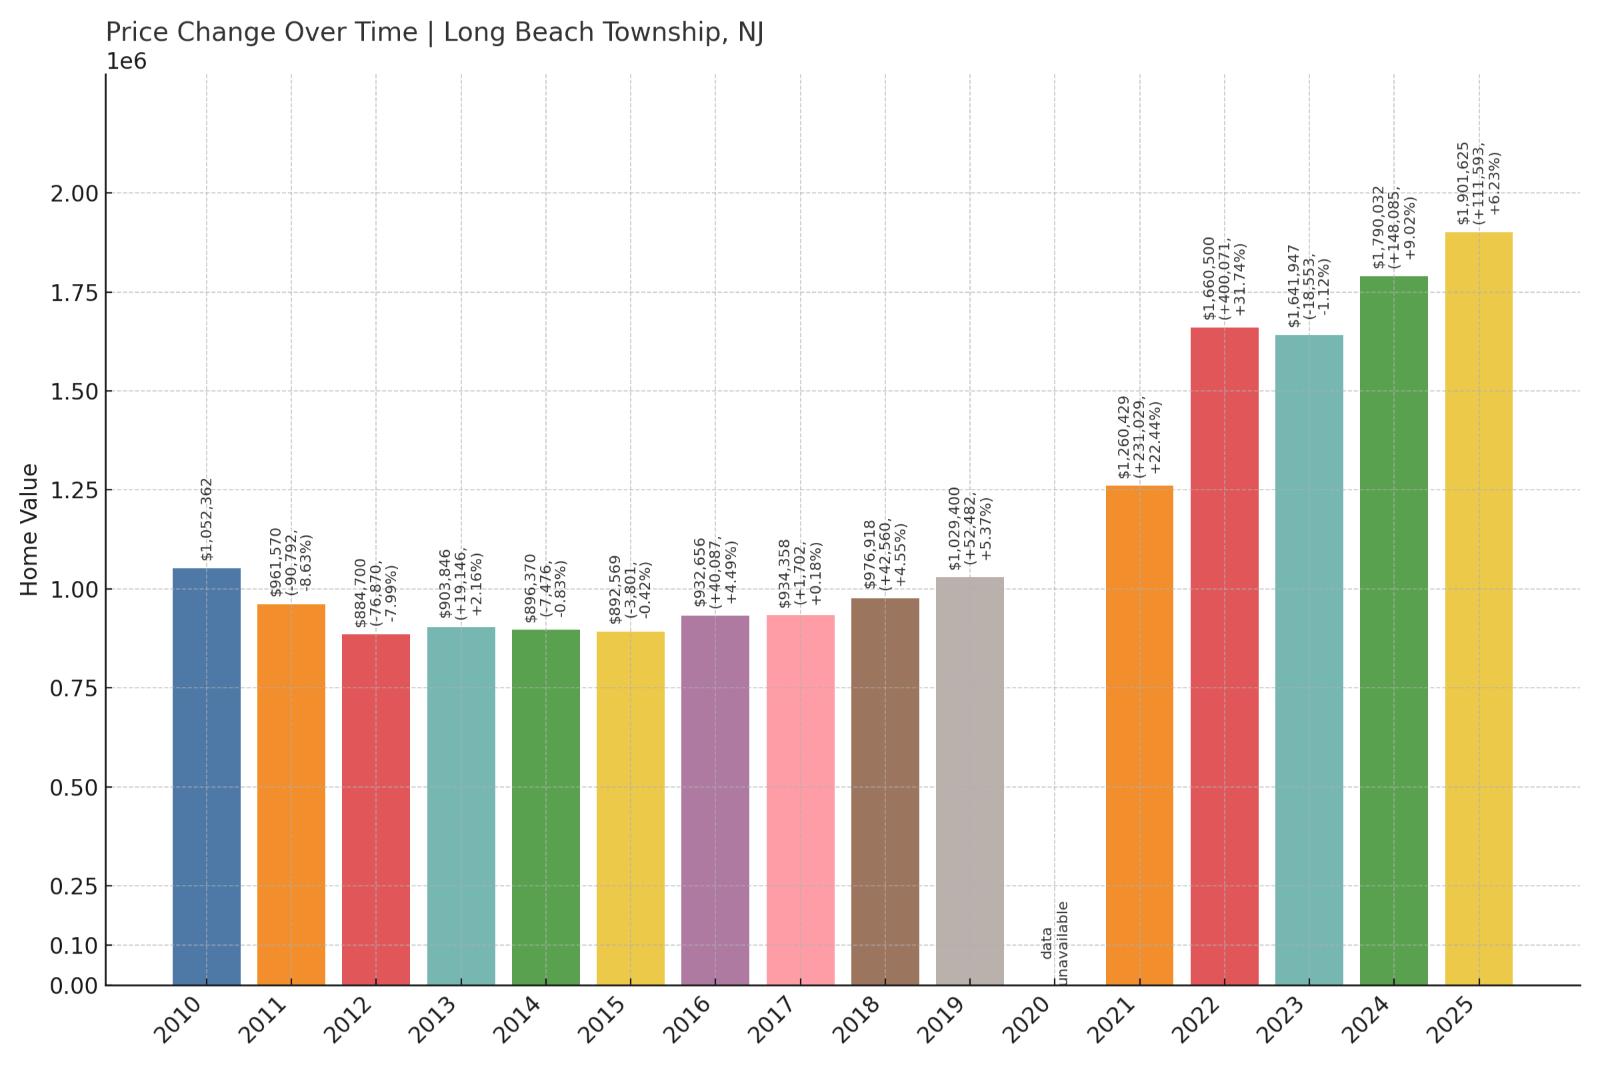
- Crash Risk Percentage: 85%
- Historical crashes (8%+ drops): 2
- Worst historical crash: -16.7% (2009)
- Total price increase since 2000: 299.6%
- Overextended above long-term average: 75.2%
- Price volatility (annual swings): 8.9%
- Current 2025 price: $1,901,625
Long Beach Township’s nearly $1.9 million median price represents dangerous territory for a coastal community that crashed 16.7% in 2009. The township’s 299.6% price growth since 2000 has pushed values 75.2% above sustainable levels, while 8.9% annual volatility indicates an unstable market prone to dramatic swings.
Long Beach Township – Coastal Premium Meets Correction Risk
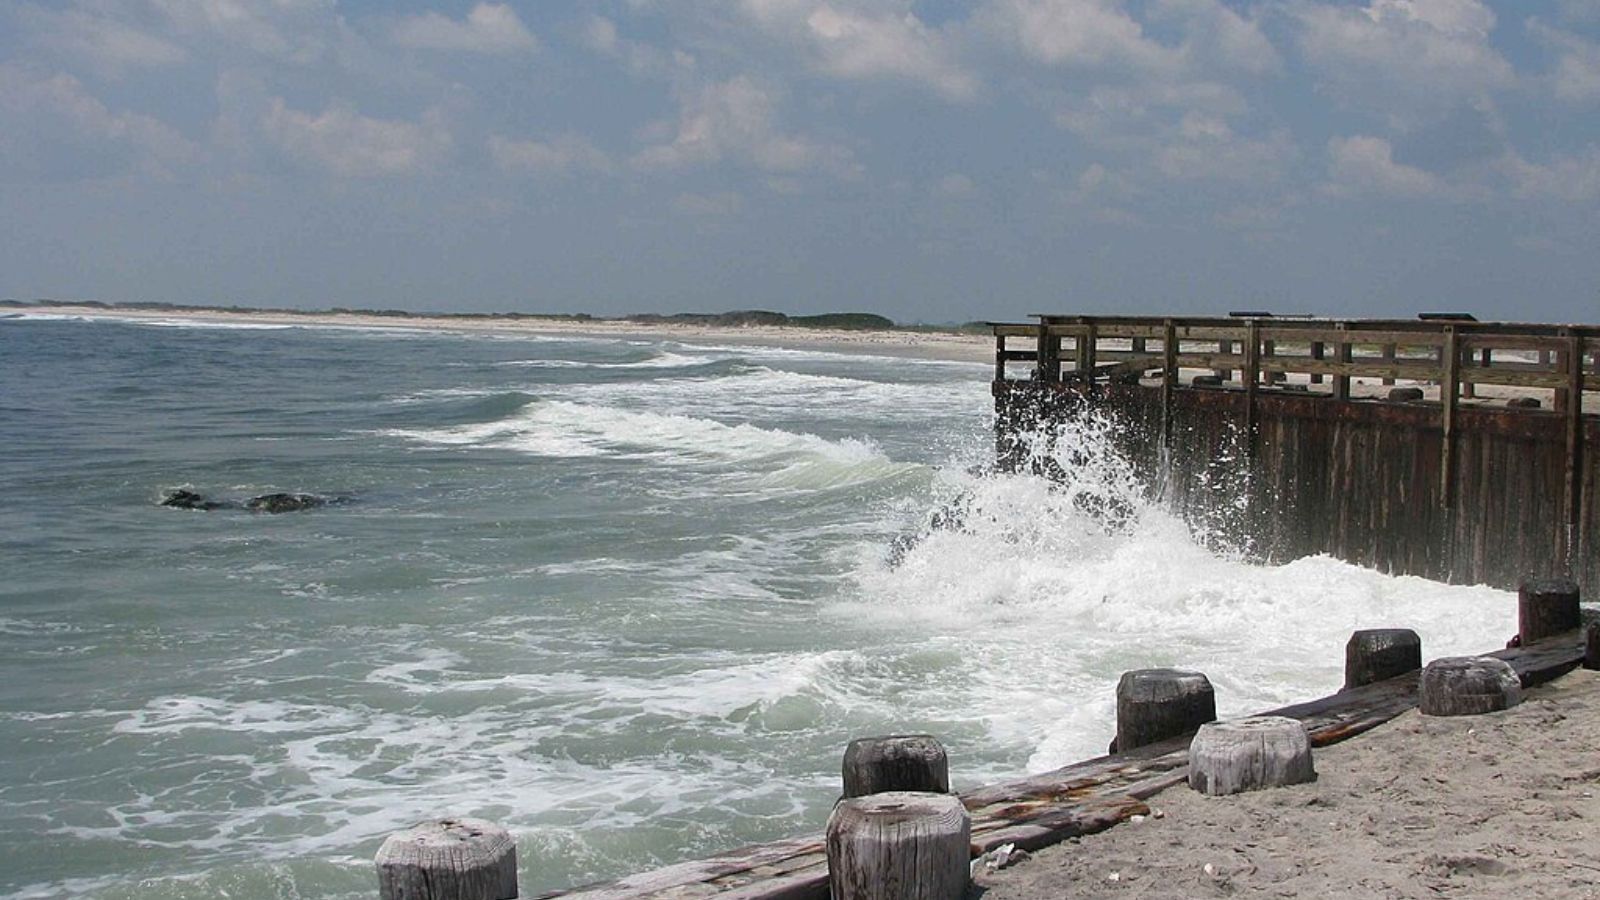
This Ocean County barrier island community stretches along 18 miles of Atlantic coastline, encompassing popular beach destinations like Surf City and Ship Bottom. The township’s astronomical median price of $1,901,625 reflects the premium commanded by oceanfront and near-ocean properties, but this valuation sits precariously 75.2% above long-term sustainable levels. The market’s vulnerability became evident during the 2009 financial crisis when prices plummeted 16.7%, demonstrating how quickly luxury coastal markets can unravel when economic conditions deteriorate.
Long Beach Township’s economy depends heavily on seasonal tourism and vacation home ownership, creating inherent instability in housing demand. The 8.9% annual price volatility reflects this seasonal dependency, as demand fluctuates dramatically between peak summer months and off-season periods. With 299.6% total appreciation since 2000, the township has experienced one of New Jersey’s most extreme price escalations, pushing affordability beyond the reach of middle-class buyers. This combination of extreme valuations, historical crash patterns, and seasonal market dependency creates a perfect storm for potential price correction.
17. Atlantic City – Crash Risk Percentage: 85%
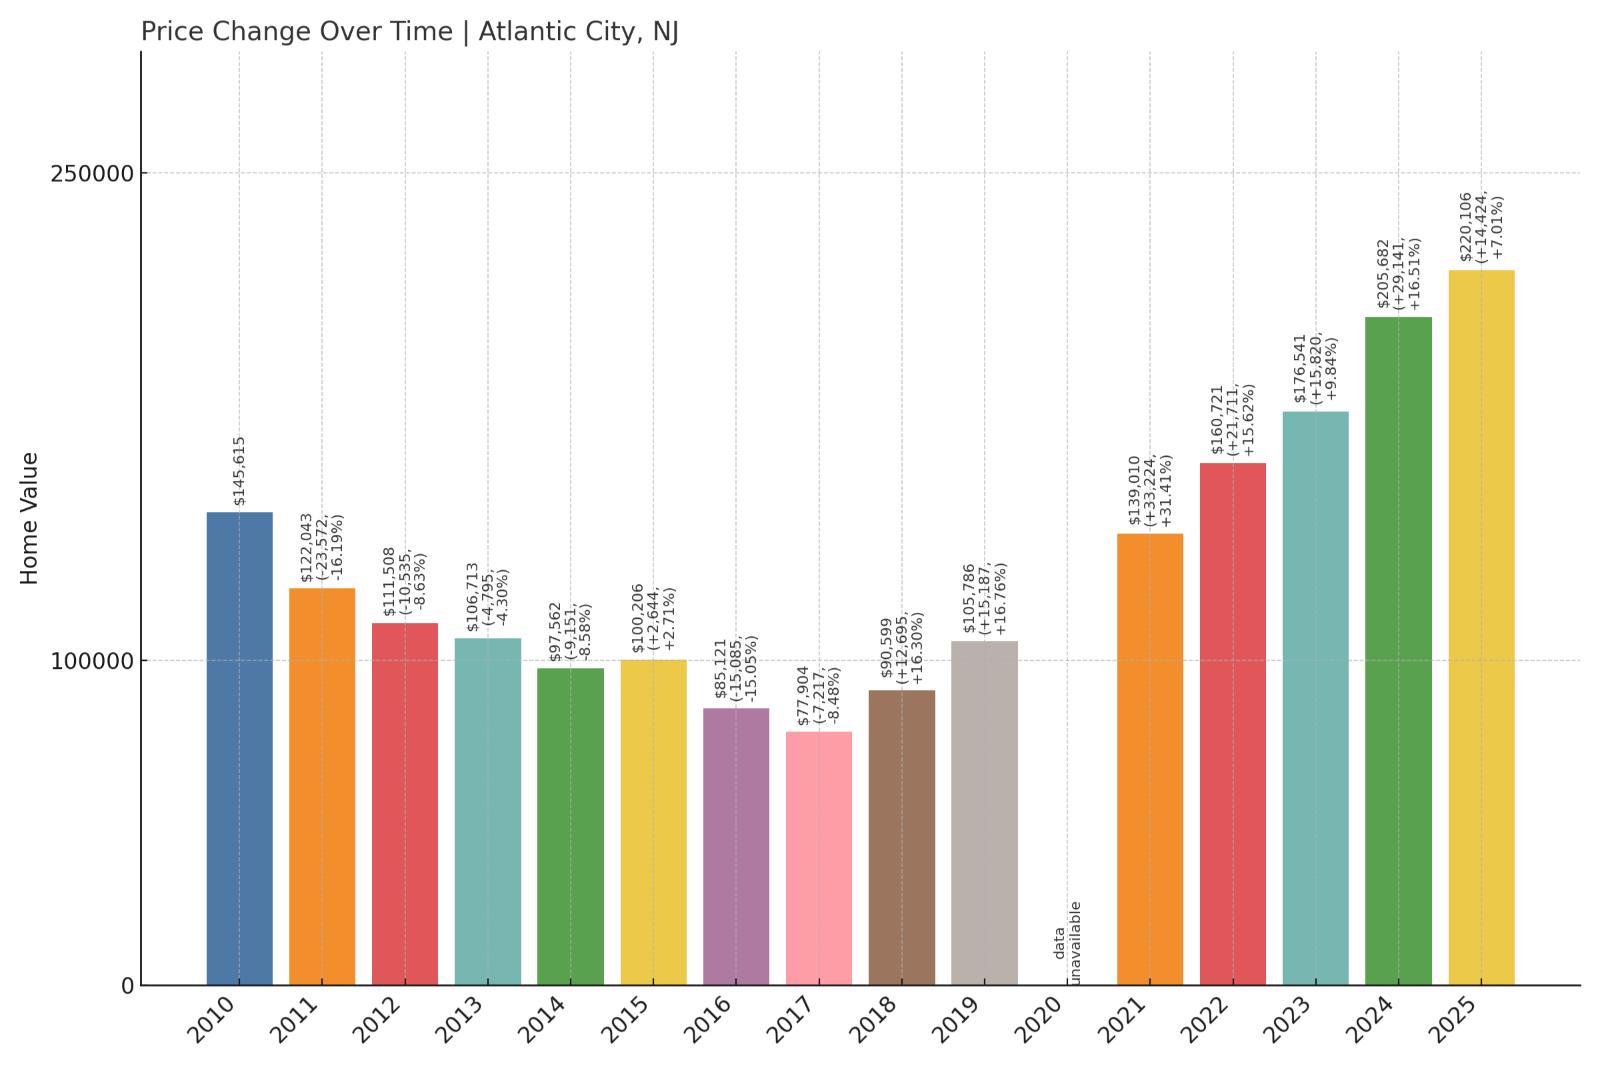
- Crash Risk Percentage: 85%
- Historical crashes (8%+ drops): 7
- Worst historical crash: -16.2% (2011)
- Total price increase since 2000: 258.9%
- Overextended above long-term average: 71.9%
- Price volatility (annual swings): 7.4%
- Current 2025 price: $220,106
Atlantic City stands out as a repeat crash offender with seven historical price drops exceeding 8%, including a brutal 16.2% collapse in 2011. Despite relatively affordable current prices, the city’s pattern of boom-and-bust cycles and 71.9% overextension above historical norms signal high risk for another downturn.
Atlantic City – Gaming Capital’s Unstable Housing Foundation
Atlantic City’s housing market reflects the volatility of its casino-dependent economy, with seven major price crashes since 2000 making it one of New Jersey’s most crash-prone markets. The city’s current median price of $220,106 might appear reasonable compared to other coastal areas, but this valuation sits 71.9% above the market’s long-term sustainable average. The worst historical crash of 16.2% in 2011 coincided with casino closures and economic restructuring, demonstrating how quickly the housing market can collapse when the tourism industry struggles.
The city’s economic challenges extend beyond gaming industry fluctuations. Atlantic City faces persistent unemployment, population decline, and urban decay issues that create fundamental headwinds for housing demand. Despite recent efforts at economic diversification and urban renewal, the market maintains 7.4% annual volatility, indicating continued instability. With a track record of seven major crashes and current overextension of nearly 72%, Atlantic City’s housing market appears positioned for another significant correction, particularly if tourism revenues decline or economic conditions deteriorate.
16. Camden – Crash Risk Percentage: 85%
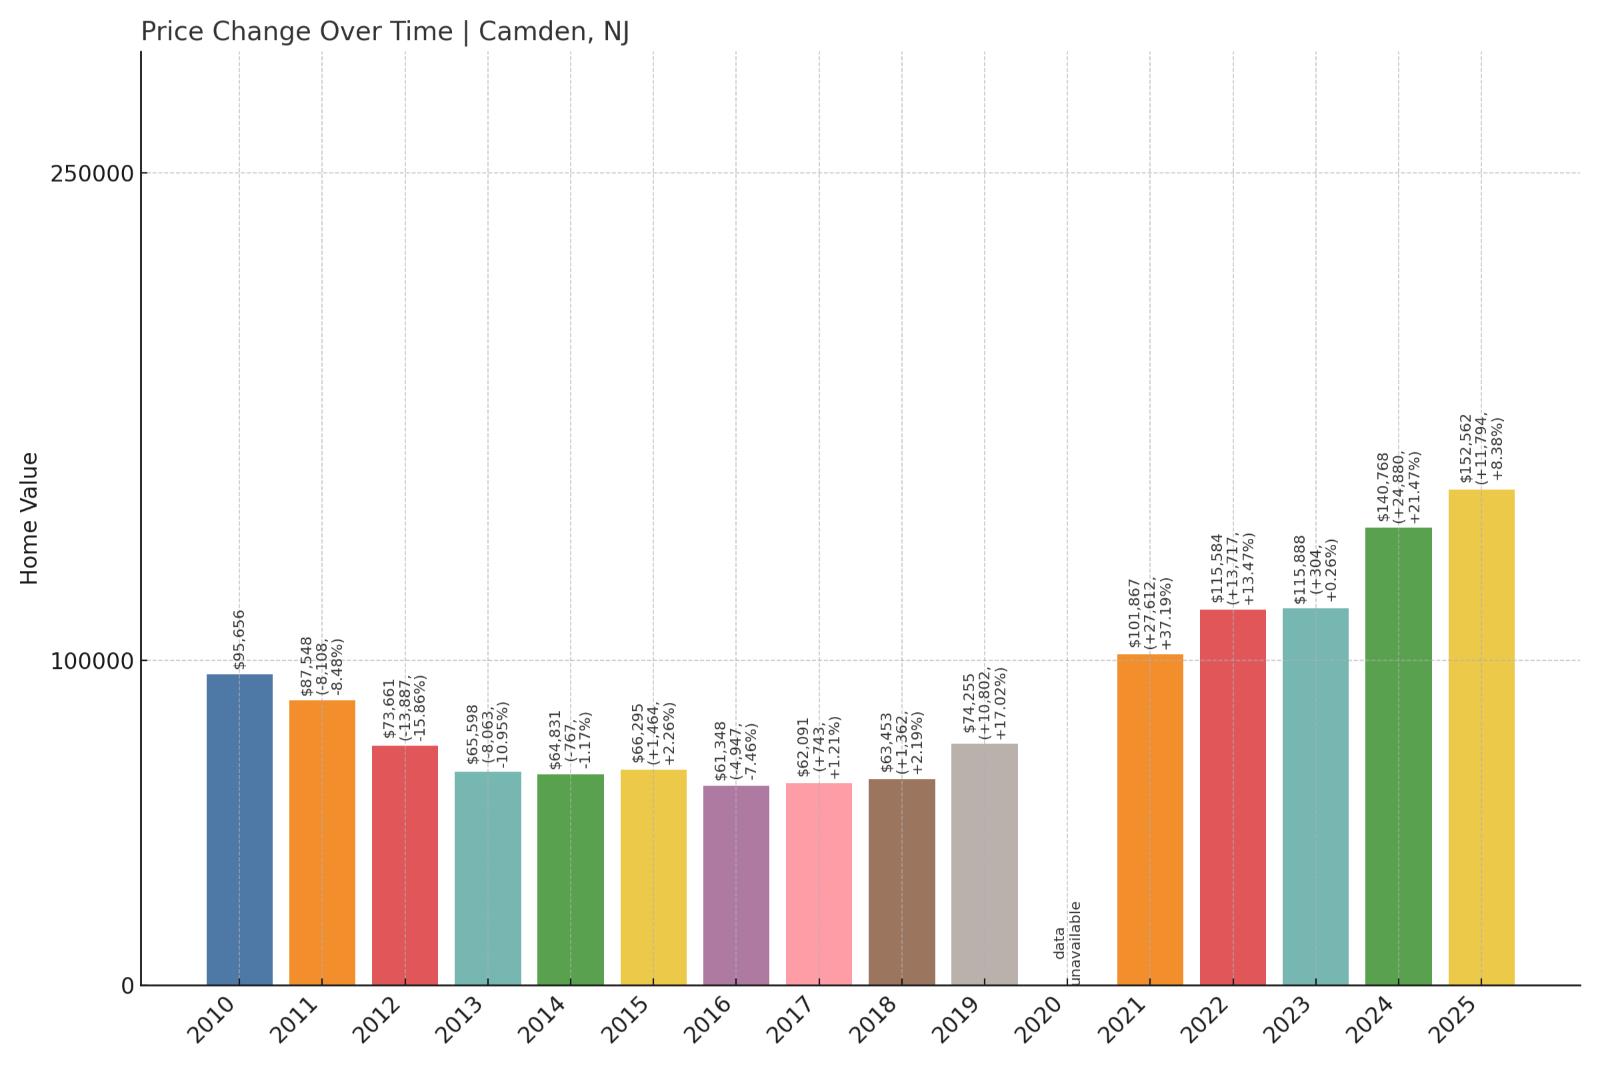
- Crash Risk Percentage: 85%
- Historical crashes (8%+ drops): 4
- Worst historical crash: -15.9% (2012)
- Total price increase since 2000: 138.5%
- Overextended above long-term average: 75.9%
- Price volatility (annual swings): 8.6%
- Current 2025 price: $152,562
Camden’s housing market shows dangerous instability with four historical crashes and extreme volatility of 8.6% annually. Despite the lowest median price among high-risk communities at $152,562, the city’s 75.9% overextension and pattern of repeated crashes create significant downside risk.
Camden – Urban Struggles Amplify Housing Volatility
Located directly across the Delaware River from Philadelphia, Camden represents one of New Jersey’s most economically challenged urban areas. The city’s median home price of $152,562 reflects deep-seated economic problems, yet even this modest valuation sits 75.9% above the market’s long-term sustainable level. Camden’s housing market has crashed four times since 2000, with the worst decline of 15.9% occurring in 2012 as the city grappled with fiscal crisis and urban decay.
Camden’s fundamental economic weaknesses create ongoing pressure on housing values. The city has struggled with high crime rates, population loss, and limited employment opportunities outside of government and healthcare sectors. The 8.6% annual price volatility indicates a highly unstable market where small changes in economic conditions can trigger dramatic price swings. While recent urban renewal efforts and proximity to Philadelphia provide some support, Camden’s track record of repeated crashes and current overextension of nearly 76% suggest the market remains vulnerable to another significant correction.
15. Ocean Gate – Crash Risk Percentage: 87%
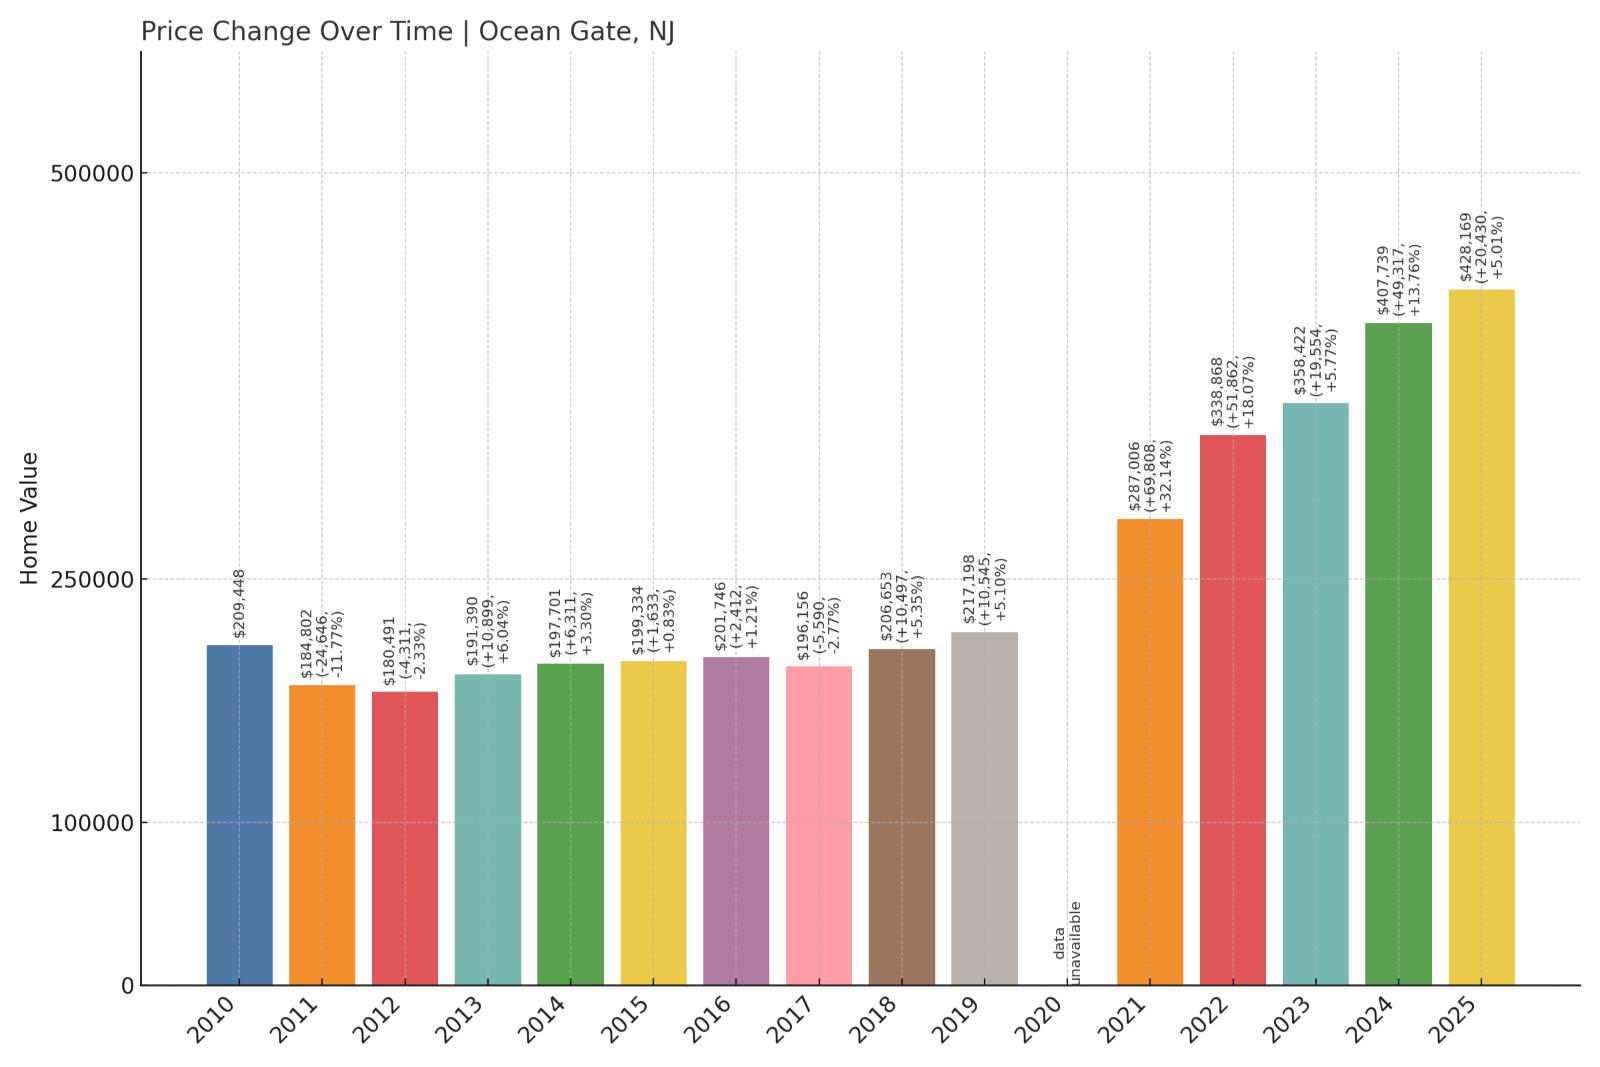
- Crash Risk Percentage: 87%
- Historical crashes (8%+ drops): 3
- Worst historical crash: -14.3% (2009)
- Total price increase since 2000: 305.5%
- Overextended above long-term average: 82.3%
- Price volatility (annual swings): 8.1%
- Current 2025 price: $428,169
Ocean Gate’s 305.5% price appreciation since 2000 has created dangerous overextension at 82.3% above sustainable levels. This small coastal borough’s three historical crashes and current median price of $428,169 reflect a market that has pushed well beyond fundamental value support.
Ocean Gate – Small Borough, Big Price Risks
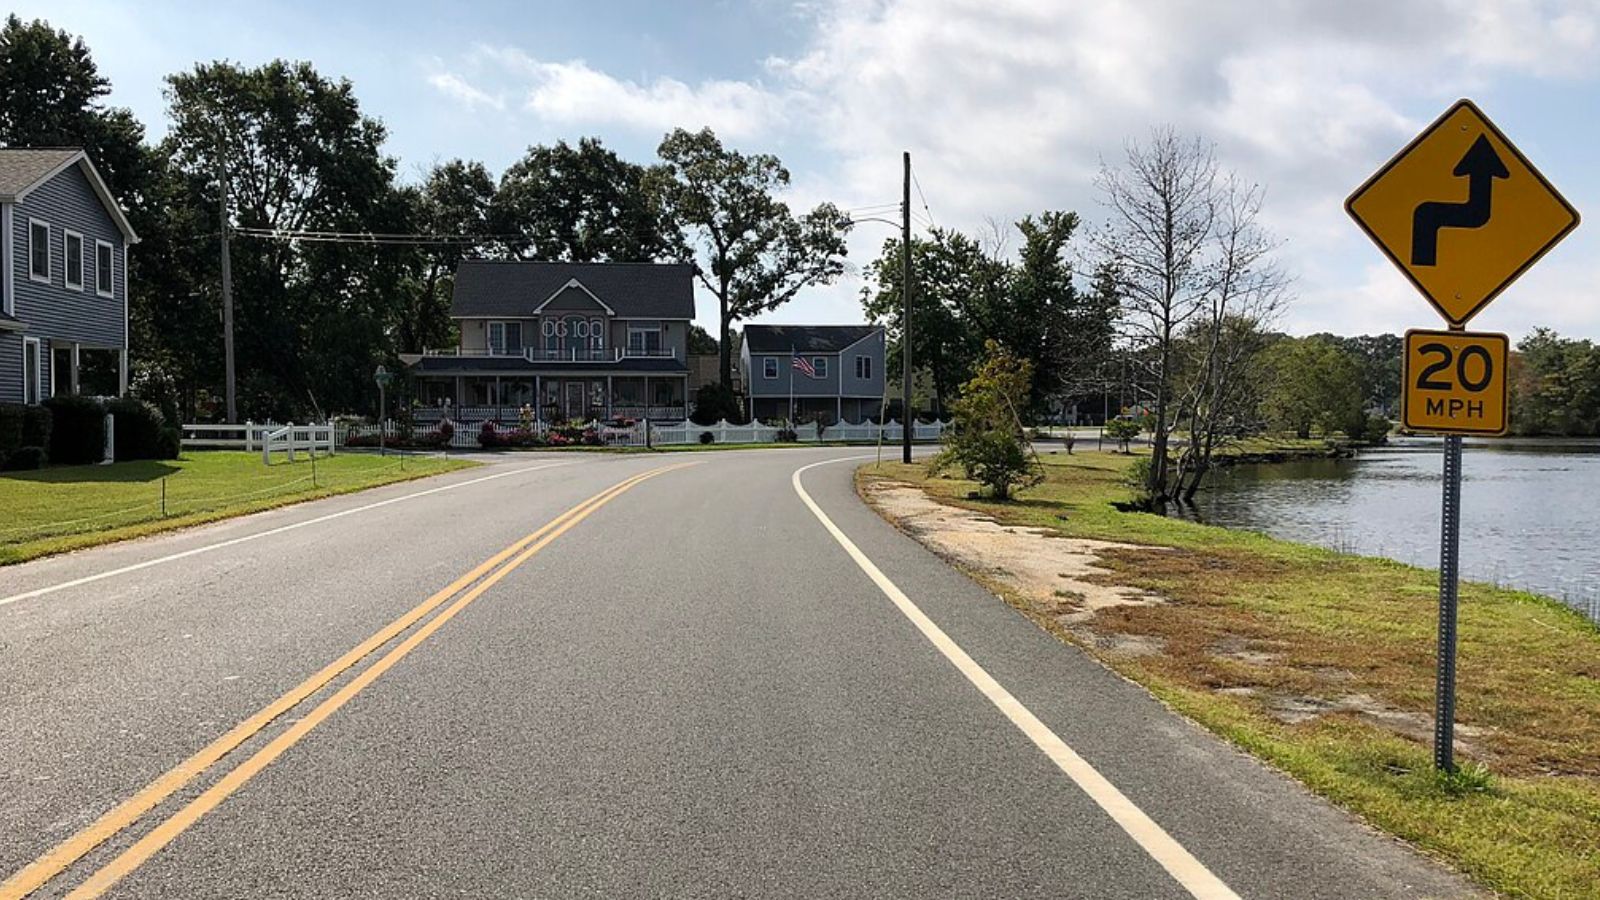
This tiny Ocean County borough along the Toms River represents one of New Jersey’s smallest municipalities by area, but its housing market carries outsized crash risk. Ocean Gate’s 305.5% price appreciation since 2000 ranks among the state’s most extreme, pushing the current median price of $428,169 to levels 82.3% above long-term sustainable averages. The borough’s small size and limited housing stock create volatility, as individual sales can dramatically impact market statistics.
Ocean Gate’s waterfront location provides appeal for boaters and water recreation enthusiasts, but this niche market creates vulnerability during economic downturns. The 14.3% crash in 2009 demonstrated how quickly luxury and recreational markets can collapse when discretionary spending declines. With only a few hundred housing units in the entire borough, Ocean Gate lacks the market depth to absorb selling pressure during stressed conditions. The combination of extreme overvaluation, limited market depth, and recreational market dependency creates high risk for significant price correction.
14. Chesilhurst – Crash Risk Percentage: 87%
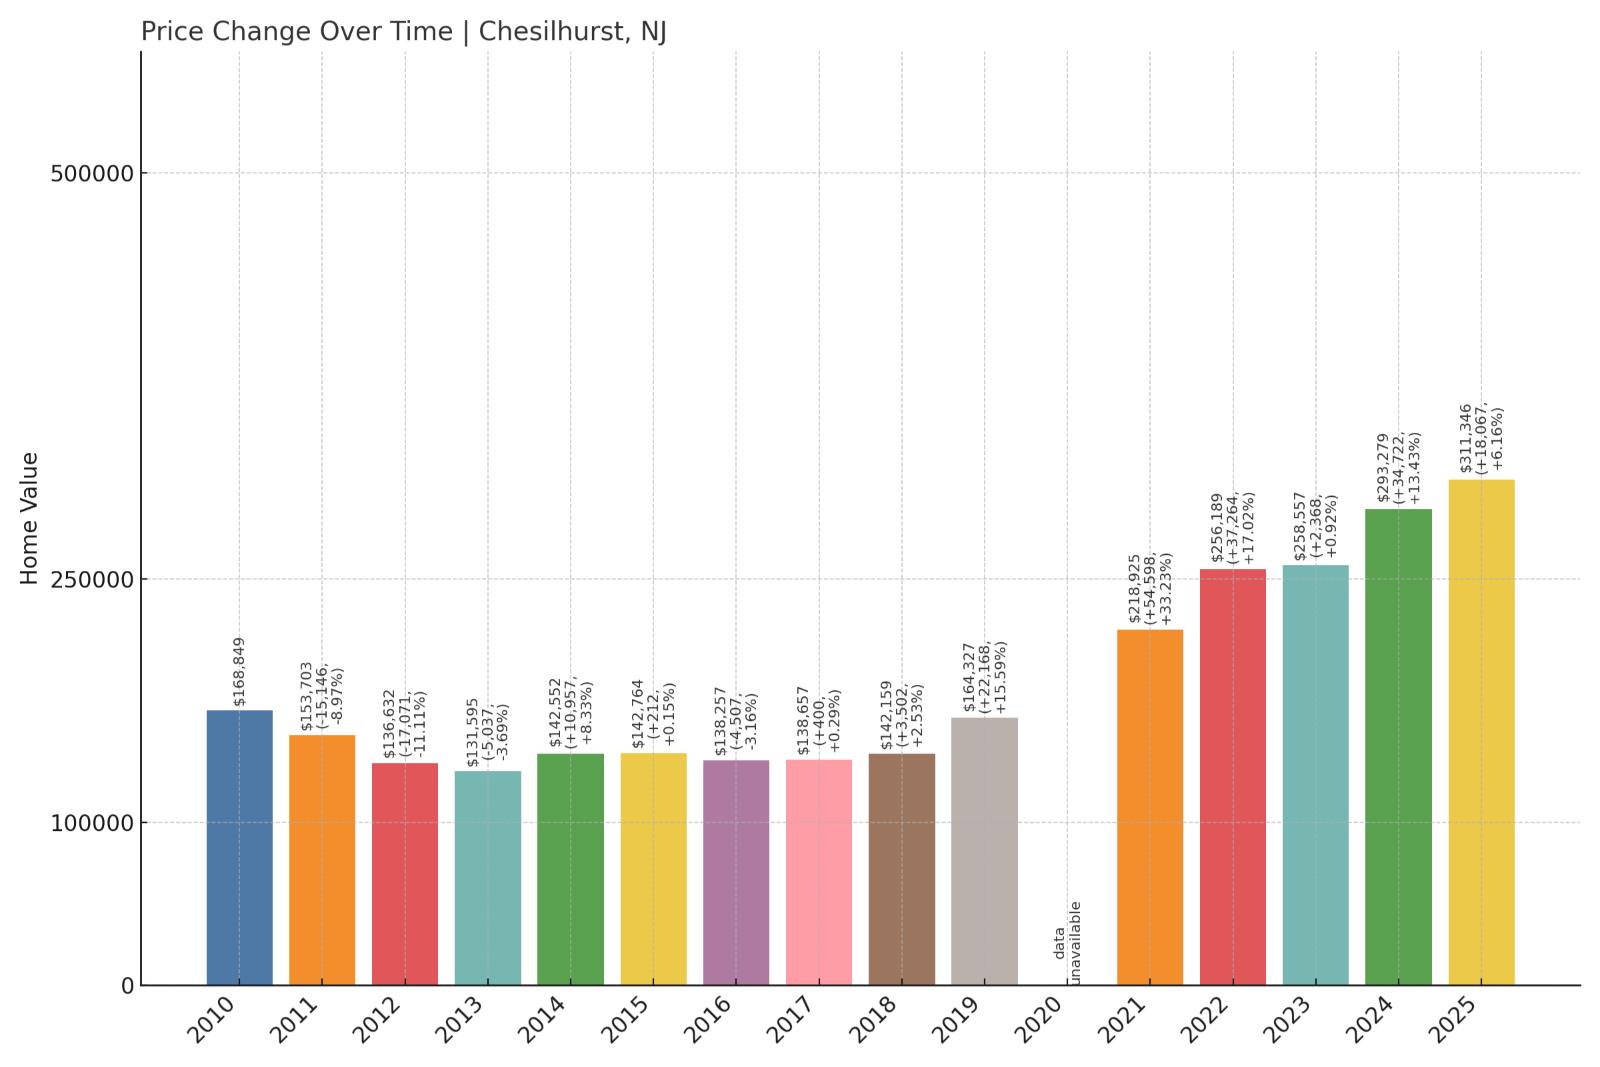
- Crash Risk Percentage: 87%
- Historical crashes (8%+ drops): 3
- Worst historical crash: -11.1% (2012)
- Total price increase since 2000: 263.9%
- Overextended above long-term average: 86.2%
- Price volatility (annual swings): 8.1%
- Current 2025 price: $311,346
Chesilhurst’s 263.9% price growth has pushed this Camden County borough 86.2% above sustainable levels. Three historical crashes and 8.1% annual volatility indicate a small market prone to dramatic swings, with current prices appearing mathematically unsustainable.
Chesilhurst – Small Market, Large Vulnerabilities
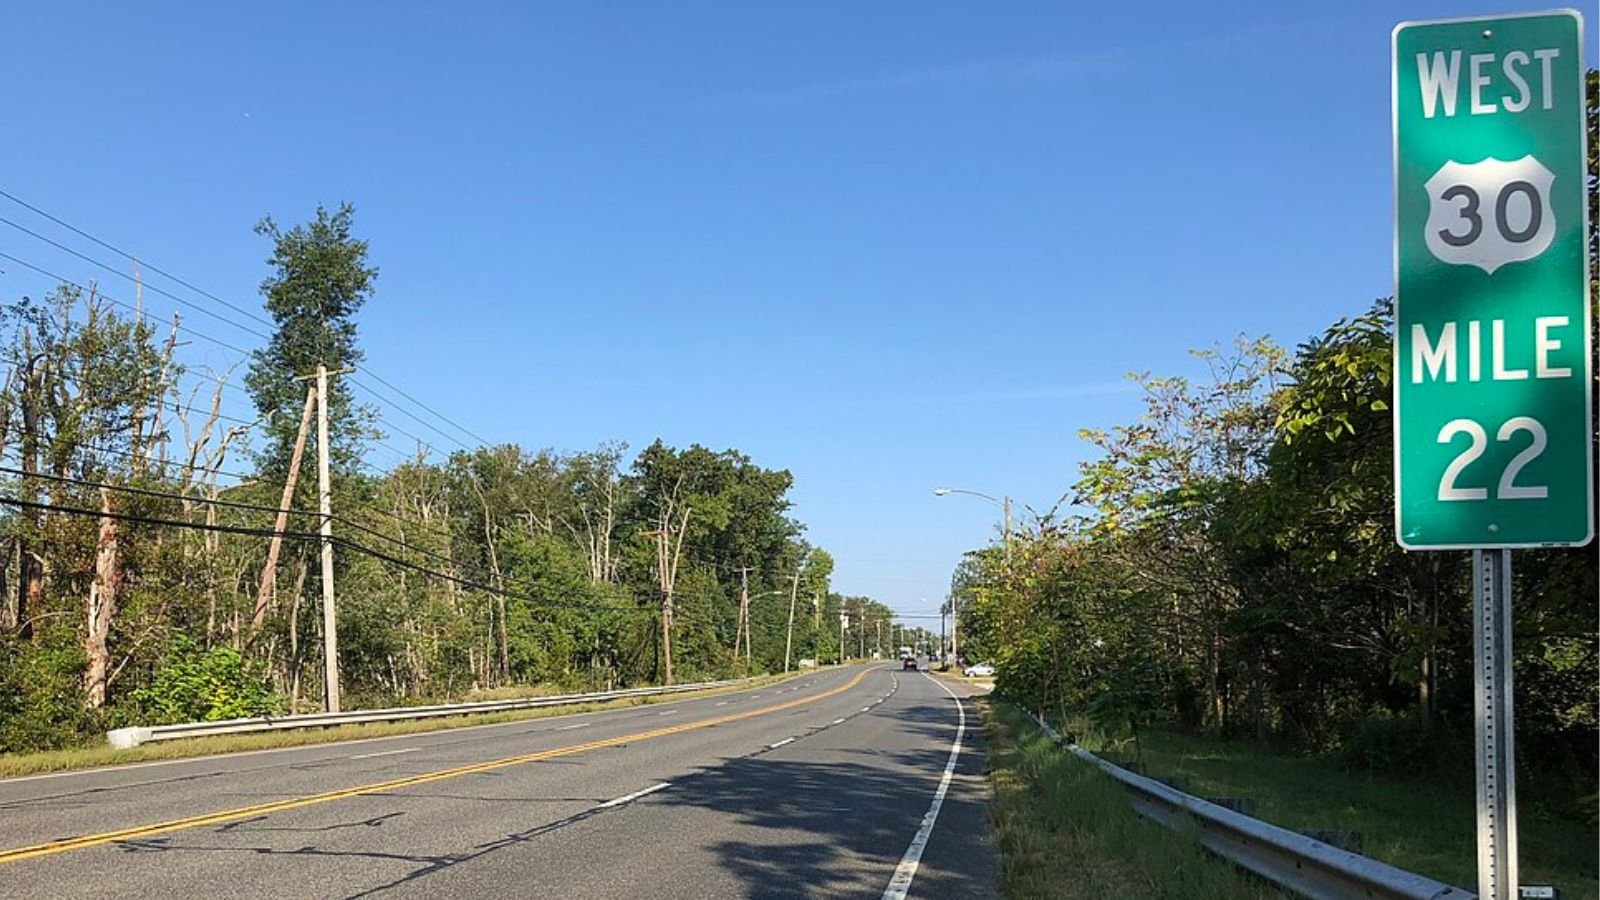
This small Camden County borough of approximately 1,600 residents has experienced dramatic housing price appreciation that appears disconnected from local economic fundamentals. Chesilhurst’s 263.9% price growth since 2000 has elevated the median home value to $311,346, a level that sits 86.2% above the market’s historical sustainable average. The borough’s three major crashes since 2000, including an 11.1% decline in 2012, demonstrate the market’s vulnerability to rapid corrections.
Chesilhurst’s rural character and limited commercial development create challenges for sustained housing demand. The borough lacks major employers or significant economic drivers beyond its proximity to larger South Jersey markets. The 8.1% annual price volatility reflects the instability common in small markets where individual property sales can dramatically impact overall statistics. With extreme overvaluation and a proven history of price crashes, Chesilhurst represents a clear example of how small New Jersey communities can experience outsized housing corrections when market conditions deteriorate.
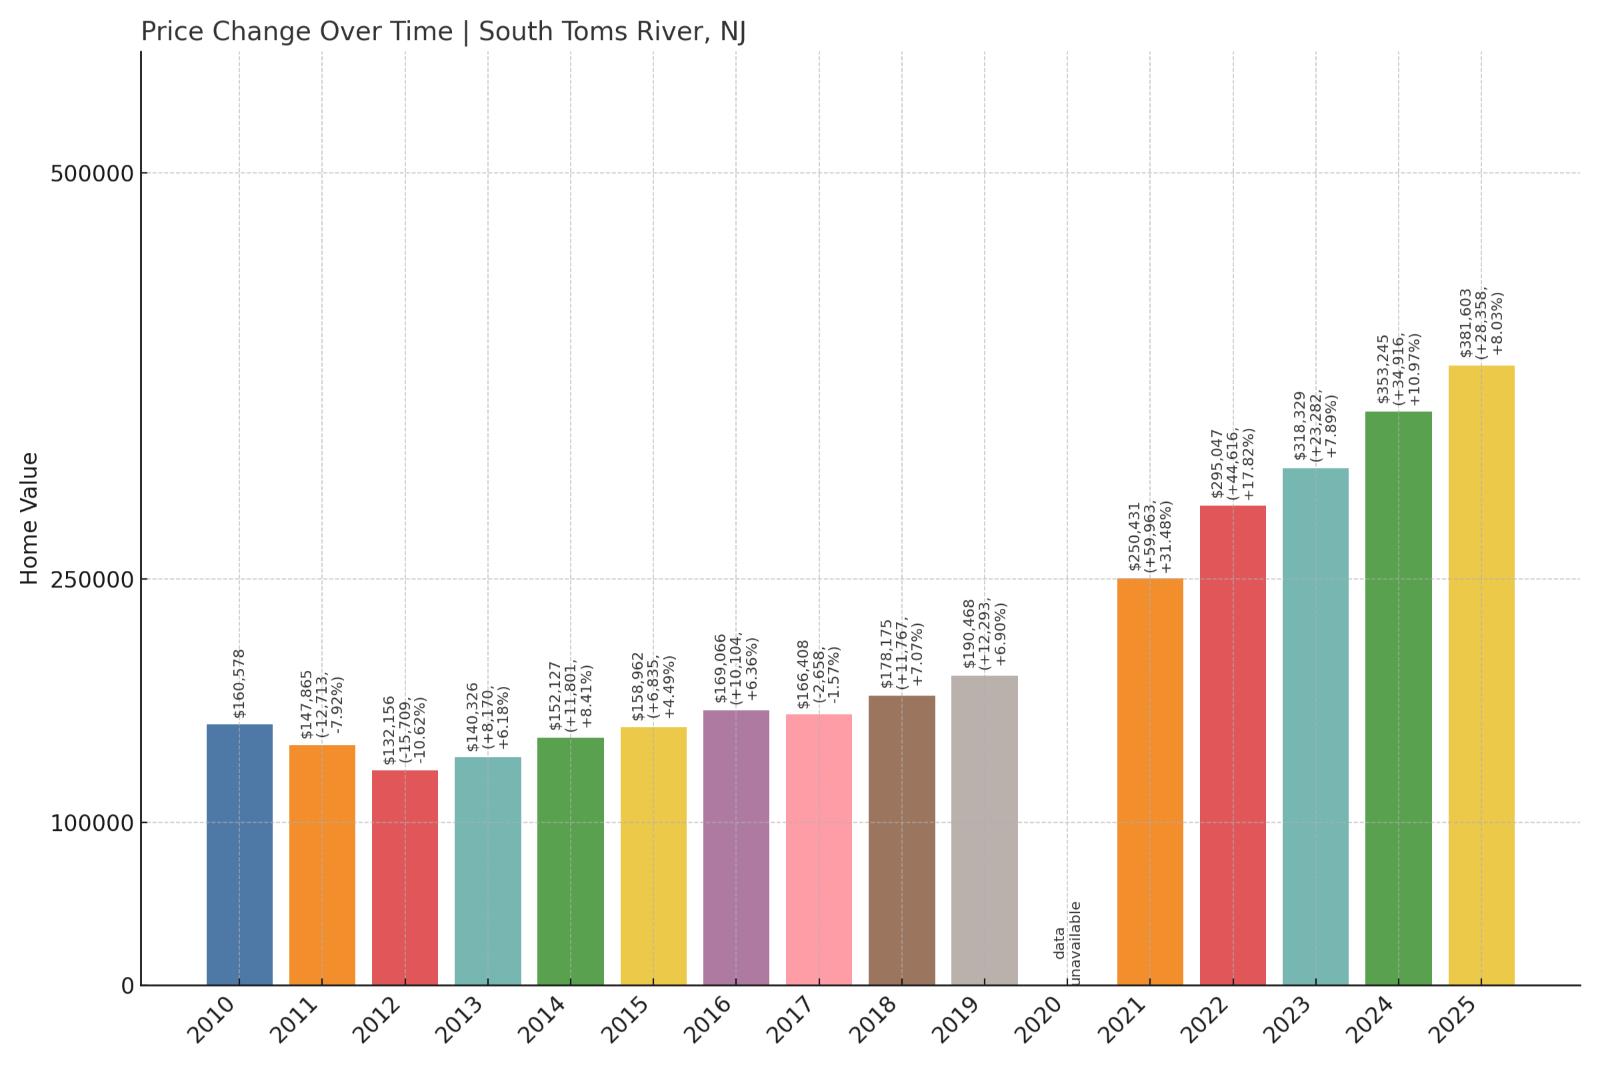
13. South Toms River – Crash Risk Percentage: 87%
🔥 Would you like to save this?
- Crash Risk Percentage: 87%
- Historical crashes (8%+ drops): 3
- Worst historical crash: -10.6% (2012)
- Total price increase since 2000: 357.4%
- Overextended above long-term average: 102.5%
- Price volatility (annual swings): 7.1%
- Current 2025 price: $381,603
South Toms River shows the most extreme overextension at 102.5% above long-term averages, making it mathematically unsustainable. The borough’s 357.4% price growth since 2000 and three historical crashes create a dangerous combination of overvaluation and proven crash vulnerability.
South Toms River – Mathematical Impossibility In Motion

South Toms River presents perhaps the most mathematically unsustainable housing market in New Jersey, with current prices sitting an extraordinary 102.5% above long-term averages. This Ocean County borough’s 357.4% appreciation since 2000 represents one of the state’s most extreme price escalations, pushing the median home value to $381,603 in an area that lacks the economic fundamentals to support such valuations. The market has already demonstrated its crash potential with three significant declines, including a 10.6% drop in 2012.
The borough’s location along the Toms River provides some recreational appeal, but this advantage cannot justify current extreme valuations. South Toms River lacks major employment centers, significant commercial development, or unique amenities that would support premium pricing. The 7.1% annual volatility indicates ongoing market instability, while the unprecedented 102.5% overextension suggests mathematical correction is not just likely but inevitable. When prices reach levels more than double their sustainable historical averages, market forces typically reassert themselves through significant corrections.
12. Ventnor City – Crash Risk Percentage: 87%
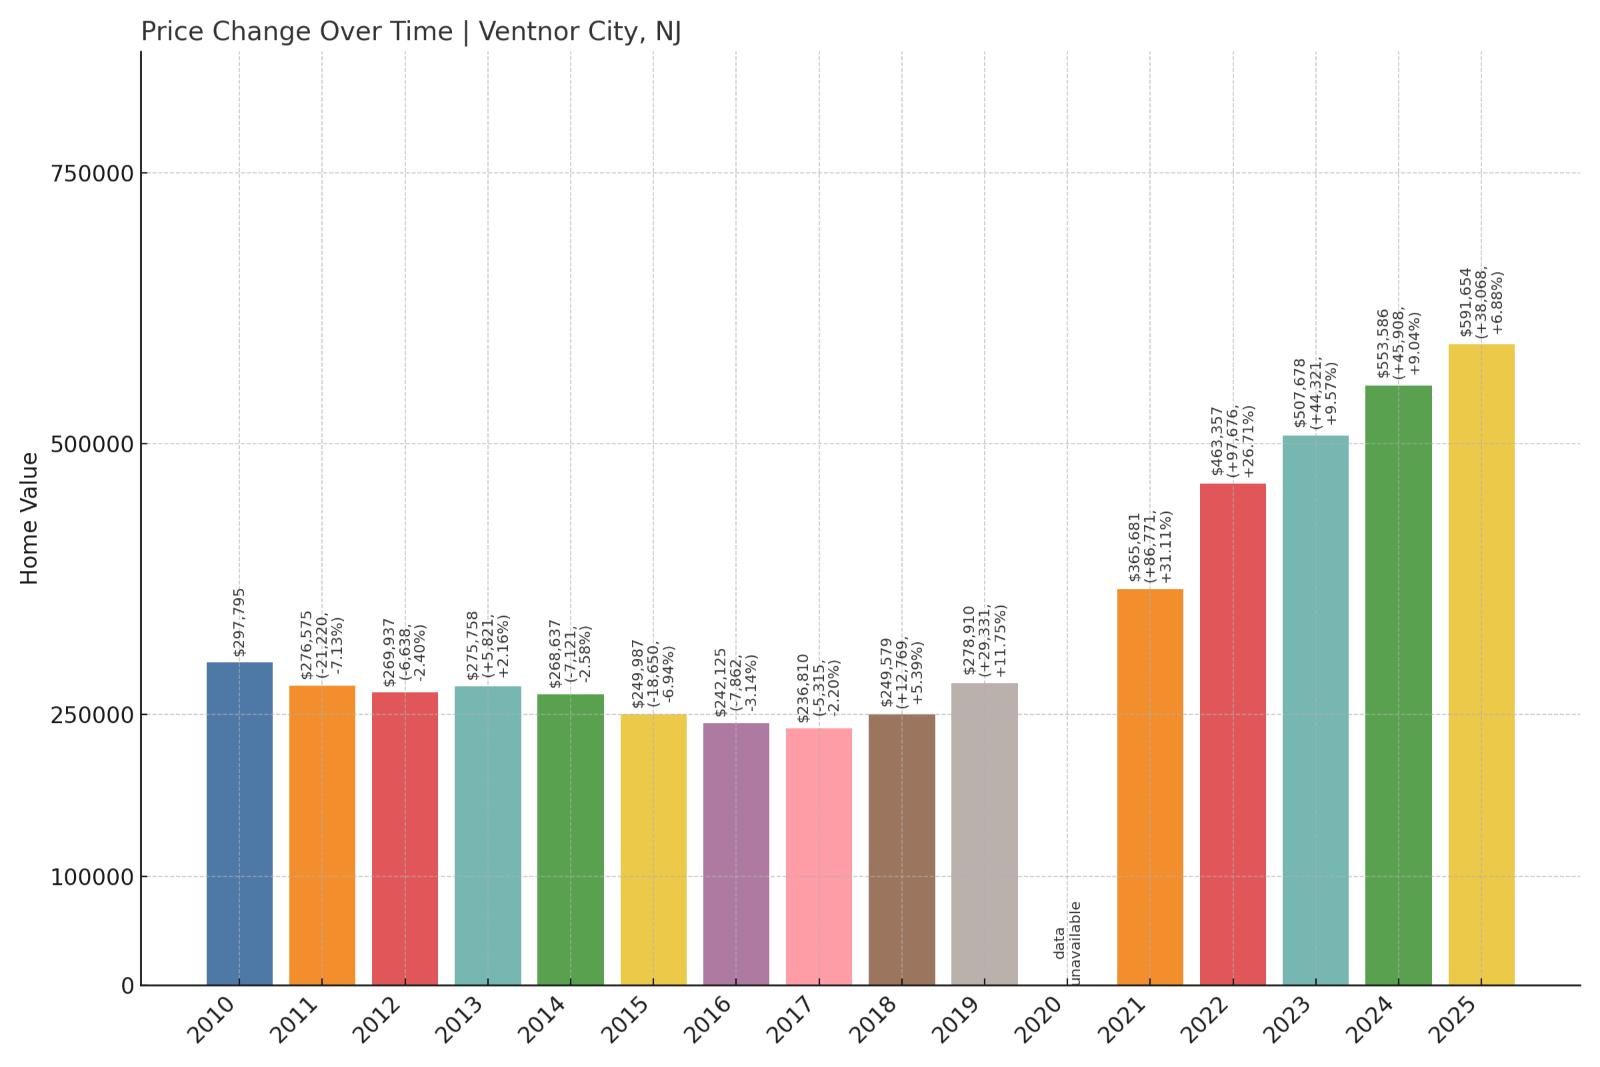
- Crash Risk Percentage: 87%
- Historical crashes (8%+ drops): 2
- Worst historical crash: -10.2% (2009)
- Total price increase since 2000: 323.2%
- Overextended above long-term average: 90.4%
- Price volatility (annual swings): 8.5%
- Current 2025 price: $591,654
Ventnor City’s 323.2% price appreciation has created dangerous overextension at 90.4% above sustainable levels. This Atlantic County coastal community’s median price of $591,654 and high volatility of 8.5% indicate a luxury market vulnerable to significant correction.
Ventnor City – Coastal Luxury Meets Reality Check
Located immediately south of Atlantic City along the Atlantic coast, Ventnor City has developed into an upscale residential community that commands premium prices for its beachfront and near-beach properties. The city’s median home price of $591,654 reflects this coastal premium, but current valuations sit 90.4% above the market’s long-term sustainable average. Ventnor’s 323.2% appreciation since 2000 ranks among New Jersey’s most extreme, creating vulnerability for significant correction when market conditions change.
Ventnor City’s proximity to Atlantic City provides both advantages and risks for its housing market. While the city benefits from casino employment and tourism spillover, it also shares exposure to the gaming industry’s volatility. The 10.2% crash in 2009 demonstrated how quickly luxury coastal markets can decline during economic stress. With 8.5% annual price volatility and extreme overvaluation at 90.4% above historical norms, Ventnor City represents a clear example of how coastal premium pricing can become mathematically unsustainable, setting the stage for eventual market correction.
11. Willingboro Township – Crash Risk Percentage: 87%
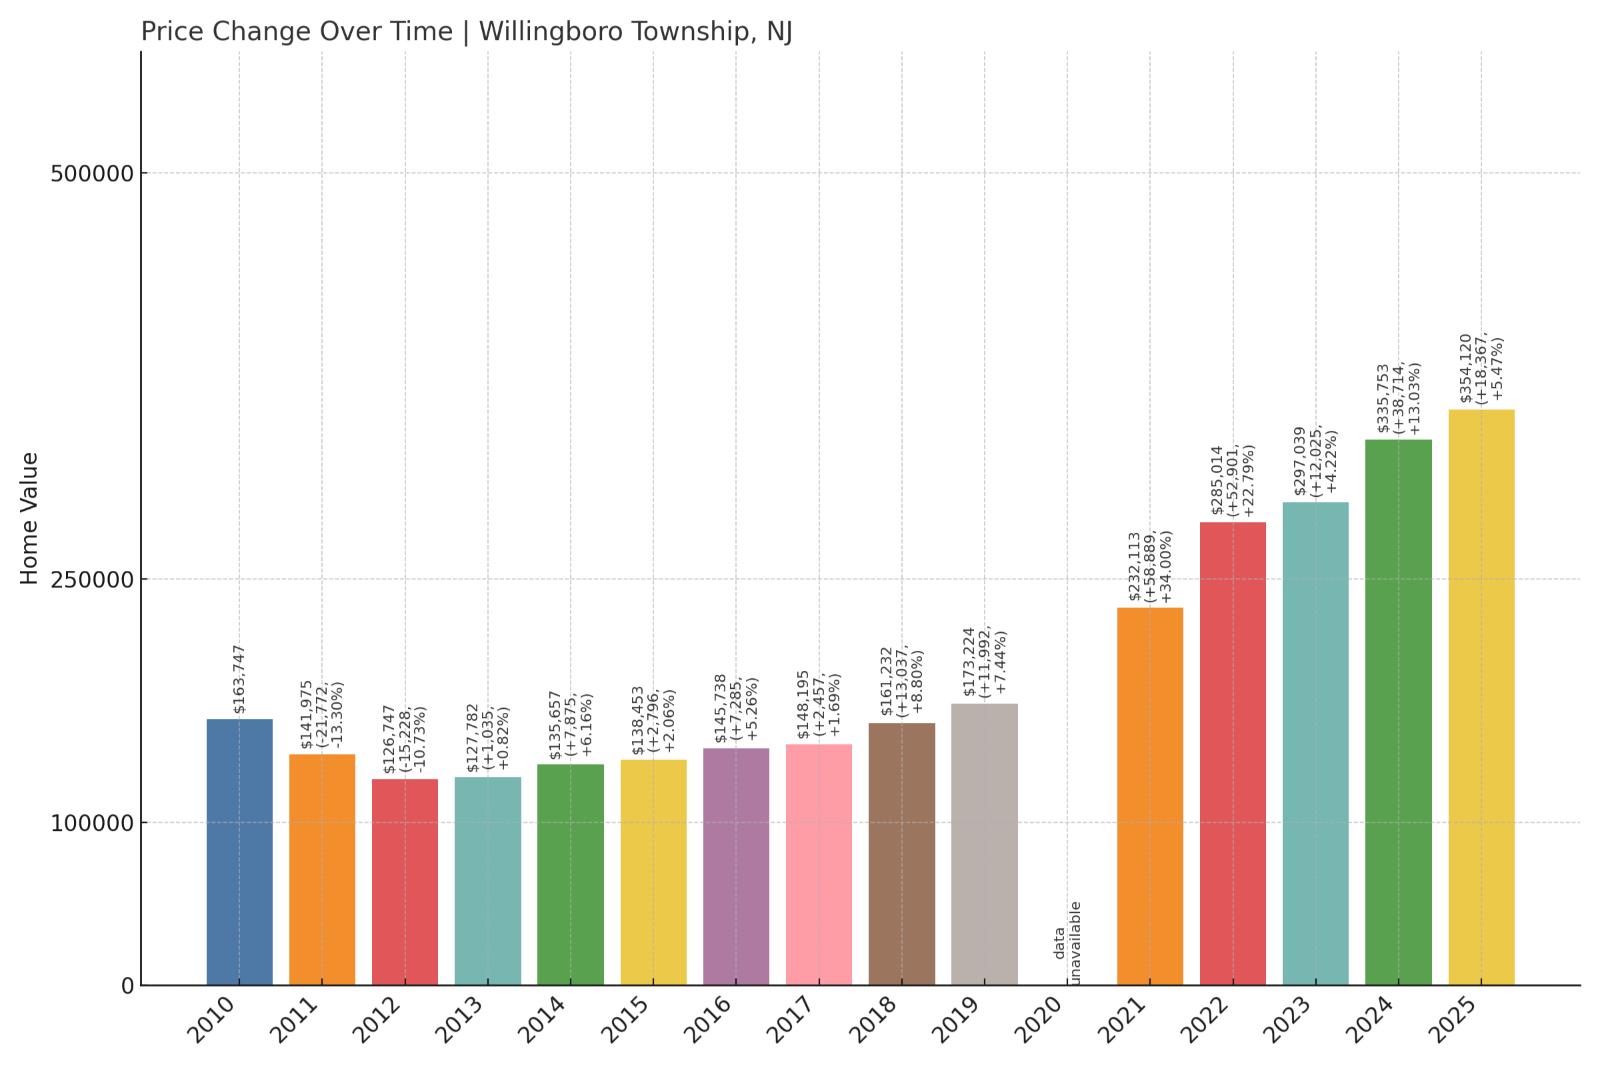
- Crash Risk Percentage: 87%
- Historical crashes (8%+ drops): 3
- Worst historical crash: -14.2% (2009)
- Total price increase since 2000: 254.0%
- Overextended above long-term average: 94.9%
- Price volatility (annual swings): 7.5%
- Current 2025 price: $354,120
Willingboro Township’s three major crashes, including a devastating 14.2% decline in 2009, establish a clear pattern of market vulnerability. The township’s current 94.9% overextension above sustainable levels and median price of $354,120 suggest another correction cycle may be approaching.
Willingboro Township – Suburban Dream Meets Market Reality

This Burlington County township was originally developed as a planned community in the 1950s and 1960s, designed to provide affordable suburban housing for middle-class families. Willingboro’s median home price of $354,120 now sits 94.9% above the market’s long-term sustainable average, a dramatic departure from its original affordable housing mission. The township has experienced three major price crashes since 2000, with the worst decline of 14.2% occurring during the 2009 financial crisis, establishing a clear pattern of market vulnerability.
Willingboro’s housing stock consists primarily of tract homes and townhouses built during the community’s initial development phases, creating relatively uniform property types that can experience correlated price movements. The township’s location between Philadelphia and Trenton provides commuter access to major employment centers, but this advantage cannot justify the current extreme overvaluation. With a proven history of significant crashes and current prices approaching double their sustainable level, Willingboro Township appears positioned for another market correction cycle.
10. East Orange – Crash Risk Percentage: 87%
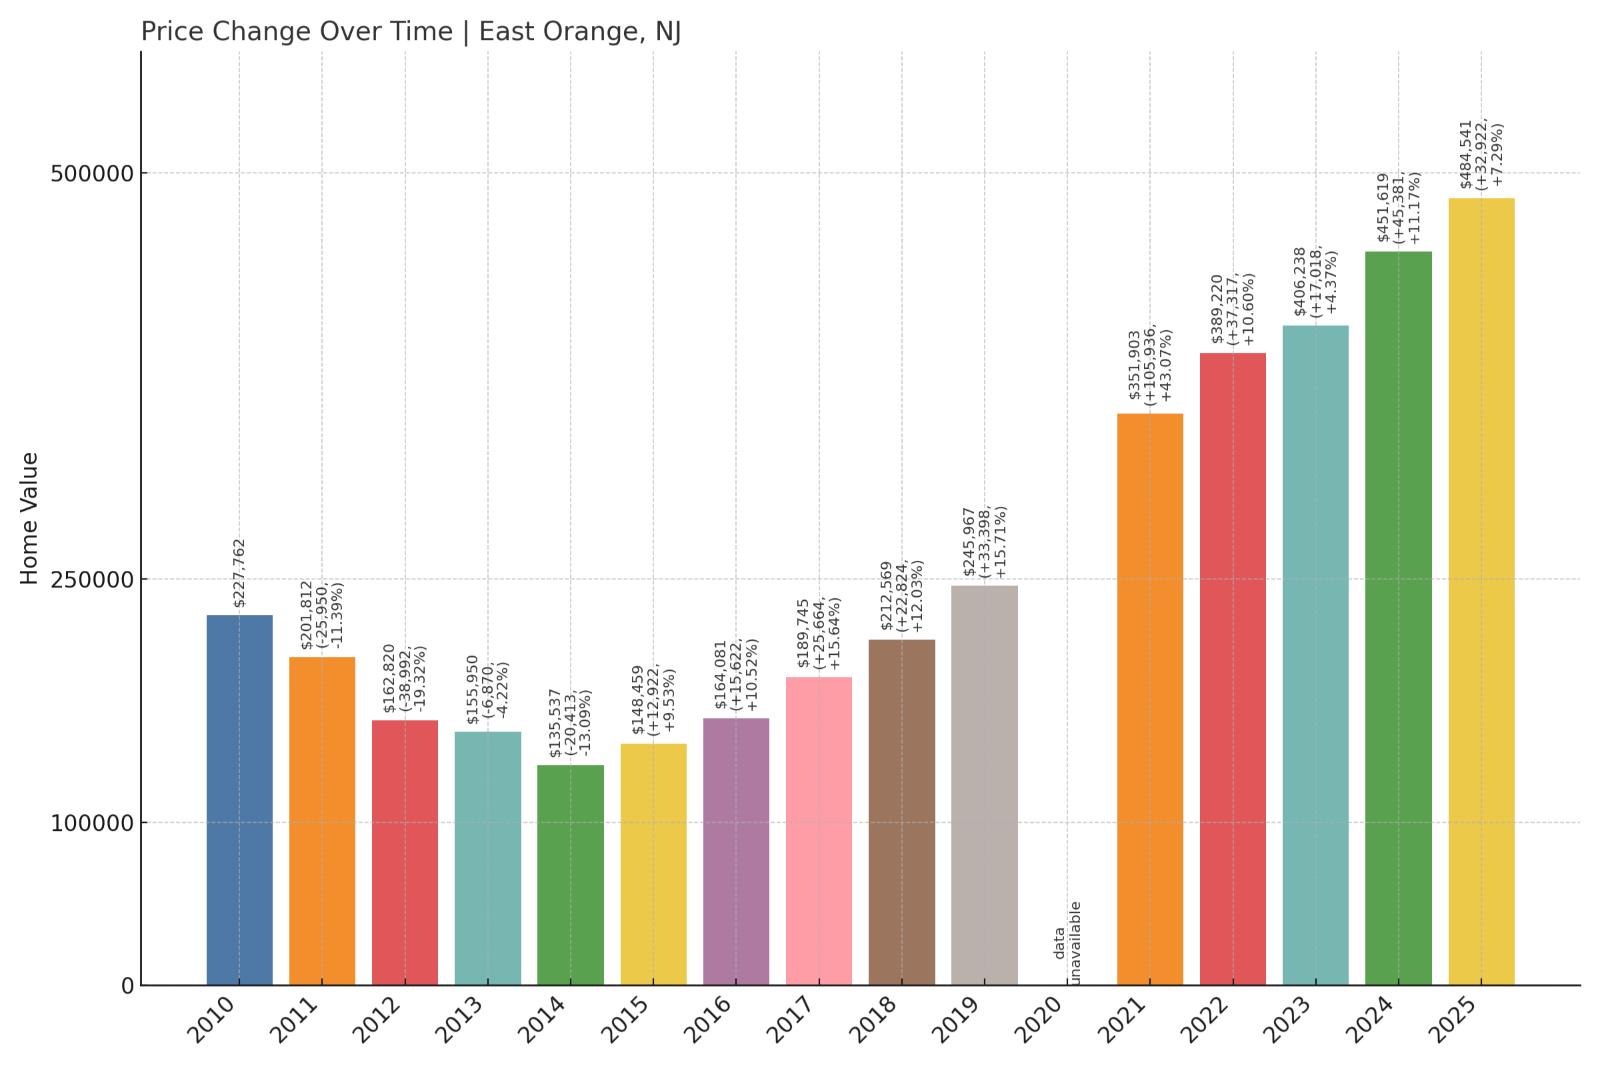
- Crash Risk Percentage: 87%
- Historical crashes (8%+ drops): 5
- Worst historical crash: -19.3% (2012)
- Total price increase since 2000: 242.7%
- Overextended above long-term average: 95.7%
- Price volatility (annual swings): 8.1%
- Current 2025 price: $484,541
East Orange emerges as the ultimate repeat crash offender with five historical declines exceeding 8%, including a catastrophic 19.3% collapse in 2012. The city’s current 95.7% overextension and median price of $484,541 suggest the cycle may be preparing to repeat.
East Orange – Serial Crasher Primed For Another Fall

East Orange stands out as New Jersey’s most crash-prone housing market, with five major price declines since 2000 culminating in a devastating 19.3% collapse in 2012. This Essex County city’s median home price of $484,541 now sits 95.7% above sustainable levels, nearly double the market’s long-term average. The city’s proximity to Newark and New York City provides commuter appeal, but this advantage has been repeatedly overwhelmed by local economic challenges and market instability.
East Orange’s housing market reflects broader urban challenges including population decline, fiscal pressures, and economic disinvestment. The city’s track record of five major crashes demonstrates exceptional vulnerability to economic downturns and market stress. With 8.1% annual price volatility and extreme overvaluation approaching 96%, East Orange appears mathematically positioned for another significant correction. The city’s pattern of repeated crashes suggests underlying structural problems that make sustained price appreciation unlikely, creating high risk for investors and homeowners.
9. Interlaken – Crash Risk Percentage: 89%
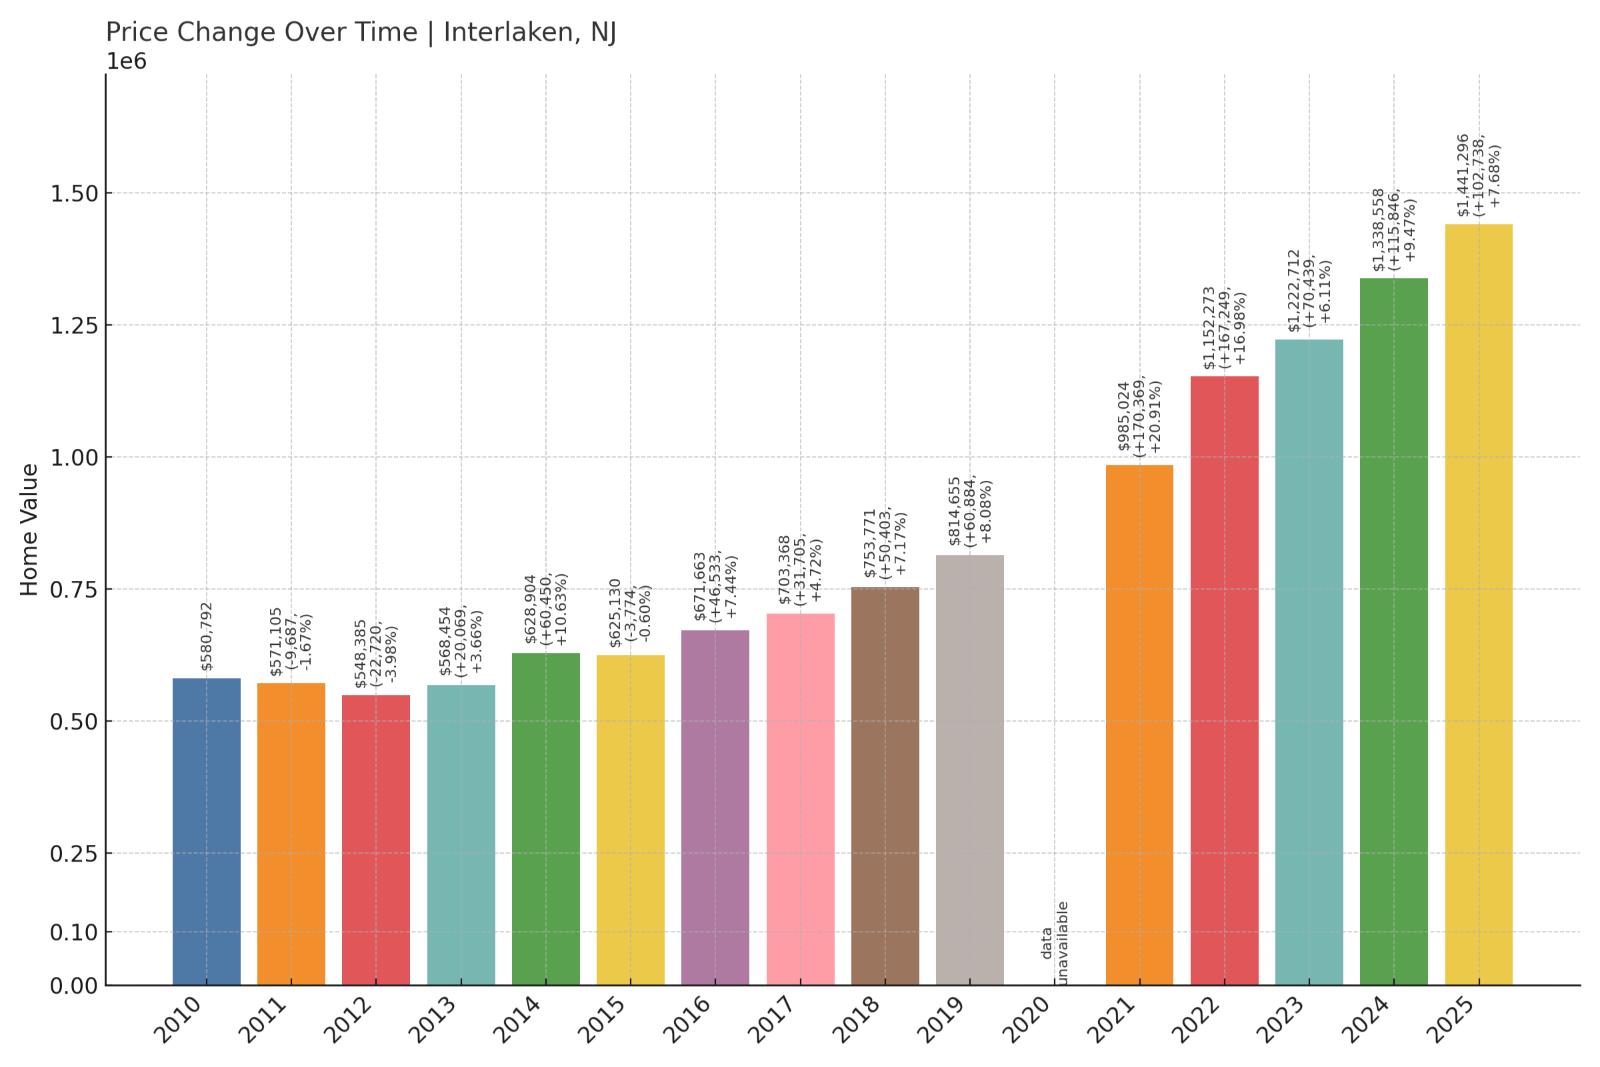
- Crash Risk Percentage: 89%
- Historical crashes (8%+ drops): 1
- Worst historical crash: -9.6% (2009)
- Total price increase since 2000: 406.9%
- Overextended above long-term average: 101.5%
- Price volatility (annual swings): 6.4%
- Current 2025 price: $1,441,296
Interlaken’s astronomical 406.9% price growth has created the second-highest overextension at 101.5% above sustainable levels. This tiny Monmouth County borough’s median price of $1.44 million represents extreme luxury market vulnerability with prices more than double their mathematical support level.
Interlaken – Millionaire Enclave On Borrowed Time
This tiny Monmouth County borough of less than 900 residents has transformed into one of New Jersey’s most exclusive residential enclaves, with a median home price of $1,441,296 that reflects its proximity to Deal and other wealthy Shore communities. Interlaken’s 406.9% appreciation since 2000 represents one of the state’s most extreme price escalations, pushing current valuations 101.5% above long-term sustainable levels. Even the luxury market cannot sustain prices more than double their mathematical foundation indefinitely.
Interlaken’s small size and exclusivity create both appeal and vulnerability. The borough’s limited housing stock can experience dramatic price swings when market conditions change, as demonstrated by the 9.6% decline in 2009. While 6.4% annual volatility appears moderate compared to other high-risk markets, the extreme overvaluation of 101.5% suggests mathematical correction is likely regardless of overall market stability. Luxury markets often experience the most severe corrections when economic conditions deteriorate, as discretionary real estate purchases become unaffordable for even wealthy buyers.
8. Brielle – Crash Risk Percentage: 89%
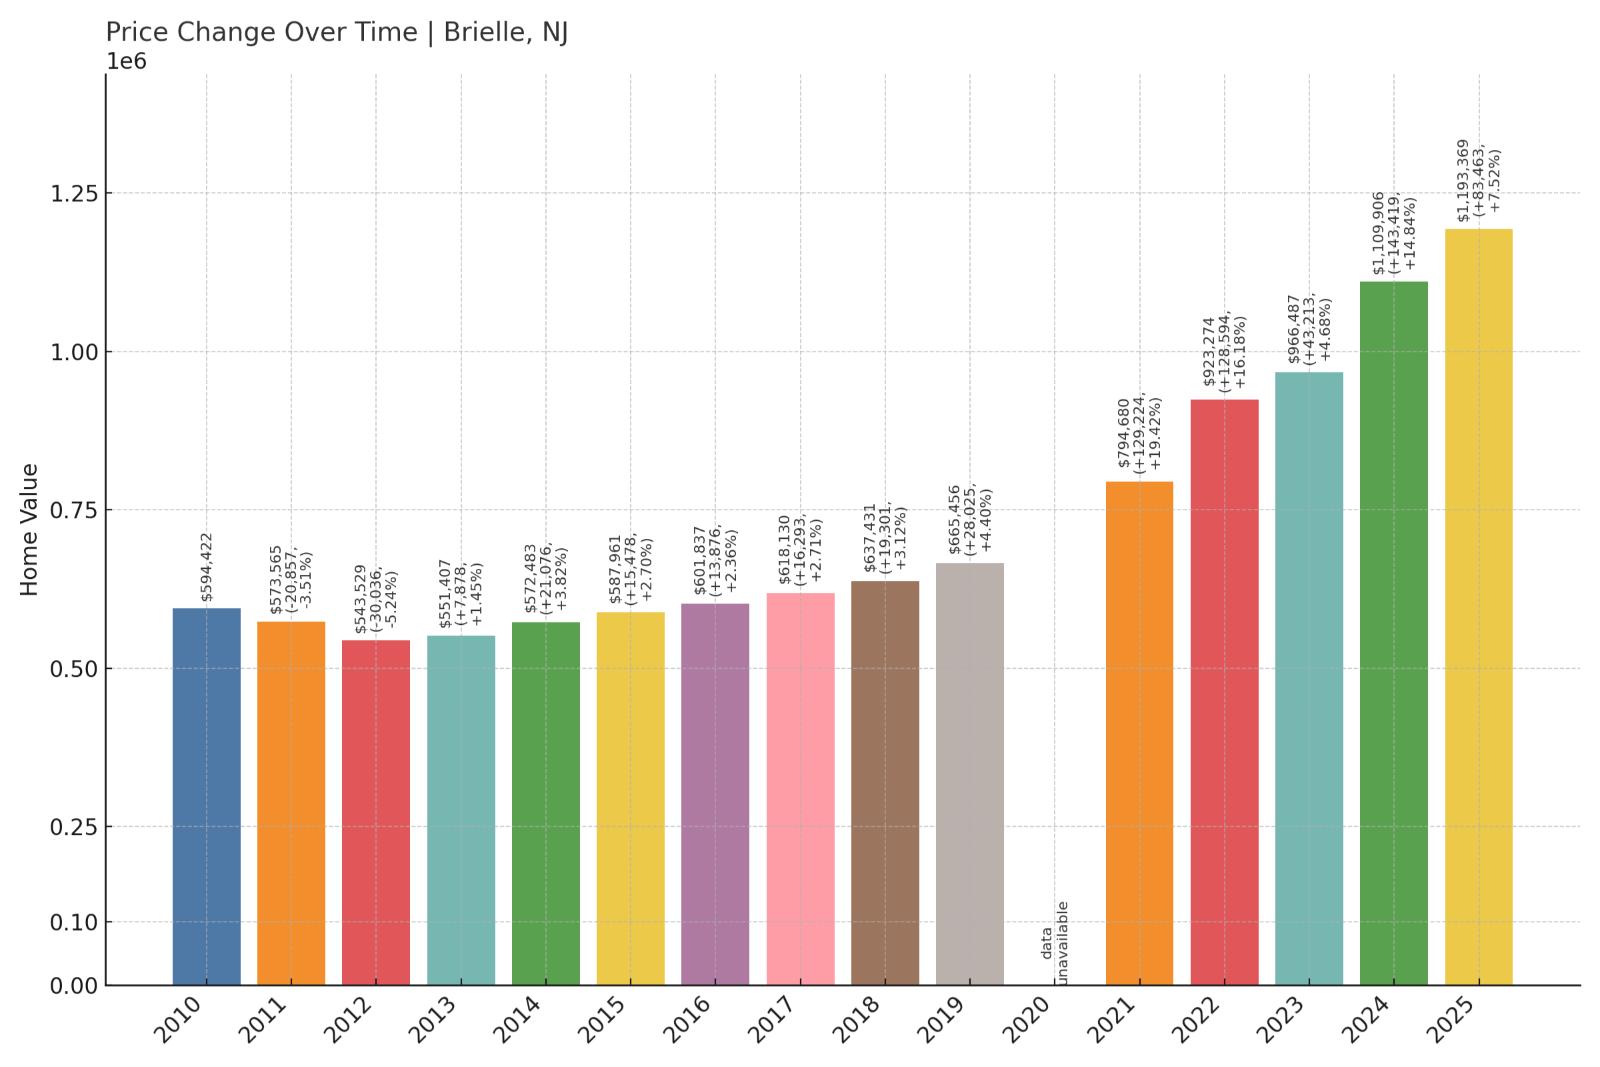
- Crash Risk Percentage: 89%
- Historical crashes (8%+ drops): 1
- Worst historical crash: -8.9% (2009)
- Total price increase since 2000: 269.7%
- Overextended above long-term average: 81.1%
- Price volatility (annual swings): 5.8%
- Current 2025 price: $1,193,369
Brielle’s median price of nearly $1.2 million reflects luxury coastal market dynamics, but the 269.7% appreciation since 2000 has pushed valuations 81.1% above sustainable levels. Despite relatively low volatility, the extreme overvaluation creates significant downside risk.
Brielle – Luxury Haven With Mathematical Headwinds
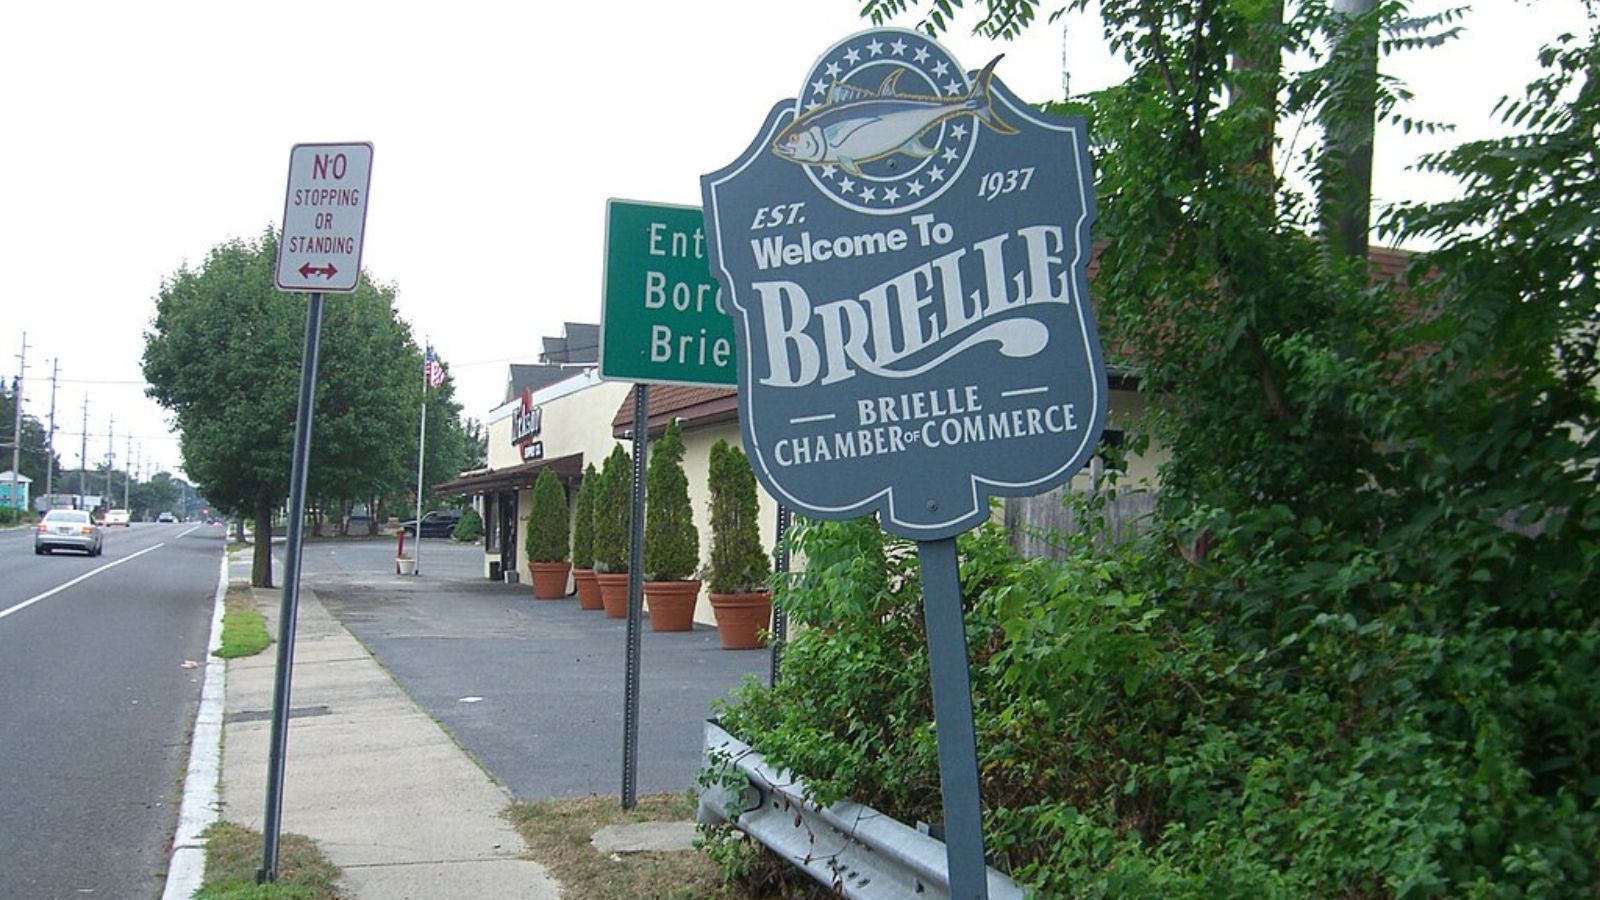
Located along the Manasquan River in Monmouth County, Brielle has established itself as an upscale residential community that attracts affluent buyers seeking waterfront and near-waterfront properties. The borough’s median home price of $1,193,369 reflects this luxury market positioning, but current valuations sit 81.1% above the market’s long-term sustainable average. Brielle’s 269.7% appreciation since 2000 has been driven by its desirable location and limited housing supply, but has now reached levels that appear mathematically unsustainable.
Brielle’s relatively low 5.8% annual volatility might suggest market stability, but this apparent calm often precedes significant corrections in luxury markets. The borough’s 8.9% decline in 2009 demonstrated how quickly even stable luxury markets can turn when economic conditions deteriorate. With extreme overvaluation exceeding 81% and a proven track record of price crashes, Brielle represents the type of high-end market that typically experiences severe corrections when broader economic pressures mount. Luxury real estate markets often lead both upward trends and downward corrections.
7. Keansburg – Crash Risk Percentage: 89%
🔥 Would you like to save this?
- Crash Risk Percentage: 89%
- Historical crashes (8%+ drops): 4
- Worst historical crash: -12.7% (2011)
- Total price increase since 2000: 315.4%
- Overextended above long-term average: 92.7%
- Price volatility (annual swings): 10.2%
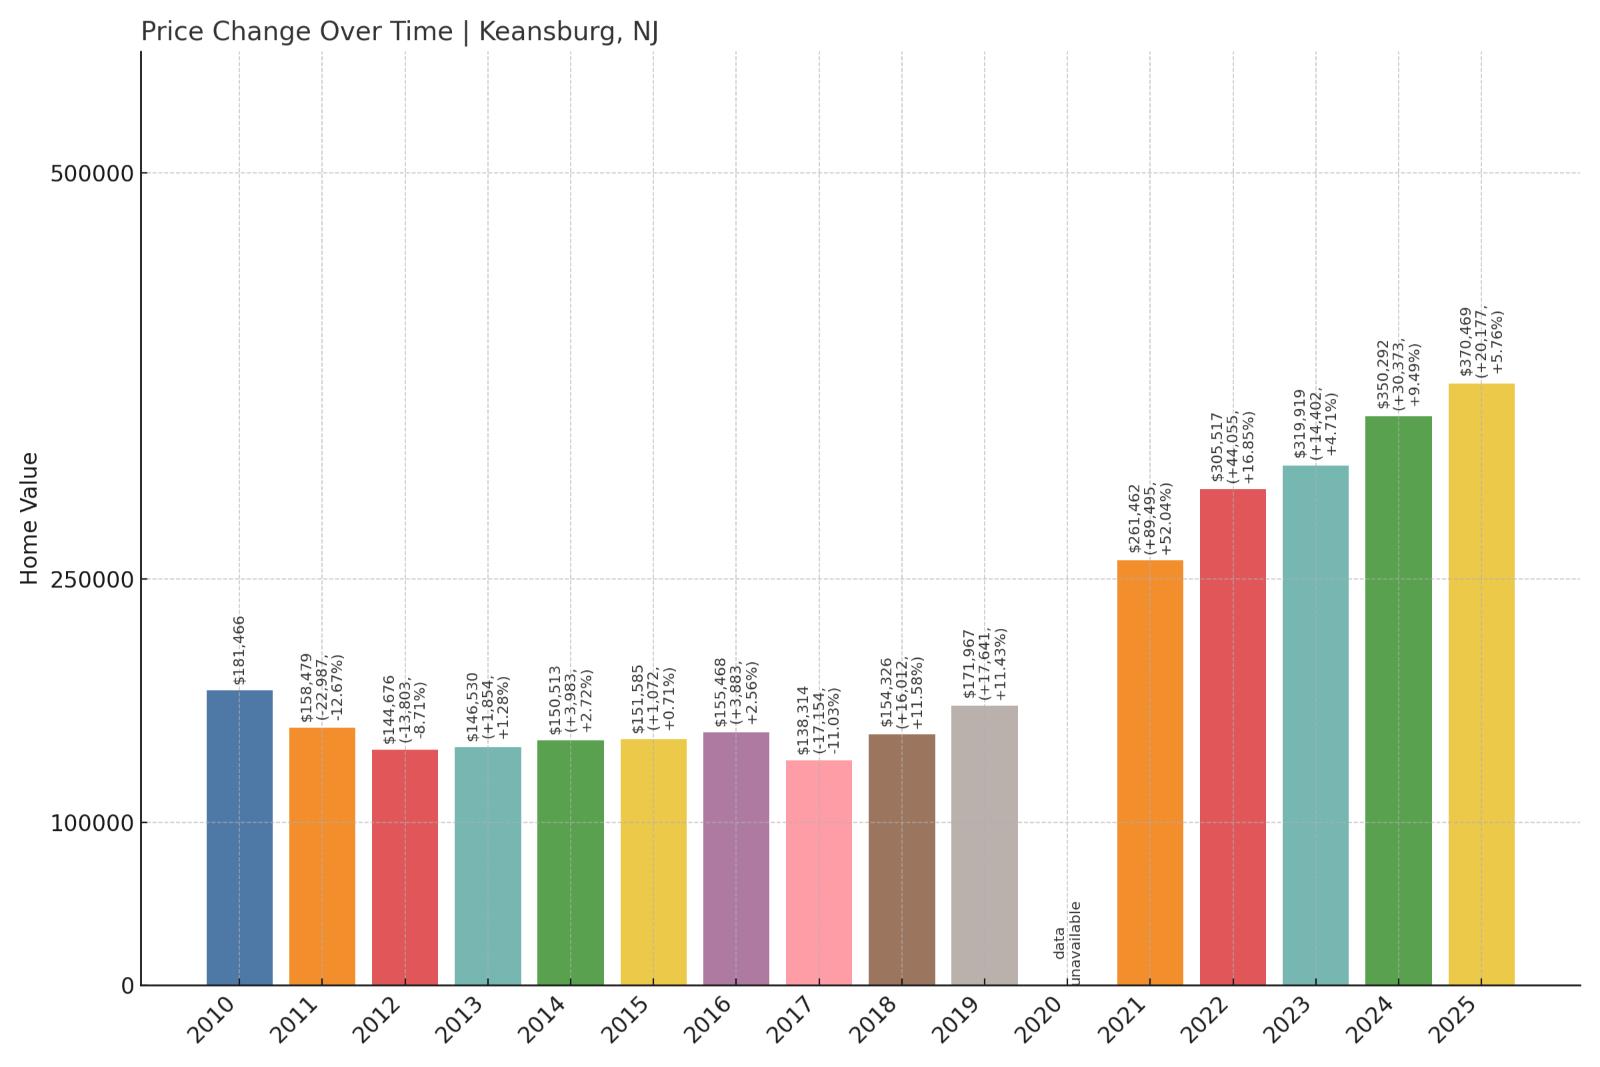
- Current 2025 price: $370,469
Keansburg combines four historical crashes with extreme 10.2% annual volatility, creating one of New Jersey’s most unstable housing markets. The borough’s 315.4% price growth has pushed the median to $370,469, a level 92.7% above sustainable averages.
Keansburg – Coastal Volatility Reaches Dangerous Levels

This Monmouth County coastal borough has developed a reputation for extreme housing market volatility, with four major crashes since 2000 and annual price swings averaging 10.2%. Keansburg’s median home price of $370,469 now sits 92.7% above the market’s long-term sustainable average, following 315.4% appreciation since 2000. The borough’s worst crash of 12.7% in 2011 demonstrates the severity of corrections that can occur when this volatile market turns negative.
Keansburg’s housing market reflects the challenges facing many New Jersey Shore communities that lack the amenities and exclusivity of their wealthier neighbors. The borough’s beachfront location provides some appeal, but aging infrastructure and modest economic base create ongoing pressures. The exceptional 10.2% annual volatility indicates a market where small changes in conditions can trigger dramatic price movements. With four historical crashes, extreme current overvaluation, and the highest volatility among high-risk markets, Keansburg appears positioned for another significant correction cycle.
6. Ship Bottom – Crash Risk Percentage: 90%
- Crash Risk Percentage: 90%
- Historical crashes (8%+ drops): 4
- Worst historical crash: -13.3% (2008)
- Total price increase since 2000: 312.6%
- Overextended above long-term average: 74.4%
- Price volatility (annual swings): 7.7%
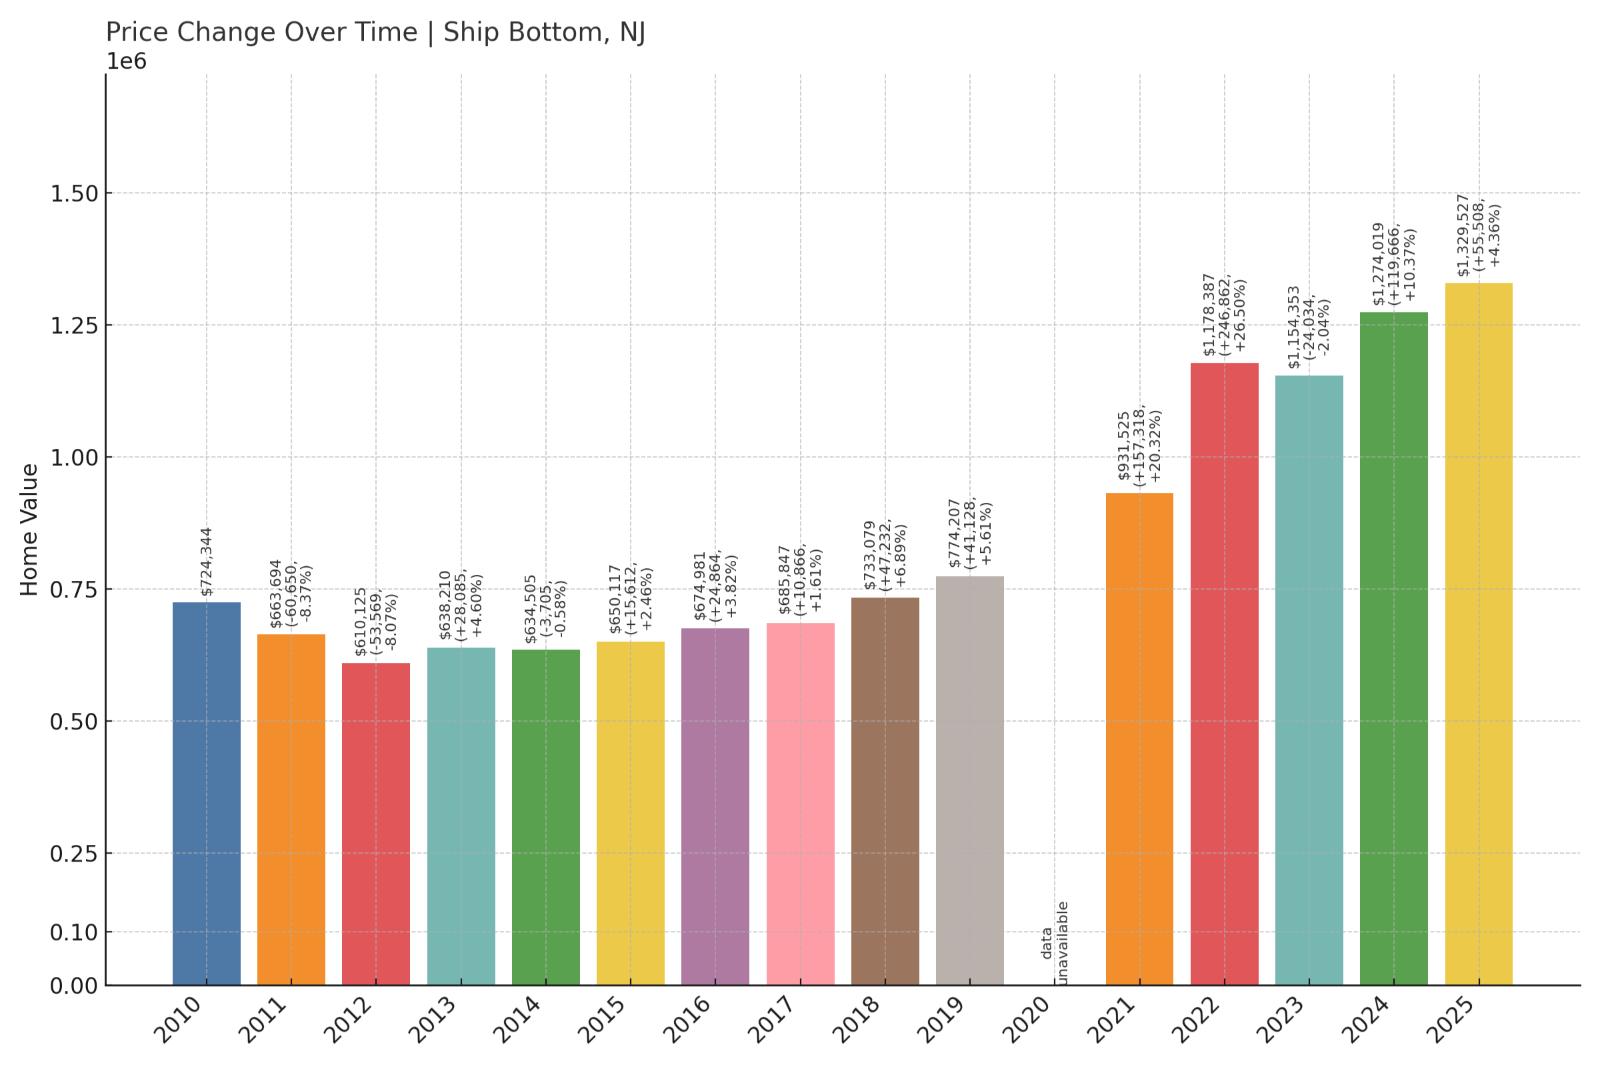
- Current 2025 price: $1,329,527
Ship Bottom’s four historical crashes and 312.6% price appreciation have created a dangerous combination on Long Beach Island. The borough’s median price of $1.33 million sits 74.4% above sustainable levels, with the 13.3% crash in 2008 demonstrating this luxury barrier island market’s vulnerability.
Ship Bottom – Barrier Island Beauty Meets Market Brutality
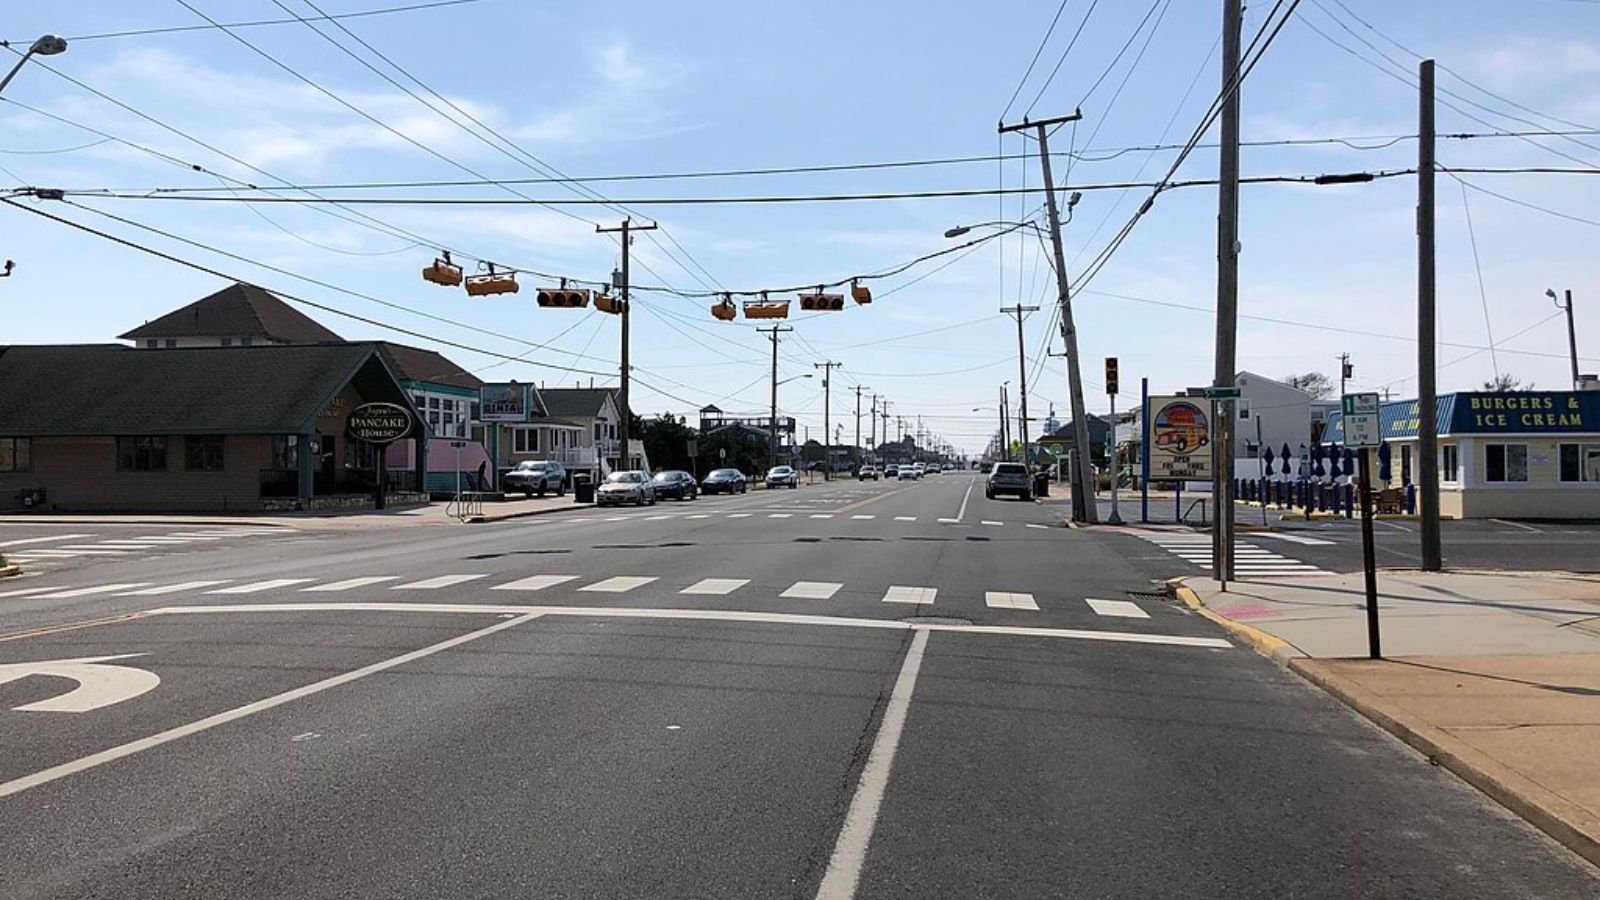
Located on Long Beach Island in Ocean County, Ship Bottom represents one of New Jersey’s premier barrier island communities, with oceanfront and bay-front properties commanding premium prices. The borough’s median home price of $1,329,527 reflects this exclusive coastal positioning, but current valuations sit 74.4% above the market’s long-term sustainable average. Ship Bottom’s four major crashes since 2000, including a devastating 13.3% decline in 2008, establish a clear pattern of vulnerability in this luxury vacation home market.
Ship Bottom’s economy depends almost entirely on seasonal tourism and vacation home ownership, creating inherent instability in housing demand. The borough’s 312.6% appreciation since 2000 has been driven by limited supply and high demand from wealthy buyers seeking Shore properties, but this extreme appreciation has now pushed prices well beyond fundamental support levels. The 7.7% annual volatility reflects the seasonal nature of this market, while the track record of four crashes demonstrates how quickly luxury coastal markets can correct when economic conditions deteriorate or discretionary spending declines.
5. Gloucester City – Crash Risk Percentage: 90%
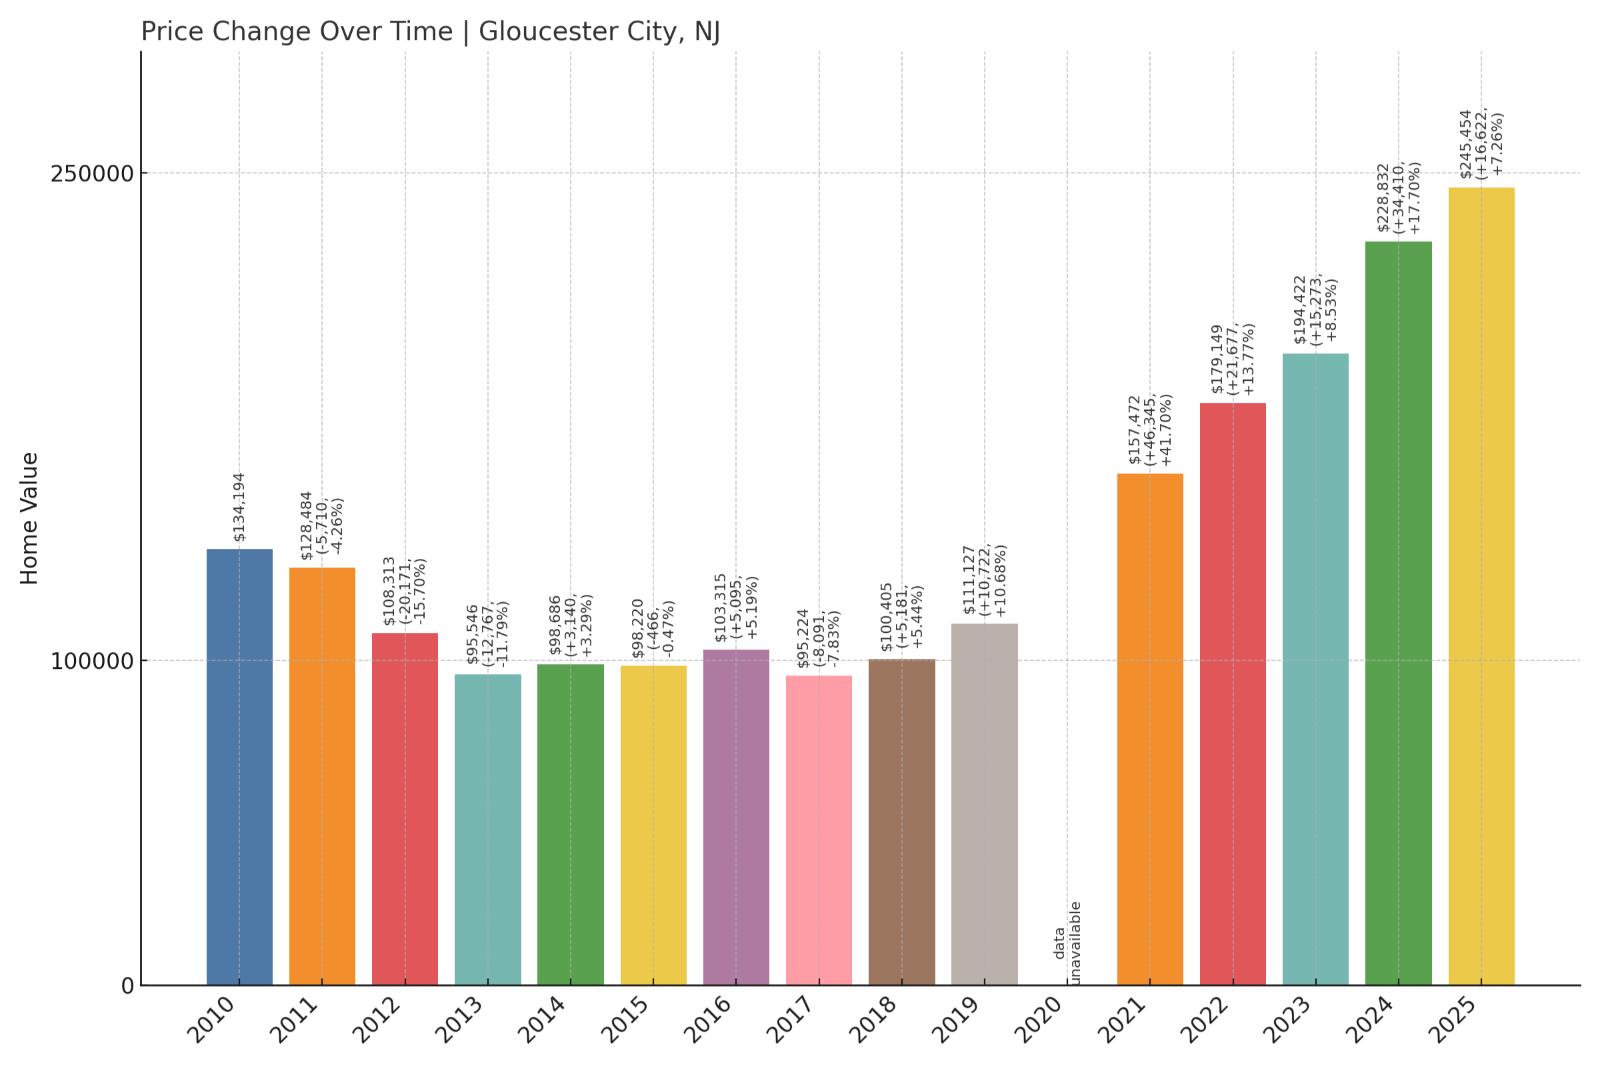
- Crash Risk Percentage: 90%
- Historical crashes (8%+ drops): 3
- Worst historical crash: -15.7% (2012)
- Total price increase since 2000: 206.6%
- Overextended above long-term average: 89.5%
- Price volatility (annual swings): 8.8%
- Current 2025 price: $245,454
Gloucester City’s 206.6% price growth has pushed this Camden County riverfront community 89.5% above sustainable levels despite relatively modest current prices. Three historical crashes, including a brutal 15.7% decline in 2012, highlight the market’s crash-prone nature.
Gloucester City – Delaware River Location Can’t Justify Overvaluation
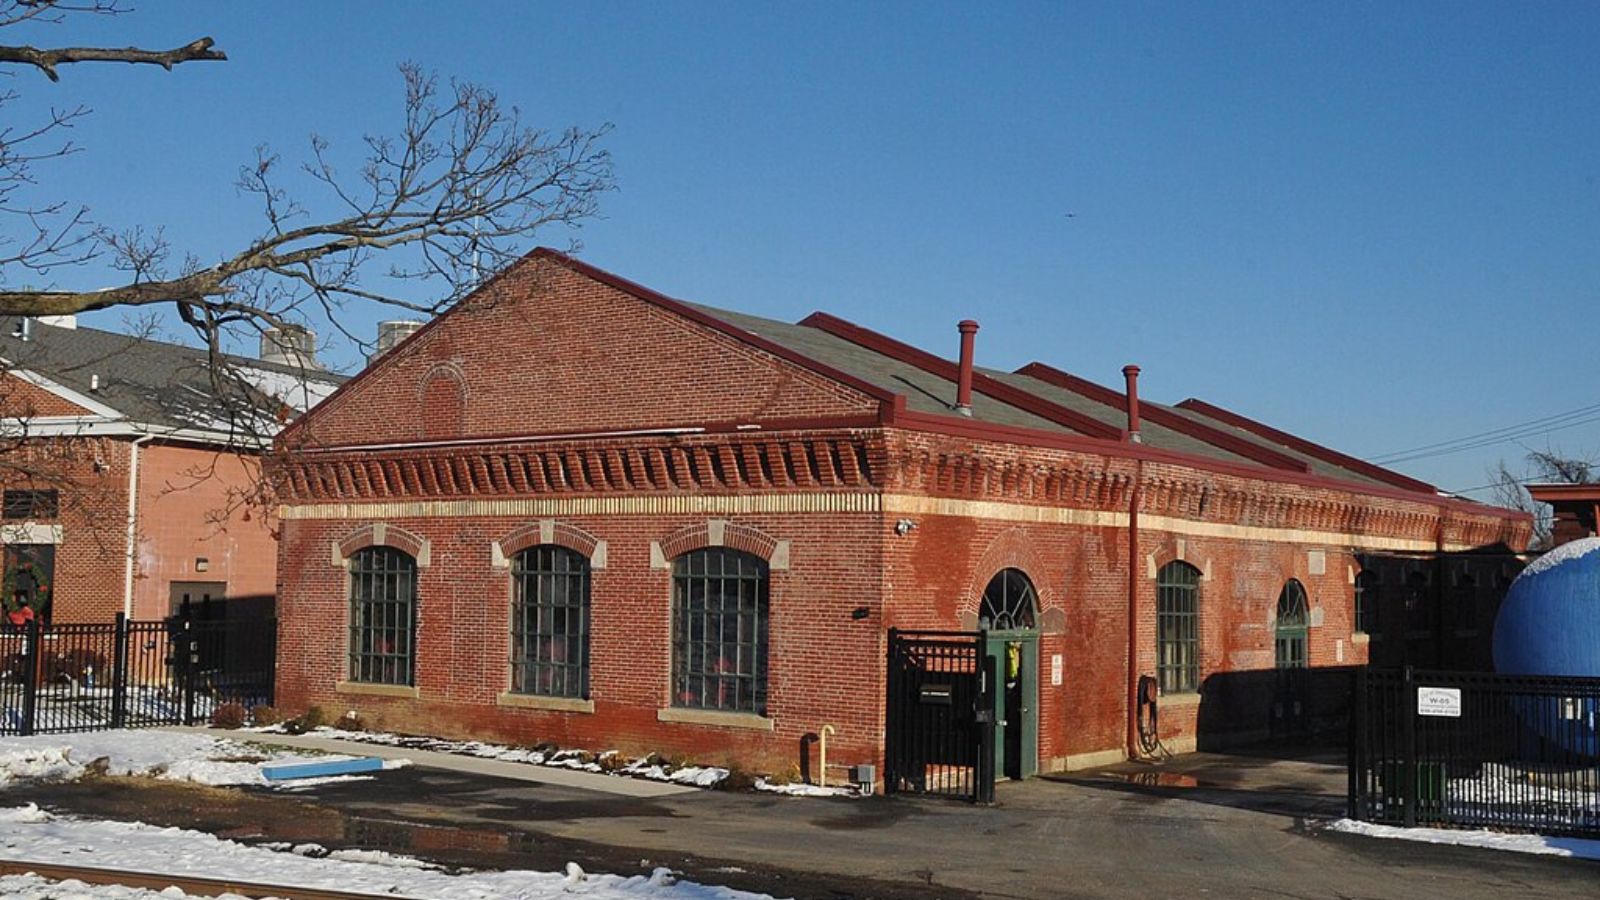
Situated along the Delaware River directly across from Philadelphia, Gloucester City benefits from proximity to major employment centers while maintaining relatively affordable housing compared to other high-risk markets. However, the city’s median home price of $245,454 still sits 89.5% above its long-term sustainable average, following 206.6% appreciation since 2000. Gloucester City has experienced three major crashes since 2000, with the worst decline of 15.7% in 2012 coinciding with broader regional economic stress.
Gloucester City’s riverfront location and Philadelphia access provide some economic advantages, but the city faces typical urban challenges including aging infrastructure and limited local economic development. The 8.8% annual price volatility indicates ongoing market instability, while the pattern of three major crashes suggests underlying structural vulnerabilities. Despite current prices appearing modest compared to luxury coastal markets, the extreme 89.5% overvaluation indicates that even this working-class community has pushed valuations well beyond sustainable levels, creating significant downside risk.
4. Pleasantville – Crash Risk Percentage: 90%
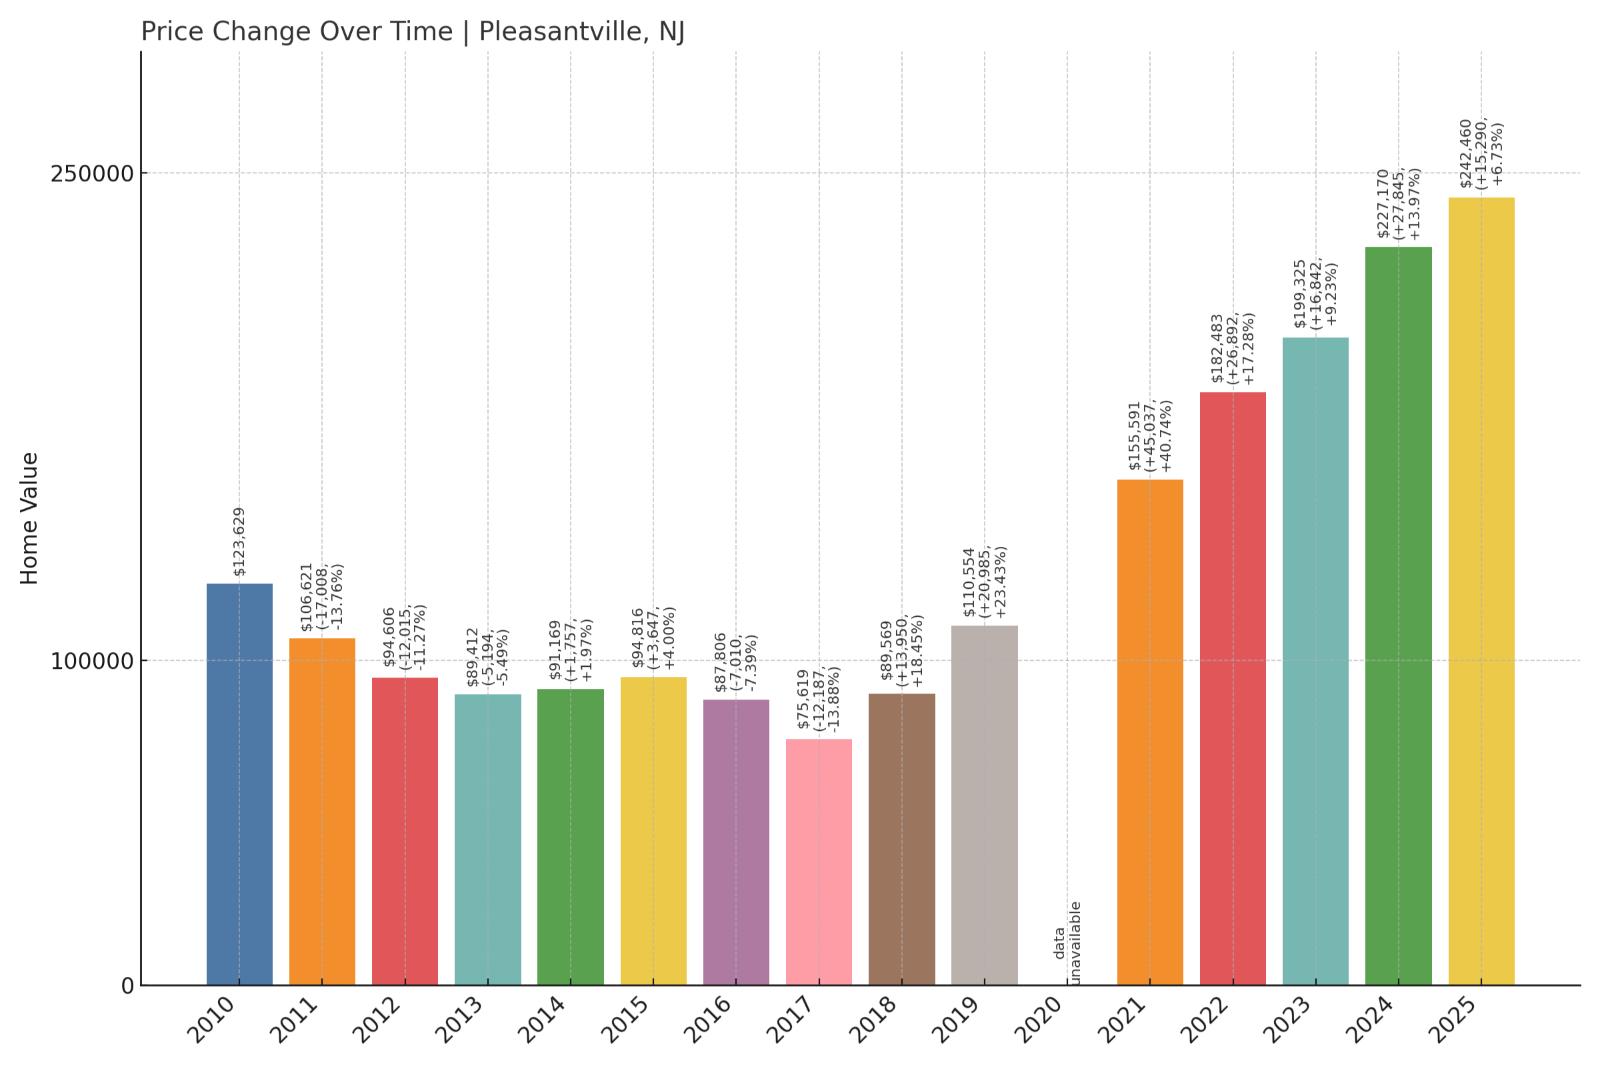
- Crash Risk Percentage: 90%
- Historical crashes (8%+ drops): 5
- Worst historical crash: -16.3% (2009)
- Total price increase since 2000: 242.5%
- Overextended above long-term average: 91.7%
- Price volatility (annual swings): 8.5%
- Current 2025 price: $242,460
Pleasantville ranks among New Jersey’s most crash-prone markets with five historical declines exceeding 8%, including a devastating 16.3% collapse in 2009. The city’s current 91.7% overextension and pattern of repeated crashes suggest another correction cycle may be imminent.
Pleasantville – Serial Crasher Shows No Signs Of Stability
This Atlantic County city adjacent to Atlantic City has established itself as one of New Jersey’s most crash-prone housing markets, with five major price declines since 2000 culminating in a brutal 16.3% collapse during the 2009 financial crisis. Pleasantville’s median home price of $242,460 might appear modest, but current valuations sit 91.7% above the market’s long-term sustainable average following 242.5% appreciation since 2000. The city’s proximity to Atlantic City provides employment access but also exposes it to the volatility of the casino and tourism industries.
Pleasantville’s economic fundamentals reflect typical challenges facing small urban communities near major economic centers. The city benefits from spillover employment and development from Atlantic City, but also inherits exposure to the gaming industry’s boom-and-bust cycles. The pattern of five major crashes demonstrates exceptional market vulnerability that appears to be structural rather than cyclical. With 8.5% annual volatility and extreme overvaluation exceeding 91%, Pleasantville represents a textbook example of a housing market that crashes repeatedly due to underlying economic instability and speculative pricing.
3. Deal – Crash Risk Percentage: 92%
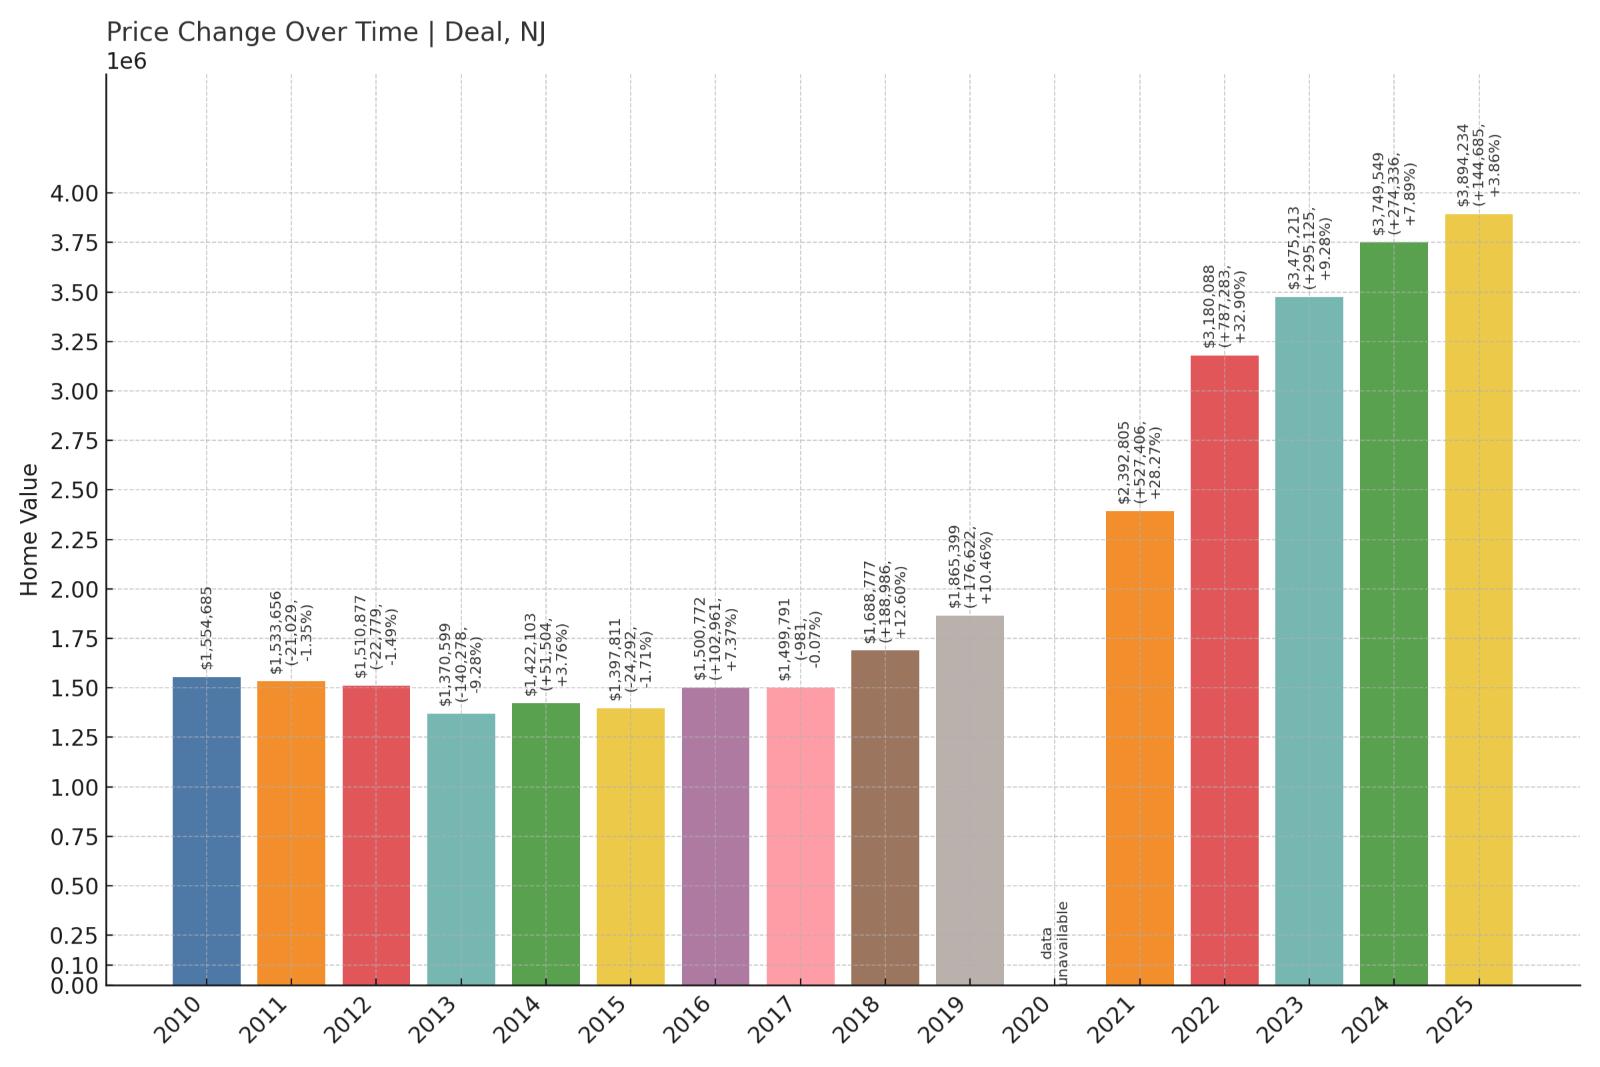
- Crash Risk Percentage: 92%
- Historical crashes (8%+ drops): 1
- Worst historical crash: -9.3% (2013)
- Total price increase since 2000: 680.6%
- Overextended above long-term average: 123.9%
- Price volatility (annual swings): 9.4%
- Current 2025 price: $3,894,234
Deal represents the ultimate example of mathematical impossibility in housing, with prices sitting an astronomical 123.9% above sustainable levels. The borough’s median price of $3.89 million and 680.6% appreciation since 2000 have created the most extreme overvaluation in New Jersey.
Deal – Where Mathematics Meets Millionaire Madness
🔥 Would you like to save this?
Deal stands as New Jersey’s most mathematically impossible housing market, with a median home price of $3,894,234 that sits an unprecedented 123.9% above sustainable levels. This Monmouth County Shore borough’s 680.6% appreciation since 2000 represents the most extreme price escalation in the state, pushing luxury oceanfront properties to valuations that appear disconnected from any reasonable economic foundation. Even considering Deal’s status as an ultra-exclusive enclave, current prices exceed mathematical sustainability by such margins that correction appears inevitable.
Deal’s reputation as a playground for ultra-wealthy buyers has driven speculative pricing that now exceeds even luxury market norms. The borough’s proximity to New York City and exclusive Shore amenities justify premium pricing, but not at levels exceeding 123% above historical averages. The 9.3% decline in 2013 demonstrated that even this rarified market can experience corrections, while 9.4% annual volatility indicates ongoing instability despite extreme valuations. When luxury markets reach levels more than double their mathematical foundation, even the wealthiest buyers eventually recognize overvaluation, typically triggering severe corrections.
2. Sea Girt – Crash Risk Percentage: 92%
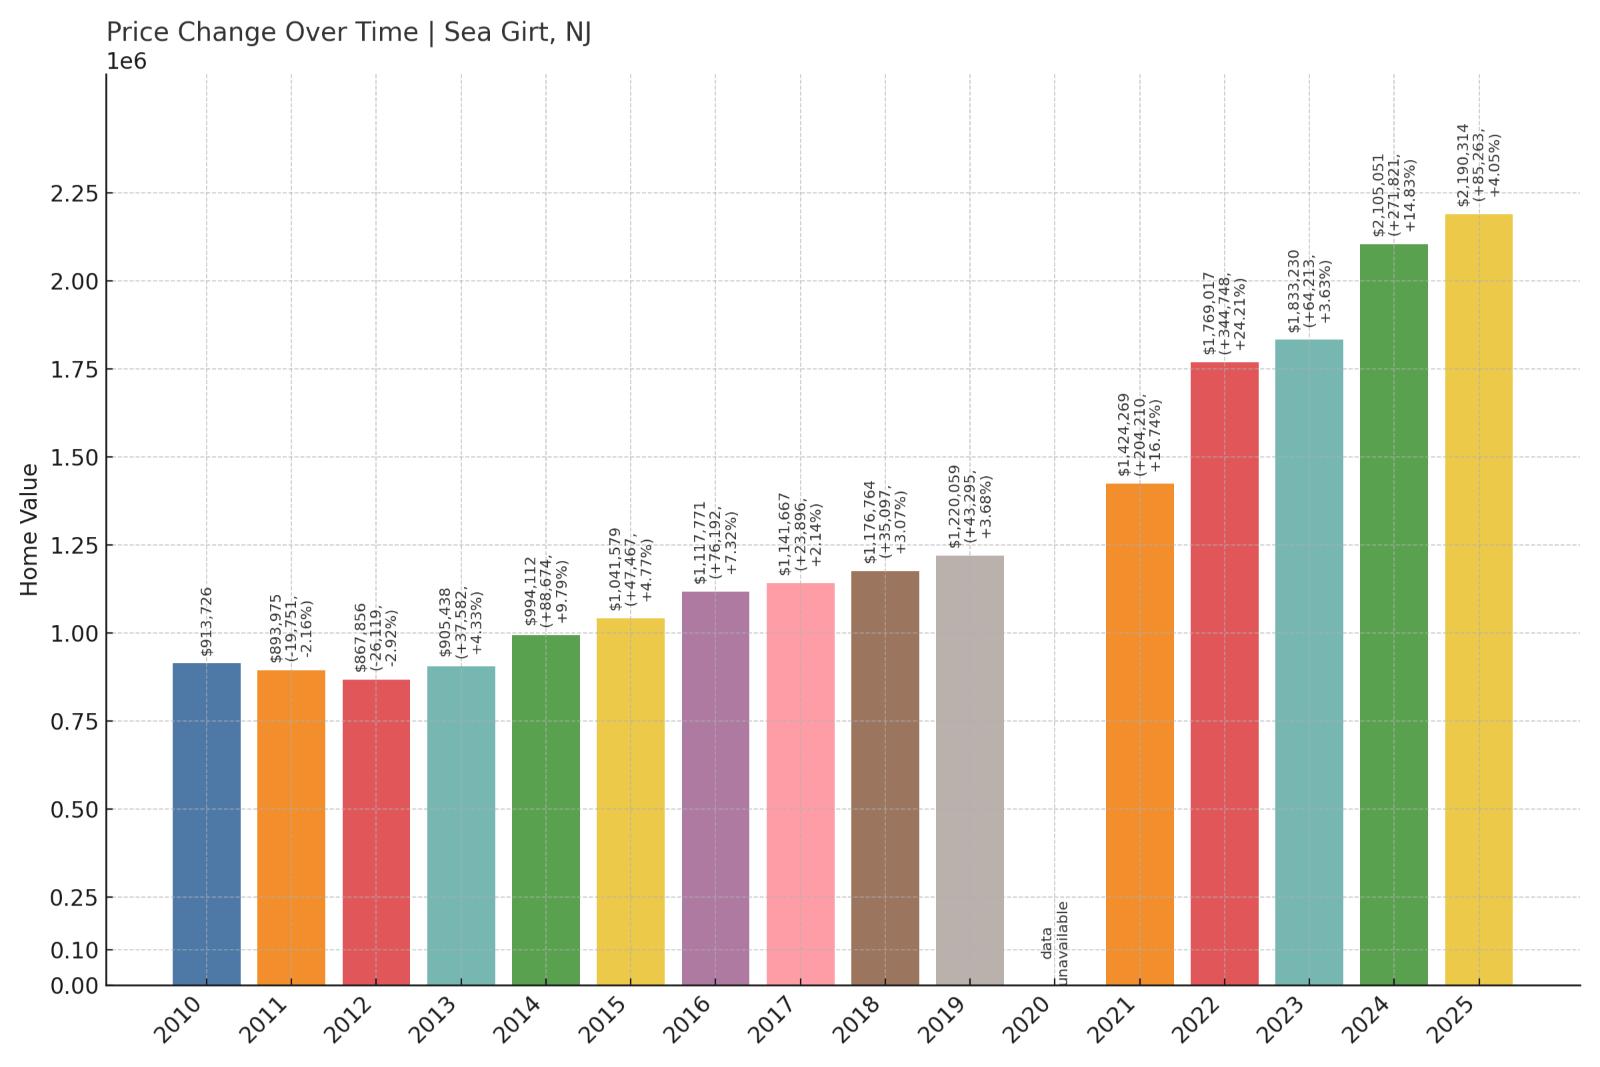
- Crash Risk Percentage: 92%
- Historical crashes (8%+ drops): 1
- Worst historical crash: -9.3% (2009)
- Total price increase since 2000: 408.5%
- Overextended above long-term average: 97.8%
- Price volatility (annual swings): 7.1%
- Current 2025 price: $2,190,314
Sea Girt’s 408.5% appreciation has pushed this exclusive Monmouth County borough 97.8% above sustainable levels. The median price of $2.19 million reflects luxury Shore market dynamics, but current valuations appear mathematically unsustainable even for this prestigious address.
Sea Girt – Prestigious Address, Precarious Pricing
This exclusive Monmouth County Shore borough has long been considered one of New Jersey’s most prestigious residential addresses, attracting wealthy buyers who value its pristine beaches, historic character, and proximity to New York City. Sea Girt’s median home price of $2,190,314 reflects this ultra-luxury positioning, but current valuations sit 97.8% above the market’s long-term sustainable average following 408.5% appreciation since 2000. Even in the context of luxury Shore real estate, these valuations appear to have pushed well beyond reasonable mathematical support.
Sea Girt’s appeal stems from its combination of oceanfront location, historic Victorian architecture, and small-town exclusivity that attracts discerning buyers. However, the borough’s 9.3% decline in 2009 demonstrated that even this prestigious market can experience corrections when broader economic conditions deteriorate. The 7.1% annual volatility appears moderate for a luxury market, but the extreme 97.8% overvaluation suggests mathematical correction is likely regardless of market stability. When luxury markets approach double their sustainable price levels, even wealthy buyers eventually recognize overvaluation and adjust their purchasing behavior accordingly.
1. Woodlynne – Crash Risk Percentage: 95%
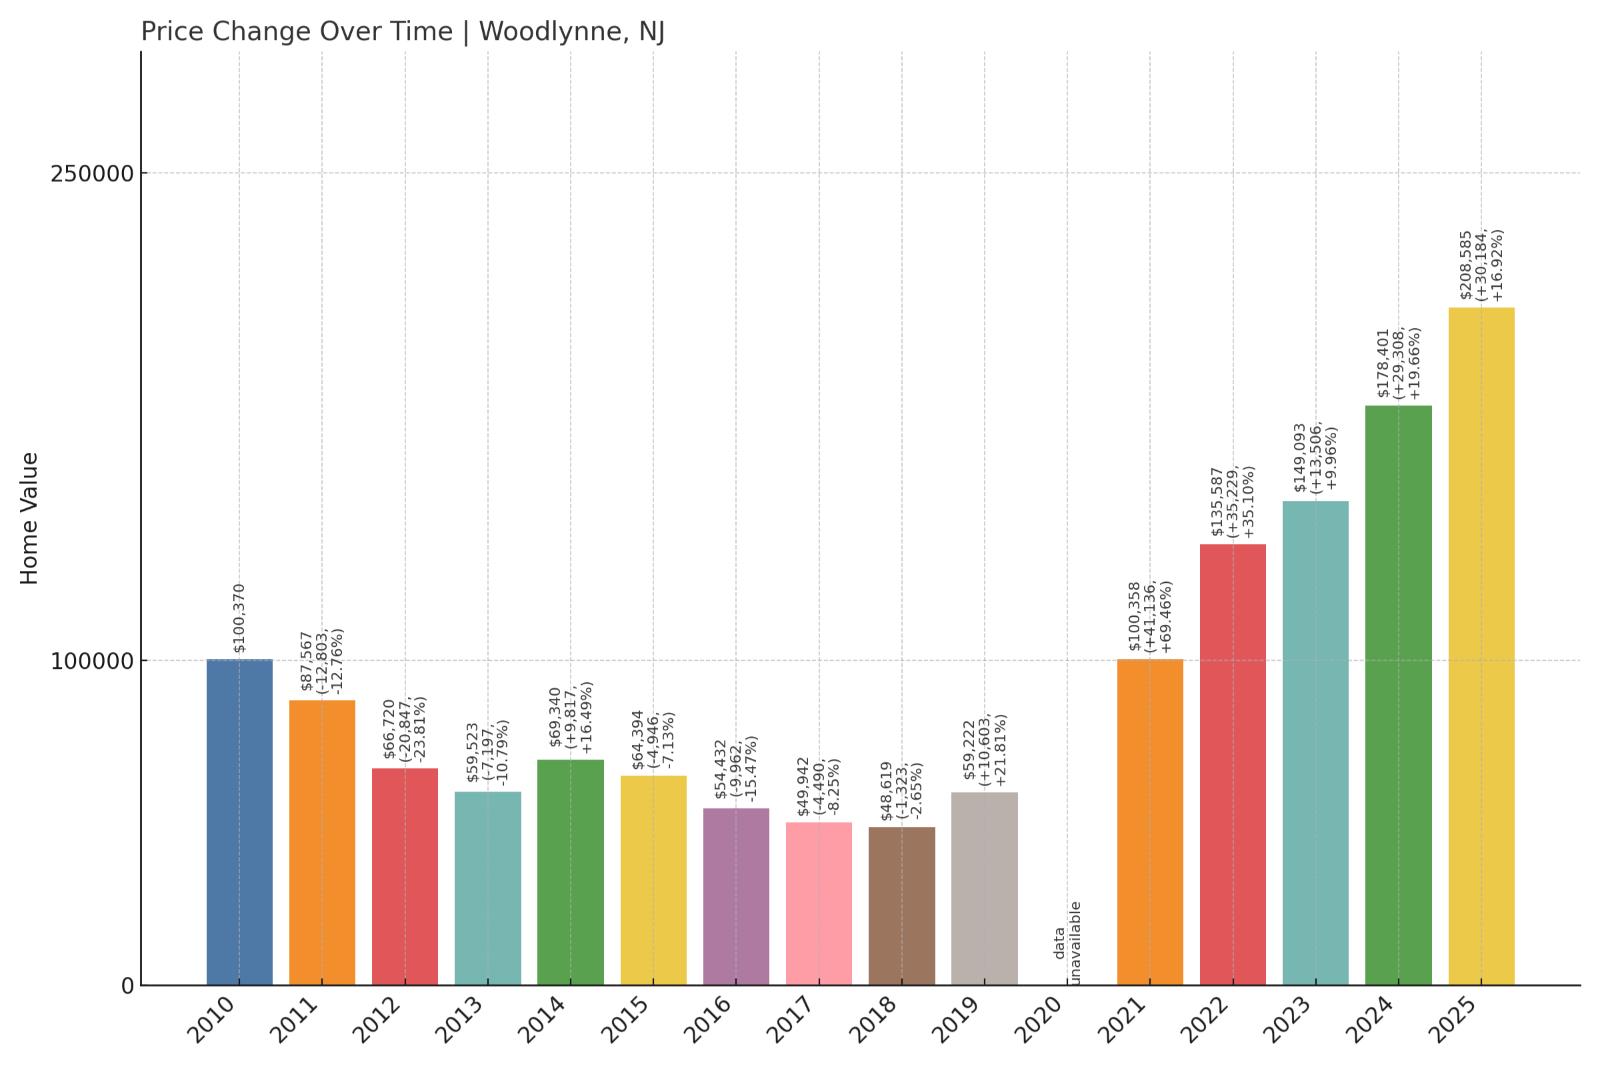
- Crash Risk Percentage: 95%
- Historical crashes (8%+ drops): 5
- Worst historical crash: -23.8% (2012)
- Total price increase since 2000: 268.5%
- Overextended above long-term average: 126.1%
- Price volatility (annual swings): 13.5%
- Current 2025 price: $208,585
Woodlynne tops our crash risk rankings with the most extreme overextension at 126.1% above sustainable levels and catastrophic 13.5% annual volatility. Five historical crashes, including a devastating 23.8% collapse in 2012, combined with the highest overvaluation in New Jersey, create a perfect storm for another severe correction.
Woodlynne – The Perfect Storm Of Housing Market Disaster
Woodlynne represents the apex of housing market vulnerability in New Jersey, combining the most extreme overvaluation at 126.1% above sustainable levels with the most volatile pricing at 13.5% annual swings. This tiny Camden County borough’s median home price of $208,585 might appear modest, but current valuations exceed mathematical sustainability by the largest margin in the state. Woodlynne has crashed five times since 2000, with the catastrophic 23.8% decline in 2012 representing one of New Jersey’s most severe housing corrections.
Woodlynne’s fundamental economic challenges create ongoing pressures that make sustained price appreciation virtually impossible. The borough lacks significant economic drivers, faces typical urban challenges including infrastructure needs and limited development prospects, yet somehow maintains prices more than double their sustainable level. The exceptional 13.5% annual volatility indicates a market where dramatic price swings occur regularly, while the pattern of five major crashes suggests structural problems that prevent stable appreciation. With the most extreme overvaluation and highest crash risk in New Jersey, Woodlynne appears mathematically certain to experience another severe correction.
For homeowners in these communities, the data provides clear guidance: current valuations appear unsustainable based on 15 years of historical patterns. Buyers should approach these markets with extreme caution, recognizing that purchasing at current price levels carries significant downside risk. The combination of proven crash histories, extreme overvaluations, and high volatility creates a perfect storm where significant price corrections appear not just likely, but mathematically inevitable


