Would you like to save this?
I’ve analyzed data from the Zillow Home Value Index to identify Nevada’s top-performing housing markets over the past decade. The results reveal fascinating patterns of growth across the Silver State’s diverse communities.
What stands out is how smaller towns like Silver Springs and Pahrump have outperformed traditional hotspots, delivering extraordinary returns for early investors. These communities represent a major shift in where housing demand is concentrating in Nevada.
The data suggests we’re witnessing a redistribution of housing wealth across Nevada, with impressive gains even in areas previously overlooked. For investors and homeowners alike, these trends indicate potential opportunities in less conventional markets.
24. Smith

Historic prices and percent change over time:
- % change from 2016 to 2025: 91.93%
- 2025: $573,958
- 2024: $544,826
- 2023: $526,893
- 2022: $573,561
- 2021: $479,186
- 2020: $417,455
- 2019: $384,824
- 2018: $348,364
- 2017: $317,716
- 2016: $299,040
About Smith
With median home values approaching $574,000, Smith offers compelling financial performance with a 91.93% appreciation since 2016. Your investment potential here remains strong, with price momentum indicating further upside despite recent market headwinds. The town’s growth trajectory suggests a favorable environment for both near-term flips and long-term holds. Strategic buyers might consider Smith’s relative value compared to nearby luxury markets.
23. Gardnerville

Historic prices and percent change over time:
- % change from 2016 to 2025: 92.29%
- 2025: $586,755
- 2024: $573,420
- 2023: $556,081
- 2022: $594,422
- 2021: $499,676
- 2020: $432,205
- 2019: $404,667
- 2018: $368,477
- 2017: $333,035
- 2016: $305,147
About Gardnerville
With a median home value of $586,755, Gardnerville presents a solid wealth-building opportunity after gaining 92.29% since 2016. Your investment prospects look promising as the market shows resilience despite post-pandemic adjustments. The price trajectory suggests both immediate equity potential and long-term appreciation above state averages. Financially savvy buyers might leverage this growth corridor’s continuing momentum in the Carson Valley region.
22. Glenbrook
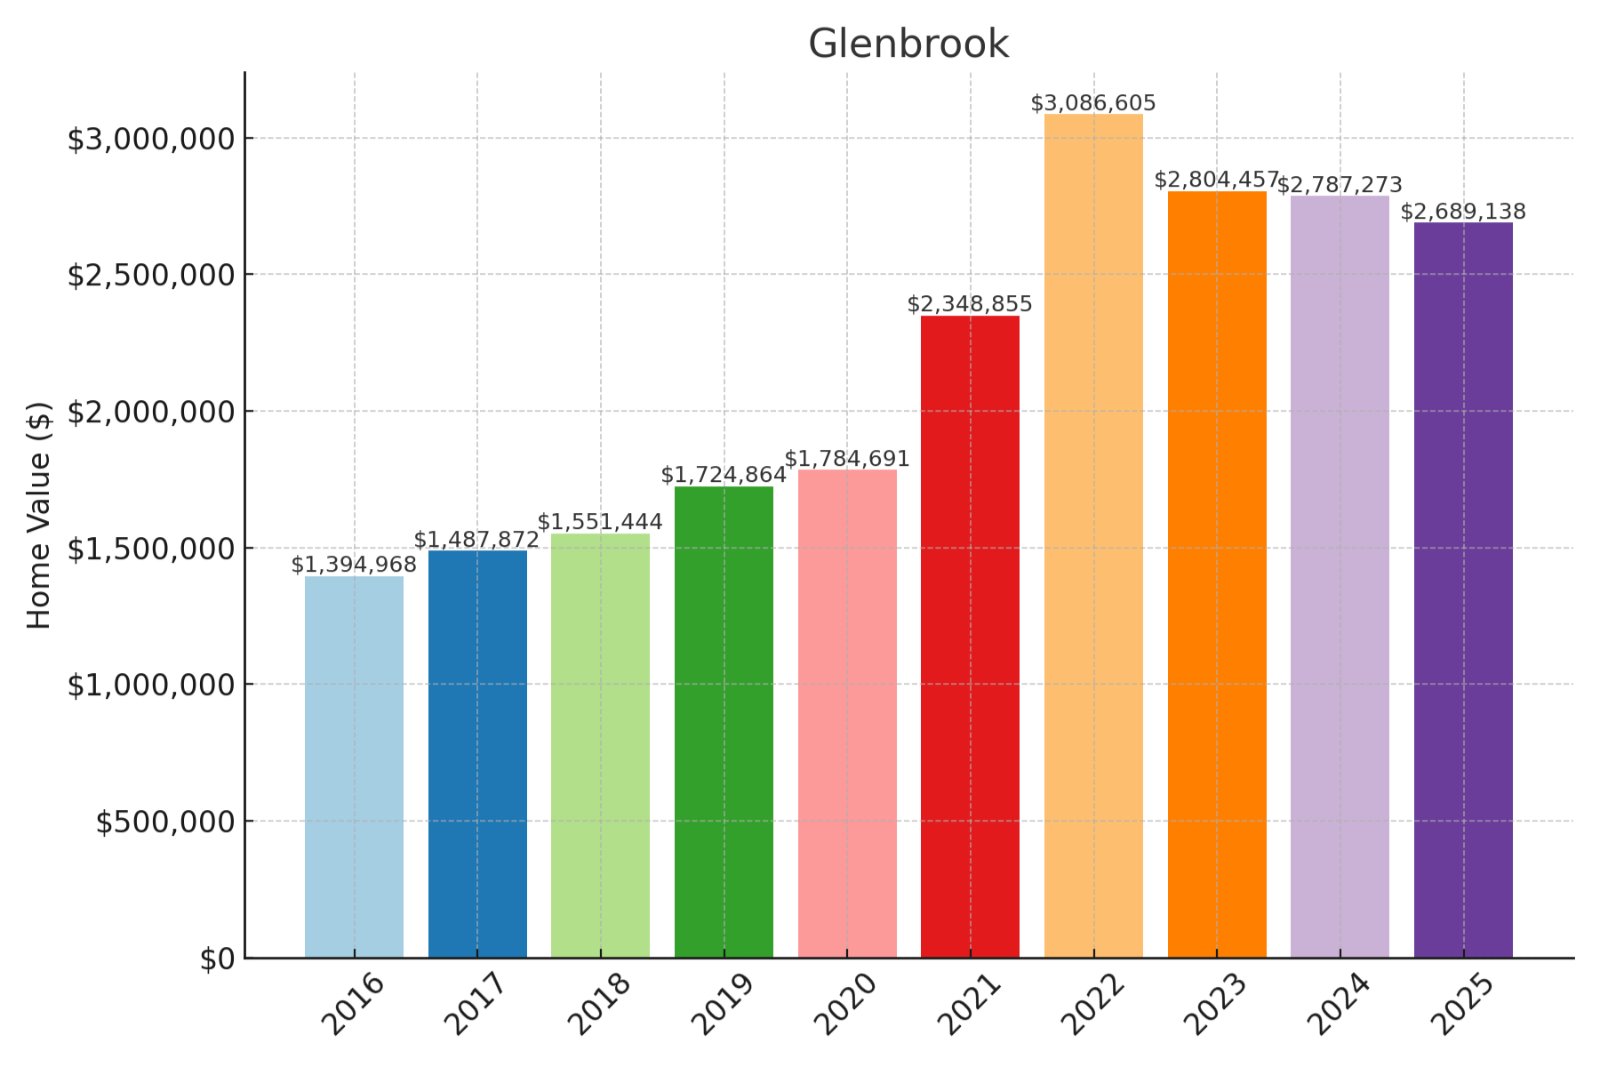
Historic prices and percent change over time:
- % change from 2016 to 2025: 92.77%
- 2025: $2,689,138
- 2024: $2,787,273
- 2023: $2,804,457
- 2022: $3,086,605
- 2021: $2,348,855
- 2020: $1,784,691
- 2019: $1,724,864
- 2018: $1,551,444
- 2017: $1,487,872
- 2016: $1,394,968
About Glenbrook
At $2.69M median value, Glenbrook represents Nevada’s luxury market with impressive 92.77% appreciation since 2016. Your investment in this premium enclave captures both exclusivity and financial growth potential despite recent plateau. The high-end price point creates significant wealth preservation opportunities alongside tax advantages unique to Nevada. Value-conscious luxury buyers might note Glenbrook offers relative value compared to California Tahoe communities.
21. Verdi
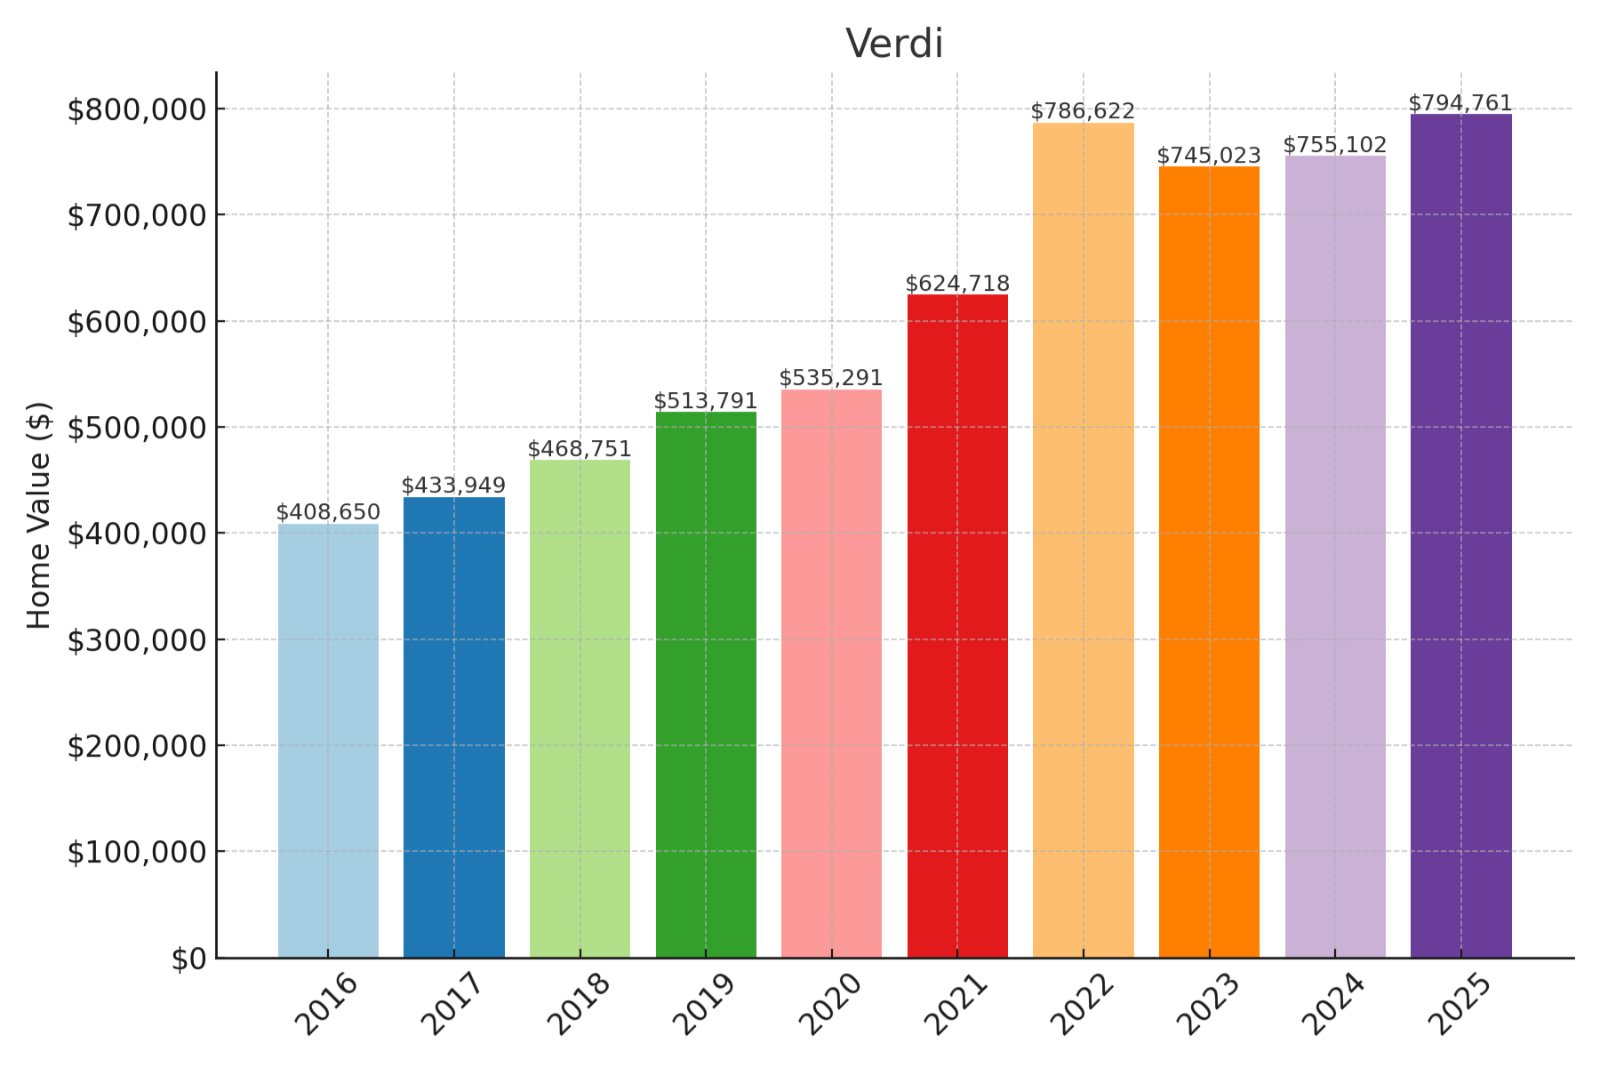
Historic prices and percent change over time:
- % change from 2016 to 2025: 94.48%
- 2025: $794,761
- 2024: $755,102
- 2023: $745,023
- 2022: $786,622
- 2021: $624,718
- 2020: $535,291
- 2019: $513,791
- 2018: $468,751
- 2017: $433,949
- 2016: $408,650
About Verdi
With median values approaching $795,000, Verdi’s 94.48% growth since 2016 demonstrates exceptional investment performance. Your capital appreciation prospects remain strong in this high-demand area despite broader market cooling. The price trajectory indicates healthy future returns with particular appeal for equity-rich California transplants. Financially, Verdi represents a strategic opportunity to capture both lifestyle premium and continued price momentum.
20. Moapa
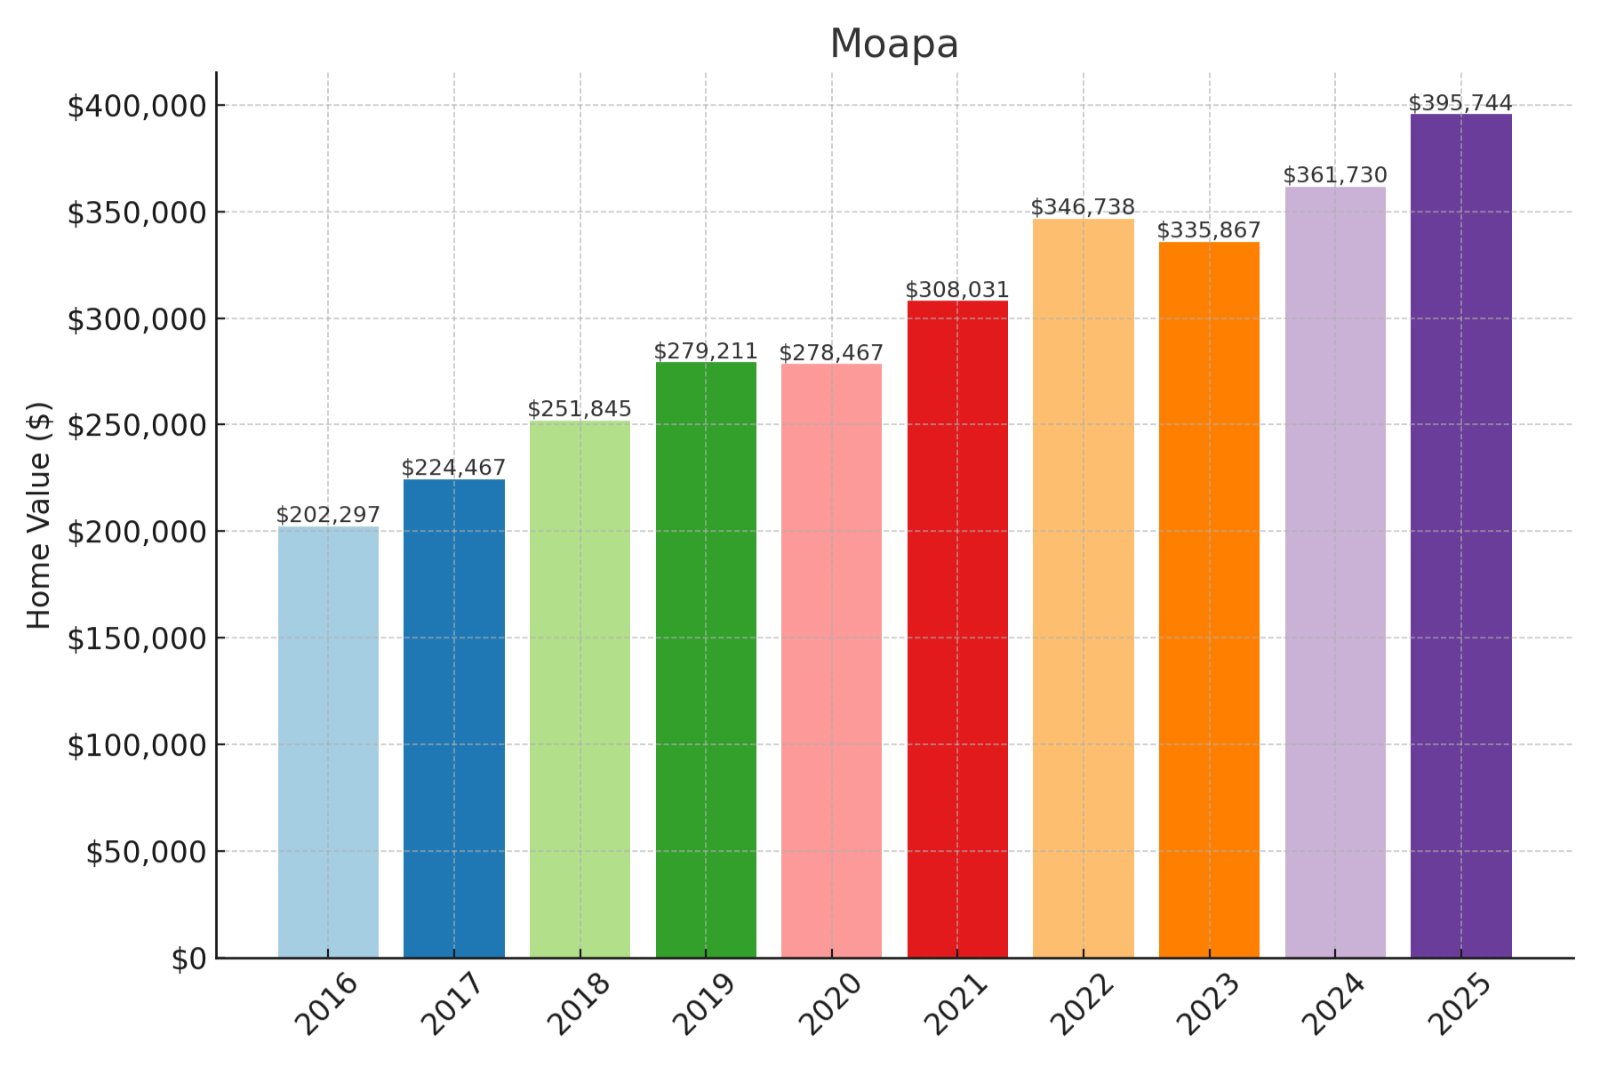
Historic prices and percent change over time:
- % change from 2016 to 2025: 95.63%
- 2025: $395,744
- 2024: $361,730
- 2023: $335,867
- 2022: $346,738
- 2021: $308,031
- 2020: $278,467
- 2019: $279,211
- 2018: $251,845
- 2017: $224,467
- 2016: $202,297
About Moapa
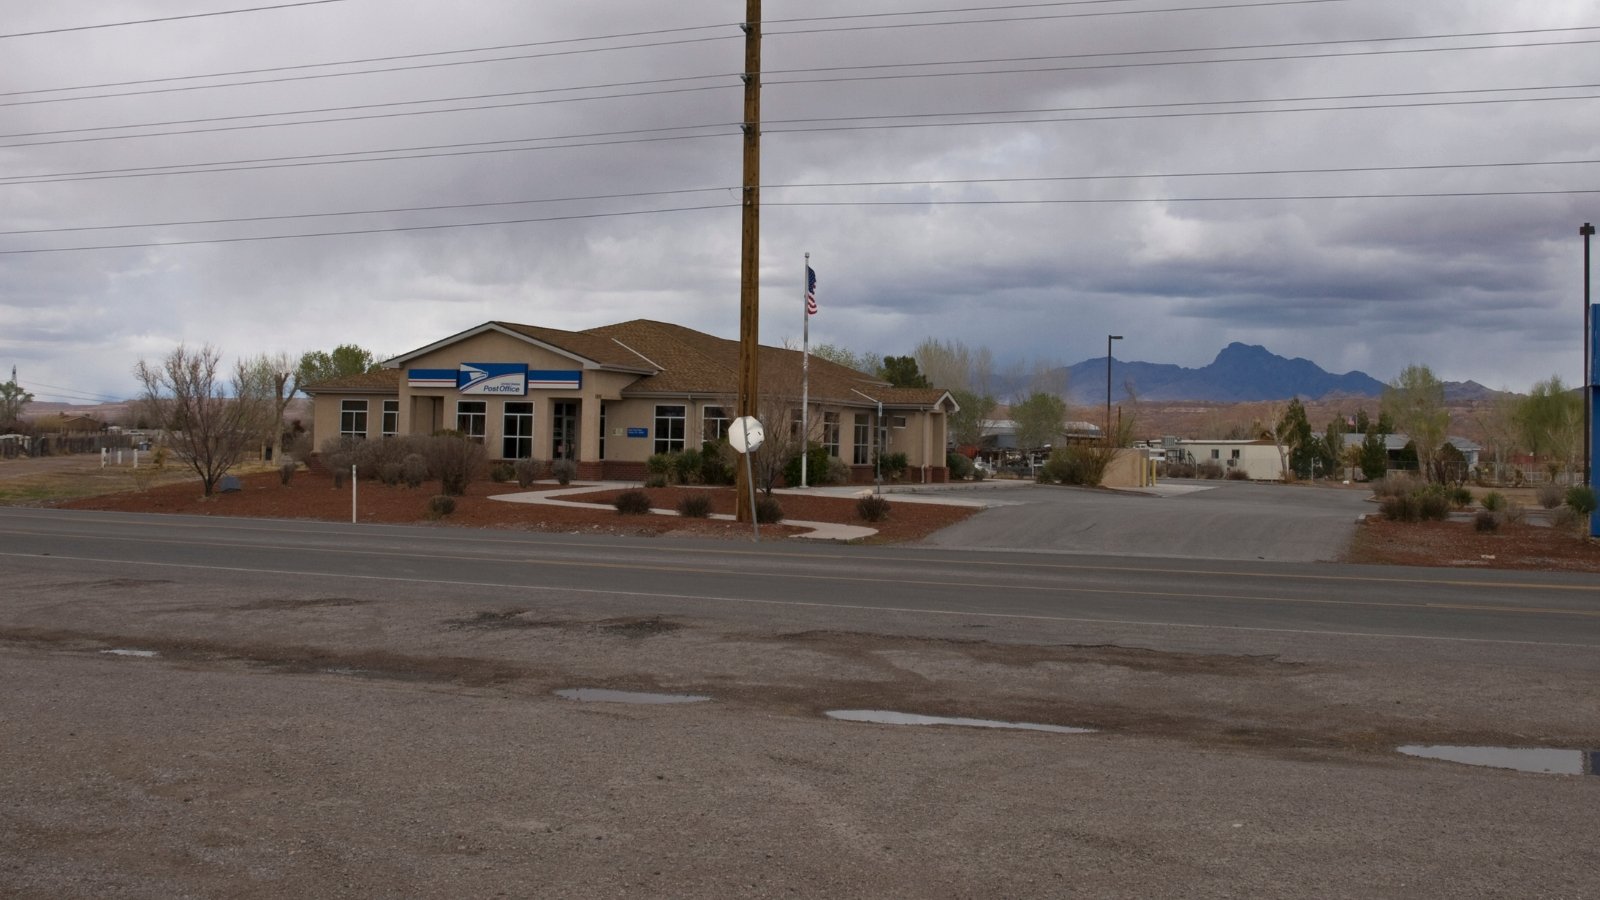
With a median value of $395,744, Moapa’s 95.63% appreciation represents exceptional ROI potential compared to neighboring markets. Your investment in this growth corridor benefits from strong momentum and relative affordability despite recent price acceleration. The financial fundamentals suggest continued equity building as development expands northward from Las Vegas. Value-conscious investors might capitalize on Moapa’s position at the intersection of growth and affordability.
19. Logandale

Historic prices and percent change over time:
- % change from 2016 to 2025: 97.57%
- 2025: $502,061
- 2024: $472,554
- 2023: $451,948
- 2022: $448,897
- 2021: $385,053
- 2020: $339,763
- 2019: $328,651
- 2018: $300,873
- 2017: $269,880
- 2016: $254,120
About Logandale
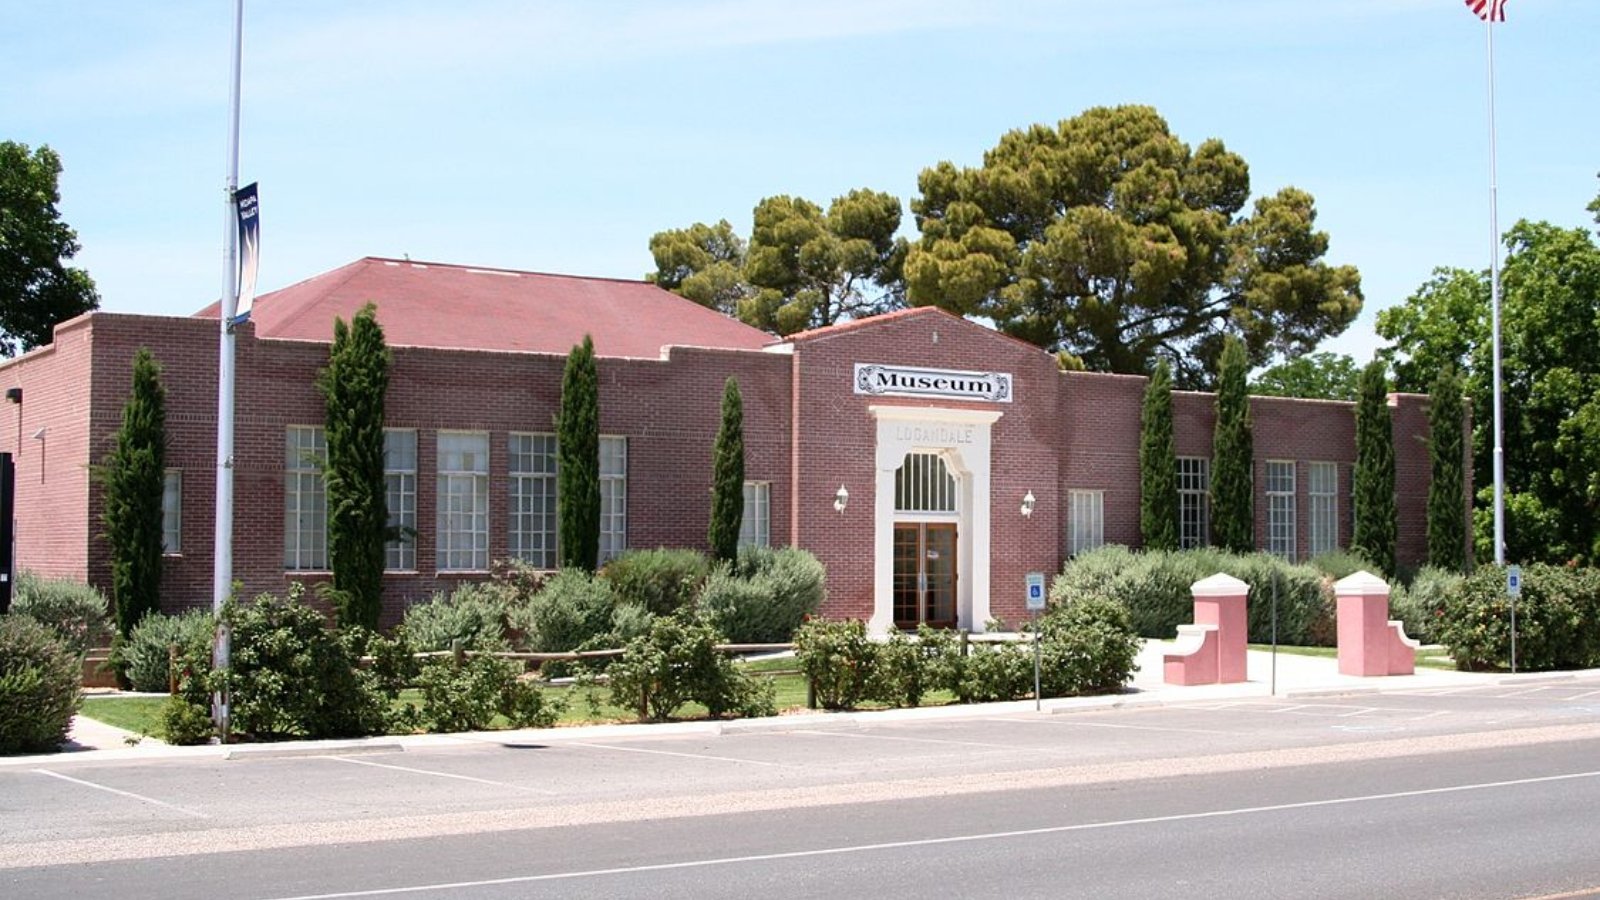
At a median price of $502,061, Logandale’s 97.57% growth creates compelling wealth-building opportunities in Nevada’s expanding northeastern corridor. Your investment benefits from strong price momentum combined with relative value compared to Las Vegas proper. The financial trajectory shows accelerating appreciation potential despite broader market headwinds since 2022. Strategic buyers might leverage Logandale’s growth pattern to maximize both rental yields and capital appreciation.
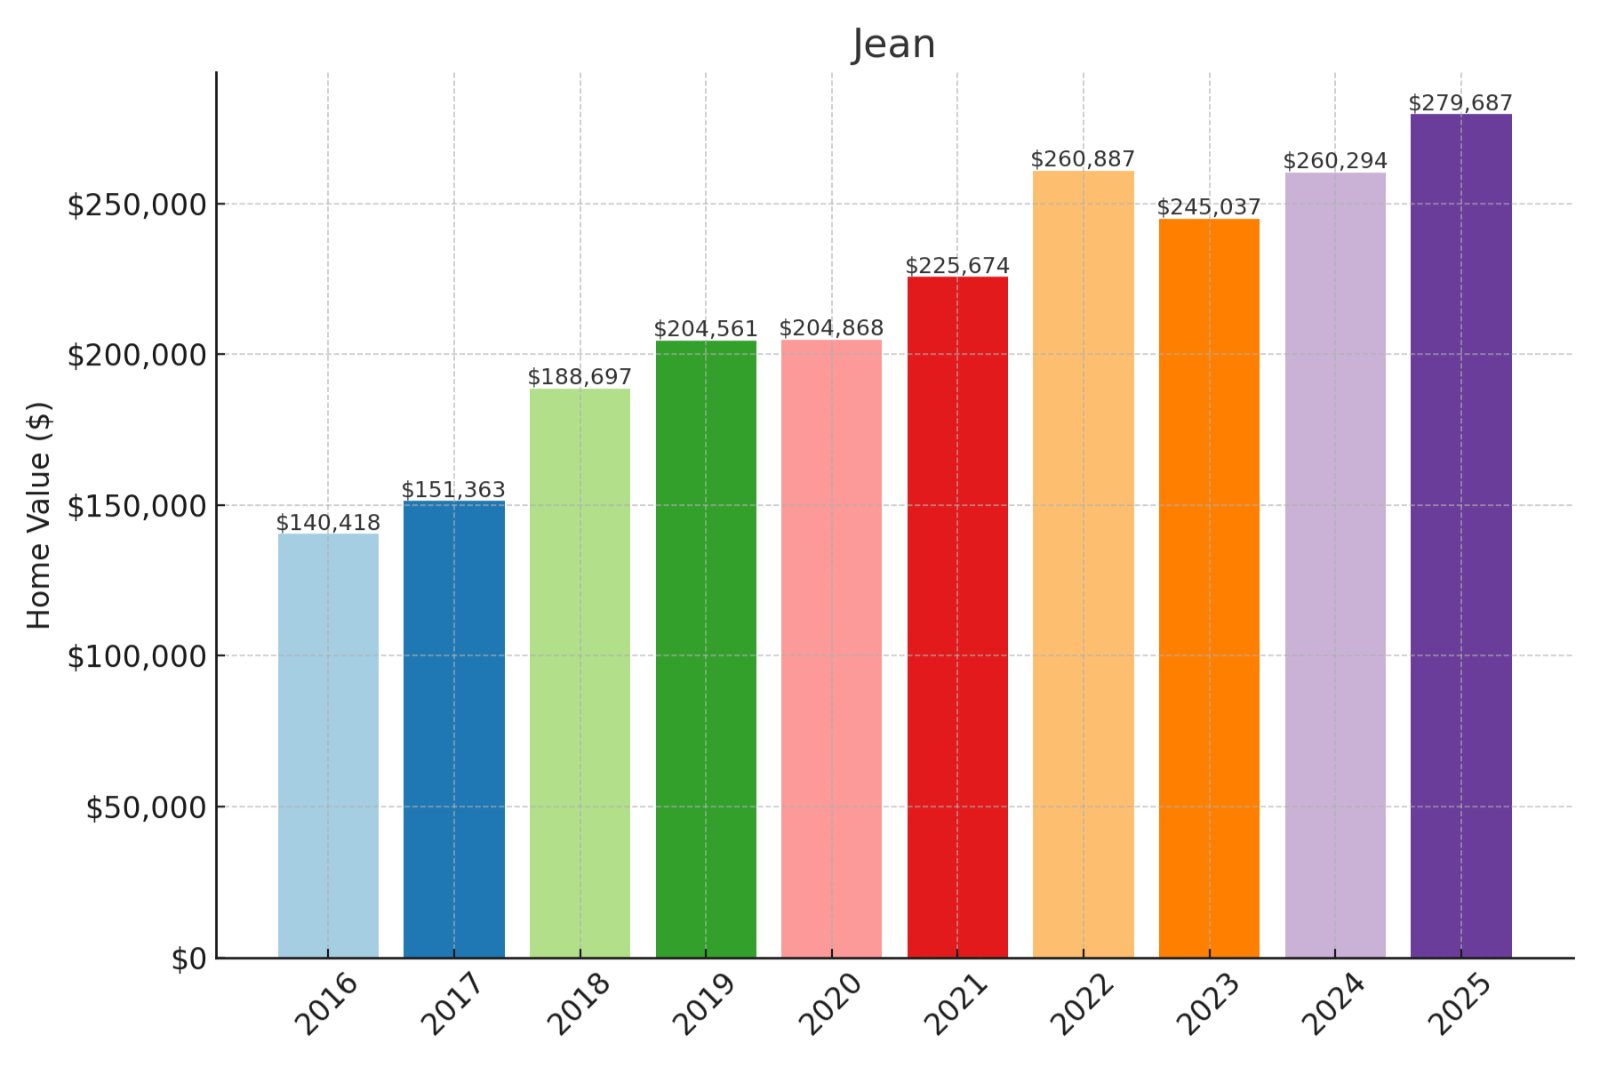
18. Jean
Would you like to save this?
Historic prices and percent change over time:
- % change from 2016 to 2025: 99.18%
- 2025: $279,687
- 2024: $260,294
- 2023: $245,037
- 2022: $260,887
- 2021: $225,674
- 2020: $204,868
- 2019: $204,561
- 2018: $188,697
- 2017: $151,363
- 2016: $140,418
About Jean
With median values now $279,687, Jean nearly doubled in value with 99.18% appreciation since 2016. Your investment potential remains exceptional as this entry-point market continues its strong price trajectory. The financial fundamentals support further growth as development expands along the I-15 corridor from Las Vegas. Strategic investors might leverage Jean’s relative affordability to maximize both cash flow and appreciation upside.
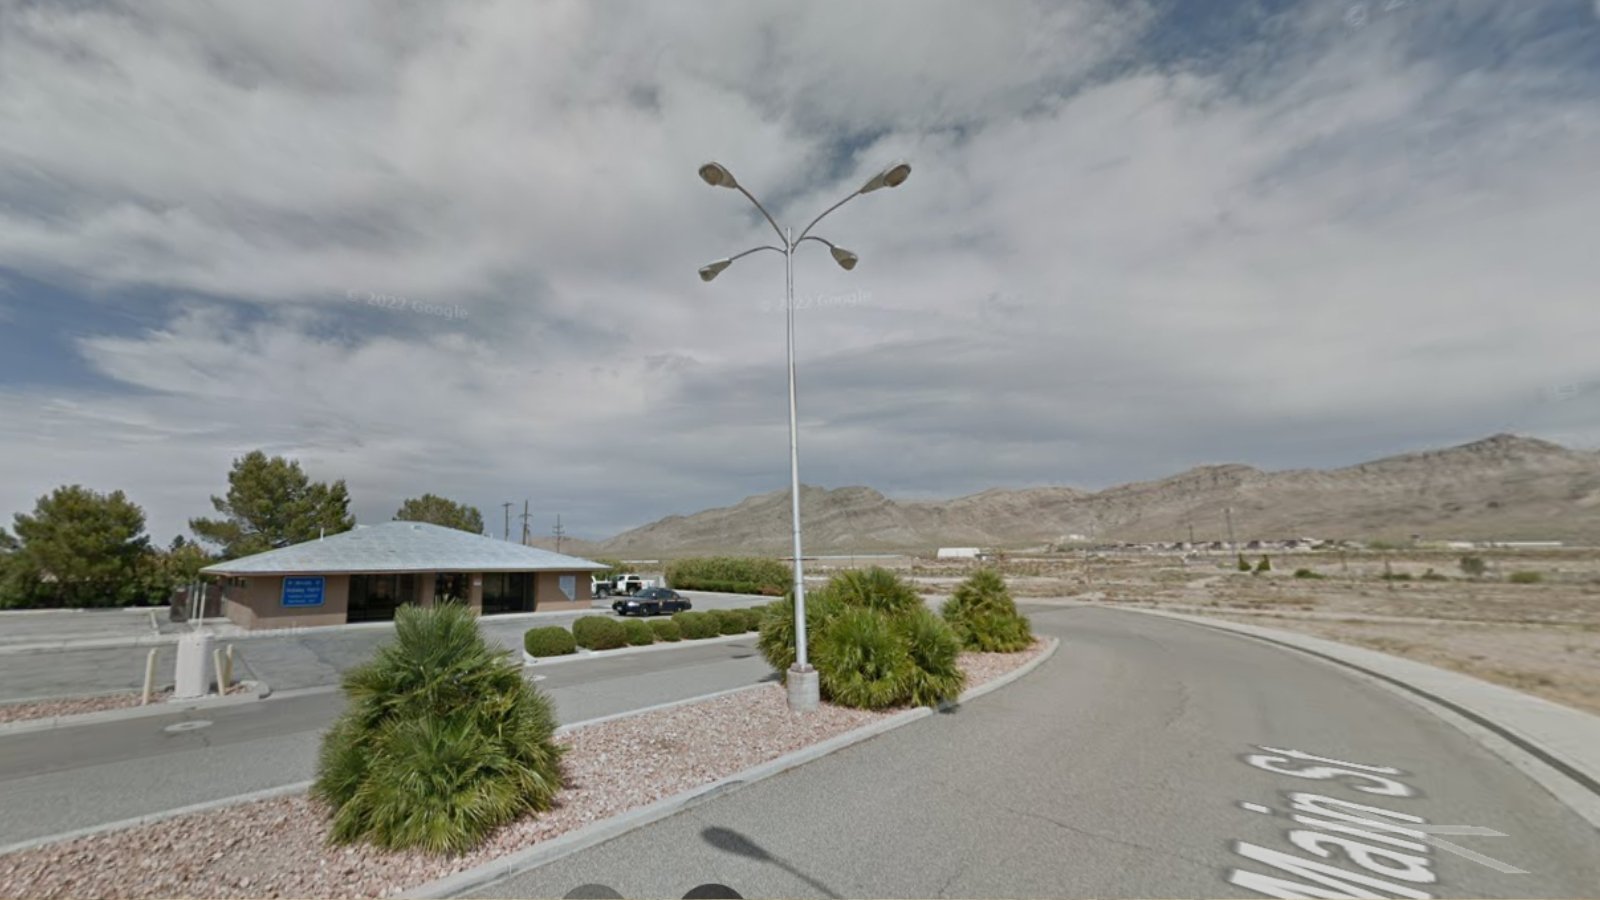
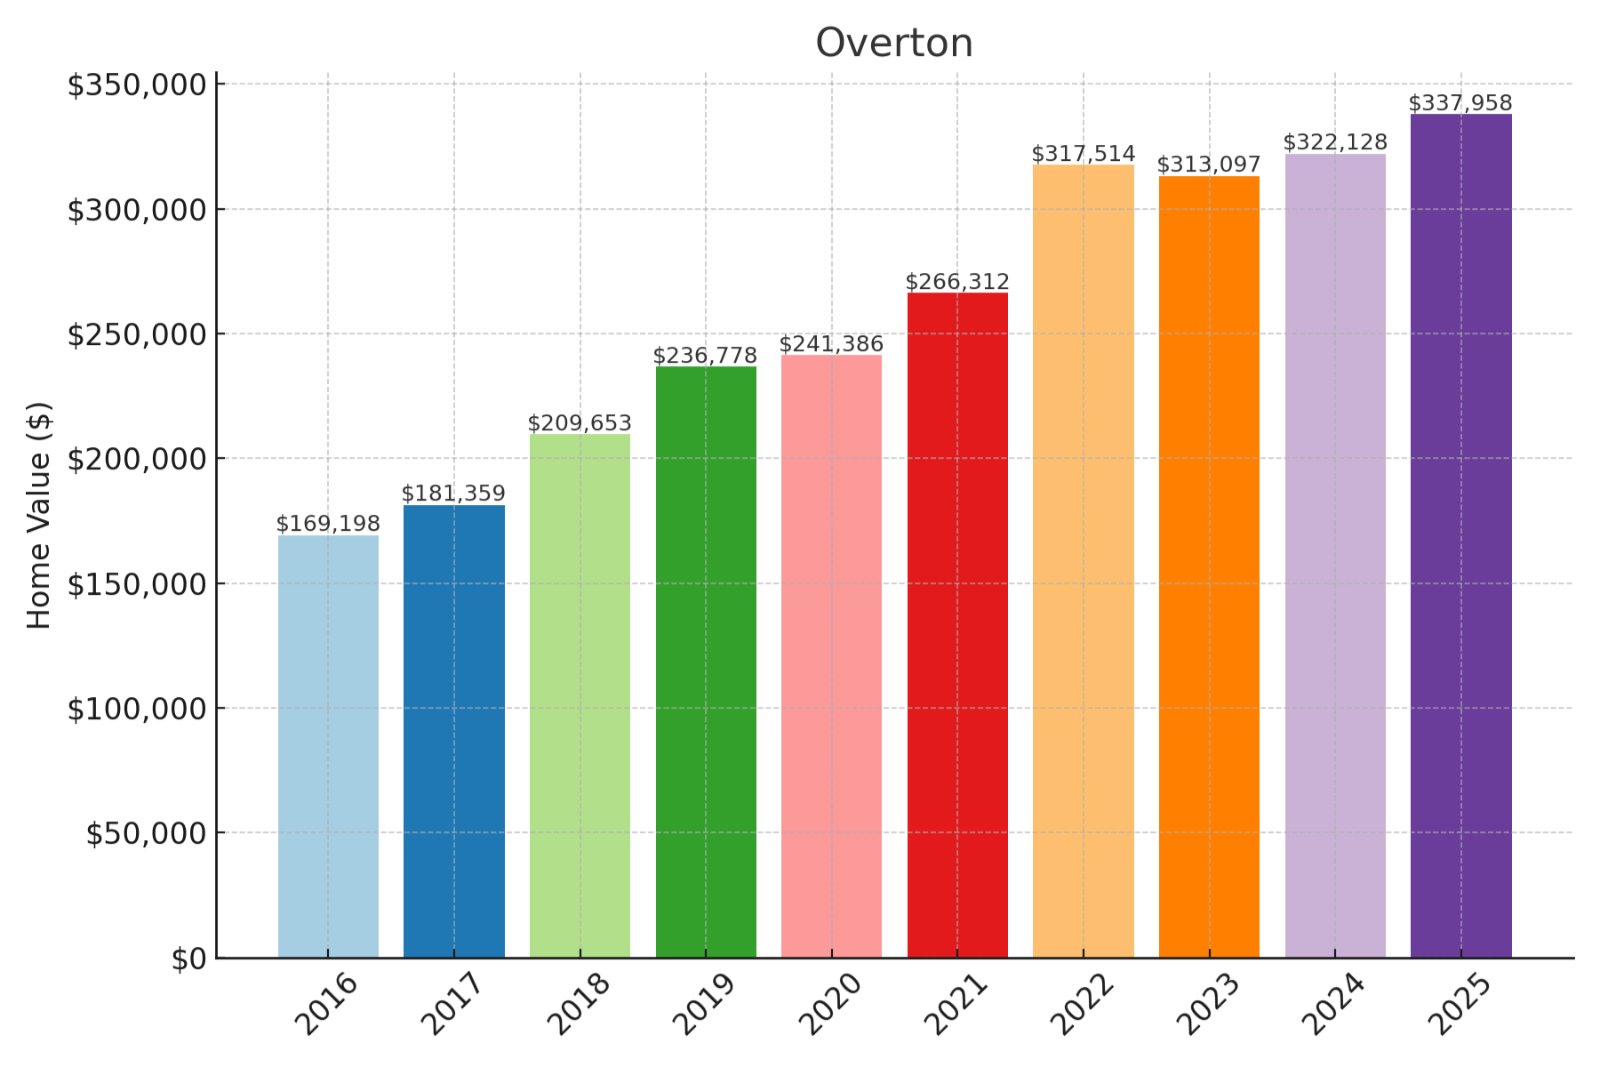
17. Overton
Historic prices and percent change over time:
- % change from 2016 to 2025: 99.74%
- 2025: $337,958
- 2024: $322,128
- 2023: $313,097
- 2022: $317,514
- 2021: $266,312
- 2020: $241,386
- 2019: $236,778
- 2018: $209,653
- 2017: $181,359
- 2016: $169,198
About Overton
At $337,958 median value, Overton’s 99.74% appreciation demonstrates exceptional investment performance in Nevada’s under-the-radar markets. Your capital growth potential remains strong despite broader market fluctuations since the pandemic peak. The price momentum indicates healthy future returns with particular advantage for early positioning in this emerging growth corridor. Financially savvy investors might note Overton’s favorable price-to-rent ratios alongside substantial equity building potential.
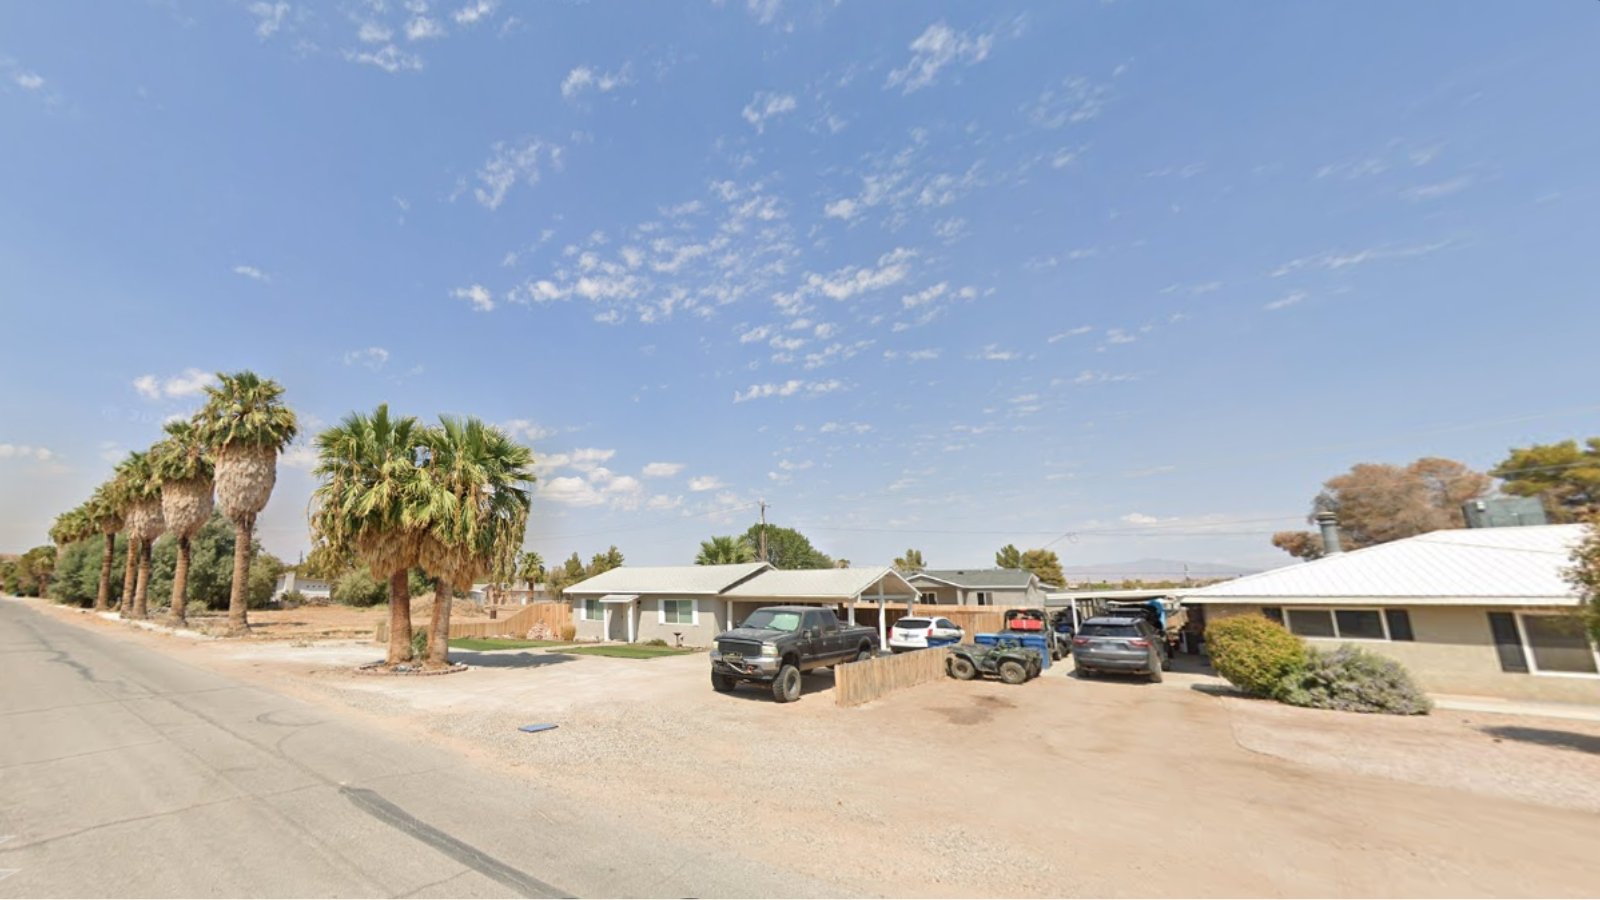
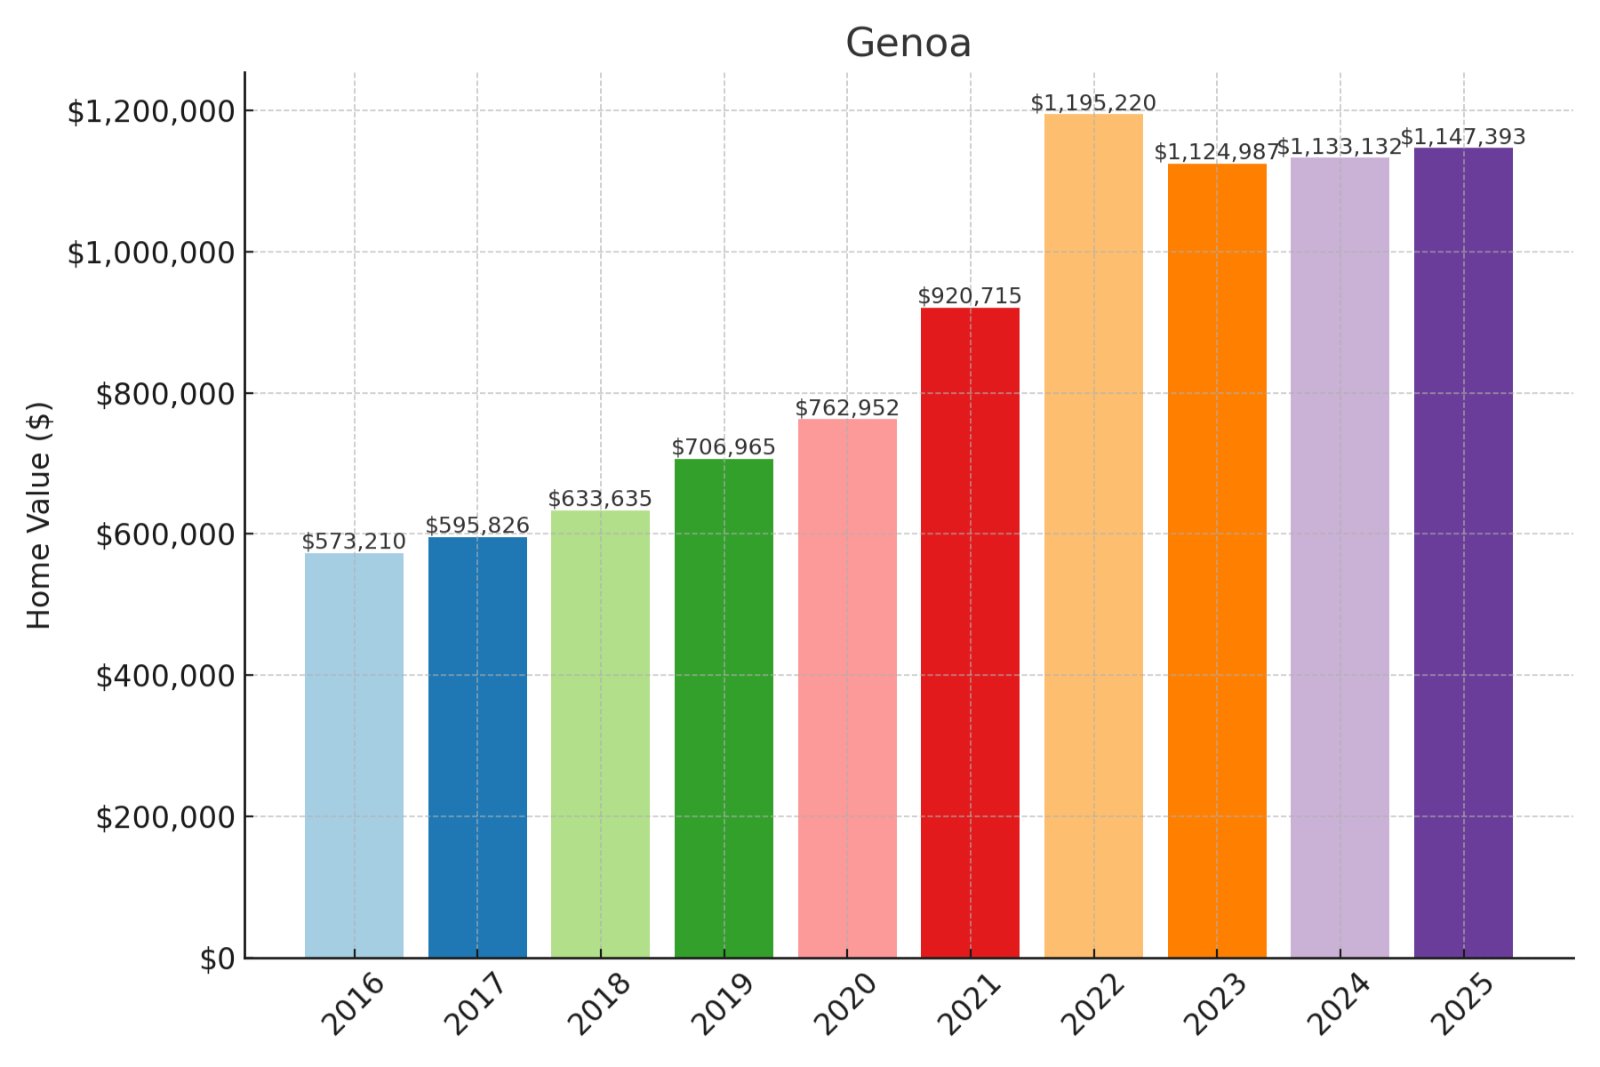
16. Genoa
Historic prices and percent change over time:
- % change from 2016 to 2025: 100.17%
- 2025: $1,147,393
- 2024: $1,133,132
- 2023: $1,124,987
- 2022: $1,195,220
- 2021: $920,715
- 2020: $762,952
- 2019: $706,965
- 2018: $633,635
- 2017: $595,826
- 2016: $573,210
About Genoa
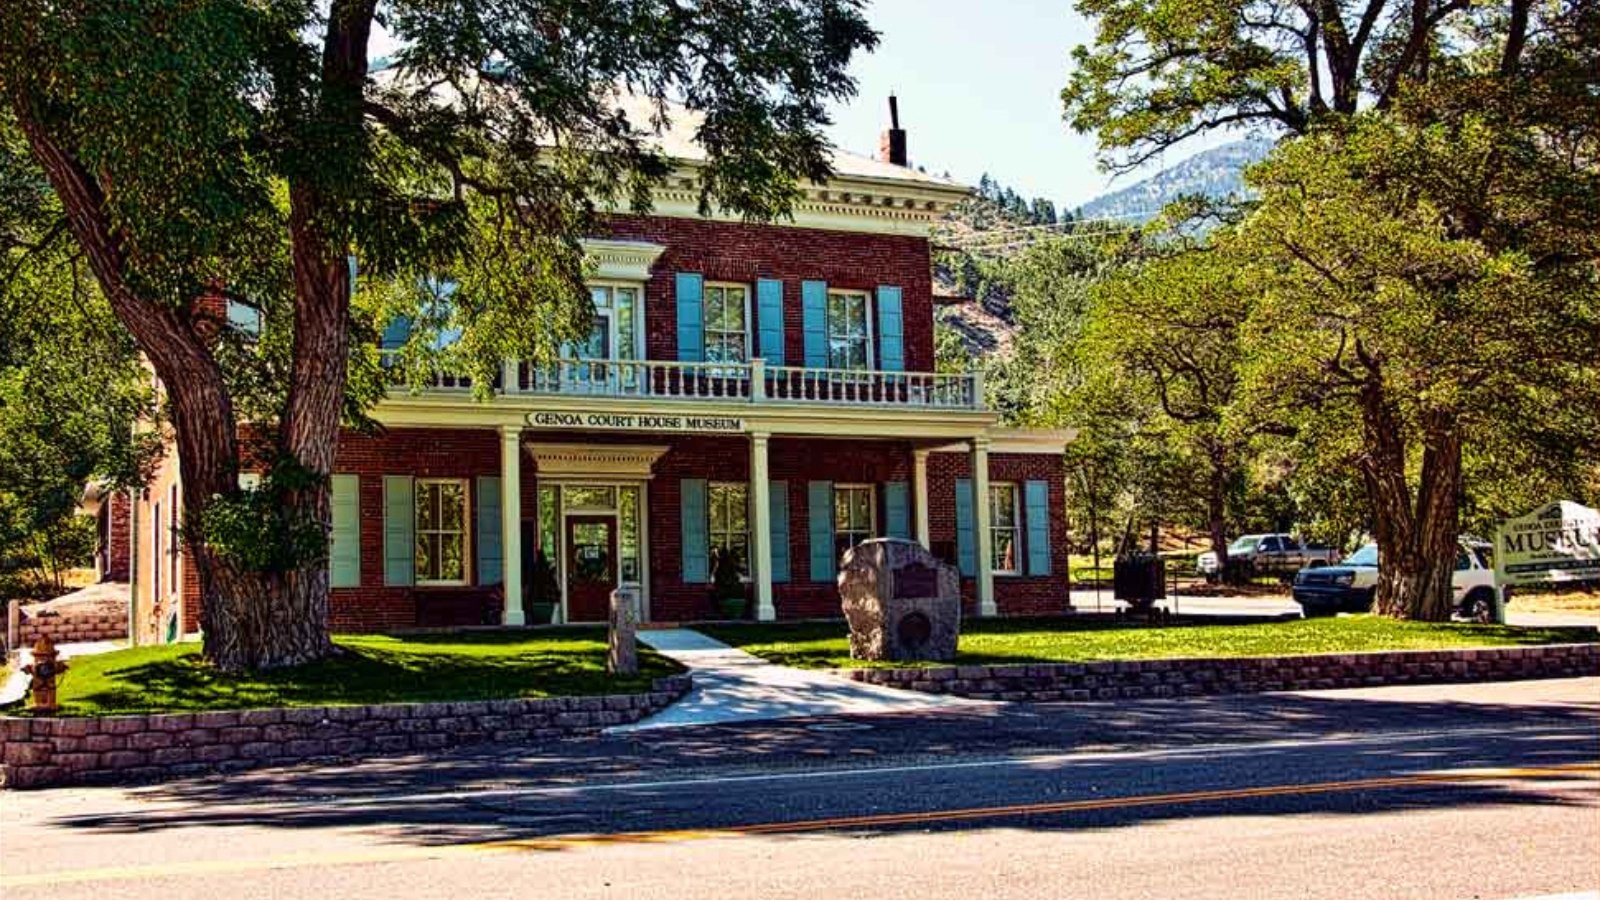
With median prices exceeding $1.14M, Genoa has precisely doubled in value since 2016, offering both luxury positioning and financial performance. Your investment captures exceptional wealth preservation alongside Nevada’s favorable tax environment despite recent high-end market cooling. The price trajectory indicates resilient demand in this premium market segment with unique historic character. Investment-minded buyers might leverage Genoa’s strong fundamentals to maximize both portfolio diversification and long-term appreciation.
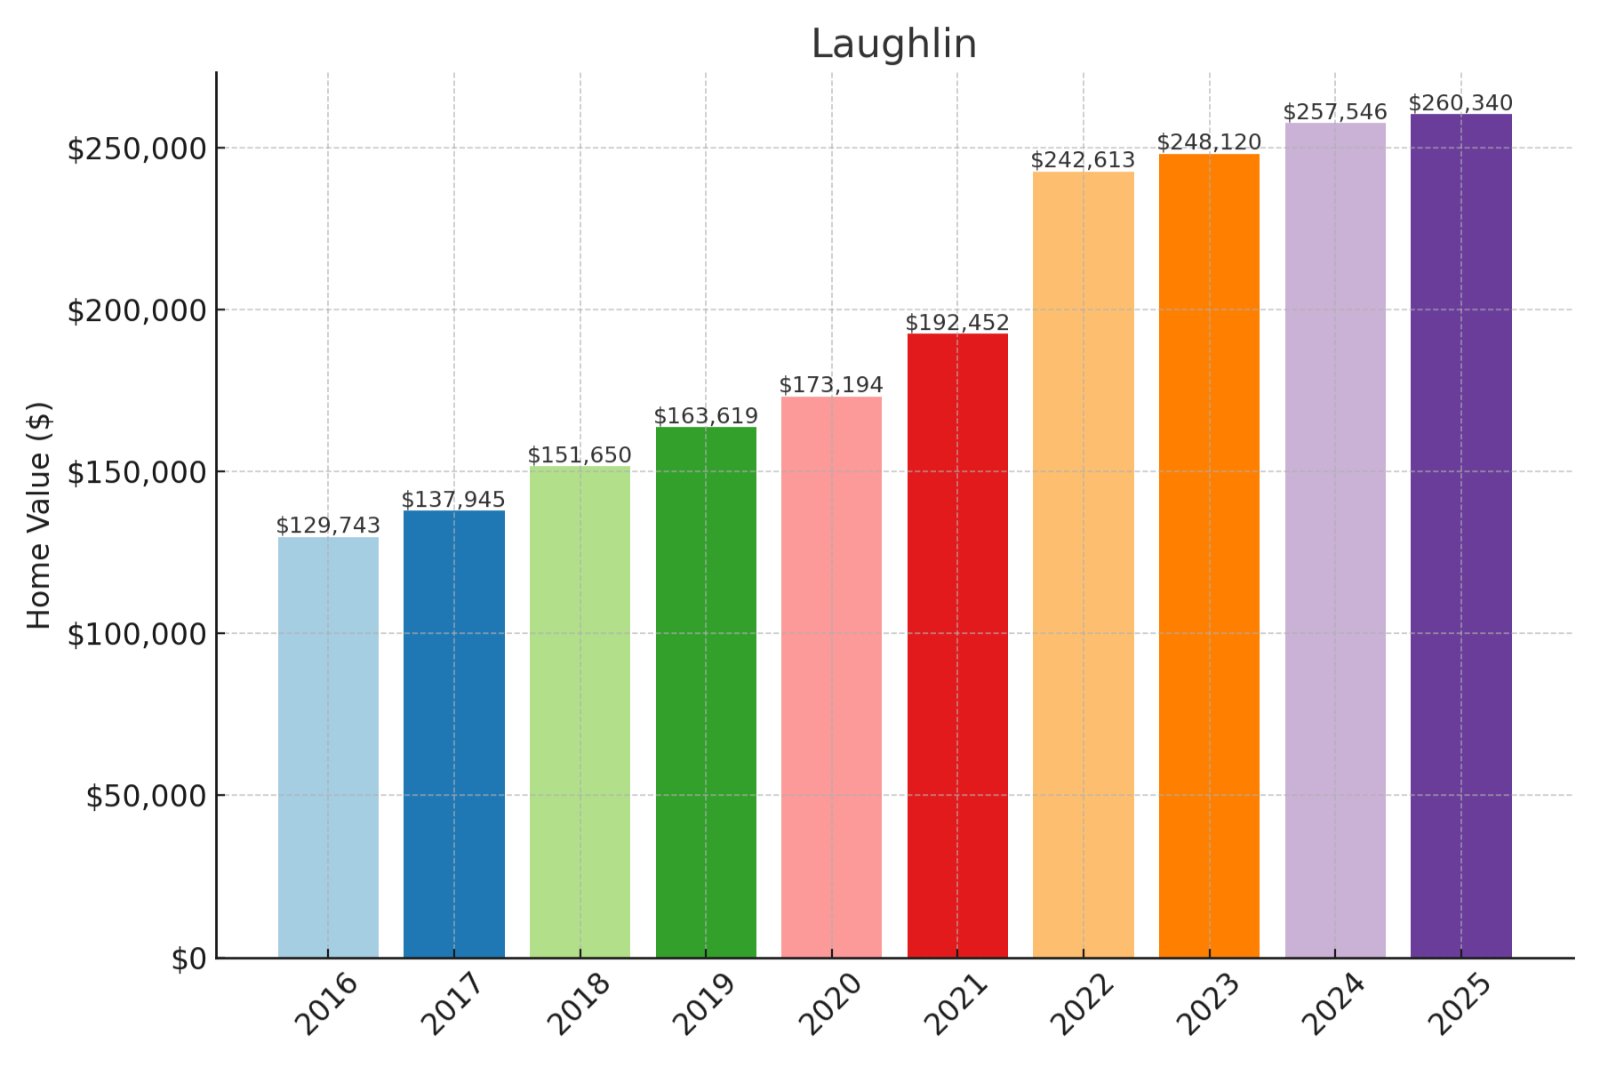
15. Laughlin
Historic prices and percent change over time:
- % change from 2016 to 2025: 100.66%
- 2025: $260,340
- 2024: $257,546
- 2023: $248,120
- 2022: $242,613
- 2021: $192,452
- 2020: $173,194
- 2019: $163,619
- 2018: $151,650
- 2017: $137,945
- 2016: $129,743
About Laughlin
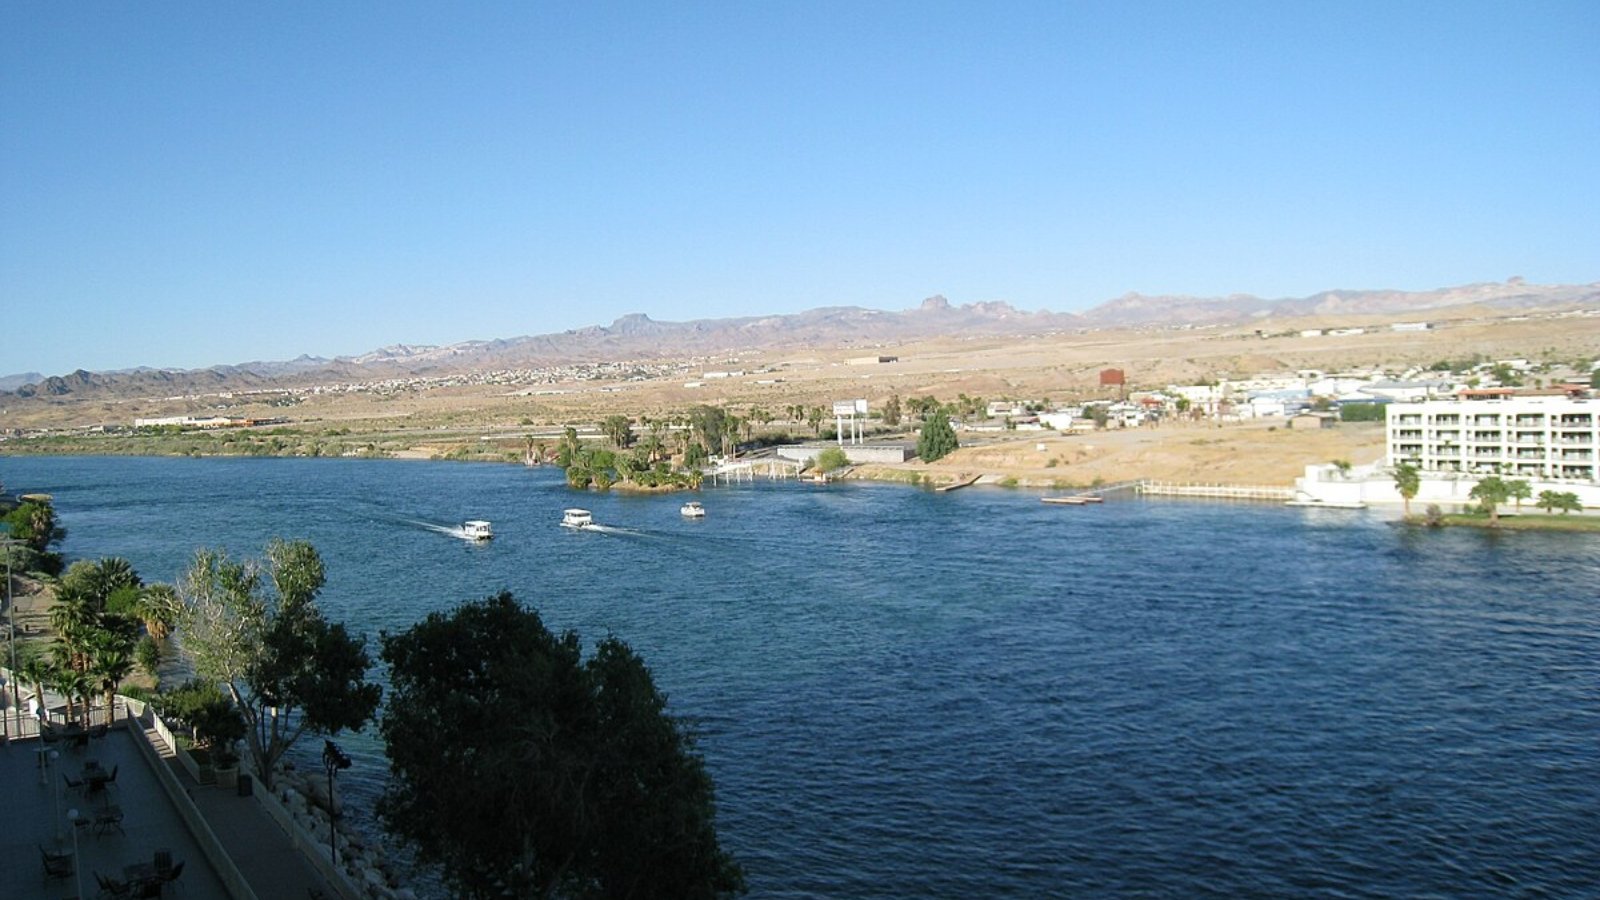
At $260,340 median value, Laughlin has doubled investor capital with 100.66% appreciation since 2016. Your investment benefits from both strong price momentum and Nevada’s lowest entry point among high-growth markets. The financial fundamentals suggest continued wealth-building potential despite recent normalization after pandemic price surges. Strategic investors might leverage Laughlin’s favorable cash flow metrics alongside the substantial equity growth evidenced by this decade-long trend.
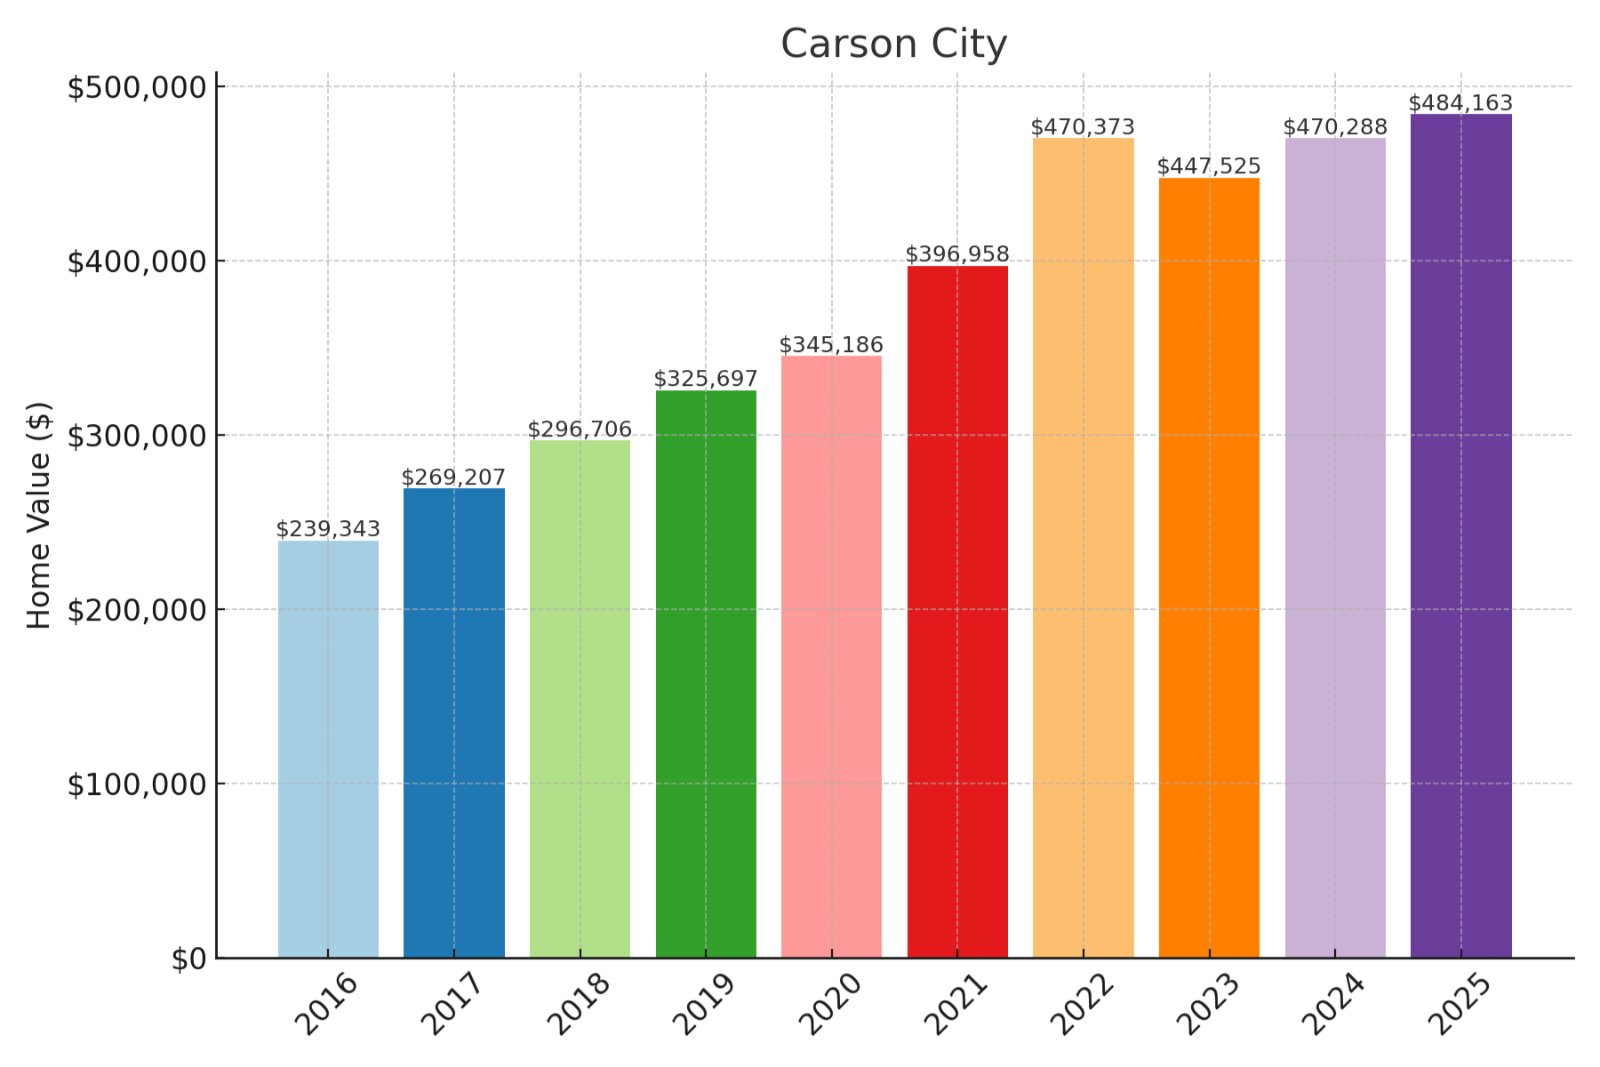
14. Carson City
Historic prices and percent change over time:
- % change from 2016 to 2025: 102.29%
- 2025: $484,163
- 2024: $470,288
- 2023: $447,525
- 2022: $470,373
- 2021: $396,958
- 2020: $345,186
- 2019: $325,697
- 2018: $296,706
- 2017: $269,207
- 2016: $239,343
About Carson City
With median values at $484,163, Carson City offers exceptional financial performance after 102.29% appreciation since 2016. Your investment captures both capital city stability and strong wealth-building momentum despite recent market normalization. The price trajectory indicates sustained demand with particular advantage for positioning ahead of continued migration from California markets. Financially sophisticated buyers might leverage Carson City’s government-sector economic stability alongside its proven long-term appreciation pattern.
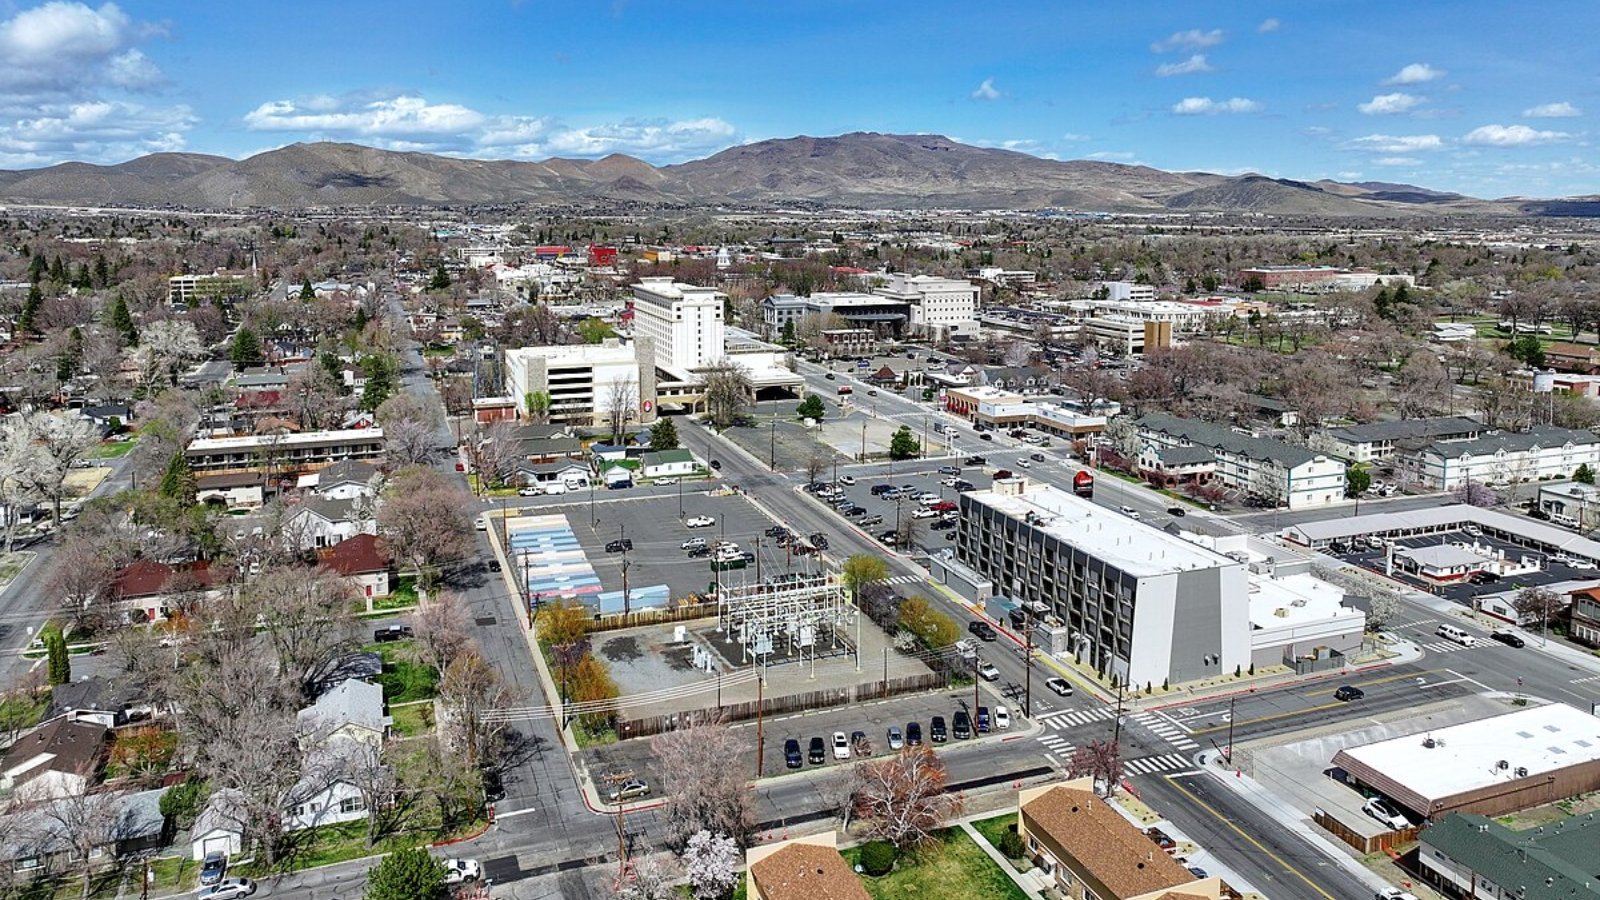
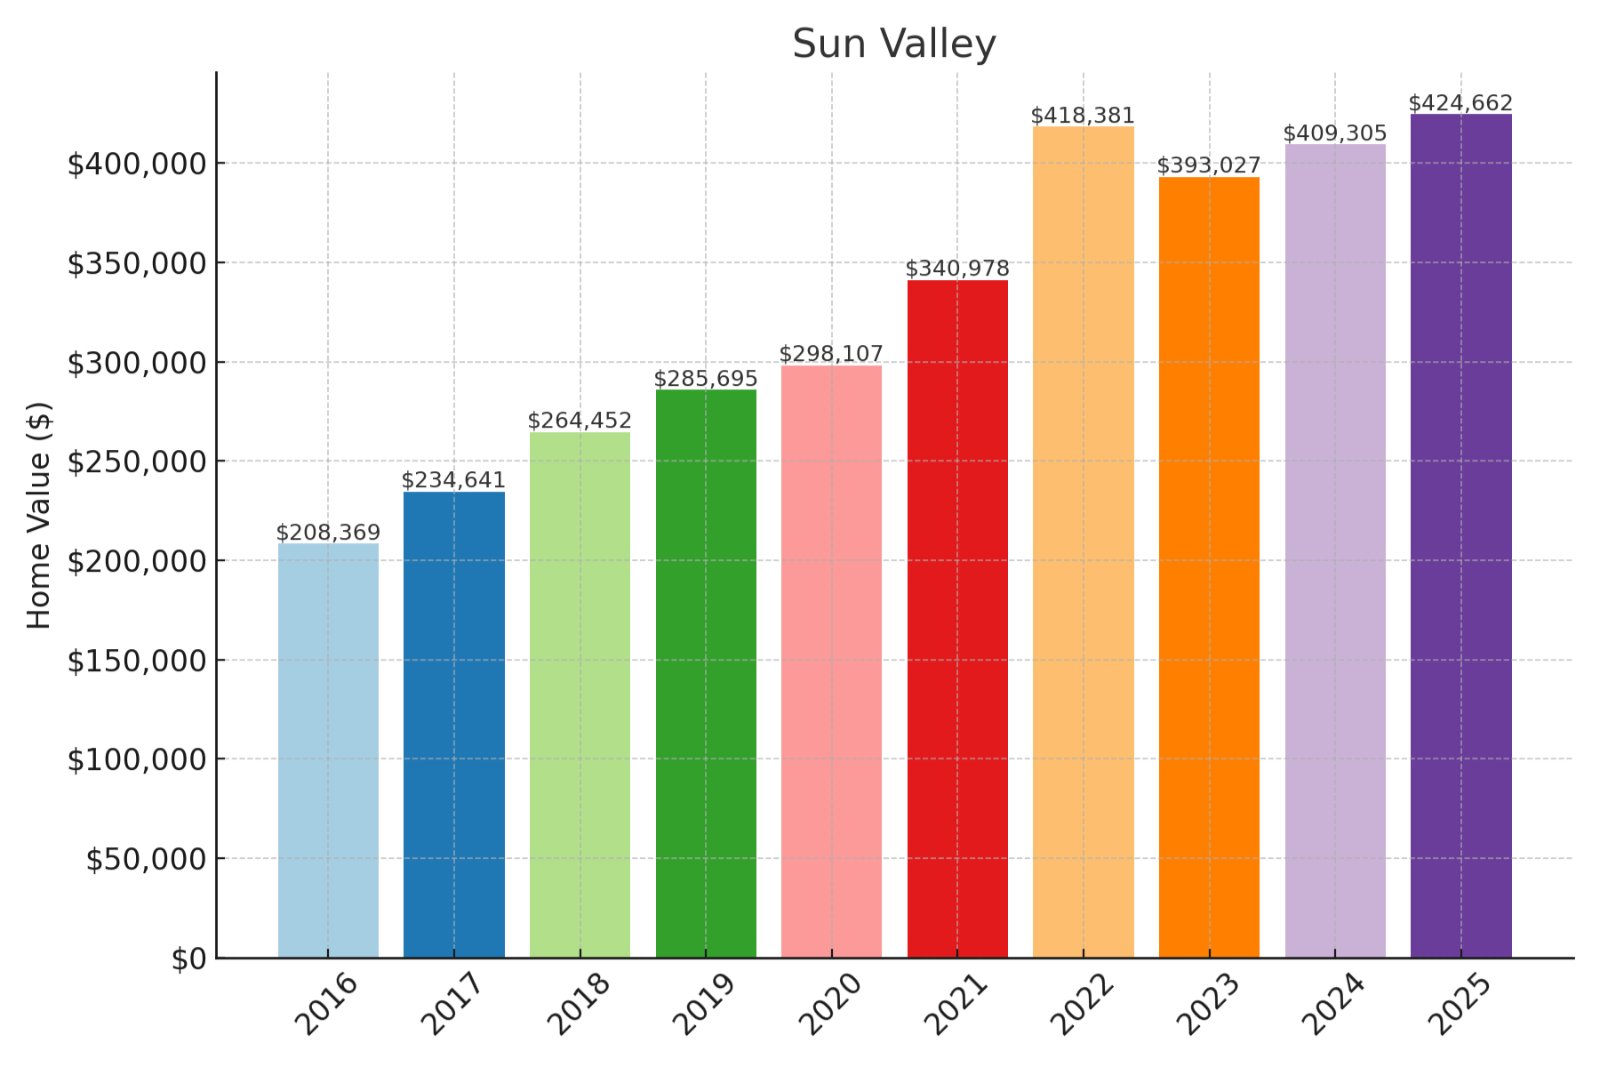
13. Sun Valley
Historic prices and percent change over time:
- % change from 2016 to 2025: 103.8%
- 2025: $424,662
- 2024: $409,305
- 2023: $393,027
- 2022: $418,381
- 2021: $340,978
- 2020: $298,107
- 2019: $285,695
- 2018: $264,452
- 2017: $234,641
- 2016: $208,369
About Sun Valley
At $424,662 median value, Sun Valley has more than doubled investor capital with 103.8% appreciation since 2016. Your investment potential remains strong in this growth corridor adjacent to Reno’s expanding economic base. The financial trajectory shows resilient demand despite broader market fluctuations since the 2022 peak. Value-minded investors might note Sun Valley offers a compelling combination of relative affordability and proven price momentum in the competitive Reno metro area.


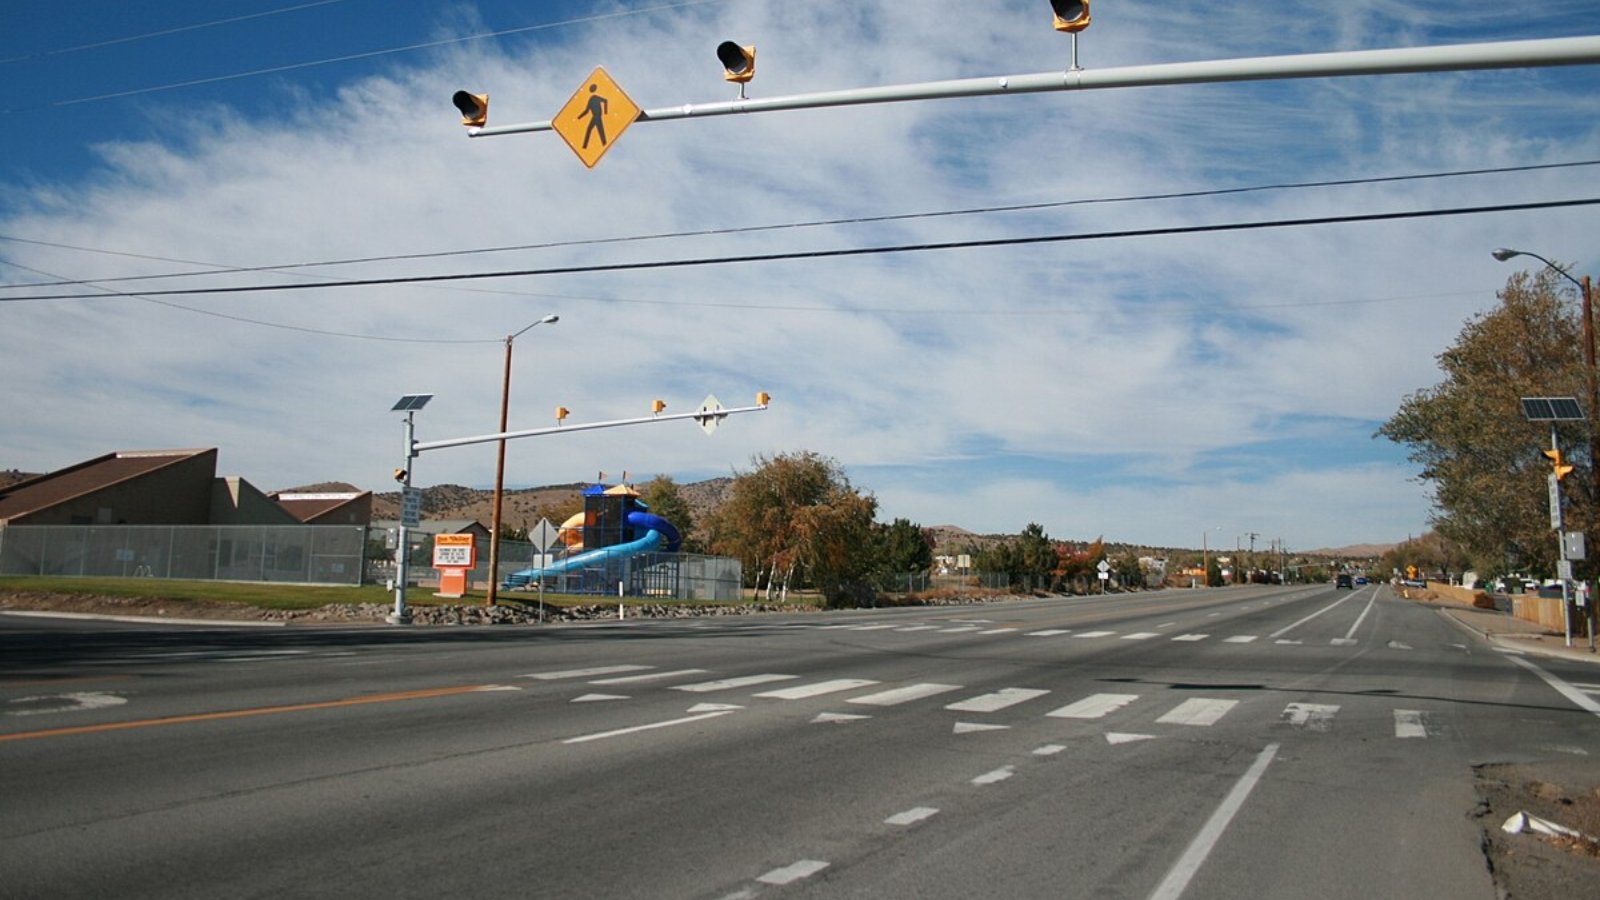
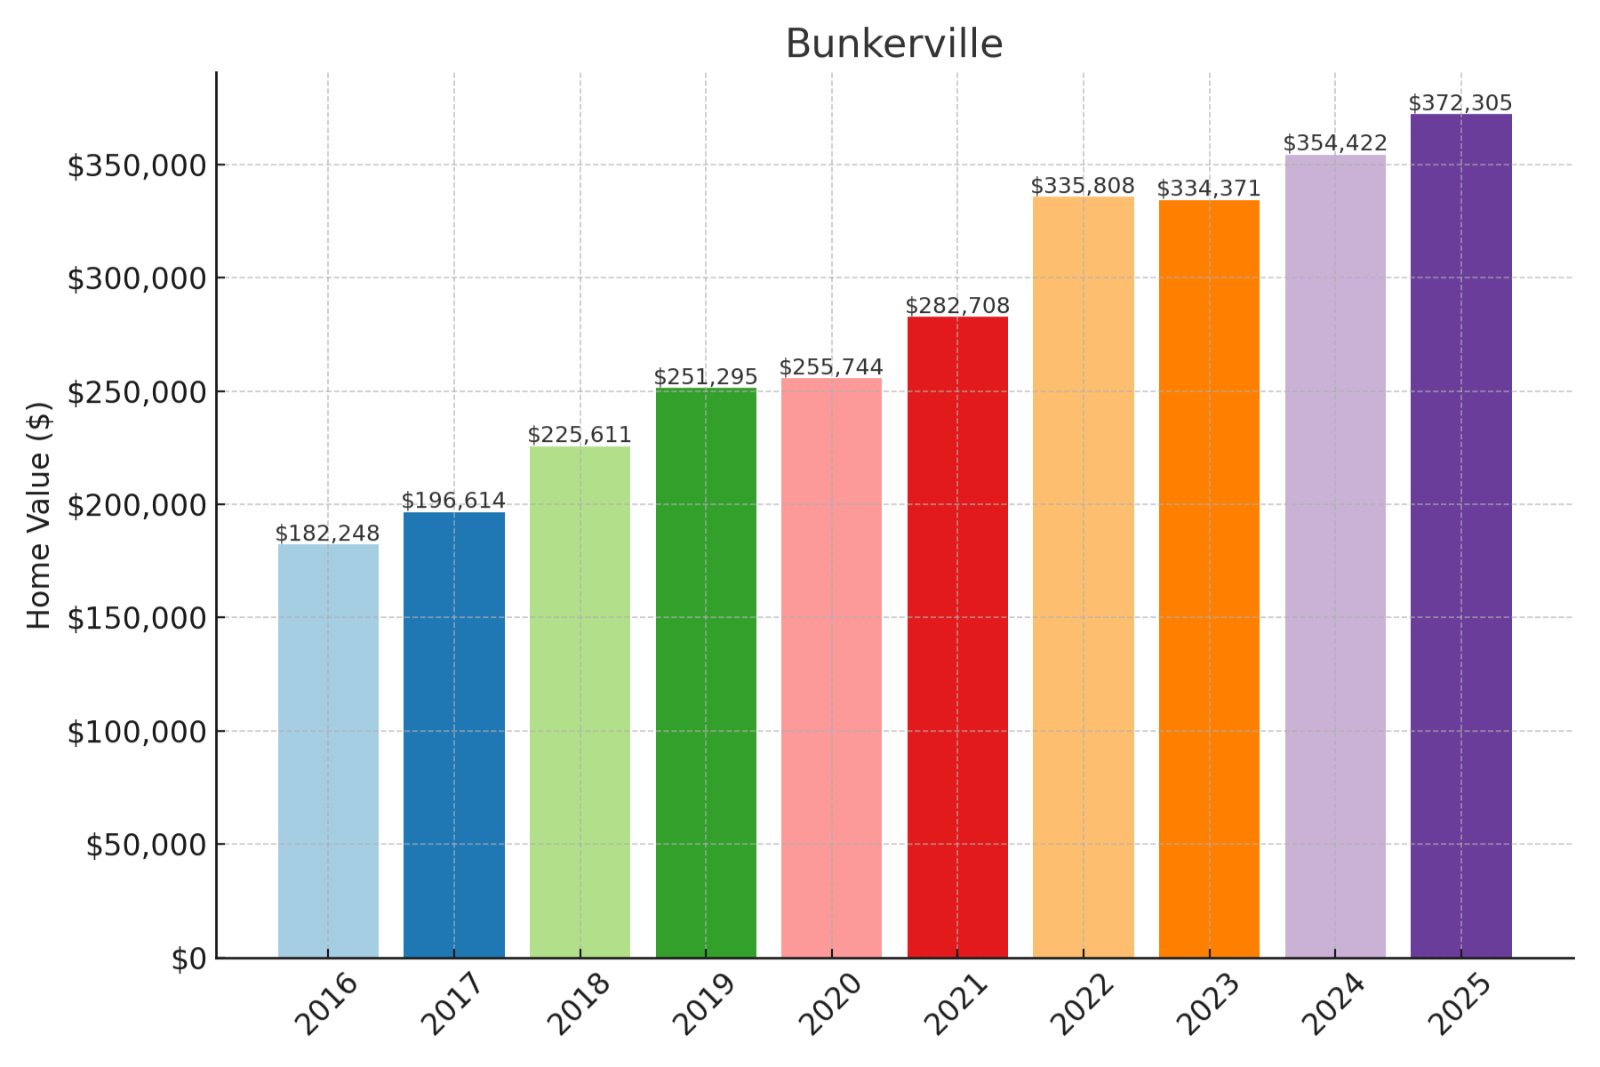
12. Bunkerville
Would you like to save this?
Historic prices and percent change over time:
- % change from 2016 to 2025: 104.28%
- 2025: $372,305
- 2024: $354,422
- 2023: $334,371
- 2022: $335,808
- 2021: $282,708
- 2020: $255,744
- 2019: $251,295
- 2018: $225,611
- 2017: $196,614
- 2016: $182,248
About Bunkerville
With values reaching $372,305, Bunkerville has more than doubled investor capital with 104.28% appreciation since 2016. Your wealth-building potential benefits from exceptional price momentum in this emerging growth corridor near Mesquite. The financial fundamentals suggest continued equity generation despite recent market normalization post-pandemic surge. Strategic investors might capitalize on Bunkerville’s position at the intersection of strong appreciation and relative value compared to neighboring Arizona and Utah markets.
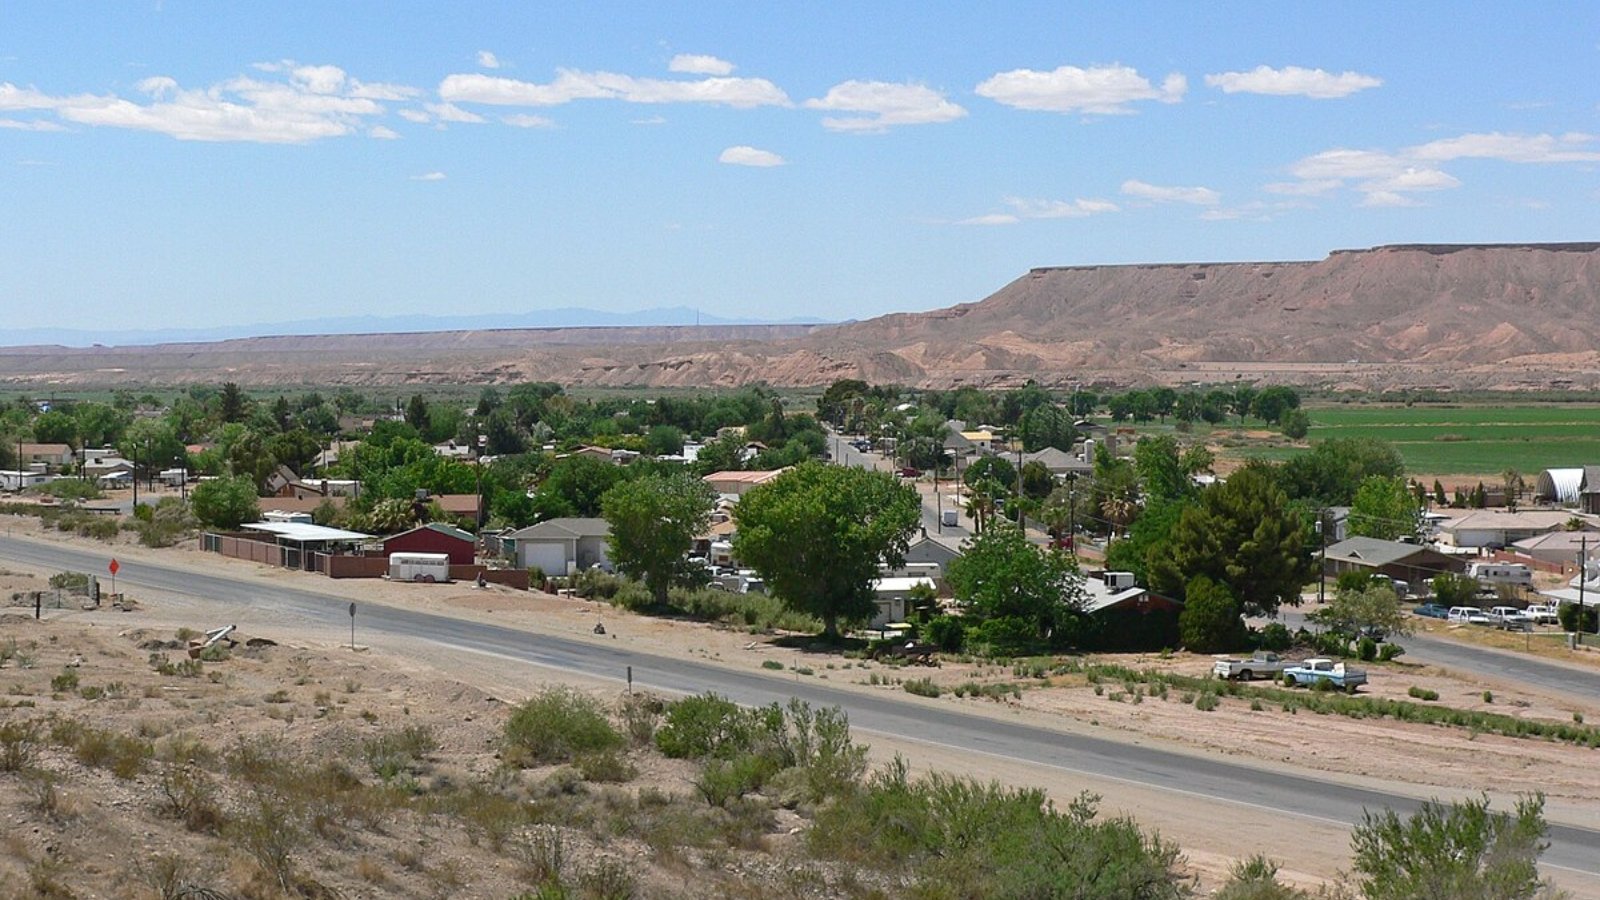
11. Fernley
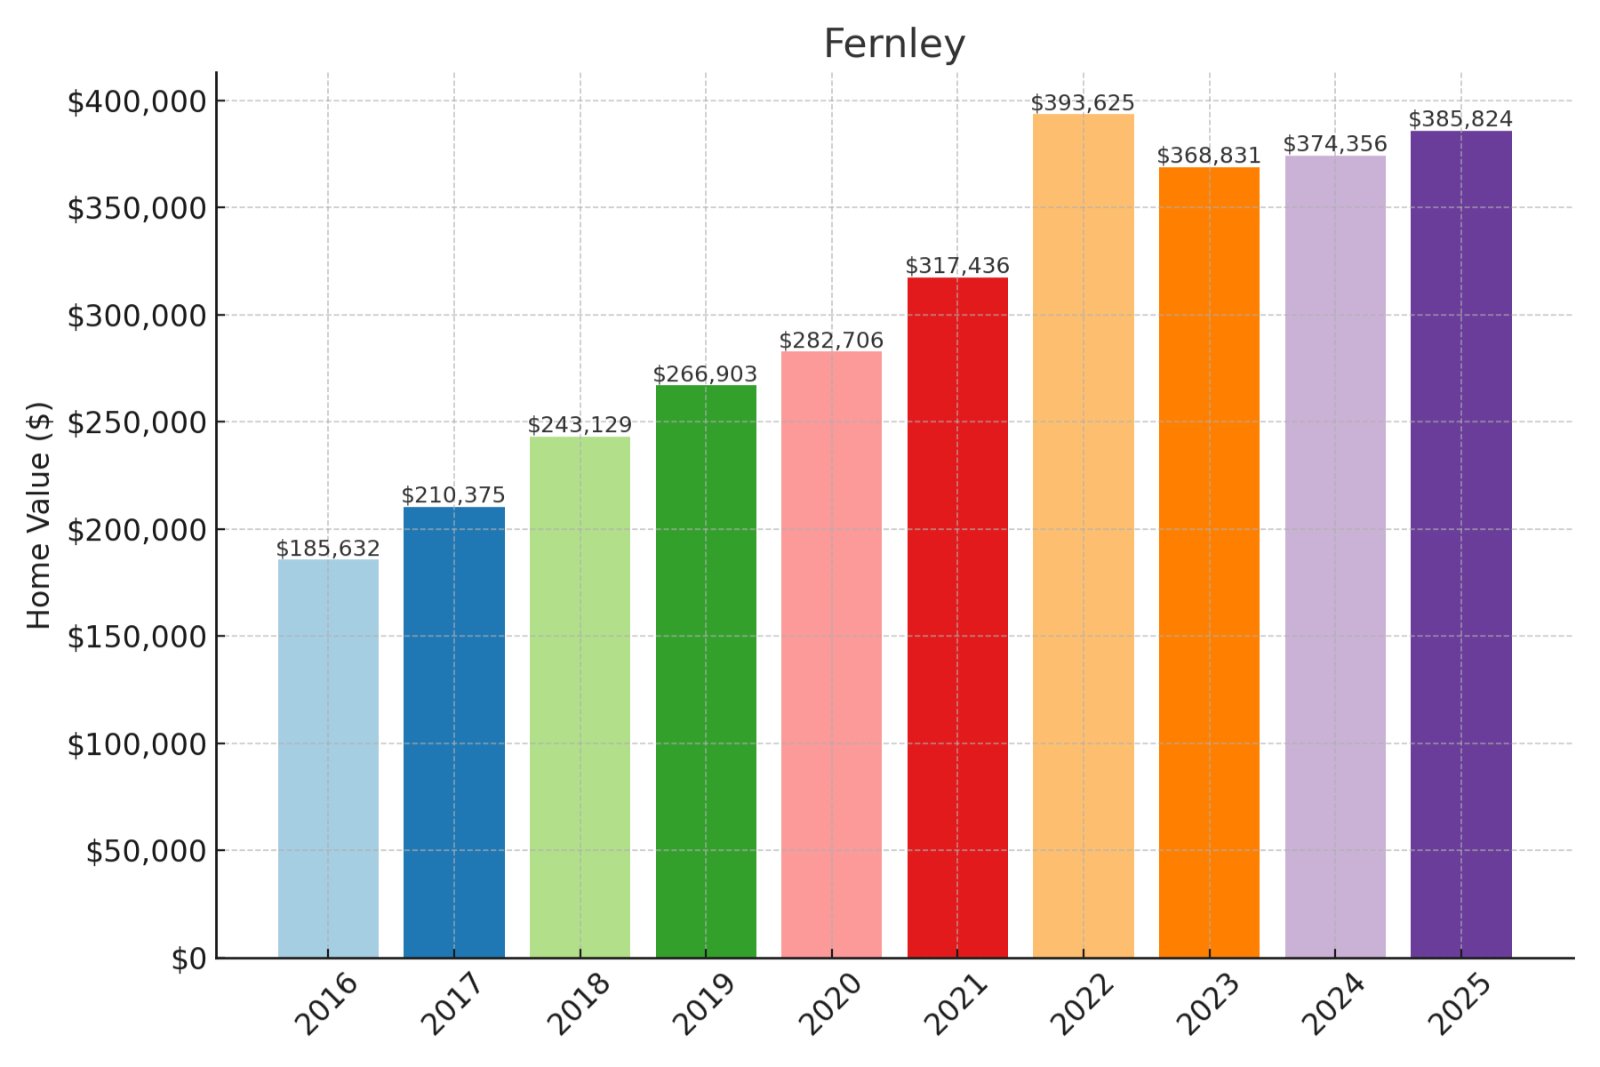
Historic prices and percent change over time:
- % change from 2016 to 2025: 107.84%
- 2025: $385,824
- 2024: $374,356
- 2023: $368,831
- 2022: $393,625
- 2021: $317,436
- 2020: $282,706
- 2019: $266,903
- 2018: $243,129
- 2017: $210,375
- 2016: $185,632
About Fernley
At $385,824 median value, Fernley has delivered exceptional ROI with 107.84% appreciation since 2016. Your investment benefits from Fernley’s strategic position in northern Nevada’s industrial expansion corridor despite recent normalization from pandemic peaks. The financial trajectory indicates sustainable long-term growth with particularly favorable outlook as major employers continue regional expansion. Savvy investors might leverage Fernley’s proven appreciation pattern alongside its relative value compared to Reno’s escalating market.
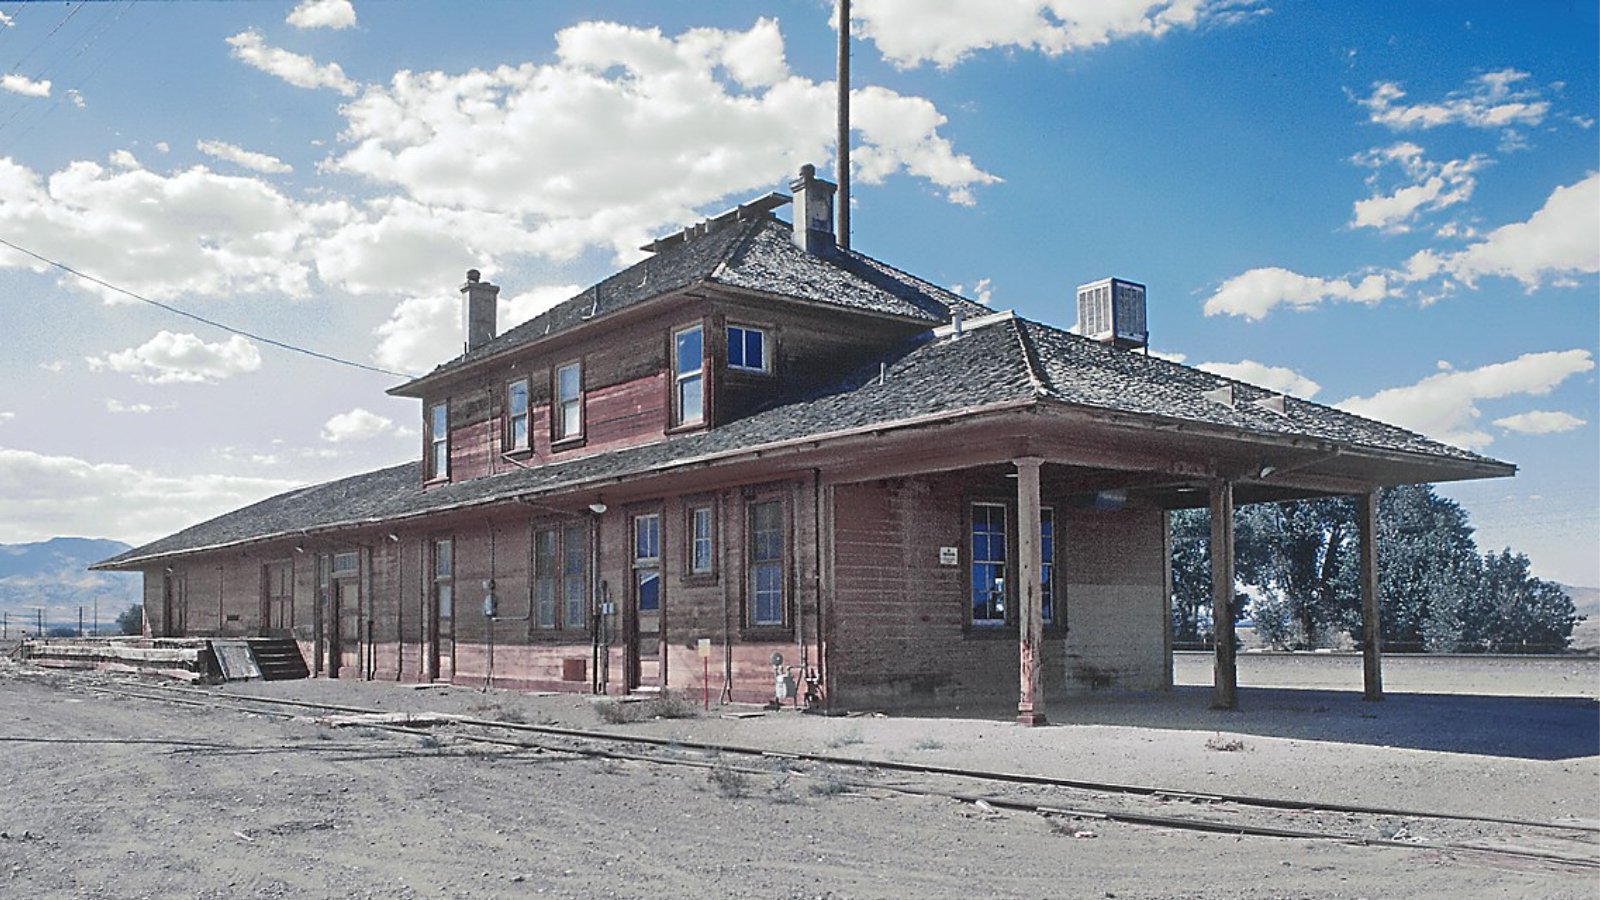
10. Zephyr Cove
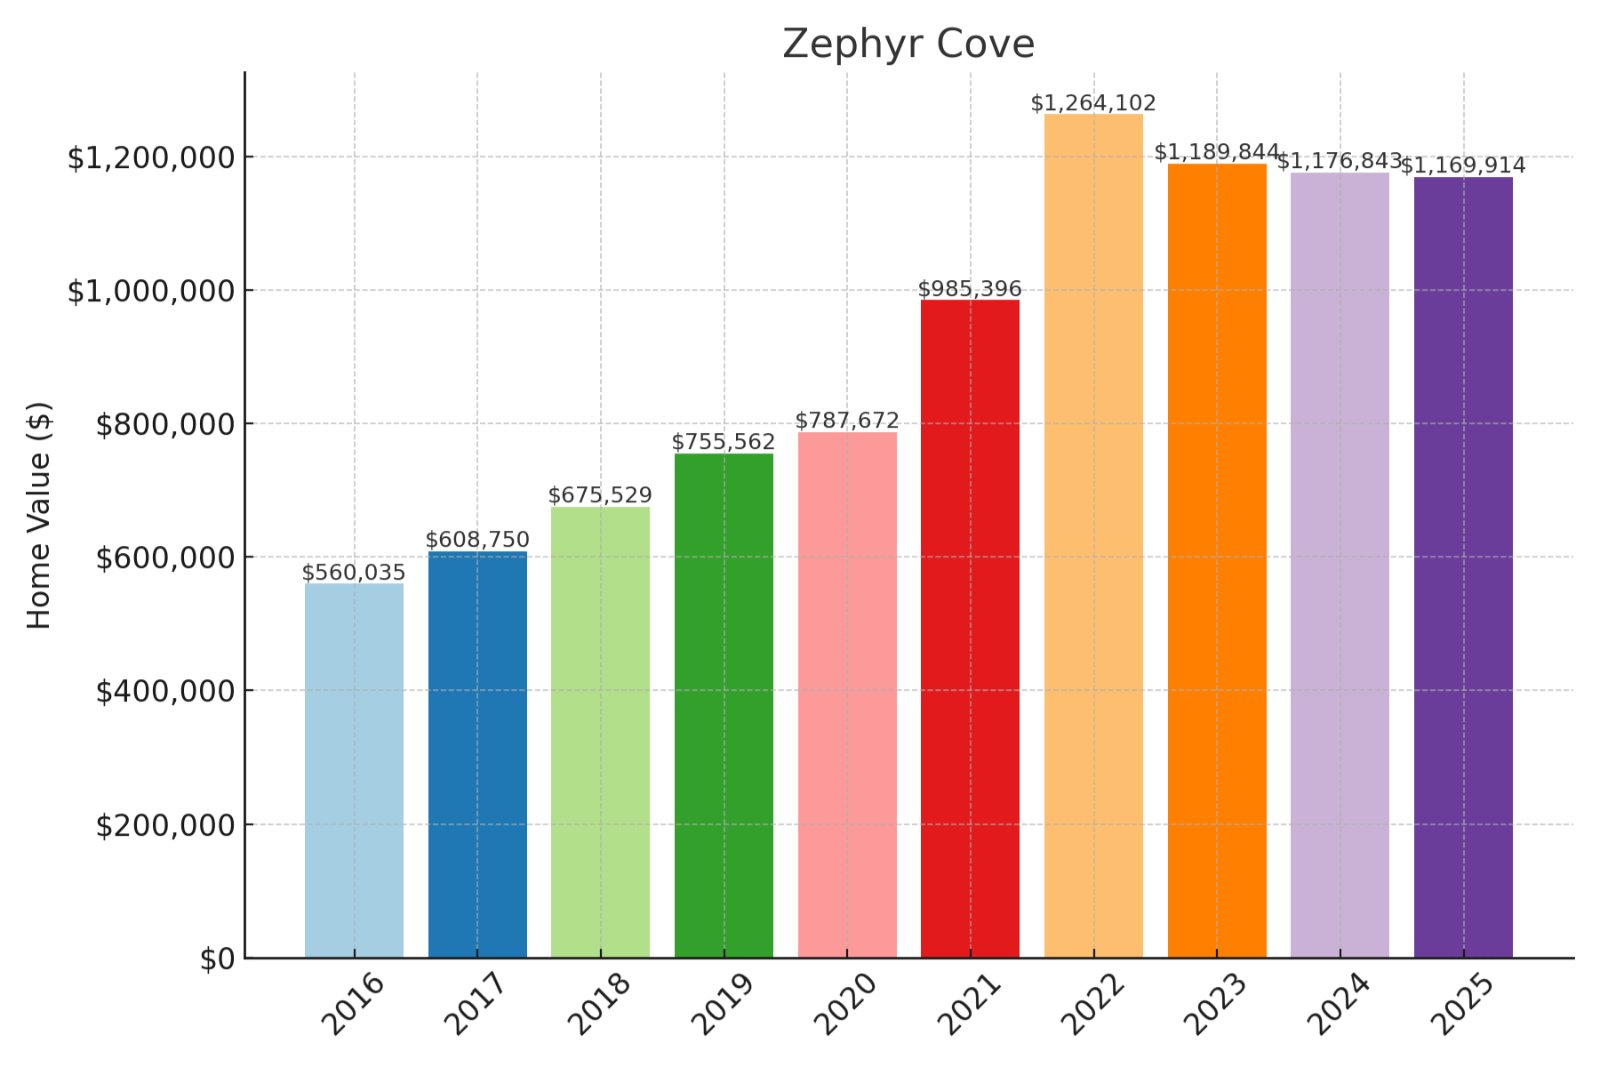
Historic prices and percent change over time:
- % change from 2016 to 2025: 108.9%
- 2025: $1,169,914
- 2024: $1,176,843
- 2023: $1,189,844
- 2022: $1,264,102
- 2021: $985,396
- 2020: $787,672
- 2019: $755,562
- 2018: $675,529
- 2017: $608,750
- 2016: $560,035
About Zephyr Cove

With median values exceeding $1.16M, Zephyr Cove has more than doubled investment capital with 108.9% appreciation since 2016. Your portfolio benefits from both luxury positioning and exceptional financial performance despite recent high-end market adjustments. The price trajectory indicates strong wealth preservation alongside Nevada’s tax advantages compared to neighboring California Tahoe communities. Investment-focused buyers might leverage Zephyr Cove’s proven appreciation pattern in this supply-constrained luxury market segment.
9. Incline Village
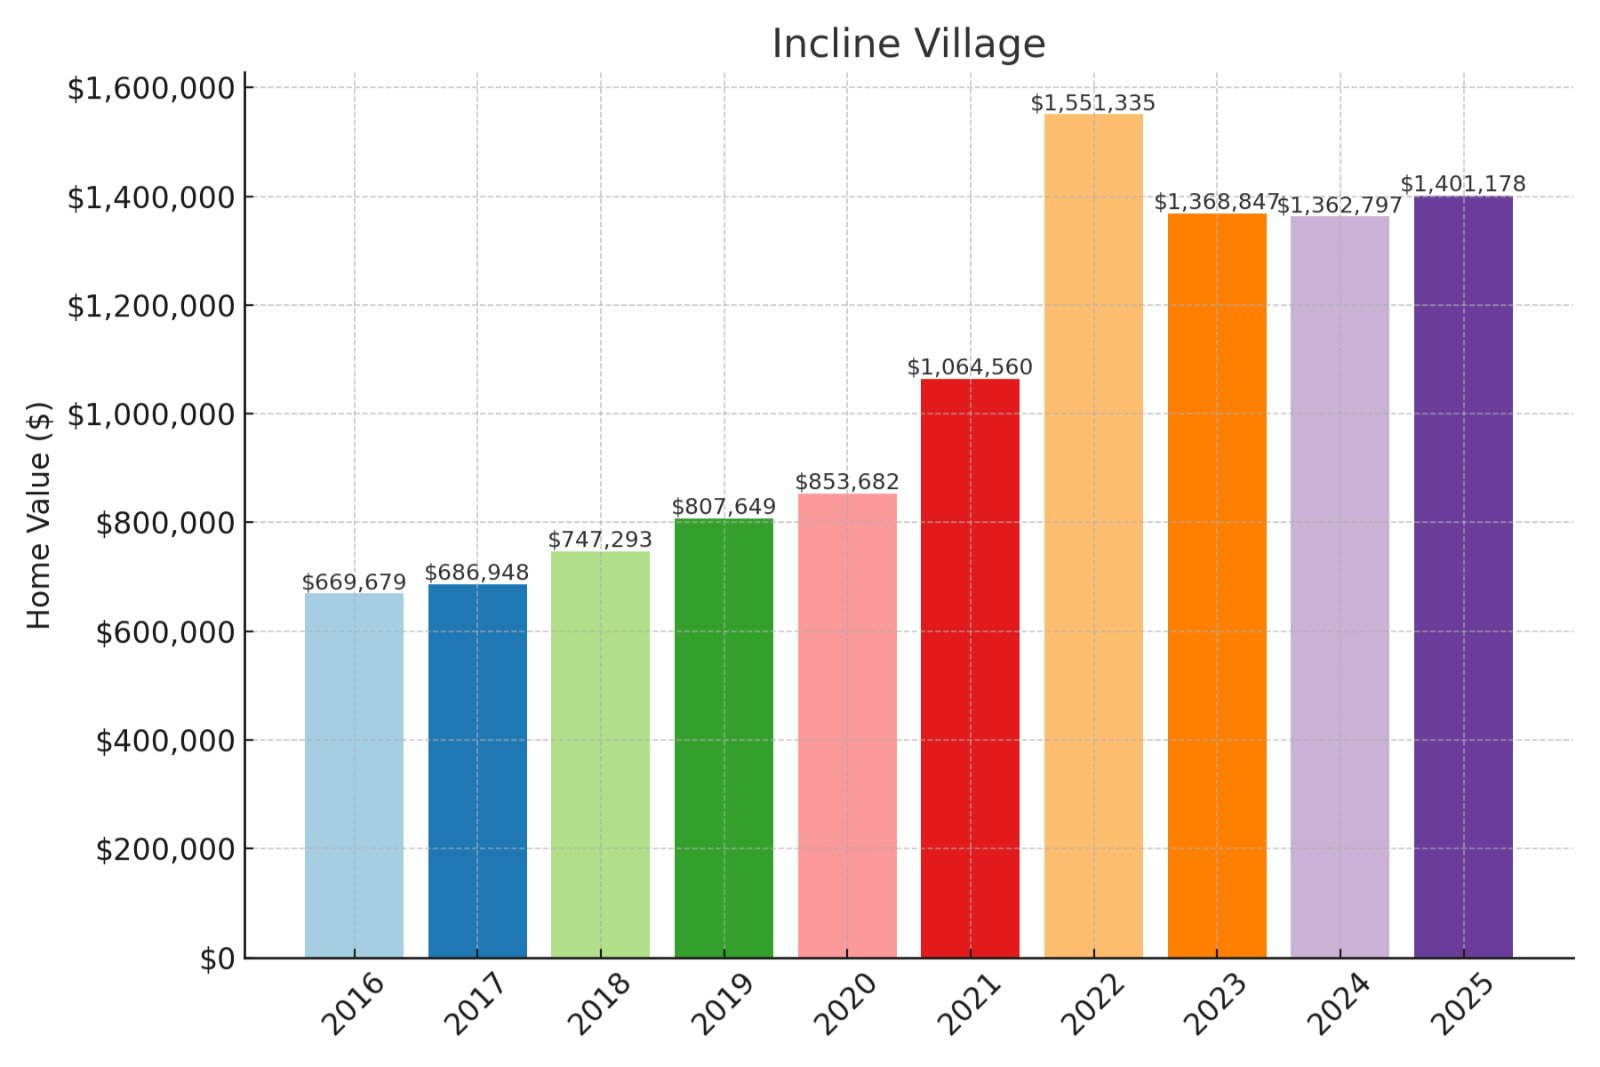
Historic prices and percent change over time:
- % change from 2016 to 2025: 109.23%
- 2025: $1,401,178
- 2024: $1,362,797
- 2023: $1,368,847
- 2022: $1,551,335
- 2021: $1,064,560
- 2020: $853,682
- 2019: $807,649
- 2018: $747,293
- 2017: $686,948
- 2016: $669,679
About Incline Village
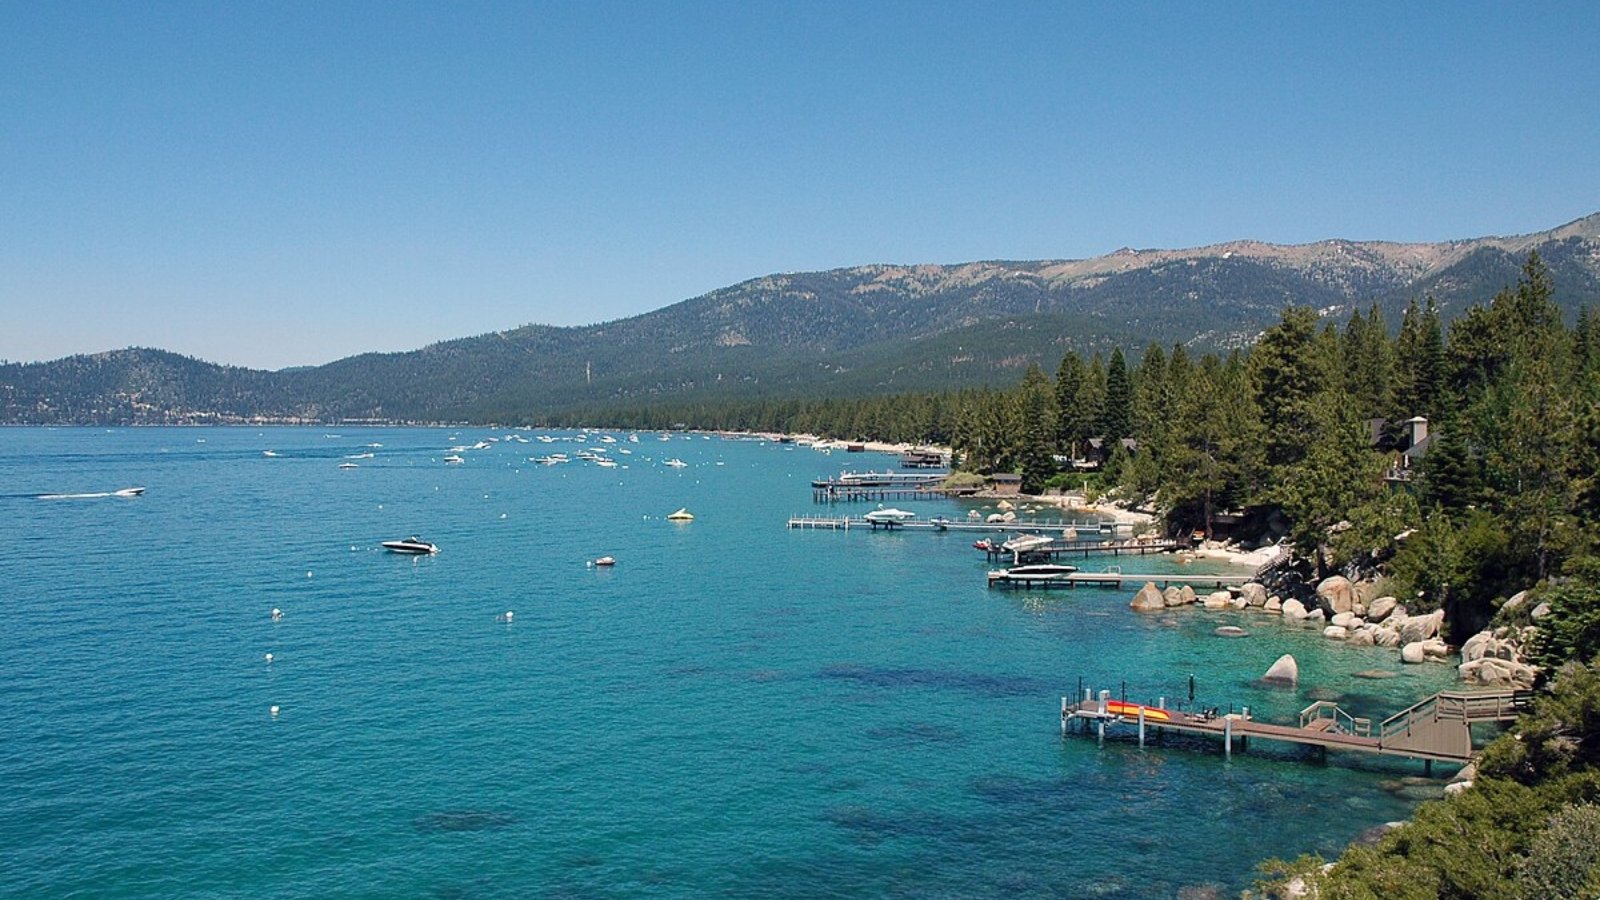
At $1.4M median value, Incline Village has more than doubled investor capital with 109.23% appreciation since 2016. Your wealth accumulation benefits from both premium positioning and Nevada’s favorable tax environment despite luxury market cooling since 2022. The financial fundamentals support long-term value preservation with unique supply constraints in this prestigious Lake Tahoe enclave. High-net-worth investors might leverage Incline Village’s proven appreciation alongside tax advantages unavailable in California Tahoe communities.
8. Las Vegas
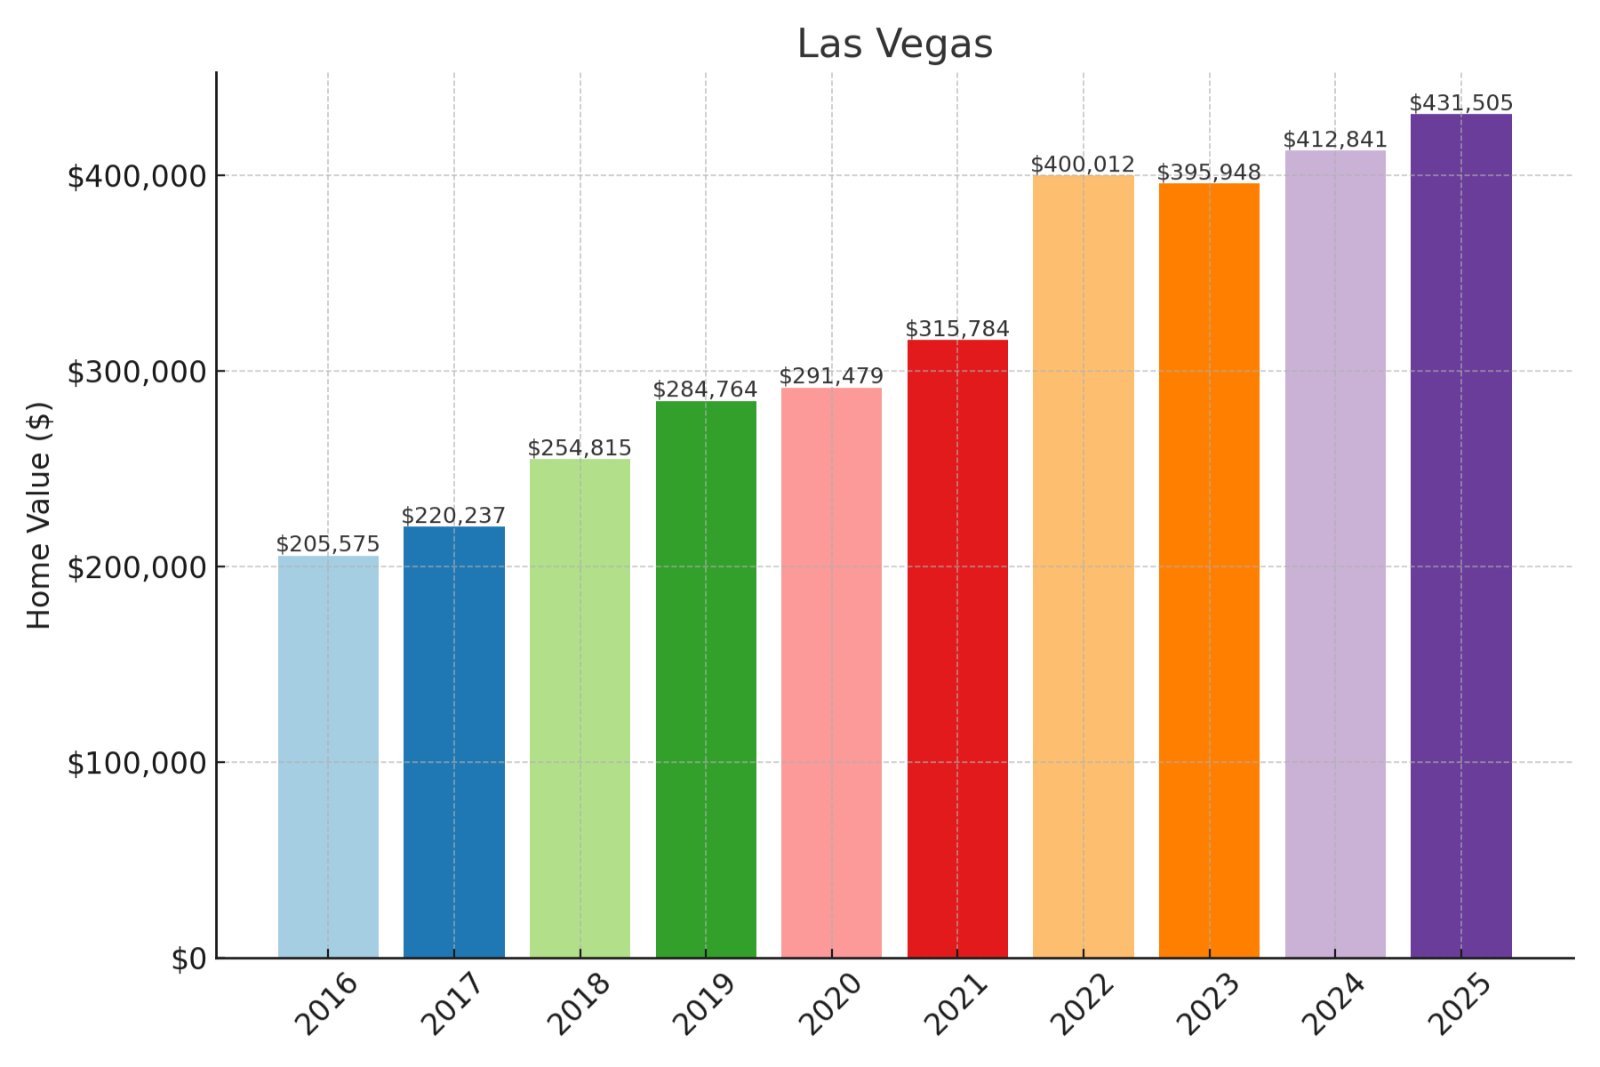
Historic prices and percent change over time:
- % change from 2016 to 2025: 109.9%
- 2025: $431,505
- 2024: $412,841
- 2023: $395,948
- 2022: $400,012
- 2021: $315,784
- 2020: $291,479
- 2019: $284,764
- 2018: $254,815
- 2017: $220,237
- 2016: $205,575
About Las Vegas
Would you like to save this?
With median values at $431,505, Las Vegas has more than doubled investor capital with 109.9% appreciation since 2016. Your investment captures exceptional wealth-building momentum in Nevada’s economic center despite broader market normalization since 2022. The financial trajectory indicates sustainable long-term growth with particularly strong fundamentals as population and employment continue expanding. Strategic investors might leverage Las Vegas’ proven resilience alongside diversification opportunities across its varied submarkets.
7. Yerington

Historic prices and percent change over time:
- % change from 2016 to 2025: 111.13%
- 2025: $294,280
- 2024: $285,999
- 2023: $284,163
- 2022: $293,461
- 2021: $245,120
- 2020: $218,052
- 2019: $193,776
- 2018: $172,417
- 2017: $151,870
- 2016: $139,381
About Yerington
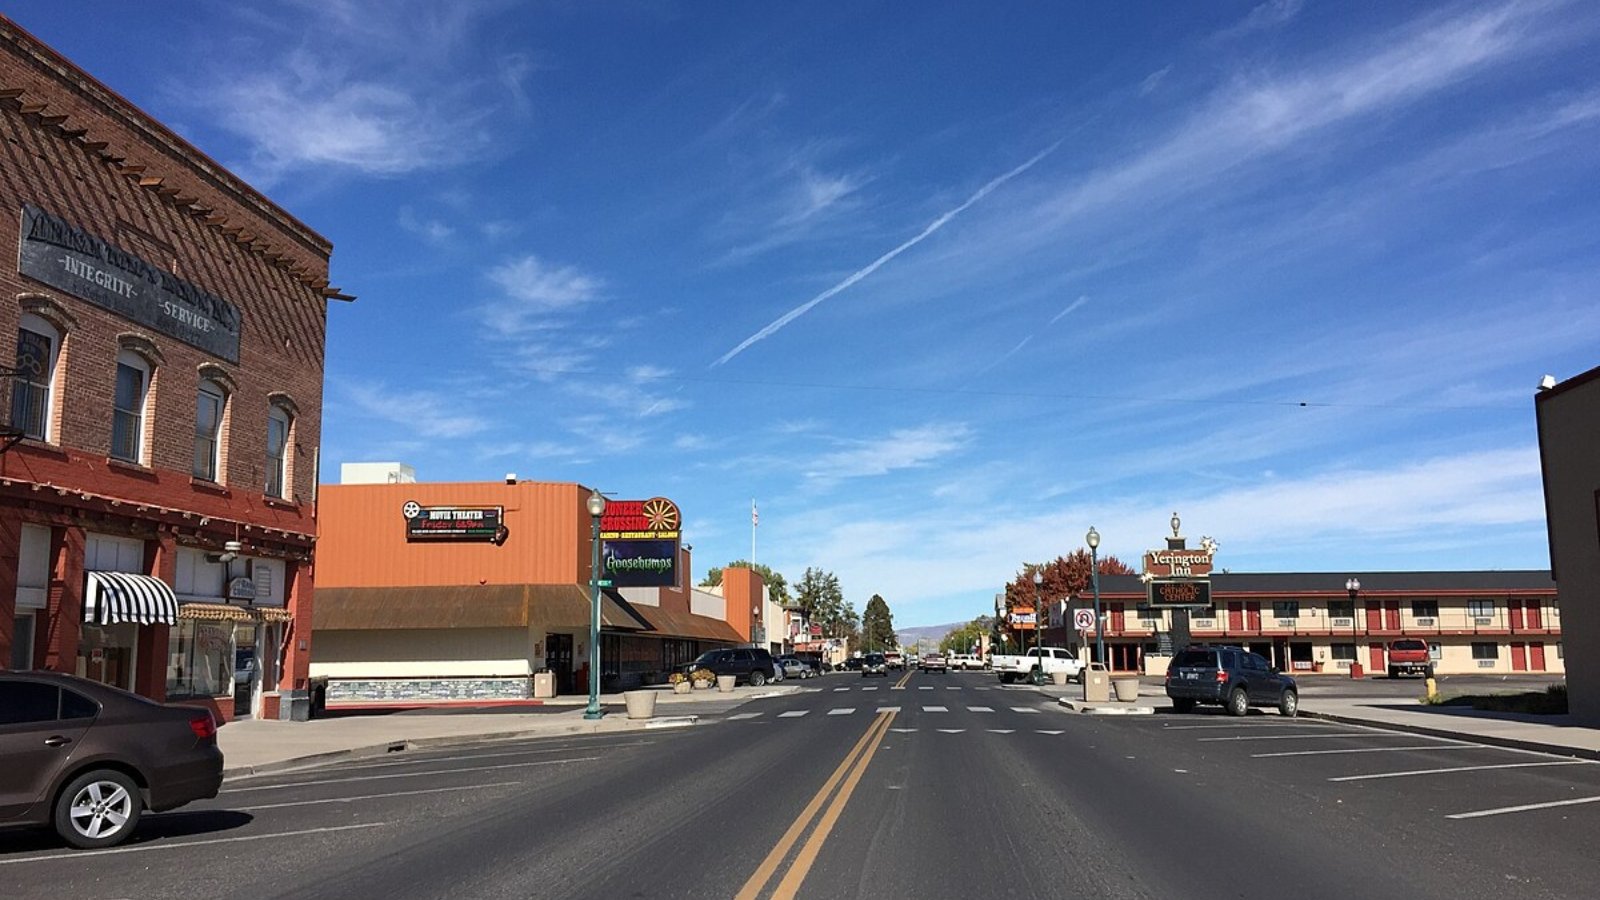
At $294,280 median value, Yerington has delivered extraordinary ROI with 111.13% appreciation since 2016. Your investment benefits from both exceptional price momentum and favorable entry point compared to other high-growth Nevada markets. The financial fundamentals suggest continued wealth creation potential as regional mining and industrial development expands. Value-focused investors might leverage Yerington’s proven appreciation pattern alongside above-average rental yields in this emerging growth corridor.
6. Dayton
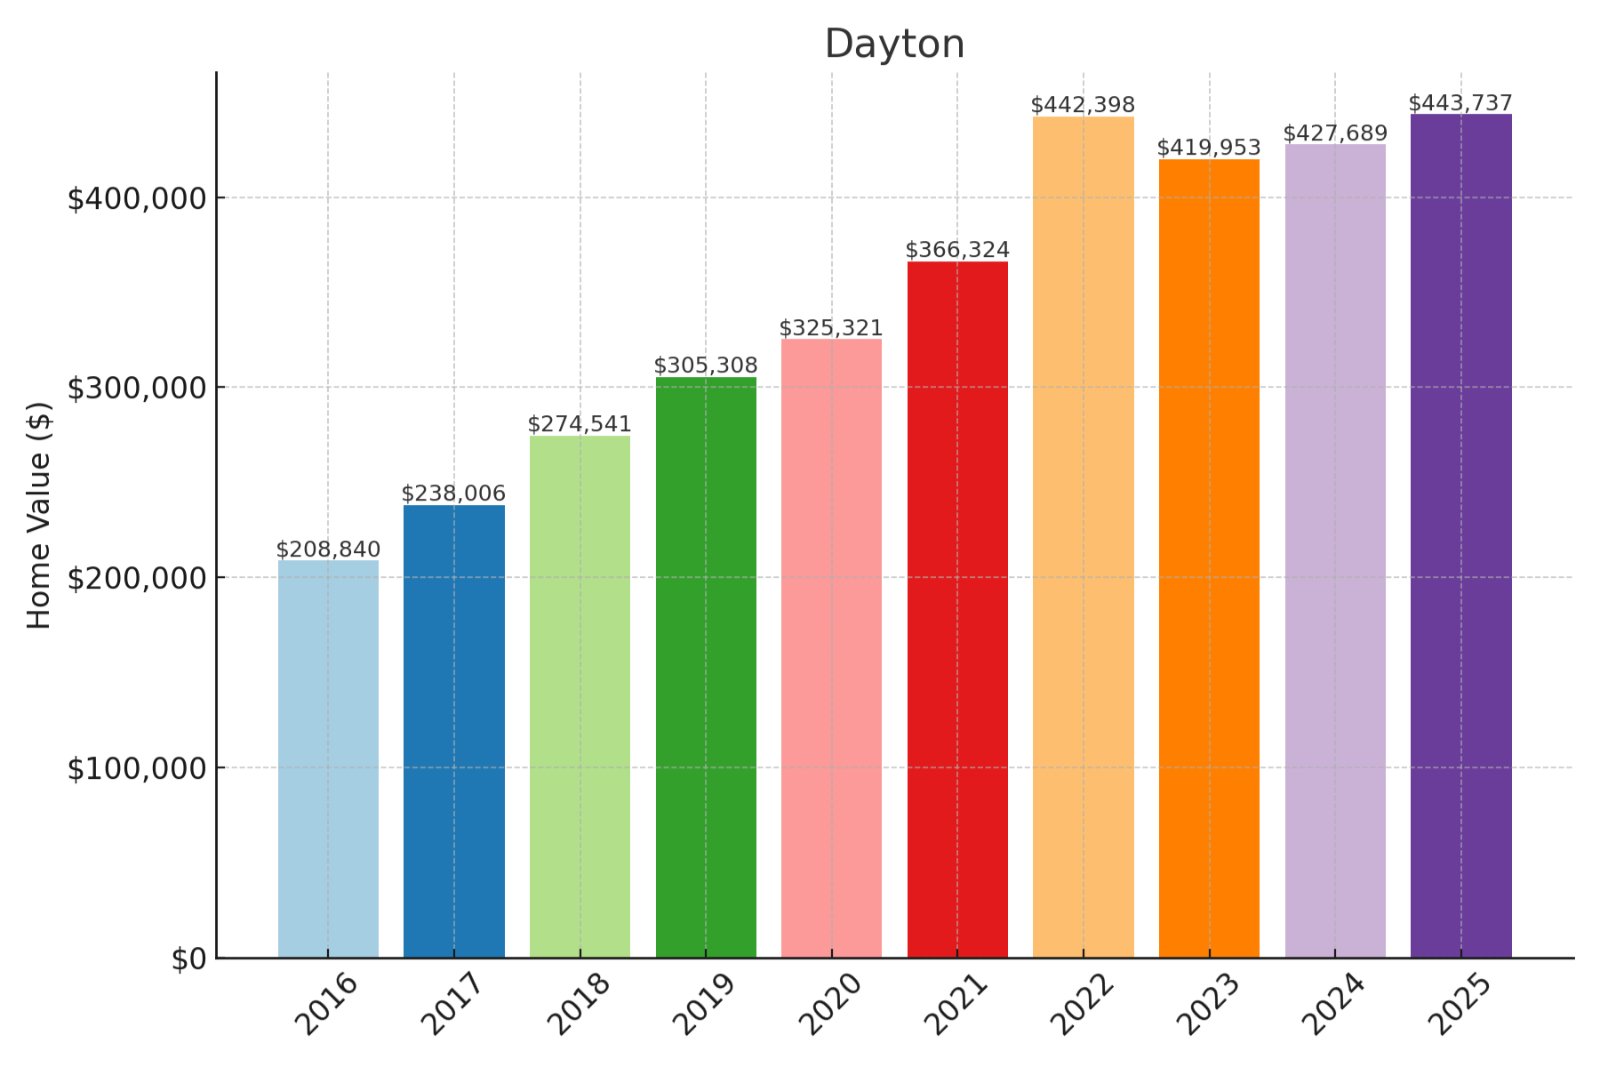
Historic prices and percent change over time:
- % change from 2016 to 2025: 112.48%
- 2025: $443,737
- 2024: $427,689
- 2023: $419,953
- 2022: $442,398
- 2021: $366,324
- 2020: $325,321
- 2019: $305,308
- 2018: $274,541
- 2017: $238,006
- 2016: $208,840
About Dayton
With median values reaching $443,737, Dayton has more than doubled investor capital with 112.48% appreciation since 2016. Your portfolio benefits from exceptional wealth-building momentum in this high-growth corridor between Carson City and Reno. The financial trajectory indicates sustainable long-term appreciation despite recent market normalization from pandemic peaks. Strategic investors might leverage Dayton’s proven value appreciation alongside its relative affordability compared to neighboring Carson City and Reno markets.
5. Fallon

Historic prices and percent change over time:
- % change from 2016 to 2025: 117.8%
- 2025: $377,918
- 2024: $360,037
- 2023: $348,816
- 2022: $358,455
- 2021: $295,441
- 2020: $259,377
- 2019: $242,929
- 2018: $212,779
- 2017: $191,140
- 2016: $173,513
About Fallon
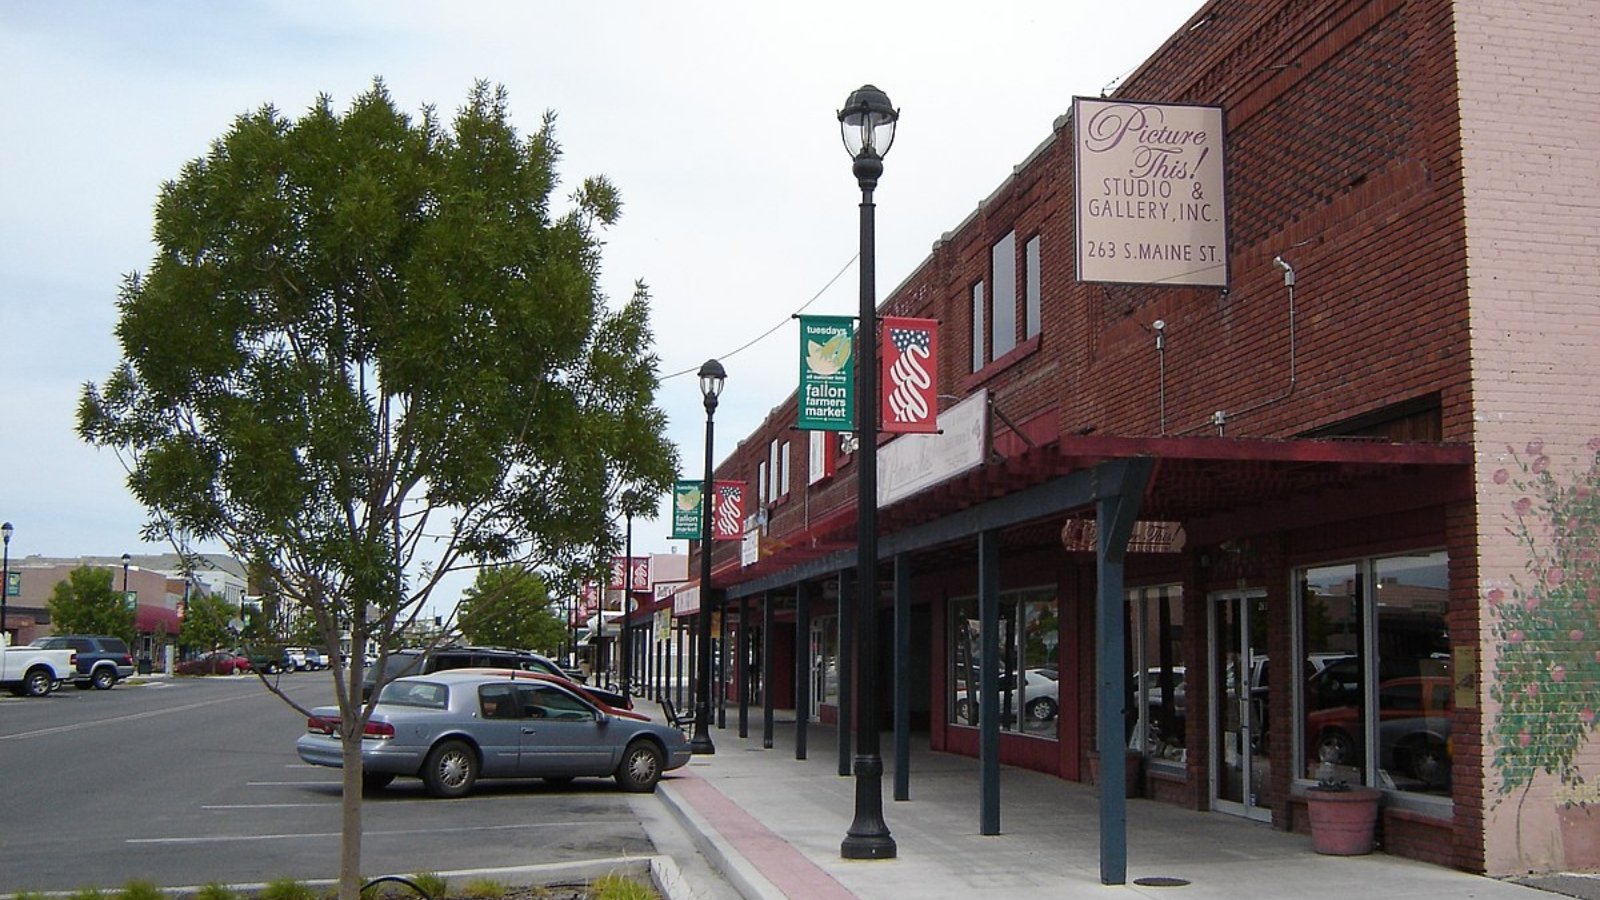
At $377,918 median value, Fallon has delivered remarkable ROI with 117.8% appreciation since 2016. Your investment benefits from exceptional price momentum in this emerging growth corridor with naval air station economic stability. The financial fundamentals suggest continued equity accumulation potential despite broader market headwinds since 2022. Savvy investors might leverage Fallon’s proven appreciation pattern alongside favorable price-to-rent ratios for balanced portfolio growth and income.
4. Lovelock
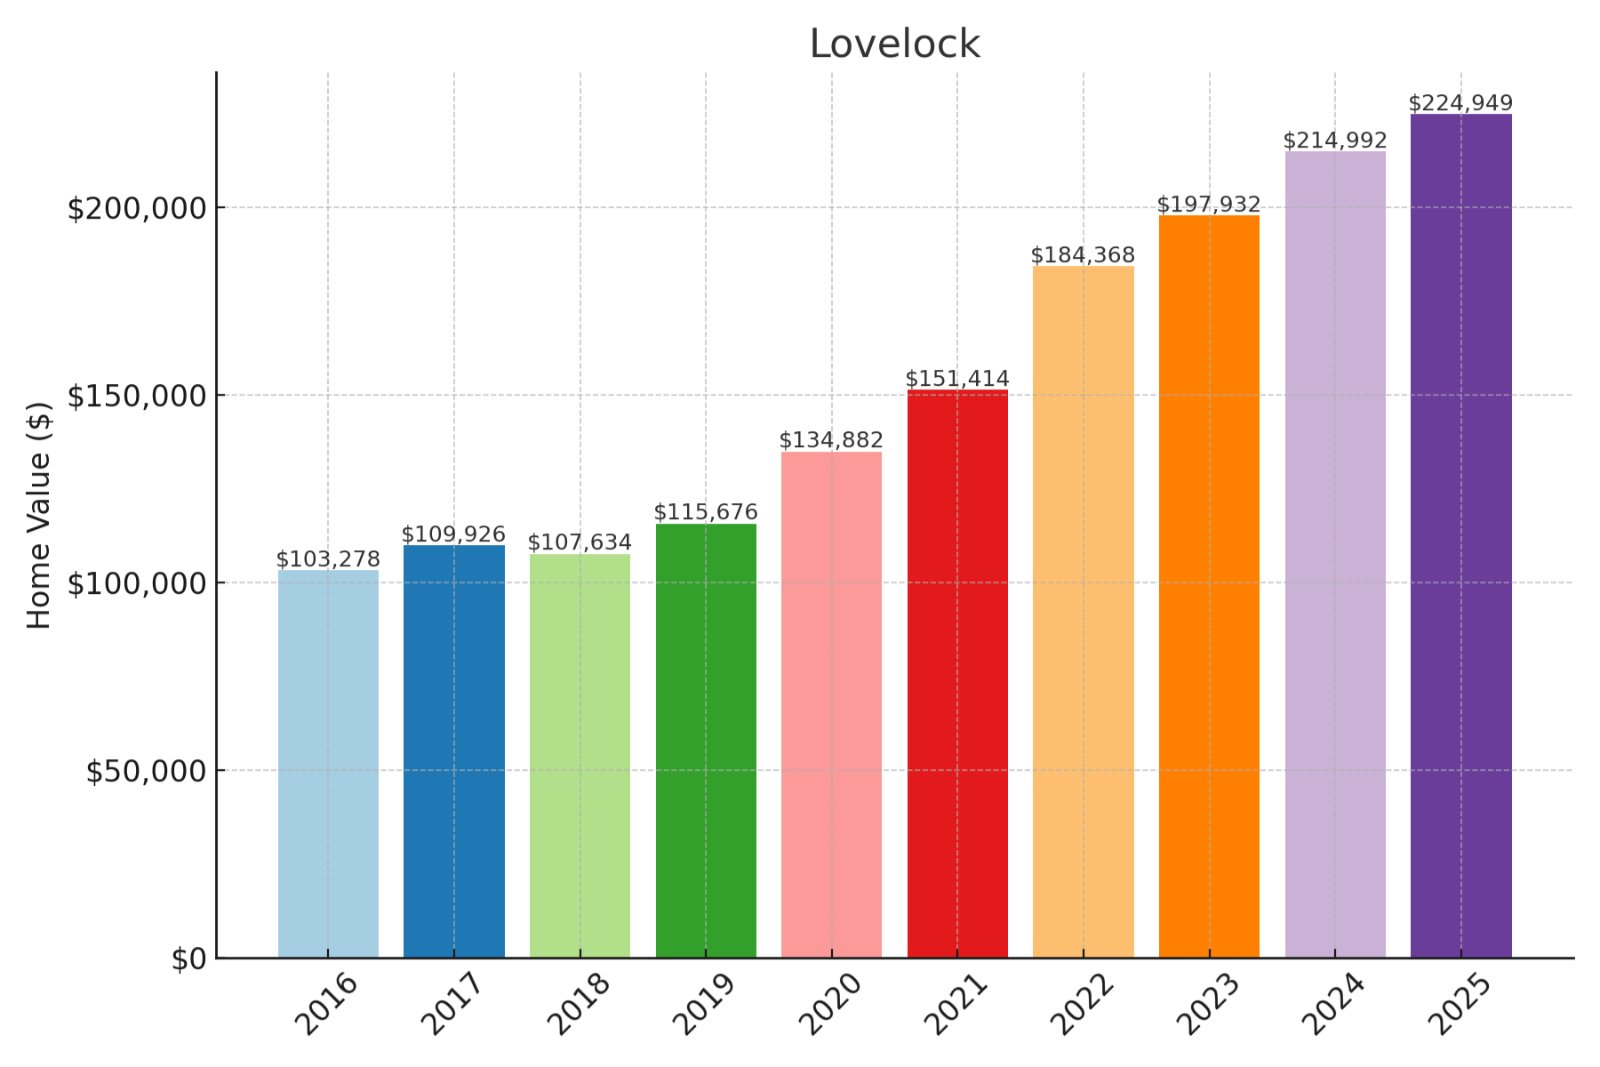
Historic prices and percent change over time:
- % change from 2016 to 2025: 117.81%
- 2025: $224,949
- 2024: $214,992
- 2023: $197,932
- 2022: $184,368
- 2021: $151,414
- 2020: $134,882
- 2019: $115,676
- 2018: $107,634
- 2017: $109,926
- 2016: $103,278
About Lovelock
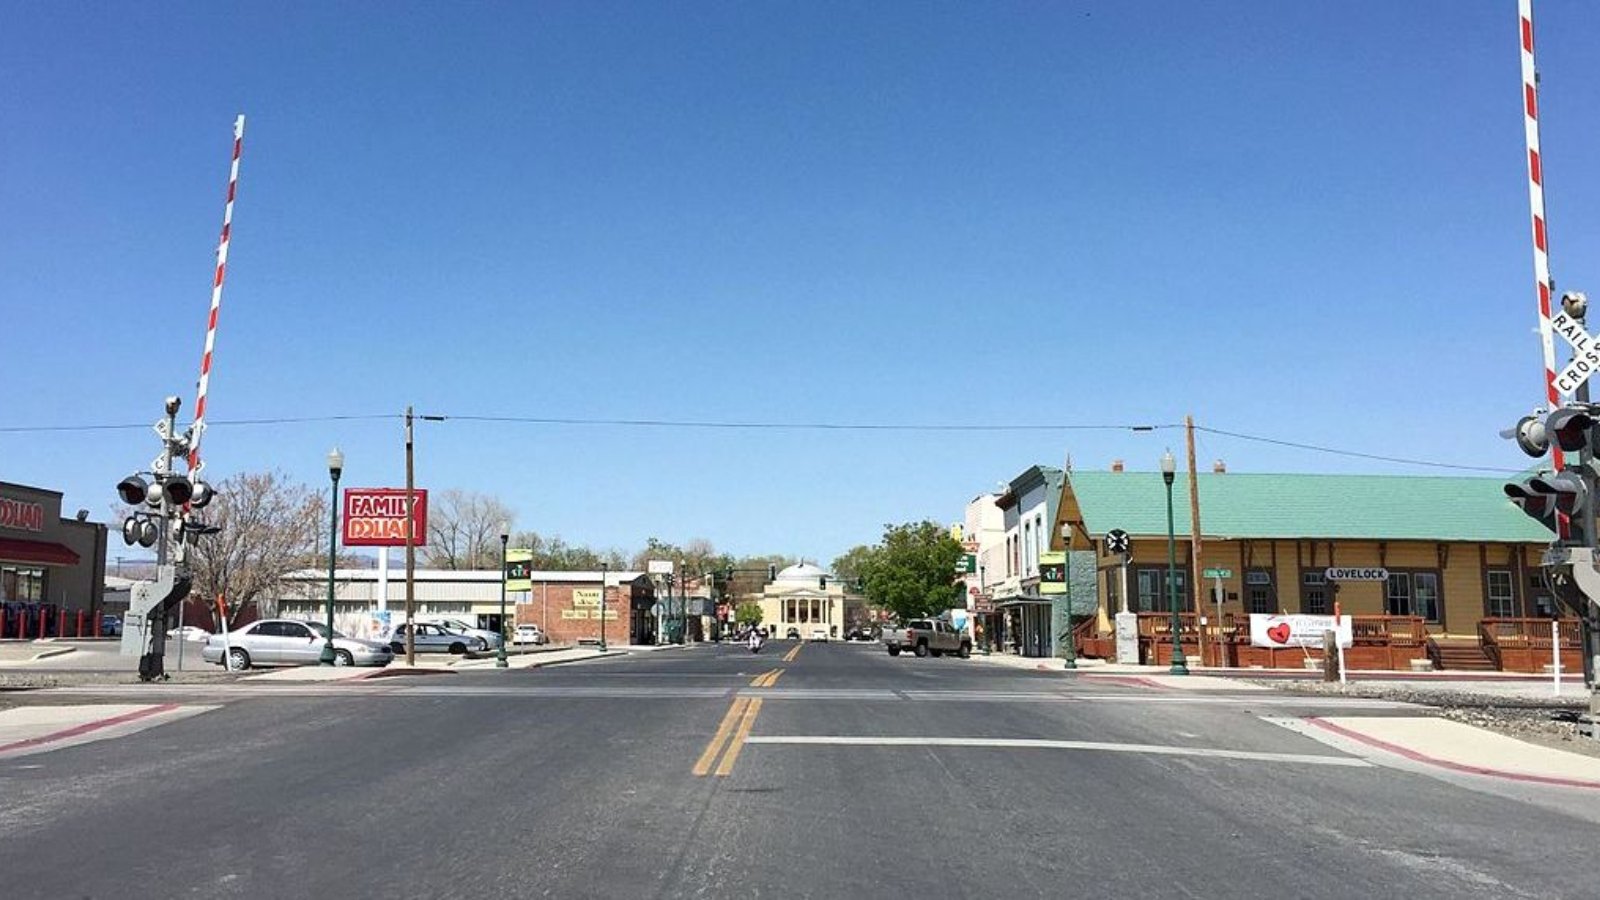
With a median value of just $224,949, Lovelock offers Nevada’s best ROI with 117.81% appreciation since 2016. Your investment captures extraordinary wealth-building at Nevada’s lowest price point among top-performing markets. The financial trajectory indicates continued growth potential despite broader market conditions, with particular advantage for cash buyers. Value-focused investors might leverage Lovelock’s exceptional price momentum alongside Nevada’s most favorable price-to-rent ratios for balanced growth and income.
3. North Las Vegas
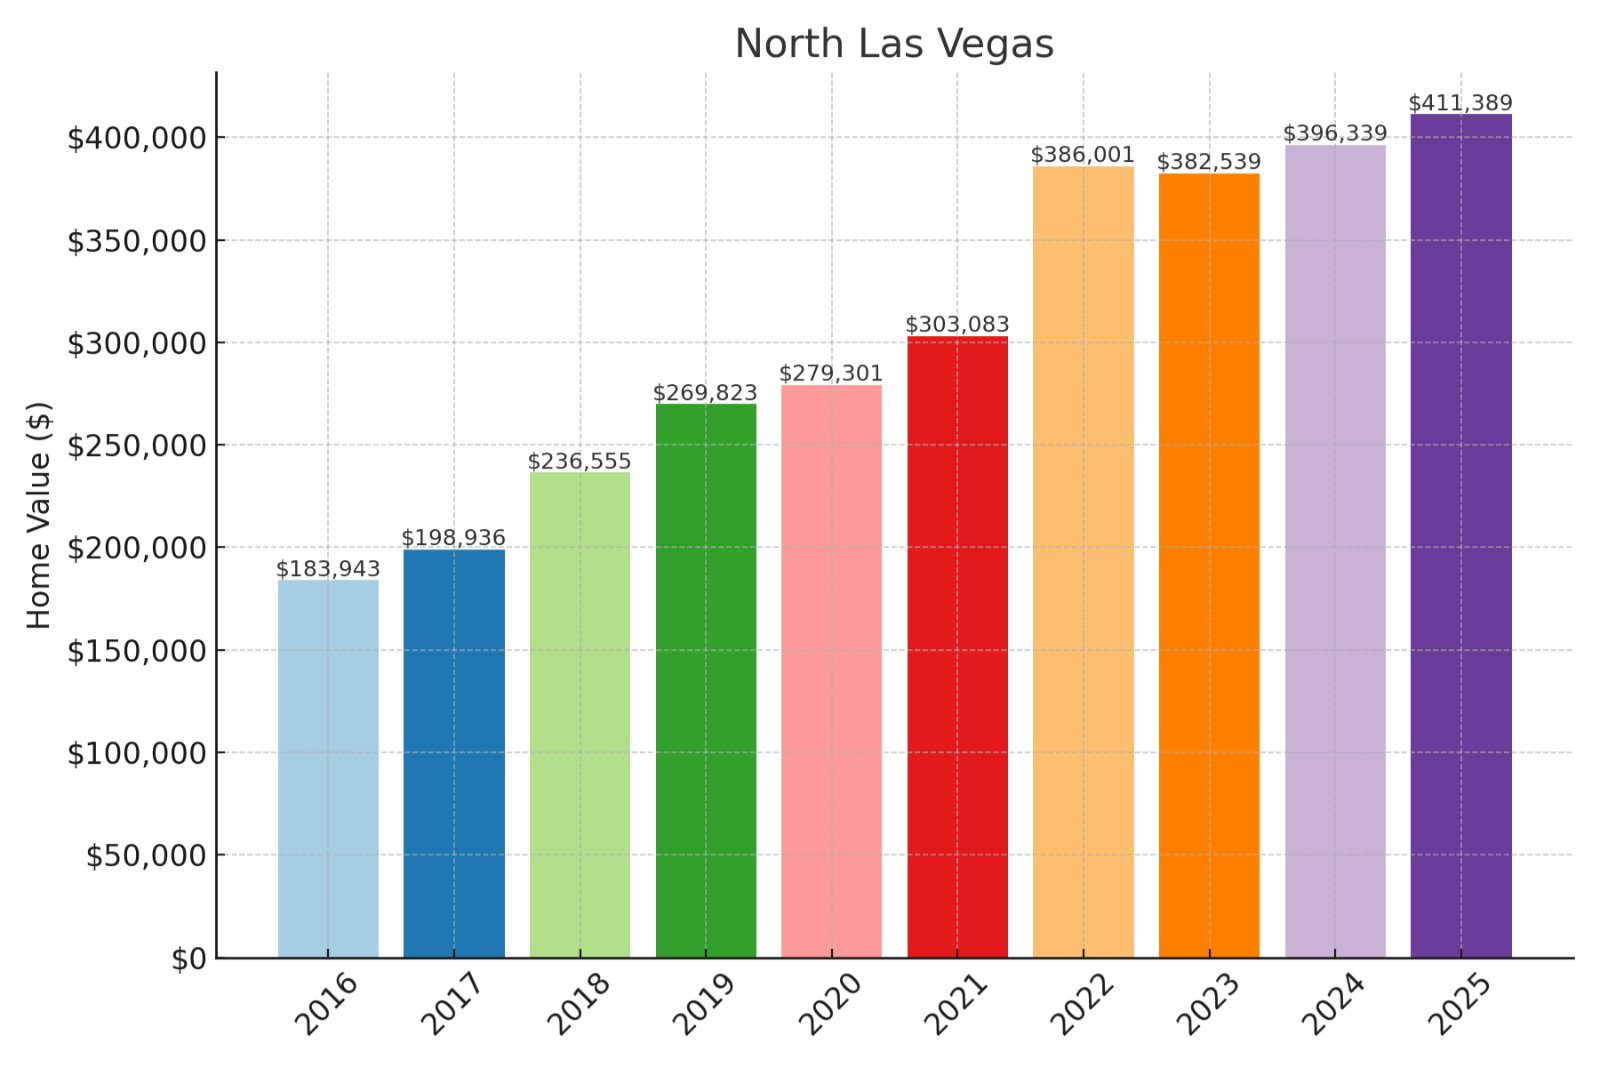
Historic prices and percent change over time:
- % change from 2016 to 2025: 123.65%
- 2025: $411,389
- 2024: $396,339
- 2023: $382,539
- 2022: $386,001
- 2021: $303,083
- 2020: $279,301
- 2019: $269,823
- 2018: $236,555
- 2017: $198,936
- 2016: $183,943
About North Las Vegas
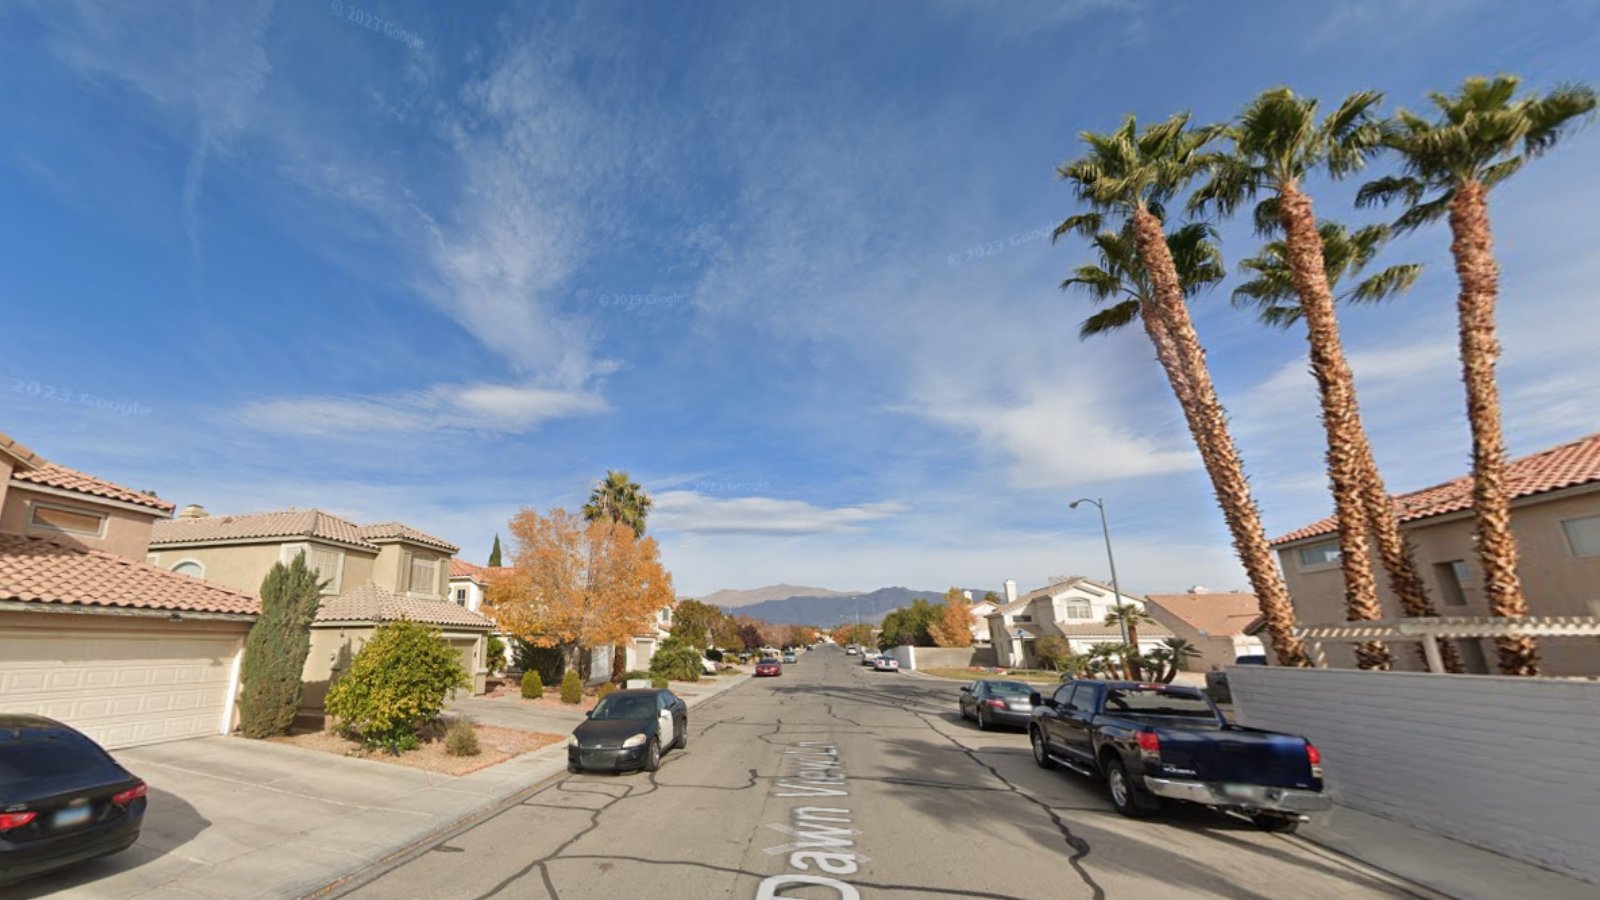
At $411,389 median value, North Las Vegas has delivered exceptional ROI with 123.65% appreciation since 2016. Your investment benefits from both extraordinary price momentum and relative value compared to neighboring Las Vegas submarkets. The financial fundamentals indicate continued equity-building potential as development expands northward with major industrial and residential projects. Strategic investors might leverage North Las Vegas’ proven appreciation pattern alongside favorable cash flow metrics for balanced portfolio growth.
2. Pahrump

Historic prices and percent change over time:
- % change from 2016 to 2025: 125.5%
- 2025: $347,936
- 2024: $333,678
- 2023: $335,775
- 2022: $338,977
- 2021: $264,617
- 2020: $239,790
- 2019: $214,613
- 2018: $181,744
- 2017: $162,412
- 2016: $154,296
About Pahrump
With median values at $347,936, Pahrump has delivered remarkable wealth creation with 125.5% appreciation since 2016. Your investment benefits from extraordinary price momentum in this emerging alternative to Las Vegas’ higher-priced submarkets. The financial trajectory shows exceptional resilience despite broader market fluctuations, with continued upside potential as development expands. Value-conscious investors might leverage Pahrump’s proven appreciation pattern alongside its relative affordability for optimal growth-to-price positioning.
1. Silver Springs
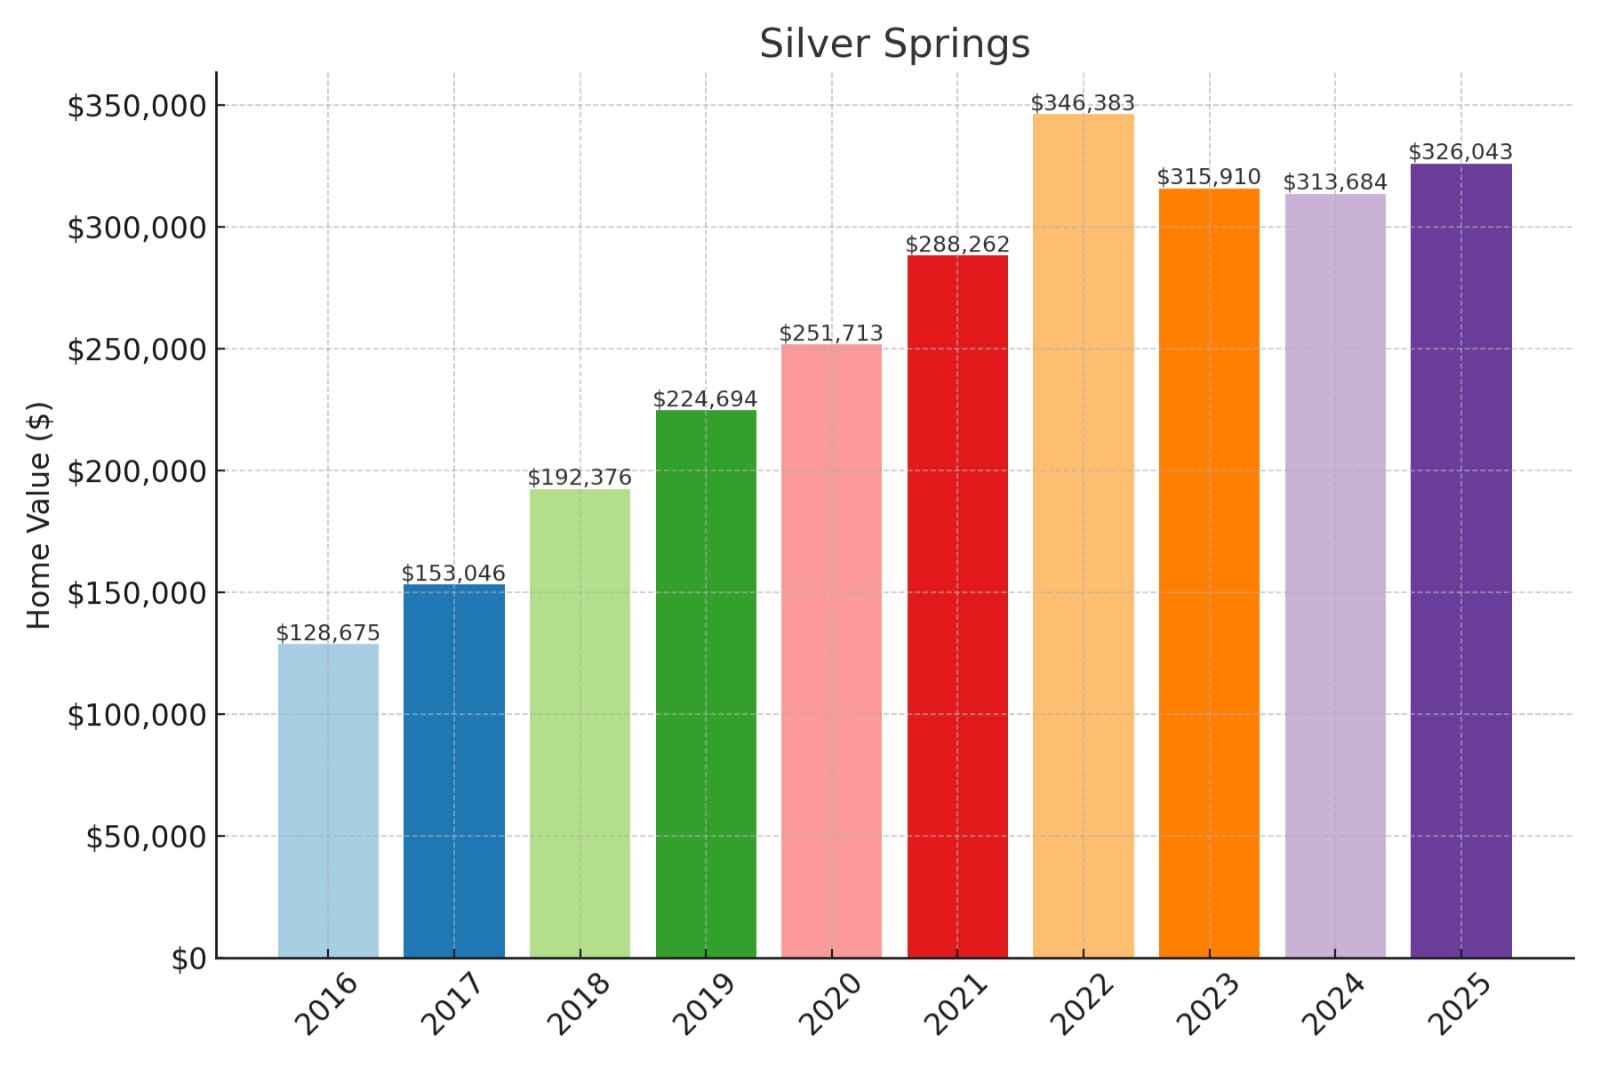
Historic prices and percent change over time:
- % change from 2016 to 2025: 153.39%
- 2025: $326,043
- 2024: $313,684
- 2023: $315,910
- 2022: $346,383
- 2021: $288,262
- 2020: $251,713
- 2019: $224,694
- 2018: $192,376
- 2017: $153,046
- 2016: $128,675
About Silver Springs

At $326,043 median value, Silver Springs stands as Nevada’s undisputed ROI leader with extraordinary 153.39% appreciation since 2016. Your investment captures unmatched wealth-building momentum in this emerging growth corridor between Reno and Las Vegas. The financial fundamentals suggest continued equity acceleration despite broader market normalization, with particularly strong positioning ahead of regional development. Strategic investors might leverage Silver Springs’ exceptional price trajectory alongside favorable entry point for optimal growth-to-price ratio.