🔥 Would you like to save this?
I’ve analyzed data from the Zillow Home Value Index to identify Michigan neighborhoods with the highest percentage increases in home values from 2016 to 2025, revealing some fascinating patterns of growth and investment opportunity.
What struck me most was the remarkable resurgence happening in Detroit and Flint neighborhoods, with some areas seeing nearly 370% appreciation over just nine years. This represents a significant shift in Michigan’s real estate landscape and contradicts many outdated perceptions about these communities.
In order to come up with the very specific design ideas, we create most designs with the assistance of state-of-the-art AI interior design software.
The data reveals a compelling story of renewal across Michigan’s urban centers, with previously overlooked neighborhoods now delivering returns that outpace many traditionally “hot” markets nationwide. These aren’t just numbers—they represent transformative economic opportunity for residents and investors alike.
25. Ballenger Square Community
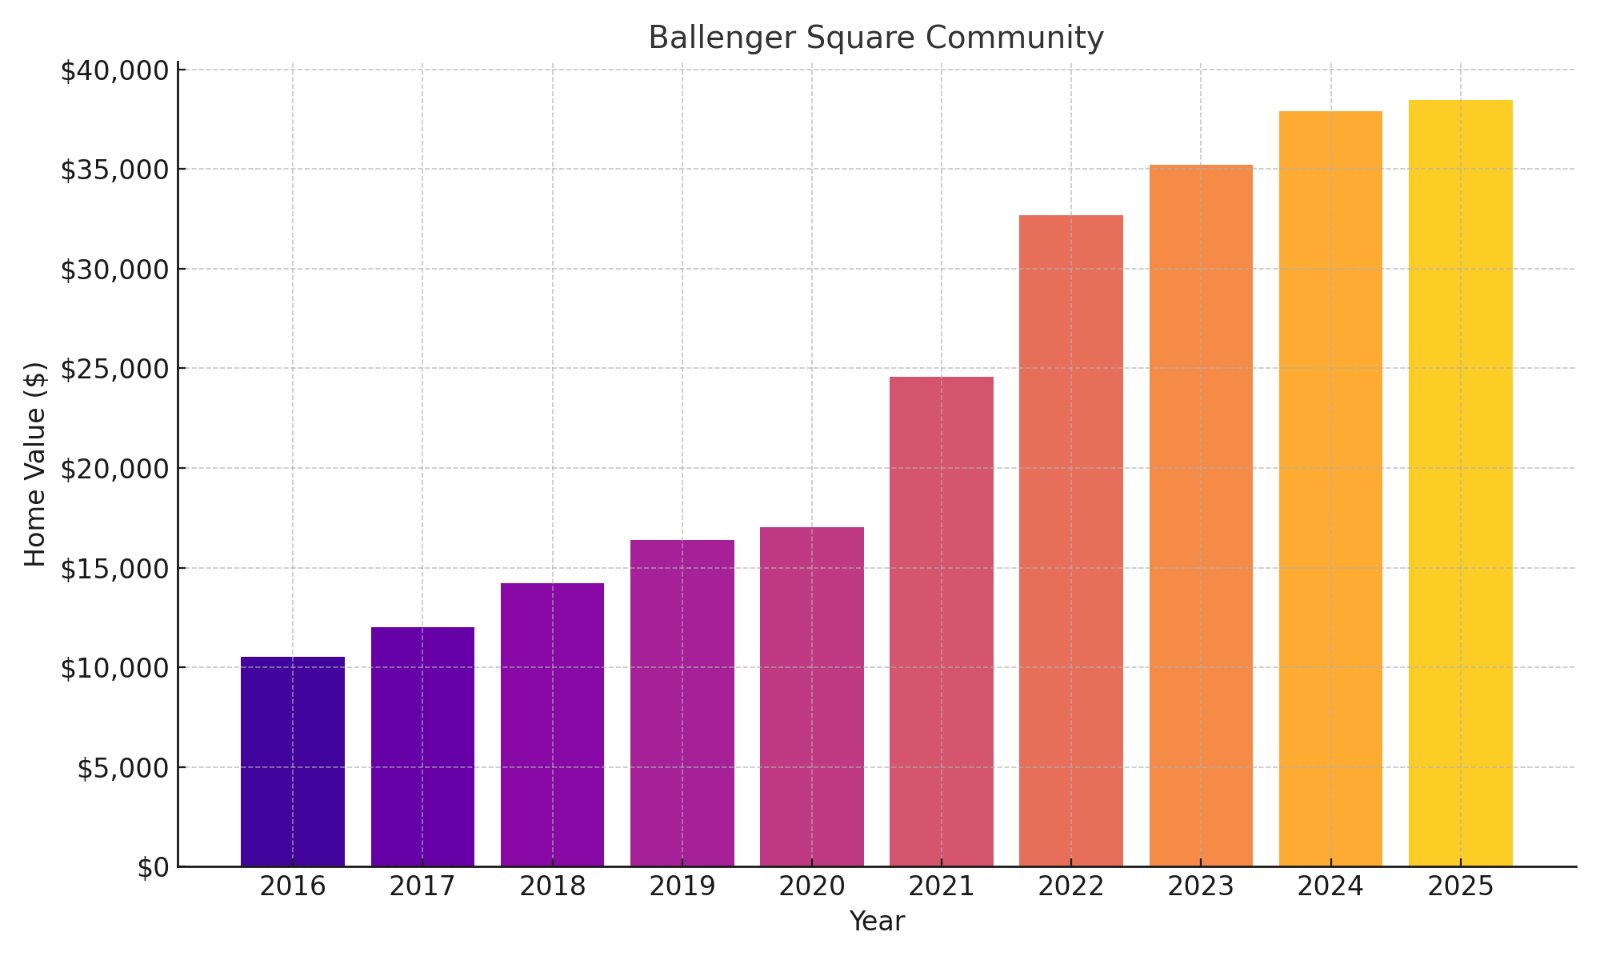
- % change from 2016 to 2025: 265.37%
- 2025: $38,480
- 2024: $37,898
- 2023: $35,208
- 2022: $32,693
- 2021: $24,571
- 2020: $17,028
- 2019: $16,402
- 2018: $14,236
- 2017: $12,001
- 2016: $10,532
Your investment dollars stretch remarkably far in Ballenger Square, where the sub-$40K price point still offers substantial growth potential. The neighborhood’s consistent year-over-year appreciation suggests we’re witnessing sustained revitalization rather than a temporary spike. Located near Flint’s western corridor, Ballenger Square represents an accessible entry point for investors seeking value with promising upside potential.
24. Glendale Hills

- % change from 2016 to 2025: 267.51%
- 2025: $81,781
- 2024: $79,510
- 2023: $77,271
- 2022: $73,748
- 2021: $57,729
- 2020: $44,291
- 2019: $42,355
- 2018: $34,549
- 2017: $24,628
- 2016: $22,253
Glendale Hills offers a compelling risk-reward profile with properties still priced well below six figures despite nearly tripling in value over nine years. You’re looking at a market with particularly strong momentum since 2020, indicating pandemic-era demand has accelerated rather than diminished. The neighborhood’s strategic location provides the dual advantage of affordability and proximity to revitalizing commercial corridors, making it particularly attractive for buy-and-hold investors.
23. College Park

- % change from 2016 to 2025: 268.77%
- 2025: $82,282
- 2024: $71,084
- 2023: $74,248
- 2022: $72,483
- 2021: $56,798
- 2020: $43,462
- 2019: $39,752
- 2018: $31,816
- 2017: $25,367
- 2016: $22,312
College Park represents a textbook example of asymmetric investment opportunity, where relatively modest capital unlocks substantial appreciation potential. The $60K jump since 2016 highlights how educational institution proximity continues to anchor neighborhood stability despite broader market fluctuations. For investors seeking cash flow with long-term equity growth, this neighborhood’s rental demand from student populations creates a compelling dual-income stream opportunity while appreciation trends remain firmly positive.
22. Far West
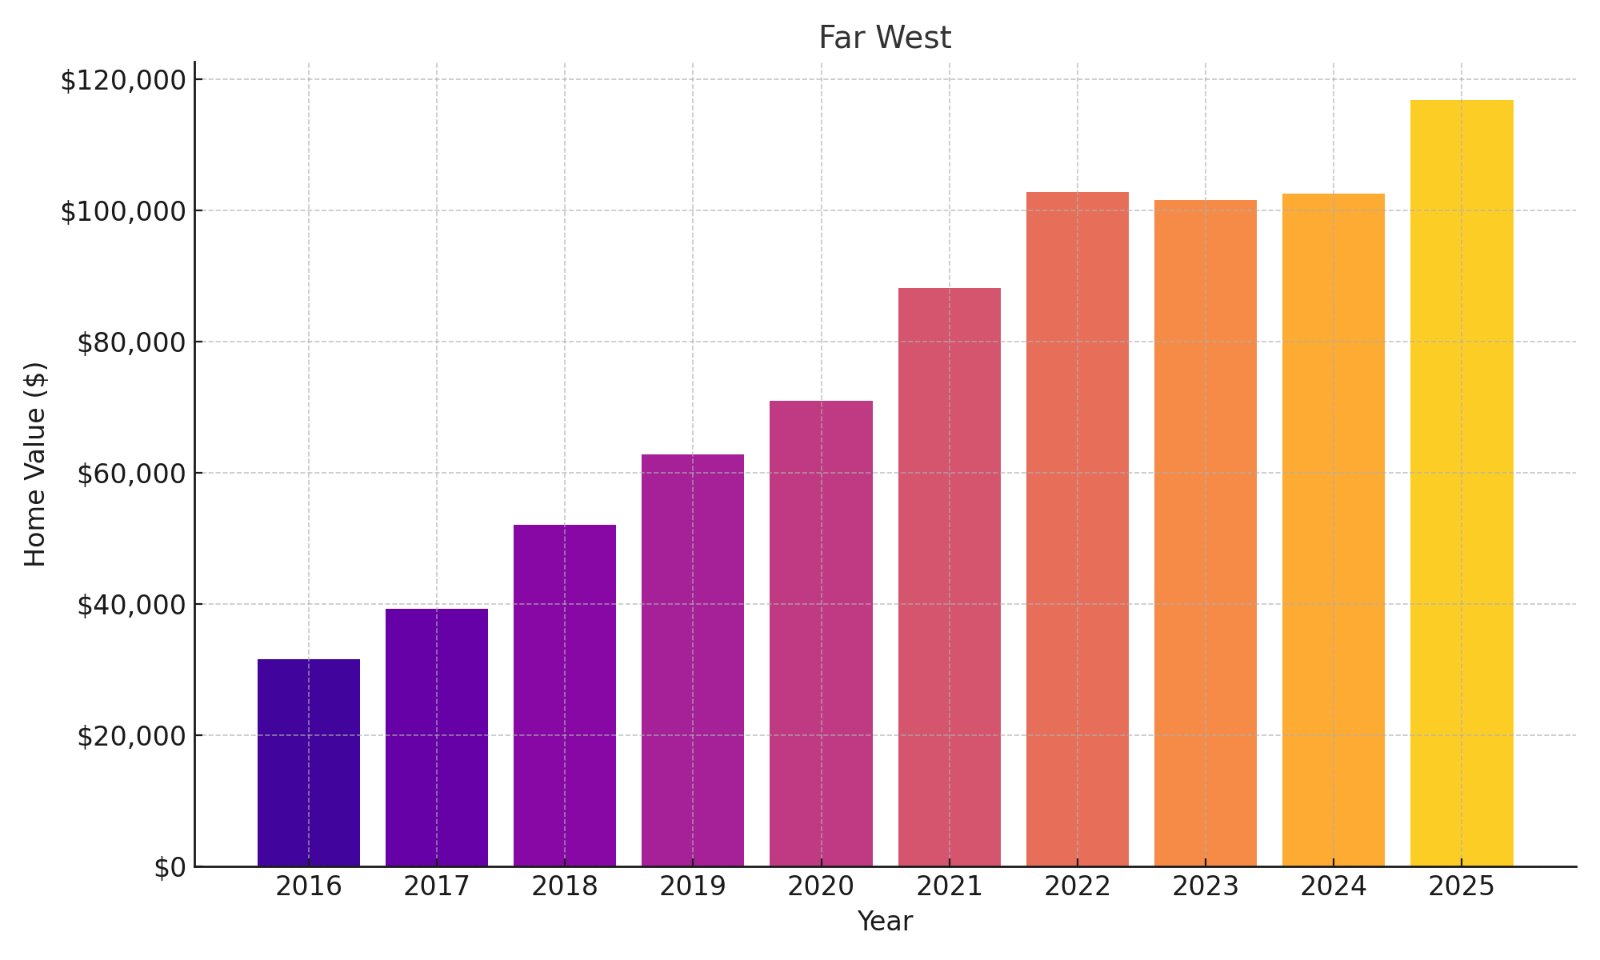
- % change from 2016 to 2025: 269.15%
- 2025: $116,934
- 2024: $102,572
- 2023: $101,595
- 2022: $102,883
- 2021: $88,162
- 2020: $70,965
- 2019: $62,862
- 2018: $52,150
- 2017: $39,261
- 2016: $31,676
Far West has crossed the psychological $100K threshold, signaling its transition from “emerging” to “established” in investment terms. The impressive $85K appreciation since 2016 presents compelling equity-building opportunities while still offering cap rates typically unavailable in more mature markets. Situated in Detroit’s western reaches, this neighborhood demonstrates how targeted infrastructure improvements can catalyze sustained property value growth that outpaces inflation by several multiples.
21. Wildemere Park
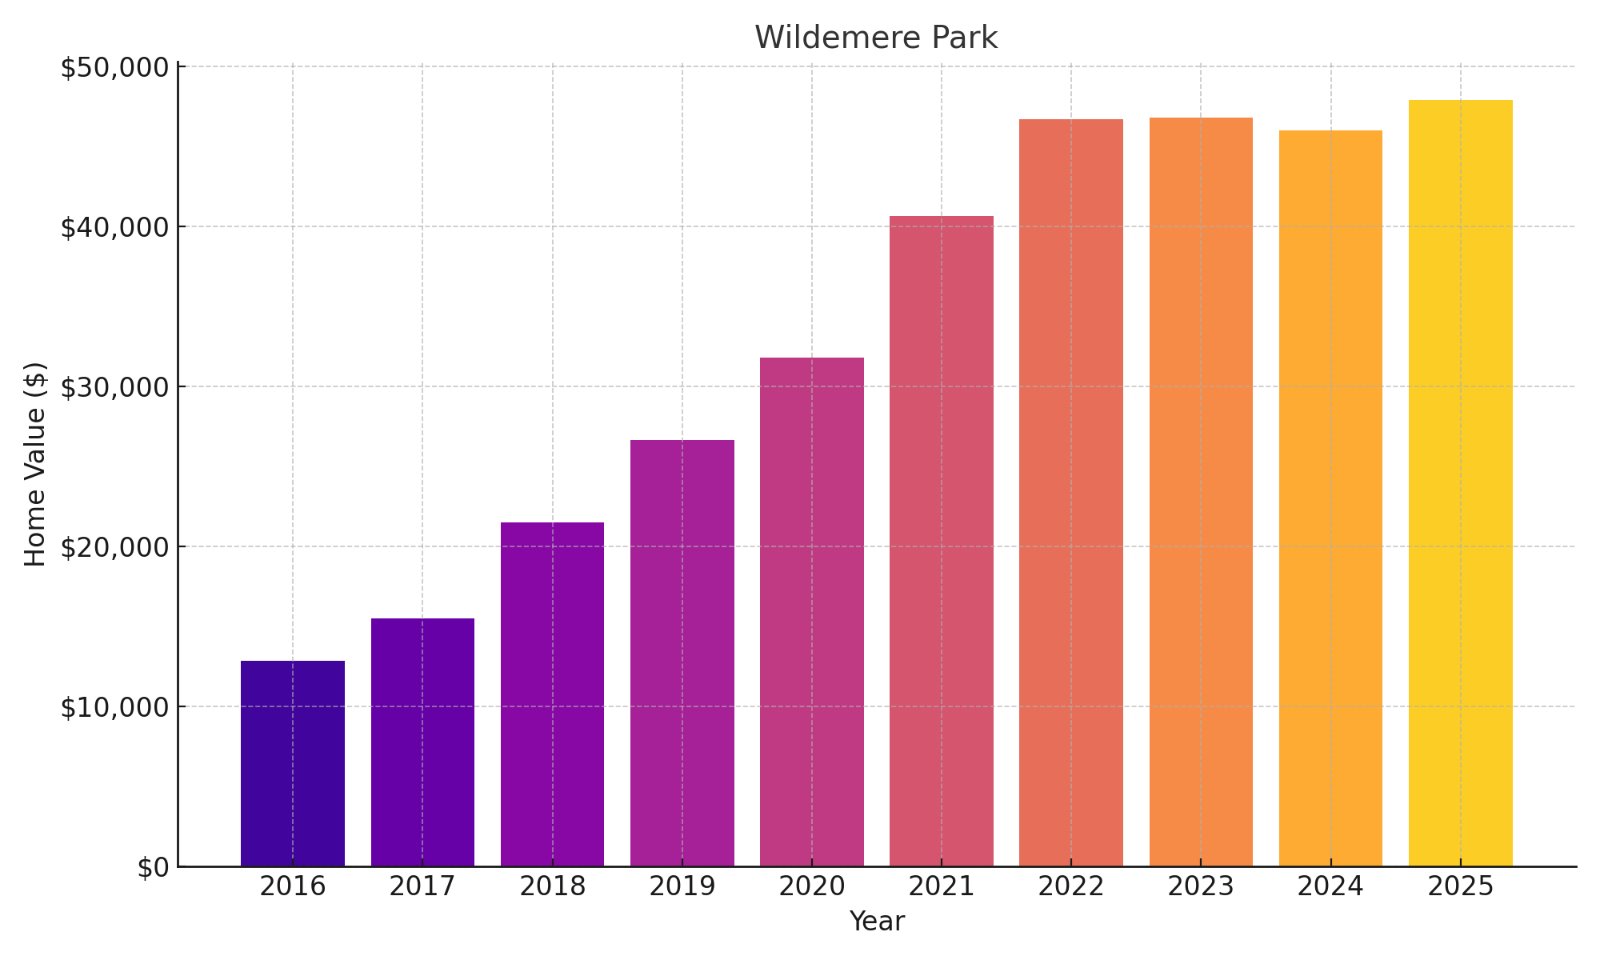
- % change from 2016 to 2025: 272.57%
- 2025: $47,905
- 2024: $46,008
- 2023: $46,779
- 2022: $46,701
- 2021: $40,632
- 2020: $31,804
- 2019: $26,634
- 2018: $21,488
- 2017: $15,523
- 2016: $12,858
Wildemere Park embodies the contrarian investment thesis that substantial returns often emerge from overlooked markets rather than trendy hotspots. Your capital deployment here benefits from the neighborhood’s remarkable price stability during the 2022-2024 period, suggesting a maturing market less susceptible to speculation. Positioned near historic Detroit neighborhoods experiencing renaissance, Wildemere allows investors to participate in urban renewal at entry points still accessible to middle-income buyers.
20. Russell Woods
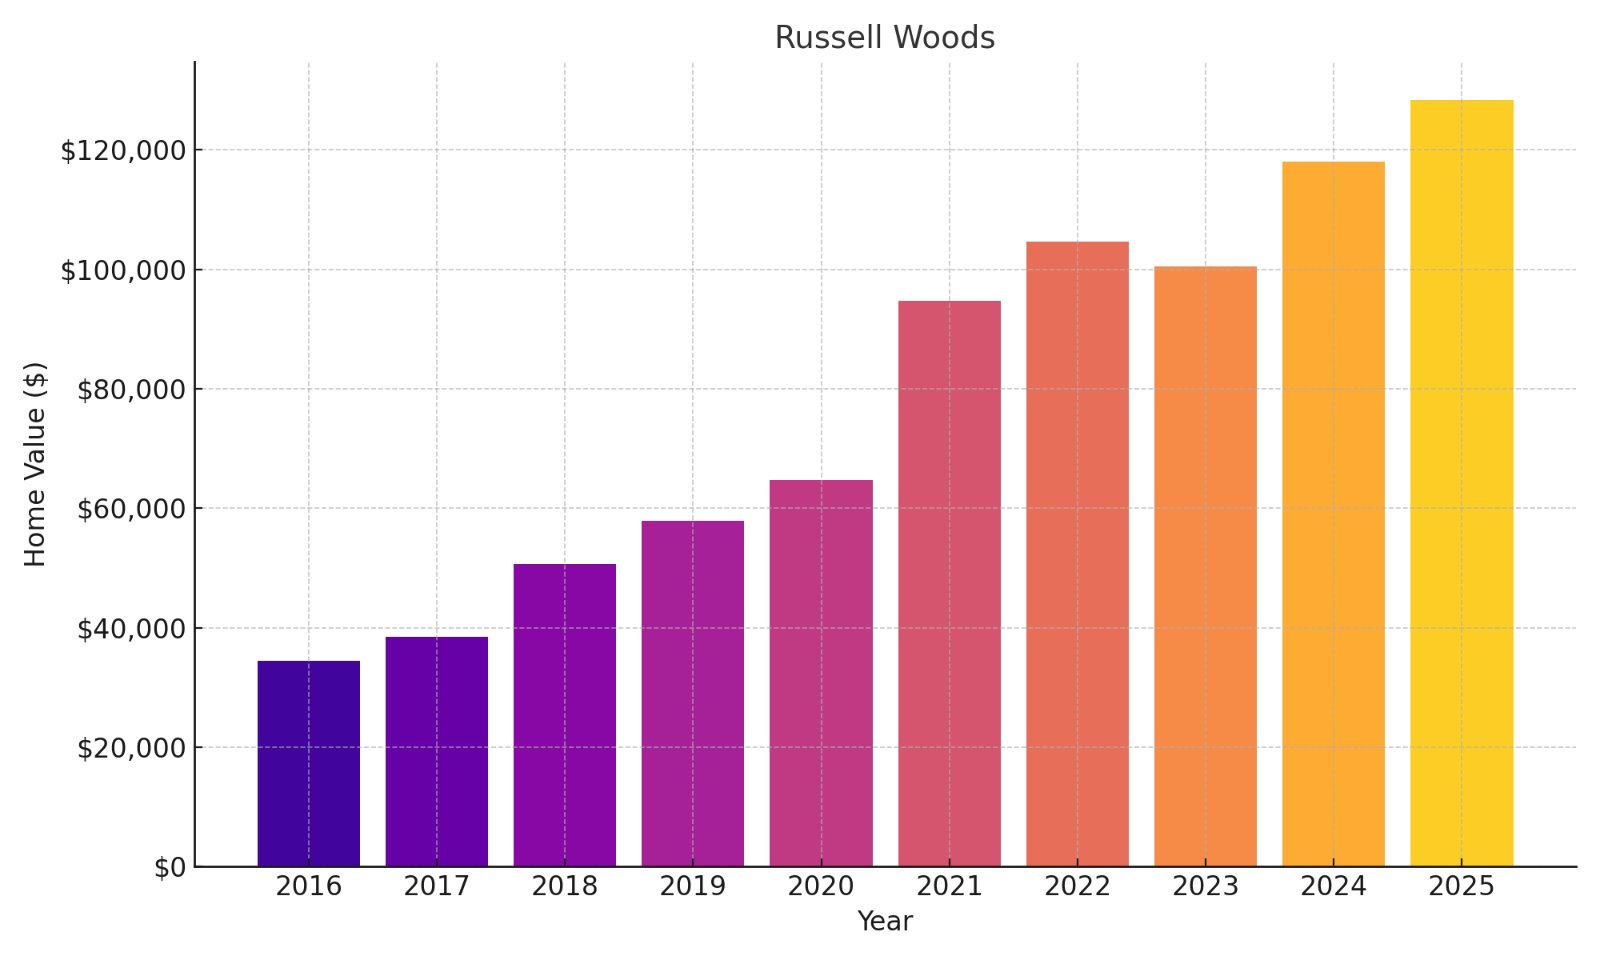
- % change from 2016 to 2025: 272.66%
- 2025: $128,401
- 2024: $118,059
- 2023: $100,552
- 2022: $104,601
- 2021: $94,725
- 2020: $64,735
- 2019: $57,906
- 2018: $50,674
- 2017: $38,413
- 2016: $34,456
Russell Woods offers a sophisticated value proposition, with properties that have nearly quadrupled their worth yet remain priced at fractions of comparable homes in other Midwestern urban centers. You’re witnessing the financial benefits of historic district designation, where architectural significance provides downside protection while appreciation continues its upward trajectory. The neighborhood’s proximity to Detroit’s cultural corridor makes it particularly attractive for long-term investors betting on continued urban renewal and lifestyle migration trends.
19. Mapleridge
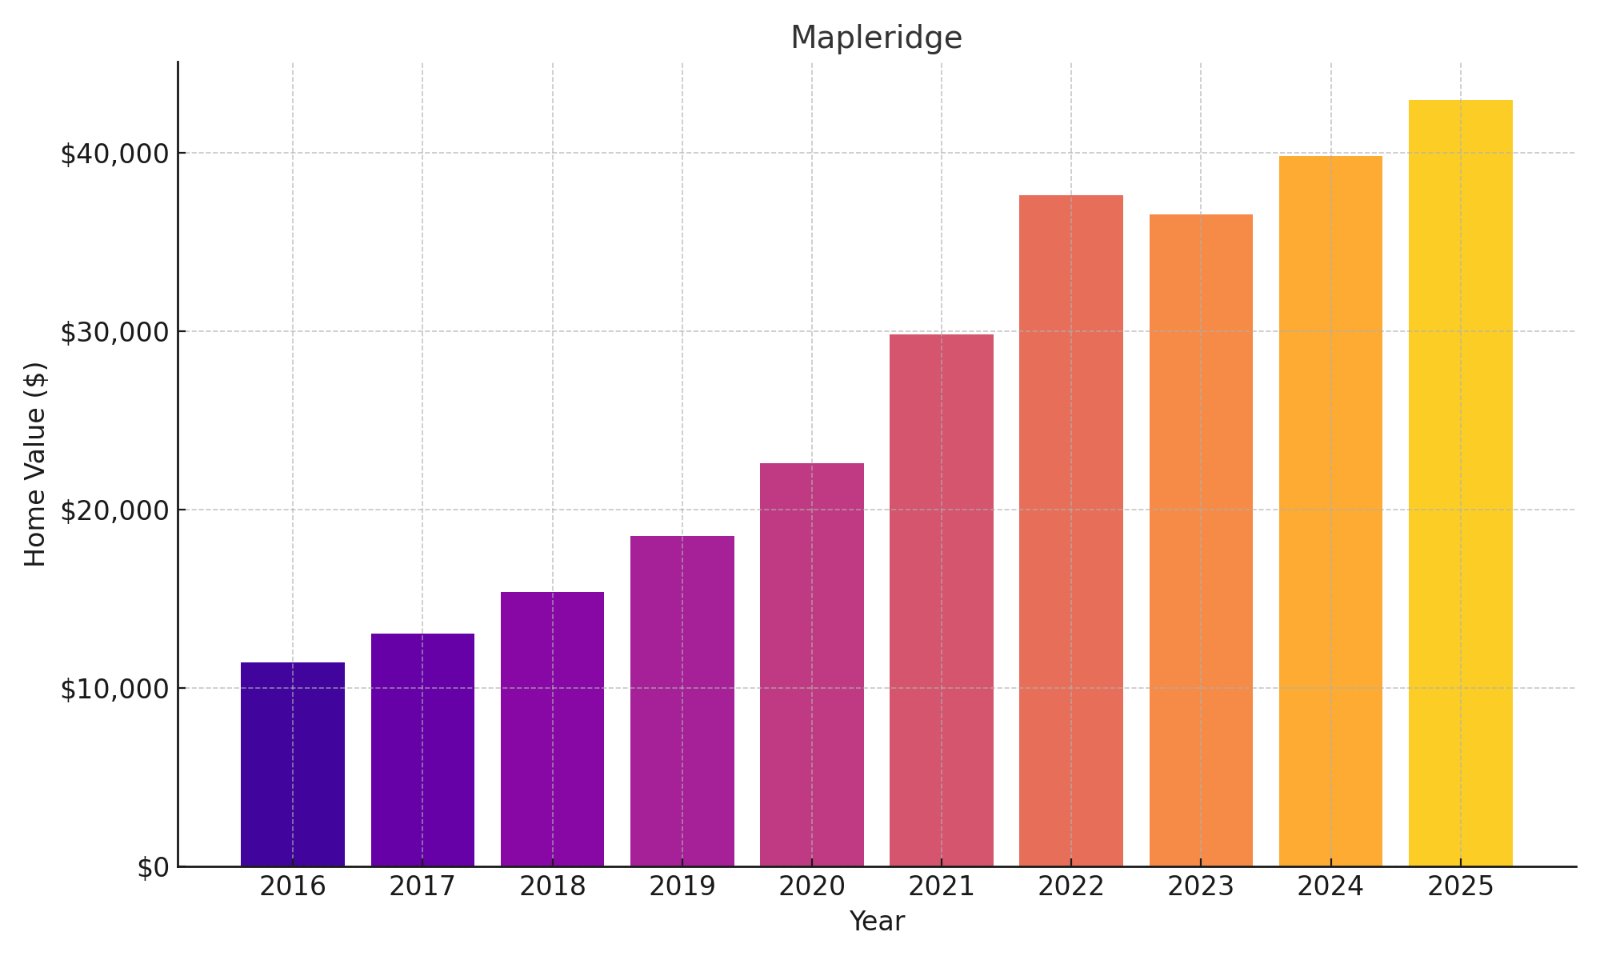
- % change from 2016 to 2025: 275.75%
- 2025: $42,967
- 2024: $39,798
- 2023: $36,517
- 2022: $37,637
- 2021: $29,819
- 2020: $22,609
- 2019: $18,532
- 2018: $15,385
- 2017: $13,033
- 2016: $11,435
Mapleridge presents a textbook case for contrarian real estate investing, where extraordinary returns emerge from modest initial capital requirements. The consistent price growth curve indicates structural rather than speculative appreciation, suggesting room for further upside despite the already impressive gains. Situated in a transitional area where community revitalization efforts are gaining momentum, Mapleridge offers investors both immediate cash flow potential and compelling long-term wealth building prospects.
18. Grand River-St. Marys
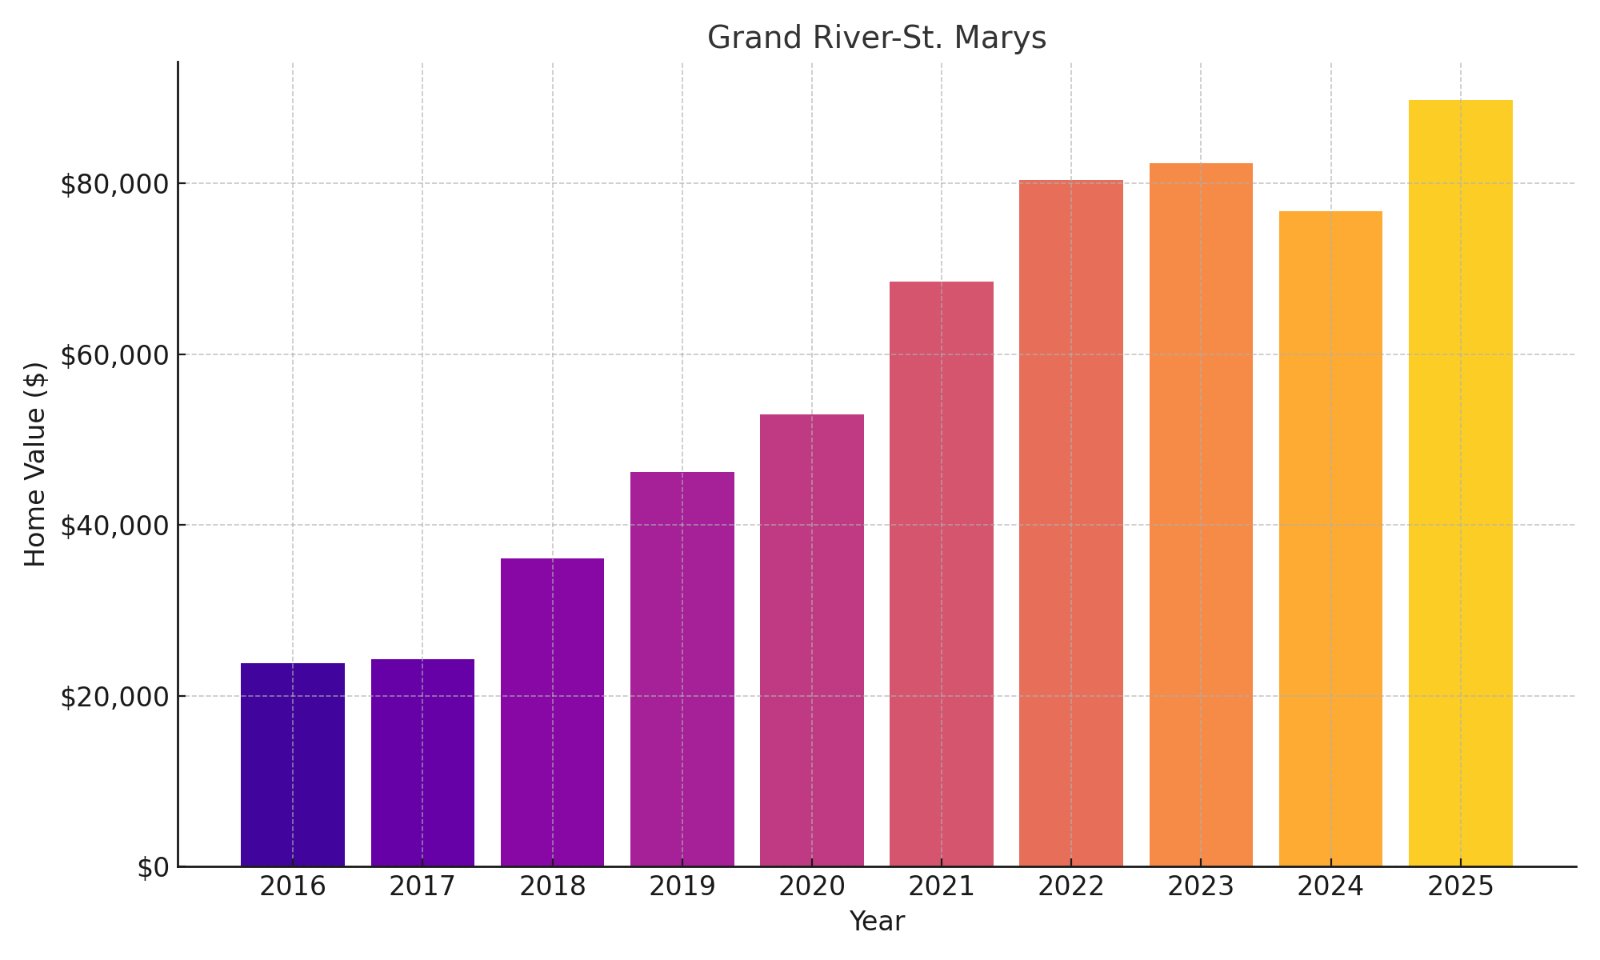
- % change from 2016 to 2025: 276.97%
- 2025: $89,773
- 2024: $76,678
- 2023: $82,371
- 2022: $80,329
- 2021: $68,511
- 2020: $52,968
- 2019: $46,181
- 2018: $36,026
- 2017: $24,294
- 2016: $23,814
Grand River-St. Marys illustrates how proximity to commercial corridors can accelerate residential appreciation in revitalizing urban markets. Your investment benefits from the neighborhood’s strategic location along major transportation arteries, enhancing both rental demand and resale potential. The notable $13K jump just from 2024 to 2025 signals accelerating momentum that savvy investors should monitor, particularly with properties still available below the psychological $100K threshold that often triggers broader buyer interest.
17. Nortown
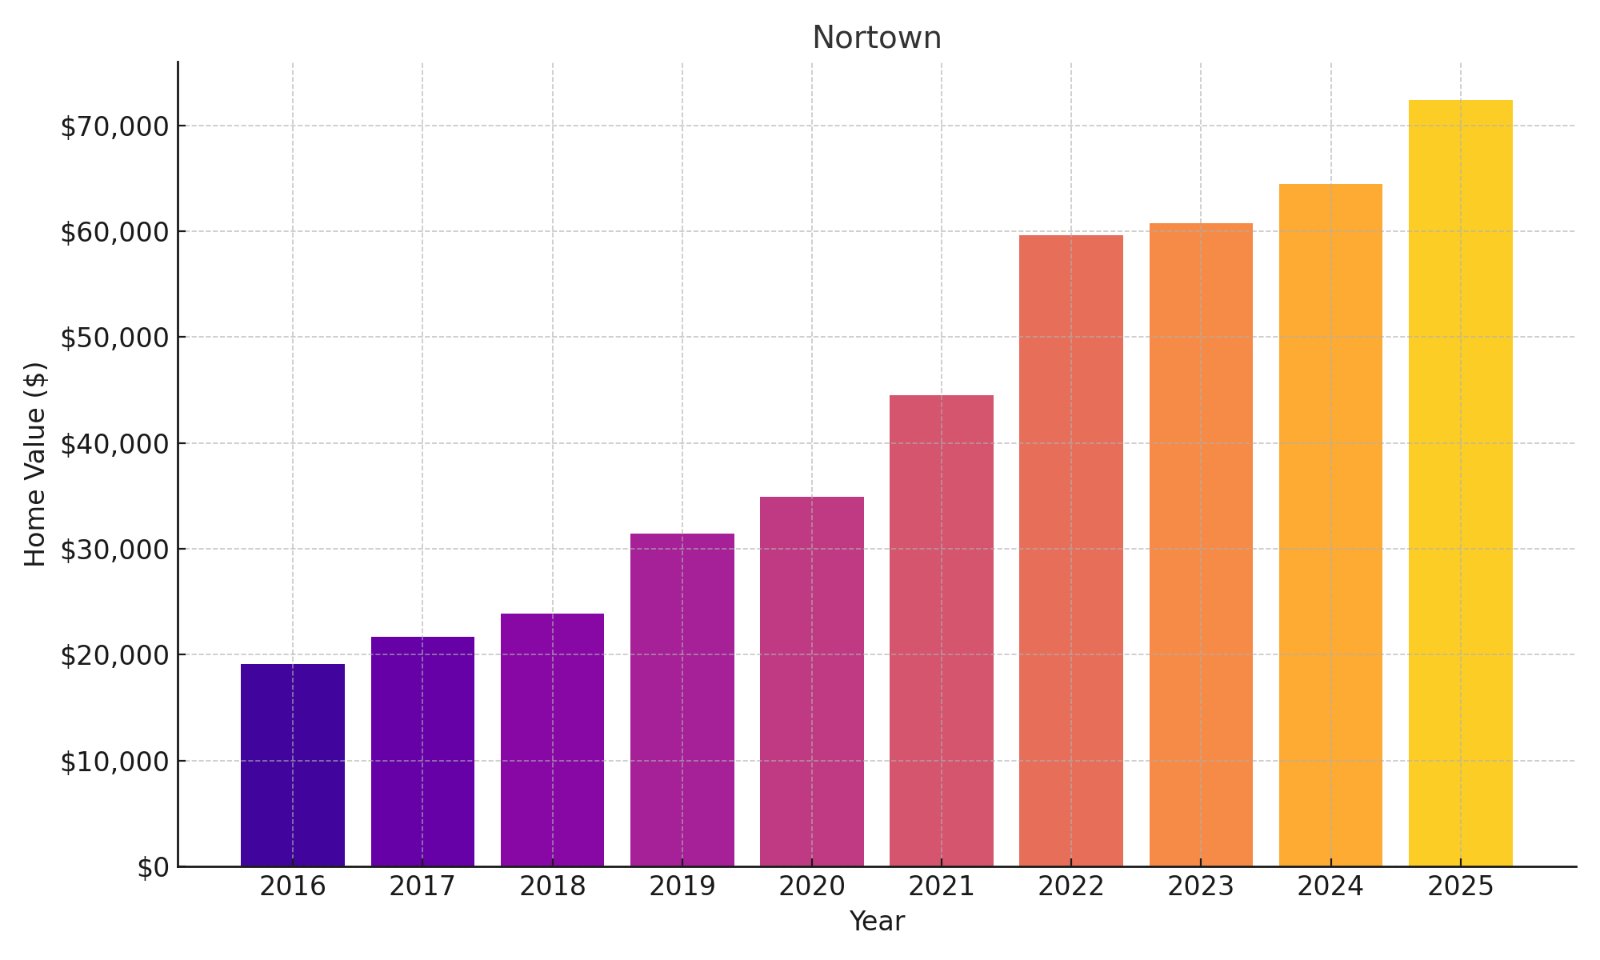
- % change from 2016 to 2025: 278.63%
- 2025: $72,434
- 2024: $64,466
- 2023: $60,788
- 2022: $59,600
- 2021: $44,499
- 2020: $34,930
- 2019: $31,419
- 2018: $23,911
- 2017: $21,716
- 2016: $19,131
Nortown exemplifies how patient capital can compound dramatically in emerging neighborhoods, with property values nearly tripling while still remaining accessible to first-time investors. Your potential returns benefit from the neighborhood’s consistent post-2021 acceleration, suggesting market fundamentals rather than speculative forces are driving appreciation. Positioned in Detroit’s northeast corridor, Nortown’s proximity to revitalizing commercial nodes creates a symbiotic relationship between residential values and community economic development.
16. Eight Mile Wyoming
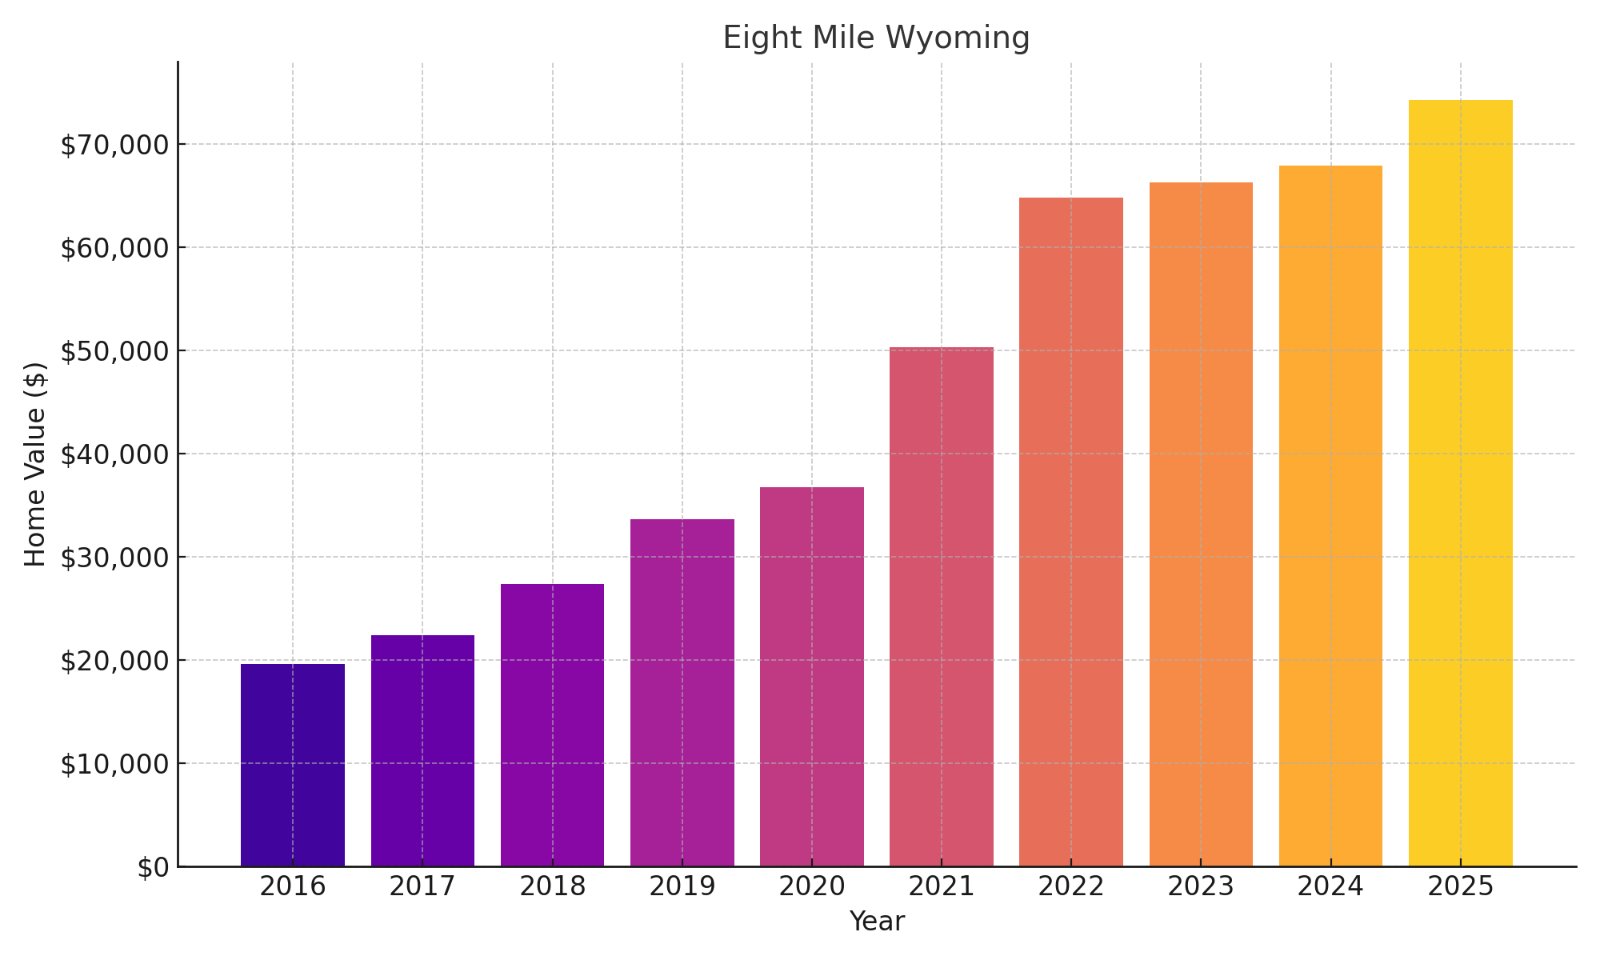
- % change from 2016 to 2025: 278.70%
- 2025: $74,318
- 2024: $67,904
- 2023: $66,323
- 2022: $64,829
- 2021: $50,356
- 2020: $36,796
- 2019: $33,665
- 2018: $27,352
- 2017: $22,433
- 2016: $19,625
Eight Mile Wyoming demonstrates how boundary neighborhoods often deliver outsized returns as urban reinvestment expands outward from city centers. Your investment thesis here benefits from the area’s strategic location along major transportation corridors that enhance both commuter appeal and commercial development potential. With property values still hovering below $75K despite nearly 280% appreciation, the neighborhood represents that sweet spot where substantial gains have materialized while significant upside potential remains.
15. Seven Mile-Rouge
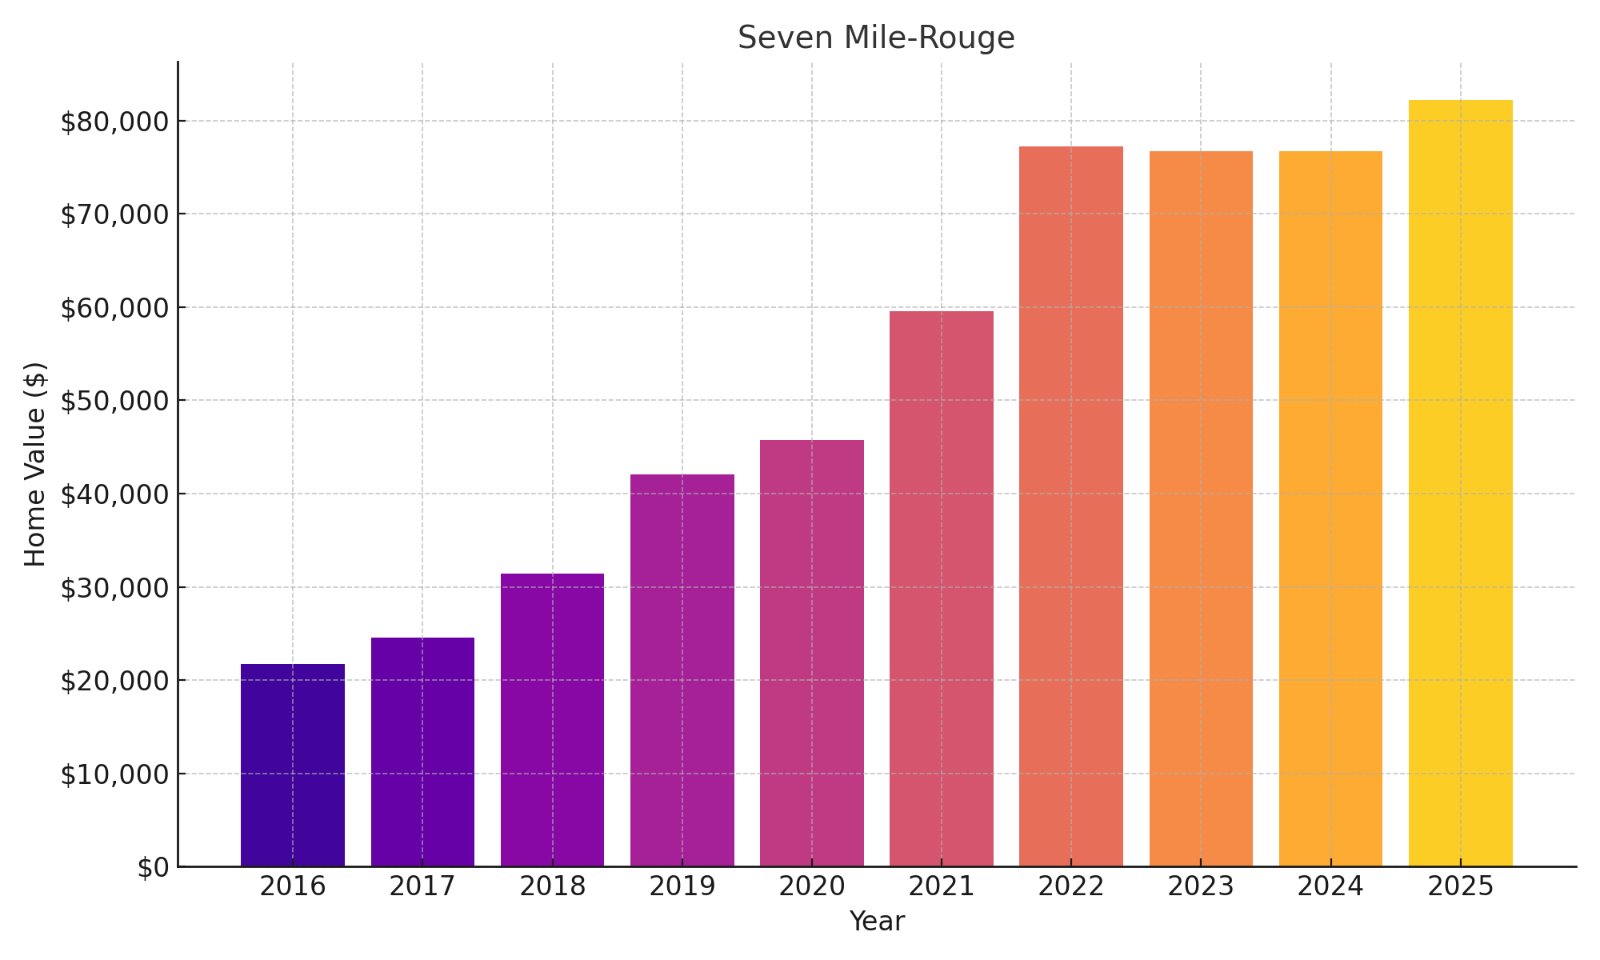
- % change from 2016 to 2025: 278.85%
- 2025: $82,252
- 2024: $76,765
- 2023: $76,744
- 2022: $77,260
- 2021: $59,584
- 2020: $45,728
- 2019: $42,086
- 2018: $31,379
- 2017: $24,544
- 2016: $21,711
Seven Mile-Rouge offers compelling investment mathematics, where $21K invested in 2016 would have generated over $60K in equity by 2025 without factoring rental income. Your capital deployment benefits from the neighborhood’s remarkable price stability during market fluctuations, suggesting fundamentally sound demand rather than speculative interest. Located near major employment centers and transportation corridors, the area combines cash flow potential with equity growth that has consistently outperformed traditional investment vehicles by substantial margins.
14. Conner Creek

- % change from 2016 to 2025: 279.35%
- 2025: $66,790
- 2024: $61,307
- 2023: $57,861
- 2022: $59,869
- 2021: $45,691
- 2020: $34,679
- 2019: $31,519
- 2018: $24,080
- 2017: $20,773
- 2016: $17,606
Conner Creek presents the rare opportunity where properties have nearly quadrupled in value yet remain priced below national averages for used vehicles. The neighborhood’s appreciation curve shows particularly strong momentum in post-pandemic years, suggesting structural rather than cyclical growth factors. Positioned on Detroit’s east side near waterways and green spaces, Conner Creek offers investors a compelling combination of affordable entry points, strong cash flow potential, and continued appreciation upside as urban renewal expands eastward.
13. Bentler-Pickford

🔥 Would you like to save this?
- % change from 2016 to 2025: 280.82%
- 2025: $57,056
- 2024: $51,445
- 2023: $49,003
- 2022: $47,963
- 2021: $35,336
- 2020: $27,488
- 2019: $25,120
- 2018: $21,319
- 2017: $16,908
- 2016: $14,982
Bentler-Pickford demonstrates the investment principle that timing often matters more than location, with early entrants reaping nearly 281% appreciation over nine years. Your capital here benefits from the neighborhood’s consistent year-over-year gains, indicating sustainable demand rather than the boom-bust cycles common in speculative markets. Situated in Detroit’s northwest corridor, Bentler-Pickford combines manageable entry points with strong rental potential, making it particularly attractive for investors seeking both immediate cash flow and substantial long-term equity growth.
12. Campau/Banglatown

- % change from 2016 to 2025: 281.84%
- 2025: $99,786
- 2024: $98,221
- 2023: $89,943
- 2022: $89,254
- 2021: $81,623
- 2020: $66,297
- 2019: $54,112
- 2018: $40,492
- 2017: $34,729
- 2016: $26,133
Campau/Banglatown exemplifies how cultural diversity can drive real estate appreciation, with properties approaching the $100K milestone after starting at just $26K in 2016. The neighborhood’s price resilience during recent market fluctuations suggests strong underlying demand fundamentals rather than speculative interest. Positioned at the convergence of Detroit and Hamtramck, this vibrant multicultural district offers investors not just impressive returns but also benefits from emerging small business growth that continues to enhance neighborhood appeal and long-term value.
11. Mott Park

- % change from 2016 to 2025: 284.63%
- 2025: $61,108
- 2024: $56,376
- 2023: $53,228
- 2022: $54,457
- 2021: $42,510
- 2020: $32,727
- 2019: $31,143
- 2018: $26,002
- 2017: $18,985
- 2016: $15,888
Mott Park offers an investment caliber rarely seen in established markets: properties that have nearly quadrupled while remaining accessible at entry-level price points. Your capital benefits from the neighborhood’s remarkable resilience during the 2022-2023 market contraction that affected many regions nationwide. Located near Flint’s educational institutions and cultural amenities, Mott Park represents a compelling opportunity for investors seeking both immediate rental returns and substantial long-term appreciation potential as the area continues its renaissance.
10. South East Community

- % change from 2016 to 2025: 285.35%
- 2025: $210,005
- 2024: $195,401
- 2023: $174,704
- 2022: $168,651
- 2021: $144,987
- 2020: $117,850
- 2019: $104,976
- 2018: $87,868
- 2017: $69,179
- 2016: $54,497
South East Community demonstrates the remarkable wealth-building power of real estate in revitalizing markets, with properties increasing by over $155K in just nine years. Your investment thesis here benefits from the neighborhood’s consistent price momentum even after crossing the psychological $200K threshold that often triggers buyer hesitation. Located in a strategic corridor with excellent connectivity to employment centers, South East Community offers the rare combination of established neighborhood stability with appreciation rates typically associated with emerging markets.
9. McDowell

- % change from 2016 to 2025: 290.77%
- 2025: $123,695
- 2024: $111,432
- 2023: $111,943
- 2022: $107,777
- 2021: $91,924
- 2020: $73,727
- 2019: $64,365
- 2018: $49,846
- 2017: $37,979
- 2016: $31,654
McDowell exemplifies the power of strategic positioning in urban revival markets, with properties that have nearly tripled while crossing the significant $100K psychological threshold. The neighborhood’s impressive $12K jump from 2024 to 2025 suggests acceleration rather than deceleration in the appreciation curve, indicating continued upside potential. Located near revitalized commercial corridors and community amenities, McDowell offers investors a compelling blend of established neighborhood character with emerging market appreciation rates.
8. McNichols Evergreen

- % change from 2016 to 2025: 292.76%
- 2025: $116,600
- 2024: $106,080
- 2023: $106,607
- 2022: $105,368
- 2021: $88,489
- 2020: $70,798
- 2019: $64,220
- 2018: $44,383
- 2017: $34,780
- 2016: $29,687
McNichols Evergreen demonstrates how strategic urban revival efforts can translate directly into property value appreciation, with nearly 293% returns over nine years. Your investment benefits from the neighborhood’s stability in the $105-106K range during 2022-2023, followed by renewed upward momentum indicating resilience to broader market fluctuations. Positioned along key transportation arteries with improving commercial amenities, McNichols Evergreen presents a compelling value proposition where significant appreciation has already materialized while continued upside potential remains substantial.
7. Hubbell-Puritan

- % change from 2016 to 2025: 293.64%
- 2025: $91,901
- 2024: $82,086
- 2023: $82,286
- 2022: $78,617
- 2021: $66,591
- 2020: $54,772
- 2019: $47,185
- 2018: $37,523
- 2017: $24,747
- 2016: $23,346
Hubbell-Puritan presents a masterclass in asymmetric investment opportunity, with properties that have nearly quadrupled while remaining accessible below the $100K threshold. Your capital gains are particularly impressive in the post-pandemic period, with values increasing approximately $25K since 2021 despite broader market headwinds. Located in Detroit’s northwest corridor with improving infrastructure and community amenities, this neighborhood offers investors the rare combination of strong rental demand, manageable entry points, and continued appreciation potential.
6. Black Hills

- % change from 2016 to 2025: 294.71%
- 2025: $192,584
- 2024: $178,482
- 2023: $153,699
- 2022: $145,629
- 2021: $126,995
- 2020: $104,136
- 2019: $90,100
- 2018: $71,179
- 2017: $60,263
- 2016: $48,791
Black Hills exemplifies how strategic positioning in urban revival corridors can generate exceptional returns, with property values nearly quadrupling over nine years. The neighborhood’s impressive post-2022 acceleration, adding nearly $40K in just two years, suggests strengthening market fundamentals rather than speculative interest. Located in a desirable section with historic character and improving amenities, Black Hills offers investors both immediate equity position and continued appreciation potential as Detroit’s renaissance continues to expand outward from its core.
5. East English Village

- % change from 2016 to 2025: 302.05%
- 2025: $137,619
- 2024: $128,314
- 2023: $129,154
- 2022: $129,870
- 2021: $112,166
- 2020: $88,239
- 2019: $70,838
- 2018: $54,431
- 2017: $41,013
- 2016: $34,229
East English Village demonstrates the wealth-building power of strategic neighborhood selection, with properties tripling in value while maintaining price stability during broader market fluctuations. Your investment benefits from the area’s architectural distinctiveness and historic designation, providing a competitive moat that helps sustain price appreciation. Situated on Detroit’s east side with tree-lined streets and distinctive Tudor and Colonial homes, East English Village has transitioned from “hidden gem” to “established performer” while still offering value compared to similar neighborhoods nationwide.
4. The Eye

- % change from 2016 to 2025: 327.20%
- 2025: $89,775
- 2024: $83,053
- 2023: $80,425
- 2022: $74,457
- 2021: $56,904
- 2020: $42,165
- 2019: $35,693
- 2018: $29,224
- 2017: $24,578
- 2016: $21,015
The Eye represents the quintessential urban revival investment opportunity, with over 327% appreciation while still offering sub-$90K entry points for new investors. Your capital benefits from consistent year-over-year gains averaging approximately 17% annually, far outpacing traditional investment vehicles and inflation. Positioned strategically within Detroit’s revitalization corridor, this neighborhood offers exceptional value for investors seeking both immediate cash flow potential and continued equity growth as urban renewal efforts continue to expand and mature.
3. Madison Area

- % change from 2016 to 2025: 346.35%
- 2025: $188,020
- 2024: $174,426
- 2023: $155,621
- 2022: $150,763
- 2021: $130,325
- 2020: $102,911
- 2019: $87,993
- 2018: $73,171
- 2017: $58,788
- 2016: $42,124
Madison Area exemplifies the wealth-building potential of early-stage neighborhood revitalization, with properties more than quadrupling to nearly $190K from a modest $42K baseline. Your investment thesis benefits from the area’s proximity to Detroit’s entertainment district and commercial revival, driving both rental demand and resale value. The neighborhood’s consistent post-2020 acceleration, even during broader market headwinds, highlights how strategic urban positioning can deliver outsized returns that substantially outperform both inflation and traditional investment vehicles.
2. Henry Ford

- % change from 2016 to 2025: 361.44%
- 2025: $205,920
- 2024: $192,513
- 2023: $179,788
- 2022: $171,819
- 2021: $151,895
- 2020: $134,687
- 2019: $128,086
- 2018: $119,226
- 2017: $106,884
- 2016: $96,664
Henry Ford demonstrates the compounding power of established neighborhood momentum, with properties doubling in value and breaking the $200K milestone despite starting from a relatively high base. Your capital benefits from the area’s remarkable price stability during market fluctuations, suggesting fundamentally sound demand rather than speculative interest. Located near major health systems and educational institutions that provide employment anchors, this neighborhood offers investors the security of established amenities combined with appreciation rates typically associated with emerging markets.
1. Jamison

🔥 Would you like to save this?
- % change from 2016 to 2025: 369.86%
- 2025: $64,481
- 2024: $52,740
- 2023: $46,149
- 2022: $44,956
- 2021: $34,904
- 2020: $26,319
- 2019: $22,882
- 2018: $17,219
- 2017: $14,039
- 2016: $13,723
Jamison represents Michigan’s ultimate real estate success story, with nearly 370% appreciation while still remaining accessible at sub-$65K price points. The neighborhood’s recent acceleration is particularly notable, adding nearly $12K in the last year alone—a 22% single-year gain that suggests momentum is building rather than waning. Positioned in a strategic corridor benefiting from targeted revitalization efforts, Jamison offers new investors a rare opportunity to enter a proven growth market while prices remain well below replacement cost and national averages.