🔥 Would you like to save this?
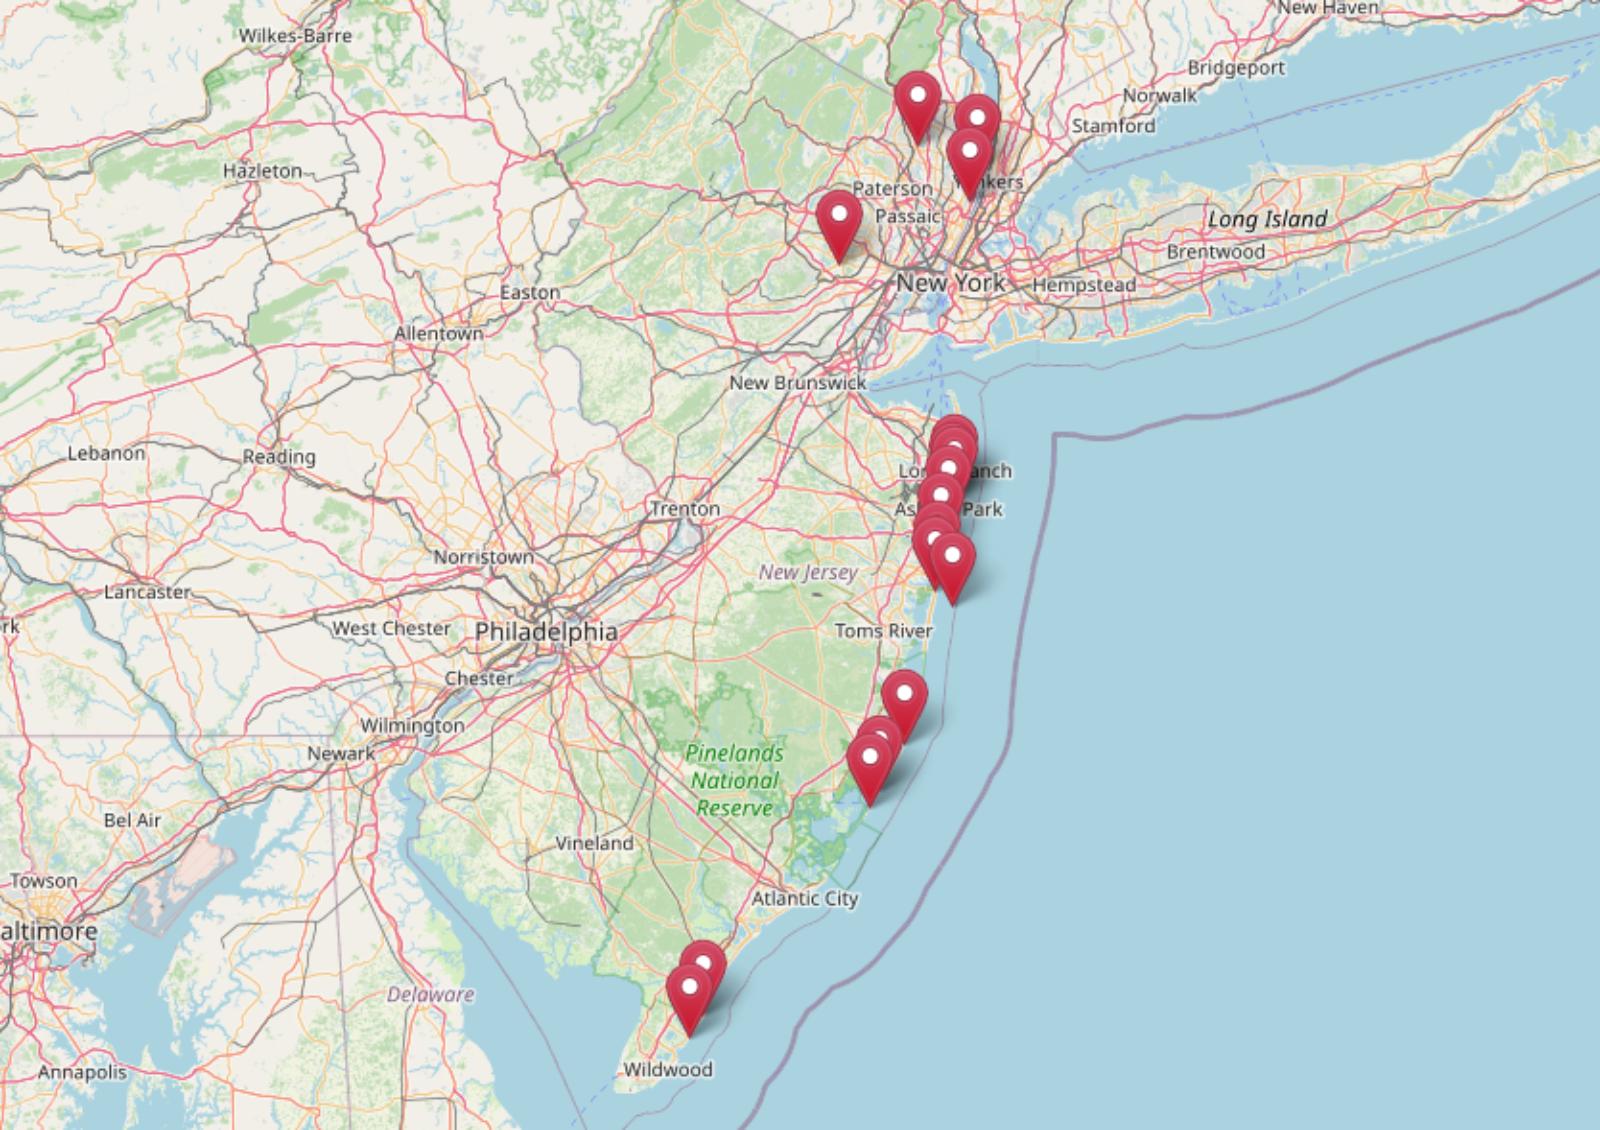
Some New Jersey towns didn’t just keep up with the market—they left it in the dust. Based on Zillow Home Value Index data, these 17 spots have seen home prices skyrocket since 2010, climbing to heights that would have been hard to imagine just 15 years ago. Think beachfront mansions, commuter havens just outside NYC, and legacy-rich enclaves where demand never really cooled off. These places aren’t just expensive—they’ve become symbols of long-term growth, deep-pocketed demand, and real estate that’s anything but average.
17. Beach Haven – 106.09% Home Price Increase Since May 2010

- 2010: $765,575
- 2011: $731,248 (-$34,327, -4.48% from previous year)
- 2012: $701,037 (-$30,211, -4.13% from previous year)
- 2013: $696,183 (-$4,854, -0.69% from previous year)
- 2014: $707,922 (+$11,739, +1.69% from previous year)
- 2015: $725,033 (+$17,111, +2.42% from previous year)
- 2016: $752,095 (+$27,062, +3.73% from previous year)
- 2017: $755,323 (+$3,228, +0.43% from previous year)
- 2018: $827,554 (+$72,231, +9.56% from previous year)
- 2019: $863,780 (+$36,226, +4.38% from previous year)
- 2020: $908,410 (+$44,630, +5.17% from previous year)
- 2021: $1,110,251 (+$201,841, +22.22% from previous year)
- 2022: $1,429,464 (+$319,213, +28.75% from previous year)
- 2023: $1,398,905 (-$30,559, -2.14% from previous year)
- 2024: $1,493,400 (+$94,495, +6.75% from previous year)
- 2025: $1,577,784 (+$84,384, +5.65% from previous year)
Beach Haven’s home values have surged more than 106% since 2010, doubling in just 15 years. While there were early years of decline, values began to climb steadily after 2013, accelerating sharply between 2020 and 2022. This massive jump included a 22% gain in 2021 and a nearly 29% spike in 2022 alone. Although there was a slight dip in 2023, the recovery continued with solid gains in the two most recent years. The town’s current median value of over $1.57 million places it firmly among New Jersey’s luxury markets.
In order to come up with the very specific design ideas, we create most designs with the assistance of state-of-the-art AI interior design software.
Beach Haven – Coastal Growth and Pandemic Boost
Located on Long Beach Island, Beach Haven is known for its pristine beaches, historic Victorian charm, and strong vacation rental market. Its popularity with second-home buyers surged during the pandemic, as remote work made beachfront living more viable year-round. The area boasts a lively boardwalk, water activities, and a mix of classic beach homes and modern builds, all contributing to strong property values.
Limited inventory and strict zoning have also played a role in maintaining high demand and driving up prices. With robust tourism and year-round appeal, Beach Haven continues to attract affluent buyers looking for both lifestyle and investment potential. The double-digit price gains in recent years reflect the area’s lasting draw for high-net-worth individuals.
16. Avon by the Sea – 90.90% Home Price Increase Since May 2010
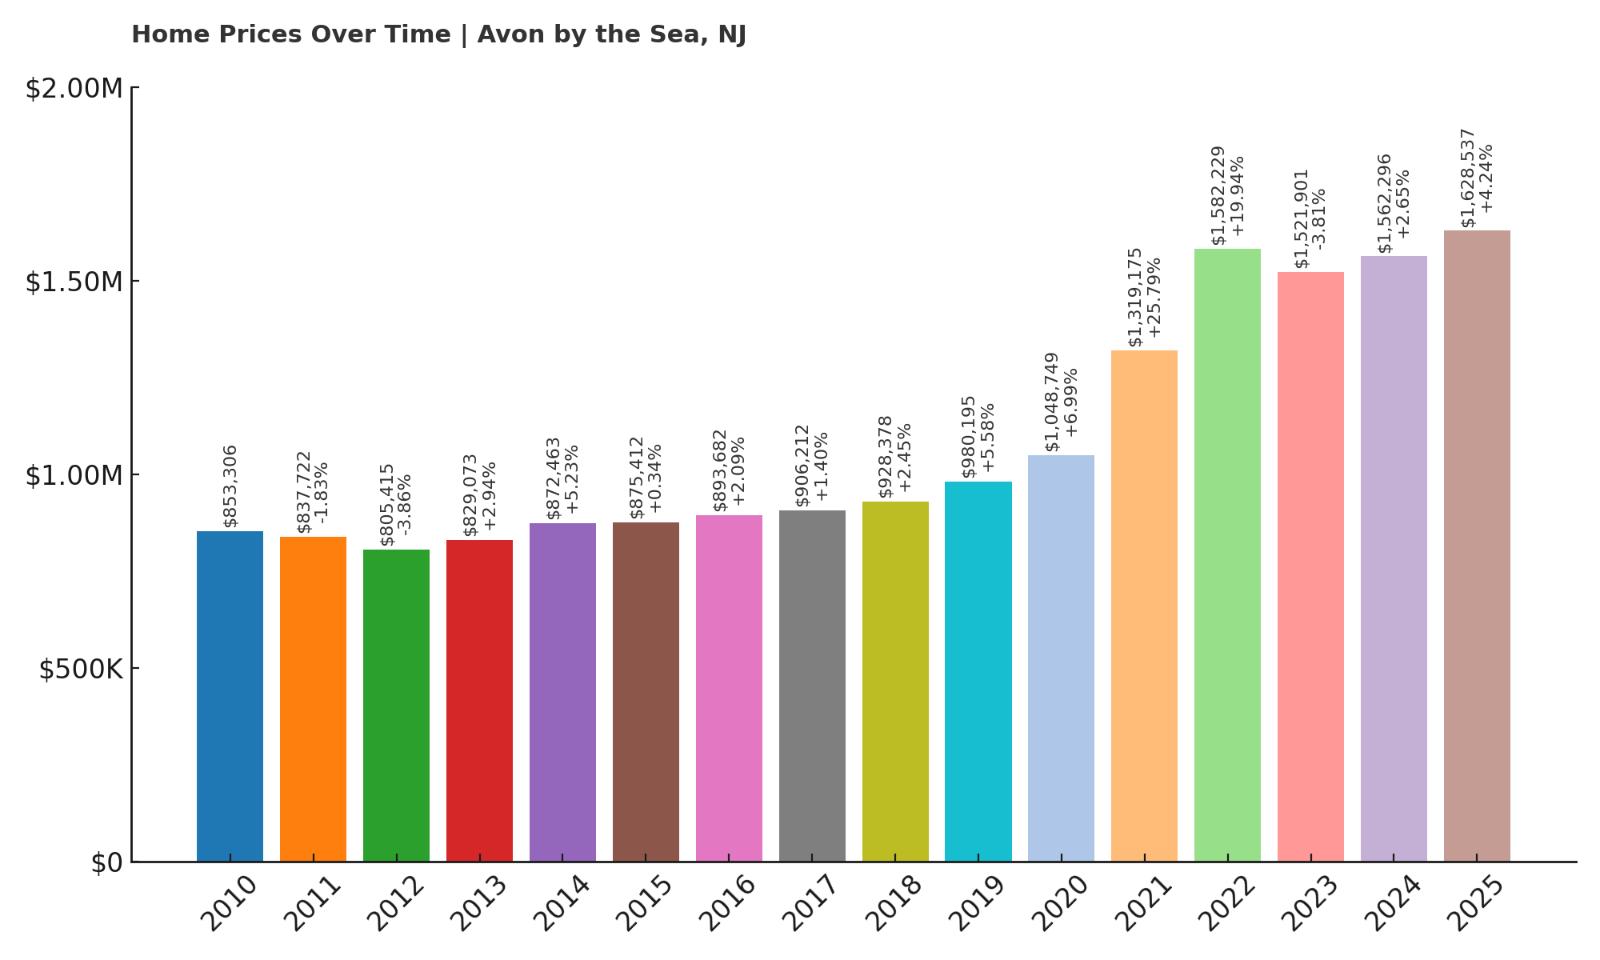
- 2010: $853,306
- 2011: $837,722 (-$15,584, -1.83% from previous year)
- 2012: $805,415 (-$32,307, -3.86% from previous year)
- 2013: $829,073 (+$23,658, +2.94% from previous year)
- 2014: $872,463 (+$43,390, +5.23% from previous year)
- 2015: $875,412 (+$2,949, +0.34% from previous year)
- 2016: $893,682 (+$18,270, +2.09% from previous year)
- 2017: $906,212 (+$12,530, +1.40% from previous year)
- 2018: $928,378 (+$22,166, +2.45% from previous year)
- 2019: $980,195 (+$51,817, +5.58% from previous year)
- 2020: $1,048,749 (+$68,554, +6.99% from previous year)
- 2021: $1,319,175 (+$270,426, +25.79% from previous year)
- 2022: $1,582,229 (+$263,054, +19.94% from previous year)
- 2023: $1,521,901 (-$60,328, -3.81% from previous year)
- 2024: $1,562,296 (+$40,395, +2.65% from previous year)
- 2025: $1,628,537 (+$66,241, +4.24% from previous year)
Avon by the Sea has seen its home prices nearly double over the last 15 years, with a total increase of over 90%. The most dramatic jumps came between 2020 and 2022, when home values rocketed by over half a million dollars in just two years. After a small correction in 2023, prices rebounded again and now hover around $1.63 million. Even modest year-over-year growth in the last two years points to continued strength in the market.
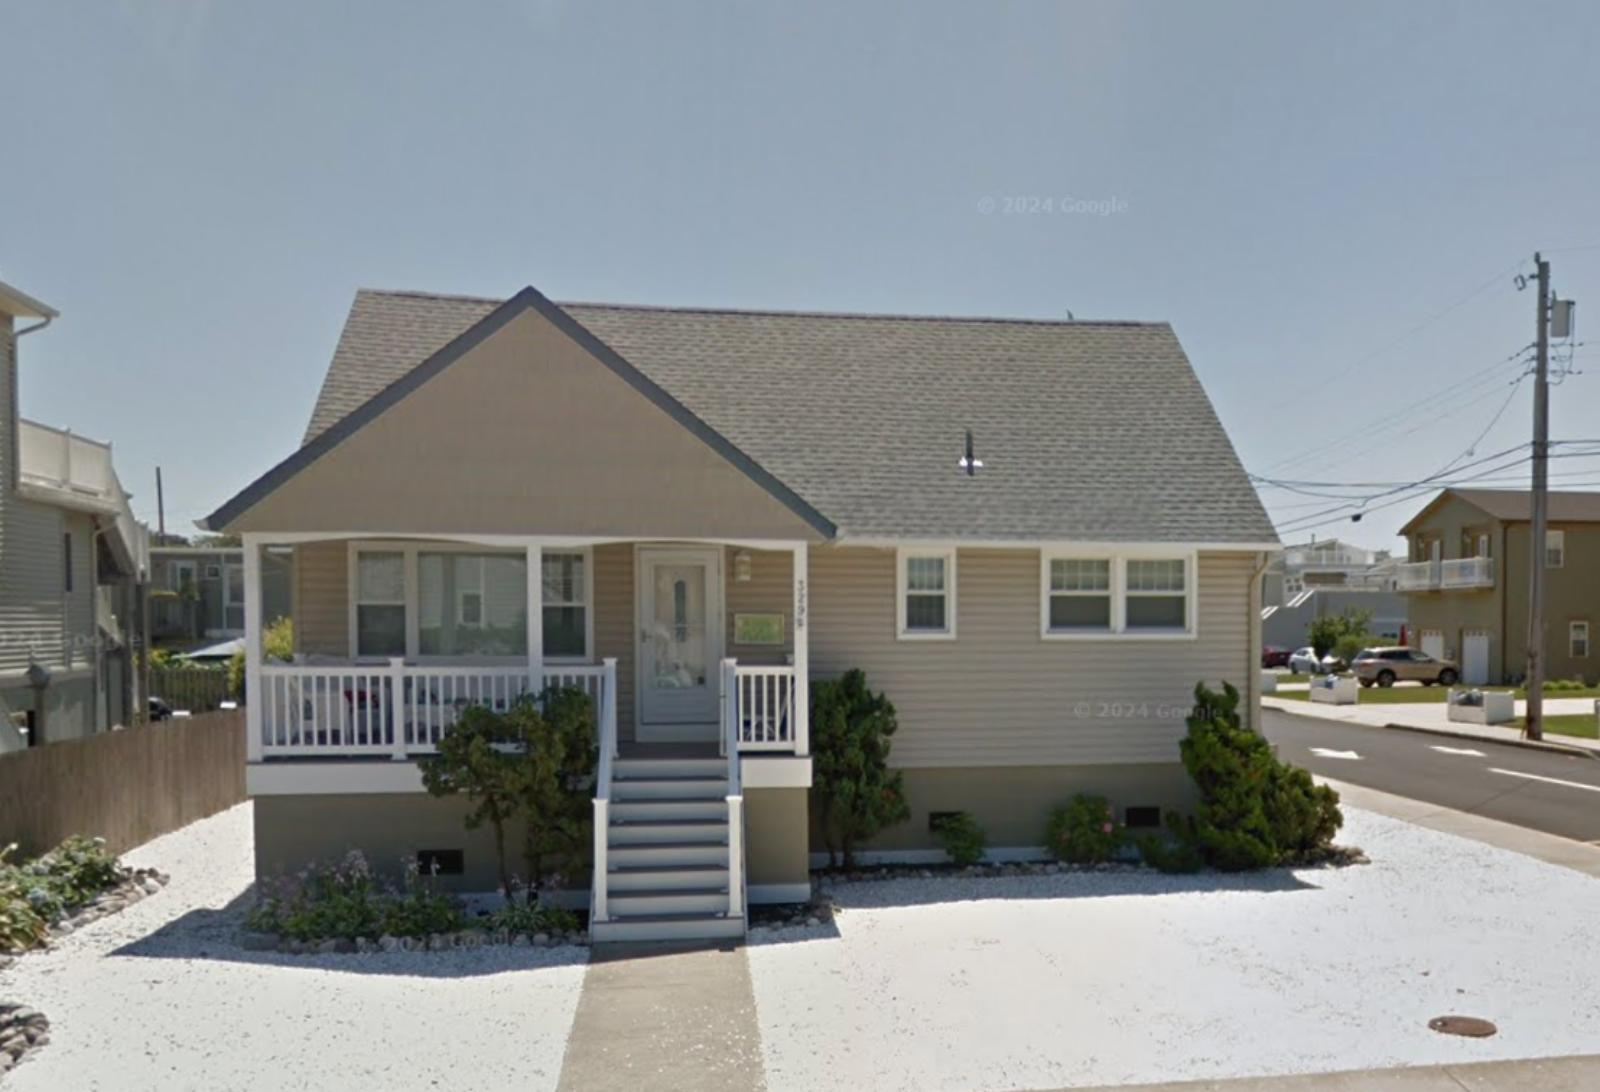
Avon by the Sea – High Demand Along the Jersey Shore
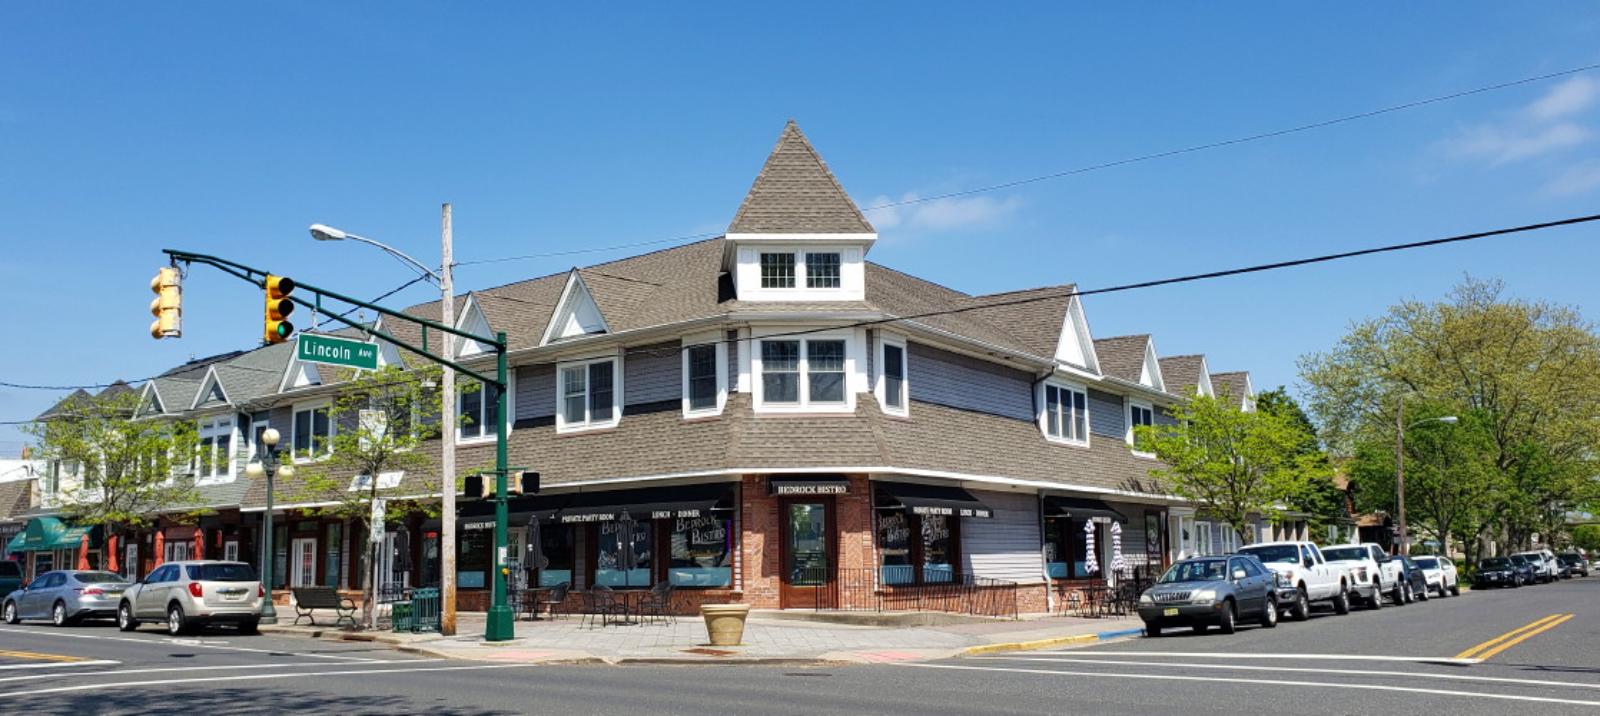
Avon by the Sea is a compact, picturesque town nestled between the Atlantic Ocean and Shark River. Its beachfront location and small-town atmosphere make it a prime spot for luxury buyers seeking tranquility without sacrificing access to the amenities of larger towns like Asbury Park. Victorian architecture and strict preservation rules add to its charm and desirability.
The scarcity of listings in Avon drives up competition and prices. Homes don’t stay on the market long, especially in spring and summer. This pressure on supply has kept prices climbing steadily. With its boardwalk, seasonal events, and upscale reputation, Avon continues to draw long-term interest from both retirees and wealthy second-home seekers.
15. Englewood Cliffs – 62.57% Home Price Increase Since May 2010

- 2010: $1,038,111
- 2011: $991,748 (-$46,363, -4.47% from previous year)
- 2012: $1,035,057 (+$43,309, +4.37% from previous year)
- 2013: $1,075,641 (+$40,584, +3.92% from previous year)
- 2014: $1,171,828 (+$96,187, +8.94% from previous year)
- 2015: $1,219,058 (+$47,230, +4.03% from previous year)
- 2016: $1,232,882 (+$13,824, +1.13% from previous year)
- 2017: $1,265,702 (+$32,820, +2.66% from previous year)
- 2018: $1,286,743 (+$21,041, +1.66% from previous year)
- 2019: $1,274,587 (-$12,156, -0.94% from previous year)
- 2020: $1,265,403 (-$9,184, -0.72% from previous year)
- 2021: $1,352,856 (+$87,453, +6.91% from previous year)
- 2022: $1,500,440 (+$147,584, +10.91% from previous year)
- 2023: $1,493,876 (-$6,564, -0.44% from previous year)
- 2024: $1,584,001 (+$90,125, +6.03% from previous year)
- 2025: $1,687,622 (+$103,621, +6.54% from previous year)
Englewood Cliffs has seen home values rise by more than 62% since 2010. The growth has been fairly consistent, with a handful of minor setbacks in 2011, 2019, and 2020. Price growth picked up again post-2020, with solid annual gains leading to a 2025 median value near $1.69 million. Its proximity to Manhattan continues to make it a popular choice for high-income professionals.
Englewood Cliffs – Luxury Meets Location
Just across the Hudson River from Upper Manhattan, Englewood Cliffs blends suburban space with urban convenience. The town is home to major corporate headquarters, low taxes, and zoning that favors larger lots. It offers a quiet, exclusive feel while being minutes from the George Washington Bridge.
While it doesn’t have a traditional downtown or major attractions, Englewood Cliffs’ main draw is location and prestige. Custom-built homes, manicured streets, and a strong local school system round out the appeal. As prices continue to rise across the metro region, demand in this borough remains steady and competitive.
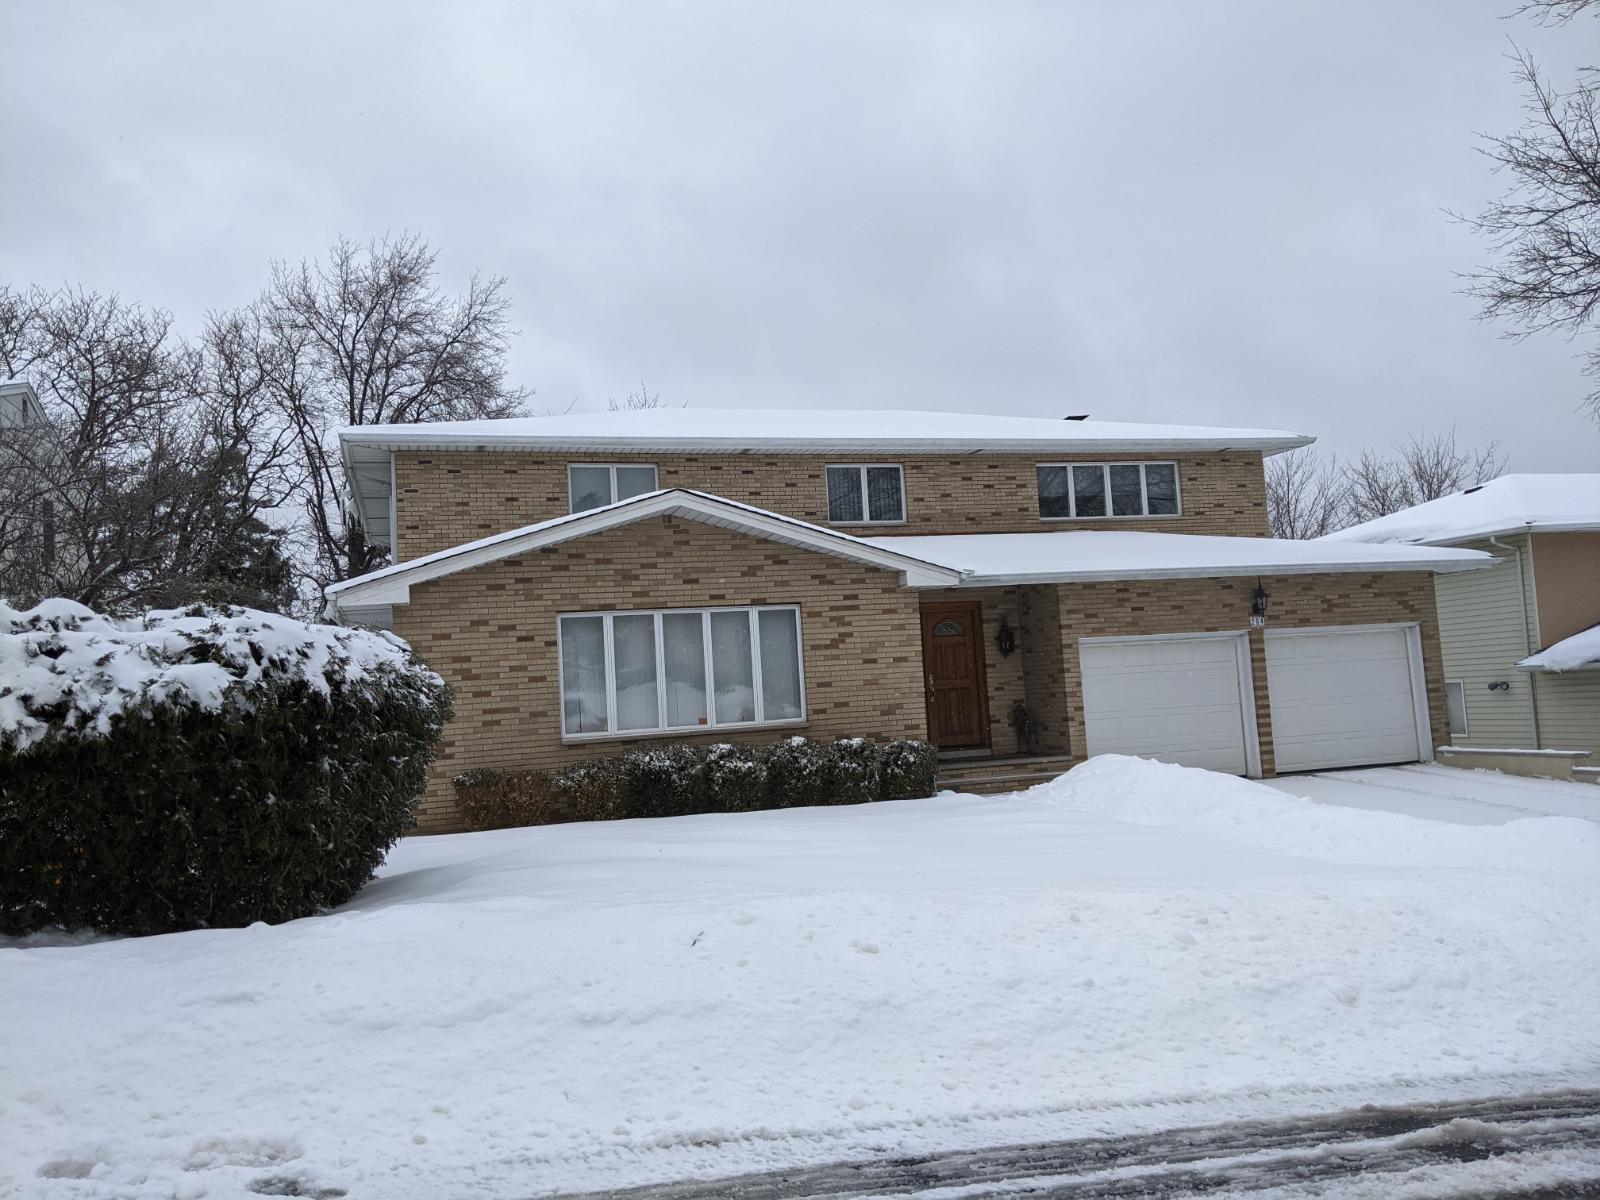
14. Mantoloking – 91.79% Home Price Increase Since May 2010
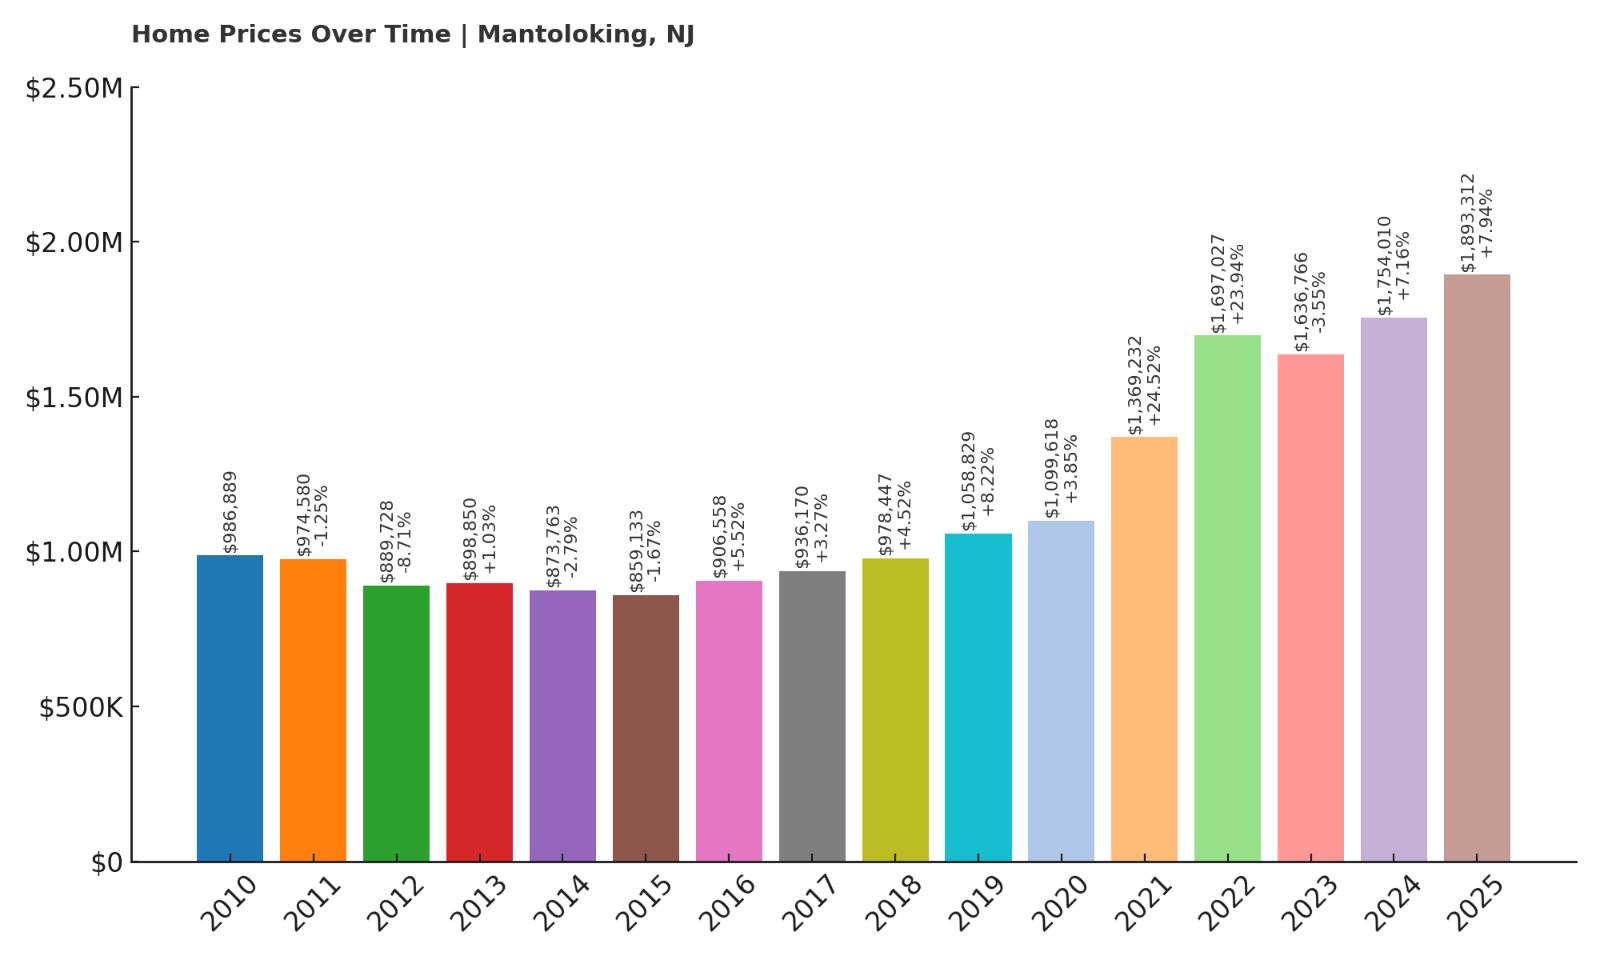
- 2010: $986,889
- 2011: $974,580 (-$12,309, -1.25% from previous year)
- 2012: $889,728 (-$84,852, -8.71% from previous year)
- 2013: $898,850 (+$9,122, +1.03% from previous year)
- 2014: $873,763 (-$25,087, -2.79% from previous year)
- 2015: $859,133 (-$14,630, -1.67% from previous year)
- 2016: $906,558 (+$47,425, +5.52% from previous year)
- 2017: $936,170 (+$29,612, +3.27% from previous year)
- 2018: $978,447 (+$42,277, +4.52% from previous year)
- 2019: $1,058,829 (+$80,382, +8.22% from previous year)
- 2020: $1,099,618 (+$40,789, +3.85% from previous year)
- 2021: $1,369,232 (+$269,614, +24.52% from previous year)
- 2022: $1,697,027 (+$327,795, +23.94% from previous year)
- 2023: $1,636,766 (-$60,261, -3.55% from previous year)
- 2024: $1,754,010 (+$117,244, +7.16% from previous year)
- 2025: $1,893,312 (+$139,302, +7.94% from previous year)
Home prices in Mantoloking have climbed by nearly 92% since 2010. After years of modest or even negative changes, the market surged in 2021 and 2022, with gains exceeding $597,000 across just those two years. Even after a brief dip in 2023, prices continued to rise and have reached nearly $1.9 million in 2025. The sharp increases reflect a market that has become highly desirable, especially for high-end coastal buyers.
Mantoloking – Resilience and Premium Shorefront Appeal
Mantoloking is a tiny borough along the Jersey Shore known for its large oceanfront estates and quiet atmosphere. Severely impacted by Hurricane Sandy in 2012, the town has since rebuilt stronger and more luxurious than ever. This transformation helped spark a wave of investment and rising prices, especially after 2015.
The borough’s location on a narrow barrier island, along with strict zoning and limited inventory, helps keep demand high. Many properties boast private docks or ocean access, adding to the town’s exclusivity. With limited commercial activity and a close-knit feel, Mantoloking has become a prime destination for New Jersey’s wealthiest homebuyers looking for serenity and water views.
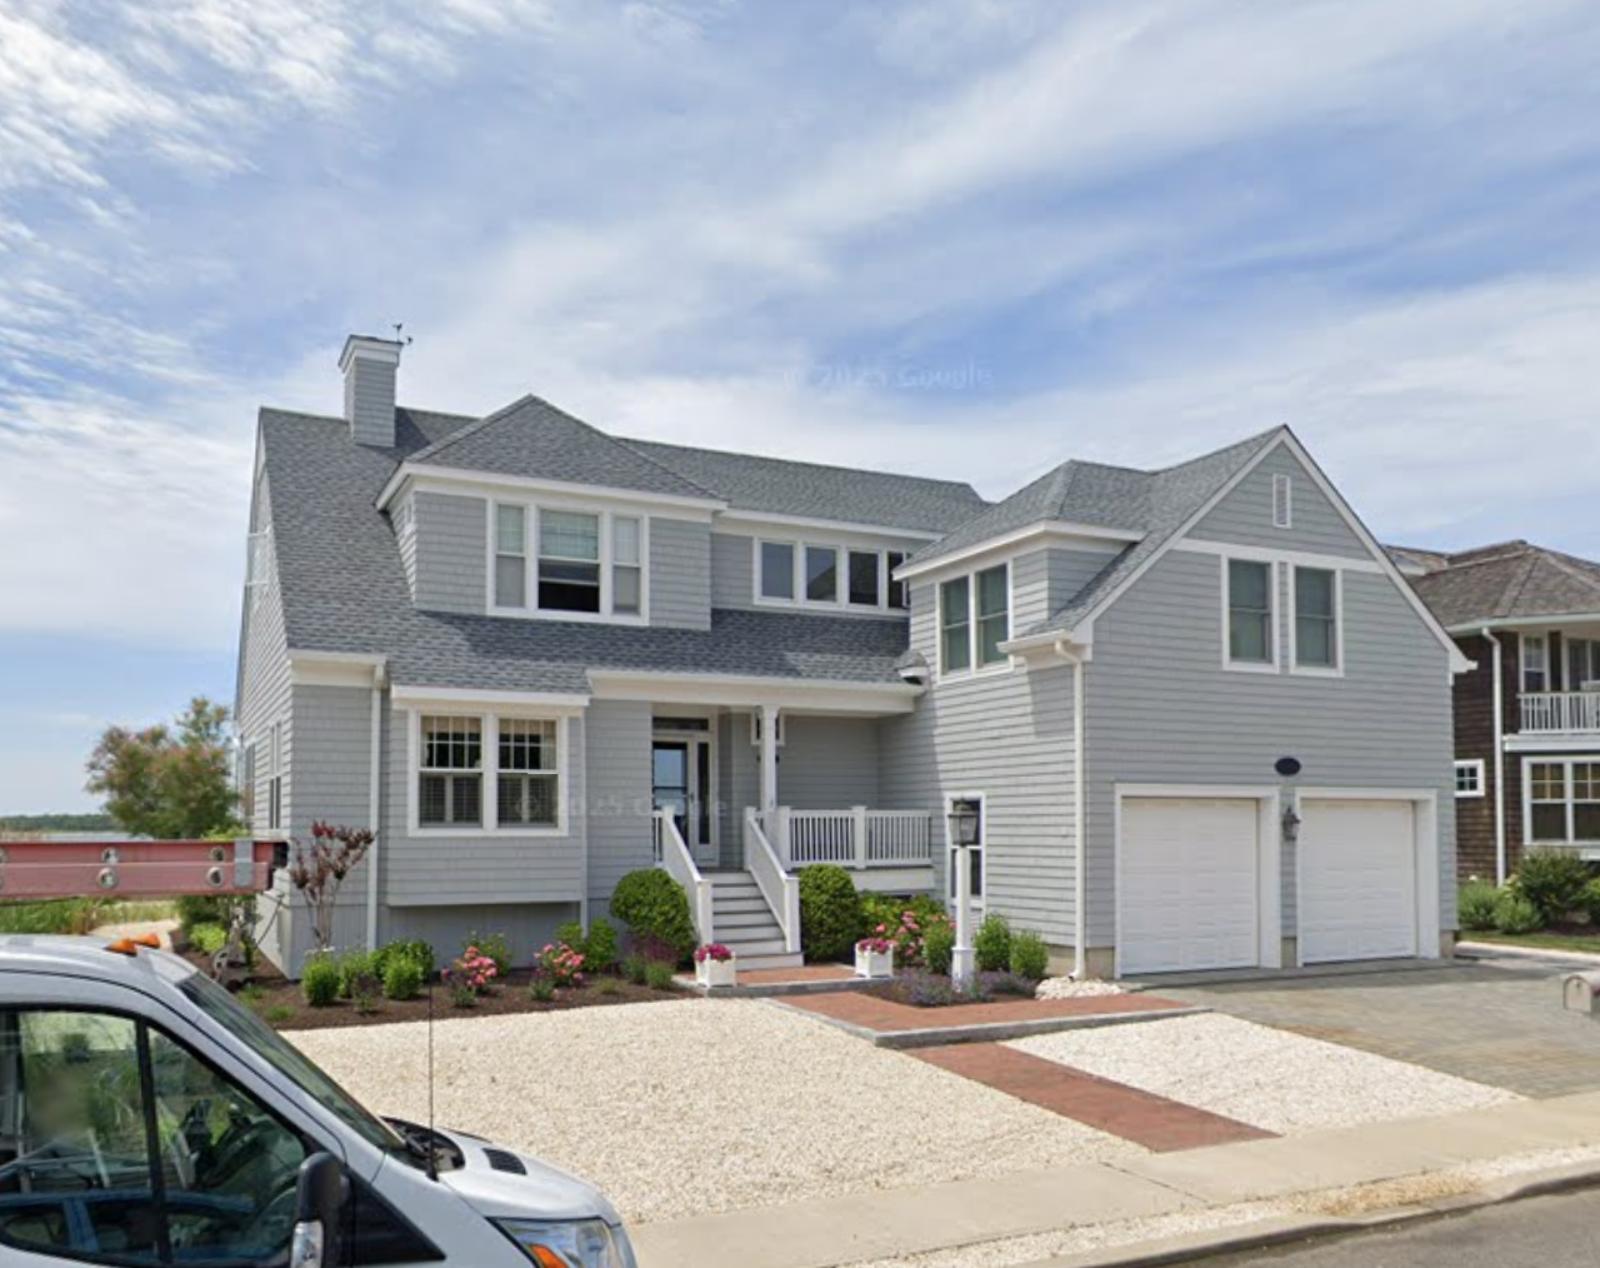
13. Long Beach Township – 83.44% Home Price Increase Since May 2010
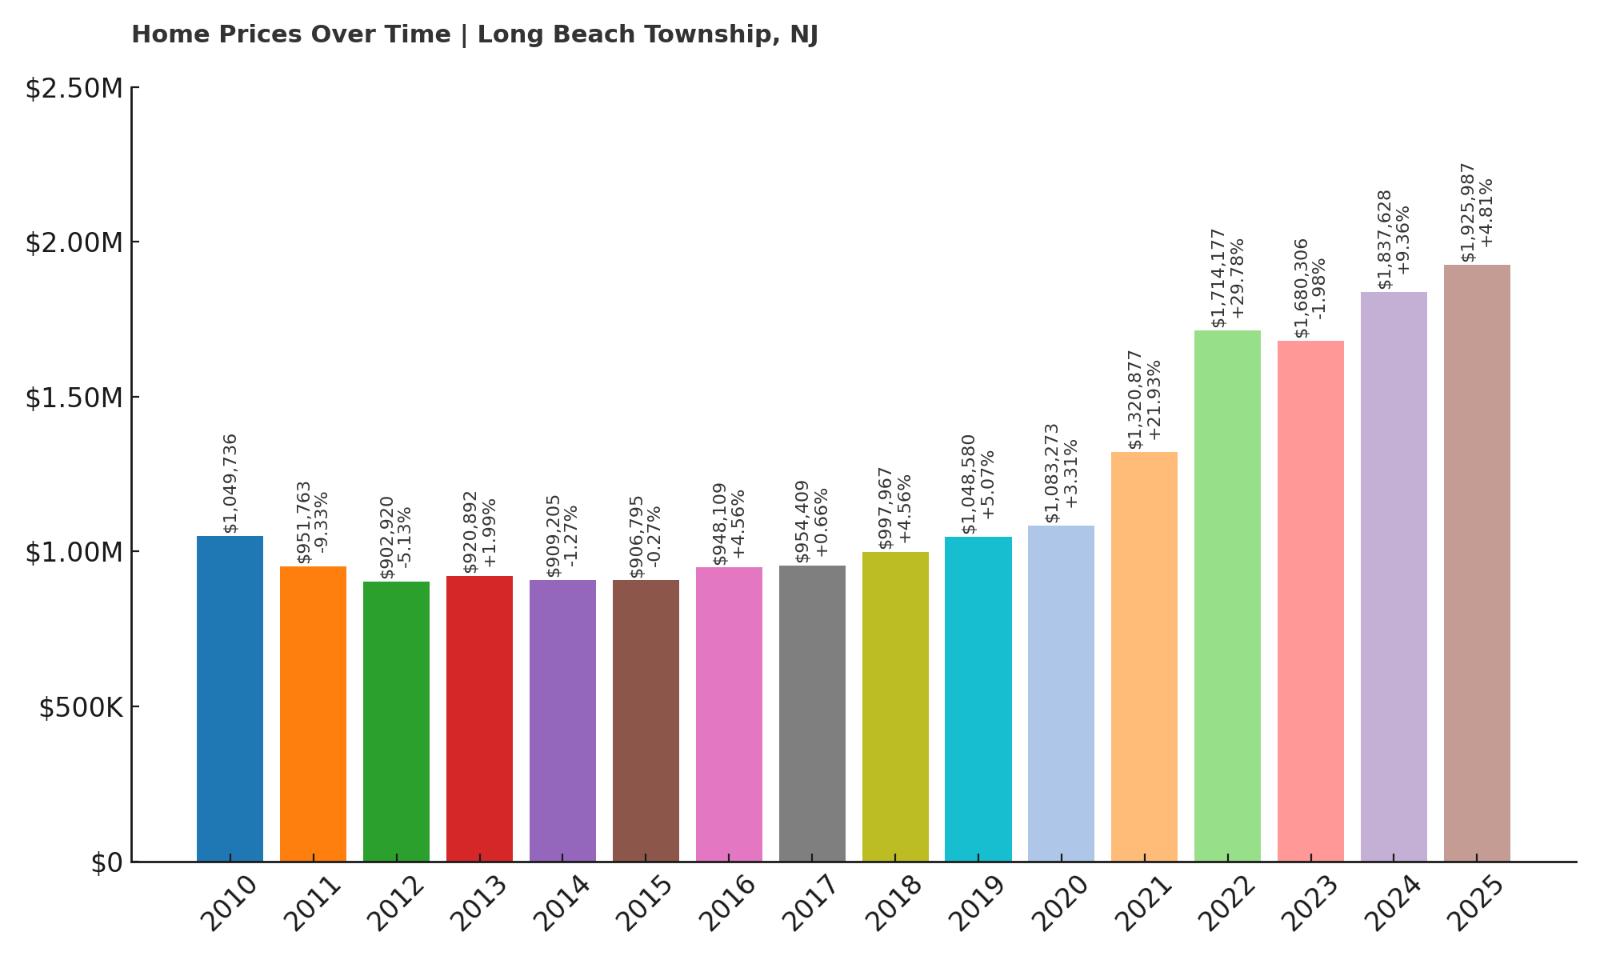
- 2010: $1,049,736
- 2011: $951,763 (-$97,973, -9.33% from previous year)
- 2012: $902,920 (-$48,843, -5.13% from previous year)
- 2013: $920,892 (+$17,972, +1.99% from previous year)
- 2014: $909,205 (-$11,687, -1.27% from previous year)
- 2015: $906,795 (-$2,410, -0.27% from previous year)
- 2016: $948,109 (+$41,314, +4.56% from previous year)
- 2017: $954,409 (+$6,300, +0.66% from previous year)
- 2018: $997,967 (+$43,558, +4.56% from previous year)
- 2019: $1,048,580 (+$50,613, +5.07% from previous year)
- 2020: $1,083,273 (+$34,693, +3.31% from previous year)
- 2021: $1,320,877 (+$237,604, +21.93% from previous year)
- 2022: $1,714,177 (+$393,300, +29.78% from previous year)
- 2023: $1,680,306 (-$33,871, -1.98% from previous year)
- 2024: $1,837,628 (+$157,322, +9.36% from previous year)
- 2025: $1,925,987 (+$88,359, +4.81% from previous year)
Long Beach Township home prices have grown by more than 83% since 2010. The market was relatively flat until 2020, when prices began soaring. In particular, 2021 and 2022 saw an explosion in values, with a combined increase of more than $630,000. Though there was a minor dip in 2023, the momentum resumed, pushing values to nearly $1.93 million in 2025.
Long Beach Township – Island Living with Long-Term Growth

Long Beach Township spans a large portion of Long Beach Island and includes several distinct neighborhoods, each with its own style and appeal. With sweeping ocean views, walkable beaches, and tight-knit communities, it’s a favorite for second-home buyers and retirees looking for relaxation along the Jersey Shore.
The township’s size and diversity of properties—from modest bungalows to luxury waterfront homes—give it broad appeal. A limited supply of buildable land and frequent renovation of older homes have helped elevate overall home values. As remote work remains popular, more buyers are treating Long Beach Township properties as primary residences, adding to long-term price support.
12. Rumson – 90.41% Home Price Increase Since May 2010
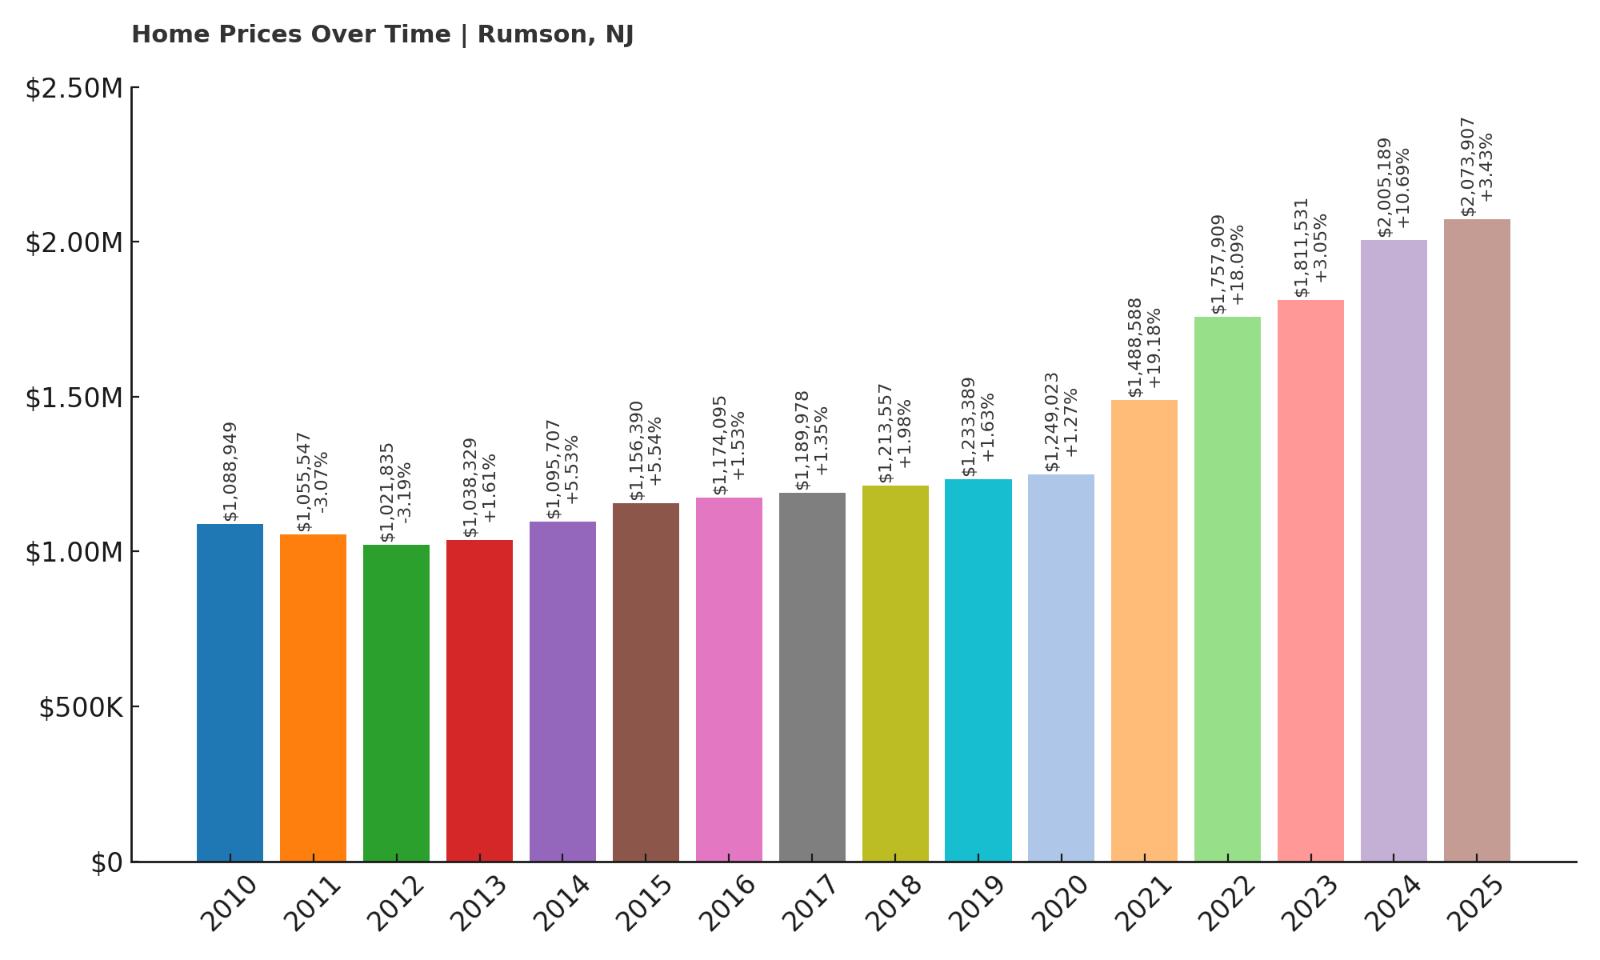
- 2010: $1,088,949
- 2011: $1,055,547 (-$33,402, -3.07% from previous year)
- 2012: $1,021,835 (-$33,712, -3.19% from previous year)
- 2013: $1,038,329 (+$16,494, +1.61% from previous year)
- 2014: $1,095,707 (+$57,378, +5.53% from previous year)
- 2015: $1,156,390 (+$60,683, +5.54% from previous year)
- 2016: $1,174,095 (+$17,705, +1.53% from previous year)
- 2017: $1,189,978 (+$15,883, +1.35% from previous year)
- 2018: $1,213,557 (+$23,579, +1.98% from previous year)
- 2019: $1,233,389 (+$19,832, +1.63% from previous year)
- 2020: $1,249,023 (+$15,634, +1.27% from previous year)
- 2021: $1,488,588 (+$239,565, +19.18% from previous year)
- 2022: $1,757,909 (+$269,321, +18.09% from previous year)
- 2023: $1,811,531 (+$53,622, +3.05% from previous year)
- 2024: $2,005,189 (+$193,658, +10.69% from previous year)
- 2025: $2,073,907 (+$68,718, +3.43% from previous year)
Rumson’s home values have risen over 90% since 2010, crossing the $2 million mark in 2024. While early gains were steady but modest, the market took off in 2021 and 2022 with back-to-back double-digit jumps totaling more than $500,000. Even with smaller increases in recent years, prices remain at an all-time high in 2025.
Rumson – Wealth and Waterfront Living

Located along the Navesink and Shrewsbury Rivers, Rumson is one of New Jersey’s most established and affluent towns. It’s known for sprawling estates, historic homes, and proximity to both the Jersey Shore and New York City via ferry or rail. The town consistently ranks among the wealthiest zip codes in the state.
Its elite private schools, yacht clubs, and manicured streets draw high-income buyers year after year. With large riverfront lots and limited development, Rumson’s real estate market offers both exclusivity and long-term investment appeal. The town’s high-end stability is reflected in its steady price appreciation and resilience during broader market shifts.
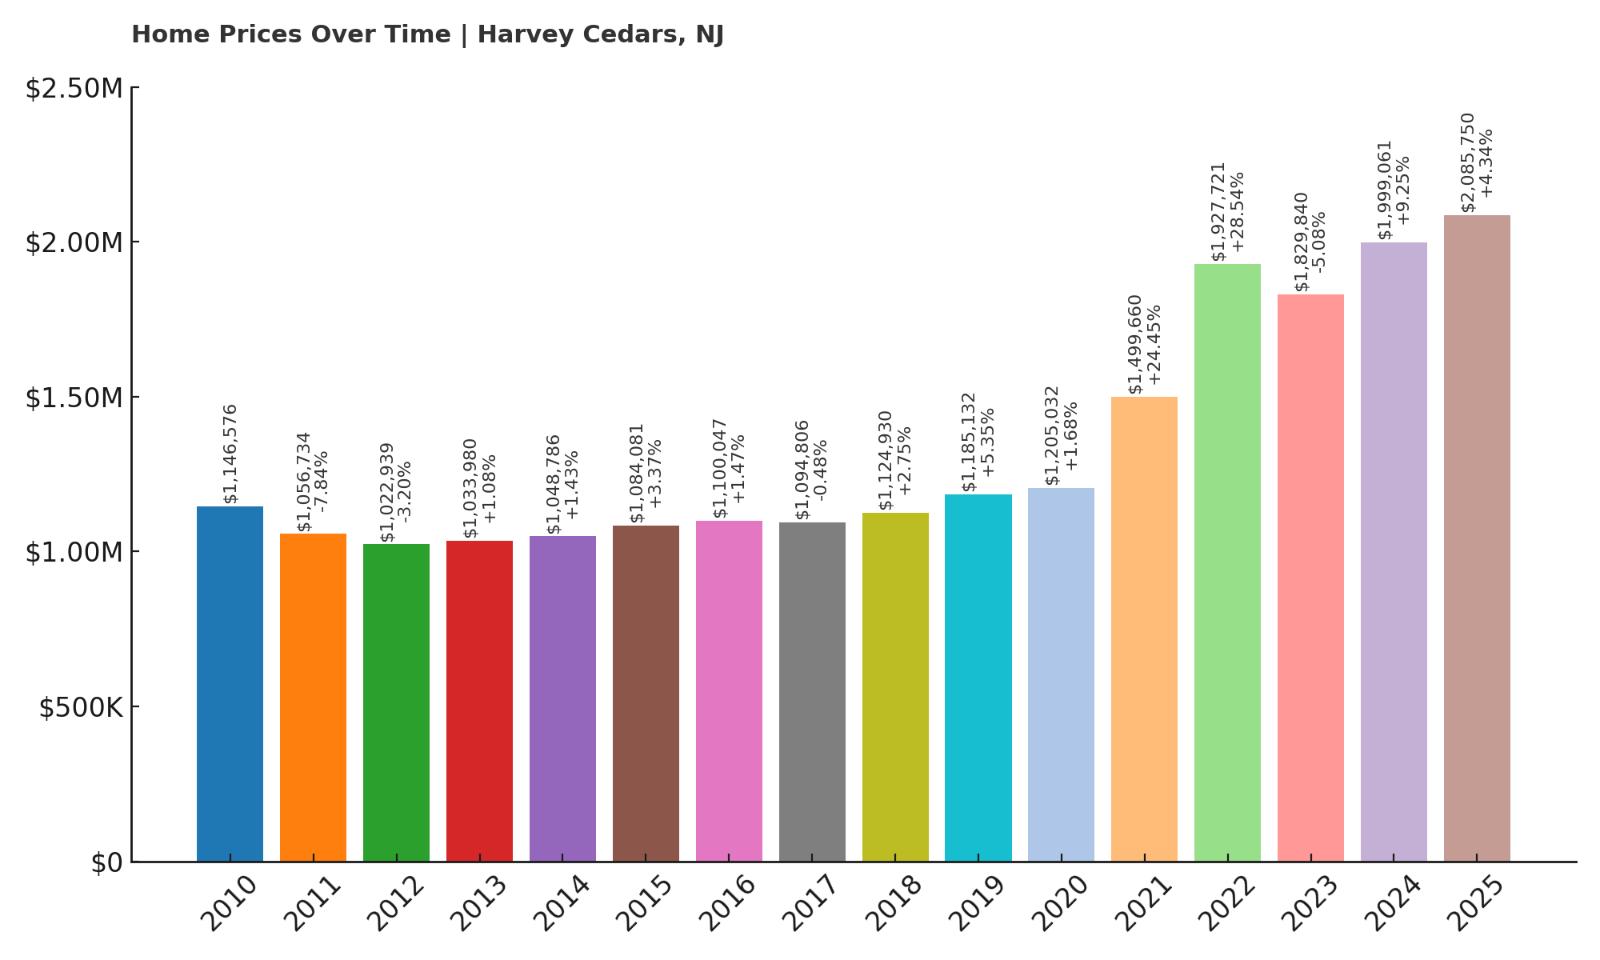
11. Harvey Cedars – 81.86% Home Price Increase Since May 2010
🔥 Would you like to save this?
- 2010: $1,146,576
- 2011: $1,056,734 (-$89,842, -7.84% from previous year)
- 2012: $1,022,939 (-$33,795, -3.20% from previous year)
- 2013: $1,033,980 (+$11,041, +1.08% from previous year)
- 2014: $1,048,786 (+$14,806, +1.43% from previous year)
- 2015: $1,084,081 (+$35,295, +3.37% from previous year)
- 2016: $1,100,047 (+$15,966, +1.47% from previous year)
- 2017: $1,094,806 (-$5,241, -0.48% from previous year)
- 2018: $1,124,930 (+$30,124, +2.75% from previous year)
- 2019: $1,185,132 (+$60,202, +5.35% from previous year)
- 2020: $1,205,032 (+$19,900, +1.68% from previous year)
- 2021: $1,499,660 (+$294,628, +24.45% from previous year)
- 2022: $1,927,721 (+$428,061, +28.54% from previous year)
- 2023: $1,829,840 (-$97,881, -5.08% from previous year)
- 2024: $1,999,061 (+$169,221, +9.25% from previous year)
- 2025: $2,085,750 (+$86,689, +4.34% from previous year)
Harvey Cedars home prices are up nearly 82% since 2010. The market moved gradually until a dramatic upswing in 2021 and 2022, when values surged by over $722,000. Although 2023 saw a dip, the recovery has been steady and prices now sit above $2 million for the first time in 2025.
Harvey Cedars – Exclusive, Elevated Living on LBI
Harvey Cedars is a quiet and exclusive borough on Long Beach Island with a reputation for large homes, scenic views, and low population density. It’s one of the most sought-after sections of the island, attracting wealthy buyers looking for peaceful shorefront living.
Strict building codes, low turnover, and premium waterfront locations help push prices higher over time. Despite some year-to-year variability, the overall trend points toward long-term growth. With limited land and strong appeal for high-end second-home buyers, Harvey Cedars remains one of New Jersey’s most valuable coastal enclaves.
10. Saddle River – 62.26% Home Price Increase Since May 2010
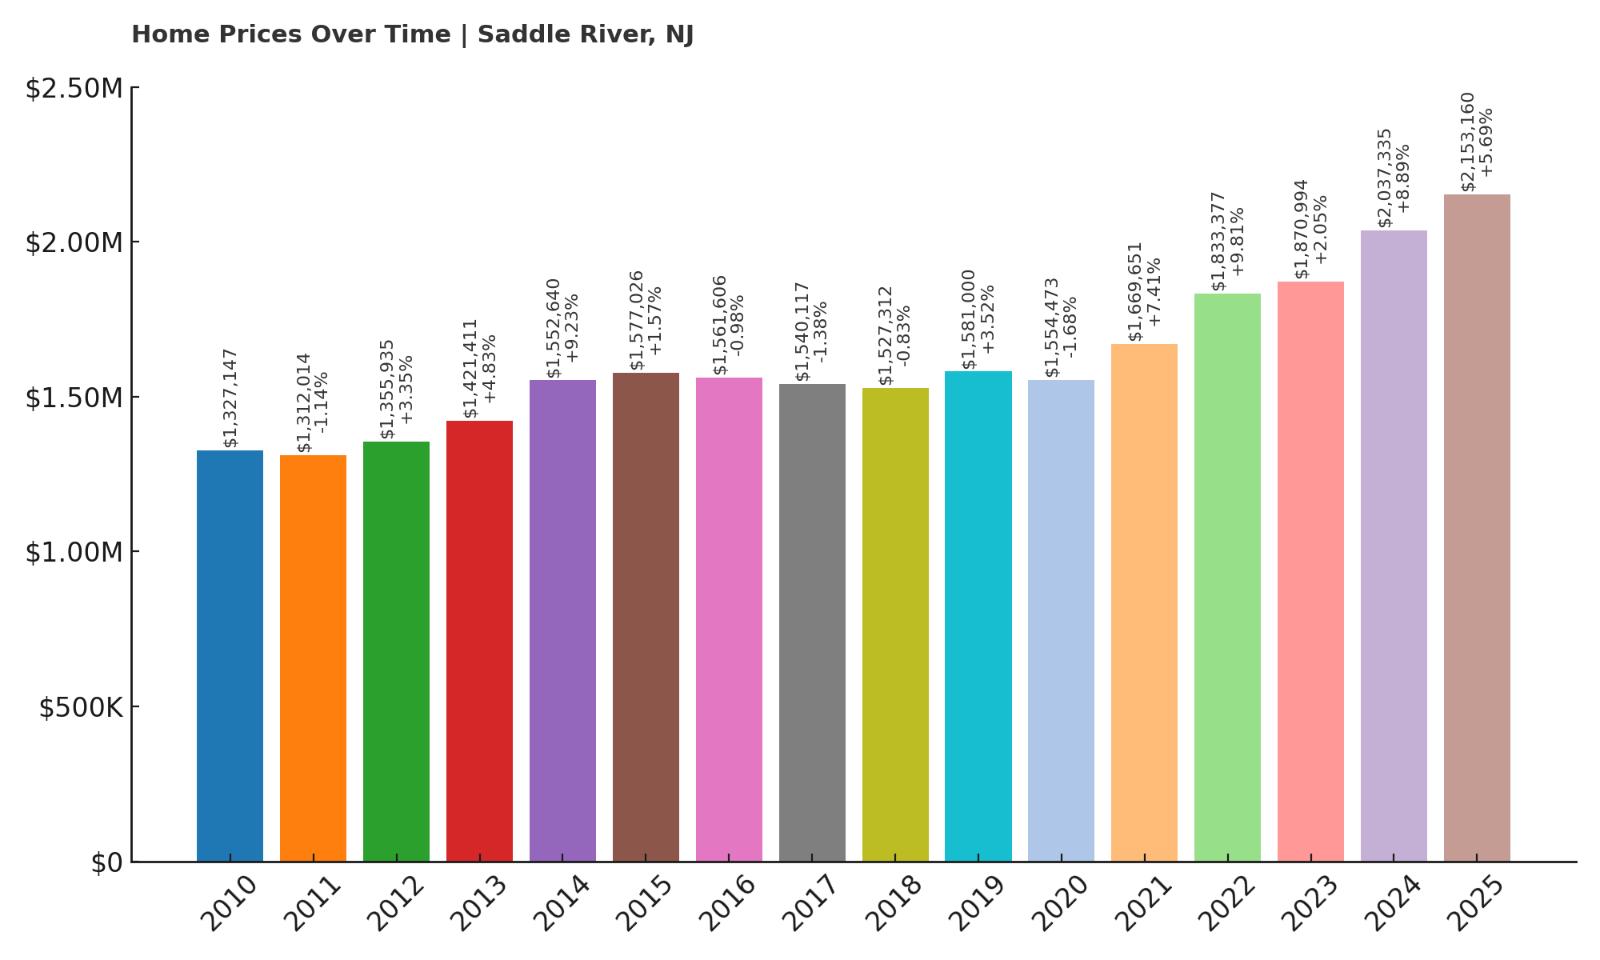
- 2010: $1,327,147
- 2011: $1,312,014 (-$15,133, -1.14% from previous year)
- 2012: $1,355,935 (+$43,921, +3.35% from previous year)
- 2013: $1,421,411 (+$65,476, +4.83% from previous year)
- 2014: $1,552,640 (+$131,229, +9.23% from previous year)
- 2015: $1,577,026 (+$24,386, +1.57% from previous year)
- 2016: $1,561,606 (-$15,420, -0.98% from previous year)
- 2017: $1,540,117 (-$21,489, -1.38% from previous year)
- 2018: $1,527,312 (-$12,805, -0.83% from previous year)
- 2019: $1,581,000 (+$53,688, +3.52% from previous year)
- 2020: $1,554,473 (-$26,527, -1.68% from previous year)
- 2021: $1,669,651 (+$115,178, +7.41% from previous year)
- 2022: $1,833,377 (+$163,726, +9.81% from previous year)
- 2023: $1,870,994 (+$37,617, +2.05% from previous year)
- 2024: $2,037,335 (+$166,341, +8.89% from previous year)
- 2025: $2,153,160 (+$115,825, +5.69% from previous year)
Over the last 15 years, Saddle River has seen its home values rise by more than 62%, climbing from just over $1.3 million to over $2.15 million in 2025. While the market was uneven during the mid-2010s—with several years of modest declines—price momentum picked up dramatically starting in 2021. Between 2021 and 2024 alone, home values increased by over $367,000, with especially large jumps in 2022 and 2024. This recent surge reflects renewed interest in suburban luxury homes with space and privacy. Despite minor setbacks earlier in the decade, Saddle River’s long-term market strength remains intact.
Saddle River – Private Estates and Consistent High-End Appeal
Saddle River is one of New Jersey’s most iconic upscale communities, known for its sprawling estates, quiet lanes, and exclusivity. Situated in Bergen County and bordered by the Saddle River itself, the town offers some of the largest residential lots in the area, often exceeding two acres. Strict zoning regulations and a lack of commercial development help preserve its serene, wooded feel, making it a top choice for high-net-worth buyers who value both space and privacy. Many properties are custom-built and feature luxury amenities like private tennis courts, gated drives, and pools.
Its appeal extends to celebrities, executives, and those looking to stay within commuting range of New York City without sacrificing tranquility. The town is served by top-rated schools and has convenient access to major highways, adding to its desirability. While prices saw slower growth earlier in the decade, recent trends show a strong resurgence, driven by growing demand for private luxury living. With limited inventory and no signs of overdevelopment, Saddle River continues to hold its place as a premier destination for elite buyers in New Jersey.
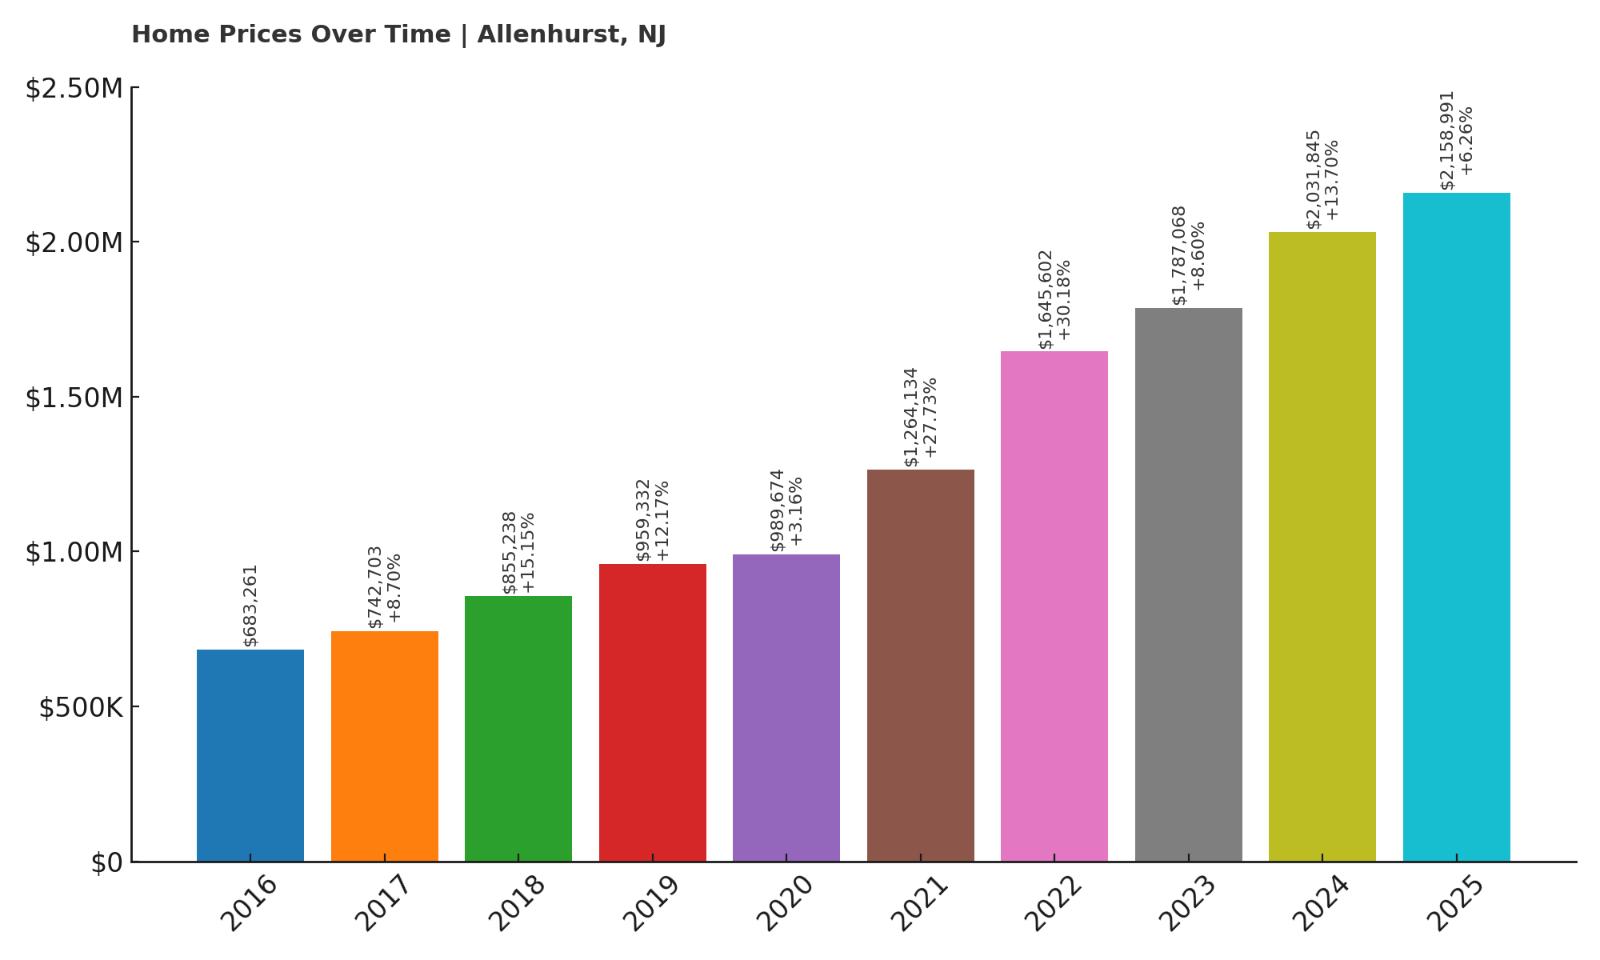
9. Allenhurst – 215.92% Home Price Increase Since May 2016
- 2010: N/A
- 2011: N/A
- 2012: N/A
- 2013: N/A
- 2014: N/A
- 2015: N/A
- 2016: $683,261
- 2017: $742,703 (+$59,442, +8.70% from previous year)
- 2018: $855,238 (+$112,535, +15.15% from previous year)
- 2019: $959,332 (+$104,094, +12.17% from previous year)
- 2020: $989,674 (+$30,342, +3.16% from previous year)
- 2021: $1,264,134 (+$274,460, +27.73% from previous year)
- 2022: $1,645,602 (+$381,468, +30.18% from previous year)
- 2023: $1,787,068 (+$141,466, +8.60% from previous year)
- 2024: $2,031,845 (+$244,777, +13.70% from previous year)
- 2025: $2,158,991 (+$127,146, +6.26% from previous year)
Since data became available in 2016, home values in Allenhurst have more than tripled, rising over 215%. That explosive growth includes several consecutive double-digit gains, with a staggering $655,000 jump between 2020 and 2022 alone. While the pace slowed slightly in recent years, prices have continued to climb steadily, reaching a remarkable $2.15 million by May 2025. Allenhurst’s small size, historic charm, and highly desirable location appear to be fueling this outsized demand. The town’s market has transformed over the past decade into one of the most exclusive on the Jersey Shore.
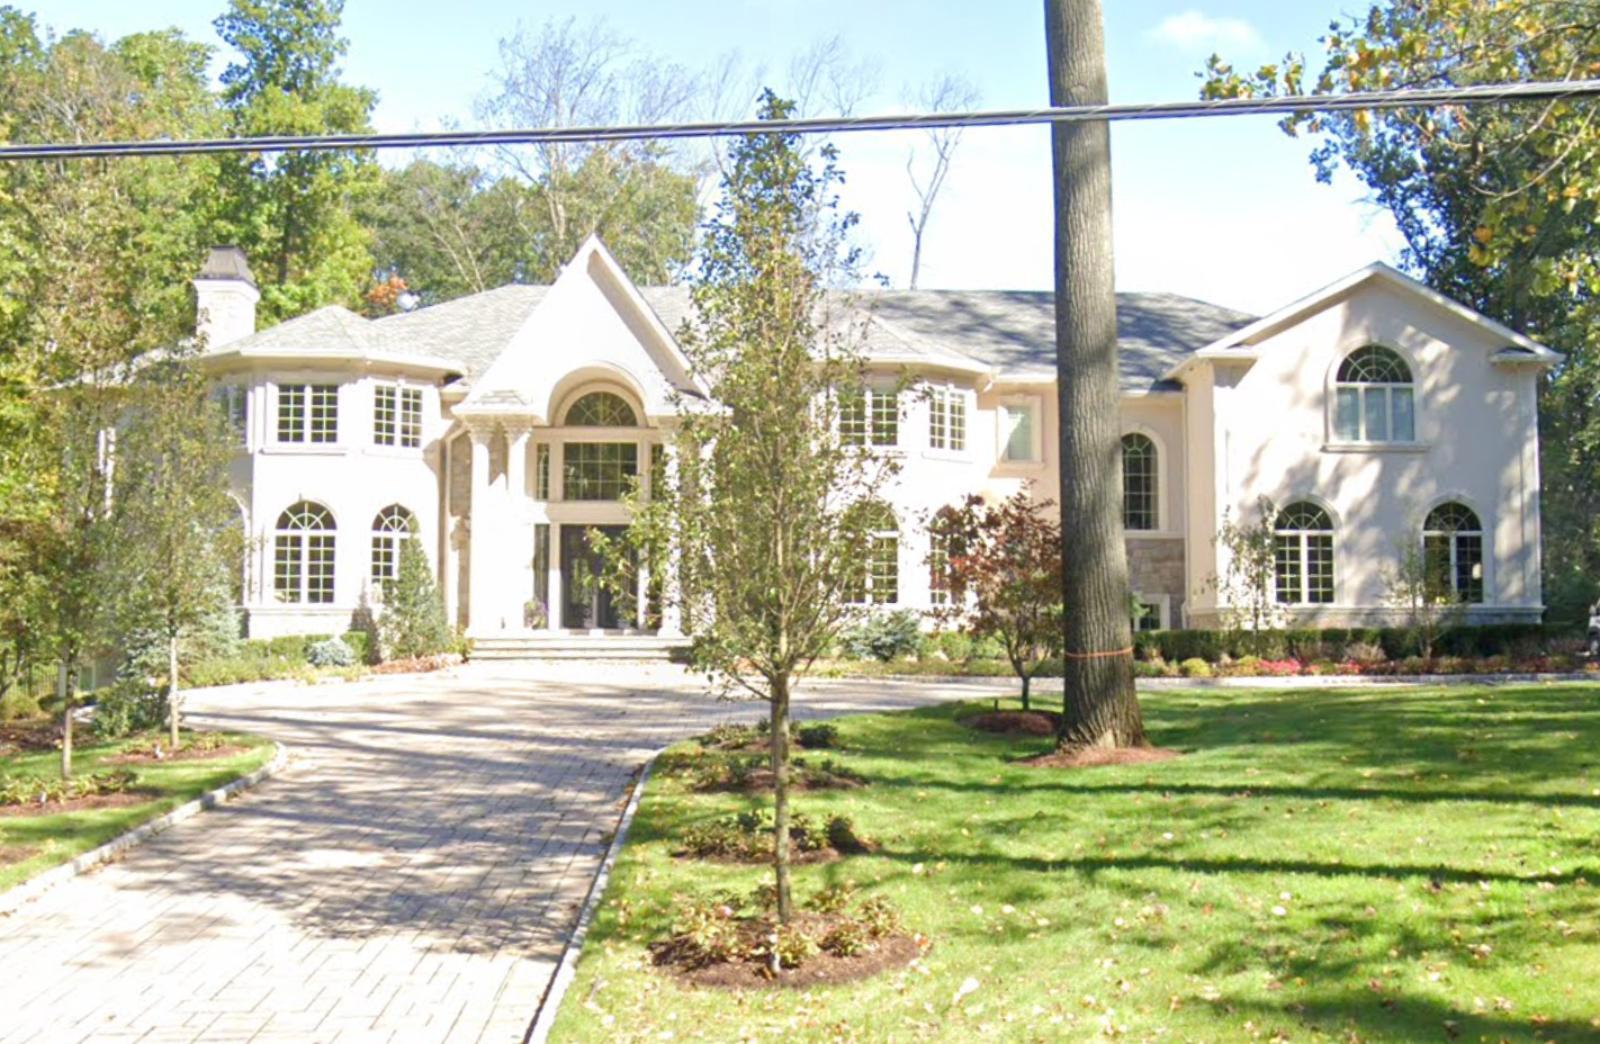
Allenhurst – Historic Architecture and Soaring Demand
Allenhurst is a tiny oceanfront borough in Monmouth County, covering just half a square mile, but it boasts some of the most impressive architecture in the region. Known for its large, early-20th-century homes, the town feels like a preserved slice of history, with wide streets, leafy sidewalks, and a distinctly upscale, quiet character. There’s no commercial sprawl here—just beautiful homes and a small beach that serves residents and their guests. Because of its size and strict preservation practices, turnover is low and competition for properties is fierce.
Many of Allenhurst’s homes have been meticulously restored or modernized, keeping demand strong among buyers looking for character-rich properties with premium coastal access. The town also benefits from close proximity to Asbury Park, offering entertainment and dining while retaining its own low-key, exclusive feel. Prices reflect this rarity: inventory is minimal, and when homes do hit the market, they often spark bidding wars. With limited room for expansion and no appetite for change, Allenhurst’s housing market remains one of New Jersey’s most powerful examples of concentrated, sustained luxury growth.
8. Sea Girt – 139.35% Home Price Increase Since May 2010
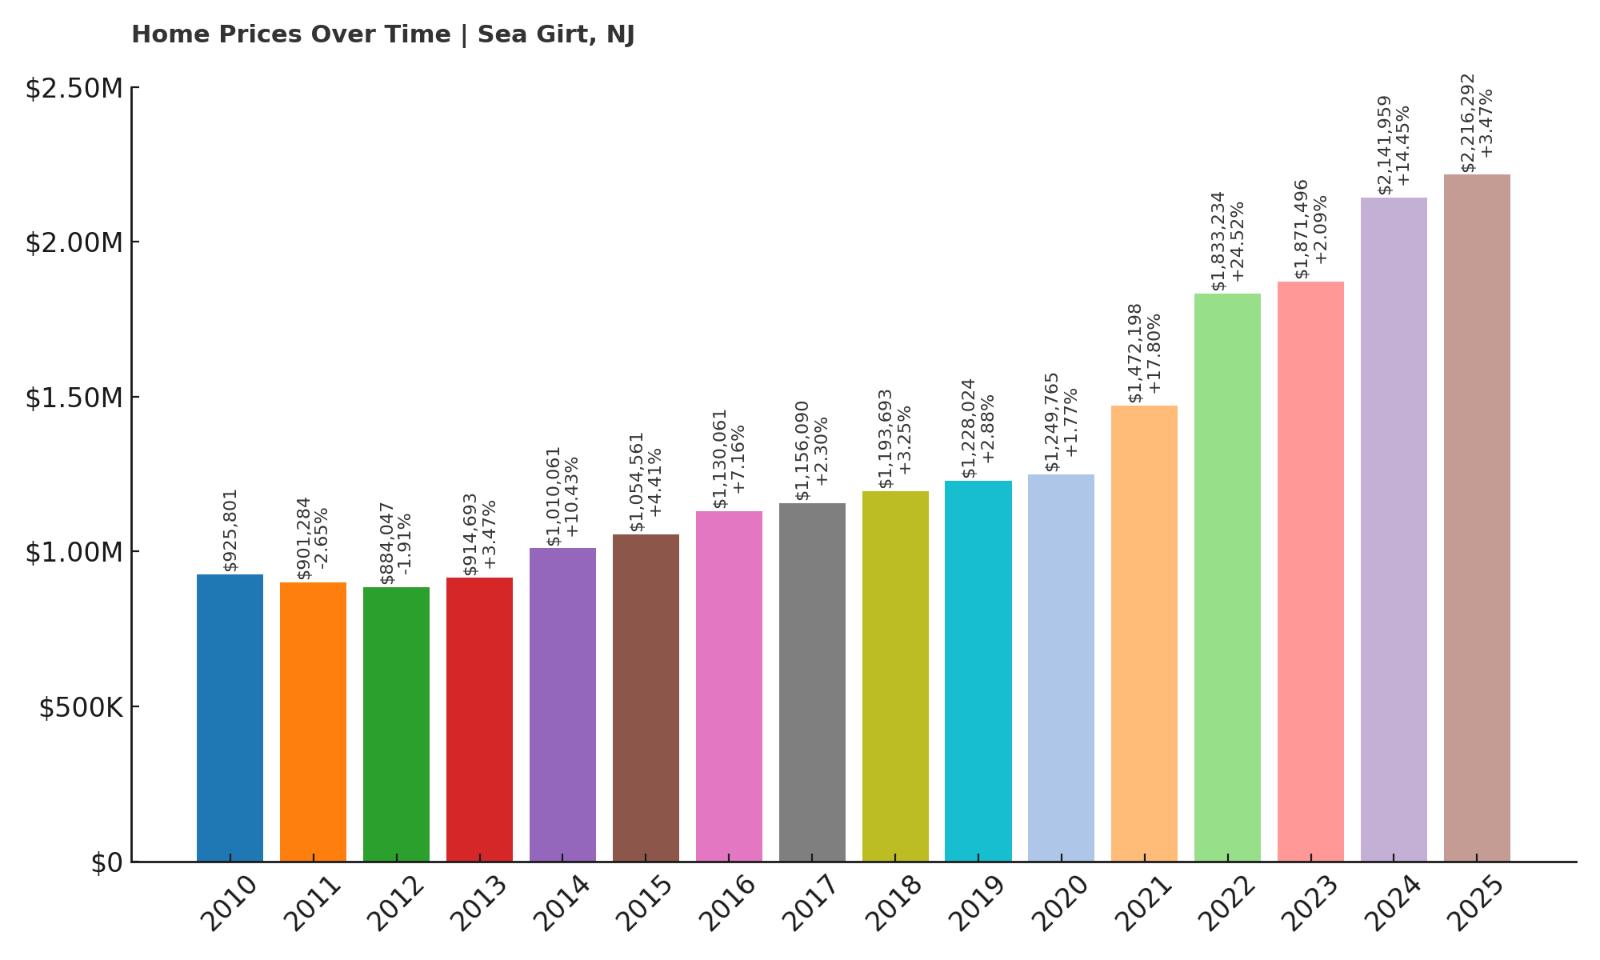
- 2010: $925,801
- 2011: $901,284 (-$24,517, -2.65% from previous year)
- 2012: $884,047 (-$17,237, -1.91% from previous year)
- 2013: $914,693 (+$30,646, +3.47% from previous year)
- 2014: $1,010,061 (+$95,368, +10.43% from previous year)
- 2015: $1,054,561 (+$44,500, +4.41% from previous year)
- 2016: $1,130,061 (+$75,500, +7.16% from previous year)
- 2017: $1,156,090 (+$26,029, +2.30% from previous year)
- 2018: $1,193,693 (+$37,603, +3.25% from previous year)
- 2019: $1,228,024 (+$34,331, +2.88% from previous year)
- 2020: $1,249,765 (+$21,741, +1.77% from previous year)
- 2021: $1,472,198 (+$222,433, +17.80% from previous year)
- 2022: $1,833,234 (+$361,036, +24.52% from previous year)
- 2023: $1,871,496 (+$38,262, +2.09% from previous year)
- 2024: $2,141,959 (+$270,463, +14.45% from previous year)
- 2025: $2,216,292 (+$74,333, +3.47% from previous year)
Sea Girt’s home values have risen by over 139% since 2010, more than doubling during that span. While the early 2010s saw modest fluctuations, prices started to climb quickly after 2014, accelerating in the pandemic-era boom. A standout surge came in 2022, when prices soared by over $361,000 in a single year. Even as the pace cooled slightly in 2023, values resumed a strong upward trend through 2025. At over $2.2 million, the current median value reflects not just high demand, but extreme scarcity in one of New Jersey’s most tightly held markets.
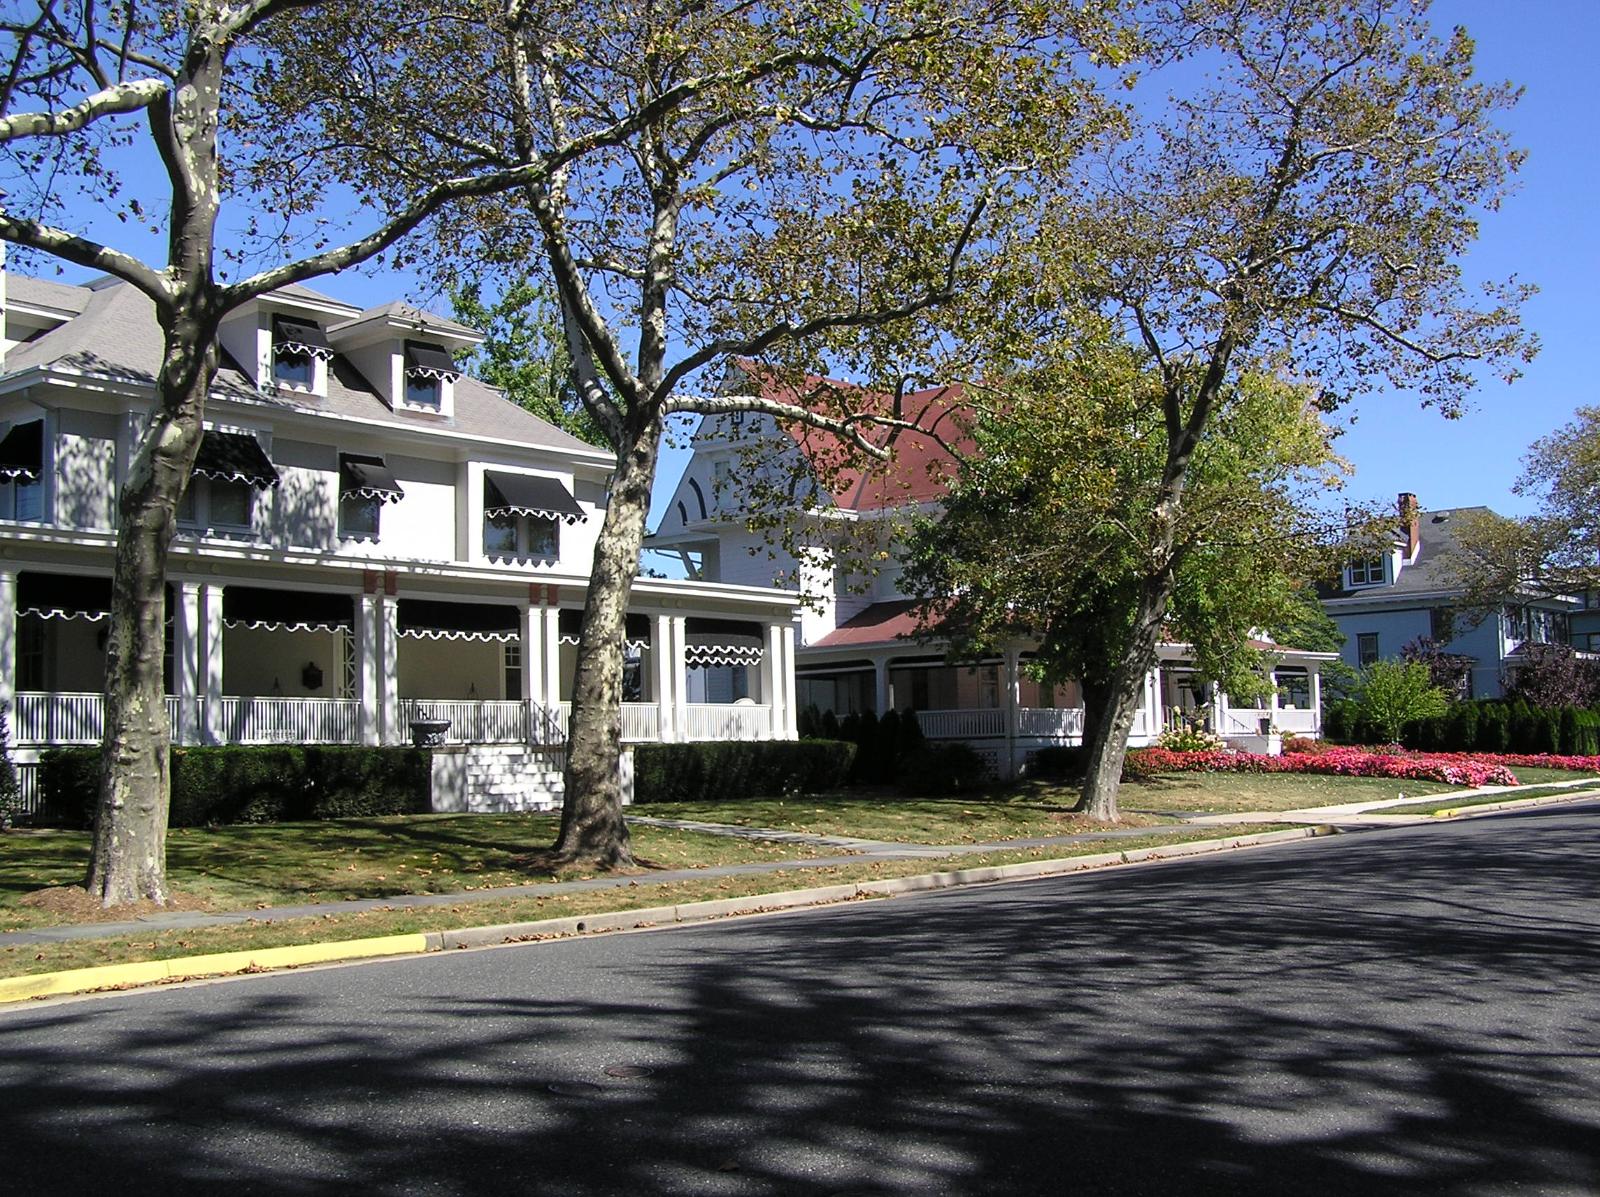
Sea Girt – Premium Real Estate in a Picture-Perfect Shore Town
Sea Girt is a highly coveted coastal community in Monmouth County, prized for its small-town charm, expansive beaches, and quiet affluence. Despite its close proximity to major beach destinations like Spring Lake and Point Pleasant, Sea Girt maintains a distinctly calm and residential feel. The town’s tree-lined streets are filled with stately homes, many of them early-20th-century properties that have been extensively renovated or rebuilt. Strict zoning keeps new development minimal, preserving the town’s exclusive atmosphere. Buyers here aren’t just paying for real estate—they’re buying into a lifestyle of low density, clean public spaces, and a strong sense of tradition.
The area is also attractive to those commuting to New York City, thanks to its easy rail access and highway connections. But many homeowners treat Sea Girt as a year-round residence, drawn by the town’s excellent public school system and sense of security. With limited turnover and few listings available at any time, prices have climbed steadily as demand has remained high. Sea Girt’s beachfront properties are particularly rare and often trade privately or command multi-million-dollar bids. With little room for expansion and unrelenting buyer interest, Sea Girt continues to rank among New Jersey’s most expensive—and most protected—real estate markets.
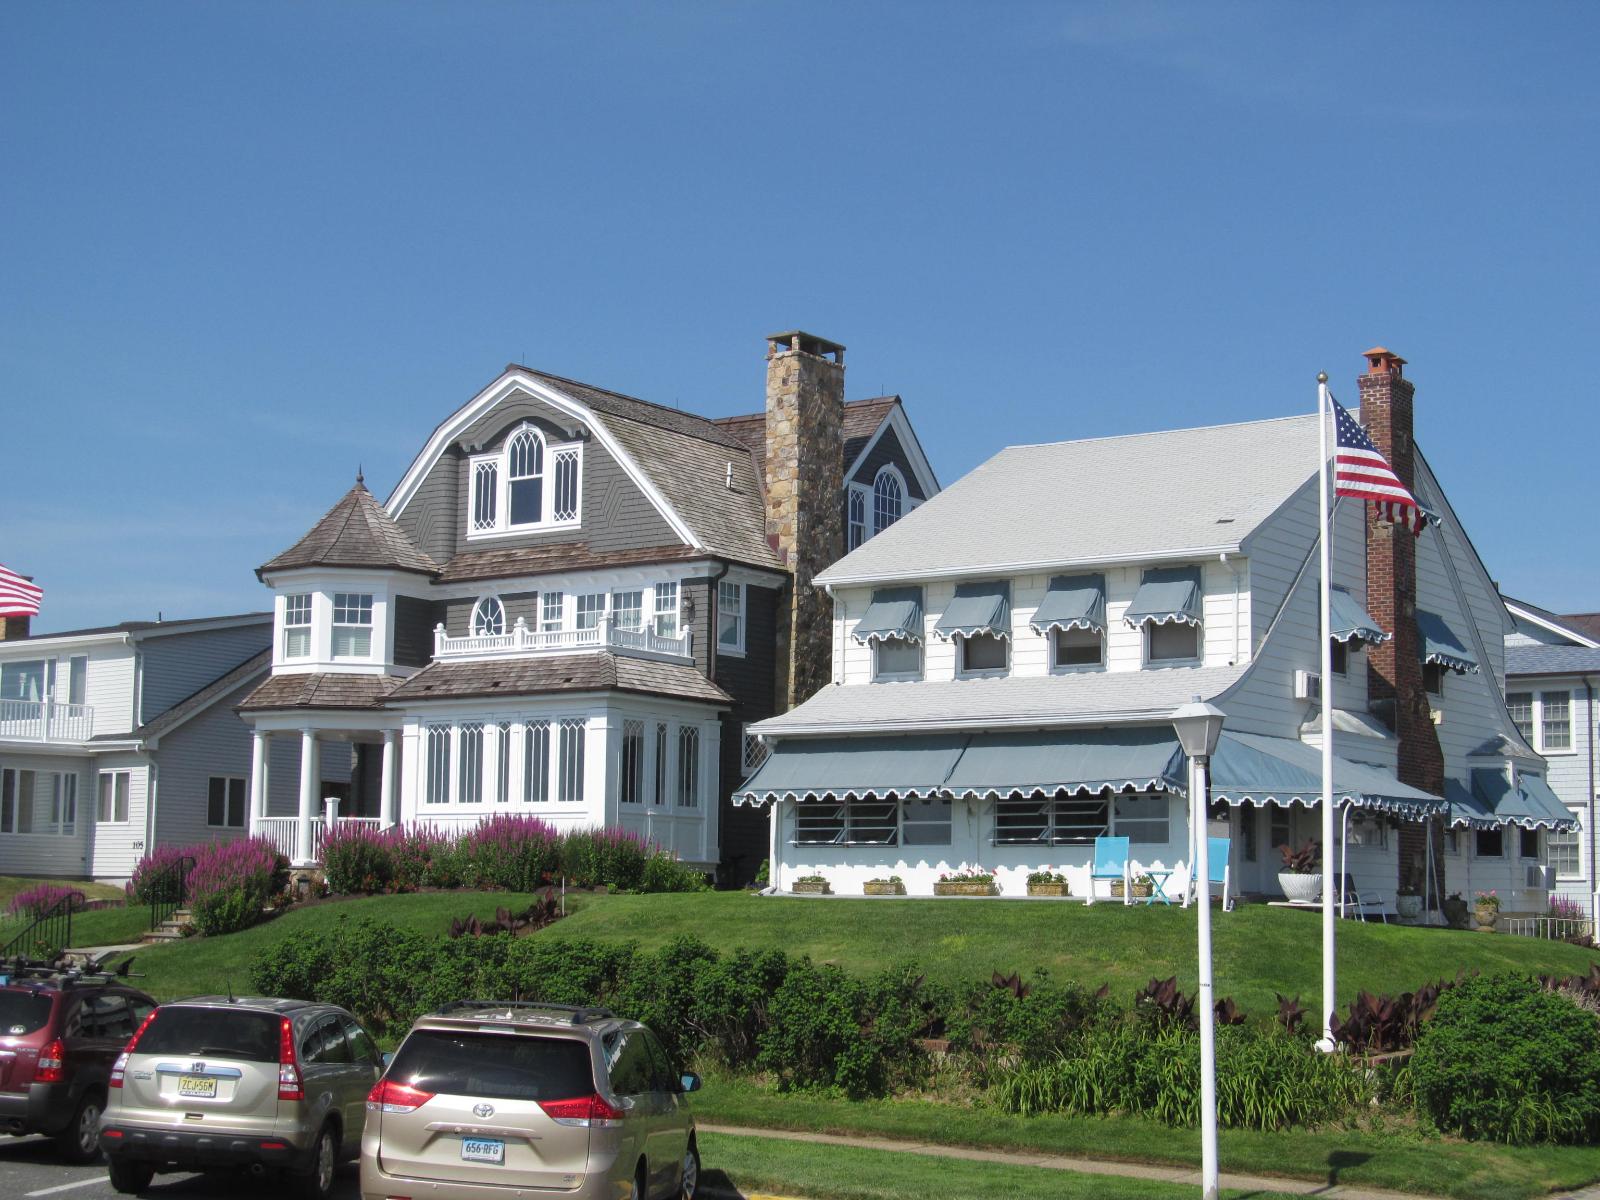
7. Bay Head – 90.17% Home Price Increase Since May 2010
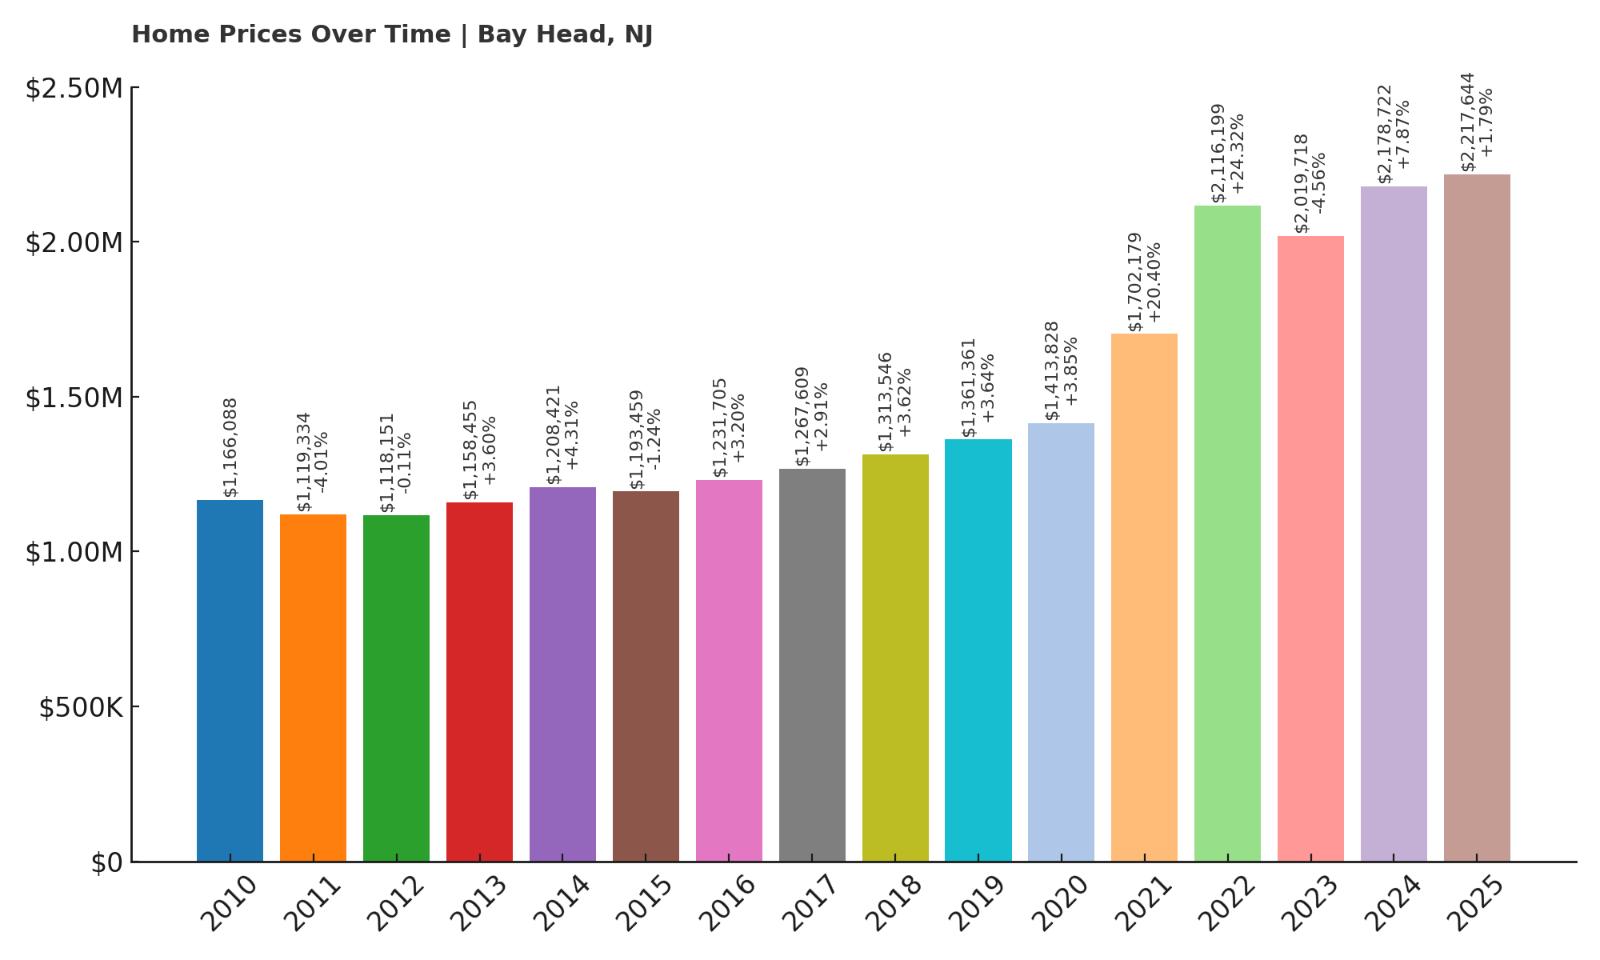
- 2010: $1,166,088
- 2011: $1,119,334 (-$46,754, -4.01% from previous year)
- 2012: $1,118,151 (-$1,183, -0.11% from previous year)
- 2013: $1,158,455 (+$40,304, +3.60% from previous year)
- 2014: $1,208,421 (+$49,966, +4.31% from previous year)
- 2015: $1,193,459 (-$14,962, -1.24% from previous year)
- 2016: $1,231,705 (+$38,246, +3.20% from previous year)
- 2017: $1,267,609 (+$35,904, +2.91% from previous year)
- 2018: $1,313,546 (+$45,937, +3.62% from previous year)
- 2019: $1,361,361 (+$47,815, +3.64% from previous year)
- 2020: $1,413,828 (+$52,467, +3.85% from previous year)
- 2021: $1,702,179 (+$288,351, +20.40% from previous year)
- 2022: $2,116,199 (+$414,020, +24.32% from previous year)
- 2023: $2,019,718 (-$96,481, -4.56% from previous year)
- 2024: $2,178,722 (+$159,004, +7.87% from previous year)
- 2025: $2,217,644 (+$38,922, +1.79% from previous year)
Bay Head has experienced a 90% rise in home values since 2010, with the sharpest gains concentrated between 2020 and 2022. That two-year window alone saw prices increase by over $700,000, elevating the town into the elite bracket of New Jersey shore markets. A temporary dip in 2023 gave way to resumed growth, though at a slower pace, culminating in a 2025 median home price of over $2.2 million. The overall trajectory points to long-term strength with only minor cyclical corrections. High demand for shoreline properties continues to define the market here.
Bay Head – Quiet Prestige on the Northern Shore
Bay Head is a small, tranquil borough nestled between Point Pleasant and Mantoloking on the Barnegat Peninsula. Despite its modest footprint, the town exudes quiet affluence and is known for its historic homes, boutique atmosphere, and well-maintained public spaces. Many of its homes are century-old properties, built in the classic shore style and often lovingly preserved or upgraded. The community also includes a private yacht club, tennis courts, and a small commercial district with galleries and fine dining, offering a refined alternative to more commercialized shore towns nearby.
Its limited housing stock and tight-knit year-round population make Bay Head an especially competitive market. Homes here rarely stay on the market long, and waterfront listings are even more fiercely pursued. The borough’s strict building codes limit new construction, helping preserve its character while driving demand for existing homes. With no significant new supply in the pipeline, and ongoing appeal for retirees, second-home buyers, and remote workers alike, Bay Head is positioned to remain one of New Jersey’s most prestigious shorefront destinations. Its price trajectory reflects a combination of heritage, lifestyle, and unrelenting demand for exclusivity by the water.
6. Short Hills – 81.64% Home Price Increase Since May 2010
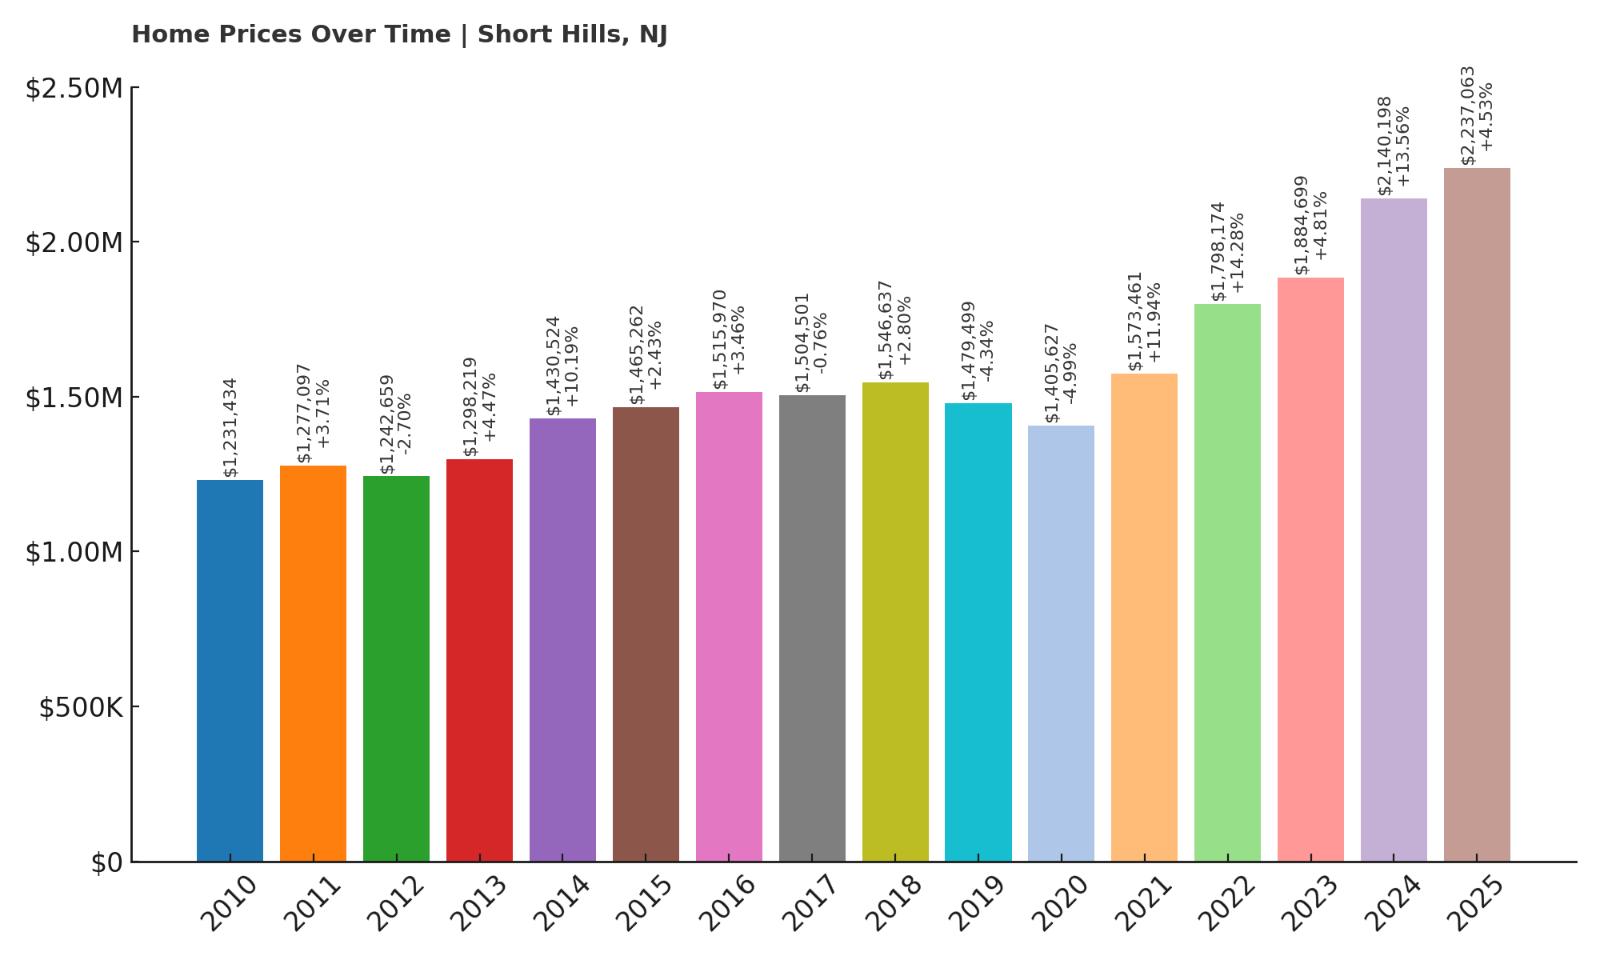
- 2010: $1,231,434
- 2011: $1,277,097 (+$45,663, +3.71% from previous year)
- 2012: $1,242,659 (-$34,438, -2.70% from previous year)
- 2013: $1,298,219 (+$55,560, +4.47% from previous year)
- 2014: $1,430,524 (+$132,305, +10.19% from previous year)
- 2015: $1,465,262 (+$34,738, +2.43% from previous year)
- 2016: $1,515,970 (+$50,708, +3.46% from previous year)
- 2017: $1,504,501 (-$11,469, -0.76% from previous year)
- 2018: $1,546,637 (+$42,136, +2.80% from previous year)
- 2019: $1,479,499 (-$67,138, -4.34% from previous year)
- 2020: $1,405,627 (-$73,872, -4.99% from previous year)
- 2021: $1,573,461 (+$167,834, +11.94% from previous year)
- 2022: $1,798,174 (+$224,713, +14.28% from previous year)
- 2023: $1,884,699 (+$86,525, +4.81% from previous year)
- 2024: $2,140,198 (+$255,499, +13.56% from previous year)
- 2025: $2,237,063 (+$96,865, +4.53% from previous year)
Short Hills has gained over 81% in home value since 2010, with recent years delivering particularly strong growth. A brief downturn around 2019 and 2020 gave way to an aggressive rebound, with prices rising by more than $665,000 between 2021 and 2024. The market now sits above $2.2 million, driven by persistent buyer interest in luxury suburban living. Despite some year-to-year volatility, the long-term trend is undeniably upward. Short Hills remains a top-tier housing market in northern New Jersey, with demand firmly outpacing supply in most seasons.
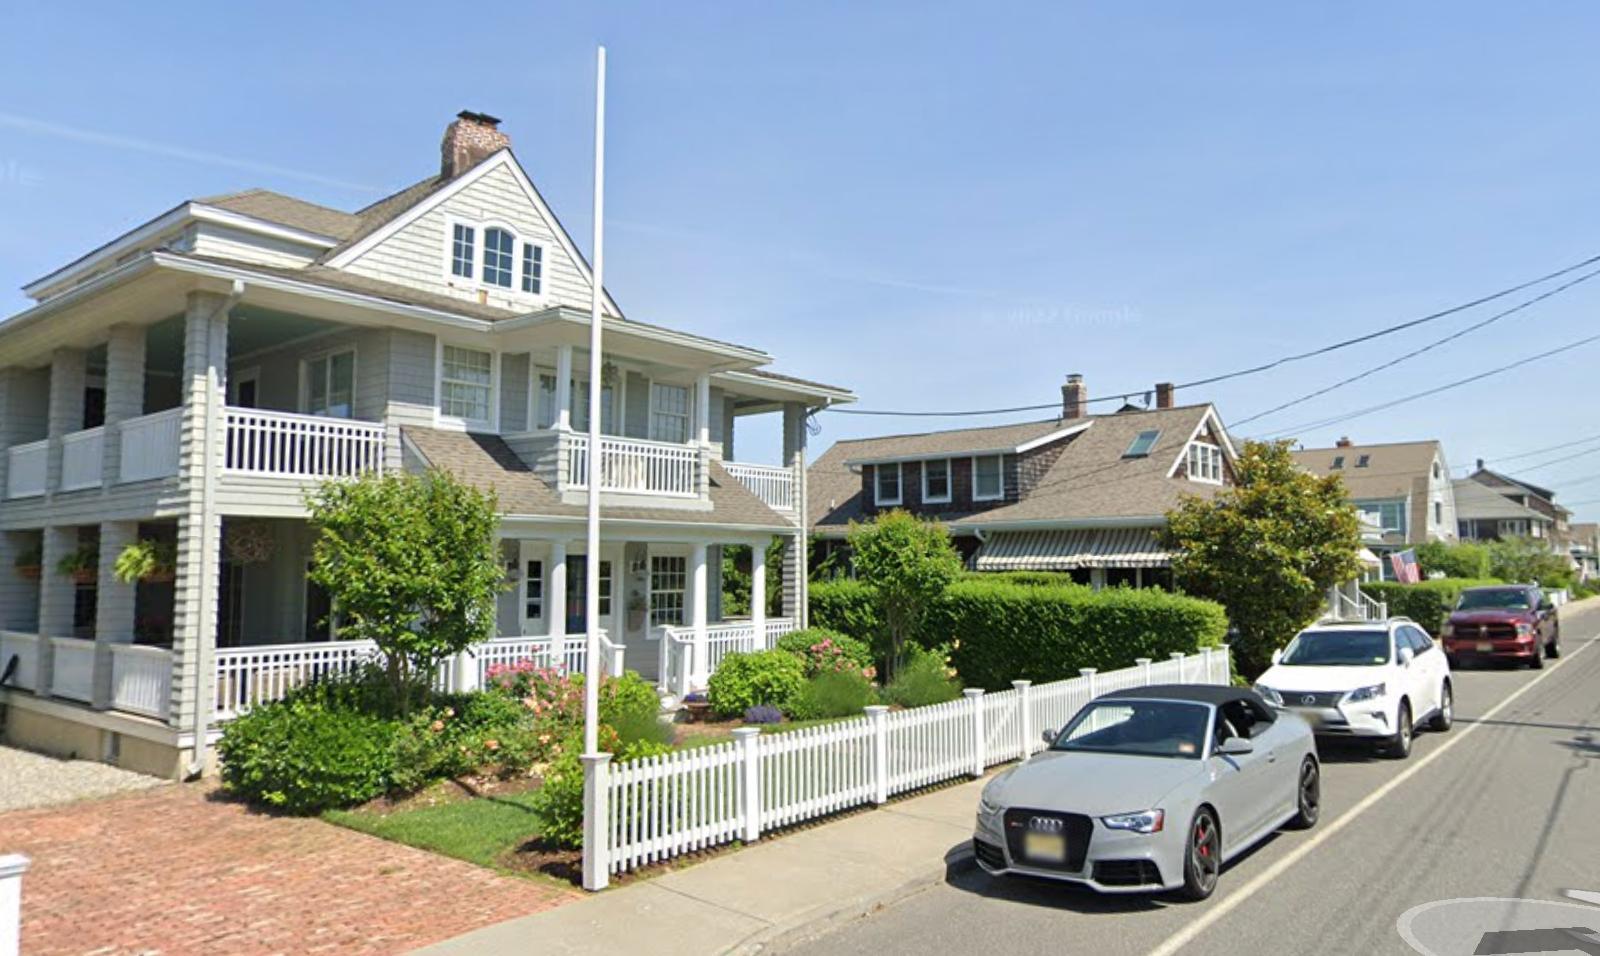
Short Hills – Suburban Luxury With Manhattan Access
Short Hills, a section of Millburn Township in Essex County, is one of the most affluent commuter suburbs in the tri-state area. With a direct train line to Manhattan and one of the highest-performing public school systems in the state, it attracts wealthy professionals seeking both prestige and practicality. The town features large, custom-built homes on manicured lots, with architecture ranging from colonial to modern. Its tree-lined streets, private clubs, and shopping at the Short Hills Mall add layers of convenience and status that keep demand strong across generations.
In recent years, the desire for space, top schools, and a safe, amenity-rich environment has only grown stronger. Buyers who once sought condos in the city are now turning to towns like Short Hills for larger homes and backyard living. Strict zoning and a resistance to dense development have helped preserve property values, even as other suburbs experience uneven pricing. With its balance of prestige and livability, Short Hills continues to lead the northern New Jersey housing market as a stable and highly desirable place to invest in real estate.
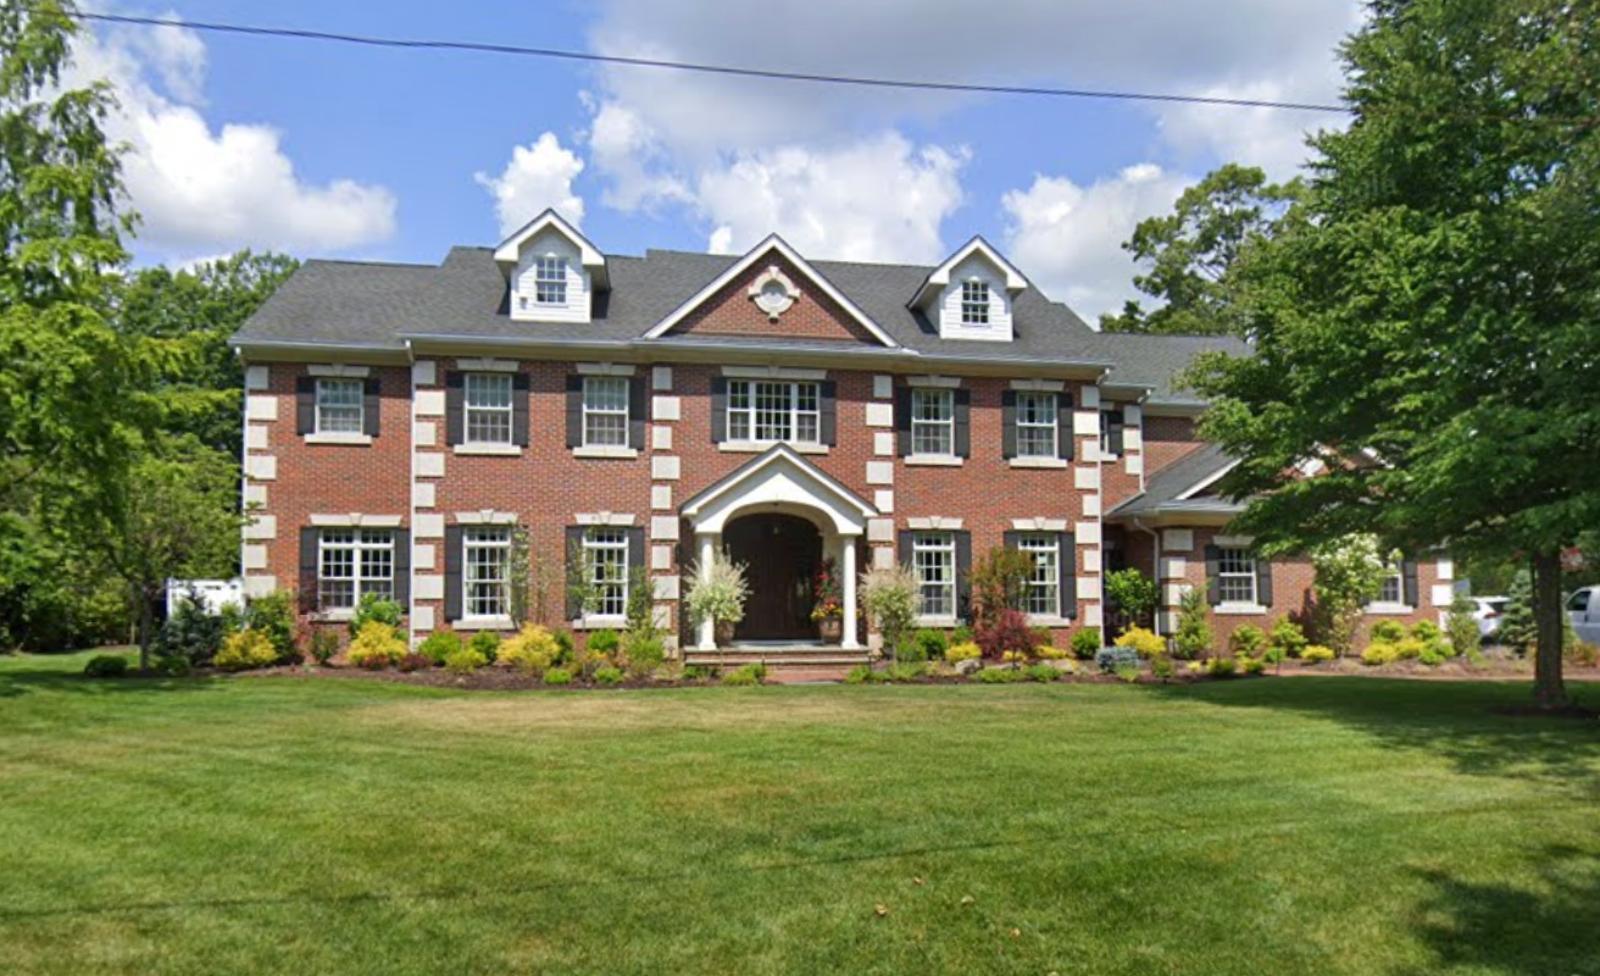
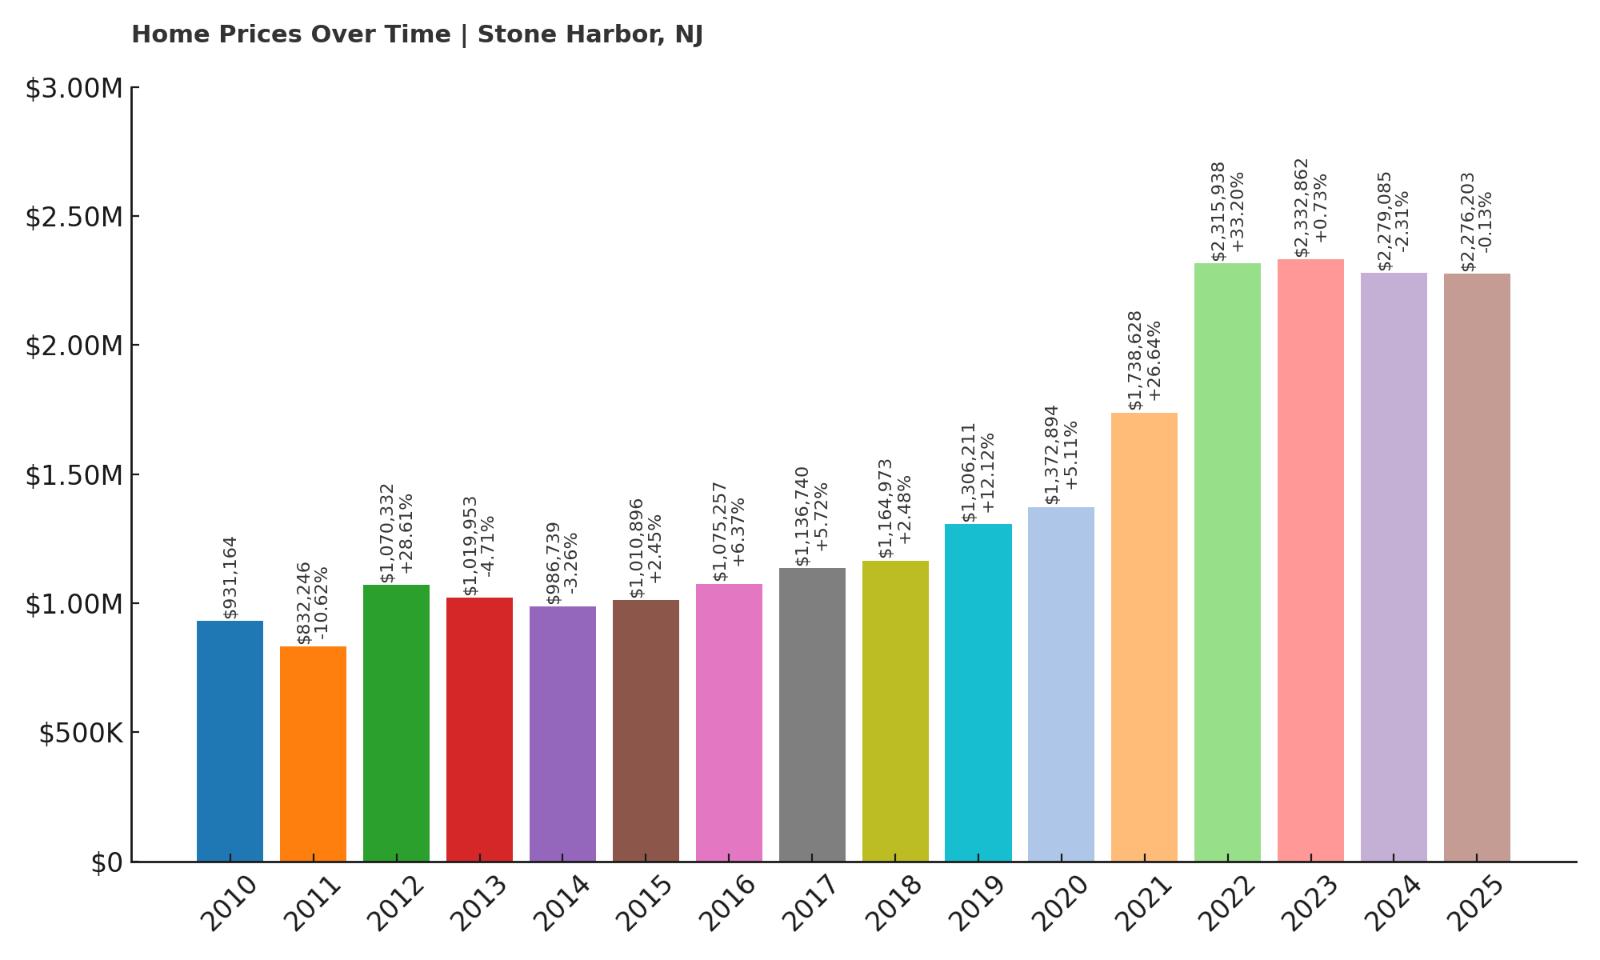
5. Stone Harbor – 144.39% Home Price Increase Since May 2010
🔥 Would you like to save this?
- 2010: $931,164
- 2011: $832,246 (-$98,918, -10.62% from previous year)
- 2012: $1,070,332 (+$238,086, +28.61% from previous year)
- 2013: $1,019,953 (-$50,379, -4.71% from previous year)
- 2014: $986,739 (-$33,214, -3.26% from previous year)
- 2015: $1,010,896 (+$24,157, +2.45% from previous year)
- 2016: $1,075,257 (+$64,361, +6.37% from previous year)
- 2017: $1,136,740 (+$61,483, +5.72% from previous year)
- 2018: $1,164,973 (+$28,233, +2.48% from previous year)
- 2019: $1,306,211 (+$141,238, +12.12% from previous year)
- 2020: $1,372,894 (+$66,683, +5.11% from previous year)
- 2021: $1,738,628 (+$365,734, +26.64% from previous year)
- 2022: $2,315,938 (+$577,310, +33.20% from previous year)
- 2023: $2,332,862 (+$16,924, +0.73% from previous year)
- 2024: $2,279,085 (-$53,777, -2.31% from previous year)
- 2025: $2,276,203 (-$2,882, -0.13% from previous year)
Home prices in Stone Harbor have more than doubled since 2010, with a total increase of over 144%. After early volatility, values began rising steadily, especially during the explosive 2021–2022 period, when prices jumped by nearly $1 million in just two years. While the last couple of years showed minor declines, the market appears to be stabilizing at a high plateau near $2.28 million. The long-term growth reflects sustained luxury demand and limited inventory in this iconic Jersey Shore destination.
Stone Harbor – Elite Coastal Living With Historic Charm
Stone Harbor is one of the crown jewels of the Jersey Shore, located on Seven Mile Island and sharing the barrier with Avalon. Known for its clean beaches, upscale boutiques, and a community that leans toward understated luxury, it’s long been a magnet for affluent vacationers and second-home buyers. Strict zoning laws limit building heights and density, which helps protect ocean views and preserve the town’s quiet, village-like atmosphere. Unlike many other resort towns, Stone Harbor has no boardwalk, adding to its refined, low-key appeal.
The town’s real estate market is defined by scarcity—whether it’s oceanfront, bayfront, or inland. Homes here tend to be large, custom-built, and outfitted for year-round comfort, with many newer constructions replacing aging properties. High demand and limited supply keep prices elevated, even in years of economic uncertainty. The massive price gains seen during the pandemic reflect a renewed interest in private beachfront living, and while recent dips suggest a cooling, it’s more likely a return to equilibrium than a drop in desirability. Stone Harbor remains one of New Jersey’s most sought-after addresses.
4. Avalon – 183.39% Home Price Increase Since May 2010

- 2010: $911,810
- 2011: $676,366 (-$235,444, -25.82% from previous year)
- 2012: $957,204 (+$280,838, +41.52% from previous year)
- 2013: $1,055,255 (+$98,051, +10.24% from previous year)
- 2014: $1,124,965 (+$69,710, +6.61% from previous year)
- 2015: $1,135,446 (+$10,481, +0.93% from previous year)
- 2016: $1,197,015 (+$61,569, +5.42% from previous year)
- 2017: $1,256,004 (+$58,989, +4.93% from previous year)
- 2018: $1,298,071 (+$42,067, +3.35% from previous year)
- 2019: $1,494,808 (+$196,737, +15.16% from previous year)
- 2020: $1,586,600 (+$91,792, +6.14% from previous year)
- 2021: $1,981,942 (+$395,342, +24.92% from previous year)
- 2022: $2,612,004 (+$630,062, +31.79% from previous year)
- 2023: $2,627,683 (+$15,679, +0.60% from previous year)
- 2024: $2,595,399 (-$32,284, -1.23% from previous year)
- 2025: $2,584,007 (-$11,392, -0.44% from previous year)
Home values in Avalon have skyrocketed by more than 183% since 2010, with some of the largest gains concentrated between 2019 and 2022. In that three-year period, prices surged by over $1.1 million. Though the past two years showed slight decreases, the overall market remains one of the most expensive in the state at over $2.58 million. These small dips follow a period of rapid growth and may represent a normalization more than a decline. Avalon’s luxury status appears secure for the long run.
Avalon – High-End Real Estate on a Premier Barrier Island
Avalon shares Seven Mile Island with Stone Harbor, and together they form one of New Jersey’s most elite coastal stretches. Avalon is known for its deep lots, architectural consistency, and wide beaches, all of which contribute to its high property values. The town also emphasizes conservation and low-impact development, which helps preserve open space and protect its natural environment. Most of the town is residential, and many homeowners treat Avalon as a multi-generational family retreat.
The pandemic supercharged Avalon’s housing market, as affluent buyers sought private, well-appointed homes away from crowded cities. Oceanfront homes here can exceed $10 million, but even modest inland properties command seven figures. Buyers are drawn by both the physical beauty of the town and its exclusivity—Avalon feels like a private club, with little transient traffic and tightly held inventory. As prices settle after the post-pandemic boom, Avalon remains a benchmark for high-end coastal living in the Northeast.
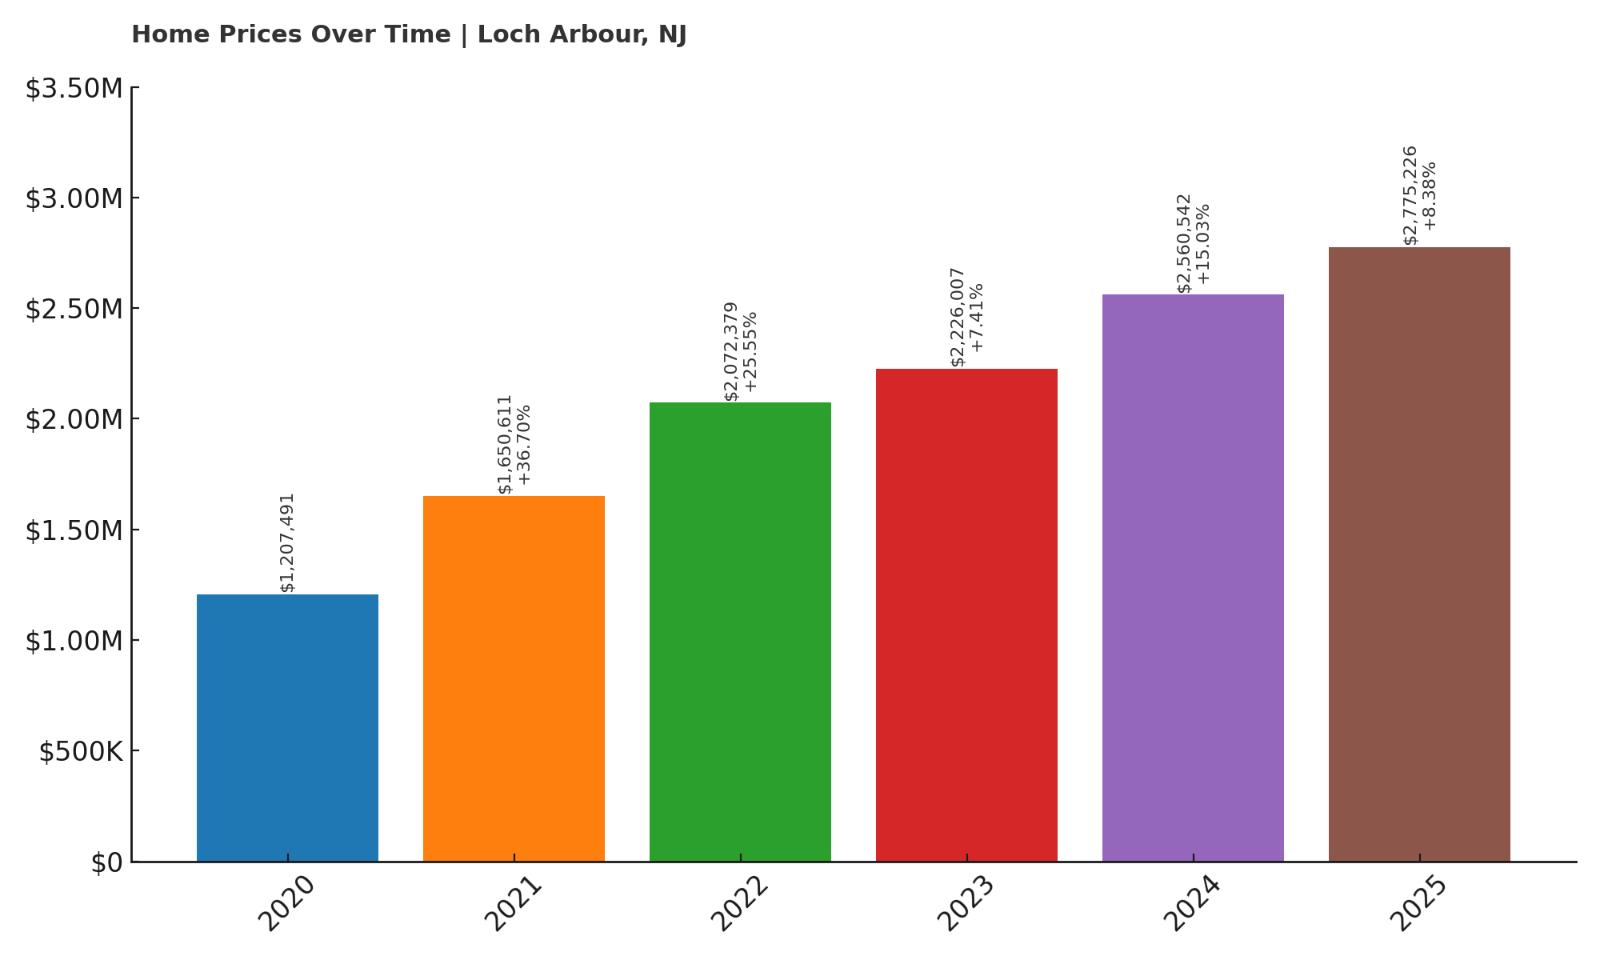
3. Loch Arbour – 129.88% Home Price Increase Since May 2020
- 2010: N/A
- 2011: N/A
- 2012: N/A
- 2013: N/A
- 2014: N/A
- 2015: N/A
- 2016: N/A
- 2017: N/A
- 2018: N/A
- 2019: N/A
- 2020: $1,207,491
- 2021: $1,650,611 (+$443,120, +36.70% from previous year)
- 2022: $2,072,379 (+$421,768, +25.55% from previous year)
- 2023: $2,226,007 (+$153,628, +7.41% from previous year)
- 2024: $2,560,542 (+$334,535, +15.03% from previous year)
- 2025: $2,775,226 (+$214,684, +8.38% from previous year)
Loch Arbour home values have risen nearly 130% since 2020, reflecting one of the fastest recent growth spurts in the state. Starting at $1.2 million in 2020, prices soared by more than $1.5 million over just five years. The surge includes consecutive double-digit percentage increases and speaks to the dramatic revaluation of small, exclusive towns in the post-pandemic market. As of 2025, median home values are approaching $2.8 million, putting Loch Arbour in the very top tier of New Jersey real estate.
Loch Arbour – A Tiny Village With Outsized Value
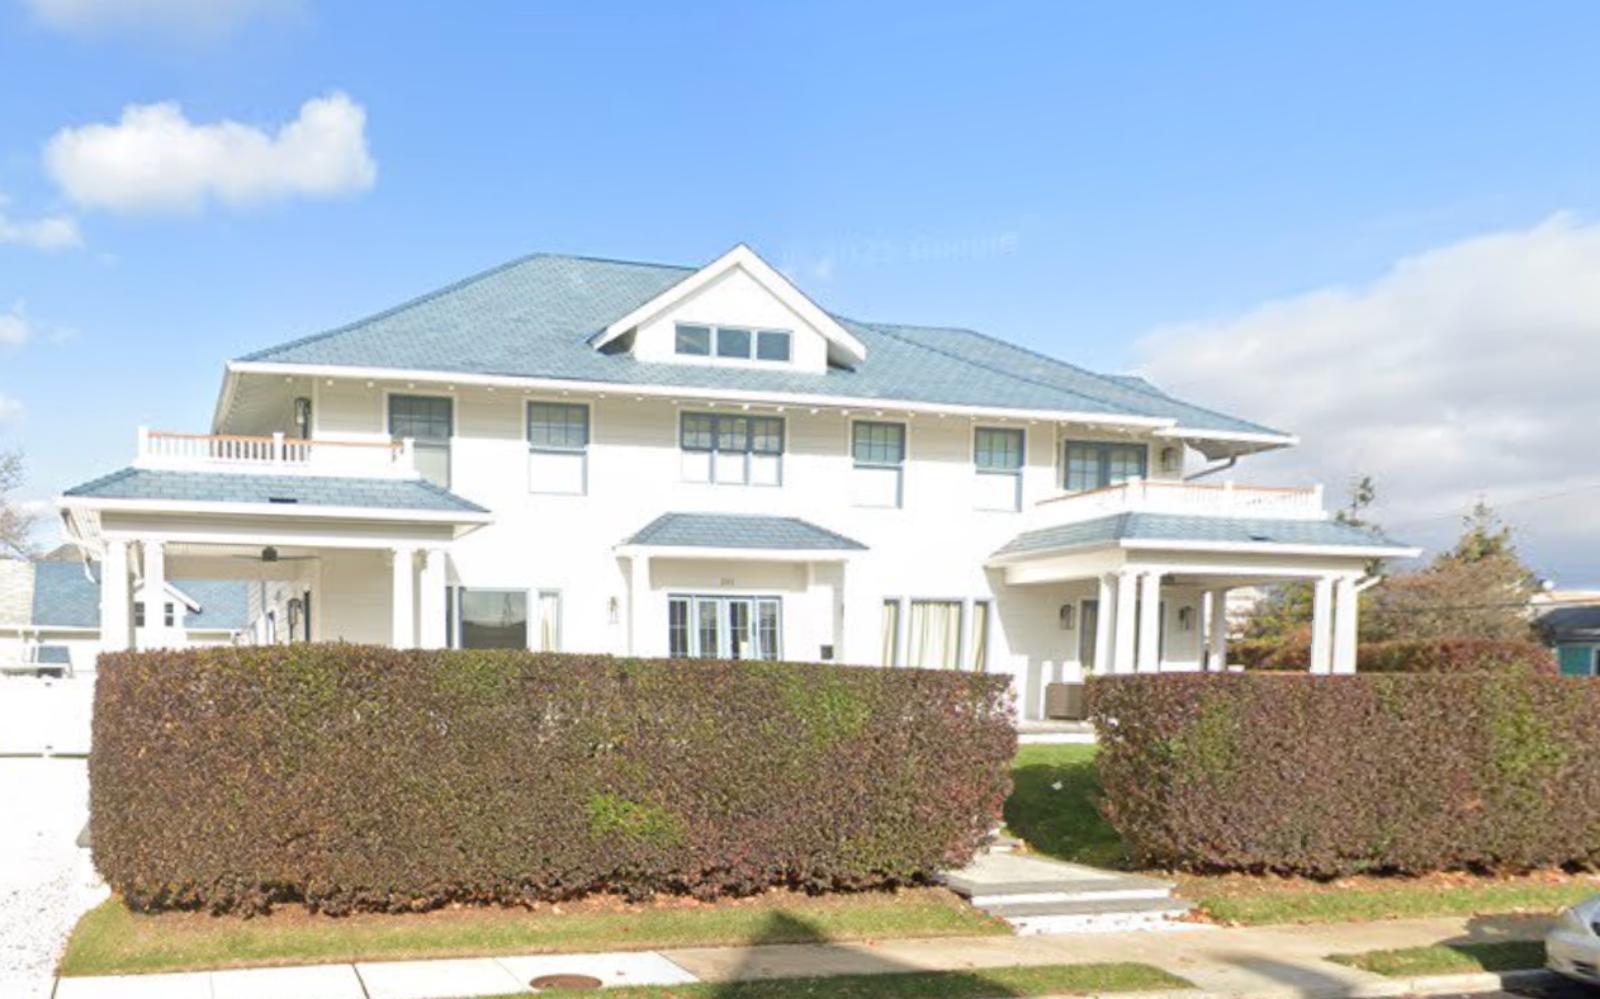
Loch Arbour is one of the smallest municipalities in New Jersey, both by population and land area, but its real estate punches well above its weight. Located along the Atlantic Ocean just north of Asbury Park, this tiny village offers quiet residential streets, direct beach access, and a uniquely private feel. Its small size—under 200 residents—means extremely limited housing supply, which only intensifies price competition among wealthy buyers seeking low-density living along the shore.
Many homes in Loch Arbour are custom-designed and sit on generous lots for such a compact location. The town’s proximity to urban centers and lifestyle hotspots like Asbury Park adds to its appeal. With so few transactions annually, even modest increases in demand can dramatically impact values, as seen in the last five years. Loch Arbour’s trajectory proves that exclusivity and scarcity are powerful drivers of real estate value.
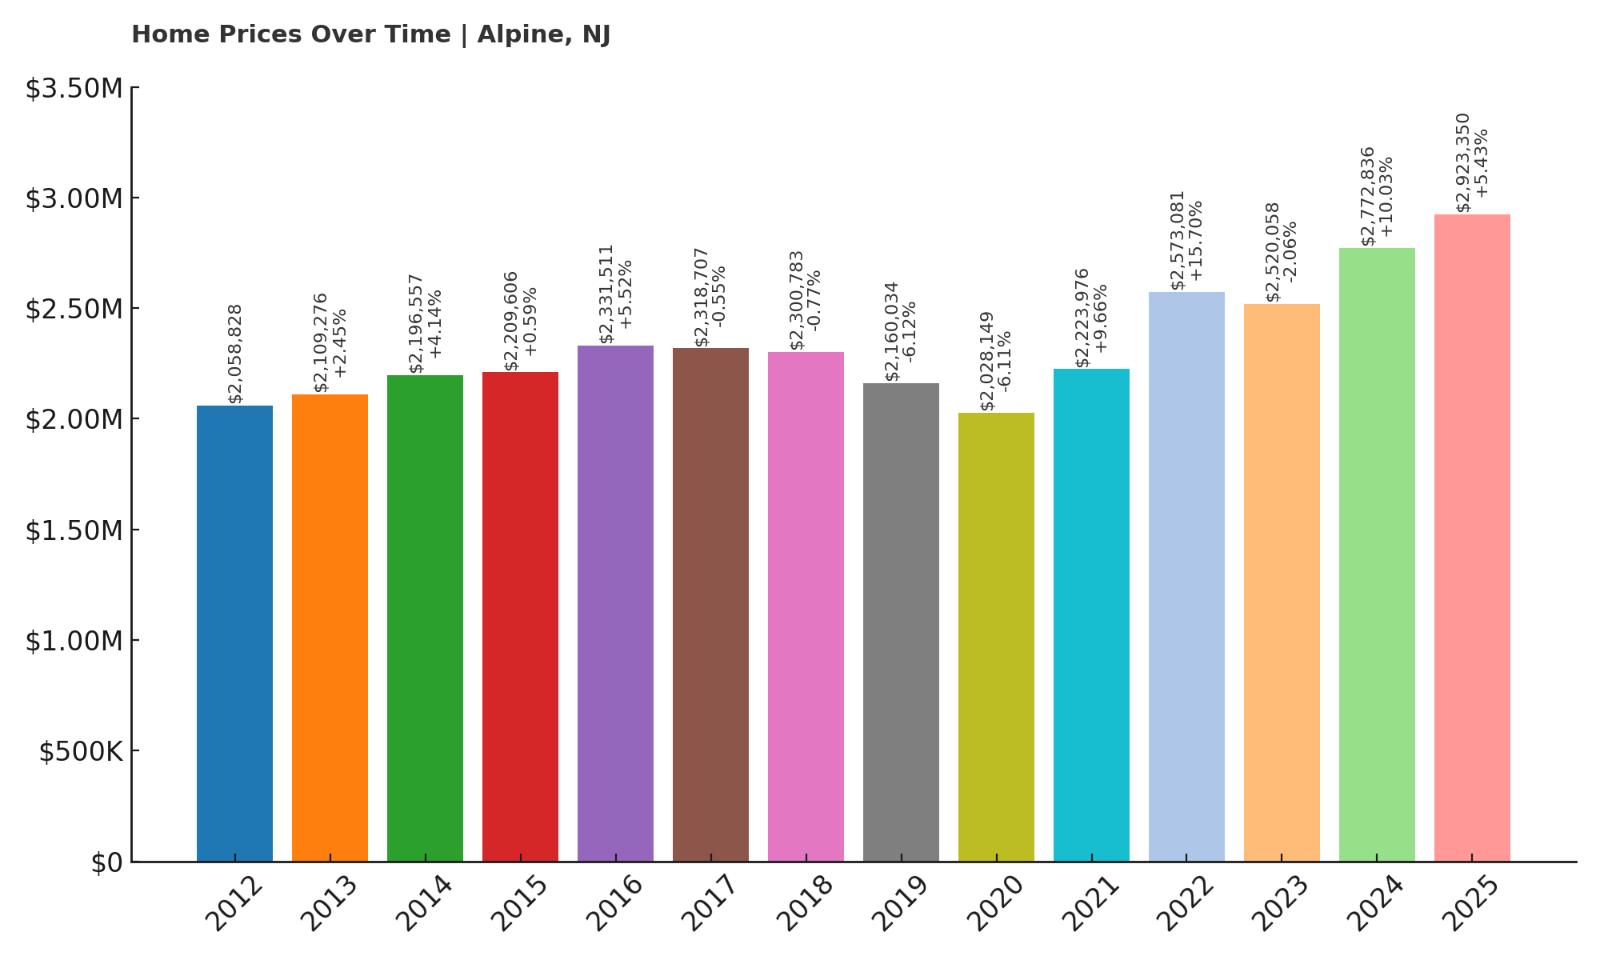
2. Alpine – 41.96% Home Price Increase Since May 2012
- 2010: N/A
- 2011: N/A
- 2012: $2,058,828
- 2013: $2,109,276 (+$50,448, +2.45% from previous year)
- 2014: $2,196,557 (+$87,281, +4.14% from previous year)
- 2015: $2,209,606 (+$13,049, +0.59% from previous year)
- 2016: $2,331,511 (+$121,905, +5.52% from previous year)
- 2017: $2,318,707 (-$12,804, -0.55% from previous year)
- 2018: $2,300,783 (-$17,924, -0.77% from previous year)
- 2019: $2,160,034 (-$140,749, -6.12% from previous year)
- 2020: $2,028,149 (-$131,885, -6.11% from previous year)
- 2021: $2,223,976 (+$195,827, +9.66% from previous year)
- 2022: $2,573,081 (+$349,105, +15.70% from previous year)
- 2023: $2,520,058 (-$53,023, -2.06% from previous year)
- 2024: $2,772,836 (+$252,778, +10.03% from previous year)
- 2025: $2,923,350 (+$150,514, +5.43% from previous year)
Home prices in Alpine have risen nearly 42% since 2012, despite some significant dips in the late 2010s. The past few years, however, have brought strong and consistent growth, with values rising by nearly $900,000 since 2020. This recent resurgence suggests Alpine is regaining momentum in the ultra-luxury market. As of 2025, the median price sits just under $3 million, making it one of the costliest zip codes in New Jersey.
Alpine – Ultra-Luxury Living With NYC Views
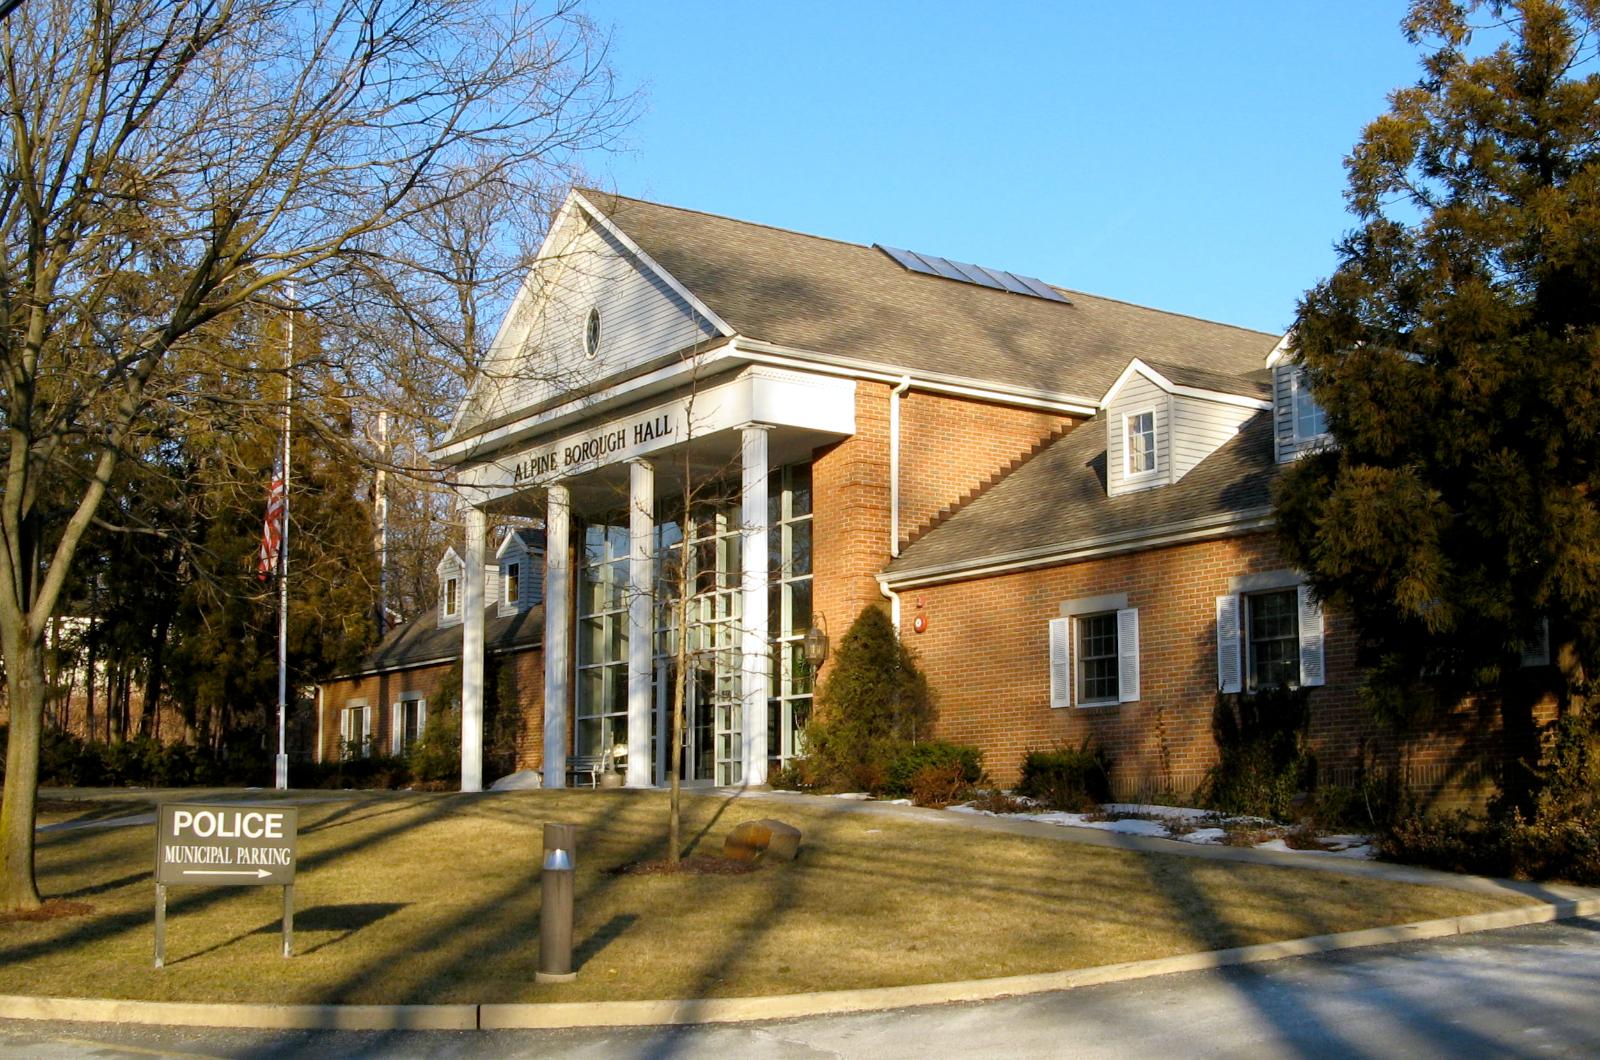
Alpine has long been known as one of New Jersey’s most prestigious communities, consistently ranking among the wealthiest towns in America. Located in Bergen County and less than 10 miles from Manhattan, it combines secluded, wooded estates with easy access to city amenities. Properties here often exceed 10,000 square feet, with private gates, expansive grounds, and commanding views of the Palisades or Hudson River. This is where celebrities, CEOs, and global elites go when they want luxury without the spotlight.
With no commercial zoning and a population of just a few thousand, Alpine retains a quiet, country-like feel that contrasts sharply with its wealth. The town’s school system, security, and strict zoning codes add to its desirability. Though the market slowed in the mid-2010s, post-pandemic demand for privacy and mega-mansions has brought Alpine back into focus. Its long-term appeal is built on space, discretion, and proximity to power.
1. Deal – 149.15% Home Price Increase Since May 2010
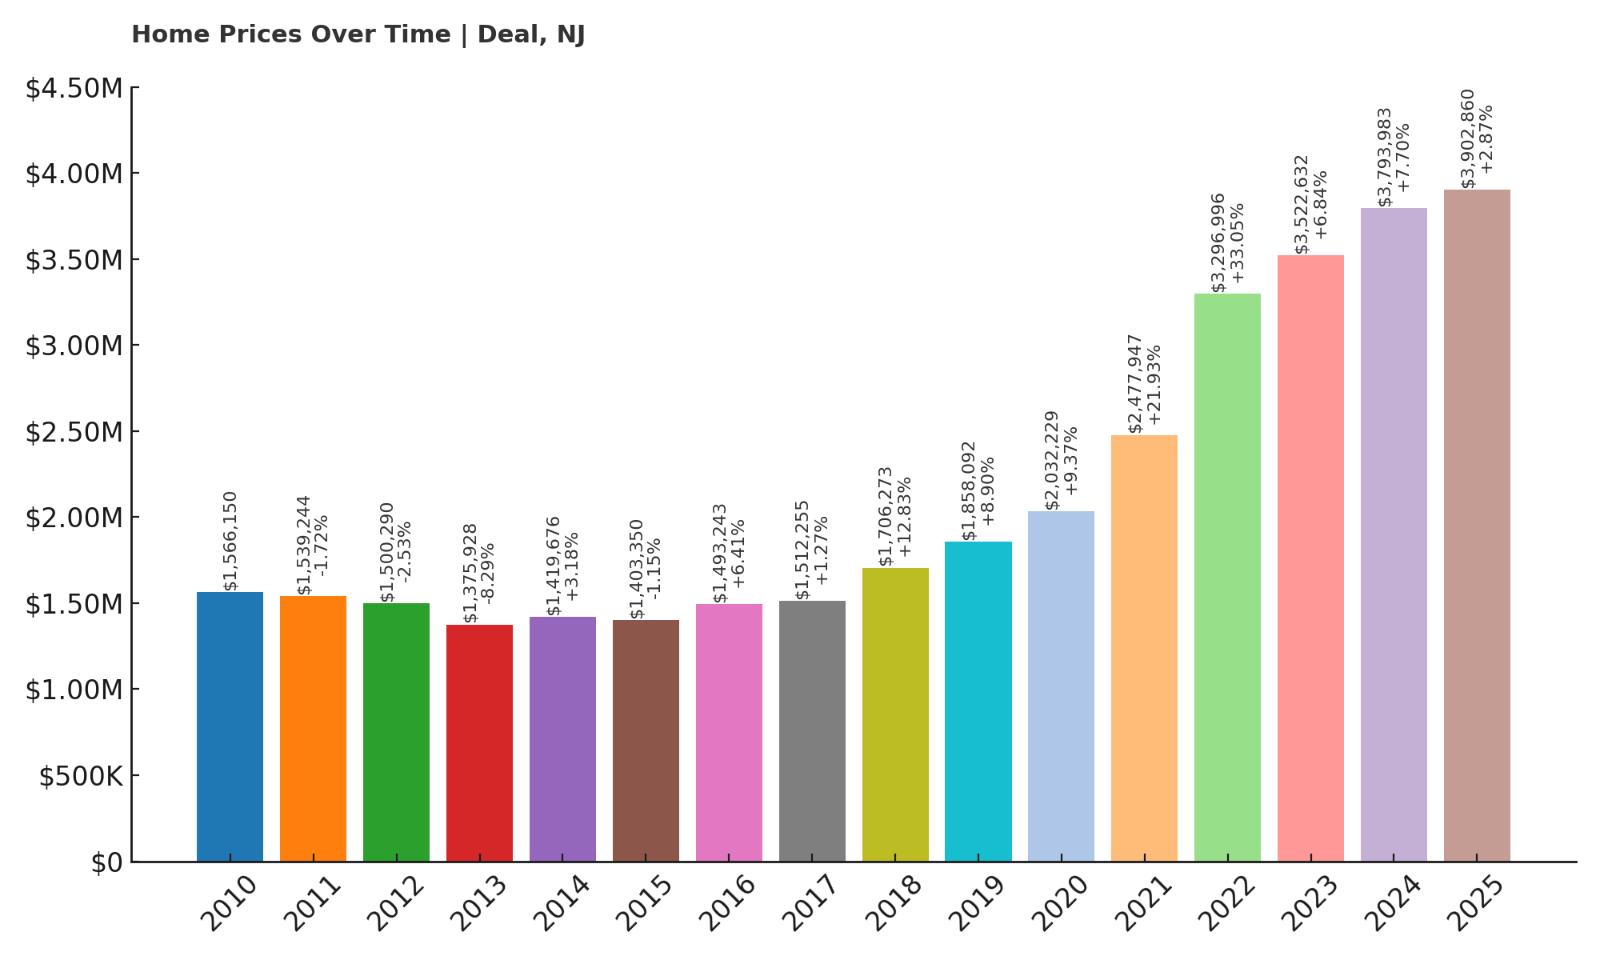
- 2010: $1,566,150
- 2011: $1,539,244 (-$26,906, -1.72% from previous year)
- 2012: $1,500,290 (-$38,954, -2.53% from previous year)
- 2013: $1,375,928 (-$124,362, -8.29% from previous year)
- 2014: $1,419,676 (+$43,748, +3.18% from previous year)
- 2015: $1,403,350 (-$16,326, -1.15% from previous year)
- 2016: $1,493,243 (+$89,893, +6.41% from previous year)
- 2017: $1,512,255 (+$19,012, +1.27% from previous year)
- 2018: $1,706,273 (+$194,018, +12.83% from previous year)
- 2019: $1,858,092 (+$151,819, +8.90% from previous year)
- 2020: $2,032,229 (+$174,137, +9.37% from previous year)
- 2021: $2,477,947 (+$445,718, +21.93% from previous year)
- 2022: $3,296,996 (+$819,049, +33.05% from previous year)
- 2023: $3,522,632 (+$225,636, +6.84% from previous year)
- 2024: $3,793,983 (+$271,351, +7.70% from previous year)
- 2025: $3,902,860 (+$108,877, +2.87% from previous year)
Deal has posted the highest home values in New Jersey in 2025, with prices climbing by nearly 150% since 2010. The town saw dramatic increases during the pandemic-era housing boom, with a massive $819,000 gain in 2022 alone. Home values now exceed $3.9 million, capping more than a decade of steep appreciation. What was once a quiet luxury community has rapidly become a housing market powerhouse on the national scale.
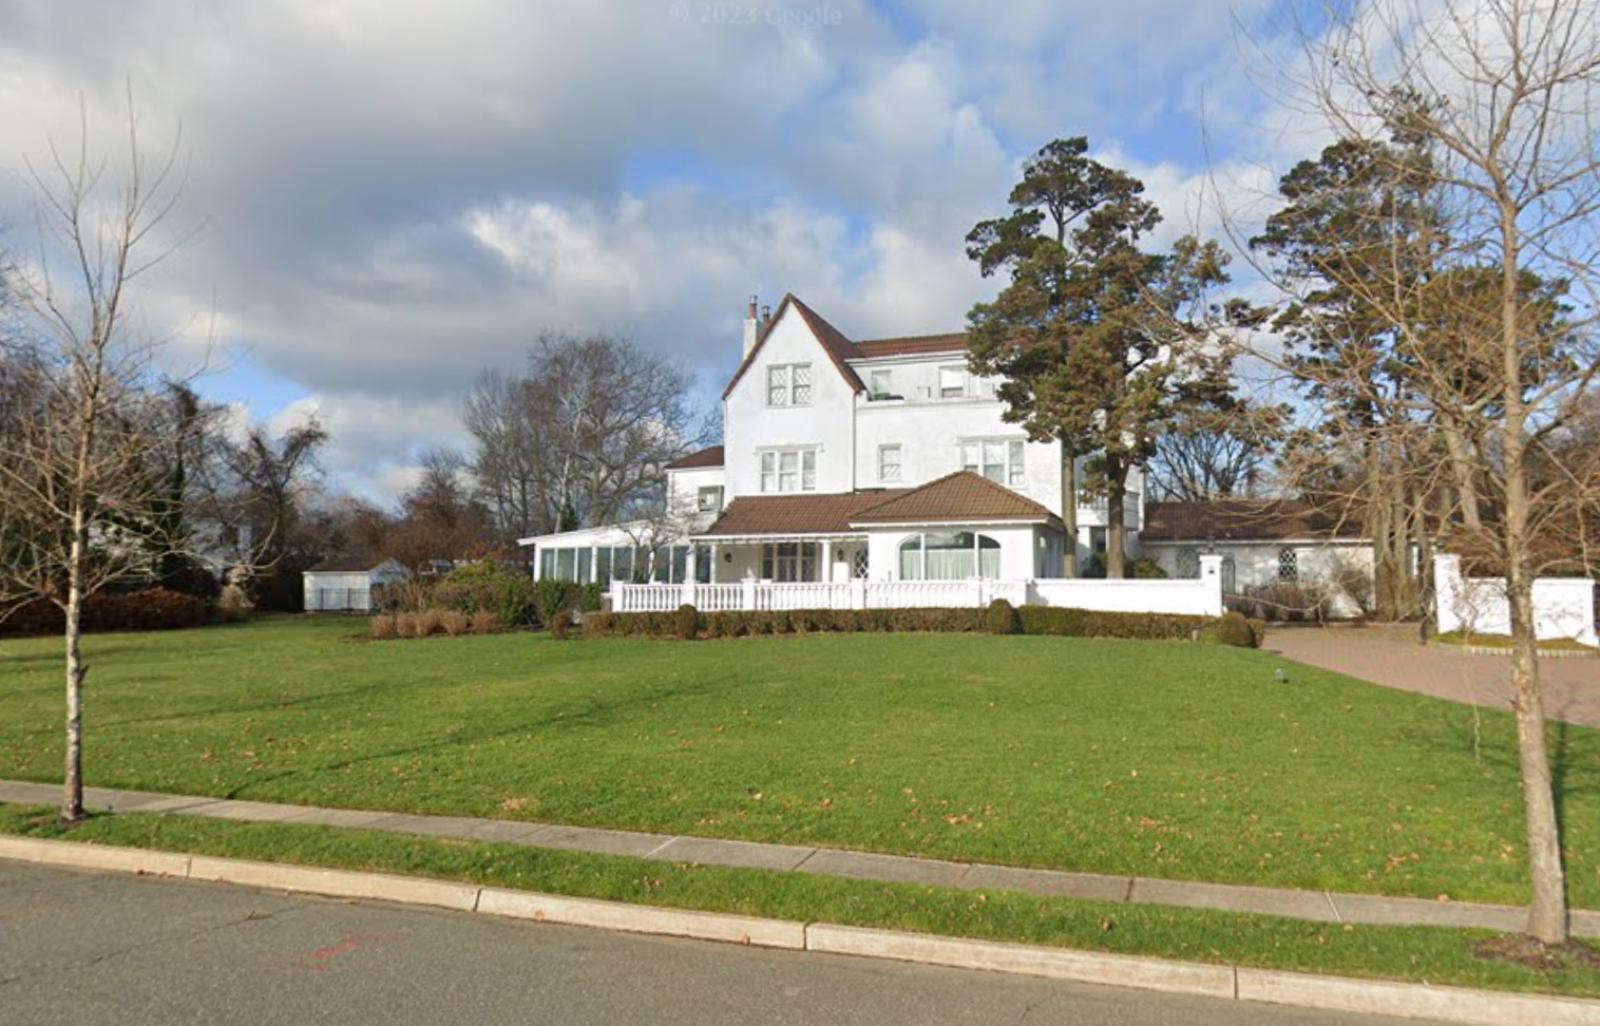
Deal – The Most Expensive Town in New Jersey
🔥 Would you like to save this?
Located in Monmouth County on the Atlantic coast, Deal has earned a reputation as a discreet enclave for ultra-wealthy families, particularly among New York’s Syrian Jewish community. Many homes here are seasonal residences, but they feature year-round luxury—grand entrances, pools, tennis courts, and meticulously landscaped grounds. With only about 1,000 year-round residents and strict zoning laws, the town maintains a rare combination of oceanfront living and total privacy.
Demand exploded in recent years, fueled by limited listings, rising construction quality, and soaring interest in New Jersey shore towns among high-net-worth buyers. Deal is home to some of the largest private properties on the state’s coastline. Even modest-sized homes now trade for millions. With no commercial zoning and minimal public traffic, it offers an exclusive environment that is nearly impossible to replicate. As of 2025, Deal stands firmly as the most expensive housing market in New Jersey.


