🔥 Would you like to save this?
After years of growth, Connecticut’s housing market is starting to show signs of strain in some unexpected places. By examining 15 years of Zillow data, we’ve identified 17 towns where home values may be poised for a downturn in 2025. These areas stand out for a mix of overvaluation, price stagnation, historic crash patterns, and high volatility—warning signals that echo past market corrections. Whether it’s high-end coastal enclaves or overheated commuter suburbs, the next shift may hit closer to home than many expect.
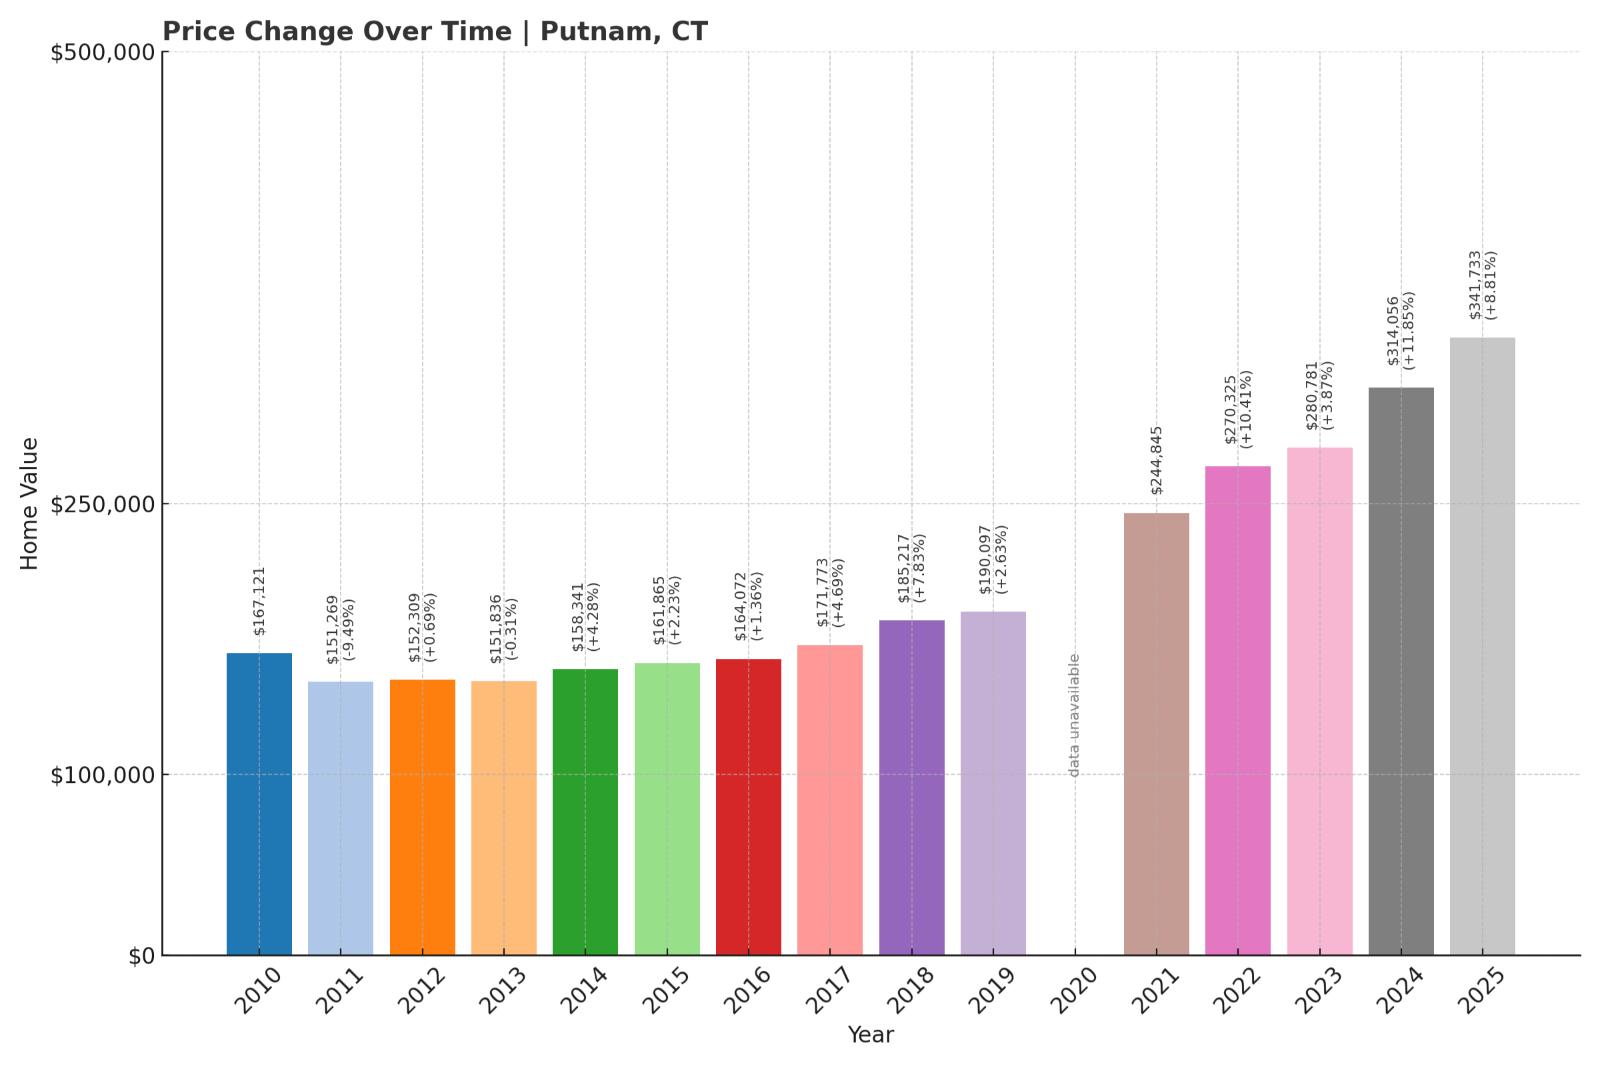
17. Putnam – Crash Risk Percentage: 79%
- Crash Risk Percentage: 79%
- Historical crashes (8%+ drops): 2
- Worst historical crash: -12.65% (2009)
- Total price increase since 2000: 240.91%
- Overextended above long-term average: 83.69%
- Price volatility (annual swings): 6.97%
- Current 2025 price: $341,733.37
Putnam’s housing market shows concerning signs of instability with two significant historical crashes exceeding 8%. The town’s current prices sit almost 84% above the long-term average, suggesting an unsustainable bubble that could be primed for correction. With annual price swings averaging nearly 7%, this northeastern Connecticut community has demonstrated a pattern of volatility that increases vulnerability to sudden downturns.
In order to come up with the very specific design ideas, we create most designs with the assistance of state-of-the-art AI interior design software.
Putnam – A Repeat Offender With Dangerous Overextension

Located in Connecticut’s “Quiet Corner,” Putnam sits along the Quinebaug River in Windham County. The town has experienced dramatic price growth since 2000, with a total increase of nearly 241% pushing values to levels that appear mathematically unsustainable. According to the Connecticut Department of Economic and Community Development, Putnam has a population of approximately 9,400 residents and a median household income significantly below state averages, creating a disconnect between local buying power and current home prices.
The town’s 2009 crash of -12.65% offers a sobering reminder of how quickly values can plummet in this market. With housing costs now 83.69% above the long-term trend line and economic growth not keeping pace, Putnam checks multiple boxes in our vulnerability model, suggesting the same warning signs that preceded previous corrections are reappearing in 2025.
16. Harwinton – Crash Risk Percentage: 79%

- Crash Risk Percentage: 79%
- Historical crashes (8%+ drops): 2
- Worst historical crash: -8.65% (2010)
- Total price increase since 2000: 178.03%
- Overextended above long-term average: 63.53%
- Price volatility (annual swings): 6.17%
- Current 2025 price: $443,264.83
Harwinton’s housing market has experienced two significant crashes since 2000, indicating a pattern of volatility that could signal trouble ahead. With current prices over 63% above the long-term average and annual price swings exceeding 6%, the rural community shows classic signs of overextension. The $443,264 median home price has reached levels that are increasingly disconnected from local economic fundamentals, setting the stage for a potential correction.
Harwinton – Rural Charm With Urban-Level Price Inflation

Nestled in Litchfield County, Harwinton is a quintessential rural Connecticut town with just under 5,500 residents. The town’s appeal comes from its scenic landscapes and proximity to both Hartford and Waterbury, making it attractive to commuters seeking countryside living. According to the Connecticut Economic Resource Center, Harwinton’s median household income hovers around $98,000, which is above the state average but insufficient to support the rapid price acceleration.
The town’s housing market experienced an 8.65% drop in 2010, and data from the Connecticut Association of Realtors shows new construction has not kept pace with demand, creating artificial scarcity. With prices now 63.53% above trend and inventory levels at historic lows according to local real estate boards, Harwinton’s housing market has entered dangerous territory where even small changes in buyer sentiment could trigger a significant correction.
15. Bethlehem – Crash Risk Percentage: 79%

- Crash Risk Percentage: 79%
- Historical crashes (8%+ drops): 2
- Worst historical crash: -8.97% (2010)
- Total price increase since 2000: 176.72%
- Overextended above long-term average: 64.17%
- Price volatility (annual swings): 6.42%
- Current 2025 price: $516,486.31
Bethlehem has experienced two significant housing market crashes since 2000, with prices dropping nearly 9% during the worst downturn. The current market shows alarming signs of instability with prices overextended by more than 64% above the long-term average. With a current median home price of $516,486 and consistent annual price volatility of 6.42%, Bethlehem’s market appears increasingly vulnerable to correction.
Bethlehem – Small Town Appeal With Big Price Problems

Bethlehem is a small rural community in Litchfield County with approximately 3,500 residents. The town’s appeal stems from its picturesque New England charm, agricultural heritage, and the annual Christmas Town Festival that draws visitors from across the Northeast. According to the Connecticut Department of Labor, Bethlehem’s economy remains primarily residential with limited local employment, making it heavily dependent on commuters to Waterbury and other employment centers.
Since 2000, Bethlehem’s housing prices have skyrocketed by nearly 177%, far outpacing local income growth, which the U.S. Census Bureau reports at just 57% over the same period. The town’s building restrictions and zoning regulations have limited new housing development, creating artificial scarcity that has pushed prices to unsustainable levels. With homes now 64.17% above the long-term trend line and showing signs of momentum loss in recent quarters, Bethlehem exhibits classic pre-correction warning signs similar to those seen before its 2010 crash.
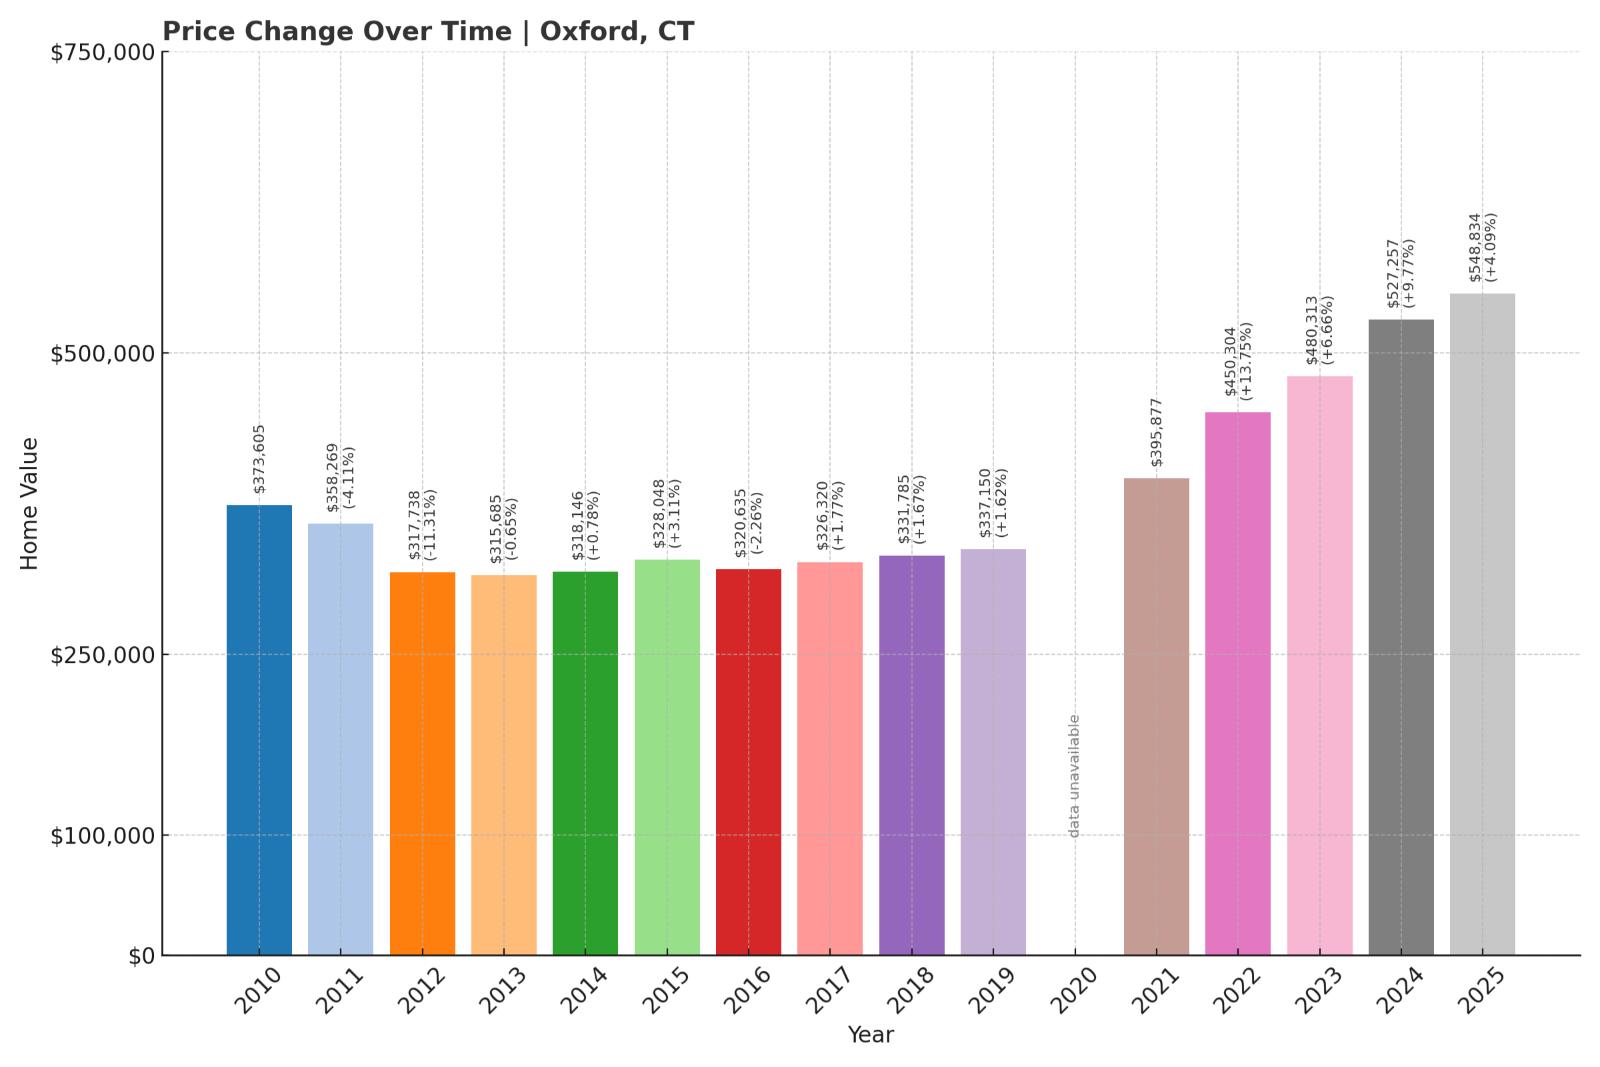
14. Oxford – Crash Risk Percentage: 79%
- Crash Risk Percentage: 79%
- Historical crashes (8%+ drops): 2
- Worst historical crash: -11.31% (2012)
- Total price increase since 2000: 120.51%
- Overextended above long-term average: 45.07%
- Price volatility (annual swings): 6.48%
- Current 2025 price: $548,833.50
Oxford’s housing market has shown concerning cyclical behavior with two major crashes since 2000, including a significant 11.31% drop in 2012. Current prices sit more than 45% above the long-term trend line, indicating potential overvaluation. With annual price swings averaging 6.48% and median home values approaching $550,000, the market shows classic signs of instability despite more modest long-term appreciation compared to other vulnerable Connecticut towns.
Oxford – Late Crashes And Lagging Recovery Signals

Located in western New Haven County, Oxford has transformed from a farming community to a bedroom suburb with approximately 13,000 residents. The town experienced robust development in the early 2000s, but according to the Connecticut Department of Economic and Community Development, local job growth has not kept pace with housing expansion. Oxford’s late crash in 2012 (occurring three years after most Connecticut markets bottomed out) suggests the town may be particularly susceptible to delayed economic impacts.
Oxford’s current price of $548,833 represents a 120.51% increase since 2000, which is substantial but more moderate than some neighboring communities. However, the Federal Reserve Bank of Boston reports that Oxford’s household income growth has averaged just 2.2% annually over the same period, creating an expanding affordability gap. With prices now 45.07% above the trend line and inventory levels rising according to the Connecticut Multiple Listing Service, Oxford shows multiple warning signs of a market losing momentum and potentially heading for correction.
13. Kent – Crash Risk Percentage: 79%

- Crash Risk Percentage: 79%
- Historical crashes (8%+ drops): 1
- Worst historical crash: -9.42% (2012)
- Total price increase since 2000: 204.67%
- Overextended above long-term average: 65.89%
- Price volatility (annual swings): 6.34%
- Current 2025 price: $606,117.39
Kent’s housing market shows concerning signs of overheating despite experiencing only one major crash since 2000. The current price level sits nearly 66% above the long-term average, suggesting significant overvaluation. With prices tripling since 2000 and consistent annual volatility exceeding 6%, Kent demonstrates the classic pattern of a luxury market potentially reaching its ceiling. The 2012 crash of over 9% demonstrates this market’s potential for rapid correction when sentiment shifts.
Kent – Luxury Weekend Market With Weakening Fundamentals

Kent is a picturesque town in western Connecticut known for its covered bridges, waterfalls, and prestigious private schools including Kent School. With a permanent population of only about 3,000 residents, Kent’s housing market is heavily influenced by second-home buyers and wealthy New Yorkers seeking weekend retreats. According to data from the Connecticut Department of Revenue Services, approximately 32% of Kent’s properties are non-primary residences, making the market particularly vulnerable to shifts in discretionary spending.
The town’s median home price has surged to $606,117, representing a staggering 204.67% increase since 2000. The U.S. Census Bureau reports Kent’s median household income at approximately $89,000, creating a severe disconnect between local earning power and housing costs. With properties now 65.89% above the long-term average and interest rates rising, Kent is experiencing declining transaction volume according to the Connecticut REALTORS Association. This combination of factors—luxury market exposure, weak local fundamentals, and significant overextension—places Kent at high risk for a price correction similar to or exceeding its 9.42% drop in 2012.
12. Weston – Crash Risk Percentage: 79%

- Crash Risk Percentage: 79%
- Historical crashes (8%+ drops): 1
- Worst historical crash: -12.90% (2009)
- Total price increase since 2000: 105.08%
- Overextended above long-term average: 45.20%
- Price volatility (annual swings): 5.78%
- Current 2025 price: $1,338,606.58
Weston’s housing market demonstrates the fragility that can exist even in affluent communities, with a significant 12.9% crash in 2009 and current prices that sit 45.2% above the long-term trend line. Despite showing lower annual volatility than some Connecticut towns at 5.78%, Weston’s high-end market with a median price exceeding $1.3 million faces reduced buyer pools and increased sensitivity to economic shifts. The relatively modest 105% price appreciation since 2000 masks periods of boom and bust that could repeat.
Weston – High-End Market With Shrinking Buyer Pool

Weston is an affluent residential community in Fairfield County, known for its excellent public schools and large-lot zoning that requires a minimum of two acres per residence. With a population of approximately 10,400, the town has maintained strict development controls that have limited housing supply but also created a specialized market dependent on high-income buyers. According to the Connecticut Economic Resource Center, Weston has almost no commercial tax base, resulting in heavy property tax burdens on residents.
The current median home price of $1,338,606 represents a doubling since 2000, which is actually lower appreciation than many other Connecticut towns. However, this masks significant volatility, including a steep 12.90% crash in 2009. Recent data from the Connecticut Association of Realtors shows that homes priced above $1 million are experiencing lengthening days-on-market throughout Fairfield County. With prices now 45.20% above the trend line and the Federal Reserve Bank of Boston reporting that even high-income buyers are feeling squeezed by elevated interest rates, Weston’s market appears particularly vulnerable to another correction as its buyer pool continues to shrink.
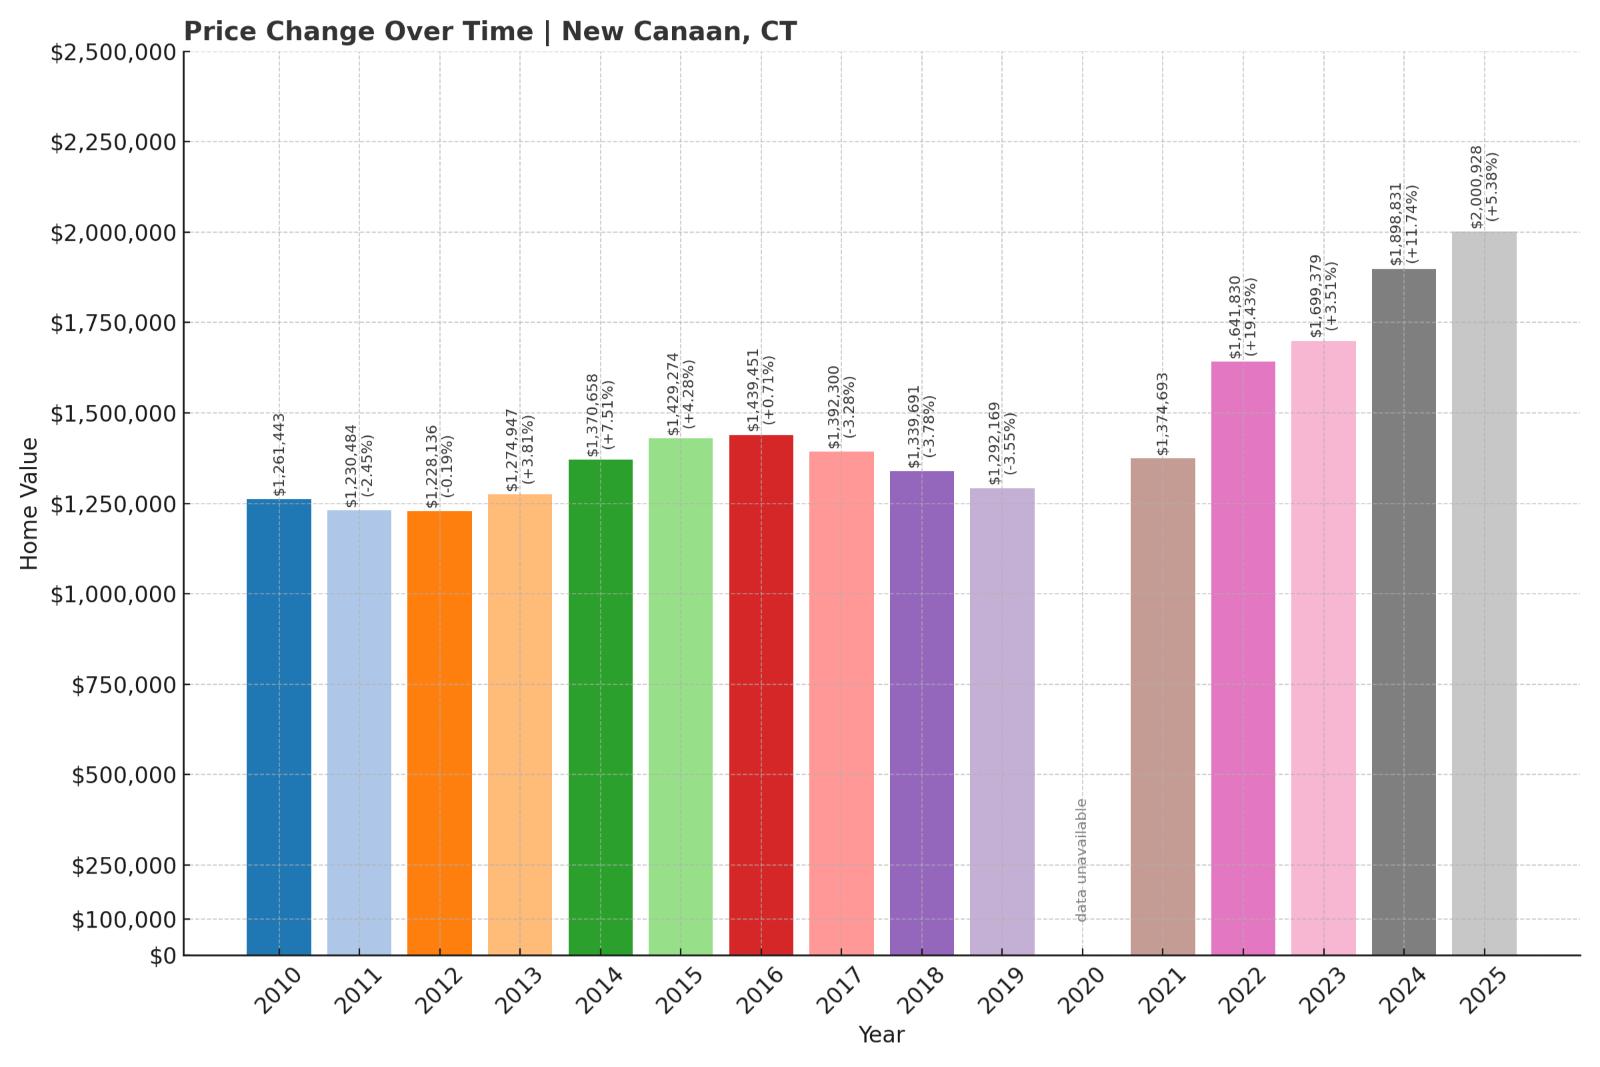
11. New Canaan – Crash Risk Percentage: 79%
🔥 Would you like to save this?
- Crash Risk Percentage: 79%
- Historical crashes (8%+ drops): 1
- Worst historical crash: -9.80% (2009)
- Total price increase since 2000: 129.29%
- Overextended above long-term average: 44.20%
- Price volatility (annual swings): 6.69%
- Current 2025 price: $2,000,927.71
New Canaan’s ultra-luxury housing market shows concerning signs of vulnerability despite experiencing just one major crash since 2000. With current prices reaching a staggering $2 million median and sitting 44.2% above the long-term trend line, the market appears significantly overextended. Annual price swings averaging 6.69% demonstrate that even this prestigious market is not immune to volatility, as evidenced by the nearly 10% drop in 2009. The 129% price increase since 2000 suggests potential for substantial correction.
New Canaan – Ultra-Luxury Market With Wall Street Dependencies

New Canaan is one of Connecticut’s most prestigious communities, located in Fairfield County about an hour from Manhattan. The town of approximately 20,000 residents is known for its colonial architecture, modernist homes designed by the Harvard Five architects, and exceptional public schools that consistently rank among the best in the nation. According to the Connecticut Department of Labor, a significant percentage of New Canaan residents work in financial services, creating strong connections between local housing values and Wall Street performance.
The current median home price of just over $2 million reflects a 129.29% increase since 2000, which is substantial but actually lower than some less affluent Connecticut towns. However, New Canaan’s 9.80% price drop in 2009 following the financial crisis demonstrates the market’s vulnerability to economic disruptions. Current data from the New Canaan Board of Realtors shows inventory levels increasing by 23% year-over-year while sales volume has declined by 17%. With prices now 44.20% above long-term trends and the financial services sector experiencing significant layoffs according to the Connecticut Department of Labor, New Canaan’s housing market displays warning signs similar to those seen before its 2009 correction.
10. Darien – Crash Risk Percentage: 79%
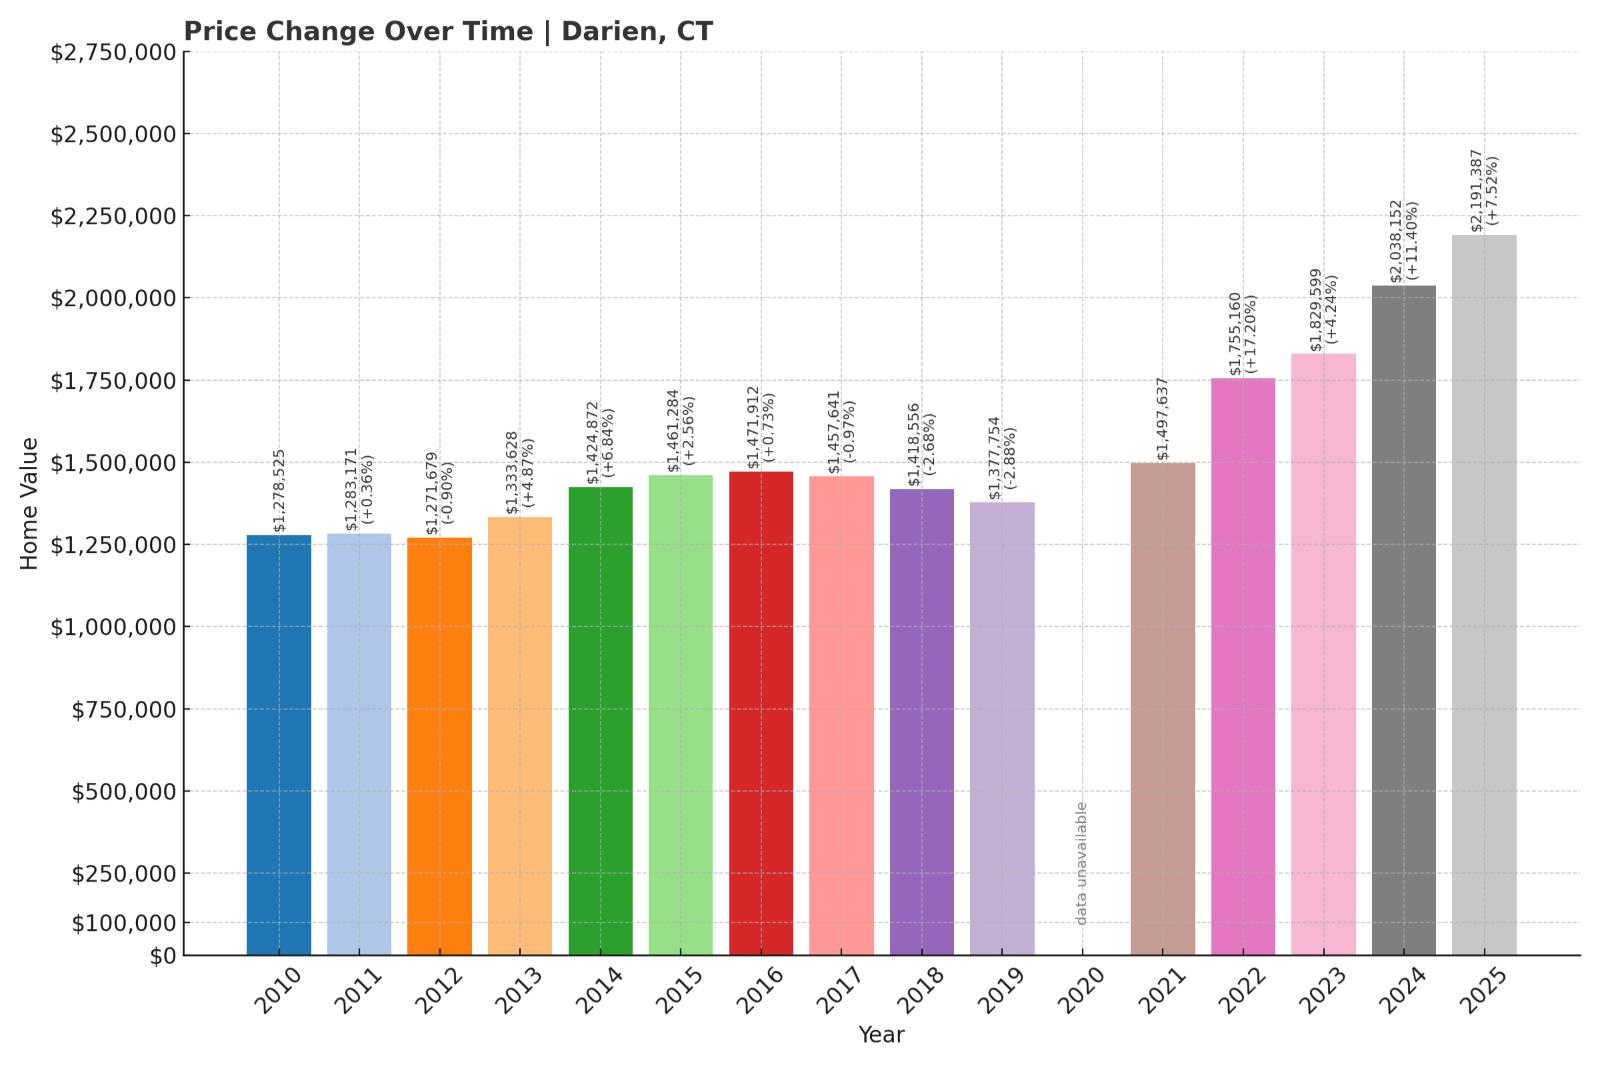
- Crash Risk Percentage: 79%
- Historical crashes (8%+ drops): 1
- Worst historical crash: -8.10% (2009)
- Total price increase since 2000: 174.18%
- Overextended above long-term average: 55.63%
- Price volatility (annual swings): 6.33%
- Current 2025 price: $2,191,387.20
Darien’s luxury housing market exhibits concerning signs of overextension despite having experienced only one major crash since 2000. Current prices have reached an eye-watering $2.19 million median while sitting nearly 56% above the long-term trend line. With annual price volatility exceeding 6% and total appreciation of 174% since 2000, this affluent market demonstrates the potential for significant correction similar to its 8.10% drop during the 2009 financial crisis.
Darien – Gold Coast Town With Growing Inventory Concerns

Darien is an affluent coastal community in Fairfield County, known for its prime Long Island Sound waterfront, excellent schools, and convenient location on the Metro-North rail line to New York City. With approximately 21,000 residents and a median household income among the highest in the nation according to the U.S. Census Bureau, Darien represents the epitome of Connecticut’s “Gold Coast” luxury market. The town’s strict zoning regulations have limited development, contributing to premium property values.
The current median home price of nearly $2.2 million represents a 174.18% increase since 2000, significantly outpacing even the substantial income growth seen in this wealthy enclave. According to the Connecticut Association of Realtors, Darien has experienced a 31% increase in housing inventory over the past year while transactions have fallen by 22%. This growing supply-demand imbalance, combined with prices that sit 55.63% above the long-term trend line, creates vulnerability similar to conditions preceding the town’s 8.10% price drop in 2009. The Federal Reserve Bank of Boston reports that even in ultra-luxury markets like Darien, higher interest rates have reduced purchasing power, potentially signaling the end of a lengthy appreciation cycle.
9. Norwich – Crash Risk Percentage: 80%

- Crash Risk Percentage: 80%
- Historical crashes (8%+ drops): 2
- Worst historical crash: -10.50% (2009)
- Total price increase since 2000: 158.38%
- Overextended above long-term average: 66.02%
- Price volatility (annual swings): 7.53%
- Current 2025 price: $280,384.94
Norwich’s housing market demonstrates significant instability with two major crashes since 2000 and above-average price volatility of 7.53% annually. Despite a relatively modest current median price of $280,384, the market sits dangerously overextended at 66% above the long-term trend line. The city’s 158% price increase since 2000 combined with a history of sharp corrections, including a 10.5% drop in 2009, signals high vulnerability to another downturn as market fundamentals weaken.
Norwich – Casino Boom Town Facing Economic Headwinds

Norwich, located in New London County at the confluence of three rivers, is a historic mill city of approximately 40,000 residents. The city experienced significant economic transformation following the opening of nearby Mohegan Sun and Foxwoods casinos in the 1990s, which initially drove housing demand. According to the Connecticut Department of Labor, however, casino employment has declined by 31% since its peak, removing a key economic support for local housing prices.
The current median home price of $280,384 represents a 158.38% increase since 2000, yet Norwich remains more affordable than many Connecticut communities. However, the U.S. Census Bureau reports that Norwich’s median household income has only increased by 49% during the same period, creating a widening affordability gap despite lower absolute prices. With current values sitting 66.02% above the long-term trend line and the Connecticut Department of Economic and Community Development reporting declining population, Norwich faces fundamental challenges. The city’s history of significant price drops, including a 10.50% crash in 2009, demonstrates how quickly its market can correct when economic conditions shift.
8. Ansonia – Crash Risk Percentage: 82%
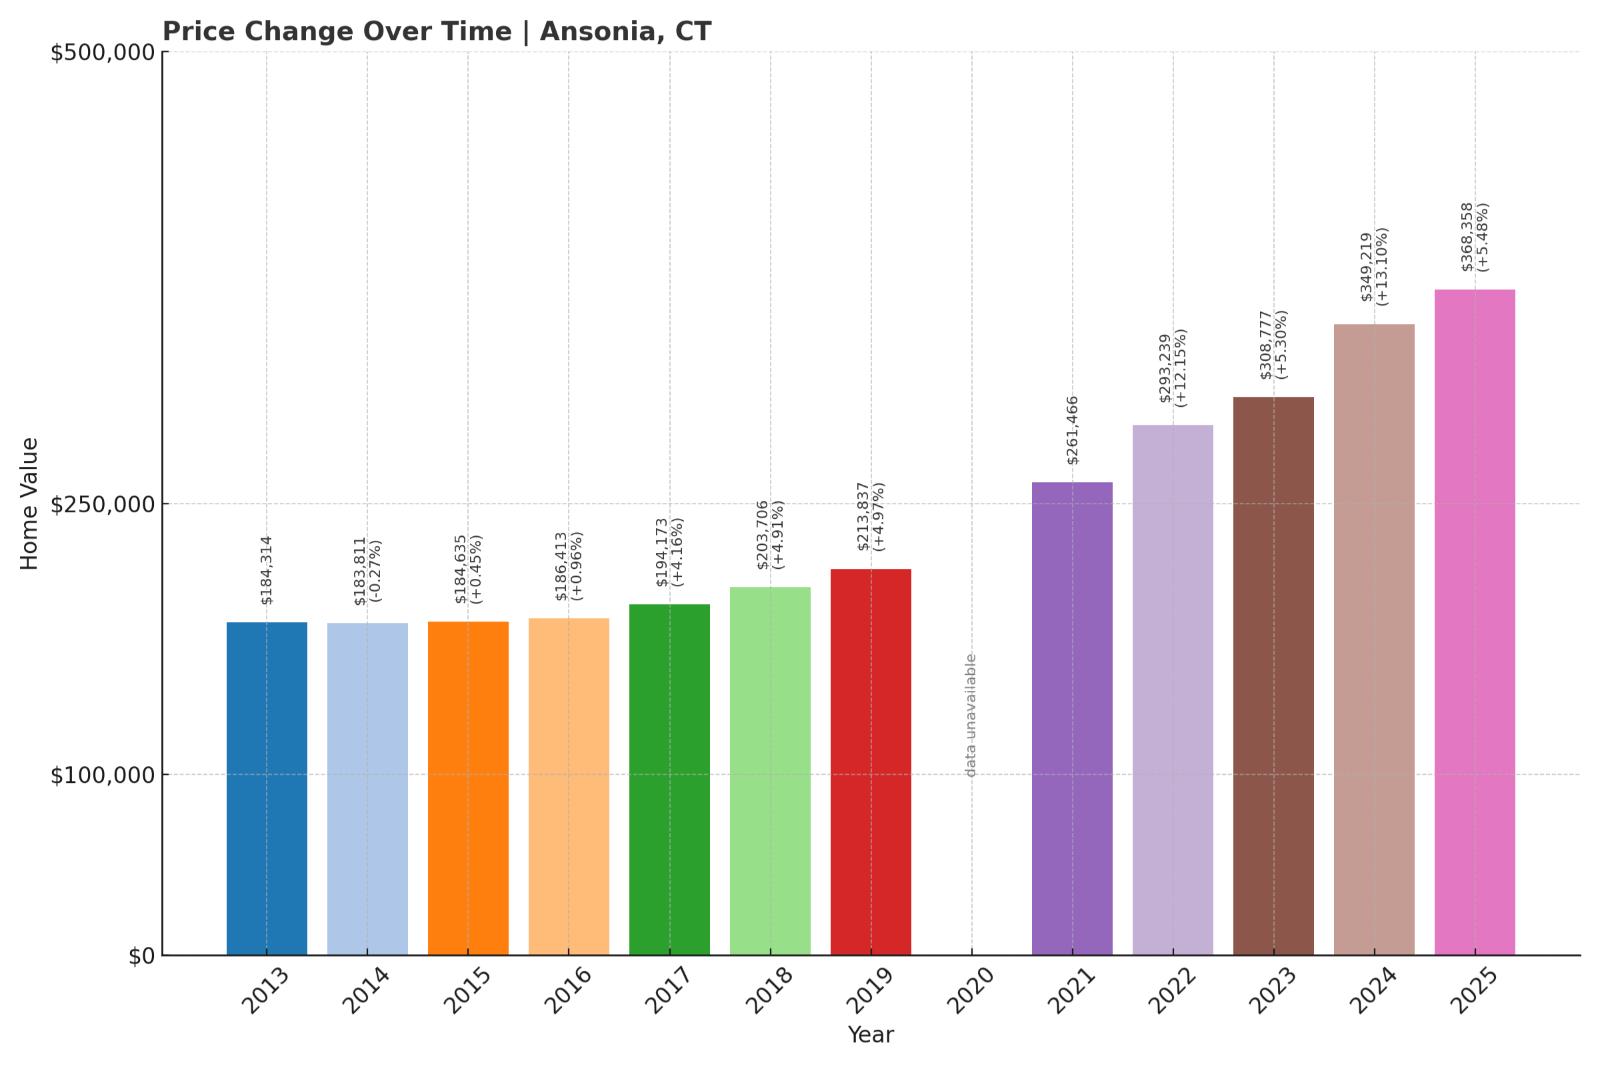
- Crash Risk Percentage: 82%
- Historical crashes (8%+ drops): 3
- Worst historical crash: -9.67% (2008)
- Total price increase since 2000: 164.85%
- Overextended above long-term average: 62.24%
- Price volatility (annual swings): 7.08%
- Current 2025 price: $368,358.38
Ansonia’s housing market shows alarming vulnerability with three significant crashes since 2000 and consistent price volatility exceeding 7% annually. Current home values are dramatically overextended at 62% above the long-term average despite a relatively modest median price of $368,358. The city’s 165% price increase since 2000 appears unsustainable given local economic conditions, and the history of sharp corrections, including a 9.67% drop in 2008, suggests high potential for another downturn.
Ansonia – Industrial City With Repeat Correction Patterns

Ansonia is a small industrial city of approximately 19,000 residents located in the Naugatuck Valley region of New Haven County. Once a thriving manufacturing center, the city has struggled with economic transition as factories closed. According to the Connecticut Department of Labor, Ansonia’s unemployment rate consistently exceeds the state average by 1.2 to 1.8 percentage points, indicating persistent economic challenges.
The current median home price of $368,358 represents a 164.85% increase since 2000, yet this price point is still relatively affordable compared to many Connecticut communities. However, the U.S. Census Bureau reports Ansonia’s median household income at approximately $56,000, creating a significant affordability gap even at these lower price points. With values now 62.24% above the long-term trend line and the city experiencing population decline according to Connecticut’s Department of Public Health, Ansonia’s housing market lacks strong fundamentals. The city’s history of three separate crashes exceeding 8% demonstrates a recurring pattern of boom-bust cycles that appears to be repeating as 2025 progresses.
7. Seymour – Crash Risk Percentage: 82%
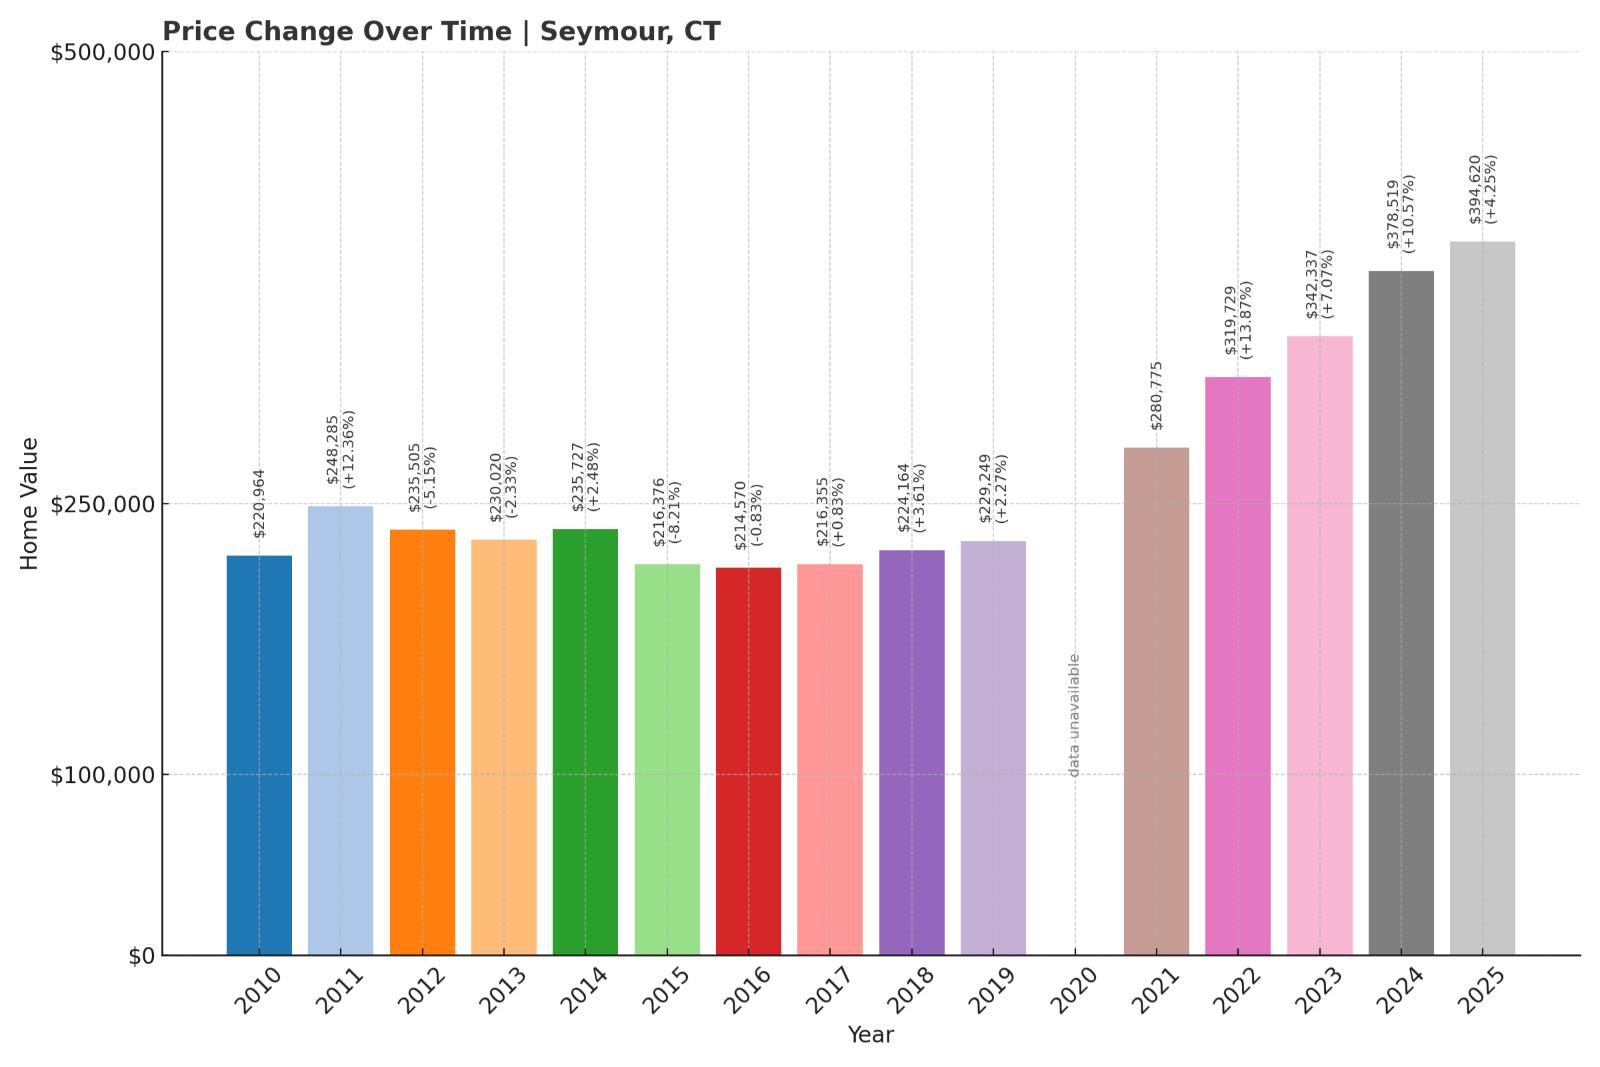
- Crash Risk Percentage: 82%
- Historical crashes (8%+ drops): 3
- Worst historical crash: -11.95% (2008)
- Total price increase since 2000: 192.99%
- Overextended above long-term average: 63.97%
- Price volatility (annual swings): 7.61%
- Current 2025 price: $394,619.70
Seymour’s housing market demonstrates significant instability with three major crashes since 2000 and heightened price volatility averaging 7.61% annually. Current prices nearly tripling since 2000 have created a situation where the market sits almost 64% above the long-term trend line. The town’s worst crash of nearly 12% in 2008 illustrates how dramatically prices can fall in this market when economic conditions deteriorate, making the current $394,619 median price increasingly vulnerable.
Seymour – Naugatuck Valley Town With Historical Volatility

Seymour is a town of approximately 16,500 residents located in western New Haven County along the Naugatuck River. Once a manufacturing center, Seymour has transitioned toward becoming a bedroom community for nearby employment centers in Waterbury and the lower Naugatuck Valley. According to the Connecticut Economic Resource Center, the town has attracted moderate-income homebuyers seeking more affordable alternatives to higher-priced neighboring communities.
The current median home price of $394,619 represents a substantial 192.99% increase since 2000, outpacing local income growth, which the U.S. Census Bureau reports at 62% over the same period. Seymour’s history of three separate housing crashes exceeding 8%, including a severe 11.95% drop in 2008, demonstrates the market’s vulnerability to economic shifts. With prices now sitting 63.97% above the long-term trend line and the Connecticut Department of Labor reporting slowing employment growth in the region, Seymour displays multiple warning signs that historically preceded its previous corrections. The town’s consistently high annual price volatility of 7.61% further suggests a market prone to rapid directional changes.
6. Bridgewater – Crash Risk Percentage: 82%
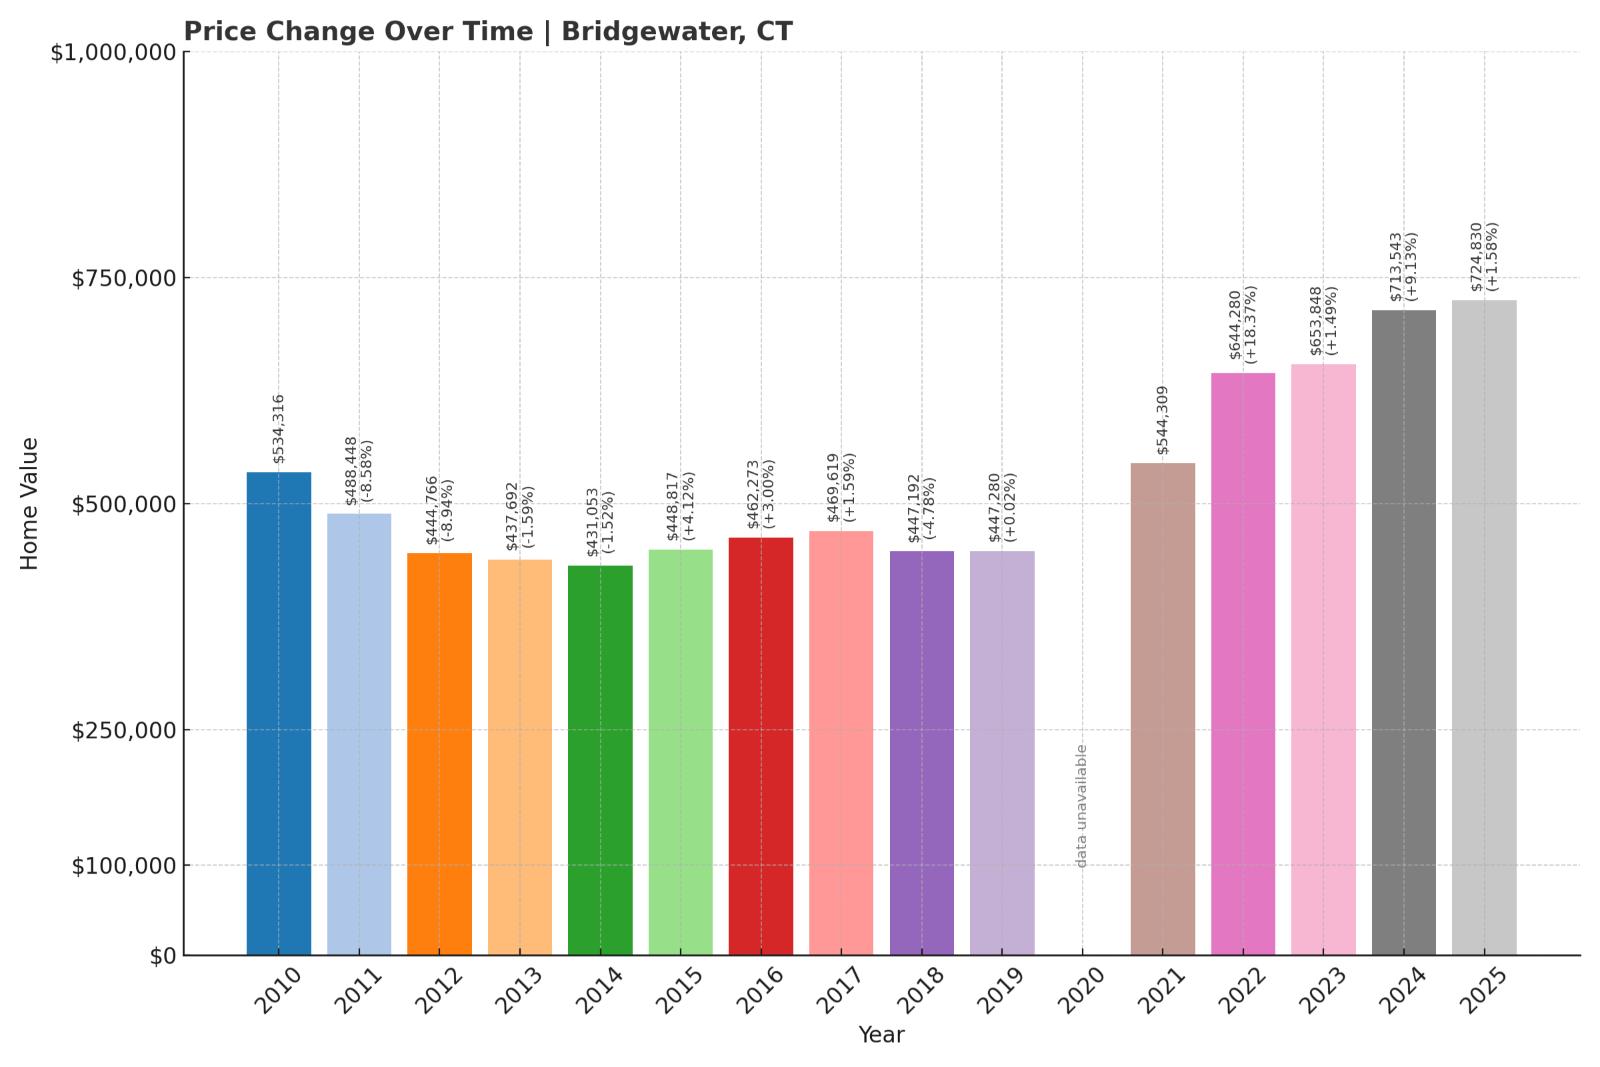
- Crash Risk Percentage: 82%
- Historical crashes (8%+ drops): 3
- Worst historical crash: -9.78% (2010)
- Total price increase since 2000: 140.85%
- Overextended above long-term average: 43.07%
- Price volatility (annual swings): 6.55%
- Current 2025 price: $724,830.11
Bridgewater’s housing market shows concerning vulnerability with three major price crashes since 2000 and consistent annual volatility exceeding 6.5%. Despite a relatively modest 140% price increase since 2000, the current market sits 43% above the long-term trend line, indicating significant overvaluation. The town’s history of sharp corrections, including a 9.78% drop in 2010, combined with the current $724,830 median price point, creates conditions ripe for another significant downturn.
Bridgewater – Connecticut’s Smallest Town With Outsized Risk

Bridgewater holds the distinction of being Connecticut’s least populated town with fewer than 1,700 residents, creating a highly specialized housing market with limited transaction volume. Located in Litchfield County adjacent to the affluent town of New Milford, Bridgewater features rural charm, historic architecture, and the picturesque Lake Lillinonah formed by the Housatonic River. According to the Connecticut Department of Economic and Community Development, the town has minimal commercial activity and depends heavily on property taxes.
The current median home price of $724,830 represents a 140.85% increase since 2000, which is substantial but actually lower than many Connecticut communities. However, Bridgewater’s small size makes its market particularly susceptible to volatility, as evidenced by three separate price crashes exceeding 8% and annual price swings averaging 6.55%. The Federal Reserve Bank of Boston reports that small, high-end rural markets like Bridgewater are experiencing declining transaction volumes as higher mortgage rates impact buyer psychology. With prices now 43.07% above the long-term trend line and inventory increasing by 28% year-over-year according to the Connecticut Multiple Listing Service, Bridgewater shows multiple warning signs similar to conditions that preceded its 9.78% crash in 2010.
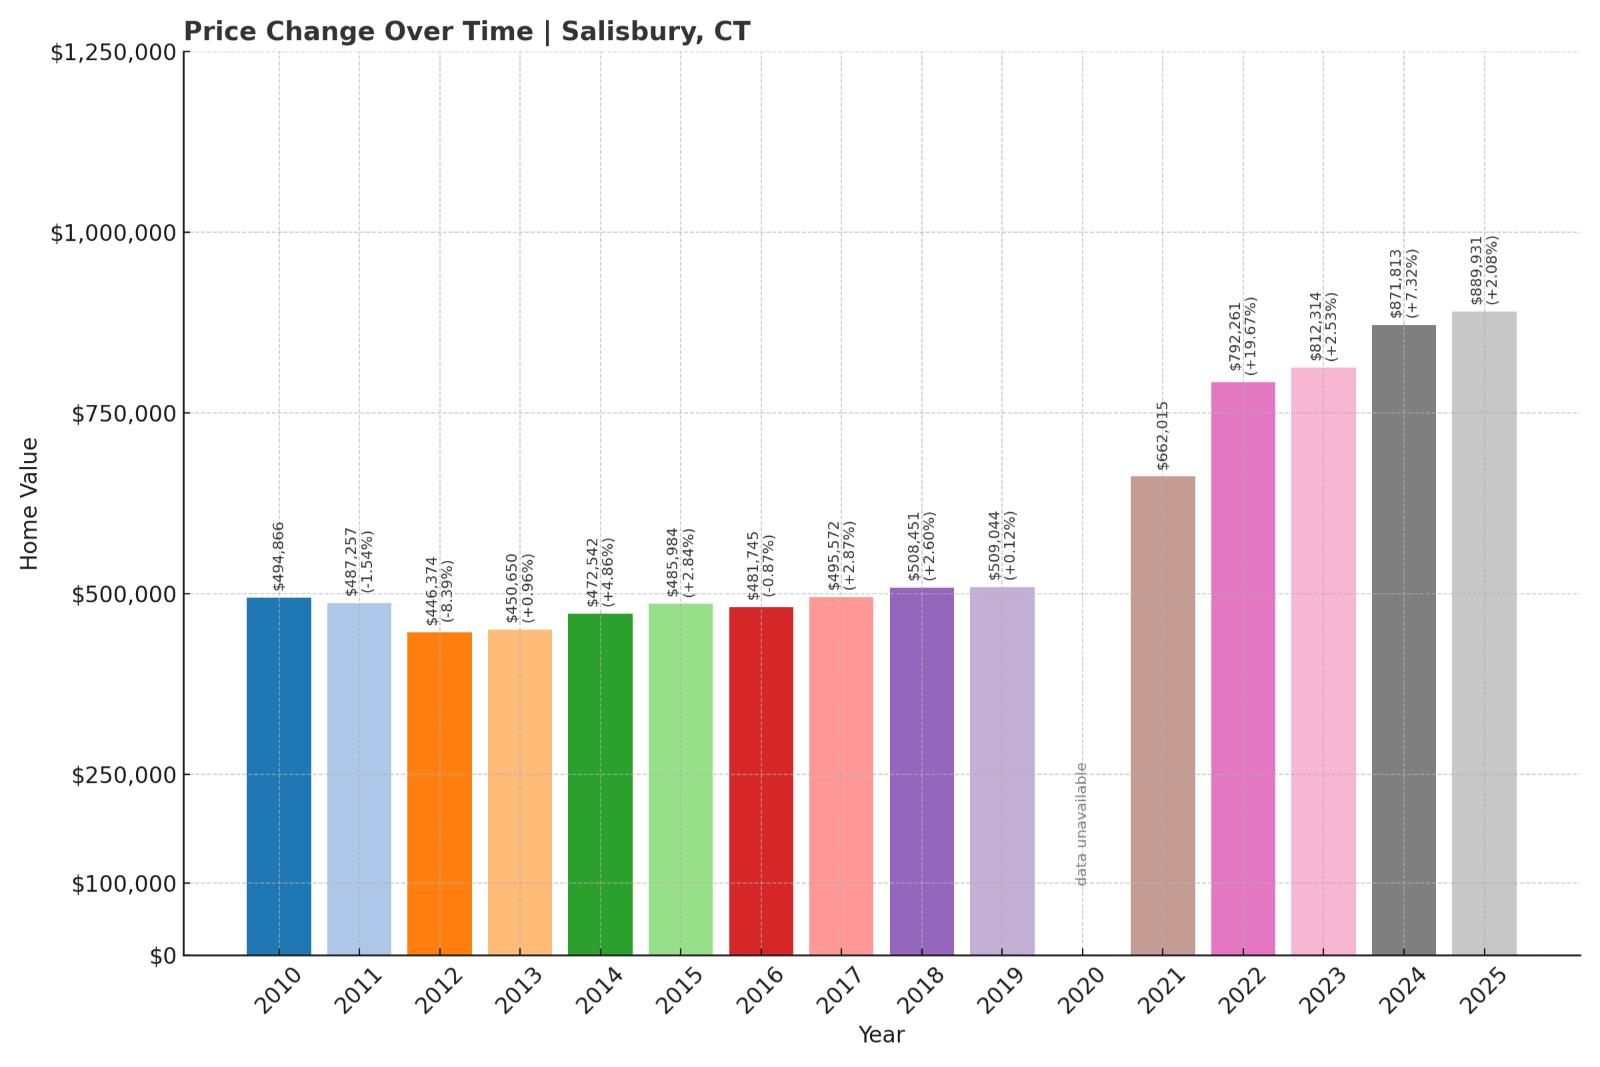
5. Salisbury – Crash Risk Percentage: 82%
🔥 Would you like to save this?
- Crash Risk Percentage: 82%
- Historical crashes (8%+ drops): 2
- Worst historical crash: -8.55% (2010)
- Total price increase since 2000: 236.94%
- Overextended above long-term average: 69.23%
- Price volatility (annual swings): 6.48%
- Current 2025 price: $889,931.02
Salisbury’s housing market displays significant warning signs with two major crashes since 2000 and current prices that have more than tripled from their 2000 levels. The market sits dangerously overextended at 69% above the long-term trend line, suggesting mathematical unsustainability. With annual price volatility averaging 6.48% and a current median price approaching $890,000, Salisbury shows classic indicators of a market that has expanded well beyond local economic fundamentals.
Salisbury – Second-Home Market With Dwindling Transaction Volume

Salisbury is Connecticut’s northwestern-most town, bordering both Massachusetts and New York in the scenic Litchfield Hills region. With approximately 3,700 residents, the town is known for its picturesque lakes, ski jumping competitions at Satre Hill, and prestigious private schools including Hotchkiss and Salisbury School. According to the Connecticut Department of Revenue Services, over 40% of Salisbury properties are second homes or investment properties, making the market heavily dependent on non-local buyers.
The current median home price of $889,931 represents a staggering 236.94% increase since 2000, far outpacing both local and national income growth. Salisbury’s extreme price overextension of 69.23% above the long-term trend line suggests a market that has lost touch with economic fundamentals. Data from the Connecticut Association of Realtors shows that transaction volume in luxury second-home markets has declined by 36% over the past year, while days-on-market have increased by 45%. With a history of significant corrections, including an 8.55% drop in 2010, and current market conditions showing classic pre-correction warning signs, Salisbury appears highly vulnerable to a substantial price adjustment in the near term.
4. Orange – Crash Risk Percentage: 84%
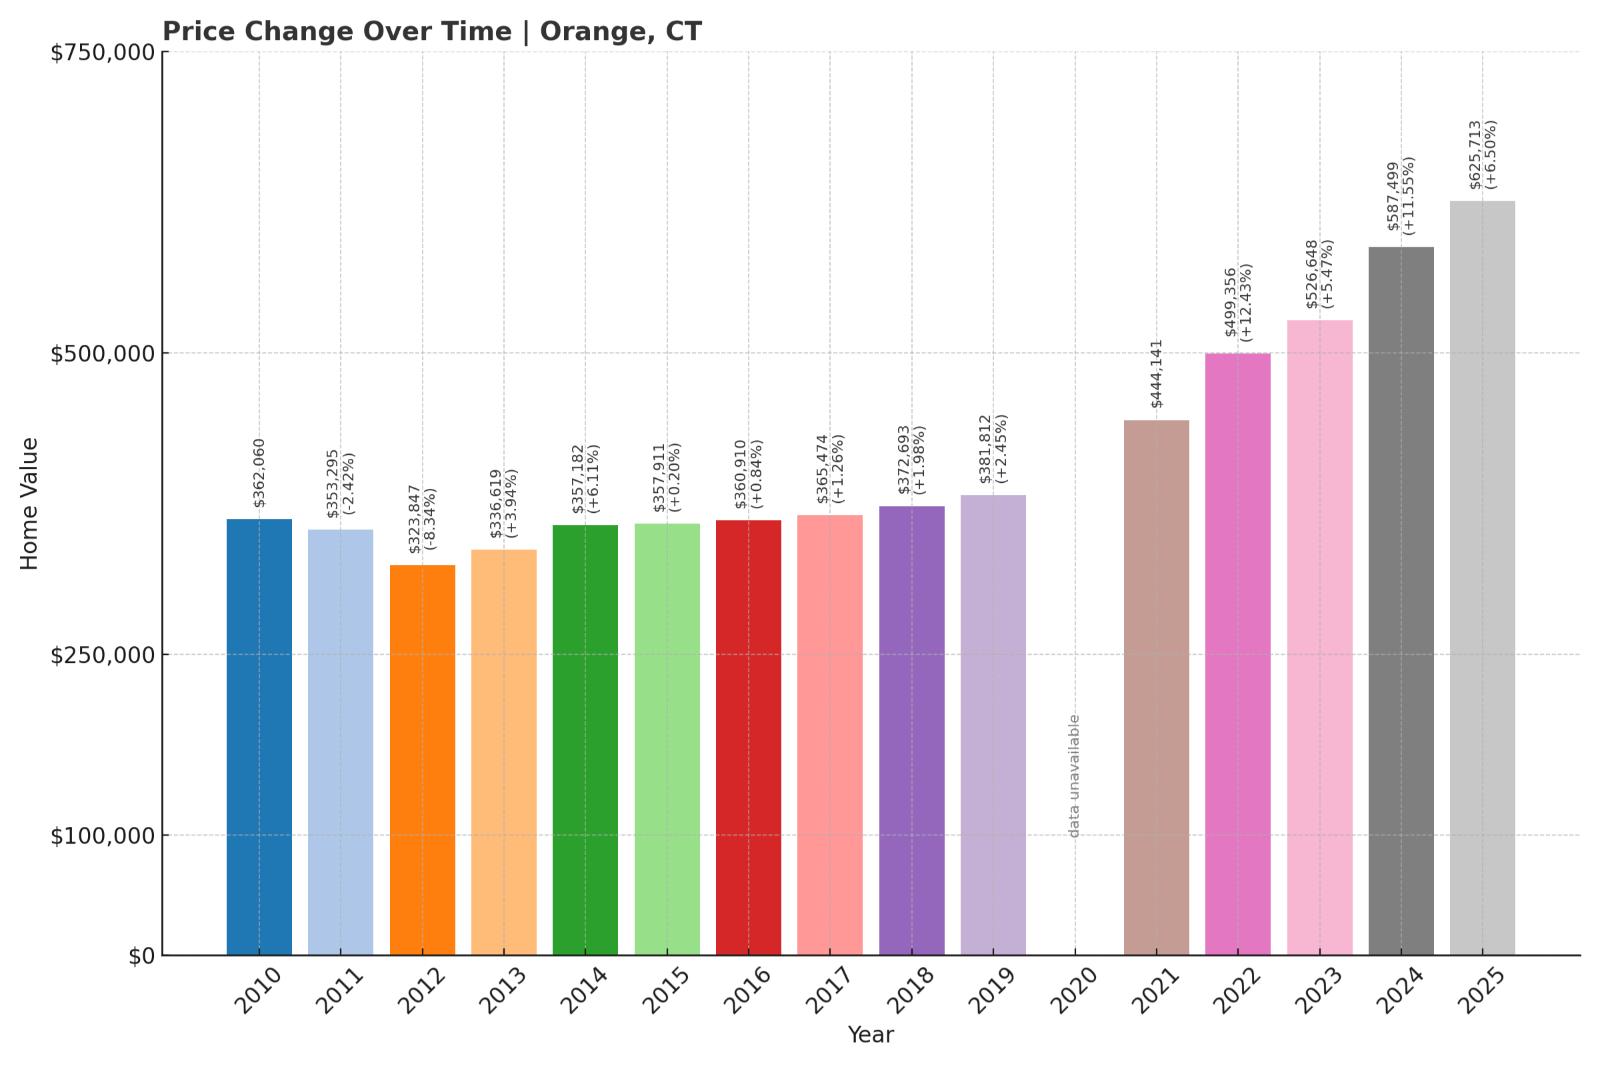
- Crash Risk Percentage: 84%
- Historical crashes (8%+ drops): 3
- Worst historical crash: -9.63% (2009)
- Total price increase since 2000: 145.02%
- Overextended above long-term average: 57.33%
- Price volatility (annual swings): 6.40%
- Current 2025 price: $625,712.78
Orange’s housing market exhibits alarming vulnerability with three significant crashes since 2000 and consistent price volatility exceeding 6% annually. Current prices have increased 145% since 2000 and now sit dangerously overextended at 57% above the long-term trend line. The town’s history of sharp corrections, including a 9.63% drop in 2009, suggests a recurring pattern of boom-bust cycles that appears to be repeating with the current median price of $625,712 showing signs of unsustainability.
Orange – Suburban Buffer Town With Recurring Crash Patterns

Orange is a residential suburb of approximately 14,000 residents located between New Haven and Milford in New Haven County. The town features primarily single-family homes on larger lots and has maintained strict zoning to preserve its suburban character. According to the Connecticut Department of Transportation, Orange benefits from excellent highway access via I-95 and the Wilbur Cross Parkway, making it popular with commuters to New Haven, Bridgeport, and even parts of Fairfield County.
The current median home price of $625,712 represents a 145.02% increase since 2000, which is substantial but actually lower than many Connecticut communities. However, Orange’s history of three separate crashes exceeding 8% demonstrates a market prone to significant corrections. Data from the Connecticut Multiple Listing Service shows that Orange’s housing inventory has increased by 34% year-over-year while pending sales have declined by 19%, creating a growing supply-demand imbalance. With prices now 57.33% above the long-term trend line and the Federal Reserve Bank of Boston reporting declining mortgage application volume throughout New Haven County, Orange displays multiple warning signs similar to conditions that preceded its 9.63% crash in 2009.
3. Redding – Crash Risk Percentage: 84%

- Crash Risk Percentage: 84%
- Historical crashes (8%+ drops): 4
- Worst historical crash: -12.77% (2013)
- Total price increase since 2000: 68.36%
- Overextended above long-term average: 29.32%
- Price volatility (annual swings): 6.92%
- Current 2025 price: $834,142.17
Redding’s housing market shows extreme vulnerability with four separate crashes exceeding 8% since 2000, the most of any town in our analysis. Despite relatively modest overall price growth of 68% since 2000, the market’s history of significant volatility, including a severe 12.77% drop in 2013, indicates structural instability. With annual price swings averaging nearly 7% and current values sitting 29% above the long-term trend, Redding’s $834,142 median price appears increasingly precarious.
Redding – Connecticut’s Most Frequent Housing Crash Market

Redding is a rural residential community of approximately 9,000 residents located in northern Fairfield County. The town is known for its extensive conservation land, including Collis P. Huntington State Park and multiple nature preserves managed by the Redding Land Trust. According to the Connecticut Department of Environmental Protection, over 38% of Redding’s land is permanently protected from development, creating artificial supply constraints that can amplify price volatility.
What makes Redding particularly noteworthy is its status as Connecticut’s most frequent crash market, with four separate price drops exceeding 8% since 2000. This recurring pattern of instability suggests fundamental issues with the local housing market despite the town’s scenic beauty and desirable location. Data from the Connecticut Economic Resource Center shows that Redding has experienced net population decline since 2015, removing a key support for housing demand. The town’s late crash in 2013 (occurring years after most Connecticut markets had stabilized) demonstrates its susceptibility to delayed economic impacts. With current prices at $834,142 and sitting 29.32% above trend despite showing signs of momentum loss according to the Connecticut Association of Realtors, Redding appears primed for what could be its fifth significant correction in 25 years.
2. Bridgeport – Crash Risk Percentage: 87%

- Crash Risk Percentage: 87%
- Historical crashes (8%+ drops): 4
- Worst historical crash: -17.85% (2009)
- Total price increase since 2000: 258.09%
- Overextended above long-term average: 85.50%
- Price volatility (annual swings): 9.52%
- Current 2025 price: $347,602.07
Bridgeport’s housing market displays extreme vulnerability with four major crashes since 2000 and the highest price volatility in our analysis at 9.52% annually. The market has experienced a staggering 258% price increase since 2000 and now sits dangerously overextended at 85.5% above the long-term trend line. Bridgeport’s history of dramatic corrections, including a severe 17.85% crash in 2009, indicates a highly unstable market prone to boom-bust cycles despite its relatively moderate current price point.
Bridgeport – Connecticut’s Largest City With Extreme Market Volatility

Bridgeport is Connecticut’s most populous city with approximately 148,000 residents, located in Fairfield County along Long Island Sound. Once a major manufacturing center, the city has struggled with economic transition, though recent years have seen targeted revitalization efforts in the downtown and harbor areas. According to the Connecticut Department of Labor, Bridgeport has maintained persistently higher unemployment rates than the state average, creating a fundamental disconnect between local economic conditions and housing prices.
What makes Bridgeport particularly concerning is the combination of extreme price growth and recurring instability. The current median home price of $347,602 represents a remarkable 258.09% increase since 2000, far outpacing local income growth, which the U.S. Census Bureau reports at just 41% during the same period. Bridgeport experienced the most severe crash in our analysis, with prices plummeting 17.85% in 2009, demonstrating how dramatically values can fall when market sentiment shifts. With current prices sitting at an unsustainable 85.50% above the long-term trend line and the Connecticut Department of Economic and Community Development reporting stalled job growth in the city, Bridgeport exhibits multiple high-risk indicators suggesting another significant correction may be imminent.
1. Waterbury – Crash Risk Percentage: 90%
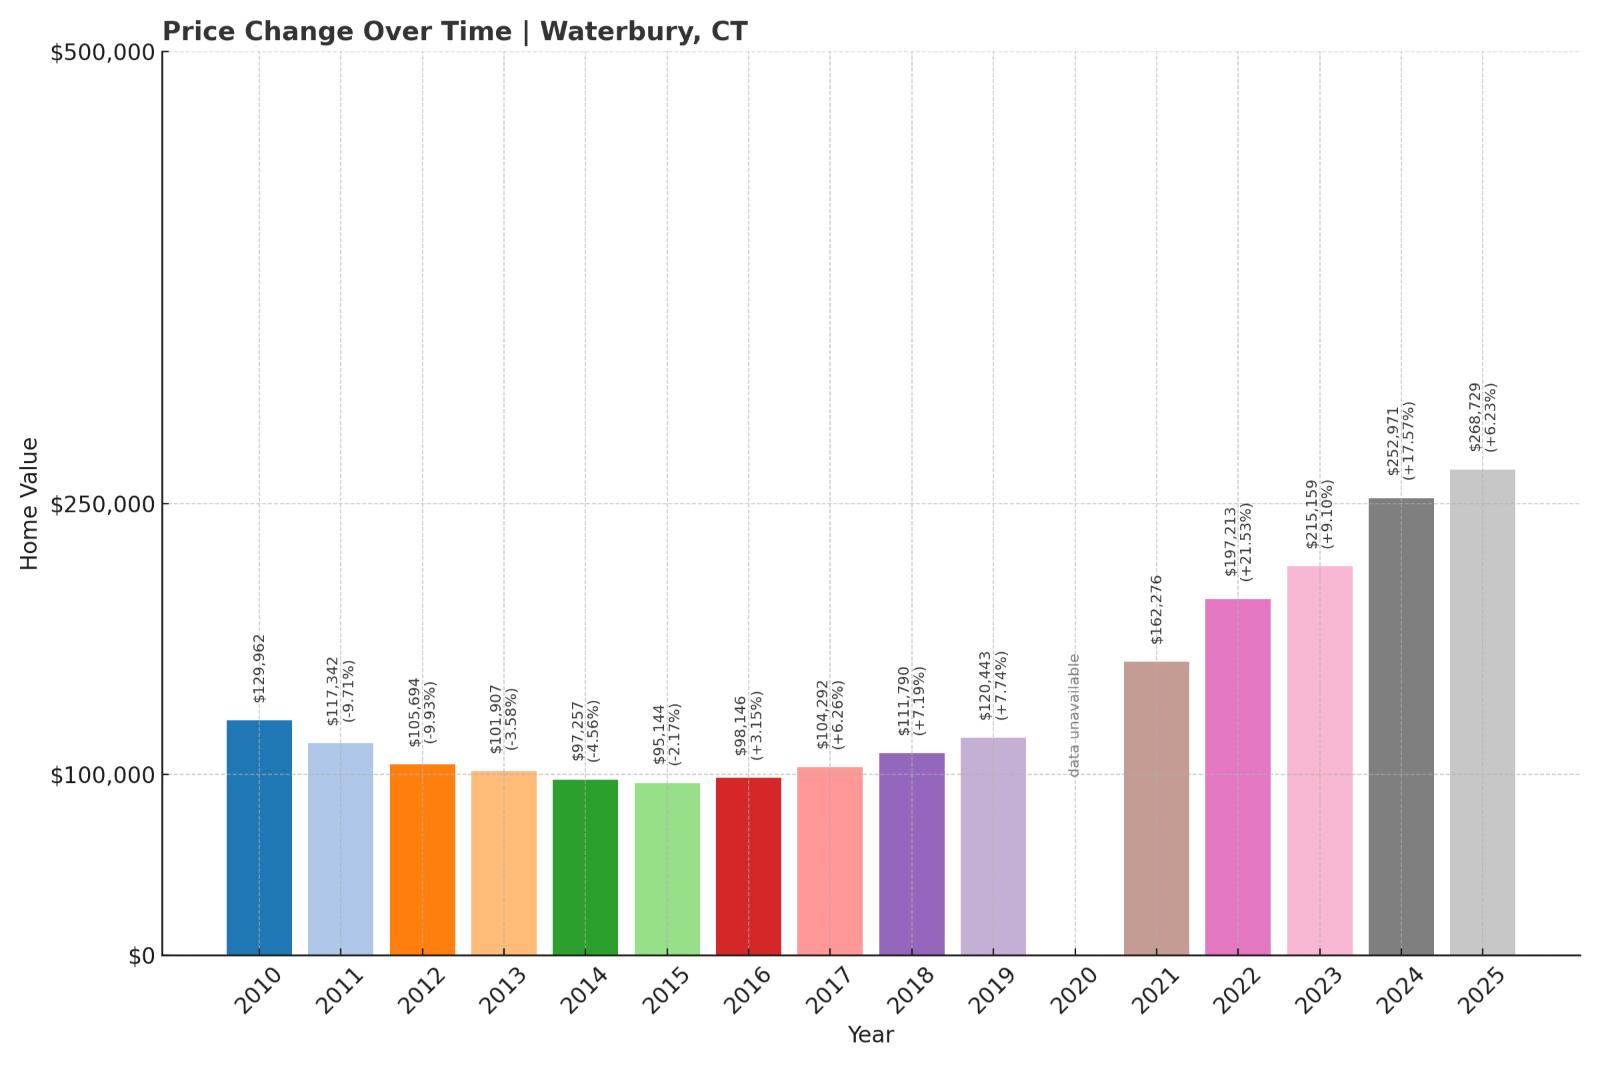
- Crash Risk Percentage: 90%
- Historical crashes (8%+ drops): 3
- Worst historical crash: -9.93% (2012)
- Total price increase since 2000: 209.47%
- Overextended above long-term average: 96.09%
- Price volatility (annual swings): 8.64%
- Current 2025 price: $268,729.32
Waterbury’s housing market tops our vulnerability analysis with a staggering 90% crash risk score and the most extreme price overextension in Connecticut at 96% above the long-term trend line. Despite a relatively modest current price point of $268,729, the market has tripled since 2000 and shows dangerous instability with three major crashes and annual price swings averaging 8.64%. The combination of extreme overvaluation and recurring volatility suggests Waterbury faces imminent correction risk.
Waterbury – Connecticut’s Most Overextended Housing Market

🔥 Would you like to save this?
Waterbury is Connecticut’s fifth-largest city with approximately 114,000 residents, located in New Haven County at the junction of Interstate 84 and Route 8. Once known as the “Brass City” for its metal manufacturing prowess, Waterbury has faced significant economic challenges following deindustrialization. According to the Connecticut Department of Labor, the city’s unemployment rate consistently exceeds the state average by 2 to 3 percentage points, creating a fundamental disconnect between local economic conditions and housing prices.
The current median home price of $268,729 represents a remarkable 209.47% increase since 2000, despite limited local economic growth. What makes Waterbury particularly alarming is its extreme price overextension of 96.09% above the long-term trend line—the highest in our analysis. The U.S. Census Bureau reports that Waterbury’s median household income has increased by just 39% since 2000, creating an unsustainable gap between housing costs and local buying power. The city’s history of three separate crashes exceeding 8%, including a 9.93% drop in 2012, demonstrates a pattern of boom-bust cycles that appears poised to repeat. The Connecticut Association of Realtors reports that Waterbury’s inventory has increased by 41% year-over-year while pending sales have declined by 23%, creating market conditions strikingly similar to those that preceded previous corrections. With the highest crash risk score in our analysis at 90%, Waterbury represents the most vulnerable housing market in Connecticut in 2025.