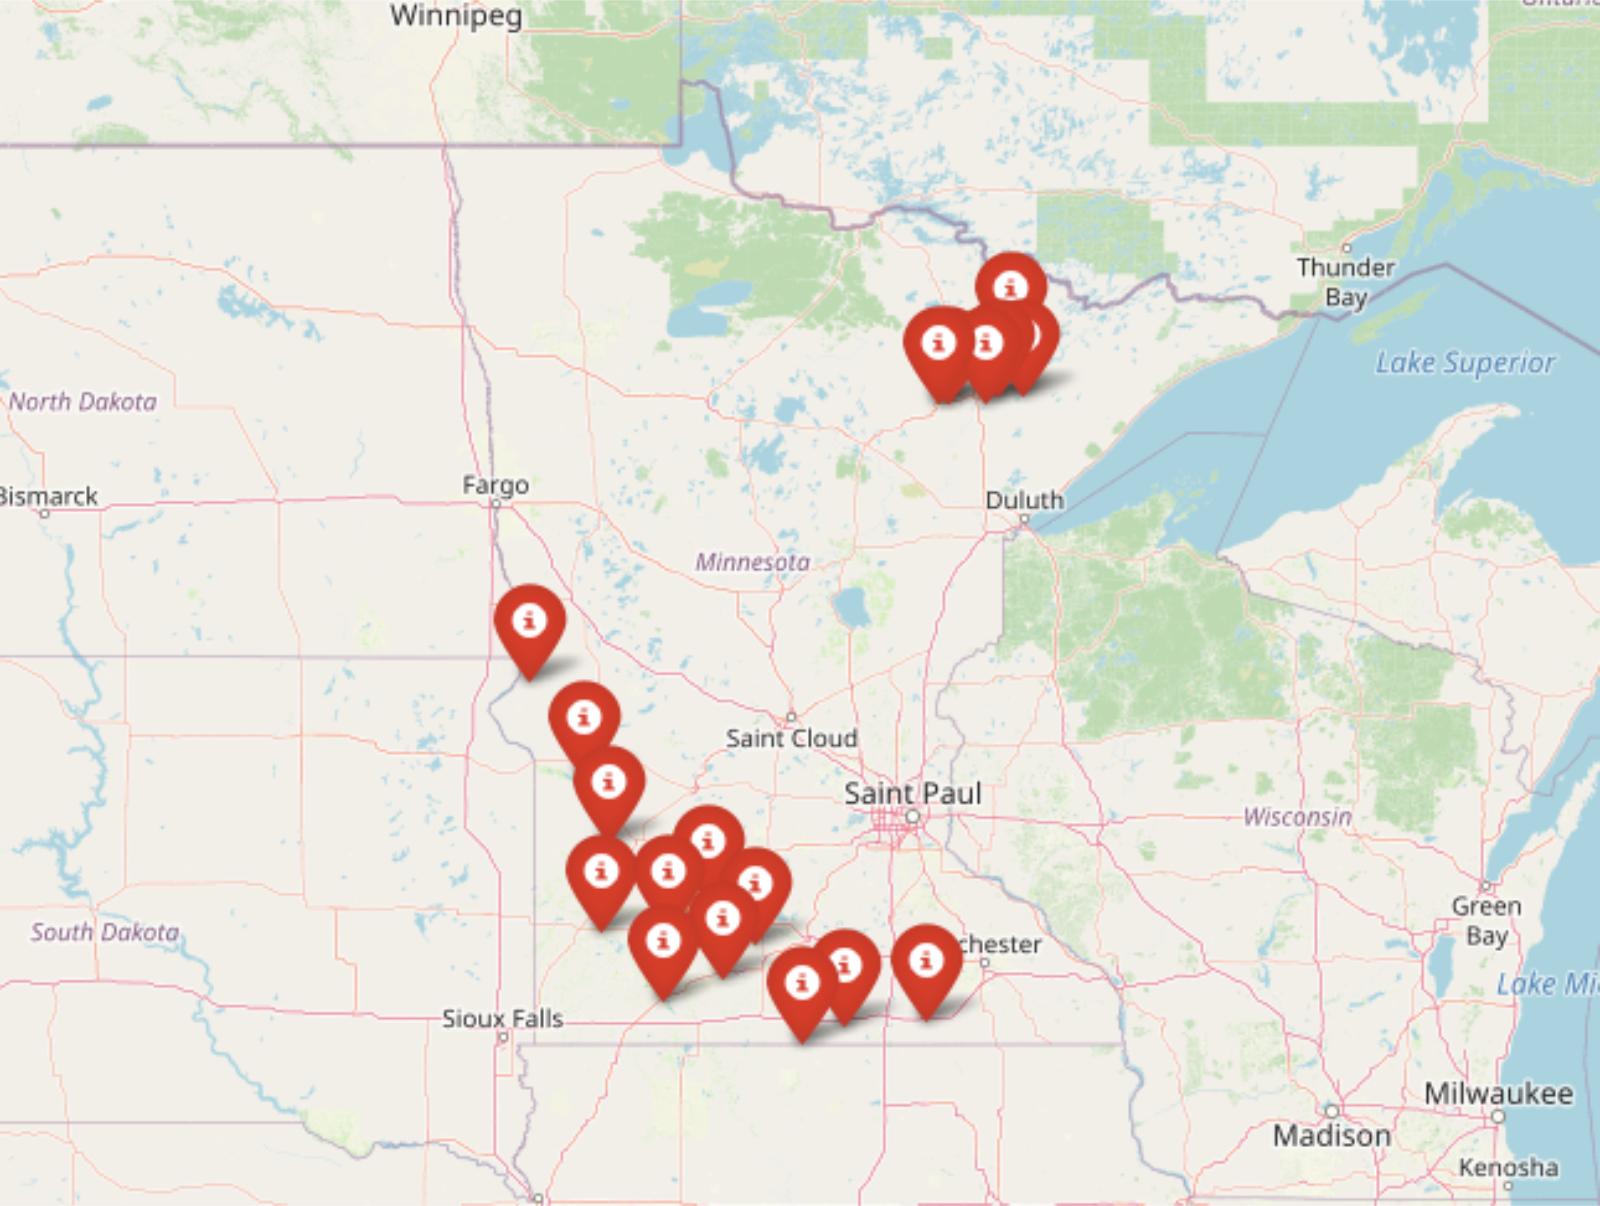
Home prices keep climbing across the U.S., but in these 18 Minnesota towns, the Zillow Home Value Index still shows room to breathe. From sleepy rural hideouts to overlooked small cities, these places have stayed affordable while the rest of the market raced ahead. They’re not just cheap—they’re steady, livable, and in some cases, quietly gaining value. Whether you’re a first-time buyer, a remote worker with options, or just tired of sky-high prices, these towns might be exactly what you didn’t know you were looking for.
18. Wheaton – 50% Home Price Increase Since 2014
- 2010: N/A
- 2011: N/A
- 2012: N/A
- 2013: N/A
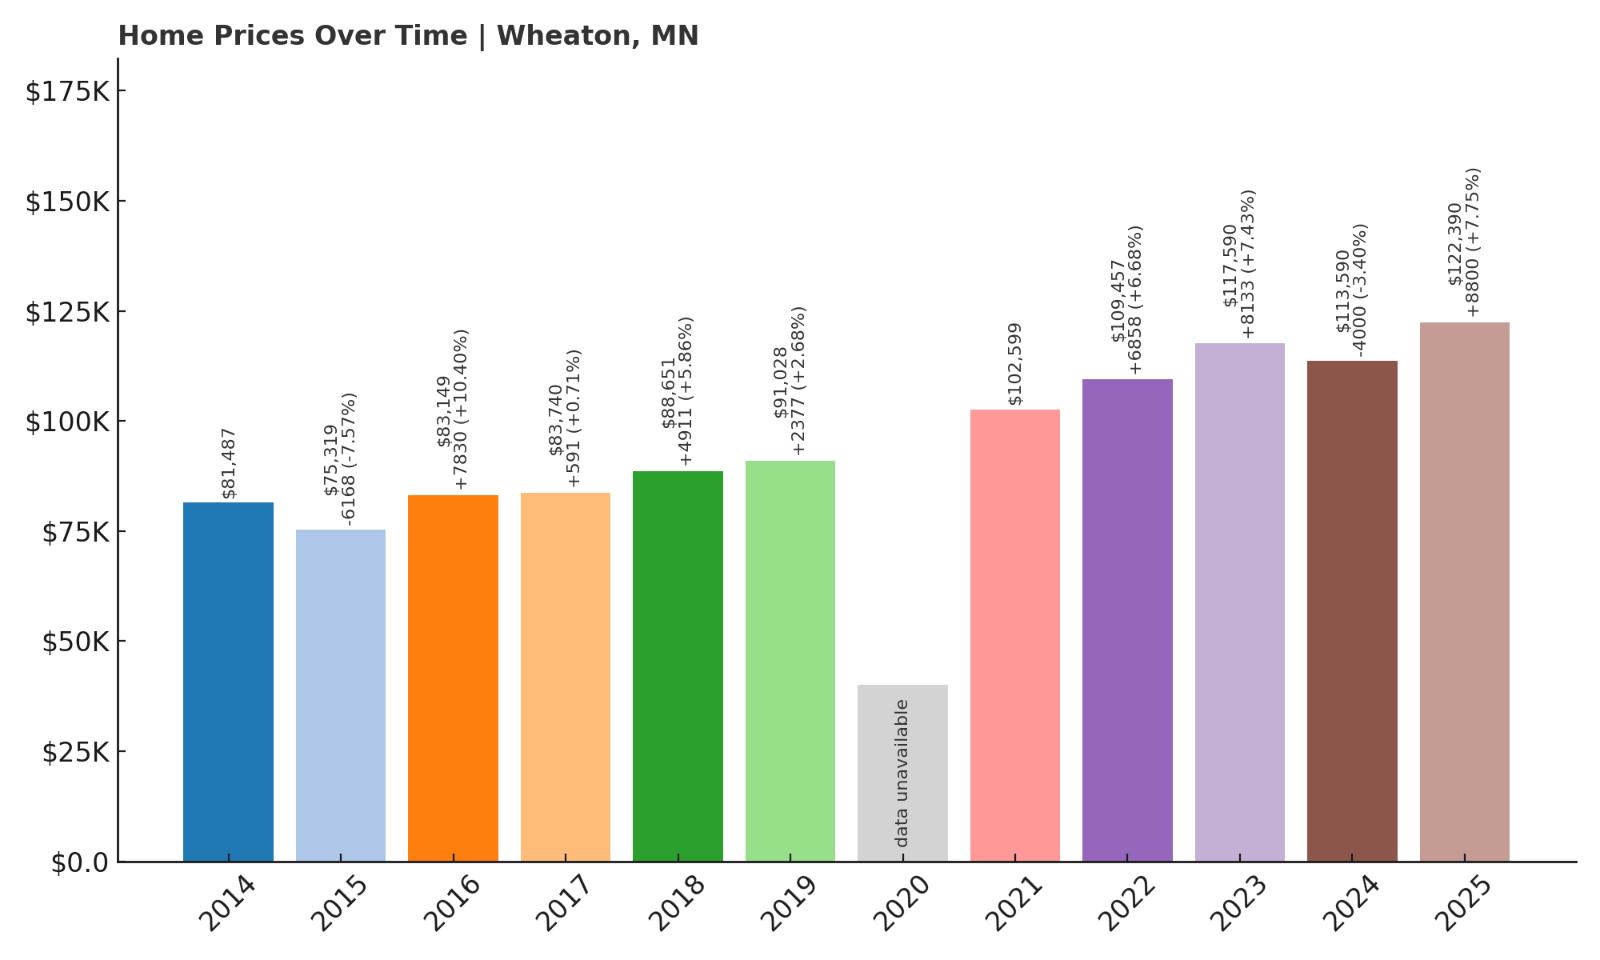
- 2014: $81,487
- 2015: $75,319 ($-6,169, -7.57% from previous year)
- 2016: $83,149 (+$7,831, +10.40% from previous year)
- 2017: $83,740 (+$591, +0.71% from previous year)
- 2018: $88,651 (+$4,911, +5.87% from previous year)
- 2019: $91,028 (+$2,377, +2.68% from previous year)
- 2020: N/A
- 2021: $102,599 (+$11,571, +12.71% from previous year)
- 2022: $109,457 (+$6,858, +6.68% from previous year)
- 2023: $117,590 (+$8,134, +7.43% from previous year)
- 2024: $113,590 ($-4,000, -3.40% from previous year)
- 2025: $122,390 (+$8,799, +7.75% from previous year)
Home values in Wheaton have climbed by 50% since 2014, with 2025 prices averaging around $122,390. After a dip in 2015, the market rebounded steadily, with notable gains in 2021 and 2023. While there was a small correction in 2024, prices bounced back the following year. Overall, Wheaton’s market has shown moderate, sustained growth, making it a consistent option for budget-conscious buyers.
In order to come up with the very specific design ideas, we create most designs with the assistance of state-of-the-art AI interior design software. Also, assume links that take you off the site are affiliate links such as links to Amazon. this means we may earn a commission if you buy something.
Wheaton – Stability in a Quiet Corner of Western Minnesota
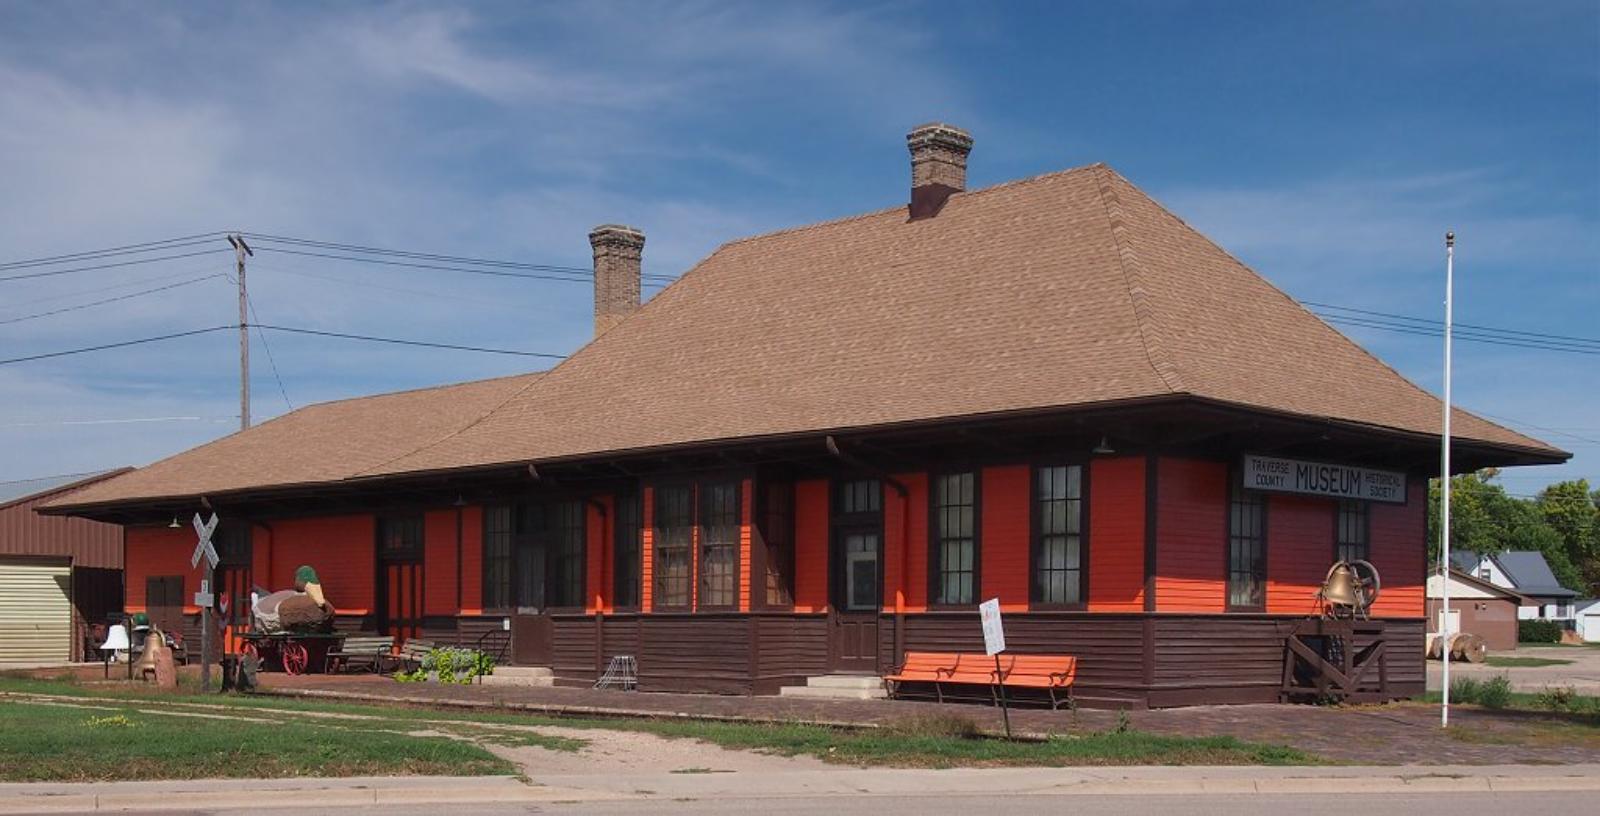
Wheaton is tucked away in Traverse County near the South Dakota border, offering a peaceful setting in Minnesota’s western prairies. It’s known for its agricultural roots and low population density, which contribute to its affordability. The town hasn’t seen the kind of real estate surges that hit metro areas, helping keep prices grounded. Local amenities are simple but reliable, with good access to schools and community facilities.
Affordability and consistency are what define Wheaton’s housing market. The absence of dramatic spikes or dips—aside from a minor correction in 2015—suggests a stable local economy. While it may not be a booming hotspot, Wheaton appeals to buyers seeking space, simplicity, and long-term value. Its low cost of entry makes it an attractive choice for first-time buyers or retirees looking to downsize without giving up comfort.
17. Morgan – 125% Home Price Increase Since 2013
- 2010: N/A
- 2011: N/A
- 2012: N/A
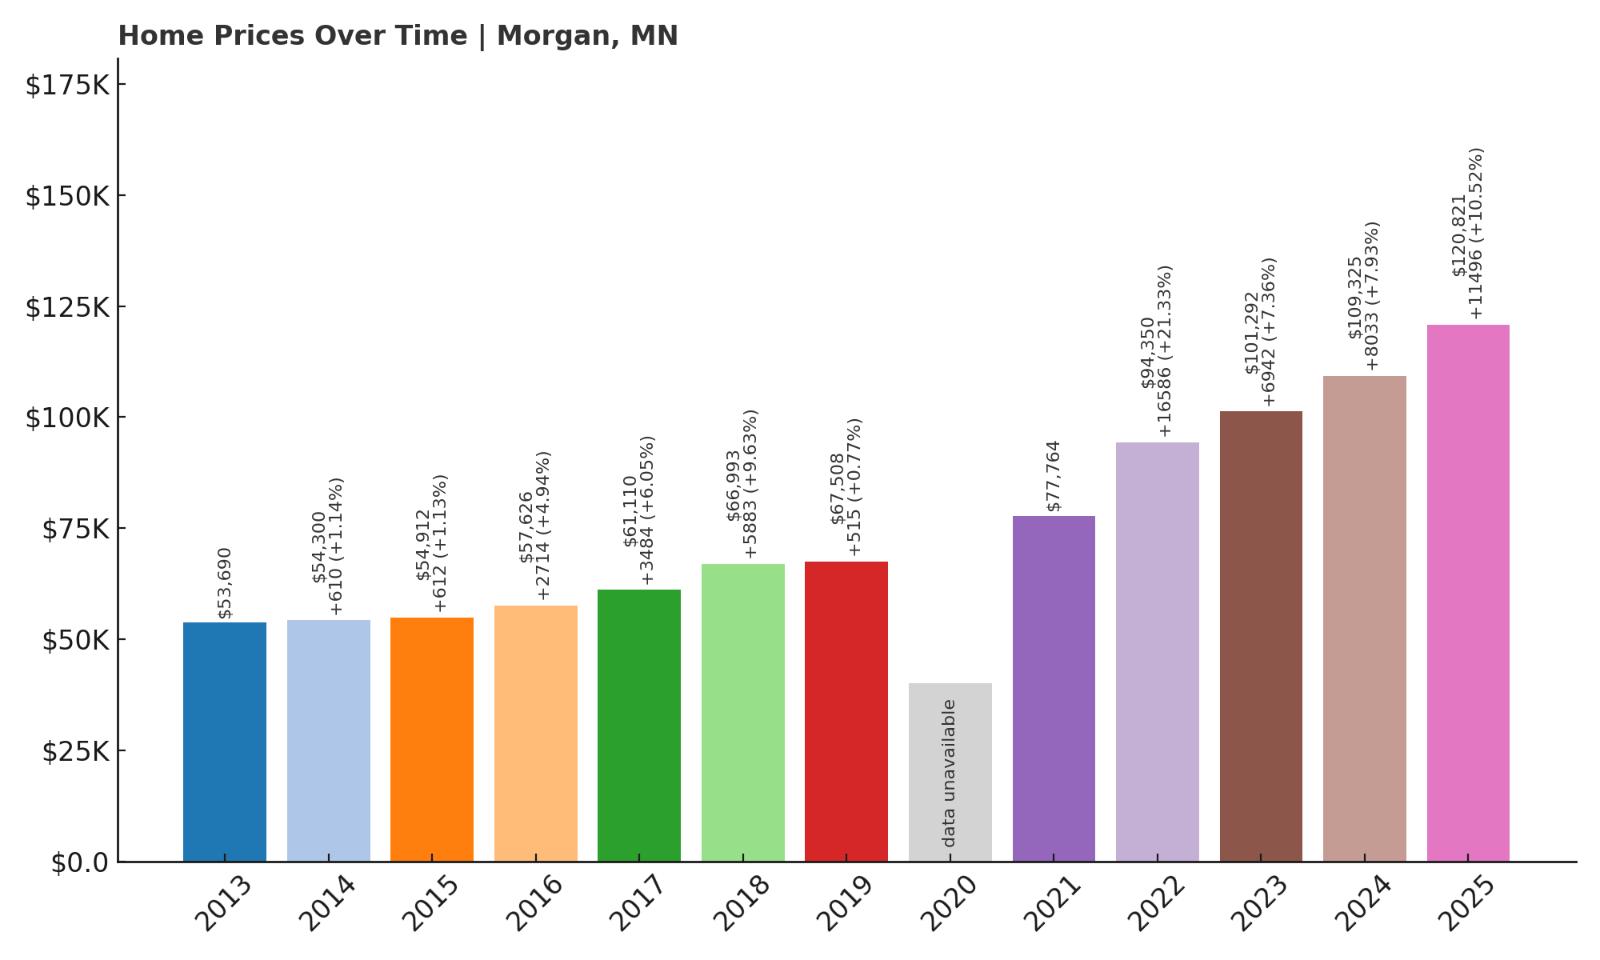
- 2013: $53,690
- 2014: $54,300 (+$610, +1.14% from previous year)
- 2015: $54,912 (+$612, +1.13% from previous year)
- 2016: $57,626 (+$2,715, +4.94% from previous year)
- 2017: $61,110 (+$3,484, +6.05% from previous year)
- 2018: $66,993 (+$5,883, +9.63% from previous year)
- 2019: $67,508 (+$515, +0.77% from previous year)
- 2020: N/A
- 2021: $77,764 (+$10,256, +15.19% from previous year)
- 2022: $94,350 (+$16,586, +21.33% from previous year)
- 2023: $101,292 (+$6,942, +7.36% from previous year)
- 2024: $109,325 (+$8,034, +7.93% from previous year)
- 2025: $120,821 (+$11,495, +10.51% from previous year)
Home prices in Morgan have more than doubled since 2013, rising from $53,690 to $120,821 by 2025. This steep increase includes especially large gains from 2021 onward, suggesting recent demand. Even with a relatively quiet early climb, the market caught momentum in the last five years, making it one of the fastest risers on this list.
Morgan – Small Town, Big Gains in Redwood County
Located in Redwood County, Morgan is a tight-knit farming town with strong community ties. The affordability and rural charm are drawing attention from buyers priced out of other parts of Minnesota. With modest home sizes and accessible infrastructure, Morgan is becoming an appealing destination for those looking to put down roots without overstretching.
The sharp home value increases since 2021 point to new interest in the area, possibly driven by remote work flexibility and the search for lower costs. While it remains affordable compared to statewide averages, the upward trajectory indicates that Morgan’s market is heating up. With further improvements in local facilities or transportation, it could become a sleeper pick for longer-term investment.
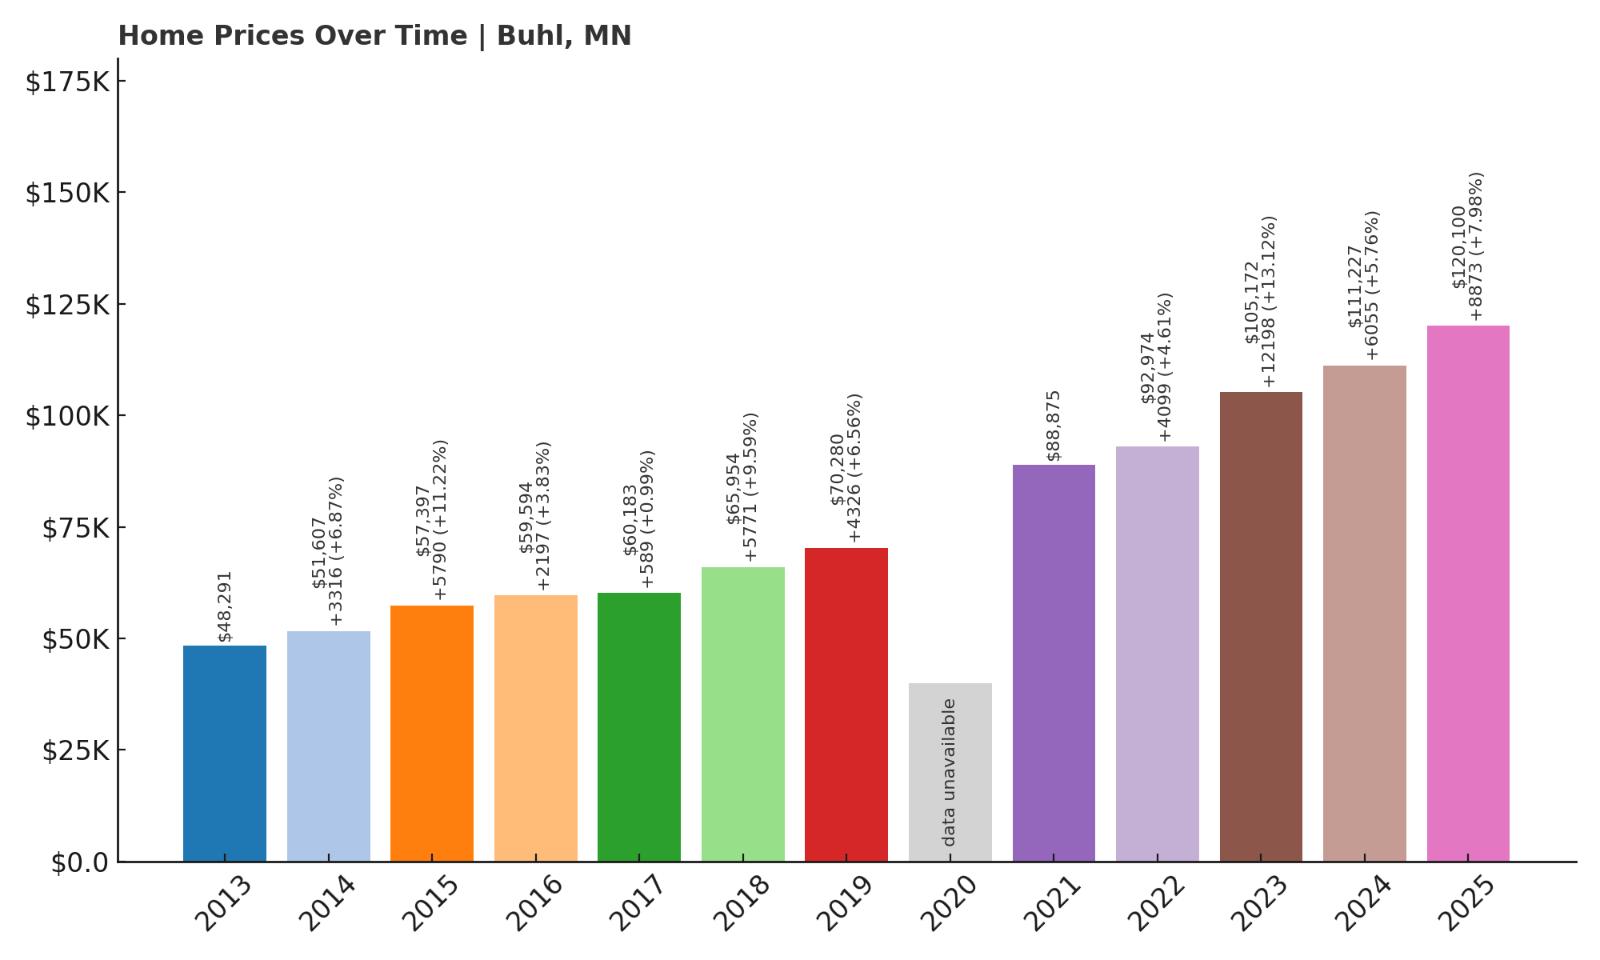
16. Buhl – 149% Home Price Increase Since 2013
- 2010: N/A
- 2011: N/A
- 2012: N/A
- 2013: $48,291
- 2014: $51,607 (+$3,315, +6.87% from previous year)
- 2015: $57,397 (+$5,790, +11.22% from previous year)
- 2016: $59,594 (+$2,197, +3.83% from previous year)
- 2017: $60,183 (+$589, +0.99% from previous year)
- 2018: $65,954 (+$5,771, +9.59% from previous year)
- 2019: $70,280 (+$4,326, +6.56% from previous year)
- 2020: N/A
- 2021: $88,875 (+$18,596, +26.46% from previous year)
- 2022: $92,974 (+$4,099, +4.61% from previous year)
- 2023: $105,172 (+$12,197, +13.12% from previous year)
- 2024: $111,227 (+$6,055, +5.76% from previous year)
- 2025: $120,100 (+$8,873, +7.98% from previous year)
Home values in Buhl have risen nearly 150% since 2013, with prices increasing sharply between 2021 and 2023. The 2025 average of $120,100 shows just how much the market has accelerated, especially in recent years. Despite a lull around 2017, the long-term trend has been consistently upward.
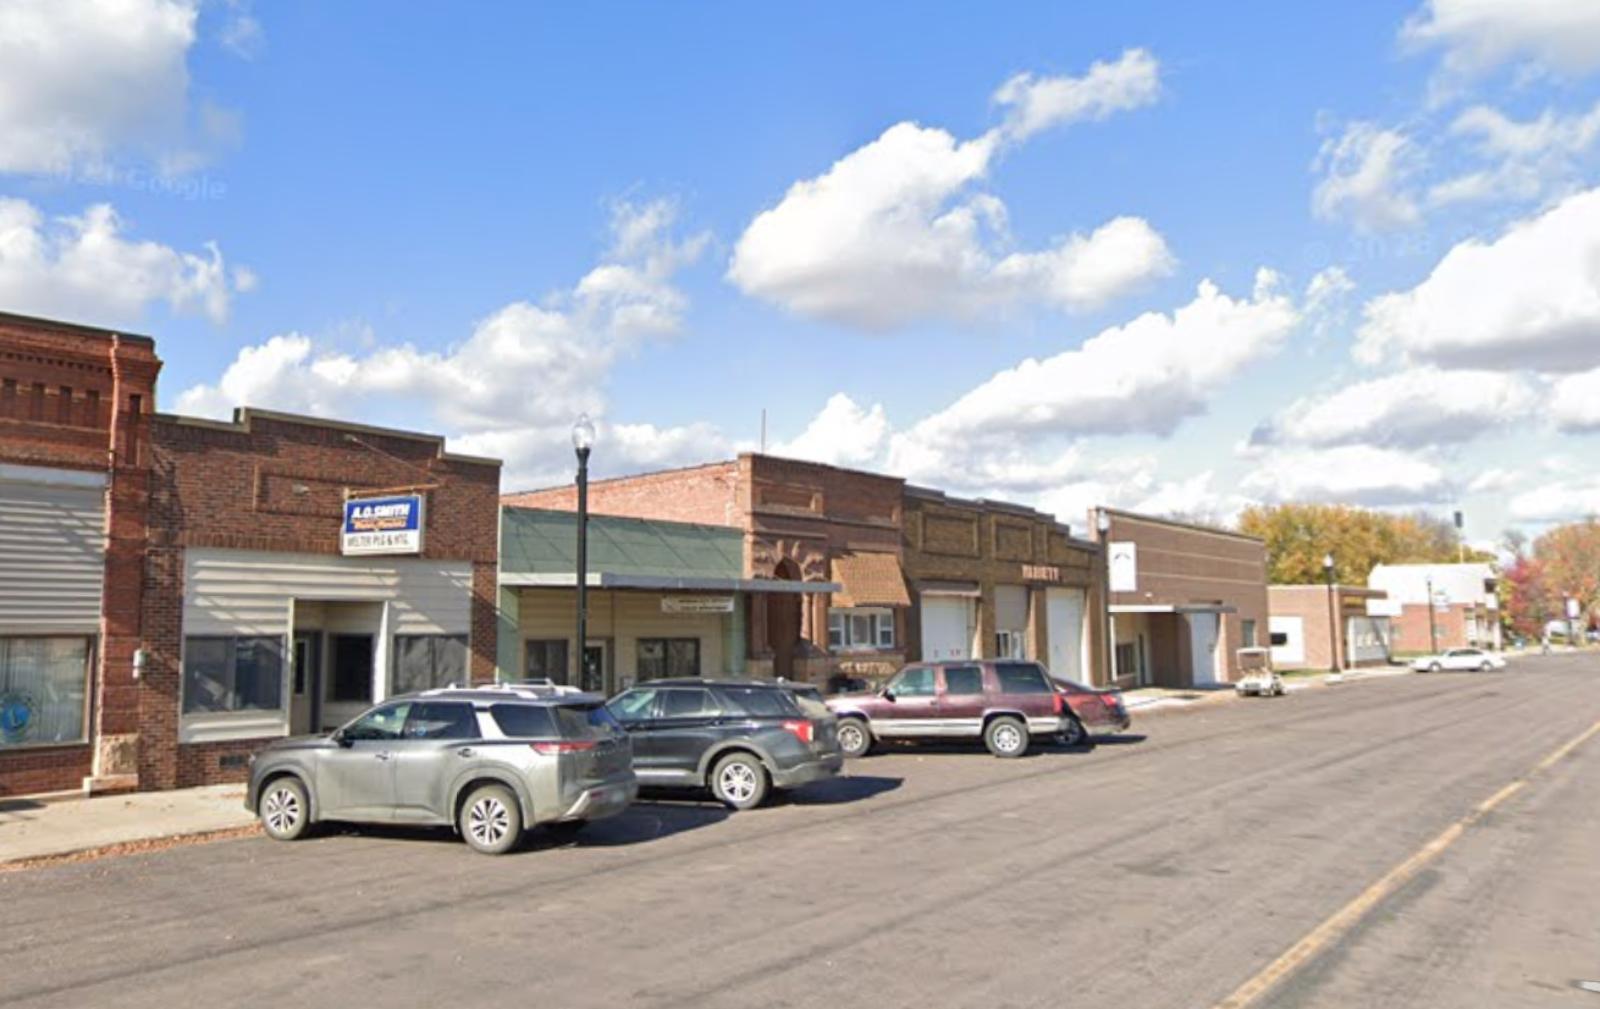
Buhl – Iron Range Roots With New Appeal

Buhl lies in St. Louis County, within Minnesota’s Iron Range. Historically linked to mining, the town has shifted in recent years, drawing buyers interested in affordable alternatives to larger nearby cities. It’s surrounded by lakes and forest, making it attractive to outdoor lovers and second-home seekers alike.
While job opportunities in traditional industries have shrunk, Buhl’s housing market tells a different story. Prices surged after 2020, and the growth has remained steady since. Local charm, low taxes, and access to nature may be helping Buhl reinvent itself. It’s still far below the statewide average in price, yet its growth rate signals strong potential ahead.
15. Hoyt Lakes – 41% Home Price Increase Since 2010
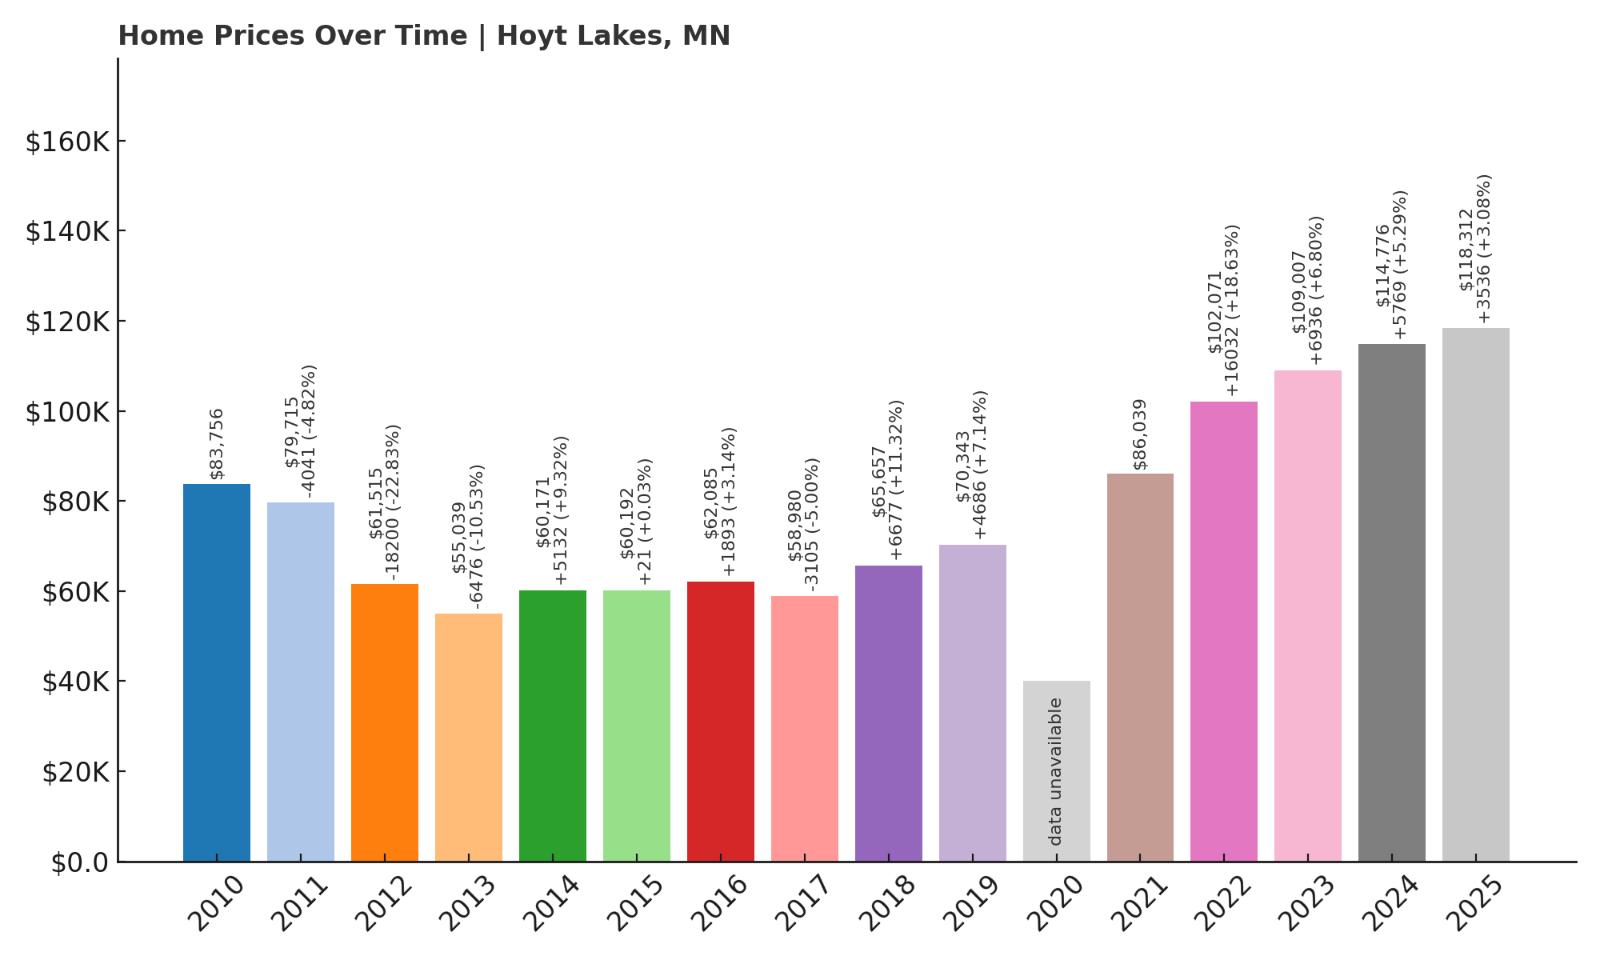
- 2010: $83,756
- 2011: $79,715 ($-4,040, -4.82% from previous year)
- 2012: $61,515 ($-18,200, -22.83% from previous year)
- 2013: $55,039 ($-6,476, -10.53% from previous year)
- 2014: $60,171 (+$5,132, +9.32% from previous year)
- 2015: $60,192 (+$21, +0.04% from previous year)
- 2016: $62,085 (+$1,893, +3.15% from previous year)
- 2017: $58,980 ($-3,105, -5.00% from previous year)
- 2018: $65,657 (+$6,677, +11.32% from previous year)
- 2019: $70,343 (+$4,687, +7.14% from previous year)
- 2020: N/A
- 2021: $86,039 (+$15,696, +22.31% from previous year)
- 2022: $102,071 (+$16,032, +18.63% from previous year)
- 2023: $109,007 (+$6,936, +6.80% from previous year)
- 2024: $114,776 (+$5,769, +5.29% from previous year)
- 2025: $118,312 (+$3,536, +3.08% from previous year)
Hoyt Lakes has had one of the more volatile price trends on this list. After a sharp drop from 2010 to 2013, home values gradually recovered and have since more than rebounded. The town saw a surge beginning in 2021 that brought prices to $118,312 by 2025—an increase of 41% over 15 years, despite a rocky start.
Hoyt Lakes – Bouncing Back in Northern Minnesota
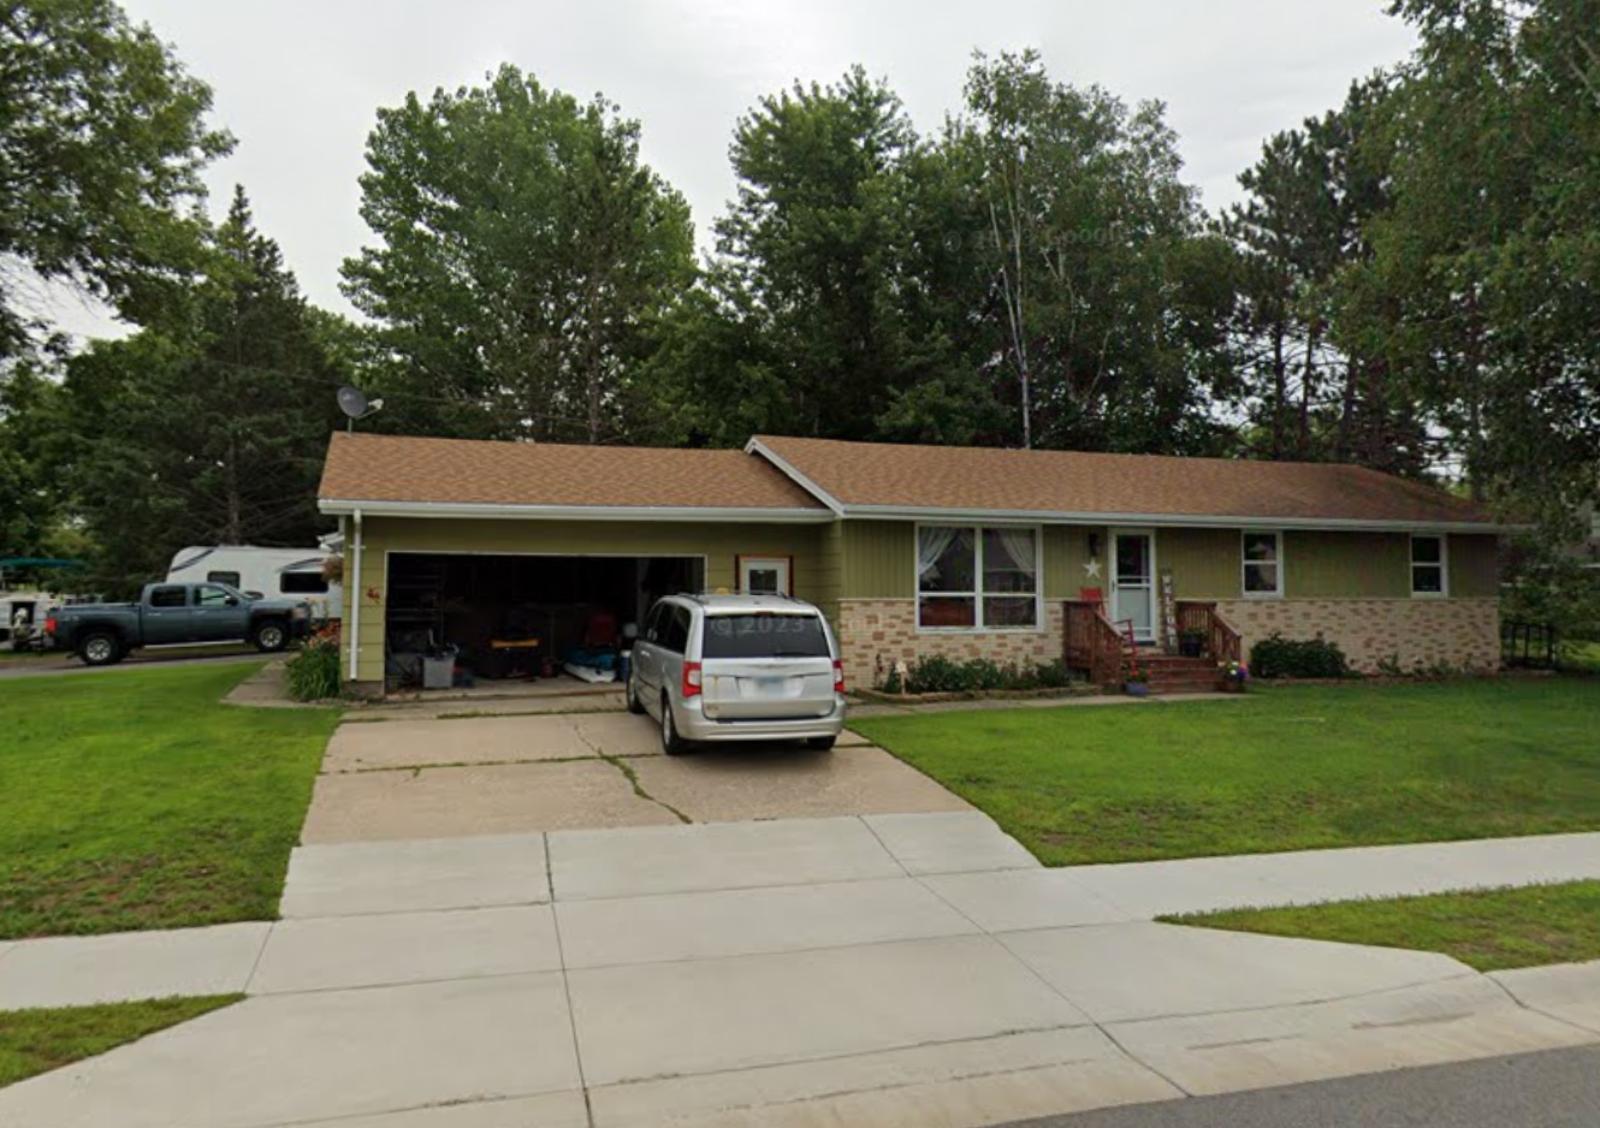
Nestled in northeastern Minnesota, Hoyt Lakes is part of the Iron Range and benefits from scenic surroundings and a close-knit community. The town struggled in the early 2010s with declining home prices, likely tied to economic shifts in mining and manufacturing. But recent years tell a very different story—home values jumped significantly starting in 2021, suggesting renewed interest in the area.
Affordable land, recreational access, and improving infrastructure are playing a part in Hoyt Lakes’ recovery. Fishing, snowmobiling, and lake activities draw a mix of retirees and seasonal visitors. The increase in home values may also reflect growing demand for less expensive housing near larger northern hubs. Though prices remain below the state average, the town is clearly on an upward track.
14. Gilbert – 77% Home Price Increase Since 2010
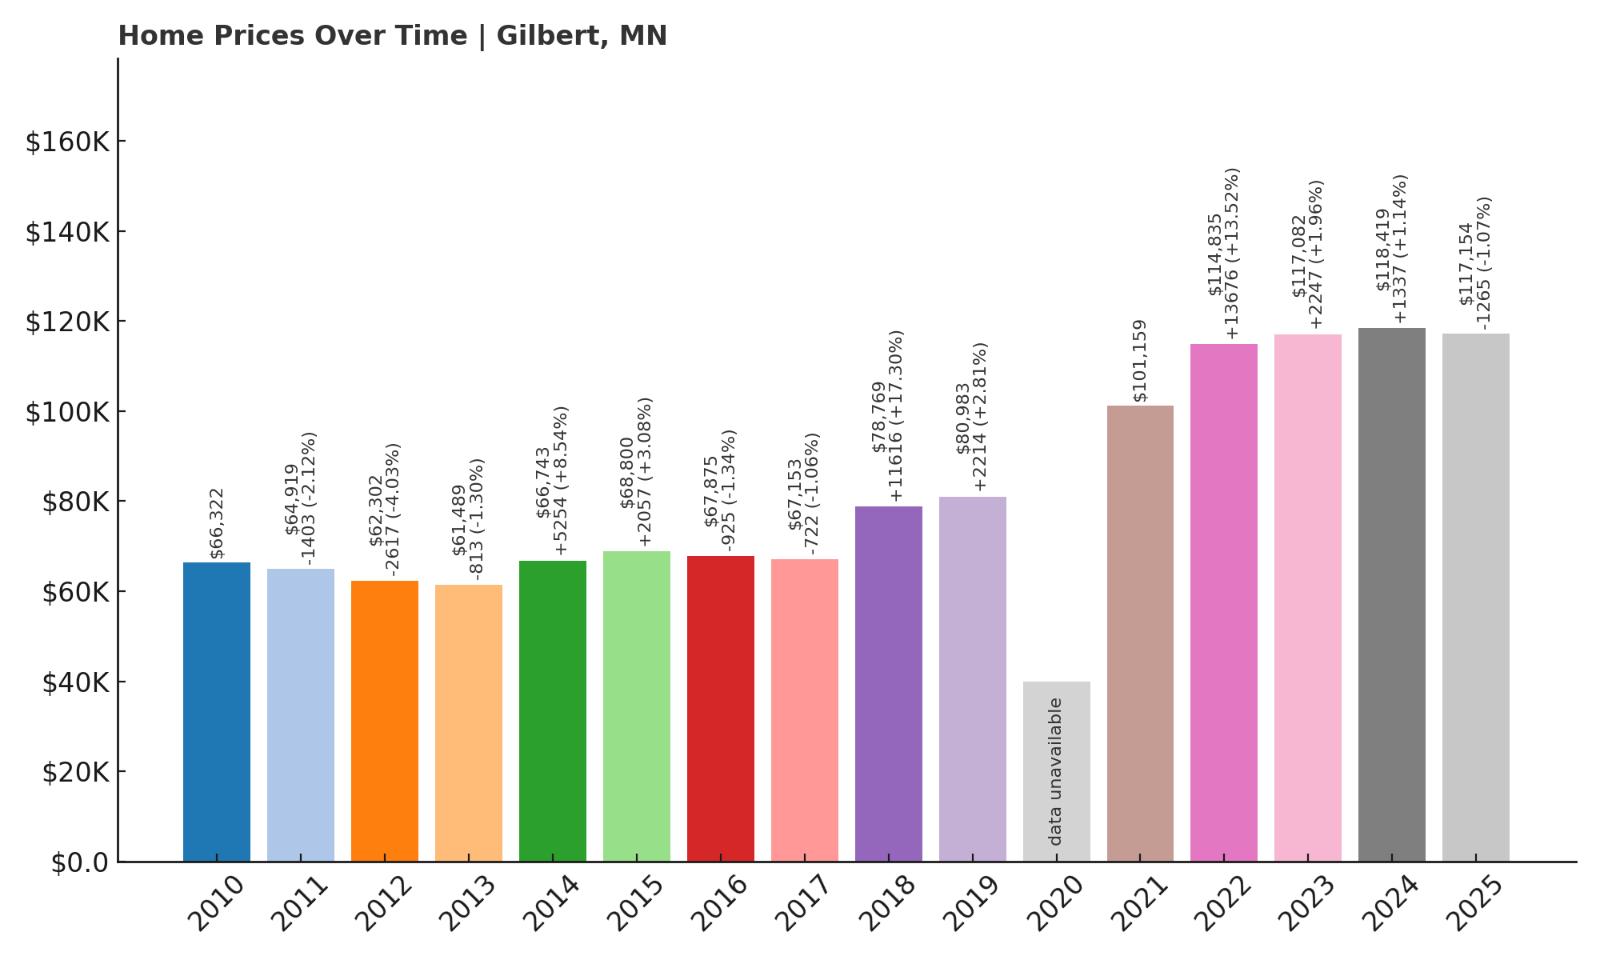
- 2010: $66,322
- 2011: $64,919 ($-1,403, -2.12% from previous year)
- 2012: $62,302 ($-2,616, -4.03% from previous year)
- 2013: $61,489 ($-813, -1.31% from previous year)
- 2014: $66,743 (+$5,253, +8.54% from previous year)
- 2015: $68,800 (+$2,057, +3.08% from previous year)
- 2016: $67,875 ($-924, -1.34% from previous year)
- 2017: $67,153 ($-722, -1.06% from previous year)
- 2018: $78,769 (+$11,616, +17.30% from previous year)
- 2019: $80,983 (+$2,214, +2.81% from previous year)
- 2020: N/A
- 2021: $101,159 (+$20,175, +24.91% from previous year)
- 2022: $114,835 (+$13,676, +13.52% from previous year)
- 2023: $117,082 (+$2,247, +1.96% from previous year)
- 2024: $118,419 (+$1,337, +1.14% from previous year)
- 2025: $117,154 ($-1,265, -1.07% from previous year)
Gilbert’s market has appreciated steadily over time, with a total home price increase of 77% since 2010. While there were minor dips early on, prices climbed sharply after 2018. The town peaked in 2024 at $118,419 before a slight dip in 2025, ending the period at $117,154—still well above where it began.
Gilbert – Iron Range Community With Steady Growth
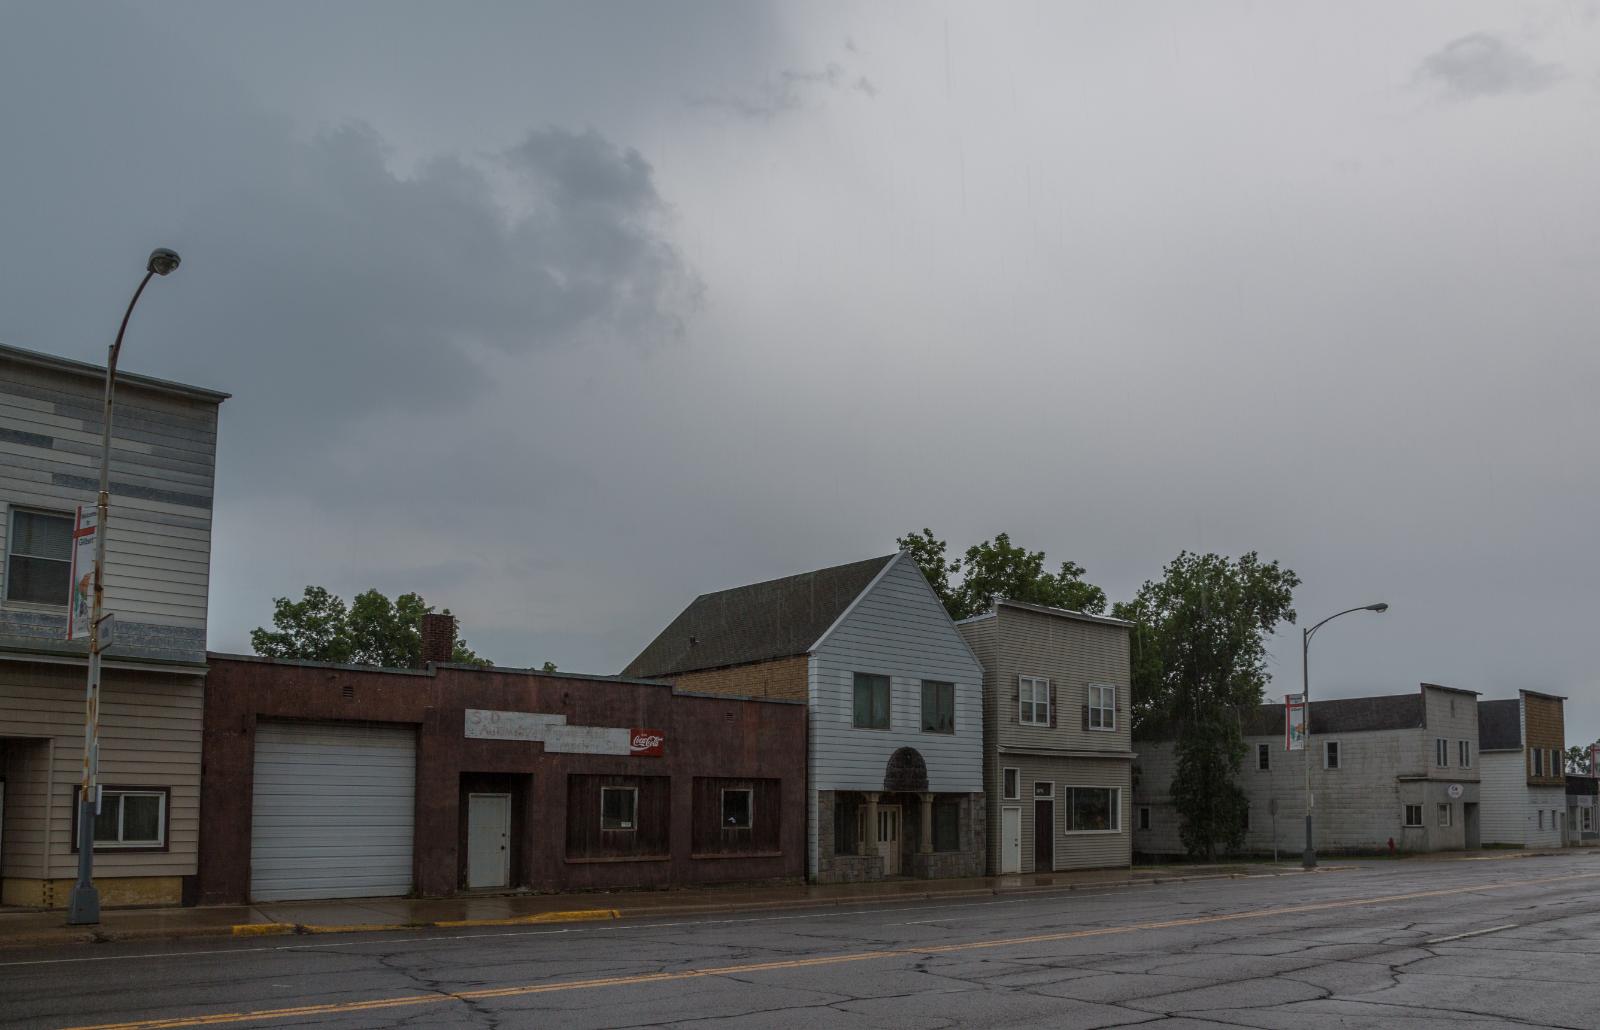
Located in St. Louis County, Gilbert is another Iron Range town that has seen renewed interest in recent years. It offers access to the Mesabi Trail, a draw for cyclists and outdoor enthusiasts, and sits near several other small communities with shared amenities. Though long influenced by mining, Gilbert has seen new attention as buyers look for livable alternatives to pricier parts of Minnesota.
Its housing market has become more dynamic since 2018, possibly reflecting improved access, recreational appeal, and general migration toward smaller towns. Prices remain relatively modest compared to the rest of the state, but the pace of change suggests growing demand. Gilbert’s blend of history, affordability, and outdoor lifestyle is attracting both year-round residents and seasonal homebuyers.
13. Biwabik – 134% Home Price Increase Since 2010
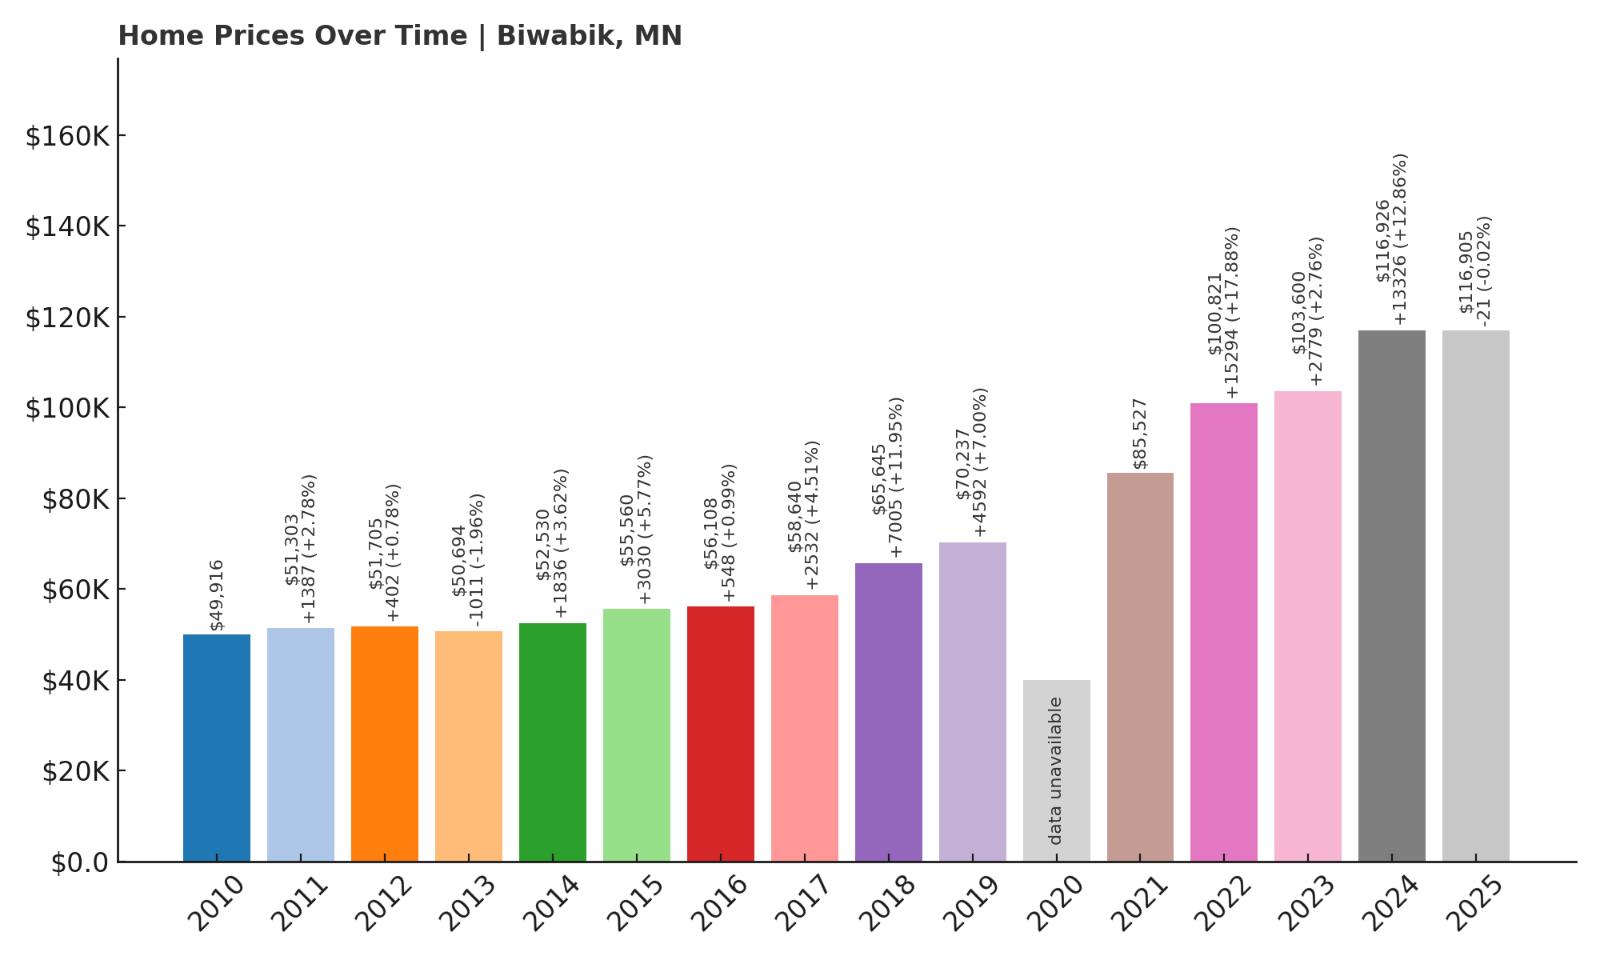
- 2010: $49,916
- 2011: $51,303 (+$1,387, +2.78% from previous year)
- 2012: $51,705 (+$403, +0.79% from previous year)
- 2013: $50,694 ($-1,012, -1.96% from previous year)
- 2014: $52,530 (+$1,836, +3.62% from previous year)
- 2015: $55,560 (+$3,029, +5.77% from previous year)
- 2016: $56,108 (+$548, +0.99% from previous year)
- 2017: $58,640 (+$2,532, +4.51% from previous year)
- 2018: $65,645 (+$7,005, +11.95% from previous year)
- 2019: $70,237 (+$4,592, +6.99% from previous year)
- 2020: N/A
- 2021: $85,527 (+$15,290, +21.77% from previous year)
- 2022: $100,821 (+$15,294, +17.88% from previous year)
- 2023: $103,600 (+$2,779, +2.76% from previous year)
- 2024: $116,926 (+$13,326, +12.86% from previous year)
- 2025: $116,905 ($-20, -0.02% from previous year)
Biwabik has seen home values climb from just under $50,000 in 2010 to nearly $117,000 in 2025—a 134% increase. Growth accelerated especially after 2020, with big gains continuing through 2024. While 2025 saw a marginal drop, the overall trend remains very strong for this Iron Range town.
Biwabik – A Scenic, Affordable Gateway to Giants Ridge
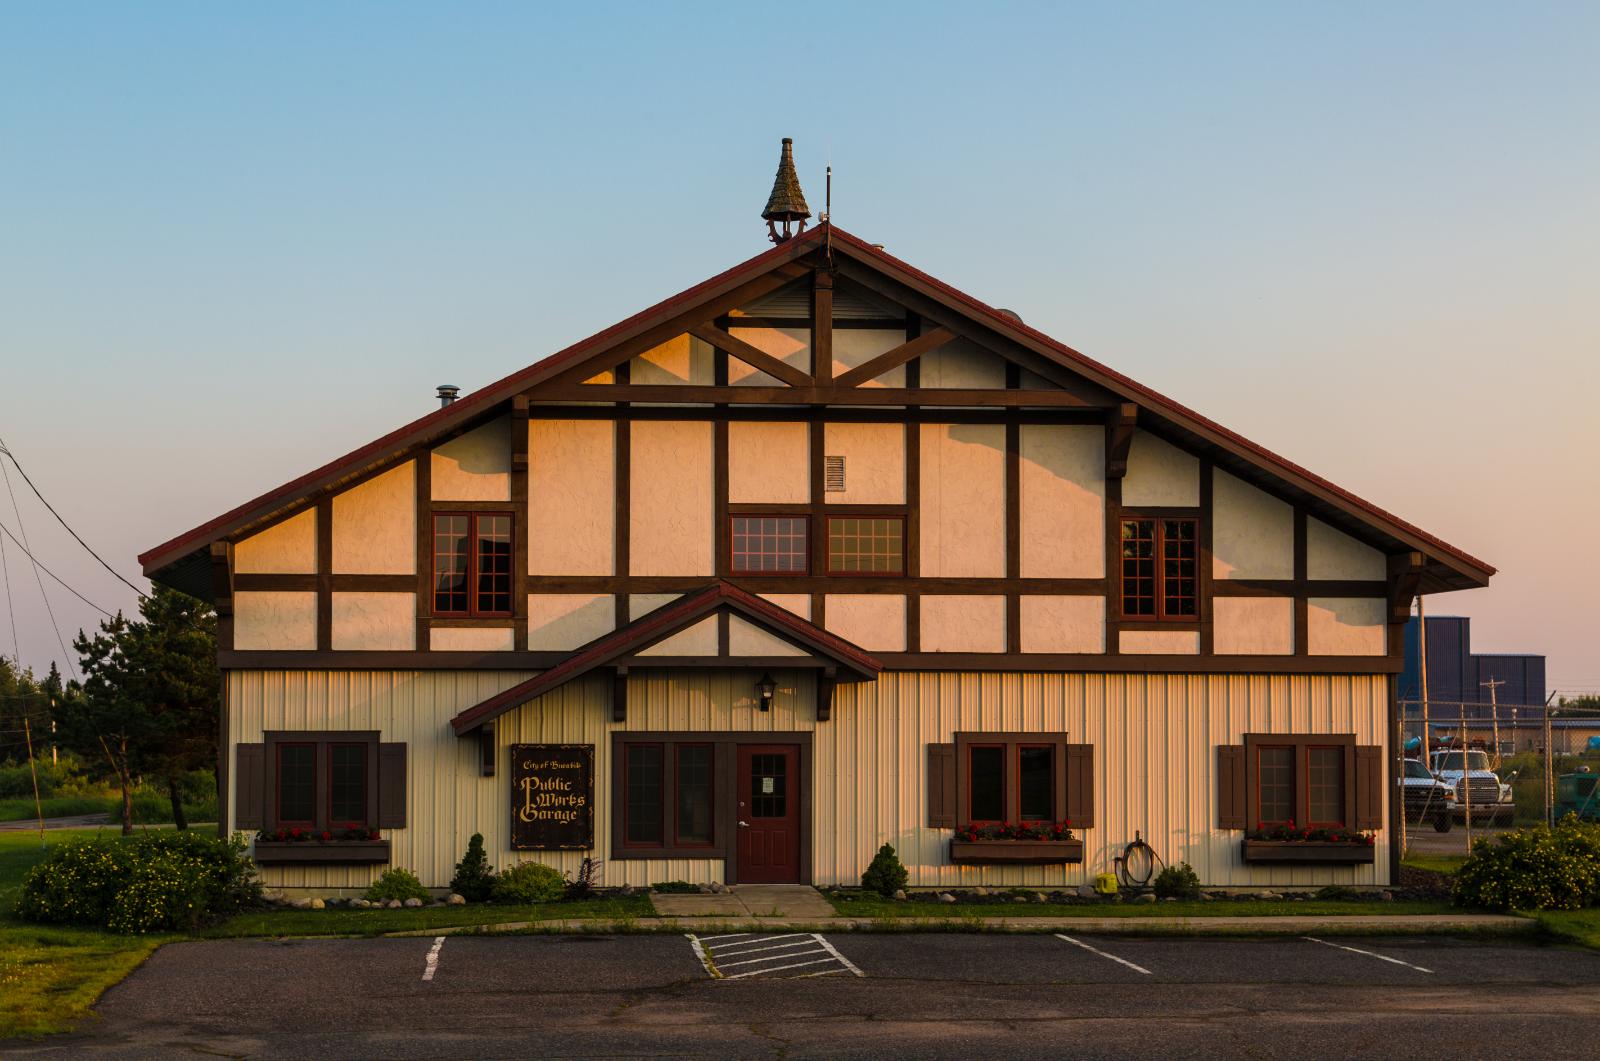
Biwabik is best known for its proximity to Giants Ridge, a popular ski and golf destination in northeastern Minnesota. This has helped the town stand out among Iron Range communities, drawing more seasonal homeowners and recreational visitors. The charming main street, Nordic influences, and natural surroundings make Biwabik a unique option in the region.
The surge in home values reflects that appeal. With improved tourism infrastructure and outdoor amenities, demand has increased—especially post-2020, when lifestyle shifts drove interest in quieter, greener spaces. Even with rising prices, Biwabik remains accessible compared to metro suburbs. For anyone seeking an affordable launchpad into the outdoors, it’s worth a serious look.
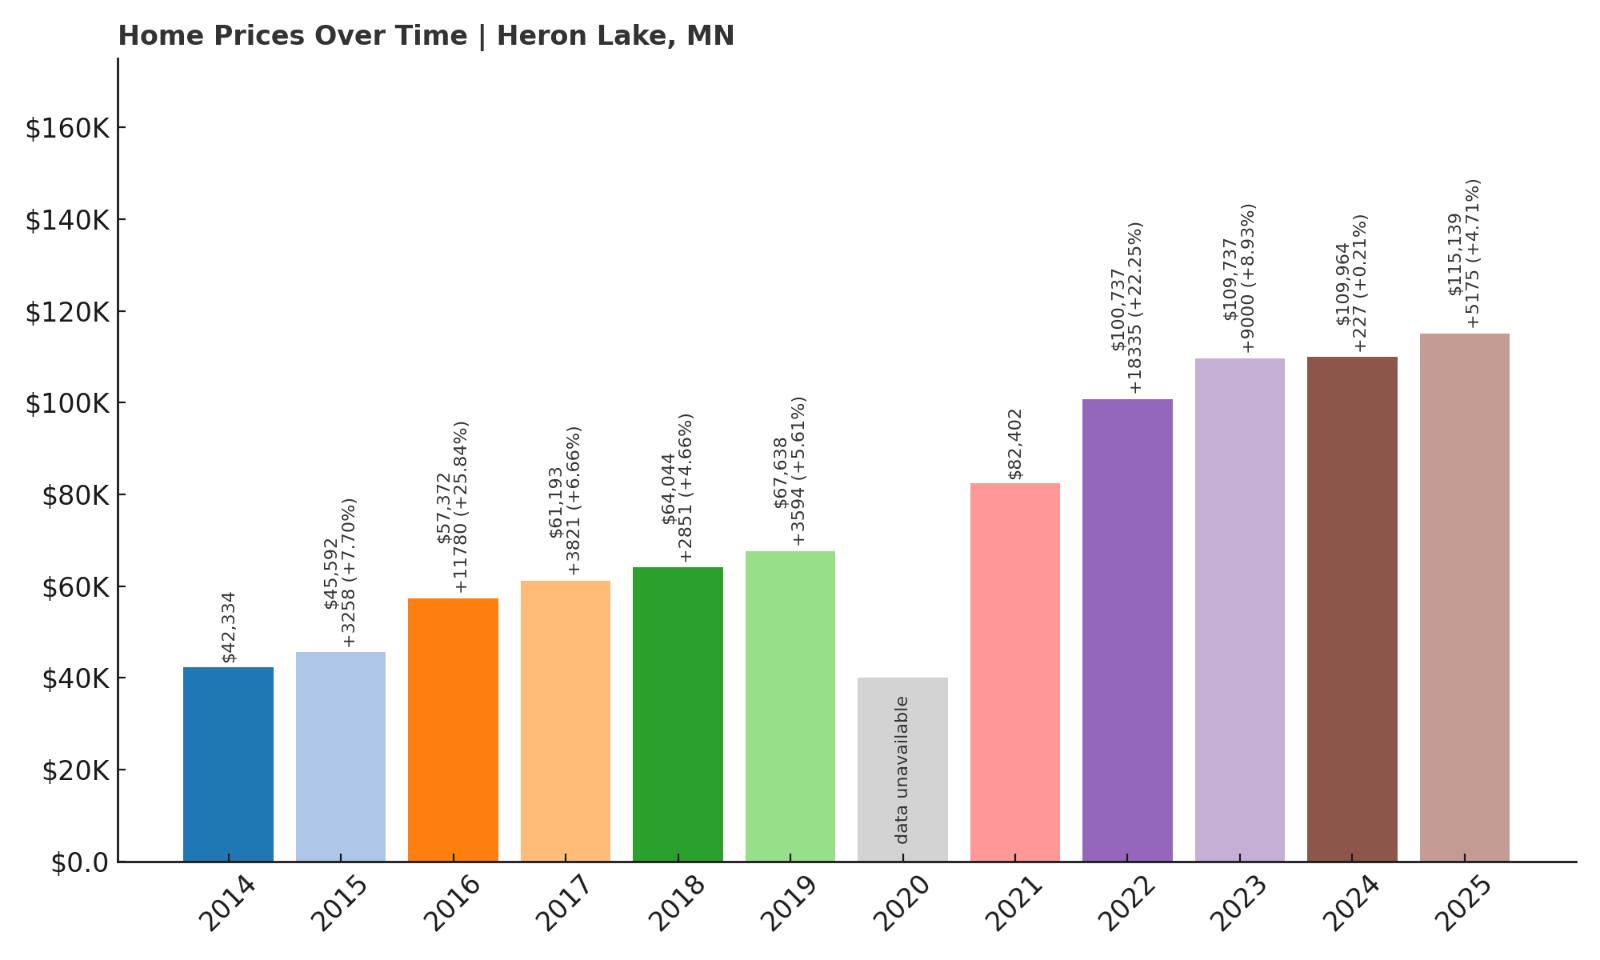
12. Heron Lake – 172% Home Price Increase Since 2014
🔥 Would you like to save this?
- 2010: N/A
- 2011: N/A
- 2012: N/A
- 2013: N/A
- 2014: $42,334
- 2015: $45,592 (+$3,258, +7.69% from previous year)
- 2016: $57,372 (+$11,780, +25.84% from previous year)
- 2017: $61,193 (+$3,821, +6.66% from previous year)
- 2018: $64,044 (+$2,851, +4.66% from previous year)
- 2019: $67,638 (+$3,594, +5.61% from previous year)
- 2020: N/A
- 2021: $82,402 (+$14,764, +21.83% from previous year)
- 2022: $100,737 (+$18,335, +22.25% from previous year)
- 2023: $109,737 (+$9,000, +8.93% from previous year)
- 2024: $109,964 (+$227, +0.21% from previous year)
- 2025: $115,139 (+$5,175, +4.71% from previous year)
Heron Lake’s home values have surged by over 170% since 2014, jumping from $42,334 to $115,139 in 2025. While there was already steady growth in the late 2010s, the largest leaps came after 2020. The town has since held on to those gains, suggesting lasting demand in this small southwestern Minnesota market.
Heron Lake – Strong Growth in a Quiet Agricultural Hub
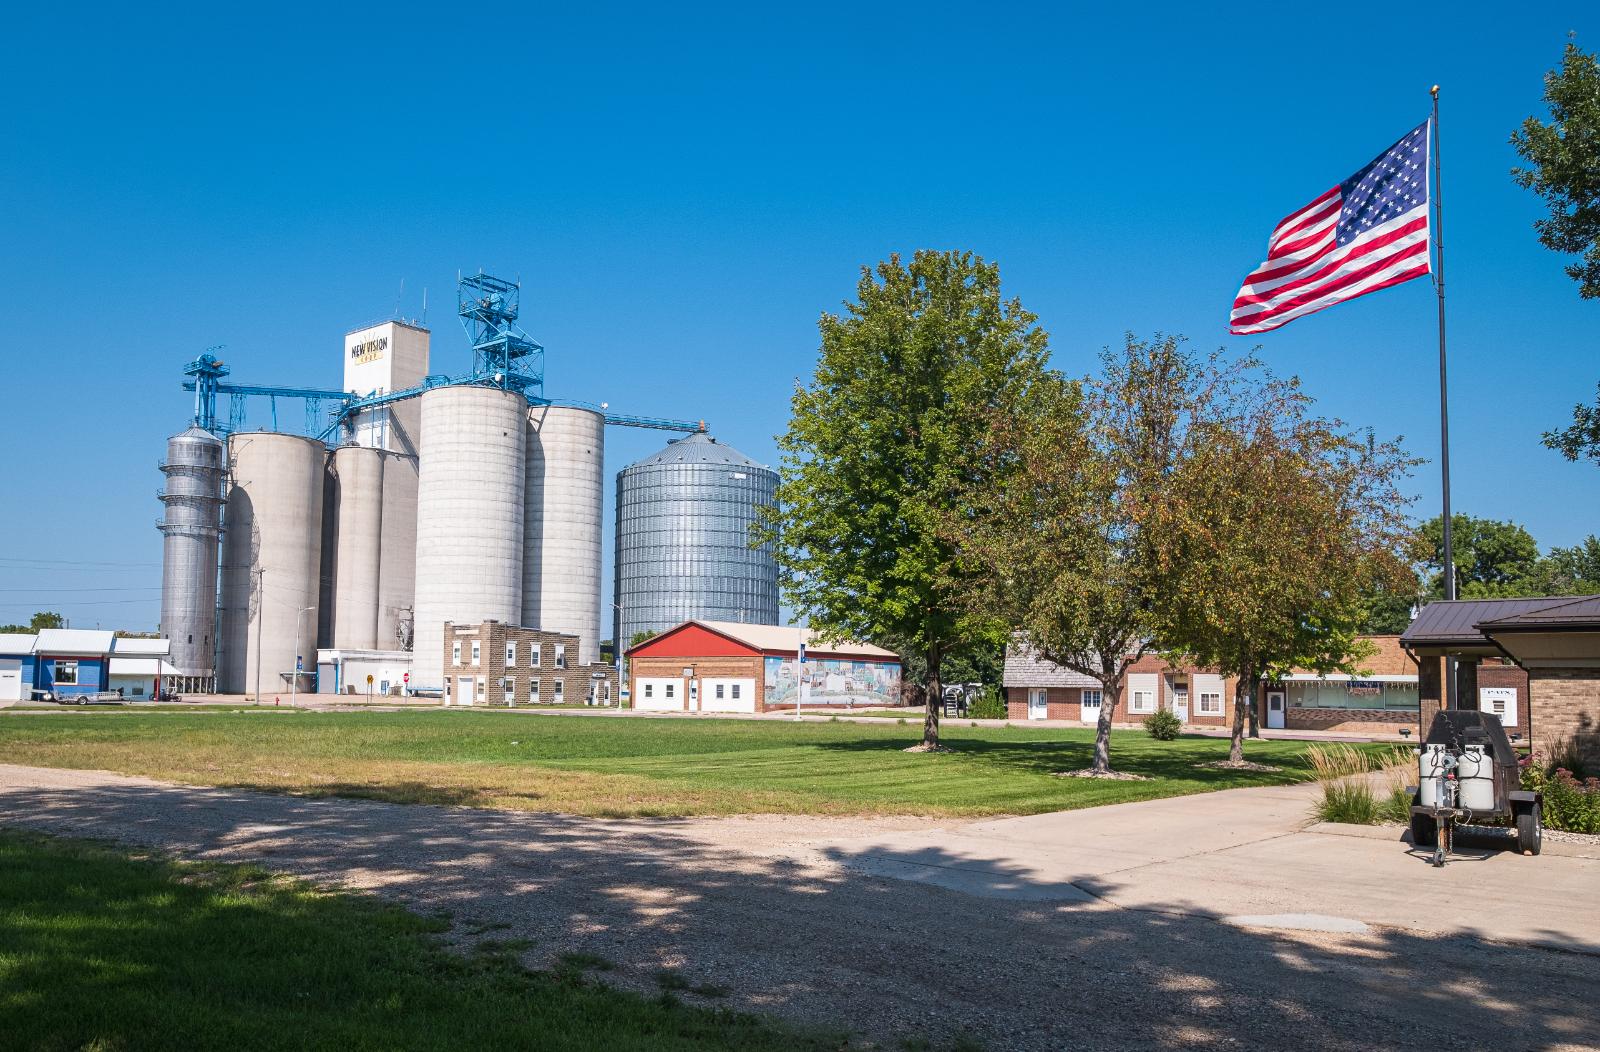
Heron Lake is located in Jackson County, surrounded by farmland and prairie. It’s a small community with fewer than 700 residents, and much of its character is shaped by agriculture and outdoor access. With the nearby Heron Lake Wildlife Management Area, it’s a quiet, nature-adjacent place that’s beginning to draw attention for its low-cost housing and relaxed pace of life.
The housing market here has undergone a transformation in the past five years. A mix of pent-up demand and limited inventory likely contributed to the sharp price increases after 2020. Yet even with its gains, the town remains among the most affordable in the state. Heron Lake proves that low-cost housing doesn’t always mean stagnation—it can also signal opportunity for those willing to look beyond larger towns.
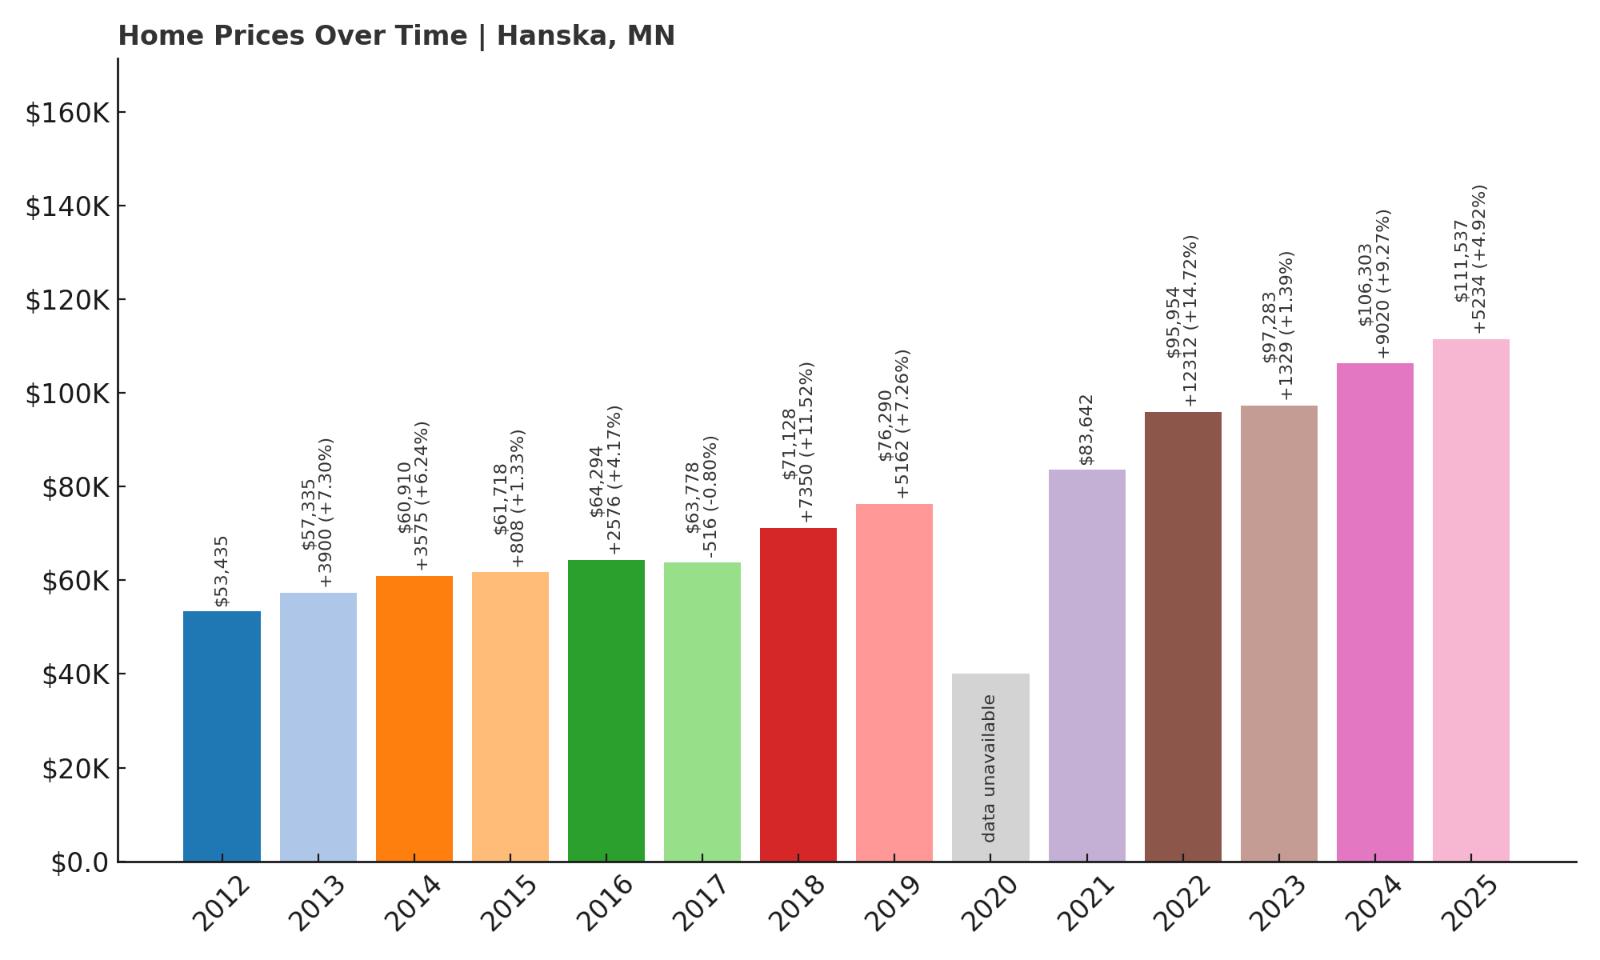
11. Hanska – 109% Home Price Increase Since 2012
- 2010: N/A
- 2011: N/A
- 2012: $53,435
- 2013: $57,335 (+$3,900, +7.30% from previous year)
- 2014: $60,910 (+$3,574, +6.23% from previous year)
- 2015: $61,718 (+$809, +1.33% from previous year)
- 2016: $64,294 (+$2,576, +4.17% from previous year)
- 2017: $63,778 ($-516, -0.80% from previous year)
- 2018: $71,128 (+$7,349, +11.52% from previous year)
- 2019: $76,290 (+$5,162, +7.26% from previous year)
- 2020: N/A
- 2021: $83,642 (+$7,353, +9.64% from previous year)
- 2022: $95,954 (+$12,312, +14.72% from previous year)
- 2023: $97,283 (+$1,329, +1.38% from previous year)
- 2024: $106,303 (+$9,020, +9.27% from previous year)
- 2025: $111,537 (+$5,234, +4.92% from previous year)
Since 2012, Hanska’s home prices have more than doubled, rising from $53,435 to $111,537 by 2025. While growth wasn’t always rapid, it was consistent. The strongest increases came after 2020, and prices have remained stable since, with small but steady gains continuing into 2025.
Hanska – Affordable Living With Long-Term Gains
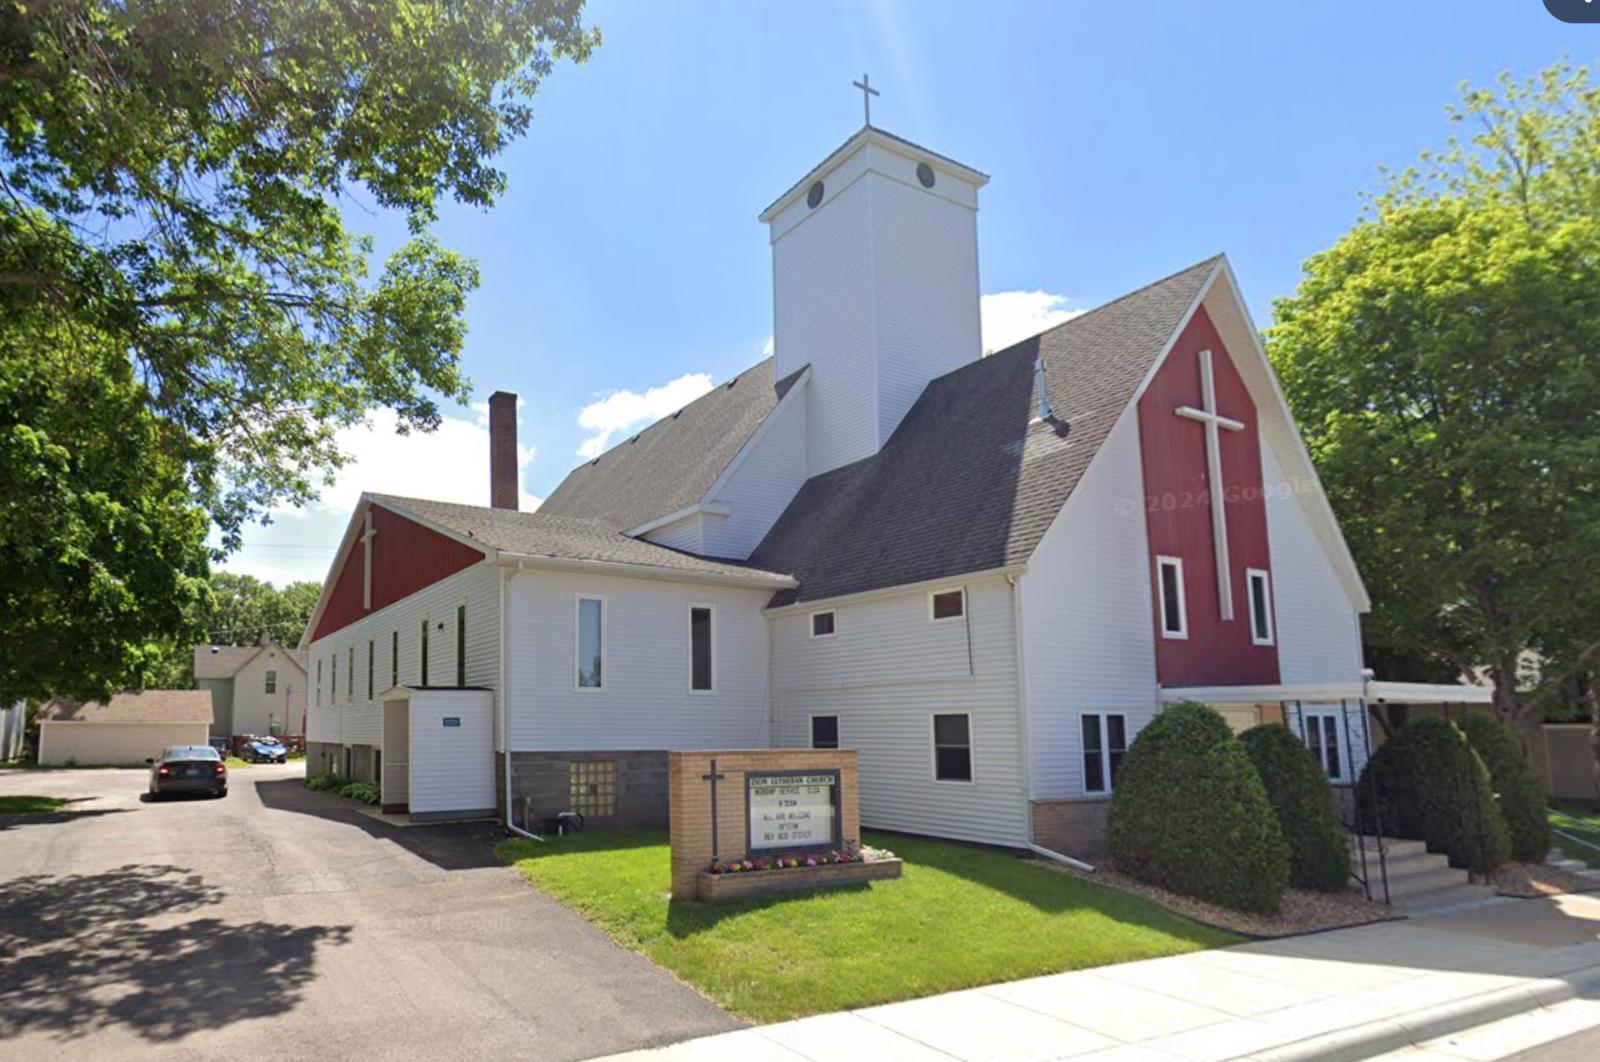
Located in Brown County, Hanska is a quiet rural town with deep Scandinavian roots. Its modest population and low traffic make it ideal for those seeking a peaceful environment without venturing too far from services—New Ulm is just a short drive away. The housing market here has stayed under the radar but rewarded those who bought in early.
The recent uptick in values may be due to renewed interest in smaller towns following broader housing shifts in the state. Hanska offers affordability with room for appreciation, making it attractive to remote workers, retirees, or families looking to buy their first home. The consistent gains since 2020 indicate that the market here has staying power.
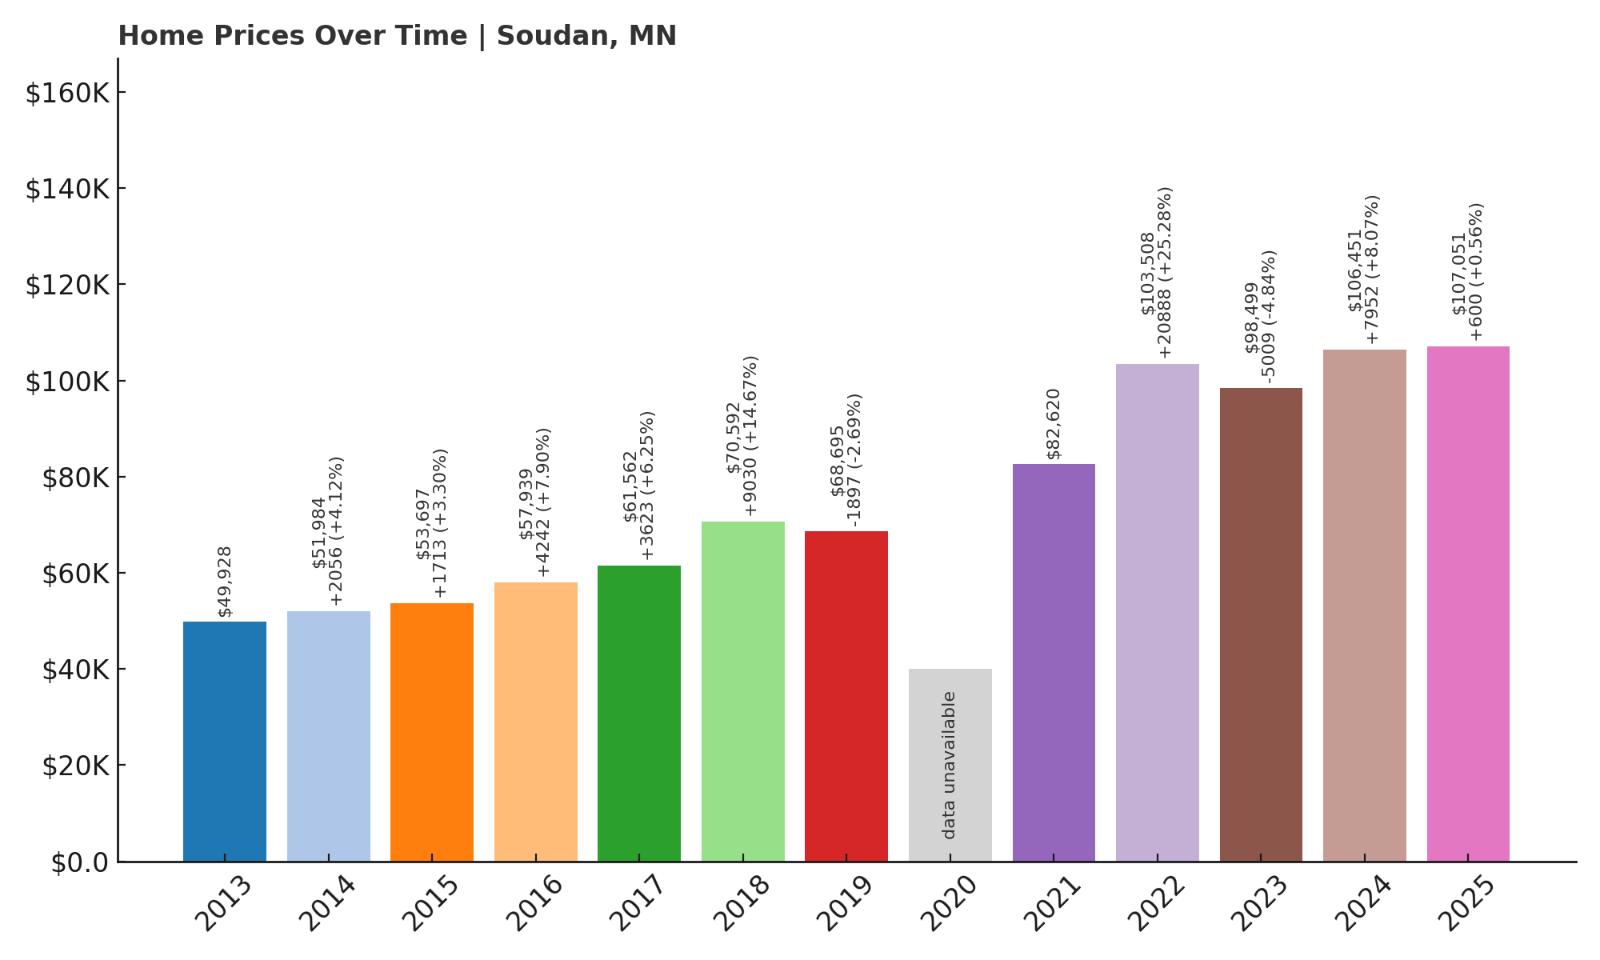
10. Soudan – 114% Home Price Increase Since 2013
- 2010: N/A
- 2011: N/A
- 2012: N/A
- 2013: $49,928
- 2014: $51,984 (+$2,056, +4.12% from previous year)
- 2015: $53,697 (+$1,712, +3.29% from previous year)
- 2016: $57,939 (+$4,242, +7.90% from previous year)
- 2017: $61,562 (+$3,623, +6.25% from previous year)
- 2018: $70,592 (+$9,029, +14.67% from previous year)
- 2019: $68,695 ($-1,897, -2.69% from previous year)
- 2020: N/A
- 2021: $82,620 (+$13,926, +20.27% from previous year)
- 2022: $103,508 (+$20,888, +25.28% from previous year)
- 2023: $98,499 ($-5,009, -4.84% from previous year)
- 2024: $106,451 (+$7,952, +8.07% from previous year)
- 2025: $107,051 (+$600, +0.56% from previous year)
Soudan’s home prices have climbed from $49,928 in 2013 to $107,051 in 2025—a gain of over 114%. While prices dipped briefly in 2019 and again slightly in 2023, the general trend has been upward, particularly from 2020 to 2022 when prices saw double-digit yearly increases.
Soudan – Gateway to Adventure With Climbing Prices
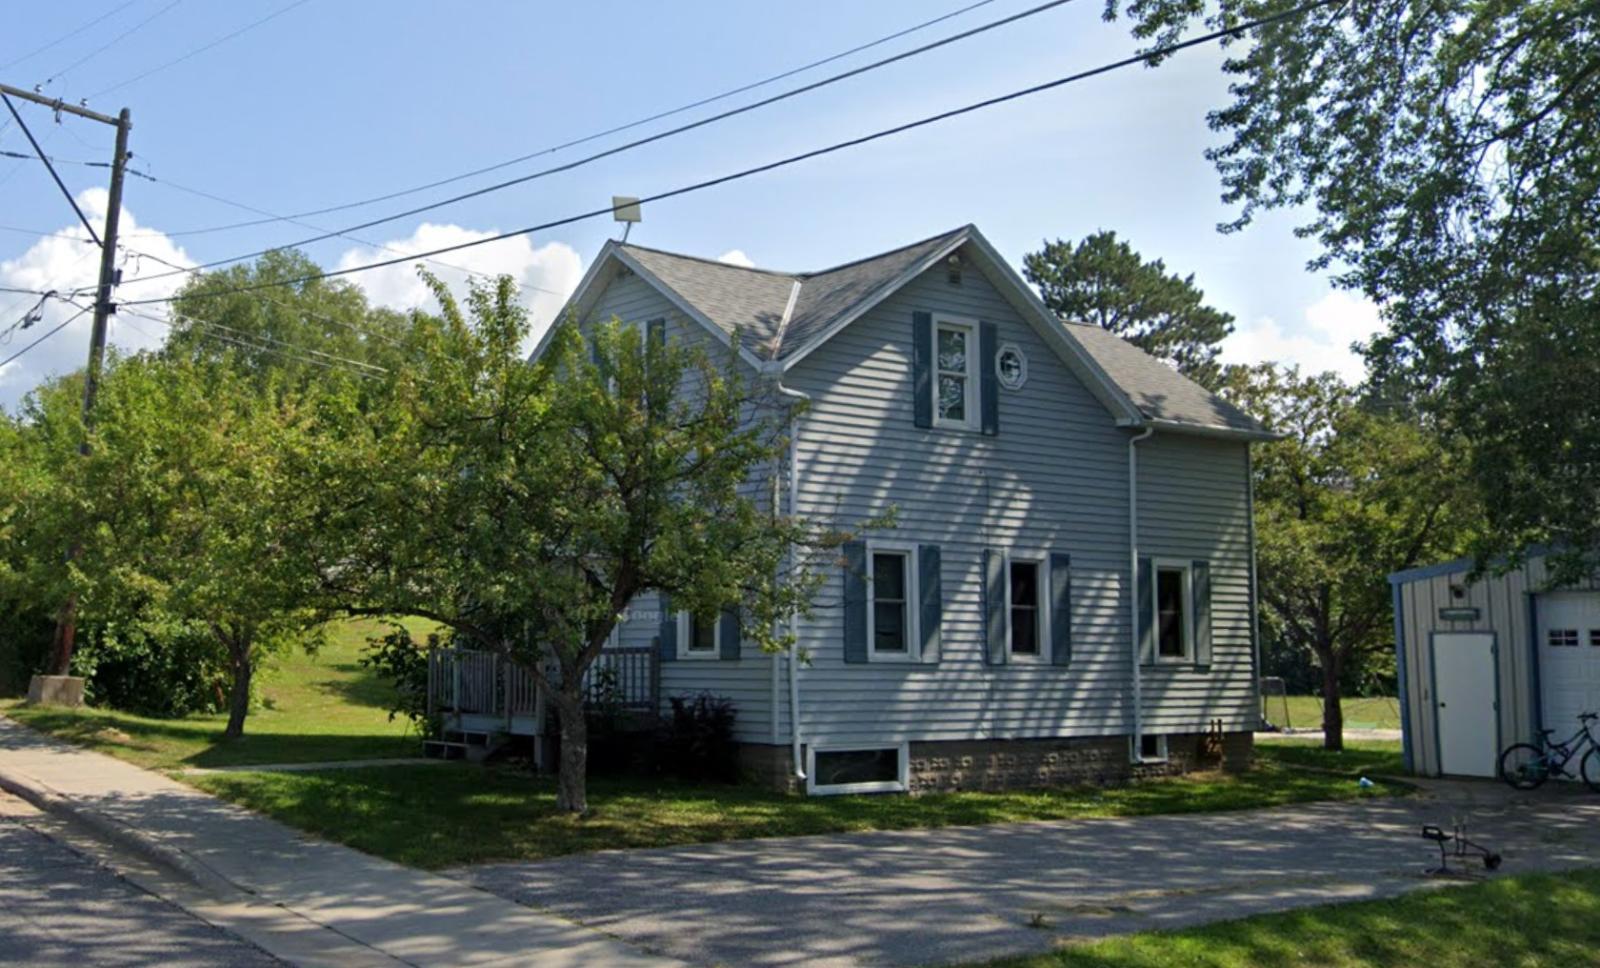
Situated near Lake Vermilion in northeastern Minnesota, Soudan is a small community known for its historic iron mine and stunning natural surroundings. It’s the kind of place where fishing, hiking, and snowshoeing are part of everyday life. The nearby Soudan Underground Mine State Park adds character and brings occasional tourist traffic to this otherwise quiet area.
Housing here has become more valuable in recent years as more Minnesotans and out-of-state buyers look for affordable retreats with access to outdoor activities. The surge in 2021 and 2022 suggests a pandemic-era interest in rural property that hasn’t fully faded. Even with some cooling in 2023, prices bounced back in 2024 and held steady in 2025, pointing to ongoing interest.
9. Chisholm – 92% Home Price Increase Since 2010
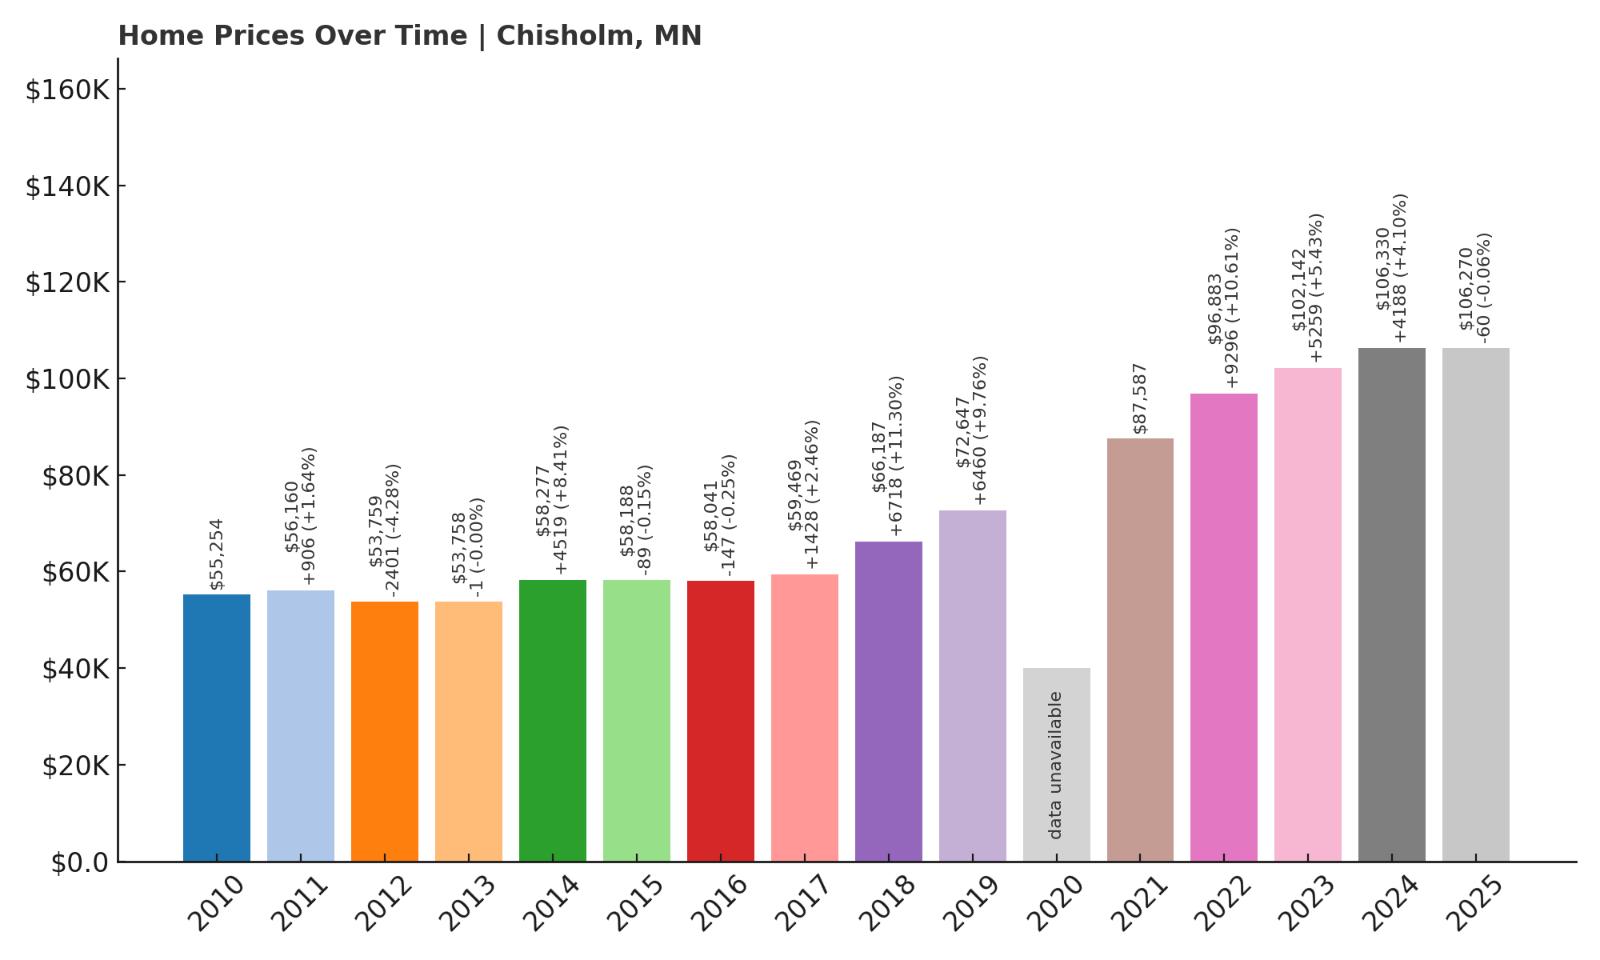
- 2010: $55,254
- 2011: $56,160 (+$907, +1.64% from previous year)
- 2012: $53,759 ($-2,402, -4.28% from previous year)
- 2013: $53,758 ($-1, -0.00% from previous year)
- 2014: $58,277 (+$4,519, +8.41% from previous year)
- 2015: $58,188 ($-89, -0.15% from previous year)
- 2016: $58,041 ($-147, -0.25% from previous year)
- 2017: $59,469 (+$1,428, +2.46% from previous year)
- 2018: $66,187 (+$6,718, +11.30% from previous year)
- 2019: $72,647 (+$6,460, +9.76% from previous year)
- 2020: N/A
- 2021: $87,587 (+$14,940, +20.57% from previous year)
- 2022: $96,883 (+$9,296, +10.61% from previous year)
- 2023: $102,142 (+$5,259, +5.43% from previous year)
- 2024: $106,330 (+$4,188, +4.10% from previous year)
- 2025: $106,270 ($-60, -0.06% from previous year)
Chisholm’s home prices have increased 92% since 2010, with strong acceleration between 2018 and 2022. The market has leveled out since then, but the gains have largely held. At $106,270 in 2025, prices are still well under Minnesota’s average, keeping the town firmly in the affordable category.
Chisholm – A Historic Iron Range Town With Room to Grow
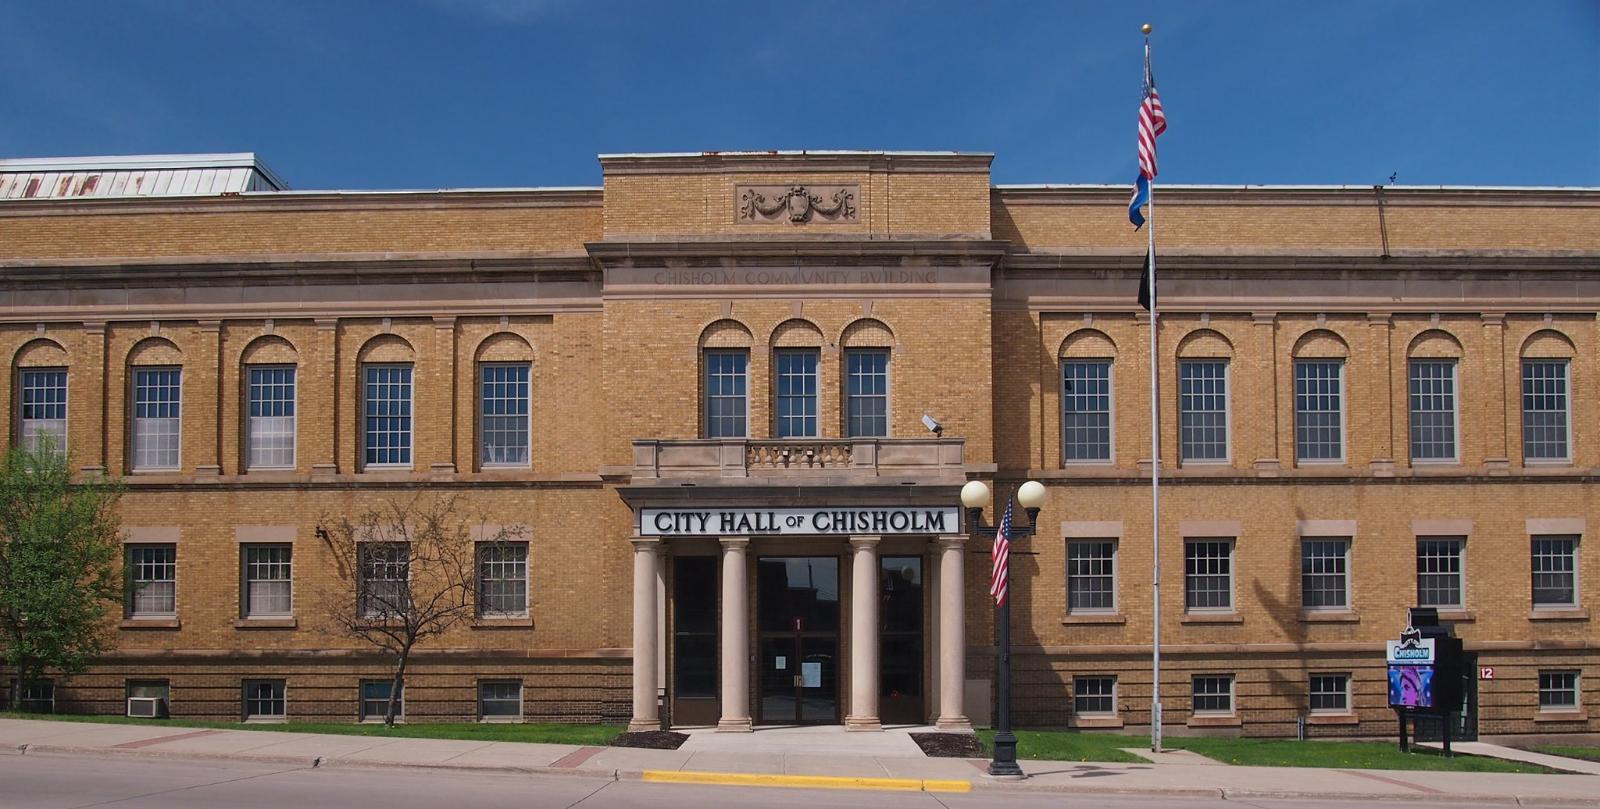
Chisholm is one of the larger communities on Minnesota’s Iron Range, and its mining history runs deep. With a charming downtown, a mining museum, and access to lakes and forests, it blends heritage with natural beauty. The housing stock is older but well maintained, and the community retains a strong local identity.
The increase in home prices since 2018 suggests growing interest, possibly from those seeking space and affordability in northern Minnesota. While the market cooled slightly after 2022, prices remained stable. Chisholm continues to offer long-term value and livability, especially for buyers who appreciate a balance of history, small-town infrastructure, and access to nature.
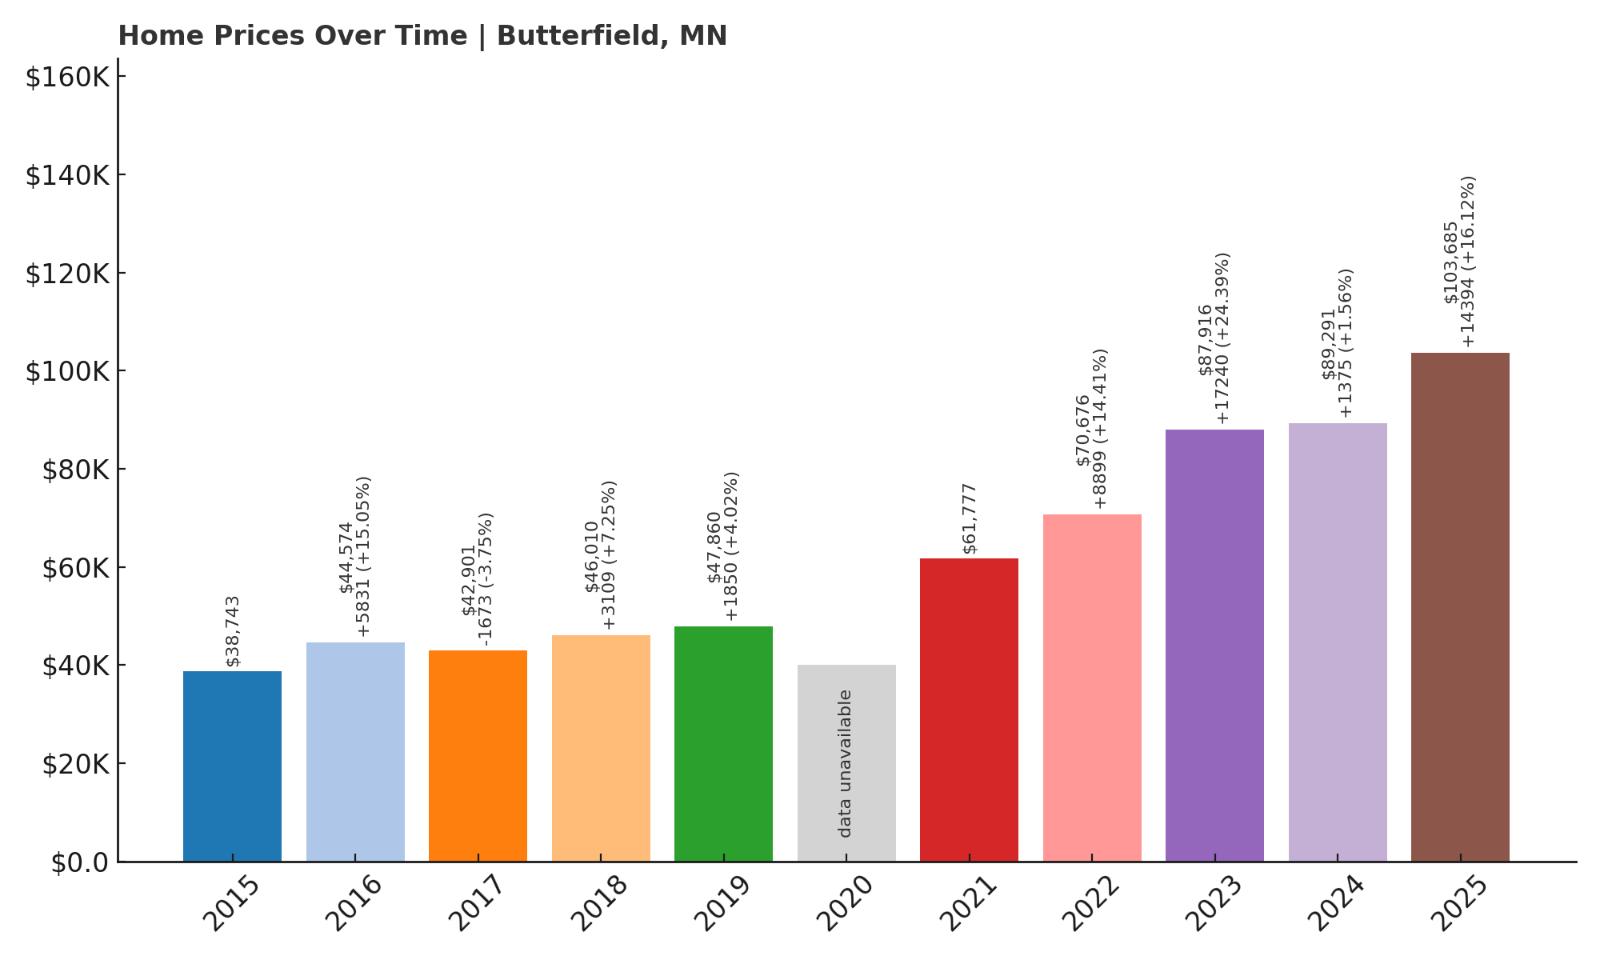
8. Butterfield – 167% Home Price Increase Since 2015
- 2010: N/A
- 2011: N/A
- 2012: N/A
- 2013: N/A
- 2014: N/A
- 2015: $38,743
- 2016: $44,574 (+$5,831, +15.05% from previous year)
- 2017: $42,901 ($-1,674, -3.75% from previous year)
- 2018: $46,010 (+$3,109, +7.25% from previous year)
- 2019: $47,860 (+$1,851, +4.02% from previous year)
- 2020: N/A
- 2021: $61,777 (+$13,917, +29.08% from previous year)
- 2022: $70,676 (+$8,899, +14.41% from previous year)
- 2023: $87,916 (+$17,239, +24.39% from previous year)
- 2024: $89,291 (+$1,375, +1.56% from previous year)
- 2025: $103,685 (+$14,394, +16.12% from previous year)
Since 2015, home values in Butterfield have climbed a massive 167%, reaching $103,685 in 2025. After some modest early increases, the market took off after 2020. The strong post-pandemic gains suggest renewed attention and possibly growing demand from outside buyers.
Butterfield – Big Price Gains in a Tiny Town
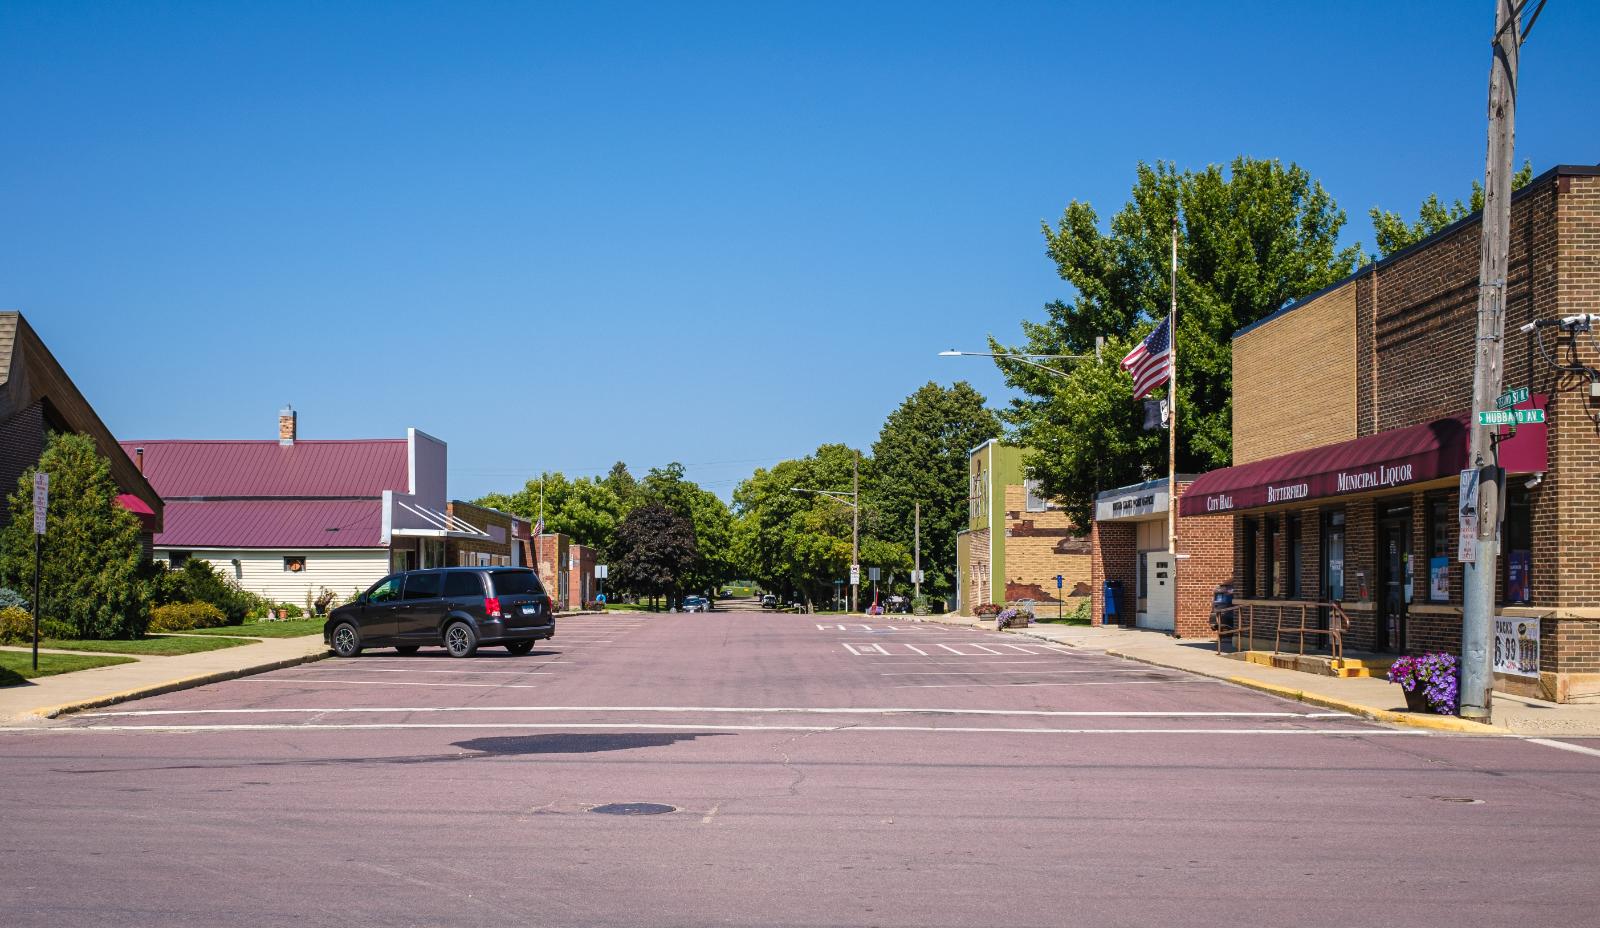
Butterfield is a tiny town in Watonwan County, tucked into south-central Minnesota. With a population of under 600, it’s the kind of place where neighbors know each other and amenities are few but functional. Historically off the radar, its recent home price surge has raised some eyebrows—especially for a town of its size.
There are few signs of large-scale development, so much of the growth likely comes from rising interest in rural affordability. With median prices still below $105,000, Butterfield remains accessible to buyers with modest budgets. As remote work reshapes where people choose to live, even very small towns like this one are starting to see measurable housing shifts.
7. Mapleview – 81% Home Price Increase Since 2010
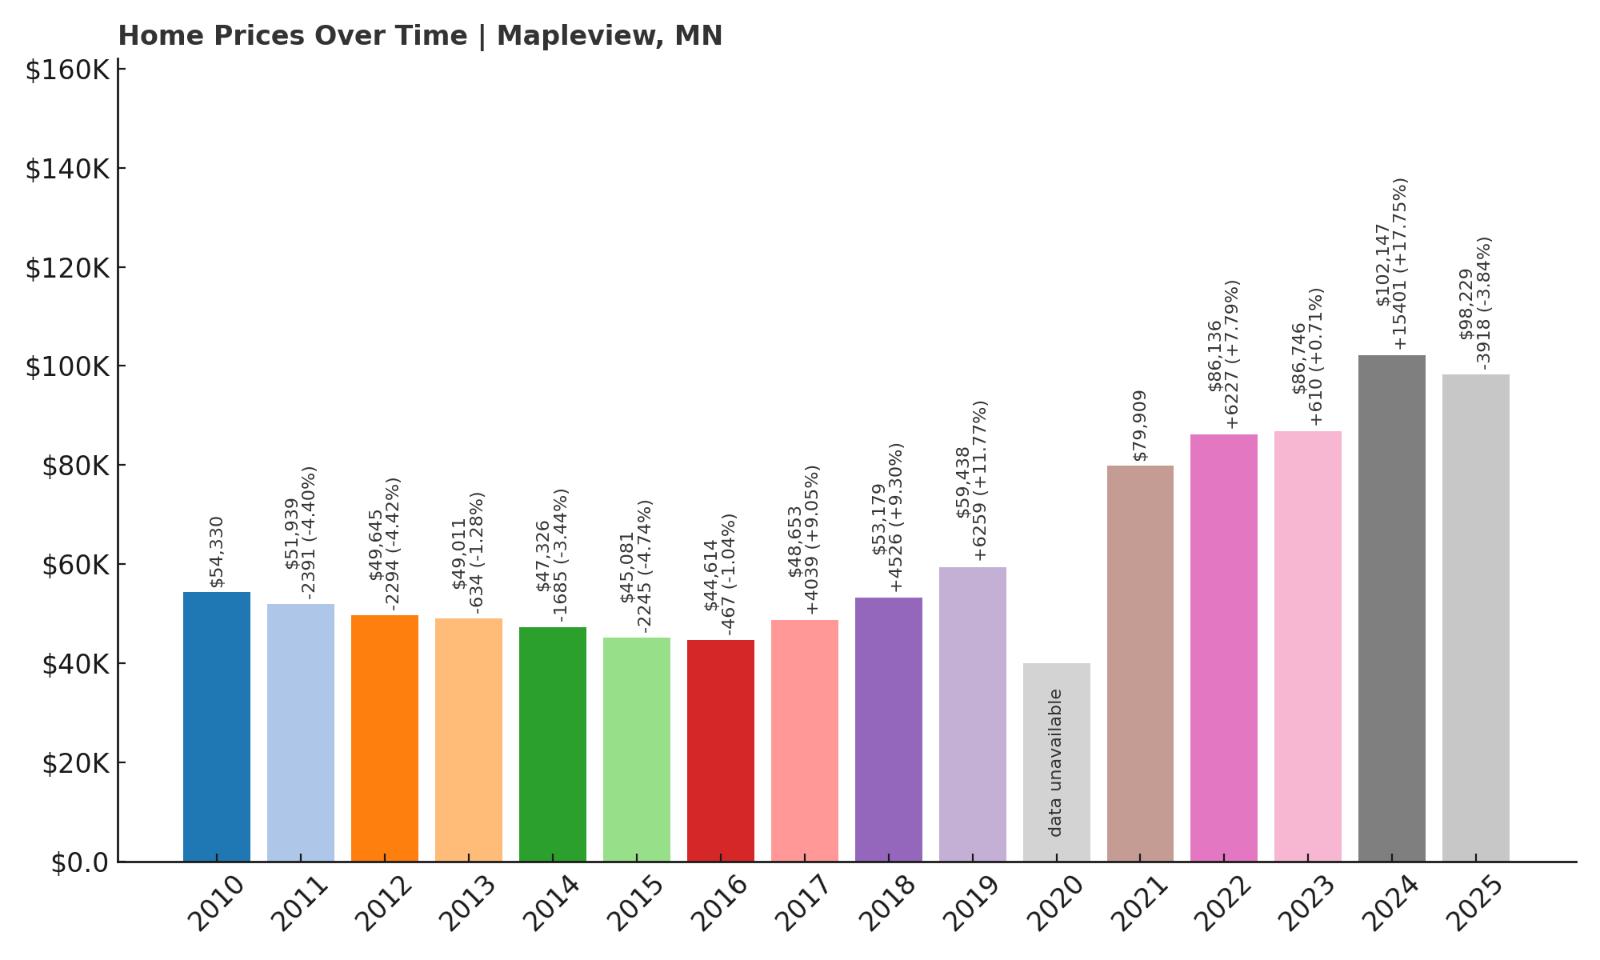
- 2010: $54,330
- 2011: $51,939 ($-2,391, -4.40% from previous year)
- 2012: $49,645 ($-2,294, -4.42% from previous year)
- 2013: $49,011 ($-634, -1.28% from previous year)
- 2014: $47,326 ($-1,685, -3.44% from previous year)
- 2015: $45,081 ($-2,246, -4.75% from previous year)
- 2016: $44,614 ($-466, -1.03% from previous year)
- 2017: $48,653 (+$4,039, +9.05% from previous year)
- 2018: $53,179 (+$4,526, +9.30% from previous year)
- 2019: $59,438 (+$6,260, +11.77% from previous year)
- 2020: N/A
- 2021: $79,909 (+$20,470, +34.44% from previous year)
- 2022: $86,136 (+$6,227, +7.79% from previous year)
- 2023: $86,746 (+$610, +0.71% from previous year)
- 2024: $102,147 (+$15,401, +17.75% from previous year)
- 2025: $98,229 ($-3,919, -3.84% from previous year)
Mapleview’s housing market started slow, with several years of declining values, but it turned a sharp corner after 2017. Prices rose 81% from 2010 to 2025, with especially large jumps post-2020. Even with a slight dip in 2025, values remain strong compared to the town’s history.
Mapleview – A Turnaround Story in Southeastern Minnesota

Just northeast of Austin, Mapleview is a small enclave town known for its proximity to larger amenities while maintaining a lower cost of living. It offers easy access to jobs, schools, and shopping in Austin, making it a practical choice for budget-conscious buyers who don’t want to go fully rural.
The town’s price rebound after 2017 mirrors broader trends in regional affordability. A combination of underpriced homes and spillover demand from neighboring areas likely fueled the big increases in 2021 and 2024. At under $100,000 on average, Mapleview remains a relative bargain even after the gains.
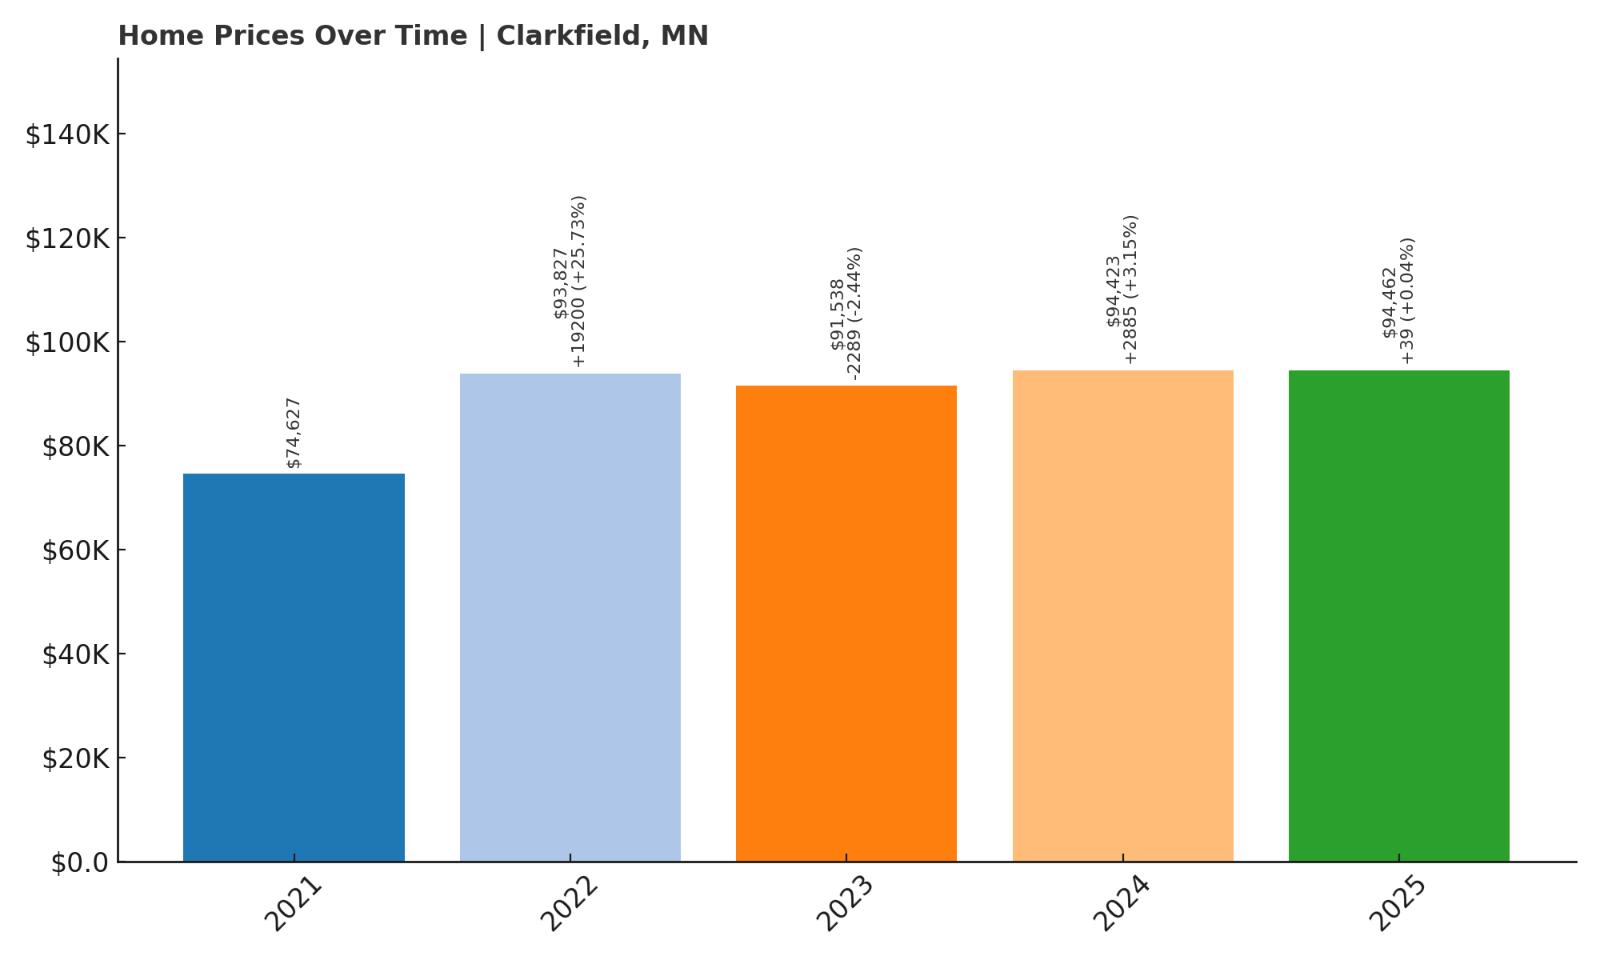
6. Clarkfield – 27% Home Price Increase Since 2021
🔥 Would you like to save this?
- 2010: N/A
- 2011: N/A
- 2012: N/A
- 2013: N/A
- 2014: N/A
- 2015: N/A
- 2016: N/A
- 2017: N/A
- 2018: N/A
- 2019: N/A
- 2020: N/A
- 2021: $74,627
- 2022: $93,827 (+$19,201, +25.73% from previous year)
- 2023: $91,538 ($-2,289, -2.44% from previous year)
- 2024: $94,423 (+$2,884, +3.15% from previous year)
- 2025: $94,462 (+$39, +0.04% from previous year)
Clarkfield saw home prices climb nearly 27% between 2021 and 2025, with the biggest jump happening in 2022. While prices dipped slightly in 2023, they stabilized and regained traction. With 2025 values at $94,462, Clarkfield remains a very affordable option within Minnesota’s small-town housing landscape.
Clarkfield – Modest Prices and Strong Momentum

Located in Yellow Medicine County, Clarkfield is a small town with a long agricultural tradition. It’s surrounded by farmland, has a compact residential footprint, and offers a peaceful rural lifestyle. Despite its size, recent trends show the housing market gaining modest momentum, driven in part by broader affordability pressures across the state.
With the first Zillow data point appearing only in 2021, the recent growth may reflect renewed interest in smaller western Minnesota communities. The town’s infrastructure is simple but sufficient—think basic services, a public school, and community charm. For those looking for value and a break from urban noise, Clarkfield offers an inviting starting point under the $100K range.
5. Kiester – 115% Home Price Increase Since 2017

- 2010: N/A
- 2011: N/A
- 2012: N/A
- 2013: N/A
- 2014: N/A
- 2015: N/A
- 2016: N/A
- 2017: $43,633
- 2018: $44,450 (+$817, +1.87% from previous year)
- 2019: $46,573 (+$2,123, +4.78% from previous year)
- 2020: N/A
- 2021: $57,845 (+$11,273, +24.20% from previous year)
- 2022: $70,023 (+$12,178, +21.05% from previous year)
- 2023: $78,694 (+$8,671, +12.38% from previous year)
- 2024: $77,941 ($-754, -0.96% from previous year)
- 2025: $94,113 (+$16,173, +20.75% from previous year)
Kiester has experienced an impressive 115% jump in home prices since 2017. After several years of sharp increases, values briefly dipped in 2024 but rebounded strongly in 2025, ending the period at $94,113. For such a small town, this level of appreciation stands out.
Kiester – Quiet Gains in Southern Minnesota

Kiester is a tiny town in Faribault County, not far from the Iowa border. It has fewer than 500 residents and a very relaxed pace of life, making it a retreat for those who want simplicity. It’s also one of the more affordable places in the state, with home prices still under $100,000 despite strong growth.
The post-2020 price surge may be connected to rising interest in rural housing and the expanding flexibility of remote work. With limited inventory, even small shifts in demand can produce noticeable increases. Kiester is ideal for buyers focused on long-term affordability, investment potential, or just a place to slow down.
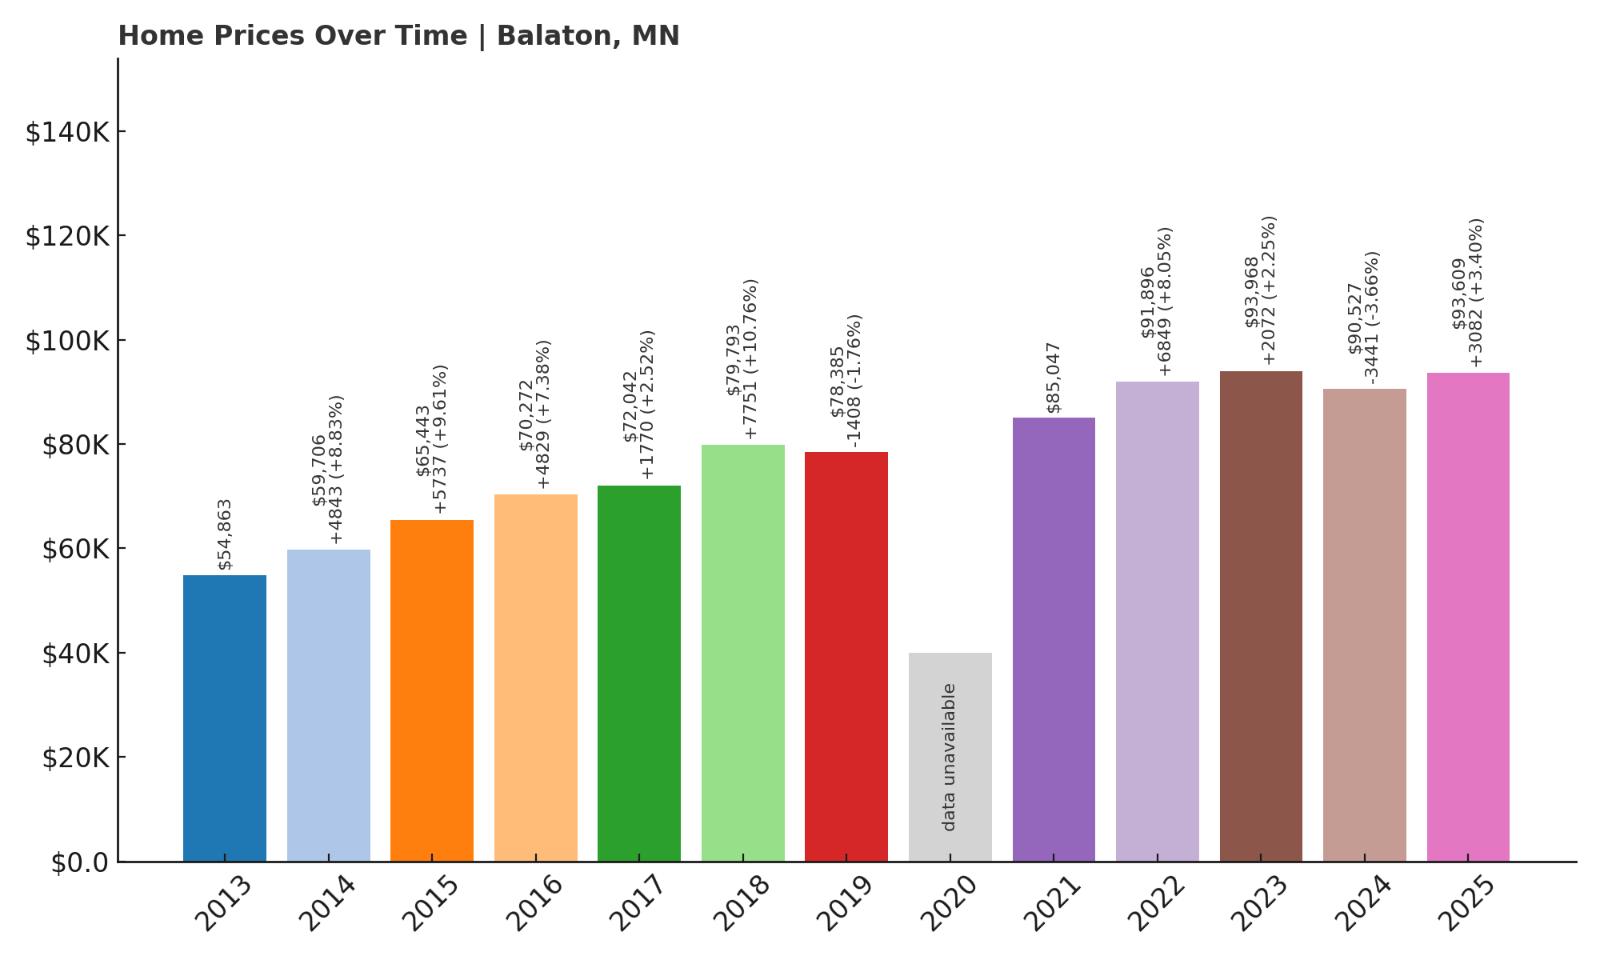
4. Balaton – 71% Home Price Increase Since 2013
- 2010: N/A
- 2011: N/A
- 2012: N/A
- 2013: $54,863
- 2014: $59,706 (+$4,843, +8.83% from previous year)
- 2015: $65,443 (+$5,737, +9.61% from previous year)
- 2016: $70,272 (+$4,828, +7.38% from previous year)
- 2017: $72,042 (+$1,770, +2.52% from previous year)
- 2018: $79,793 (+$7,752, +10.76% from previous year)
- 2019: $78,385 ($-1,408, -1.76% from previous year)
- 2020: N/A
- 2021: $85,047 (+$6,661, +8.50% from previous year)
- 2022: $91,896 (+$6,849, +8.05% from previous year)
- 2023: $93,968 (+$2,071, +2.25% from previous year)
- 2024: $90,527 ($-3,441, -3.66% from previous year)
- 2025: $93,609 (+$3,082, +3.40% from previous year)
Balaton’s home values have grown by 71% since 2013, with the most consistent gains occurring between 2014 and 2022. Although there were a few small declines, prices remained resilient and reached $93,609 in 2025, keeping the town well within reach for entry-level buyers.
Balaton – Consistent Growth in Lyon County
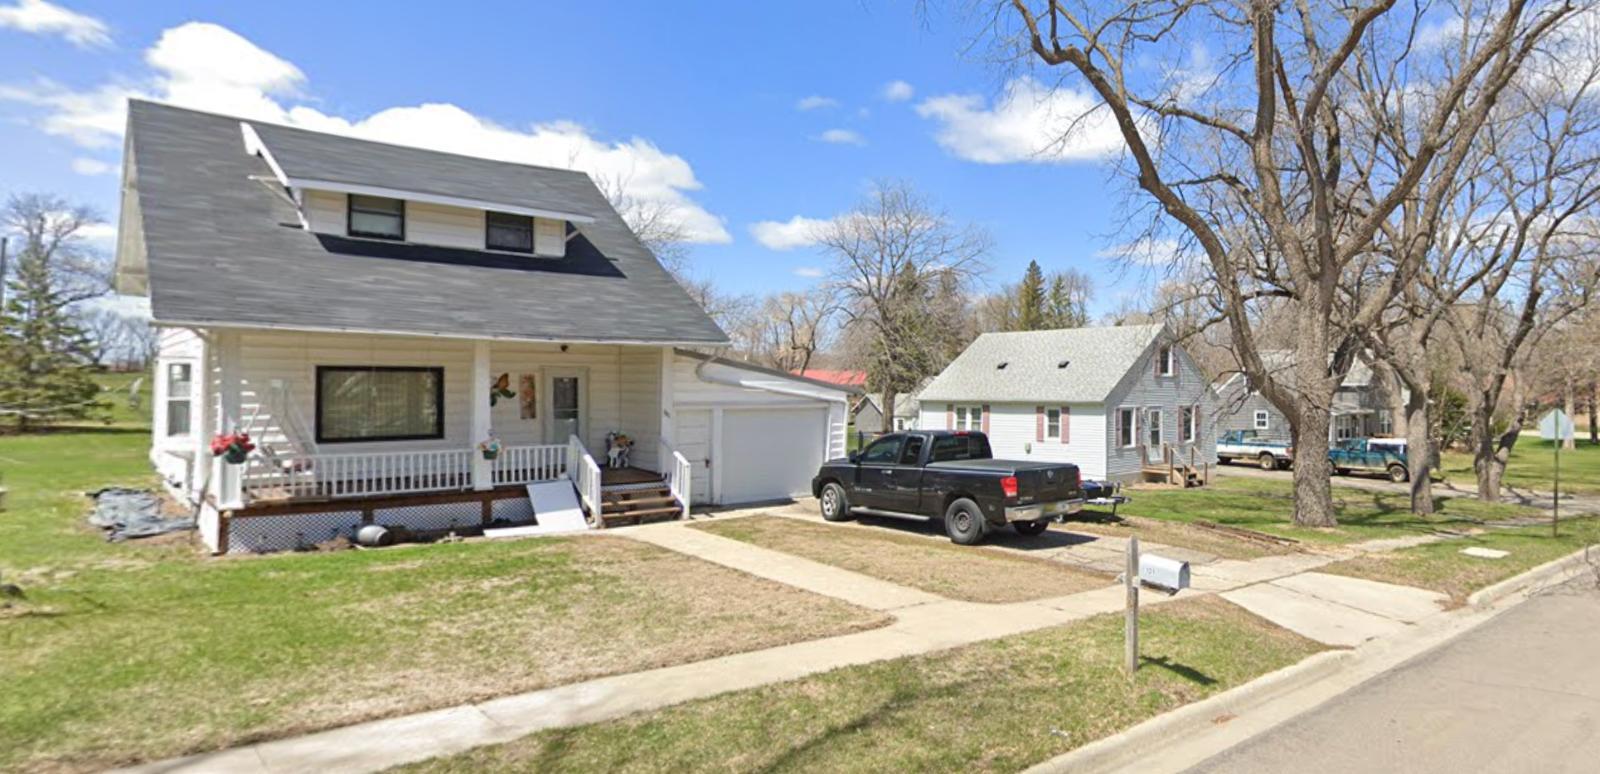
Balaton sits in southwestern Minnesota, within Lyon County. It’s a quiet community surrounded by lakes, farmland, and prairie, and it offers a cost of living far below the national average. Despite its modest size, Balaton has managed to sustain a stable and growing housing market over the past decade.
The steady price increases, especially in the late 2010s, point to a combination of low supply and slow-but-steady demand. Buyers priced out of larger towns like Marshall or Worthington may find Balaton appealing. The town’s affordability and community atmosphere make it a viable option for families or retirees seeking long-term value.
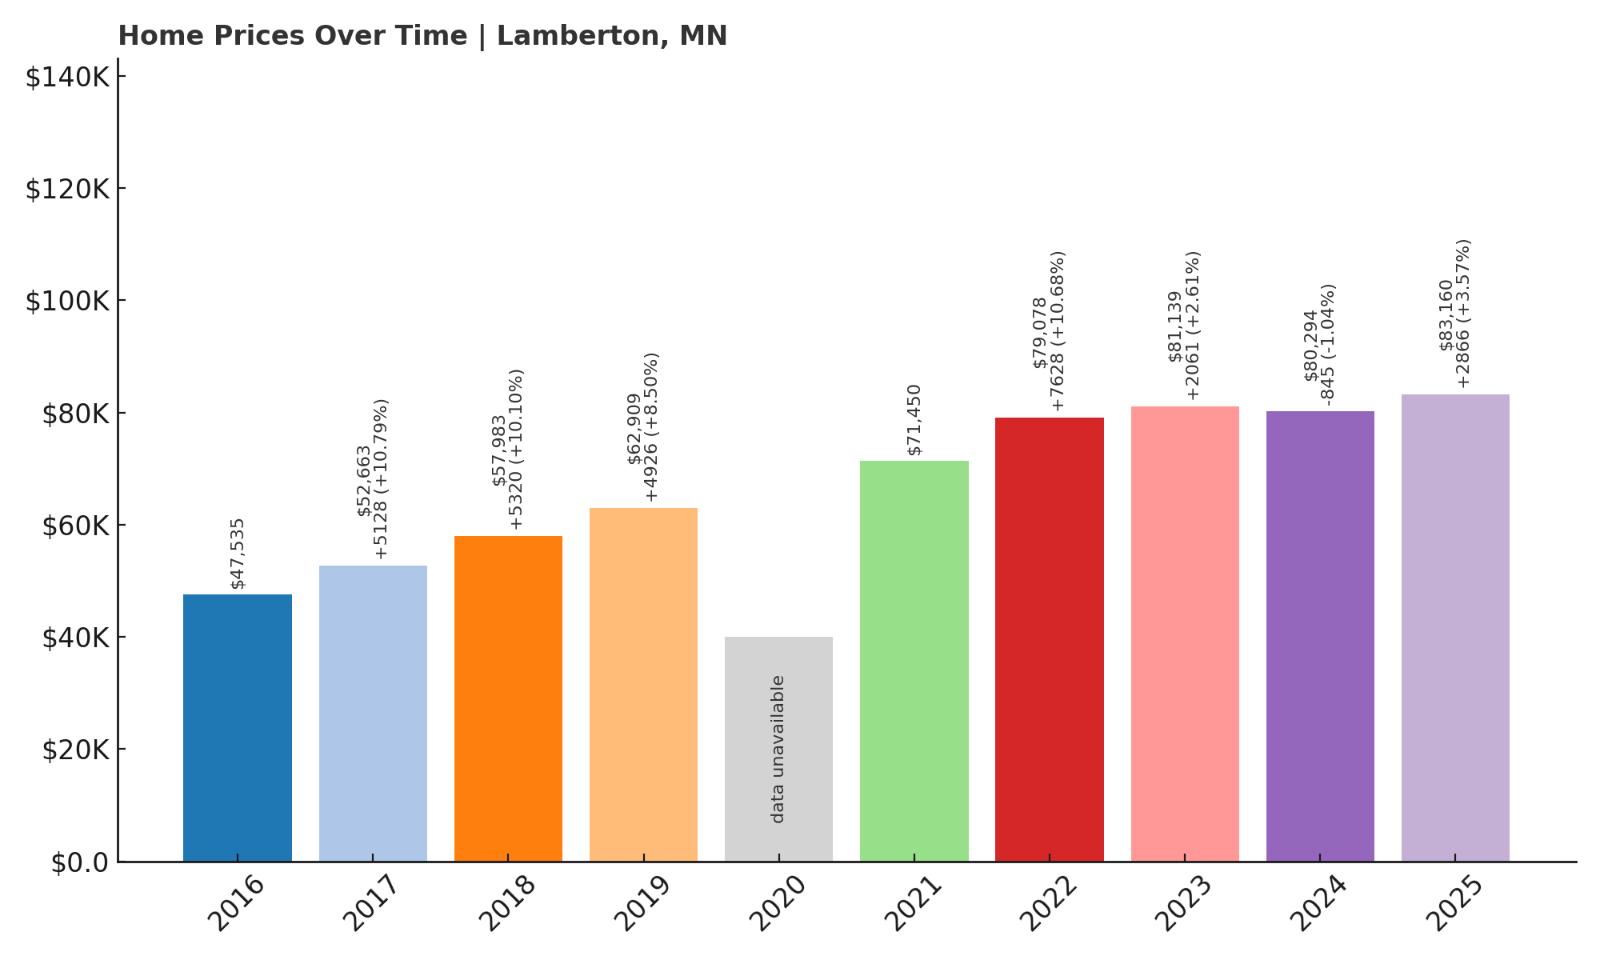
3. Lamberton – 75% Home Price Increase Since 2016
- 2010: N/A
- 2011: N/A
- 2012: N/A
- 2013: N/A
- 2014: N/A
- 2015: N/A
- 2016: $47,535
- 2017: $52,663 (+$5,128, +10.79% from previous year)
- 2018: $57,983 (+$5,320, +10.10% from previous year)
- 2019: $62,909 (+$4,925, +8.49% from previous year)
- 2020: N/A
- 2021: $71,450 (+$8,541, +13.58% from previous year)
- 2022: $79,078 (+$7,628, +10.68% from previous year)
- 2023: $81,139 (+$2,061, +2.61% from previous year)
- 2024: $80,294 ($-844, -1.04% from previous year)
- 2025: $83,160 (+$2,866, +3.57% from previous year)
Home values in Lamberton have increased by 75% since 2016, with the sharpest gains coming between 2020 and 2022. Prices held mostly steady after that, ending at $83,160 in 2025. It’s one of the more stable and affordable towns on this list with long-term potential.
Lamberton – Slow and Steady in Redwood County
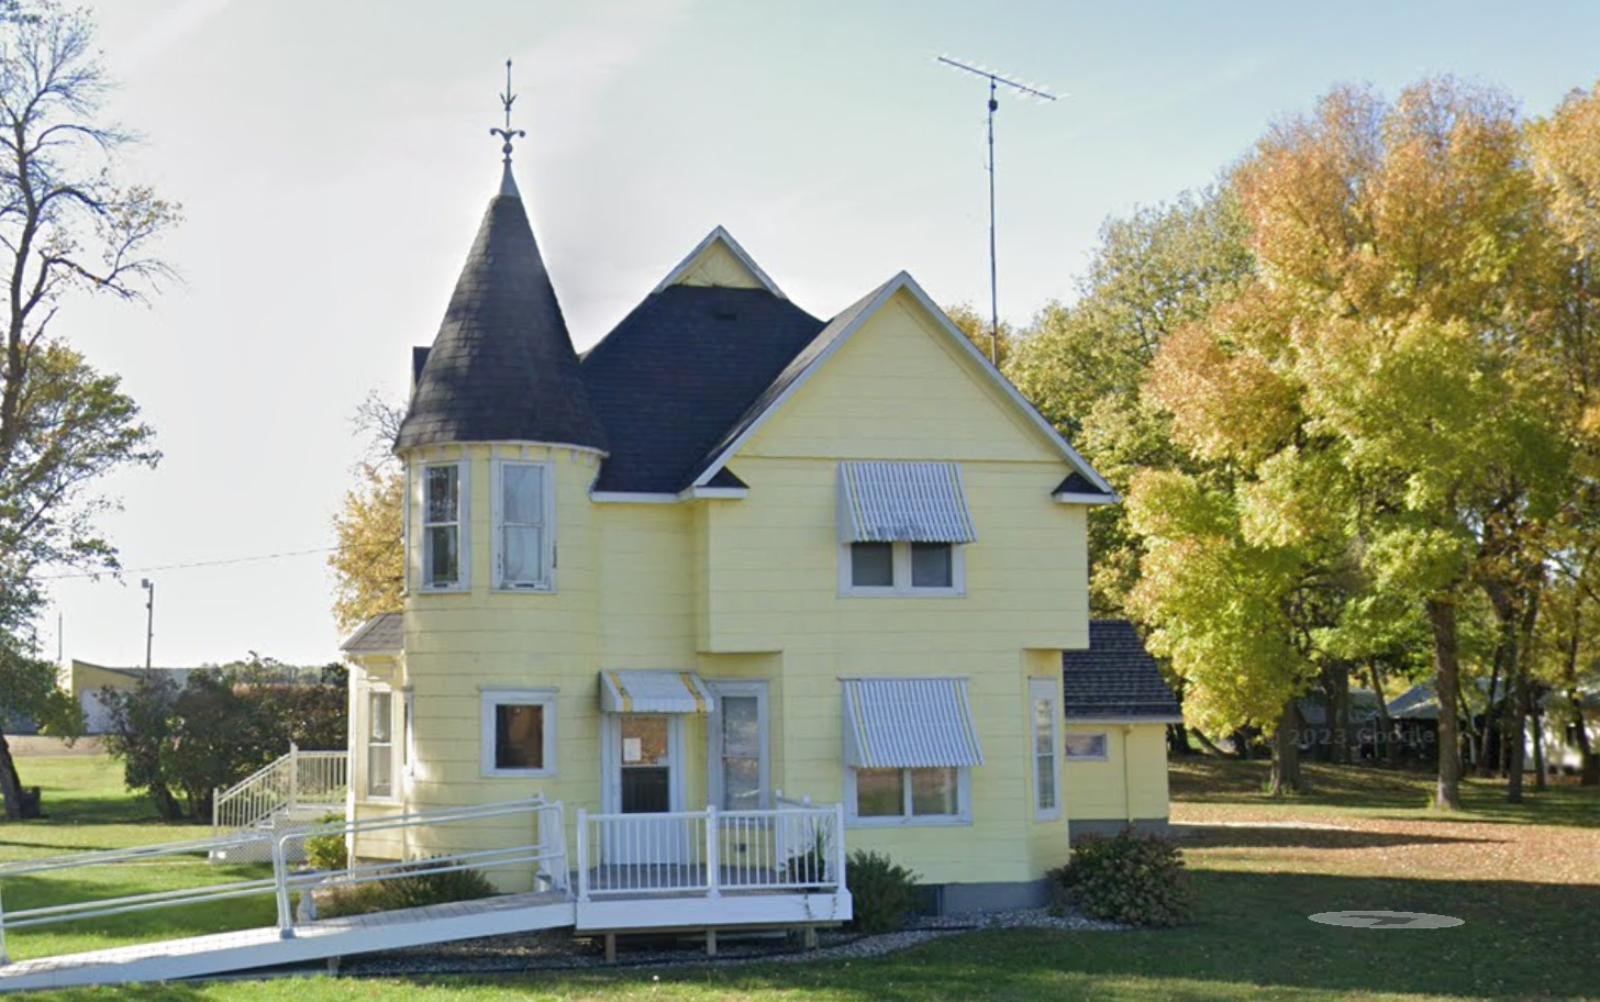
Lamberton is a small farming town in Redwood County, and it reflects many of the trends seen across rural southern Minnesota. Quiet streets, affordable homes, and a dependable local economy keep the market here grounded. There’s no speculation or sudden surges—just steady, measured growth over time.
For those looking to invest without the rollercoaster of city markets, Lamberton offers predictability. The market’s resilience through economic shifts and its strong gains since 2020 show that even the smallest towns can be part of Minnesota’s broader real estate story. It’s especially attractive for buyers who value long-term stability and a slower pace of life.
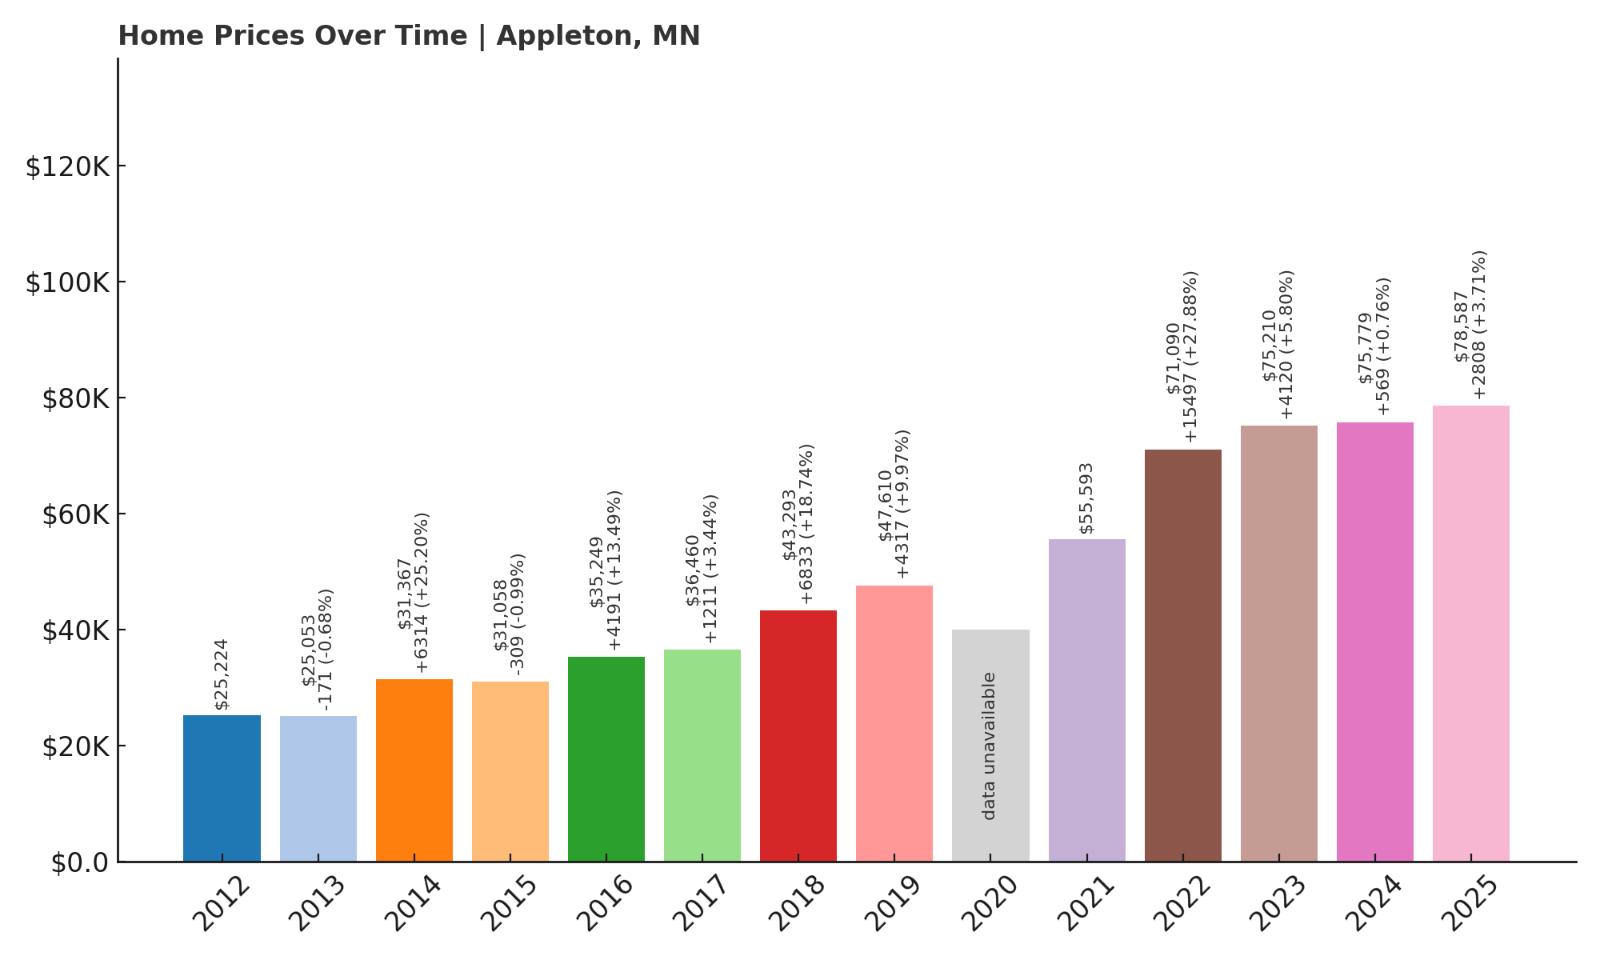
2. Appleton – 212% Home Price Increase Since 2012
- 2010: N/A
- 2011: N/A
- 2012: $25,224
- 2013: $25,053 ($-170, -0.67% from previous year)
- 2014: $31,367 (+$6,313, +25.20% from previous year)
- 2015: $31,058 ($-309, -0.99% from previous year)
- 2016: $35,249 (+$4,191, +13.49% from previous year)
- 2017: $36,460 (+$1,211, +3.44% from previous year)
- 2018: $43,293 (+$6,833, +18.74% from previous year)
- 2019: $47,610 (+$4,317, +9.97% from previous year)
- 2020: N/A
- 2021: $55,593 (+$7,983, +16.77% from previous year)
- 2022: $71,090 (+$15,497, +27.88% from previous year)
- 2023: $75,210 (+$4,120, +5.80% from previous year)
- 2024: $75,779 (+$569, +0.76% from previous year)
- 2025: $78,587 (+$2,807, +3.70% from previous year)
Appleton’s home prices have surged more than 212% since 2012, making it one of the fastest-growing markets in Minnesota’s affordable tier. The strongest growth came after 2020, with double-digit annual increases through 2022. By 2025, average home prices hit $78,587—still well below the state average, despite the steep appreciation.
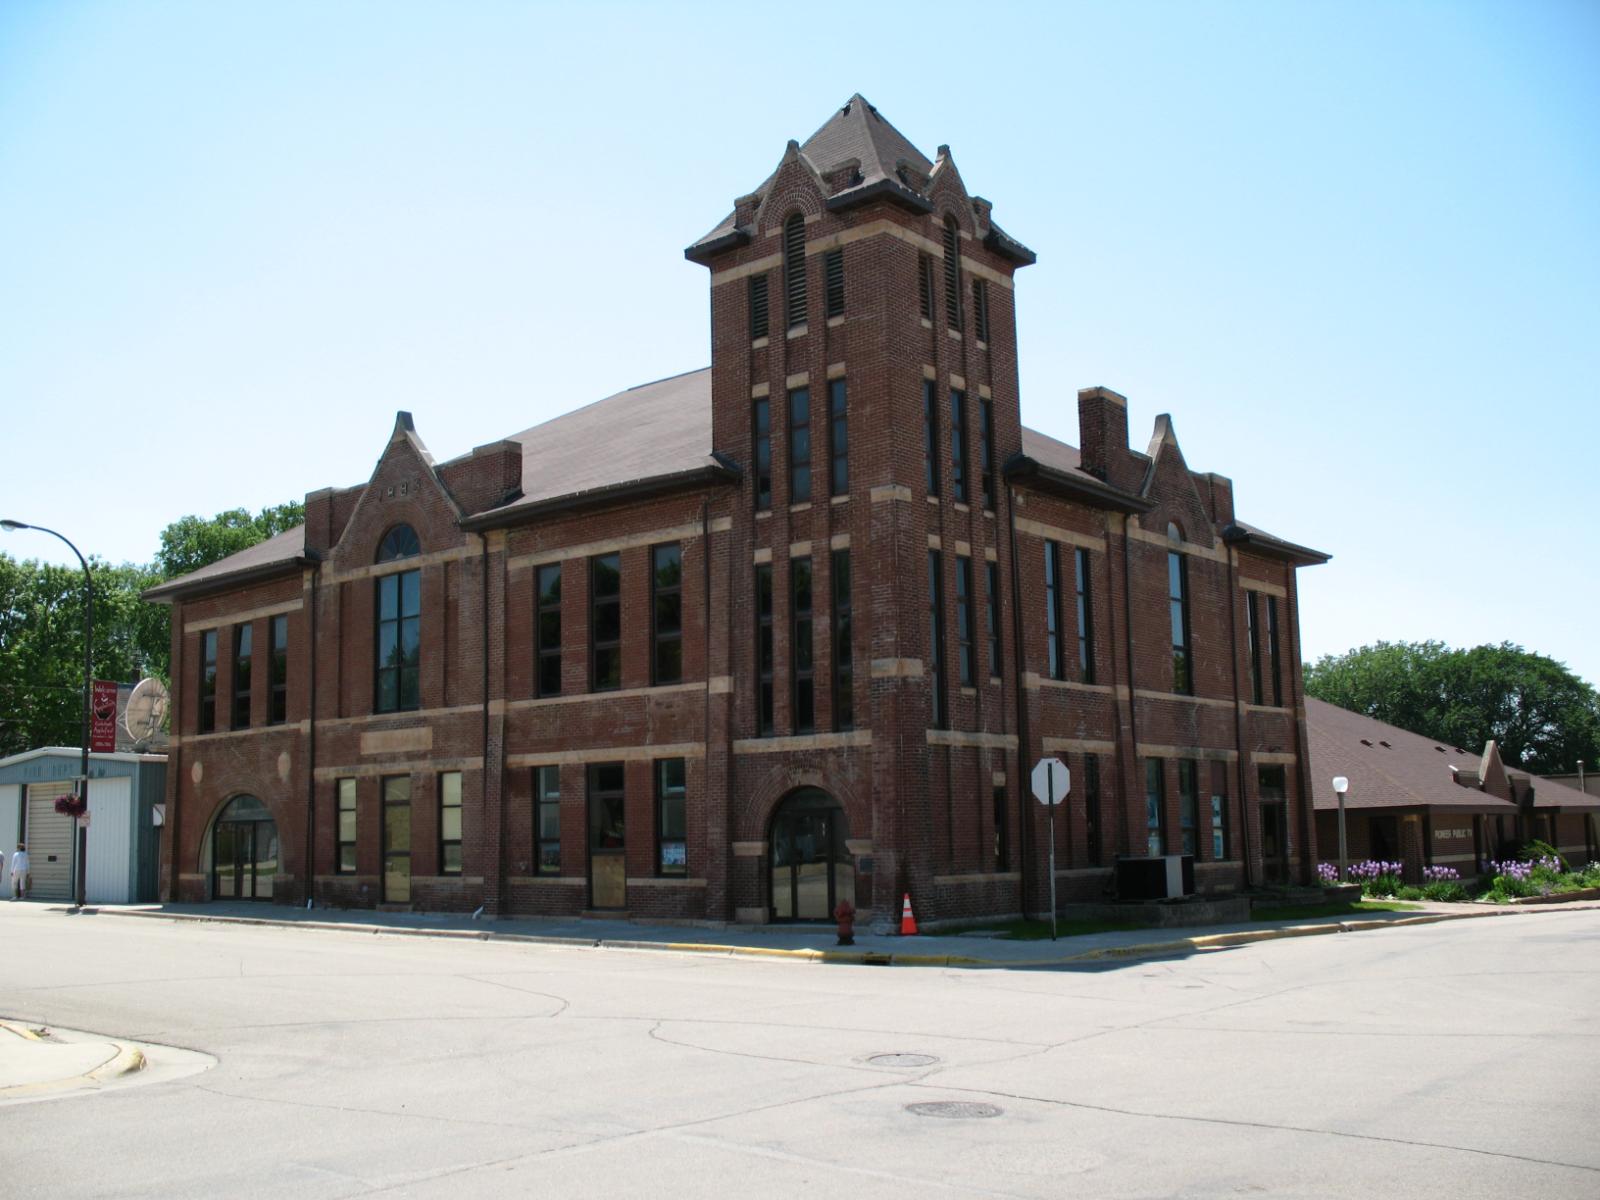
Appleton – Major Growth, Modest Prices in Western Minnesota
🔥 Would you like to save this?
Located in Swift County, Appleton is a western Minnesota town that has quietly transformed over the past decade. Once best known for its correctional facility, the town is now attracting attention for its low cost of living and large price gains. Its location along U.S. Highway 59 offers good regional access, and it’s not far from larger hubs like Morris or Montevideo.
The town’s housing stock is a mix of modest older homes and newer builds, and demand has picked up as more buyers look for budget-friendly options. The post-2020 spike reflects broader affordability-driven migration across rural America. With prices still under $80,000, Appleton presents a compelling case for first-time buyers, investors, or anyone priced out of urban markets.
1. Elmore – 20% Home Price Increase Since 2022

- 2010: N/A
- 2011: N/A
- 2012: N/A
- 2013: N/A
- 2014: N/A
- 2015: N/A
- 2016: N/A
- 2017: N/A
- 2018: N/A
- 2019: N/A
- 2020: N/A
- 2021: N/A
- 2022: $61,253
- 2023: $68,287 (+$7,034, +11.48% from previous year)
- 2024: $64,241 ($-4,047, -5.93% from previous year)
- 2025: $73,681 (+$9,440, +14.69% from previous year)
Elmore tops the list as the most affordable town in Minnesota, with 2025 home prices averaging just $73,681. While Zillow data for Elmore only starts in 2022, the town has already seen a 20% increase in value. Despite a dip in 2024, prices rebounded strongly the following year, underscoring its stability in a low-cost tier.
Elmore – Minnesota’s Most Affordable Market in 2025

Elmore sits right along the Iowa border in Faribault County and is the very definition of small-town living. With a population hovering around 600, the town offers basic services, quiet neighborhoods, and access to Highway 169. Its affordability is unmatched in the state, making it a strong candidate for anyone looking to minimize housing costs.
Though the housing data is limited, the early signs point to a market that’s gaining ground. With fewer listings and very low prices, even a small influx of demand can drive noticeable appreciation. Elmore may not be flashy, but for buyers focused purely on cost and long-term value, it’s a standout option in 2025.