According to the Zillow Home Value Index, Ohio’s housing market isn’t all bargain buys and modest growth. In fact, these 20 towns have seen home prices skyrocket over the last 15 years—some more than doubling in value since 2010. Fueled by demand, limited inventory, and long-term appeal, these places now rank as the most expensive in the state. Whether it’s charming suburbs or tucked-away towns with serious staying power, these markets show just how fast prices can climb in the Buckeye State.
20. Grandview Heights – 135% Home Price Increase Since 2010

- 2010: $232,562
- 2011: $228,109 (-$4,453, -1.91% from previous year)
- 2012: $229,094 (+$985, +0.43% from previous year)
- 2013: $252,179 (+$23,085, +10.08% from previous year)
- 2014: $275,937 (+$23,758, +9.42% from previous year)
- 2015: $298,927 (+$22,990, +8.33% from previous year)
- 2016: $336,383 (+$37,456, +12.53% from previous year)
- 2017: $364,845 (+$28,462, +8.46% from previous year)
- 2018: $394,560 (+$29,715, +8.14% from previous year)
- 2019: $408,893 (+$14,333, +3.63% from previous year)
- 2020: N/A
- 2021: $476,835
- 2022: $504,173 (+$27,338, +5.73% from previous year)
- 2023: $514,509 (+$10,336, +2.05% from previous year)
- 2024: $532,900 (+$18,391, +3.57% from previous year)
- 2025: $547,305 (+$14,405, +2.70% from previous year)
Home prices in Grandview Heights have surged by over 135% since 2010, reflecting steady and strong growth nearly every year. Notable jumps occurred during 2016 and 2013, both of which saw increases over 10%. While growth has slowed recently, values continue to rise, making this one of Ohio’s most expensive markets in 2025.
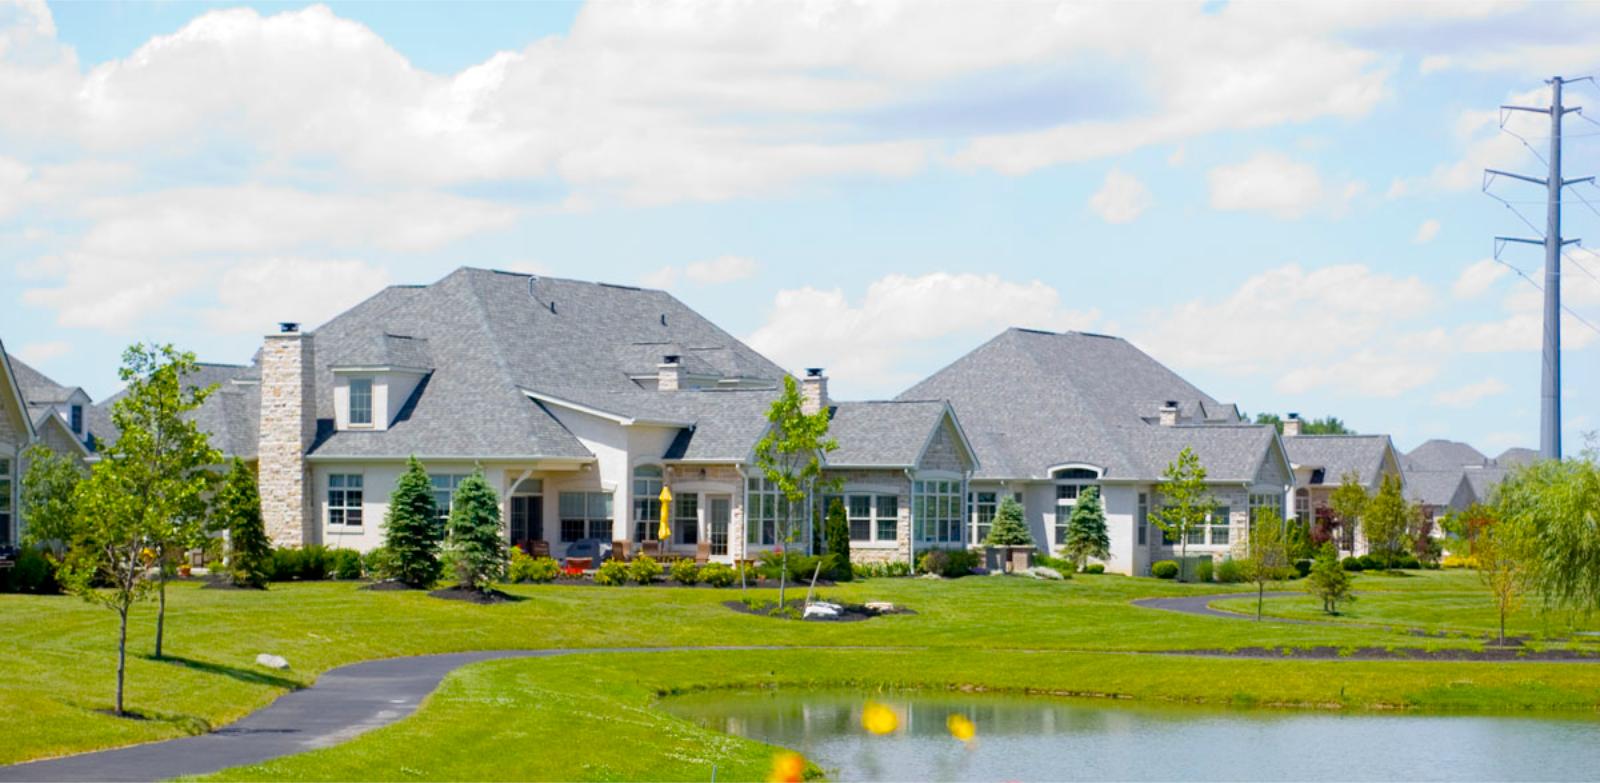
Grandview Heights – Desirable Location With Steady Upside
Just west of downtown Columbus, Grandview Heights is a compact, walkable suburb known for its tree-lined streets, good schools, and quick city access. Its growing popularity has made it a magnet for young professionals and families alike. Proximity to Ohio State University and a mix of historic homes and modern builds help explain why prices have doubled here over the past 15 years.
The neighborhood’s strong sense of community and local retail scene also add to its appeal. As demand has steadily increased, supply has remained tight—driving up prices consistently year after year. Even in recent slower growth years, the market has stayed competitive.
19. Bexley – 134% Home Price Increase Since 2010

- 2010: $240,157
- 2011: $233,426 (-$6,731, -2.80% from previous year)
- 2012: $239,832 (+$6,406, +2.74% from previous year)
- 2013: $257,295 (+$17,463, +7.28% from previous year)
- 2014: $284,793 (+$27,498, +10.69% from previous year)
- 2015: $302,295 (+$17,502, +6.15% from previous year)
- 2016: $322,180 (+$19,885, +6.58% from previous year)
- 2017: $349,697 (+$27,517, +8.54% from previous year)
- 2018: $382,576 (+$32,879, +9.40% from previous year)
- 2019: $392,067 (+$9,491, +2.48% from previous year)
- 2020: N/A
- 2021: $469,399
- 2022: $504,525 (+$35,126, +7.48% from previous year)
- 2023: $526,470 (+$21,945, +4.35% from previous year)
- 2024: $550,439 (+$23,969, +4.55% from previous year)
- 2025: $562,646 (+$12,207, +2.22% from previous year)
Prices in Bexley have climbed by more than 134% since 2010, driven by large annual gains in the mid-2010s and a second wave of appreciation after 2020. The market has held strong even in cooling conditions, continuing to see value increases year over year through 2025.
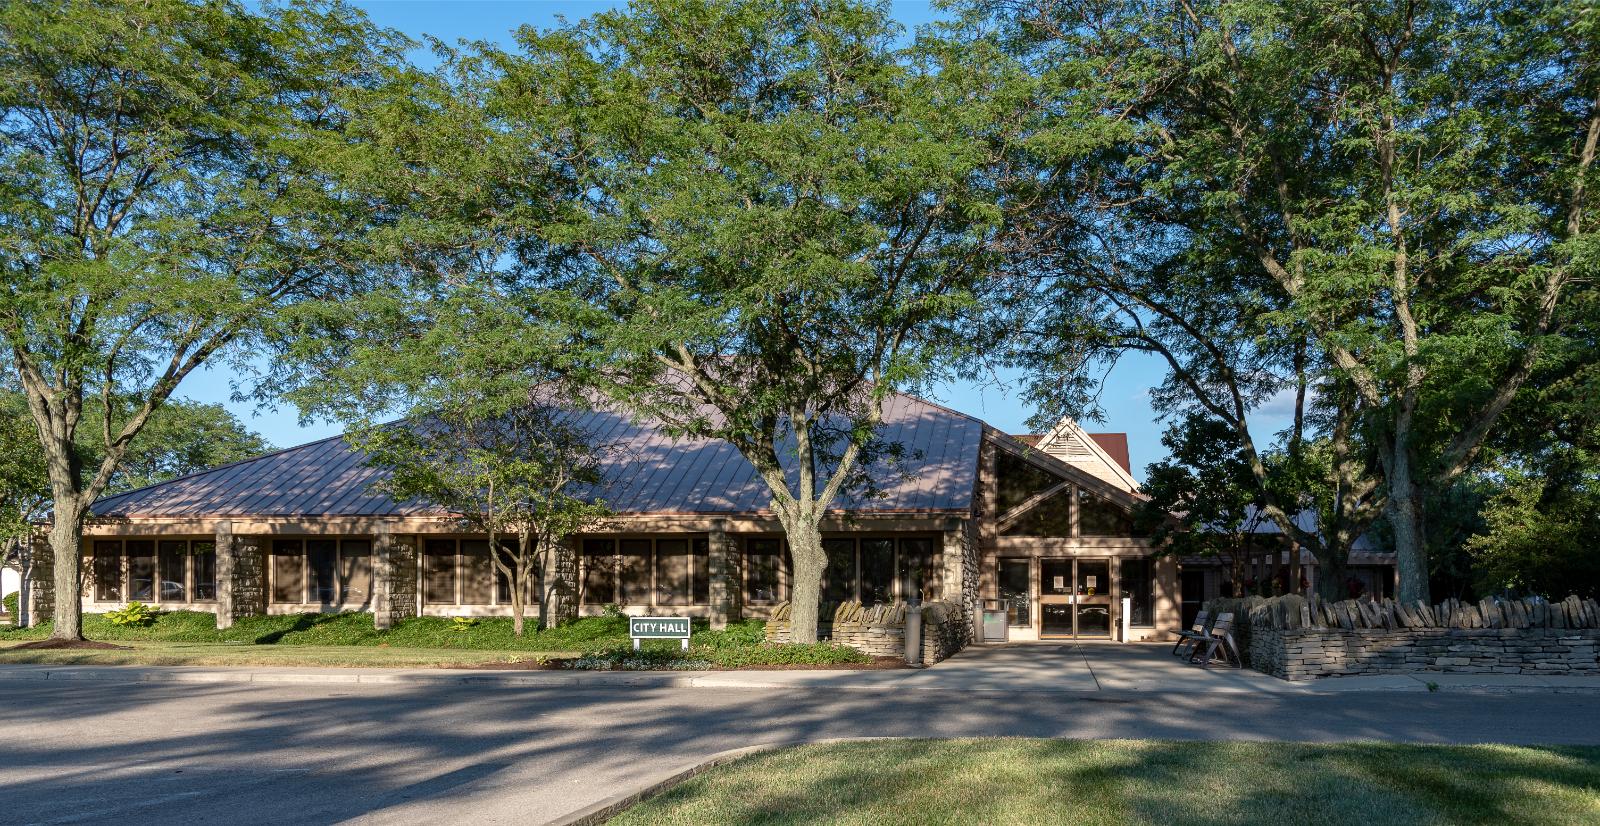
Bexley – Historic Charm and Strong Demand
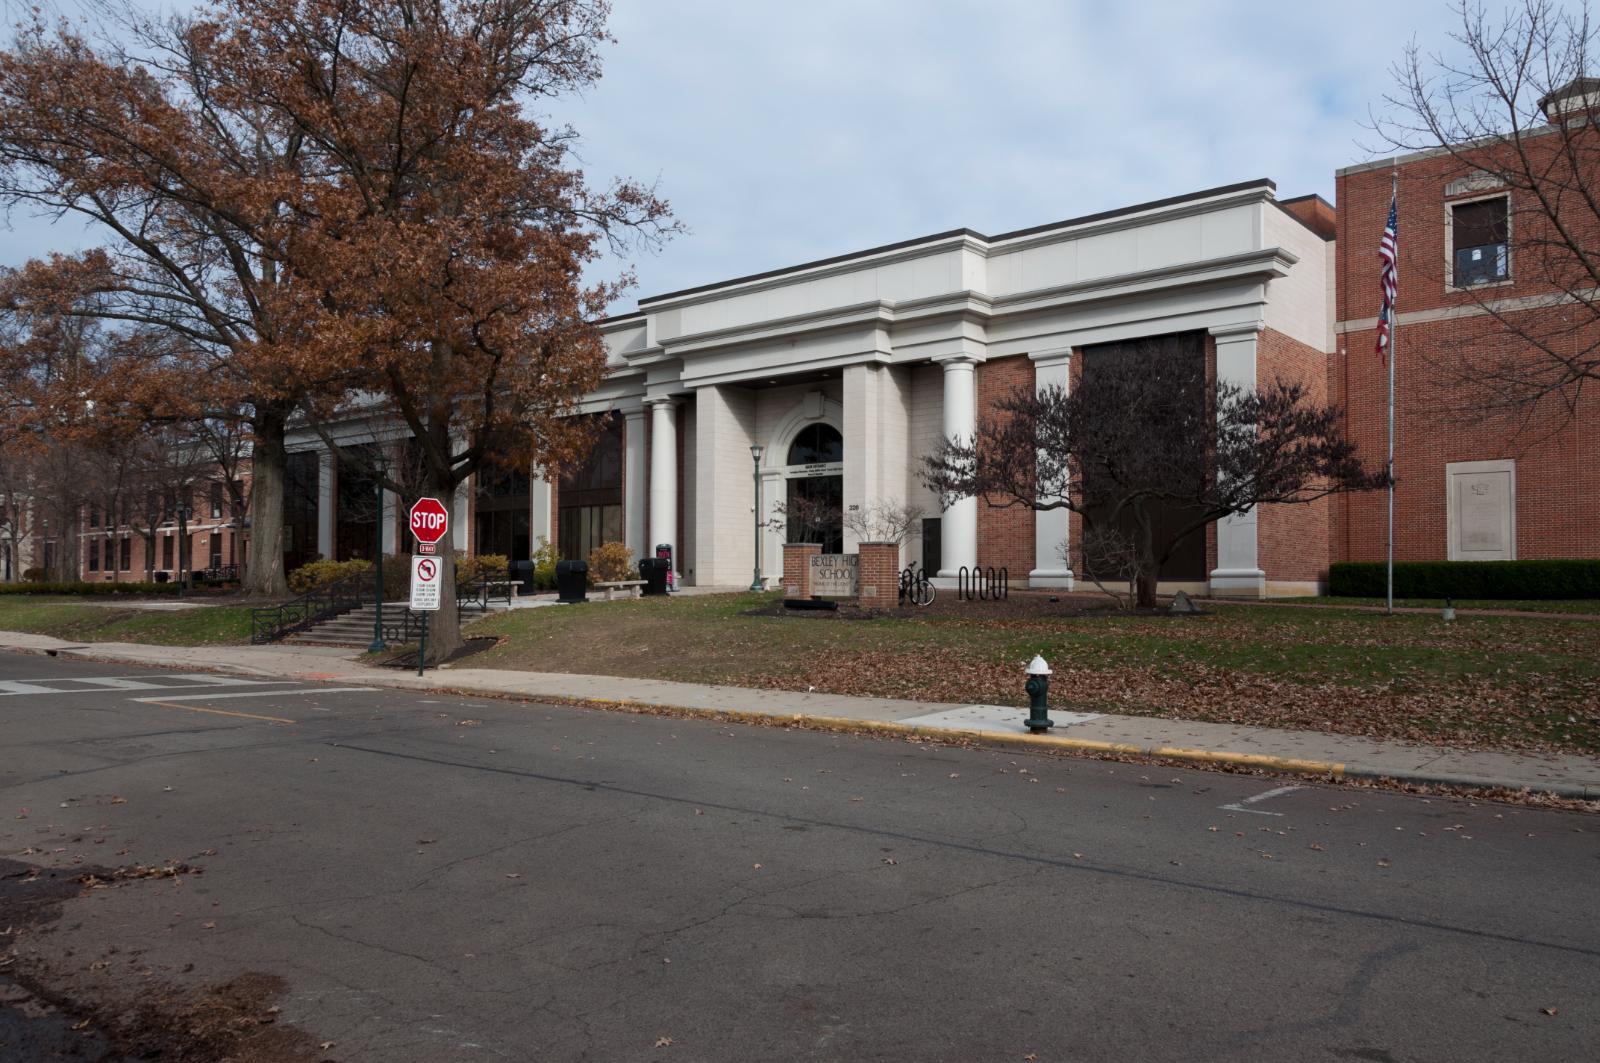
Bexley is a well-established suburb of Columbus known for its historic homes, mature trees, and elite private schools. It’s home to Capital University and offers a classic small-town feel within minutes of the city. That blend of prestige and location has made it a perennial favorite in the Columbus housing market.
Much of Bexley’s growth came from its upscale housing stock and high owner-occupancy rates, which limit turnover. As demand rises and listings remain low, prices have steadily moved upward. This consistency helps explain why Bexley ranks among the most expensive towns in Ohio.
18. Powell – 93% Home Price Increase Since 2010

- 2010: $293,765
- 2011: $286,528 (-$7,237, -2.46% from previous year)
- 2012: $288,438 (+$1,910, +0.67% from previous year)
- 2013: $302,738 (+$14,300, +4.96% from previous year)
- 2014: $321,449 (+$18,711, +6.18% from previous year)
- 2015: $334,945 (+$13,496, +4.20% from previous year)
- 2016: $348,166 (+$13,221, +3.95% from previous year)
- 2017: $360,367 (+$12,201, +3.50% from previous year)
- 2018: $374,715 (+$14,348, +3.98% from previous year)
- 2019: $386,239 (+$11,524, +3.08% from previous year)
- 2020: N/A
- 2021: $449,904
- 2022: $511,515 (+$61,611, +13.69% from previous year)
- 2023: $535,523 (+$24,008, +4.69% from previous year)
- 2024: $558,126 (+$22,603, +4.22% from previous year)
- 2025: $569,538 (+$11,412, +2.04% from previous year)
Powell’s home prices have grown by nearly 94% since 2010, with much of the appreciation coming after 2020. The sharpest increase happened in 2022, which marked a standout year for local real estate. Despite cooling elsewhere, Powell has continued a reliable upward trend.
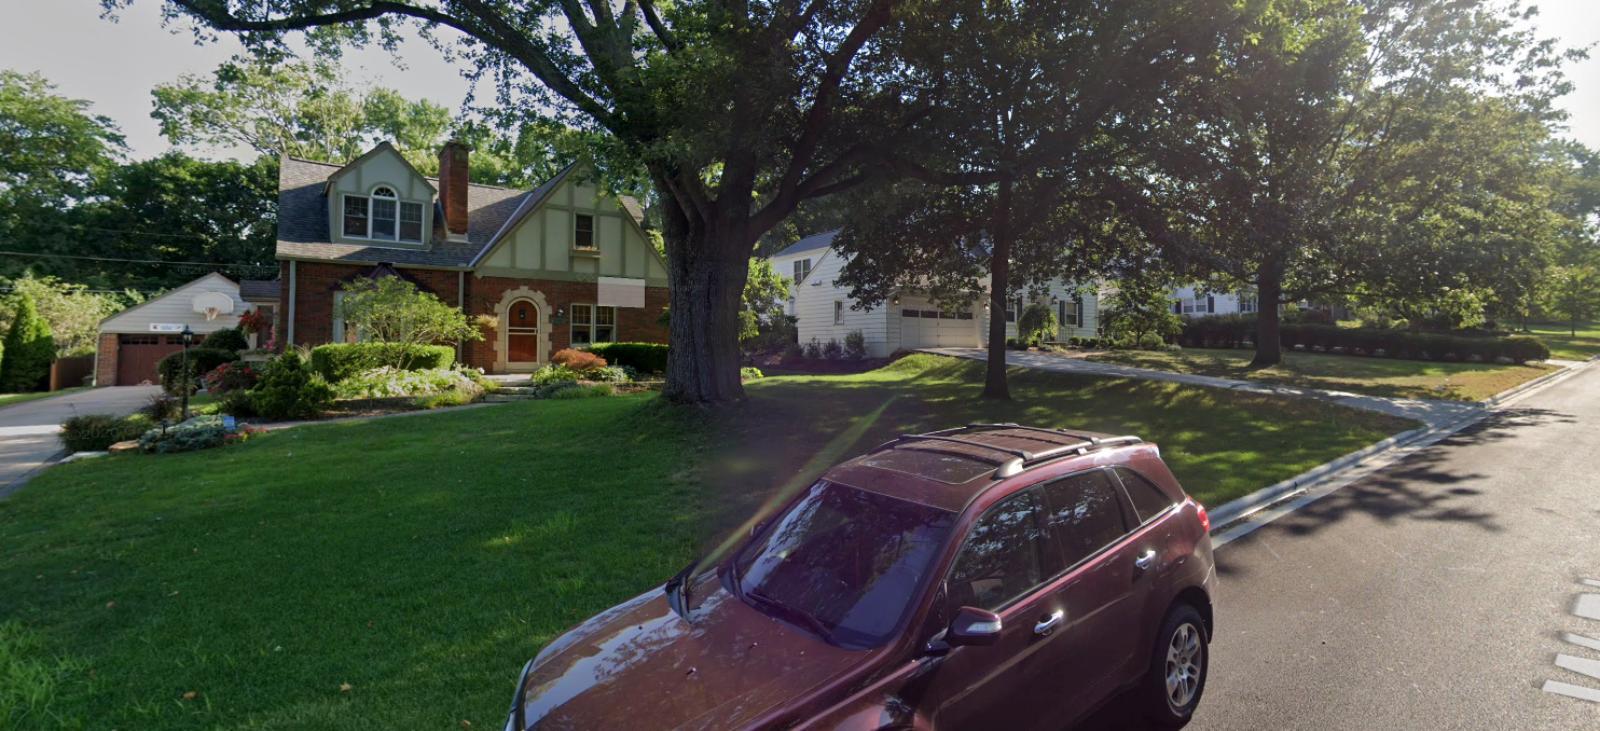
Powell – Family-Friendly Growth Hub
Located north of Columbus, Powell has evolved into one of central Ohio’s most sought-after communities for families. Its highly rated schools, proximity to the Columbus Zoo, and access to green space make it a prime destination for buyers seeking space without sacrificing amenities.
With newer subdivisions and steady population growth, Powell’s housing supply expanded—but not enough to cool prices. Recent years have brought significant jumps in value, especially as buyers sought more space post-2020. The upward trend suggests continued demand in the coming years.
17. Dublin – 97% Home Price Increase Since 2010

- 2010: $289,549
- 2011: $280,974 (-$8,575, -2.96% from previous year)
- 2012: $278,791 (-$2,183, -0.78% from previous year)
- 2013: $293,186 (+$14,395, +5.16% from previous year)
- 2014: $311,839 (+$18,653, +6.36% from previous year)
- 2015: $320,392 (+$8,553, +2.74% from previous year)
- 2016: $332,398 (+$12,006, +3.75% from previous year)
- 2017: $343,207 (+$10,809, +3.25% from previous year)
- 2018: $355,561 (+$12,354, +3.60% from previous year)
- 2019: $369,409 (+$13,848, +3.89% from previous year)
- 2020: N/A
- 2021: $426,642
- 2022: $489,081 (+$62,439, +14.63% from previous year)
- 2023: $514,491 (+$25,410, +5.20% from previous year)
- 2024: $549,421 (+$34,930, +6.79% from previous year)
- 2025: $570,977 (+$21,556, +3.92% from previous year)
Since 2010, Dublin’s home prices have risen nearly 97%, led by consistent annual gains and a major jump in 2022. The market has shown remarkable resilience, bouncing back stronger after slower early-2010s performance.
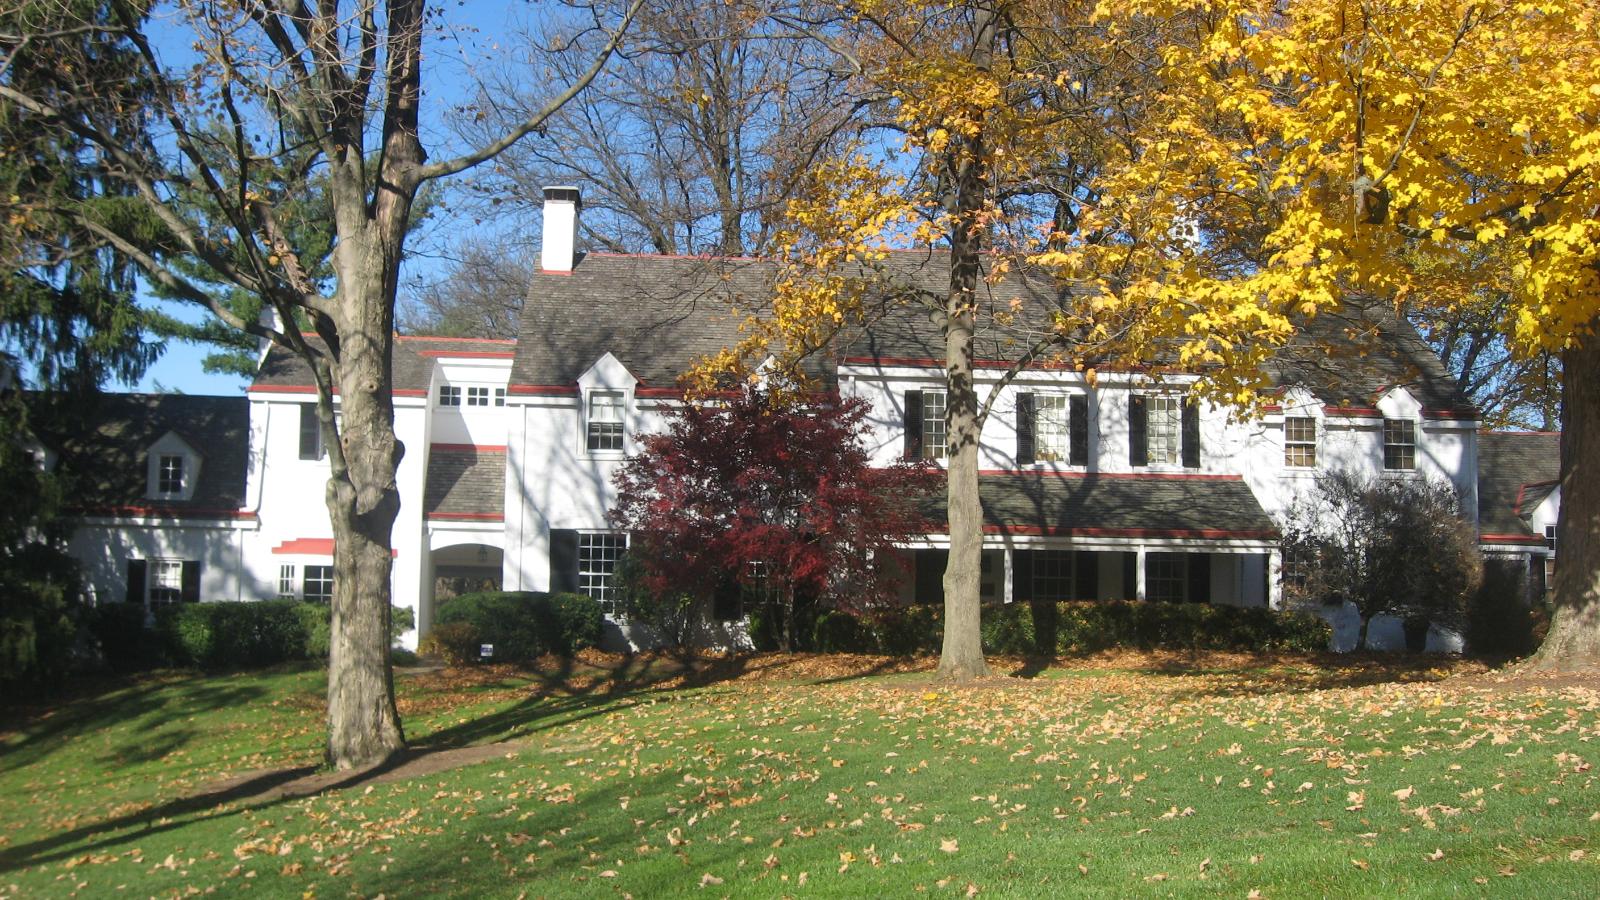
Dublin – Upscale Living with Business Appeal
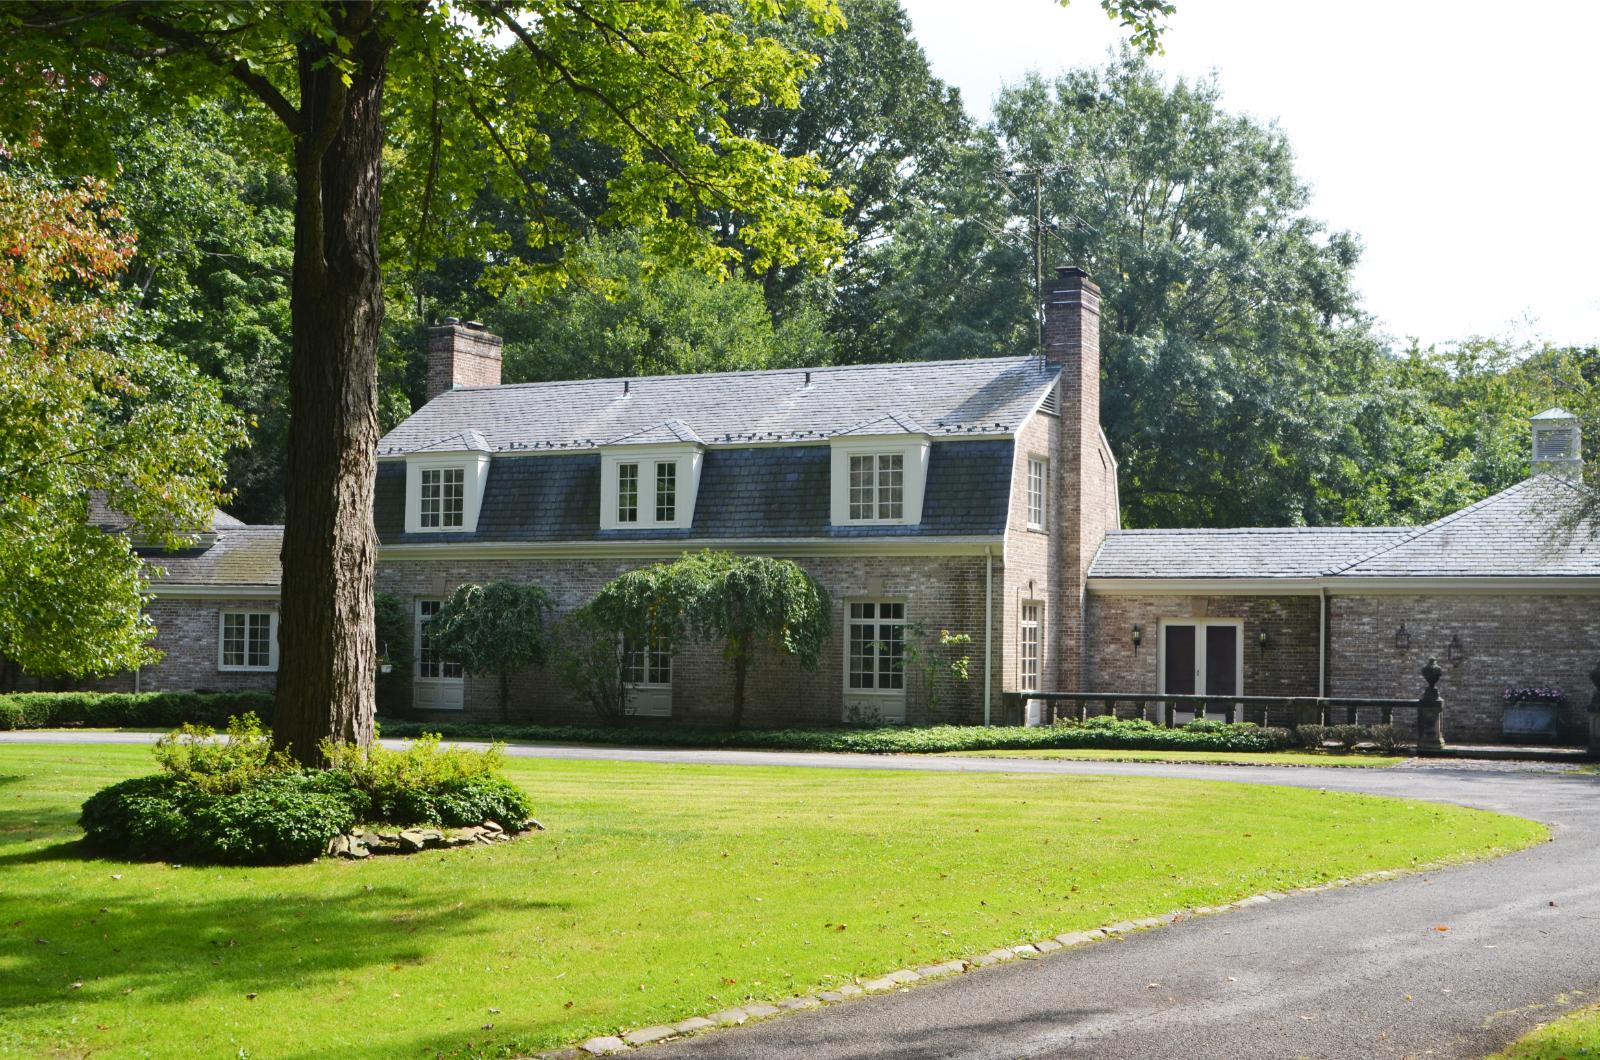
Hunting Valley Town Image
Dublin combines upscale suburban living with a robust job market, thanks to a strong presence of tech and healthcare employers. It’s also home to the annual PGA Memorial Tournament, which brings national attention. These factors help keep demand for homes high.
Its school district is one of the top in the state, drawing steady interest from relocating families. Large homes, excellent parks, and access to major highways have made Dublin a consistent performer in Ohio’s real estate market.
16. Riverlea – 105% Home Price Increase Since 2010

- 2010: $281,196
- 2011: $276,077 (-$5,119, -1.82% from previous year)
- 2012: $269,368 (-$6,709, -2.43% from previous year)
- 2013: $281,418 (+$12,050, +4.47% from previous year)
- 2014: $316,797 (+$35,379, +12.57% from previous year)
- 2015: $328,515 (+$11,718, +3.70% from previous year)
- 2016: $356,187 (+$27,672, +8.42% from previous year)
- 2017: $368,673 (+$12,486, +3.51% from previous year)
- 2018: $381,490 (+$12,817, +3.48% from previous year)
- 2019: $388,872 (+$7,382, +1.94% from previous year)
- 2020: N/A
- 2021: $451,718
- 2022: $498,286 (+$46,568, +10.31% from previous year)
- 2023: $525,581 (+$27,295, +5.48% from previous year)
- 2024: $543,770 (+$18,189, +3.46% from previous year)
- 2025: $575,606 (+$31,836, +5.85% from previous year)
Riverlea has seen prices more than double since 2010, with the most substantial gains in recent years. A strong 2022 and 2025 helped push the total increase past 100%, making this tiny enclave one of Ohio’s top gainers.
Riverlea – Small Town, Big Growth
Riverlea is one of Ohio’s smallest municipalities, bordered entirely by the city of Worthington. Its limited size and character-rich homes make listings rare—and highly desirable. The secluded setting with easy access to urban amenities creates a perfect storm for price appreciation.
Its growth trajectory in the past five years shows a mix of renewed demand and continued scarcity. As more buyers seek charm and exclusivity, Riverlea’s values have risen sharply, making it a surprising standout in the state’s luxury market.
15. Amberley – 107% Home Price Increase Since 2010

- 2010: $279,277
- 2011: $262,935 (-$16,342, -5.85% from previous year)
- 2012: $258,183 (-$4,752, -1.81% from previous year)
- 2013: $260,032 (+$1,849, +0.72% from previous year)
- 2014: $275,261 (+$15,229, +5.86% from previous year)
- 2015: $285,093 (+$9,832, +3.57% from previous year)
- 2016: $296,081 (+$10,988, +3.85% from previous year)
- 2017: $318,350 (+$22,269, +7.52% from previous year)
- 2018: $331,972 (+$13,622, +4.28% from previous year)
- 2019: $359,124 (+$27,152, +8.18% from previous year)
- 2020: N/A
- 2021: $429,956
- 2022: $470,544 (+$40,588, +9.44% from previous year)
- 2023: $504,667 (+$34,123, +7.25% from previous year)
- 2024: $549,661 (+$44,994, +8.92% from previous year)
- 2025: $579,162 (+$29,501, +5.37% from previous year)
Amberley’s home prices have climbed by over 107% since 2010, with sharp growth especially evident after 2020. The town saw double-digit jumps in recent years, showing strong demand and rising appeal among buyers.
Amberley – Peaceful Living with City Access
Located near Cincinnati, Amberley Village blends quiet, leafy neighborhoods with proximity to major highways and employers. It’s known for its large lots, strong community involvement, and local parks. The stability of the area, combined with its upscale feel, has kept housing values rising steadily.
Growth since 2019 has been especially impressive, reflecting increased buyer interest in suburban spaces with quick city access. Amberley’s careful zoning and consistent infrastructure investments have also helped maintain and grow its value over time.
14. New Albany – 102% Home Price Increase Since 2010

- 2010: $307,295
- 2011: $296,034 (-$11,261, -3.66% from previous year)
- 2012: $293,386 (-$2,648, -0.89% from previous year)
- 2013: $313,805 (+$20,419, +6.96% from previous year)
- 2014: $339,244 (+$25,439, +8.11% from previous year)
- 2015: $351,699 (+$12,455, +3.67% from previous year)
- 2016: $359,614 (+$7,915, +2.25% from previous year)
- 2017: $369,275 (+$9,661, +2.69% from previous year)
- 2018: $383,553 (+$14,278, +3.87% from previous year)
- 2019: $393,253 (+$9,700, +2.53% from previous year)
- 2020: N/A
- 2021: $455,661
- 2022: $524,934 (+$69,273, +15.20% from previous year)
- 2023: $553,284 (+$28,350, +5.40% from previous year)
- 2024: $597,825 (+$44,541, +8.05% from previous year)
- 2025: $620,662 (+$22,837, +3.82% from previous year)
Home prices in New Albany have more than doubled since 2010, led by a major spike in 2022. The town has maintained strong year-over-year growth, fueled by its reputation as one of Ohio’s most desirable suburbs.
New Albany – Master-Planned Growth with High Appeal
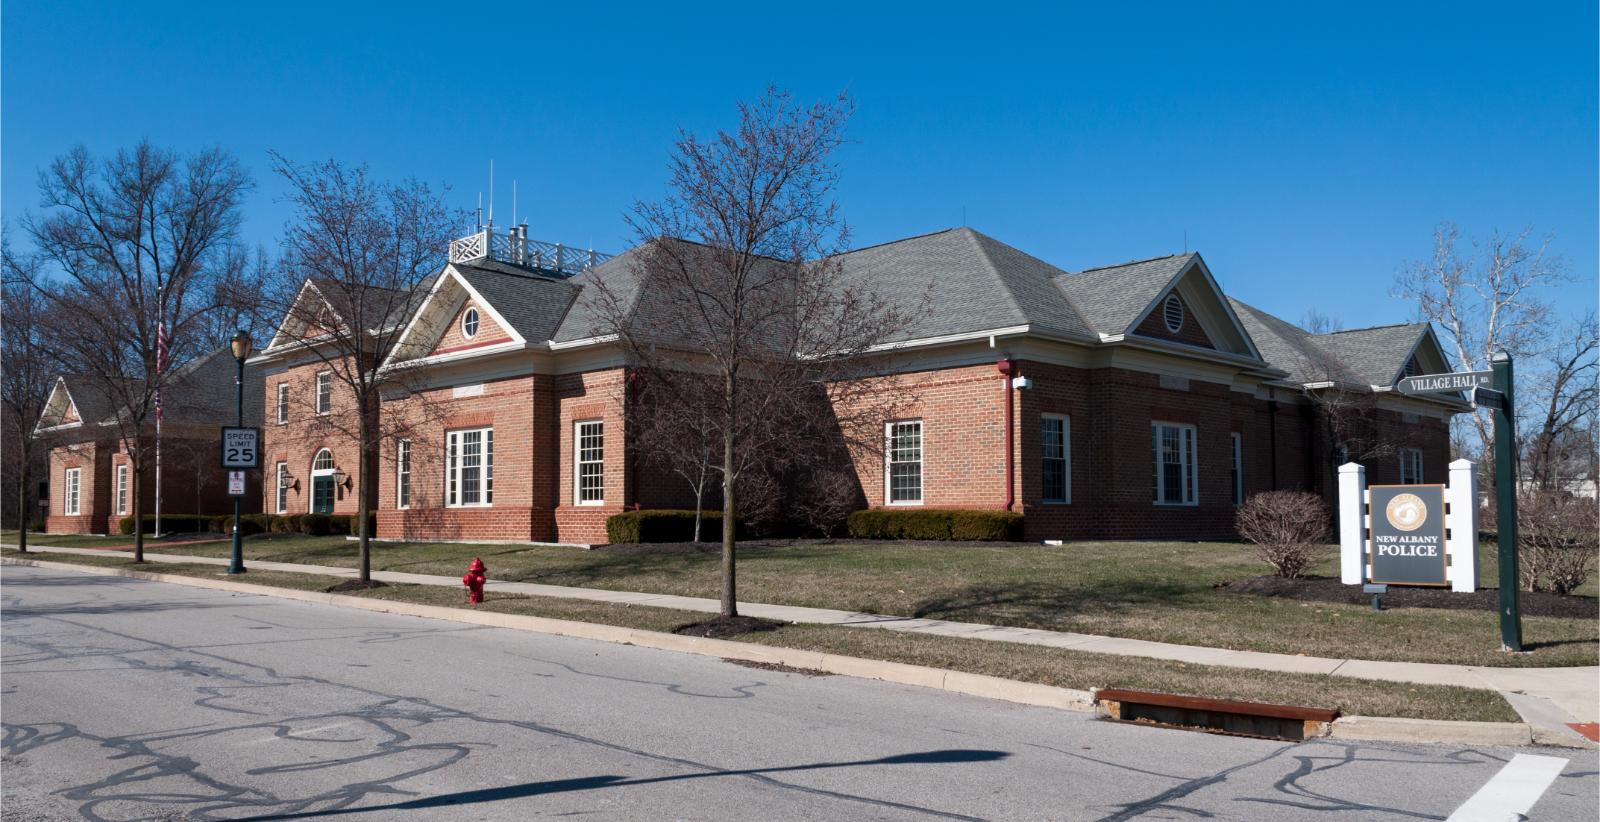
Located northeast of Columbus, New Albany is a standout example of a well-planned suburb. Known for its Georgian-style architecture, excellent schools, and corporate campuses, it has attracted affluent homebuyers for years. Meta, Google, and Intel investments in the region have further raised its profile.
With meticulously maintained public spaces and strong civic leadership, the town has become a model for upscale suburban living. Demand continues to climb, reflected in the rapid appreciation of home values throughout the 2020s.
13. Upper Arlington – 116% Home Price Increase Since 2010

- 2010: $289,529
- 2011: $279,305 (-$10,224, -3.53% from previous year)
- 2012: $279,235 (-$70, -0.03% from previous year)
- 2013: $300,049 (+$20,814, +7.45% from previous year)
- 2014: $330,459 (+$30,410, +10.14% from previous year)
- 2015: $347,694 (+$17,235, +5.22% from previous year)
- 2016: $370,652 (+$22,958, +6.60% from previous year)
- 2017: $392,496 (+$21,844, +5.89% from previous year)
- 2018: $413,781 (+$21,285, +5.42% from previous year)
- 2019: $420,947 (+$7,166, +1.73% from previous year)
- 2020: N/A
- 2021: $497,564
- 2022: $546,452 (+$48,888, +9.83% from previous year)
- 2023: $571,632 (+$25,180, +4.61% from previous year)
- 2024: $607,628 (+$35,996, +6.30% from previous year)
- 2025: $625,171 (+$17,543, +2.89% from previous year)
Upper Arlington’s home prices have surged more than 116% since 2010, with sustained double-digit growth in the early 2010s and a strong follow-up performance after 2020. The town has remained a reliable real estate bet across market cycles.
Upper Arlington – Timeless Appeal Near Ohio State
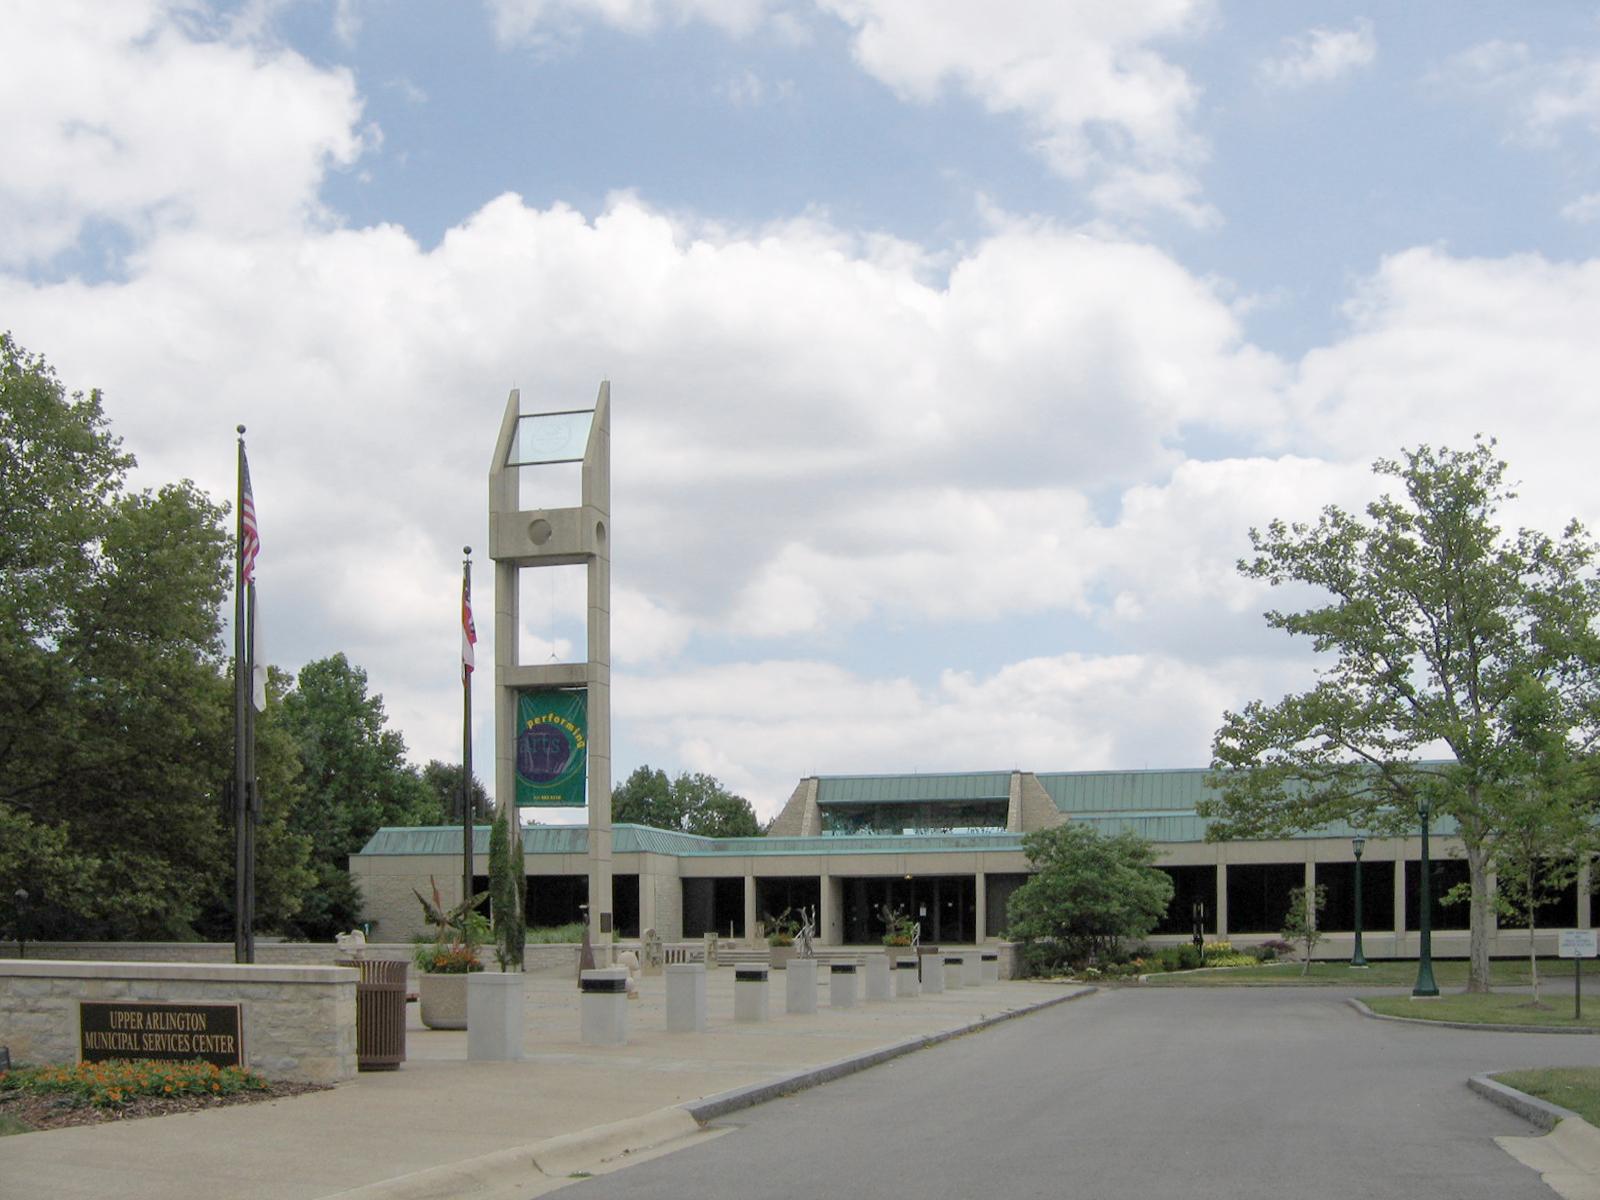
Situated just west of downtown Columbus, Upper Arlington offers prime access to The Ohio State University and downtown employers. It’s known for its prestigious public schools, historic homes, and stable housing market. Its central location and long-standing reputation have helped drive continuous value growth.
Even as surrounding markets cooled, Upper Arlington stayed strong thanks to limited inventory and strong demand from professionals, professors, and families alike. It’s no surprise the area has seen over 100% appreciation since 2010.
12. Galena – 103% Home Price Increase Since 2010

- 2010: $311,519
- 2011: $305,570 (-$5,949, -1.91% from previous year)
- 2012: $306,733 (+$1,163, +0.38% from previous year)
- 2013: $317,177 (+$10,444, +3.40% from previous year)
- 2014: $345,375 (+$28,198, +8.89% from previous year)
- 2015: $360,505 (+$15,130, +4.38% from previous year)
- 2016: $374,112 (+$13,607, +3.77% from previous year)
- 2017: $387,823 (+$13,711, +3.66% from previous year)
- 2018: $407,080 (+$19,257, +4.97% from previous year)
- 2019: $417,059 (+$9,979, +2.45% from previous year)
- 2020: N/A
- 2021: $490,279
- 2022: $560,573 (+$70,294, +14.34% from previous year)
- 2023: $590,998 (+$30,425, +5.43% from previous year)
- 2024: $615,437 (+$24,439, +4.14% from previous year)
- 2025: $632,614 (+$17,177, +2.79% from previous year)
Home prices in Galena have jumped 103% since 2010, with the sharpest increase happening in 2022. Since then, values have continued a healthy upward trend—making it one of the most consistently growing towns in central Ohio.
Galena – Rural Roots, Rapid Rise
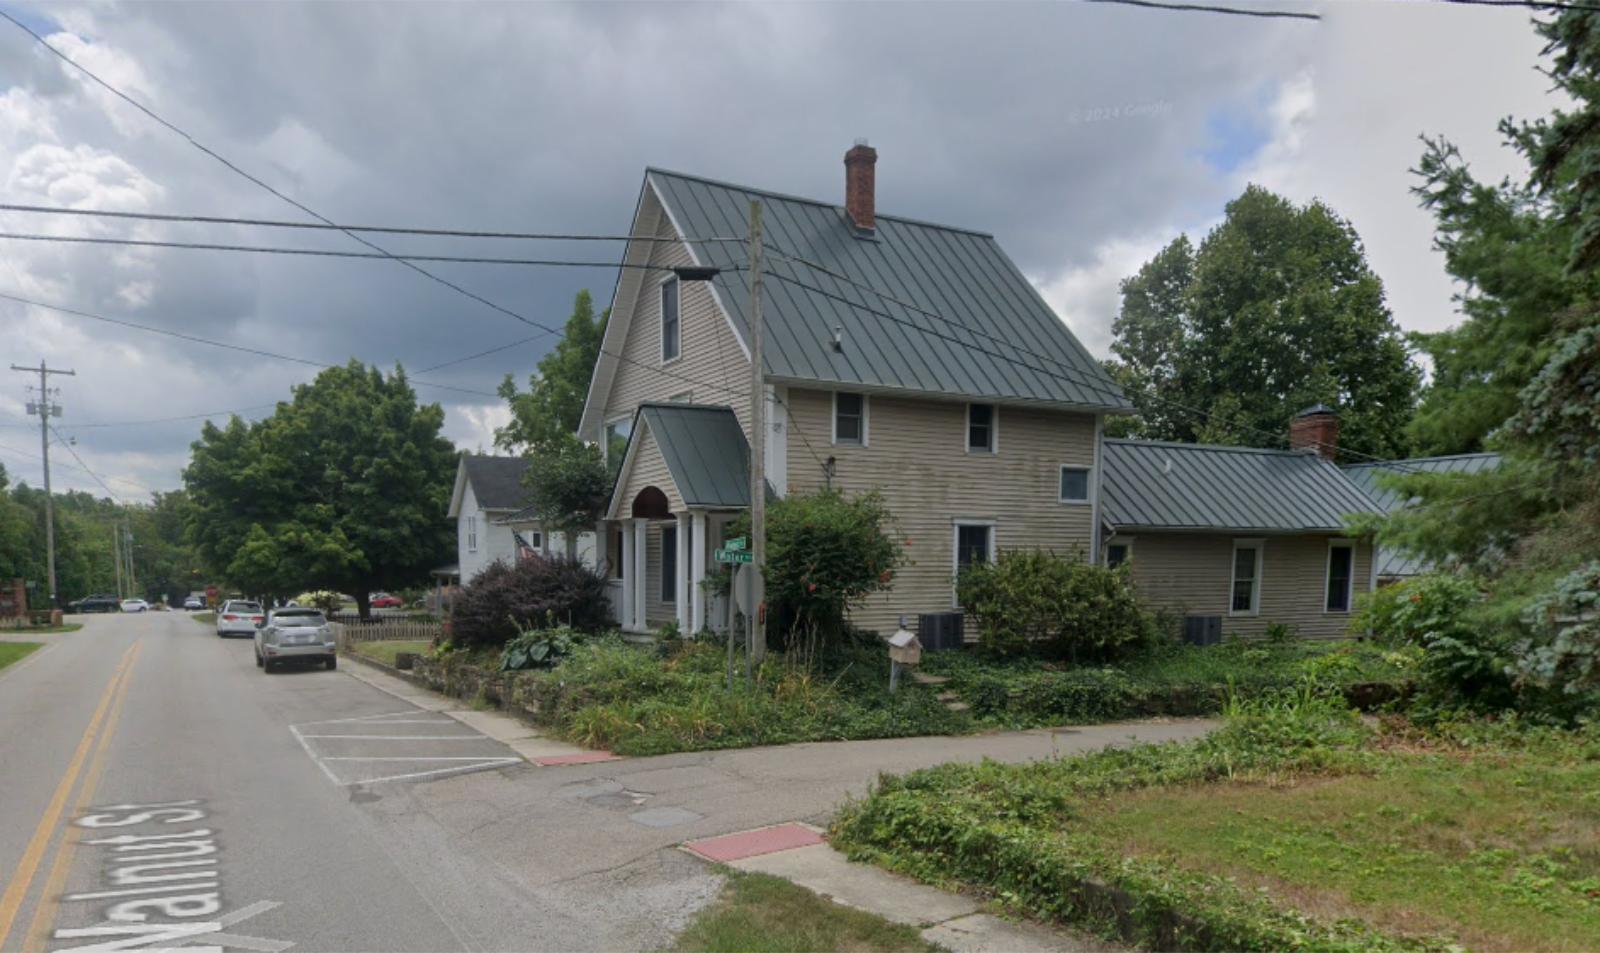
Galena sits in Delaware County, one of the fastest-growing counties in the state. Once a quiet rural town, it has become a hotspot for development, offering scenic views, larger lots, and access to Alum Creek State Park. New housing construction and school district appeal have fueled ongoing interest.
The town blends natural beauty with suburban comforts, and its rising popularity has led to competitive pricing. Galena continues to attract buyers seeking space and style without sacrificing proximity to Columbus.
11. Montgomery – 88% Home Price Increase Since 2010

- 2010: $358,782
- 2011: $338,745 (-$20,037, -5.58% from previous year)
- 2012: $324,616 (-$14,129, -4.17% from previous year)
- 2013: $319,839 (-$4,777, -1.47% from previous year)
- 2014: $341,962 (+$22,123, +6.92% from previous year)
- 2015: $360,101 (+$18,139, +5.30% from previous year)
- 2016: $387,182 (+$27,081, +7.52% from previous year)
- 2017: $415,348 (+$28,166, +7.27% from previous year)
- 2018: $422,615 (+$7,267, +1.75% from previous year)
- 2019: $448,667 (+$26,052, +6.16% from previous year)
- 2020: N/A
- 2021: $509,974
- 2022: $562,029 (+$52,055, +10.21% from previous year)
- 2023: $587,894 (+$25,865, +4.60% from previous year)
- 2024: $632,542 (+$44,648, +7.59% from previous year)
- 2025: $673,648 (+$41,106, +6.50% from previous year)
Montgomery’s home prices have climbed nearly 88% since 2010, with especially strong appreciation between 2020 and 2025. The consistent uptick points to stable demand and community desirability.
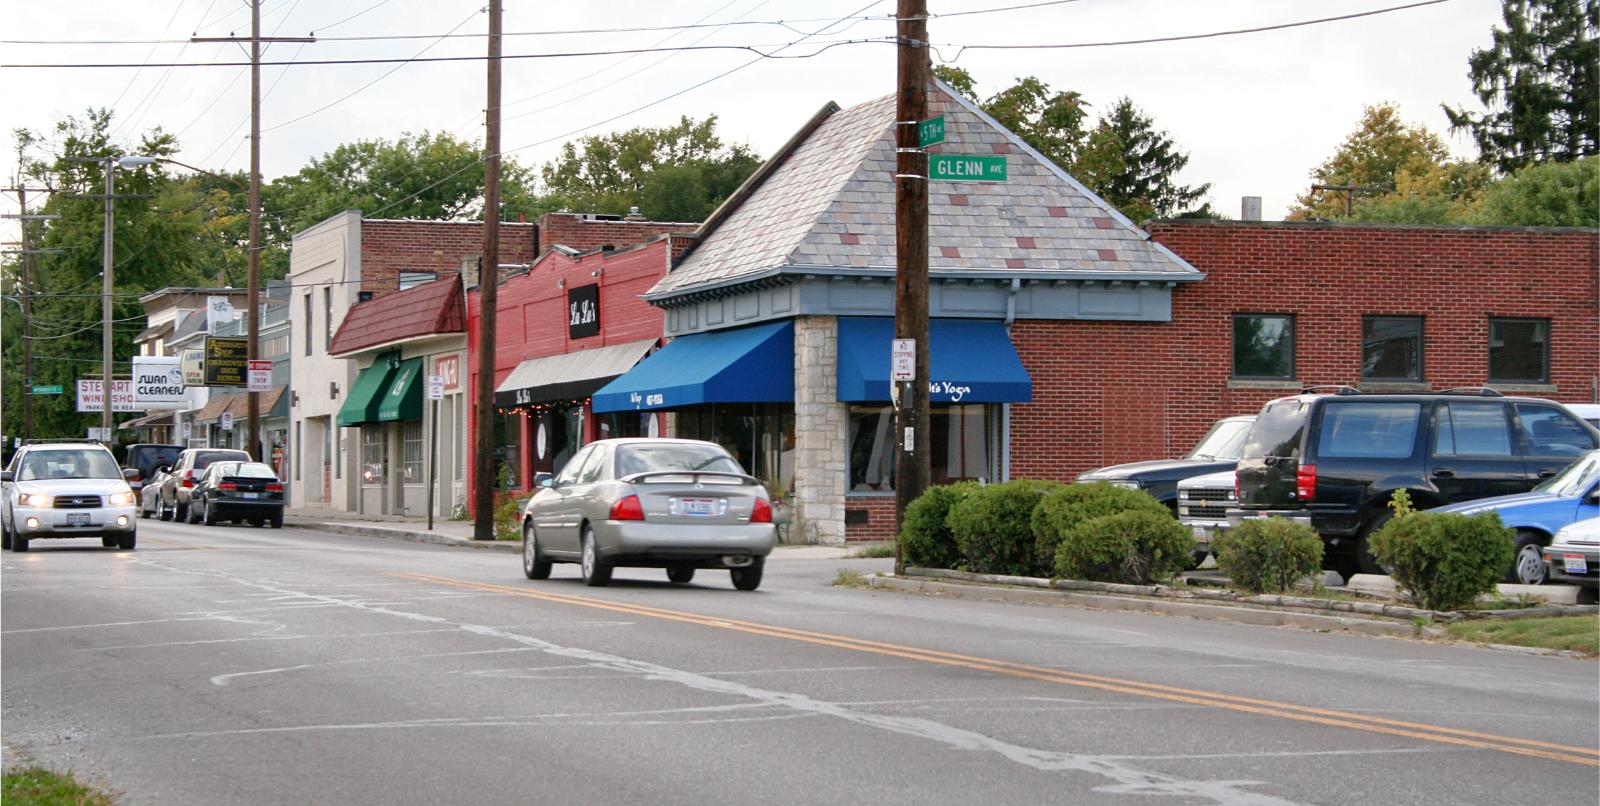
Montgomery – Tradition Meets Strong Market
North of Cincinnati, Montgomery is an upscale suburb known for its charming downtown, historic architecture, and top-rated schools. Its reputation for livability makes it a steady real estate performer. Residents enjoy quick access to I-71 and plenty of green space.
Montgomery saw accelerated price growth after 2020, driven by strong school appeal and housing scarcity. The town’s established infrastructure and balance of old and new housing stock help support its high values.
10. Pepper Pike – 72% Home Price Increase Since 2010

- 2010: $394,247
- 2011: $393,360 (-$887, -0.22% from previous year)
- 2012: $392,845 (-$515, -0.13% from previous year)
- 2013: $416,541 (+$23,696, +6.03% from previous year)
- 2014: $432,206 (+$15,665, +3.76% from previous year)
- 2015: $439,661 (+$7,455, +1.72% from previous year)
- 2016: $447,852 (+$8,191, +1.86% from previous year)
- 2017: $452,597 (+$4,745, +1.06% from previous year)
- 2018: $459,478 (+$6,881, +1.52% from previous year)
- 2019: $472,394 (+$12,916, +2.81% from previous year)
- 2020: N/A
- 2021: $532,652
- 2022: $588,423 (+$55,771, +10.47% from previous year)
- 2023: $607,705 (+$19,282, +3.28% from previous year)
- 2024: $652,077 (+$44,372, +7.30% from previous year)
- 2025: $679,387 (+$27,310, +4.19% from previous year)
Pepper Pike home values have risen 72% since 2010, with gradual increases for most of the decade followed by faster growth in recent years. The biggest spike came in 2022, helping push the town firmly into Ohio’s top 10 most expensive markets.
Pepper Pike – Quiet Prestige in Northeast Ohio
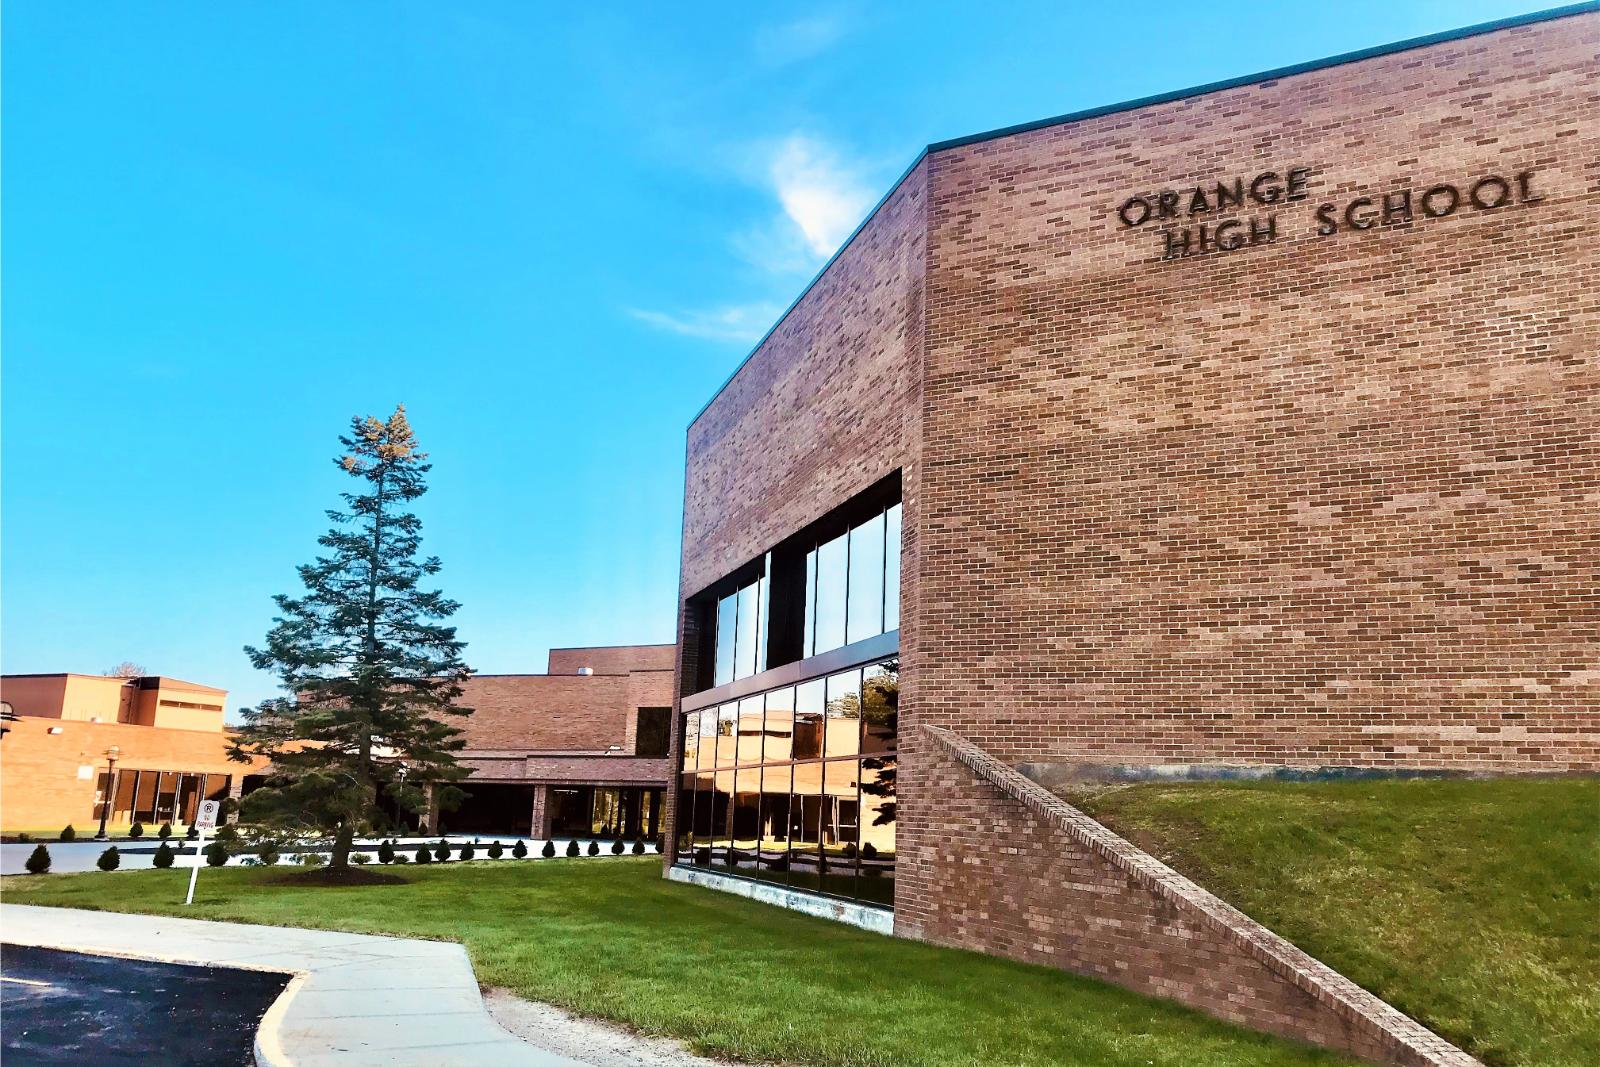
Pepper Pike is a leafy, upscale suburb of Cleveland, known for its spacious homes and calm, private feel. It’s part of the Orange City School District, one of the highest-rated in the region, and offers easy access to I-271 and Cleveland’s east-side medical and university hubs.
The area has long attracted professionals and retirees looking for large lots, low-density neighborhoods, and architectural diversity. Newer development and sustained interest in high-end properties have kept prices rising even as growth in the broader Cleveland area has slowed.
9. Moreland Hills – 80% Home Price Increase Since 2010

- 2010: $386,421
- 2011: $379,824 (-$6,597, -1.71% from previous year)
- 2012: $376,824 (-$3,000, -0.79% from previous year)
- 2013: $396,835 (+$20,011, +5.31% from previous year)
- 2014: $421,428 (+$24,593, +6.20% from previous year)
- 2015: $434,399 (+$12,971, +3.08% from previous year)
- 2016: $441,087 (+$6,688, +1.54% from previous year)
- 2017: $443,387 (+$2,300, +0.52% from previous year)
- 2018: $448,580 (+$5,193, +1.17% from previous year)
- 2019: $462,825 (+$14,245, +3.18% from previous year)
- 2020: N/A
- 2021: $528,789
- 2022: $585,061 (+$56,272, +10.64% from previous year)
- 2023: $615,651 (+$30,590, +5.23% from previous year)
- 2024: $660,865 (+$45,214, +7.34% from previous year)
- 2025: $697,382 (+$36,517, +5.53% from previous year)
Moreland Hills has seen an 80% increase in home values since 2010. Though early growth was modest, recent years have brought large annual jumps that pushed the town into Ohio’s top-tier price bracket.
Moreland Hills – Elegant Living in the Chagrin Valley
This eastern suburb of Cleveland is part of the affluent Chagrin Valley region, prized for its wooded lots, upscale homes, and proximity to the scenic South Chagrin Reservation. Moreland Hills has maintained a low-density, semi-rural feel that draws high-income buyers looking for privacy and prestige.
With limited inventory and consistent demand, the town’s prices have steadily climbed—especially as Cleveland’s wealthier residents seek lifestyle upgrades outside the urban core. Well-rated schools and access to country clubs and equestrian amenities have only added to its appeal.
8. Marble Cliff – 119% Home Price Increase Since 2010

- 2010: $332,700
- 2011: $330,152 (-$2,548, -0.77% from previous year)
- 2012: $333,856 (+$3,704, +1.12% from previous year)
- 2013: $375,650 (+$41,794, +12.52% from previous year)
- 2014: $412,900 (+$37,250, +9.92% from previous year)
- 2015: $436,595 (+$23,695, +5.74% from previous year)
- 2016: $465,652 (+$29,057, +6.66% from previous year)
- 2017: $485,325 (+$19,673, +4.22% from previous year)
- 2018: $508,257 (+$22,932, +4.73% from previous year)
- 2019: $532,994 (+$24,737, +4.87% from previous year)
- 2020: N/A
- 2021: $608,354
- 2022: $674,657 (+$66,303, +10.90% from previous year)
- 2023: $705,162 (+$30,505, +4.52% from previous year)
- 2024: $718,537 (+$13,375, +1.90% from previous year)
- 2025: $728,906 (+$10,369, +1.44% from previous year)
With a 119% increase since 2010, Marble Cliff has posted some of the strongest price appreciation in central Ohio. It enjoyed huge gains early on, then steadied into a slow-and-steady climb into 2025.
Marble Cliff – Compact, Exclusive, and Centrally Located
Marble Cliff is a tiny enclave entirely surrounded by Grandview Heights and Upper Arlington. Its location—less than 10 minutes from downtown Columbus—makes it a rare find. The village’s blend of historic homes and newer builds adds character and variety to its housing stock.
Strict zoning and minimal turnover have made the local real estate market competitive. Buyers seeking proximity to the city without sacrificing charm have driven up prices, pushing this quiet village to the top 10 in Ohio’s housing market.
7. Waite Hill – 67% Home Price Increase Since 2010

- 2010: $442,219
- 2011: $477,478 (+$35,259, +7.97% from previous year)
- 2012: $428,498 (-$48,980, -10.26% from previous year)
- 2013: $438,072 (+$9,574, +2.23% from previous year)
- 2014: $461,455 (+$23,383, +5.34% from previous year)
- 2015: $462,956 (+$1,501, +0.33% from previous year)
- 2016: $462,247 (-$709, -0.15% from previous year)
- 2017: $460,903 (-$1,344, -0.29% from previous year)
- 2018: $477,444 (+$16,541, +3.59% from previous year)
- 2019: $507,621 (+$30,177, +6.32% from previous year)
- 2020: N/A
- 2021: $580,670
- 2022: $657,133 (+$76,463, +13.17% from previous year)
- 2023: $652,375 (-$4,758, -0.72% from previous year)
- 2024: $707,958 (+$55,583, +8.52% from previous year)
- 2025: $738,218 (+$30,260, +4.27% from previous year)
Waite Hill’s home values have risen by nearly 67% since 2010. After a few early setbacks, the town experienced strong appreciation post-2020, especially with a massive boost in 2022.
Waite Hill – Forested Estates in Lake County
Waite Hill is an upscale village east of Cleveland that’s known for its estate-sized lots, forested landscape, and commitment to preserving open space. There are no sidewalks or streetlights here—by design. Residents value privacy, quiet, and natural surroundings.
Recent interest in more secluded, high-end living has pushed Waite Hill prices upward. As wealthy buyers shift away from traditional suburbs, demand in rural-feel towns like Waite Hill has soared, especially for one-of-a-kind properties.
6. Terrace Park – 76% Home Price Increase Since 2010

- 2010: $418,860
- 2011: $394,990 (-$23,870, -5.70% from previous year)
- 2012: $384,497 (-$10,493, -2.66% from previous year)
- 2013: $404,067 (+$19,570, +5.09% from previous year)
- 2014: $438,319 (+$34,252, +8.48% from previous year)
- 2015: $446,971 (+$8,652, +1.97% from previous year)
- 2016: $466,738 (+$19,767, +4.42% from previous year)
- 2017: $482,292 (+$15,554, +3.33% from previous year)
- 2018: $483,523 (+$1,231, +0.26% from previous year)
- 2019: $492,847 (+$9,324, +1.93% from previous year)
- 2020: N/A
- 2021: $569,793
- 2022: $628,804 (+$59,011, +10.36% from previous year)
- 2023: $662,661 (+$33,857, +5.38% from previous year)
- 2024: $705,758 (+$43,097, +6.50% from previous year)
- 2025: $739,165 (+$33,407, +4.73% from previous year)
Terrace Park has seen home values increase by over 76% since 2010. Growth has been particularly strong in the last five years, reflecting increased demand for high-quality suburban living near Cincinnati.
Terrace Park – A Tight-Knit Riverside Community
Located along the Little Miami River, Terrace Park is a historic village with a tight-knit feel and top-tier schools. It offers quick access to downtown Cincinnati while maintaining a small-town atmosphere that’s increasingly attractive to families.
The area’s charm, walkability, and excellent location have led to consistent home value growth. Buyers are drawn by its blend of history, natural beauty, and convenience—all of which have helped fuel steady price increases year after year.
5. Gates Mills – 65% Home Price Increase Since 2010

- 2010: $452,777
- 2011: $448,945 (-$3,832, -0.85% from previous year)
- 2012: $441,457 (-$7,488, -1.67% from previous year)
- 2013: $446,085 (+$4,628, +1.05% from previous year)
- 2014: $470,409 (+$24,324, +5.45% from previous year)
- 2015: $490,119 (+$19,710, +4.19% from previous year)
- 2016: $501,917 (+$11,798, +2.41% from previous year)
- 2017: $500,242 (-$1,675, -0.33% from previous year)
- 2018: $517,810 (+$17,568, +3.51% from previous year)
- 2019: $519,773 (+$1,963, +0.38% from previous year)
- 2020: N/A
- 2021: $581,428
- 2022: $648,981 (+$67,553, +11.62% from previous year)
- 2023: $659,643 (+$10,662, +1.64% from previous year)
- 2024: $713,362 (+$53,719, +8.14% from previous year)
- 2025: $745,492 (+$32,130, +4.50% from previous year)
Gates Mills home prices have increased by nearly 65% since 2010. Most of that growth occurred after 2020, with 2022 marking a breakout year in price appreciation. It’s now one of the highest-priced markets in northeast Ohio.
Gates Mills – Historic Estate Village with Lasting Value
Gates Mills is a prestigious suburb east of Cleveland, known for its grand homes, art galleries, and wooded setting. Its roots as a 19th-century mill town are still visible in preserved stone bridges and historic buildings. The Chagrin River adds natural beauty and recreational options.
The town’s large lot sizes, tight zoning regulations, and high income demographics have helped support long-term home value increases. Its tranquil setting and cultural richness make it a perennial favorite among luxury buyers.
4. Kirtland Hills – 73% Home Price Increase Since 2010

- 2010: $443,909
- 2011: $449,016 (+$5,107, +1.15% from previous year)
- 2012: $416,209 (-$32,807, -7.31% from previous year)
- 2013: $442,167 (+$25,958, +6.24% from previous year)
- 2014: $453,594 (+$11,427, +2.58% from previous year)
- 2015: $462,953 (+$9,359, +2.06% from previous year)
- 2016: $466,229 (+$3,276, +0.71% from previous year)
- 2017: $469,658 (+$3,429, +0.74% from previous year)
- 2018: $480,479 (+$10,821, +2.30% from previous year)
- 2019: $498,423 (+$17,944, +3.73% from previous year)
- 2020: N/A
- 2021: $580,754
- 2022: $659,512 (+$78,758, +13.56% from previous year)
- 2023: $677,645 (+$18,133, +2.75% from previous year)
- 2024: $731,498 (+$53,853, +7.95% from previous year)
- 2025: $769,500 (+$38,002, +5.20% from previous year)
Kirtland Hills home prices have increased 73% since 2010, with the most aggressive gains coming after 2021. It remains one of the most exclusive and secluded markets in Ohio.
Kirtland Hills – Private Living in Lake County

Kirtland Hills is a rural-residential village in Lake County that places a premium on privacy and natural surroundings. With large plots of land, country-style estates, and access to Holden Arboretum, the area has long appealed to buyers seeking space and seclusion.
Home prices have climbed steadily thanks to very limited inventory and growing demand for properties that offer both luxury and peace. High demand from professionals commuting to Cleveland has kept prices strong even in market lulls.
3. Bentleyville – 55% Home Price Increase Since 2010

- 2010: $530,097
- 2011: $533,757 (+$3,660, +0.69% from previous year)
- 2012: $527,956 (-$5,801, -1.09% from previous year)
- 2013: $545,486 (+$17,530, +3.32% from previous year)
- 2014: $565,790 (+$20,304, +3.72% from previous year)
- 2015: $575,075 (+$9,285, +1.64% from previous year)
- 2016: $561,466 (-$13,609, -2.37% from previous year)
- 2017: $564,613 (+$3,147, +0.56% from previous year)
- 2018: $566,185 (+$1,572, +0.28% from previous year)
- 2019: $577,696 (+$11,511, +2.03% from previous year)
- 2020: N/A
- 2021: $635,799
- 2022: $702,831 (+$67,032, +10.54% from previous year)
- 2023: $731,745 (+$28,914, +4.11% from previous year)
- 2024: $788,809 (+$57,064, +7.80% from previous year)
- 2025: $820,151 (+$31,342, +3.97% from previous year)
Bentleyville has seen home values grow 55% since 2010, driven by rapid gains in the past five years. Its low turnover and attractive setting have helped maintain strong long-term growth.
Bentleyville – Scenic, Small, and Upscale
Bentleyville is a small residential village located within the Chagrin Valley. It’s known for wooded surroundings, proximity to the Metroparks system, and luxury homes on quiet, winding streets. With fewer than 1,000 residents, the area sees very few home sales annually.
This low inventory, paired with high demand, has created pressure on prices. Buyers looking for both prestige and peace have helped Bentleyville maintain its place among the priciest Ohio markets.
2. Hunting Valley – 56% Home Price Increase Since 2010

- 2010: $981,473
- 2011: $948,258 (-$33,215, -3.38% from previous year)
- 2012: $957,137 (+$8,879, +0.94% from previous year)
- 2013: $973,372 (+$16,235, +1.70% from previous year)
- 2014: $1,011,450 (+$38,078, +3.91% from previous year)
- 2015: $1,020,188 (+$8,738, +0.86% from previous year)
- 2016: $1,033,790 (+$13,602, +1.33% from previous year)
- 2017: $1,010,969 (-$22,821, -2.21% from previous year)
- 2018: $1,043,587 (+$32,618, +3.23% from previous year)
- 2019: $1,080,424 (+$36,837, +3.53% from previous year)
- 2020: N/A
- 2021: $1,175,249
- 2022: $1,316,941 (+$141,692, +12.06% from previous year)
- 2023: $1,285,950 (-$30,991, -2.35% from previous year)
- 2024: $1,432,751 (+$146,801, +11.42% from previous year)
- 2025: $1,535,076 (+$102,325, +7.14% from previous year)
Hunting Valley home prices have grown 56% since 2010. The town saw steady appreciation early on, but its most significant increases happened after 2021, including two double-digit jumps in the last three years.
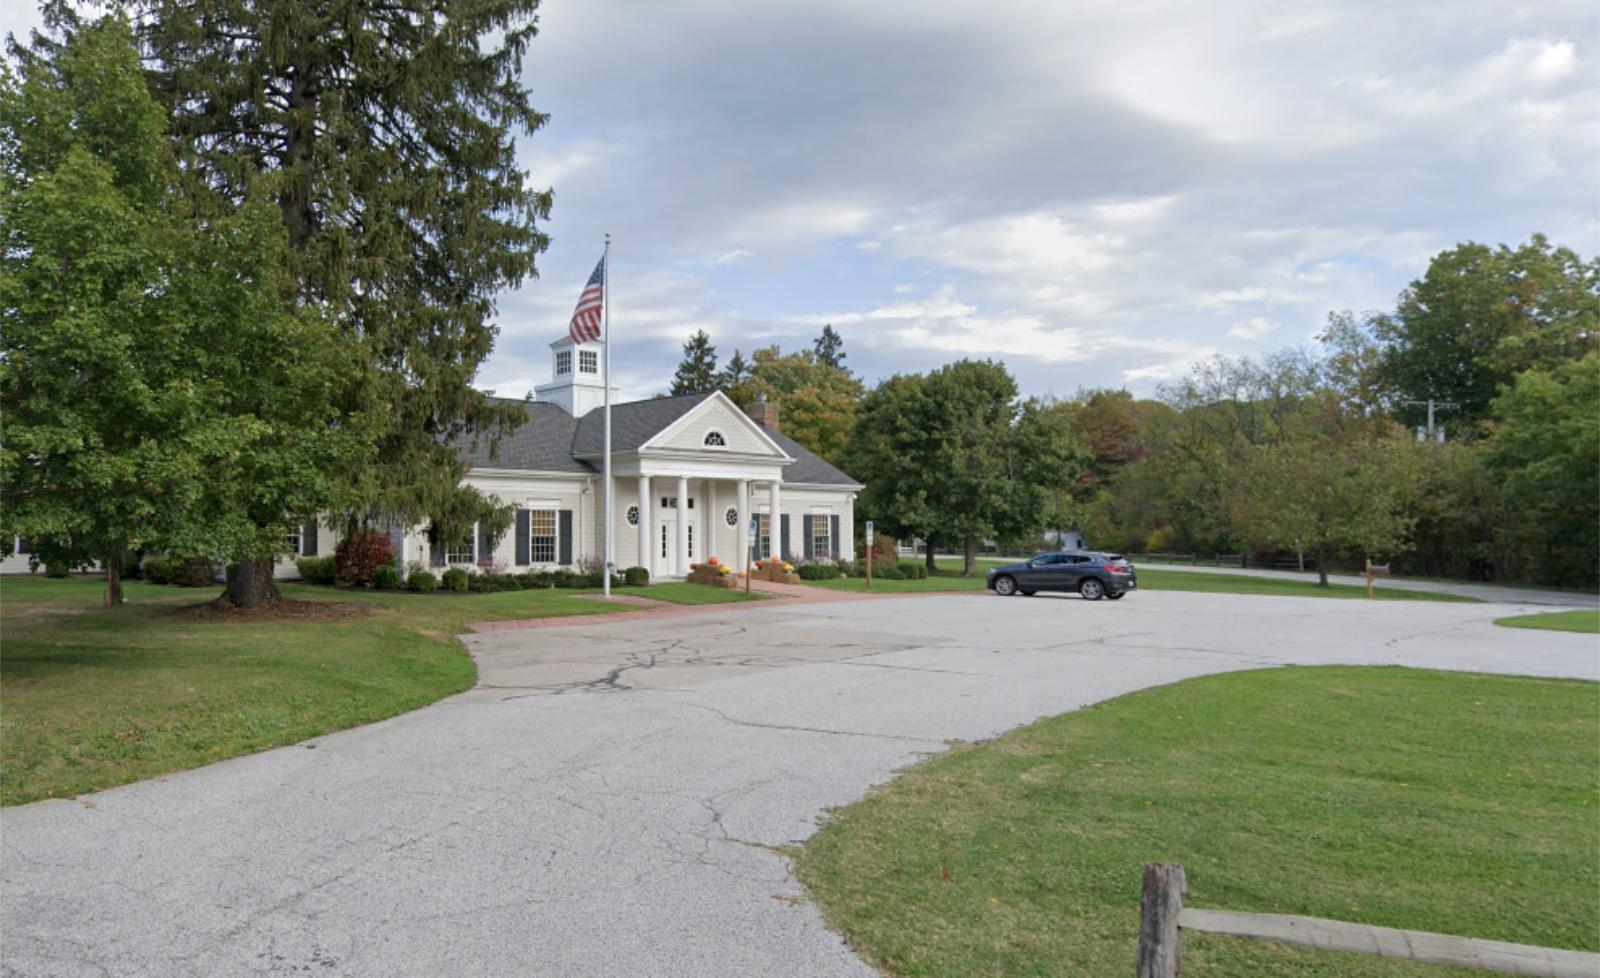
Hunting Valley – Ohio’s Elite Residential Enclave
Located across Cuyahoga and Geauga counties, Hunting Valley is consistently ranked as one of Ohio’s wealthiest towns. With large estates, private lakes, and scenic landscapes, it’s home to executives, philanthropists, and long-time residents who value privacy and elegance.
Strict zoning laws keep development minimal and preserve the natural setting. This exclusivity has helped sustain home prices at the top of the market, especially as more buyers compete for ultra-luxury real estate near Cleveland.
1. The Village of Indian Hill – 56% Home Price Increase Since 2010

- 2010: $1,004,334
- 2011: $943,759 (-$60,575, -6.03% from previous year)
- 2012: $899,213 (-$44,546, -4.72% from previous year)
- 2013: $912,896 (+$13,683, +1.52% from previous year)
- 2014: $965,312 (+$52,416, +5.74% from previous year)
- 2015: $991,002 (+$25,690, +2.66% from previous year)
- 2016: $986,598 (-$4,404, -0.44% from previous year)
- 2017: $985,899 (-$699, -0.07% from previous year)
- 2018: $955,130 (-$30,769, -3.12% from previous year)
- 2019: $1,020,820 (+$65,690, +6.88% from previous year)
- 2020: N/A
- 2021: $1,177,333
- 2022: $1,346,242 (+$168,909, +14.35% from previous year)
- 2023: $1,383,102 (+$36,860, +2.74% from previous year)
- 2024: $1,490,527 (+$107,425, +7.77% from previous year)
- 2025: $1,567,139 (+$76,612, +5.14% from previous year)
Indian Hill remains Ohio’s most expensive housing market, with a 56% increase in home prices since 2010. Despite its already high base, the town has continued to post strong gains, especially after 2020.
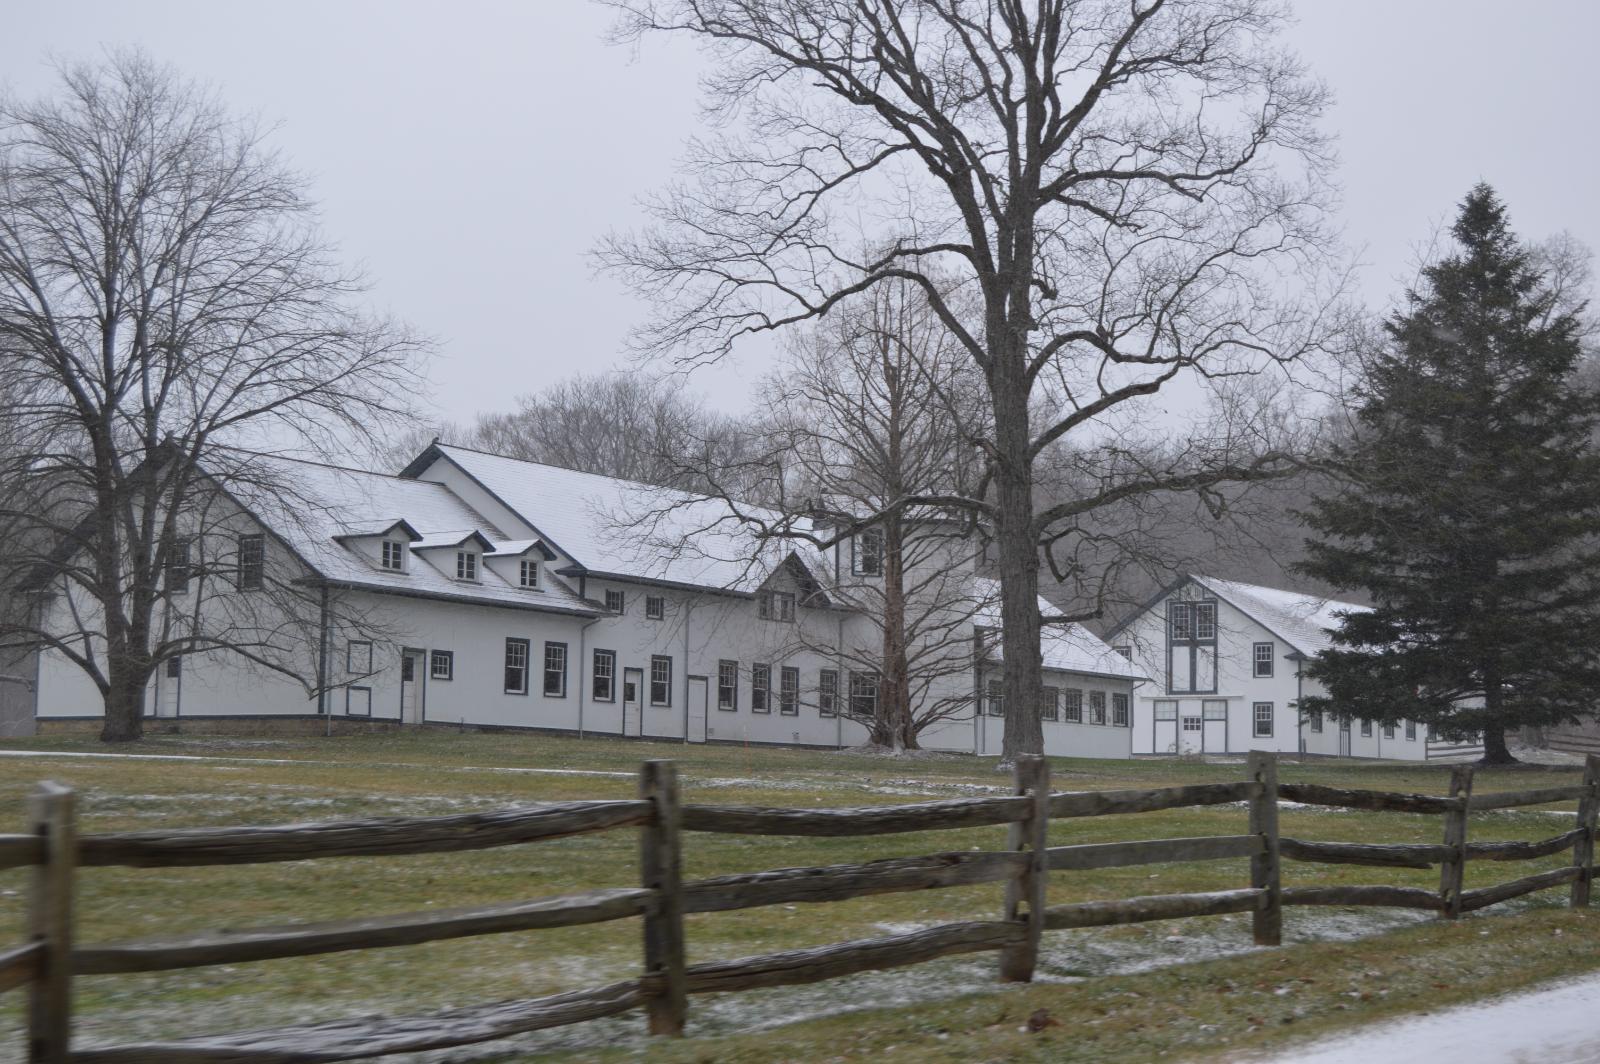
Indian Hill – Legacy Wealth and Landmark Homes
Hunting Valley Town Image
Located outside Cincinnati, Indian Hill has long been synonymous with affluence and old-money prestige. Mansions sit on expansive wooded lots, and strict development rules ensure privacy and low density. The town consistently ranks among the most expensive zip codes in the Midwest.
Indian Hill’s home values are supported by generational wealth, excellent schools, and a commitment to maintaining green space and historic character. As of 2025, it remains the pinnacle of residential real estate in Ohio.