
🔥 Would you like to save this?
According to Zillow Home Value Index data, not every housing market in Oregon has spiraled out of reach. In fact, these 18 towns still offer a chance to buy a home without draining your life savings. Scattered across the state, they range from quiet coastal enclaves to inland farming communities—places where prices have stayed grounded even as much of Oregon’s market has soared. If you’re looking for space, charm, and actual affordability, these towns are still holding the line.
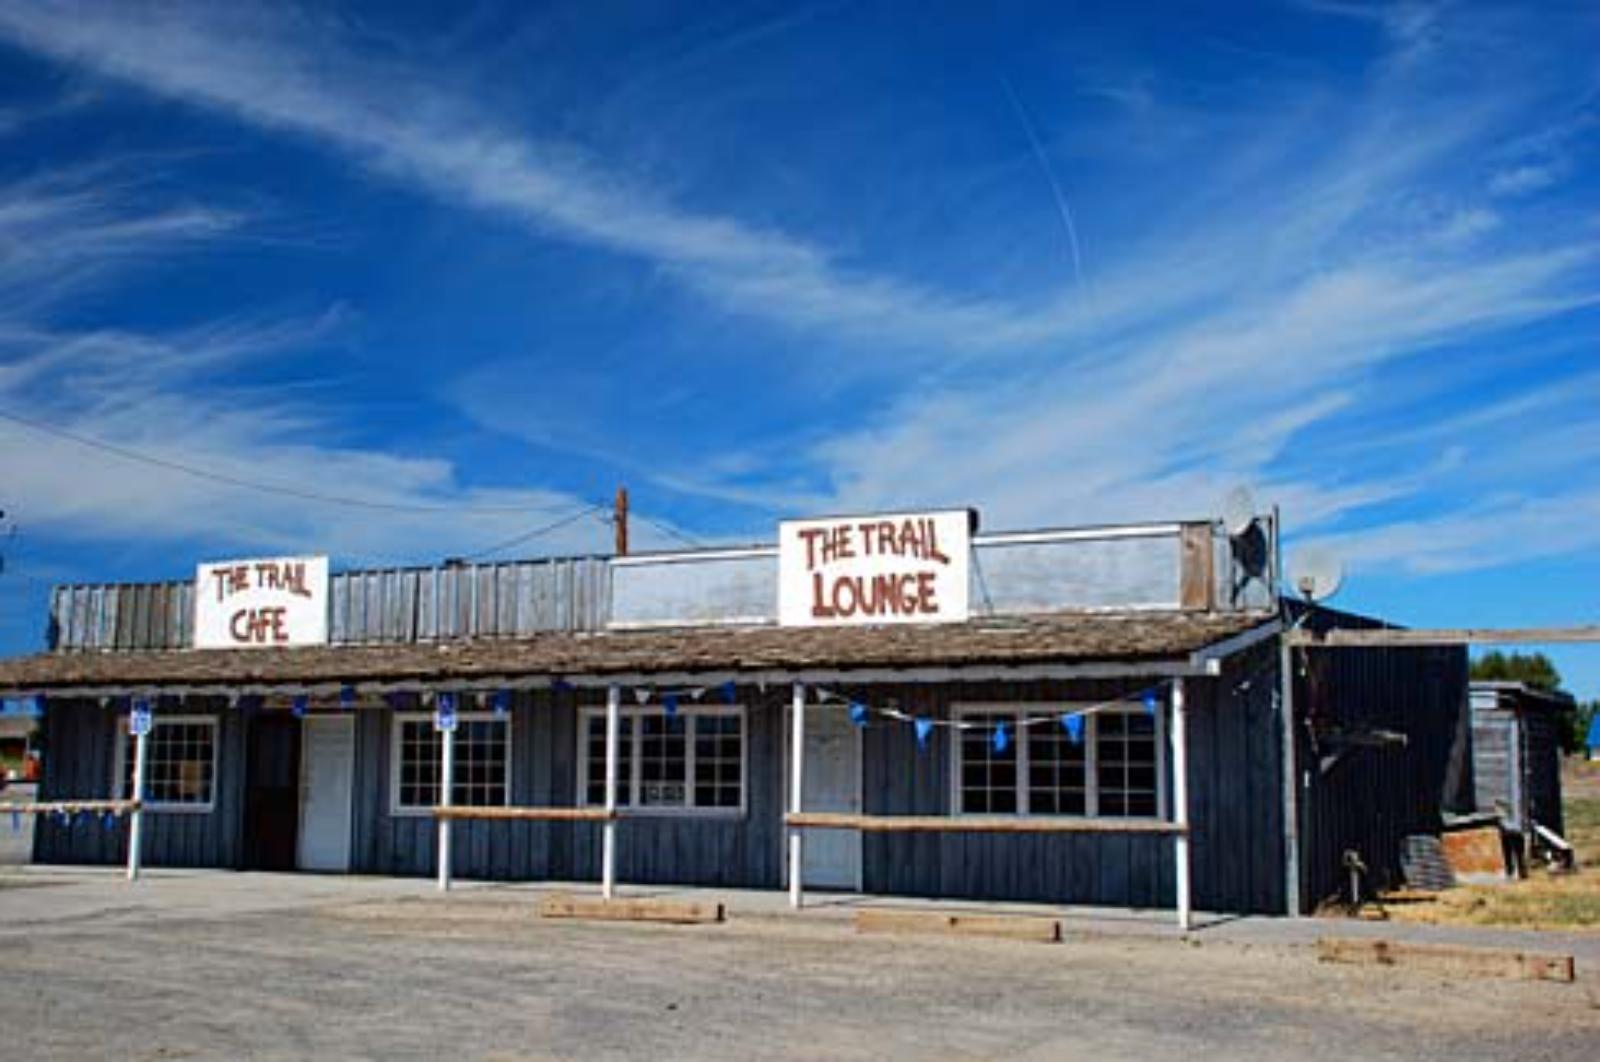
18. Elgin – 101% Home Price Increase Since 2010
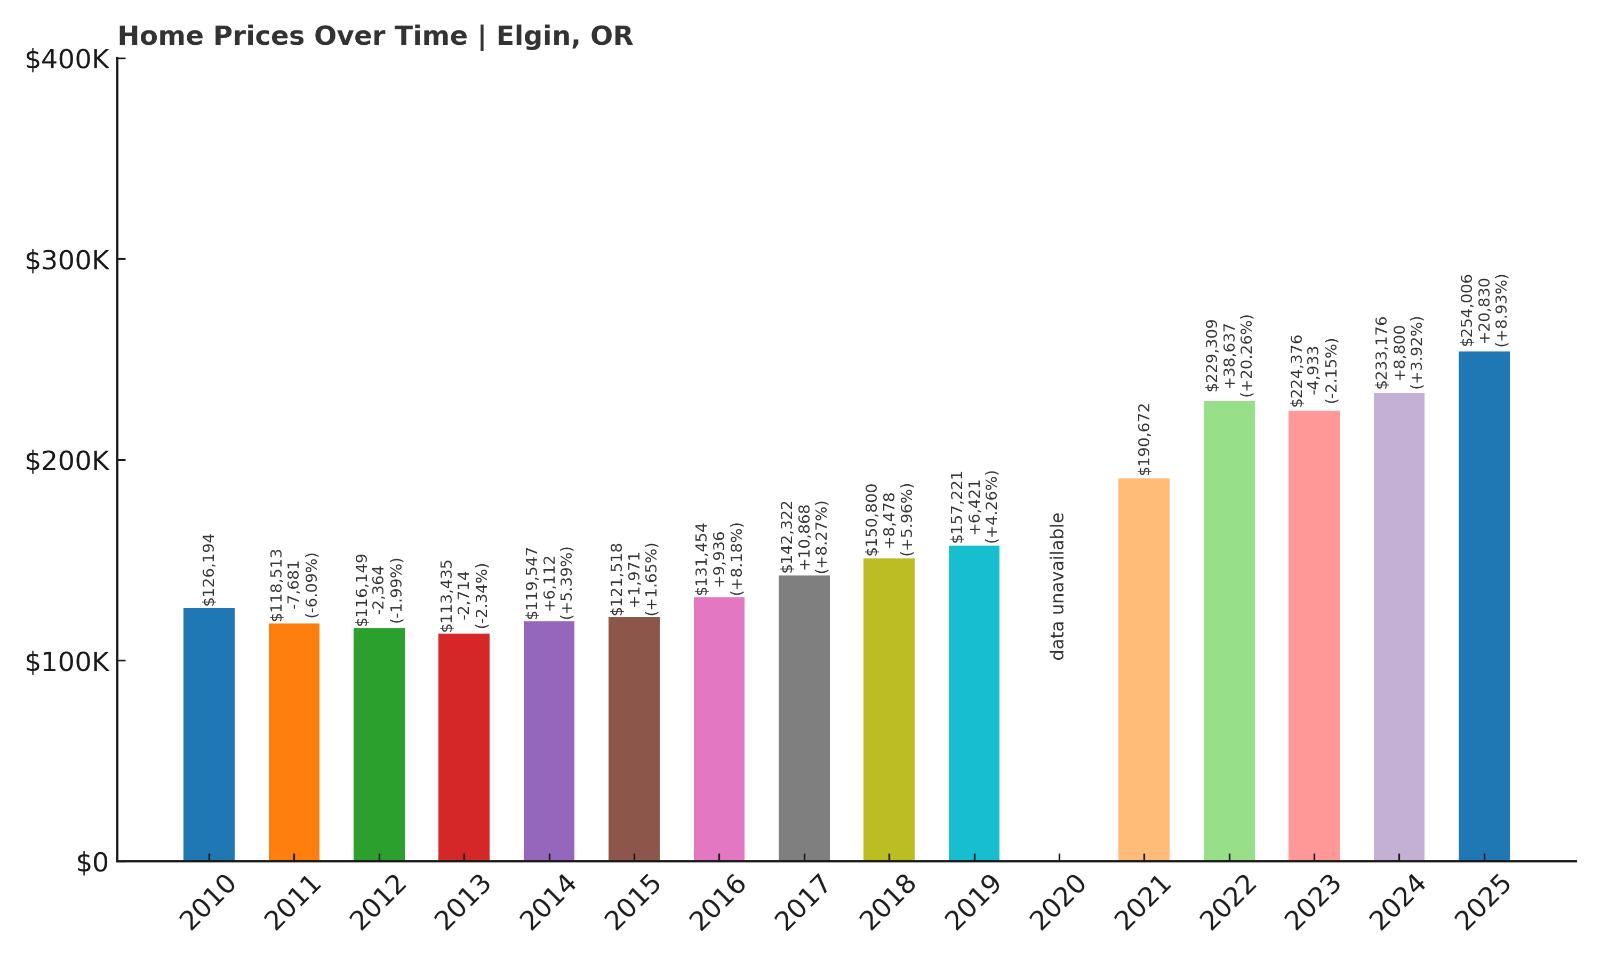
- 2010: $126,194
- 2011: $118,513 (-$7,681, -6.09% from previous year)
- 2012: $116,149 (-$2,364, -1.99% from previous year)
- 2013: $113,435 (-$2,714, -2.34% from previous year)
- 2014: $119,547 (+$6,112, +5.39% from previous year)
- 2015: $121,518 (+$1,971, +1.65% from previous year)
- 2016: $131,454 (+$9,936, +8.18% from previous year)
- 2017: $142,322 (+$10,868, +8.27% from previous year)
- 2018: $150,800 (+$8,478, +5.96% from previous year)
- 2019: $157,221 (+$6,421, +4.26% from previous year)
- 2020: N/A
- 2021: $190,672
- 2022: $229,309 (+$38,637, +20.26% from previous year)
- 2023: $224,376 (-$4,933, -2.15% from previous year)
- 2024: $233,176 (+$8,800, +3.92% from previous year)
- 2025: $254,006 (+$20,831, +8.93% from previous year)
Elgin’s home prices have more than doubled since 2010, with a total increase of 101% over the 15-year period. Though there was a dip early on, the town has seen strong gains since 2016, and the recent 8.93% growth from 2024 to 2025 suggests the upward trend is continuing. This is a rural market quietly picking up steam.
In order to come up with the very specific design ideas, we create most designs with the assistance of state-of-the-art AI interior design software.
Elgin – Modest Growth in Eastern Oregon
Located in Union County, Elgin sits in northeastern Oregon and is known for its timber heritage and quiet pace of life. The presence of the scenic Eagle Cap Excursion Train and proximity to the Wallowa Mountains give it some tourism appeal. While it’s not a booming metropolis, price growth here reflects a rising interest in rural affordability and lifestyle shifts since the pandemic.
Home values remained stagnant for a few years but started climbing notably in the mid-2010s. The surge post-2020 aligns with statewide trends in demand for less crowded, nature-adjacent areas. With 2025 values at $254,006, Elgin may continue gaining attention among buyers priced out of larger cities.
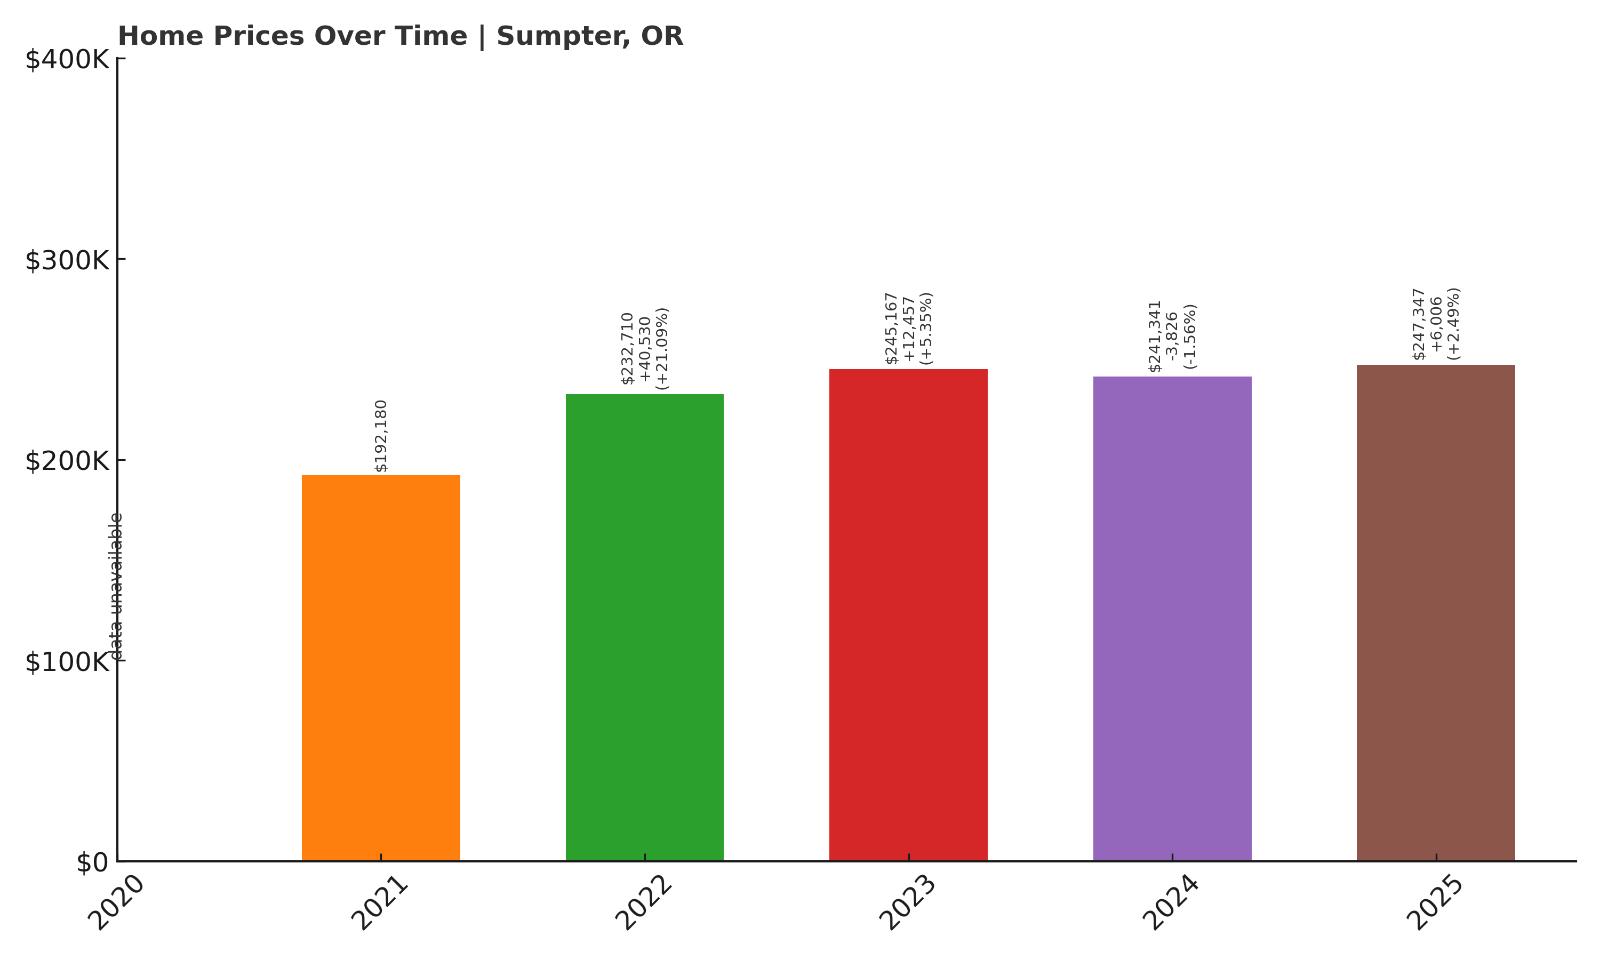
17. Sumpter – 29% Home Price Increase Since May 2021
- 2010: N/A
- 2011: N/A
- 2012: N/A
- 2013: N/A
- 2014: N/A
- 2015: N/A
- 2016: N/A
- 2017: N/A
- 2018: N/A
- 2019: N/A
- 2020: N/A
- 2021: $192,180
- 2022: $232,710 (+$40,530, +21.09% from previous year)
- 2023: $245,167 (+$12,457, +5.35% from previous year)
- 2024: $241,341 (-$3,826, -1.56% from previous year)
- 2025: $247,347 (+$6,006, +2.49% from previous year)
Sumpter entered the dataset in 2021 with a home value of $192,180. Since then, prices have risen nearly 29%, despite a brief dip in 2024. The latest figure of $247,347 suggests a continuing upward trend, though not as sharp as other towns on this list.
Sumpter – A Gold Rush Legacy with New Appeal
Nestled in the Blue Mountains of Baker County, Sumpter has historic roots dating back to Oregon’s gold rush. Once nearly a ghost town, it’s now a niche destination for outdoor lovers and history buffs drawn by attractions like the Sumpter Valley Railroad and gold dredge.
Limited housing stock and scenic isolation have kept inventory low, and even small changes in demand cause noticeable price shifts. The 2022 surge may have reflected post-pandemic migration, while the modest 2025 uptick points to market stabilization. With a median price under $250K, it remains relatively accessible compared to statewide averages.
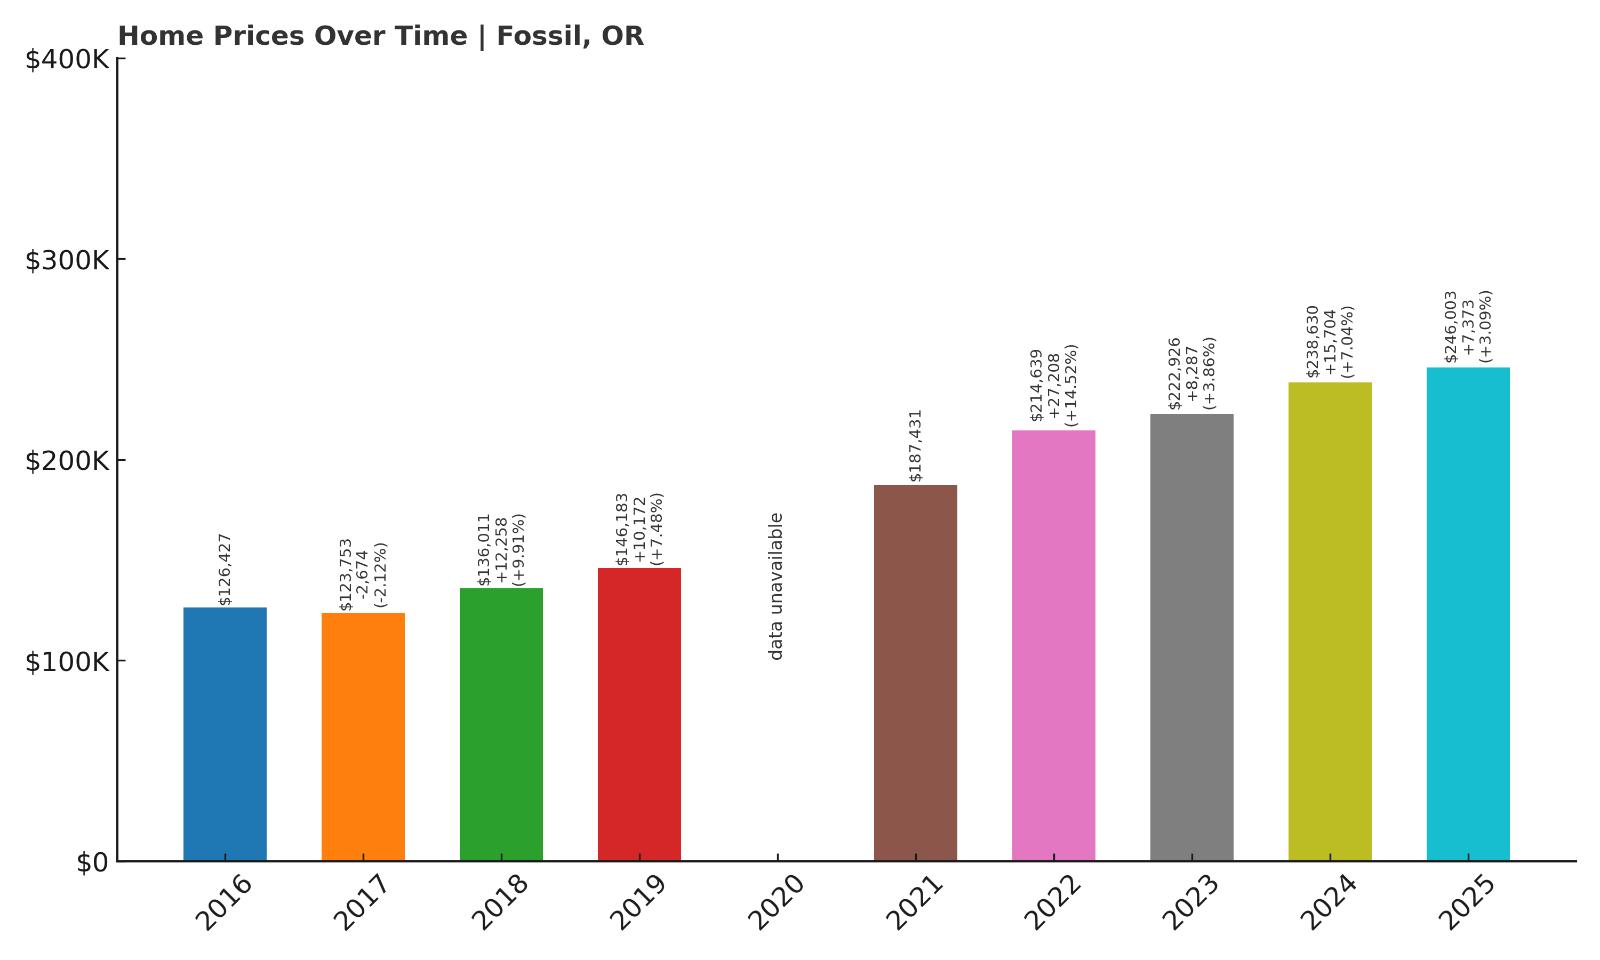
16. Fossil – 94% Home Price Increase Since May 2016
- 2010: N/A
- 2011: N/A
- 2012: N/A
- 2013: N/A
- 2014: N/A
- 2015: N/A
- 2016: $126,427
- 2017: $123,753 (-$2,674, -2.12% from previous year)
- 2018: $136,011 (+$12,258, +9.91% from previous year)
- 2019: $146,183 (+$10,172, +7.48% from previous year)
- 2020: N/A
- 2021: $187,431
- 2022: $214,639 (+$27,208, +14.52% from previous year)
- 2023: $222,926 (+$8,286, +3.86% from previous year)
- 2024: $238,630 (+$15,704, +7.04% from previous year)
- 2025: $246,003 (+$7,373, +3.09% from previous year)
Since 2016, home prices in Fossil have climbed by 94%. After a slow start, prices accelerated sharply from 2020 onward, peaking at $246,003 in May 2025. With annual growth now settling into the 3–7% range, Fossil is seeing sustained gains, not just a pandemic-era spike.
Fossil – Small Town, Big Percentage Gains
Fossil, the seat of Wheeler County, is a tiny town of fewer than 500 residents but carries major historical and geological intrigue. It’s home to Oregon’s only public fossil beds and offers outdoor access to the John Day River system. Its unique appeal and lack of inventory make its housing market highly sensitive to demand changes.
The dramatic value jump since 2020 mirrors renewed interest in remote living. The town saw double-digit price increases in 2022 and 2024, and while 2025’s rise was more modest, it signals continuing growth. Buyers seeking quiet, small-town living with distinctive local flavor may keep Fossil on the rise.
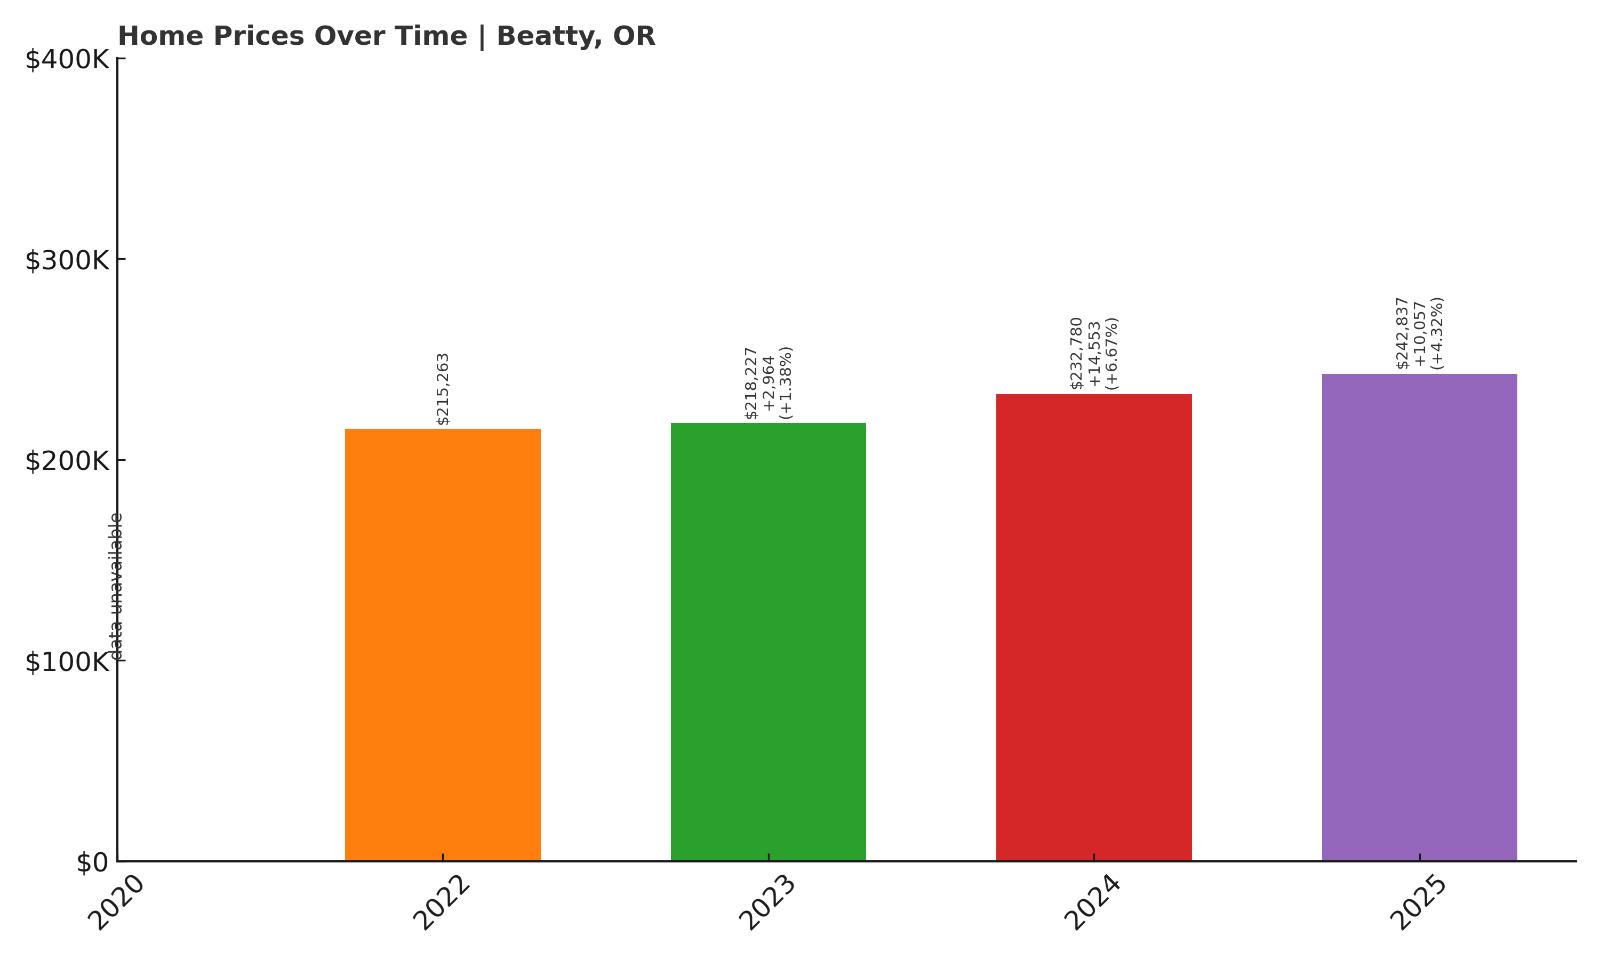
15. Beatty – 12.8% Home Price Increase Since May 2022
- 2010: N/A
- 2011: N/A
- 2012: N/A
- 2013: N/A
- 2014: N/A
- 2015: N/A
- 2016: N/A
- 2017: N/A
- 2018: N/A
- 2019: N/A
- 2020: N/A
- 2021: N/A
- 2022: $215,263
- 2023: $218,227 (+$2,964, +1.38% from previous year)
- 2024: $232,780 (+$14,553, +6.67% from previous year)
- 2025: $242,837 (+$10,057, +4.32% from previous year)
Beatty has limited historical data, but since entering the records in 2022, its home values have grown by nearly 13%. The steady increases each year suggest consistent demand, even without a major population or commercial base.
Beatty – Quiet Growth in Klamath County
Beatty is a small community located along the Sprague River in Klamath County, southeast Oregon. It’s mostly residential and agricultural, with few services—but that quiet simplicity is part of its draw. Limited supply and low density can create upward pricing pressure, especially when buyers seek out peace and land.
Since 2022, the town has added over $27,000 to its median home value. That might seem modest, but for such a remote location, it’s a noteworthy trend. Buyers priced out of nearby Klamath Falls or looking for rural properties may be keeping this micro-market alive.
14. Pilot Rock – 123% Home Price Increase Since 2010

- 2010: $107,485
- 2011: $99,805 (-$7,680, -7.15% from previous year)
- 2012: $97,794 (-$2,011, -2.01% from previous year)
- 2013: $102,580 (+$4,786, +4.89% from previous year)
- 2014: $109,320 (+$6,741, +6.57% from previous year)
- 2015: $114,604 (+$5,284, +4.83% from previous year)
- 2016: $119,907 (+$5,303, +4.63% from previous year)
- 2017: $123,261 (+$3,354, +2.80% from previous year)
- 2018: $133,728 (+$10,467, +8.49% from previous year)
- 2019: $142,341 (+$8,613, +6.44% from previous year)
- 2020: N/A
- 2021: $183,818
- 2022: $223,518 (+$39,700, +21.60% from previous year)
- 2023: $225,463 (+$1,945, +0.87% from previous year)
- 2024: $230,031 (+$4,568, +2.03% from previous year)
- 2025: $239,267 (+$9,236, +4.02% from previous year)
Pilot Rock’s home values have soared by 123% since 2010. The town has experienced especially sharp increases since 2020, with values jumping more than $55,000 over the past three years alone. The consistent year-over-year growth reflects increasing demand in this part of eastern Oregon.
Pilot Rock – Steady Momentum in Umatilla County
Located south of Pendleton in Umatilla County, Pilot Rock has a history rooted in lumber and agriculture. While it’s not a bustling city, its affordability and scenic setting near the Blue Mountains make it attractive to families and retirees alike. The town’s relative proximity to services in Pendleton also boosts appeal.
The market here has warmed up significantly since 2021, with prices increasing each year. The 2022 spike of over 21% stands out, possibly driven by post-pandemic relocation and limited housing inventory. With 2025 values nearing $240,000, the town’s upward trajectory shows no sign of slowing.
13. Heppner – 121% Home Price Increase Since 2010
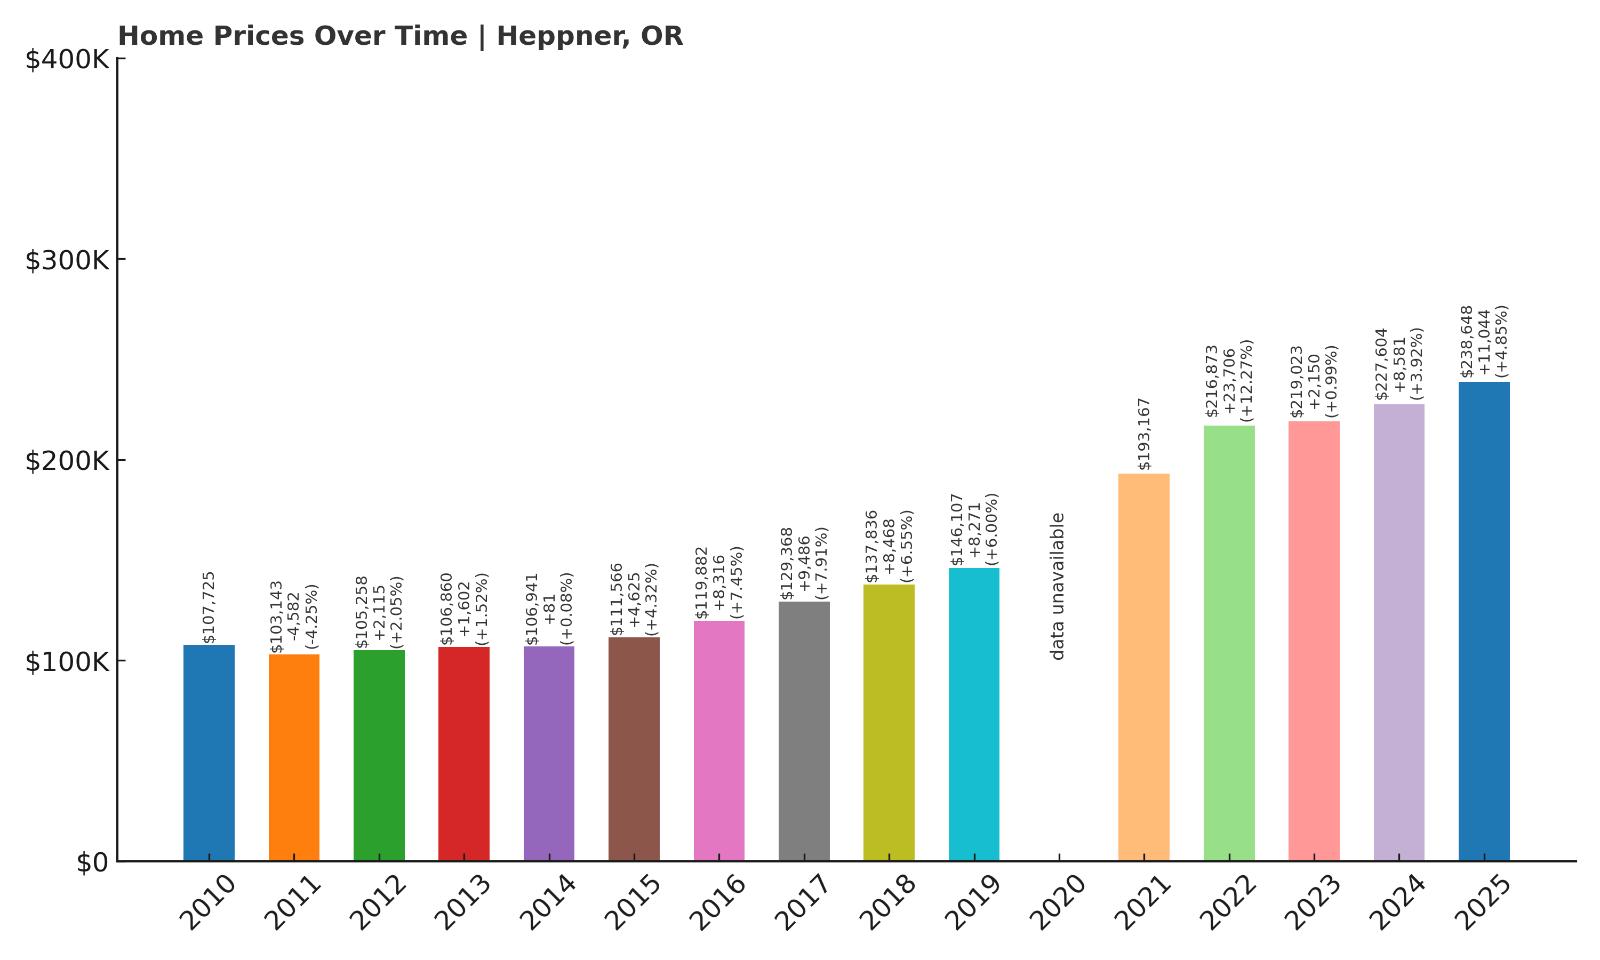
- 2010: $107,725
- 2011: $103,143 (-$4,582, -4.25% from previous year)
- 2012: $105,258 (+$2,116, +2.05% from previous year)
- 2013: $106,860 (+$1,602, +1.52% from previous year)
- 2014: $106,941 (+$81, +0.08% from previous year)
- 2015: $111,566 (+$4,626, +4.33% from previous year)
- 2016: $119,882 (+$8,315, +7.45% from previous year)
- 2017: $129,368 (+$9,486, +7.91% from previous year)
- 2018: $137,836 (+$8,468, +6.55% from previous year)
- 2019: $146,107 (+$8,271, +6.00% from previous year)
- 2020: N/A
- 2021: $193,167
- 2022: $216,873 (+$23,707, +12.27% from previous year)
- 2023: $219,023 (+$2,150, +0.99% from previous year)
- 2024: $227,604 (+$8,580, +3.92% from previous year)
- 2025: $238,648 (+$11,044, +4.85% from previous year)
Heppner’s home prices have risen steadily over the past 15 years, more than doubling since 2010. Despite a dip early in the decade, prices surged in the early 2020s, especially between 2020 and 2022. Growth has remained stable through 2025, with current values sitting just under $240,000.
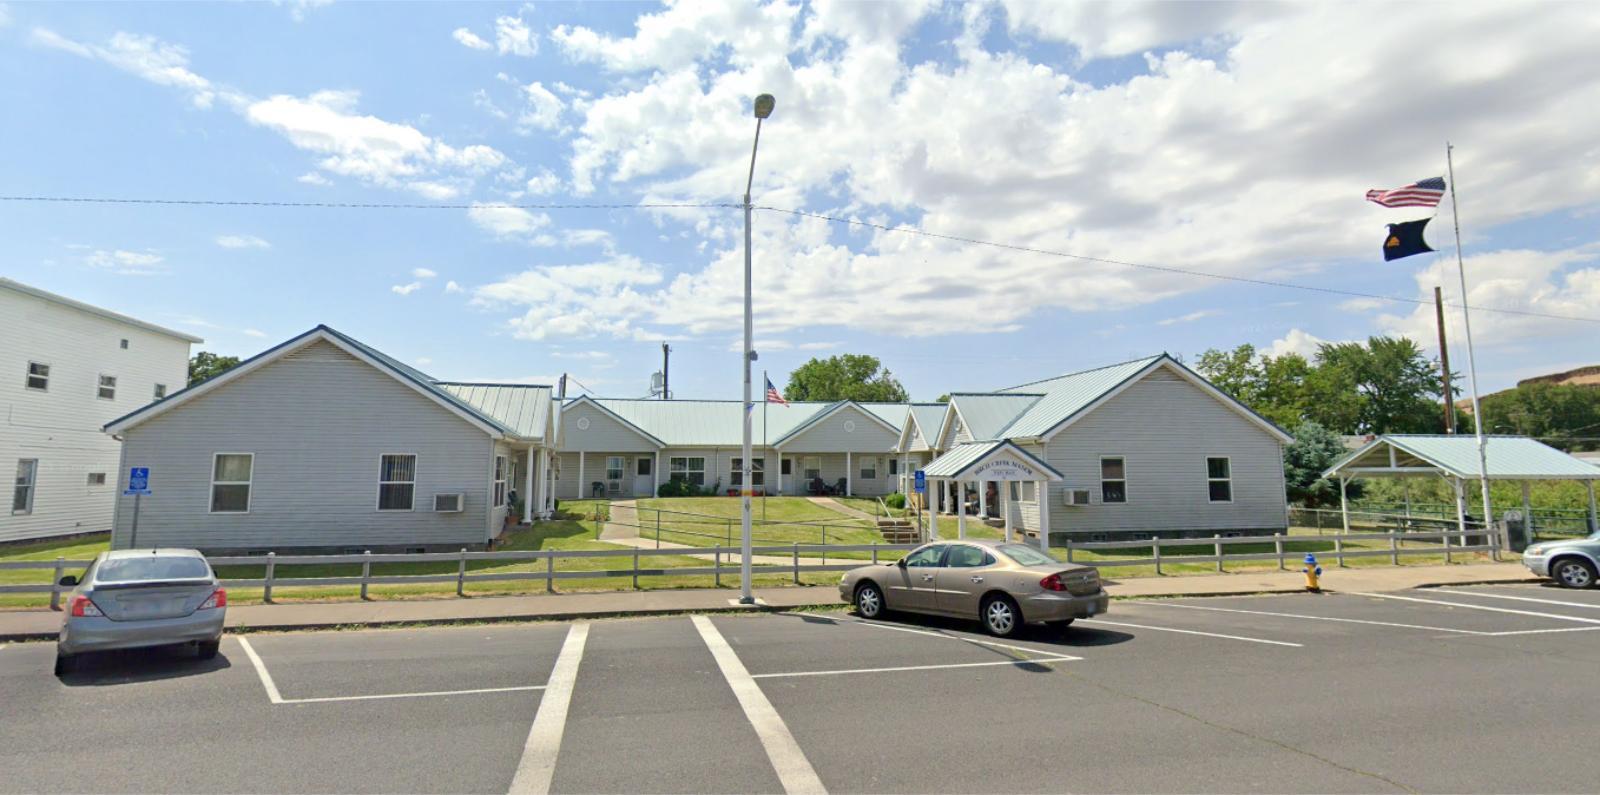
Heppner – Strong Growth in a Small-Town Market
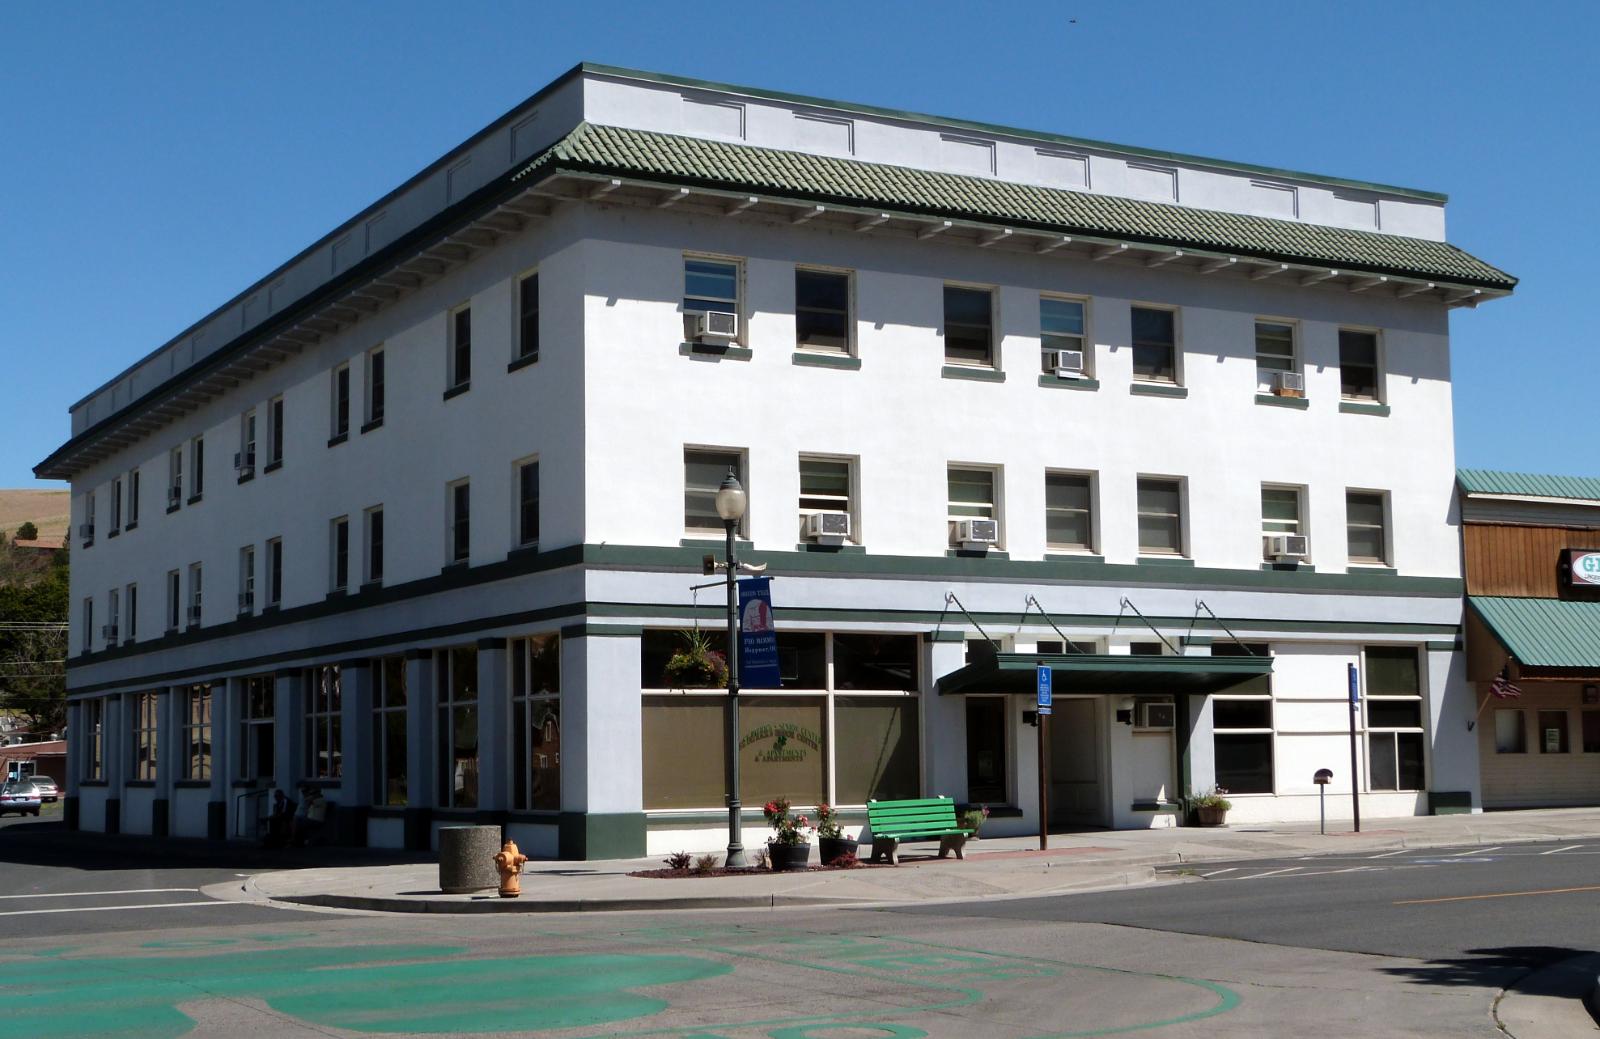
Located in Morrow County, Heppner is a quiet town in northeastern Oregon surrounded by rolling farmland and sagebrush hills. It’s a place where affordability still exists, even as prices have climbed substantially. The town benefits from its position along OR-74, linking it to larger markets like Hermiston and Pendleton.
Home prices have moved steadily upward since 2015, driven by slow but consistent demand and a tight supply of listings. Heppner’s modest gains each year make it a stable and attractive choice for buyers looking for small-town life without extreme volatility. With values up 121% since 2010, the appreciation here has outpaced many more visible markets.
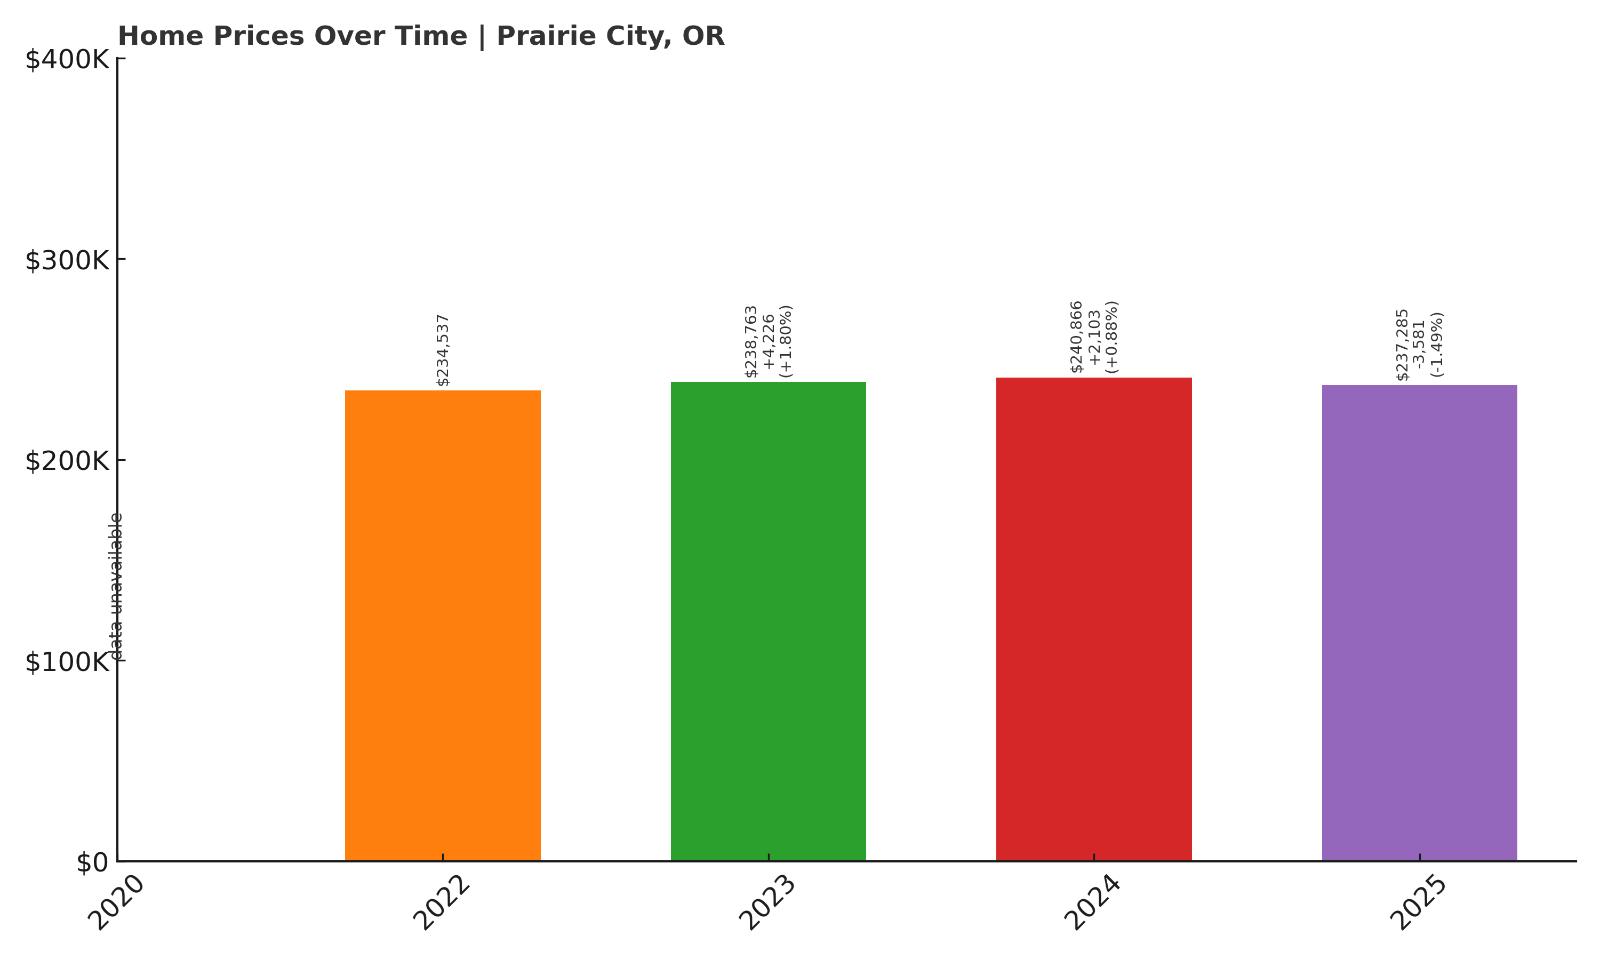
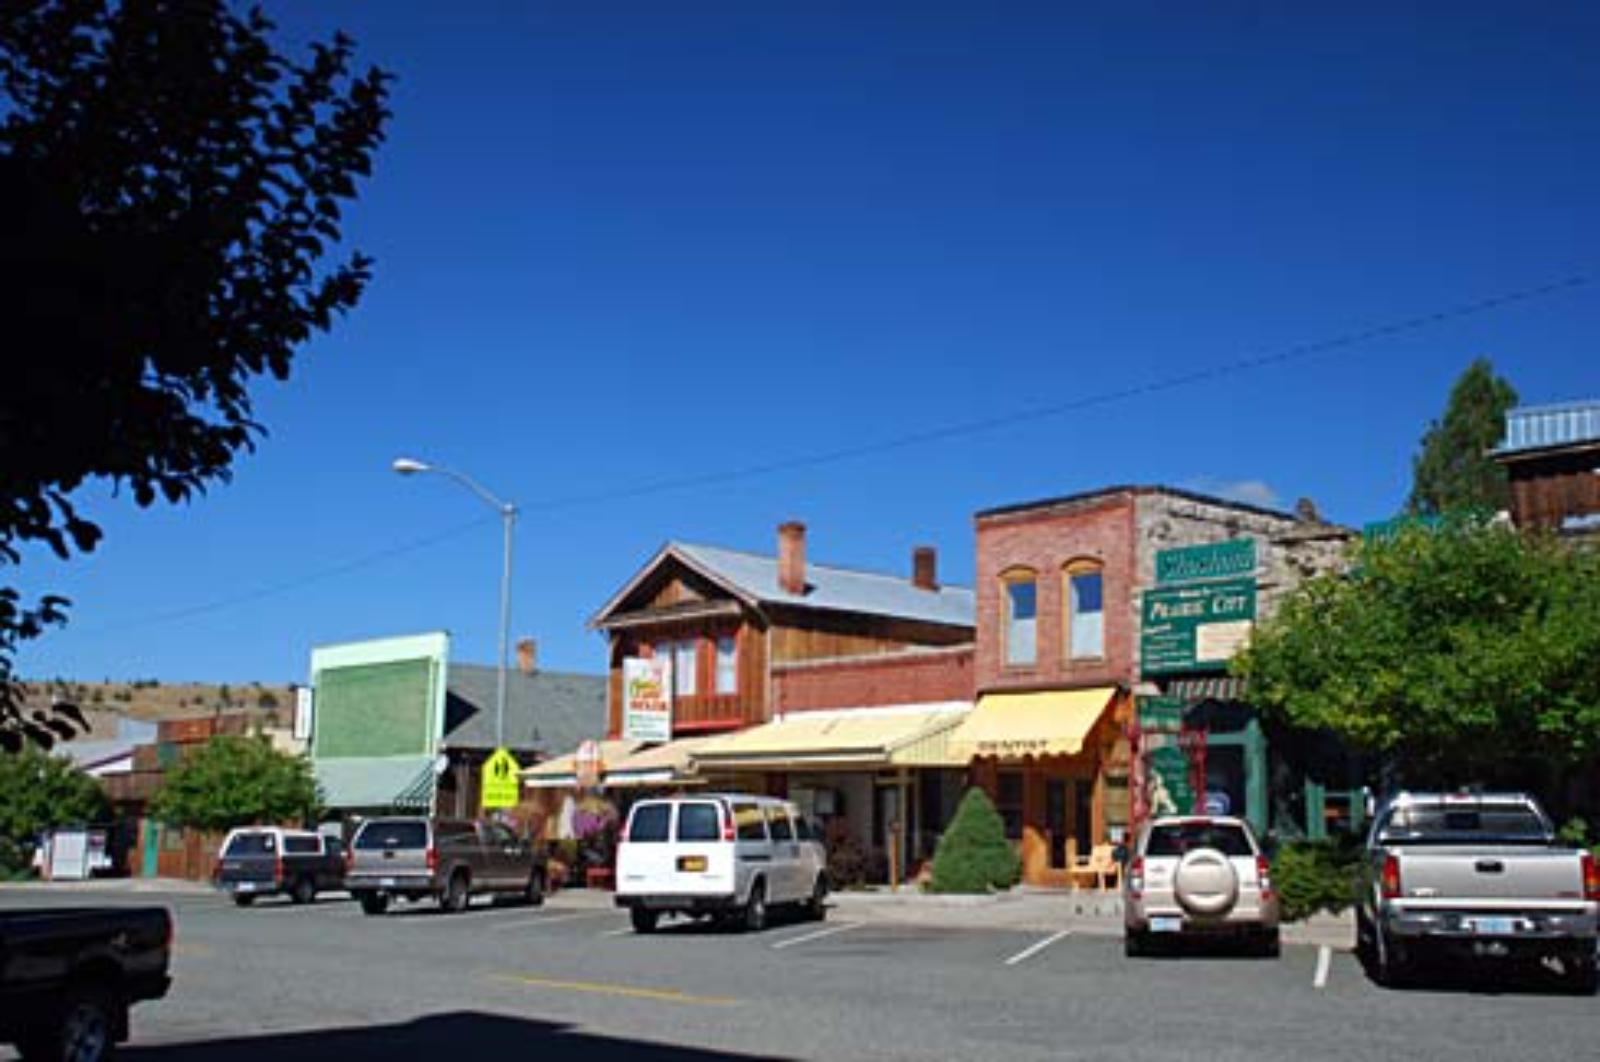
12. Prairie City – 1.2% Home Price Increase Since May 2022
🔥 Would you like to save this?
- 2010: N/A
- 2011: N/A
- 2012: N/A
- 2013: N/A
- 2014: N/A
- 2015: N/A
- 2016: N/A
- 2017: N/A
- 2018: N/A
- 2019: N/A
- 2020: N/A
- 2021: N/A
- 2022: $234,537
- 2023: $238,763 (+$4,226, +1.80% from previous year)
- 2024: $240,866 (+$2,103, +0.88% from previous year)
- 2025: $237,285 (-$3,581, -1.49% from previous year)
Prairie City has shown modest movement since entering the dataset in 2022, with just a 1.2% net increase in home values over three years. After small gains in 2023 and 2024, prices dipped slightly in 2025, suggesting a plateau in local growth or potential market correction.
Prairie City – Plateauing Prices in Eastern Oregon
Prairie City sits at the base of the Strawberry Mountains in Grant County and is known for its small size, strong community ties, and stunning natural scenery. Its remote location makes it a quiet retreat—but also limits large-scale development or influxes of new buyers.
The slight price increase since 2022 hints at a market that may have reached a local ceiling. While still relatively affordable, Prairie City hasn’t seen the same explosive growth as some other rural Oregon towns. Its charm and slow pace still attract a niche crowd, but future price increases may be more gradual.
11. North Powder – 93% Home Price Increase Since May 2017

- 2010: N/A
- 2011: N/A
- 2012: N/A
- 2013: N/A
- 2014: N/A
- 2015: N/A
- 2016: N/A
- 2017: $122,614
- 2018: $125,722 (+$3,108, +2.53% from previous year)
- 2019: $133,547 (+$7,826, +6.22% from previous year)
- 2020: N/A
- 2021: $168,685
- 2022: $199,864 (+$31,180, +18.48% from previous year)
- 2023: $206,020 (+$6,155, +3.08% from previous year)
- 2024: $223,749 (+$17,730, +8.61% from previous year)
- 2025: $237,154 (+$13,404, +5.99% from previous year)
Since 2017, North Powder’s home values have nearly doubled, with a 93% increase through May 2025. While growth was gradual at first, values surged post-2020 and continue to climb steadily year-over-year, hitting $237,154 this year.
North Powder – Solid Returns in Union County
North Powder is a tiny town along I-84 in Union County, offering easy access to La Grande and the Wallowa Mountains. Known for its quiet streets and rural lifestyle, it has recently drawn attention from buyers looking to exit higher-priced urban areas without giving up access to scenic beauty or transportation routes.
The most significant bump came in 2022, when home prices jumped over 18% in a single year. Continued interest and limited inventory are helping to sustain prices, and annual growth rates remain strong into 2025. This small town is proving to be a quietly reliable market for long-term gains.
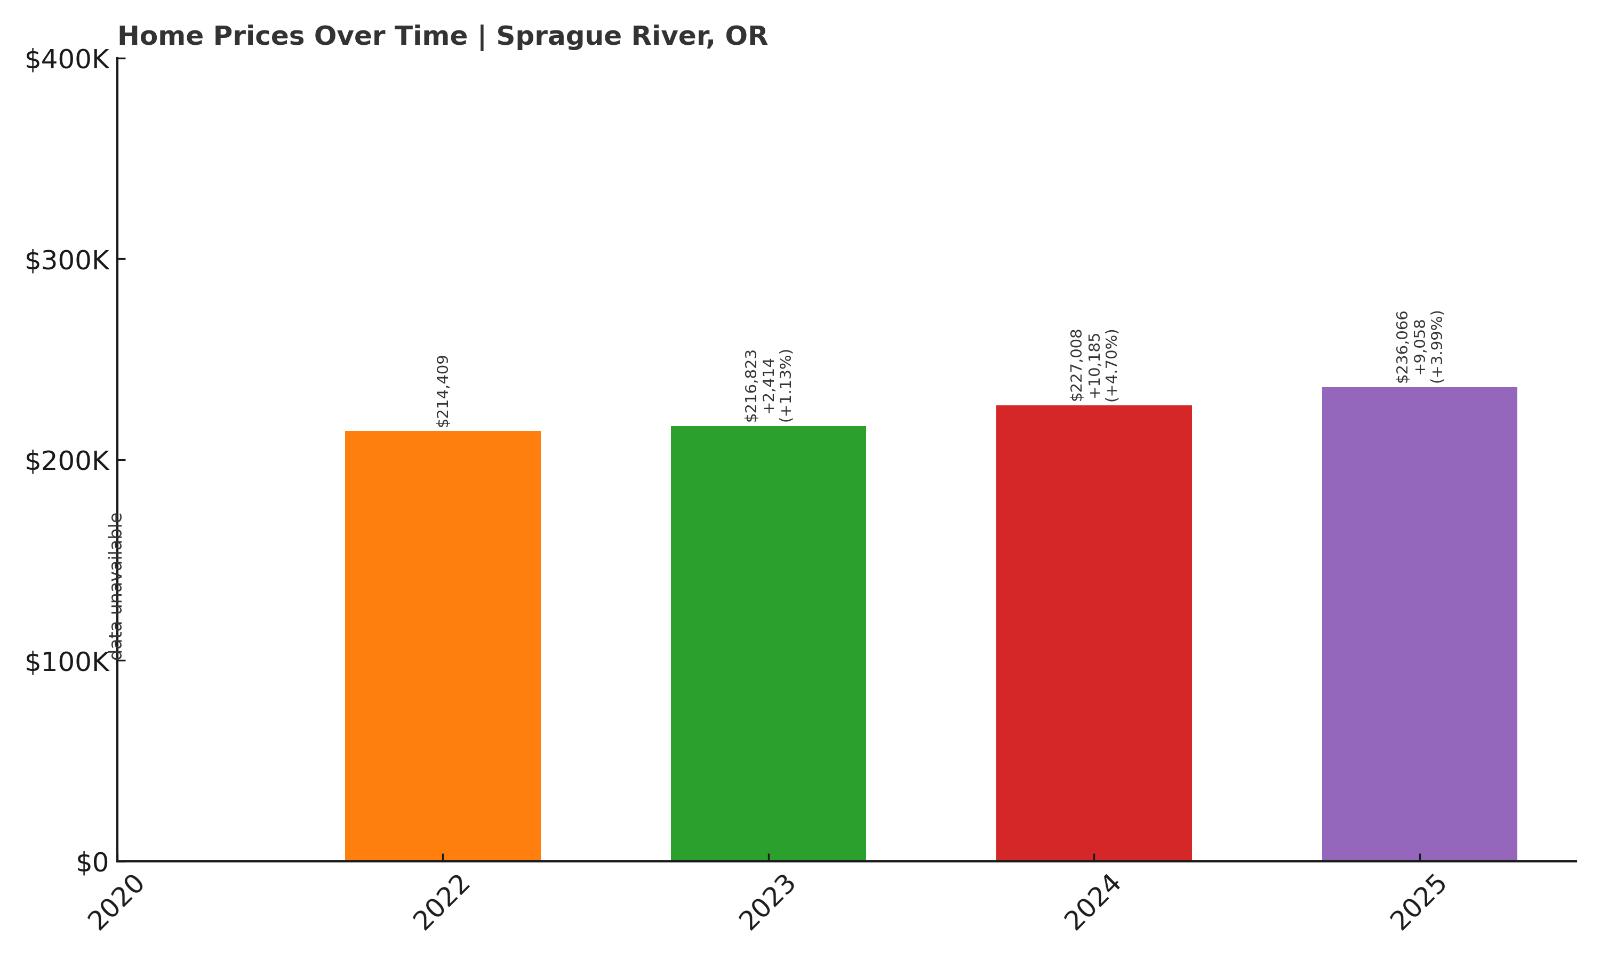
10. Sprague River – 10% Home Price Increase Since May 2022
- 2010: N/A
- 2011: N/A
- 2012: N/A
- 2013: N/A
- 2014: N/A
- 2015: N/A
- 2016: N/A
- 2017: N/A
- 2018: N/A
- 2019: N/A
- 2020: N/A
- 2021: N/A
- 2022: $214,409
- 2023: $216,823 (+$2,414, +1.13% from previous year)
- 2024: $227,008 (+$10,185, +4.70% from previous year)
- 2025: $236,066 (+$9,058, +3.99% from previous year)
Sprague River has added nearly $22,000 in home value since 2022, marking a total increase of just over 10% in three years. Annual gains have been consistent, and the market shows no signs of reversing course as of May 2025.
Sprague River – Quiet Growth Along the Waterway
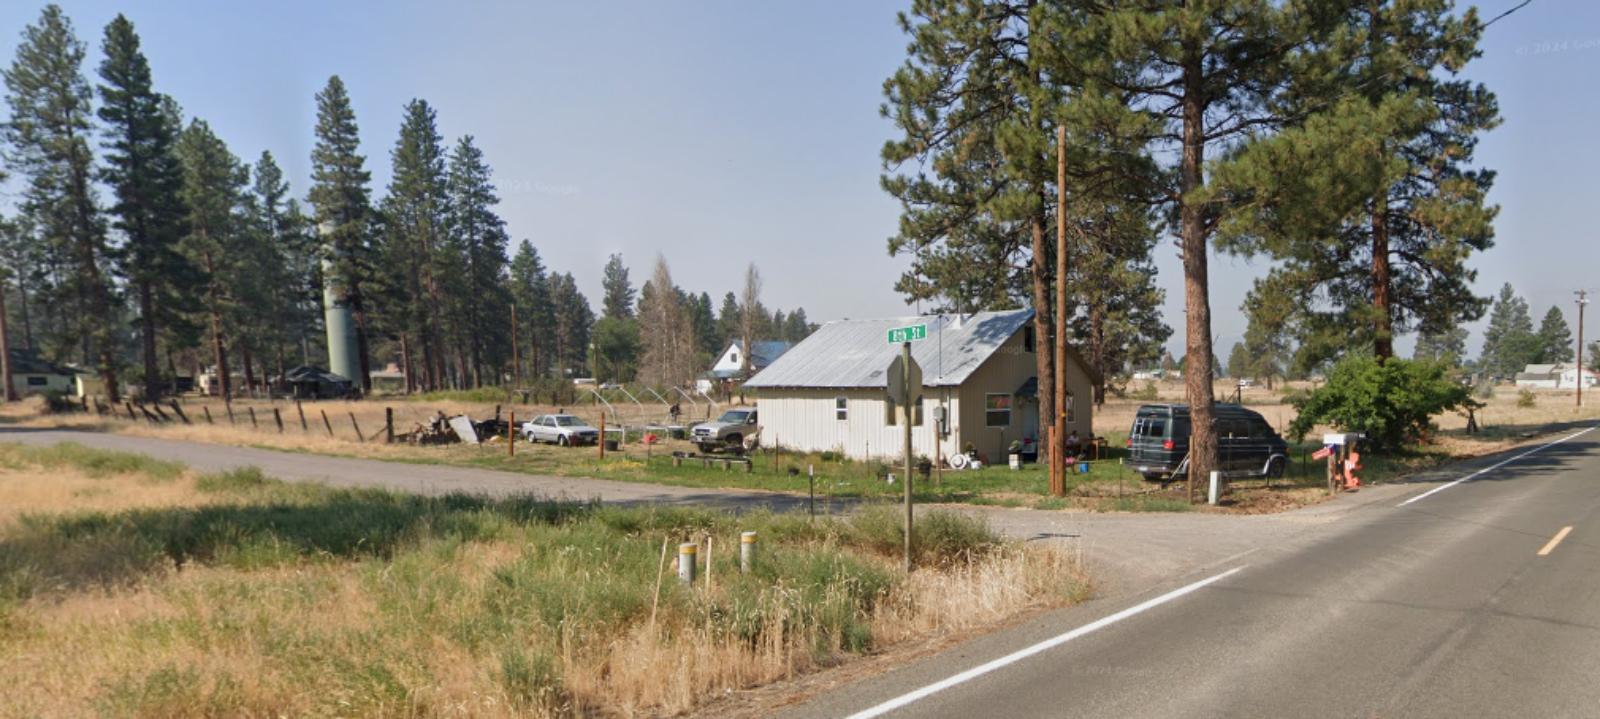
Located in Klamath County, Sprague River is a sparsely populated rural area known for its river access, fishing, and wide-open spaces. It has seen growing interest from buyers seeking seclusion, affordability, and land—especially during and after the COVID-era housing boom.
Though the market is small, limited housing stock and increasing interest in remote properties have driven a steady rise in value. The 2024–2025 increase of 3.99% continues a consistent trend, and with prices now at $236,066, Sprague River remains a viable option for buyers focused on space and natural surroundings.
9. Merrill – 136% Home Price Increase Since 2010

- 2010: $98,459
- 2011: $90,384 (-$8,076, -8.20% from previous year)
- 2012: $86,918 (-$3,466, -3.83% from previous year)
- 2013: $80,786 (-$6,131, -7.05% from previous year)
- 2014: $91,185 (+$10,399, +12.87% from previous year)
- 2015: $98,728 (+$7,543, +8.27% from previous year)
- 2016: $115,970 (+$17,242, +17.46% from previous year)
- 2017: $115,948 (-$22, -0.02% from previous year)
- 2018: $130,540 (+$14,592, +12.59% from previous year)
- 2019: $144,525 (+$13,984, +10.71% from previous year)
- 2020: N/A
- 2021: $185,601
- 2022: $216,904 (+$31,303, +16.87% from previous year)
- 2023: $221,076 (+$4,172, +1.92% from previous year)
- 2024: $226,247 (+$5,171, +2.34% from previous year)
- 2025: $232,119 (+$5,872, +2.60% from previous year)
Merrill’s home values have surged by 136% since 2010, with consistent growth since the mid-2010s. The town saw particularly sharp increases from 2016 to 2019 and again in 2021–2022. Prices continue to edge up in 2025, showing strength in a small but active market.
Merrill – Strong Recovery and Sustained Growth
Merrill is a small agricultural town near the California border in Klamath County. Known for its potato farms and open fields, it offers a slower pace of life with ties to regional food production. Its affordability compared to other parts of the state has helped drive demand among budget-conscious buyers.
The post-2015 rebound was driven by both local development and spillover interest from more expensive nearby towns. Merrill’s housing market remains stable, with annual gains of around 2–3% in recent years. With a current value above $230K, the town is still growing—just at a more measured pace.
8. Hines – 135% Home Price Increase Since 2011
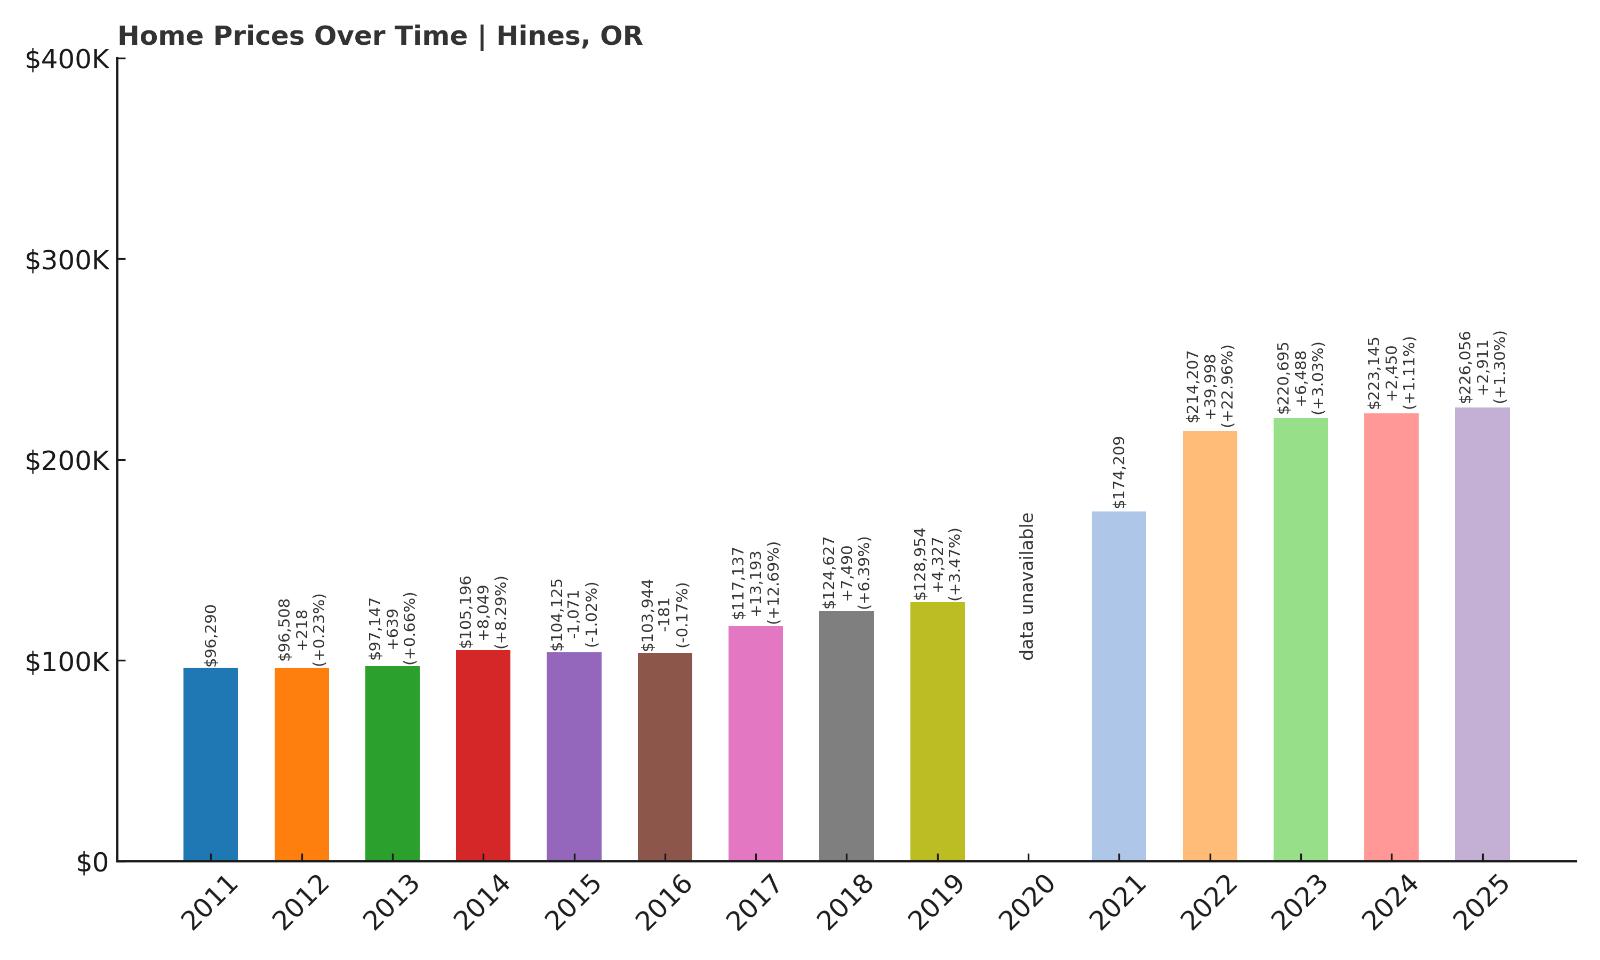
- 2010: N/A
- 2011: $96,290
- 2012: $96,508 (+$218, +0.23% from previous year)
- 2013: $97,147 (+$639, +0.66% from previous year)
- 2014: $105,196 (+$8,049, +8.29% from previous year)
- 2015: $104,125 (-$1,071, -1.02% from previous year)
- 2016: $103,944 (-$181, -0.17% from previous year)
- 2017: $117,137 (+$13,193, +12.69% from previous year)
- 2018: $124,627 (+$7,490, +6.39% from previous year)
- 2019: $128,954 (+$4,327, +3.47% from previous year)
- 2020: N/A
- 2021: $174,209
- 2022: $214,207 (+$39,999, +22.96% from previous year)
- 2023: $220,695 (+$6,488, +3.03% from previous year)
- 2024: $223,145 (+$2,450, +1.11% from previous year)
- 2025: $226,056 (+$2,910, +1.30% from previous year)
Since 2011, home values in Hines have climbed by 135%. The steepest rise came between 2020 and 2022, but even with recent slowing, prices continue edging upward, reaching $226,056 in May 2025. The pace may have cooled, but the gains remain impressive for a small town in Harney County.
Hines – Eastern Oregon Growth Driven by Value
Hines is located just south of Burns in Harney County, functioning as a paired community with shared schools and amenities. It serves as a residential base for people working in local government, healthcare, and forestry. Though remote, its affordability and scenic setting have made it increasingly popular with retirees and telecommuters.
Housing prices were stagnant for years, but the 2017 jump signaled the beginning of a real shift. Since then, values have steadily climbed. The 2022 boom saw a massive 23% leap, and while 2025’s growth was more tempered, Hines remains one of Oregon’s fastest-rising rural markets.
7. Lakeview – 96% Home Price Increase Since 2016

- 2010: N/A
- 2011: N/A
- 2012: N/A
- 2013: N/A
- 2014: N/A
- 2015: N/A
- 2016: $103,079
- 2017: $108,336 (+$5,256, +5.10% from previous year)
- 2018: $109,113 (+$778, +0.72% from previous year)
- 2019: $116,381 (+$7,268, +6.66% from previous year)
- 2020: N/A
- 2021: $158,033
- 2022: $185,228 (+$27,195, +17.21% from previous year)
- 2023: $192,589 (+$7,361, +3.97% from previous year)
- 2024: $193,407 (+$817, +0.42% from previous year)
- 2025: $202,523 (+$9,116, +4.71% from previous year)
Lakeview’s home prices have climbed 96% since 2016. The strongest momentum came between 2020 and 2022, followed by steadier year-over-year increases through 2025. Prices now sit just above $200,000, marking a nearly six-figure gain in under a decade.
Lakeview – High Desert Appeal with Steady Value Gains
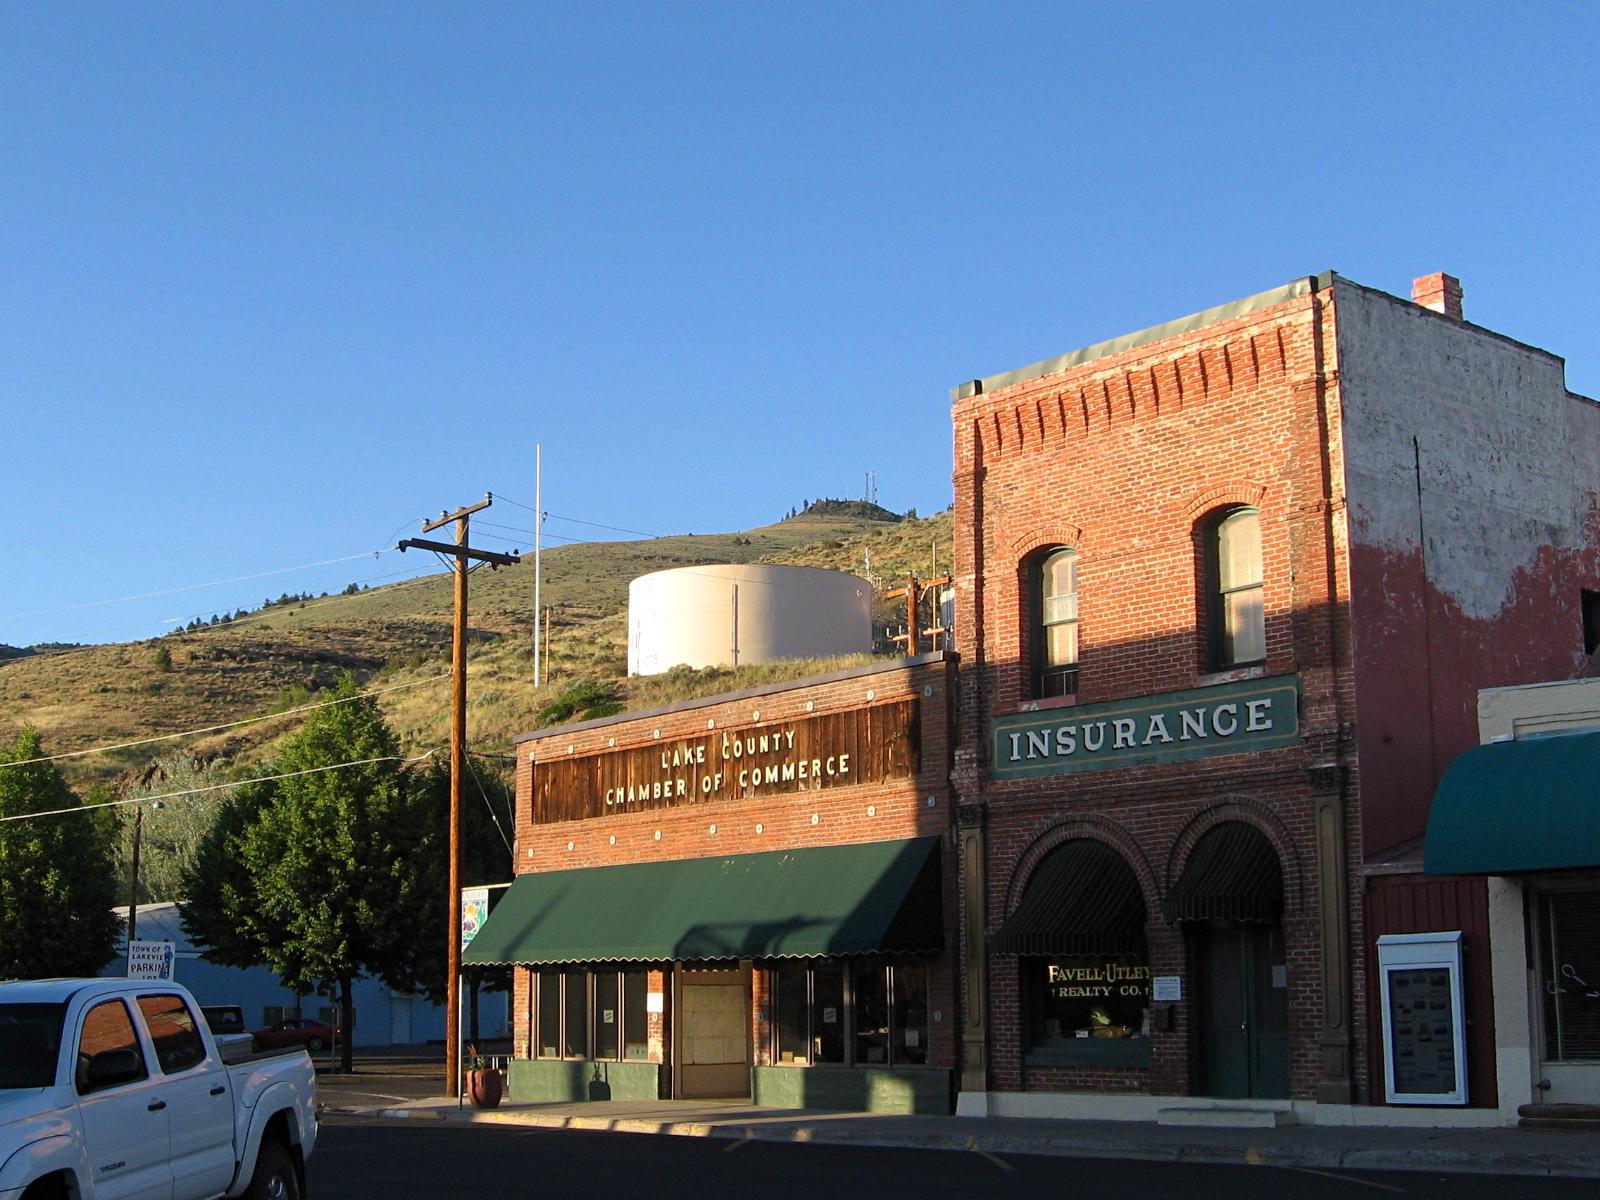
Lakeview, the seat of Lake County in south-central Oregon, sits in a high desert valley surrounded by mountains and open land. Long known for ranching and geothermal energy, the town has recently attracted interest for its scenic isolation and quiet lifestyle.
The 2022 surge added over $27,000 to median prices in just one year, a sign that even remote towns aren’t immune to Oregon’s broader housing trends. With values continuing to climb—though more gradually—Lakeview offers long-term value in a landscape known more for cattle than condos.
6. Powers – 134% Home Price Increase Since 2010

🔥 Would you like to save this?
- 2010: $81,490
- 2011: $74,540 (-$6,950, -8.53% from previous year)
- 2012: $69,513 (-$5,027, -6.74% from previous year)
- 2013: $71,092 (+$1,579, +2.27% from previous year)
- 2014: $76,379 (+$5,288, +7.44% from previous year)
- 2015: $79,442 (+$3,062, +4.01% from previous year)
- 2016: $81,357 (+$1,915, +2.41% from previous year)
- 2017: $97,854 (+$16,497, +20.28% from previous year)
- 2018: $106,781 (+$8,928, +9.12% from previous year)
- 2019: $119,910 (+$13,129, +12.29% from previous year)
- 2020: N/A
- 2021: $160,018
- 2022: $183,005 (+$22,988, +14.37% from previous year)
- 2023: $189,442 (+$6,437, +3.52% from previous year)
- 2024: $190,087 (+$645, +0.34% from previous year)
- 2025: $190,834 (+$747, +0.39% from previous year)
Powers has seen a 134% increase in home values since 2010, with the largest gains between 2016 and 2022. While the last three years have brought slower growth, the long-term trajectory remains strong, with prices stabilizing around $190,000 in 2025.
Powers – Coastal Forest Town with Big Price Gains
Located in Coos County, Powers is a former timber town near the Siskiyou National Forest and the Rogue River. It’s remote, peaceful, and surrounded by natural beauty—features that have drawn in a new wave of buyers looking for affordability without sacrificing scenery.
Housing prices were stagnant for much of the 2010s, but they began to surge in 2017 with double-digit percentage gains over multiple years. The recent flattening may reflect market saturation or simply a return to normal after fast growth. Either way, Powers stands out for long-term value appreciation in a truly rural setting.
5. Condon – 122% Home Price Increase Since 2014
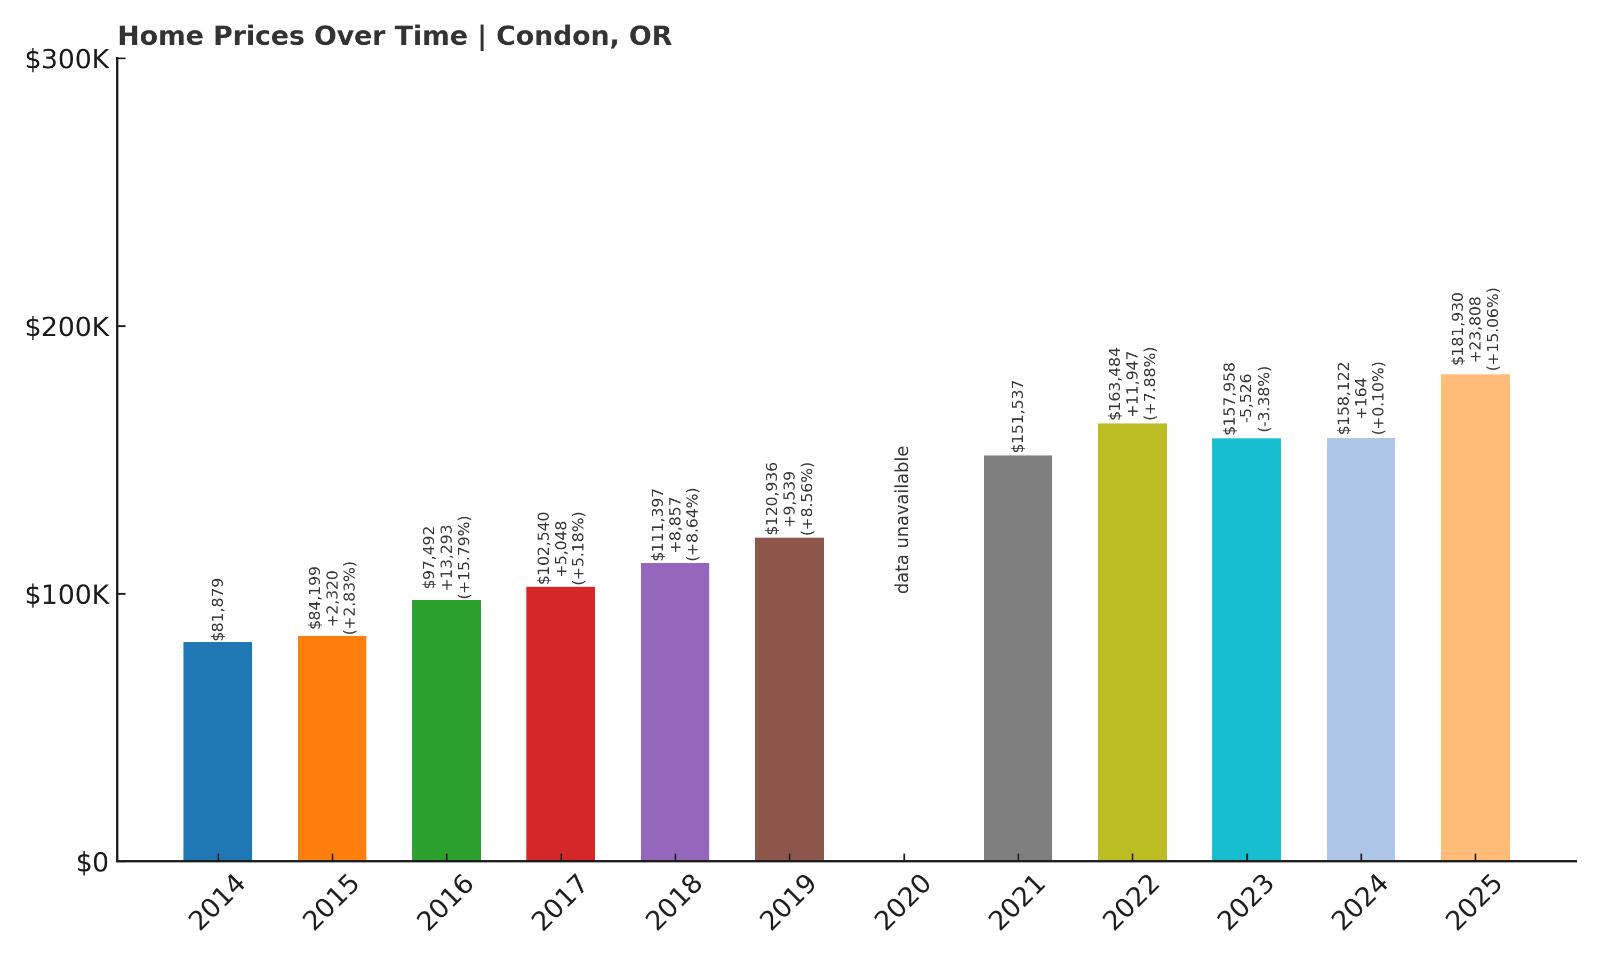
- 2010: N/A
- 2011: N/A
- 2012: N/A
- 2013: N/A
- 2014: $81,879
- 2015: $84,199 (+$2,320, +2.83% from previous year)
- 2016: $97,492 (+$13,293, +15.79% from previous year)
- 2017: $102,540 (+$5,048, +5.18% from previous year)
- 2018: $111,397 (+$8,857, +8.64% from previous year)
- 2019: $120,936 (+$9,539, +8.56% from previous year)
- 2020: N/A
- 2021: $151,537
- 2022: $163,484 (+$11,947, +7.88% from previous year)
- 2023: $157,958 (-$5,526, -3.38% from previous year)
- 2024: $158,122 (+$164, +0.10% from previous year)
- 2025: $181,930 (+$23,807, +15.06% from previous year)
Condon’s home prices have jumped 122% since 2014, driven by big annual gains in the mid-2010s and another sharp increase in 2025. Though the market cooled in 2023 and 2024, the most recent jump suggests renewed demand or limited inventory pushing values higher.
Condon – Historic Charm with Strong Price Performance
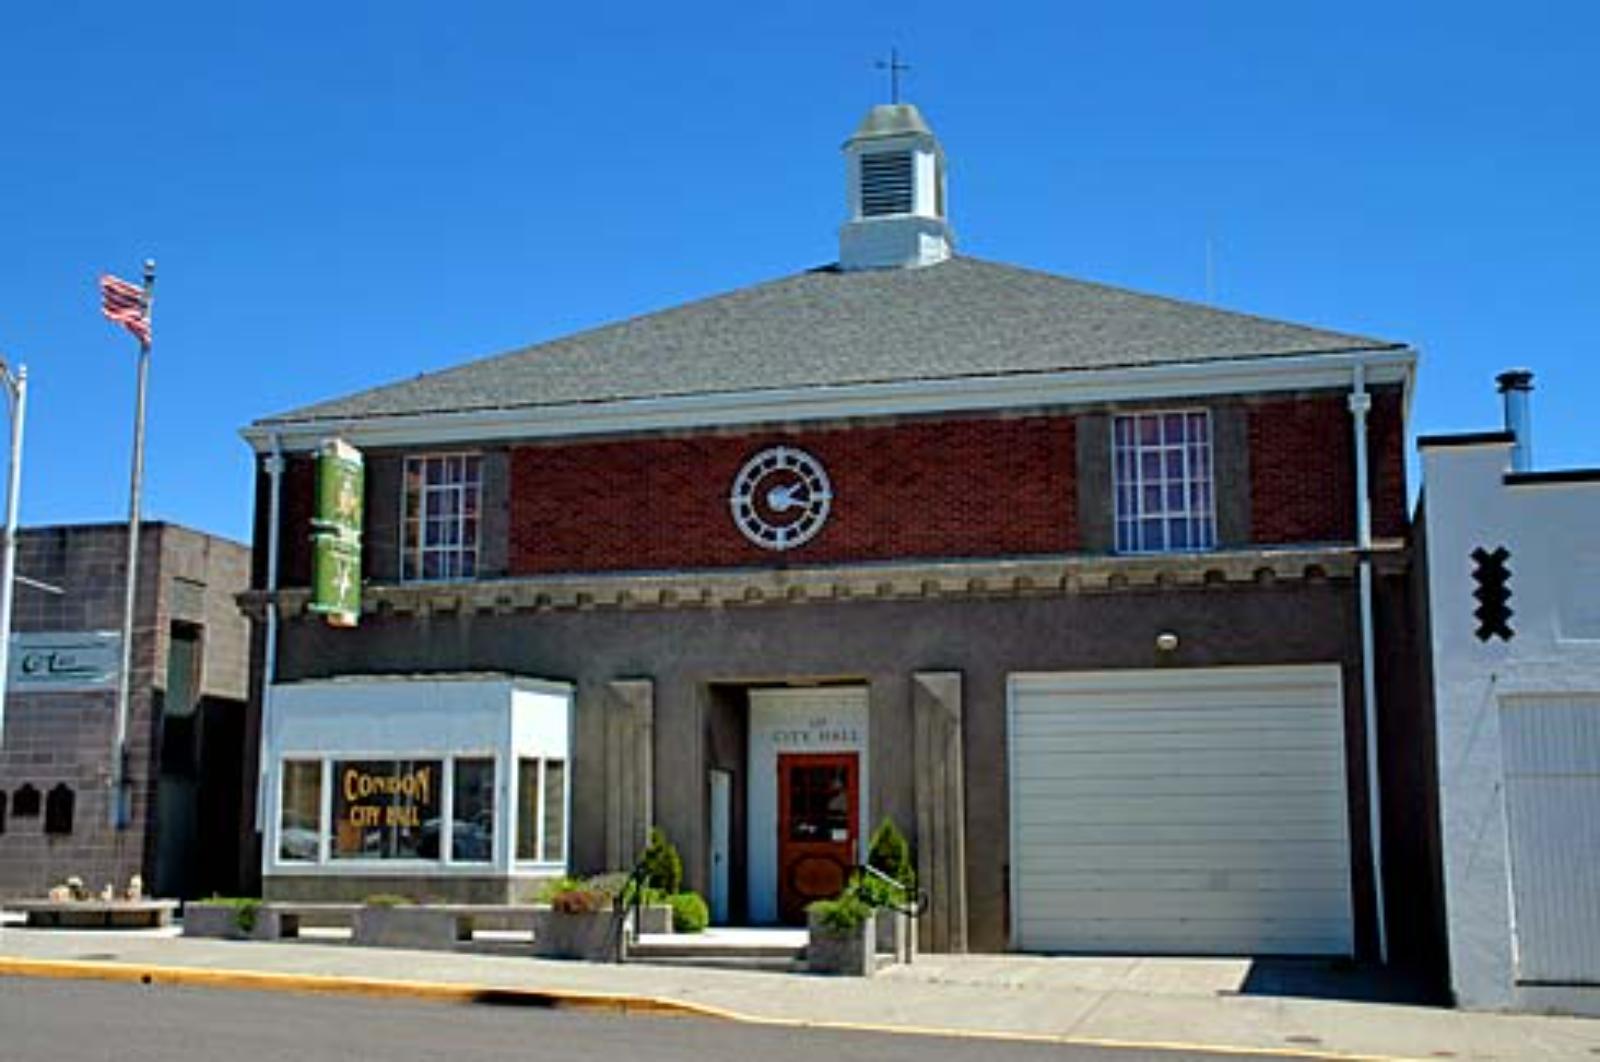
Condon is the seat of Gilliam County in north-central Oregon, known for its historic downtown and striking wheatfield views. Though remote, it offers a unique blend of charm and affordability. The town’s careful preservation of early 20th-century architecture makes it attractive to history-minded buyers and those looking to escape urban life.
Prices surged between 2015 and 2019, then again in 2025, suggesting that demand returns in waves. Condon’s limited housing stock makes each transaction impactful, and the sharp 15% gain in 2025 shows that even small markets can move quickly under the right conditions.
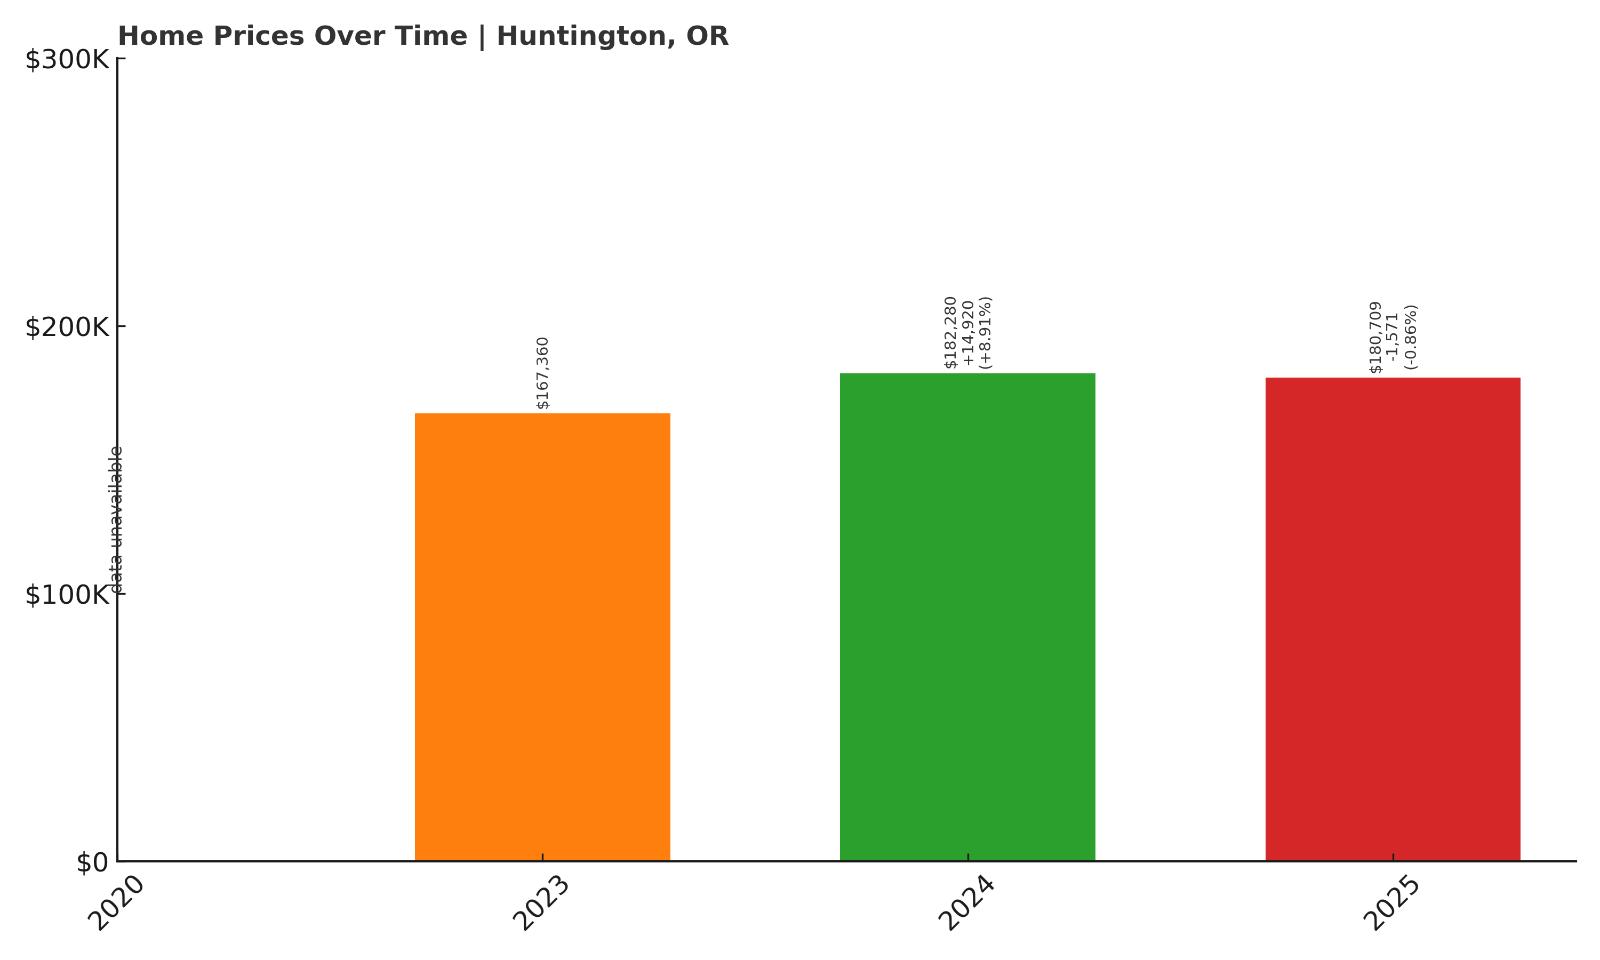
4. Huntington – 8% Home Price Increase Since May 2023
- 2010: N/A
- 2011: N/A
- 2012: N/A
- 2013: N/A
- 2014: N/A
- 2015: N/A
- 2016: N/A
- 2017: N/A
- 2018: N/A
- 2019: N/A
- 2020: N/A
- 2021: N/A
- 2022: N/A
- 2023: $167,360
- 2024: $182,280 (+$14,920, +8.91% from previous year)
- 2025: $180,709 (-$1,571, -0.86% from previous year)
Huntington saw a nearly 9% price jump in 2024 followed by a slight dip in 2025, resulting in a modest 8% overall increase since entering the data in 2023. With only three years of recorded values, the trend here is still developing—but early signs point to strong buyer interest.
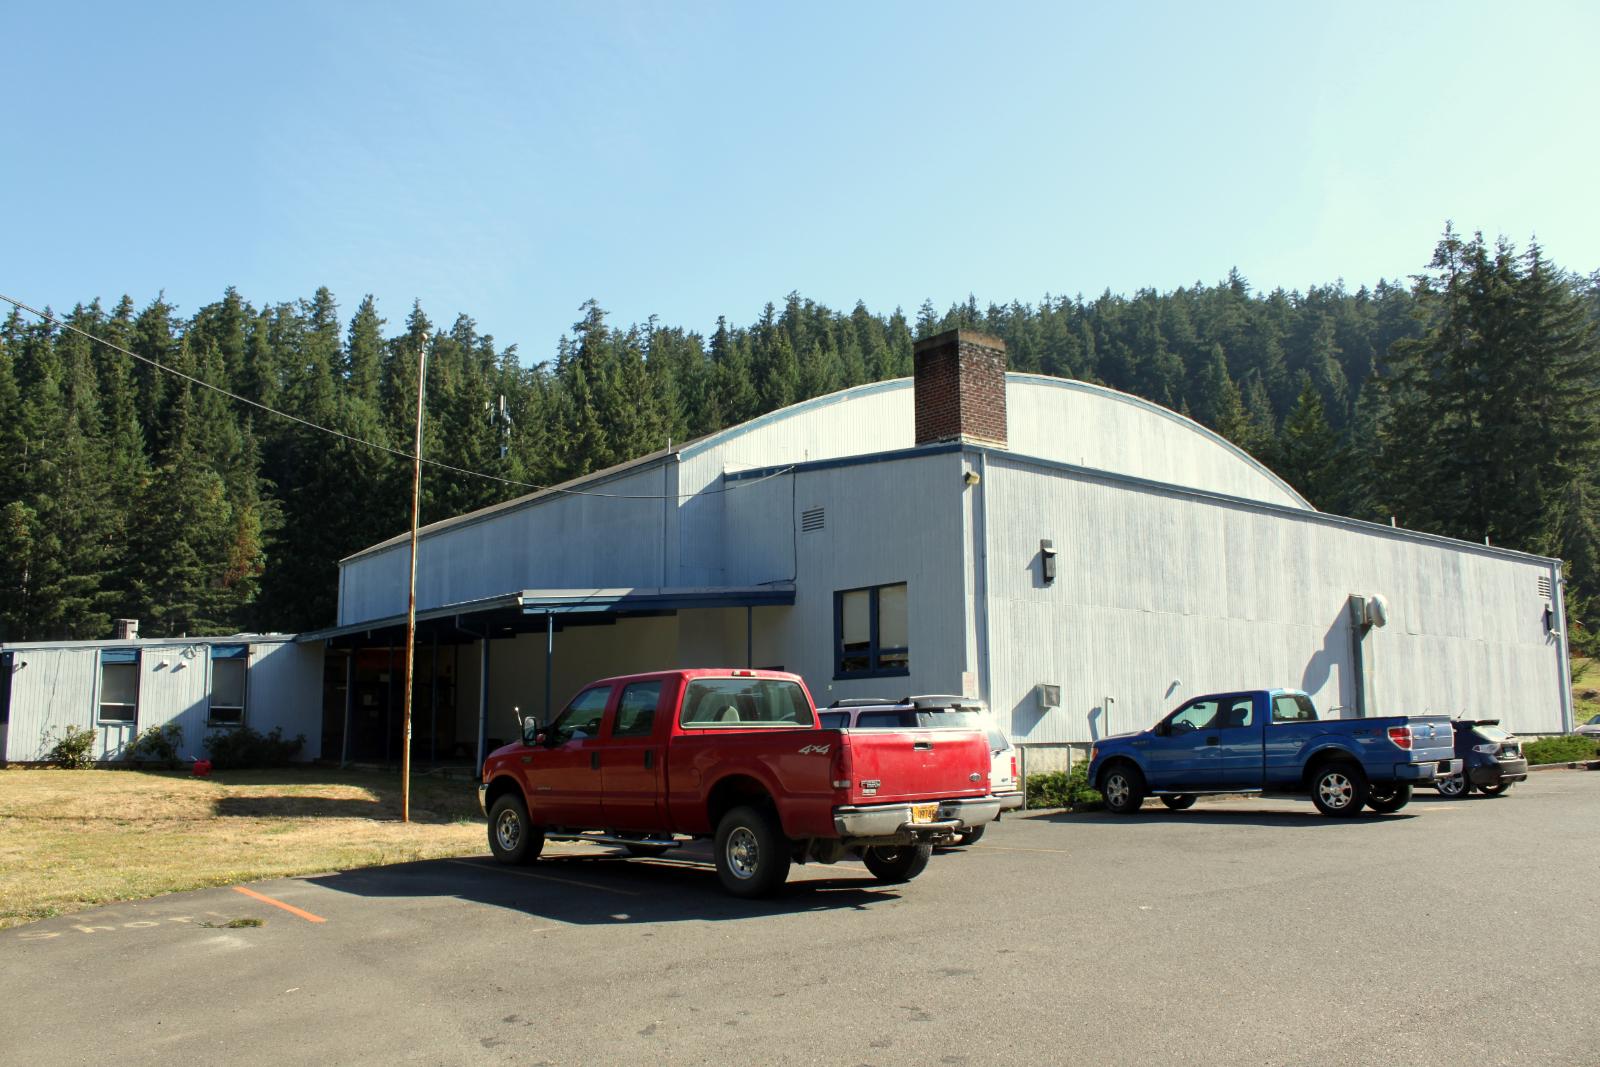
Huntington – New Market Activity Along the Snake River
Huntington is a small city in Baker County, tucked along the Snake River near the Idaho border. Known for its access to fishing, boating, and nearby hunting grounds, it’s a quiet retreat with a growing reputation among outdoor enthusiasts and buyers looking to escape larger inland cities.
Though data is limited, the sharp rise in 2024 suggests a recent increase in demand—possibly driven by second-home buyers or those seeking riverside property. The small dip in 2025 isn’t a red flag but may reflect seasonal adjustments or limited sales volume. It’s a market to watch closely in the years ahead.
3. Burns – 149% Home Price Increase Since 2011
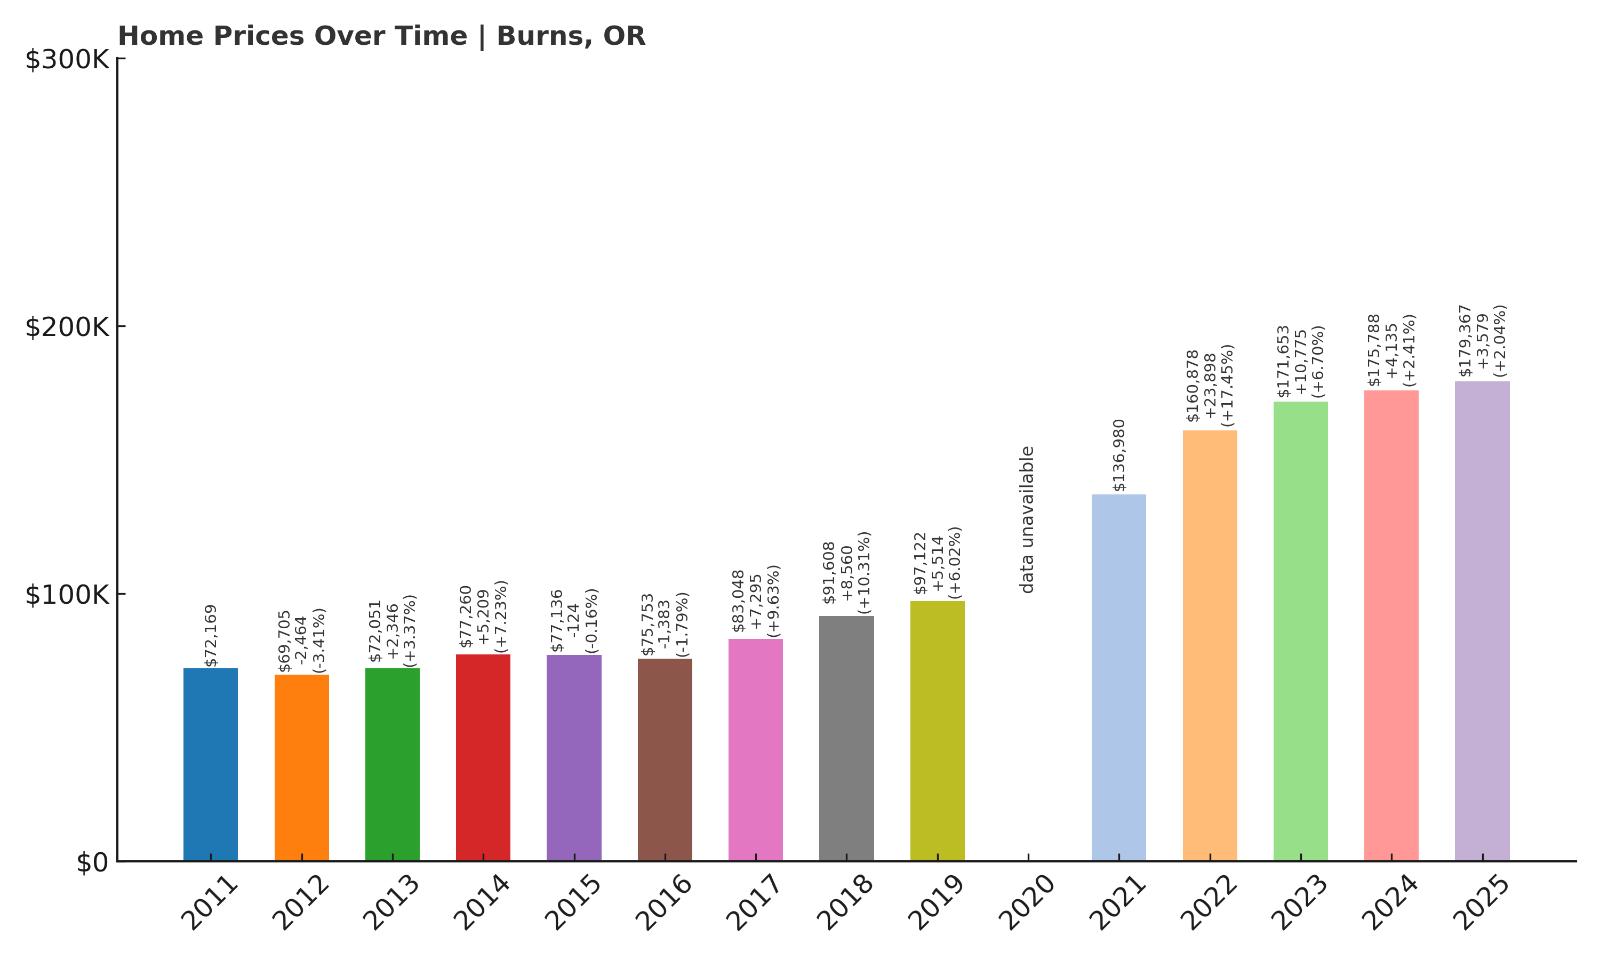
- 2010: N/A
- 2011: $72,169
- 2012: $69,705 (-$2,464, -3.41% from previous year)
- 2013: $72,051 (+$2,346, +3.37% from previous year)
- 2014: $77,260 (+$5,209, +7.23% from previous year)
- 2015: $77,136 (-$124, -0.16% from previous year)
- 2016: $75,753 (-$1,383, -1.79% from previous year)
- 2017: $83,048 (+$7,295, +9.63% from previous year)
- 2018: $91,608 (+$8,560, +10.31% from previous year)
- 2019: $97,122 (+$5,514, +6.02% from previous year)
- 2020: N/A
- 2021: $136,980
- 2022: $160,878 (+$23,898, +17.45% from previous year)
- 2023: $171,653 (+$10,775, +6.70% from previous year)
- 2024: $175,788 (+$4,135, +2.41% from previous year)
- 2025: $179,367 (+$3,579, +2.04% from previous year)
Since 2011, home prices in Burns have jumped by 149%, making it one of Oregon’s fastest-appreciating rural markets. The biggest spikes occurred between 2016 and 2022, and though growth has slowed recently, values are still climbing steadily into 2025.
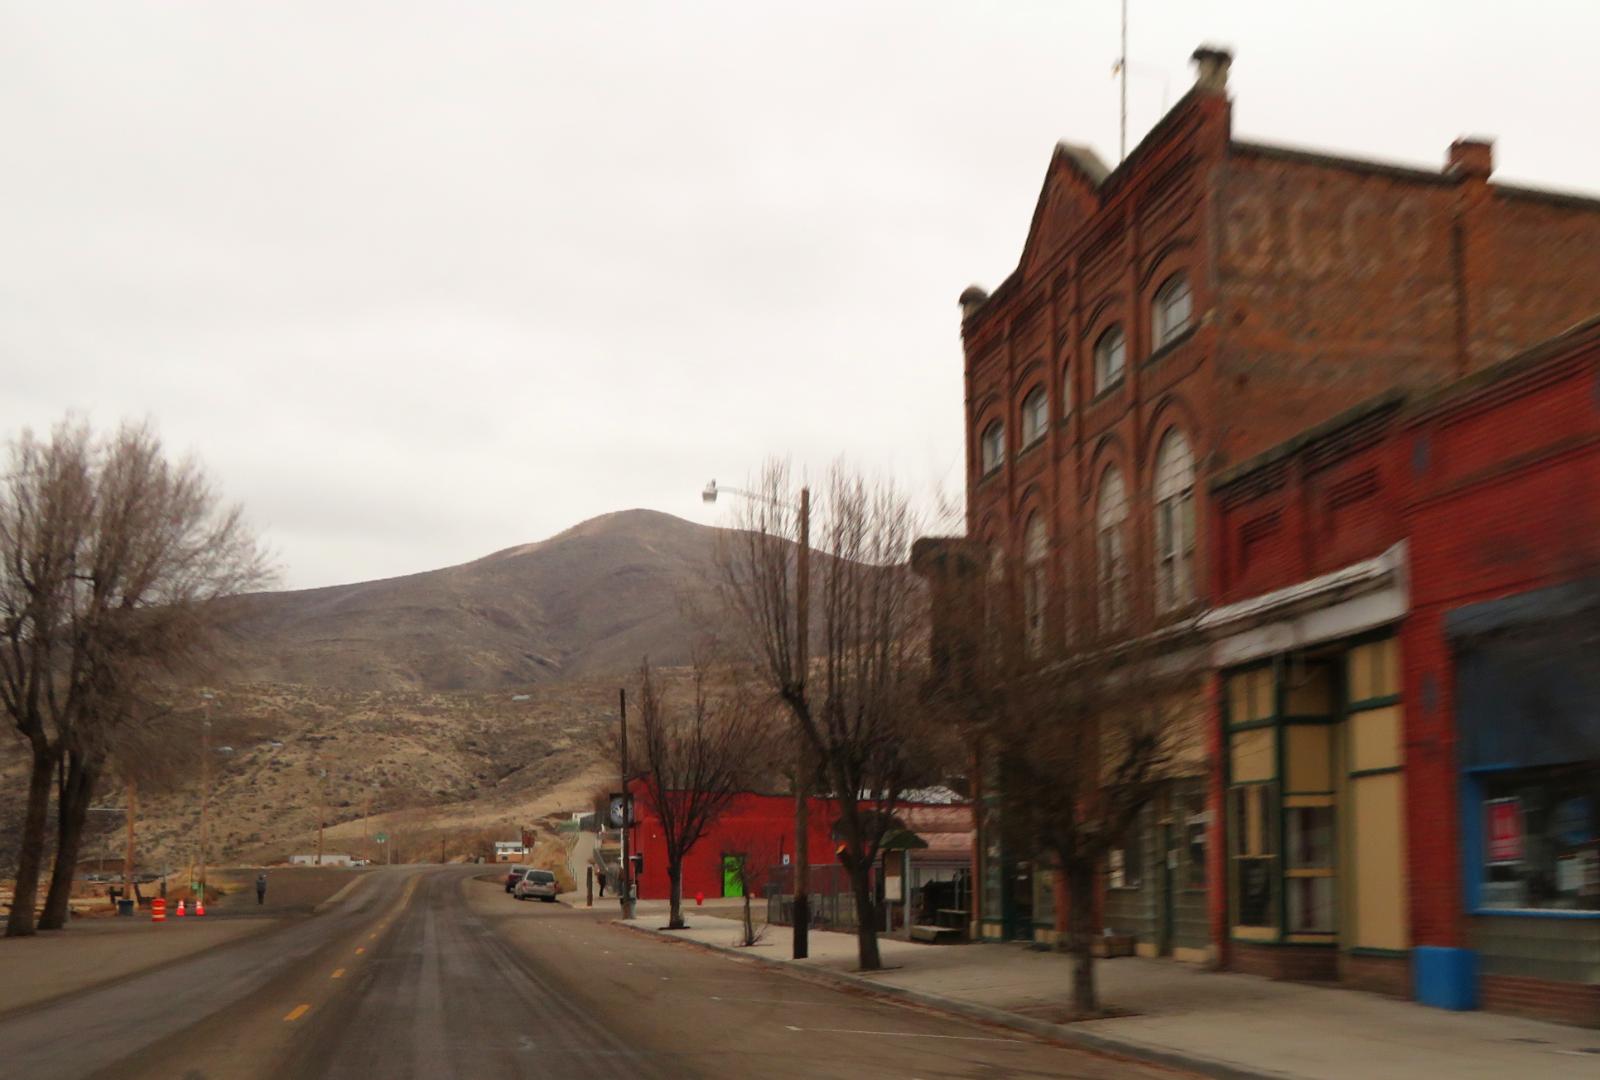
Burns – Big Gains in Oregon’s High Desert
Burns, the county seat of Harney County, sits in Oregon’s southeastern high desert. Known for cattle ranching, wide skies, and vast open space, it’s about as remote as Oregon gets. But as homebuyers searched for affordable and peaceful places to live during the pandemic, Burns quietly became a surprising real estate success story.
The town’s housing market surged in 2021 and 2022, with a nearly 17.5% gain in a single year. Though appreciation has slowed to 2% annually, prices are still rising, and values are now well over $179,000—a far cry from $72,000 back in 2011. Burns shows how even the quietest towns can attract attention when affordability meets demand.
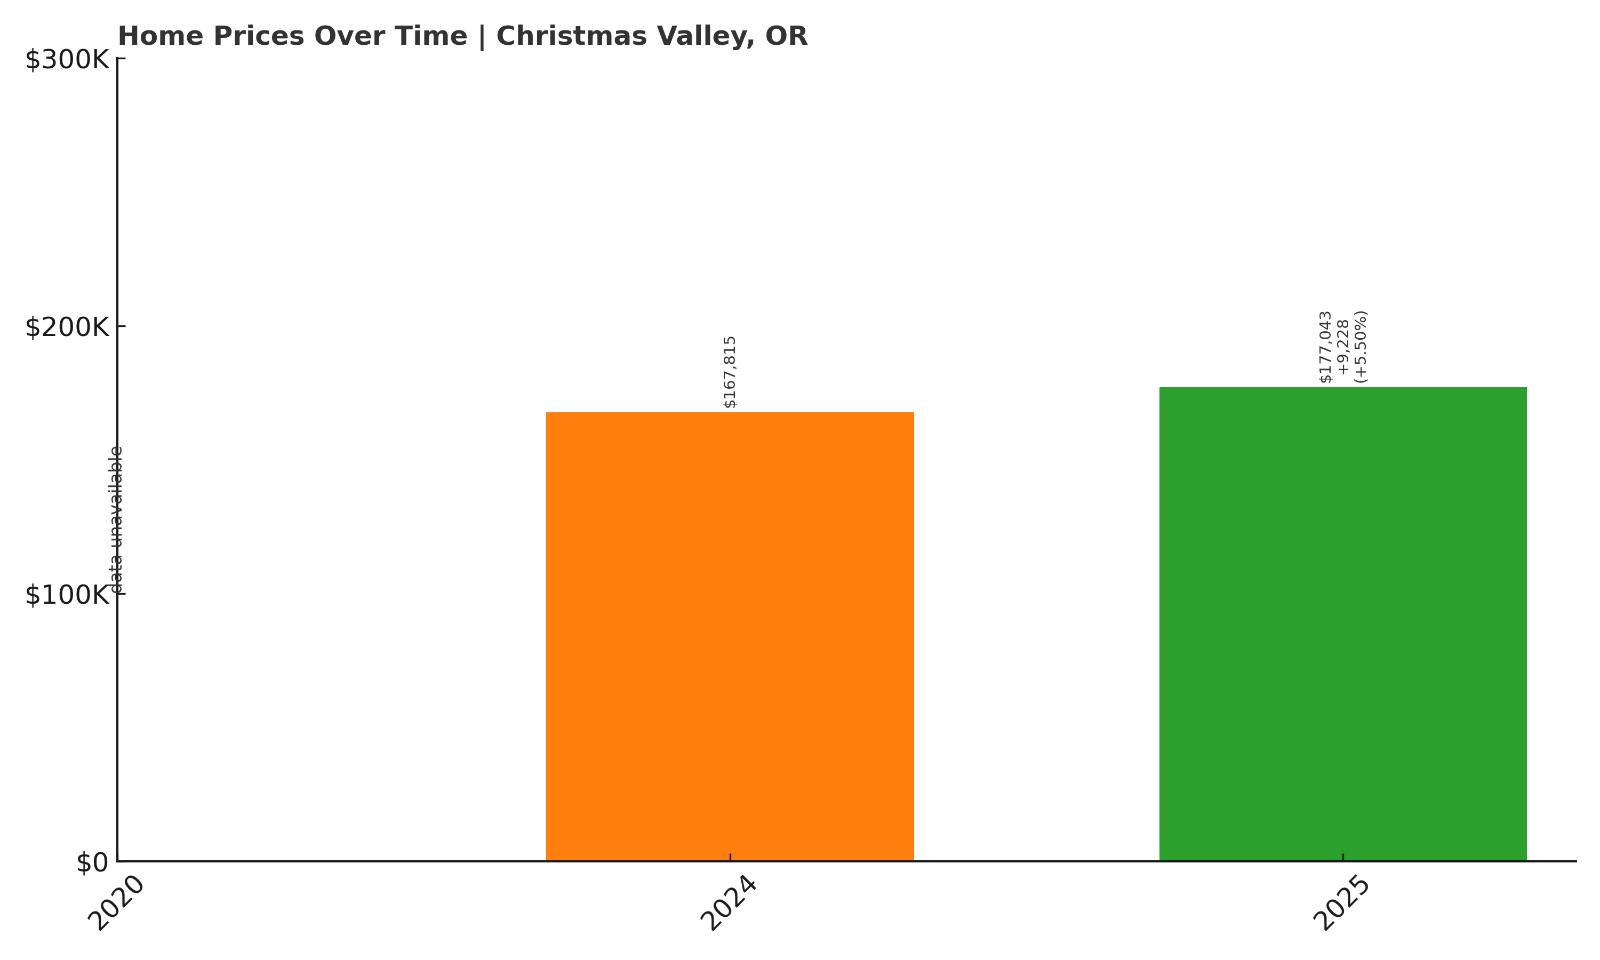
2. Christmas Valley – 5.5% Home Price Increase Since May 2024
- 2010: N/A
- 2011: N/A
- 2012: N/A
- 2013: N/A
- 2014: N/A
- 2015: N/A
- 2016: N/A
- 2017: N/A
- 2018: N/A
- 2019: N/A
- 2020: N/A
- 2021: N/A
- 2022: N/A
- 2023: N/A
- 2024: $167,815
- 2025: $177,043 (+$9,228, +5.50% from previous year)
Christmas Valley entered the dataset in 2024 with a median home value of $167,815. One year later, values rose by 5.5% to $177,043. While the timeframe is short, the increase suggests the town may be entering a new growth phase.
Christmas Valley – Remote Market Just Starting to Move
🔥 Would you like to save this?
Located in northern Lake County, Christmas Valley is a small desert community with a unique name and a landscape dotted with lava beds, sand dunes, and sagebrush. It’s long been considered remote and off the radar—but rising interest in secluded, inexpensive land has begun to stir new demand.
Though price data only goes back to 2024, the initial 5.5% bump is notable. With plenty of open land and little existing inventory, even small increases in demand can move the market. If current trends continue, Christmas Valley could see a sustained period of price appreciation, particularly among off-grid buyers and outdoor enthusiasts.
1. Bly – 130% Home Price Increase Since 2010

- 2010: $75,359
- 2011: $74,573 (-$786, -1.04% from previous year)
- 2012: $71,903 (-$2,669, -3.58% from previous year)
- 2013: $71,038 (-$865, -1.20% from previous year)
- 2014: $76,125 (+$5,087, +7.16% from previous year)
- 2015: $76,602 (+$477, +0.63% from previous year)
- 2016: $89,306 (+$12,704, +16.58% from previous year)
- 2017: $97,492 (+$8,186, +9.17% from previous year)
- 2018: $109,842 (+$12,350, +12.67% from previous year)
- 2019: $118,607 (+$8,765, +7.98% from previous year)
- 2020: N/A
- 2021: $154,219
- 2022: $179,009 (+$24,791, +16.08% from previous year)
- 2023: $180,621 (+$1,612, +0.90% from previous year)
- 2024: $179,810 (-$812, -0.45% from previous year)
- 2025: $173,442 (-$6,368, -3.54% from previous year)
Bly tops the list with a 130% home price increase since 2010. The bulk of that growth came between 2016 and 2022, with home values surging from under $90,000 to nearly $180,000. Prices have dipped slightly in the last two years, but long-term gains remain among the highest in the state.
Bly – A High-Growth Rural Market Facing a Cooldown
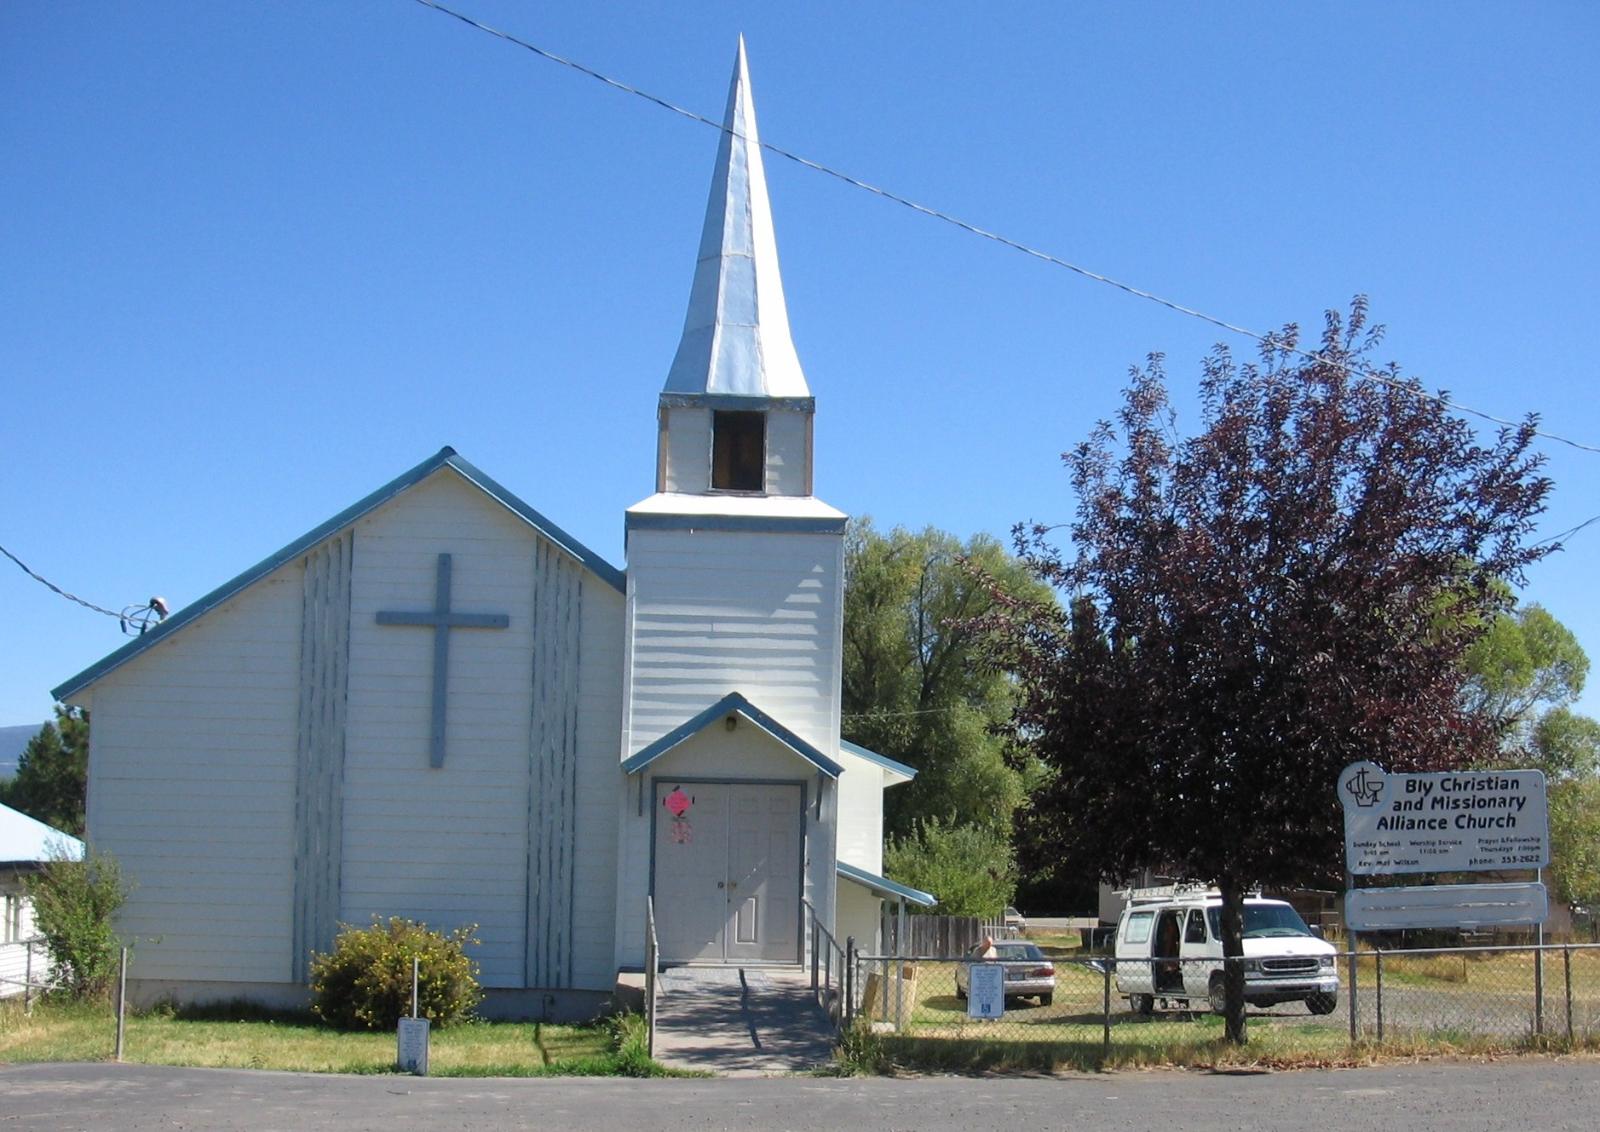
Bly is a tiny, unincorporated community in Klamath County nestled among forests and meadows in south-central Oregon. Known for its tranquility and proximity to the Fremont-Winema National Forest, it has long attracted hunters, retirees, and people seeking privacy in nature.
Home prices soared in the 2010s and early 2020s, with double-digit annual gains reflecting newfound demand. While prices have pulled back slightly since 2023, this correction follows a period of explosive growth. Even with recent softness, Bly has posted some of the most dramatic price gains in rural Oregon, and its long-term prospects remain promising if demand for remote living persists.


