🔥 Would you like to save this?
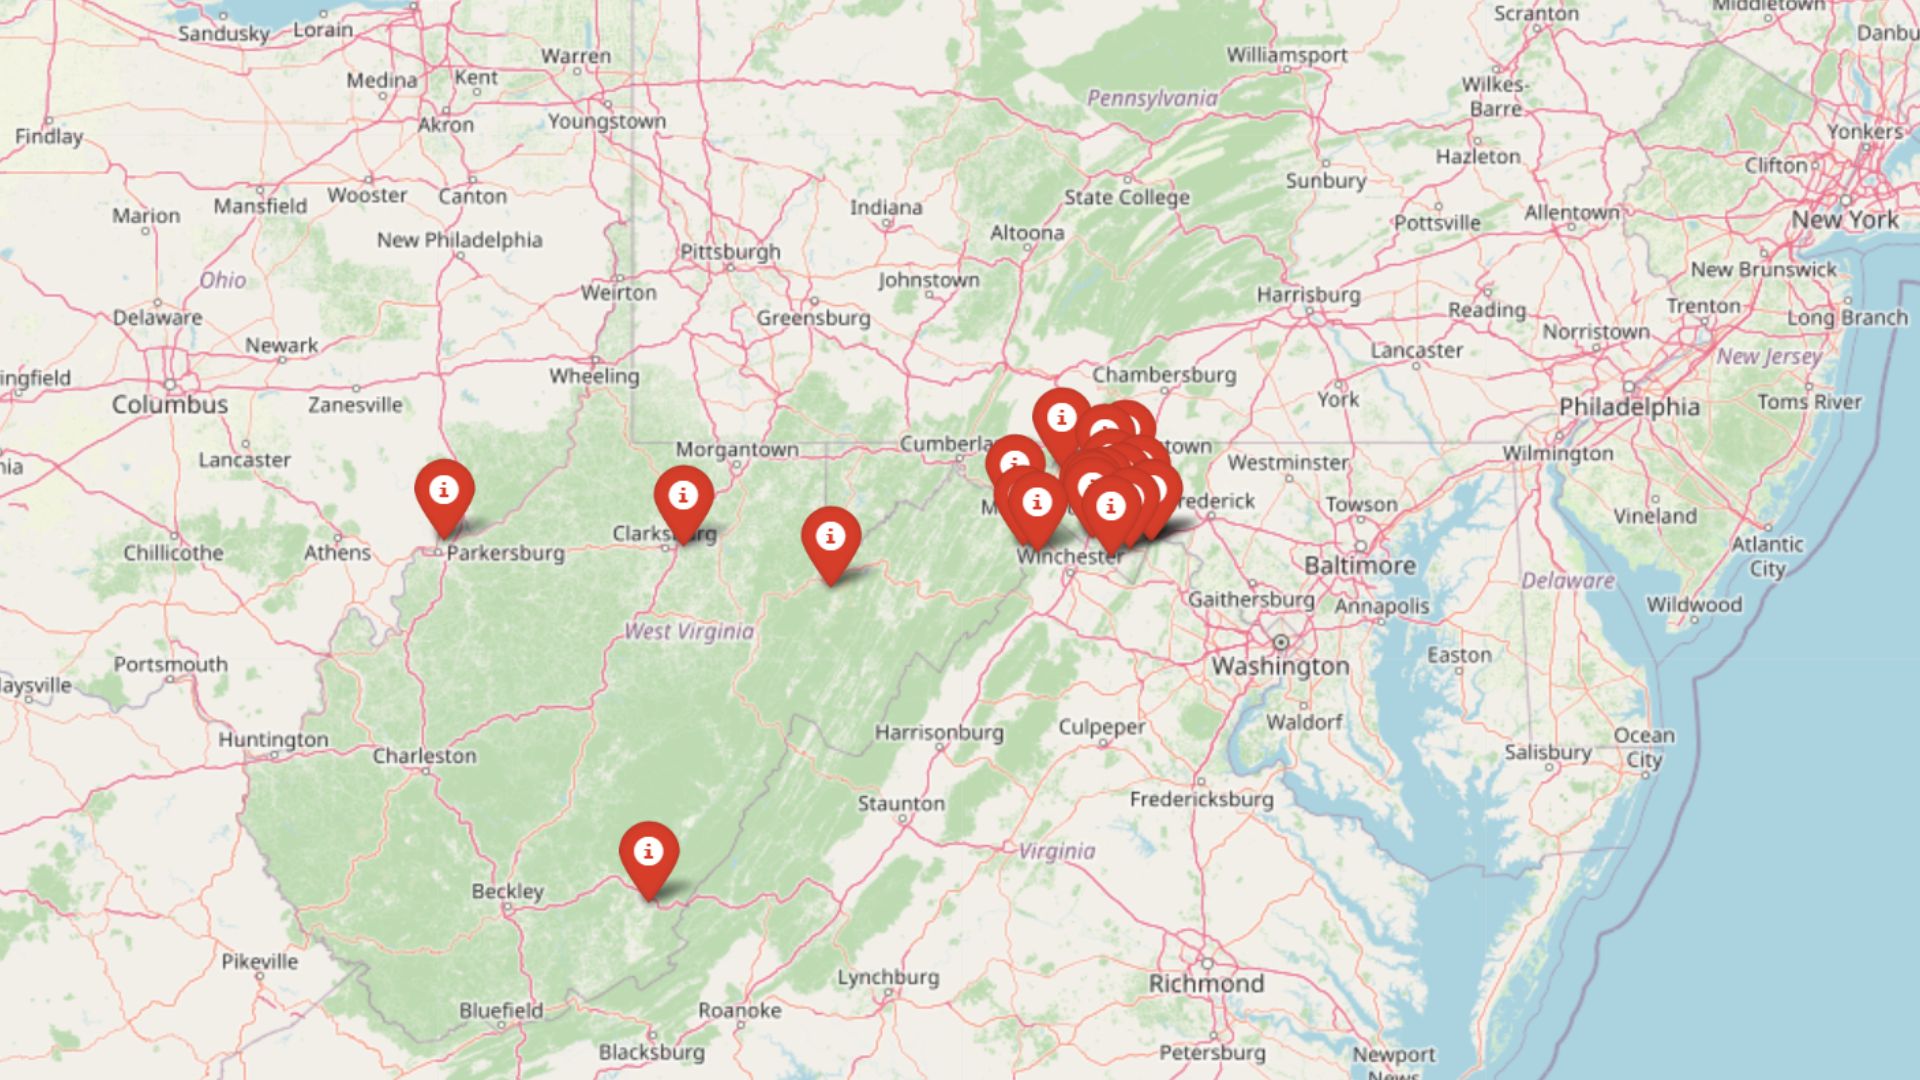
Zillow Home Value Index data for 2025 shows that some West Virginia towns have become surprisingly expensive places to buy a home. From scenic mountain communities to quiet suburbs with rising appeal, these 21 towns top the list for highest home values in the state. Whether it’s location, charm, or just plain demand driving prices, these are the places where buyers will need deeper pockets to get in the door.
21. Lewisburg – 40.6% Home Price Increase Since 2010
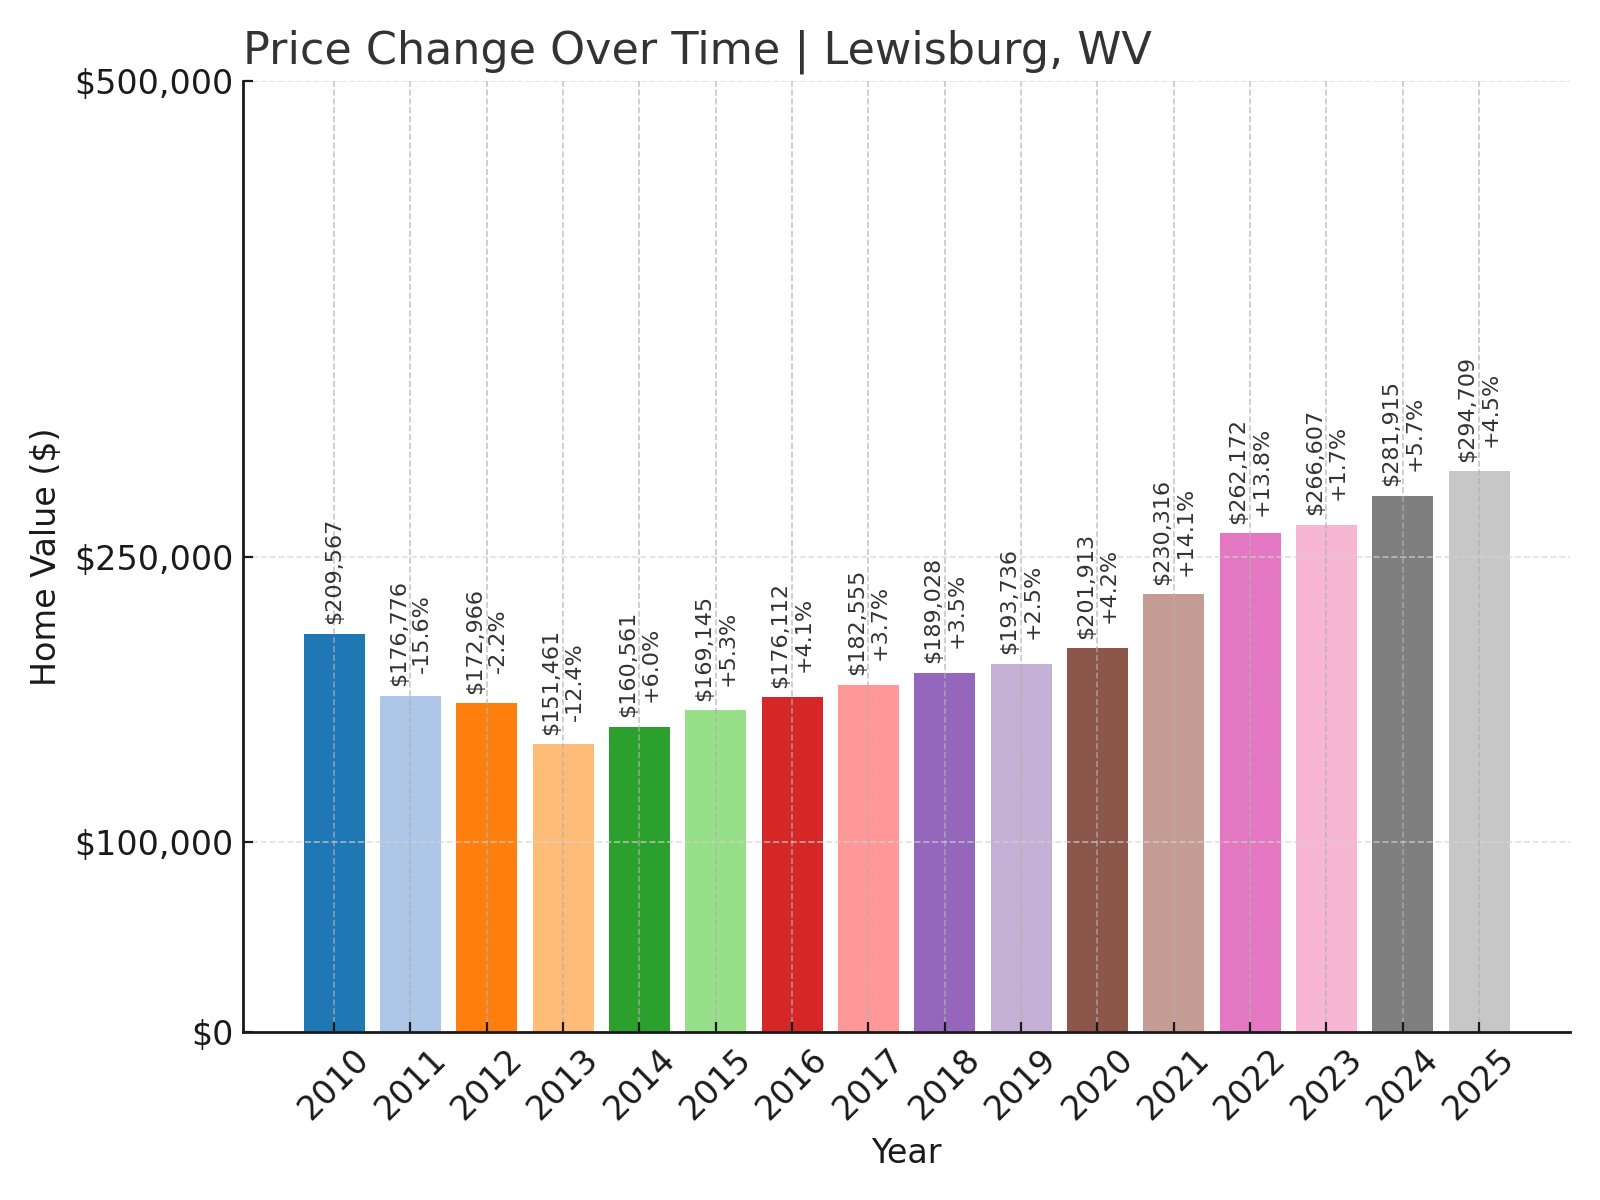
- 2010: $209,567
- 2011: $176,776 (-$32,791, -15.65% from previous year)
- 2012: $172,966 (-$3,810, -2.16% from previous year)
- 2013: $151,461 (-$21,505, -12.43% from previous year)
- 2014: $160,561 (+$9,100, +6.01% from previous year)
- 2015: $169,145 (+$8,585, +5.35% from previous year)
- 2016: $176,112 (+$6,966, +4.12% from previous year)
- 2017: $182,555 (+$6,444, +3.66% from previous year)
- 2018: $189,028 (+$6,473, +3.55% from previous year)
- 2019: $193,736 (+$4,708, +2.49% from previous year)
- 2020: $201,913 (+$8,177, +4.22% from previous year)
- 2021: $230,316 (+$28,403, +14.07% from previous year)
- 2022: $262,172 (+$31,856, +13.83% from previous year)
- 2023: $266,607 (+$4,435, +1.69% from previous year)
- 2024: $281,915 (+$15,309, +5.74% from previous year)
- 2025: $294,709 (+$12,793, +4.54% from previous year)
Lewisburg’s home prices have climbed from about $209,567 in 2010 to nearly $295,000 in 2025. The town saw steady annual growth after 2013, with a big surge in 2021 and 2022. Recent increases remain moderate, indicating continued but stabilizing demand for homes here.
In order to come up with the very specific design ideas, we create most designs with the assistance of state-of-the-art AI interior design software. Also, assume links that take you off the site are affiliate links such as links to Amazon. this means we may earn a commission if you buy something.
Lewisburg – Historic Downtown and Arts Scene Fuel Growth
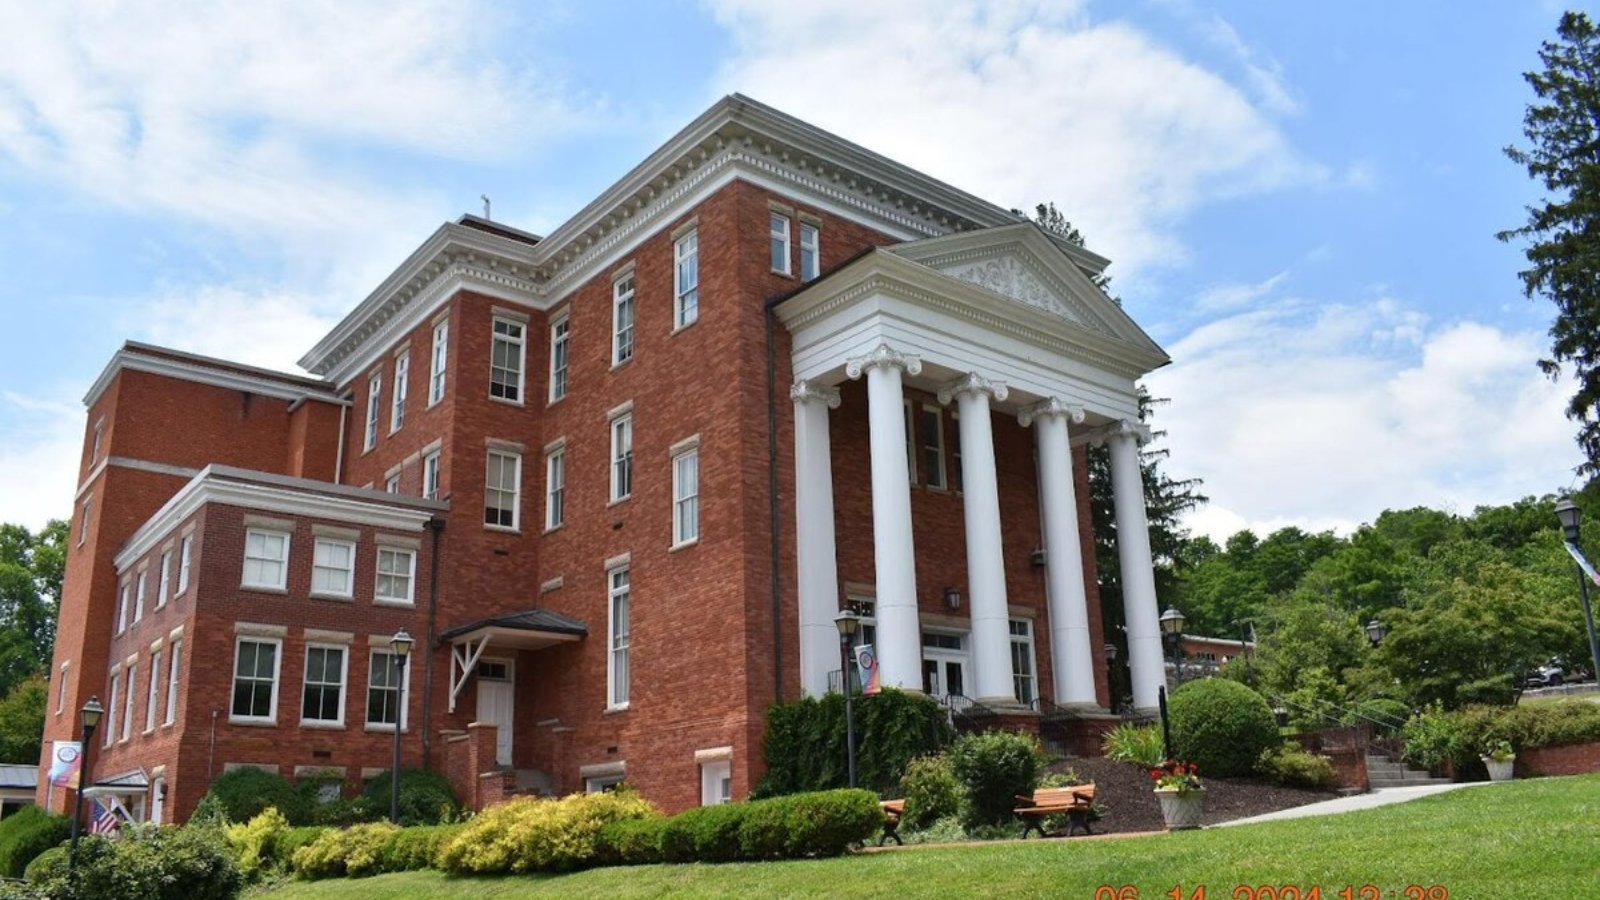
Located in Greenbrier County, Lewisburg is known for its walkable historic downtown filled with art galleries, shops, and theatres. The city was named “America’s Coolest Small Town” by Budget Travel in 2011, drawing attention to its charm and boosting interest in local real estate.
The town is also near The Greenbrier, a luxury resort that employs many residents. Its economy benefits from both tourism and healthcare sectors, creating steady local demand. With cultural events year-round, buyers are willing to pay more for homes in this lively area.
Lewisburg’s median home value rise reflects its reputation as a cultural hub in West Virginia. Its mix of old architecture, Appalachian heritage, and arts-focused community continues to attract newcomers looking for vibrant small-town living.
20. Slanesville – 92.8% Home Price Increase Since 2010
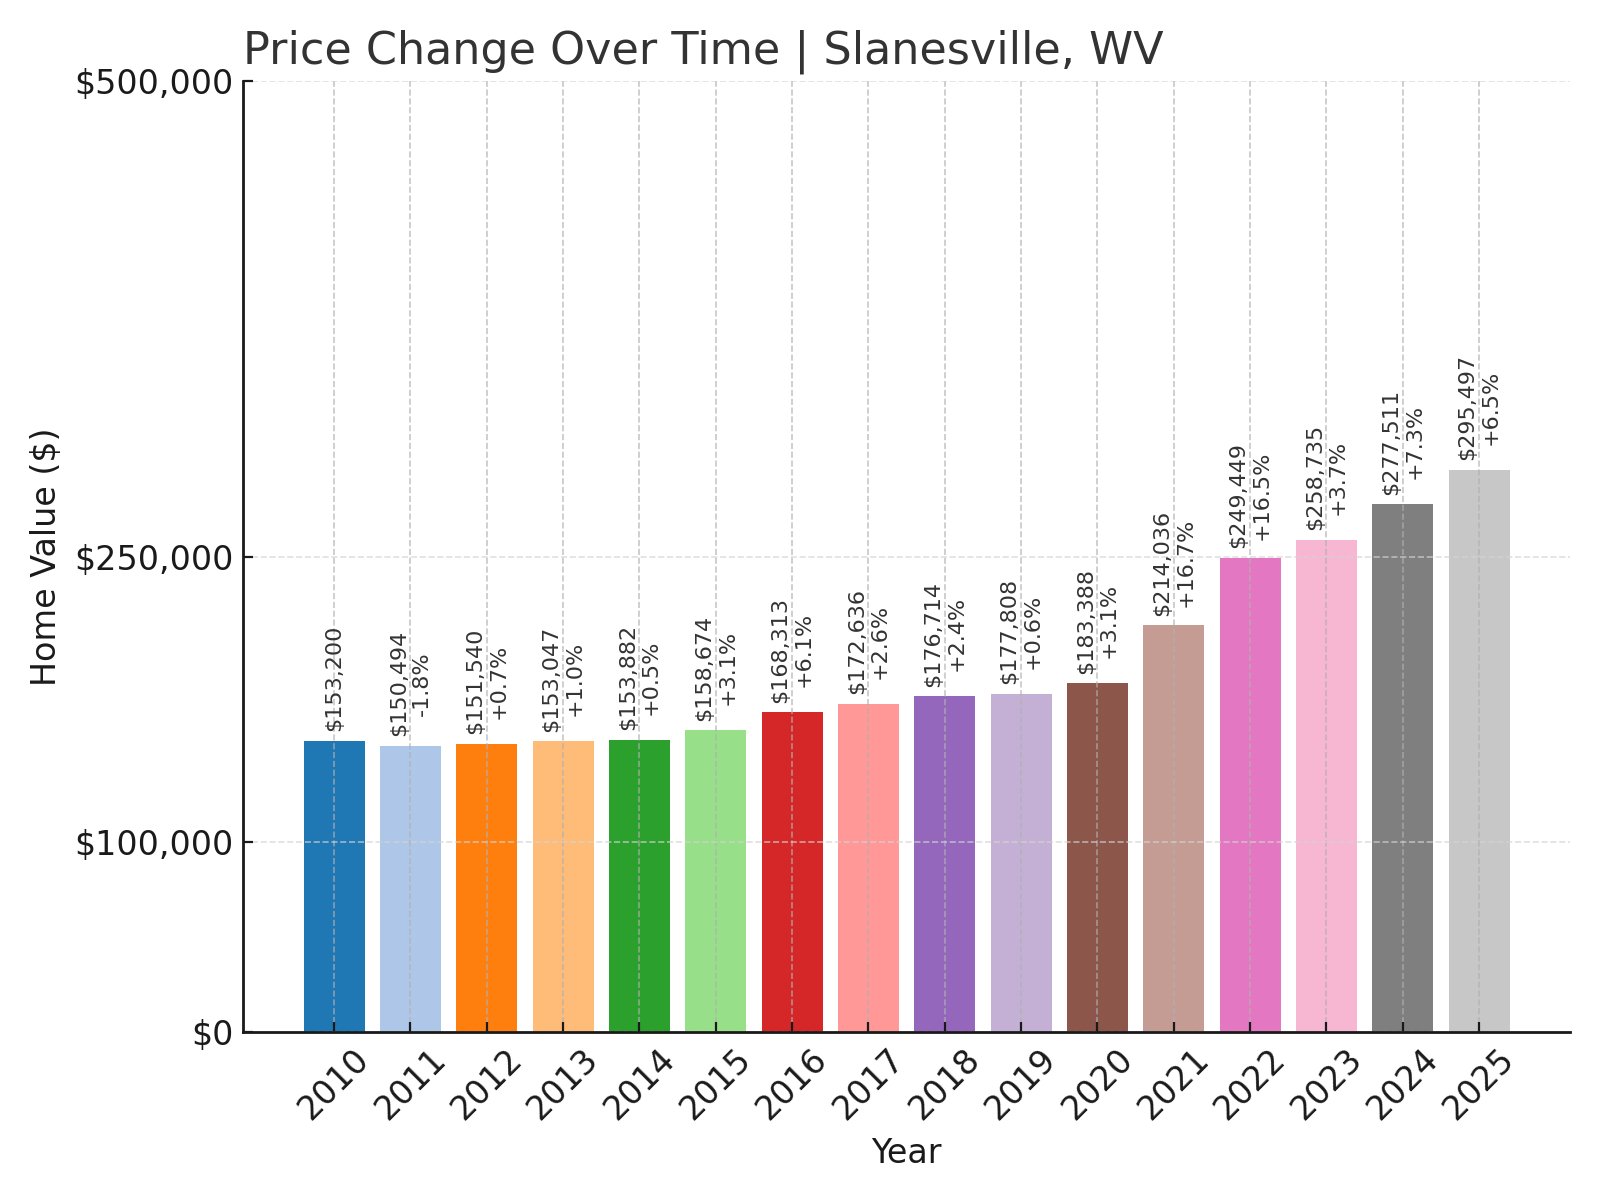
- 2010: $153,200
- 2011: $150,494 (-$2,706, -1.77% from previous year)
- 2012: $151,540 (+$1,046, +0.70% from previous year)
- 2013: $153,047 (+$1,507, +0.99% from previous year)
- 2014: $153,882 (+$835, +0.55% from previous year)
- 2015: $158,674 (+$4,792, +3.11% from previous year)
- 2016: $168,313 (+$9,639, +6.07% from previous year)
- 2017: $172,636 (+$4,323, +2.57% from previous year)
- 2018: $176,714 (+$4,079, +2.36% from previous year)
- 2019: $177,808 (+$1,094, +0.62% from previous year)
- 2020: $183,388 (+$5,580, +3.14% from previous year)
- 2021: $214,036 (+$30,648, +16.71% from previous year)
- 2022: $249,449 (+$35,414, +16.55% from previous year)
- 2023: $258,735 (+$9,285, +3.72% from previous year)
- 2024: $277,511 (+$18,777, +7.26% from previous year)
- 2025: $295,497 (+$17,985, +6.48% from previous year)
Slanesville’s home values nearly doubled over the past 15 years, starting at around $153,000 in 2010 and approaching $296,000 in 2025. Price growth accelerated sharply after 2020, driven by demand for rural homes with space and privacy.
Slanesville – Rural Lifestyle Attracts New Residents
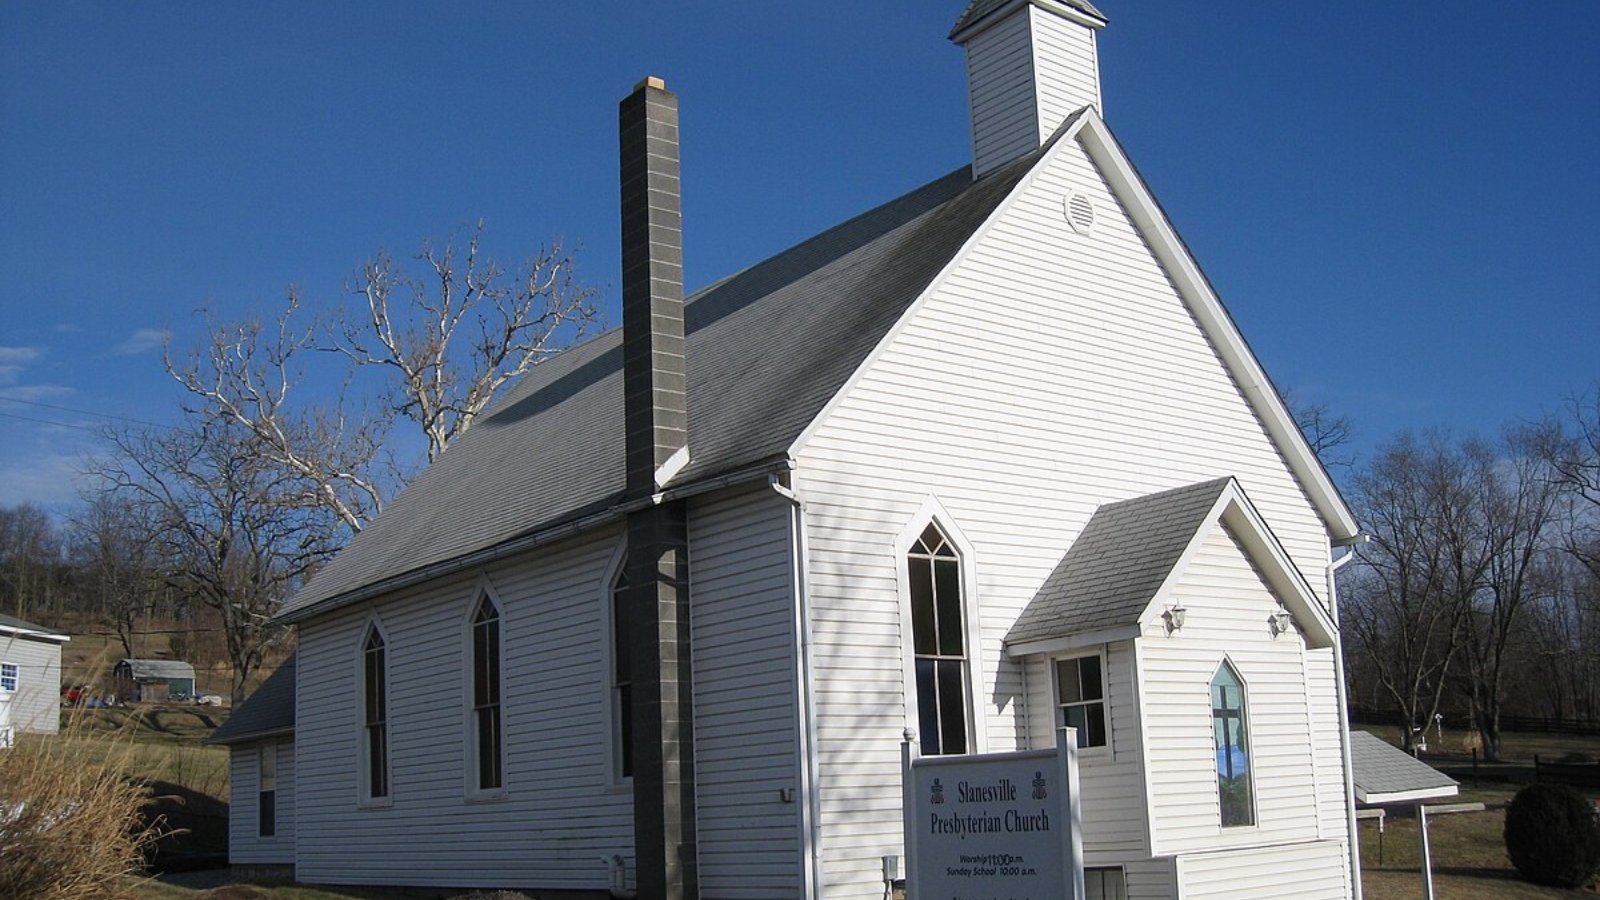
Slanesville is a quiet, unincorporated community in Hampshire County. It’s surrounded by farmland and forested hills, offering residents a peaceful lifestyle away from urban areas. Its location makes it ideal for those commuting to Winchester or Romney while enjoying rural living.
The area is known for outdoor recreation, with nearby access to the Cacapon River and hiking trails in the region. Homes here are generally on larger lots, appealing to buyers seeking privacy and natural surroundings.
Slanesville’s price growth reflects broader trends of buyers looking for more land and space since 2020. Its modest size and low-density housing continue to drive interest from families wanting quiet country living within reach of amenities.
19. Bloomery – 79.4% Home Price Increase Since 2010
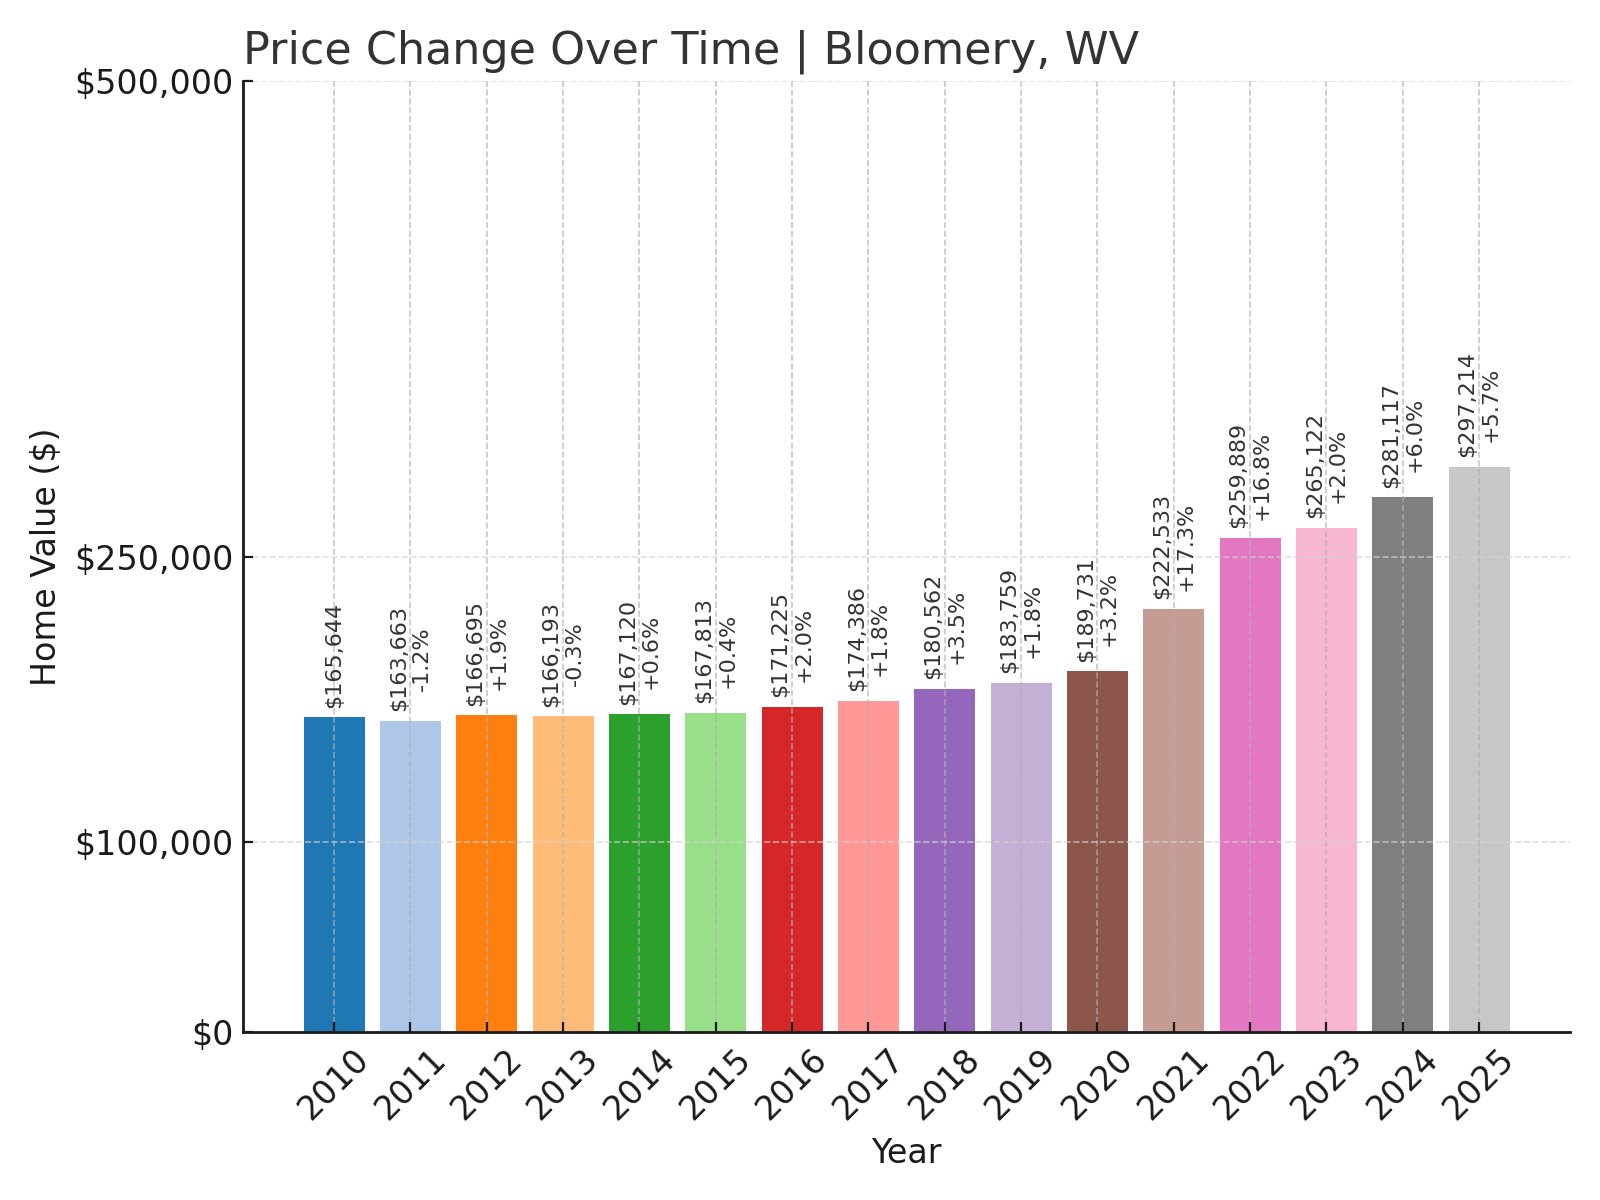
- 2010: $165,644
- 2011: $163,663 (-$1,982, -1.20% from previous year)
- 2012: $166,695 (+$3,032, +1.85% from previous year)
- 2013: $166,193 (-$501, -0.30% from previous year)
- 2014: $167,120 (+$927, +0.56% from previous year)
- 2015: $167,813 (+$693, +0.41% from previous year)
- 2016: $171,225 (+$3,412, +2.03% from previous year)
- 2017: $174,386 (+$3,161, +1.85% from previous year)
- 2018: $180,562 (+$6,176, +3.54% from previous year)
- 2019: $183,759 (+$3,197, +1.77% from previous year)
- 2020: $189,731 (+$5,972, +3.25% from previous year)
- 2021: $222,533 (+$32,801, +17.29% from previous year)
- 2022: $259,889 (+$37,357, +16.79% from previous year)
- 2023: $265,122 (+$5,232, +2.01% from previous year)
- 2024: $281,117 (+$15,995, +6.03% from previous year)
- 2025: $297,214 (+$16,096, +5.73% from previous year)
Bloomery’s home values rose from around $165,000 in 2010 to just under $300,000 in 2025. The town experienced strong growth after 2020, with significant annual increases continuing into recent years.
Bloomery – Affordable Homes in a Scenic Setting
Bloomery is located in Hampshire County, close to the Virginia border. It offers scenic views, quiet roads, and proximity to the Shenandoah Valley. Many homes in Bloomery are on larger plots, making them attractive to buyers looking for space without high prices.
The community is small and rural, with agriculture and small businesses forming the backbone of the local economy. Residents often work in nearby Winchester, Virginia, while enjoying the peacefulness of West Virginia countryside living.
Home price increases in Bloomery reflect its appeal to buyers seeking affordability with easy access to larger employment hubs. The trend of telecommuting has also helped boost local real estate interest in recent years.
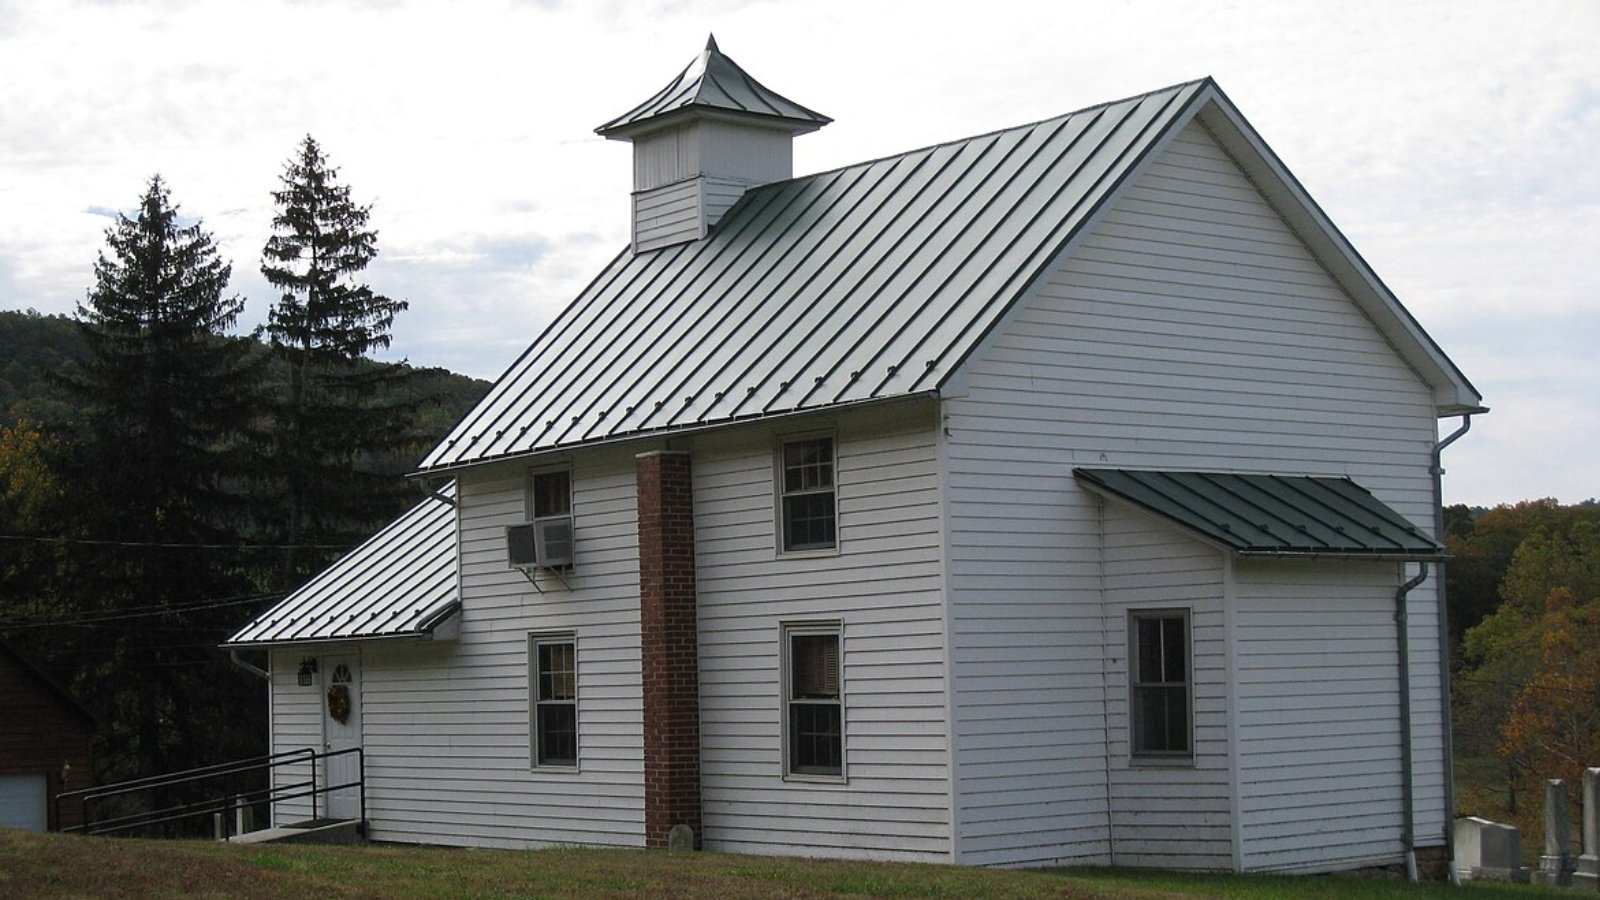
18. Bridgeport – 63.4% Home Price Increase Since 2010
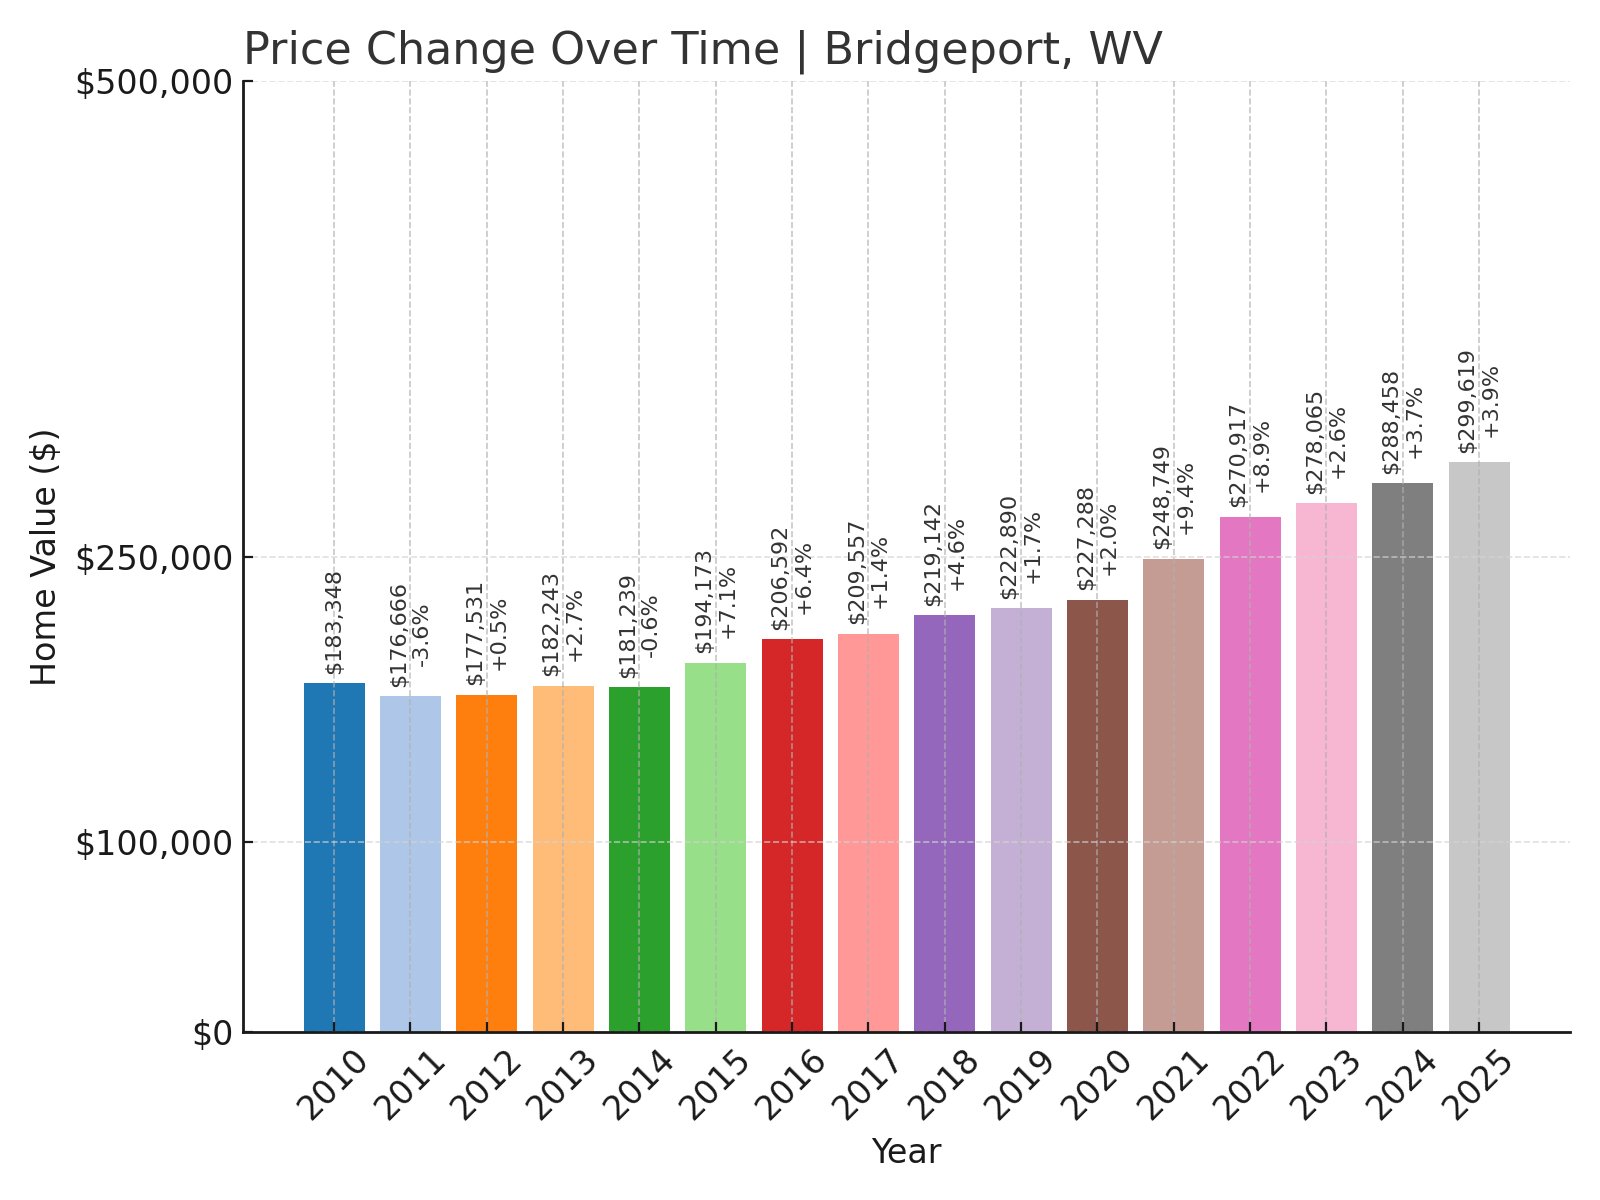
- 2010: $183,348
- 2011: $176,666 (-$6,682, -3.64% from previous year)
- 2012: $177,531 (+$865, +0.49% from previous year)
- 2013: $182,243 (+$4,712, +2.65% from previous year)
- 2014: $181,239 (-$1,003, -0.55% from previous year)
- 2015: $194,173 (+$12,933, +7.14% from previous year)
- 2016: $206,592 (+$12,419, +6.40% from previous year)
- 2017: $209,557 (+$2,965, +1.44% from previous year)
- 2018: $219,142 (+$9,585, +4.57% from previous year)
- 2019: $222,890 (+$3,748, +1.71% from previous year)
- 2020: $227,288 (+$4,399, +1.97% from previous year)
- 2021: $248,749 (+$21,460, +9.44% from previous year)
- 2022: $270,917 (+$22,168, +8.91% from previous year)
- 2023: $278,065 (+$7,148, +2.64% from previous year)
- 2024: $288,458 (+$10,393, +3.74% from previous year)
- 2025: $299,619 (+$11,161, +3.87% from previous year)
Bridgeport’s housing market saw prices increase from about $183,000 in 2010 to nearly $300,000 in 2025. The town enjoyed stable growth with notable gains since 2020, reflecting strong regional demand.
Bridgeport – A Growing City With Major Employers
Bridgeport is located in Harrison County and serves as a regional business hub. Major employers include United Hospital Center and aerospace companies near North Central West Virginia Airport. This employment base supports consistent housing demand.
The city is known for its good schools and public services, making it attractive to families. Recreation facilities, local parks, and nearby retail options also add to its appeal as a place to settle long-term.
Bridgeport’s price increases mirror its economic growth and reputation as one of West Virginia’s more prosperous communities. Continued development projects are likely to support further home value growth in the coming years.
17. Martinsburg – 93.2% Home Price Increase Since 2015
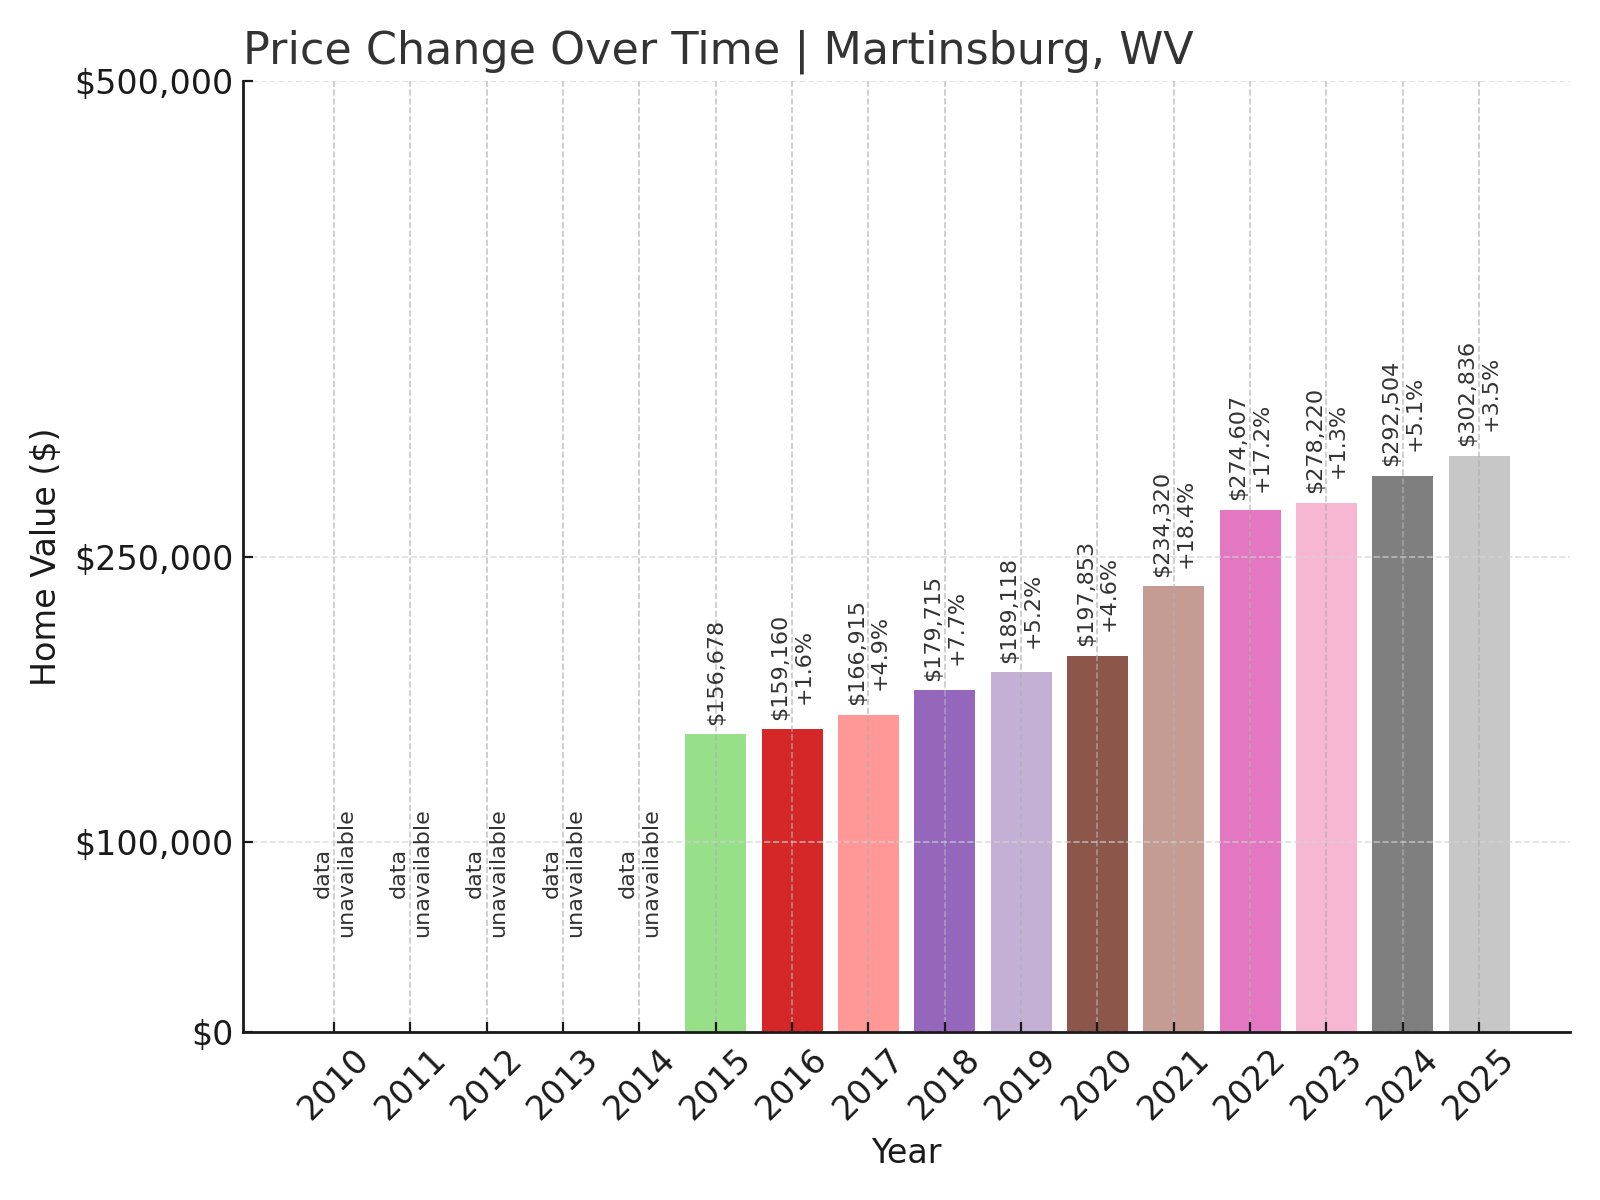
- 2015: $156,678
- 2016: $159,160 (+$2,482, +1.58% from previous year)
- 2017: $166,915 (+$7,756, +4.87% from previous year)
- 2018: $179,715 (+$12,799, +7.67% from previous year)
- 2019: $189,118 (+$9,403, +5.23% from previous year)
- 2020: $197,853 (+$8,735, +4.62% from previous year)
- 2021: $234,320 (+$36,467, +18.43% from previous year)
- 2022: $274,607 (+$40,287, +17.19% from previous year)
- 2023: $278,220 (+$3,613, +1.32% from previous year)
- 2024: $292,504 (+$14,285, +5.13% from previous year)
- 2025: $302,836 (+$10,332, +3.53% from previous year)
Martinsburg’s home prices nearly doubled since 2015, with values rising from around $156,000 to over $302,000 by 2025. The largest gains came between 2020 and 2022, driven by buyer demand in the eastern panhandle region.
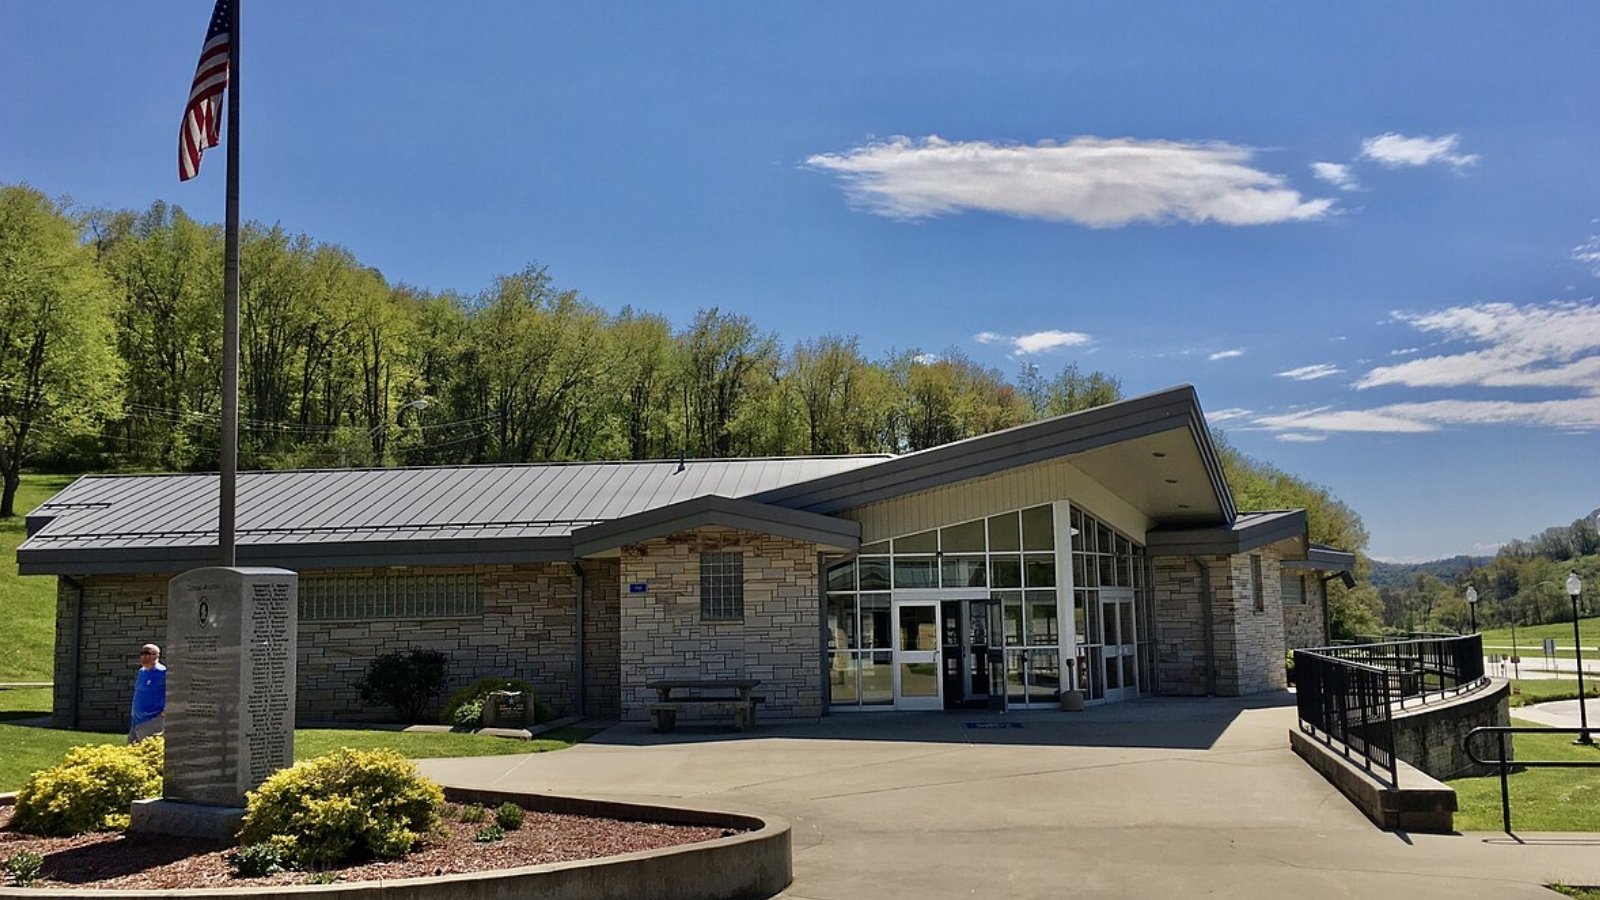
Martinsburg – Commuter Hub With Historic Charm
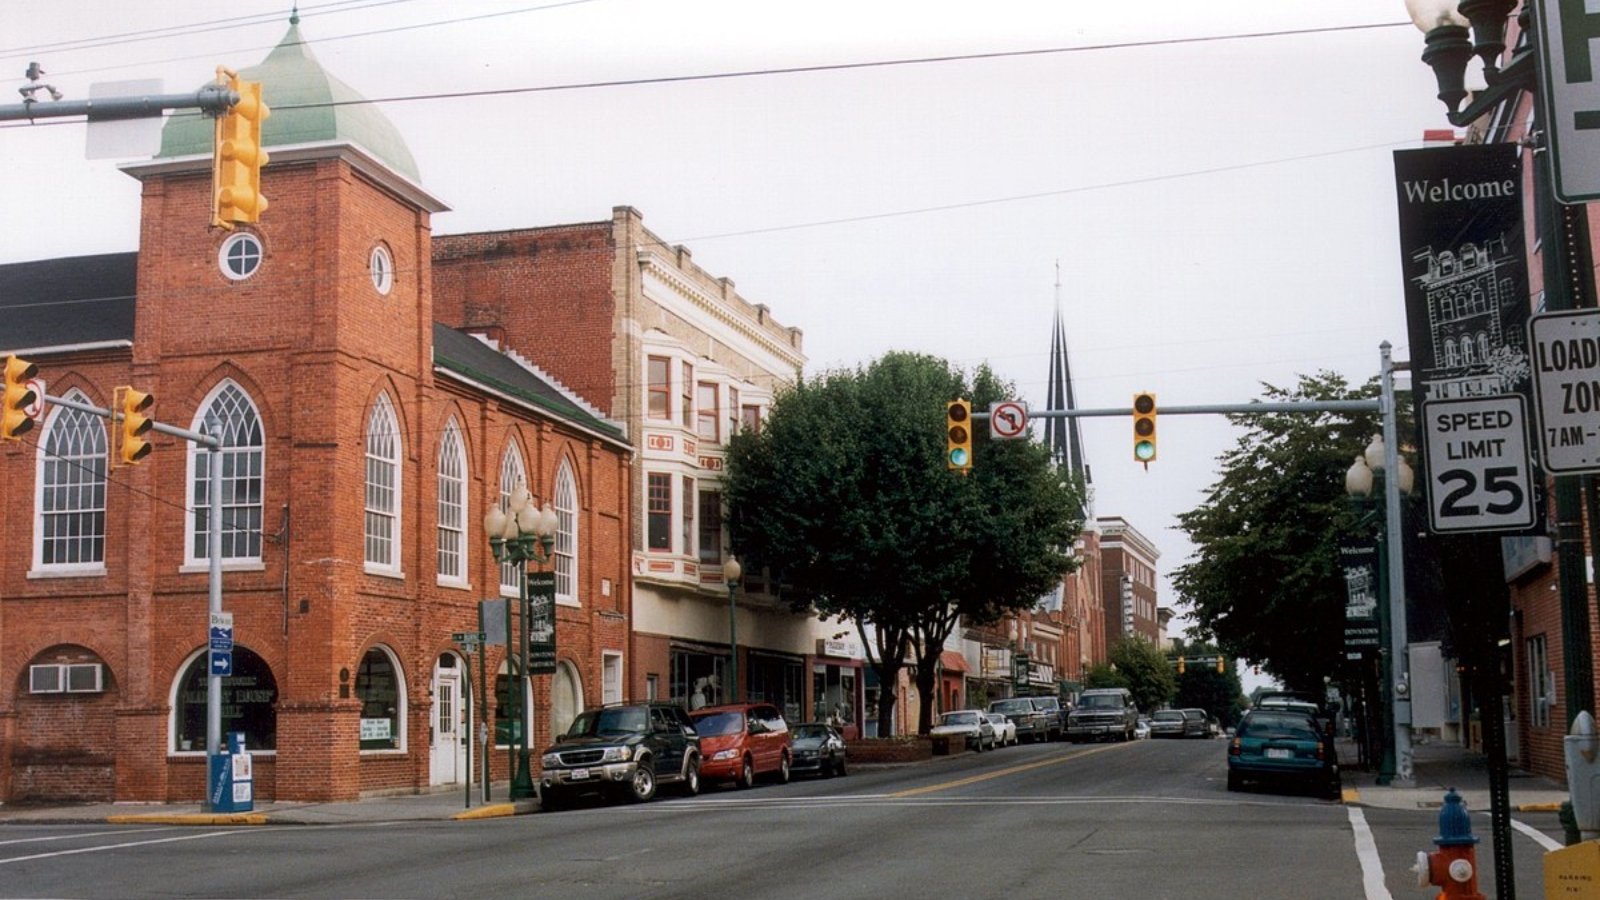
Martinsburg is located in Berkeley County, near the Maryland border. It has a MARC train station providing direct commuter service to Washington, D.C., making it popular among those who work in the capital but prefer affordable housing.
The city features historic architecture and a revitalizing downtown with restaurants and shops. Major employers include Procter & Gamble and health services, supporting the local economy and adding to housing demand.
Strong price growth in Martinsburg reflects its role as a transportation hub and a desirable choice for buyers looking for both affordability and accessibility to nearby metro areas.
16. North Hills – 89.0% Home Price Increase Since 2010
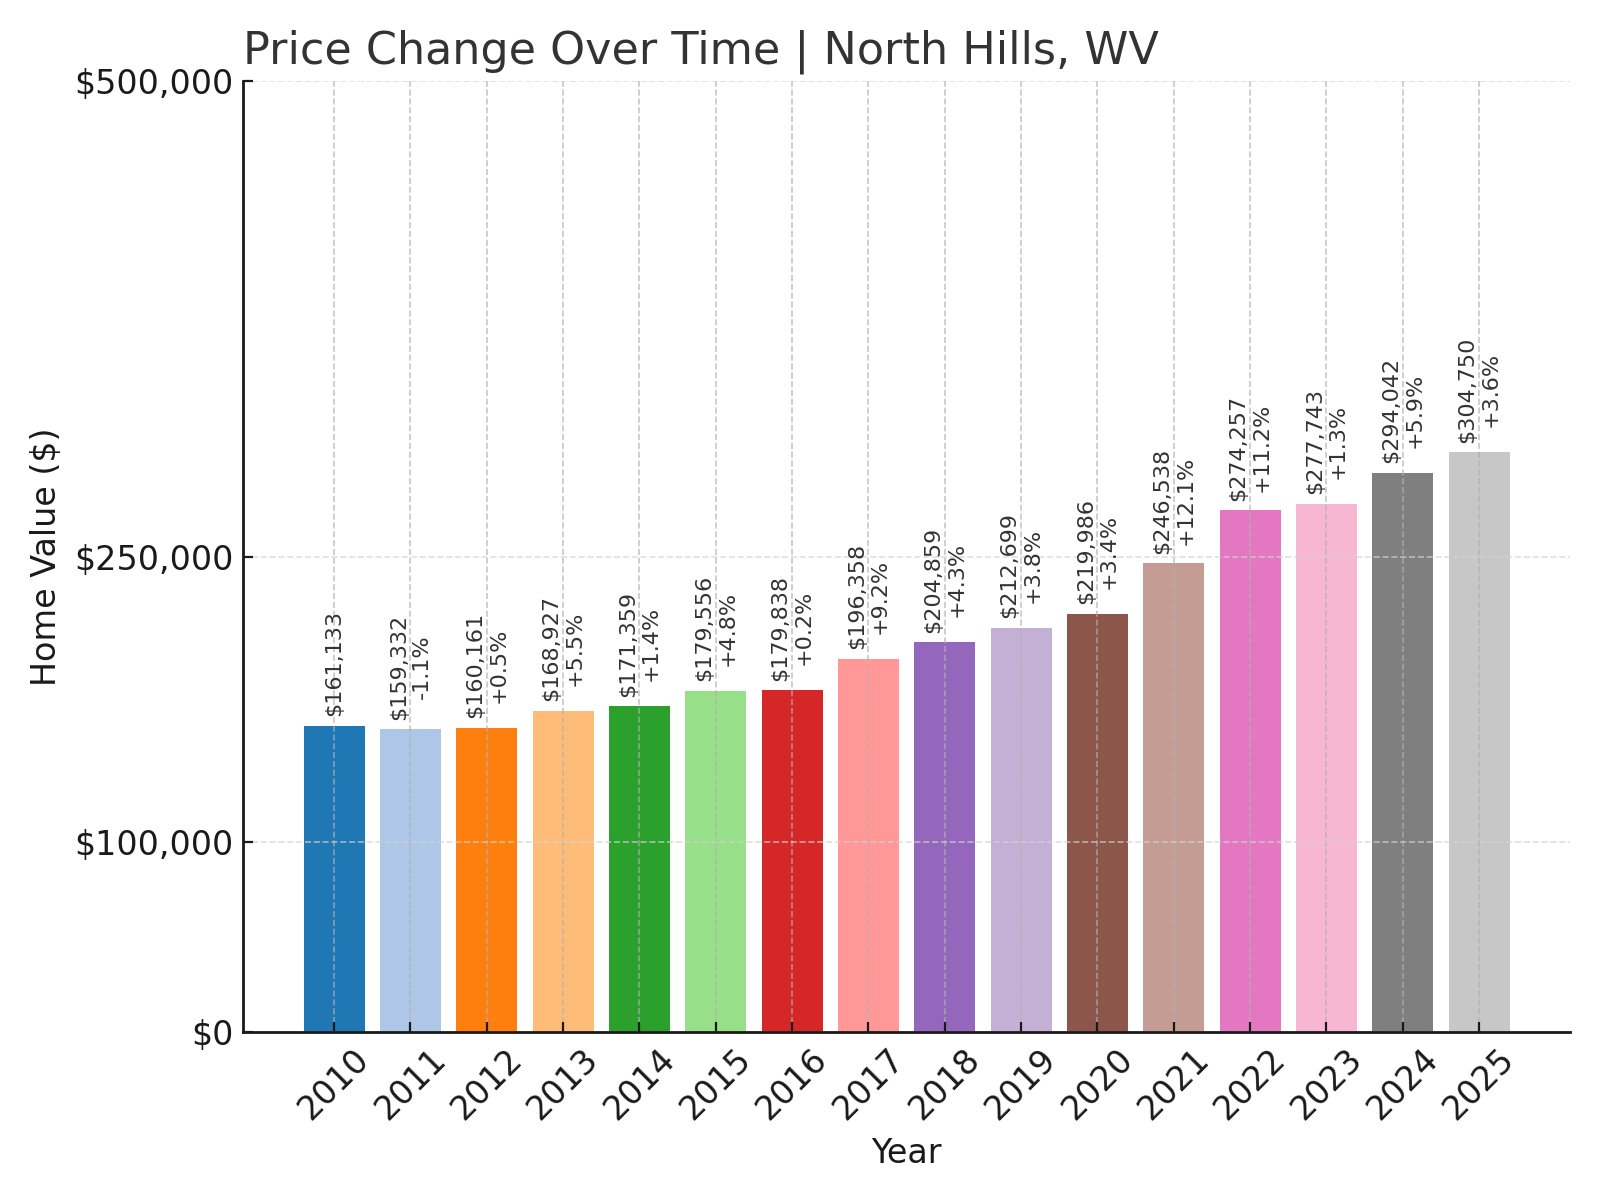
- 2010: $161,133
- 2011: $159,332 (-$1,801, -1.12% from previous year)
- 2012: $160,161 (+$829, +0.52% from previous year)
- 2013: $168,927 (+$8,766, +5.47% from previous year)
- 2014: $171,359 (+$2,432, +1.44% from previous year)
- 2015: $179,556 (+$8,197, +4.78% from previous year)
- 2016: $179,838 (+$282, +0.16% from previous year)
- 2017: $196,358 (+$16,520, +9.19% from previous year)
- 2018: $204,859 (+$8,501, +4.33% from previous year)
- 2019: $212,699 (+$7,840, +3.83% from previous year)
- 2020: $219,986 (+$7,287, +3.43% from previous year)
- 2021: $246,538 (+$26,551, +12.07% from previous year)
- 2022: $274,257 (+$27,719, +11.24% from previous year)
- 2023: $277,743 (+$3,487, +1.27% from previous year)
- 2024: $294,042 (+$16,299, +5.87% from previous year)
- 2025: $304,750 (+$10,708, +3.64% from previous year)
Home prices in North Hills climbed from roughly $161,000 in 2010 to over $304,000 in 2025. The town saw rapid growth from 2016 onward, peaking in double-digit increases in 2021 and 2022 before stabilizing more recently.
North Hills – A Residential Community With Steady Demand
North Hills is a quiet, residential neighborhood known for its tree-lined streets and suburban feel. Located near Charleston, it offers convenient access to city amenities while maintaining a peaceful setting for families and retirees.
The community features parks, local shops, and easy access to major roads. Its appeal comes from safe streets and a close-knit atmosphere, keeping demand for housing strong among those seeking suburban living without leaving the metropolitan area.
Recent price increases suggest North Hills remains a top choice for buyers in the region. Its stability and established housing market continue to attract residents looking for comfort and reliability in West Virginia’s capital region.
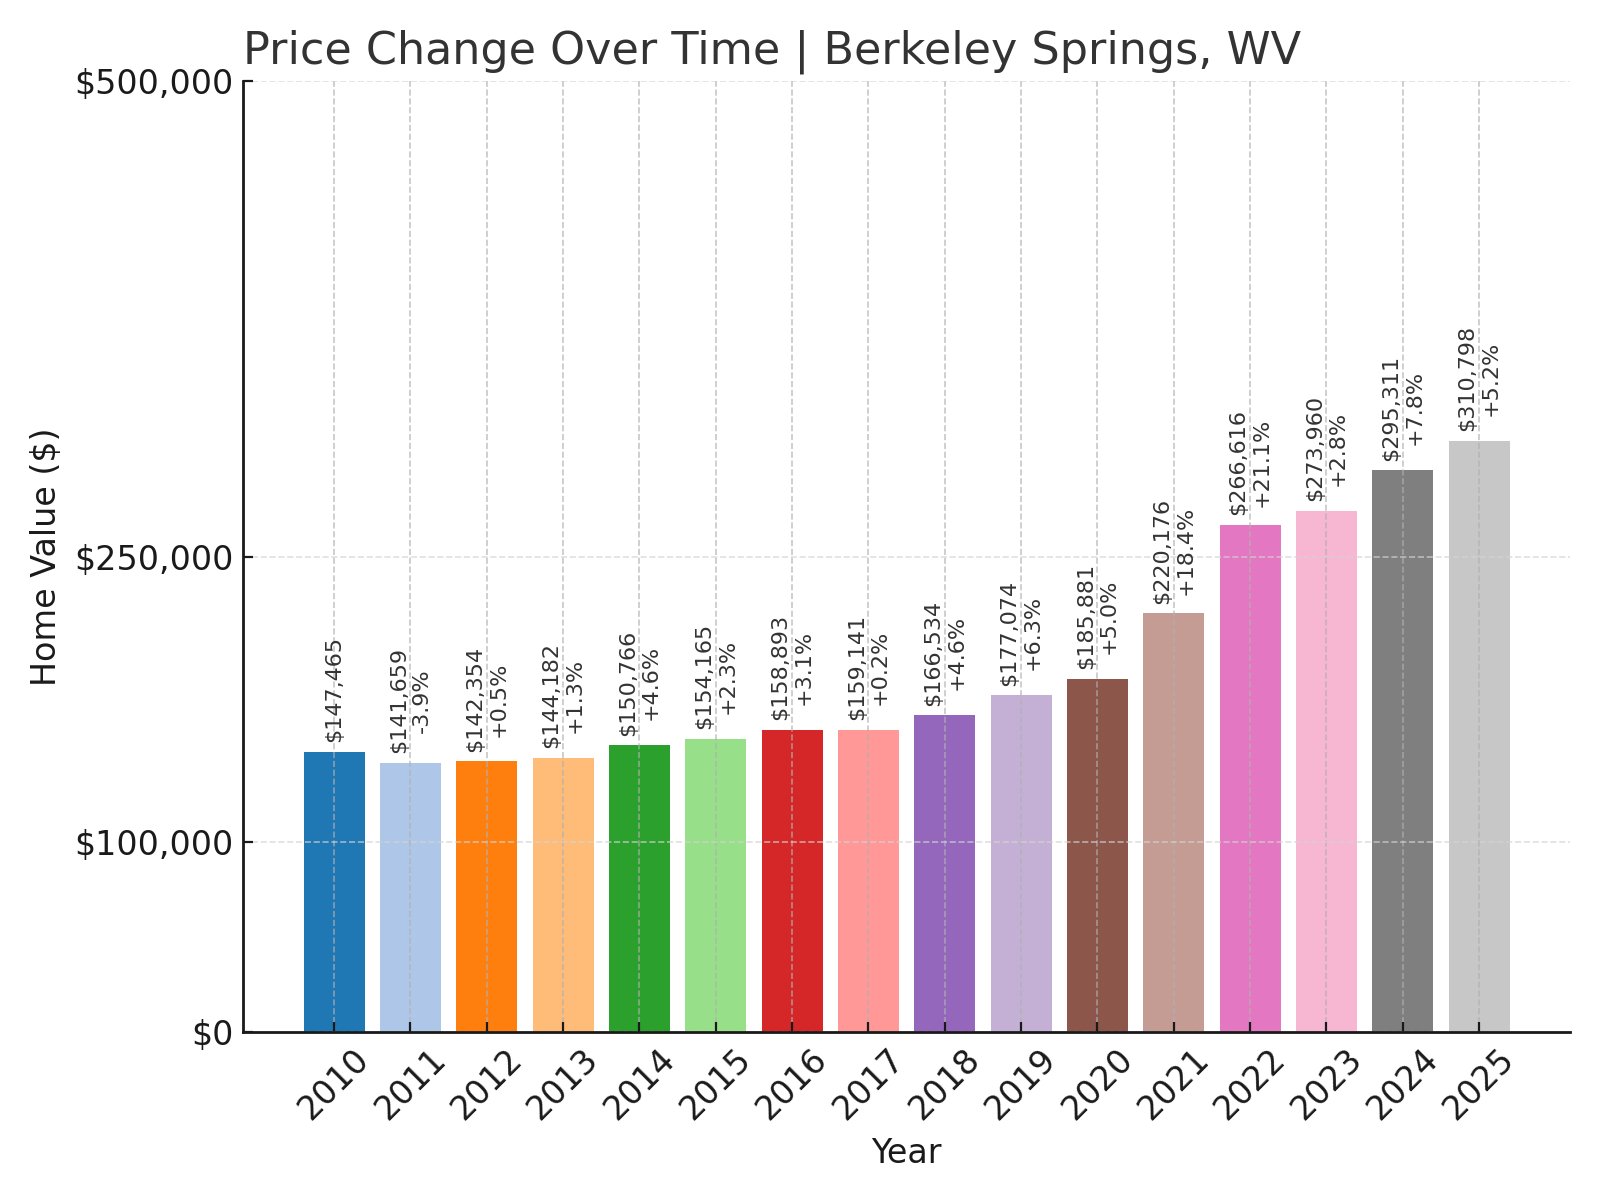
15. Berkeley Springs – 110.8% Home Price Increase Since 2010
🔥 Would you like to save this?
- 2010: $147,465
- 2011: $141,659 (-$5,806, -3.94% from previous year)
- 2012: $142,354 (+$695, +0.49% from previous year)
- 2013: $144,182 (+$1,828, +1.28% from previous year)
- 2014: $150,766 (+$6,584, +4.57% from previous year)
- 2015: $154,165 (+$3,399, +2.25% from previous year)
- 2016: $158,893 (+$4,727, +3.07% from previous year)
- 2017: $159,141 (+$248, +0.16% from previous year)
- 2018: $166,534 (+$7,393, +4.65% from previous year)
- 2019: $177,074 (+$10,540, +6.33% from previous year)
- 2020: $185,881 (+$8,807, +4.97% from previous year)
- 2021: $220,176 (+$34,295, +18.45% from previous year)
- 2022: $266,616 (+$46,440, +21.09% from previous year)
- 2023: $273,960 (+$7,344, +2.75% from previous year)
- 2024: $295,311 (+$21,352, +7.79% from previous year)
- 2025: $310,798 (+$15,487, +5.24% from previous year)
Berkeley Springs has seen home prices more than double since 2010, with values increasing from about $147,000 to over $310,000 by 2025. Rapid growth between 2020 and 2022 drove much of this rise, as the town gained popularity with buyers seeking spa town living.
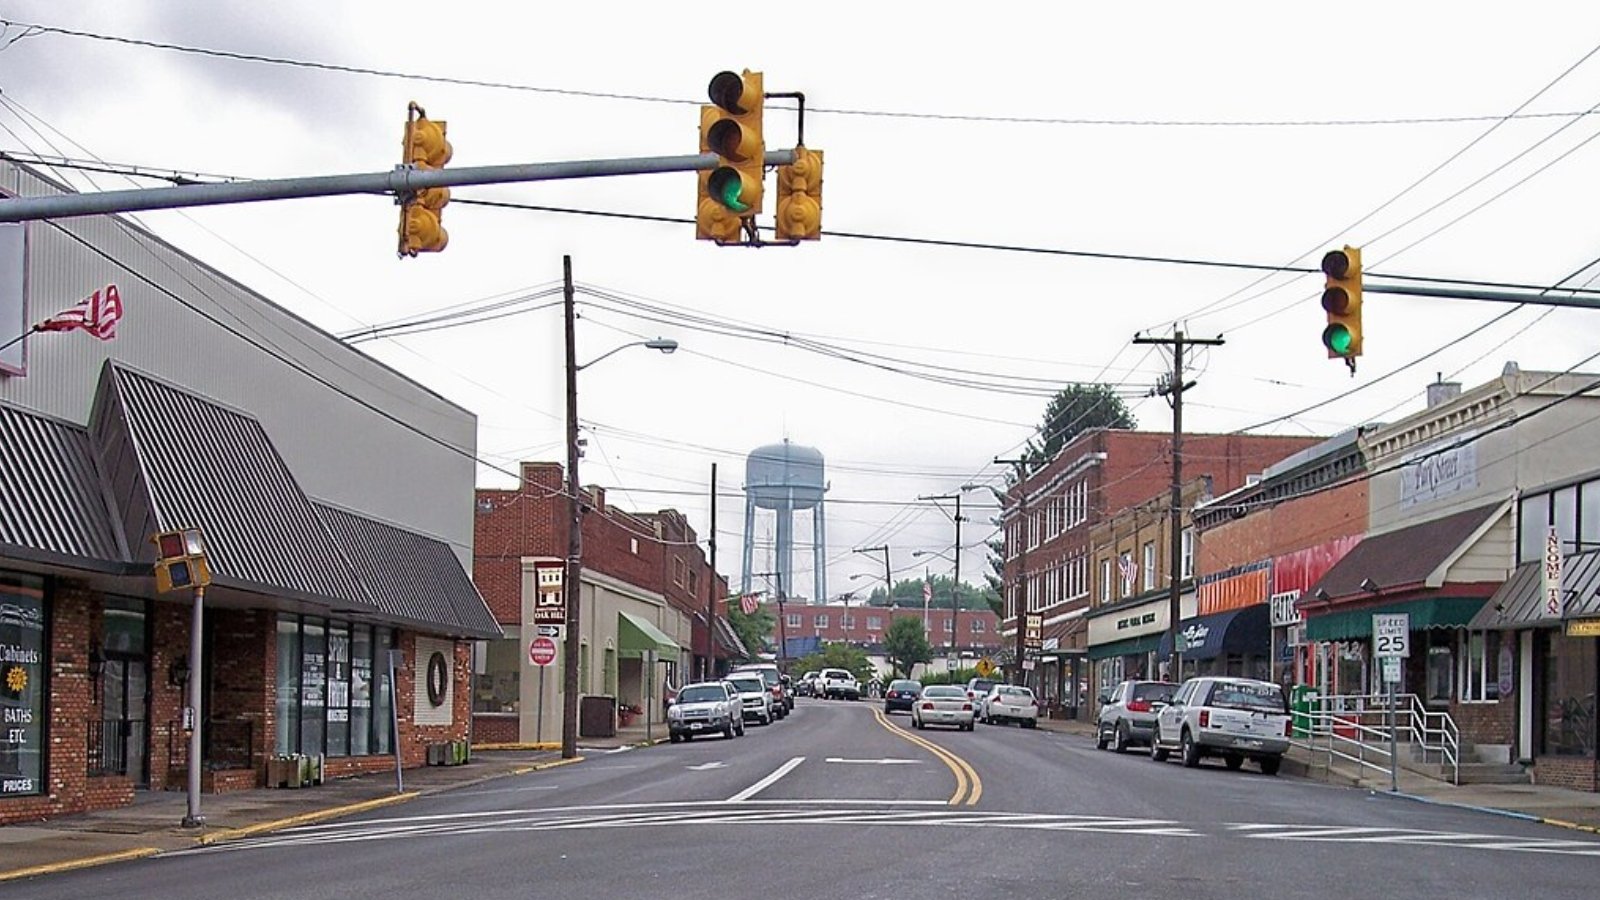
Berkeley Springs – Spa Town Attracting Buyers for Centuries
Berkeley Springs, in Morgan County, is famous for its historic mineral springs. Its state park includes the country’s first spa, attracting visitors for wellness tourism since colonial times. The town’s charming downtown features art galleries, antique shops, and locally-owned restaurants.
This reputation boosts local real estate as buyers seek both permanent homes and vacation properties. The area’s strong tourism base adds to economic stability, supporting local jobs and demand for housing year-round.
With its rich history and health-focused amenities, Berkeley Springs continues to attract new residents looking for a town with character and natural beauty, driving consistent increases in home values.
14. Bolivar – 103.8% Home Price Increase Since 2010
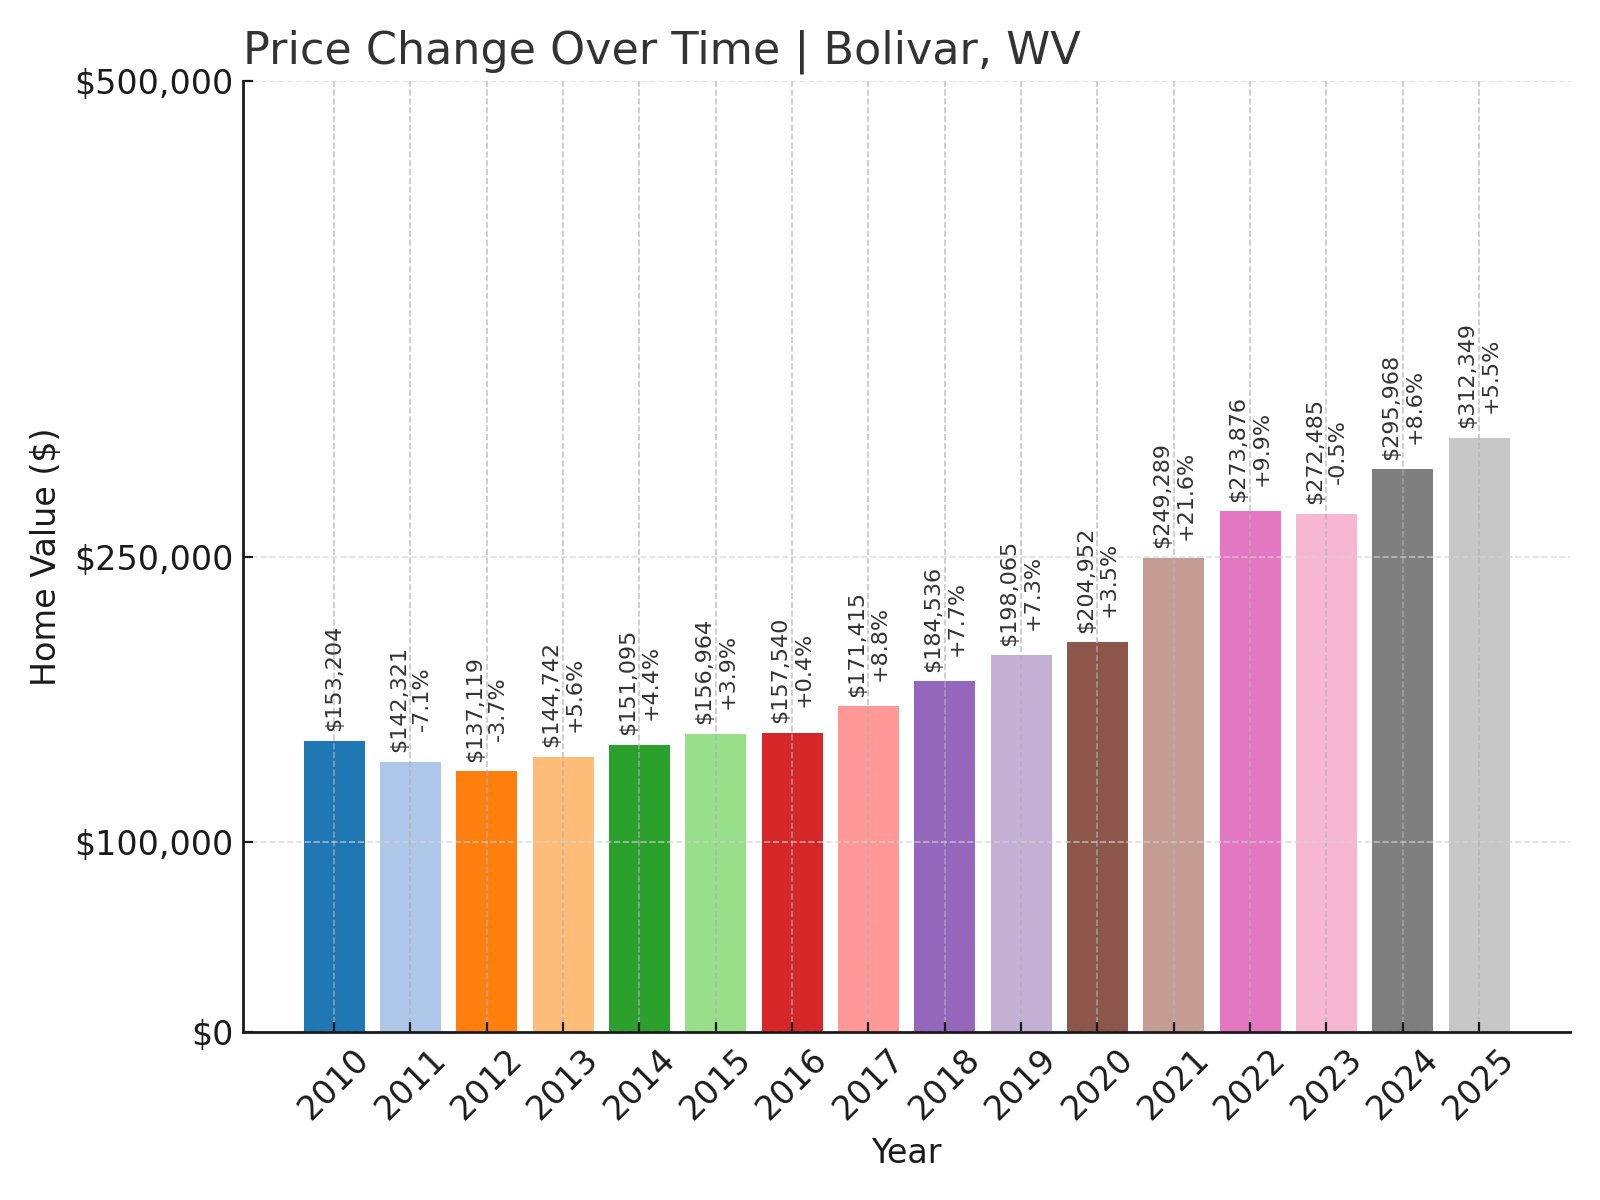
- 2010: $153,204
- 2011: $142,321 (-$10,883, -7.10% from previous year)
- 2012: $137,119 (-$5,202, -3.66% from previous year)
- 2013: $144,742 (+$7,623, +5.56% from previous year)
- 2014: $151,095 (+$6,353, +4.39% from previous year)
- 2015: $156,964 (+$5,869, +3.88% from previous year)
- 2016: $157,540 (+$576, +0.37% from previous year)
- 2017: $171,415 (+$13,875, +8.81% from previous year)
- 2018: $184,536 (+$13,121, +7.65% from previous year)
- 2019: $198,065 (+$13,530, +7.33% from previous year)
- 2020: $204,952 (+$6,887, +3.48% from previous year)
- 2021: $249,289 (+$44,336, +21.63% from previous year)
- 2022: $273,876 (+$24,587, +9.86% from previous year)
- 2023: $272,485 (-$1,391, -0.51% from previous year)
- 2024: $295,968 (+$23,484, +8.62% from previous year)
- 2025: $312,349 (+$16,380, +5.53% from previous year)
Bolivar’s housing market more than doubled in value since 2010, rising from about $153,000 to over $312,000 by 2025. The town saw strong gains in 2021 and 2022, with steady increases continuing into this year.
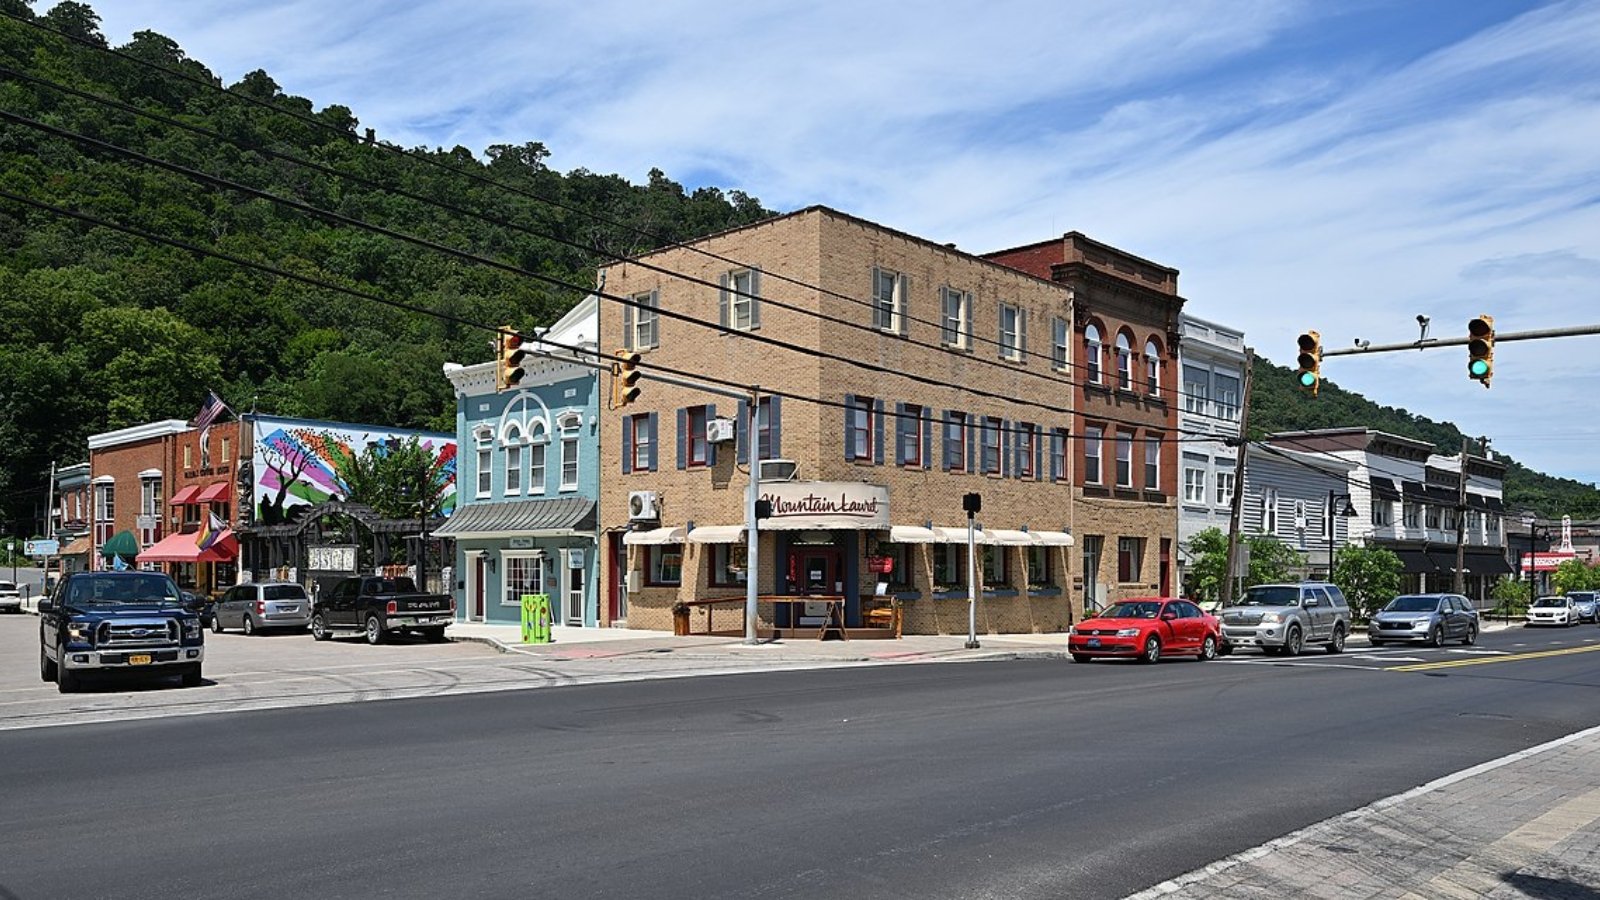
Bolivar – Small Town Tied to Harpers Ferry Tourism
Bolivar is adjacent to Harpers Ferry, sharing its rich history and scenic views. The town sits on high ground overlooking the confluence of the Potomac and Shenandoah rivers, making it a popular area for hikers and history enthusiasts.
Its proximity to the Harpers Ferry National Historical Park draws visitors and supports local shops and rental businesses. Buyers often choose Bolivar for more affordable housing while still benefiting from tourist-driven economic activity.
With access to trails, historic landmarks, and commuter routes to Maryland and Virginia, Bolivar remains a desirable choice for residents seeking both recreation and convenience, driving home price growth in recent years.
13. Falling Waters – 72.1% Home Price Increase Since 2015
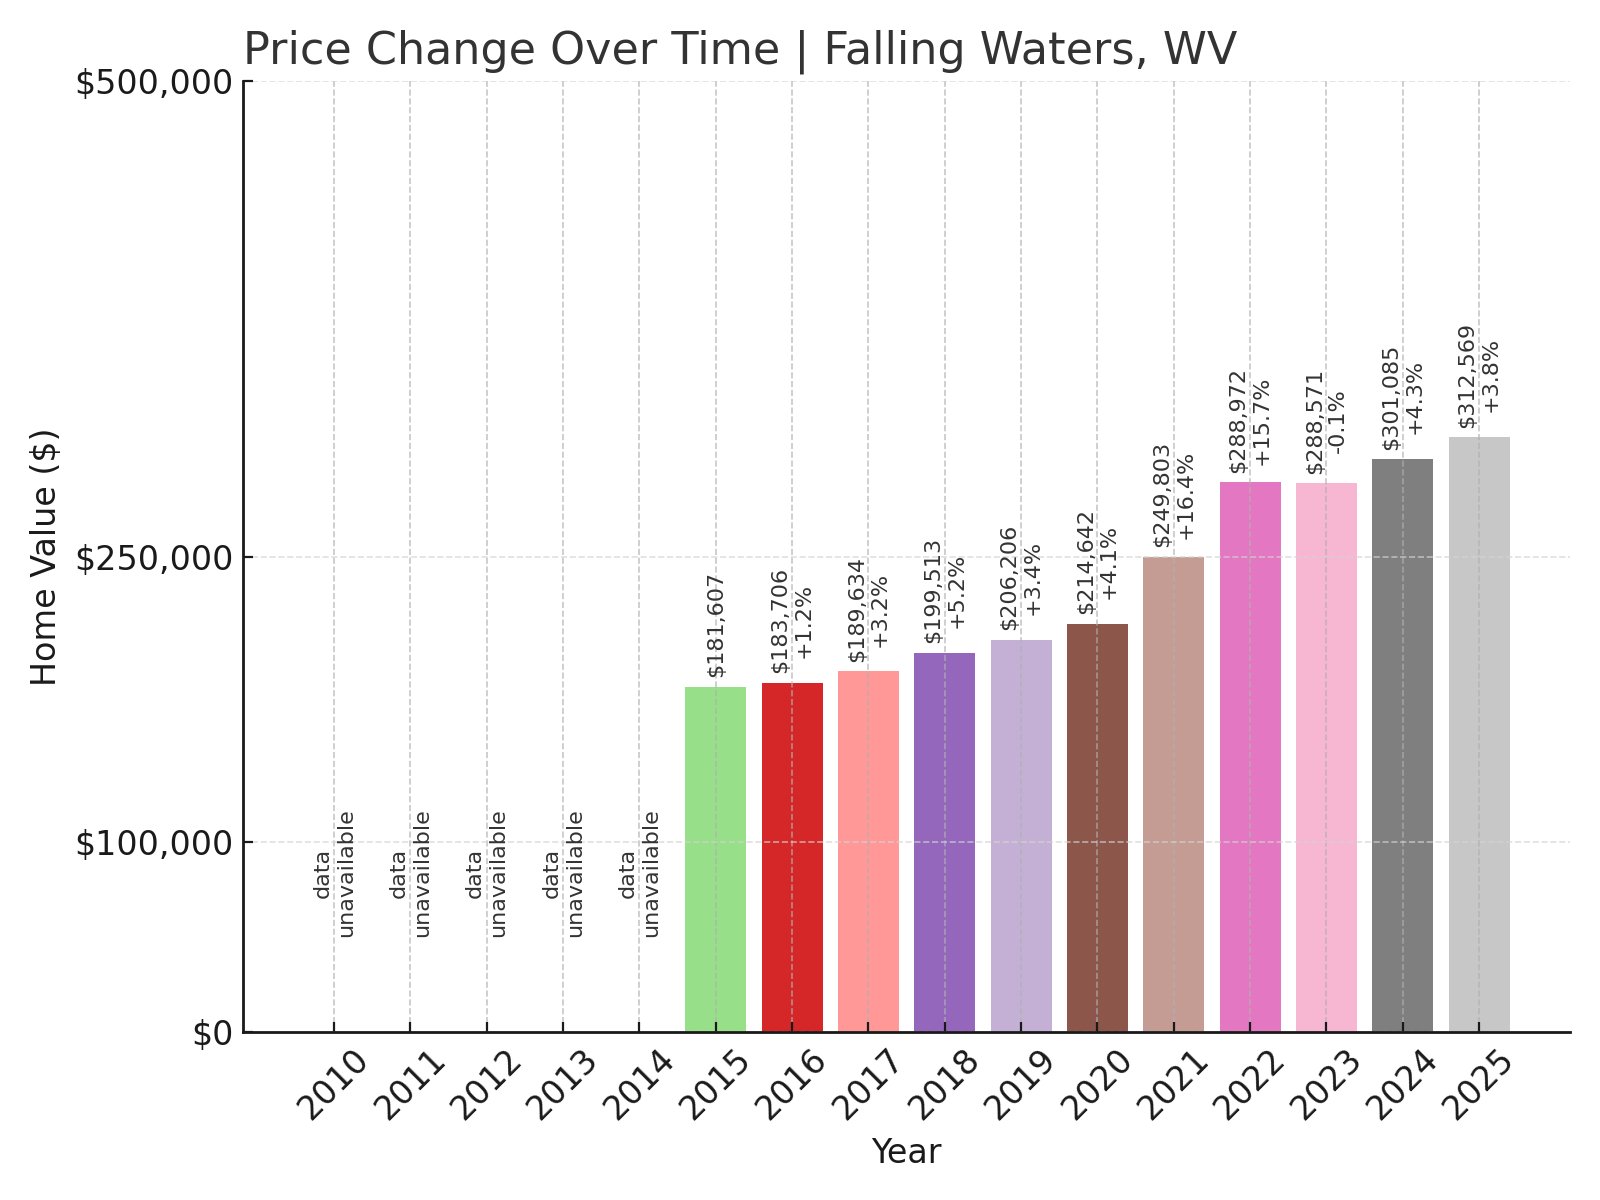
- 2015: $181,607
- 2016: $183,706 (+$2,099, +1.16% from previous year)
- 2017: $189,634 (+$5,927, +3.23% from previous year)
- 2018: $199,513 (+$9,880, +5.21% from previous year)
- 2019: $206,206 (+$6,692, +3.35% from previous year)
- 2020: $214,642 (+$8,436, +4.09% from previous year)
- 2021: $249,803 (+$35,162, +16.38% from previous year)
- 2022: $288,972 (+$39,169, +15.68% from previous year)
- 2023: $288,571 (-$401, -0.14% from previous year)
- 2024: $301,085 (+$12,513, +4.34% from previous year)
- 2025: $312,569 (+$11,484, +3.81% from previous year)
Home prices in Falling Waters rose from about $181,000 in 2015 to over $312,000 in 2025, with sharp double-digit increases between 2020 and 2022 followed by steadier growth.
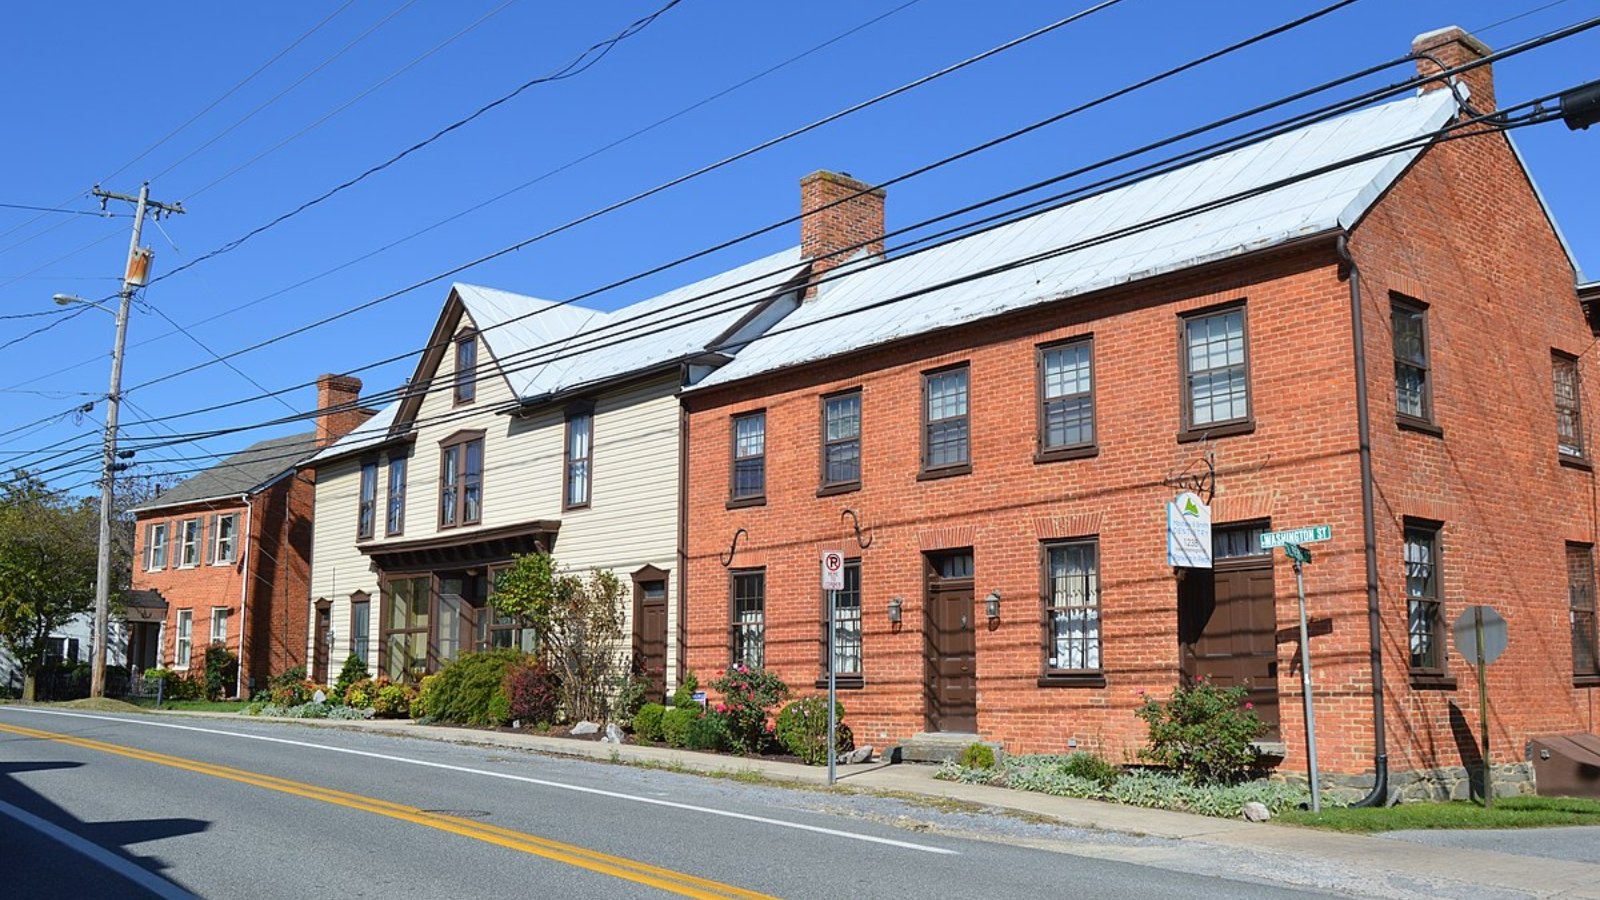
Falling Waters – Eastern Panhandle’s Growing Community
Located along the Potomac River in Berkeley County, Falling Waters offers quick access to I-81 and is popular with commuters to Hagerstown, Frederick, and Washington, D.C. The town’s riverside location provides scenic views and recreational opportunities like boating and fishing.
Development of new housing communities has increased the local population over the past decade. Residents value its mix of peaceful countryside with the convenience of nearby cities for work and shopping.
Recent home price increases reflect these trends, as buyers continue to seek homes in areas offering both natural beauty and commuter accessibility in West Virginia’s eastern panhandle.
12. Inwood – 101.2% Home Price Increase Since 2015
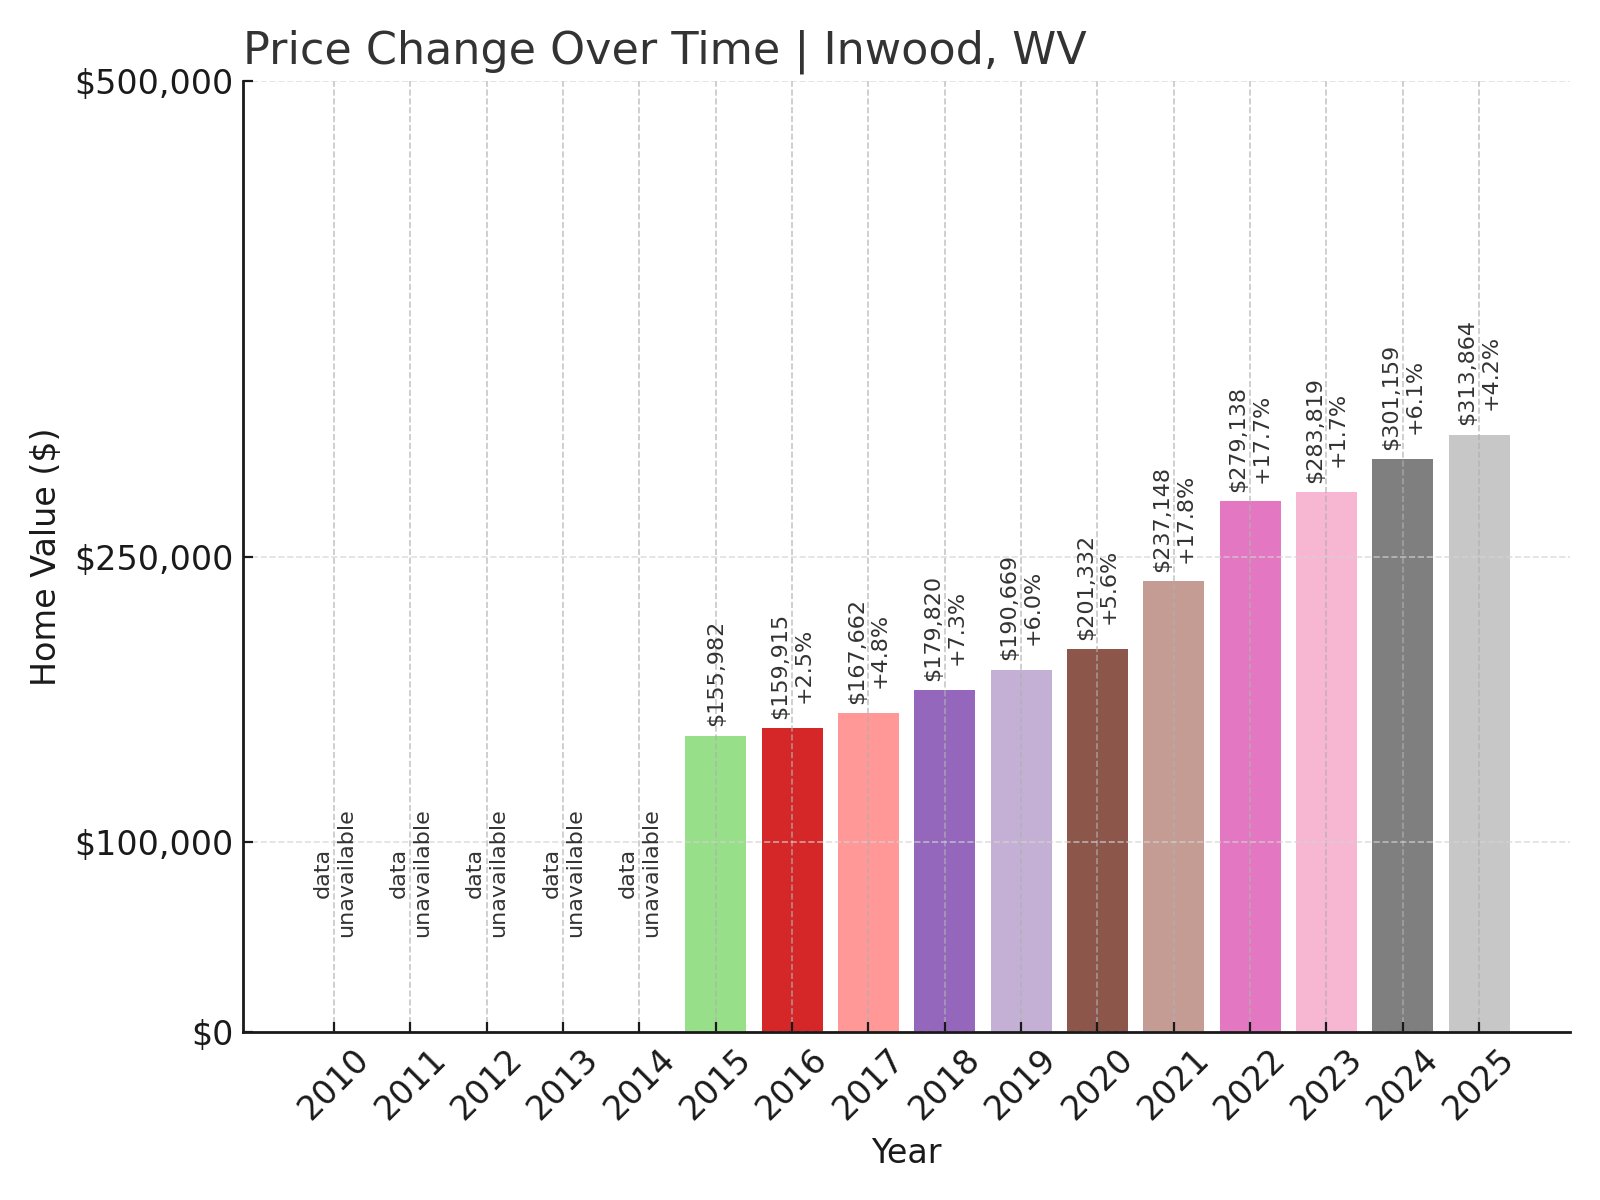
- 2015: $155,982
- 2016: $159,915 (+$3,933, +2.52% from previous year)
- 2017: $167,662 (+$7,747, +4.84% from previous year)
- 2018: $179,820 (+$12,158, +7.25% from previous year)
- 2019: $190,669 (+$10,849, +6.03% from previous year)
- 2020: $201,332 (+$10,663, +5.59% from previous year)
- 2021: $237,148 (+$35,817, +17.79% from previous year)
- 2022: $279,138 (+$41,989, +17.71% from previous year)
- 2023: $283,819 (+$4,681, +1.68% from previous year)
- 2024: $301,159 (+$17,339, +6.11% from previous year)
- 2025: $313,864 (+$12,705, +4.22% from previous year)
Inwood’s home prices doubled in just ten years, starting from about $156,000 in 2015 to over $313,000 in 2025. Major growth occurred in 2021 and 2022 with strong gains continuing recently.
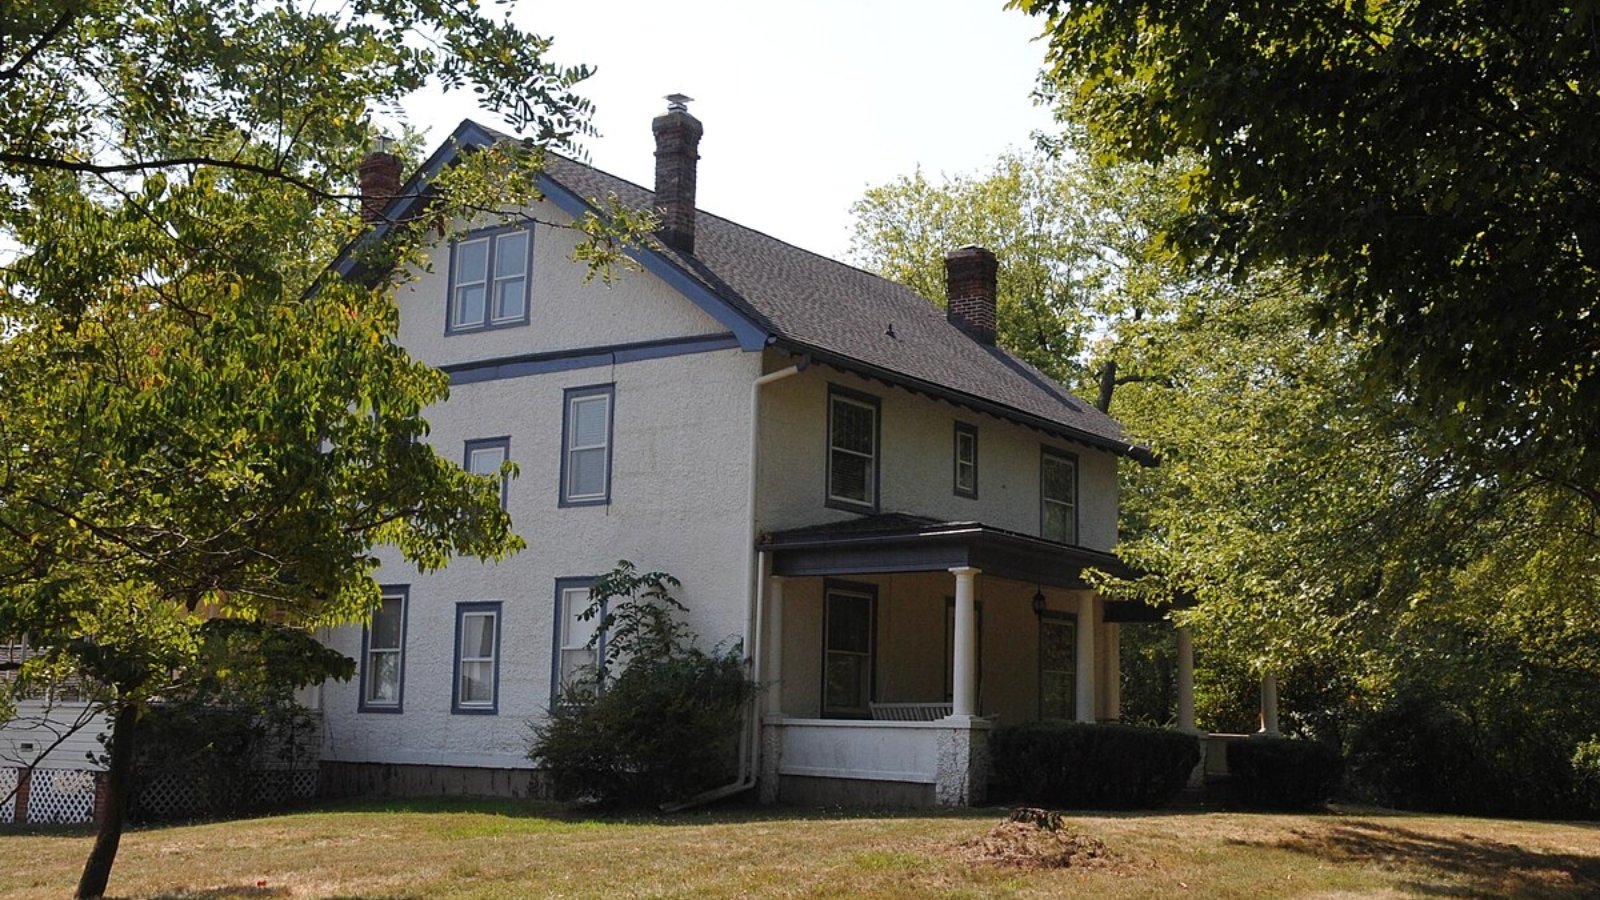
Inwood – Convenient Commuter Town With Rapid Growth
Inwood is situated in Berkeley County along Interstate 81, making it a prime choice for commuters working in Virginia and Maryland. The town has expanded quickly over the past decade, adding new residential communities and retail developments to serve its growing population.
Local amenities include grocery stores, schools, and restaurants, giving residents convenient daily access to essentials without leaving town. Its housing market has benefitted from a steady stream of buyers relocating from more expensive regions.
Strong home price increases reflect Inwood’s transformation from a quiet rural area to a thriving suburban community, offering affordable options while still within commuting distance of major employment hubs.
11. Bunker Hill – 99.4% Home Price Increase Since 2015
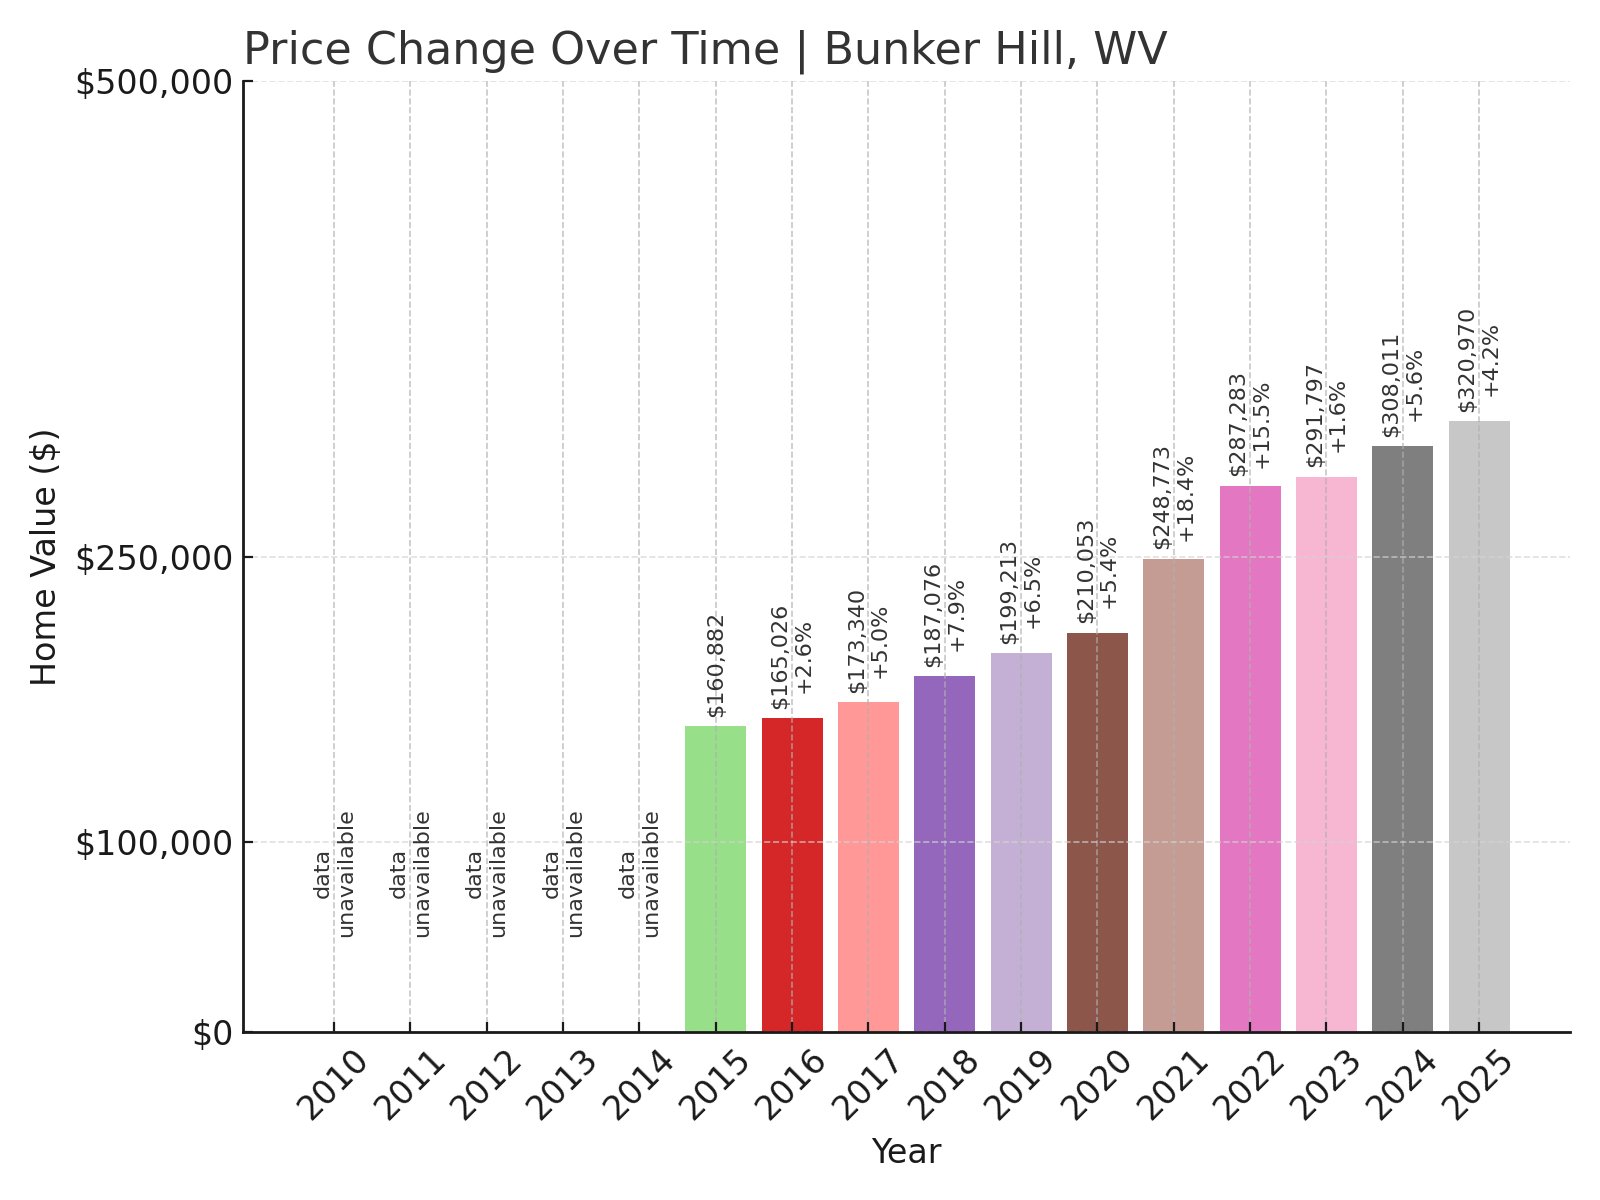
- 2015: $160,882
- 2016: $165,026 (+$4,144, +2.58% from previous year)
- 2017: $173,340 (+$8,314, +5.04% from previous year)
- 2018: $187,076 (+$13,736, +7.92% from previous year)
- 2019: $199,213 (+$12,137, +6.49% from previous year)
- 2020: $210,053 (+$10,840, +5.44% from previous year)
- 2021: $248,773 (+$38,720, +18.43% from previous year)
- 2022: $287,283 (+$38,510, +15.48% from previous year)
- 2023: $291,797 (+$4,513, +1.57% from previous year)
- 2024: $308,011 (+$16,215, +5.56% from previous year)
- 2025: $320,970 (+$12,959, +4.21% from previous year)
Bunker Hill’s home prices nearly doubled over the past decade, climbing from around $161,000 in 2015 to just under $321,000 in 2025. Price growth peaked between 2020 and 2022 with steady gains continuing recently.
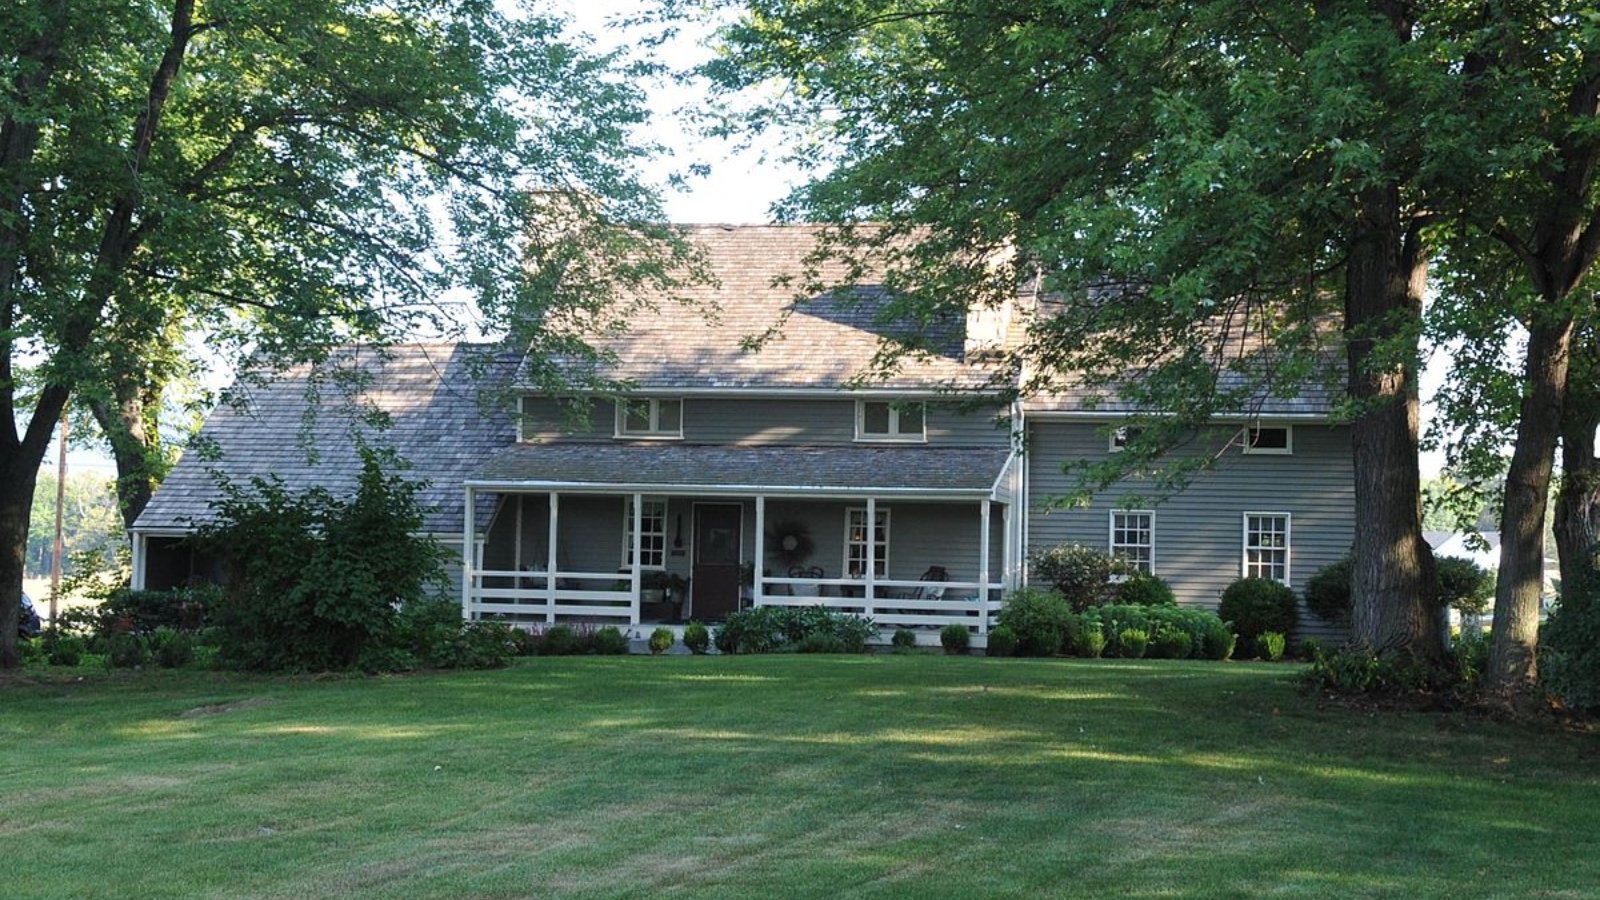
Bunker Hill – Small Town Charm With Easy Access
Bunker Hill is located in Berkeley County, known for its peaceful neighborhoods and quick access to Interstate 81. This makes it a popular choice for commuters working in Winchester, Hagerstown, or Northern Virginia.
The town’s history dates back to colonial times, and it retains a rural character while offering new housing developments that meet the needs of families seeking affordability near employment centers.
Home price increases reflect Bunker Hill’s growing role as a suburban community. Buyers value its quiet setting combined with proximity to schools, shopping centers, and regional job markets.
10. Capon Bridge – 87.4% Home Price Increase Since 2010
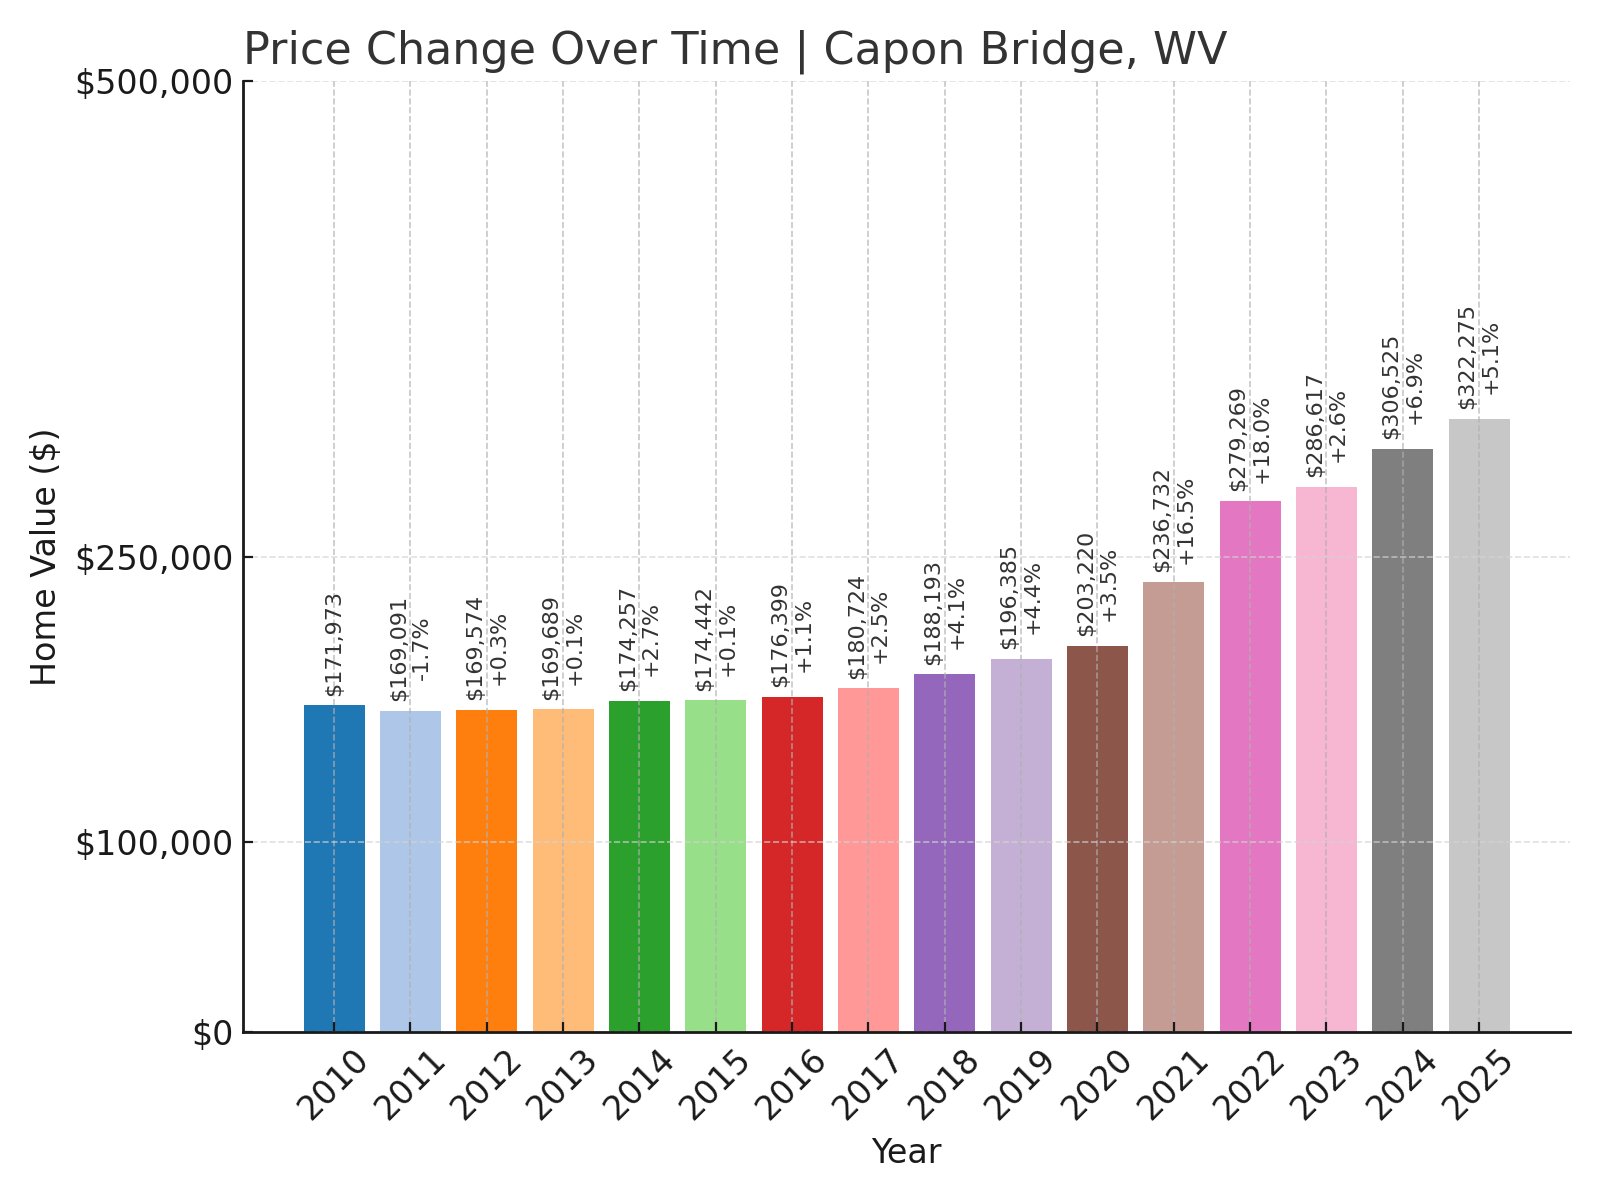
- 2010: $171,973
- 2011: $169,091 (-$2,882, -1.68% from previous year)
- 2012: $169,574 (+$483, +0.29% from previous year)
- 2013: $169,689 (+$115, +0.07% from previous year)
- 2014: $174,257 (+$4,568, +2.69% from previous year)
- 2015: $174,442 (+$185, +0.11% from previous year)
- 2016: $176,399 (+$1,957, +1.12% from previous year)
- 2017: $180,724 (+$4,325, +2.45% from previous year)
- 2018: $188,193 (+$7,468, +4.13% from previous year)
- 2019: $196,385 (+$8,192, +4.35% from previous year)
- 2020: $203,220 (+$6,836, +3.48% from previous year)
- 2021: $236,732 (+$33,511, +16.49% from previous year)
- 2022: $279,269 (+$42,538, +17.97% from previous year)
- 2023: $286,617 (+$7,348, +2.63% from previous year)
- 2024: $306,525 (+$19,908, +6.95% from previous year)
- 2025: $322,275 (+$15,750, +5.14% from previous year)
Capon Bridge’s home prices grew from about $172,000 in 2010 to over $322,000 in 2025. The most significant increases came after 2020, with strong double-digit gains in 2021 and 2022.
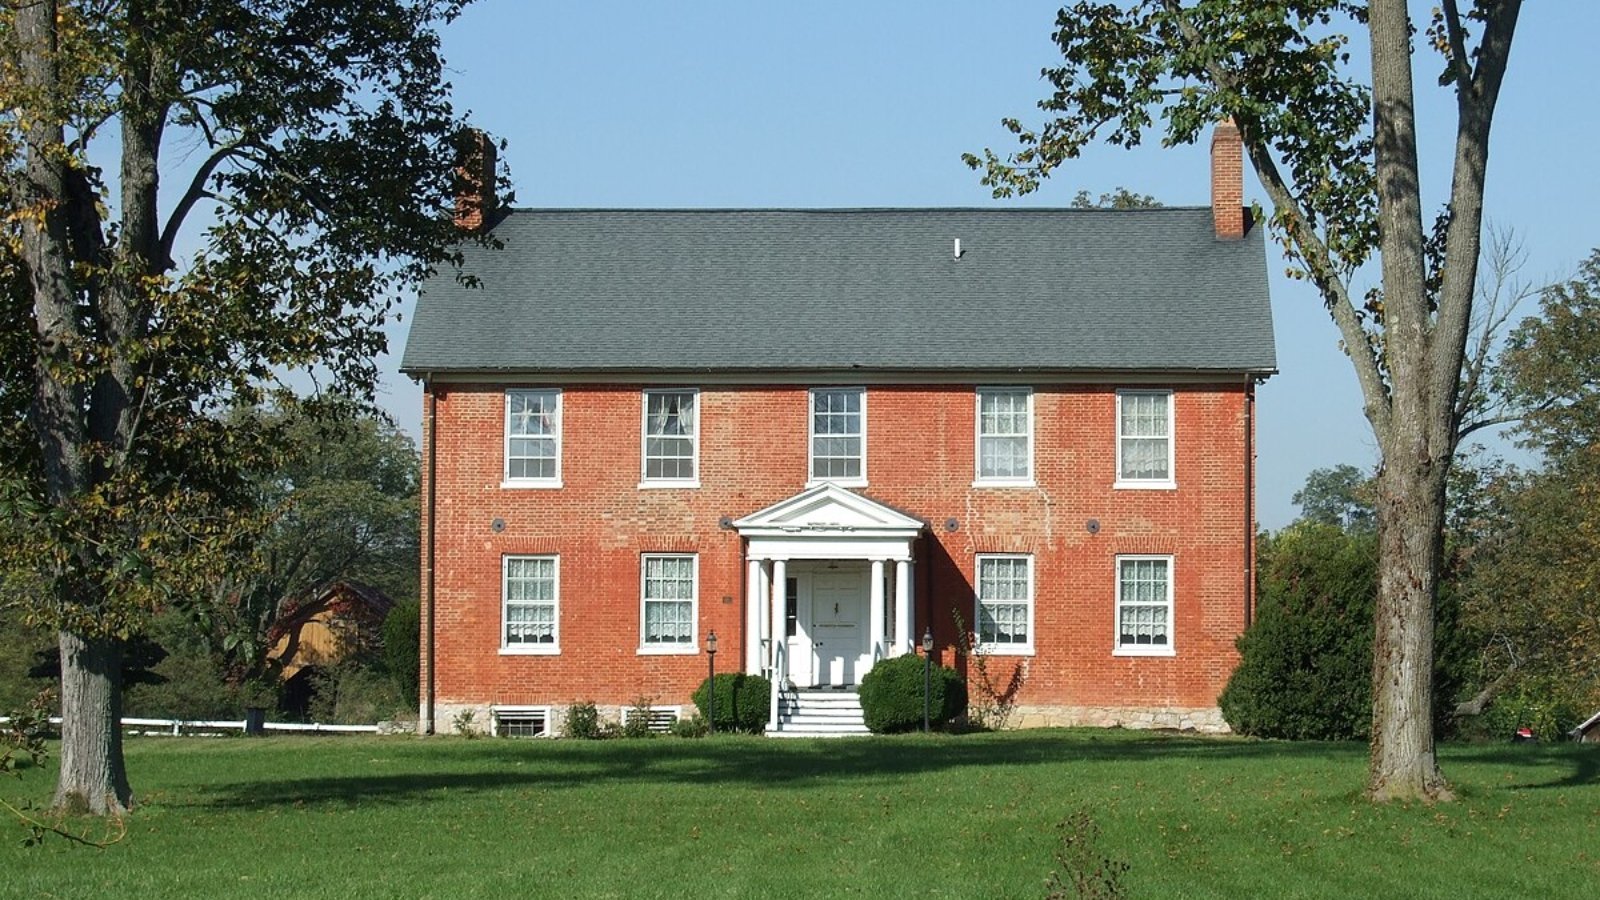
Capon Bridge – Gateway to Outdoor Adventures
Located in Hampshire County, Capon Bridge sits along U.S. Route 50 near the Virginia border. Its name comes from its historic bridge over the Cacapon River, an area known for fishing and kayaking.
Residents enjoy a small-town atmosphere with easy drives to Winchester for work and shopping. The surrounding landscape offers forested hills, farms, and scenic drives, making it attractive to retirees and those wanting a quieter pace of life.
Price increases in recent years reflect rising demand for homes in rural areas that remain accessible to larger cities, a trend seen across West Virginia’s eastern edge.
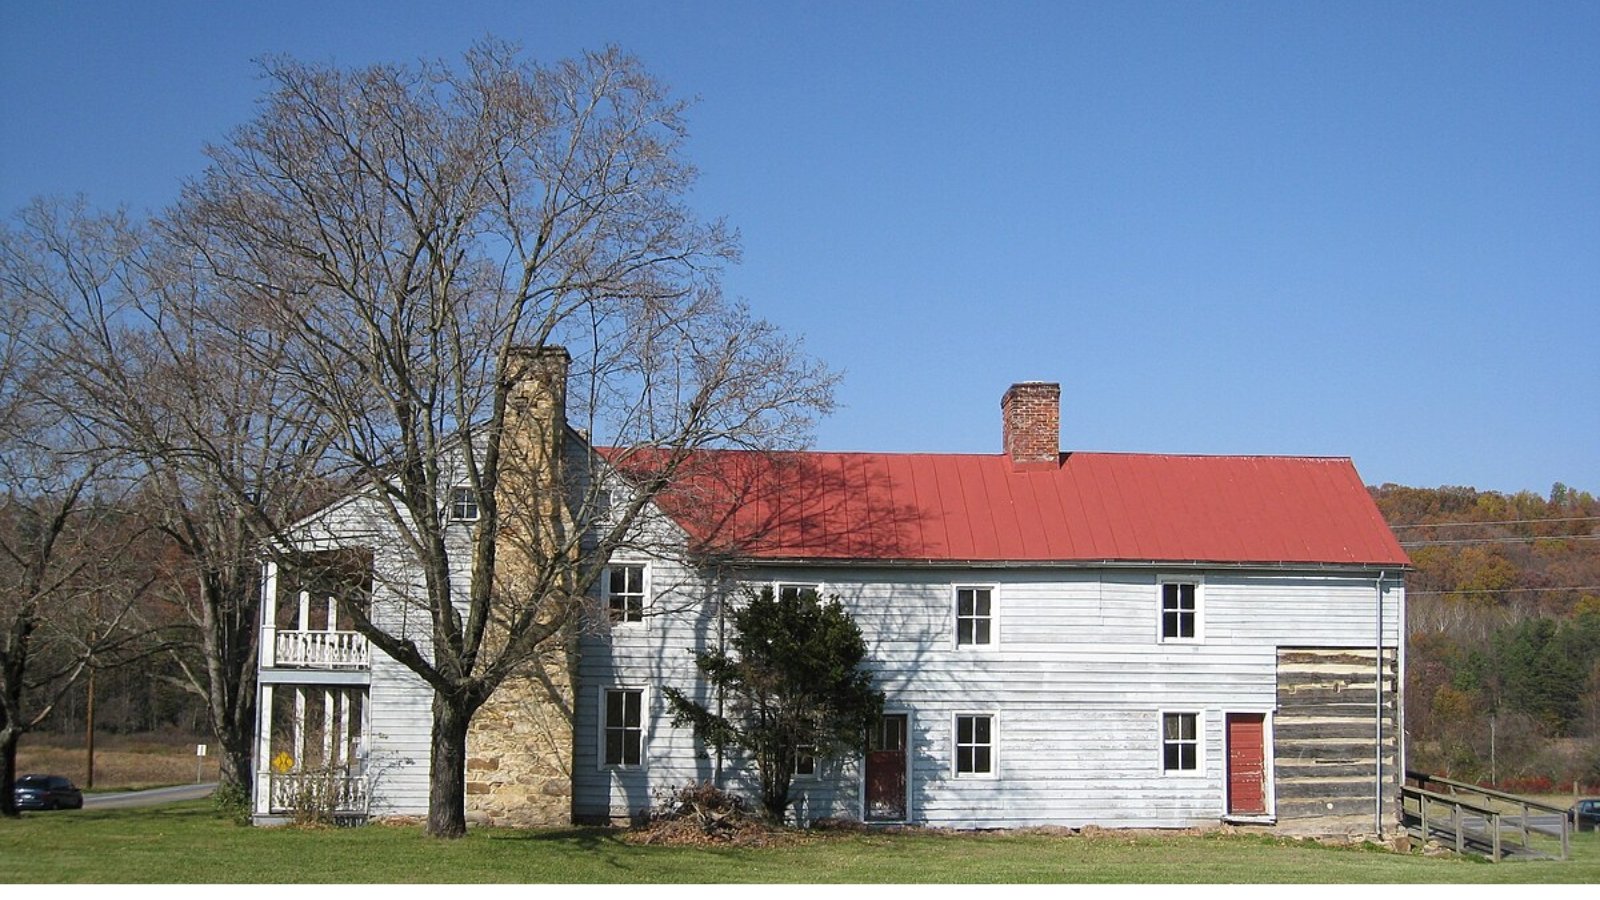
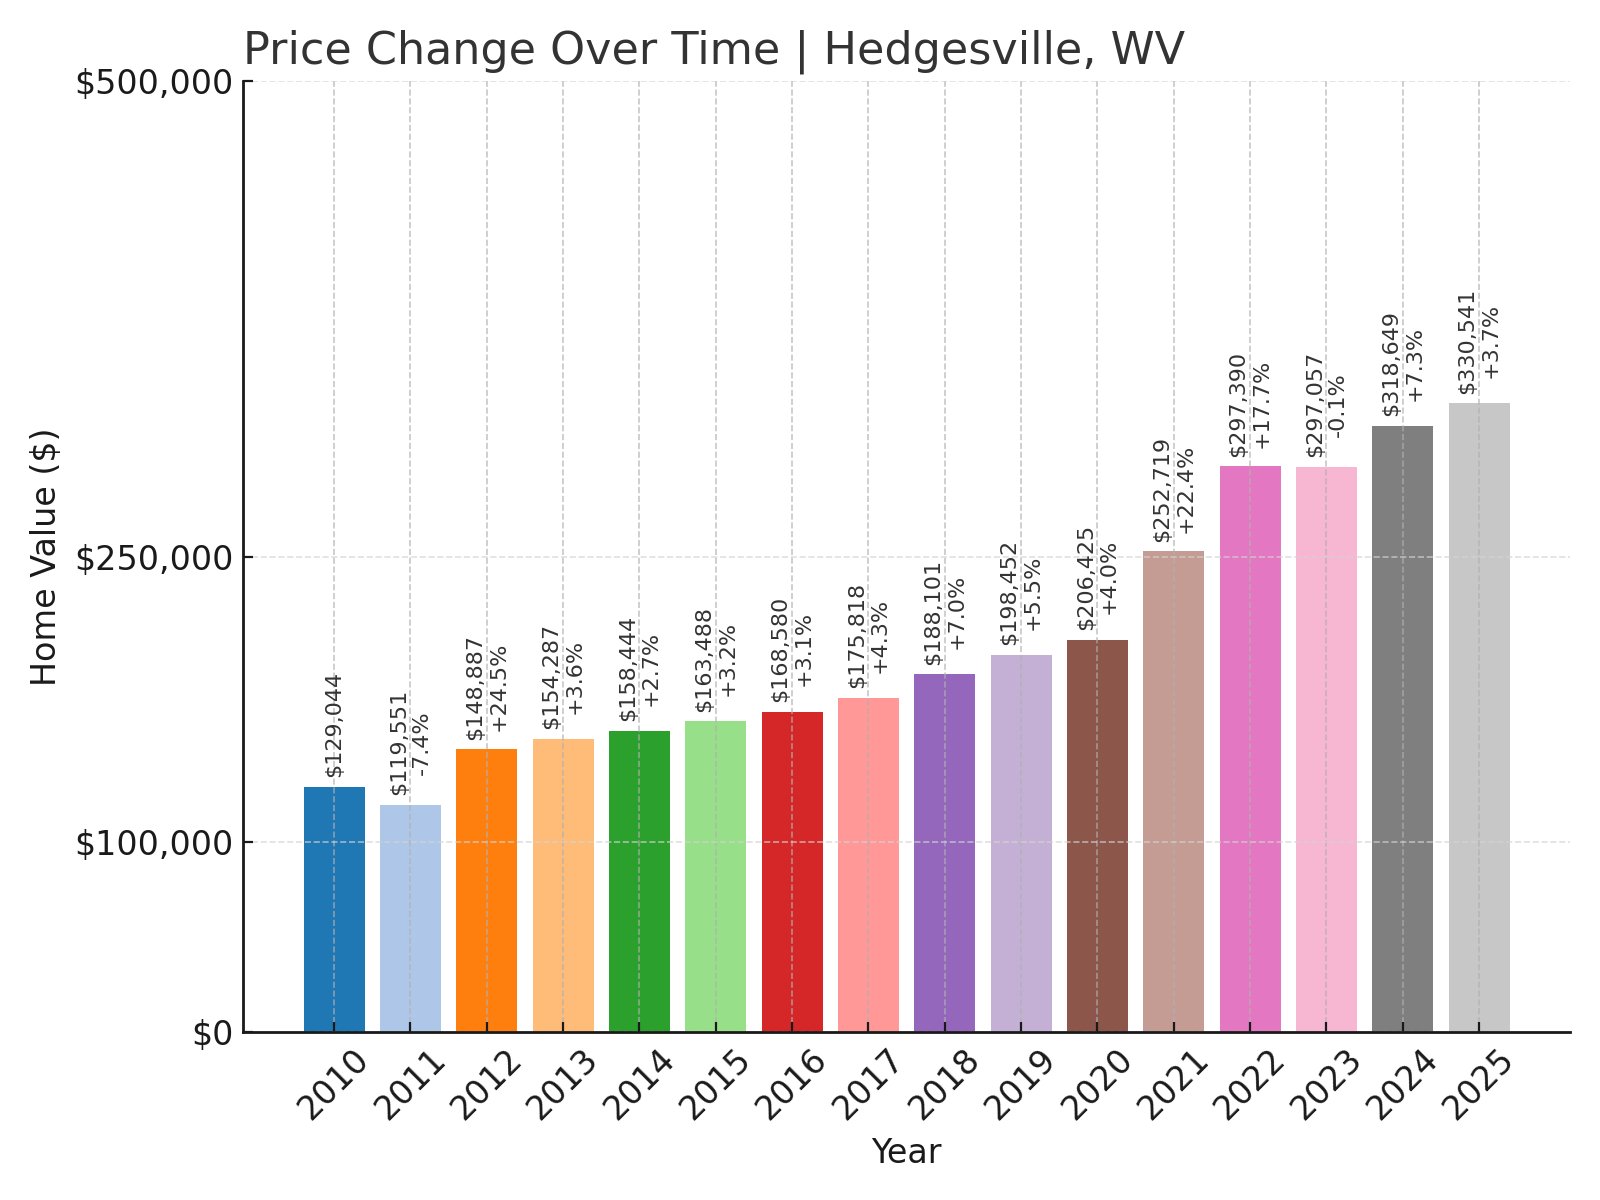
9. Hedgesville – 156.1% Home Price Increase Since 2010
🔥 Would you like to save this?
- 2010: $129,044
- 2011: $119,551 (-$9,493, -7.36% from previous year)
- 2012: $148,887 (+$29,337, +24.54% from previous year)
- 2013: $154,287 (+$5,400, +3.63% from previous year)
- 2014: $158,444 (+$4,157, +2.69% from previous year)
- 2015: $163,488 (+$5,044, +3.18% from previous year)
- 2016: $168,580 (+$5,092, +3.11% from previous year)
- 2017: $175,818 (+$7,238, +4.29% from previous year)
- 2018: $188,101 (+$12,282, +6.99% from previous year)
- 2019: $198,452 (+$10,352, +5.50% from previous year)
- 2020: $206,425 (+$7,973, +4.02% from previous year)
- 2021: $252,719 (+$46,294, +22.43% from previous year)
- 2022: $297,390 (+$44,671, +17.68% from previous year)
- 2023: $297,057 (-$333, -0.11% from previous year)
- 2024: $318,649 (+$21,592, +7.27% from previous year)
- 2025: $330,541 (+$11,892, +3.73% from previous year)
Hedgesville’s home prices more than doubled since 2010, growing from about $129,000 to over $330,000 in 2025. Its strongest increases occurred between 2020 and 2022, with steady growth continuing.
Hedgesville – Historic Town With Modern Growth
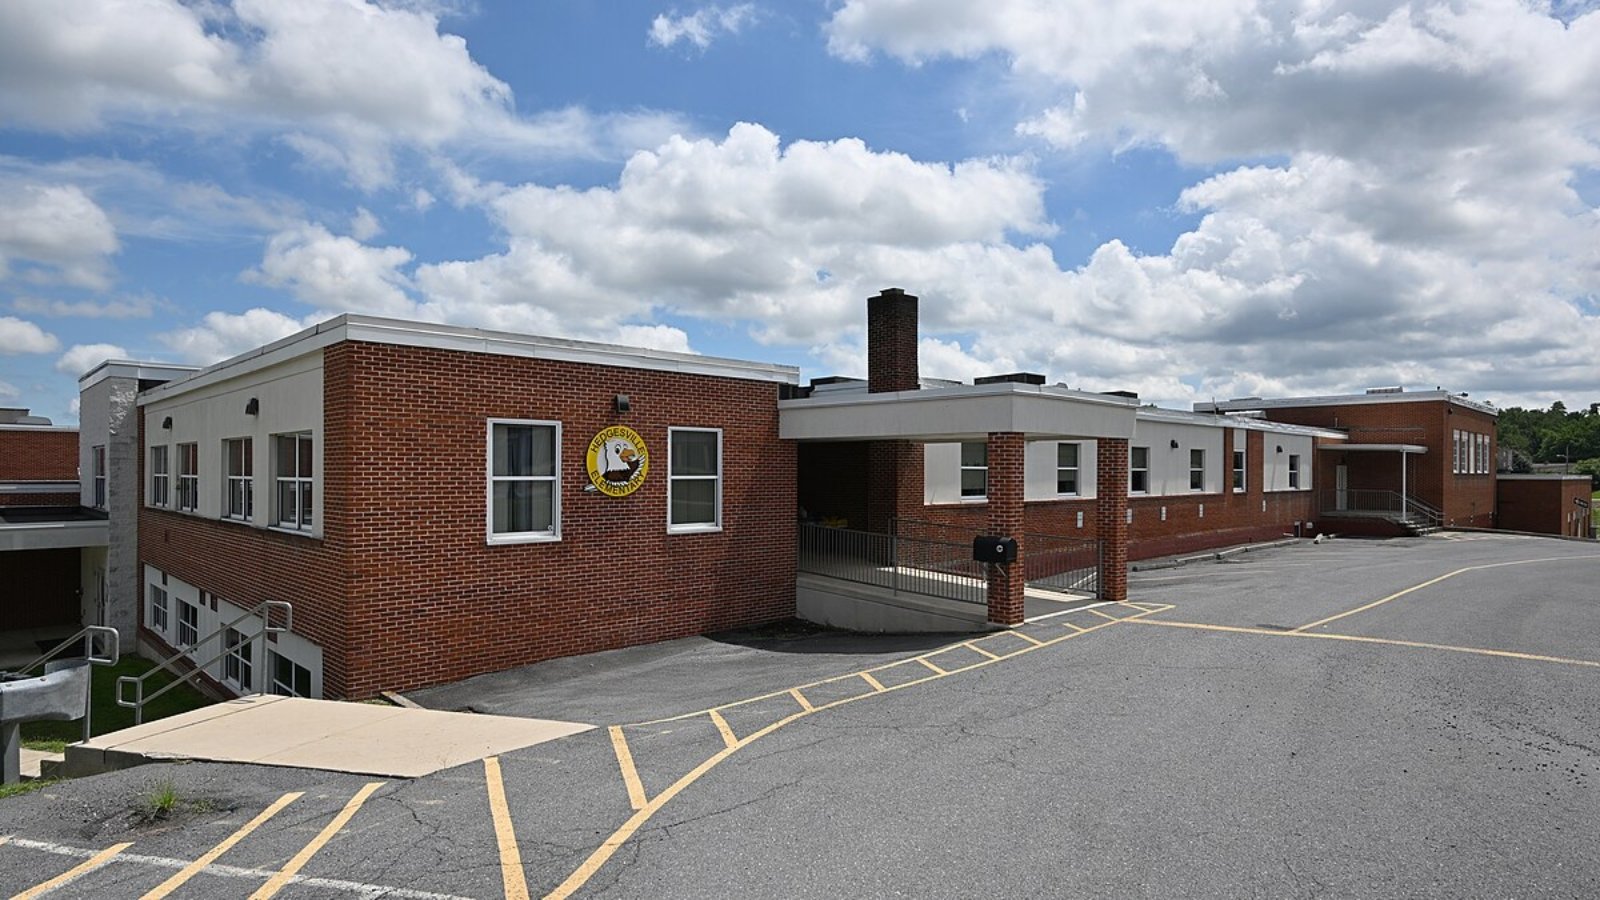
Hedgesville is located in Berkeley County and dates back to the early 1800s. Its historic district is listed on the National Register of Historic Places, preserving homes and structures from its founding era.
Today, new subdivisions surround the historic core, providing housing for families and commuters working in nearby Martinsburg, Winchester, and beyond. Residents appreciate the combination of history, small-town community, and modern conveniences.
The town’s housing market reflects a growing demand for areas with character and commuter access, helping drive its rapid home price increases over the past decade.
8. Davis – 69.9% Home Price Increase Since 2010
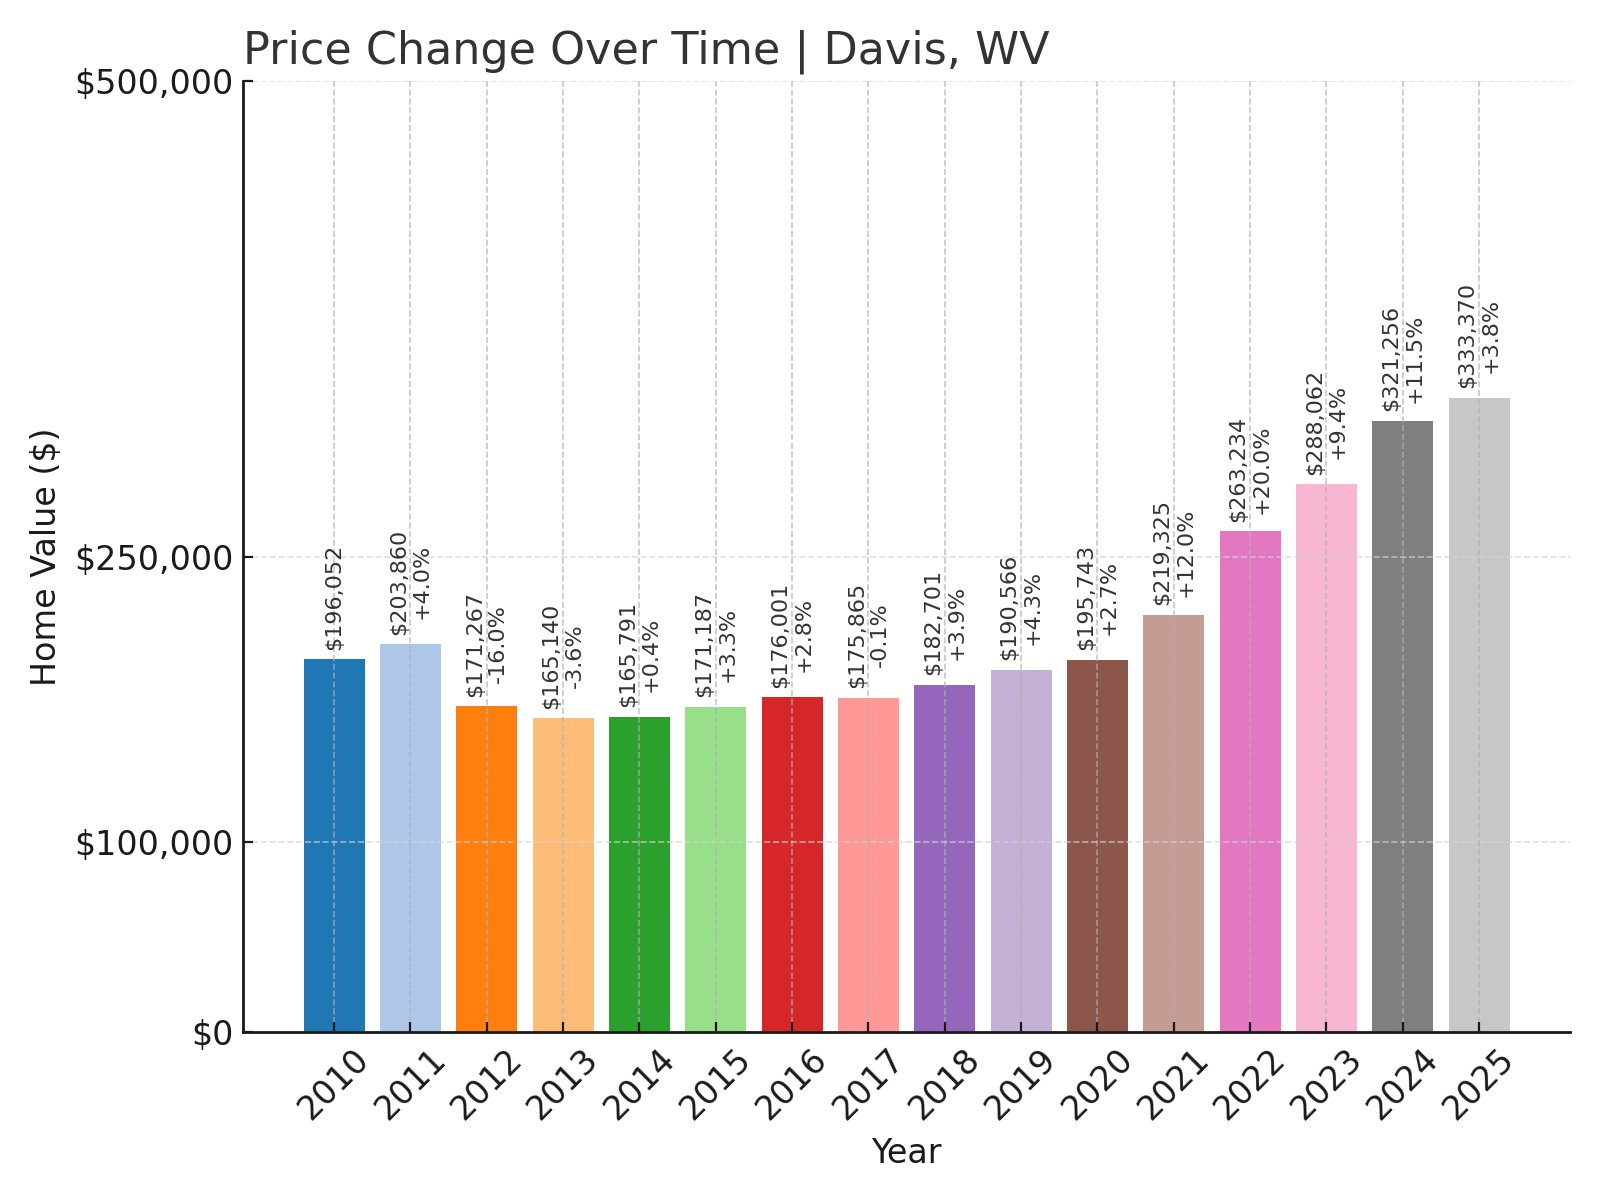
- 2010: $196,052
- 2011: $203,860 (+$7,808, +3.98% from previous year)
- 2012: $171,267 (-$32,594, -15.99% from previous year)
- 2013: $165,140 (-$6,126, -3.58% from previous year)
- 2014: $165,791 (+$651, +0.39% from previous year)
- 2015: $171,187 (+$5,395, +3.25% from previous year)
- 2016: $176,001 (+$4,814, +2.81% from previous year)
- 2017: $175,865 (-$136, -0.08% from previous year)
- 2018: $182,701 (+$6,836, +3.89% from previous year)
- 2019: $190,566 (+$7,865, +4.30% from previous year)
- 2020: $195,743 (+$5,177, +2.72% from previous year)
- 2021: $219,325 (+$23,582, +12.05% from previous year)
- 2022: $263,234 (+$43,909, +20.02% from previous year)
- 2023: $288,062 (+$24,828, +9.43% from previous year)
- 2024: $321,256 (+$33,193, +11.52% from previous year)
- 2025: $333,370 (+$12,115, +3.77% from previous year)
Davis’s home prices rose from about $196,000 in 2010 to over $333,000 in 2025. Significant growth occurred between 2020 and 2024, driven by increasing interest in mountain towns with outdoor recreation opportunities.
Davis – Mountain Town Popular With Outdoor Enthusiasts
Davis is located in Tucker County and sits near Canaan Valley and Blackwater Falls State Park, making it a destination for hiking, skiing, and nature tourism. Its downtown offers a mix of cafes, craft breweries, and art shops catering to locals and visitors alike.
The town has seen a steady influx of buyers looking for vacation homes or permanent residences with access to year-round recreation. This demand has driven home prices upward, particularly since 2020 as outdoor living grew in popularity.
Davis’s unique blend of mountain scenery, small-town community, and recreation-based economy continues to attract buyers seeking both lifestyle and investment potential in West Virginia.
7. Gerrardstown – 110.7% Home Price Increase Since 2011
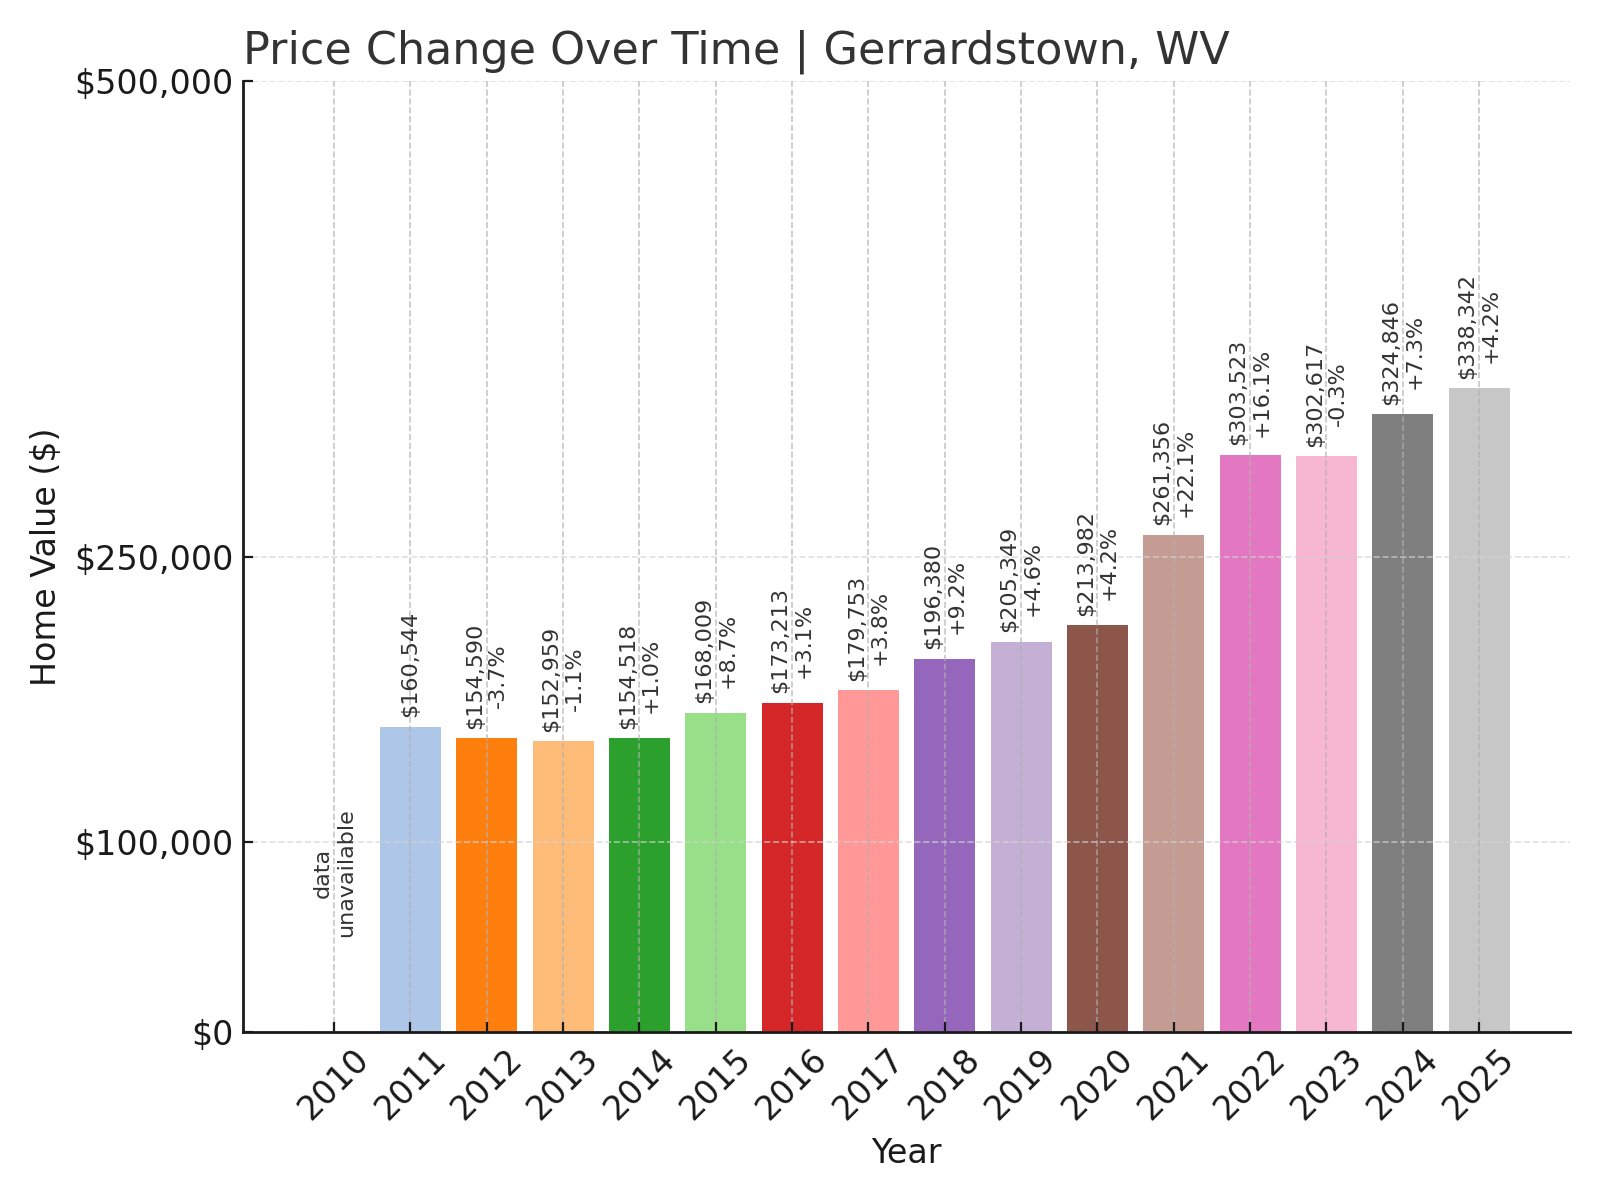
- 2011: $160,544
- 2012: $154,590 (-$5,954, -3.71% from previous year)
- 2013: $152,959 (-$1,631, -1.05% from previous year)
- 2014: $154,518 (+$1,559, +1.02% from previous year)
- 2015: $168,009 (+$13,491, +8.73% from previous year)
- 2016: $173,213 (+$5,204, +3.10% from previous year)
- 2017: $179,753 (+$6,540, +3.78% from previous year)
- 2018: $196,380 (+$16,627, +9.25% from previous year)
- 2019: $205,349 (+$8,969, +4.57% from previous year)
- 2020: $213,982 (+$8,633, +4.20% from previous year)
- 2021: $261,356 (+$47,375, +22.14% from previous year)
- 2022: $303,523 (+$42,167, +16.13% from previous year)
- 2023: $302,617 (-$907, -0.30% from previous year)
- 2024: $324,846 (+$22,229, +7.35% from previous year)
- 2025: $338,342 (+$13,496, +4.15% from previous year)
Home prices in Gerrardstown more than doubled since 2011, starting around $161,000 and reaching over $338,000 in 2025. The most significant increases occurred between 2020 and 2022.
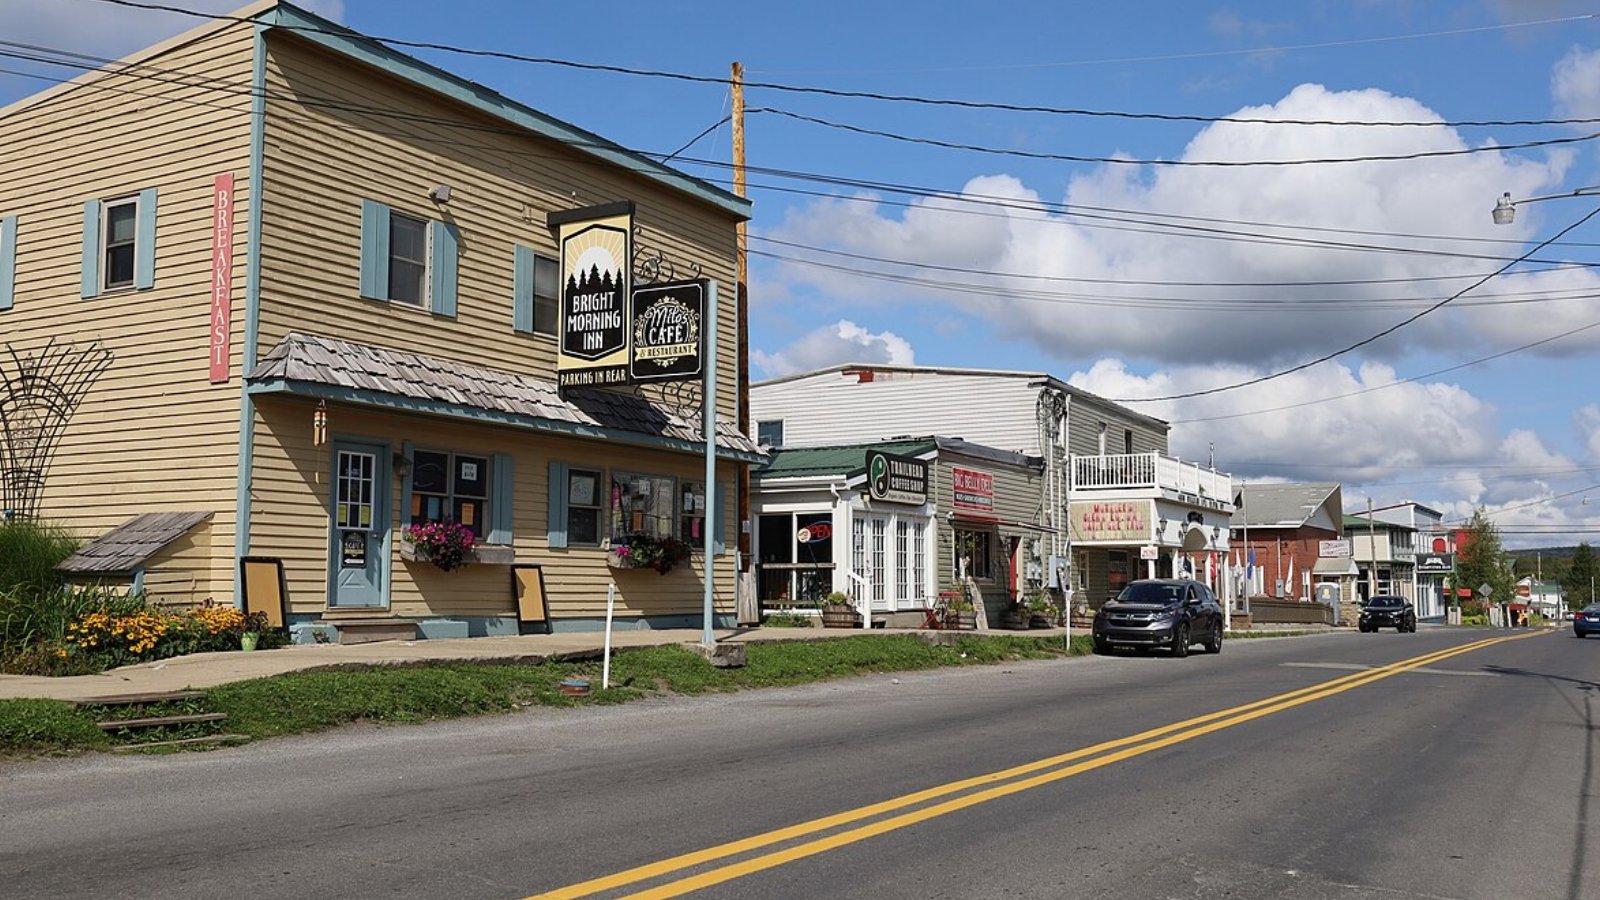
Gerrardstown – Rural Community With Historic Roots
Gerrardstown is located in Berkeley County and was settled in the mid-1700s. The town retains its historic charm while serving as a growing residential area for commuters to Martinsburg and Winchester.
Residents enjoy quiet country roads, historic churches, and local markets. Its rural setting combined with proximity to employment centers makes it popular among families and retirees alike.
Home price increases in recent years reflect demand for homes with land and small-town community living, particularly as buyers look for affordable options within reach of larger cities.
6. Kearneysville – 117.8% Home Price Increase Since 2010
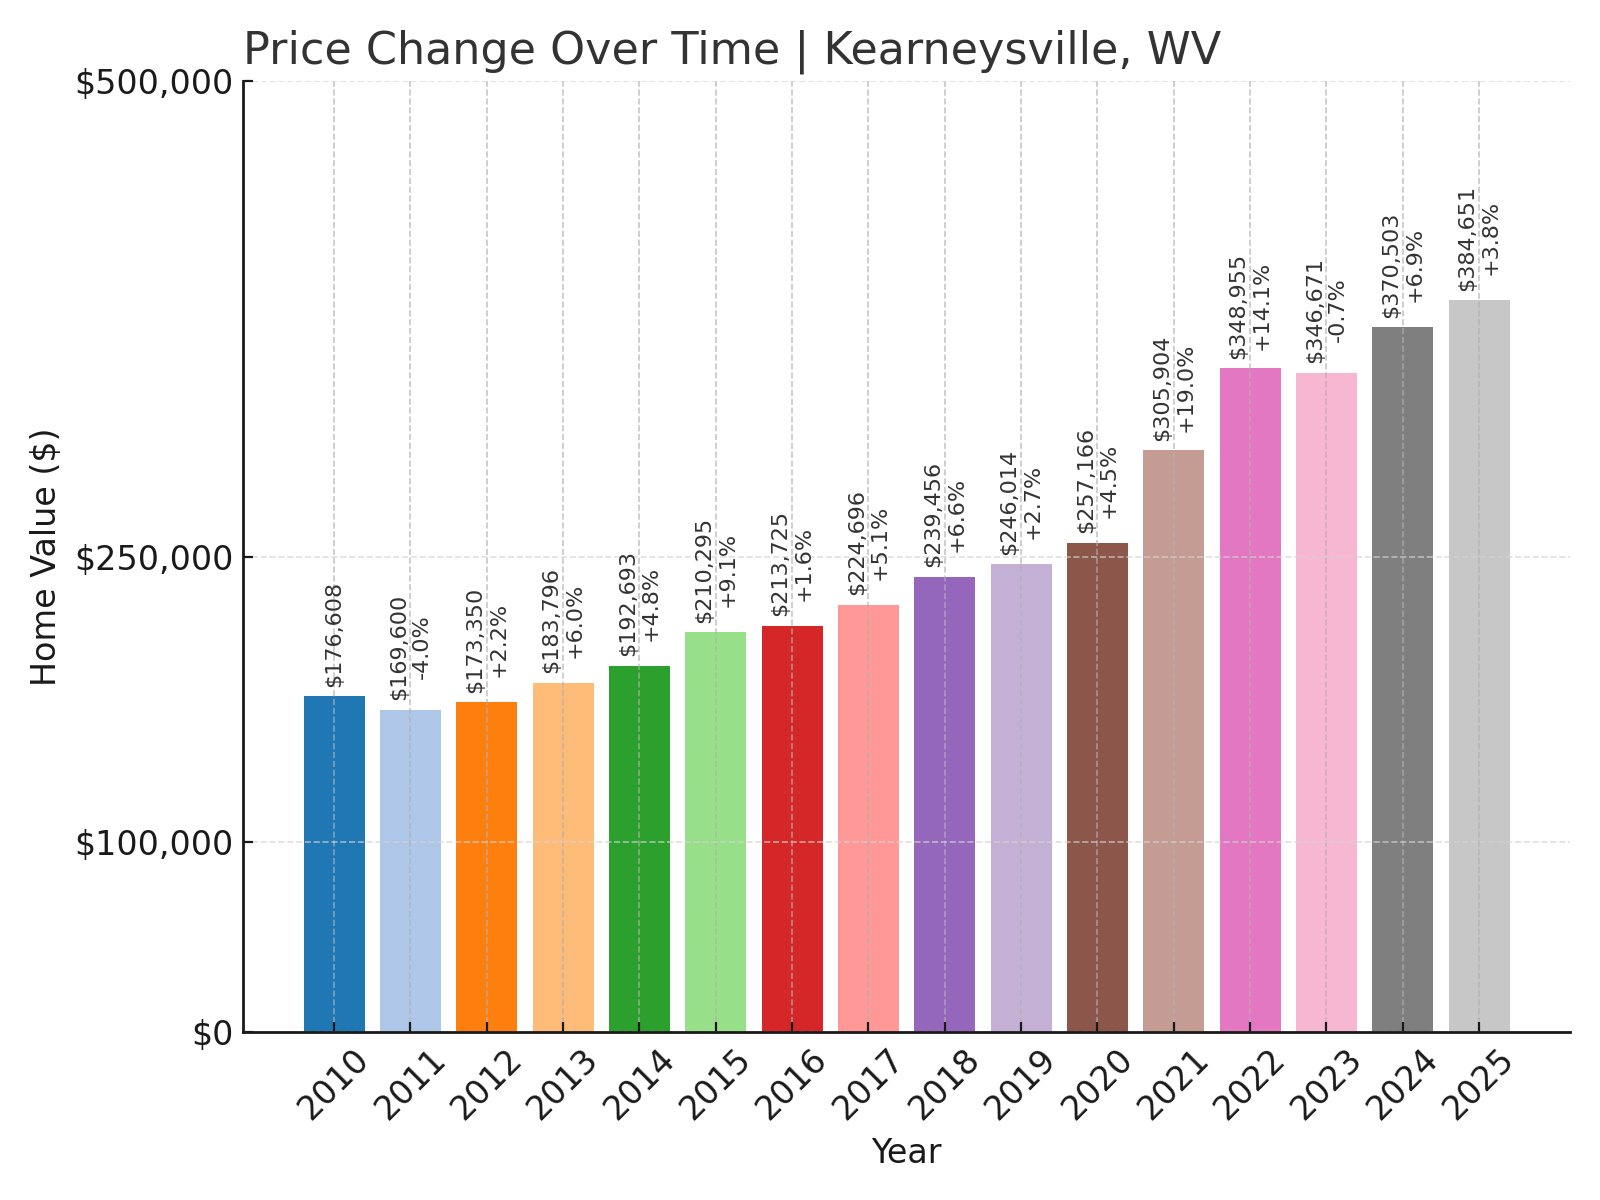
- 2010: $176,608
- 2011: $169,600 (-$7,008, -3.97% from previous year)
- 2012: $173,350 (+$3,749, +2.21% from previous year)
- 2013: $183,796 (+$10,446, +6.03% from previous year)
- 2014: $192,693 (+$8,897, +4.84% from previous year)
- 2015: $210,295 (+$17,603, +9.14% from previous year)
- 2016: $213,725 (+$3,430, +1.63% from previous year)
- 2017: $224,696 (+$10,972, +5.13% from previous year)
- 2018: $239,456 (+$14,760, +6.57% from previous year)
- 2019: $246,014 (+$6,558, +2.74% from previous year)
- 2020: $257,166 (+$11,152, +4.53% from previous year)
- 2021: $305,904 (+$48,738, +18.95% from previous year)
- 2022: $348,955 (+$43,051, +14.07% from previous year)
- 2023: $346,671 (-$2,284, -0.65% from previous year)
- 2024: $370,503 (+$23,832, +6.87% from previous year)
- 2025: $384,651 (+$14,148, +3.82% from previous year)
Kearneysville’s home prices more than doubled since 2010, rising from about $176,000 to nearly $385,000 in 2025. The strongest growth came between 2020 and 2022, reflecting strong buyer demand.
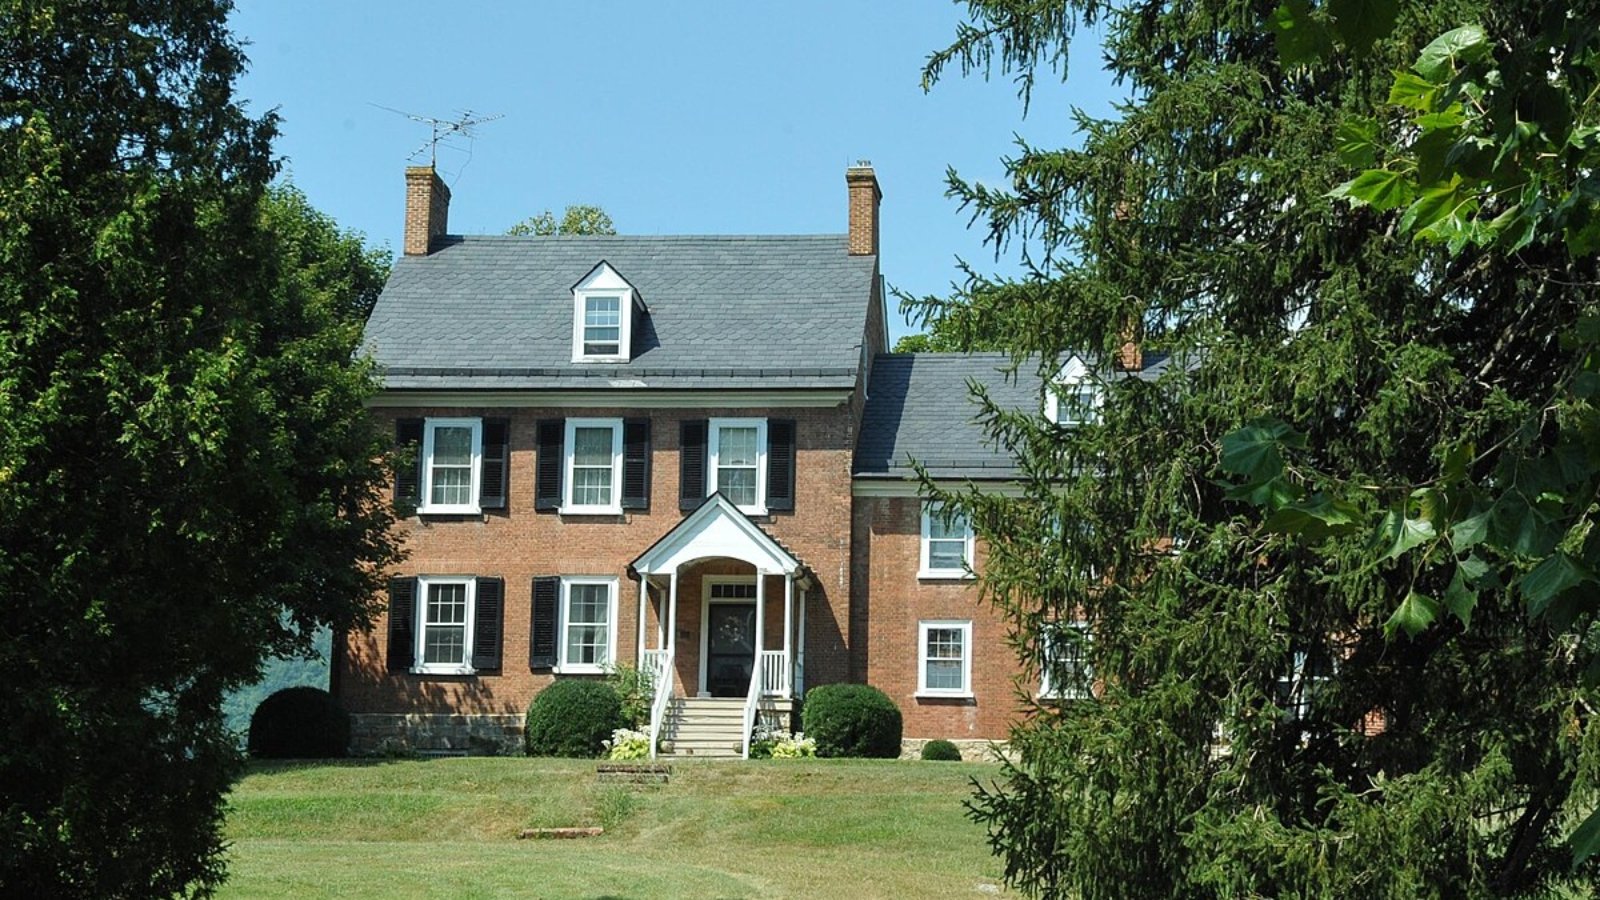
Kearneysville – Rural Farmland Meets Suburban Expansion
Kearneysville, in Jefferson County, sits between Shepherdstown and Martinsburg. Historically an agricultural area, it now includes newer residential developments that attract commuters and families.
The community hosts the USDA Appalachian Fruit Research Station, reflecting its deep ties to farming and science. Its location offers quick access to Route 9 and I-81, making it a strategic choice for those working in nearby cities.
Home price growth reflects its rising popularity as a semi-rural area that offers both peaceful farmland surroundings and commuter convenience to larger employment centers.
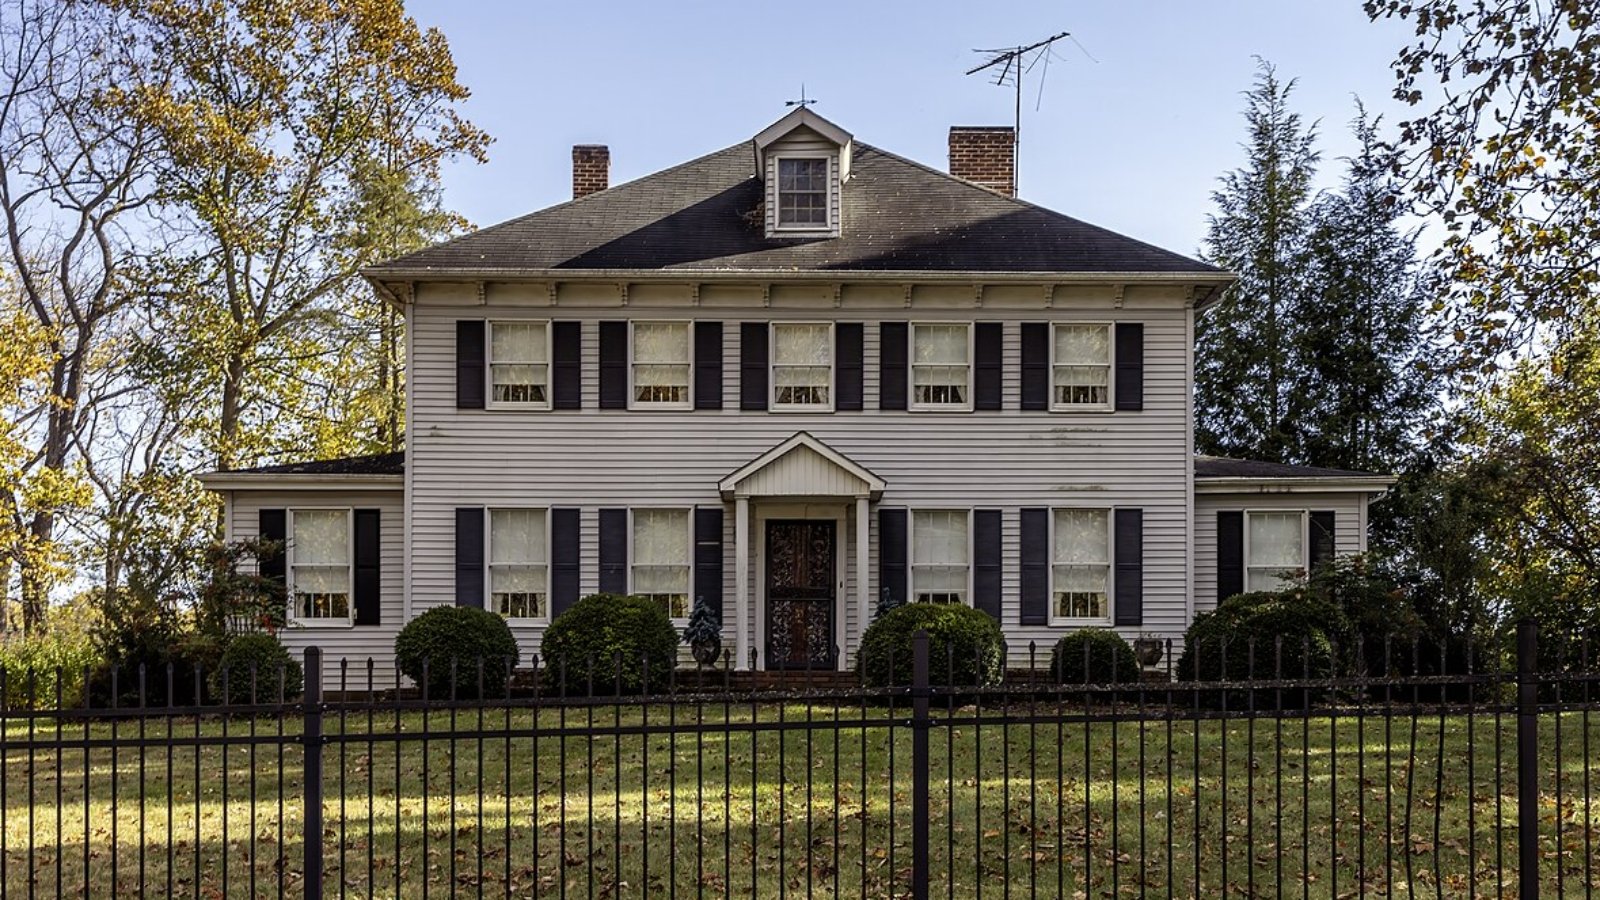
5. Harpers Ferry – 95.0% Home Price Increase Since 2010
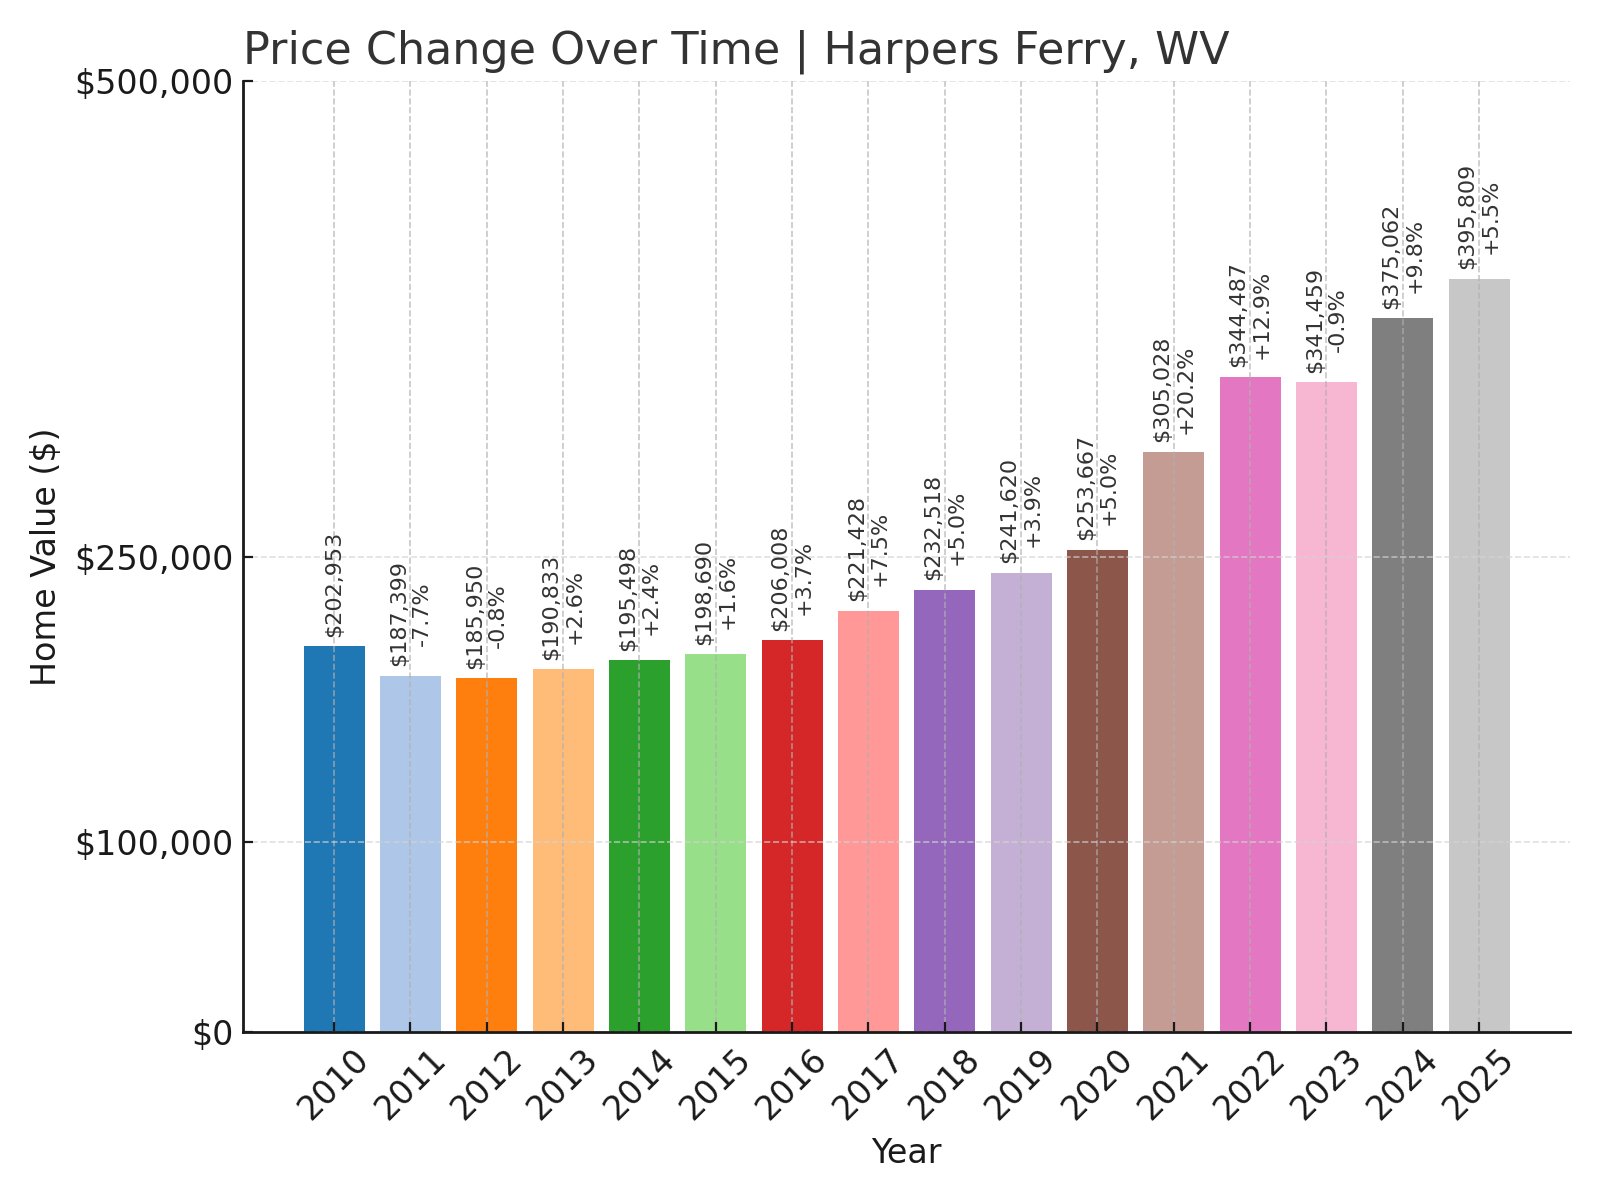
- 2010: $202,953
- 2011: $187,399 (-$15,553, -7.66% from previous year)
- 2012: $185,950 (-$1,450, -0.77% from previous year)
- 2013: $190,833 (+$4,883, +2.63% from previous year)
- 2014: $195,498 (+$4,665, +2.44% from previous year)
- 2015: $198,690 (+$3,192, +1.63% from previous year)
- 2016: $206,008 (+$7,318, +3.68% from previous year)
- 2017: $221,428 (+$15,420, +7.48% from previous year)
- 2018: $232,518 (+$11,091, +5.01% from previous year)
- 2019: $241,620 (+$9,102, +3.91% from previous year)
- 2020: $253,667 (+$12,047, +4.99% from previous year)
- 2021: $305,028 (+$51,362, +20.25% from previous year)
- 2022: $344,487 (+$39,459, +12.94% from previous year)
- 2023: $341,459 (-$3,028, -0.88% from previous year)
- 2024: $375,062 (+$33,603, +9.84% from previous year)
- 2025: $395,809 (+$20,747, +5.53% from previous year)
Harpers Ferry home prices nearly doubled since 2010, increasing from about $203,000 to almost $396,000 in 2025. The sharpest growth came between 2020 and 2022, with steady gains continuing recently.
Harpers Ferry – History and Scenery Drive Market Demand
🔥 Would you like to save this?
Harpers Ferry is a National Historical Park town where West Virginia, Maryland, and Virginia meet. Its rich Civil War history, museums, and shops attract tourists year-round.
The Appalachian Trail passes through, bringing hikers and nature enthusiasts. Its scenic bluffs overlooking the Potomac and Shenandoah rivers add to the town’s appeal for vacationers and permanent residents alike.
Home prices have increased as buyers seek historic homes with character and proximity to Washington, D.C., making Harpers Ferry one of the most sought-after towns in the state.
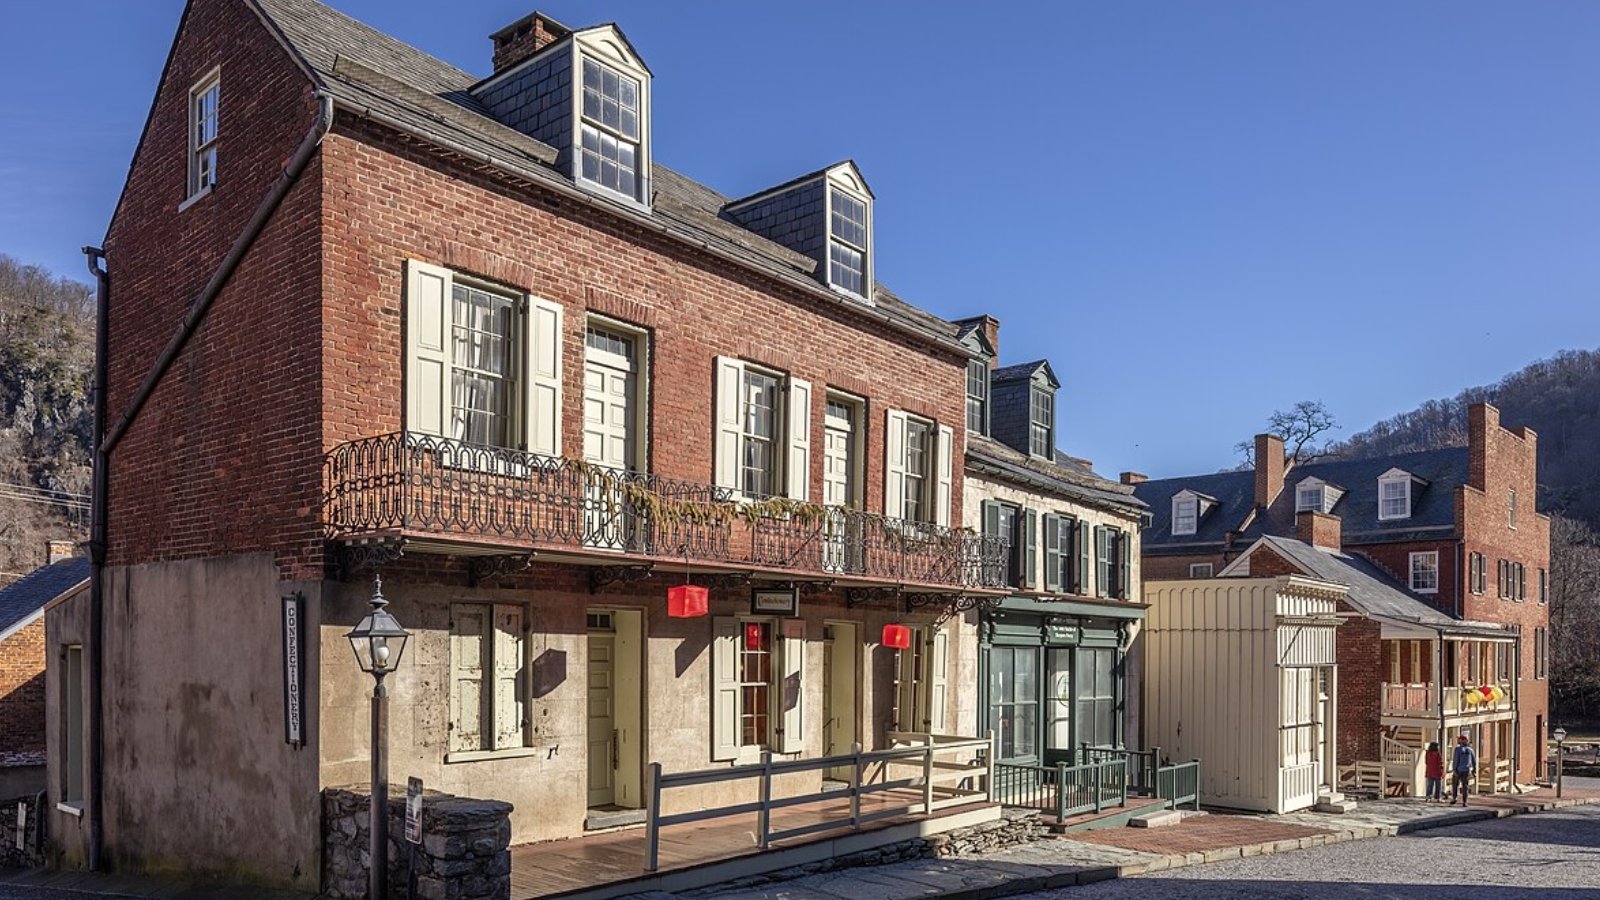
4. Charles Town – 93.0% Home Price Increase Since 2010
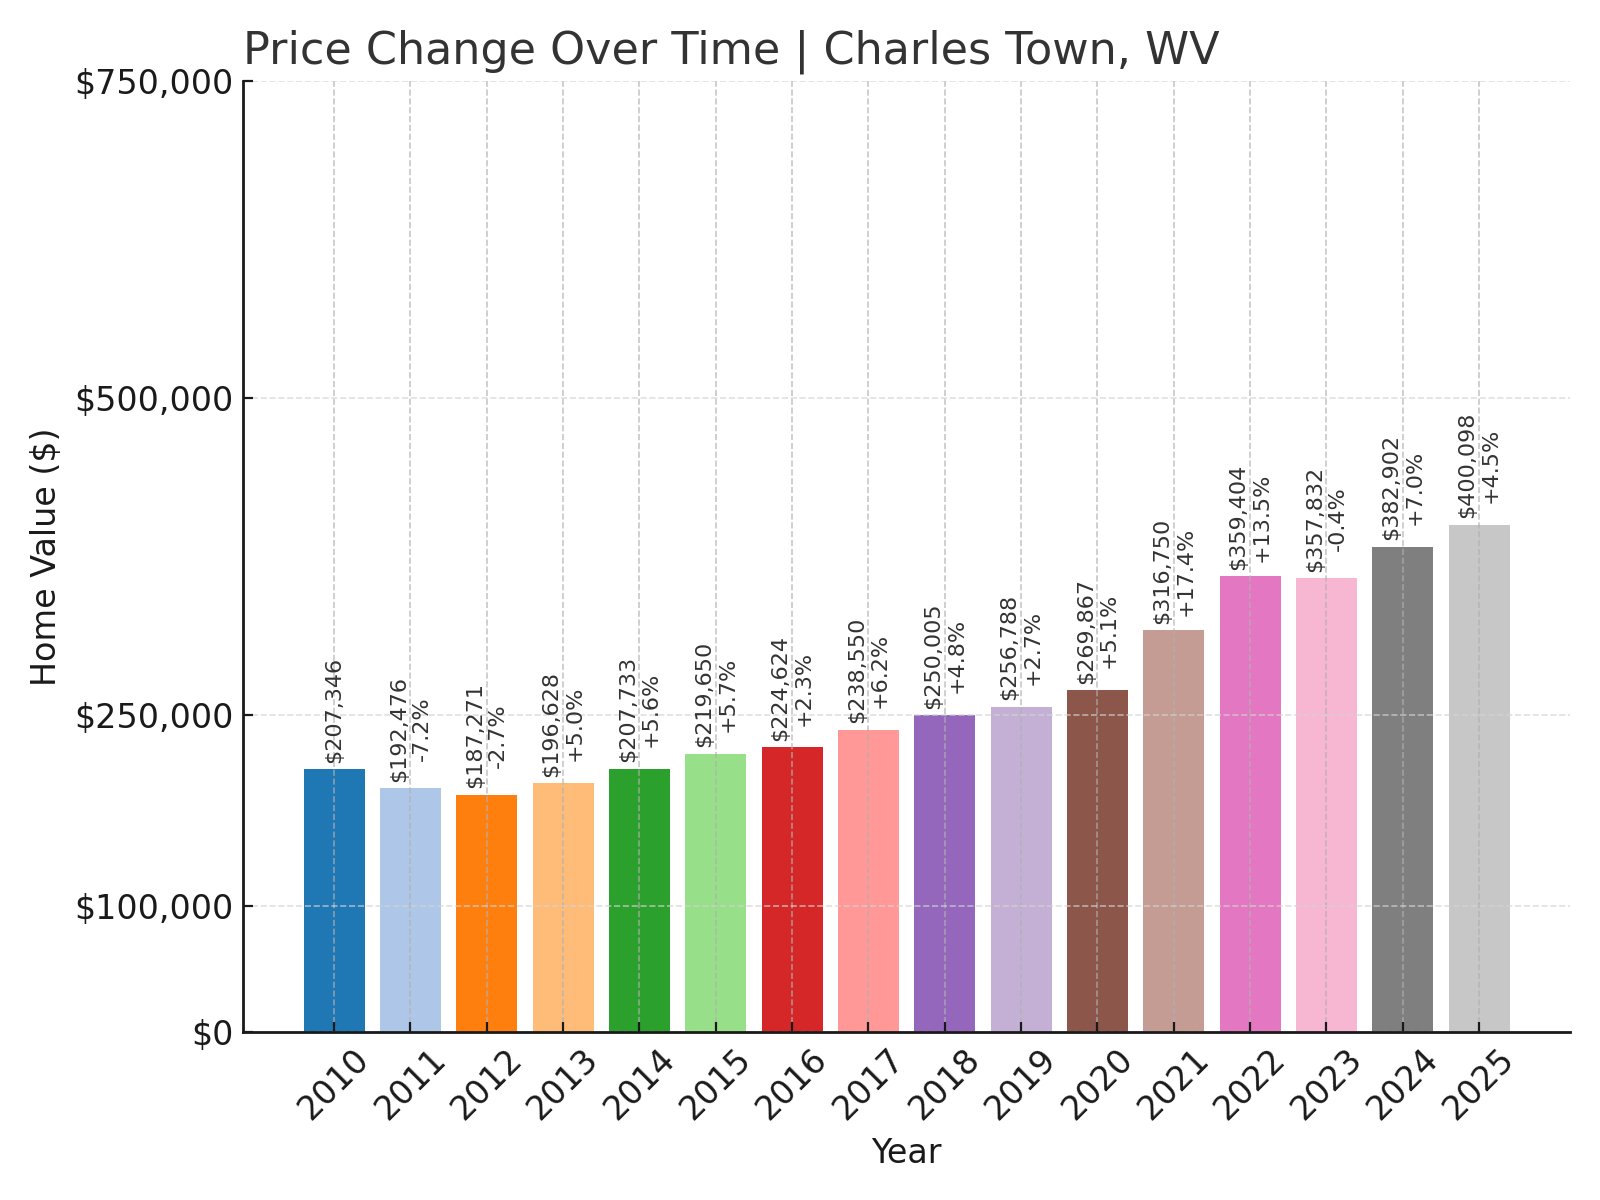
- 2010: $207,346
- 2011: $192,476 (-$14,871, -7.17% from previous year)
- 2012: $187,271 (-$5,204, -2.70% from previous year)
- 2013: $196,628 (+$9,356, +5.00% from previous year)
- 2014: $207,733 (+$11,106, +5.65% from previous year)
- 2015: $219,650 (+$11,917, +5.74% from previous year)
- 2016: $224,624 (+$4,973, +2.26% from previous year)
- 2017: $238,550 (+$13,927, +6.20% from previous year)
- 2018: $250,005 (+$11,454, +4.80% from previous year)
- 2019: $256,788 (+$6,783, +2.71% from previous year)
- 2020: $269,867 (+$13,079, +5.09% from previous year)
- 2021: $316,750 (+$46,883, +17.37% from previous year)
- 2022: $359,404 (+$42,654, +13.47% from previous year)
- 2023: $357,832 (-$1,572, -0.44% from previous year)
- 2024: $382,902 (+$25,069, +7.01% from previous year)
- 2025: $400,098 (+$17,196, +4.49% from previous year)
Charles Town’s home prices rose from around $207,000 in 2010 to $400,000 in 2025. Rapid growth occurred after 2020 as buyers sought accessible commuter towns with historic charm.
Charles Town – History Meets Modern Commuter Appeal
Founded by George Washington’s brother Charles, this Jefferson County seat offers colonial architecture and historic landmarks. Its walkable downtown has restaurants, shops, and the Hollywood Casino at Charles Town Races, adding jobs and tourism revenue.
Its proximity to major highways and MARC train stations make it a convenient choice for Washington, D.C. commuters seeking lower housing costs while enjoying small-town life.
The strong real estate market reflects its mix of heritage, economic opportunity, and convenient location in West Virginia’s eastern panhandle.
3. Shenandoah Junction – 111.4% Home Price Increase Since 2010
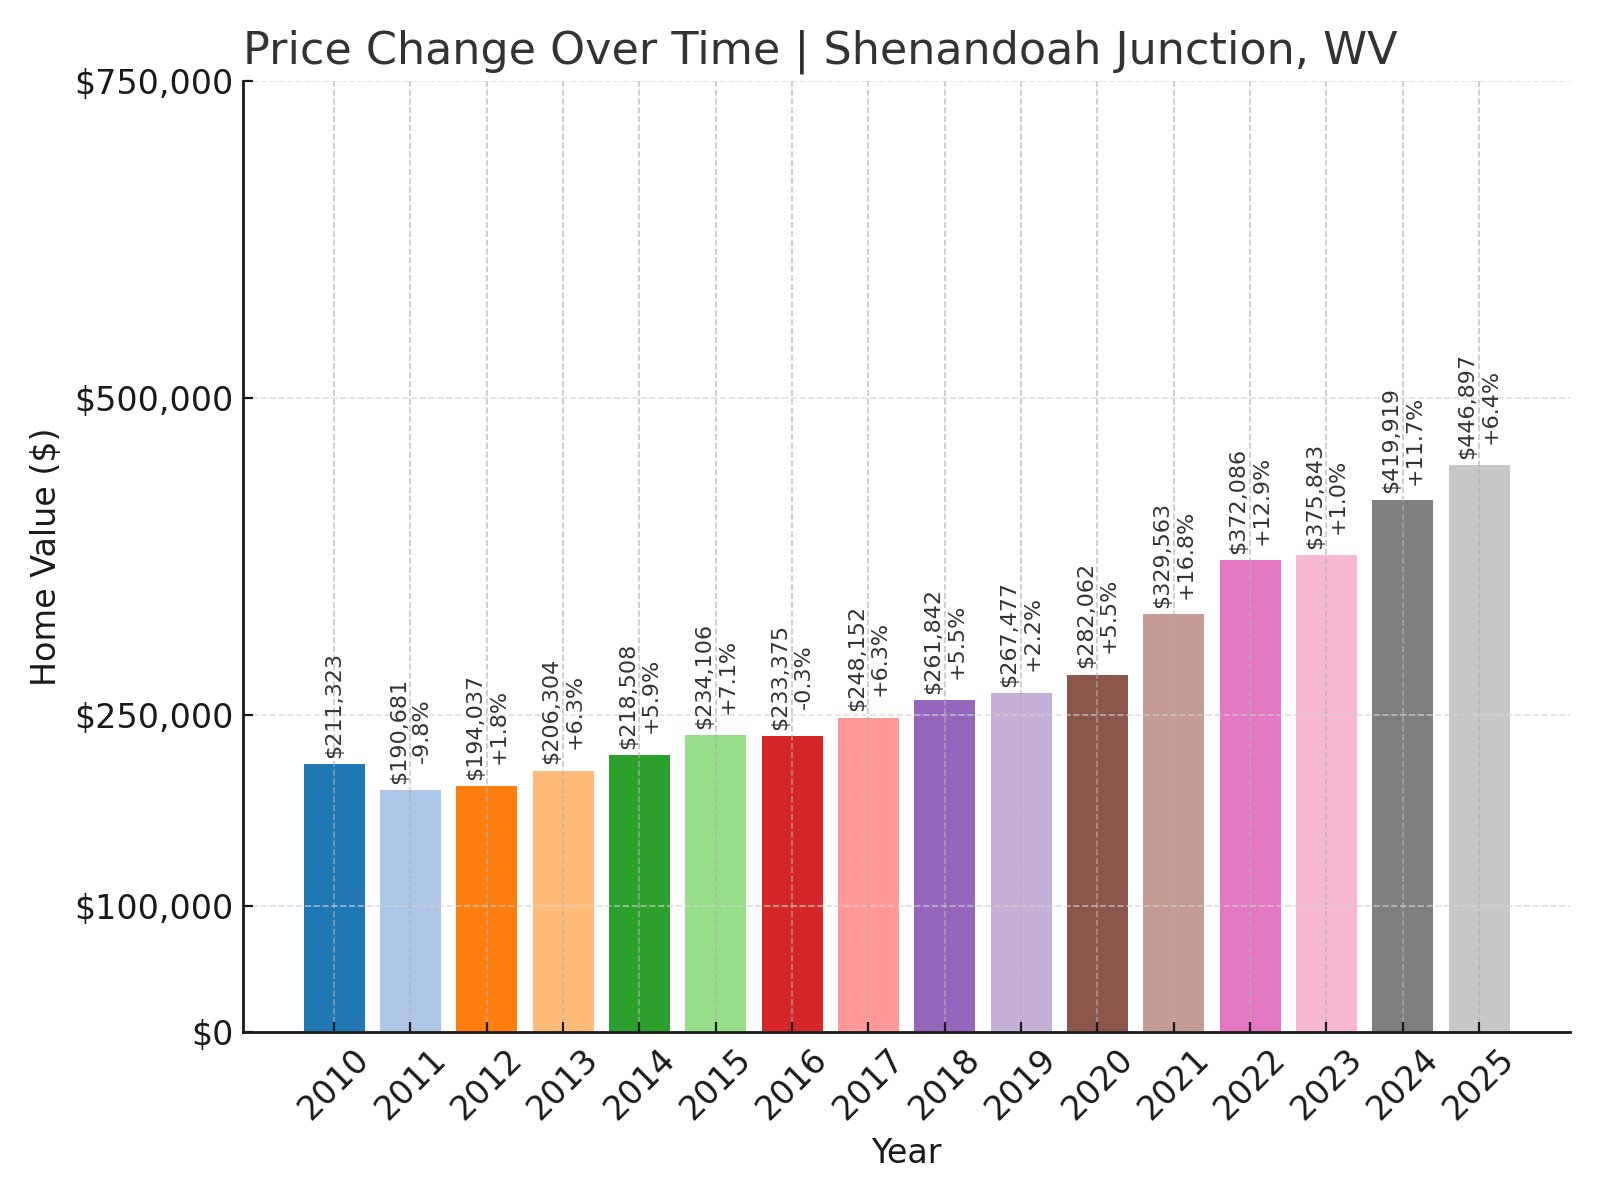
- 2010: $211,323
- 2011: $190,681 (-$20,642, -9.77% from previous year)
- 2012: $194,037 (+$3,356, +1.76% from previous year)
- 2013: $206,304 (+$12,267, +6.32% from previous year)
- 2014: $218,508 (+$12,204, +5.92% from previous year)
- 2015: $234,106 (+$15,598, +7.14% from previous year)
- 2016: $233,375 (-$732, -0.31% from previous year)
- 2017: $248,152 (+$14,777, +6.33% from previous year)
- 2018: $261,842 (+$13,690, +5.52% from previous year)
- 2019: $267,477 (+$5,635, +2.15% from previous year)
- 2020: $282,062 (+$14,585, +5.45% from previous year)
- 2021: $329,563 (+$47,501, +16.84% from previous year)
- 2022: $372,086 (+$42,523, +12.90% from previous year)
- 2023: $375,843 (+$3,757, +1.01% from previous year)
- 2024: $419,919 (+$44,076, +11.73% from previous year)
- 2025: $446,897 (+$26,978, +6.42% from previous year)
Home prices in Shenandoah Junction more than doubled from around $211,000 in 2010 to nearly $447,000 in 2025. Rapid growth occurred especially after 2020.
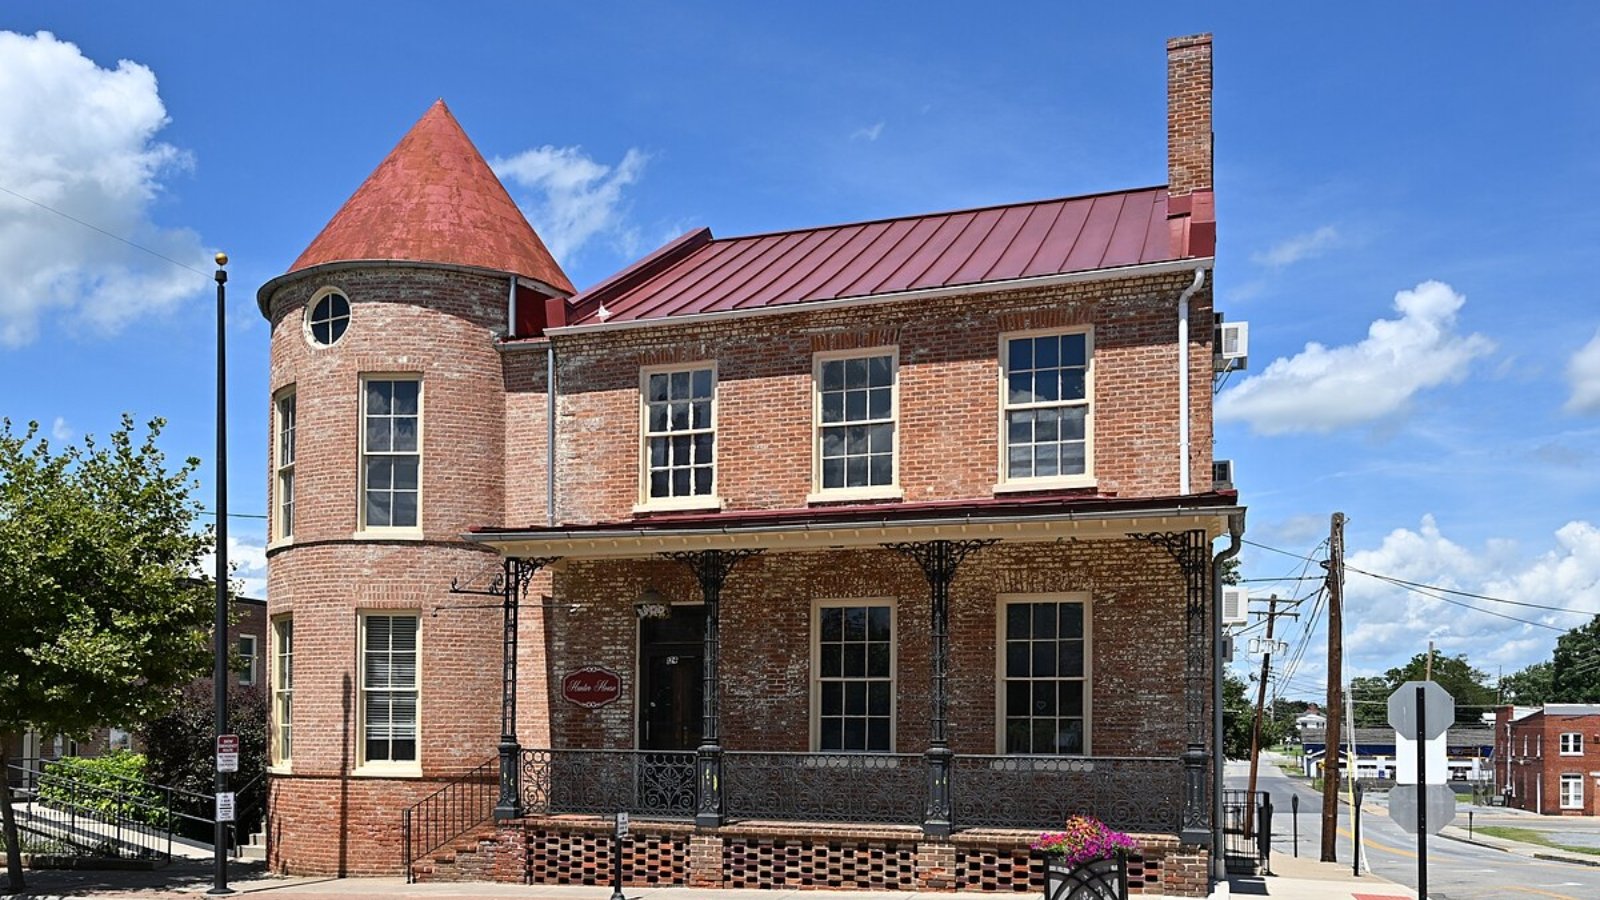
Shenandoah Junction – Quiet Community With Rail Heritage
Shenandoah Junction is a small community in Jefferson County, known for its railway crossing and location along the Norfolk Southern line. It has a rural character while being close to Shepherdstown and Charles Town for shopping and jobs.
The community includes Jefferson High School and is surrounded by farmland and residential developments. Its strategic location attracts commuters working in the metro area seeking quieter surroundings.
Recent price growth reflects its appeal as a rural area offering accessibility, educational facilities, and proximity to larger towns.
2. Summit Point – 64.6% Home Price Increase Since 2019
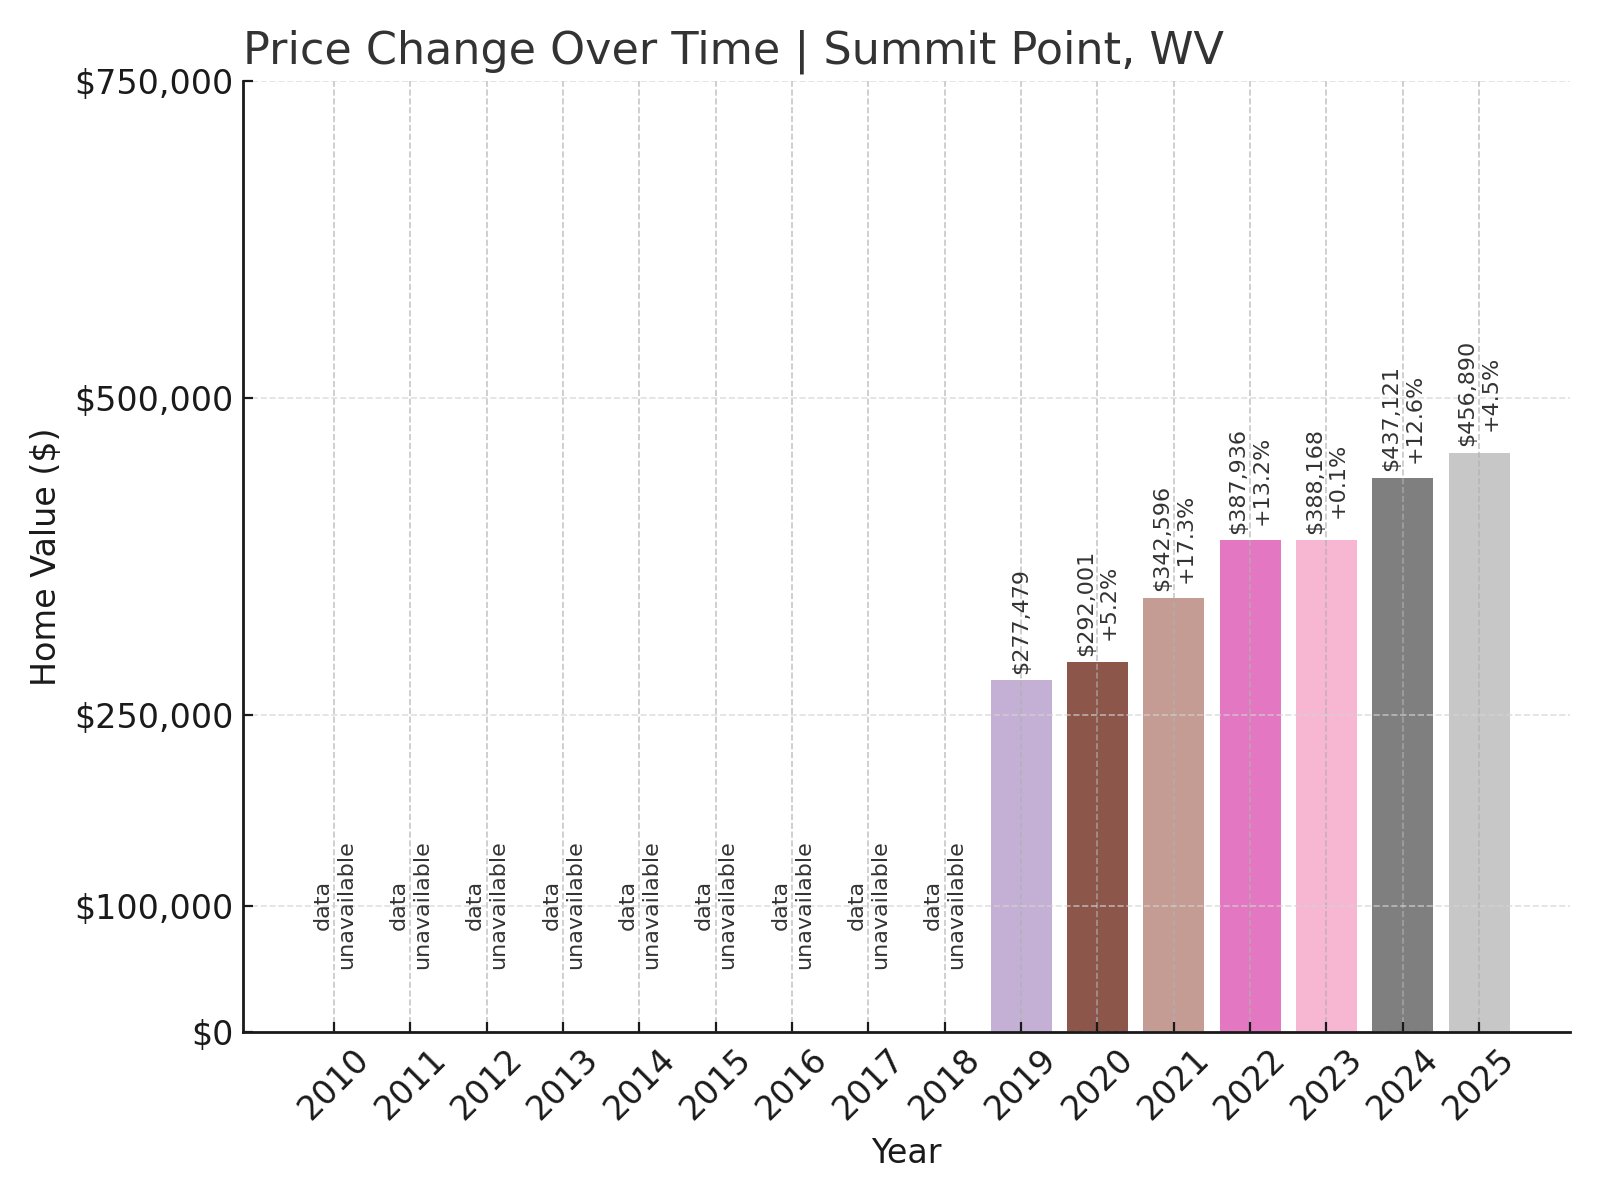
- 2019: $277,479
- 2020: $292,001 (+$14,523, +5.23% from previous year)
- 2021: $342,596 (+$50,595, +17.33% from previous year)
- 2022: $387,936 (+$45,340, +13.23% from previous year)
- 2023: $388,168 (+$232, +0.06% from previous year)
- 2024: $437,121 (+$48,953, +12.61% from previous year)
- 2025: $456,890 (+$19,769, +4.52% from previous year)
Summit Point home prices rose from around $277,000 in 2019 to nearly $457,000 in 2025. The largest jumps occurred between 2020 and 2022, with prices remaining strong in recent years.
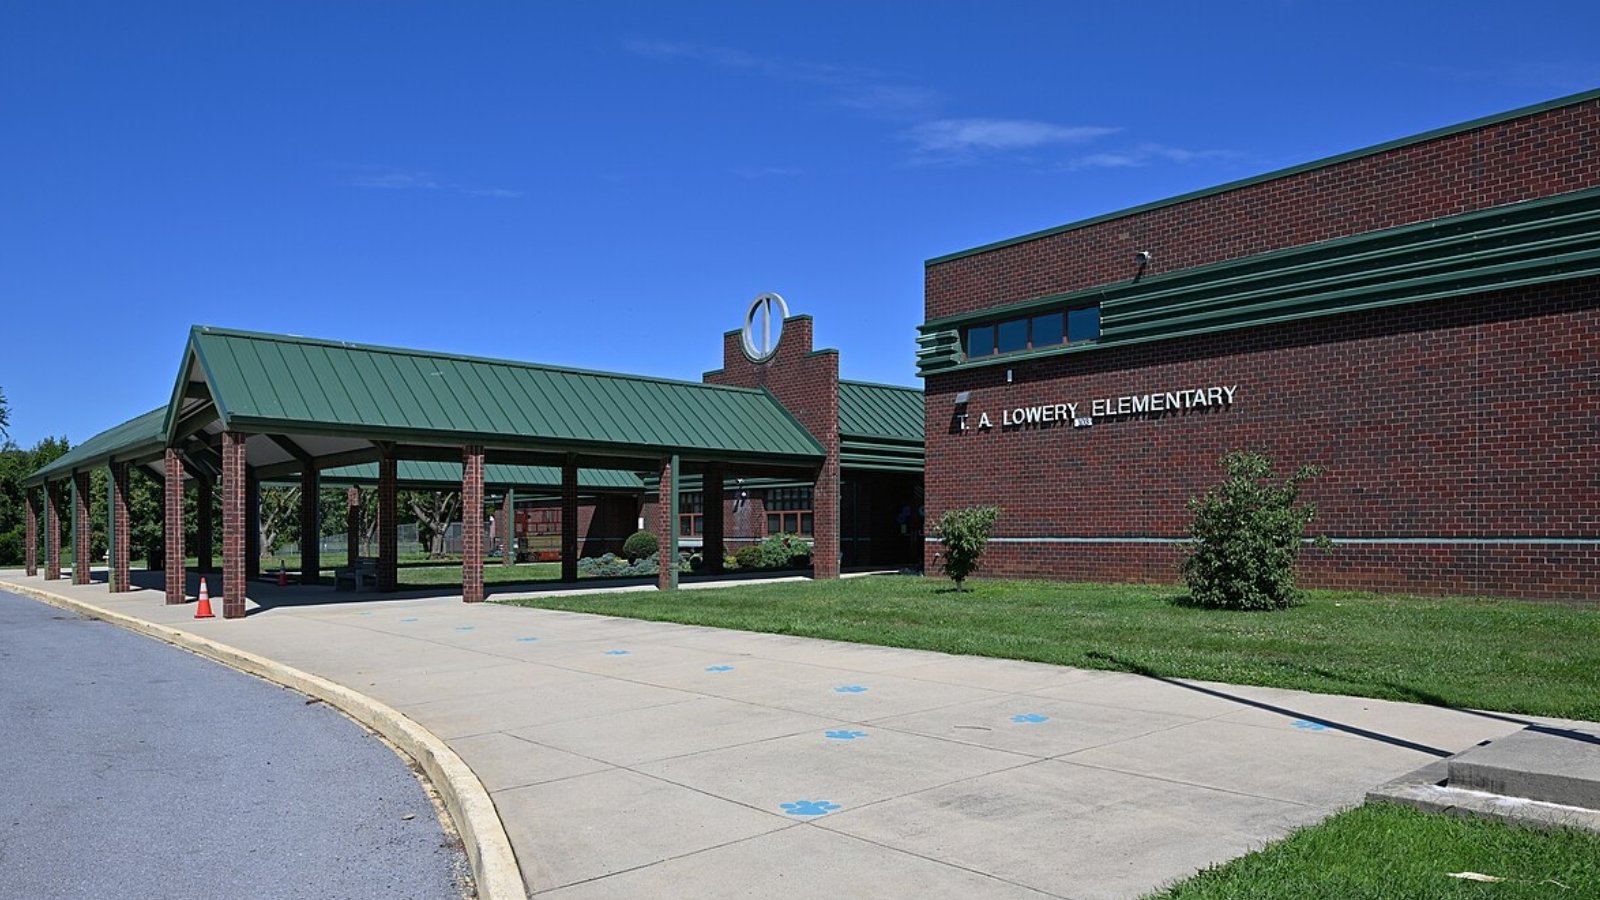
Summit Point – Motorsports and Rural Living
Summit Point is known for the Summit Point Motorsports Park, drawing visitors for racing events and driving schools. Located in Jefferson County, the area combines rural farmland living with unique local attractions.
Homes are often on larger lots, attracting buyers wanting space while staying near commuter routes into Northern Virginia and Washington, D.C.
Home price increases reflect its appeal to motorsports enthusiasts and those seeking rural West Virginia communities within reach of city jobs and amenities.
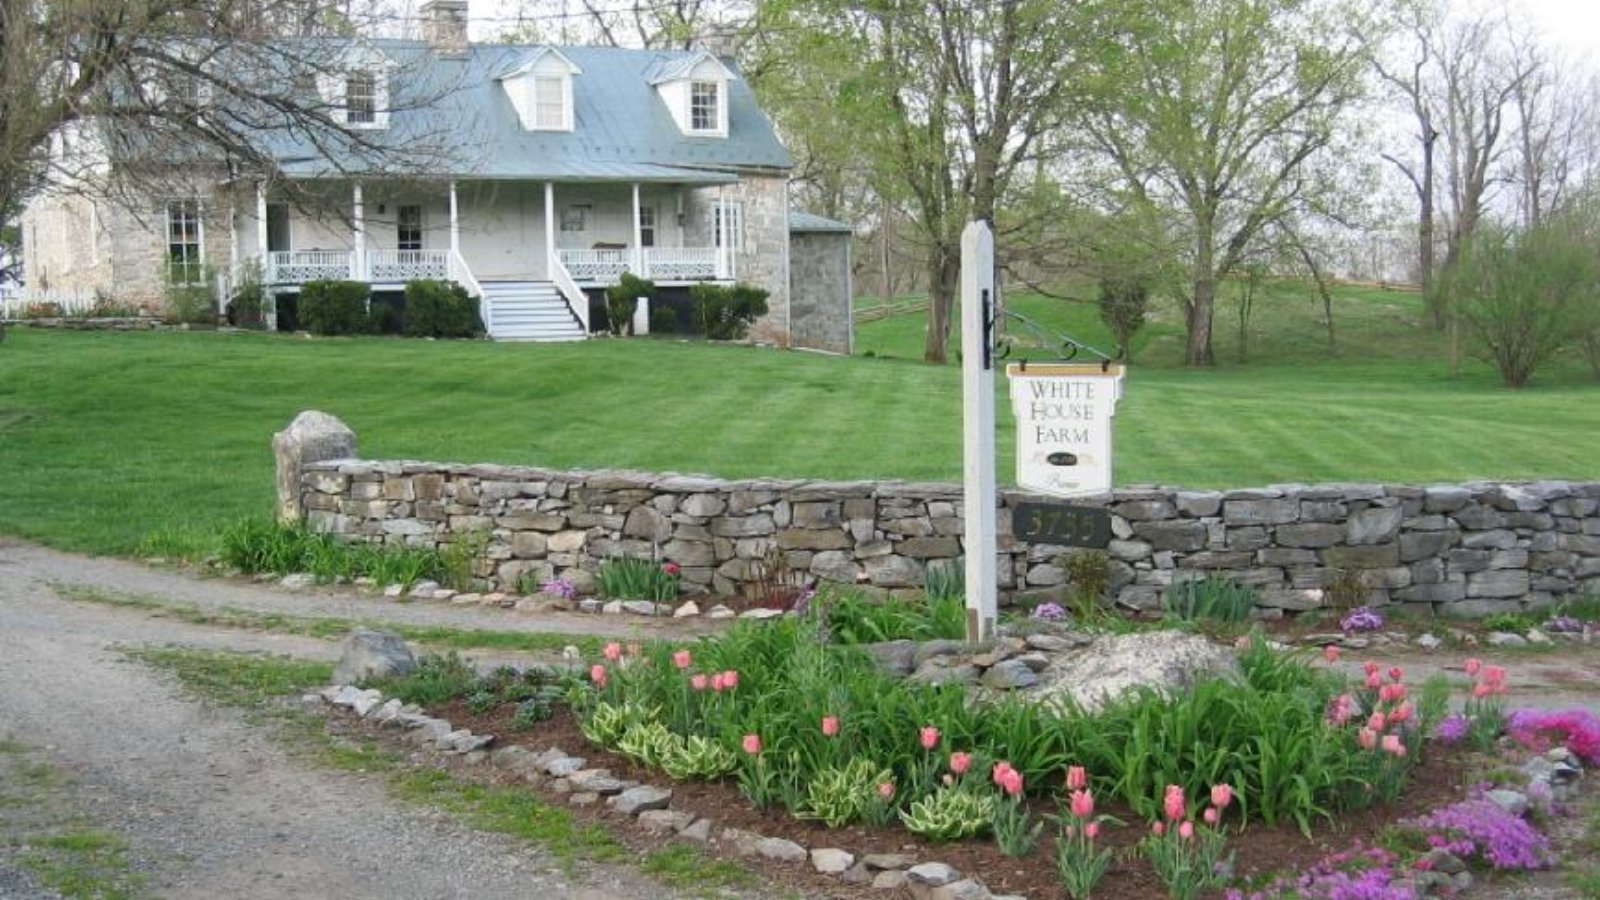
1. Shepherdstown – 84.8% Home Price Increase Since 2010
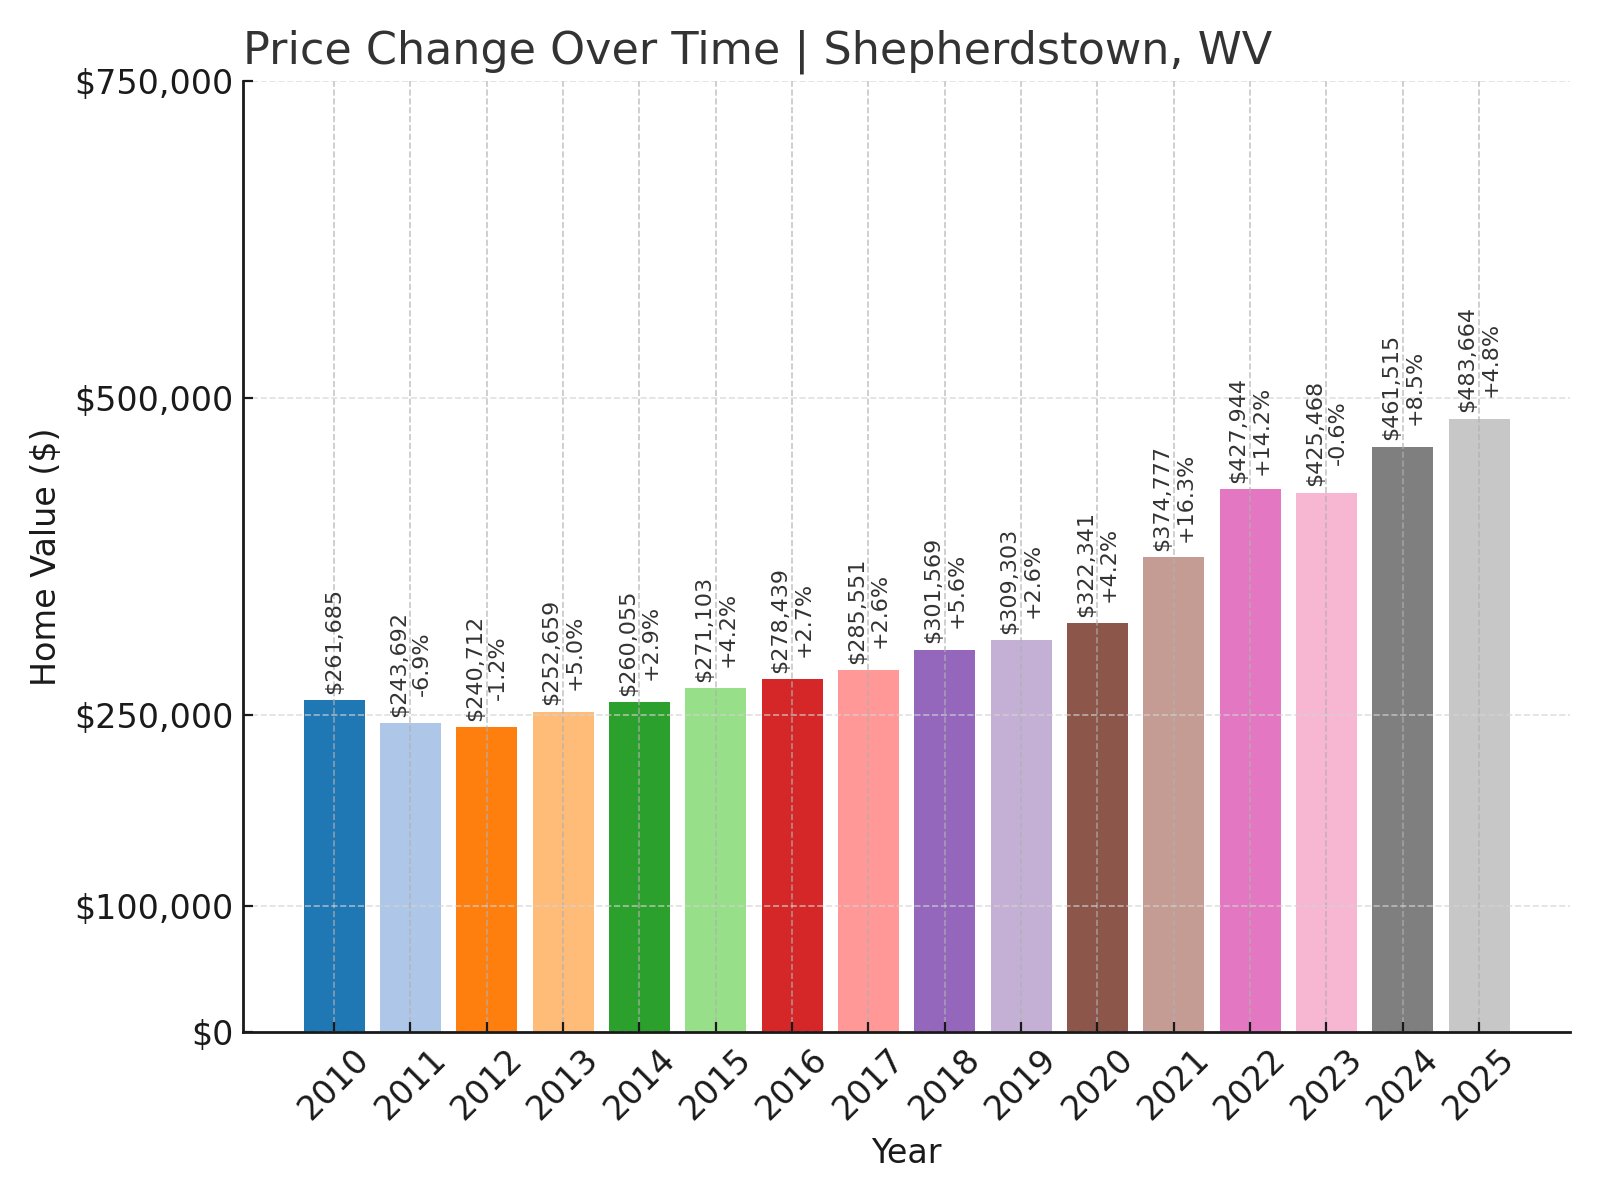
- 2010: $261,685
- 2011: $243,692 (-$17,994, -6.88% from previous year)
- 2012: $240,712 (-$2,979, -1.22% from previous year)
- 2013: $252,659 (+$11,947, +4.96% from previous year)
- 2014: $260,055 (+$7,395, +2.93% from previous year)
- 2015: $271,103 (+$11,049, +4.25% from previous year)
- 2016: $278,439 (+$7,336, +2.71% from previous year)
- 2017: $285,551 (+$7,112, +2.55% from previous year)
- 2018: $301,569 (+$16,018, +5.61% from previous year)
- 2019: $309,303 (+$7,734, +2.56% from previous year)
- 2020: $322,341 (+$13,038, +4.22% from previous year)
- 2021: $374,777 (+$52,436, +16.27% from previous year)
- 2022: $427,944 (+$53,167, +14.19% from previous year)
- 2023: $425,468 (-$2,476, -0.58% from previous year)
- 2024: $461,515 (+$36,047, +8.47% from previous year)
- 2025: $483,664 (+$22,149, +4.80% from previous year)
Shepherdstown’s home prices grew from about $262,000 in 2010 to over $483,000 in 2025. Growth accelerated after 2020 as buyers sought its college-town charm and riverside location.
Shepherdstown – College Town With Arts and Culture
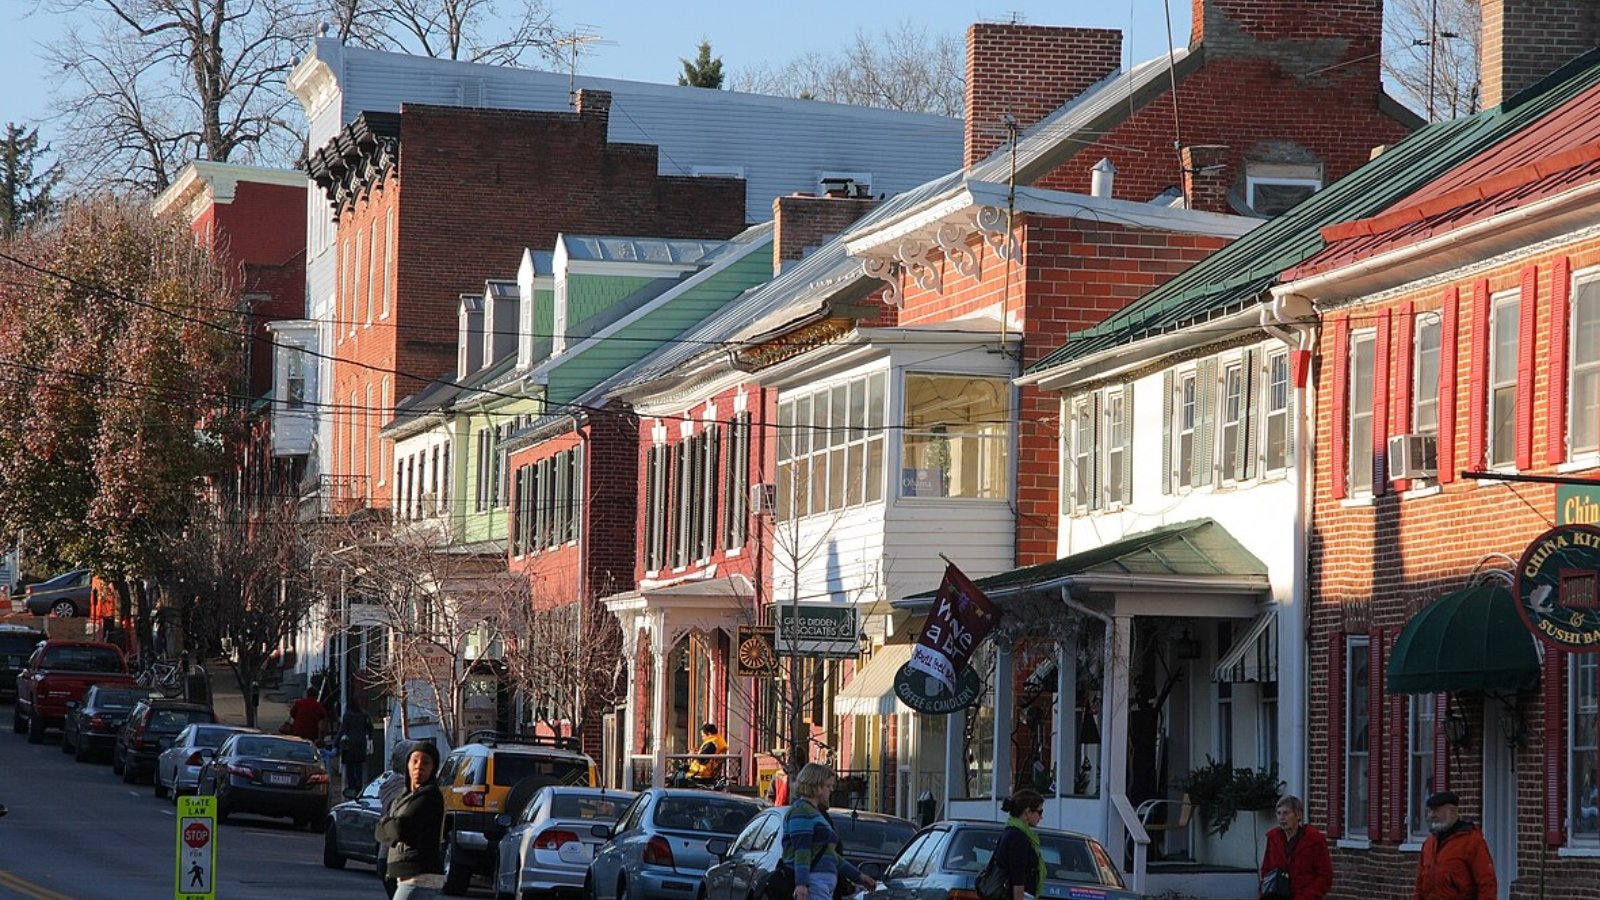
Shepherdstown is West Virginia’s oldest town, founded in 1762. It’s home to Shepherd University and a thriving arts community, with theaters, galleries, and cafes lining its historic streets.
Located along the Potomac River, it offers kayaking, biking trails, and easy access to Maryland. The town draws both students and retirees, creating a diverse and active community.
Its strong housing market reflects demand for small towns offering educational, cultural, and recreational opportunities while remaining within commuting distance of Washington, D.C. and Baltimore.