Would you like to save this?
Virginia’s housing market has gotten more expensive overall—but not everywhere. According to the Zillow Home Value Index, these 18 towns remain surprisingly affordable in 2025. Whether you’re a first-time buyer, a downsizer, or just looking for more value, these are the places where your budget still stretches.
From quiet rural spots to small city suburbs, each town on this list offers some of the lowest average home prices in the state. In a year when many markets feel out of reach, these communities prove that affordable options still exist—if you know where to look.
18. Freeman – 17% Home Price Decrease Since 2024
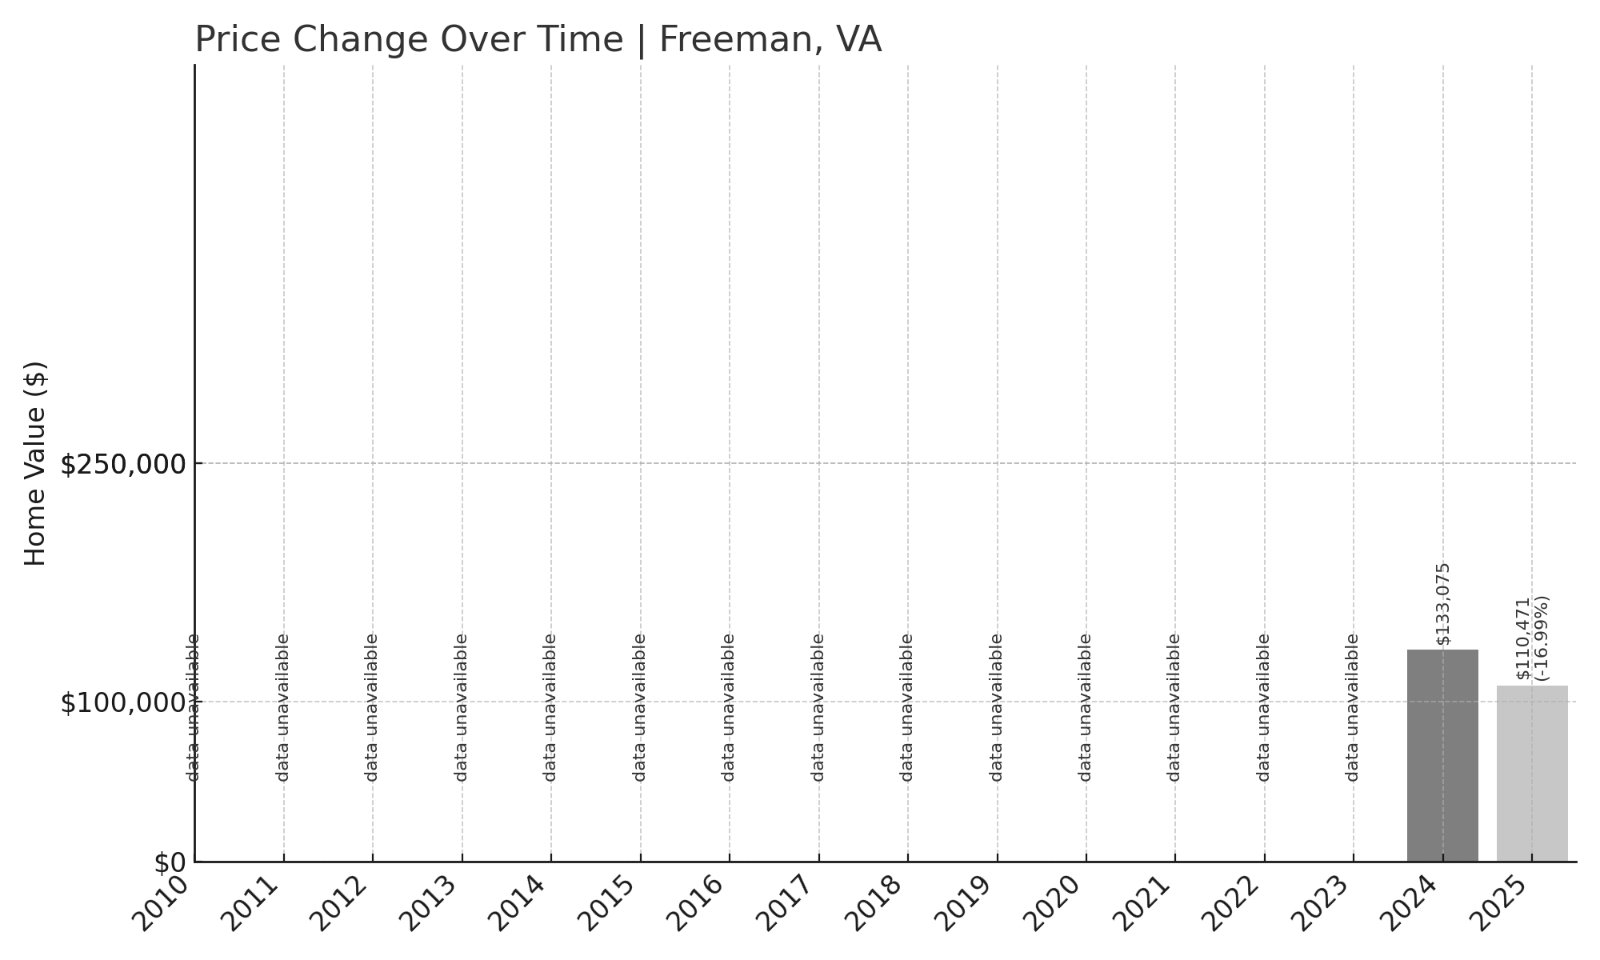
- 2024: $133,075
- 2025: $110,471 (-$22,604, -16.99% from previous year)
Freeman’s home values fell nearly 17% from 2024 to 2025, dropping from $133,075 to $110,471. This steep decline could impact local homeowners’ equity, but it may also create new opportunities for buyers seeking lower entry prices in this small Virginia community.
Freeman – A Quiet Rural Community Seeing Price Cuts
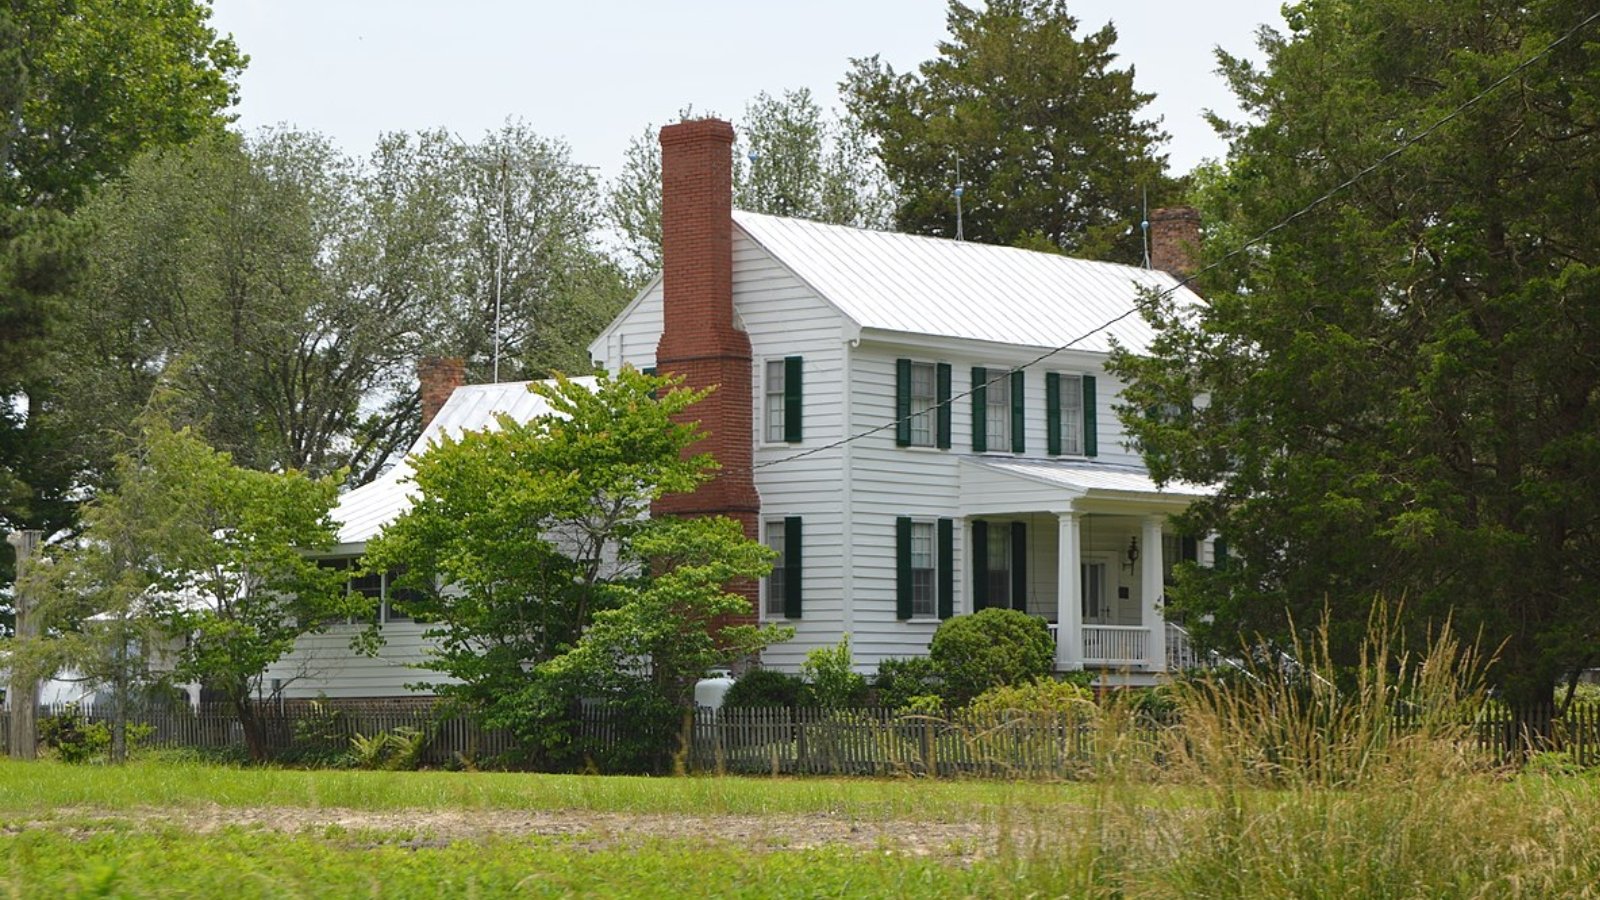
Freeman is a small unincorporated community in Brunswick County, located in southern Virginia near the North Carolina border. Known for its peaceful rural setting and sparse population, Freeman has traditionally had a modest housing market. The recent price drop brings homes to an average value of $110,471 in 2025, making it one of the more affordable locations in the region.
This decrease may reflect broader market corrections after pandemic-era price increases, or a local adjustment tied to lower buyer demand. The area is primarily residential and agricultural, with limited commercial development. Nearby highways connect Freeman to Emporia and South Hill for shopping and services, but employment and amenities within Freeman itself are minimal, which can affect price trends over time.
17. Richlands – 46% Home Price Increase Since 2010
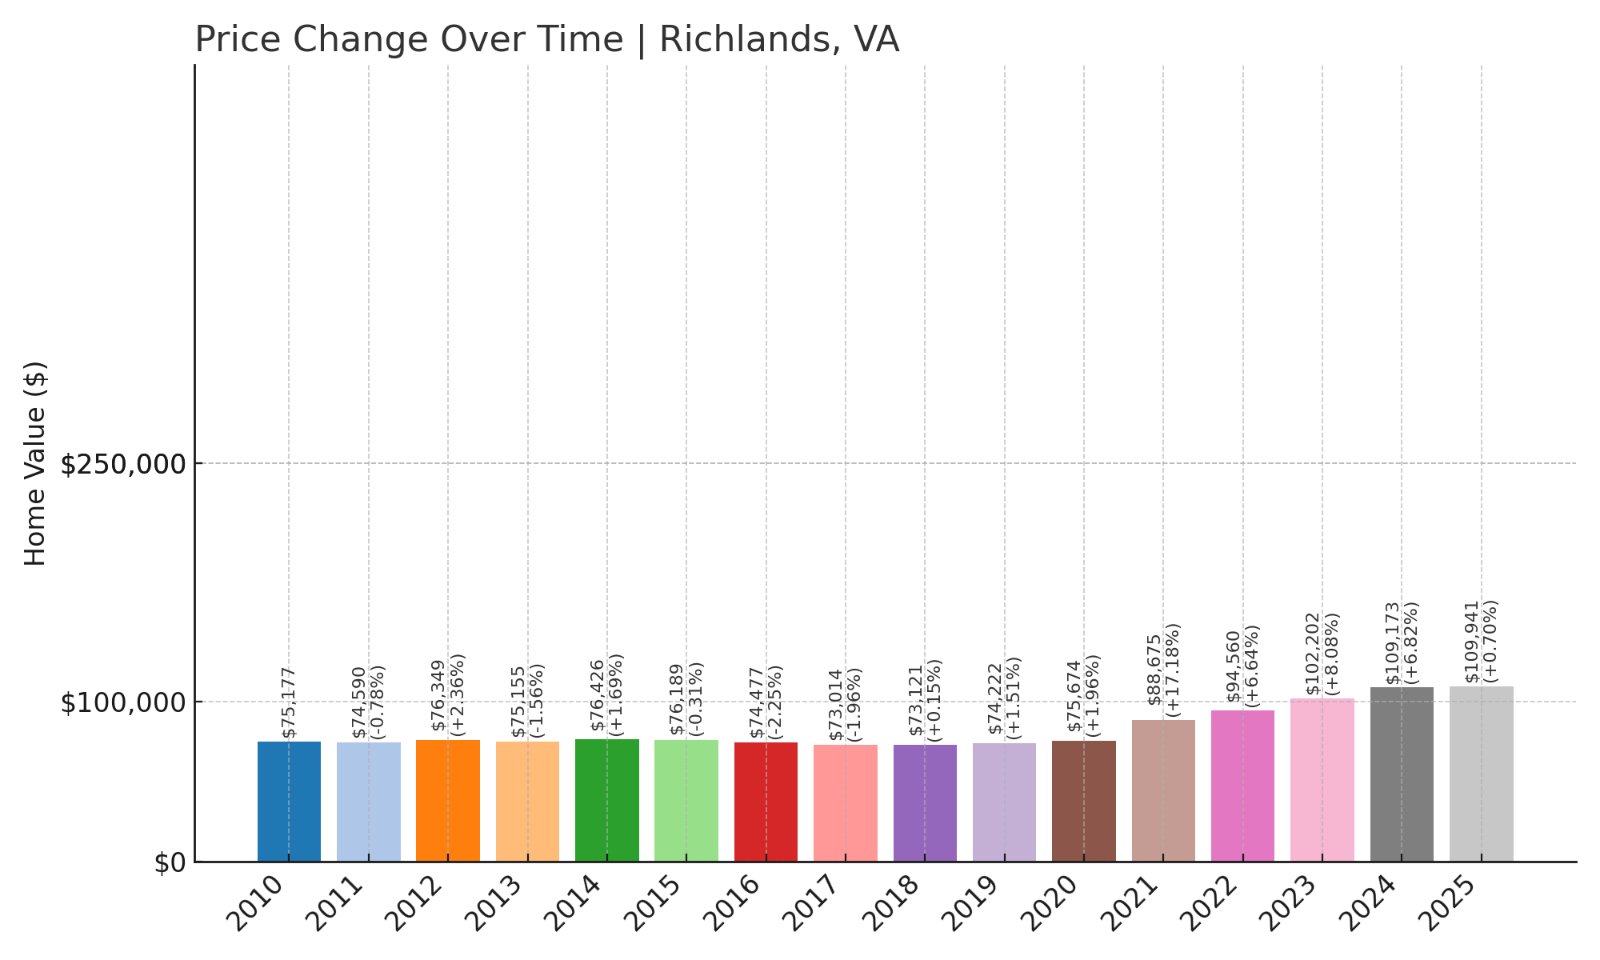
- 2010: $75,177
- 2011: $74,590 (-$587, -0.78% from previous year)
- 2012: $76,349 (+$1,759, +2.36% from previous year)
- 2013: $75,155 (-$1,194, -1.56% from previous year)
- 2014: $76,426 (+$1,271, +1.69% from previous year)
- 2015: $76,189 (-$236, -0.31% from previous year)
- 2016: $74,477 (-$1,712, -2.25% from previous year)
- 2017: $73,014 (-$1,463, -1.96% from previous year)
- 2018: $73,121 (+$107, +0.15% from previous year)
- 2019: $74,222 (+$1,101, +1.51% from previous year)
- 2020: $75,674 (+$1,452, +1.96% from previous year)
- 2021: $88,675 (+$13,001, +17.18% from previous year)
- 2022: $94,560 (+$5,885, +6.64% from previous year)
- 2023: $102,202 (+$7,643, +8.08% from previous year)
- 2024: $109,173 (+$6,970, +6.82% from previous year)
- 2025: $109,941 (+$768, +0.70% from previous year)
Richlands has seen a steady home price rise over the past decade, reaching $109,941 in 2025. Although recent growth has slowed to under 1% this year, values remain nearly 46% higher than in 2010, signaling long-term market resilience.
Richlands – A Small Town with Stable Long-Term Growth
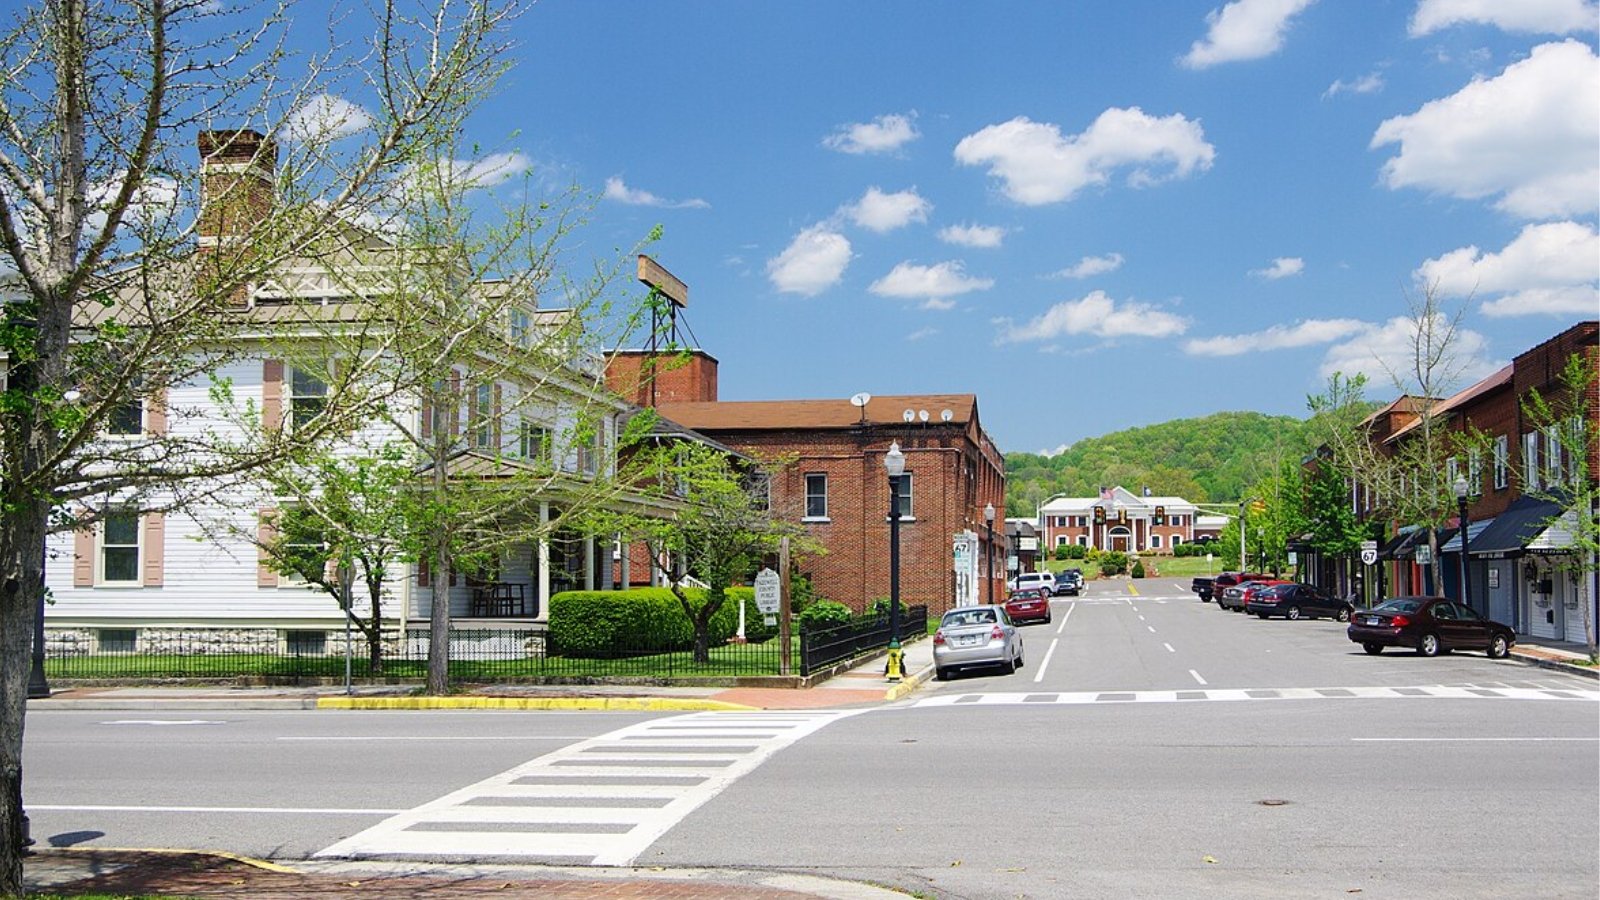
Located in Tazewell County in southwest Virginia, Richlands has a population of around 5,000 residents. This former coal town has transitioned into a small regional hub with medical centers, retail stores, and educational institutions like Southwest Virginia Community College nearby. The town’s housing market has grown steadily over the years, with a sharp boost in 2021 pushing prices above $88,000 for the first time.
In 2025, the average home value is $109,941, only a slight increase from 2024. This plateau may indicate a cooling market after years of growth, providing buyers with a stable price point compared to rapidly inflating areas. With access to the scenic Clinch River and Appalachian trails, Richlands remains attractive to families and retirees looking for affordable homes with mountain town amenities.
16. Saint Paul – 41% Home Price Increase Since 2010
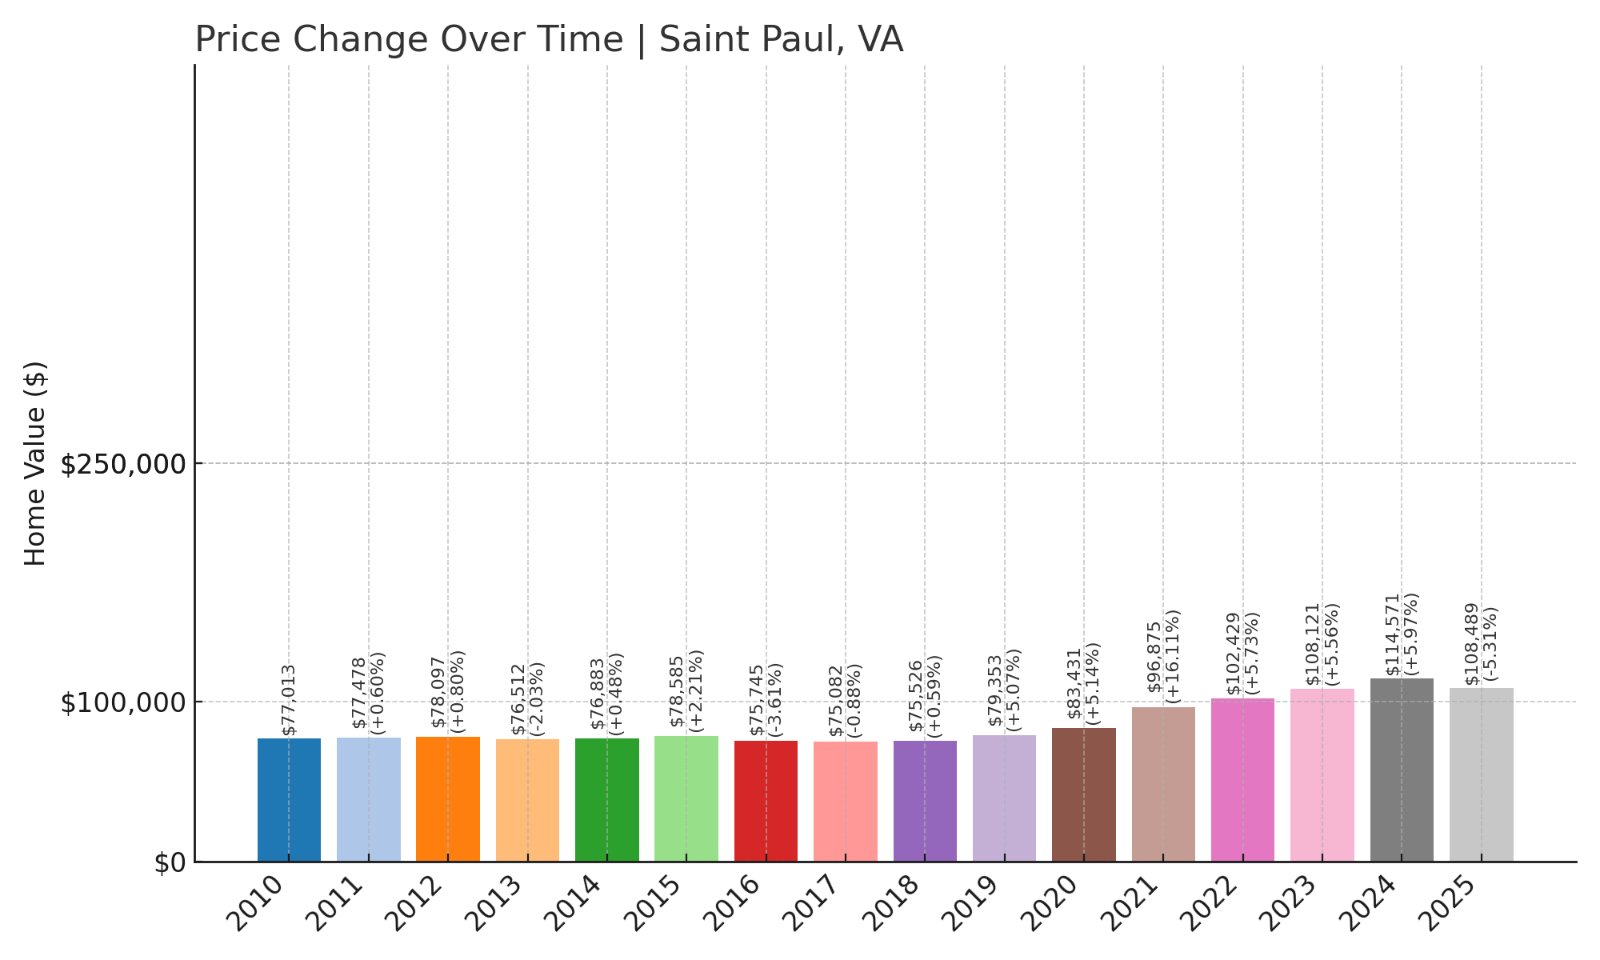
- 2010: $77,013
- 2011: $77,478 (+$465, +0.60% from previous year)
- 2012: $78,097 (+$619, +0.80% from previous year)
- 2013: $76,512 (-$1,585, -2.03% from previous year)
- 2014: $76,883 (+$371, +0.49% from previous year)
- 2015: $78,585 (+$1,702, +2.21% from previous year)
- 2016: $75,745 (-$2,840, -3.61% from previous year)
- 2017: $75,082 (-$663, -0.88% from previous year)
- 2018: $75,526 (+$444, +0.59% from previous year)
- 2019: $79,353 (+$3,827, +5.07% from previous year)
- 2020: $83,431 (+$4,078, +5.14% from previous year)
- 2021: $96,875 (+$13,444, +16.11% from previous year)
- 2022: $102,429 (+$5,554, +5.73% from previous year)
- 2023: $108,121 (+$5,692, +5.56% from previous year)
- 2024: $114,571 (+$6,451, +5.97% from previous year)
- 2025: $108,489 (-$6,083, -5.31% from previous year)
Home prices in Saint Paul peaked in 2024 at $114,571 before declining by over 5% to $108,489 in 2025. Despite this recent dip, values are still 41% higher than in 2010, reflecting overall growth in the town’s housing market.
Saint Paul – Appalachian Charm with Recent Market Corrections
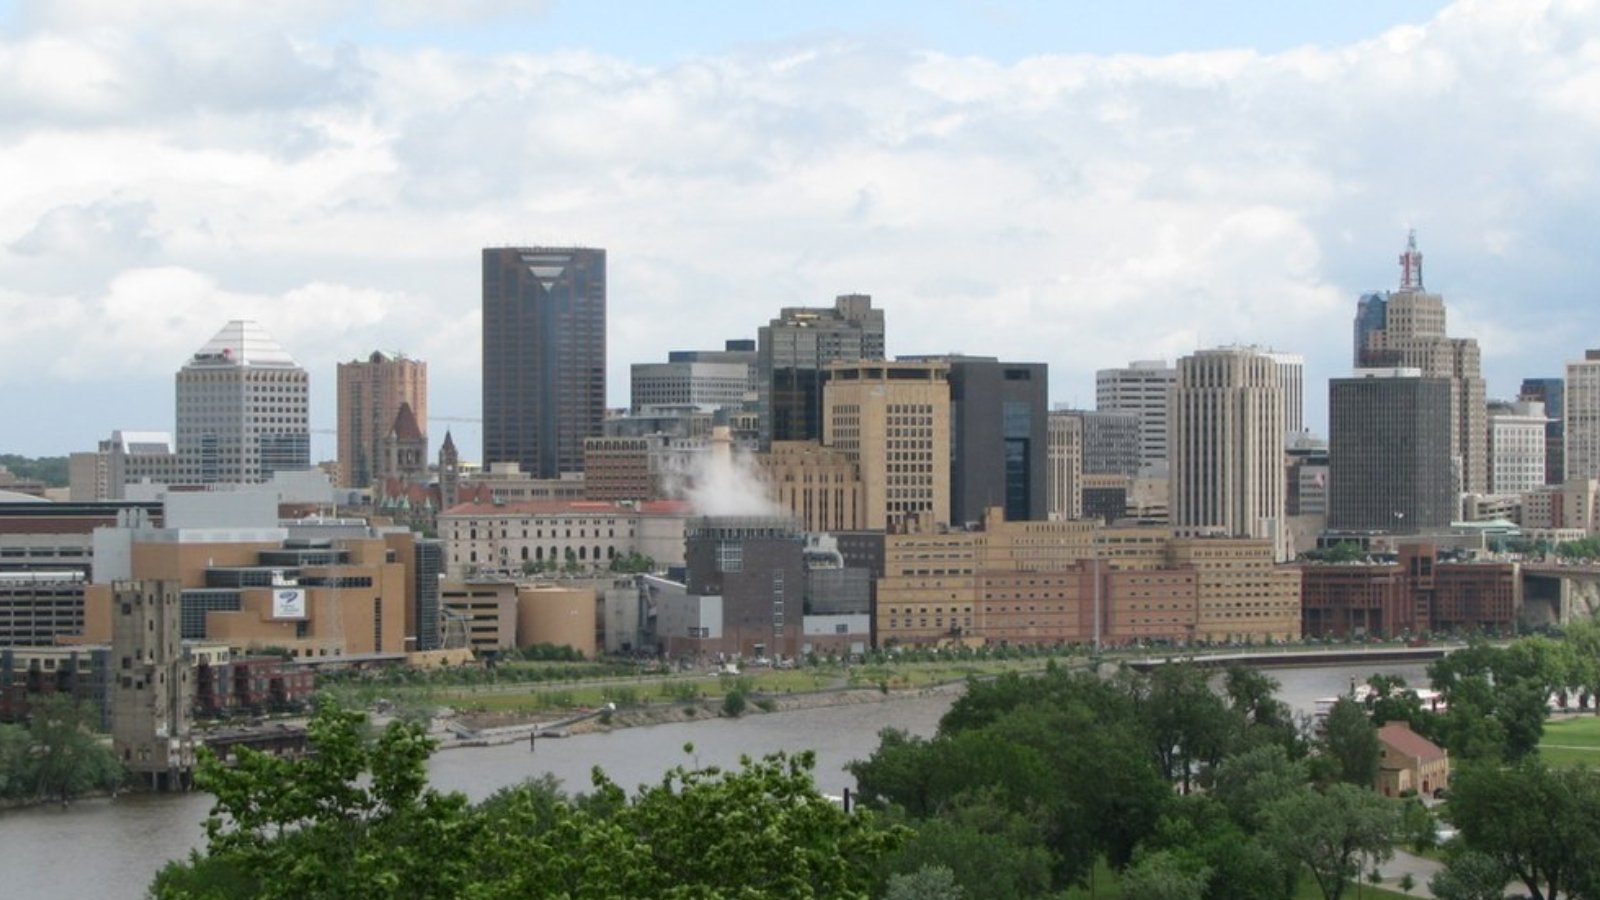
Saint Paul sits on the Clinch River in southwest Virginia’s Wise and Russell counties. The town is known for its eco-tourism, the Clinch River Days Festival, and nearby trails like Sugar Hill, which attract nature enthusiasts. The recent 5% decline in home prices brings average values to $108,489 in 2025.
With recent investments in local tourism infrastructure and historic downtown revitalization, Saint Paul remains a desirable small-town location despite price corrections. The decrease may indicate the market adjusting after years of consistent increases since 2015, making this a potential opportunity for buyers seeking affordable Appalachian living with river views and outdoor recreation nearby.
15. Dryden – 32% Home Price Increase Since 2016
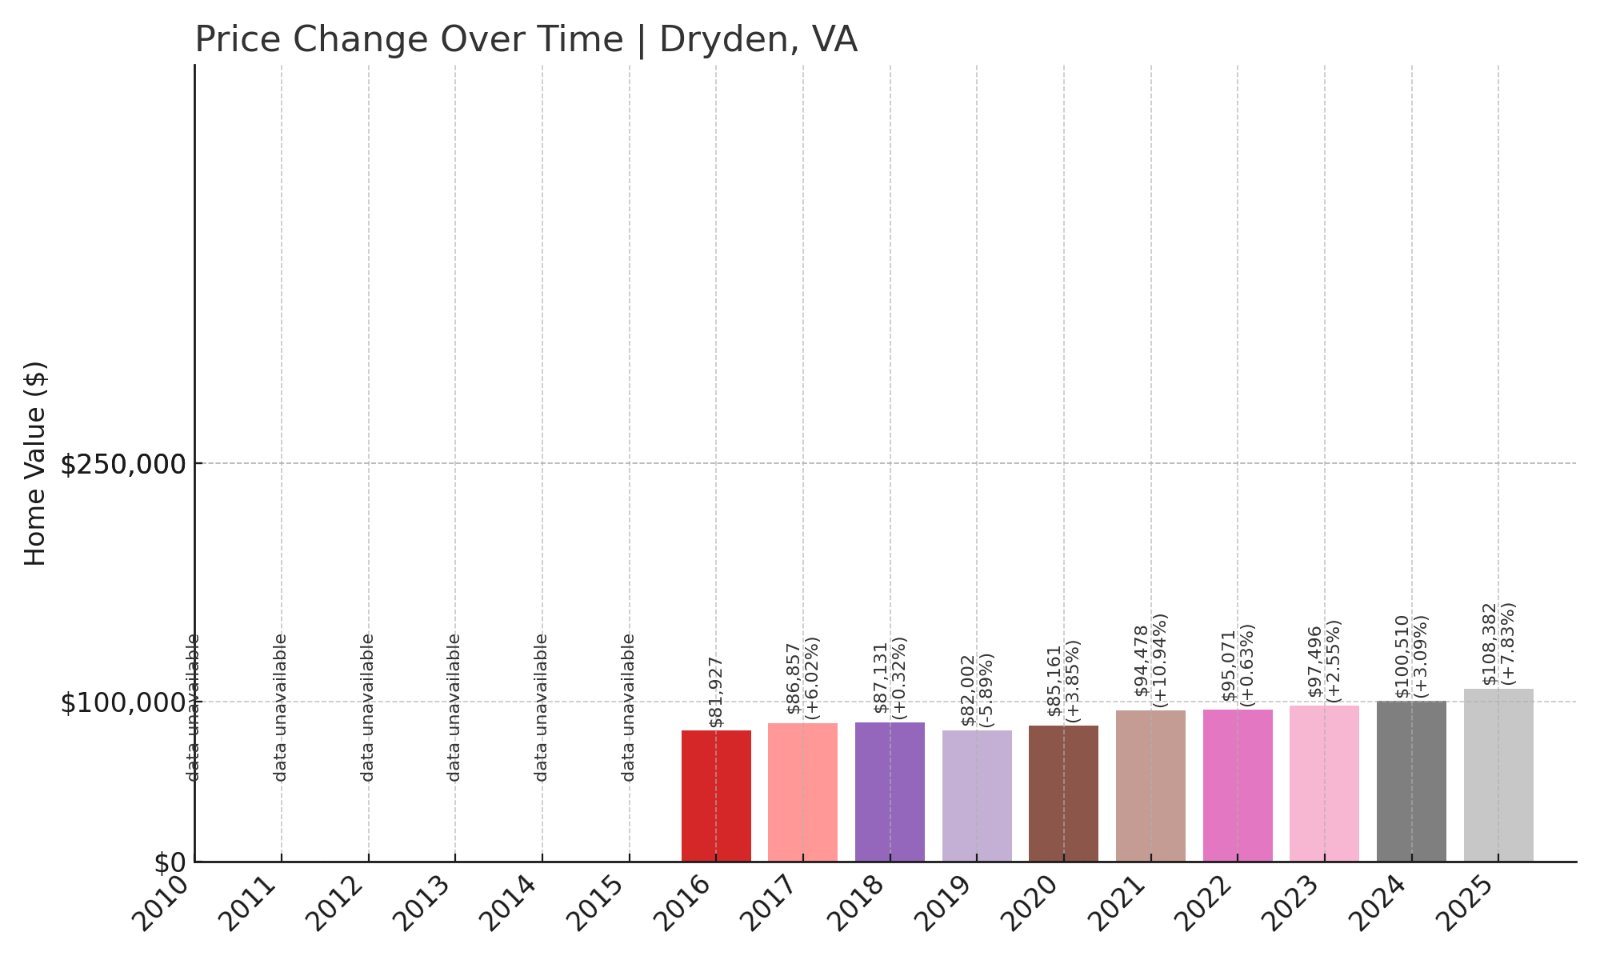
- 2016: $81,927
- 2017: $86,857 (+$4,930, +6.02% from previous year)
- 2018: $87,131 (+$274, +0.32% from previous year)
- 2019: $82,002 (-$5,129, -5.89% from previous year)
- 2020: $85,161 (+$3,159, +3.85% from previous year)
- 2021: $94,478 (+$9,318, +10.94% from previous year)
- 2022: $95,071 (+$593, +0.63% from previous year)
- 2023: $97,496 (+$2,424, +2.55% from previous year)
- 2024: $100,510 (+$3,015, +3.09% from previous year)
- 2025: $108,382 (+$7,872, +7.83% from previous year)
Dryden’s home values grew from $81,927 in 2016 to $108,382 in 2025, marking a total increase of 32%. Recent growth has been especially strong, with nearly 8% gains this year alone.
Dryden – Affordable Homes with Steady Recent Gains
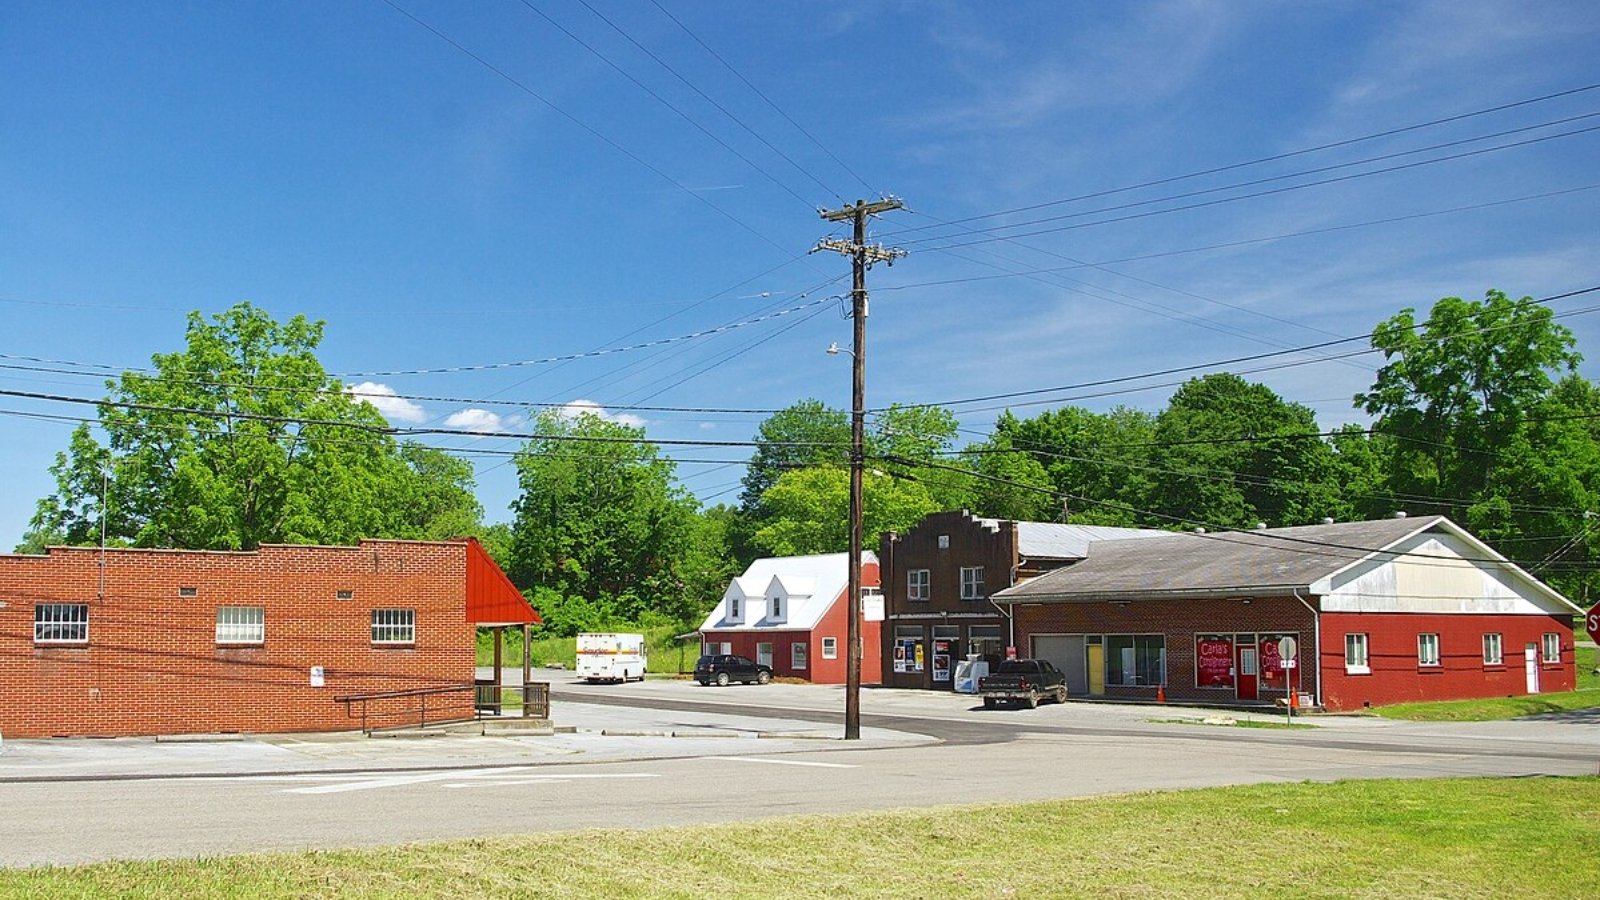
Dryden is a small community in Lee County, southwestern Virginia, along U.S. Route 58 between Pennington Gap and Big Stone Gap. This unincorporated area has an agricultural heritage, with quiet neighborhoods and a few local businesses serving residents and surrounding farms.
In 2025, the average home value is $108,382, up almost 8% from 2024. Such increases suggest a strengthening market as buyers look for affordable alternatives to nearby towns. Its proximity to regional employers and outdoor attractions like Wilderness Road State Park and Powell River may contribute to rising demand.
14. Keen Mountain – 46% Home Price Increase Since 2020
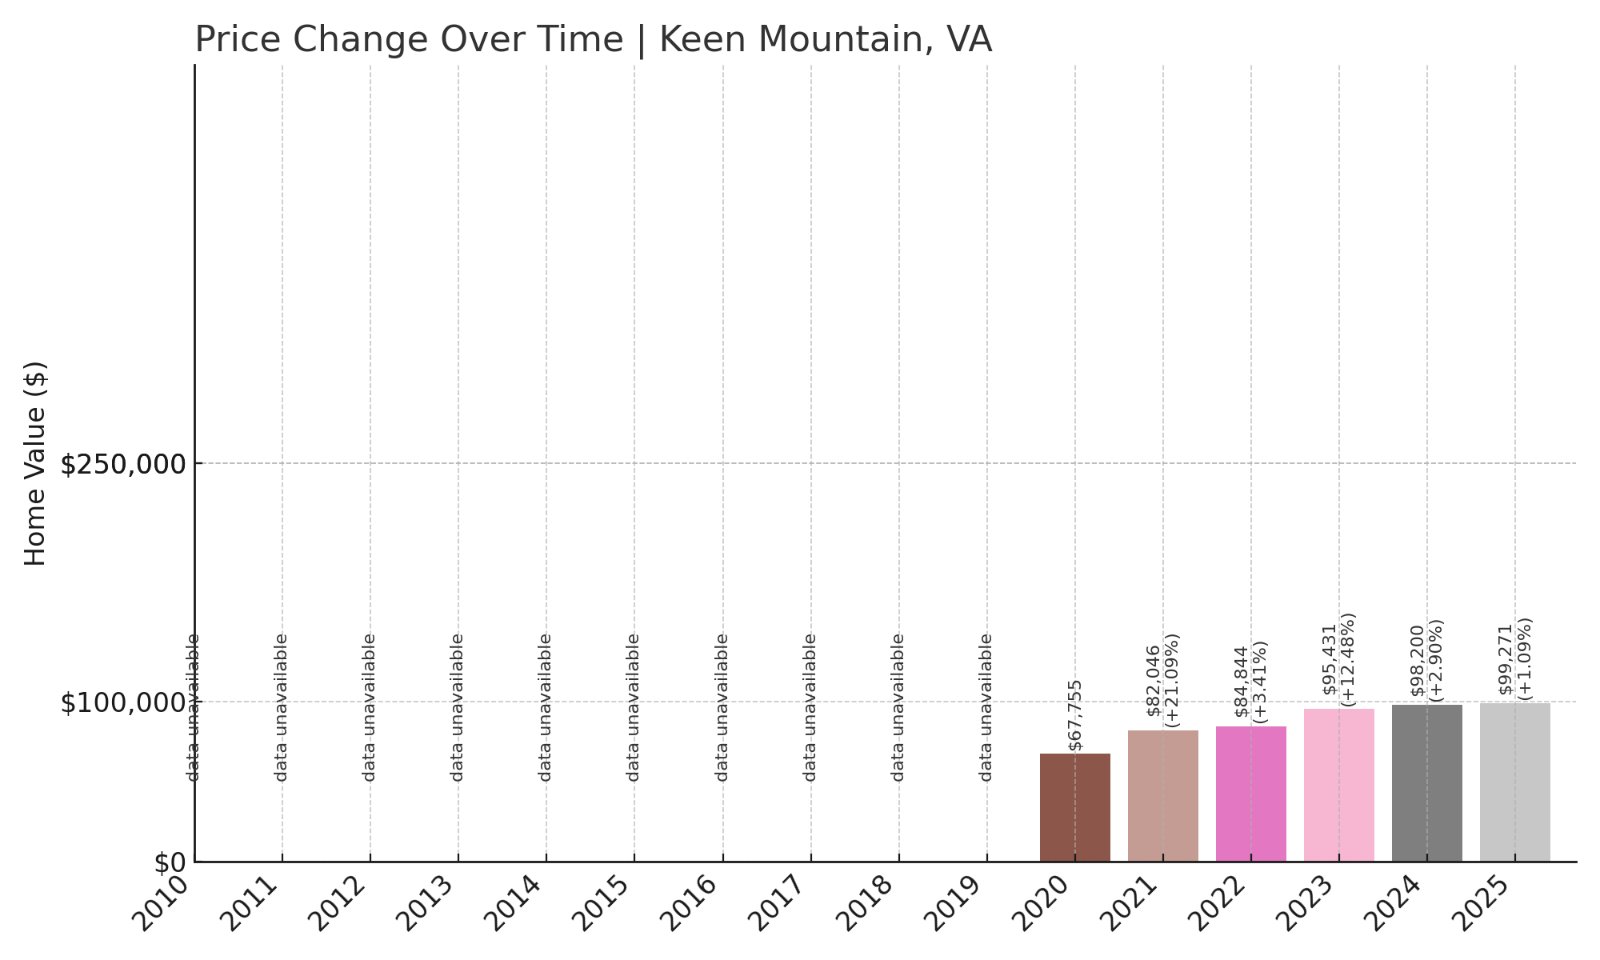
- 2020: $67,755
- 2021: $82,046 (+$14,291, +21.09% from previous year)
- 2022: $84,844 (+$2,798, +3.41% from previous year)
- 2023: $95,431 (+$10,587, +12.48% from previous year)
- 2024: $98,200 (+$2,768, +2.90% from previous year)
- 2025: $99,271 (+$1,072, +1.09% from previous year)
Keen Mountain’s home values have surged by 46% since 2020, reaching $99,271 in 2025. While growth slowed to just over 1% this year, the town’s prices remain at their highest recorded levels.
Keen Mountain – Modest Community Seeing Long-Term Price Growth
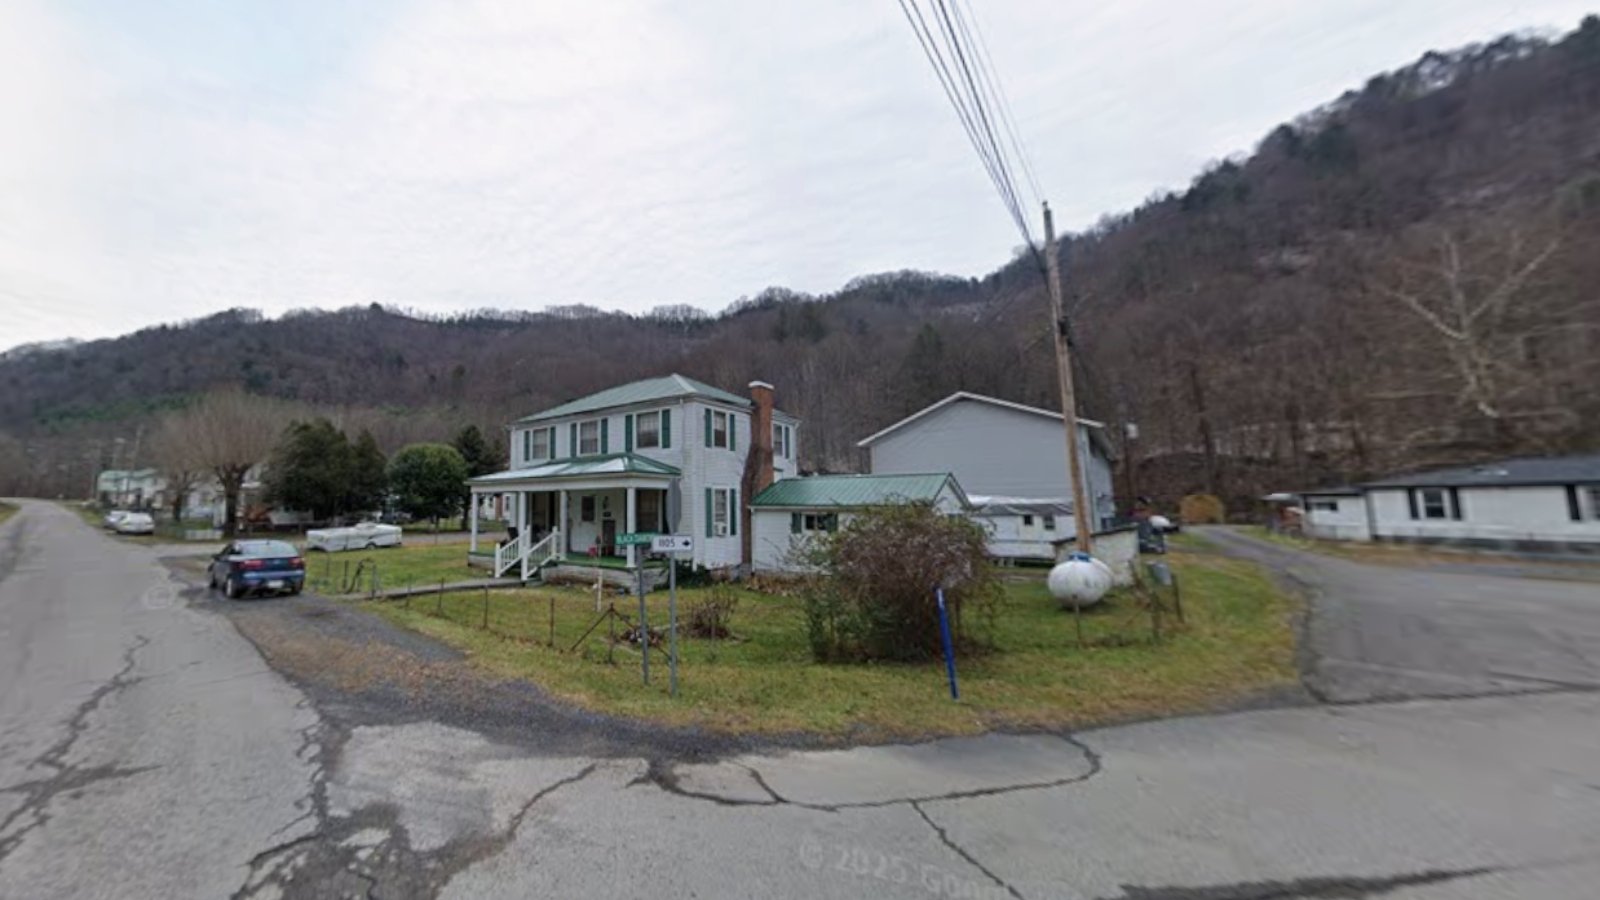
Keen Mountain is an unincorporated community in Buchanan County, Virginia, near the border with Russell County. Known mainly for its coal mining heritage, the area has limited retail or commercial infrastructure, but residents benefit from close-knit neighborhoods and quick access to the Clinch River area and local highways.
At $99,271 in 2025, average home prices are nearing the six-figure mark. The rapid increases over the last few years suggest renewed interest or investment in the region, even if recent growth has slowed. Buyers seeking affordable Appalachian housing near mining towns with deep local roots may find Keen Mountain’s market stability appealing.
13. Honaker – 42% Home Price Increase Since 2012
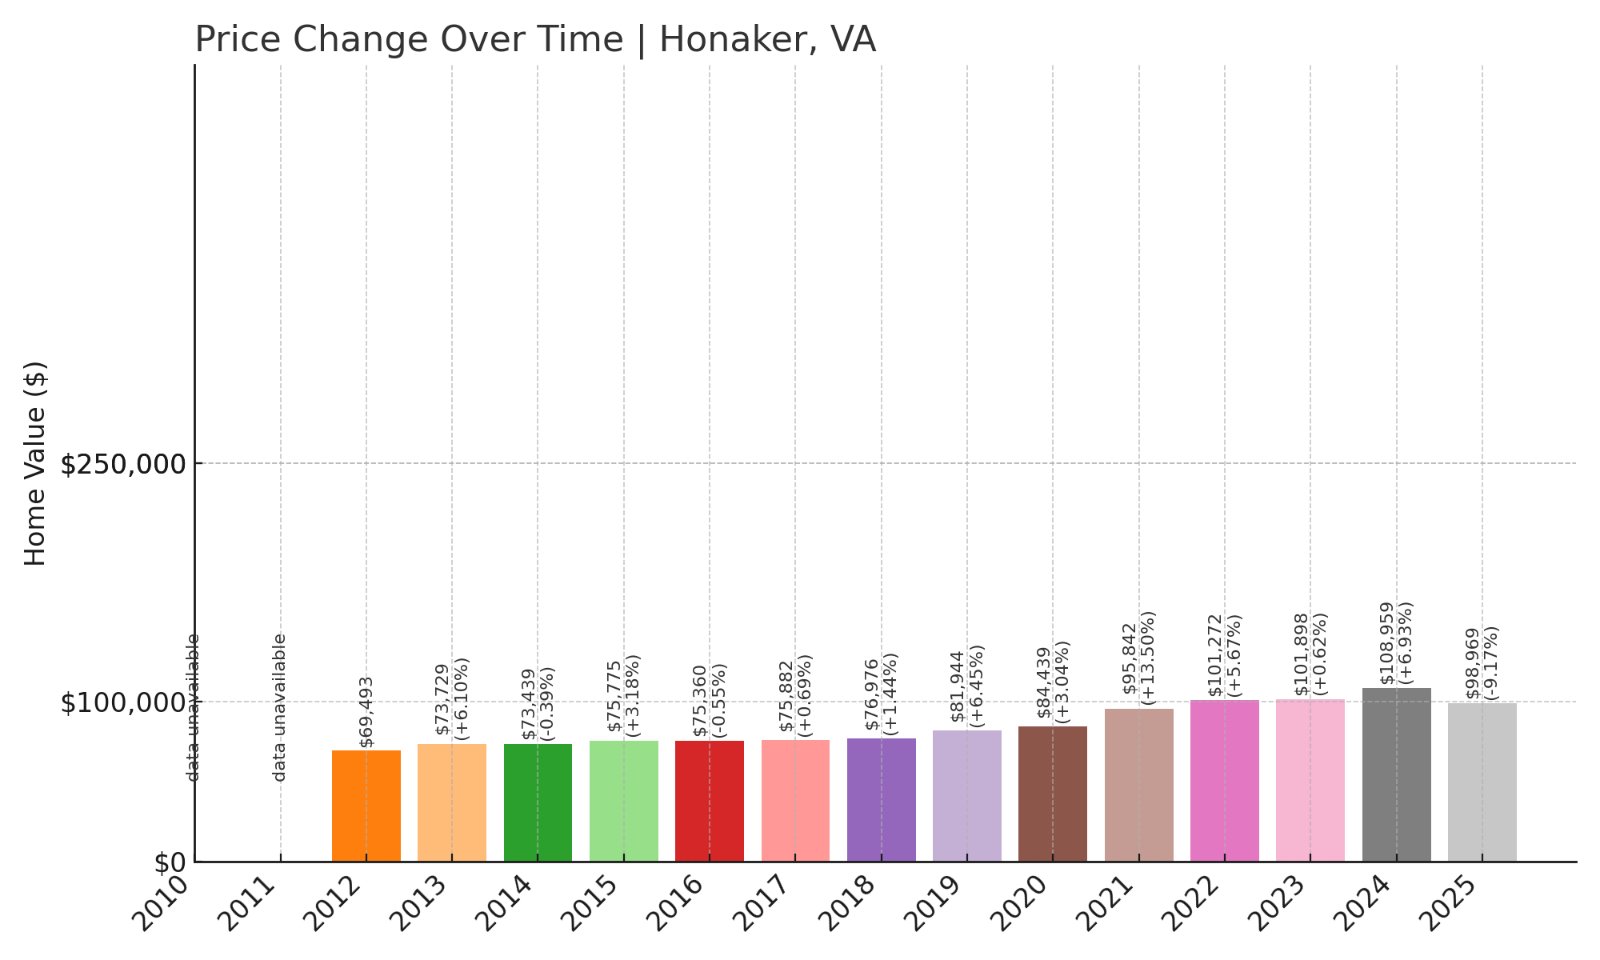
- 2012: $69,493
- 2013: $73,729 (+$4,236, +6.10% from previous year)
- 2014: $73,439 (-$291, -0.39% from previous year)
- 2015: $75,775 (+$2,336, +3.18% from previous year)
- 2016: $75,360 (-$414, -0.55% from previous year)
- 2017: $75,882 (+$522, +0.69% from previous year)
- 2018: $76,976 (+$1,094, +1.44% from previous year)
- 2019: $81,944 (+$4,968, +6.45% from previous year)
- 2020: $84,439 (+$2,495, +3.04% from previous year)
- 2021: $95,842 (+$11,404, +13.51% from previous year)
- 2022: $101,272 (+$5,430, +5.67% from previous year)
- 2023: $101,898 (+$626, +0.62% from previous year)
- 2024: $108,959 (+$7,061, +6.93% from previous year)
- 2025: $98,969 (-$9,990, -9.17% from previous year)
Honaker’s home prices have grown 42% since 2012, peaking in 2024 before dropping by 9% this year to $98,969. This decline still leaves prices significantly above their early 2010s levels.
Honaker – A Small Town Balancing Price Peaks and Corrections
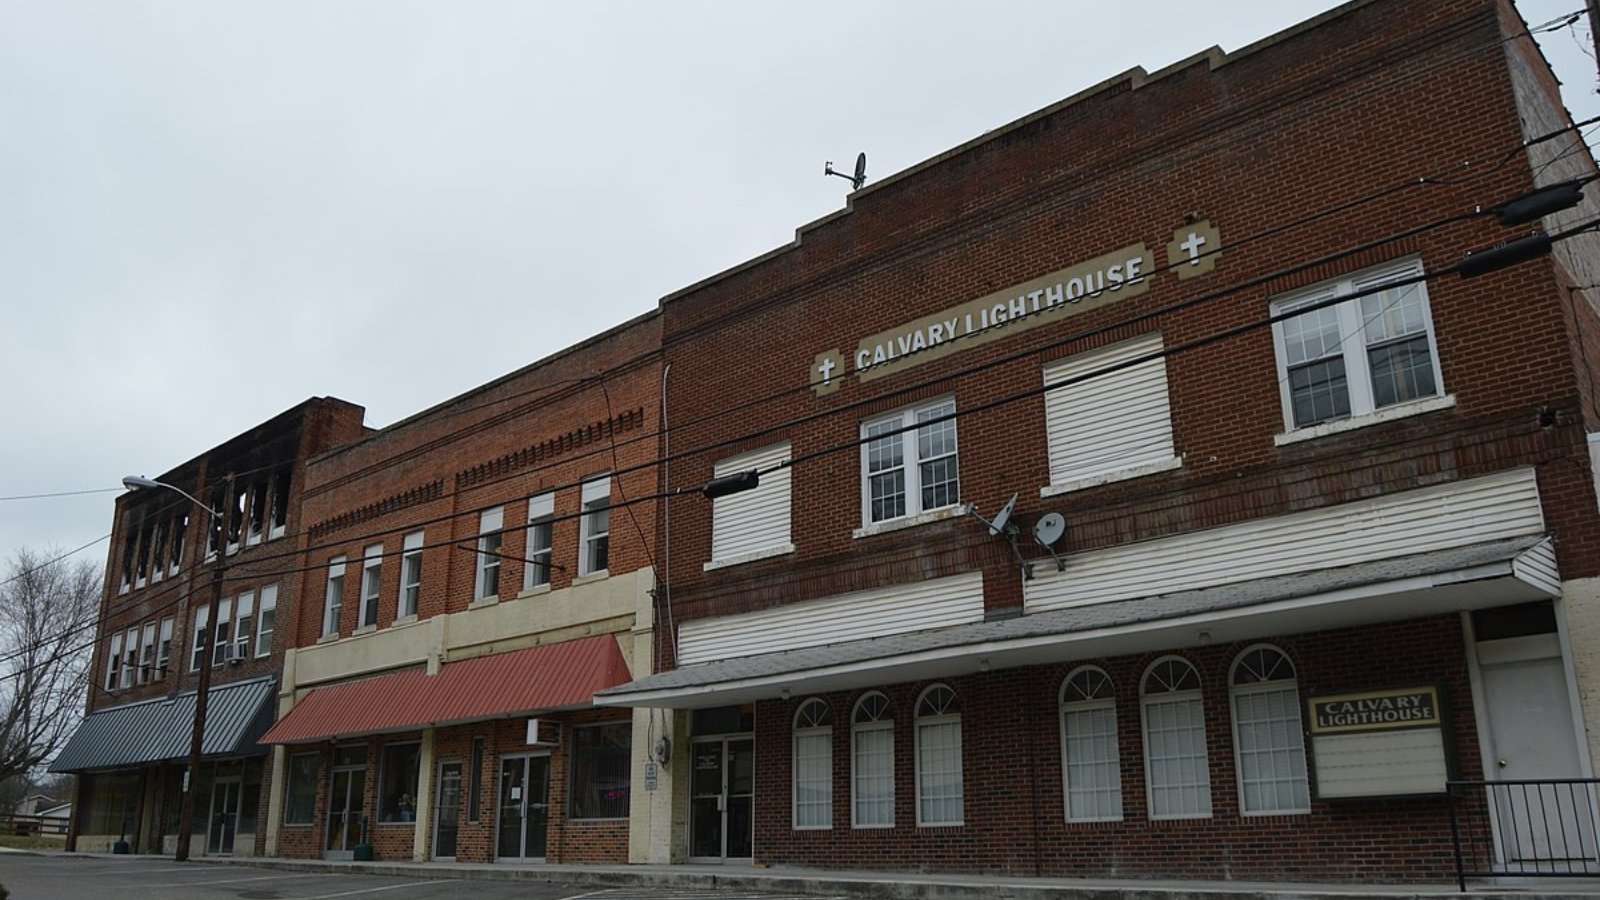
Honaker is located in Russell County, southwest Virginia. Known as the “Redbud Capital of the World,” it celebrates its famous Redbud Festival each spring, attracting visitors from across the region. Its historic downtown features local shops, churches, and community services that support its population of around 1,300 residents.
In 2025, the average home value is $98,969, down from $108,959 in 2024. While this represents a notable 9% drop, prices remain much higher than they were a decade ago. This pattern could indicate market corrections after strong growth, creating potential openings for buyers who previously found Honaker’s market out of reach.
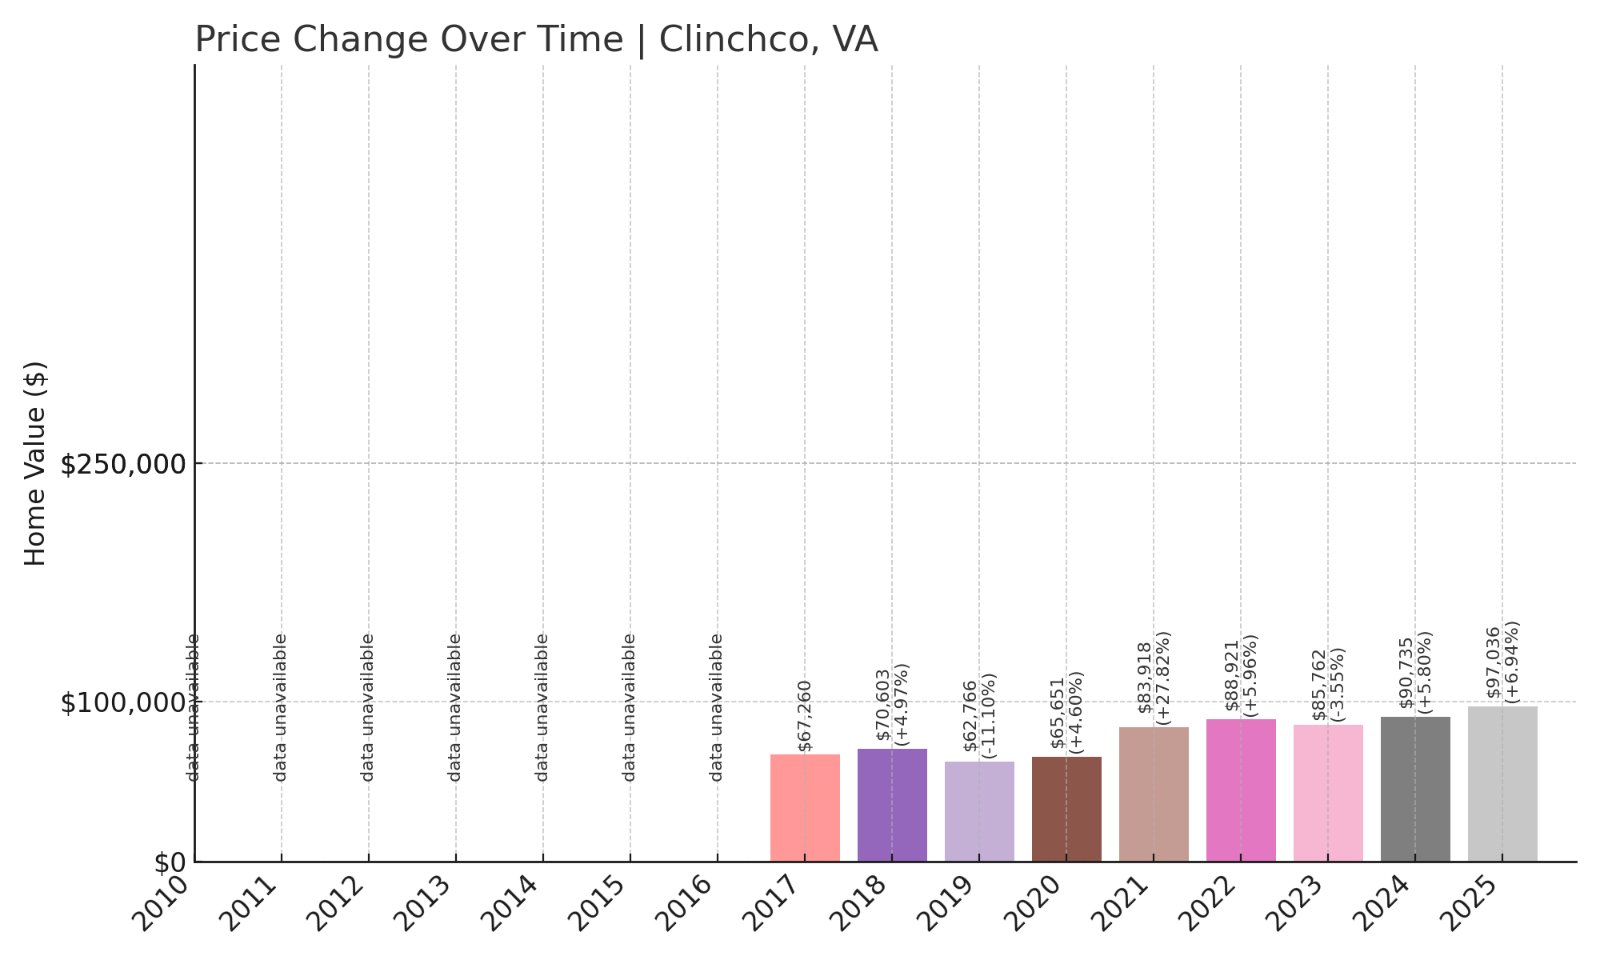
12. Clinchco – 44% Home Price Increase Since 2017
Would you like to save this?
- 2017: $67,260
- 2018: $70,603 (+$3,342, +4.97% from previous year)
- 2019: $62,766 (-$7,837, -11.10% from previous year)
- 2020: $65,651 (+$2,885, +4.60% from previous year)
- 2021: $83,918 (+$18,267, +27.82% from previous year)
- 2022: $88,921 (+$5,003, +5.96% from previous year)
- 2023: $85,762 (-$3,159, -3.55% from previous year)
- 2024: $90,735 (+$4,974, +5.80% from previous year)
- 2025: $97,036 (+$6,300, +6.94% from previous year)
Clinchco’s home values have increased by 44% since 2017, rising to $97,036 in 2025. The town saw strong gains this year, continuing its recovery from earlier market dips.
Clinchco – Small Town with Rebounding Prices
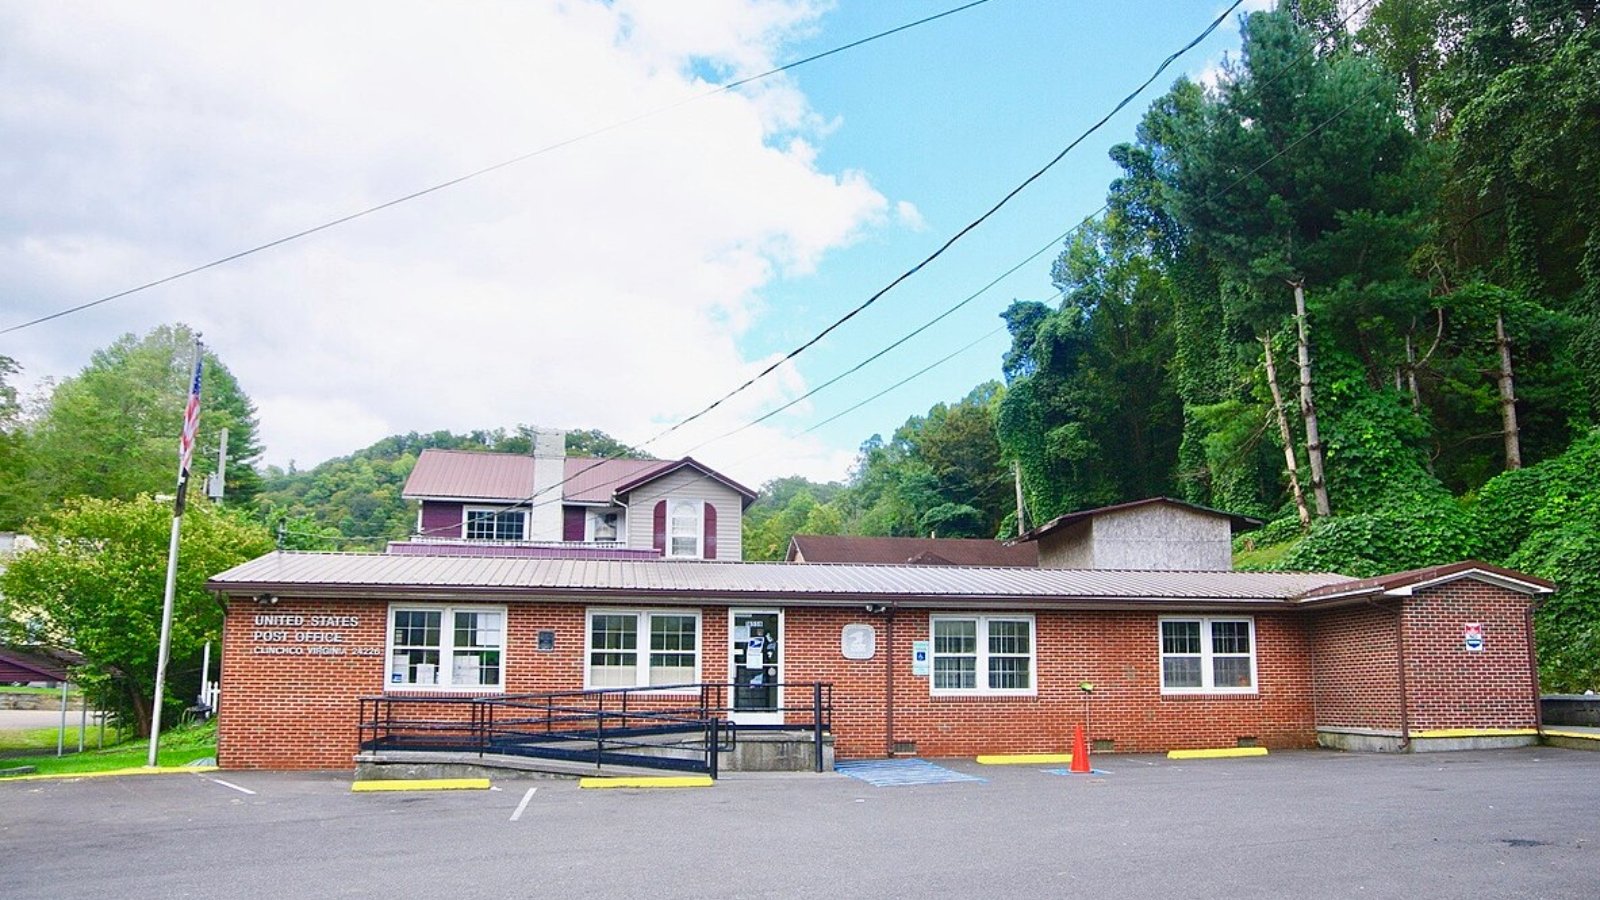
Clinchco is a small town in Dickenson County, nestled along the McClure River in the Appalachian Mountains. The town was founded in the early 20th century as a coal mining community, and its economy has since shifted towards services and local retail while maintaining its quiet, close-knit atmosphere.
In 2025, the average home price is $97,036, up nearly 7% from last year. The recent increase follows strong growth since 2021, reversing earlier declines seen in 2019. Clinchco remains a relatively affordable option for those seeking Appalachian living with access to mountain trails, river fishing, and scenic drives through southwestern Virginia.
11. Haysi – 33% Home Price Increase Since 2017
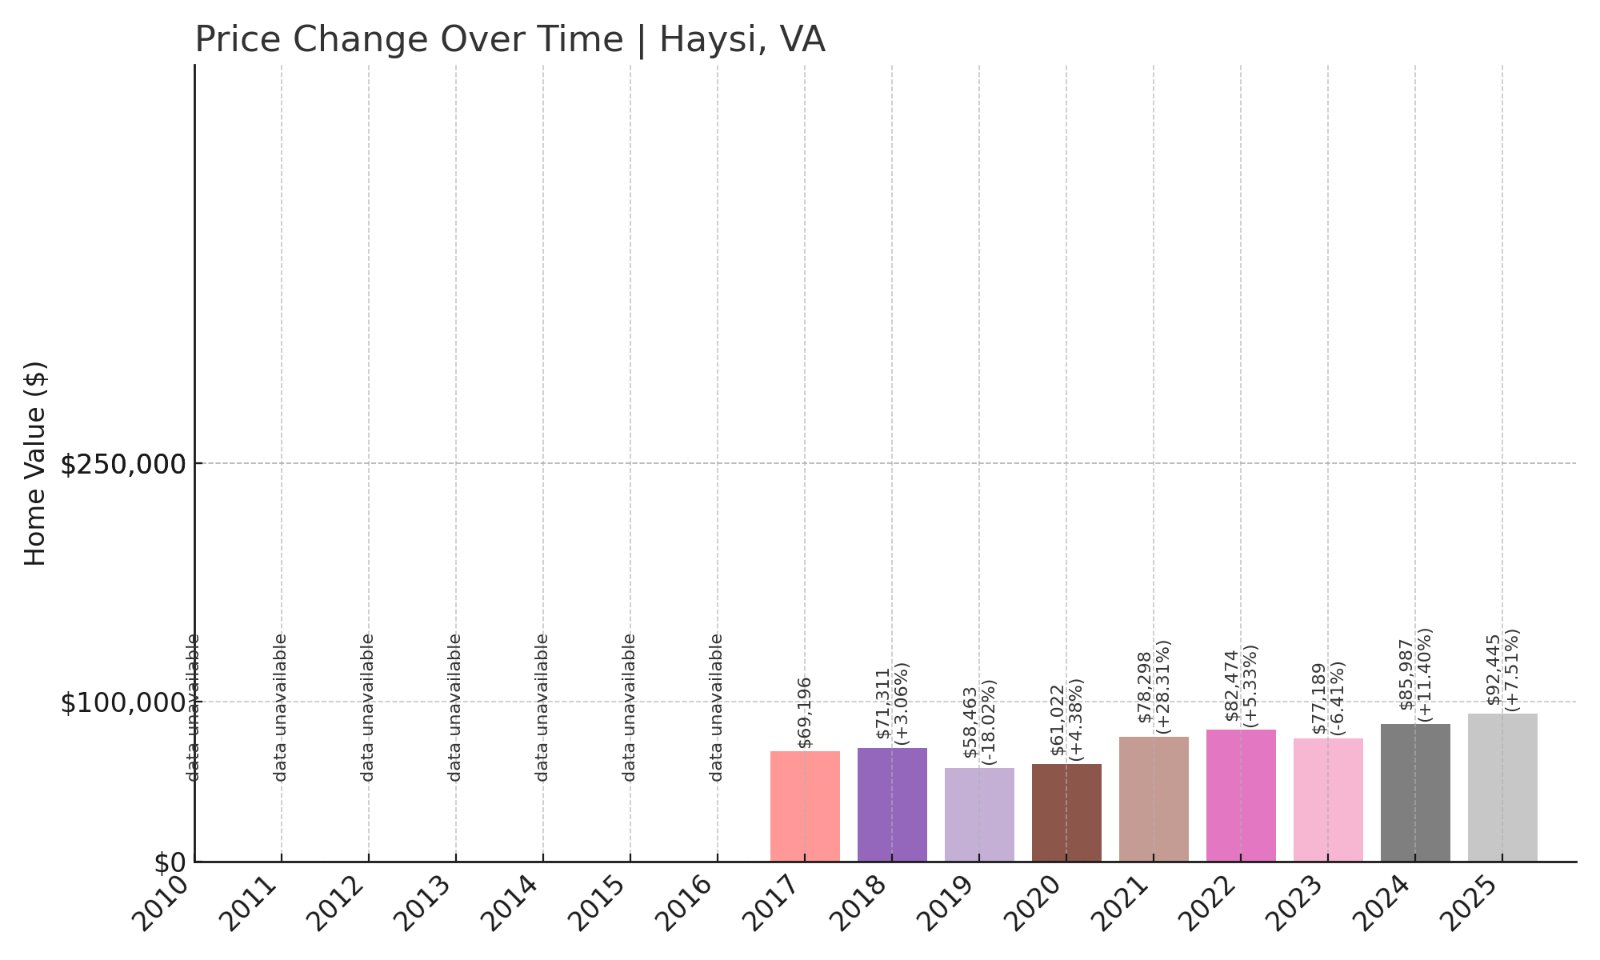
- 2017: $69,196
- 2018: $71,311 (+$2,115, +3.06% from previous year)
- 2019: $58,463 (-$12,848, -18.02% from previous year)
- 2020: $61,022 (+$2,559, +4.38% from previous year)
- 2021: $78,298 (+$17,276, +28.31% from previous year)
- 2022: $82,474 (+$4,176, +5.33% from previous year)
- 2023: $77,189 (-$5,285, -6.41% from previous year)
- 2024: $85,987 (+$8,798, +11.40% from previous year)
- 2025: $92,445 (+$6,458, +7.51% from previous year)
Haysi’s home prices have climbed 33% since 2017, with 2025 prices reaching $92,445. After some volatility, the town saw consistent growth over the last two years.
Haysi – Rebuilding Home Values After Past Declines
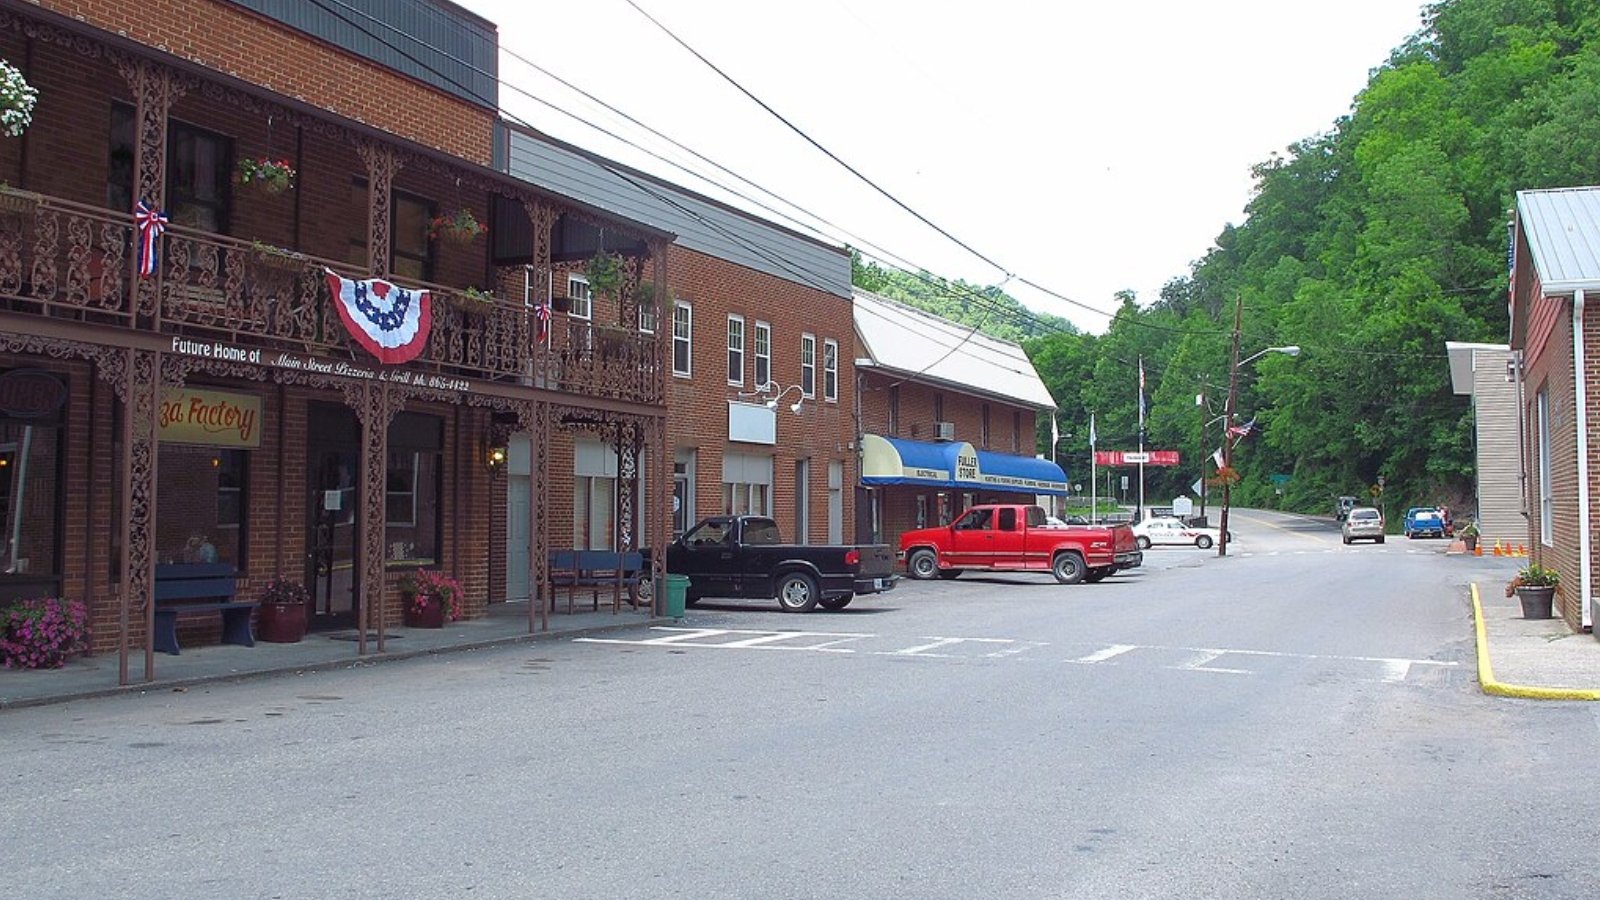
Haysi, located in Dickenson County, is known as the “Gateway to Breaks Interstate Park,” a major regional destination featuring canyons, rivers, and forest trails along the Virginia-Kentucky border. The town itself hosts local restaurants, a riverwalk, and community events celebrating Appalachian heritage.
In 2025, the average home price is $92,445, showing a 7.5% rise from 2024. This increase builds on strong growth in 2024, reversing the declines seen in 2019 and 2023. Buyers looking for scenic mountain living with easy access to outdoor recreation may find Haysi’s market conditions appealing as values continue their upward trend.
10. Pennington Gap – 44% Home Price Increase Since 2010
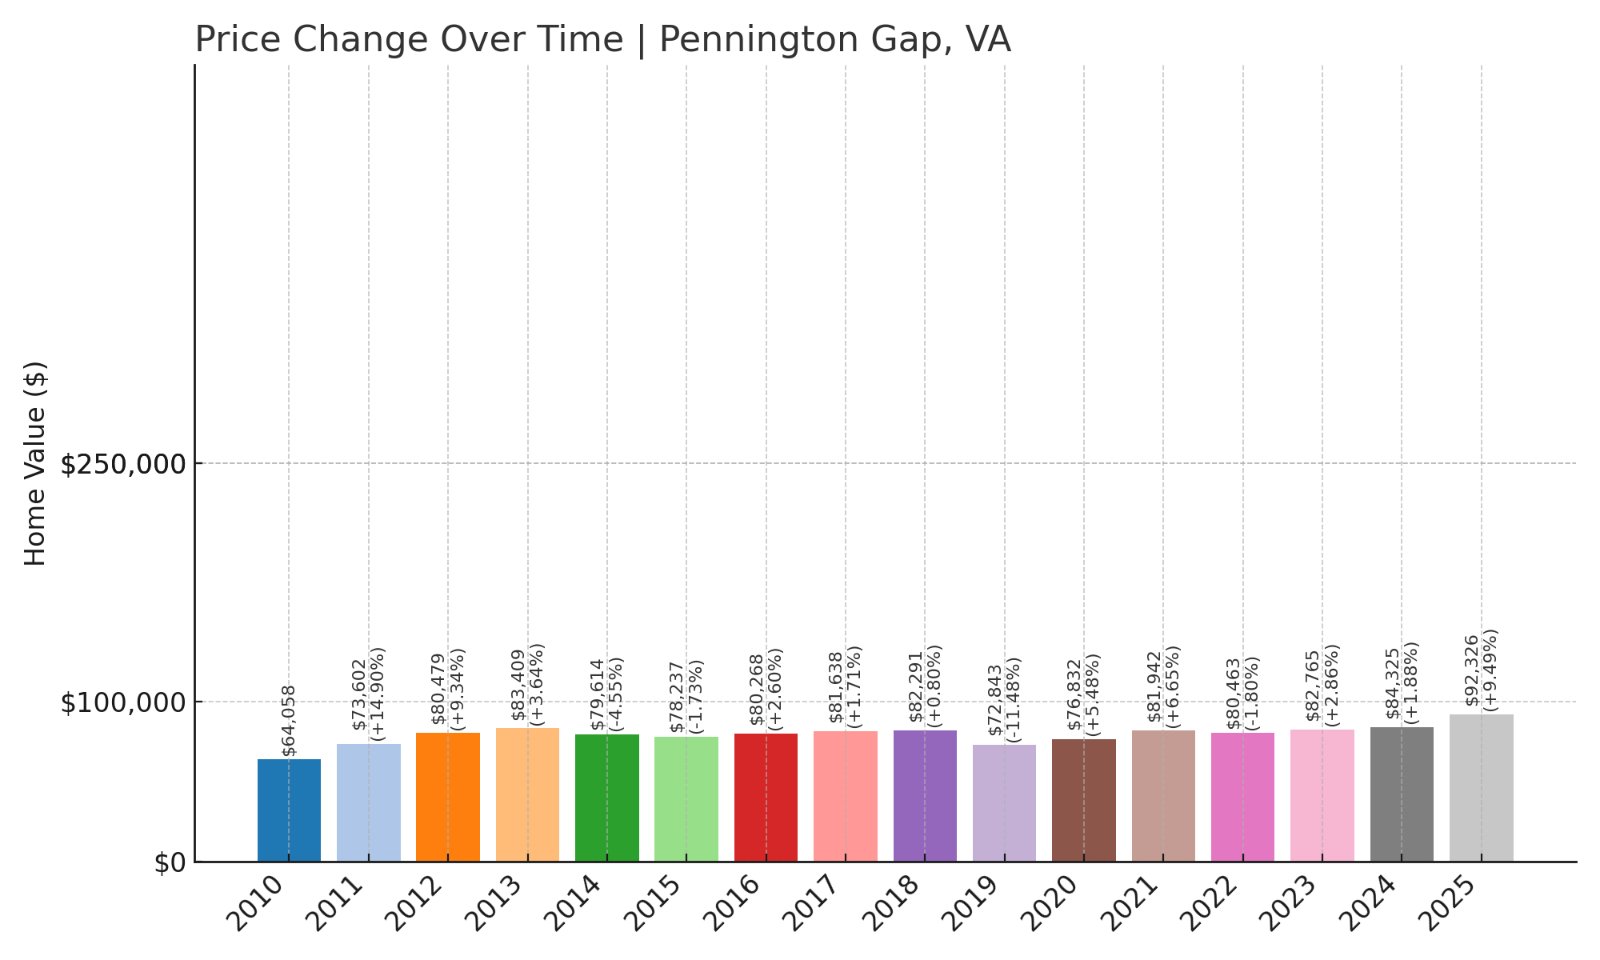
- 2010: $64,058
- 2011: $73,602 (+$9,544, +14.90% from previous year)
- 2012: $80,479 (+$6,877, +9.34% from previous year)
- 2013: $83,409 (+$2,930, +3.64% from previous year)
- 2014: $79,614 (-$3,795, -4.55% from previous year)
- 2015: $78,237 (-$1,377, -1.73% from previous year)
- 2016: $80,268 (+$2,031, +2.60% from previous year)
- 2017: $81,638 (+$1,370, +1.71% from previous year)
- 2018: $82,291 (+$653, +0.80% from previous year)
- 2019: $72,843 (-$9,448, -11.48% from previous year)
- 2020: $76,832 (+$3,989, +5.48% from previous year)
- 2021: $81,942 (+$5,110, +6.65% from previous year)
- 2022: $80,463 (-$1,479, -1.81% from previous year)
- 2023: $82,765 (+$2,302, +2.86% from previous year)
- 2024: $84,325 (+$1,561, +1.89% from previous year)
- 2025: $92,326 (+$8,000, +9.49% from previous year)
Pennington Gap’s home prices have increased by 44% since 2010, reaching $92,326 in 2025 after strong gains this year of nearly 10%.


Pennington Gap – Town Growth Strengthening Housing Values
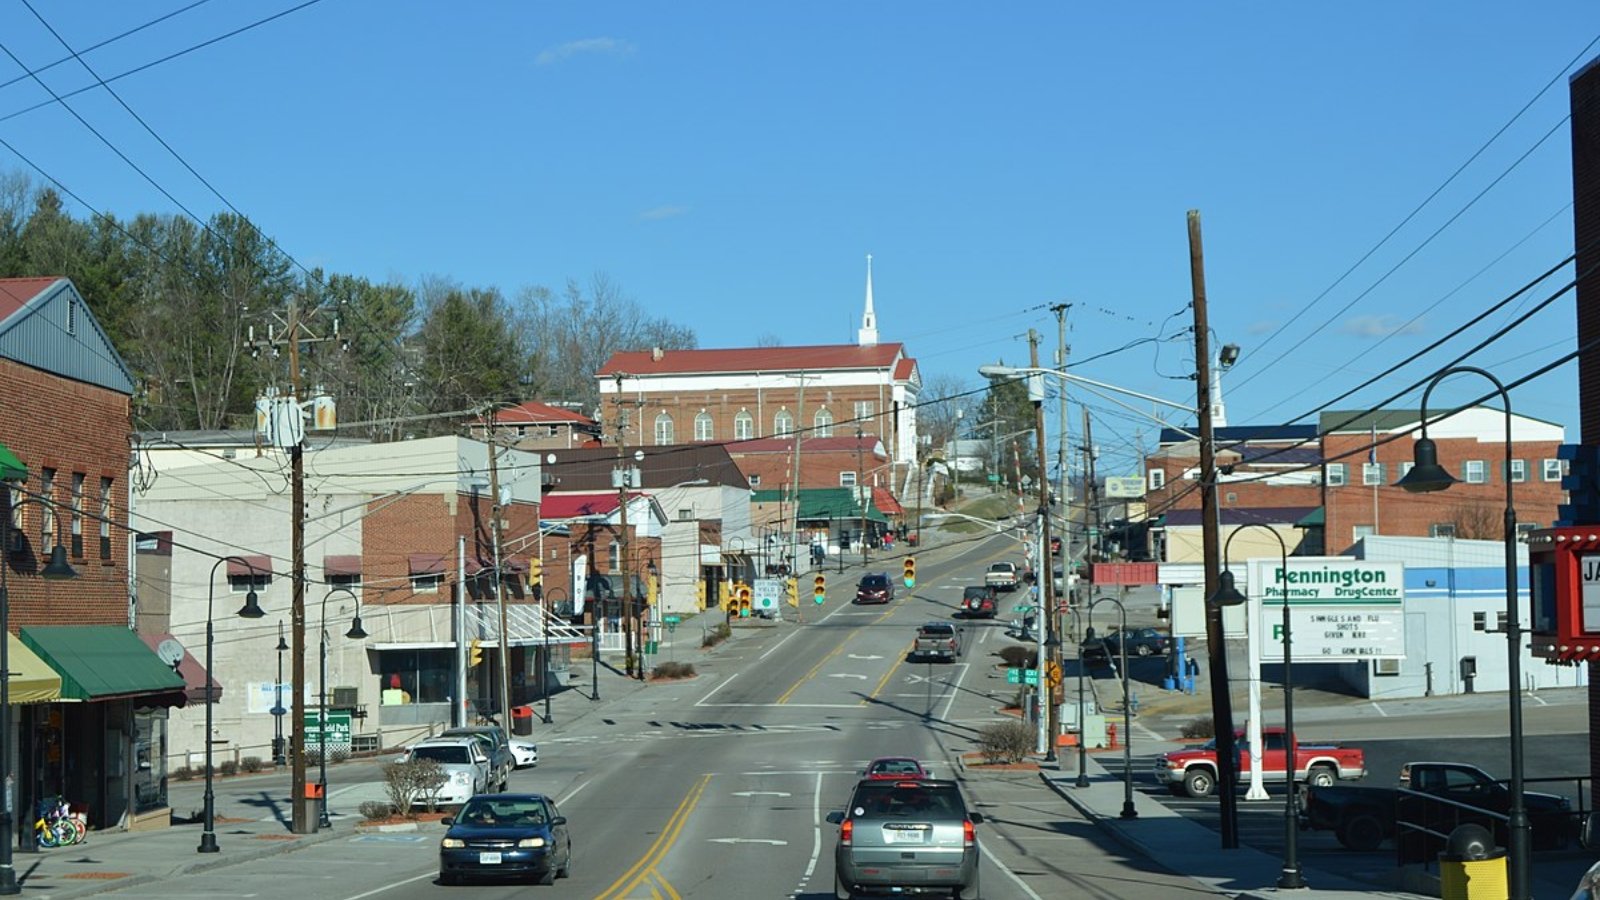
Pennington Gap, in Lee County, is the largest town in Virginia’s westernmost county. It serves as a regional center with healthcare facilities, schools, and shopping, including the Lee Regional Medical Center and small retail chains. The town is surrounded by the Appalachian Mountains, providing residents with forest views and nearby hiking trails.
Home values here reached $92,326 in 2025, up nearly 10% from the previous year. This strong growth continues Pennington Gap’s long-term price increase trend, driven by local economic resilience and its role as a services hub for smaller surrounding communities. For buyers, it remains one of southwest Virginia’s affordable yet steadily appreciating markets.
9. Raven – 34% Home Price Increase Since 2010
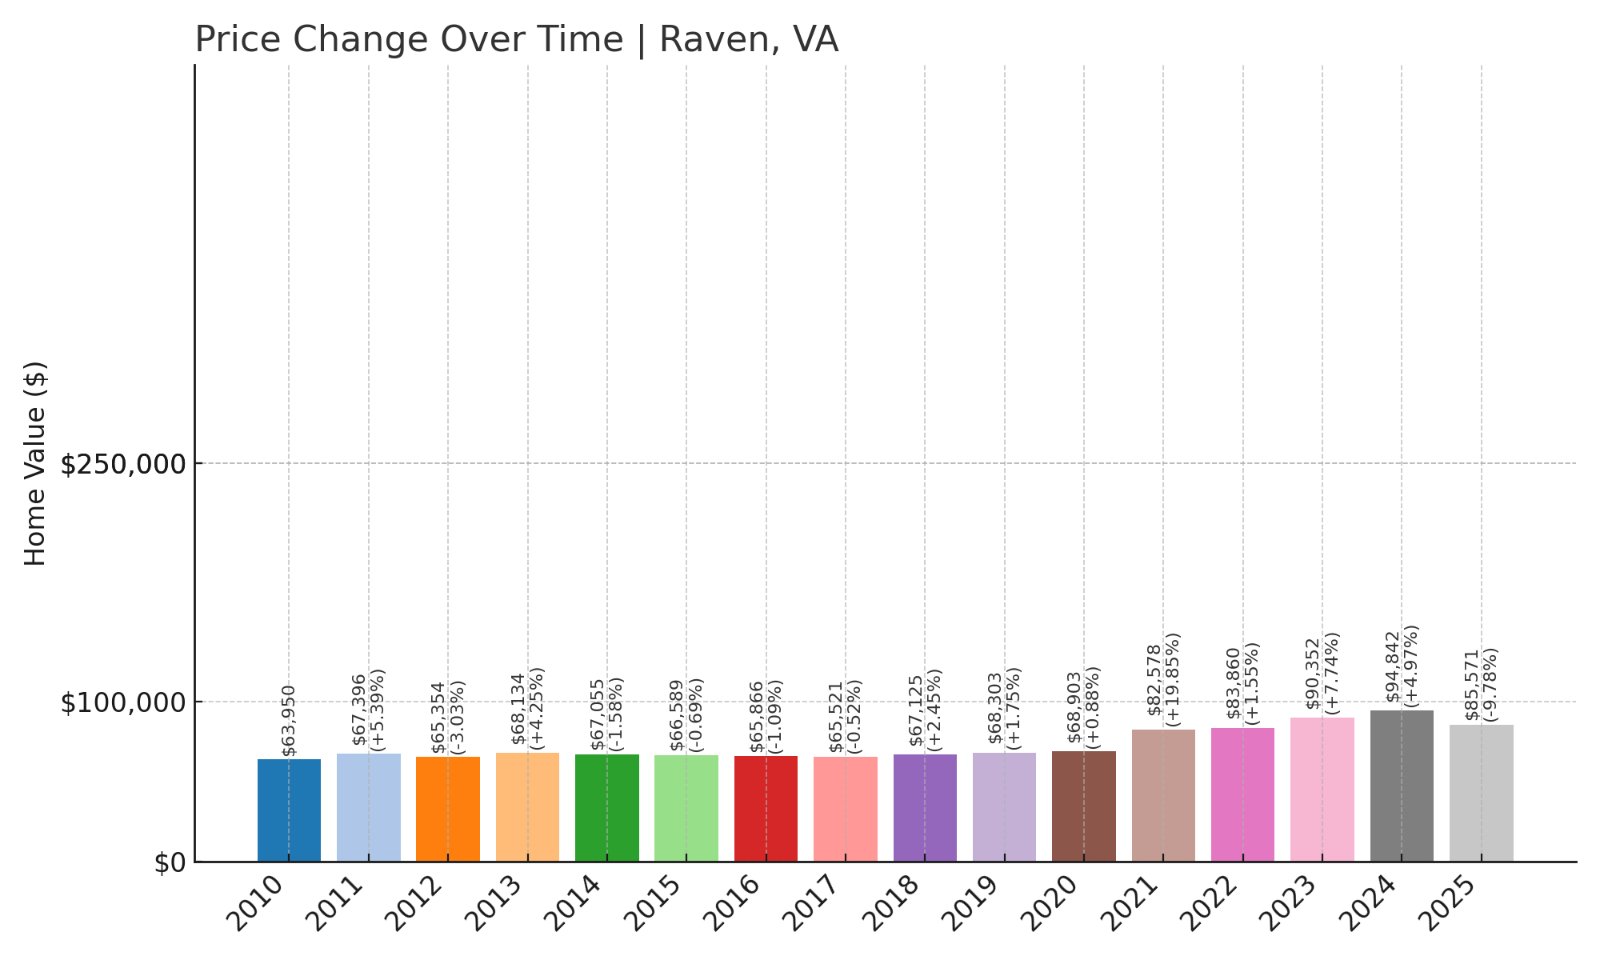
- 2010: $63,950
- 2011: $67,396 (+$3,446, +5.39% from previous year)
- 2012: $65,354 (-$2,042, -3.03% from previous year)
- 2013: $68,134 (+$2,780, +4.25% from previous year)
- 2014: $67,055 (-$1,079, -1.58% from previous year)
- 2015: $66,589 (-$466, -0.70% from previous year)
- 2016: $65,866 (-$724, -1.09% from previous year)
- 2017: $65,521 (-$344, -0.52% from previous year)
- 2018: $67,125 (+$1,604, +2.45% from previous year)
- 2019: $68,303 (+$1,178, +1.76% from previous year)
- 2020: $68,903 (+$600, +0.88% from previous year)
- 2021: $82,578 (+$13,674, +19.85% from previous year)
- 2022: $83,860 (+$1,282, +1.55% from previous year)
- 2023: $90,352 (+$6,492, +7.74% from previous year)
- 2024: $94,842 (+$4,490, +4.97% from previous year)
- 2025: $85,571 (-$9,271, -9.78% from previous year)
Raven’s home prices rose 34% since 2010, though prices dropped nearly 10% in 2025, bringing the current average down to $85,571.
Raven – Market Cooling After Years of Gains
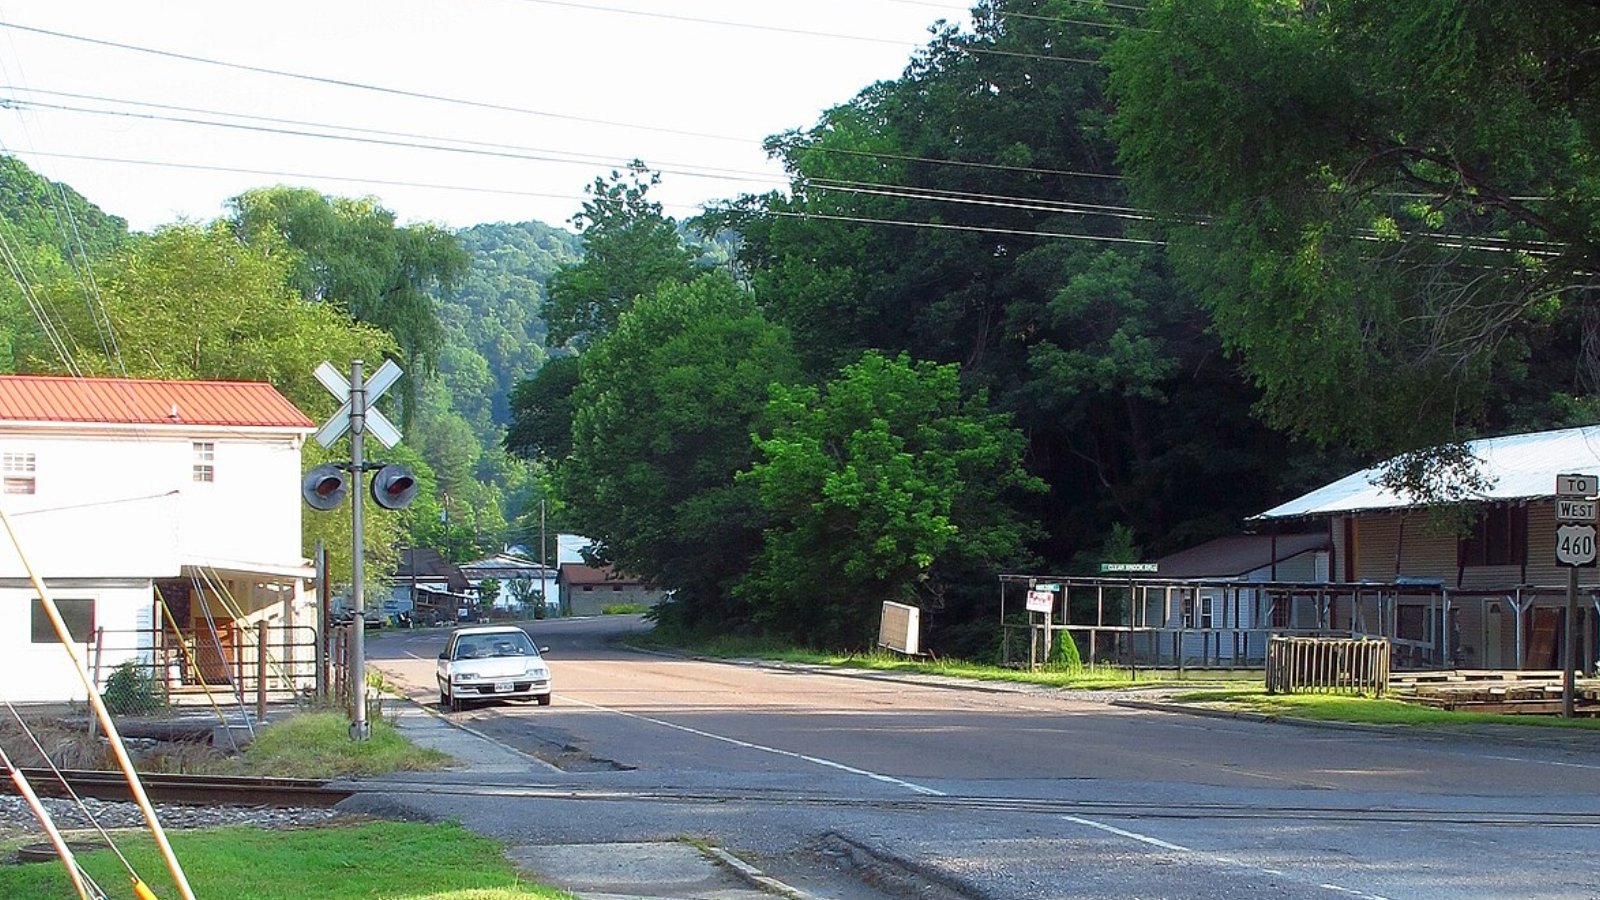
Raven is a small census-designated place spanning Russell and Tazewell counties. The community has a coal mining history and today serves primarily as a residential area with local stores and services supporting its residents.
In 2025, average home prices stand at $85,571 after a significant drop from $94,842 in 2024. This nearly 10% decline contrasts with prior steady gains, particularly the sharp jump in 2021. Market watchers may see this as a price correction, potentially opening buying opportunities for those seeking affordable housing in southwest Virginia.
8. Davenport – 9% Home Price Increase Since 2020
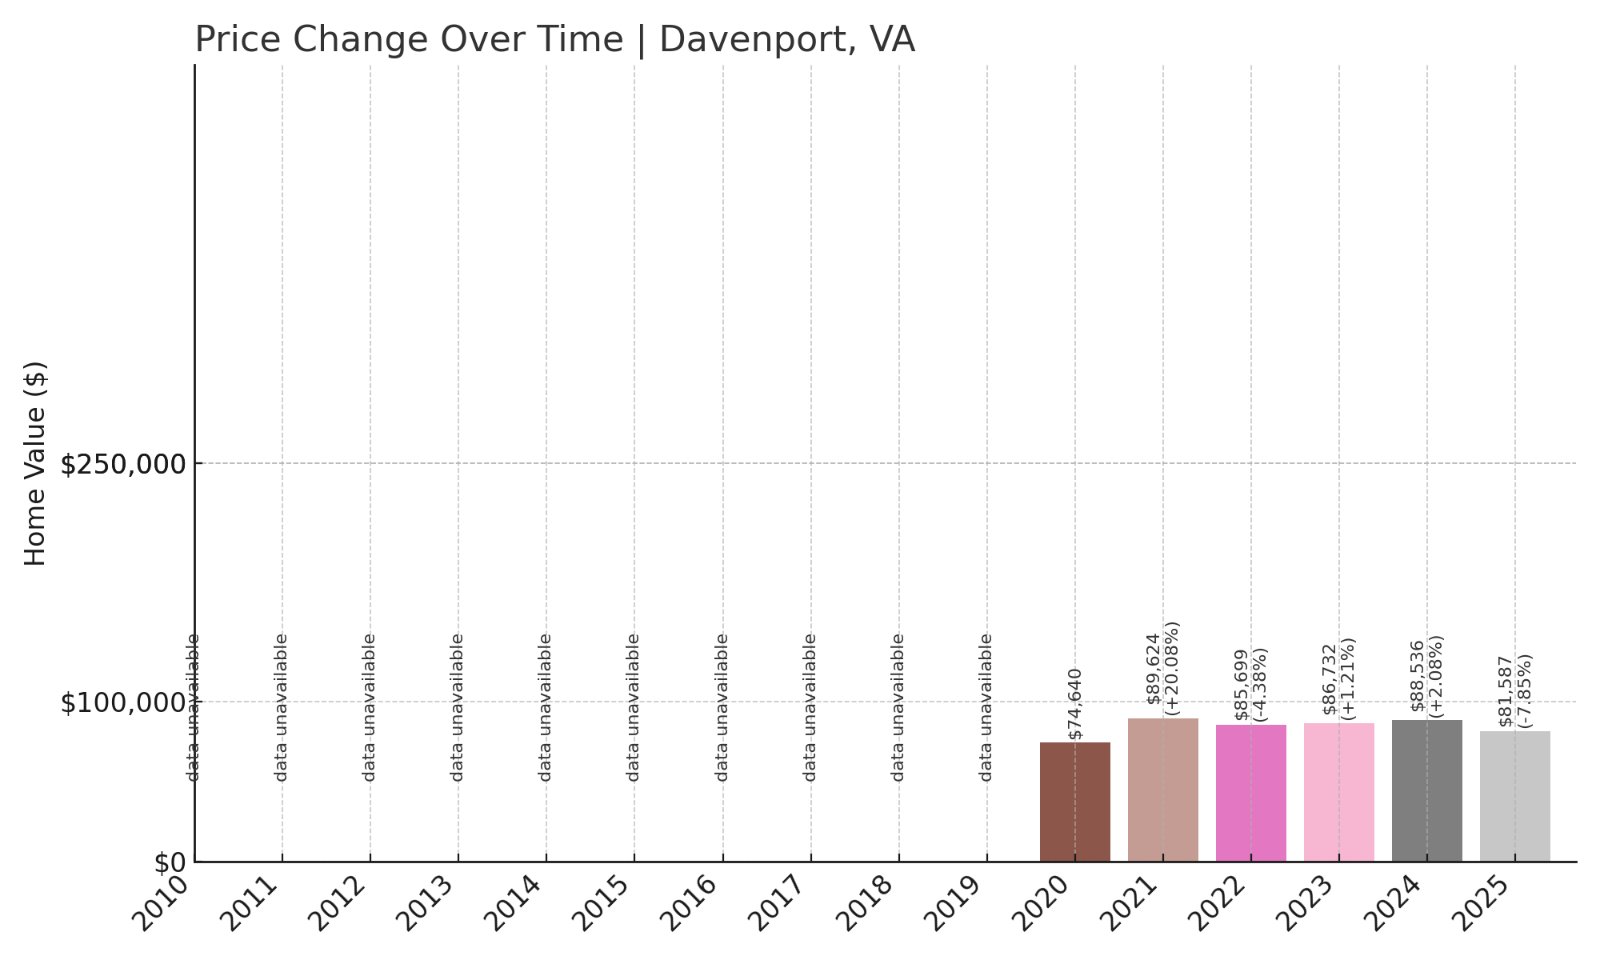
- 2020: $74,640
- 2021: $89,624 (+$14,984, +20.07% from previous year)
- 2022: $85,699 (-$3,925, -4.38% from previous year)
- 2023: $86,732 (+$1,033, +1.21% from previous year)
- 2024: $88,536 (+$1,804, +2.08% from previous year)
- 2025: $81,587 (-$6,949, -7.85% from previous year)
Davenport’s home prices have increased by 9% since 2020, despite a nearly 8% drop in 2025 that brought average values down to $81,587.
Davenport – Rural Community Experiencing Market Adjustments
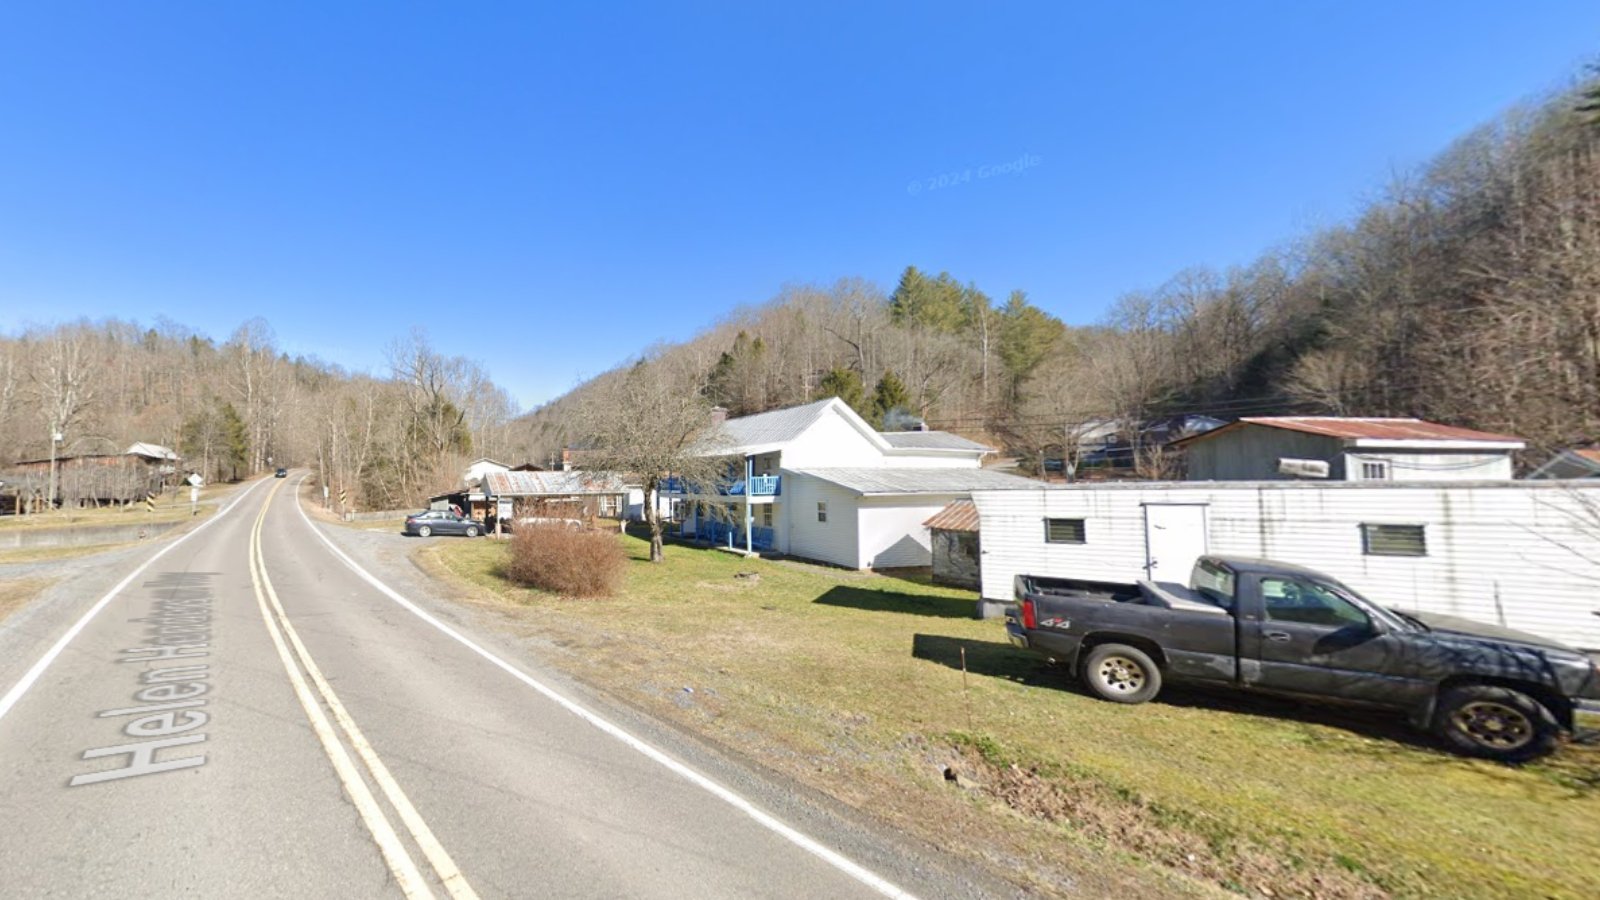
Davenport is an unincorporated community in Buchanan County, located near the Russell County line in southwest Virginia. It is a quiet area known for its rural landscapes and small residential neighborhoods. Residents often rely on nearby towns like Grundy for larger shopping and medical services.
In 2025, the average home price is $81,587, following a nearly 8% decline from the previous year. This decrease reverses steady gains since 2021, including a significant 20% jump that year. The recent drop may reflect market corrections or shifts in regional demand, potentially making Davenport more attractive for buyers seeking quiet Appalachian living at lower price points.
7. Grundy – 22% Home Price Increase Since 2014
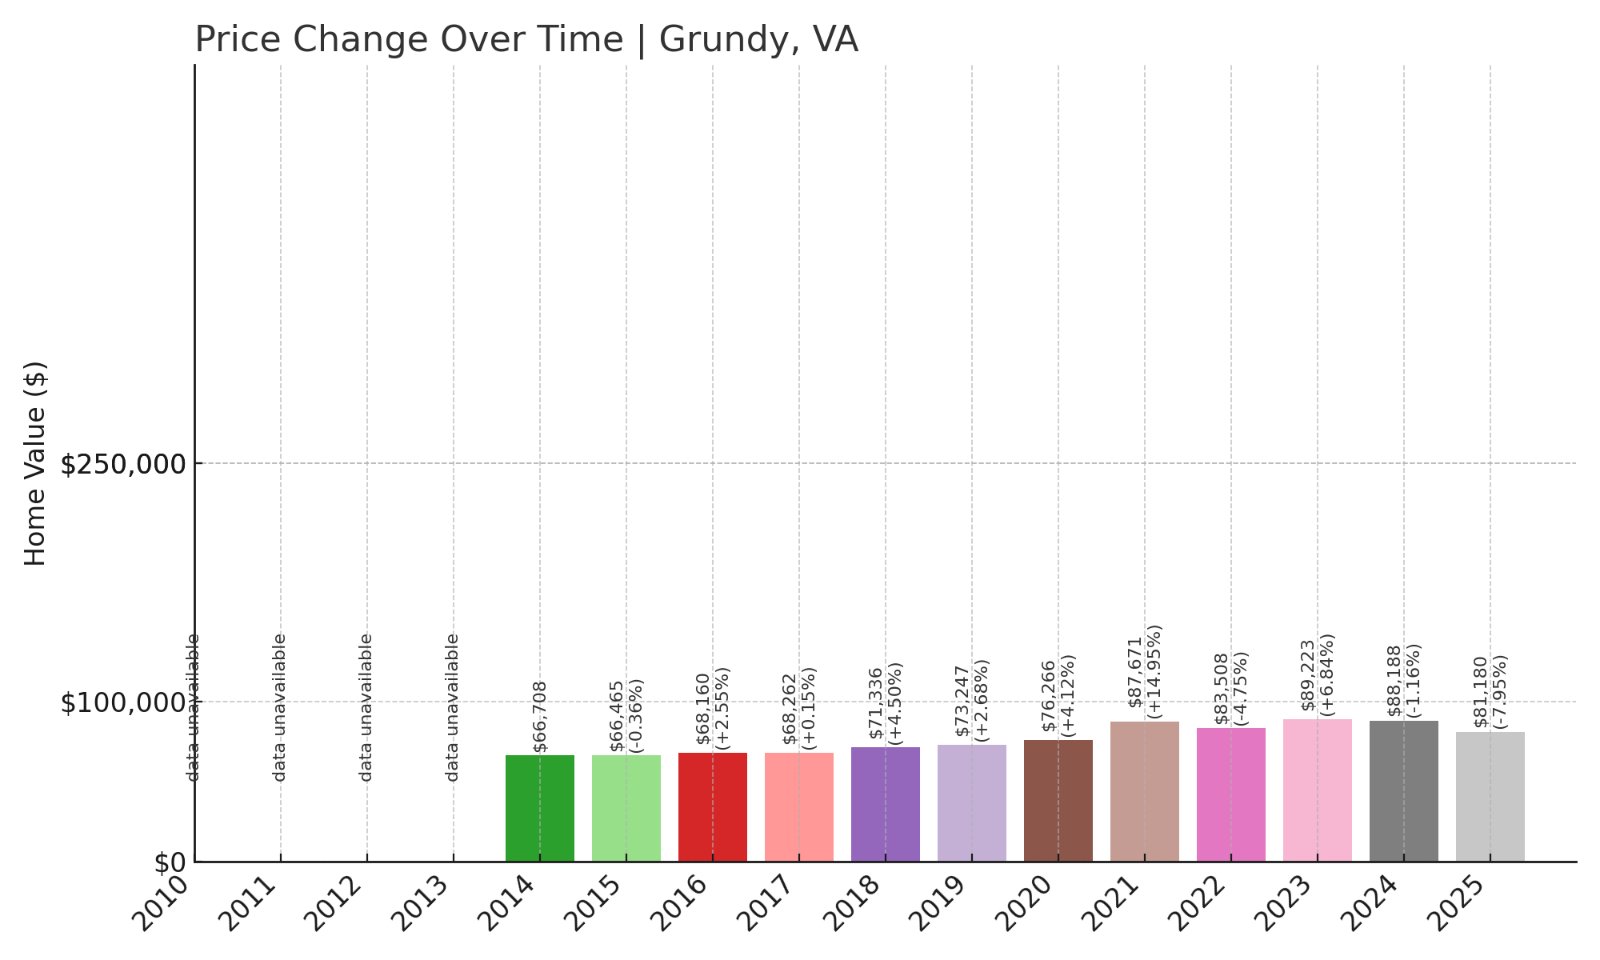
- 2014: $66,708
- 2015: $66,465 (-$243, -0.36% from previous year)
- 2016: $68,160 (+$1,695, +2.55% from previous year)
- 2017: $68,262 (+$101, +0.15% from previous year)
- 2018: $71,336 (+$3,074, +4.50% from previous year)
- 2019: $73,247 (+$1,912, +2.68% from previous year)
- 2020: $76,266 (+$3,018, +4.12% from previous year)
- 2021: $87,671 (+$11,405, +14.95% from previous year)
- 2022: $83,508 (-$4,164, -4.75% from previous year)
- 2023: $89,223 (+$5,715, +6.84% from previous year)
- 2024: $88,188 (-$1,035, -1.16% from previous year)
- 2025: $81,180 (-$7,008, -7.95% from previous year)
Grundy’s home prices have risen 22% since 2014, though recent declines brought 2025 values down to $81,180, nearly 8% lower than last year.
Grundy – Town Adapting to Shifts in Coal Country
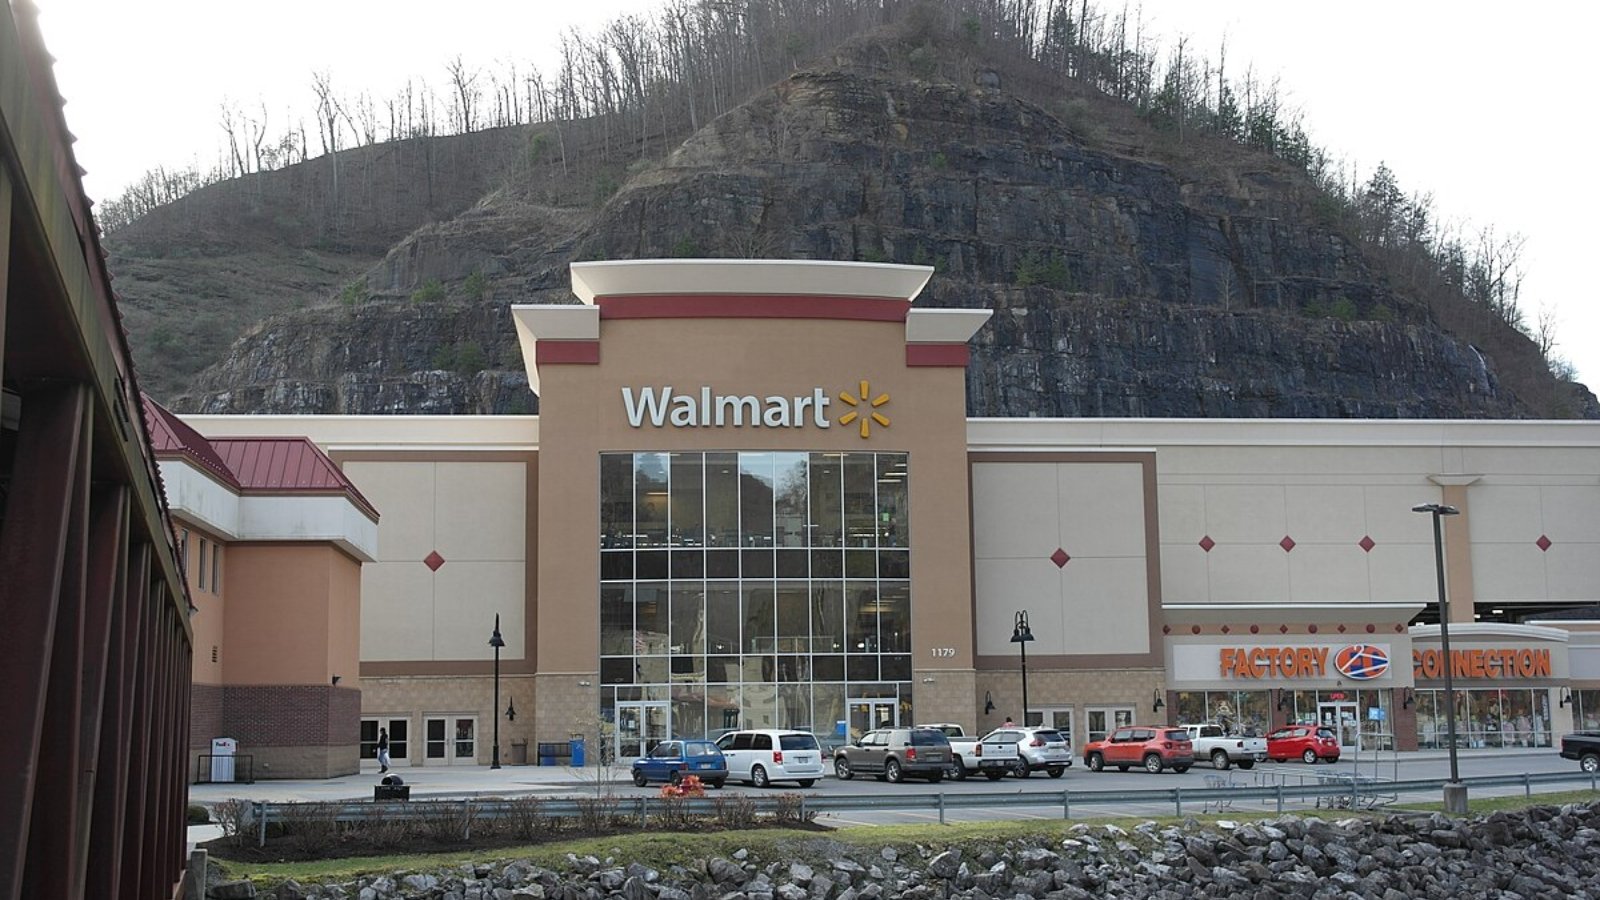
Grundy, the county seat of Buchanan County, sits along the Levisa Fork River in Virginia’s coalfields. Known for the Appalachian School of Law and new commercial developments after past flooding relocations, Grundy balances its coal heritage with educational and retail growth.
Average home prices reached $81,180 in 2025, falling nearly 8% from 2024. While recent years have shown volatility, including a strong 15% increase in 2021, the longer-term trend remains upward since 2014. Buyers looking for small-town living with educational institutions and access to regional shopping centers may find opportunities as prices adjust this year.
6. Hurley – 27% Home Price Increase Since 2019
Would you like to save this?
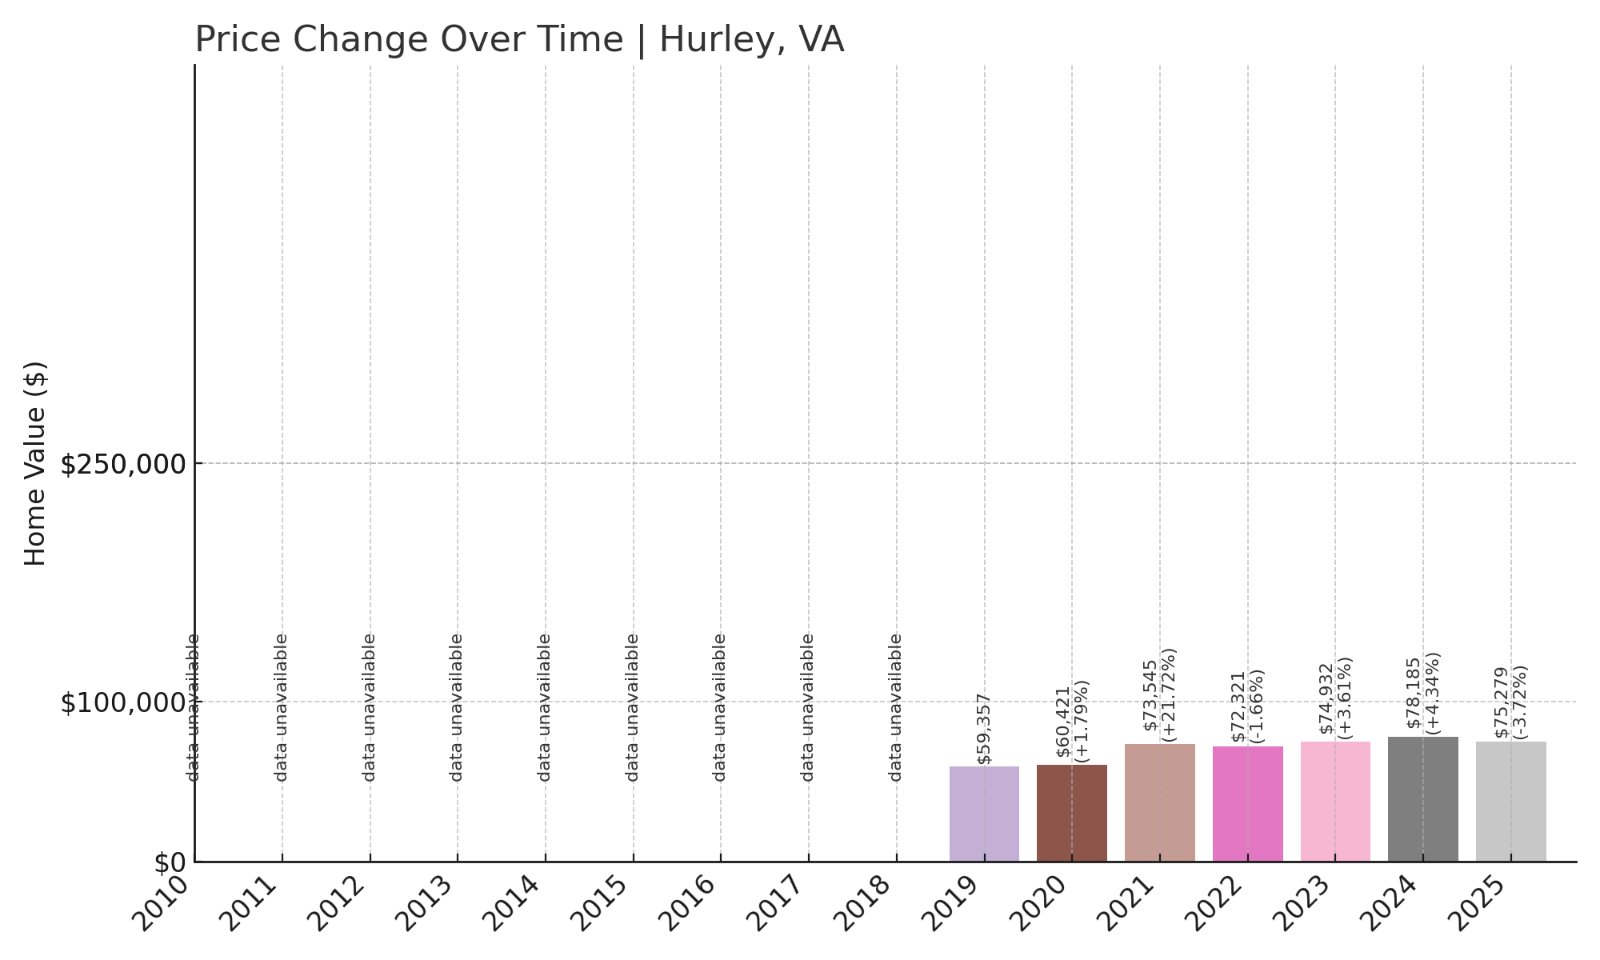
- 2019: $59,357
- 2020: $60,421 (+$1,064, +1.79% from previous year)
- 2021: $73,545 (+$13,124, +21.72% from previous year)
- 2022: $72,321 (-$1,224, -1.66% from previous year)
- 2023: $74,932 (+$2,610, +3.61% from previous year)
- 2024: $78,185 (+$3,254, +4.34% from previous year)
- 2025: $75,279 (-$2,906, -3.72% from previous year)
Hurley’s home prices have risen 27% since 2019, despite a nearly 4% drop this year to an average of $75,279 in 2025.
Hurley – Recovering Community with Recent Declines
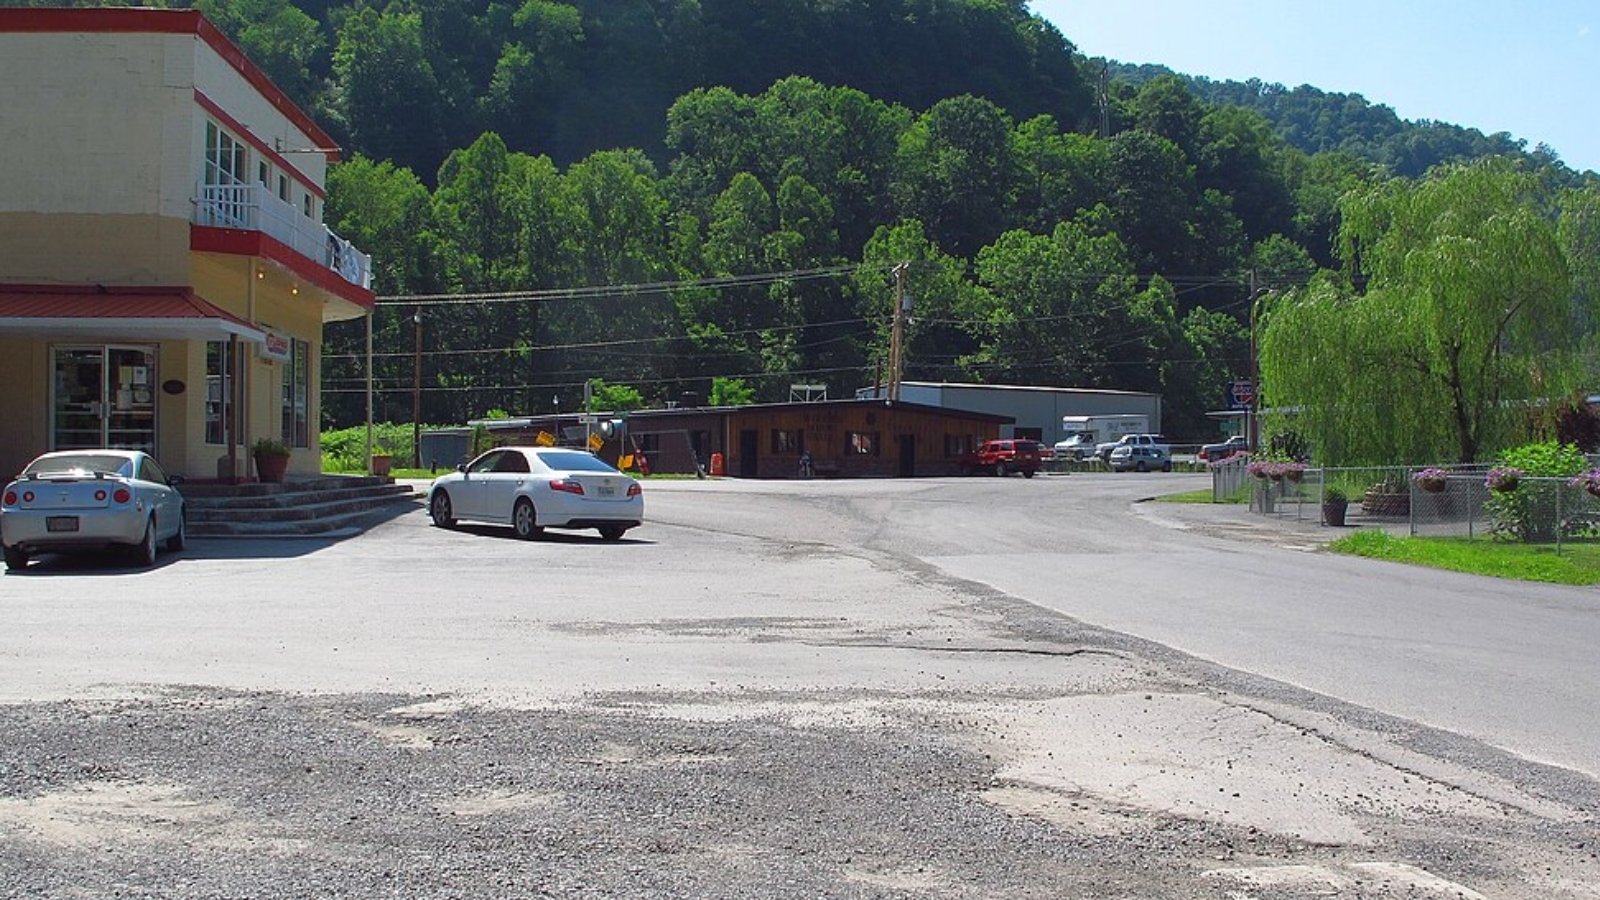
Hurley is a small unincorporated community in Buchanan County near the Kentucky border. It was heavily impacted by flooding in 2021, prompting recovery efforts and state-level infrastructure investments to restore homes and roads in the area.
In 2025, home values average $75,279, down almost 4% from 2024. The price dip follows a period of strong growth, including a dramatic 22% rise in 2021 as homes were rebuilt and renovated after flood damage. Hurley remains a tight-knit Appalachian community, and current market adjustments may offer buyers affordable housing options while the area continues rebuilding efforts.
5. Oakwood – 8% Home Price Increase Since 2019
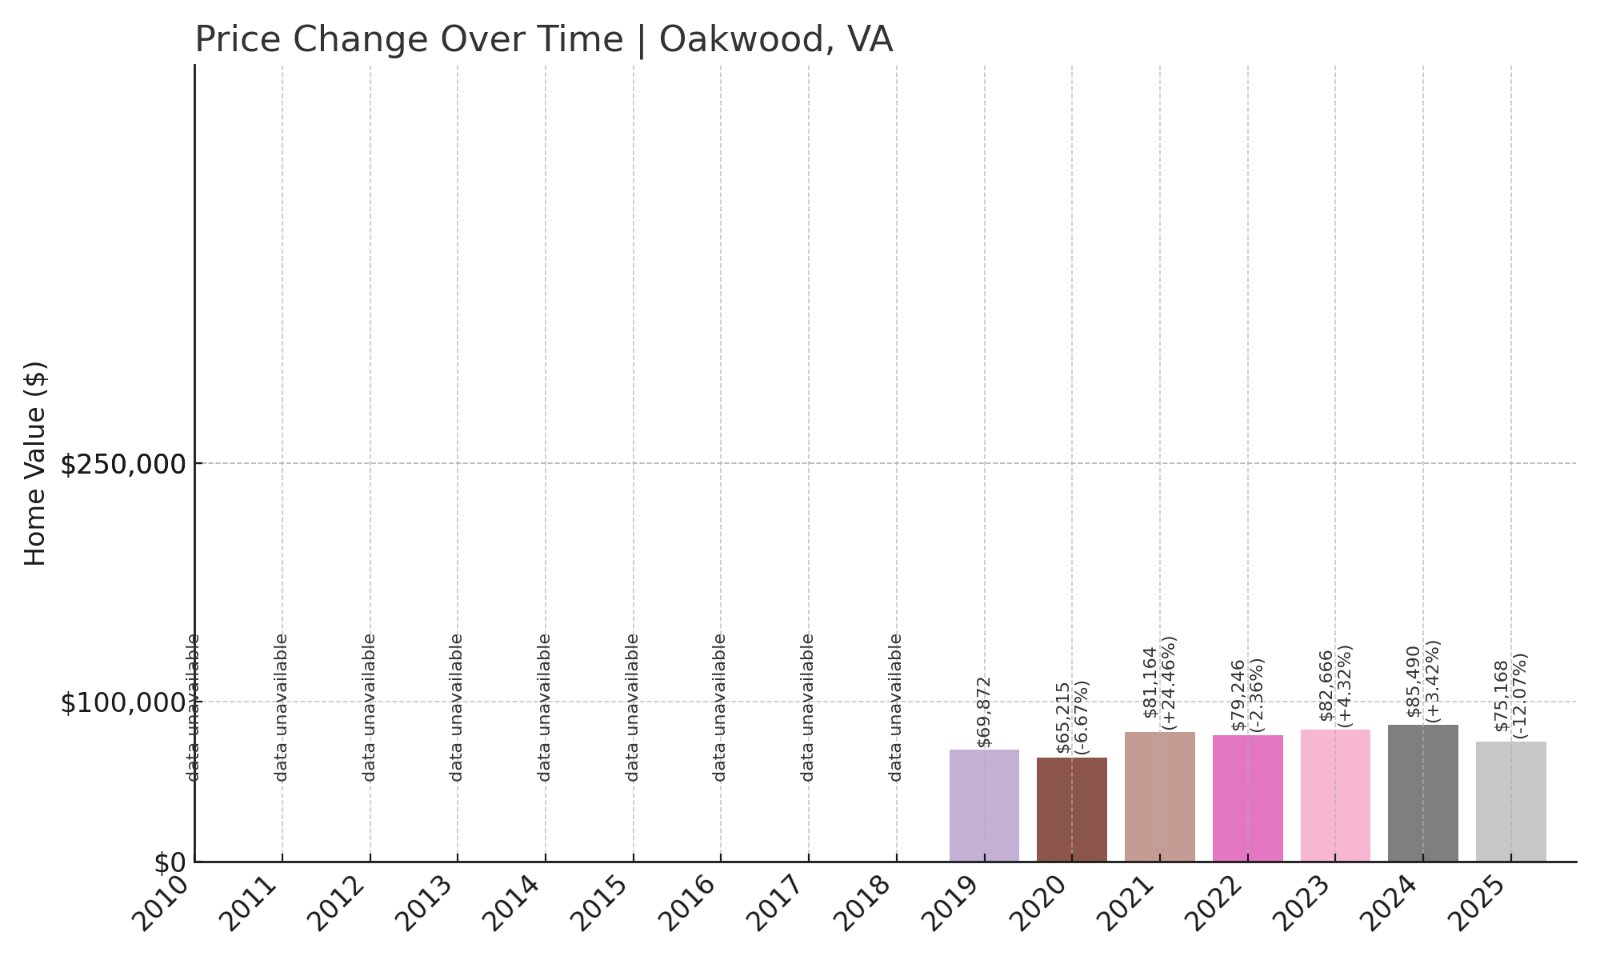
- 2019: $69,872
- 2020: $65,215 (-$4,657, -6.67% from previous year)
- 2021: $81,164 (+$15,949, +24.46% from previous year)
- 2022: $79,246 (-$1,918, -2.36% from previous year)
- 2023: $82,666 (+$3,420, +4.32% from previous year)
- 2024: $85,490 (+$2,824, +3.42% from previous year)
- 2025: $75,168 (-$10,322, -12.07% from previous year)
Oakwood’s home prices have increased by 8% since 2019, though they fell over 12% in 2025 to $75,168, erasing recent gains.
Oakwood – Coalfield Community Facing Price Corrections
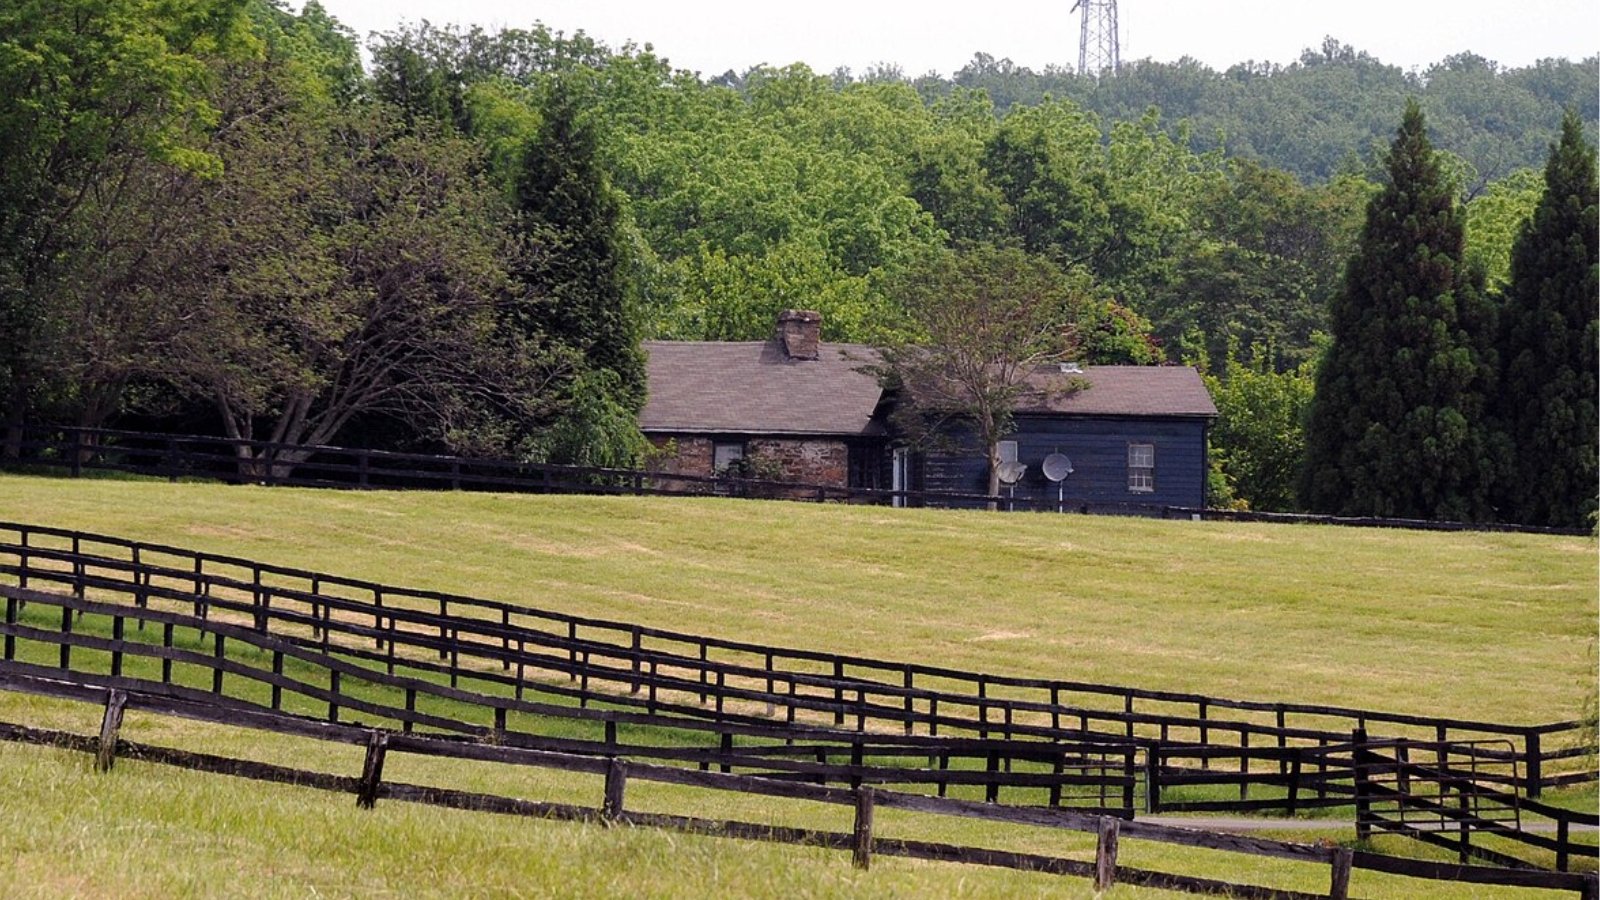
Oakwood is an unincorporated community in Buchanan County, home to the Appalachian College of Pharmacy. The local economy benefits from the college’s presence and nearby coal mining operations, but housing prices often reflect wider market fluctuations in the region.
In 2025, average home prices are $75,168, down from a high of $85,490 in 2024. The 12% decrease reverses growth seen over the past four years, including a major 24% jump in 2021. Buyers might see current conditions as a window to purchase in a college-centered Appalachian community with a stable rental market driven by pharmacy students and staff.
4. Vansant – 17% Home Price Increase Since 2019
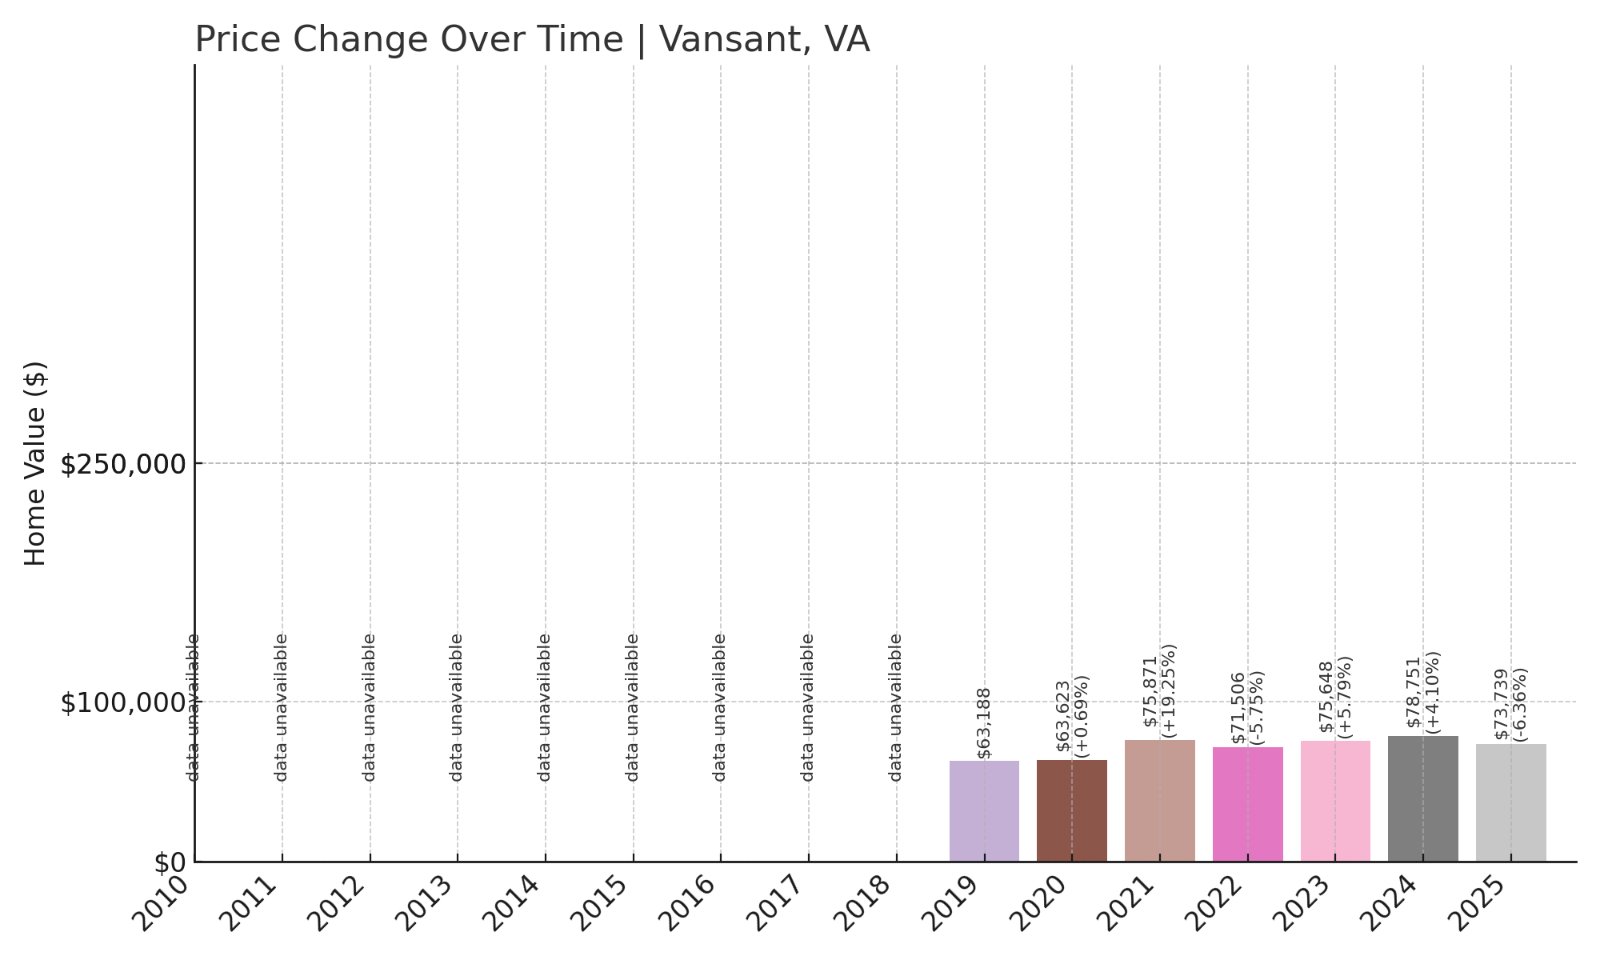
- 2019: $63,188
- 2020: $63,623 (+$435, +0.69% from previous year)
- 2021: $75,871 (+$12,248, +19.25% from previous year)
- 2022: $71,506 (-$4,365, -5.75% from previous year)
- 2023: $75,648 (+$4,142, +5.79% from previous year)
- 2024: $78,751 (+$3,103, +4.10% from previous year)
- 2025: $73,739 (-$5,012, -6.36% from previous year)
Vansant’s home prices are up 17% since 2019, even after a 6% decline in 2025 that brought average values to $73,739.
Vansant – Appalachian Housing Market with Recent Declines
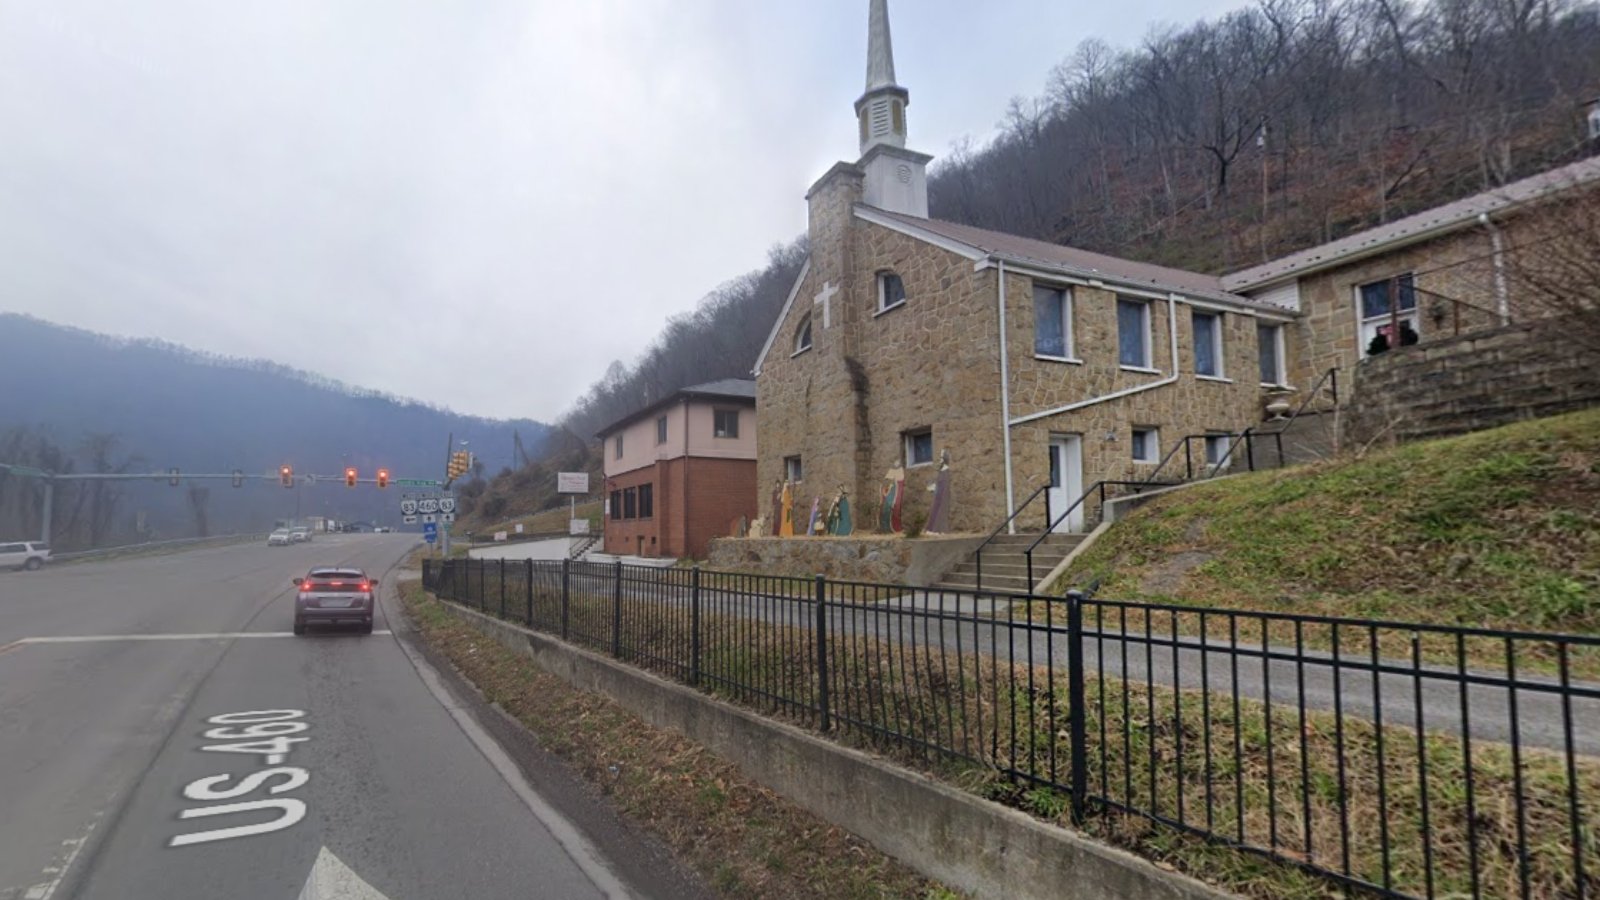
Vansant is a census-designated place in Buchanan County, known for its coal mining roots and location along U.S. Route 460. It hosts retail stores, schools, and churches serving the local community, and its proximity to Grundy offers residents access to larger services and shops.
In 2025, home prices average $73,739 after falling over 6% from the previous year. While this decline marks a market correction, values remain higher than their 2019 levels thanks to major growth in 2021. Vansant continues to offer affordable housing with quick access to major roads and neighboring Appalachian towns.
3. Rowe – 15% Home Price Increase Since 2020
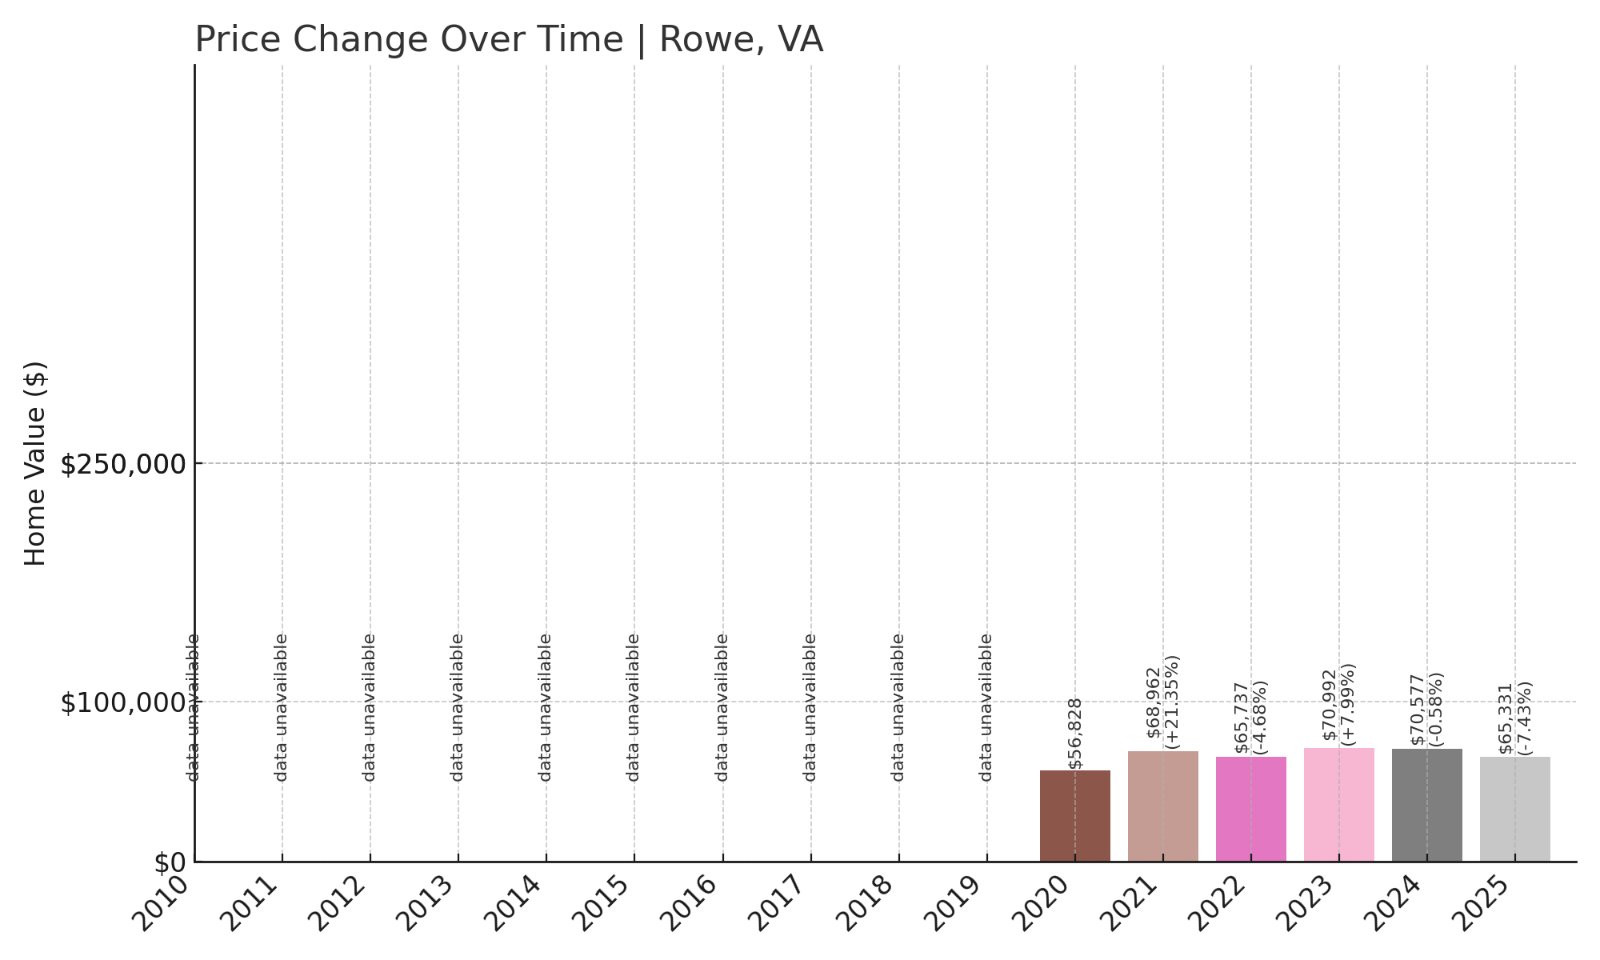
- 2020: $56,828
- 2021: $68,962 (+$12,135, +21.35% from previous year)
- 2022: $65,737 (-$3,226, -4.68% from previous year)
- 2023: $70,992 (+$5,256, +7.99% from previous year)
- 2024: $70,577 (-$415, -0.59% from previous year)
- 2025: $65,331 (-$5,246, -7.43% from previous year)
Rowe’s home prices have risen by 15% since 2020, despite a 7% decline this year bringing average values down to $65,331 in 2025.
Rowe – Quiet Appalachian Community with Recent Price Drops
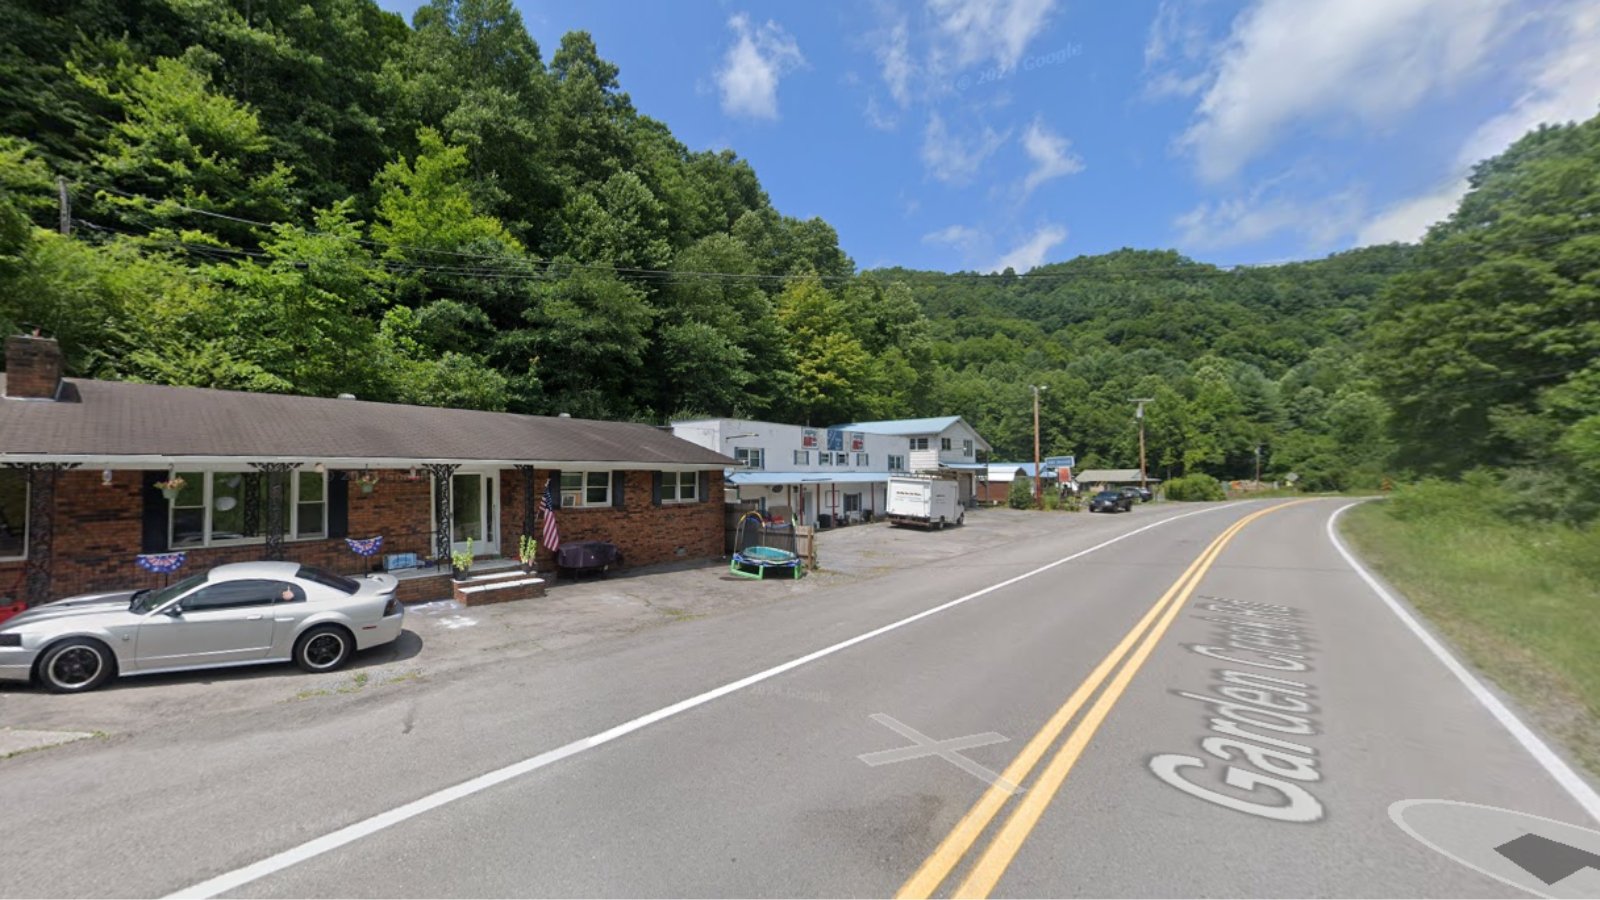
Rowe is an unincorporated community in Buchanan County, Virginia, located northeast of Grundy along State Route 624. The area is rural and largely residential, with small local businesses serving residents scattered along the mountain roads and hollows.
In 2025, the average home value is $65,331 after a 7% drop from last year. This decline comes after several years of mixed performance, including a strong 21% rise in 2021 and smaller gains in 2023. The town’s quiet setting and affordable homes may attract buyers seeking privacy and low cost of living in the Appalachian foothills.
2. Appalachia – 24% Home Price Increase Since 2010
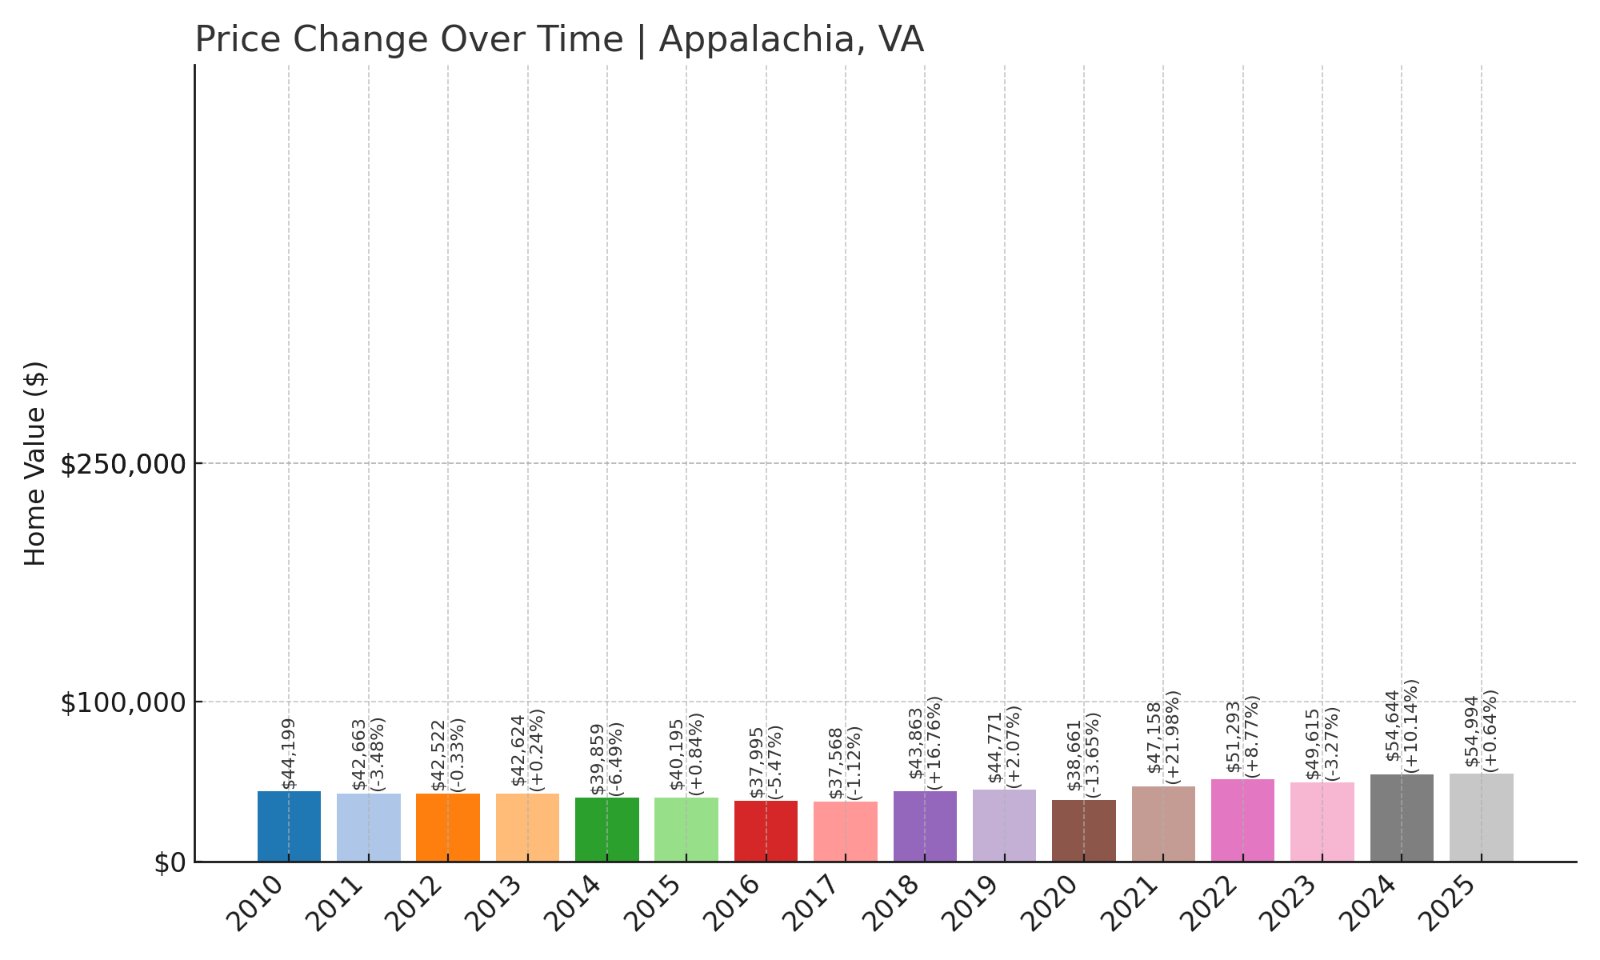
- 2010: $44,199
- 2011: $42,663 (-$1,536, -3.48% from previous year)
- 2012: $42,522 (-$141, -0.33% from previous year)
- 2013: $42,624 (+$102, +0.24% from previous year)
- 2014: $39,859 (-$2,765, -6.49% from previous year)
- 2015: $40,195 (+$335, +0.84% from previous year)
- 2016: $37,995 (-$2,199, -5.47% from previous year)
- 2017: $37,568 (-$427, -1.12% from previous year)
- 2018: $43,863 (+$6,295, +16.76% from previous year)
- 2019: $44,771 (+$908, +2.07% from previous year)
- 2020: $38,661 (-$6,110, -13.65% from previous year)
- 2021: $47,158 (+$8,498, +21.98% from previous year)
- 2022: $51,293 (+$4,135, +8.77% from previous year)
- 2023: $49,615 (-$1,678, -3.27% from previous year)
- 2024: $54,644 (+$5,029, +10.14% from previous year)
- 2025: $54,994 (+$350, +0.64% from previous year)
Appalachia’s home prices have increased by 24% since 2010, reaching $54,994 in 2025 with modest growth of less than 1% this year.
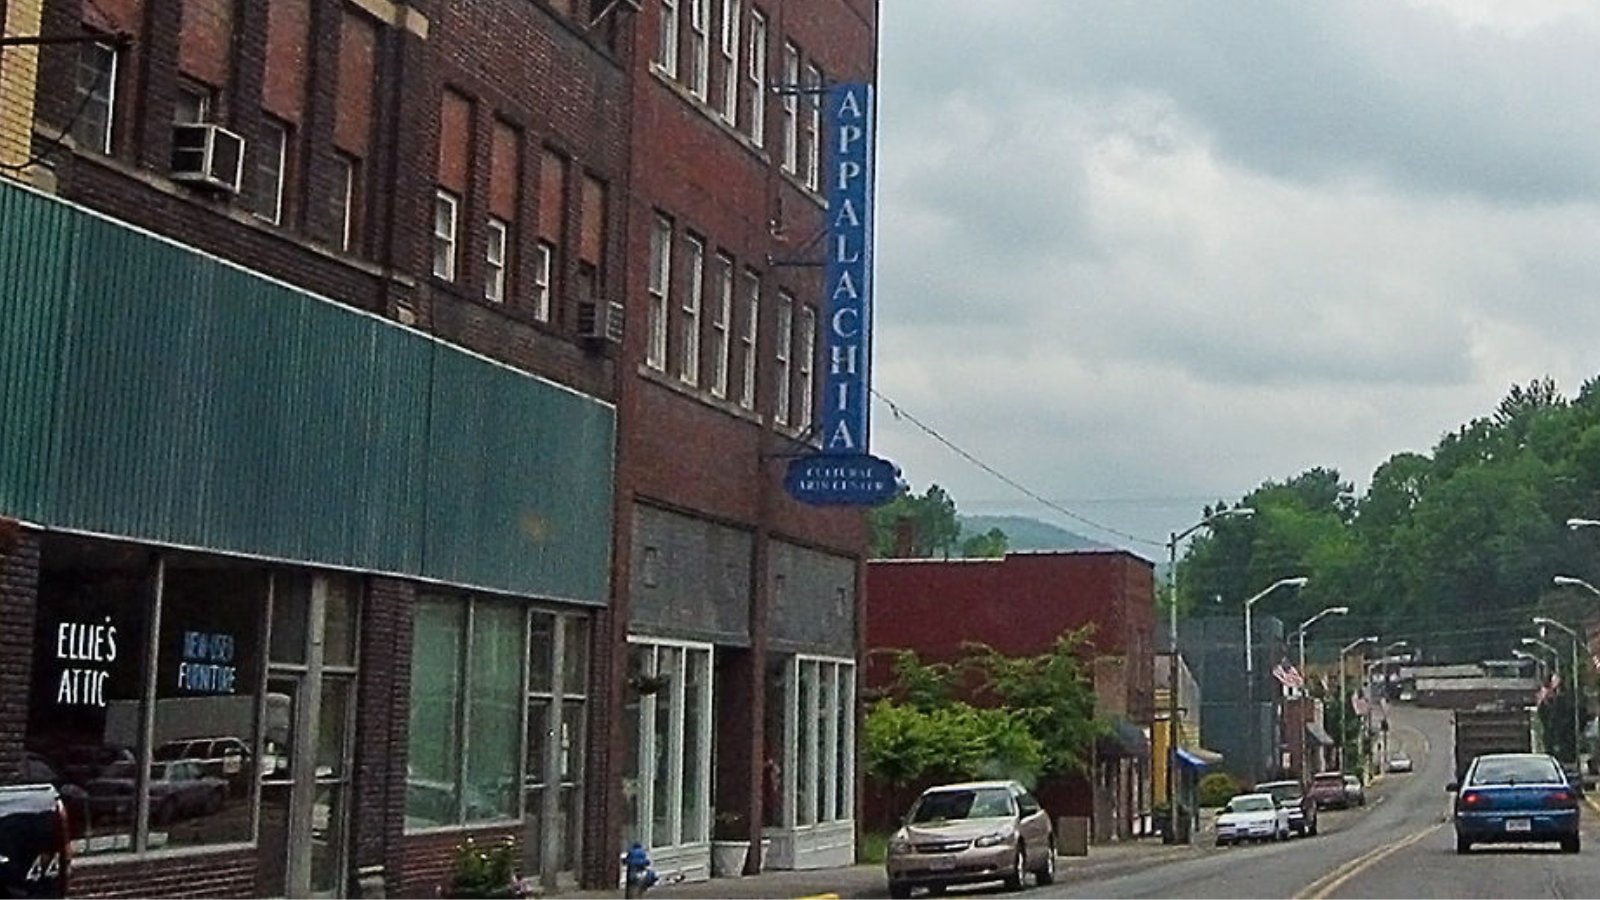
Appalachia – Modest Housing Market Stabilizing After Swings
Would you like to save this?
Appalachia is a historic town in Wise County, Virginia, known for its roots in coal mining and its preserved downtown featuring early 20th-century buildings. The town serves as a residential community with schools, parks, and regional services nearby.
In 2025, average home prices stand at $54,994, a small increase from 2024. While the market has fluctuated with significant gains in 2018 and 2021 offset by other declines, overall growth remains positive over the last 15 years. Appalachia offers affordable housing with rich cultural heritage, making it attractive to buyers looking for quiet Appalachian towns steeped in history.
1. Bishop – 23% Home Price Increase Since 2012
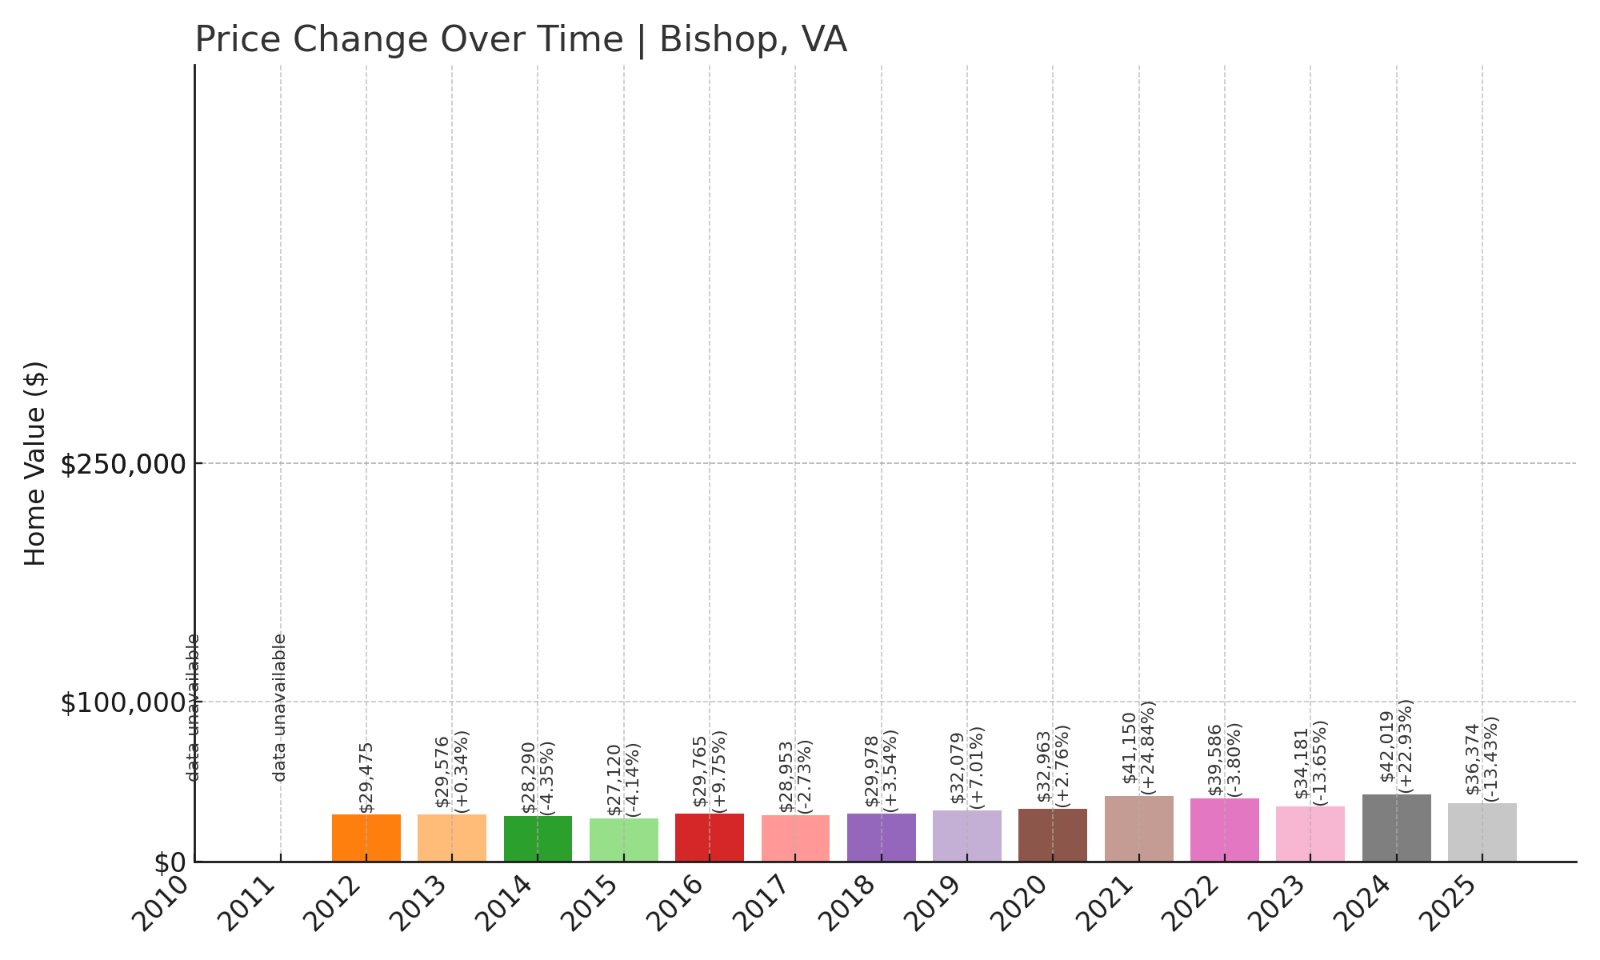
- 2012: $29,475
- 2013: $29,576 (+$101, +0.34% from previous year)
- 2014: $28,290 (-$1,286, -4.35% from previous year)
- 2015: $27,120 (-$1,170, -4.13% from previous year)
- 2016: $29,765 (+$2,645, +9.75% from previous year)
- 2017: $28,953 (-$812, -2.73% from previous year)
- 2018: $29,978 (+$1,025, +3.54% from previous year)
- 2019: $32,079 (+$2,101, +7.01% from previous year)
- 2020: $32,963 (+$884, +2.76% from previous year)
- 2021: $41,150 (+$8,187, +24.84% from previous year)
- 2022: $39,586 (-$1,564, -3.80% from previous year)
- 2023: $34,181 (-$5,405, -13.65% from previous year)
- 2024: $42,019 (+$7,838, +22.93% from previous year)
- 2025: $36,374 (-$5,645, -13.43% from previous year)
Bishop’s home prices have increased by 23% since 2012, though prices fell 13% in 2025 to $36,374 after a strong jump in 2024.
Bishop – Small Town Market Adjusting After Big Swings
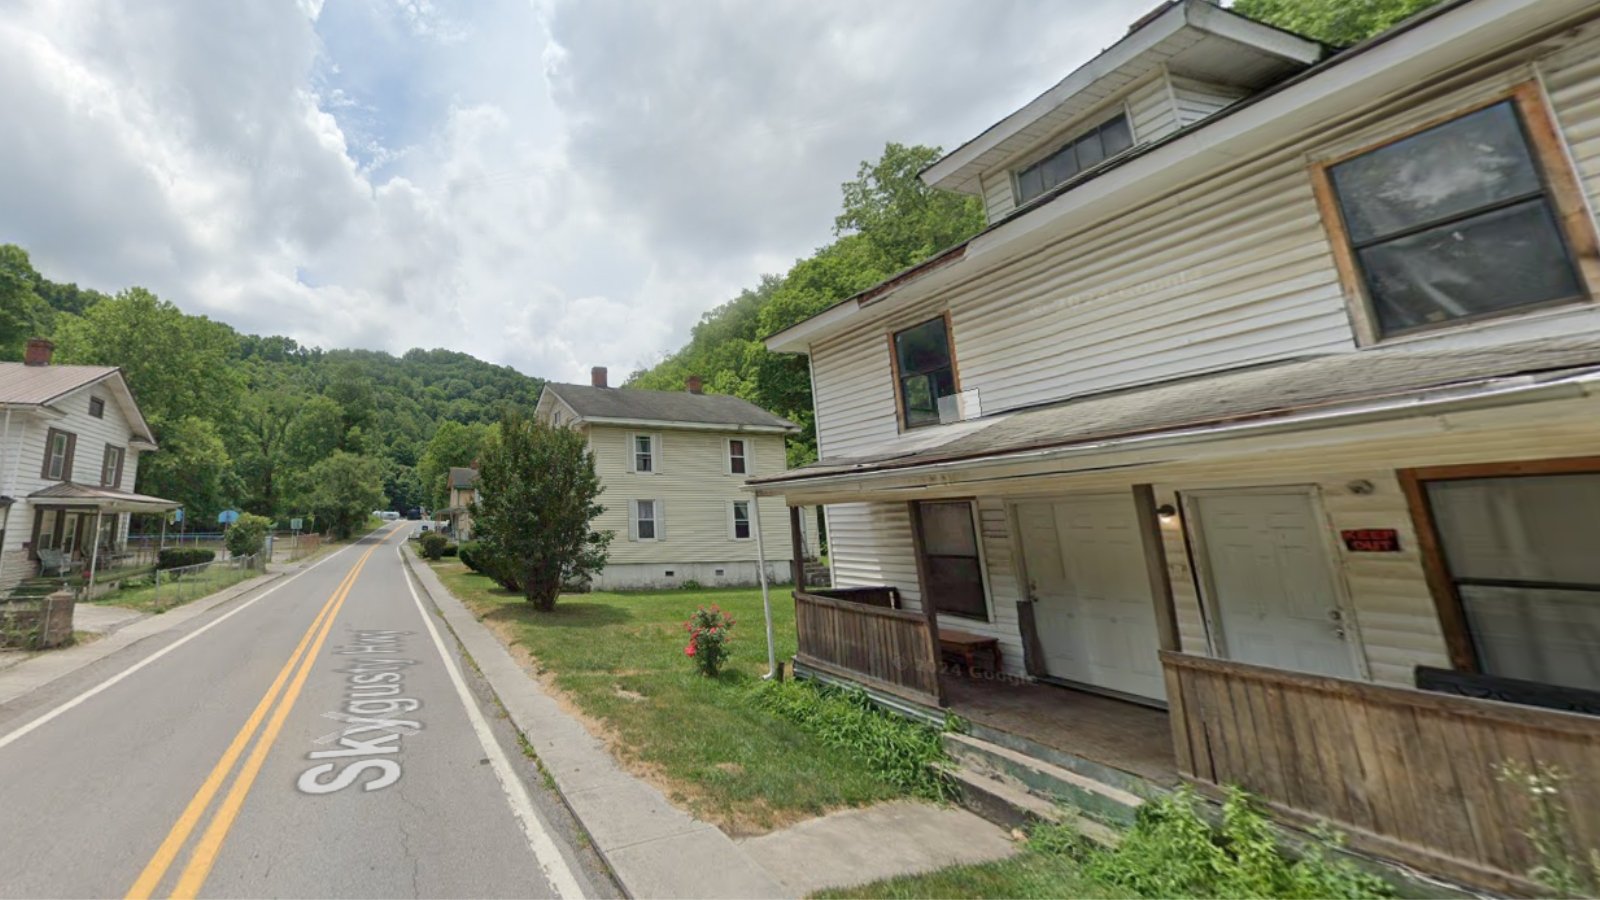
Bishop is an unincorporated community that straddles the Virginia–West Virginia border in Tazewell County. It is a quiet, rural area known for its proximity to the Appalachian mountains and small local businesses serving residents on both sides of the state line.
In 2025, home prices average $36,374, down from $42,019 in 2024. The 13% decline offsets part of the dramatic gains seen the previous year. Buyers looking for extremely affordable housing options in southwest Virginia may find Bishop’s low price points attractive, especially given its peaceful surroundings and easy access to West Virginia routes for regional commuting.