🔥 Would you like to save this?
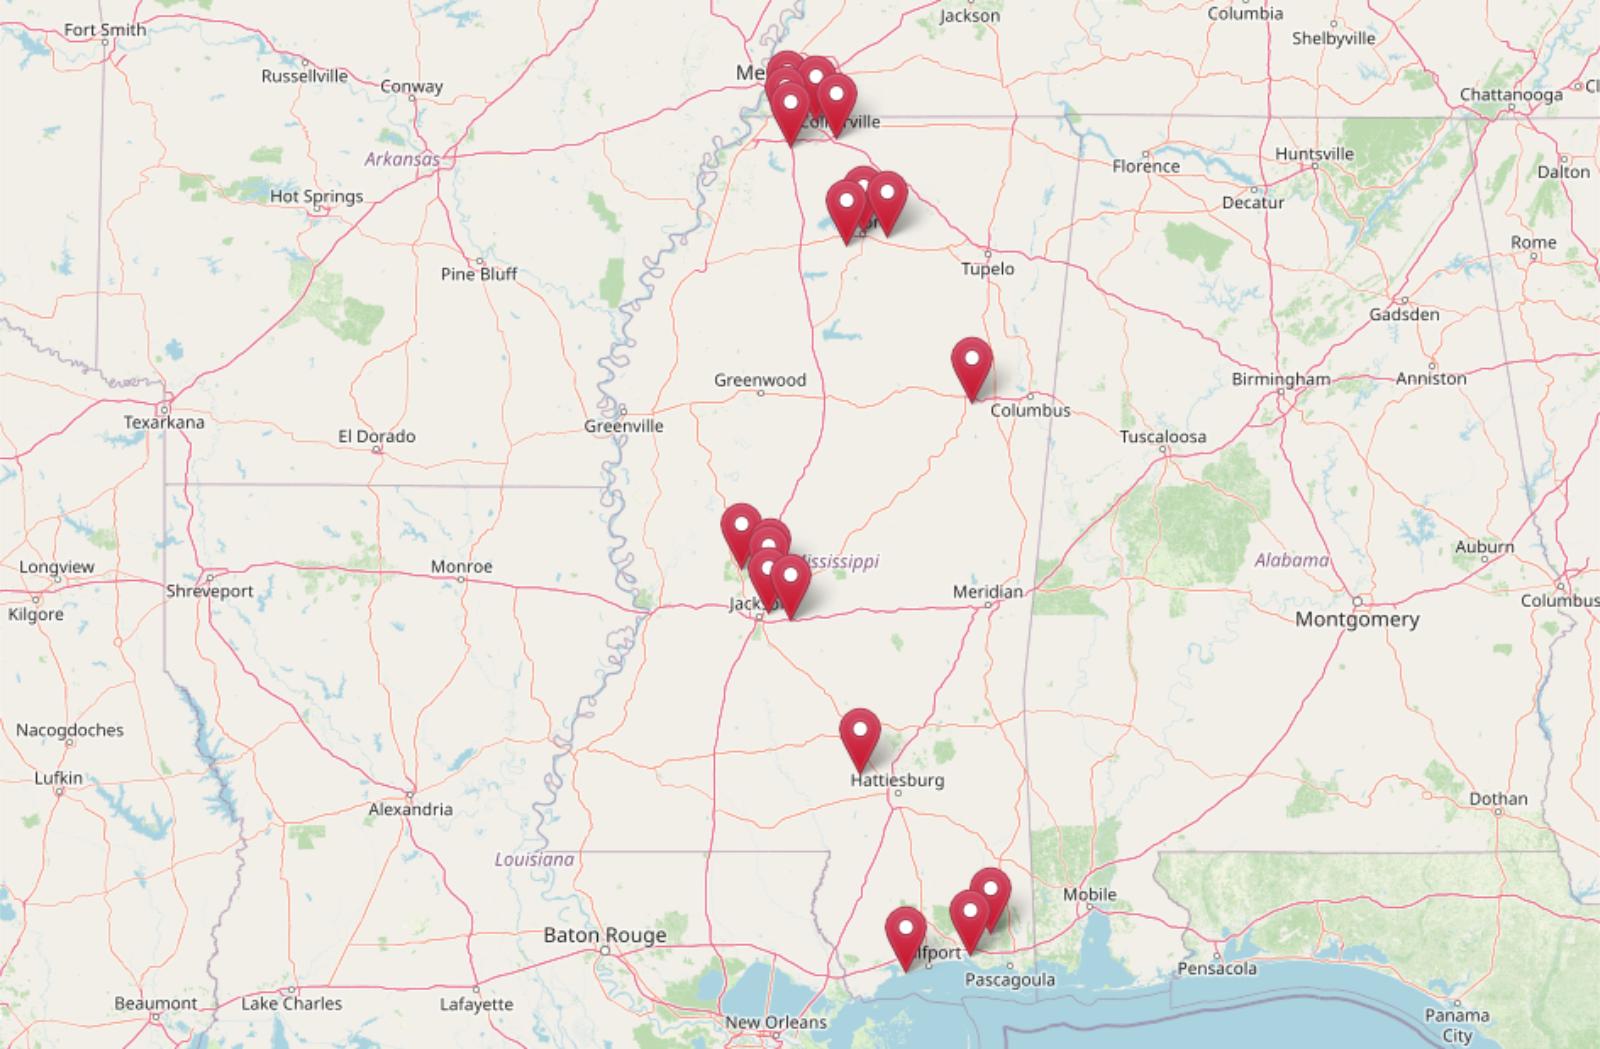
In 2025, home prices across Mississippi are climbing faster than many buyers expect. According to the Zillow Home Value Index, 18 towns are now leading the state in long-term property value growth. From small Gulf Coast communities to expanding suburbs and college towns, these places are drawing steady demand—and the numbers prove it. Some towns have quietly doubled in value over the past decade, while others are seeing price spikes fueled by new construction, second-home buyers, and retirees looking for affordable lifestyle upgrades.
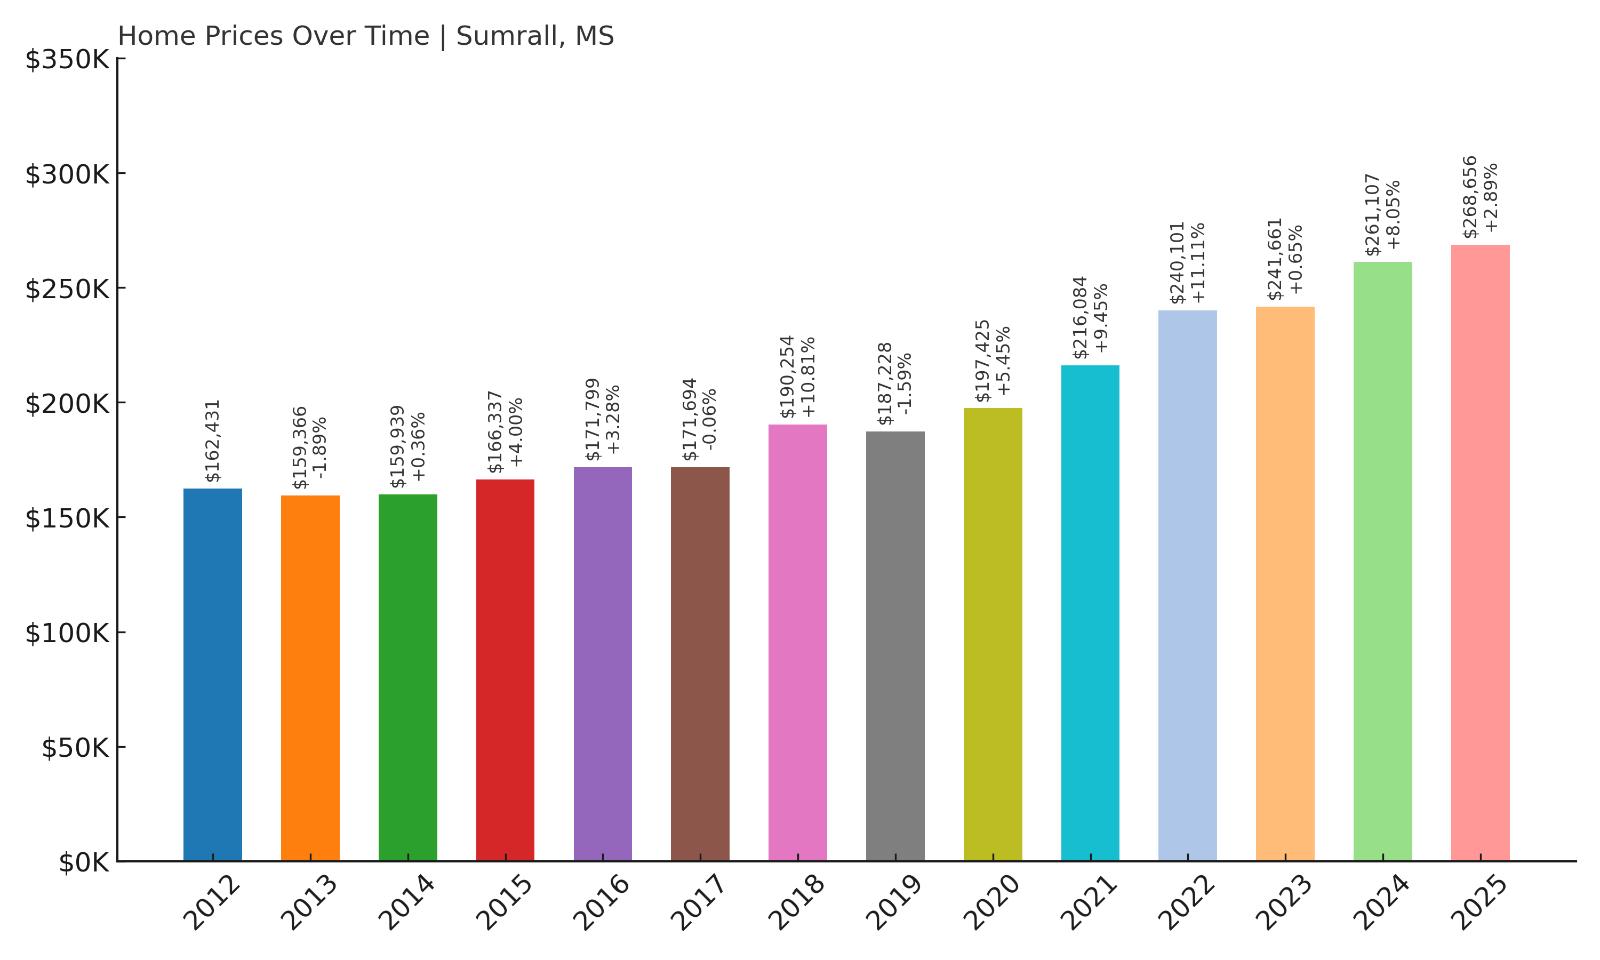
18. Sumrall – 65.4% Home Price Increase Since 2012
- 2010: N/A
- 2011: N/A
- 2012: $162,431
- 2013: $159,366 (-$3,065, -1.89% from previous year)
- 2014: $159,939 (+$573, +0.36% from previous year)
- 2015: $166,337 (+$6,397, +4.00% from previous year)
- 2016: $171,799 (+$5,462, +3.28% from previous year)
- 2017: $171,694 (-$104, -0.06% from previous year)
- 2018: $190,254 (+$18,560, +10.81% from previous year)
- 2019: $187,228 (-$3,026, -1.59% from previous year)
- 2020: $197,425 (+$10,197, +5.45% from previous year)
- 2021: $216,084 (+$18,660, +9.45% from previous year)
- 2022: $240,101 (+$24,016, +11.11% from previous year)
- 2023: $241,661 (+$1,560, +0.65% from previous year)
- 2024: $261,107 (+$19,447, +8.05% from previous year)
- 2025: $268,656 (+$7,548, +2.89% from previous year)
Home prices in Sumrall have risen by over 65% since 2012, with values climbing from $162,431 to $268,656 in 2025. The town experienced a particularly sharp increase between 2017 and 2022, driven by a 40% surge in just five years. While 2019 saw a brief dip, the market recovered quickly with consecutive years of solid growth into 2025. In the last year alone, prices rose by nearly 3%, signaling continued stability. Sumrall’s recent housing demand may be attributed to its quiet appeal and growing popularity as a commuter town. Although early 2010s growth was modest, the town’s market has become increasingly competitive since 2018, with price gains often outpacing regional averages. Recent gains reflect broader market trends in small-town Mississippi, where demand has crept beyond traditional urban cores. Even with price dips, Sumrall has held its ground and continues to draw interest. For buyers, that means more competition and higher entry points than in years past.
In order to come up with the very specific design ideas, we create most designs with the assistance of state-of-the-art AI interior design software.
Sumrall – Quiet Growth in a Small-Town Setting
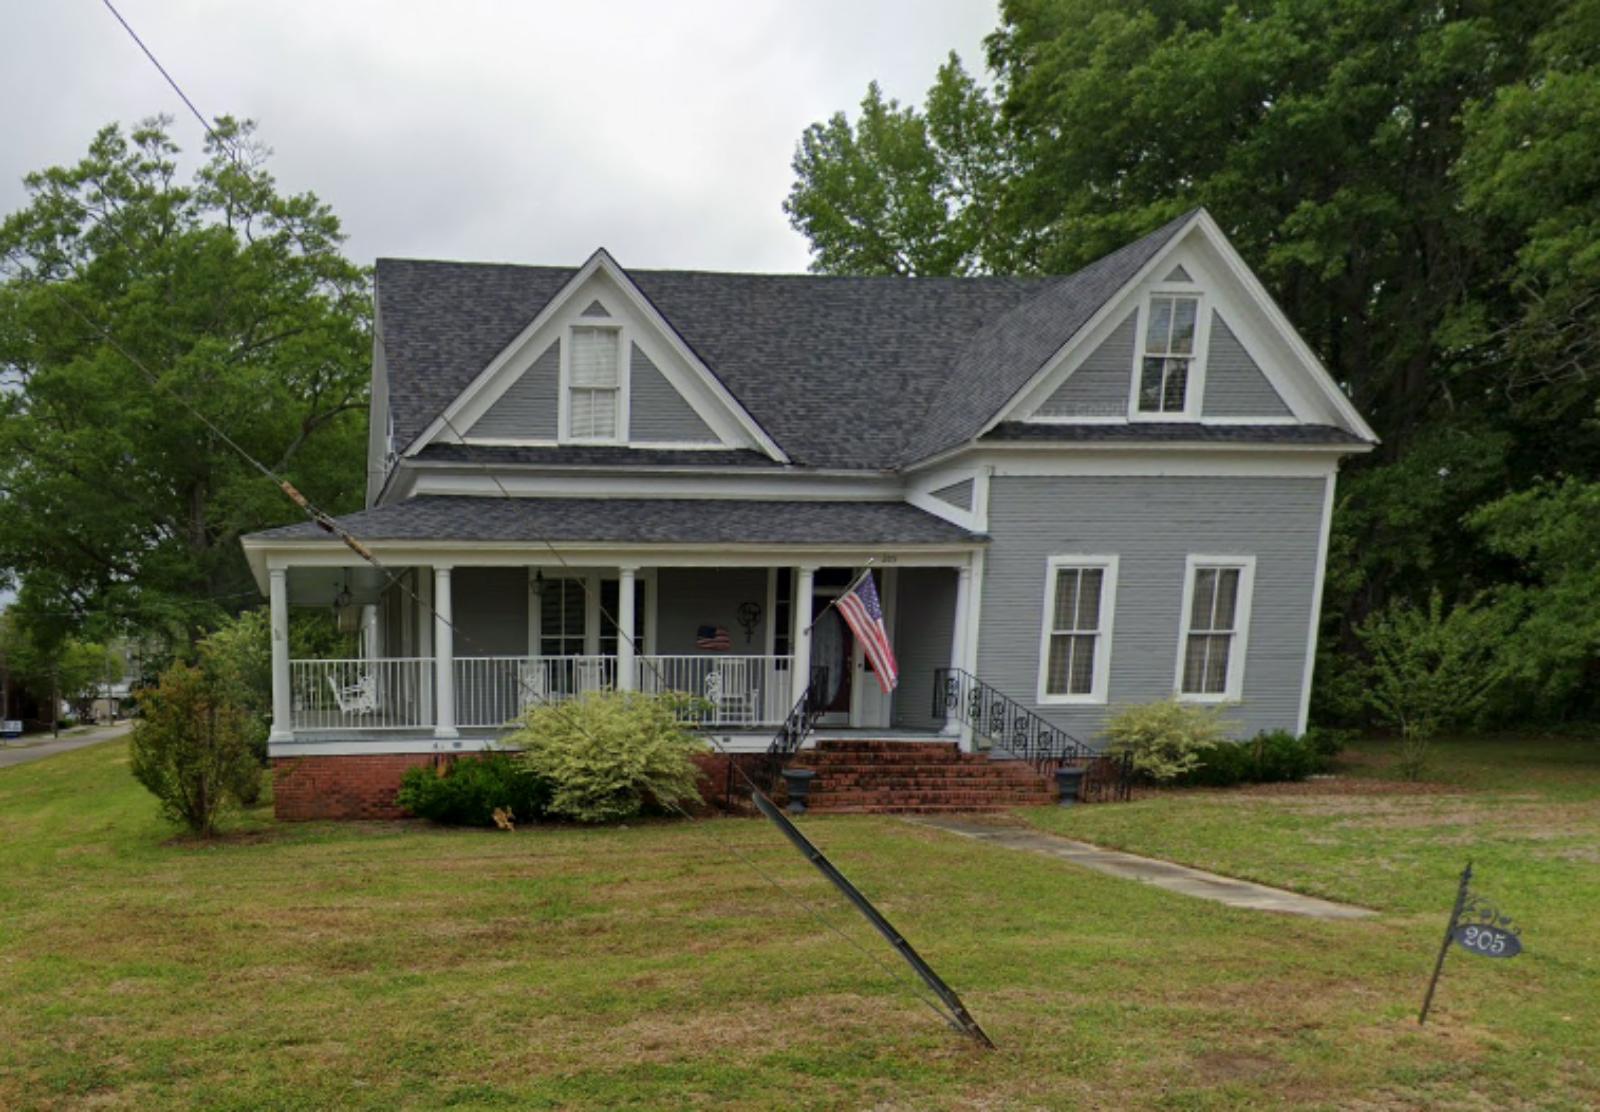
Located in Lamar County, Sumrall sits about 15 miles northwest of Hattiesburg. It’s known for its rural charm, access to good schools, and relative proximity to larger cities, making it a desirable location for families looking to avoid the bustle of city life. The town has quietly evolved from a small, lesser-known community into a sought-after place for residential investment. Many new homebuyers see it as a balanced mix of affordability and convenience—close enough to commute, but far enough to enjoy space and privacy. This blend of factors has helped sustain real estate demand, particularly during the post-pandemic migration trends that favored small towns.
Sumrall’s price history shows how market forces have shifted over time. While it didn’t initially benefit from the early 2010s housing rebound, price acceleration picked up pace around 2018. This coincided with wider regional development and a renewed interest in suburban-rural towns with strong school districts. By 2022, prices had jumped over $70,000 in just four years. Despite some cooling in 2023, the town has avoided major downturns. That kind of resilience makes it one of Mississippi’s more stable and attractive housing markets in 2025, even if it’s still under the radar compared to larger towns.
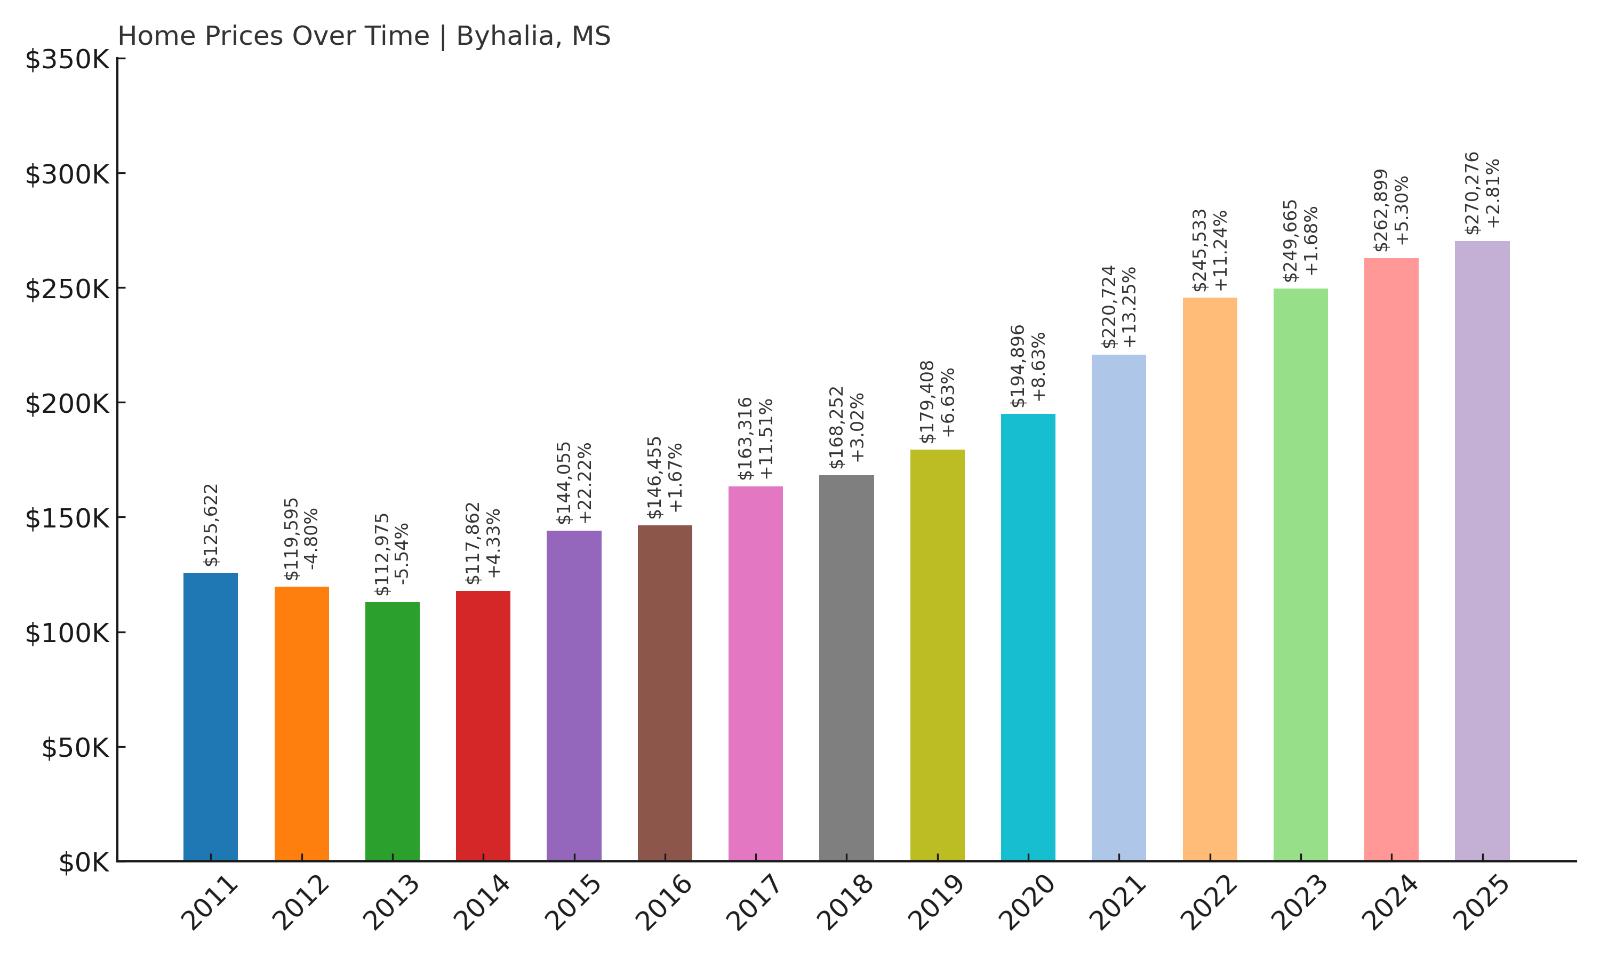
17. Byhalia – 115.2% Home Price Increase Since 2011
- 2010: N/A
- 2011: $125,622
- 2012: $119,595 (-$6,027, -4.80% from previous year)
- 2013: $112,975 (-$6,621, -5.54% from previous year)
- 2014: $117,862 (+$4,887, +4.33% from previous year)
- 2015: $144,055 (+$26,193, +22.22% from previous year)
- 2016: $146,455 (+$2,400, +1.67% from previous year)
- 2017: $163,316 (+$16,860, +11.51% from previous year)
- 2018: $168,252 (+$4,936, +3.02% from previous year)
- 2019: $179,408 (+$11,155, +6.63% from previous year)
- 2020: $194,896 (+$15,488, +8.63% from previous year)
- 2021: $220,724 (+$25,828, +13.25% from previous year)
- 2022: $245,533 (+$24,809, +11.24% from previous year)
- 2023: $249,665 (+$4,132, +1.68% from previous year)
- 2024: $262,899 (+$13,235, +5.30% from previous year)
- 2025: $270,276 (+$7,377, +2.81% from previous year)
Byhalia’s home prices have more than doubled since 2011, jumping from $125,622 to $270,276 by 2025. The most explosive growth came after 2014, when prices leapt by over 22% in just one year. That was just the beginning: over the next decade, values rose steadily, with only a couple of flat years. The biggest upward momentum came from 2019 through 2022, when homes appreciated by over $66,000. Even with modest gains in 2023 and 2024, prices remain well above average for northern Mississippi. For buyers, Byhalia now represents a serious investment zone — especially for those priced out of the Memphis metro suburbs. The data suggests that price growth has cooled slightly, but hasn’t reversed.
Byhalia – Small Town, Surging Prices
Byhalia sits in Marshall County, not far from the Tennessee border. Its proximity to Memphis has made it a convenient choice for commuters, while its small-town feel continues to attract new residents looking for more space and slower pace. What used to be a sleepy rural town is now increasingly viewed as a growth corridor. Over the last decade, new subdivisions and commercial activity have started to appear, and that development pressure has fueled the rapid appreciation in home values. Infrastructure upgrades and industrial projects nearby, including the expanding Blue Oval City auto hub in West Tennessee, are also likely playing a role in demand spillover into towns like Byhalia.
The town’s housing data shows a clear pivot after 2015, where price gains became more consistent and aggressive. While prices were stagnant or falling in the early 2010s, that shifted dramatically as the town became better connected to metro job centers. Between 2017 and 2022 alone, home values shot up by more than $80,000 — a 50% increase over five years. That kind of growth can strain affordability, but it’s also an indicator of long-term investor confidence. For buyers and developers, Byhalia is a prime example of a rural town rapidly evolving into a suburban satellite with staying power.
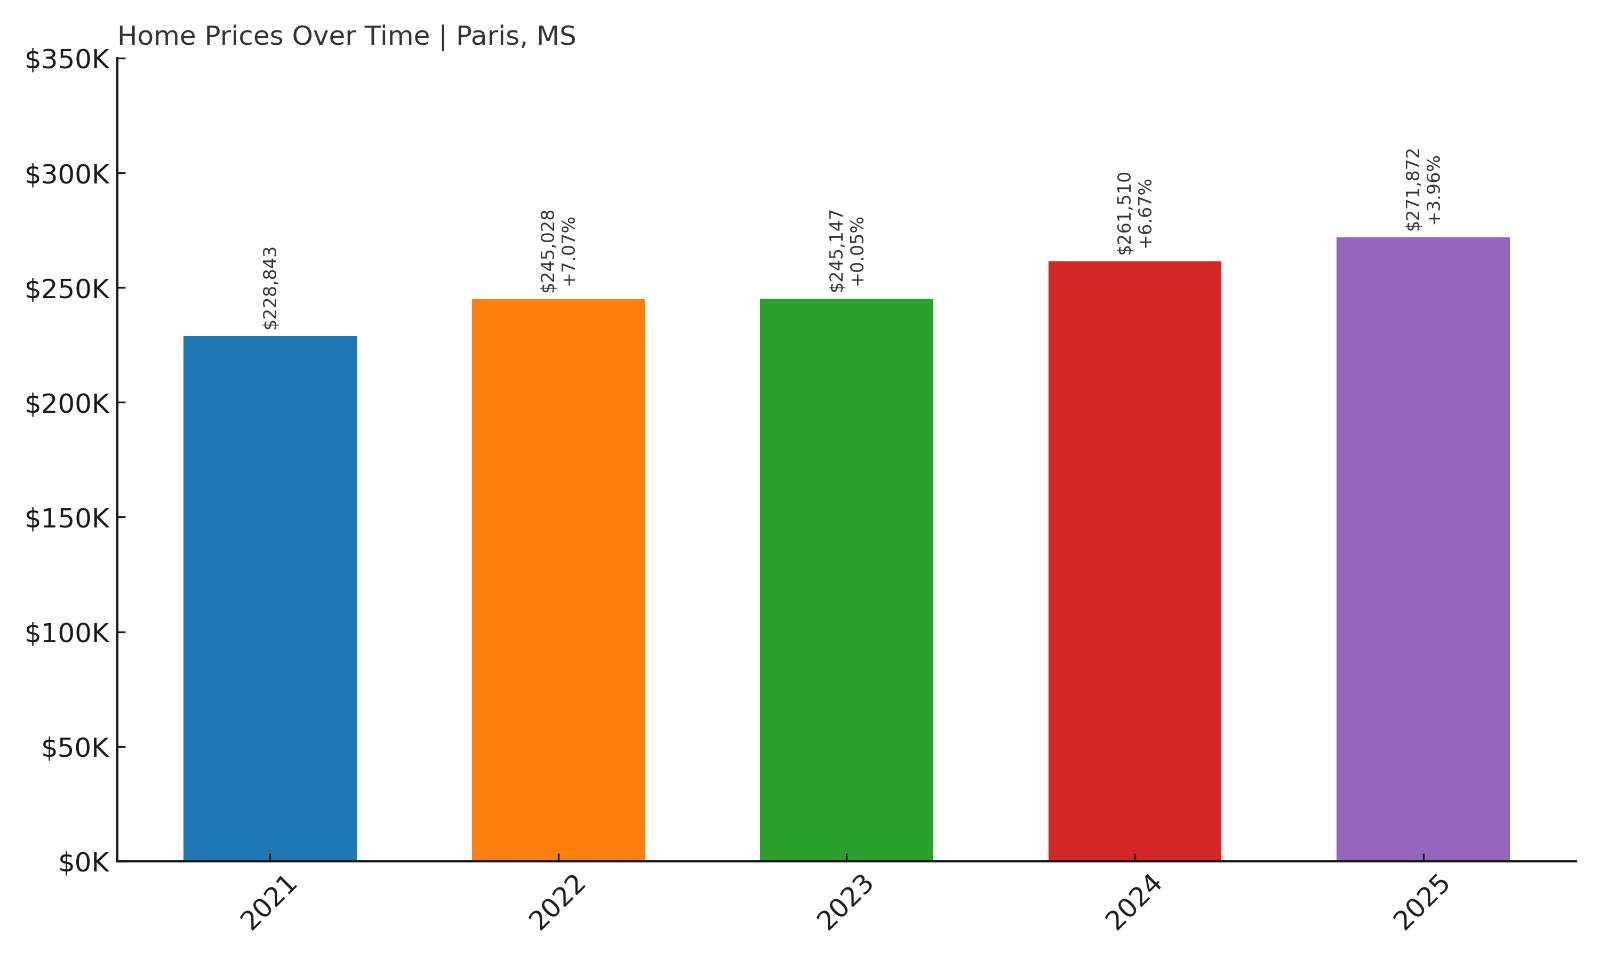
16. Paris – 18.8% Home Price Increase Since 2021
- 2010: N/A
- 2011: N/A
- 2012: N/A
- 2013: N/A
- 2014: N/A
- 2015: N/A
- 2016: N/A
- 2017: N/A
- 2018: N/A
- 2019: N/A
- 2020: N/A
- 2021: $228,843
- 2022: $245,028 (+$16,185, +7.07% from previous year)
- 2023: $245,147 (+$119, +0.05% from previous year)
- 2024: $261,510 (+$16,363, +6.67% from previous year)
- 2025: $271,872 (+$10,362, +3.96% from previous year)
Paris only has Zillow home price data starting in 2021, but even in that short window, values have risen nearly 19%. From a baseline of $228,843, prices have grown to $271,872 by 2025. Most of that growth came in 2022 and 2024, with over $16,000 in gains in each of those years. The price plateau in 2023 was brief and followed by another jump. While this isn’t a long historical series, the consistency since 2021 suggests a healthy, appreciating market. It’s also notable that Paris has avoided sharp volatility — there are no big declines or swings. That’s a positive sign for buyers and investors looking for stability in Mississippi’s smaller markets.
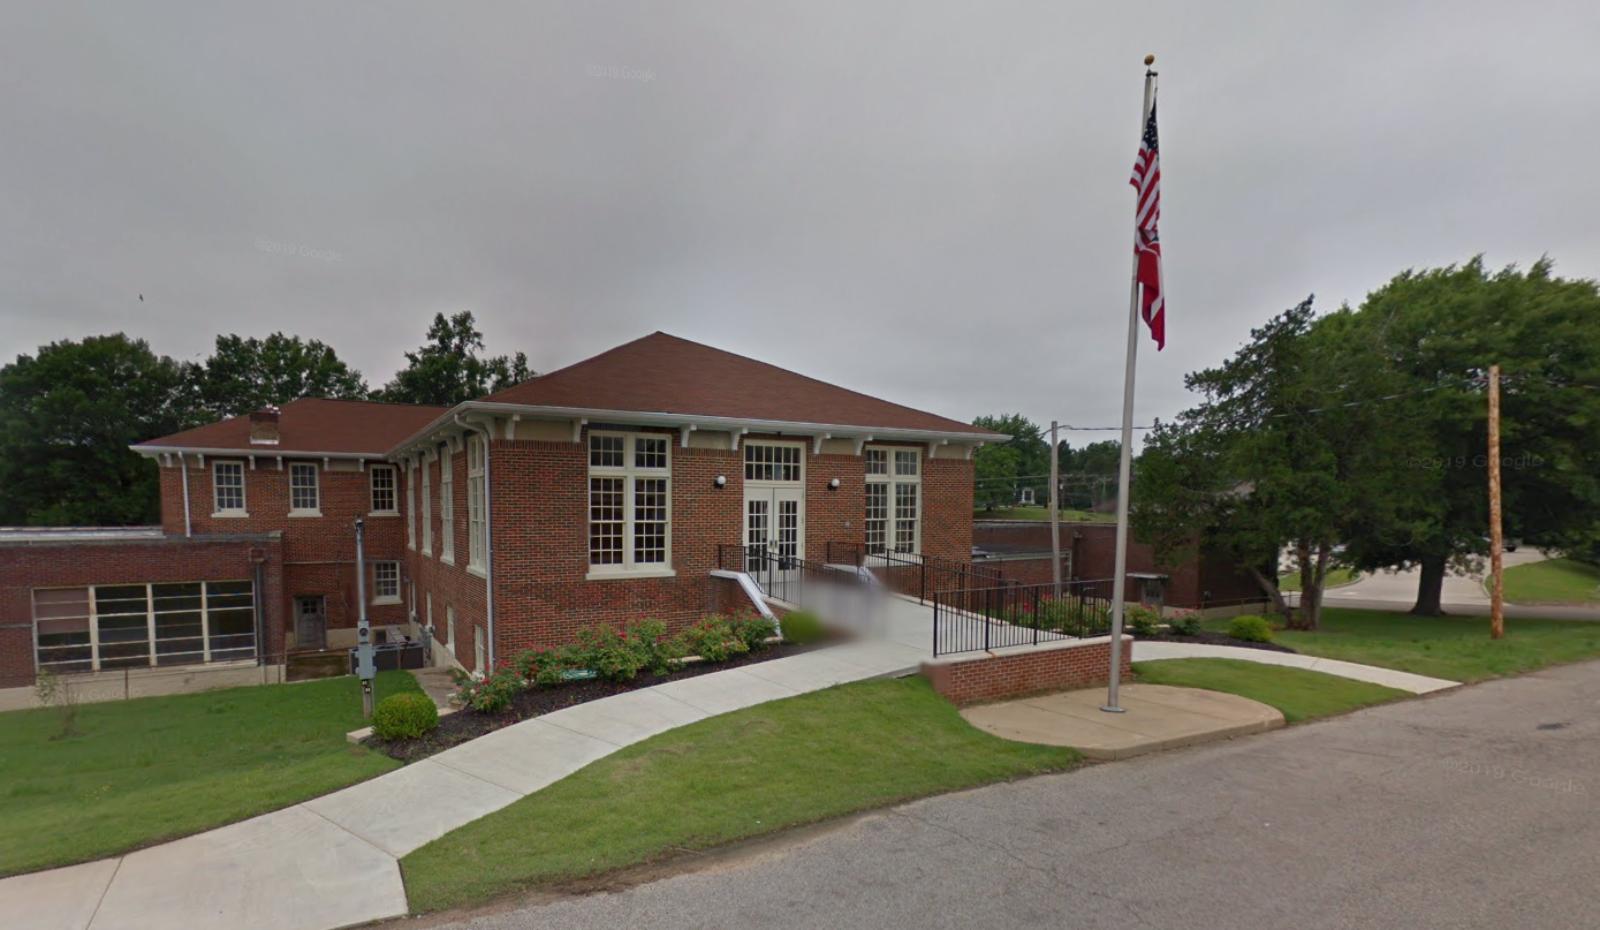
Paris – Limited Data, Clear Upside
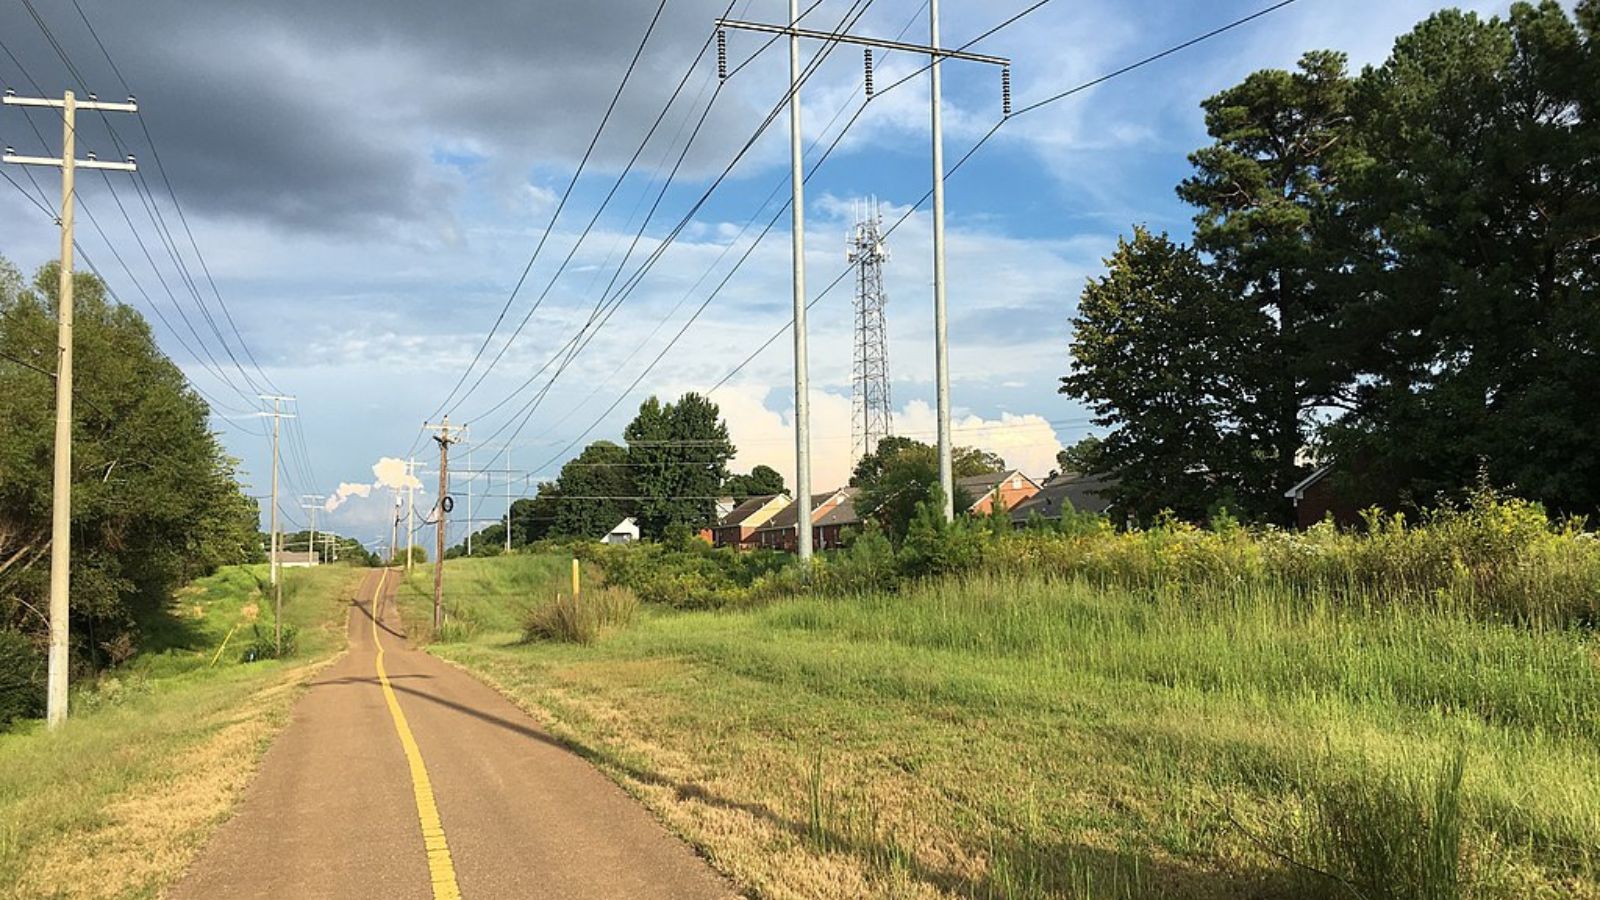
Paris is a lesser-known town located in Lafayette County, not far from Oxford. Its rural setting offers a quiet, scenic backdrop, yet it remains accessible to major university and commercial centers. That blend of seclusion and convenience can be a powerful magnet for buyers seeking both affordability and location. The modest growth captured in Zillow’s short time frame may actually understate the town’s long-term trajectory, especially as the Oxford market pushes demand outward. Many smaller communities near university towns have seen spillover effects, and Paris appears to be following that trend.
Though there’s no available data before 2021, the strong year-over-year growth since then points to solid momentum. While the town’s price level in 2025 is still below some of Mississippi’s hottest markets, it’s well above average for a rural community. Buyers may find value here relative to more saturated areas like Oxford, and the slower pace of life may also be a draw. With steady price increases, no year-to-year dips, and a relatively high 2025 benchmark, Paris earns its place among Mississippi’s most expensive towns — even with its quiet reputation.
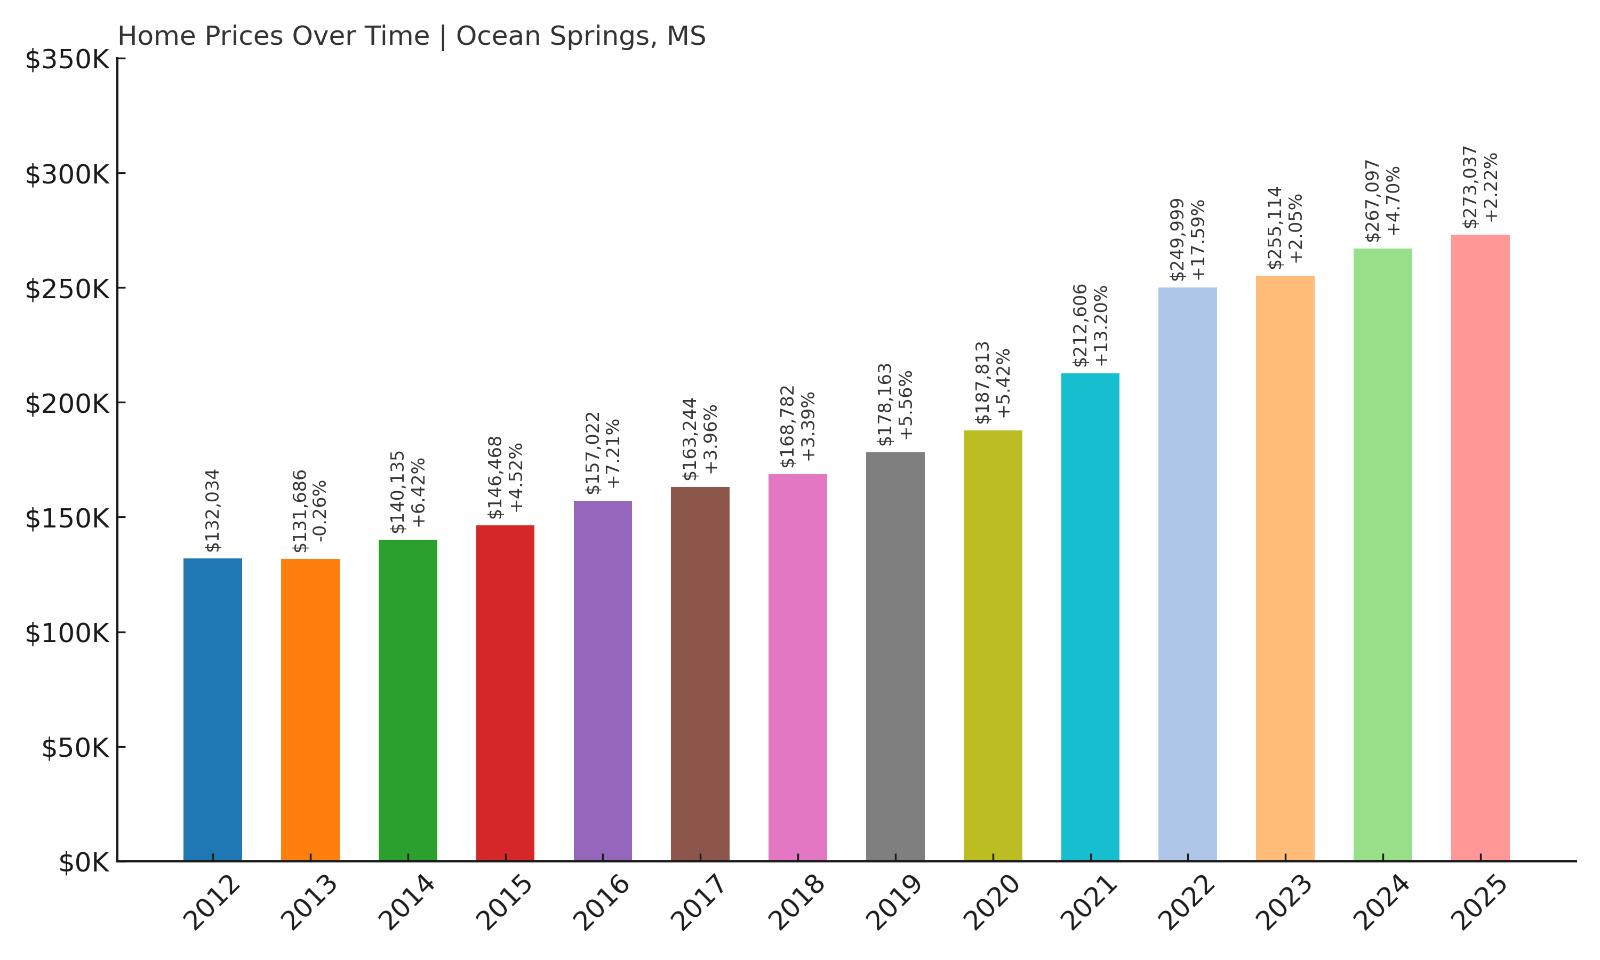
15. Ocean Springs – 106.8% Home Price Increase Since 2012
- 2010: N/A
- 2011: N/A
- 2012: $132,034
- 2013: $131,686 (-$347, -0.26% from previous year)
- 2014: $140,135 (+$8,448, +6.42% from previous year)
- 2015: $146,468 (+$6,333, +4.52% from previous year)
- 2016: $157,022 (+$10,555, +7.21% from previous year)
- 2017: $163,244 (+$6,222, +3.96% from previous year)
- 2018: $168,782 (+$5,538, +3.39% from previous year)
- 2019: $178,163 (+$9,381, +5.56% from previous year)
- 2020: $187,813 (+$9,650, +5.42% from previous year)
- 2021: $212,606 (+$24,793, +13.20% from previous year)
- 2022: $249,999 (+$37,393, +17.59% from previous year)
- 2023: $255,114 (+$5,115, +2.05% from previous year)
- 2024: $267,097 (+$11,983, +4.70% from previous year)
- 2025: $273,037 (+$5,940, +2.22% from previous year)
Ocean Springs has seen home prices more than double since 2012, climbing from $132,034 to $273,037 in 2025. After a flat 2013, growth picked up and remained strong across the 2010s. The pandemic years accelerated the trend dramatically, with a 33% jump in just two years (2020–2022). That price surge peaked in 2022 with a gain of nearly $40,000 in a single year. Growth has since moderated, but still remains positive. Ocean Springs now stands among the Gulf Coast’s most desirable housing markets, reflecting a decade-long trend of sustained appreciation.
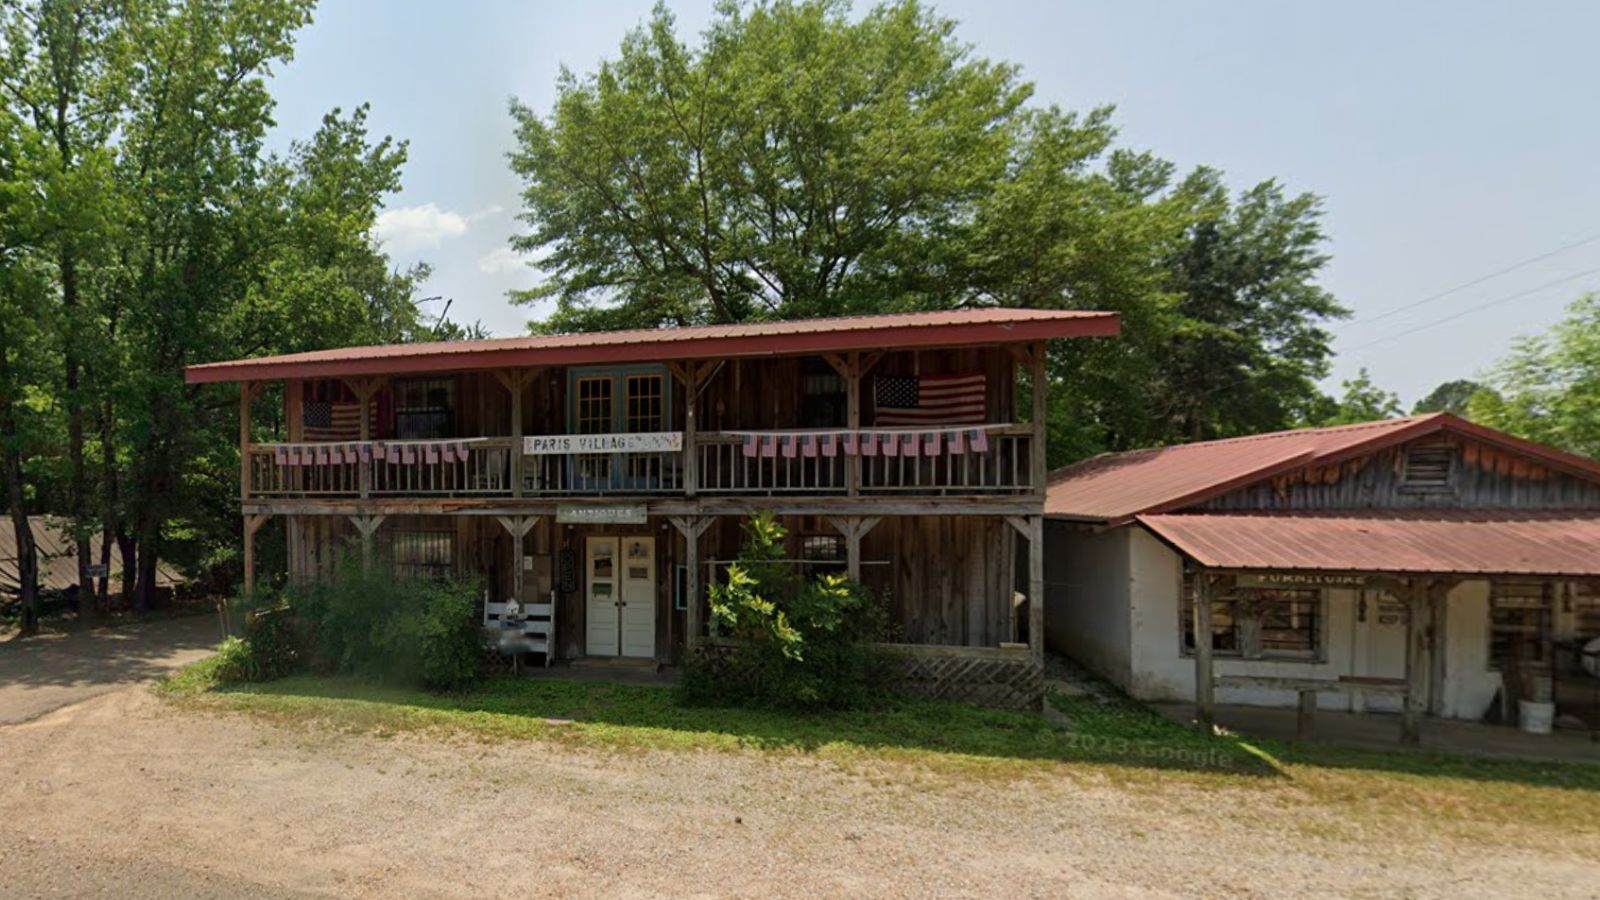
Ocean Springs – Gulf Coast Appeal and Strong Momentum
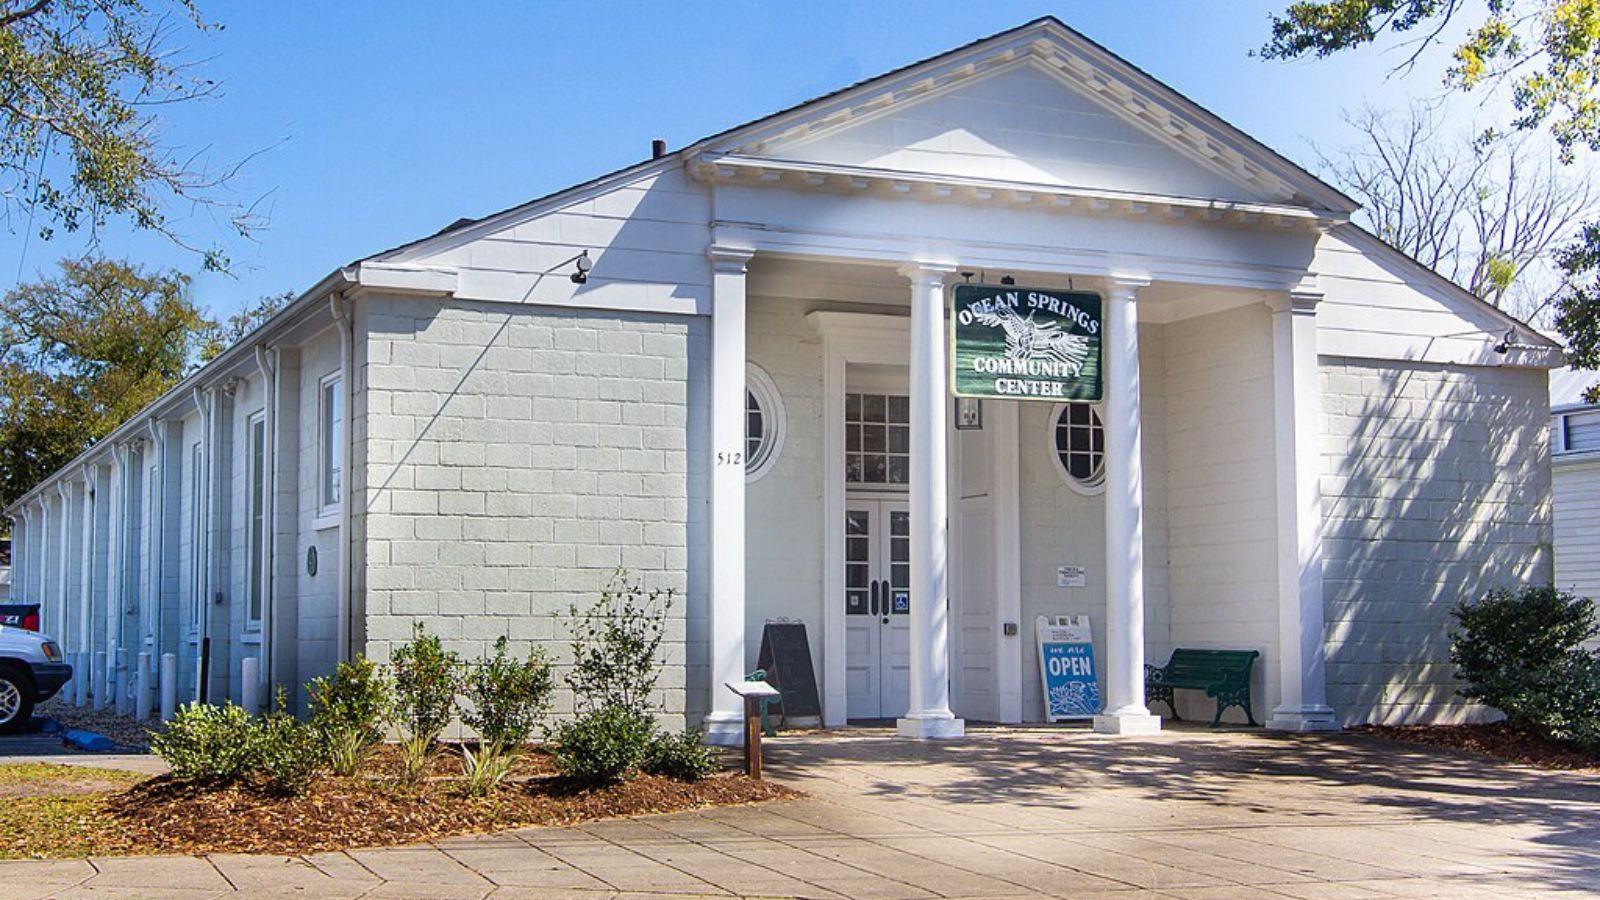
Located just east of Biloxi, Ocean Springs is one of the Mississippi Gulf Coast’s most attractive towns. Known for its walkable downtown, art galleries, coastal charm, and above-average schools, it draws a mix of families, retirees, and professionals. Unlike some coastal towns that have struggled with volatility, Ocean Springs has remained relatively resilient — both economically and in terms of housing values. Its location offers the benefits of beachfront access without the same congestion or pricing pressures found in larger cities. That balance has helped fuel consistent homebuyer interest over the years.
The town’s housing data reflects a near-ideal growth curve: modest, steady gains through the mid-2010s, followed by a steep but not unstable climb through the early 2020s. That suggests strong fundamentals are driving appreciation, not just market froth. Even in years with slower growth, the market didn’t backtrack — a rarity for coastal communities. Ocean Springs continues to benefit from regional migration, local investment, and rising demand for high-quality coastal living. With 2025 prices above $270,000, it’s now firmly positioned as one of the Gulf Coast’s premium real estate markets.
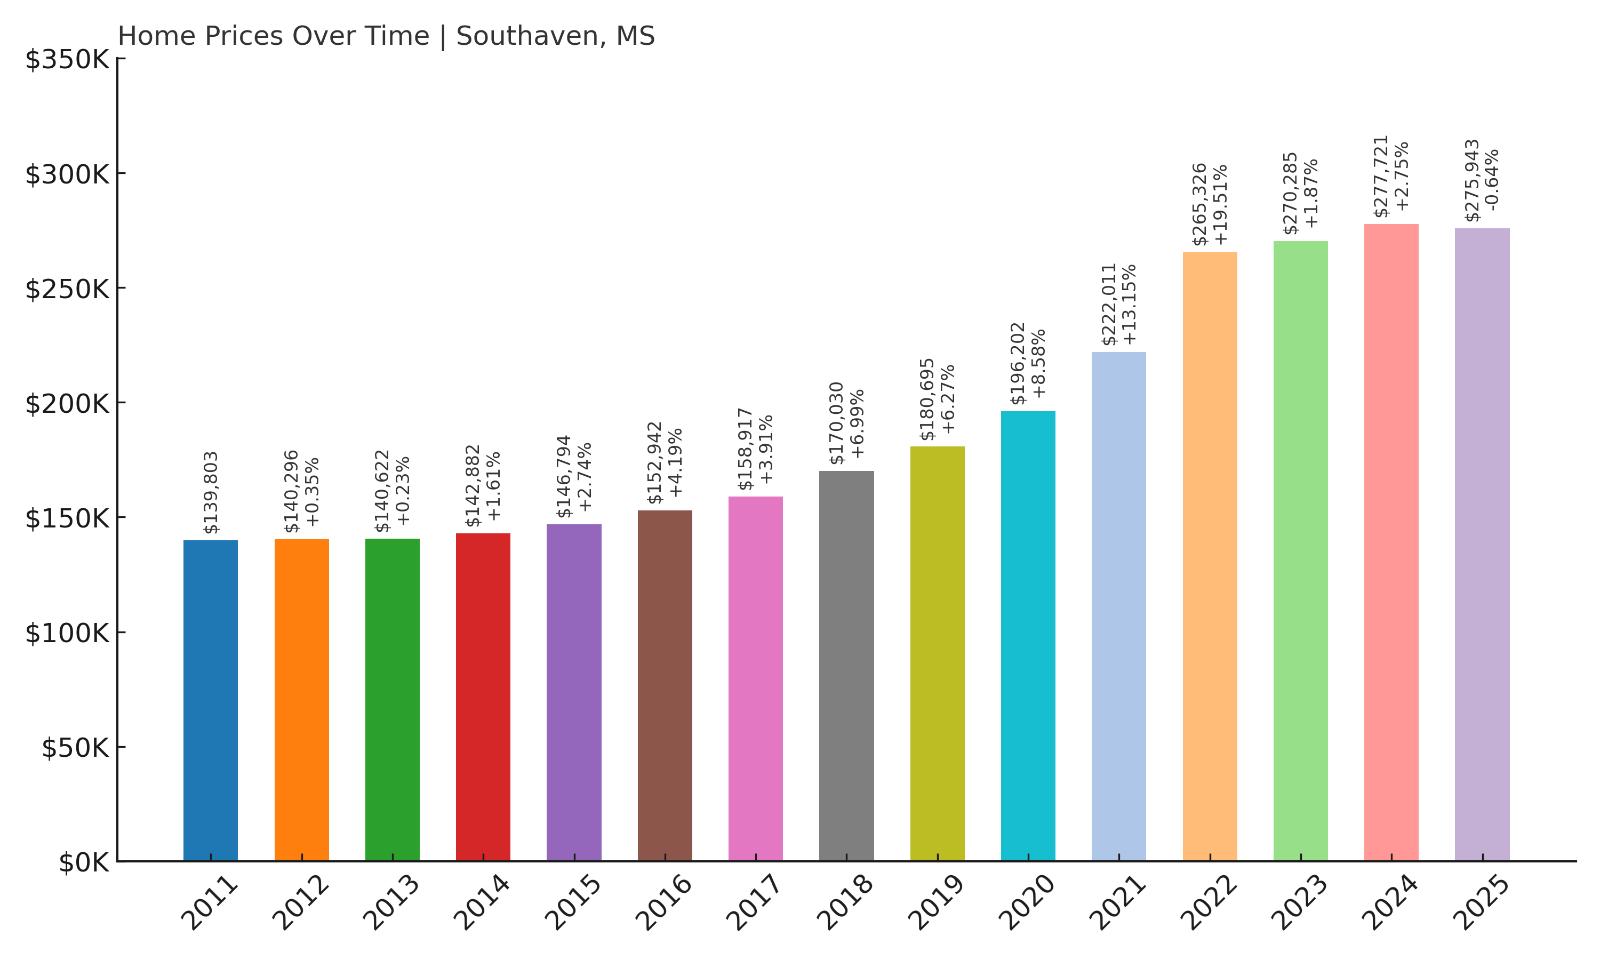
14. Southaven – 97.4% Home Price Increase Since 2011
- 2010: N/A
- 2011: $139,803
- 2012: $140,296 (+$493, +0.35% from previous year)
- 2013: $140,622 (+$327, +0.23% from previous year)
- 2014: $142,882 (+$2,260, +1.61% from previous year)
- 2015: $146,794 (+$3,912, +2.74% from previous year)
- 2016: $152,942 (+$6,147, +4.19% from previous year)
- 2017: $158,917 (+$5,976, +3.91% from previous year)
- 2018: $170,030 (+$11,113, +6.99% from previous year)
- 2019: $180,695 (+$10,664, +6.27% from previous year)
- 2020: $196,202 (+$15,507, +8.58% from previous year)
- 2021: $222,011 (+$25,810, +13.15% from previous year)
- 2022: $265,326 (+$43,314, +19.51% from previous year)
- 2023: $270,285 (+$4,959, +1.87% from previous year)
- 2024: $277,721 (+$7,436, +2.75% from previous year)
- 2025: $275,943 (-$1,778, -0.64% from previous year)
Southaven’s home prices have surged by 97.4% since 2011, when the average value was just under $140,000. In the years that followed, the market climbed steadily, with significant leaps during the 2020 to 2022 boom period. While 2025 showed a slight dip of 0.64% from the previous year, the overall growth trajectory has been strong and consistent. Prices nearly doubled in just over a decade, making Southaven one of the most expensive housing markets in Mississippi. Much of this appreciation occurred between 2020 and 2022, when homes jumped from $196,202 to $265,326 — a rise of nearly $70,000 in just two years.
Southaven – A Suburban Powerhouse Near Memphis
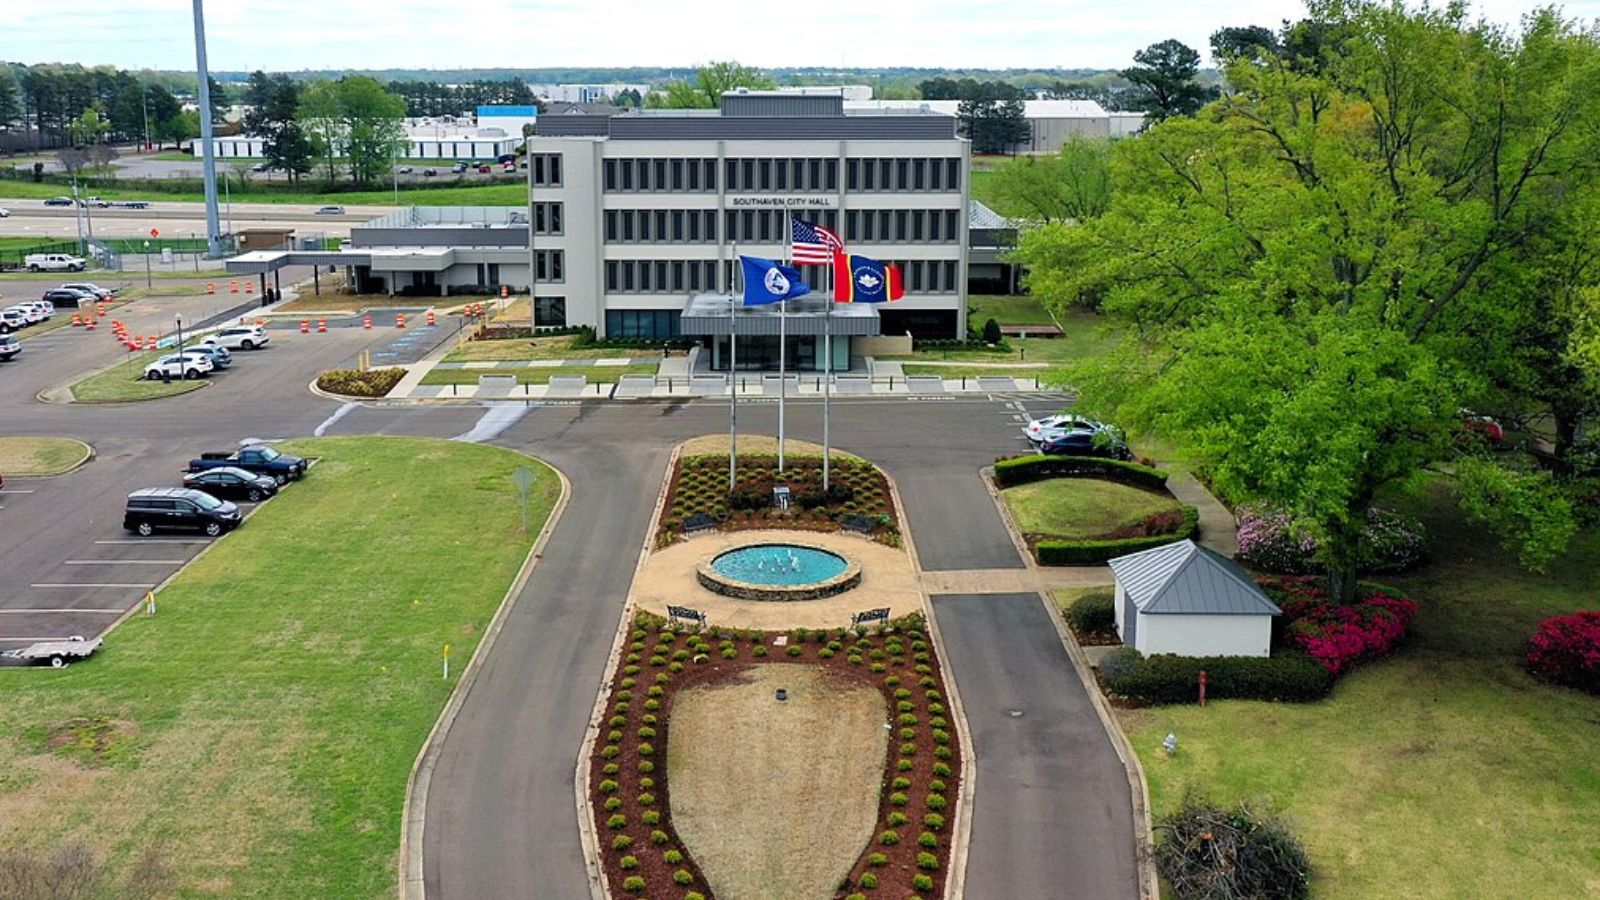
Located just across the Tennessee border, Southaven has long functioned as a key suburb of the Memphis metropolitan area. Its proximity to Memphis International Airport and major roadways like I-55 and I-69 has made it attractive for commuters, businesses, and developers alike. The city’s rapid retail and residential growth over the past decade has reshaped its landscape, transforming once-rural areas into bustling neighborhoods, big-box shopping centers, and modern apartment complexes. DeSoto County, where Southaven sits, is one of Mississippi’s fastest-growing counties, and Southaven is its largest city — with a population now topping 55,000. This sustained growth has created strong demand in the local housing market, helping drive prices upward at a pace that outstrips many other cities in the state.
Southaven’s appeal goes beyond its commuter convenience. The city has made significant investments in recreation and livability, with developments like the Landers Center (a multi-use arena), Snowden Grove Park (one of the region’s premier baseball complexes), and a variety of public schools ranked among the best in Mississippi. For many families seeking suburban amenities without the price tag of larger metro areas, Southaven hits the sweet spot. Even with its recent slowdown in price growth, demand remains solid thanks to job access, schools, and ongoing development — positioning it as a resilient market even in the face of broader real estate headwinds.
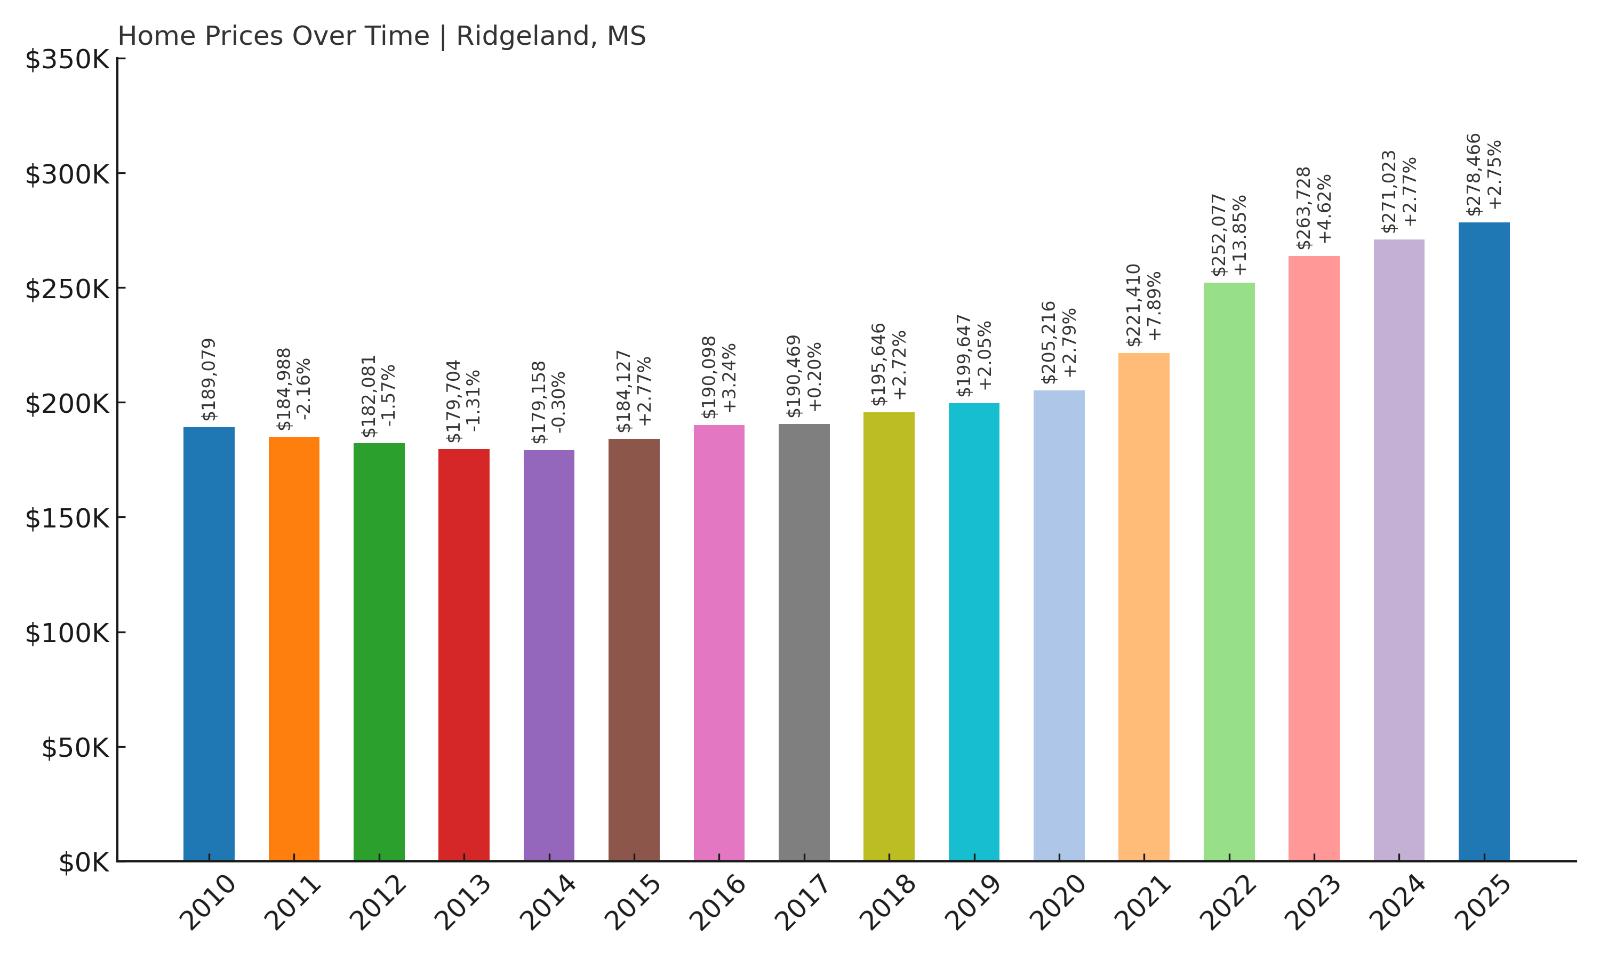
13. Ridgeland – 47.2% Home Price Increase Since 2010
- 2010: $189,079
- 2011: $184,988 (-$4,092, -2.16% from previous year)
- 2012: $182,081 (-$2,907, -1.57% from previous year)
- 2013: $179,704 (-$2,377, -1.31% from previous year)
- 2014: $179,158 (-$546, -0.30% from previous year)
- 2015: $184,127 (+$4,970, +2.77% from previous year)
- 2016: $190,098 (+$5,971, +3.24% from previous year)
- 2017: $190,469 (+$371, +0.20% from previous year)
- 2018: $195,646 (+$5,176, +2.72% from previous year)
- 2019: $199,647 (+$4,002, +2.05% from previous year)
- 2020: $205,216 (+$5,568, +2.79% from previous year)
- 2021: $221,410 (+$16,194, +7.89% from previous year)
- 2022: $252,077 (+$30,667, +13.85% from previous year)
- 2023: $263,728 (+$11,651, +4.62% from previous year)
- 2024: $271,023 (+$7,294, +2.77% from previous year)
- 2025: $278,466 (+$7,444, +2.75% from previous year)
Home values in Ridgeland have climbed 47% since 2010, rising from $189,079 to $278,466 in 2025. While the early years saw some stagnation and even mild declines, prices turned upward after 2015 and gained serious momentum by 2021. That year alone added over $16,000 in value. The biggest leap occurred in 2022, with prices jumping more than 13% in a single year. Since then, the market has cooled slightly, but continued to grow consistently through 2025. Ridgeland’s housing market now sits at the high end of the state, reflecting both its suburban appeal and strong local economy. The price trajectory shows not just recovery, but acceleration over time.
Ridgeland – Steady Climb in a Suburban Hotspot
Ridgeland, located just north of Jackson in Madison County, is one of the most developed and desirable suburbs in central Mississippi. It’s home to major employers, shopping districts, top-rated schools, and access to the scenic Natchez Trace Parkway. Over the past decade, Ridgeland has seen significant commercial and residential growth, which in turn has driven steady appreciation in home values. Buyers are often drawn by its combination of urban convenience and suburban comfort. Ridgeland is also part of the Jackson metropolitan area’s professional corridor, making it an ideal spot for those commuting to jobs in healthcare, finance, or education.
What makes Ridgeland stand out is its resilience and consistency. While other towns showed volatile price shifts, Ridgeland has maintained a smooth upward climb with no major setbacks. From 2018 to 2022, prices increased by nearly $60,000 — a jump that reflects both local investment and outside interest. Even as statewide prices cooled in 2023 and 2024, Ridgeland remained on an upward track. With its current value approaching $280,000, Ridgeland’s housing market shows no sign of slipping, and it continues to attract attention as one of Mississippi’s premier places to live, invest, or settle long-term.
12. Starkville – 50.2% Home Price Increase Since 2010

🔥 Would you like to save this?
- 2010: $185,499
- 2011: $183,879 (-$1,620, -0.87% from previous year)
- 2012: $190,337 (+$6,459, +3.51% from previous year)
- 2013: $203,112 (+$12,775, +6.71% from previous year)
- 2014: $198,253 (-$4,859, -2.39% from previous year)
- 2015: $186,730 (-$11,523, -5.81% from previous year)
- 2016: $185,950 (-$780, -0.42% from previous year)
- 2017: $193,317 (+$7,367, +3.96% from previous year)
- 2018: $196,574 (+$3,257, +1.68% from previous year)
- 2019: $205,303 (+$8,729, +4.44% from previous year)
- 2020: $206,811 (+$1,507, +0.73% from previous year)
- 2021: $219,902 (+$13,092, +6.33% from previous year)
- 2022: $244,591 (+$24,689, +11.23% from previous year)
- 2023: $246,770 (+$2,179, +0.89% from previous year)
- 2024: $265,803 (+$19,032, +7.71% from previous year)
- 2025: $278,511 (+$12,709, +4.78% from previous year)
Starkville’s housing market has grown steadily over the last 15 years, with prices rising from $185,499 in 2010 to $278,511 in 2025. That’s a gain of over 50%, despite some dips and flat years during the mid-2010s. Since 2020, the market has taken off, led by a double-digit rise in 2022 and continued strong growth into 2025. The biggest stretch came from 2020 to 2024, where home values jumped nearly $60,000 in just four years. This growth trend suggests rising demand, particularly among professionals, investors, and academics tied to the local university. Even with some historical dips, Starkville’s long-term trend remains strongly upward.
Starkville – College Town With a Rising Market
Starkville is best known as the home of Mississippi State University, which plays a major role in its housing dynamics. As a college town, it has a built-in population of students, faculty, and staff, all of whom contribute to ongoing housing demand. The presence of a major research institution also draws corporate partnerships, tech startups, and seasonal activity — all of which support home values. Starkville’s real estate market benefits from both a stable local economy and a steady influx of new residents. The growth in recent years suggests that investors and buyers are increasingly confident in Starkville’s future as a vibrant regional hub.
The town’s housing journey hasn’t been perfectly smooth. After early gains, it experienced some price dips from 2014 to 2016, followed by a slow recovery. But by 2020, that momentum returned, and price growth became more aggressive. From 2021 to 2025, home values rose by nearly $60,000. Today, Starkville combines educational influence with small-town charm and economic promise. It’s now one of Mississippi’s pricier markets, and if recent trends continue, that trajectory could still have room to climb. For buyers and long-term investors, Starkville offers a rare mix of stability, culture, and appreciation potential.
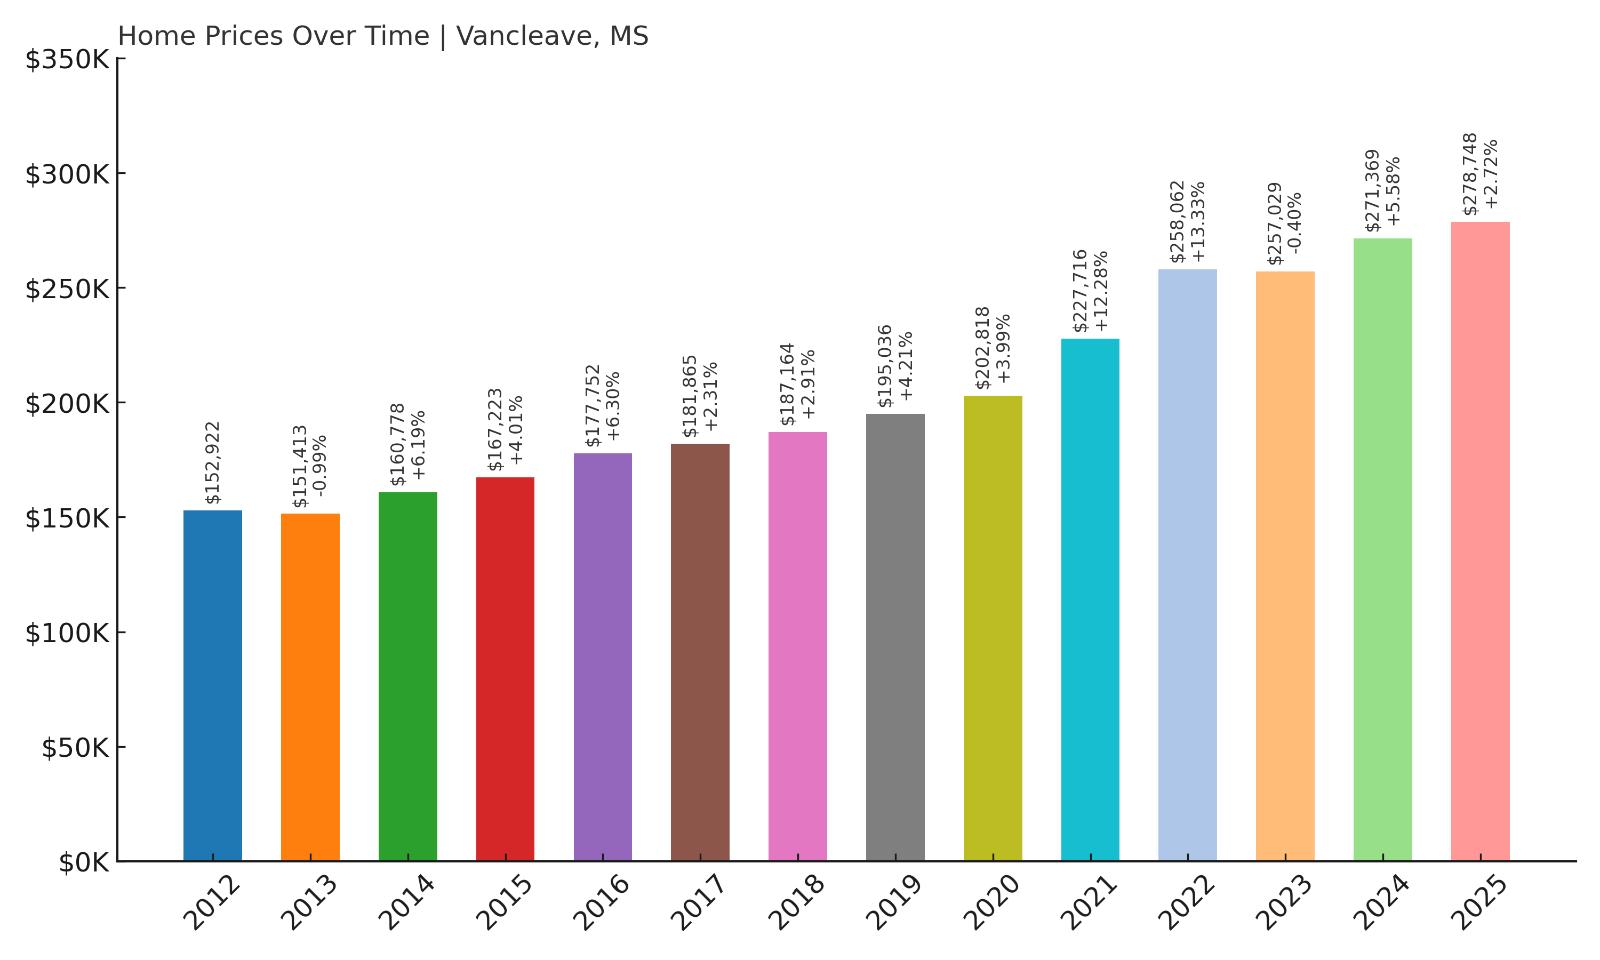
11. Vancleave – 82.4% Home Price Increase Since 2012
- 2010: N/A
- 2011: N/A
- 2012: $152,922
- 2013: $151,413 (-$1,509, -0.99% from previous year)
- 2014: $160,778 (+$9,365, +6.19% from previous year)
- 2015: $167,223 (+$6,445, +4.01% from previous year)
- 2016: $177,752 (+$10,529, +6.30% from previous year)
- 2017: $181,865 (+$4,113, +2.31% from previous year)
- 2018: $187,164 (+$5,299, +2.91% from previous year)
- 2019: $195,036 (+$7,872, +4.21% from previous year)
- 2020: $202,818 (+$7,782, +3.99% from previous year)
- 2021: $227,716 (+$24,898, +12.28% from previous year)
- 2022: $258,062 (+$30,346, +13.33% from previous year)
- 2023: $257,029 (-$1,033, -0.40% from previous year)
- 2024: $271,369 (+$14,340, +5.58% from previous year)
- 2025: $278,748 (+$7,379, +2.72% from previous year)
Since 2012, home prices in Vancleave have grown by over 82%, climbing from $152,922 to $278,748 in 2025. After modest gains in the mid-2010s, the market took off after 2020. The biggest leaps came in 2021 and 2022, where prices soared by more than $55,000 in just two years. The only dip in this period occurred in 2023, but it was minor and followed by renewed growth. The numbers show a market that has evolved from steady to strong — a shift that mirrors growing interest in quiet, well-located towns outside of busier coastal areas. In 2025, Vancleave stands out as one of Mississippi’s more valuable housing markets.
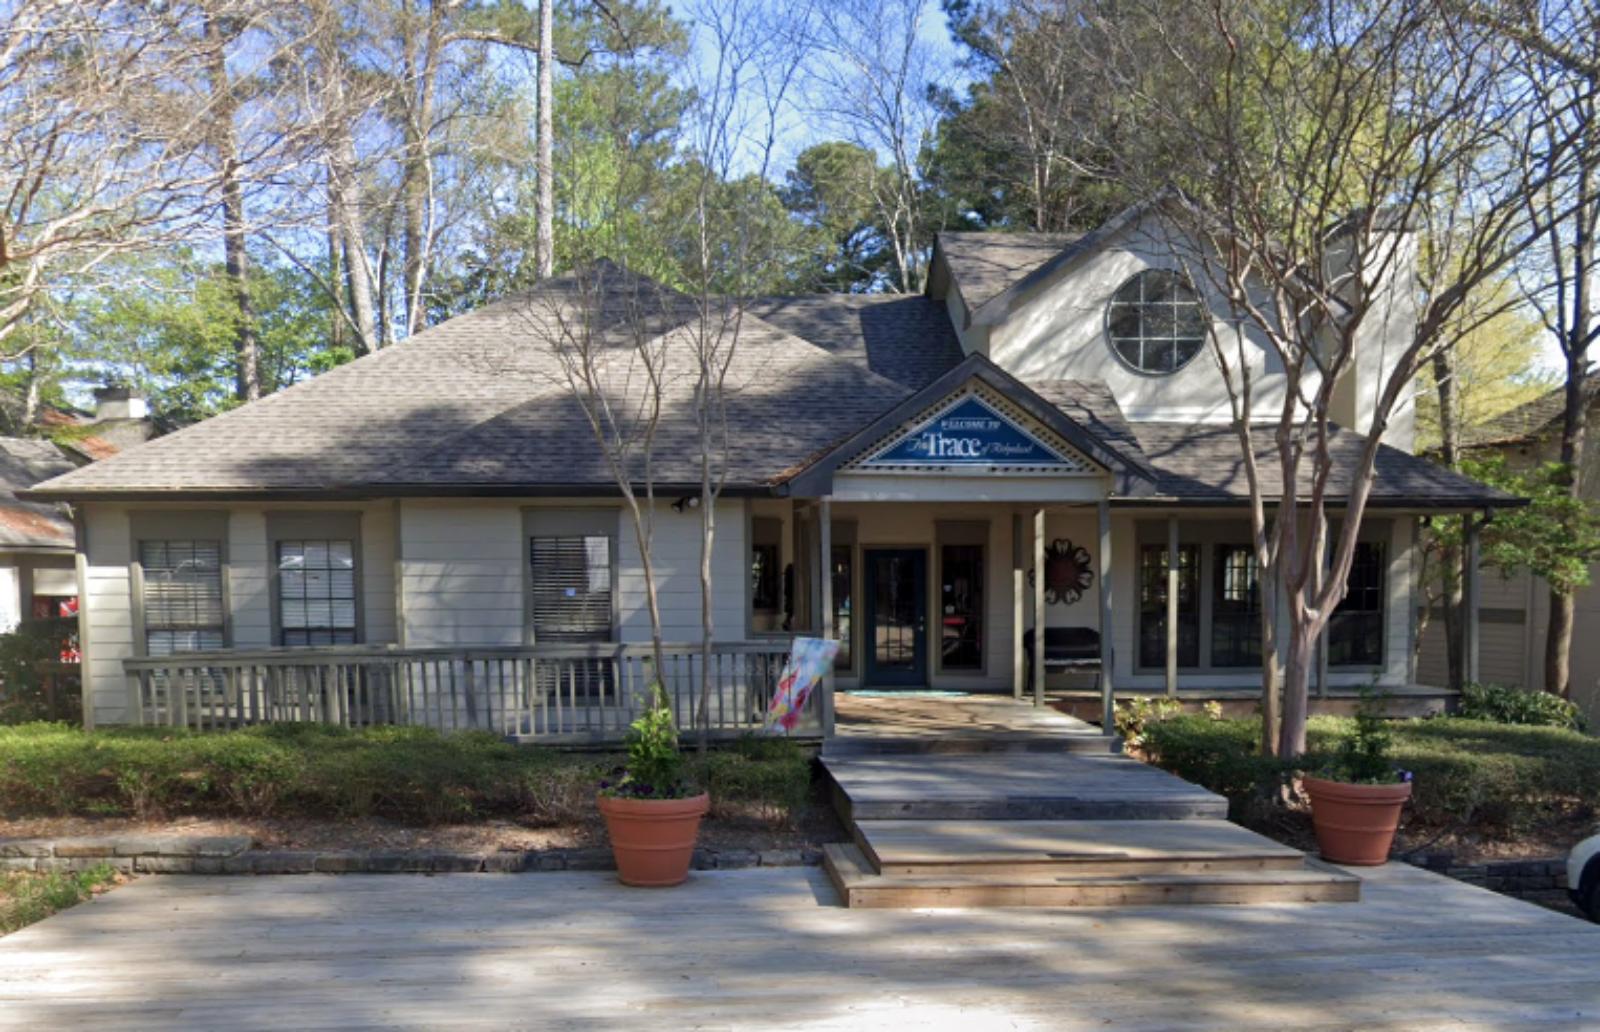
Vancleave – Strong Gains on the Gulf Edge
Vancleave is located in Jackson County, just north of the Mississippi Gulf Coast and within reach of cities like Ocean Springs and Biloxi. While it doesn’t sit directly on the water, it offers a quieter alternative to the more tourist-driven areas. That inland distance has kept it more affordable for years, but it’s also insulated it from some of the coastal market volatility. Over the last decade, Vancleave has gained attention for its peaceful setting, family-friendly environment, and access to both nature and urban centers. These qualities have fueled demand among buyers seeking more space without sacrificing accessibility.
The housing market here has evolved from slow-and-steady to rapid-growth in recent years. Once overlooked, Vancleave now sees price jumps that rival some of the state’s hottest spots. The leap from $202,000 to $258,000 in two years is especially telling — a sign of outside buyers entering the market or locals reinvesting. The town still retains a strong sense of identity, with ties to fishing, farming, and outdoor recreation. For those willing to look just beyond the Gulf, Vancleave offers high value and long-term potential. That shift is now firmly reflected in its place on this list of Mississippi’s most expensive towns.
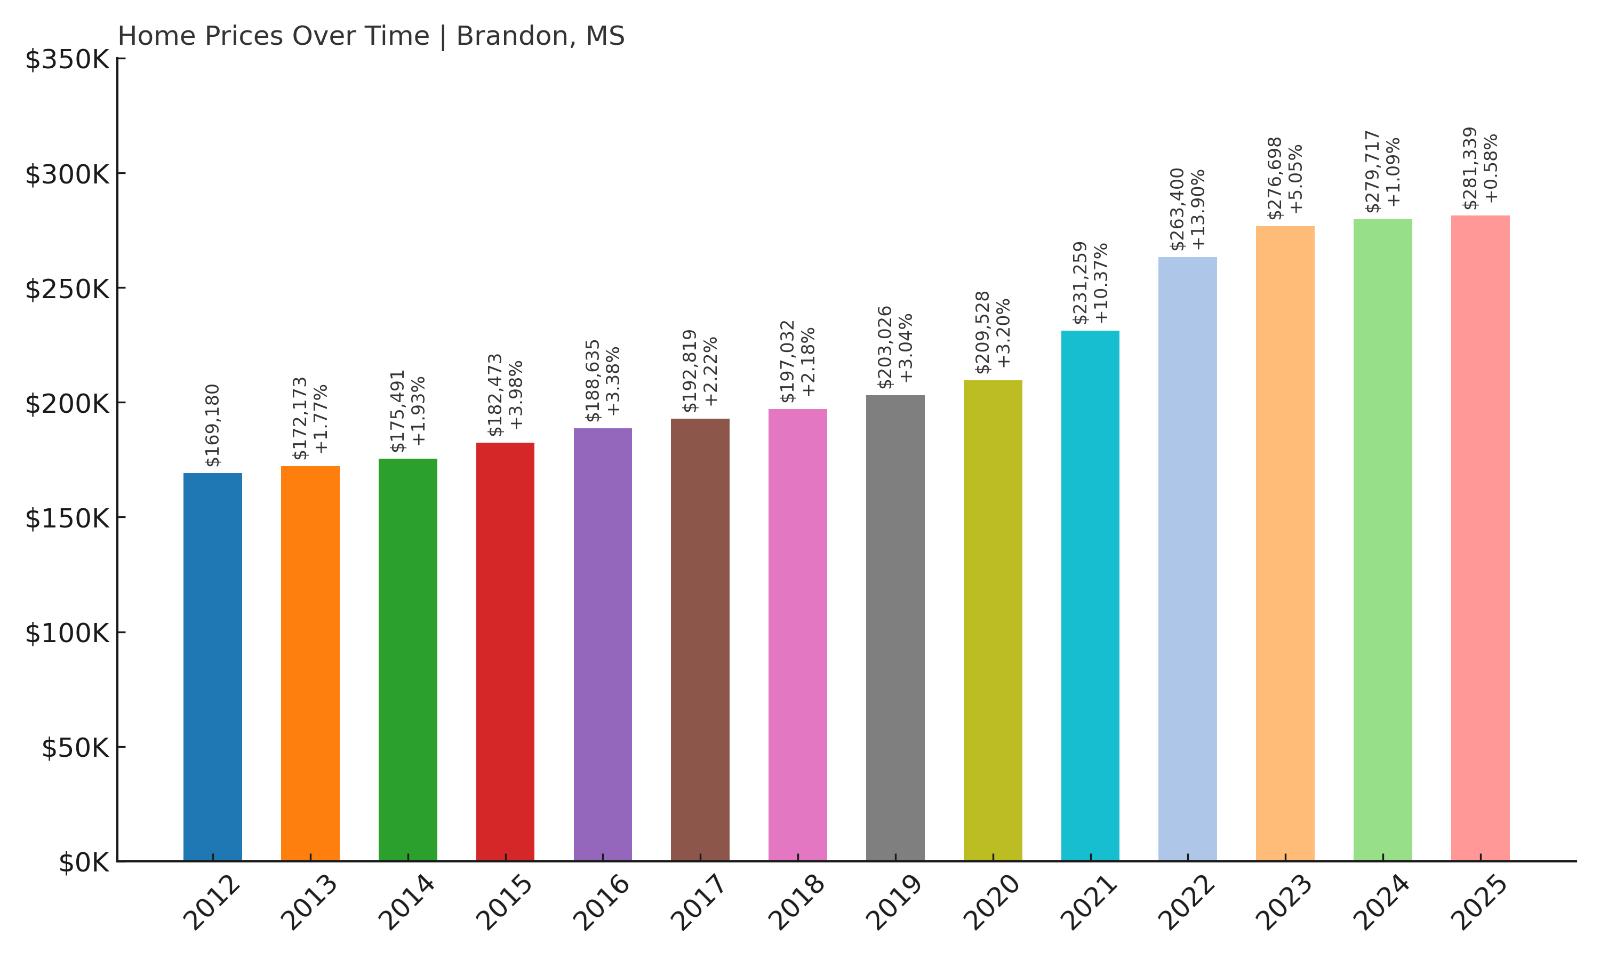
10. Brandon – 66.3% Home Price Increase Since 2012
- 2010: N/A
- 2011: N/A
- 2012: $169,180
- 2013: $172,173 (+$2,993, +1.77% from previous year)
- 2014: $175,491 (+$3,317, +1.93% from previous year)
- 2015: $182,473 (+$6,982, +3.98% from previous year)
- 2016: $188,635 (+$6,163, +3.38% from previous year)
- 2017: $192,819 (+$4,184, +2.22% from previous year)
- 2018: $197,032 (+$4,213, +2.18% from previous year)
- 2019: $203,026 (+$5,993, +3.04% from previous year)
- 2020: $209,528 (+$6,502, +3.20% from previous year)
- 2021: $231,259 (+$21,731, +10.37% from previous year)
- 2022: $263,400 (+$32,142, +13.90% from previous year)
- 2023: $276,698 (+$13,297, +5.05% from previous year)
- 2024: $279,717 (+$3,019, +1.09% from previous year)
- 2025: $281,339 (+$1,622, +0.58% from previous year)
Brandon’s home prices have surged over 66% since 2012, moving from $169,180 to $281,339 in 2025. For much of the 2010s, appreciation was modest and steady, with annual increases hovering around 2–4%. However, the market took off starting in 2021, when prices jumped by over $21,000 in a single year. The following year was even stronger, with an increase of more than $32,000. Though growth has slowed more recently, the market remains elevated, and prices have continued climbing through 2025. With consistent demand and a strong residential base, Brandon now ranks firmly among the top 10 most expensive towns in Mississippi.
Brandon – Rapid Rise in a Metro Suburb
Brandon is a key suburb of the Jackson metropolitan area and one of the fastest-growing cities in Rankin County. Known for its good schools, family-friendly neighborhoods, and proximity to the Ross Barnett Reservoir, the town has attracted a mix of young professionals and retirees alike. It offers the amenities of city life without the congestion, and that balance has fueled ongoing real estate interest. Over the past decade, Brandon has become a preferred destination for those seeking space, security, and suburban stability — factors that often translate to rising home values.
The housing data supports that narrative. After a slow build in the early 2010s, Brandon experienced a major lift during the post-pandemic housing boom, with prices spiking between 2020 and 2022. The fact that values have continued rising, even as growth has cooled elsewhere, shows the strength of local demand. In 2025, homes here average over $280,000, and that figure has been largely insulated from volatility. For buyers, that means a competitive market. For sellers and investors, it’s a clear signal that Brandon continues to deliver both desirability and upward price momentum.
9. Flora – 75.6% Home Price Increase Since 2010
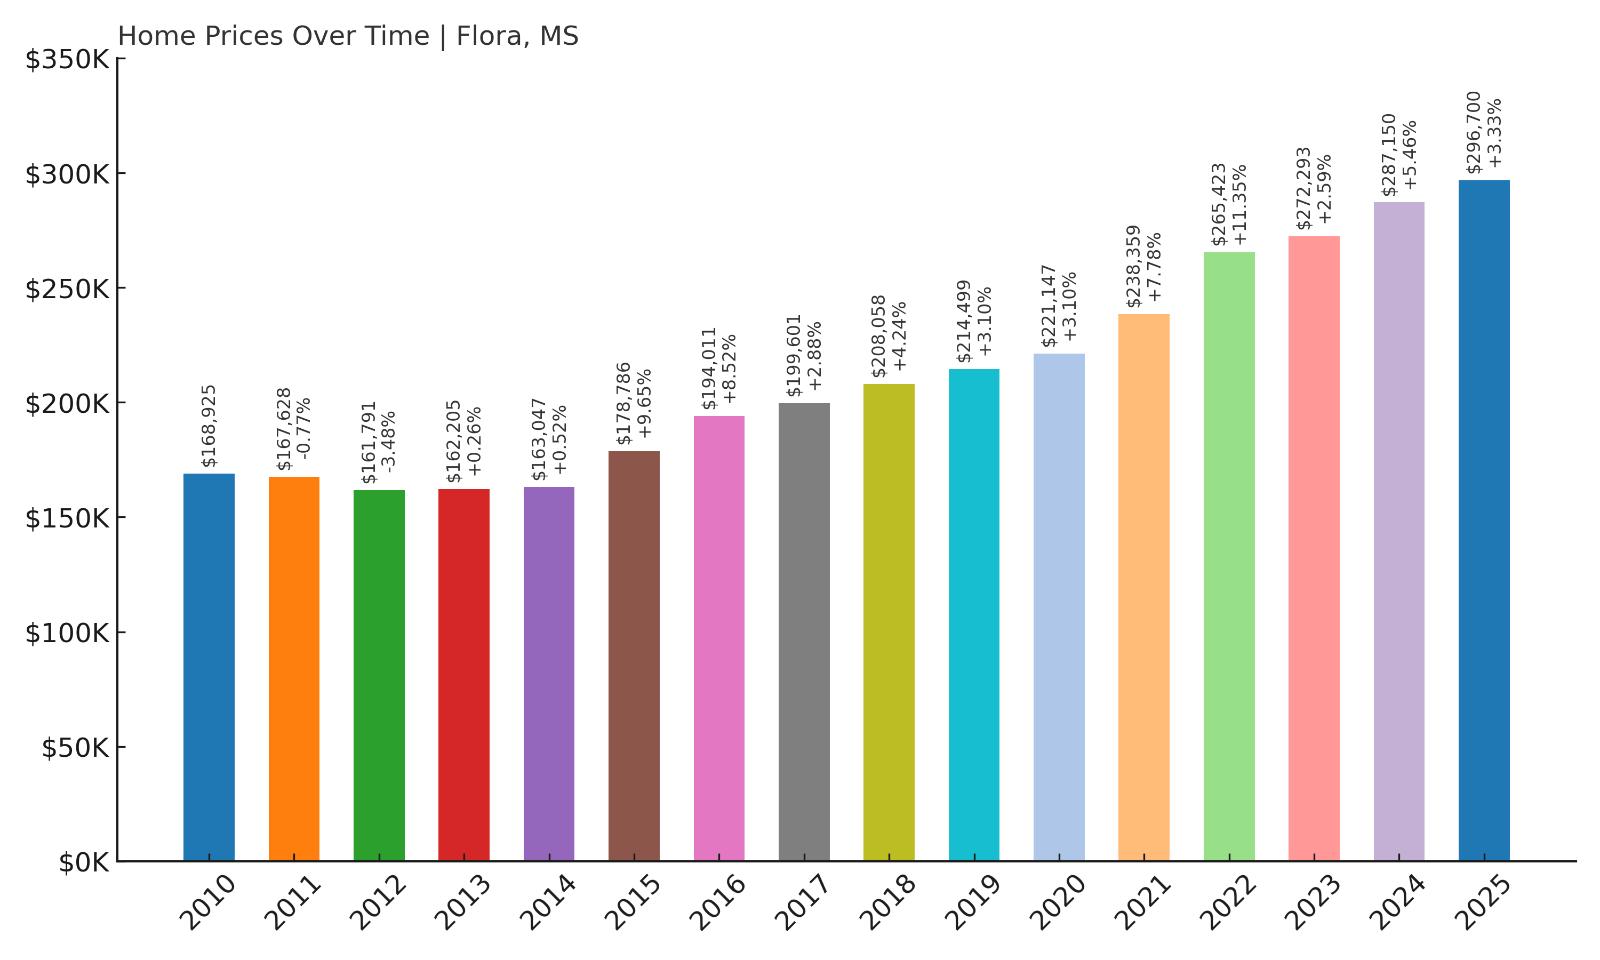
- 2010: $168,925
- 2011: $167,628 (-$1,297, -0.77% from previous year)
- 2012: $161,791 (-$5,837, -3.48% from previous year)
- 2013: $162,205 (+$414, +0.26% from previous year)
- 2014: $163,047 (+$842, +0.52% from previous year)
- 2015: $178,786 (+$15,739, +9.65% from previous year)
- 2016: $194,011 (+$15,225, +8.52% from previous year)
- 2017: $199,601 (+$5,591, +2.88% from previous year)
- 2018: $208,058 (+$8,457, +4.24% from previous year)
- 2019: $214,499 (+$6,441, +3.10% from previous year)
- 2020: $221,147 (+$6,648, +3.10% from previous year)
- 2021: $238,359 (+$17,212, +7.78% from previous year)
- 2022: $265,423 (+$27,064, +11.35% from previous year)
- 2023: $272,293 (+$6,870, +2.59% from previous year)
- 2024: $287,150 (+$14,858, +5.46% from previous year)
- 2025: $296,700 (+$9,549, +3.33% from previous year)
Home values in Flora have increased by more than 75% since 2010, rising from $168,925 to $296,700 in 2025. After a couple of early dips, the town’s real estate market began a steady climb, particularly after 2015. The two biggest gains came in 2015 and 2022, with jumps of nearly $16,000 and $27,000 respectively. Flora has seen consistent appreciation in almost every year since 2014, with no significant downturns. That kind of long-term reliability has pushed the town toward the top of Mississippi’s price charts. Even as statewide markets have cooled, Flora continues to show solid annual growth into 2025.
Flora – Quiet Town, Major Appreciation
Flora sits in Madison County, just a short drive northwest of Jackson. With a population under 2,000, it offers a tranquil, small-town lifestyle while maintaining close access to one of Mississippi’s largest economic hubs. The town has a reputation for stability, good local schools, and a strong sense of community — all factors that tend to support housing demand. In recent years, it’s also seen increased attention from developers and homebuyers looking for rural charm without sacrificing commute times. As pressure mounts in larger suburbs, Flora has quietly benefited from spillover demand.
The town’s housing history tells a story of dependable growth. Once values began rising in earnest around 2015, they haven’t stopped. Year after year, Flora’s market has delivered gains, often outpacing statewide averages. From 2020 to 2025, home prices rose more than $75,000 — a major leap for a small town. Flora’s steady appreciation and relative affordability compared to larger suburbs make it a strong contender for families and retirees alike. It’s not flashy, but it’s consistent — and in real estate, that’s often what matters most.
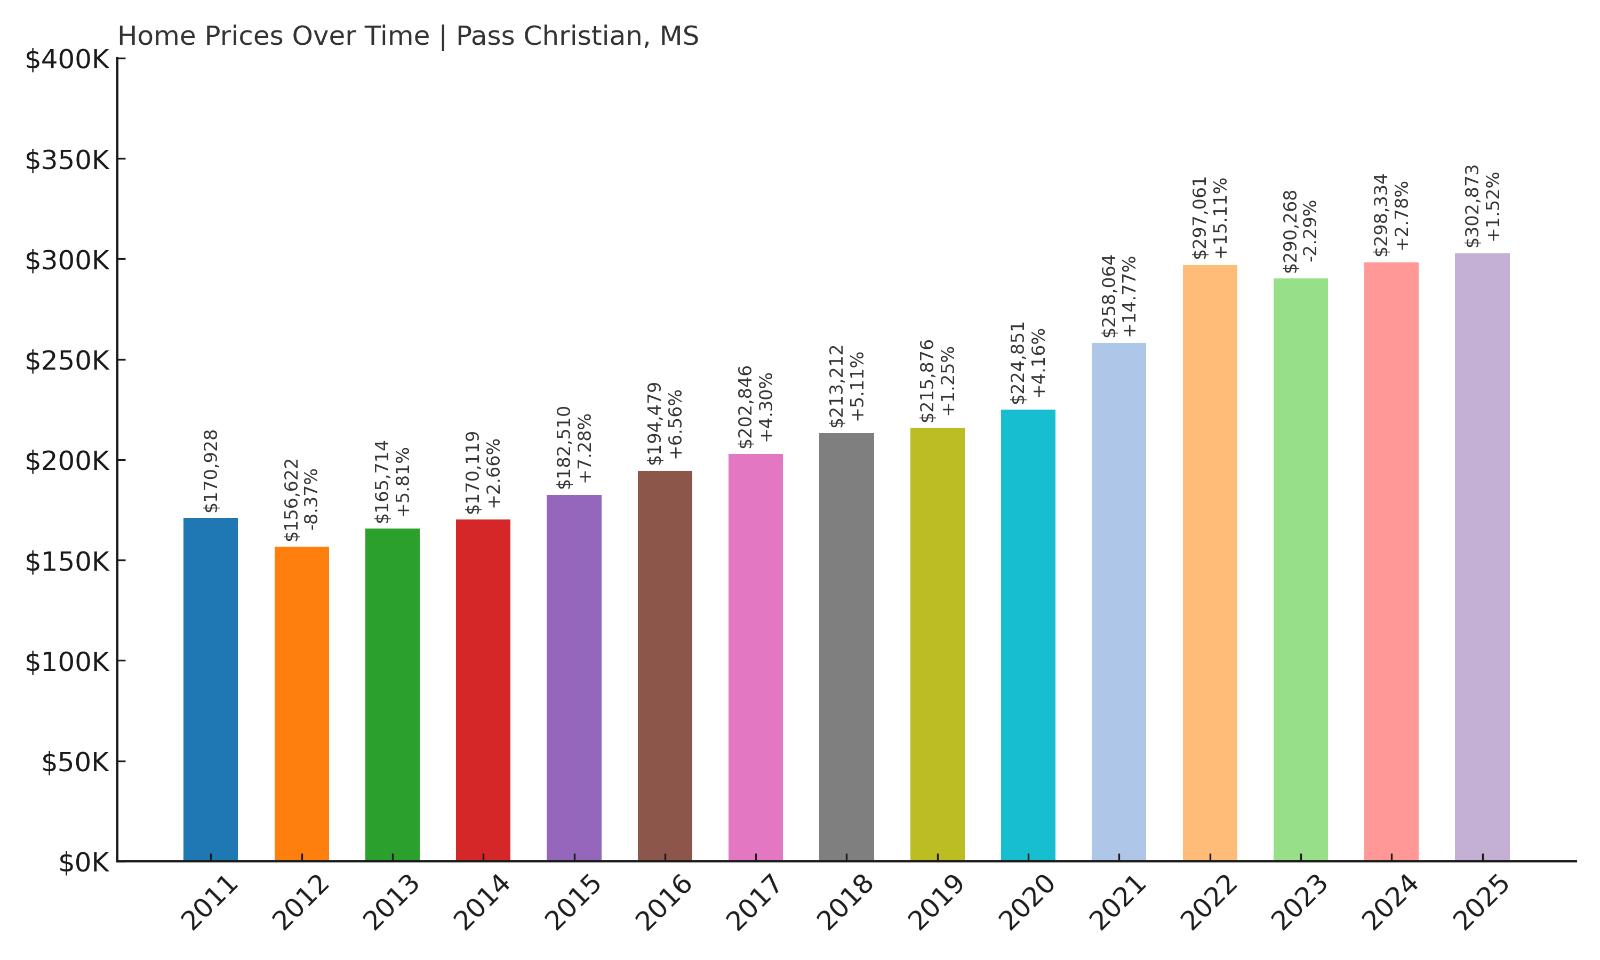
8. Pass Christian – 77.2% Home Price Increase Since 2011
- 2010: N/A
- 2011: $170,928
- 2012: $156,622 (-$14,306, -8.37% from previous year)
- 2013: $165,714 (+$9,093, +5.81% from previous year)
- 2014: $170,119 (+$4,405, +2.66% from previous year)
- 2015: $182,510 (+$12,391, +7.28% from previous year)
- 2016: $194,479 (+$11,969, +6.56% from previous year)
- 2017: $202,846 (+$8,367, +4.30% from previous year)
- 2018: $213,212 (+$10,366, +5.11% from previous year)
- 2019: $215,876 (+$2,664, +1.25% from previous year)
- 2020: $224,851 (+$8,975, +4.16% from previous year)
- 2021: $258,064 (+$33,213, +14.77% from previous year)
- 2022: $297,061 (+$38,997, +15.11% from previous year)
- 2023: $290,268 (-$6,793, -2.29% from previous year)
- 2024: $298,334 (+$8,067, +2.78% from previous year)
- 2025: $302,873 (+$4,539, +1.52% from previous year)
Home prices in Pass Christian have increased by over 77% since 2011, rising from $170,928 to $302,873 in 2025. The strongest growth came during the post-pandemic surge, particularly between 2020 and 2022, when values soared by more than $70,000 in just two years. After a brief dip in 2023, the market rebounded in 2024 and 2025 with moderate gains. Pass Christian’s long-term trend remains firmly upward, and its current pricing reflects its status as a desirable Gulf Coast destination. While volatility is a risk in coastal markets, this town has weathered recent shifts and stayed attractive to buyers.
Pass Christian – Coastal Views, Rising Demand
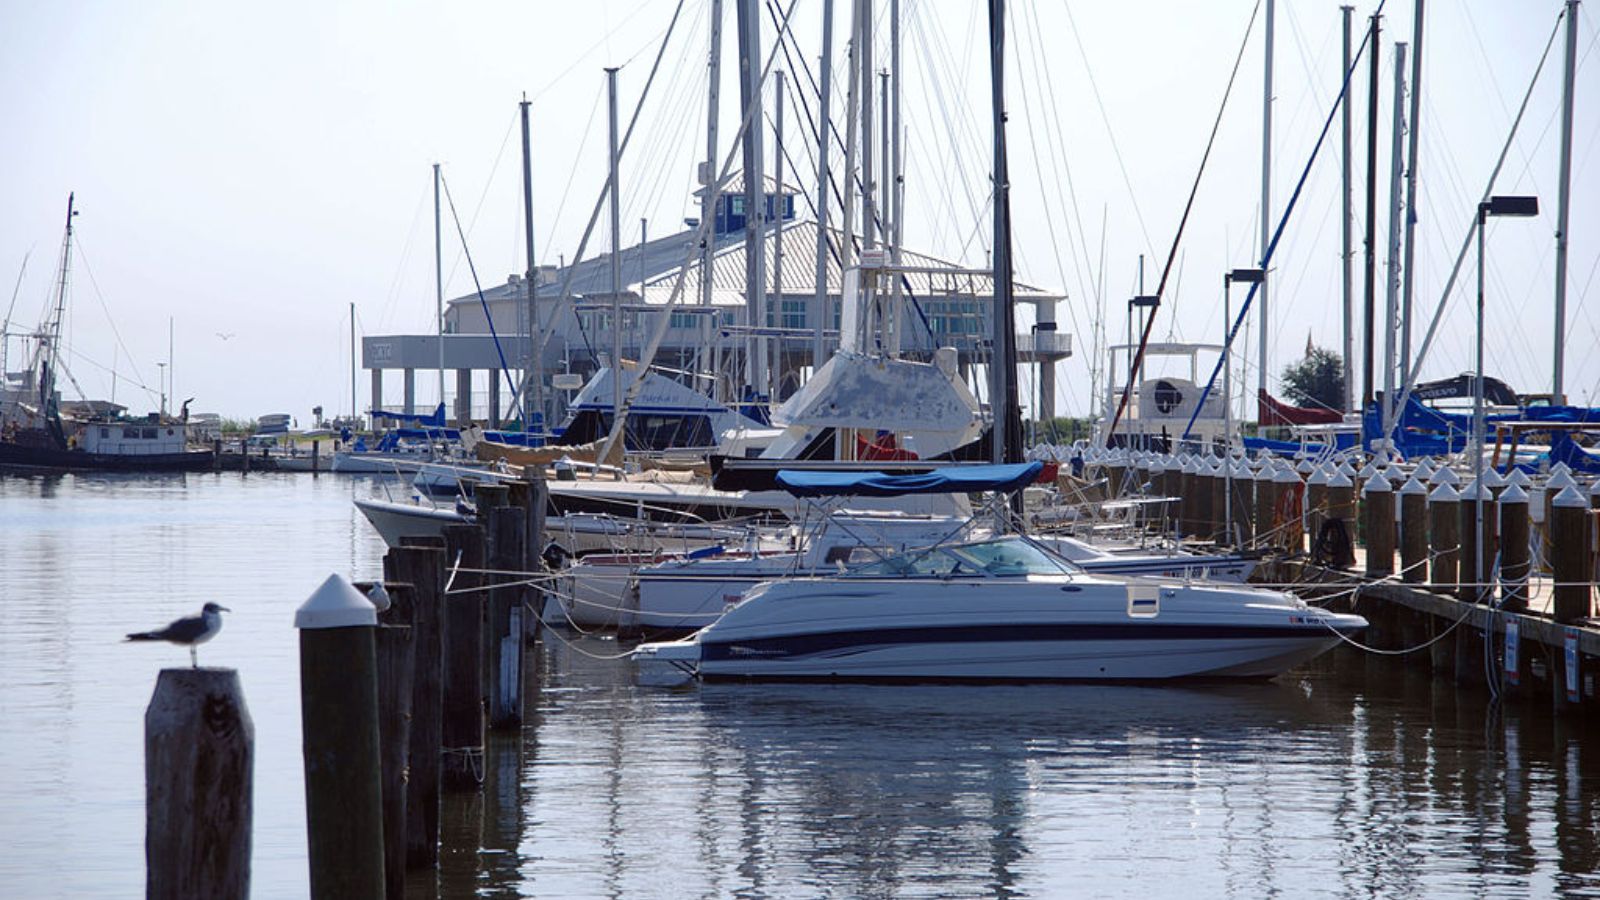
Pass Christian is located on the Gulf Coast in Harrison County and is one of Mississippi’s most scenic beach communities. Known for its beautiful waterfront homes, historic charm, and peaceful atmosphere, the town has become increasingly popular with second-home buyers, retirees, and those relocating from larger cities. Its downtown has seen revitalization in recent years, and the combination of relaxed living and access to the coast makes it one of the more upscale housing markets in the state. The town also benefits from a strong tourism base and proximity to other Gulf Coast hotspots like Bay St. Louis and Gulfport.
In terms of housing, Pass Christian saw explosive growth in the early 2020s, with double-digit annual gains driven by high demand for coastal properties. Even after a minor correction in 2023, prices bounced back quickly — a sign of resilience and ongoing interest. As of 2025, home values exceed $300,000, putting the town in the top tier of Mississippi’s real estate markets. It’s a reflection of both lifestyle appeal and limited supply. For buyers seeking coastal access with a community vibe, Pass Christian offers one of the most attractive — and now most expensive — options on the Gulf.
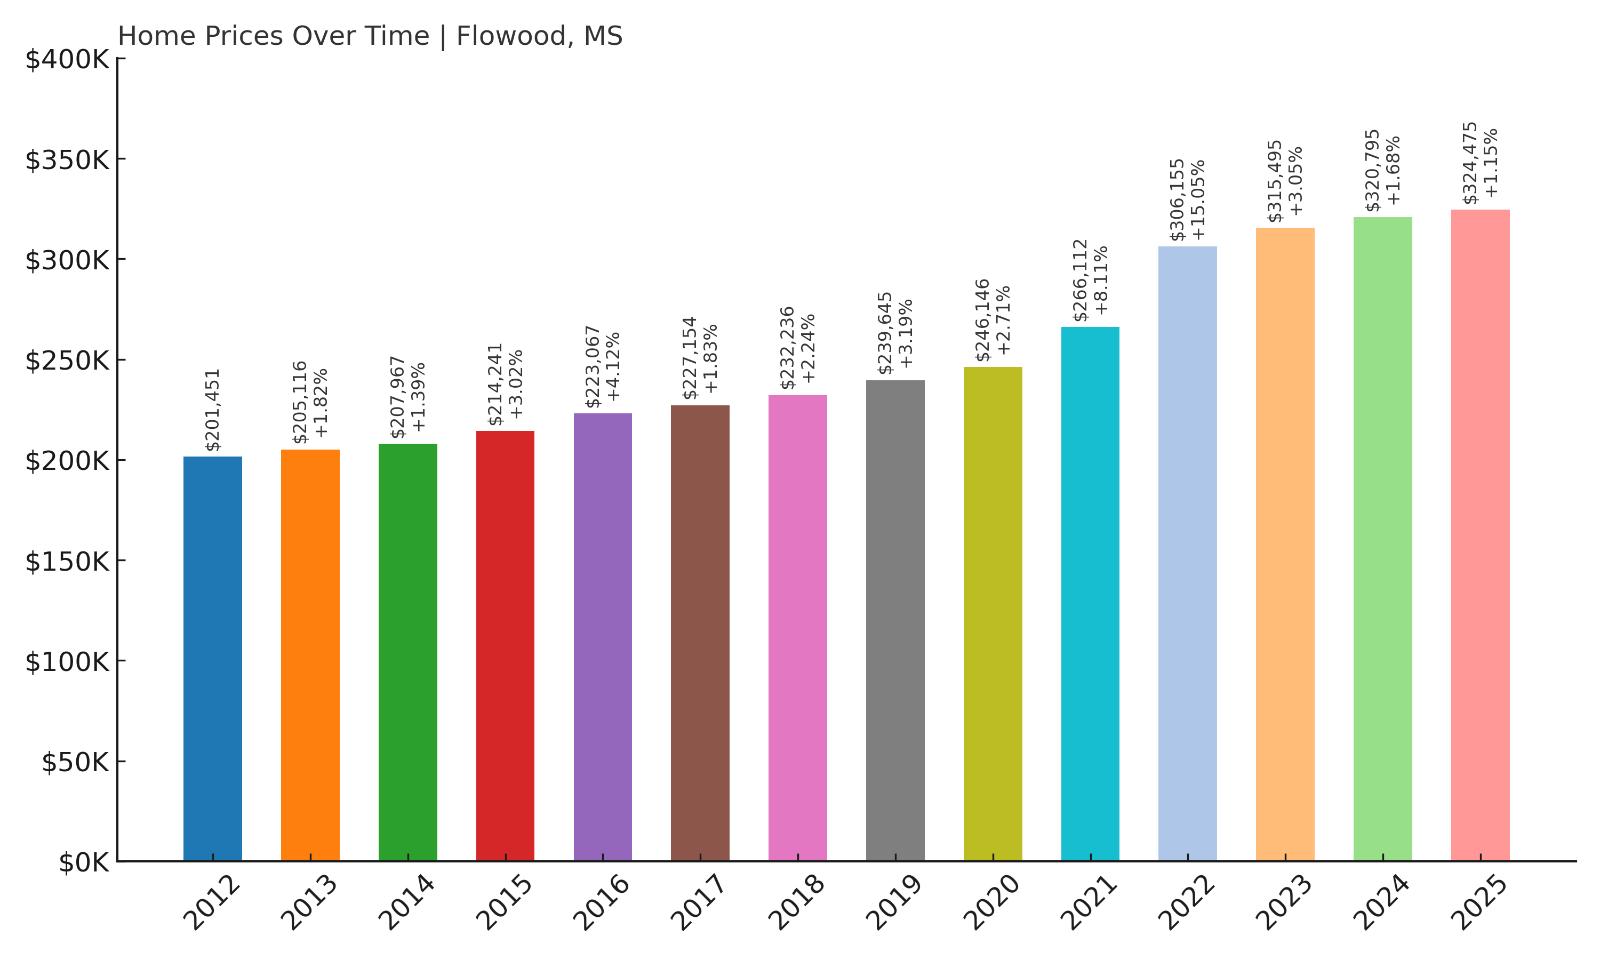
7. Flowood – 61.1% Home Price Increase Since 2012
- 2010: N/A
- 2011: N/A
- 2012: $201,451
- 2013: $205,116 (+$3,665, +1.82% from previous year)
- 2014: $207,967 (+$2,852, +1.39% from previous year)
- 2015: $214,241 (+$6,274, +3.02% from previous year)
- 2016: $223,067 (+$8,825, +4.12% from previous year)
- 2017: $227,154 (+$4,088, +1.83% from previous year)
- 2018: $232,236 (+$5,081, +2.24% from previous year)
- 2019: $239,645 (+$7,409, +3.19% from previous year)
- 2020: $246,146 (+$6,501, +2.71% from previous year)
- 2021: $266,112 (+$19,966, +8.11% from previous year)
- 2022: $306,155 (+$40,043, +15.05% from previous year)
- 2023: $315,495 (+$9,341, +3.05% from previous year)
- 2024: $320,795 (+$5,300, +1.68% from previous year)
- 2025: $324,475 (+$3,680, +1.15% from previous year)
Flowood’s home prices have surged by over 61% since 2012, growing from $201,451 to $324,475 by 2025. While price gains were moderate for much of the 2010s, the post-pandemic market lit a fire under the town’s real estate values. From 2020 to 2022 alone, home prices jumped by nearly $60,000 — one of the largest two-year increases on this list. Although the pace has slowed in recent years, prices have continued to edge upward every year, with no annual declines. The strength and consistency of this growth speak to Flowood’s enduring appeal as a commercial hub with strong residential demand.
Flowood – Suburban Powerhouse With Commercial Appeal
Flowood is one of the most economically dynamic suburbs in the Jackson metro area, located in Rankin County and adjacent to the eastern edge of the capital city. Unlike purely residential suburbs, Flowood is also a major commercial center — home to hospitals, retail plazas, restaurants, and a growing number of professional offices. Its development along Highway 25 and Lakeland Drive has transformed it into a high-demand area for both residents and businesses. This dual role as both a workplace and residential community gives Flowood an advantage in housing stability and price growth. People aren’t just commuting from Flowood — they’re staying for work, shopping, healthcare, and recreation. That all-in-one value proposition has driven consistent demand across the housing market.
The strength of Flowood’s housing market is closely tied to its infrastructure and amenities. The town has access to top medical facilities like Merit Health, and major retailers like Dogwood Festival Market have made it a shopping destination for the region. Residential development has followed, particularly in master-planned communities that cater to middle- and upper-income buyers. Even during periods of economic uncertainty, Flowood’s combination of healthcare, retail, and office jobs helps insulate its real estate market from shocks. This is reflected in the data — steady gains year after year, capped by a breakout surge between 2020 and 2022. With current home values exceeding $320,000 and demand still strong, Flowood continues to cement its position as one of Mississippi’s most valuable real estate markets for the long term.
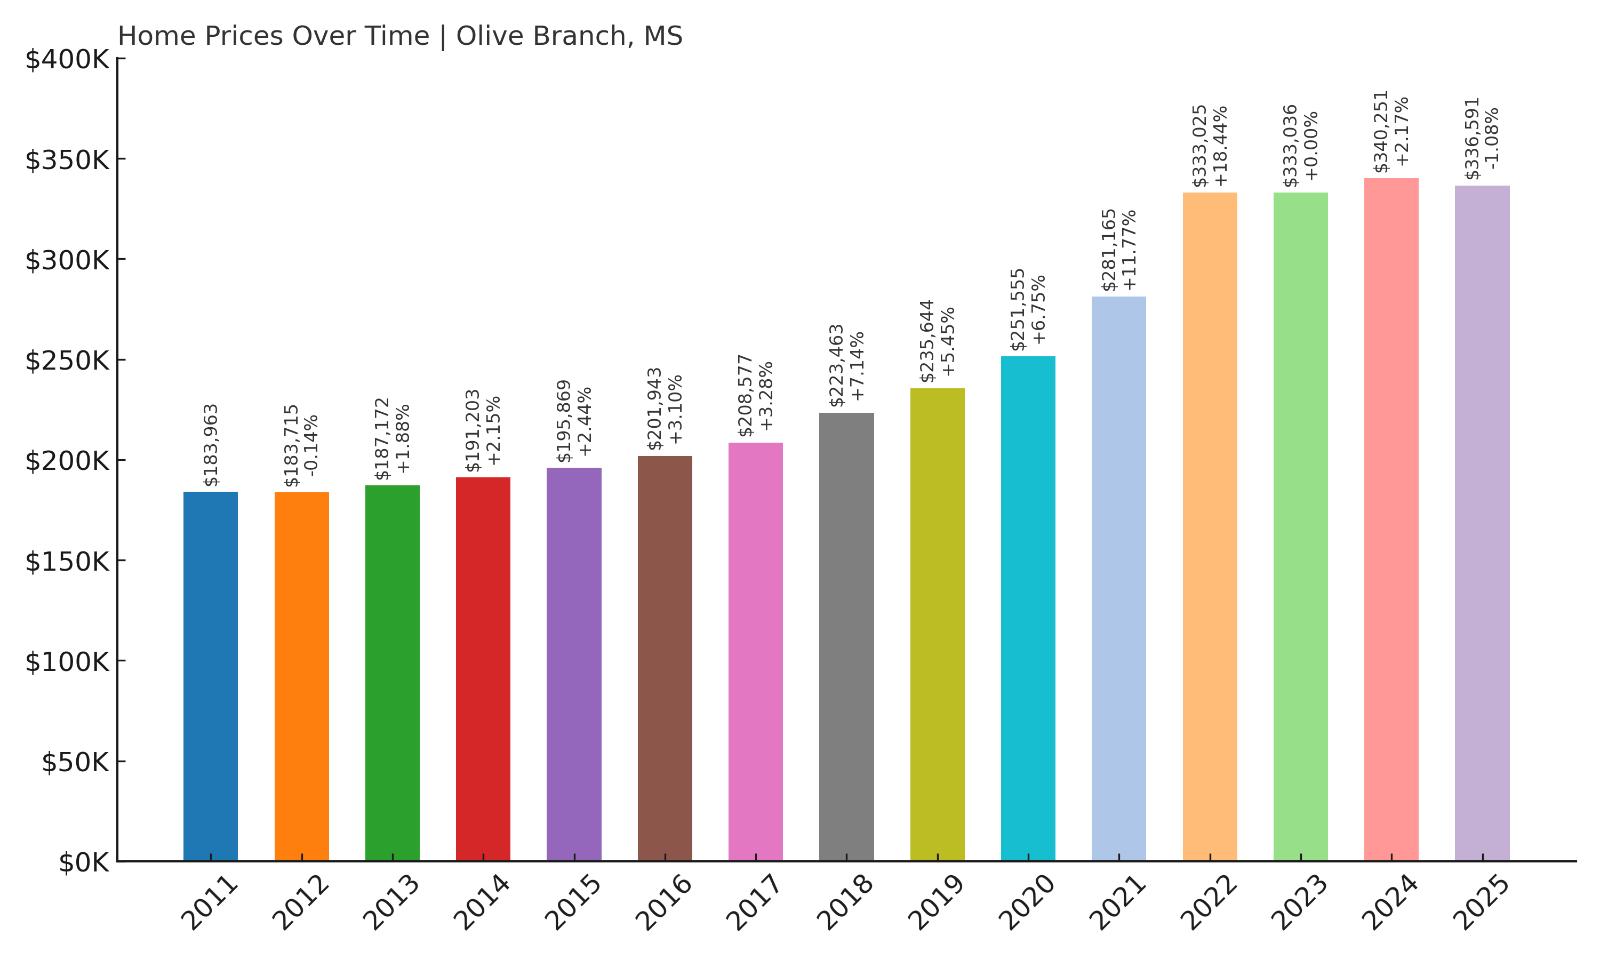
6. Olive Branch – 83.0% Home Price Increase Since 2011
🔥 Would you like to save this?
- 2010: N/A
- 2011: $183,963
- 2012: $183,715 (-$248, -0.14% from previous year)
- 2013: $187,172 (+$3,458, +1.88% from previous year)
- 2014: $191,203 (+$4,031, +2.15% from previous year)
- 2015: $195,869 (+$4,666, +2.44% from previous year)
- 2016: $201,943 (+$6,074, +3.10% from previous year)
- 2017: $208,577 (+$6,633, +3.28% from previous year)
- 2018: $223,463 (+$14,887, +7.14% from previous year)
- 2019: $235,644 (+$12,181, +5.45% from previous year)
- 2020: $251,555 (+$15,910, +6.75% from previous year)
- 2021: $281,165 (+$29,610, +11.77% from previous year)
- 2022: $333,025 (+$51,860, +18.44% from previous year)
- 2023: $333,036 (+$11, +0.00% from previous year)
- 2024: $340,251 (+$7,215, +2.17% from previous year)
- 2025: $336,591 (-$3,660, -1.08% from previous year)
Olive Branch has seen an 83% increase in home prices since 2011, with values rising from $183,963 to $336,591 in 2025. Much of that growth came after 2018, as suburban demand exploded around Memphis and pushed prices upward across DeSoto County. The biggest leap occurred in 2022, with a massive $51,860 gain in a single year. Though 2025 saw a small decline, the long-term trend remains highly favorable. Olive Branch has consistently ranked as one of Mississippi’s most sought-after markets, and its high average home value reflects both location and demand.
Olive Branch – Booming Suburb With Regional Magnetism
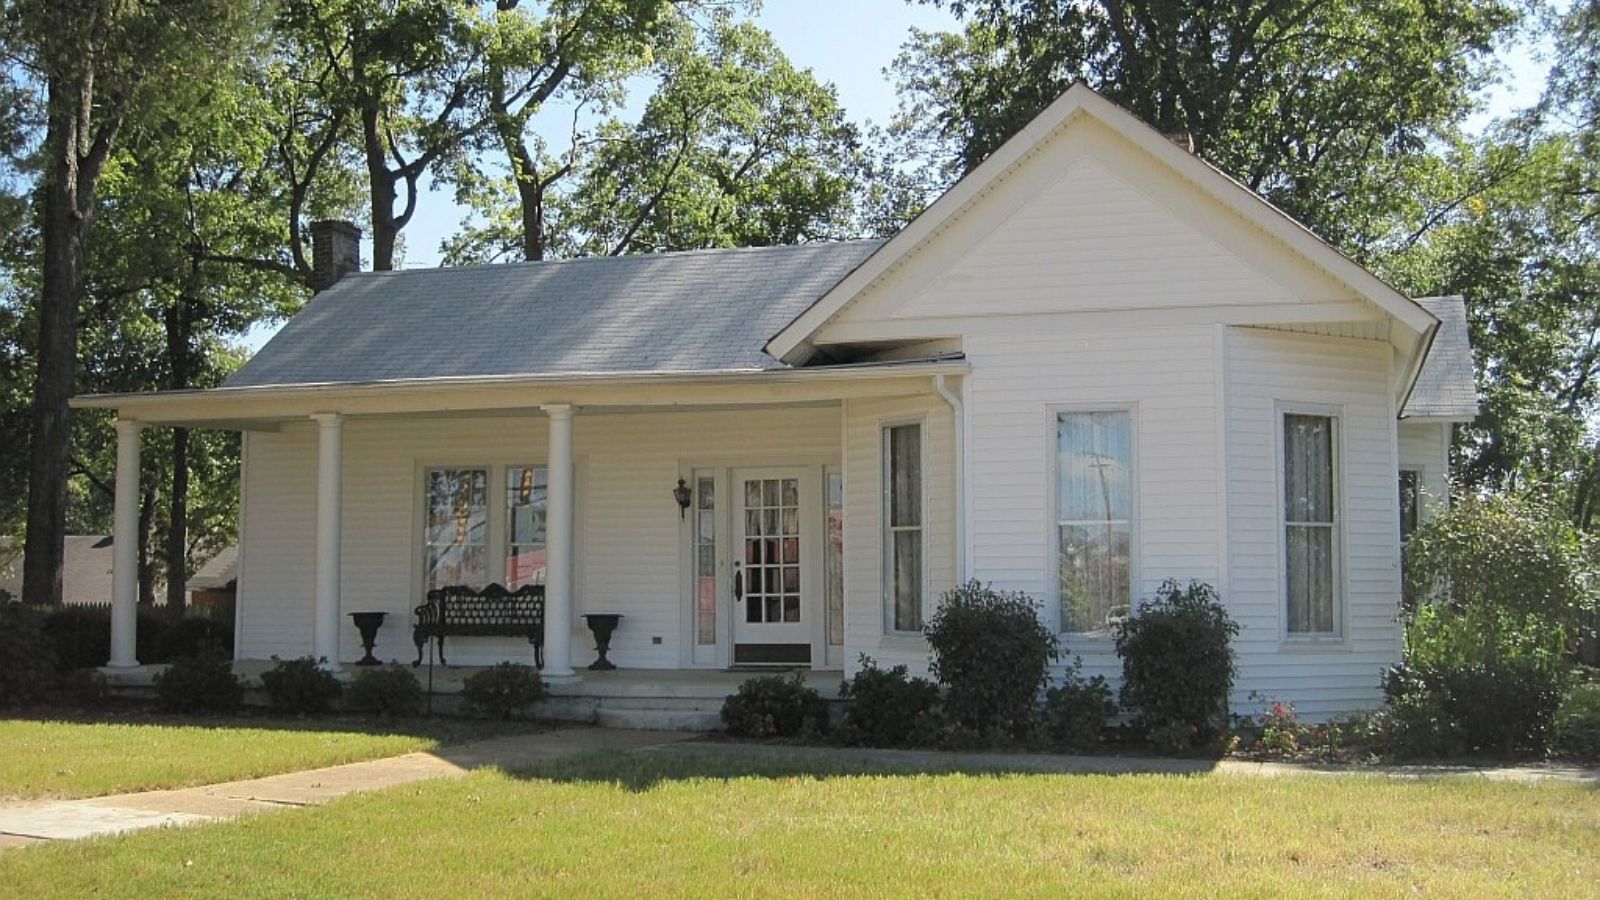
Located in DeSoto County, just minutes south of Memphis, Olive Branch is often seen as one of the best suburban alternatives to living in the city. Its appeal comes from a combination of strong public schools, safe neighborhoods, and a well-developed mix of residential and commercial zones. The town has grown rapidly over the past two decades, transitioning from a rural outpost to a bustling suburb with big-box stores, chain restaurants, medical facilities, and even industrial parks. That rapid development has brought more jobs, more traffic — and much higher home values. For Memphis commuters, Olive Branch offers everything from starter homes to large custom builds, often in planned subdivisions with amenities like clubhouses and walking trails.
Olive Branch’s real estate trajectory mirrors broader migration patterns, especially in the post-2020 era, where suburban living became a priority. As working from home expanded, more people sought space, affordability, and quality of life — all things Olive Branch offered in abundance. That demand fueled double-digit annual growth from 2018 through 2022, capped by the huge jump in 2022. Even with a flat year in 2023 and a slight correction in 2025, home values remain well above pre-pandemic levels. The town’s close ties to Memphis, along with its own expanding economy, make it a resilient and attractive market. With prices still over $330,000, Olive Branch continues to draw families, professionals, and investors looking for long-term value in Mississippi’s top-tier housing market.
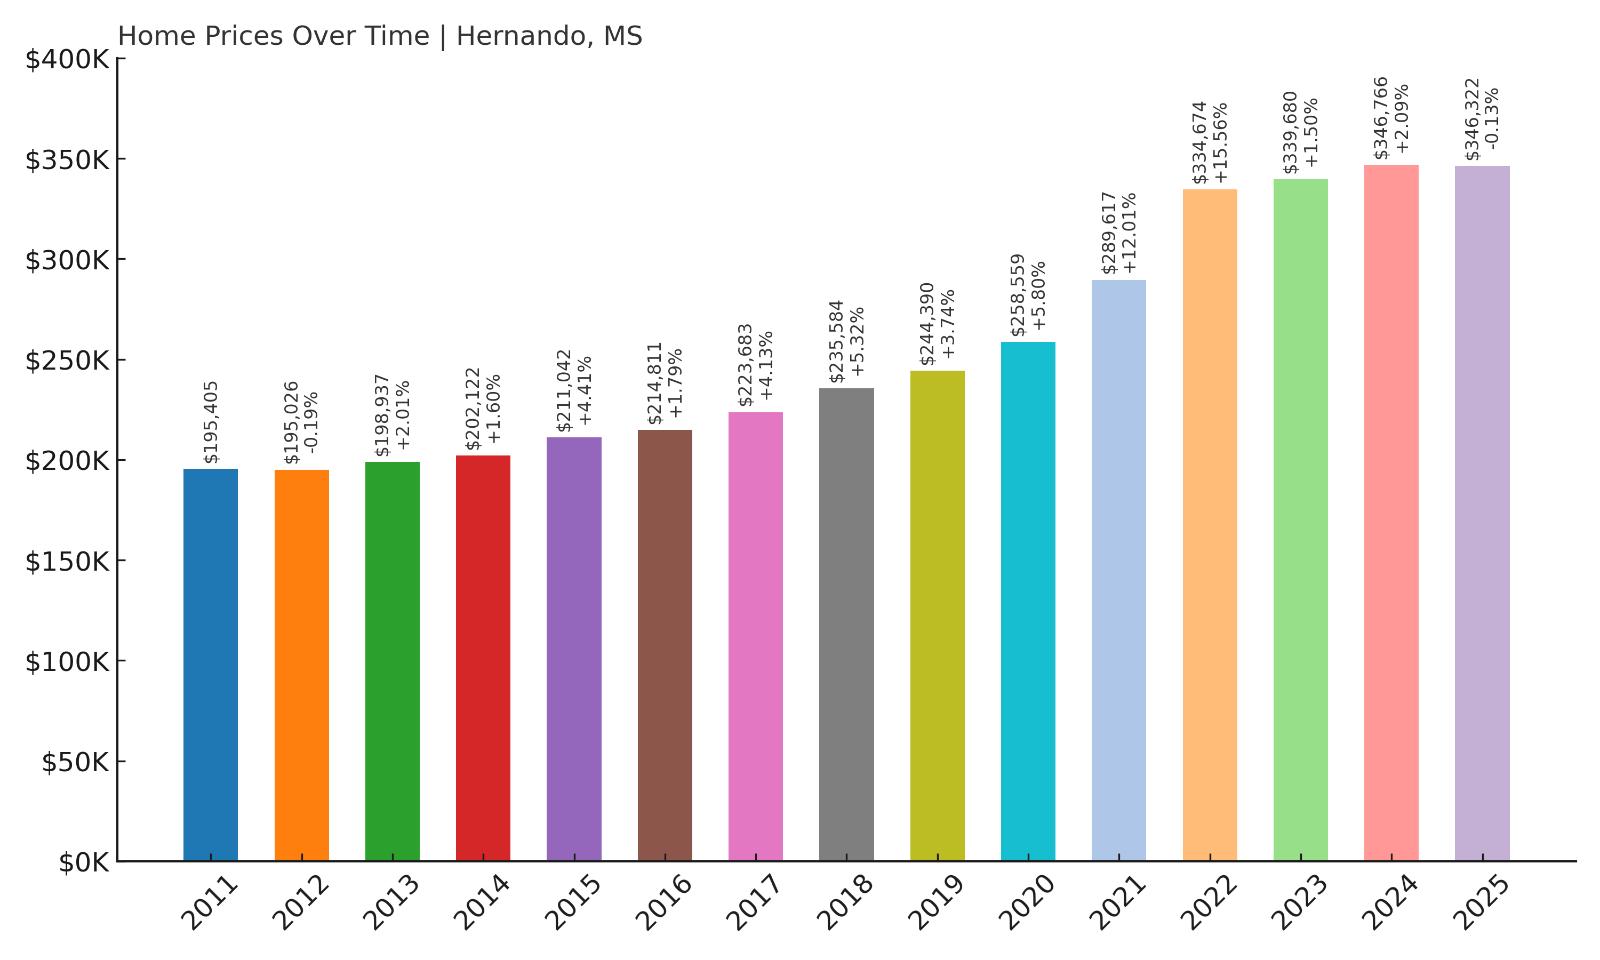
5. Hernando – 77.2% Home Price Increase Since 2011
- 2010: N/A
- 2011: $195,405
- 2012: $195,026 (-$379, -0.19% from previous year)
- 2013: $198,937 (+$3,911, +2.01% from previous year)
- 2014: $202,122 (+$3,185, +1.60% from previous year)
- 2015: $211,042 (+$8,920, +4.41% from previous year)
- 2016: $214,811 (+$3,769, +1.79% from previous year)
- 2017: $223,683 (+$8,872, +4.13% from previous year)
- 2018: $235,584 (+$11,901, +5.32% from previous year)
- 2019: $244,390 (+$8,806, +3.74% from previous year)
- 2020: $258,559 (+$14,170, +5.80% from previous year)
- 2021: $289,617 (+$31,057, +12.01% from previous year)
- 2022: $334,674 (+$45,058, +15.56% from previous year)
- 2023: $339,680 (+$5,006, +1.50% from previous year)
- 2024: $346,766 (+$7,086, +2.09% from previous year)
- 2025: $346,322 (-$445, -0.13% from previous year)
Home prices in Hernando have surged by over 77% since 2011, rising from $195,405 to $346,322 in 2025. The appreciation has been largely consistent, with only minor fluctuations over the last 15 years. Most of the growth came after 2017, with values climbing sharply from under $225,000 to over $330,000 in just five years. The biggest single-year jump occurred in 2022, when homes gained more than $45,000 in value. Although 2025 saw a very slight dip, prices remain near record highs. Hernando’s long-term trajectory makes it one of the strongest performers in DeSoto County’s already competitive housing market.
Hernando – Historic Core With Suburban Strength
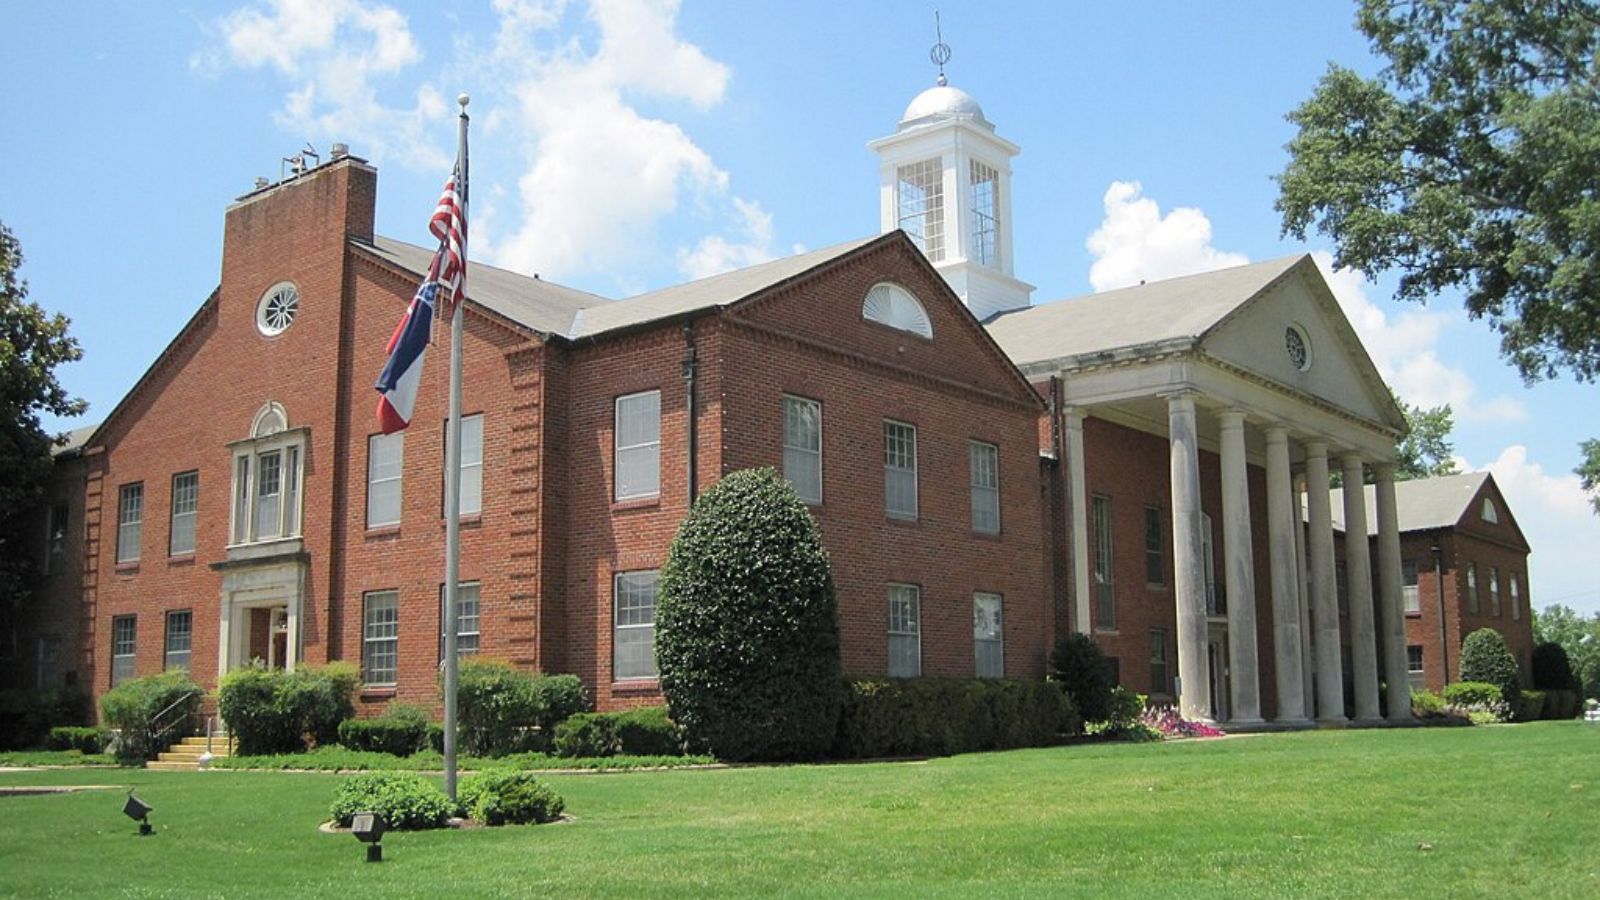
Hernando, the county seat of DeSoto County, blends historic charm with fast-paced suburban growth. Just 30 minutes south of Memphis, it has retained much of its small-town character — think courthouse square, farmer’s markets, and antebellum homes — while expanding rapidly in recent years. Its reputation for top-notch public schools, civic pride, and walkability has made it a favorite for families looking to settle down without giving up access to city jobs. As demand for housing has spread outward from Memphis, Hernando has become a key beneficiary — especially for buyers who want a quieter, more community-focused environment than some of the region’s newer subdivisions offer.
What sets Hernando apart is its ability to grow without losing identity. Residential development has ramped up, but the town has maintained its aesthetic and zoning balance better than many of its suburban peers. Housing data shows how this strategy has paid off — steady price growth through the 2010s, followed by major acceleration in the early 2020s. The town’s appreciation has outpaced many larger cities in the region, and even after 2022’s peak, values have remained strong. At over $346,000 in 2025, Hernando is one of Mississippi’s most valuable residential markets, and likely to stay that way given its balance of history, access, and livability.
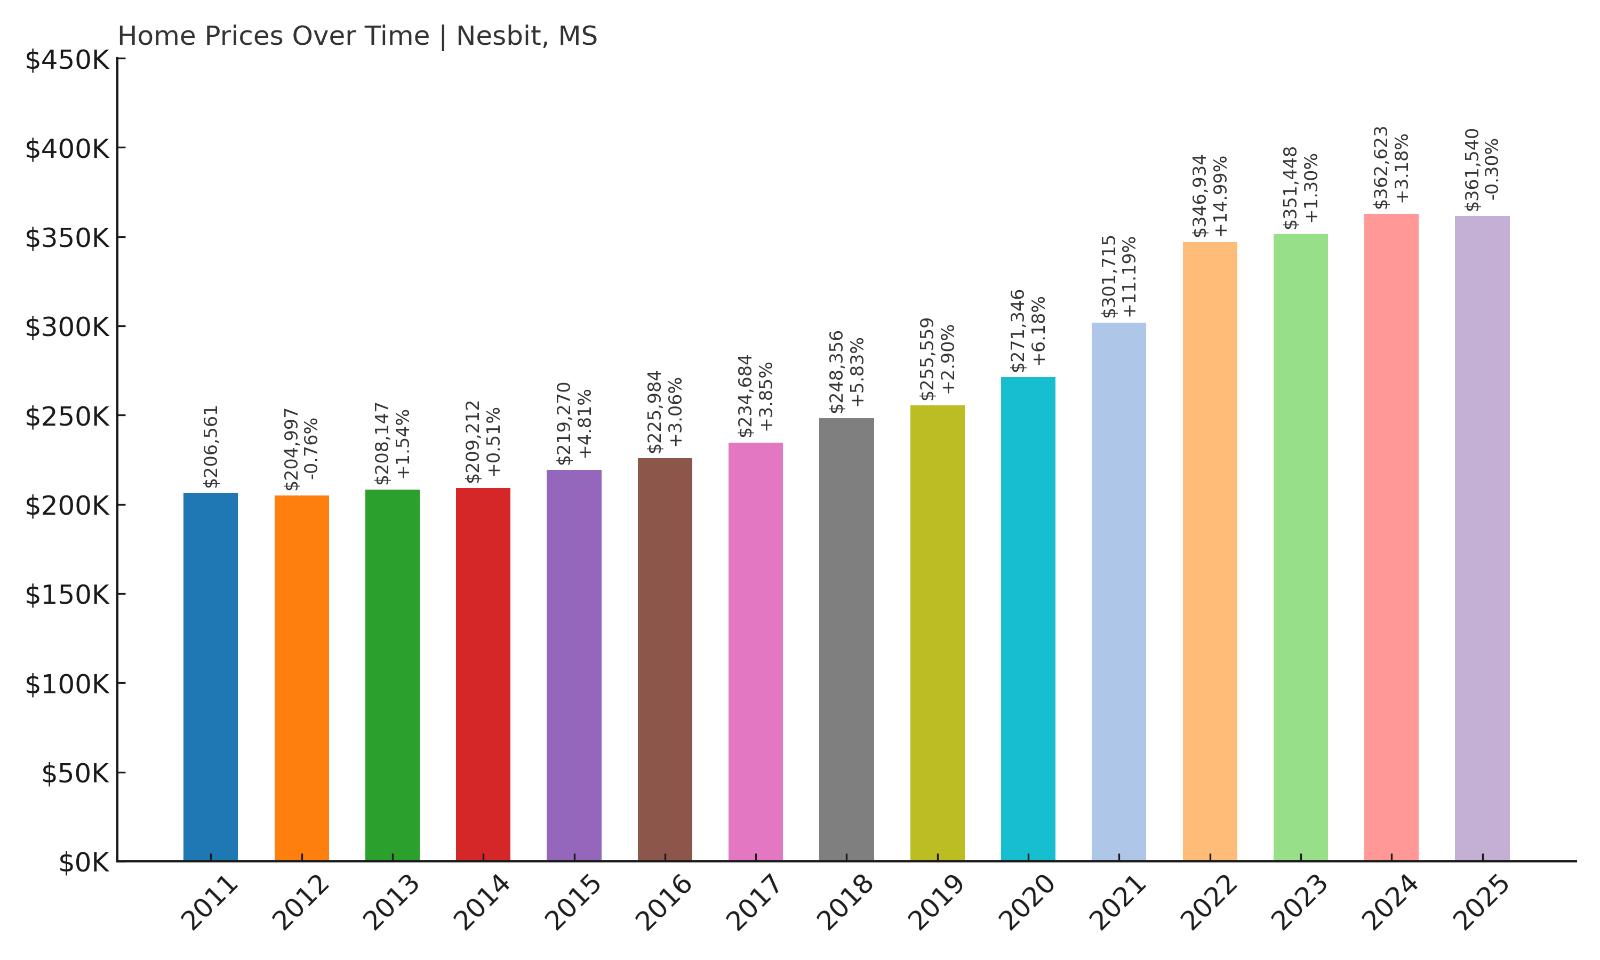
4. Nesbit – 75.0% Home Price Increase Since 2011
- 2010: N/A
- 2011: $206,561
- 2012: $204,997 (-$1,564, -0.76% from previous year)
- 2013: $208,147 (+$3,150, +1.54% from previous year)
- 2014: $209,212 (+$1,065, +0.51% from previous year)
- 2015: $219,270 (+$10,058, +4.81% from previous year)
- 2016: $225,984 (+$6,715, +3.06% from previous year)
- 2017: $234,684 (+$8,700, +3.85% from previous year)
- 2018: $248,356 (+$13,671, +5.83% from previous year)
- 2019: $255,559 (+$7,203, +2.90% from previous year)
- 2020: $271,346 (+$15,787, +6.18% from previous year)
- 2021: $301,715 (+$30,369, +11.19% from previous year)
- 2022: $346,934 (+$45,219, +14.99% from previous year)
- 2023: $351,448 (+$4,513, +1.30% from previous year)
- 2024: $362,623 (+$11,175, +3.18% from previous year)
- 2025: $361,540 (-$1,083, -0.30% from previous year)
Nesbit’s home prices have climbed 75% since 2011, growing from $206,561 to $361,540 in 2025. Like many towns in DeSoto County, it saw moderate gains throughout the 2010s before a major spike from 2020 onward. The most explosive year was 2022, when home values surged by over $45,000. While 2025 recorded a small dip, the market remains elevated compared to earlier years. Nesbit now ranks in Mississippi’s top five most expensive towns, and its growth is grounded in long-term suburban trends — not just short-term market froth.
Nesbit – Rising Star in Northern Mississippi
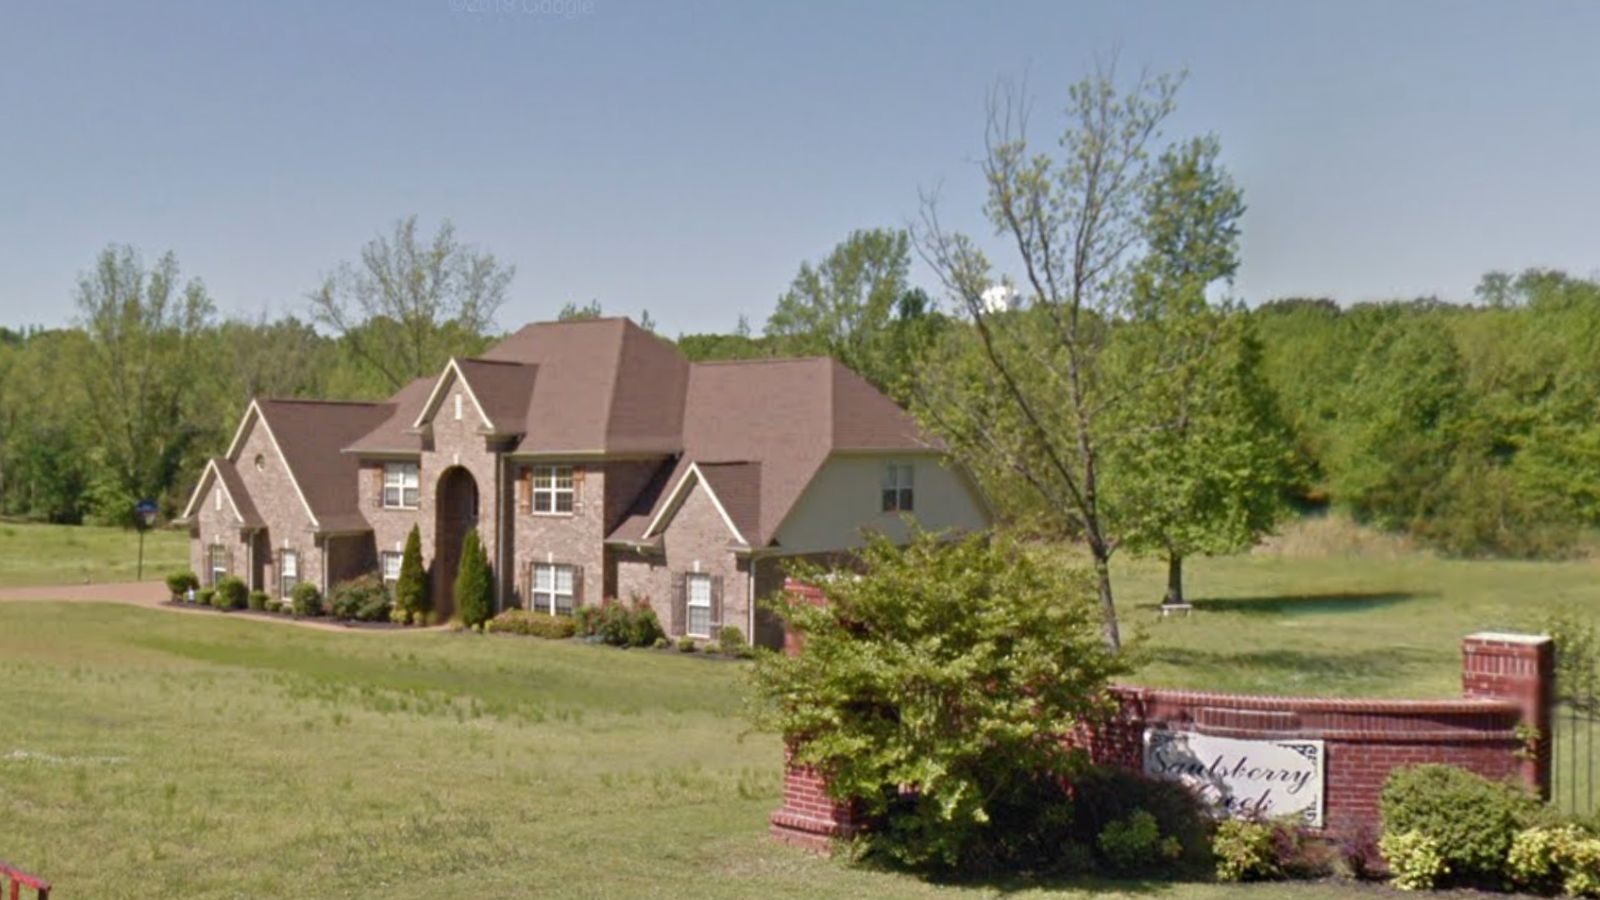
Nesbit sits just southwest of Olive Branch and is part of the fast-growing DeSoto County region. What makes it unique is that it’s not a formal municipality — it’s an unincorporated community — yet it has managed to capture the attention of developers and families alike. Larger lot sizes, rural aesthetics, and proximity to both Hernando and Southaven make Nesbit a desirable blend of privacy and convenience. The housing stock here leans newer and more spacious, with many homes built post-2010 and designed with upscale finishes and multi-acre plots. That kind of inventory has attracted professionals seeking space without sacrificing access to work and schools.
Over the last decade, Nesbit has shifted from a pass-through community to a destination in its own right. The massive jump in prices since 2020 reflects a tightening of available homes and a sharp increase in interest from outside buyers — especially those priced out of neighboring towns. Its rural feel paired with modern amenities makes it especially attractive for remote workers, builders, and buyers from nearby Memphis. With a current average home price over $360,000, Nesbit has established itself as one of the highest-value zip codes in Mississippi, and even with the recent market cool-down, its long-term growth trajectory remains among the state’s strongest.
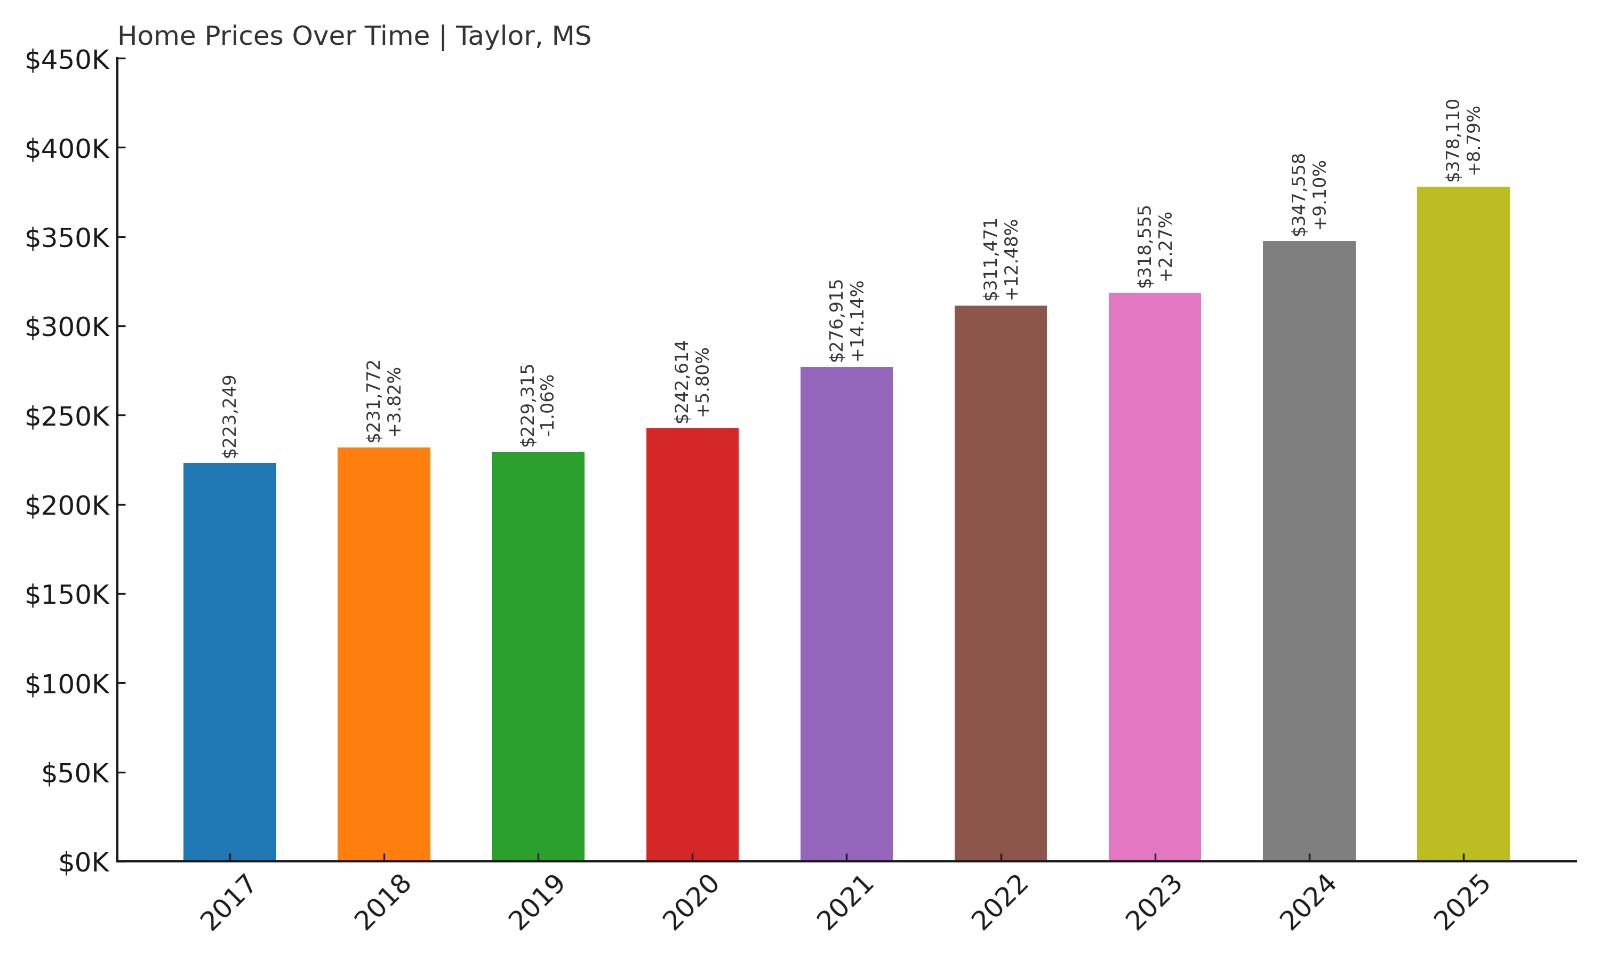
3. Taylor – 69.3% Home Price Increase Since 2017
- 2010: N/A
- 2011: N/A
- 2012: N/A
- 2013: N/A
- 2014: N/A
- 2015: N/A
- 2016: N/A
- 2017: $223,249
- 2018: $231,772 (+$8,523, +3.82% from previous year)
- 2019: $229,315 (-$2,456, -1.06% from previous year)
- 2020: $242,614 (+$13,298, +5.80% from previous year)
- 2021: $276,915 (+$34,301, +14.14% from previous year)
- 2022: $311,471 (+$34,556, +12.48% from previous year)
- 2023: $318,555 (+$7,084, +2.27% from previous year)
- 2024: $347,558 (+$29,003, +9.10% from previous year)
- 2025: $378,110 (+$30,552, +8.79% from previous year)
Taylor’s home values have risen more than 69% since 2017, increasing from $223,249 to $378,110 in just eight years. The market gained serious traction during the post-COVID housing boom, with huge jumps in 2021, 2022, and again in 2024–2025. The two most recent years added nearly $60,000 in value combined, showing continued upward momentum even as other towns started cooling. Taylor is now one of the most expensive real estate markets in the entire state, bolstered by its close ties to Oxford and its strong appeal to luxury buyers.
Taylor – Rural Charm Meets Luxury Growth
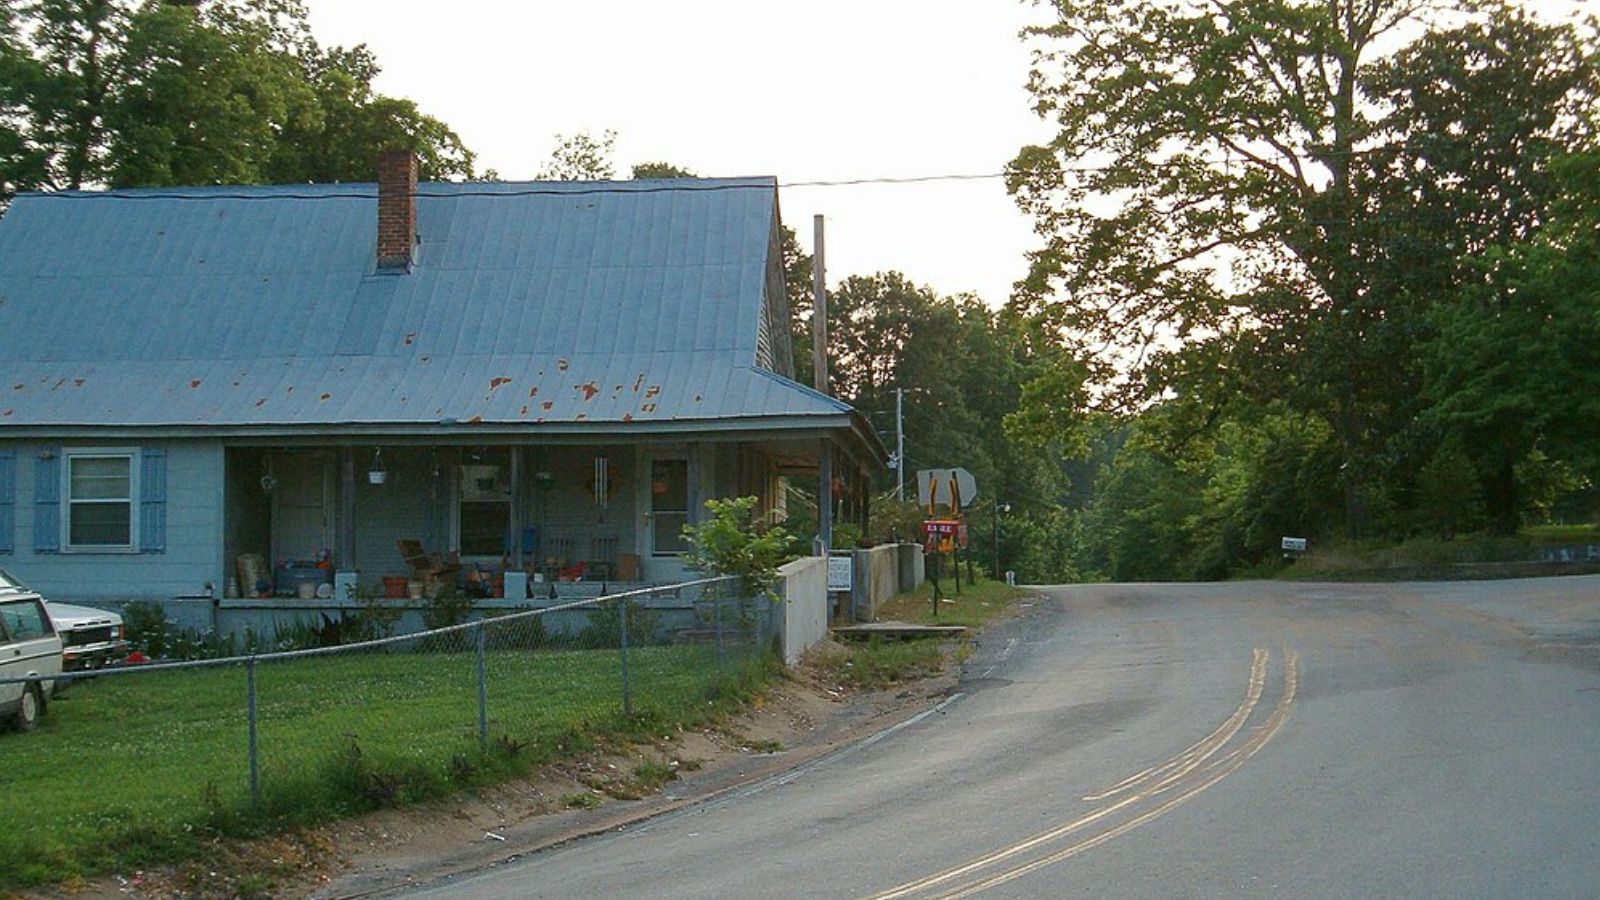
Taylor is a small town in Lafayette County, just a few miles south of Oxford. Despite its size, it has become one of north Mississippi’s most exclusive housing markets. Much of that growth is tied to its reputation as a quiet, upscale alternative to Oxford, where the university crowd keeps demand high but can also bring congestion. Taylor offers a slower pace and larger properties, which has drawn in affluent buyers, retirees, and even vacation-home owners. It’s also become a haven for artists, musicians, and creatives seeking space and beauty — all of which have contributed to a rise in custom builds and high-end developments over the last five years.
The town’s real estate growth shows what happens when demand for a particular lifestyle outpaces supply. Taylor doesn’t have sprawling subdivisions — instead, it offers wooded lots, artisan cottages, and estate-style homes, many with premium pricing. This limited inventory has created a sharp climb in values, especially since 2020. Buyers from Memphis, Nashville, and even the Gulf Coast are increasingly looking to Taylor as a destination that combines Southern charm, privacy, and investment potential. With prices approaching $380,000, Taylor is now a luxury enclave within reach of one of Mississippi’s most dynamic cultural centers, and its market reflects that exclusivity.
2. Oxford – 106.0% Home Price Increase Since 2010
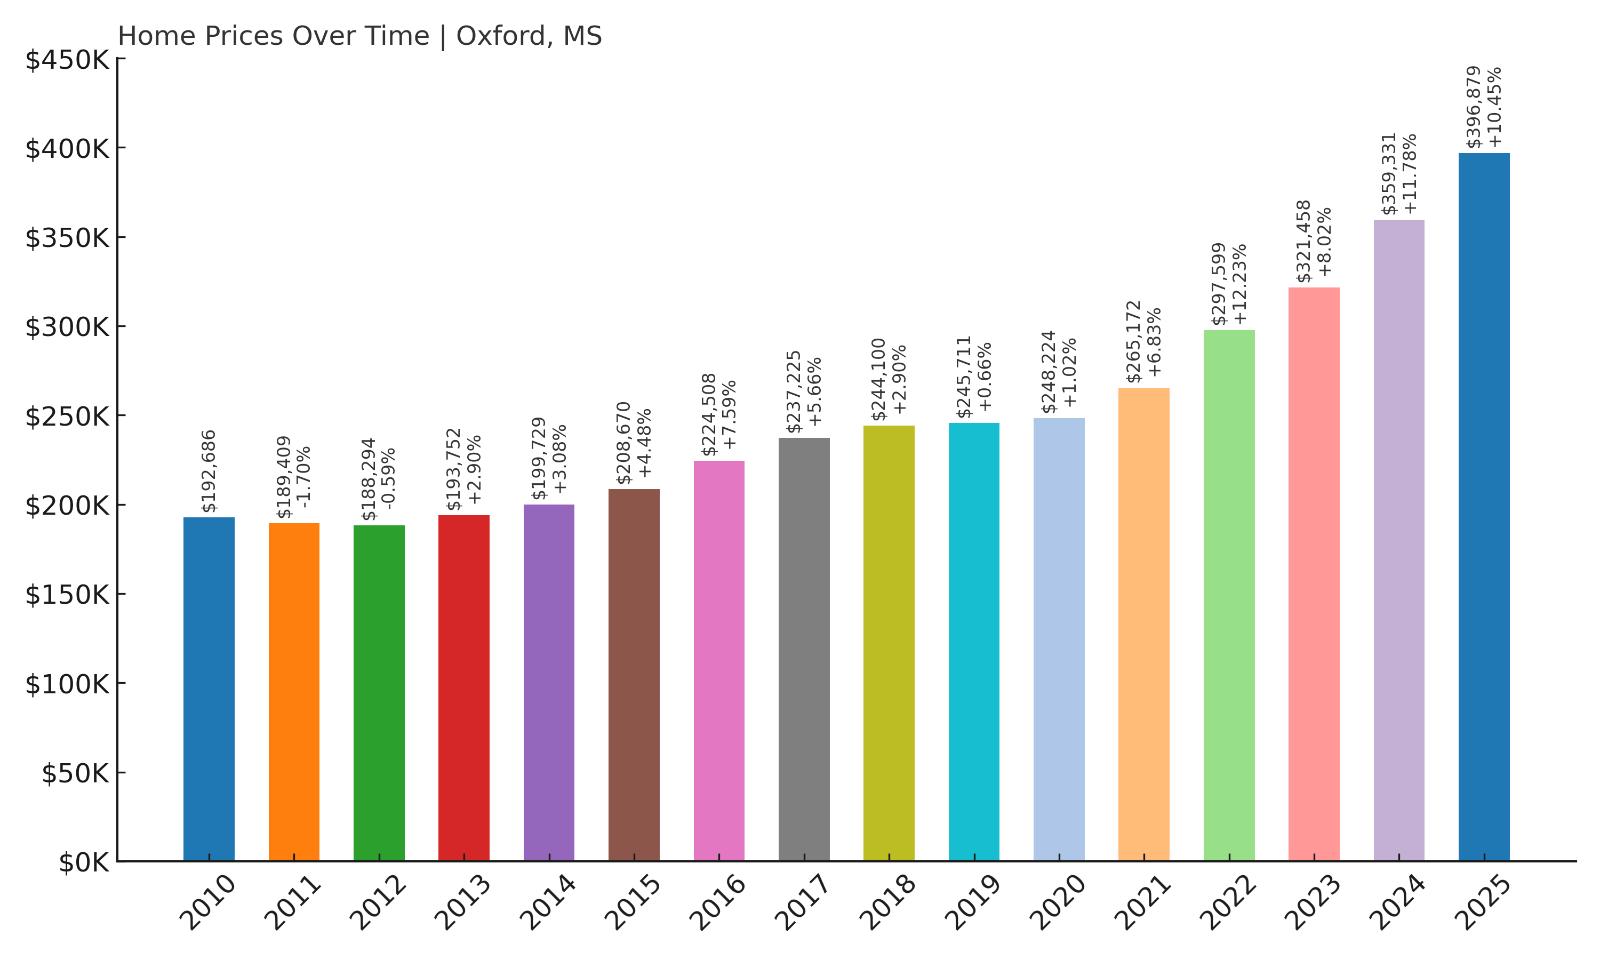
- 2010: $192,686
- 2011: $189,409 (-$3,278, -1.70% from previous year)
- 2012: $188,294 (-$1,115, -0.59% from previous year)
- 2013: $193,752 (+$5,459, +2.90% from previous year)
- 2014: $199,729 (+$5,977, +3.08% from previous year)
- 2015: $208,670 (+$8,941, +4.48% from previous year)
- 2016: $224,508 (+$15,838, +7.59% from previous year)
- 2017: $237,225 (+$12,717, +5.66% from previous year)
- 2018: $244,100 (+$6,874, +2.90% from previous year)
- 2019: $245,711 (+$1,611, +0.66% from previous year)
- 2020: $248,224 (+$2,513, +1.02% from previous year)
- 2021: $265,172 (+$16,948, +6.83% from previous year)
- 2022: $297,599 (+$32,427, +12.23% from previous year)
- 2023: $321,458 (+$23,859, +8.02% from previous year)
- 2024: $359,331 (+$37,873, +11.78% from previous year)
- 2025: $396,879 (+$37,548, +10.45% from previous year)
Oxford’s home values have skyrocketed by over 106% since 2010, growing from $192,686 to $396,879 in 2025. The pace of growth has accelerated notably in recent years, with each year from 2021 to 2025 posting gains of at least $16,000 — and three of those years adding over $30,000. While the early 2010s showed modest increases, the last five years have transformed Oxford into one of the most expensive housing markets in the state. This recent surge reflects the town’s national visibility, rising student population, and a flood of outside investment. Oxford is no longer just a college town — it’s now one of the most desirable and high-value locations in Mississippi.
Oxford – Mississippi’s Cultural and Economic Standout
🔥 Would you like to save this?
Home to the University of Mississippi, Oxford has long held a special status in the state — intellectually, culturally, and now economically. Its mix of collegiate energy, historic architecture, and high-end retail has made it a magnet for visitors and transplants alike. The downtown Square is packed with boutique shops, art galleries, award-winning restaurants, and literary landmarks, giving Oxford an appeal that stretches well beyond its size. Demand from alumni, investors, and faculty has fueled housing prices, particularly in areas near campus or close to the Square. In recent years, this demand has expanded to outer neighborhoods as the city’s profile continues to rise.
What’s remarkable about Oxford’s housing growth is its consistency and resilience. Even during years when other towns stalled, Oxford continued posting solid gains. Since 2020, the town’s real estate market has entered overdrive, driven by remote work flexibility, national press attention, and migration from urban centers. Retirees, young families, and investors have all poured into the market, creating bidding wars and pushing up home values at a rapid pace. As of 2025, Oxford’s average home price is closing in on $400,000 — a threshold few Mississippi towns have crossed. It’s a reflection of the town’s unique position as both a cultural gem and an economic powerhouse, with few signs of slowing down.
1. Madison – 49.0% Home Price Increase Since 2010
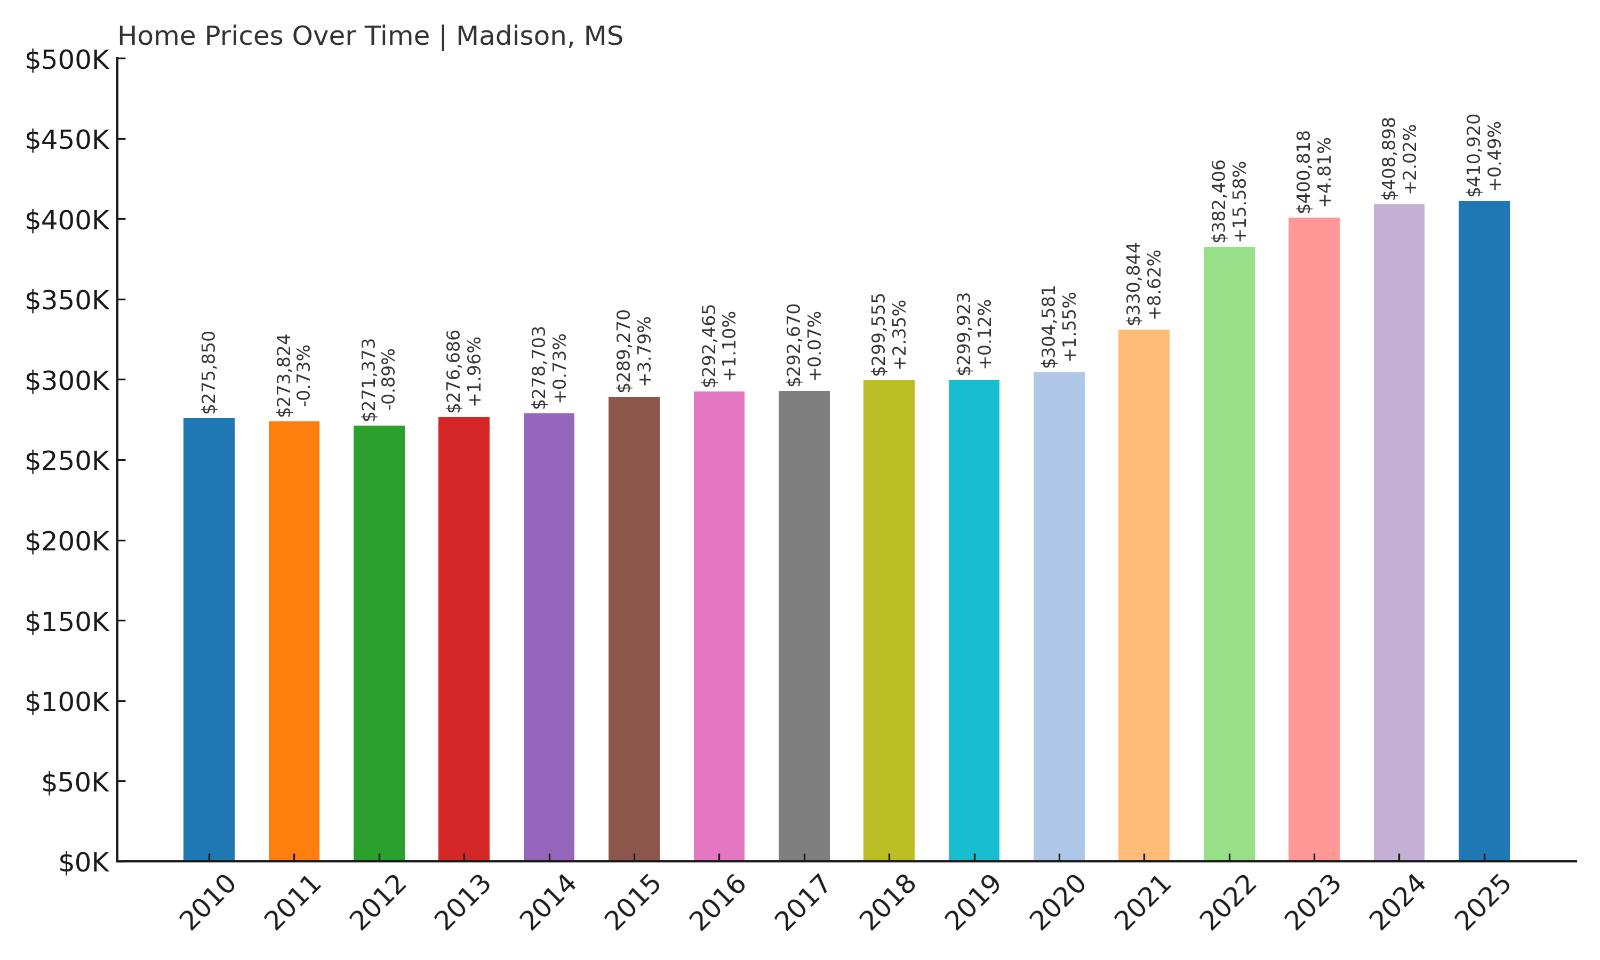
- 2010: $275,850
- 2011: $273,824 (-$2,026, -0.73% from previous year)
- 2012: $271,373 (-$2,451, -0.89% from previous year)
- 2013: $276,686 (+$5,313, +1.96% from previous year)
- 2014: $278,703 (+$2,017, +0.73% from previous year)
- 2015: $289,270 (+$10,567, +3.79% from previous year)
- 2016: $292,465 (+$3,195, +1.10% from previous year)
- 2017: $292,670 (+$205, +0.07% from previous year)
- 2018: $299,555 (+$6,885, +2.35% from previous year)
- 2019: $299,923 (+$367, +0.12% from previous year)
- 2020: $304,581 (+$4,658, +1.55% from previous year)
- 2021: $330,844 (+$26,263, +8.62% from previous year)
- 2022: $382,406 (+$51,562, +15.58% from previous year)
- 2023: $400,818 (+$18,412, +4.81% from previous year)
- 2024: $408,898 (+$8,080, +2.02% from previous year)
- 2025: $410,920 (+$2,022, +0.49% from previous year)
Madison leads the state in home value, with an average price of $410,920 as of 2025 — a 49% increase from its 2010 price of $275,850. Although growth in the 2010s was steady but modest, the post-2020 period saw a remarkable surge. In 2022 alone, home values jumped over $51,000. Since then, the market has leveled off but remained strong, with continued annual increases through 2025. Madison’s position at the top of this list reflects not just price appreciation, but sustained prestige. It’s widely recognized as one of Mississippi’s most desirable — and expensive — places to live.
Madison – The Gold Standard for Mississippi Suburbs
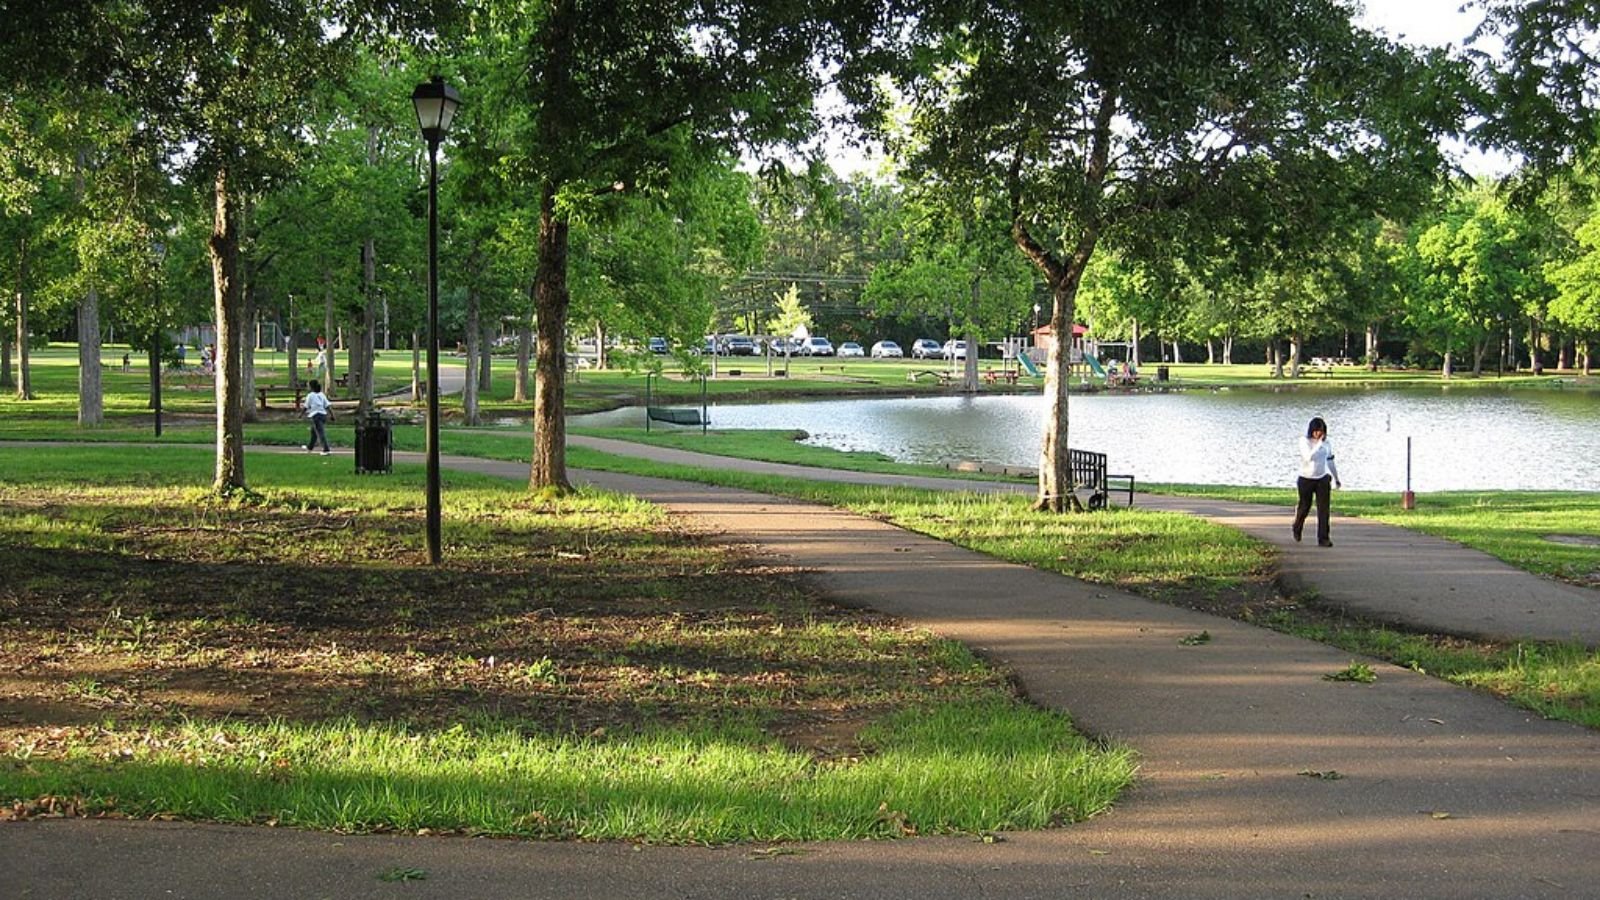
Madison, located just north of Jackson in Madison County, has long been associated with wealth, high-performing schools, and pristine master-planned neighborhoods. It offers a level of polish and organization rare in most parts of the state, with manicured parks, strict building codes, and a deeply engaged community. Residents are drawn to its safety, excellent public schools, and family-focused amenities. The city has consistently ranked among the best places to live in Mississippi, and that reputation has driven up demand year after year. Madison’s real estate market benefits not only from local interest, but also from in-state movers and corporate executives relocating to the capital region.
Over the last five years, the town’s already expensive housing market has reached new heights. With average home values surpassing $400,000, Madison now commands prices on par with large urban areas in neighboring states. The housing stock leans heavily toward newer, custom-built homes in well-maintained subdivisions, often with private lakes, tennis courts, and clubhouses. Despite its size, Madison has managed to maintain tight control over zoning and growth, which has helped sustain values. It’s not just the most expensive town in Mississippi — it’s also one of the most stable and aspirational. For many Mississippi homebuyers, Madison represents the peak of suburban living, and the data confirms it holds that position firmly in 2025.


