Georgia may be known for its humid summers and verdant landscapes, but drought is a persistent reality, especially in the southern and western parts of the state. While average rainfall is a factor, drought intensity depends more on how often and how severely areas fall into deficit, how quickly soils dry out, and how strained water supplies become. This list ranks 25 small towns that have historically experienced the most significant drought conditions, based on decades of U.S. Drought Monitor data, documented streamflow and soil moisture trends, and local advisories.
25. Blue Ridge
Annual rainfall: ~57 in.
Despite being in the wetter North Georgia mountains, Blue Ridge experiences droughts that quickly drain steep upland soils, affecting forest health and streamflow early in the dry season.
24. Cleveland
Annual rainfall: ~56 in.
Frequent late-summer droughts lower local creek flows, impacting tourism and outdoor recreation tied to the Appalachian foothills.
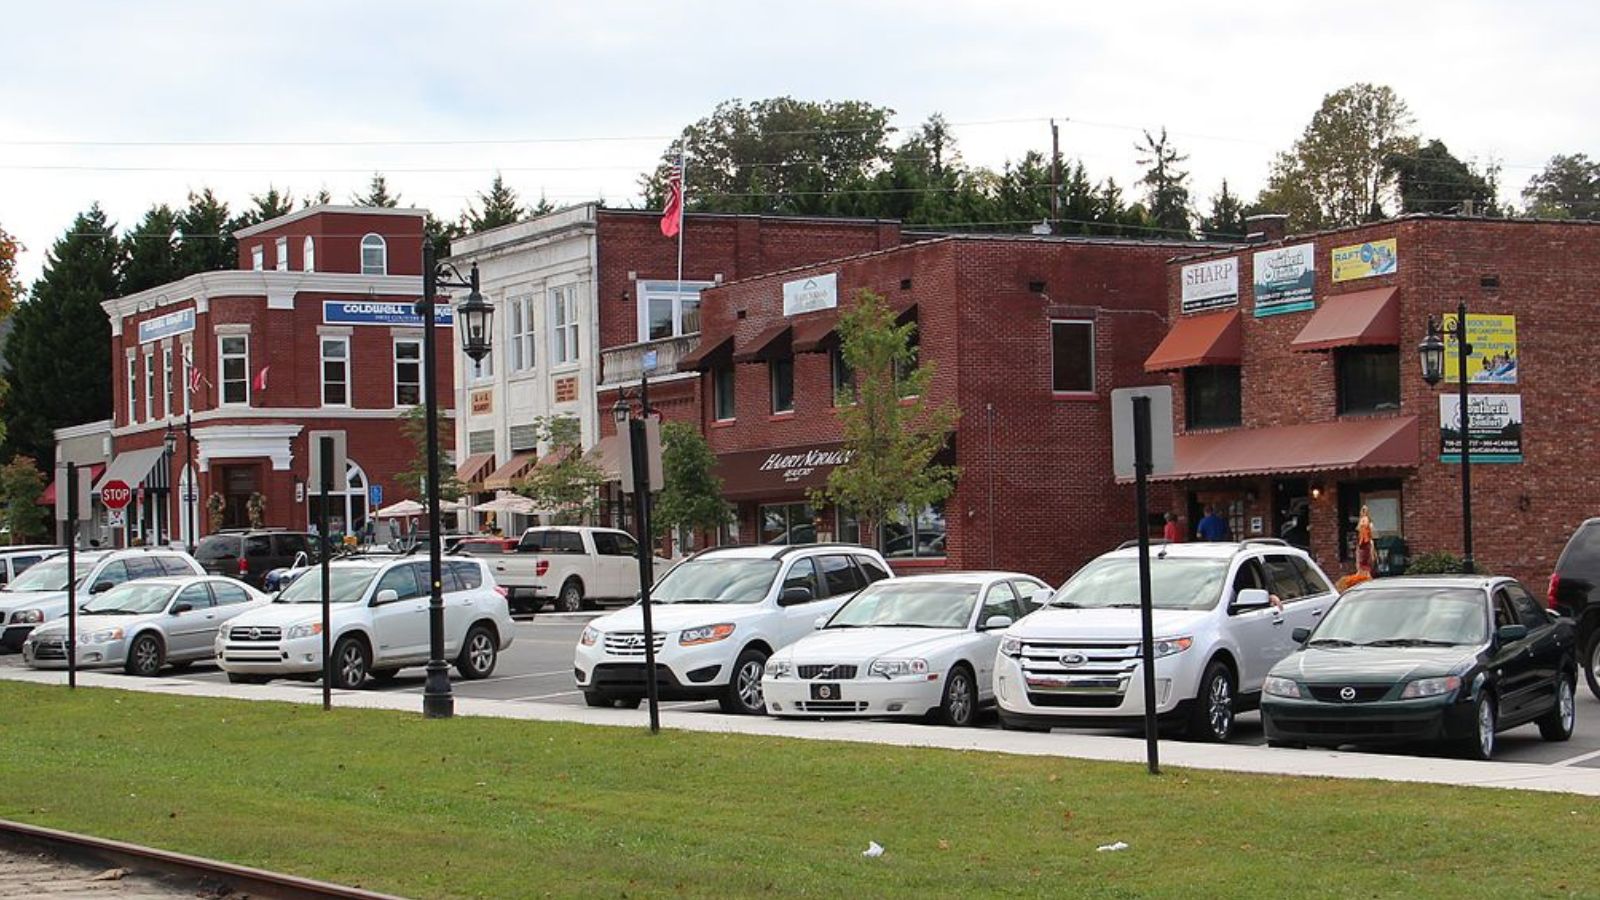
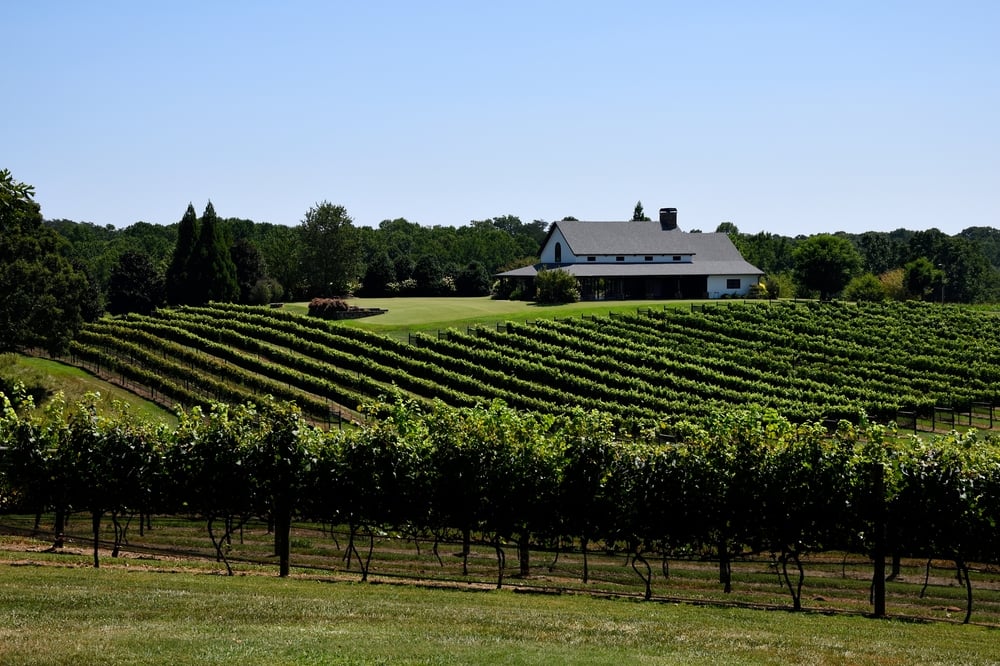
23. Dahlonega
Annual rainfall: ~55 in.
Multiple moderate to severe drought years since 2000 have stressed small reservoirs and vineyards, revealing how even higher-rainfall areas can suffer when rains are erratic.
22. Carrollton

Annual rainfall: ~53 in.
Late-summer dry patches compounded by urban water demand have produced frequent local water restrictions over the past two decades.
21. Newnan
Annual rainfall: ~52 in.
Rapid suburban growth has magnified drought impacts—higher water usage and reduced recharge mean even mild droughts strain supply.
20. Griffin
Would you like to save this?
Annual rainfall: ~51 in.
Rain often falls in short bursts, leaving prolonged dry spells in between—a pattern that quickly leads to soil moisture deficits and municipal stress.
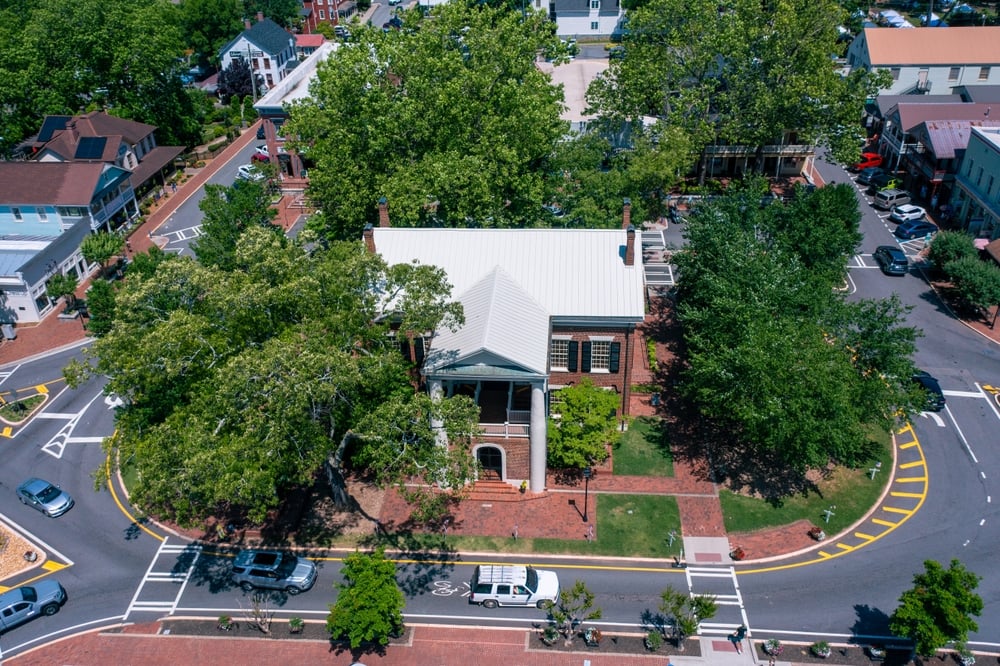
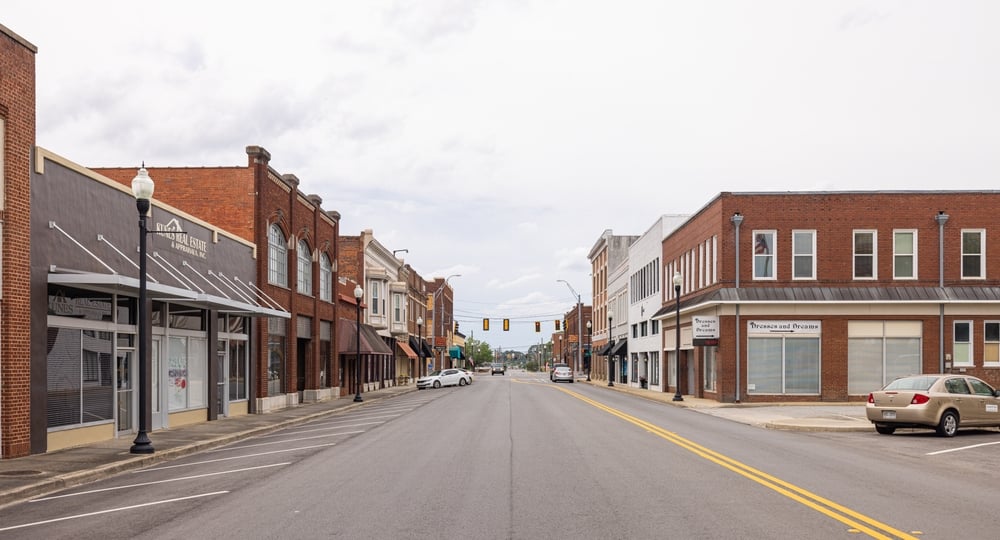
19. Milledgeville
Annual rainfall: ~50 in.
Prolonged droughts have caused low lake levels and stressed municipal supplies—and reduced recreation on the Oconee River.
18. Thomaston
Annual rainfall: ~50 in.
Repeated drought events have caused Potato Creek to shrink, disrupting local ecosystems and water availability.
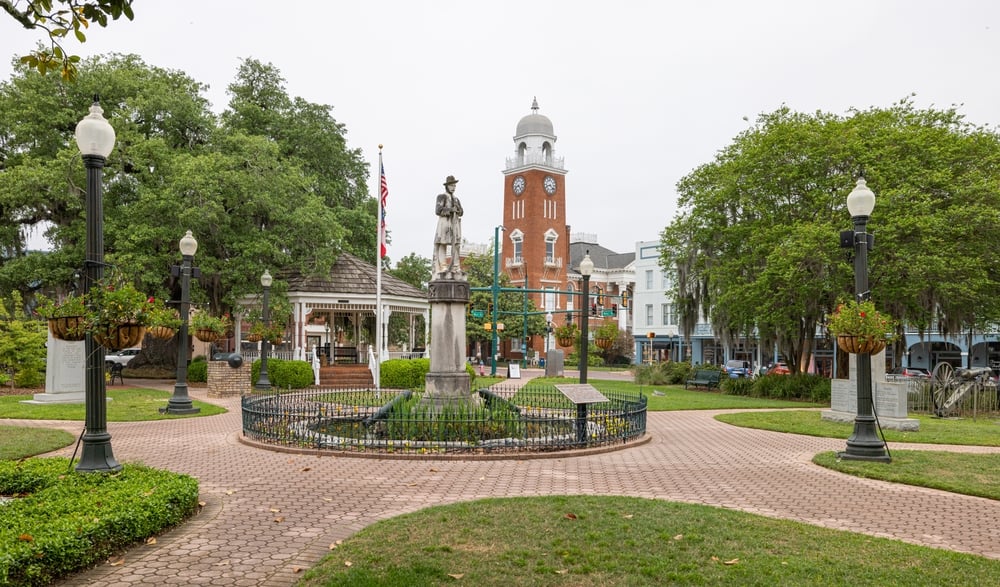
17. Sandersville
Annual rainfall: ~49 in.
Situated on central Georgia’s Coastal Plain, Sandersville sees frequent summer high-pressure ridging that means persistent dry spells.
16. Eastman
Annual rainfall: ~48 in.
Heavy soils and coastal dynamics create rapid drainage—drought episodes here hit crops, especially pecans, with little warning.
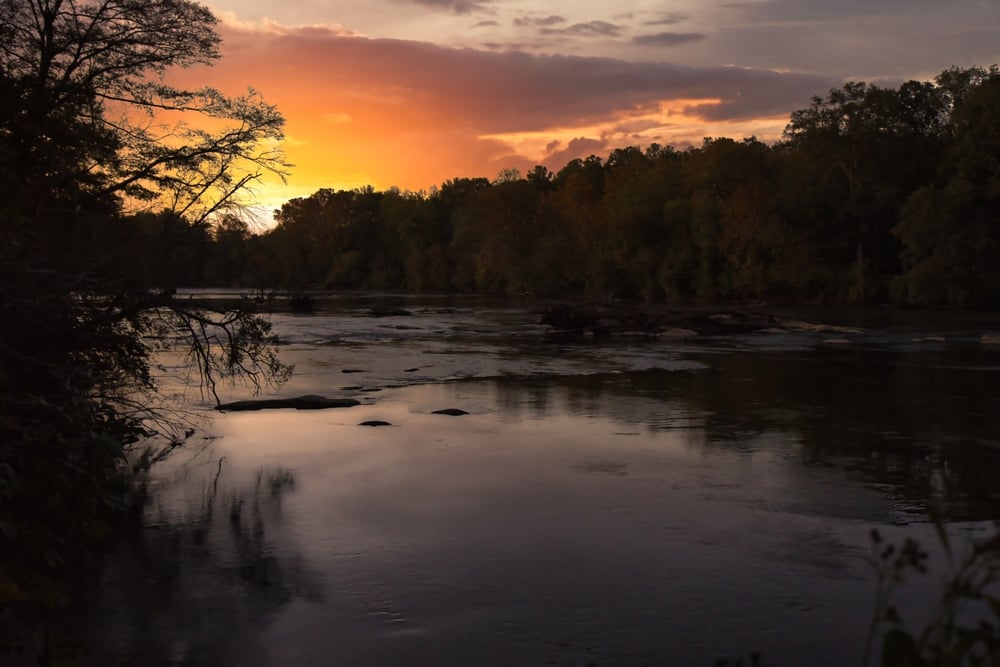
15. Dublin
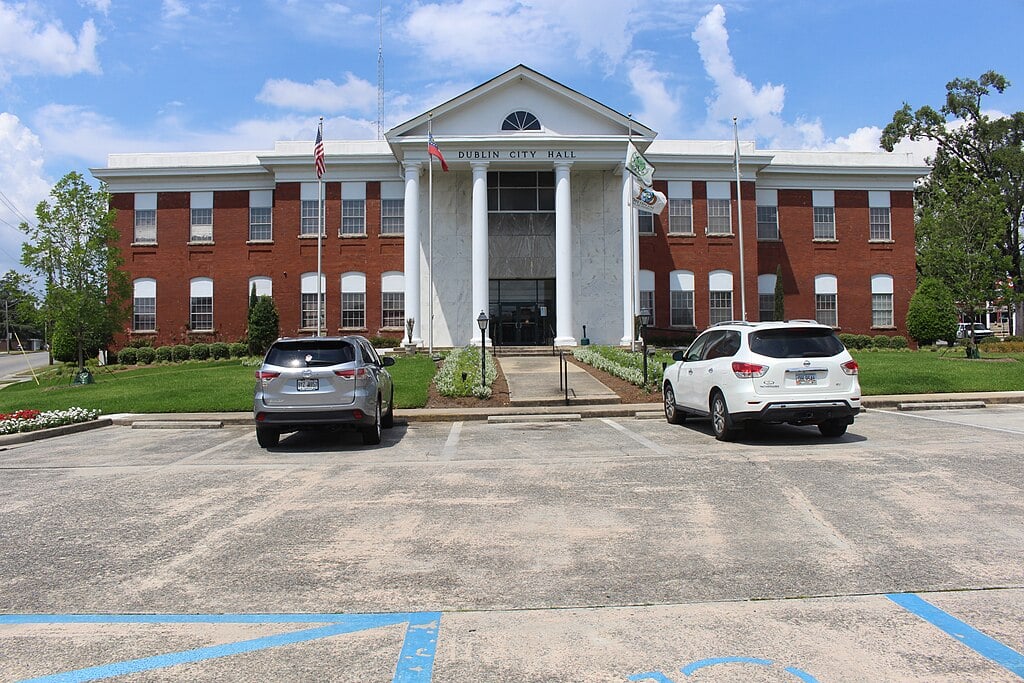
Annual rainfall: ~48 in.
Years such as 2011 and 2016 brought significant rainfall deficits, lowering nearby river systems and stressing water security.
14. Baxley
Annual rainfall: ~47 in.
Fall droughts were especially damaging when expected tropical system relief failed to materialize, impacting forestry operations.
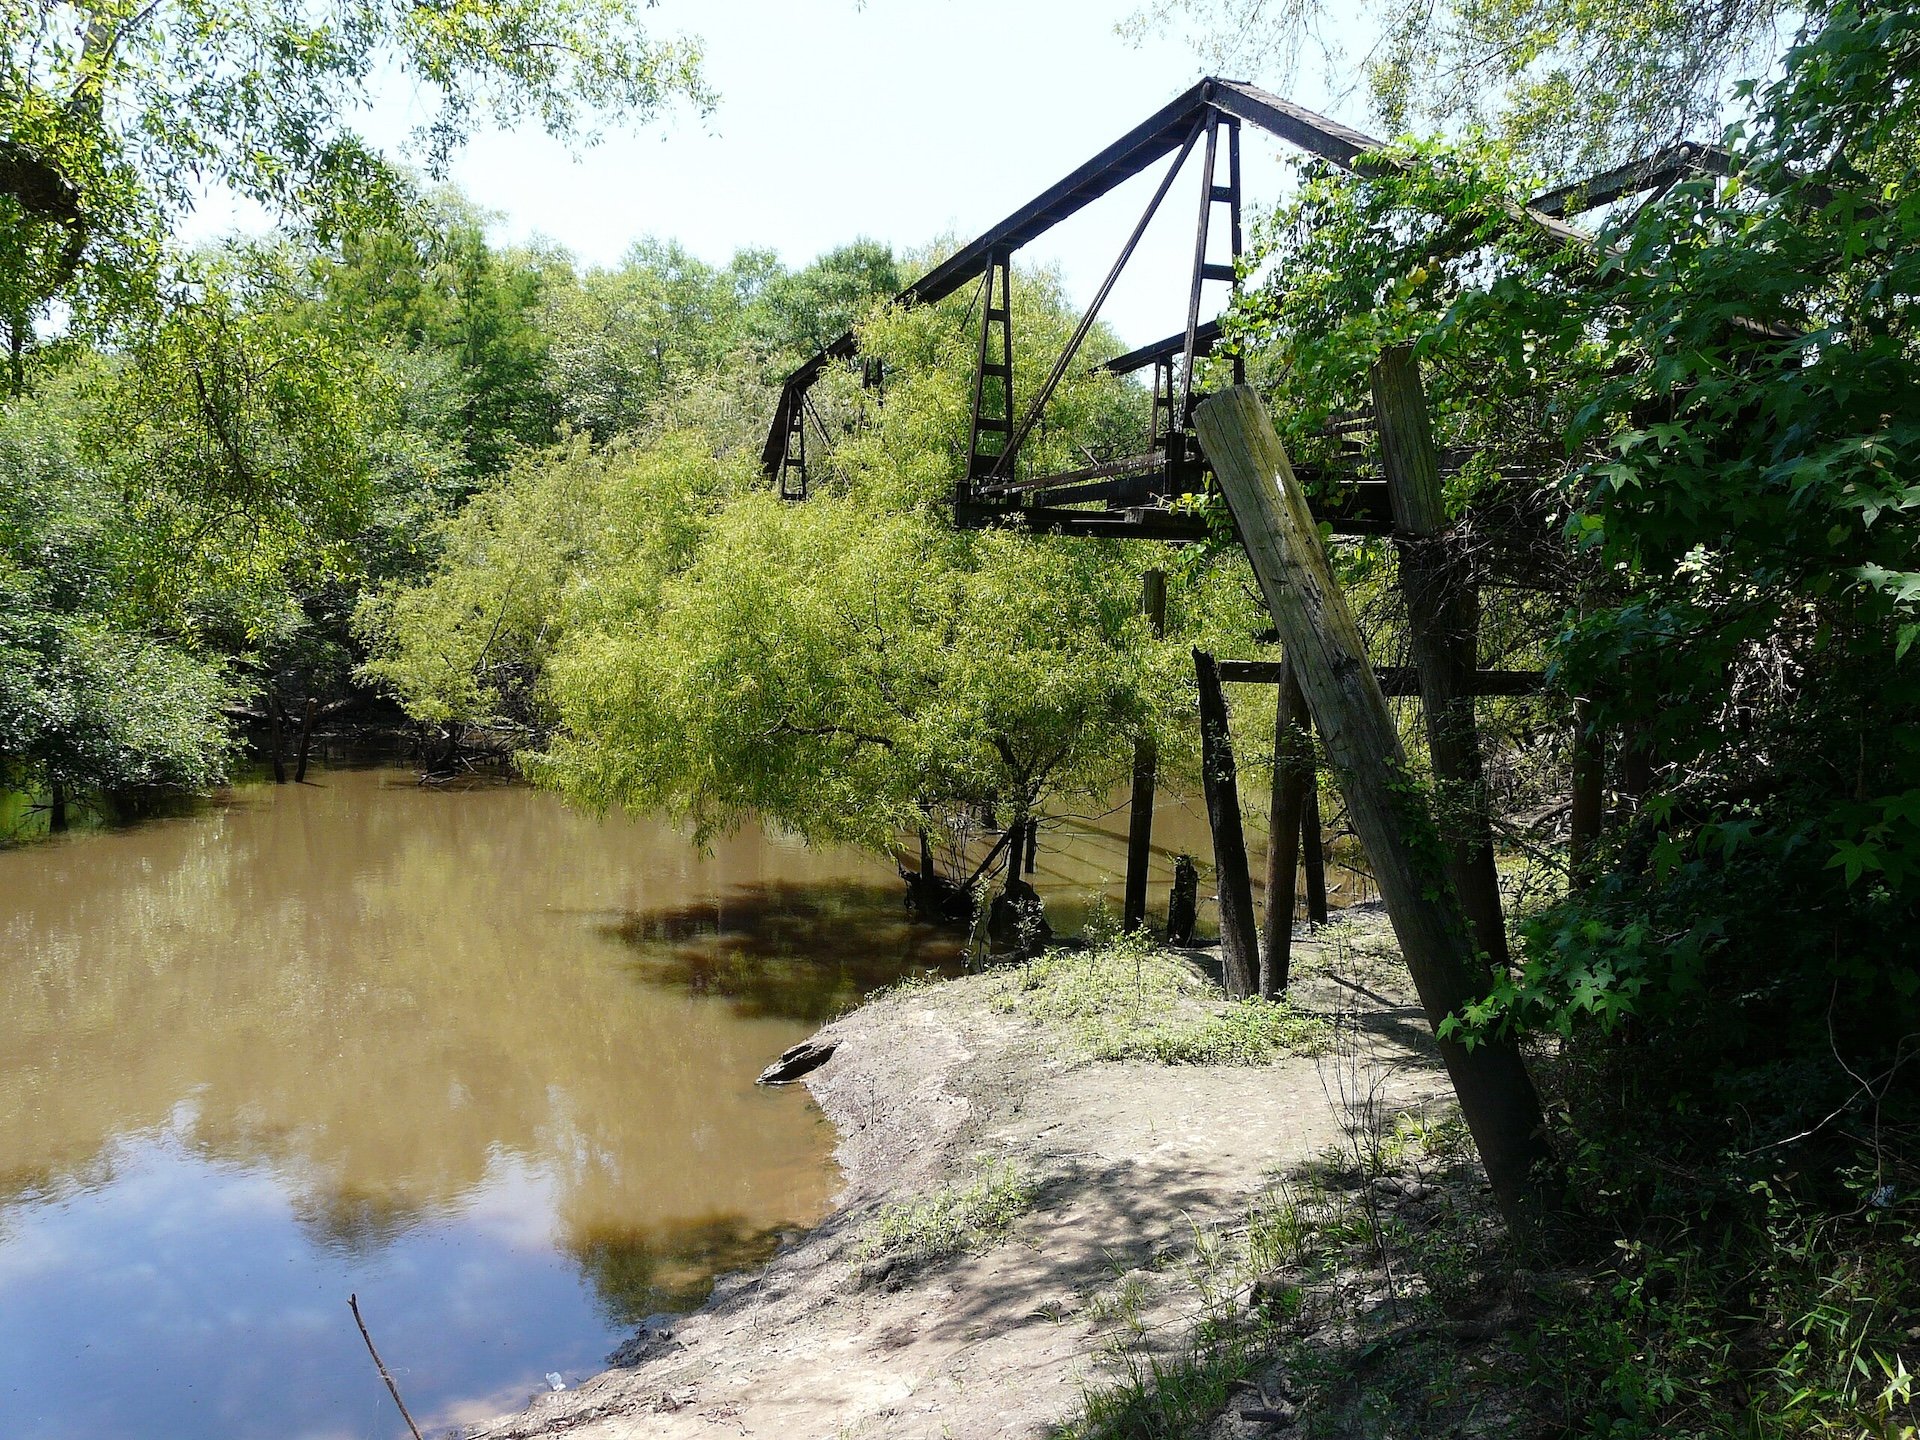
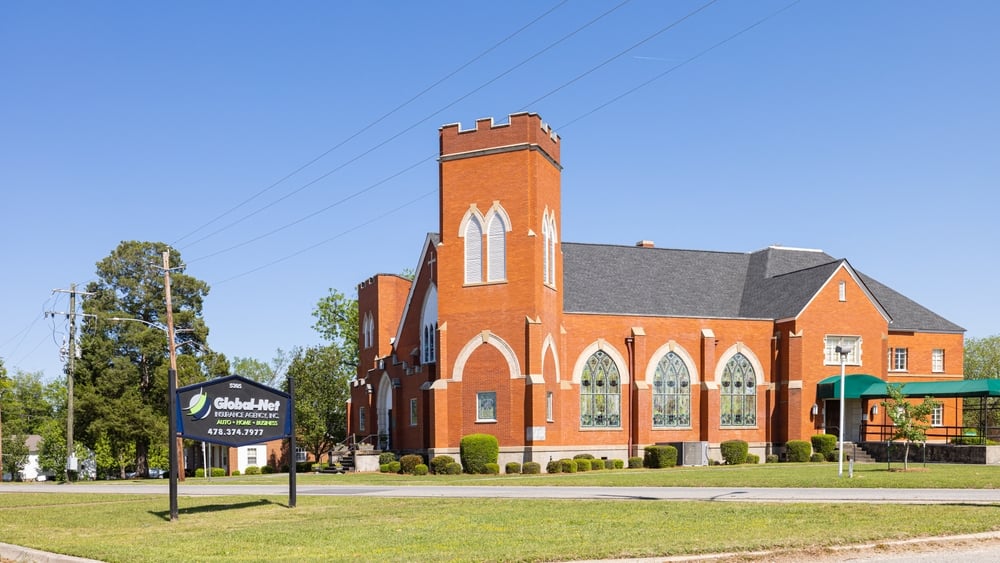
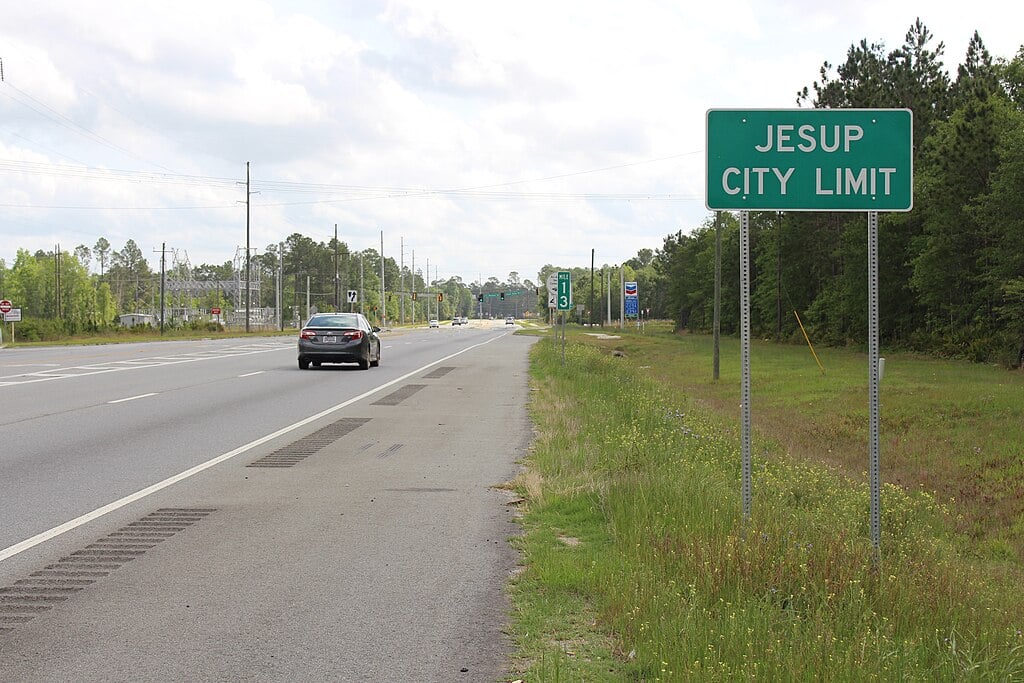
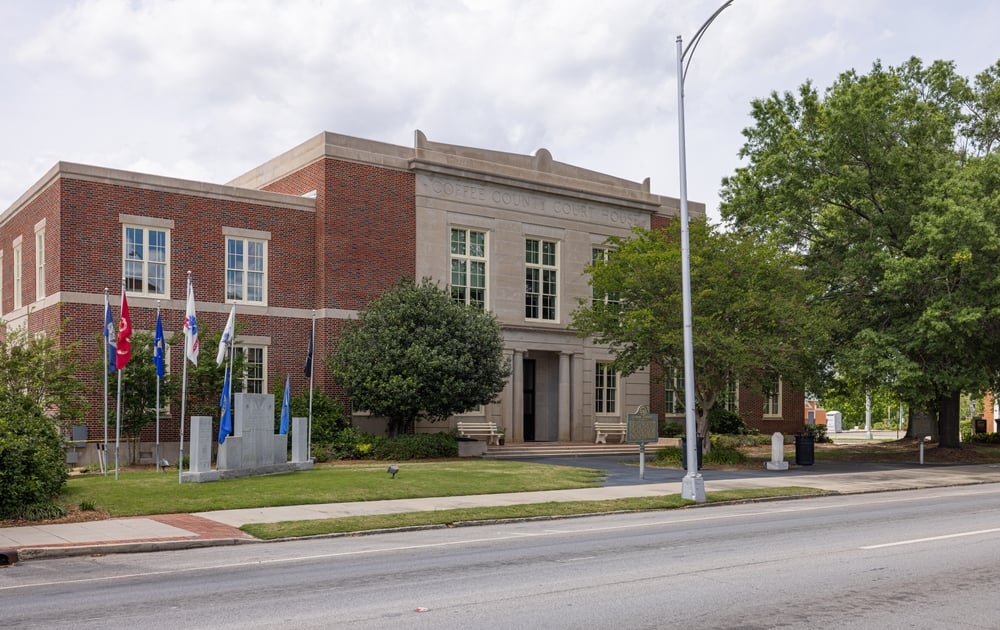
13. Jesup
Michael Rivera, CC BY-SA 4.0, via Wikimedia Commons
Annual rainfall: ~47 in.
During droughts, paper mills face tight water supply, with lingering effects on infrastructure and employment.
12. Alma
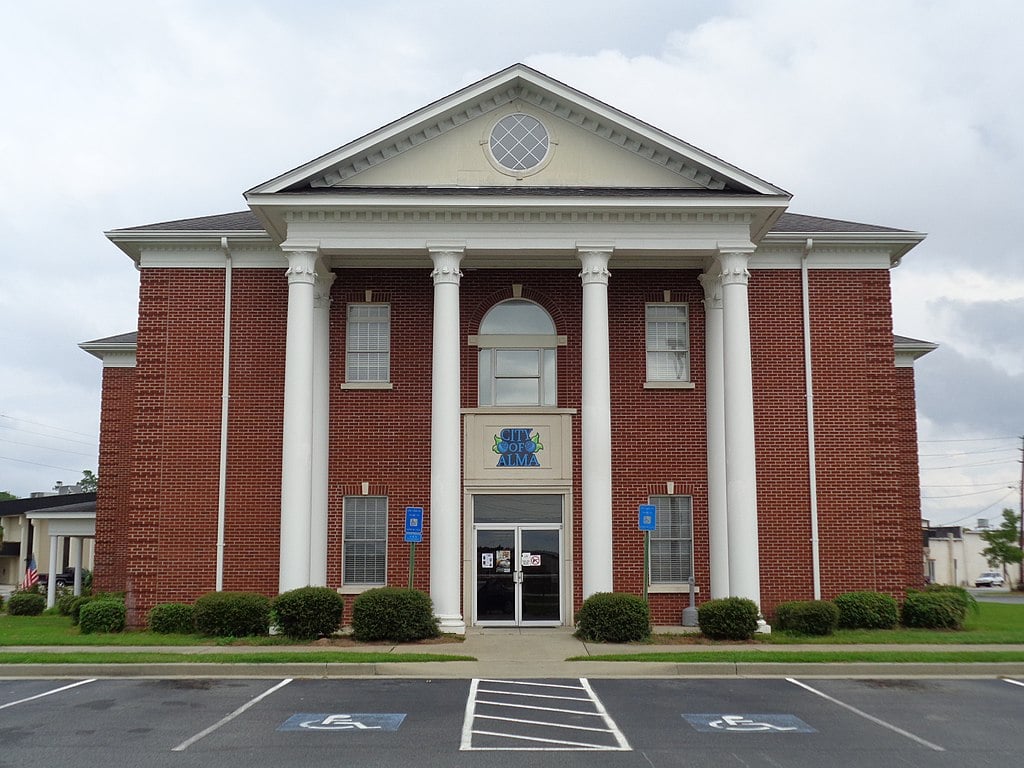
Annual rainfall: ~46 in.
Multiple severe drought years have reduced blueberry yields dramatically, revealing agricultural sensitivity to water stress.
11. Hazlehurst
Annual rainfall: ~46 in.
Drought years correlate strongly with La Niña events here, with lower-than-usual winter-spring precipitation further drying soils.
10. Douglas
Annual rainfall: ~45 in.
Sandy soils and high summer evapotranspiration mean that crop irrigation and municipal supplies are heavily impacted during drought.
9. Fitzgerald
Annual rainfall: ~45 in.
Mid-2000s droughts triggered broad water restrictions and highlighted how even average-rainfall interior towns face severe water stress.
8. Tifton
Annual rainfall: ~44 in.
Missed thunderstorm seasons rapidly turn surface soils dry—an issue for both agriculture and research institutions.
7. Moultrie
Would you like to save this?
Annual rainfall: ~44 in.
Deep sands in southern Georgia mean row crops often require irrigation during extended dry spells.
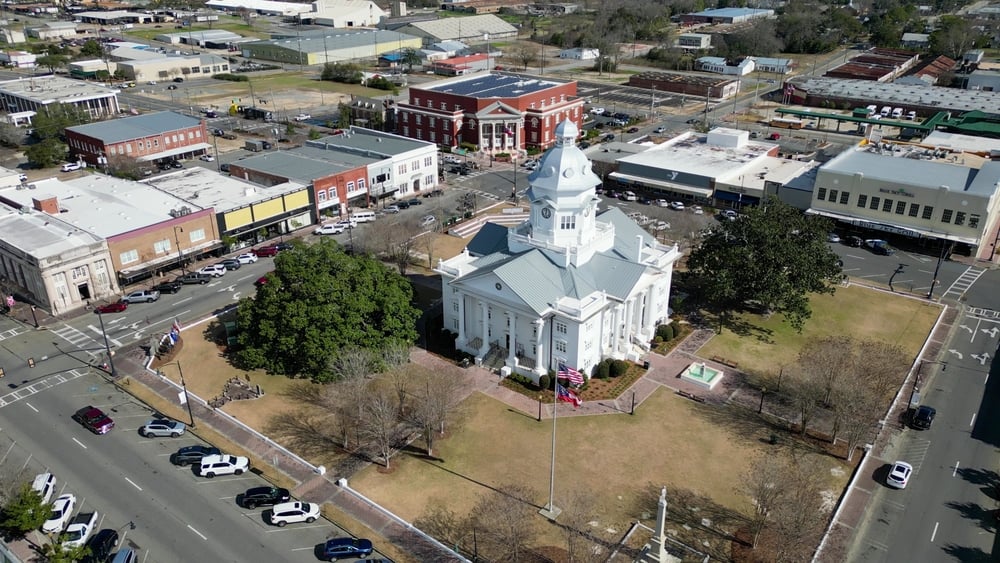
6. Camilla
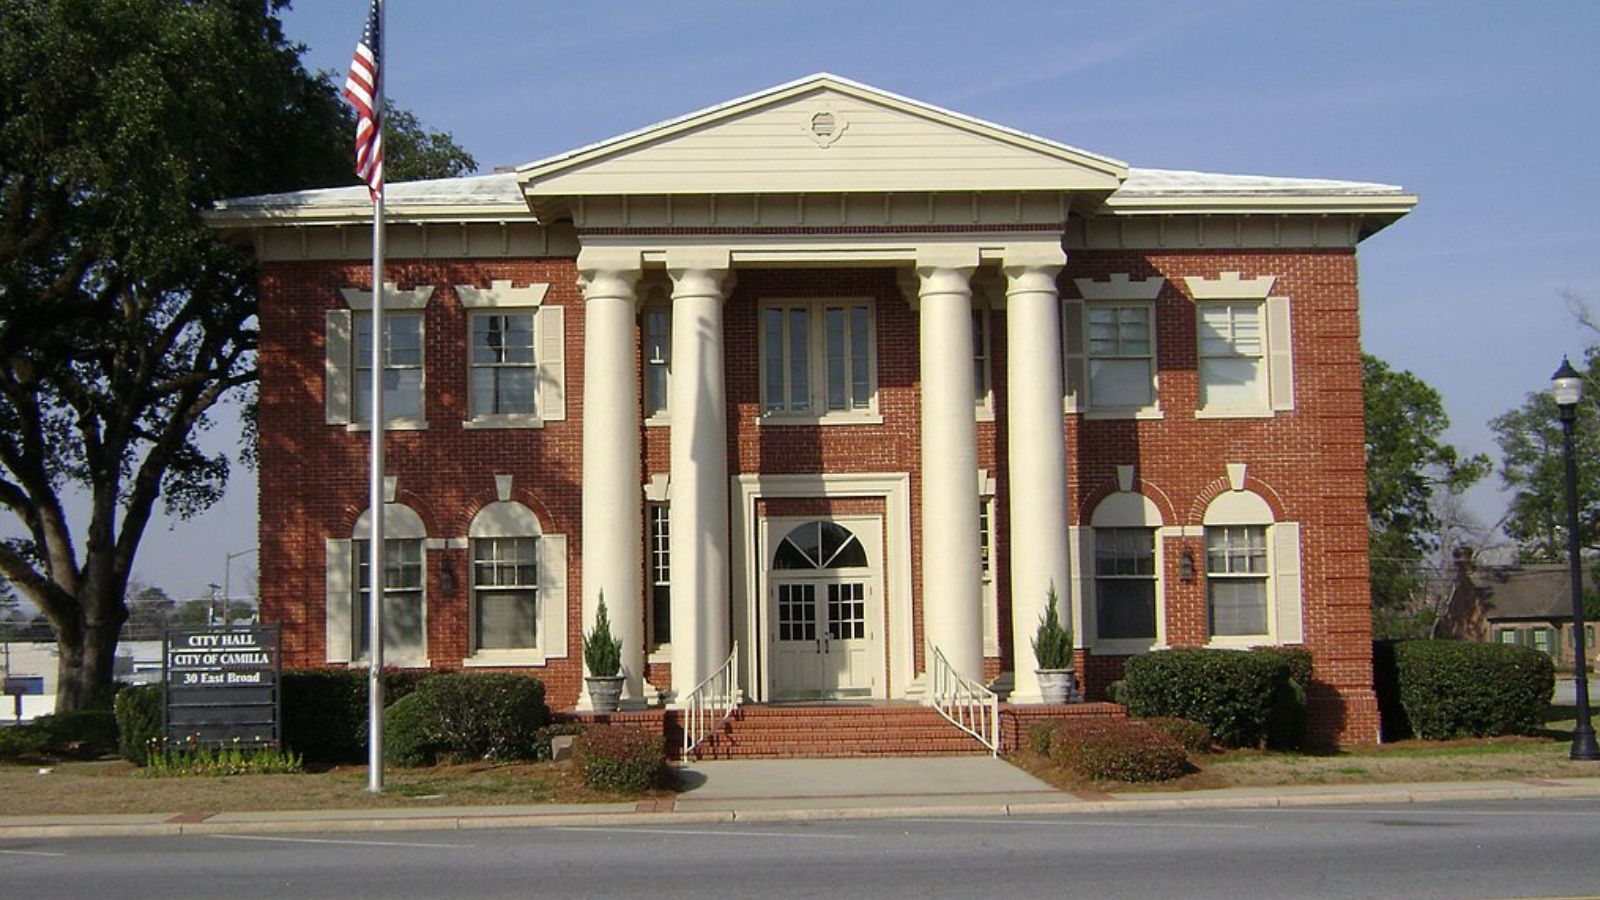
Annual rainfall: ~43 in.
Severe droughts have repeatedly lowered the Flint River levels and led to municipal shortages.
5. Bainbridge
Annual rainfall: ~43 in.
Part of southwest Georgia’s drought hotspot; river flows are often critically low during multi-year dry cycles.
4. Blakely
Annual rainfall: ~42 in.
Repeated drought has forced farmers to reduce planting in peanut and cotton, emphasizing the region’s high vulnerability.
3. Cuthbert

Annual rainfall: ~42 in.
Heavy-burst precipitation patterns mean long dry gaps—combined with hot summers, this risks soil moisture and crops continually.
2. Fort Gaines
Annual rainfall: ~41 in.
One of the driest towns statewide, recurring droughts have severely strained agricultural and municipal water systems.
1. Lumpkin

Annual rainfall: ~40 in.
This southwest Georgia town ranks highest for drought exposure—frequent moderate to severe droughts, sandy soils, and limited rainfall make water reliability a constant issue.
References
- Georgia | Drought.gov
- Georgia Environmental Protection Division – Drought Indicators Report
- U.S. Drought Monitor (USDM) Data Tables
- Palmer Drought Severity Index (PDSI)
- Keetch–Byram Drought Index (KBDI)
- Rabun County, GA – Wikipedia (rainfall reference)