🔥 Would you like to save this?
In order to come up with the very specific design ideas, we create most designs with the assistance of state-of-the-art AI interior design software. Also, assume links that take you off the site are affiliate links such as links to Amazon. this means we may earn a commission if you buy something.
The Zillow Home Value Index shows something rare in 2025: places where home prices haven’t exploded. Scattered from sun-soaked desert towns to quiet mountain communities, these 20 spots in New Mexico are still flying under the radar, with average home values under $170,000. They’re not just cheap—they offer a mix of stability, charm, and untapped potential. Whether you’re buying your first place, planning a lower-cost retirement, or just tired of overpriced markets, these towns might be your next smart move.
20. Roswell – 49.3% Home Price Increase Since 2010
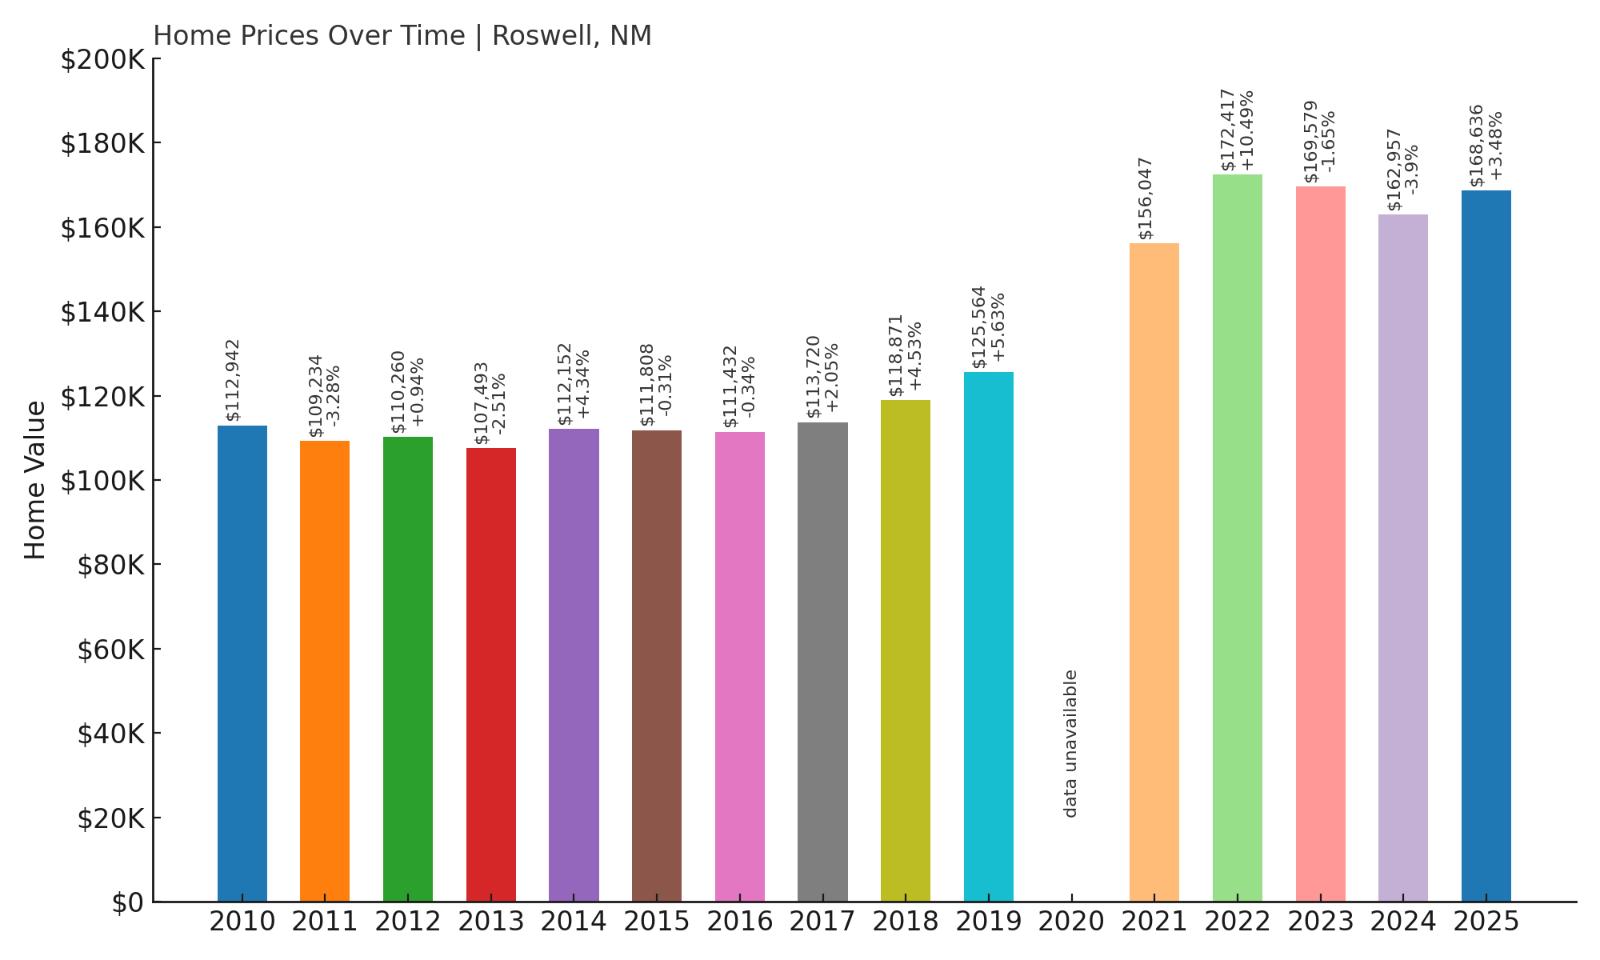
- 2010: $112,942
- 2011: $109,234 (-$3,708, -3.28% from previous year)
- 2012: $110,260 (+$1,026, +0.94% from previous year)
- 2013: $107,493 (-$2,767, -2.51% from previous year)
- 2014: $112,152 (+$4,660, +4.34% from previous year)
- 2015: $111,808 (-$345, -0.31% from previous year)
- 2016: $111,432 (-$375, -0.34% from previous year)
- 2017: $113,720 (+$2,287, +2.05% from previous year)
- 2018: $118,871 (+$5,151, +4.53% from previous year)
- 2019: $125,564 (+$6,693, +5.63% from previous year)
- 2020: N/A
- 2021: $156,047
- 2022: $172,417 (+$16,370, +10.49% from previous year)
- 2023: $169,579 (-$2,838, -1.65% from previous year)
- 2024: $162,957 (-$6,622, -3.9% from previous year)
- 2025: $168,636 (+$5,679, +3.48% from previous year)
Roswell’s home values have climbed nearly 50% since 2010, with most of that growth occurring after 2020. The town saw strong increases from 2021 onward, peaking in 2022 before a mild correction. With home values now hovering around $168,000, Roswell remains a relatively affordable option in southeastern New Mexico, especially considering its urban infrastructure and services.
Roswell – A Steady Market with Space to Grow

Roswell is one of the largest towns on this list and benefits from more economic activity than many of its rural neighbors. Known for its UFO lore and Air Force roots, the city also serves as a local hub for healthcare, education, and small manufacturing. It’s these regional roles that have likely helped stabilize home prices over time—even during periods of market fluctuation. With a population around 48,000 and services like Eastern New Mexico Medical Center, Roswell offers more amenities than many similarly priced markets. The 2020s brought significant appreciation to local real estate, particularly during the post-pandemic buying rush. While recent price dips suggest some cooling, the long-term trend remains positive. For buyers, Roswell offers value, space, and potential—all in a town that continues to invest in its future while preserving its quirky character.
19. Mountainair – No Data Before 2024

- 2010: N/A
- 2011: N/A
- 2012: N/A
- 2013: N/A
- 2014: N/A
- 2015: N/A
- 2016: N/A
- 2017: N/A
- 2018: N/A
- 2019: N/A
- 2020: N/A
- 2021: N/A
- 2022: N/A
- 2023: N/A
- 2024: $162,066
- 2025: $164,582 (+$2,515, +1.55% from previous year)
Mountainair has only recently appeared on Zillow’s radar, with data available starting in 2024. In the short time tracked, prices have increased modestly, suggesting a calm market. While it lacks a long price history, its low entry price makes it one of the most budget-friendly options in the state right now.
Mountainair – Quiet Affordability in Central New Mexico
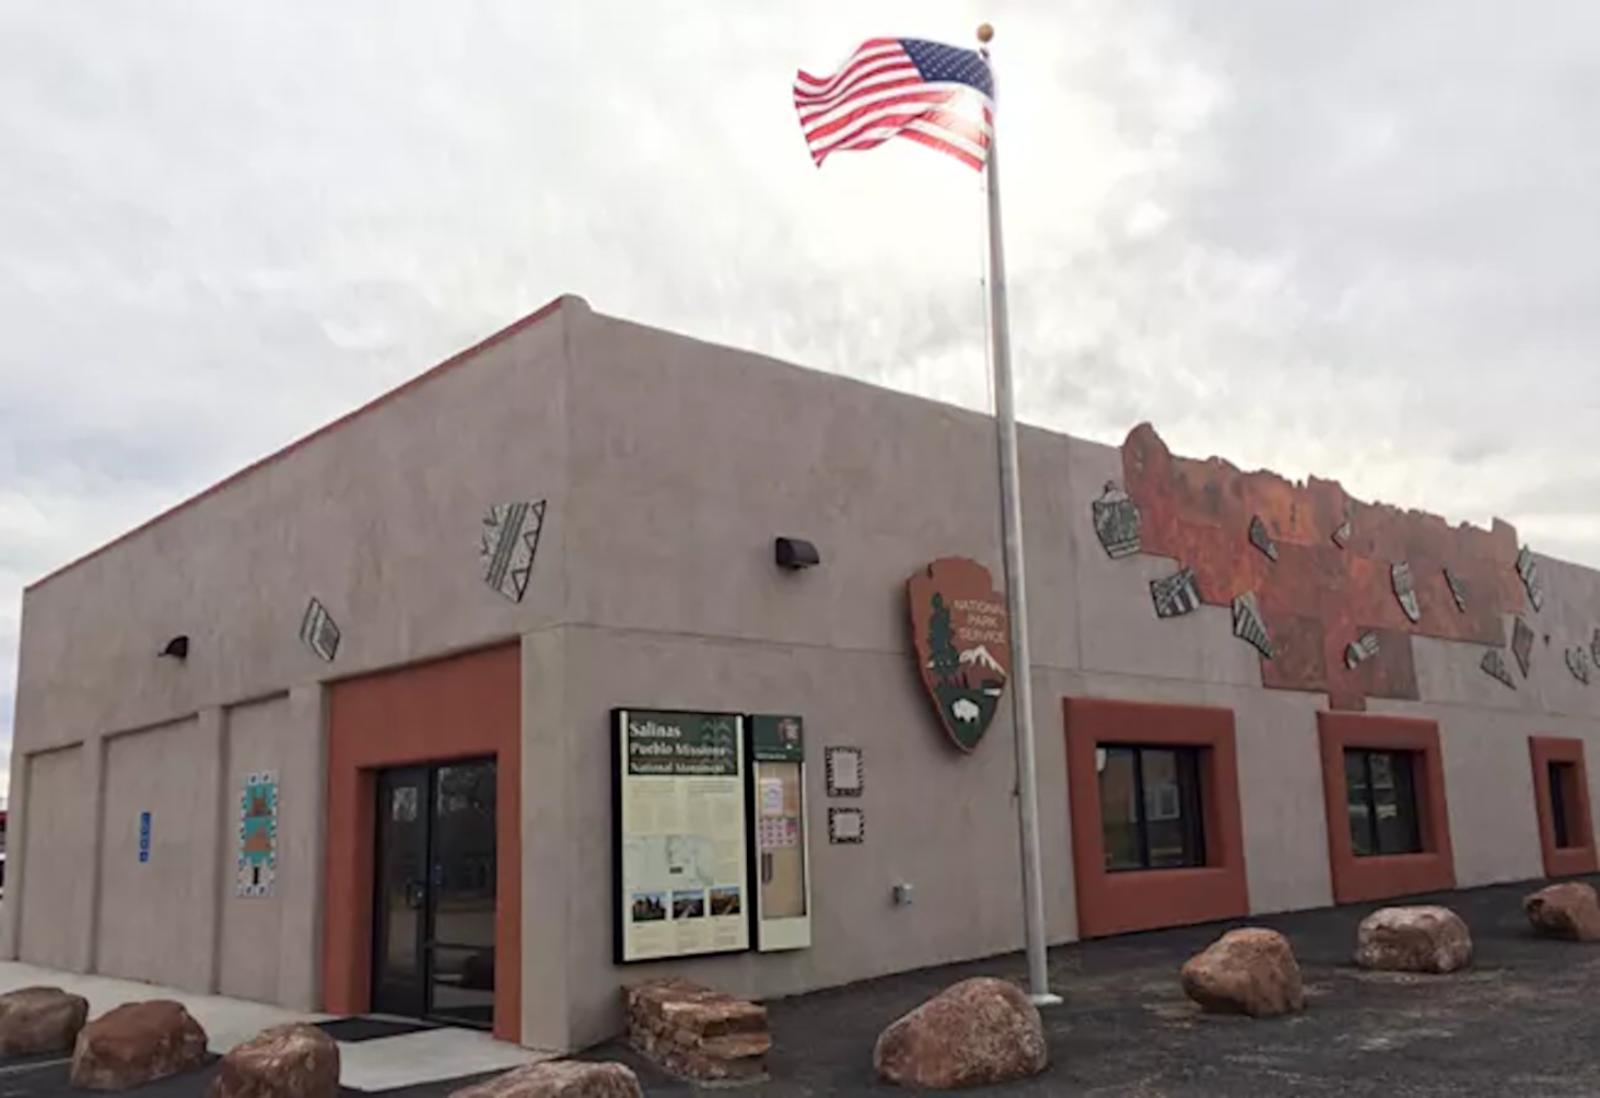
Located about 75 miles southeast of Albuquerque, Mountainair is a small community known for its proximity to the Salinas Pueblo Missions National Monument. With fewer than 900 residents, it’s a place where life moves slowly and space is plentiful. The town’s isolation may explain its relatively stable pricing, even in a time of national volatility. Homes in Mountainair are often larger parcels or older properties, appealing to buyers looking for rural charm and solitude. Basic services are limited, but the community has a strong local identity and a low cost of living. Its appeal lies in affordability, open landscapes, and a strong sense of place—qualities that often draw artists, retirees, and those looking to downshift from city life. While small, Mountainair provides real value for buyers seeking peace and price stability.
18. Clovis – 19% Home Price Increase Since 2016

- 2010: N/A
- 2011: N/A
- 2012: N/A
- 2013: N/A
- 2014: N/A
- 2015: N/A
- 2016: $138,260
- 2017: $137,350 (-$910, -0.66% from previous year)
- 2018: $132,612 (-$4,738, -3.45% from previous year)
- 2019: $141,628 (+$9,016, +6.8% from previous year)
- 2020: N/A
- 2021: $151,783
- 2022: $157,804 (+$6,021, +3.97% from previous year)
- 2023: $165,085 (+$7,281, +4.61% from previous year)
- 2024: $163,495 (-$1,591, -0.96% from previous year)
- 2025: $164,549 (+$1,054, +0.64% from previous year)
Home values in Clovis have risen nearly 19% since 2016. Prices peaked in 2023 before stabilizing over the past two years. With average values around $164,000, the city remains accessible to working families while still showing steady long-term appreciation.
Clovis – Affordable Living with a Military Backbone
Clovis is one of the larger communities in eastern New Mexico and serves as a regional anchor thanks to Cannon Air Force Base. This military presence provides a stable employment base and helps support the local economy, which includes agriculture and rail transport. Clovis also offers a solid mix of schools, healthcare, and retail, making it attractive for families. The city’s housing market reflects this balance. While it doesn’t see the dramatic swings of hotter markets, its steady gains since 2016 show that growth is happening. For buyers seeking affordability without giving up convenience, Clovis represents a smart compromise—and with a consistent rental market, investors may also find opportunity here.
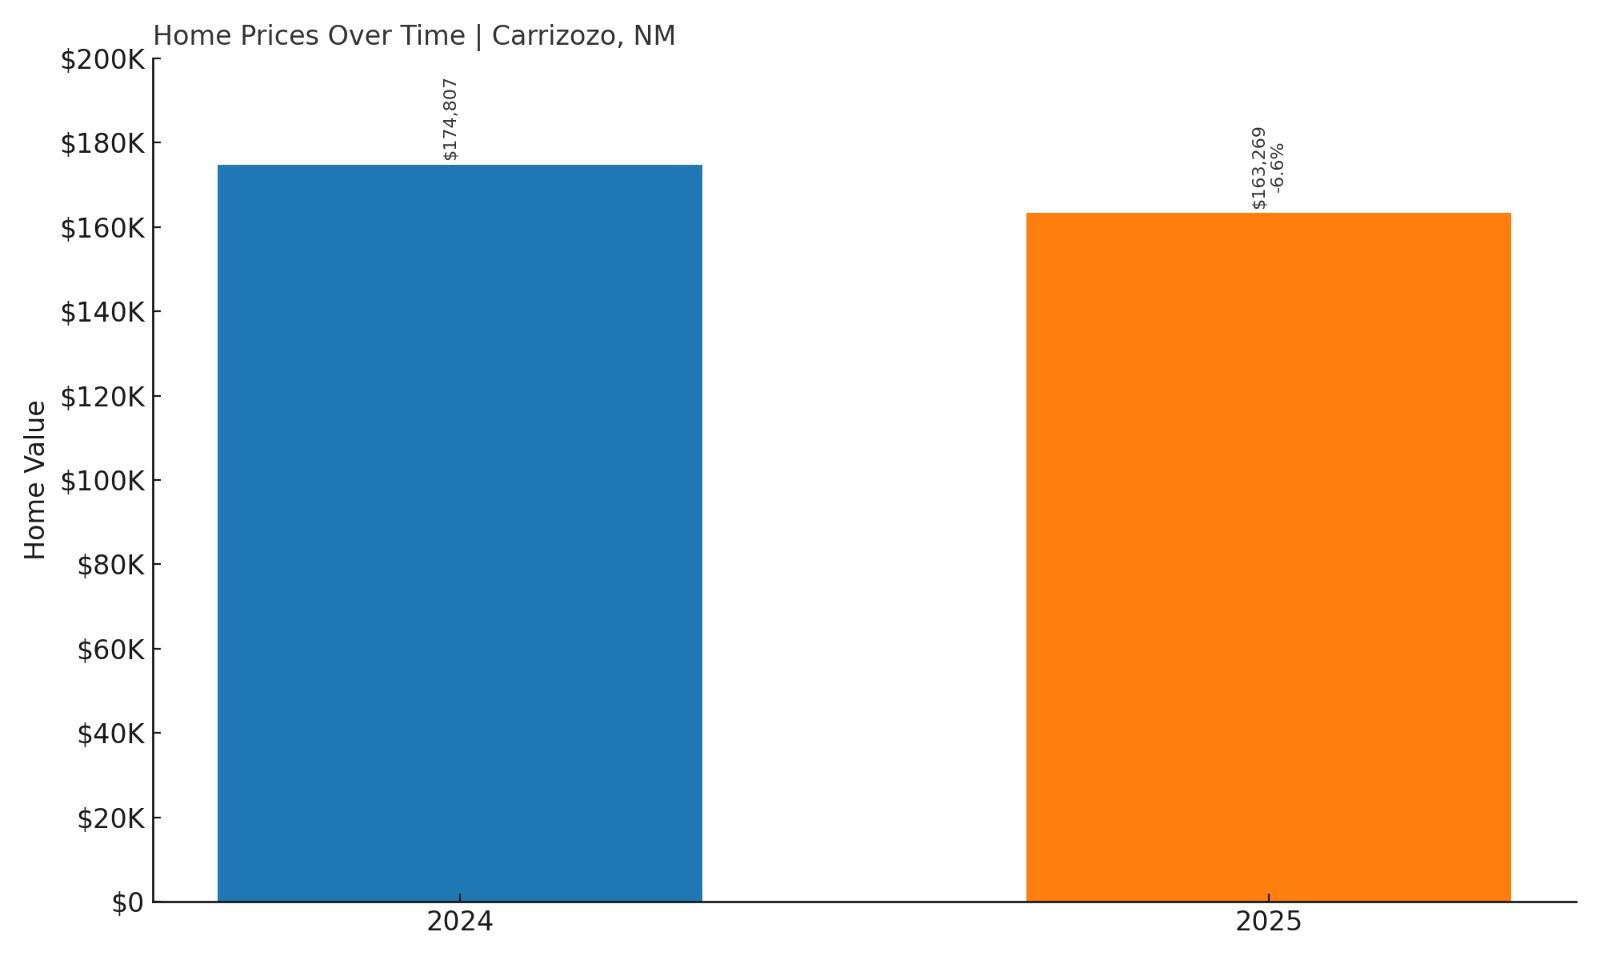
17. Carrizozo – 6.6% Home Price Decrease Since 2024
- 2010: N/A
- 2011: N/A
- 2012: N/A
- 2013: N/A
- 2014: N/A
- 2015: N/A
- 2016: N/A
- 2017: N/A
- 2018: N/A
- 2019: N/A
- 2020: N/A
- 2021: N/A
- 2022: N/A
- 2023: N/A
- 2024: $174,807
- 2025: $163,269 (-$11,538, -6.6% from previous year)
Carrizozo saw its only recorded home price drop in 2025, falling over 6% from the prior year. With limited historical data available, it’s unclear whether this decline is part of a trend or a market correction. Still, its $163,000 average price places it in the affordable tier statewide.
Carrizozo – Historic Charm Meets Small-Town Economics
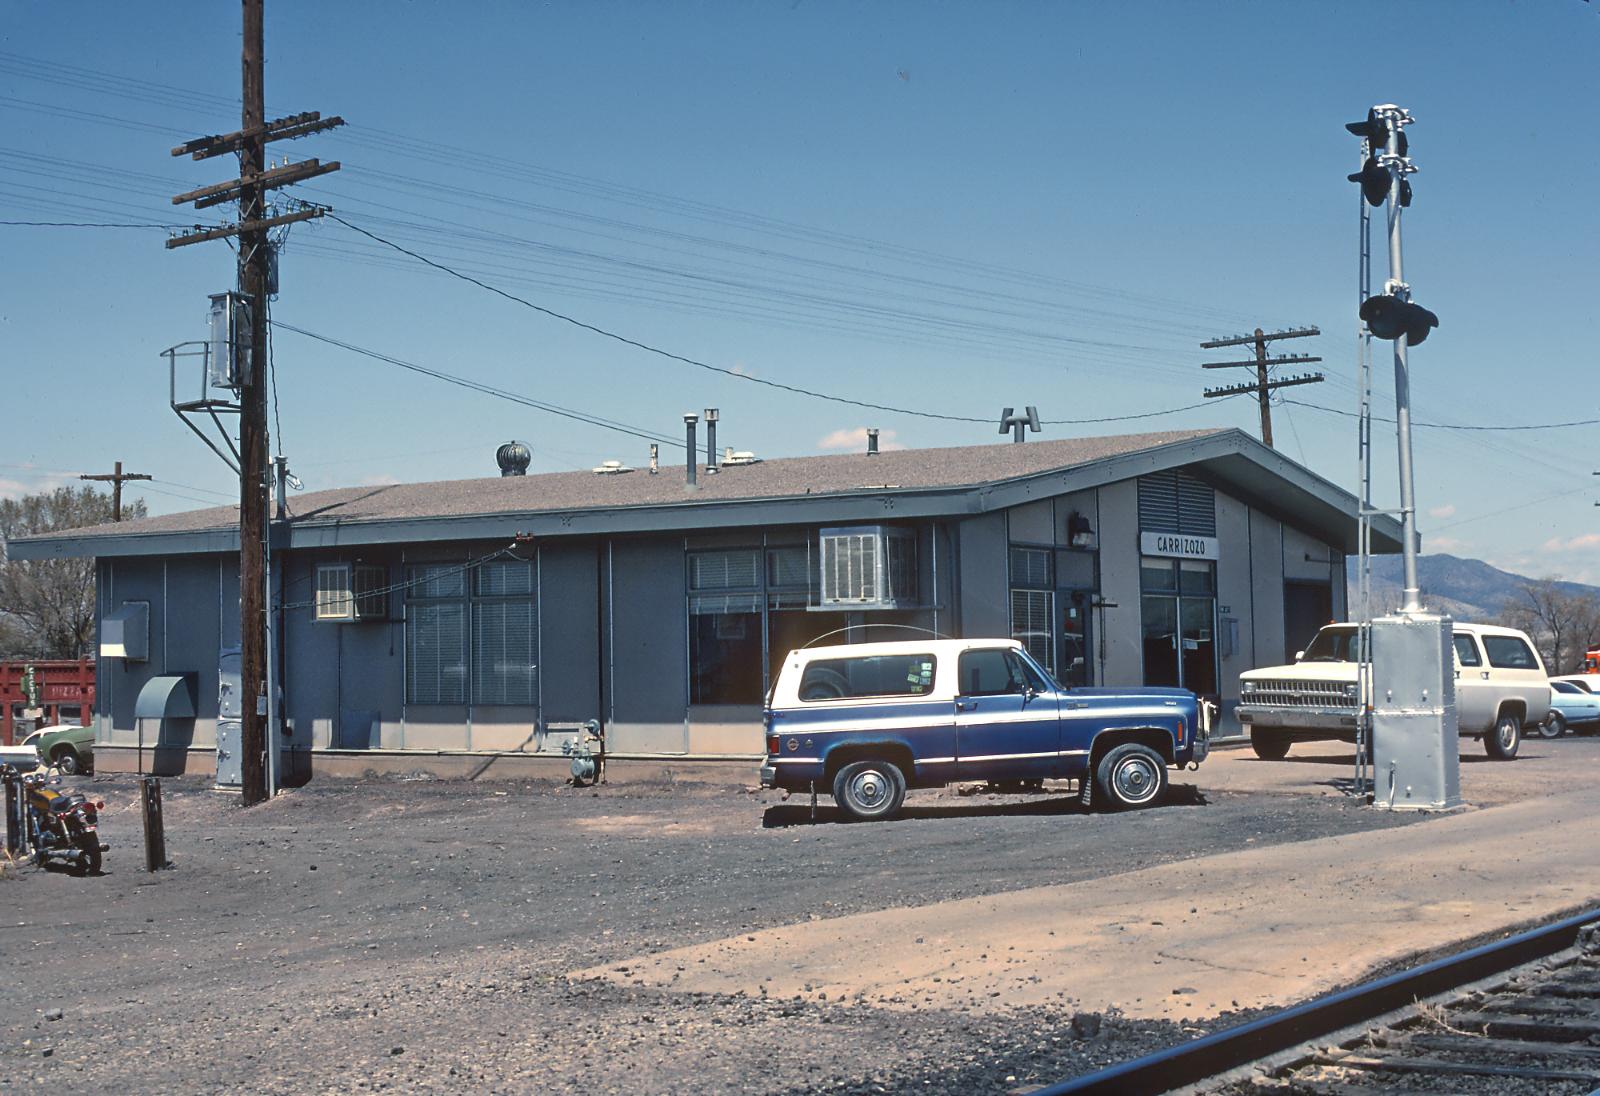
Nestled at the northern edge of Lincoln County, Carrizozo is a gateway to both high desert and mountain landscapes. Once a regional rail hub, the town today has a quieter pace and a population of just a few hundred. It’s increasingly favored by artists and remote workers, drawn to its historic buildings and scenic surroundings. The home price dip in 2025 may reflect a cooling after a brief surge or simply a limited dataset. Carrizozo’s value lies in its unique blend of affordability and character. While services are minimal, the town offers a rare combination of natural beauty, creative culture, and low property costs.
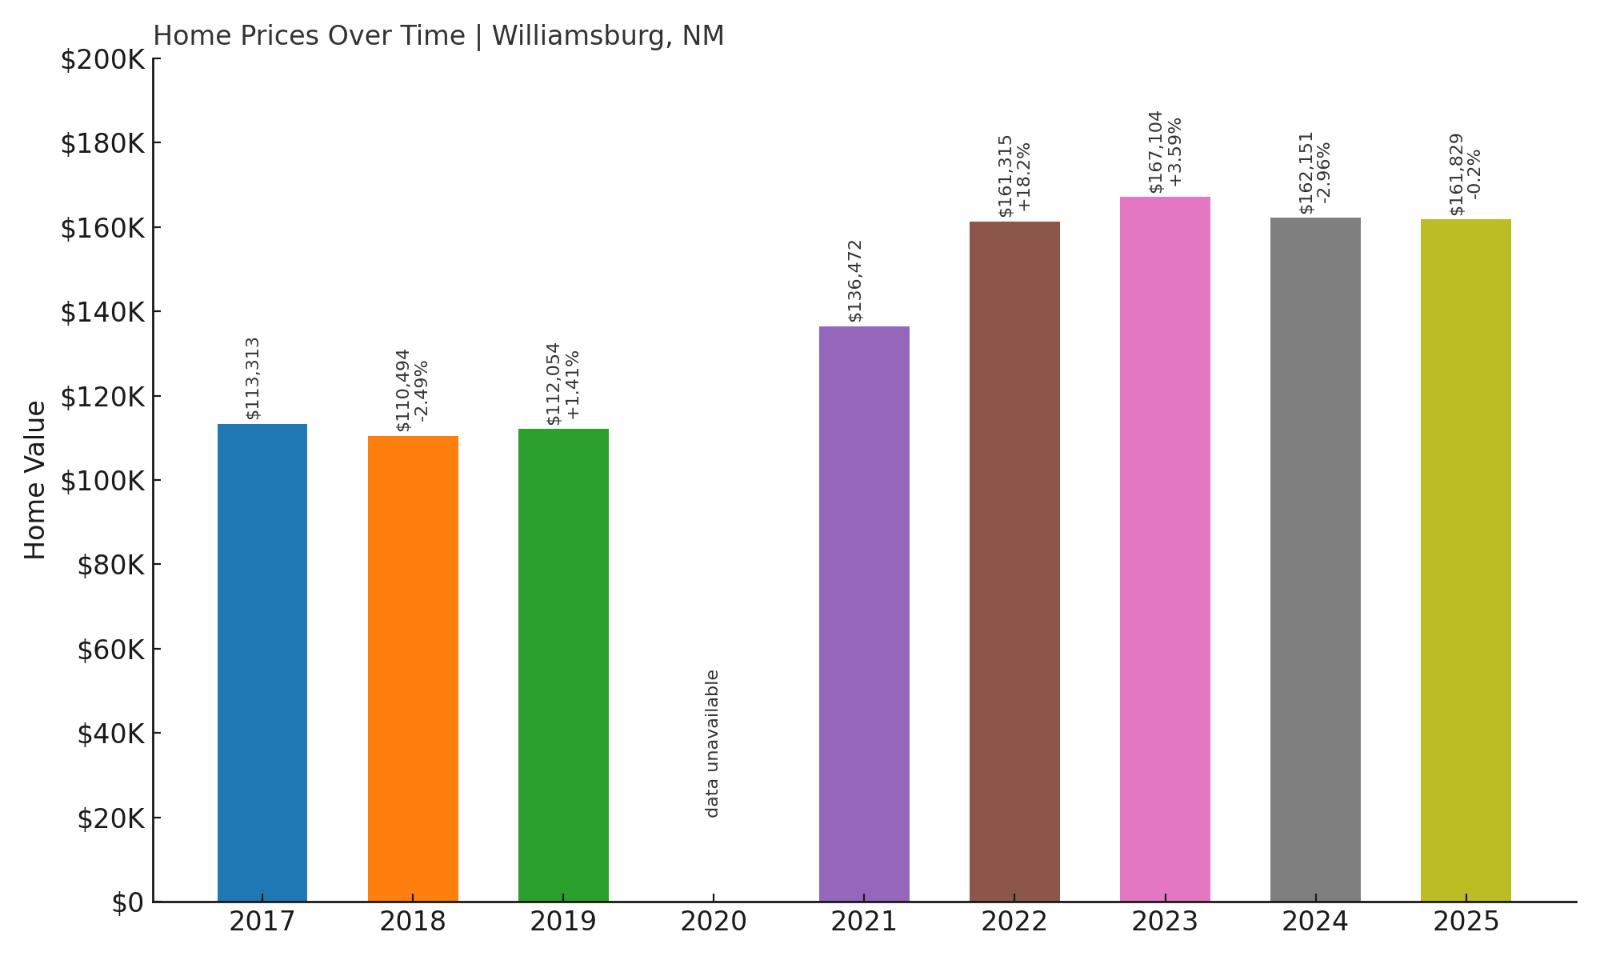
16. Williamsburg – 42.8% Home Price Increase Since 2017
- 2010: N/A
- 2011: N/A
- 2012: N/A
- 2013: N/A
- 2014: N/A
- 2015: N/A
- 2016: N/A
- 2017: $113,313
- 2018: $110,494 (-$2,819, -2.49% from previous year)
- 2019: $112,054 (+$1,559, +1.41% from previous year)
- 2020: N/A
- 2021: $136,472
- 2022: $161,315 (+$24,842, +18.2% from previous year)
- 2023: $167,104 (+$5,789, +3.59% from previous year)
- 2024: $162,151 (-$4,953, -2.96% from previous year)
- 2025: $161,829 (-$322, -0.2% from previous year)
Williamsburg home values have increased by nearly 43% since 2017. After a huge jump in 2022, prices have seen slight declines, stabilizing just above $161,000 in 2025. It’s still one of the most affordable towns near the Rio Grande corridor.
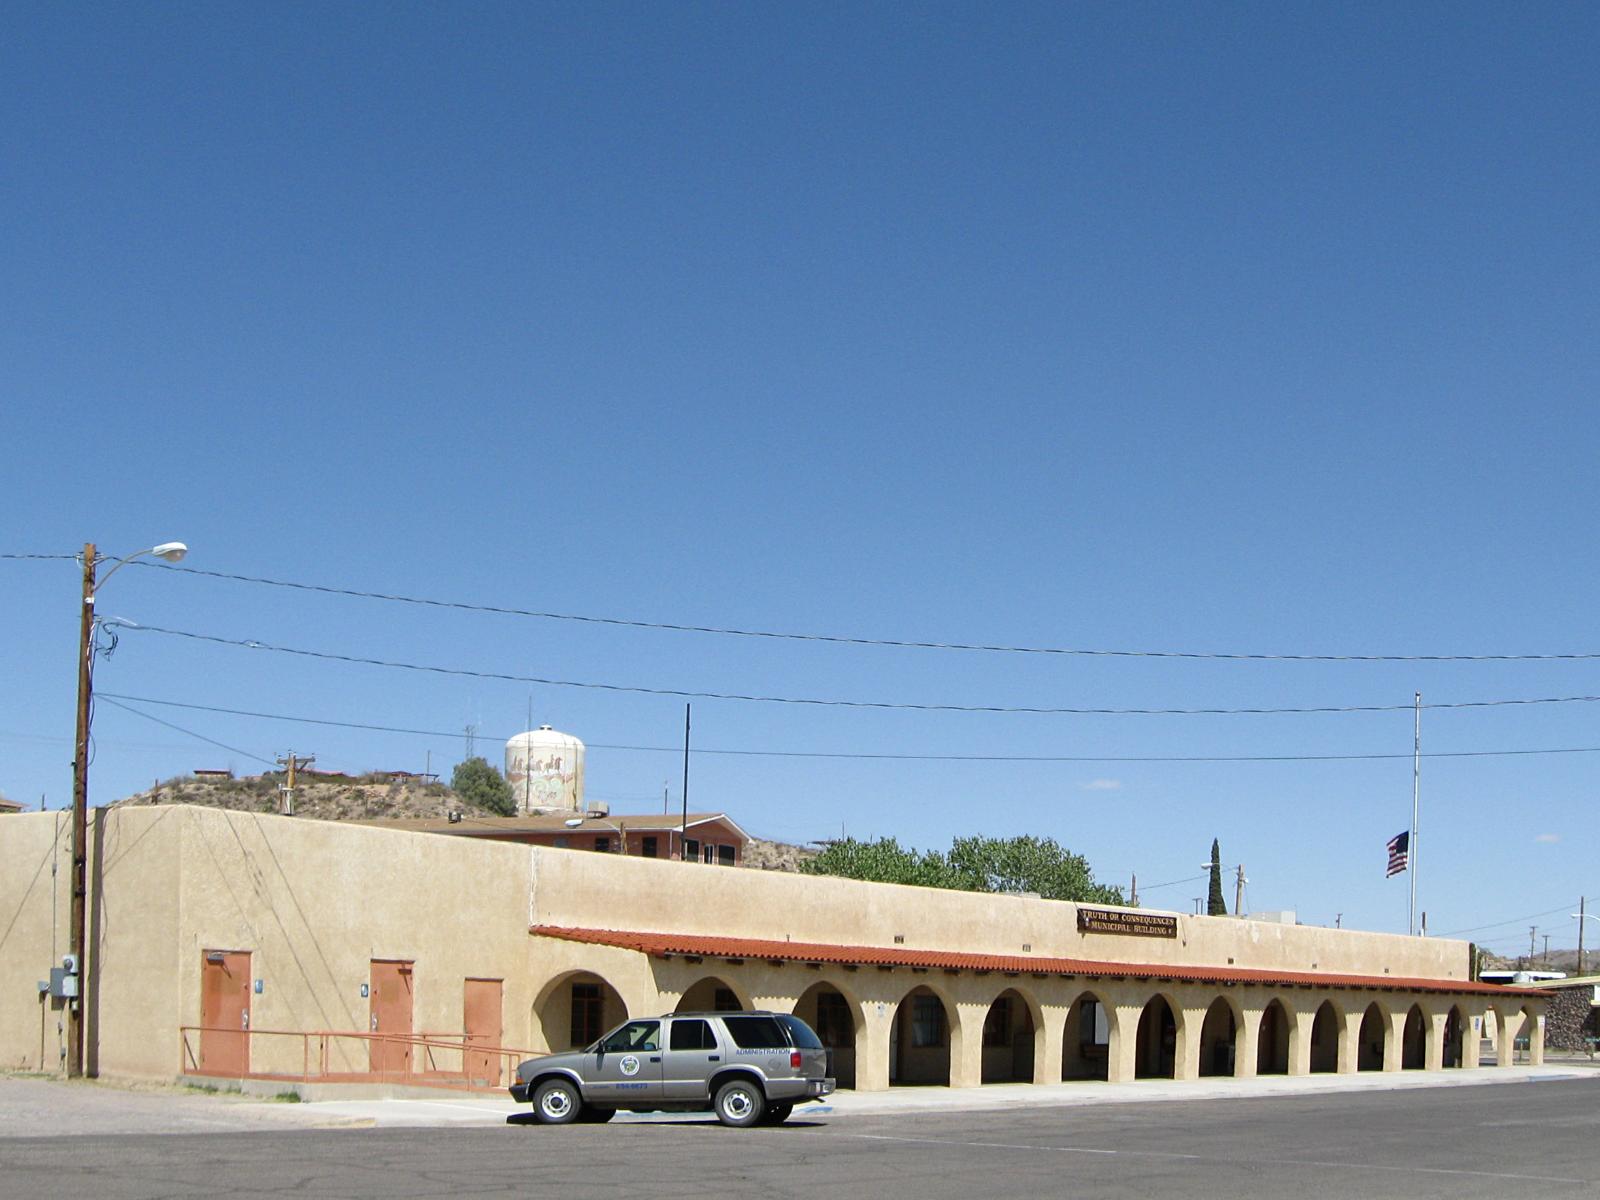
Williamsburg – Rising Value Near Truth or Consequences
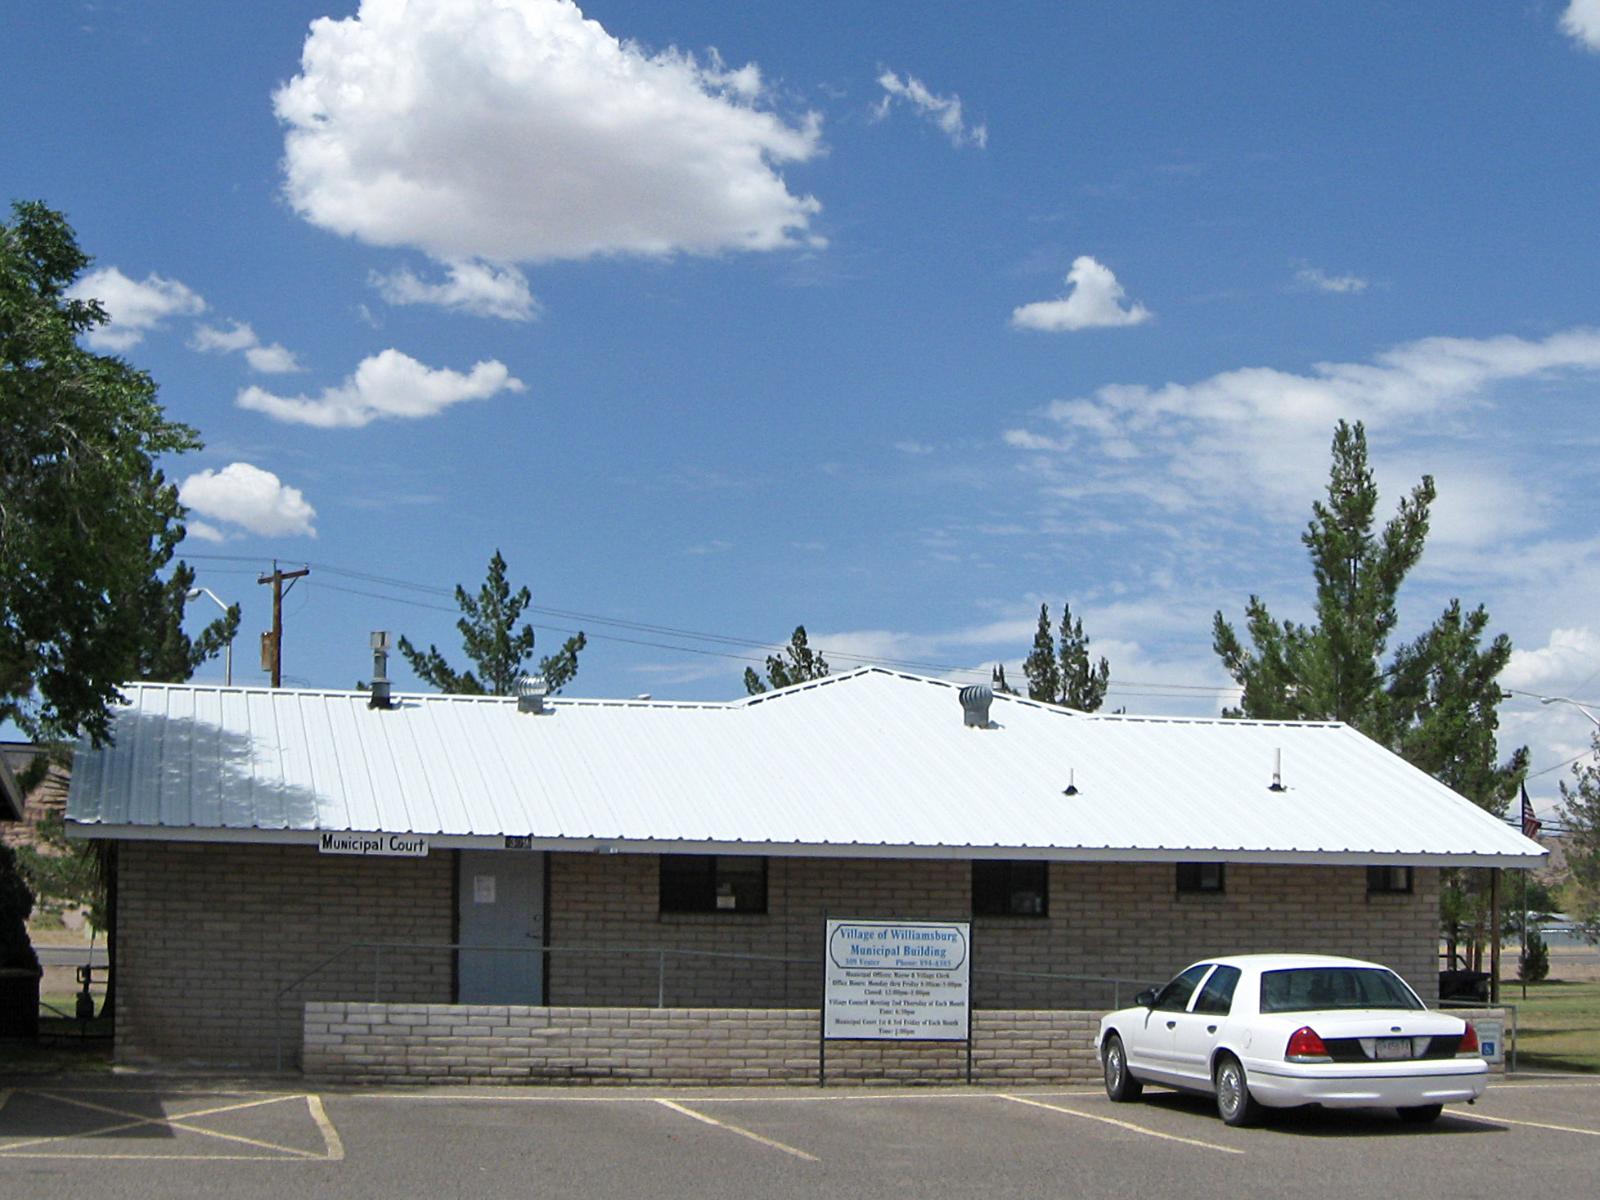
Located next to the better-known town of Truth or Consequences, Williamsburg shares in the economic and recreational benefits of the area. It offers access to Elephant Butte Lake and the Rio Grande, while maintaining a quieter, more residential feel. Housing is a mix of manufactured homes, older bungalows, and newer infill builds. Williamsburg saw a dramatic price jump in 2022, possibly driven by demand spillover from nearby towns or pandemic-era shifts in buyer behavior. Since then, price growth has slowed. But the town’s proximity to water, healthcare, and retirement services keeps it appealing—especially for those seeking warmth and value in southern New Mexico.
15. Deming – 6% Home Price Decrease Since 2012

- 2010: N/A
- 2011: N/A
- 2012: $169,216
- 2013: $139,505 (-$29,711, -17.56% from previous year)
- 2014: $146,851 (+$7,345, +5.27% from previous year)
- 2015: $132,569 (-$14,281, -9.73% from previous year)
- 2016: $118,767 (-$13,802, -10.41% from previous year)
- 2017: $113,690 (-$5,078, -4.28% from previous year)
- 2018: $116,862 (+$3,172, +2.79% from previous year)
- 2019: $121,500 (+$4,638, +3.97% from previous year)
- 2020: N/A
- 2021: $144,019
- 2022: $157,229 (+$13,210, +9.17% from previous year)
- 2023: $157,788 (+$559, +0.36% from previous year)
- 2024: $156,703 (-$1,085, -0.69% from previous year)
- 2025: $159,204 (+$2,501, +1.6% from previous year)
Deming’s housing market has seen significant fluctuations over the years, with a sharp drop from 2012 through 2017 and gradual recovery since then. Prices in 2025 are still about 6% below their 2012 level, which is rare in today’s market and points to long-term affordability. With values now at roughly $159,000, Deming continues to attract budget-conscious buyers.
Deming – Desert Affordability and a Comeback in Progress
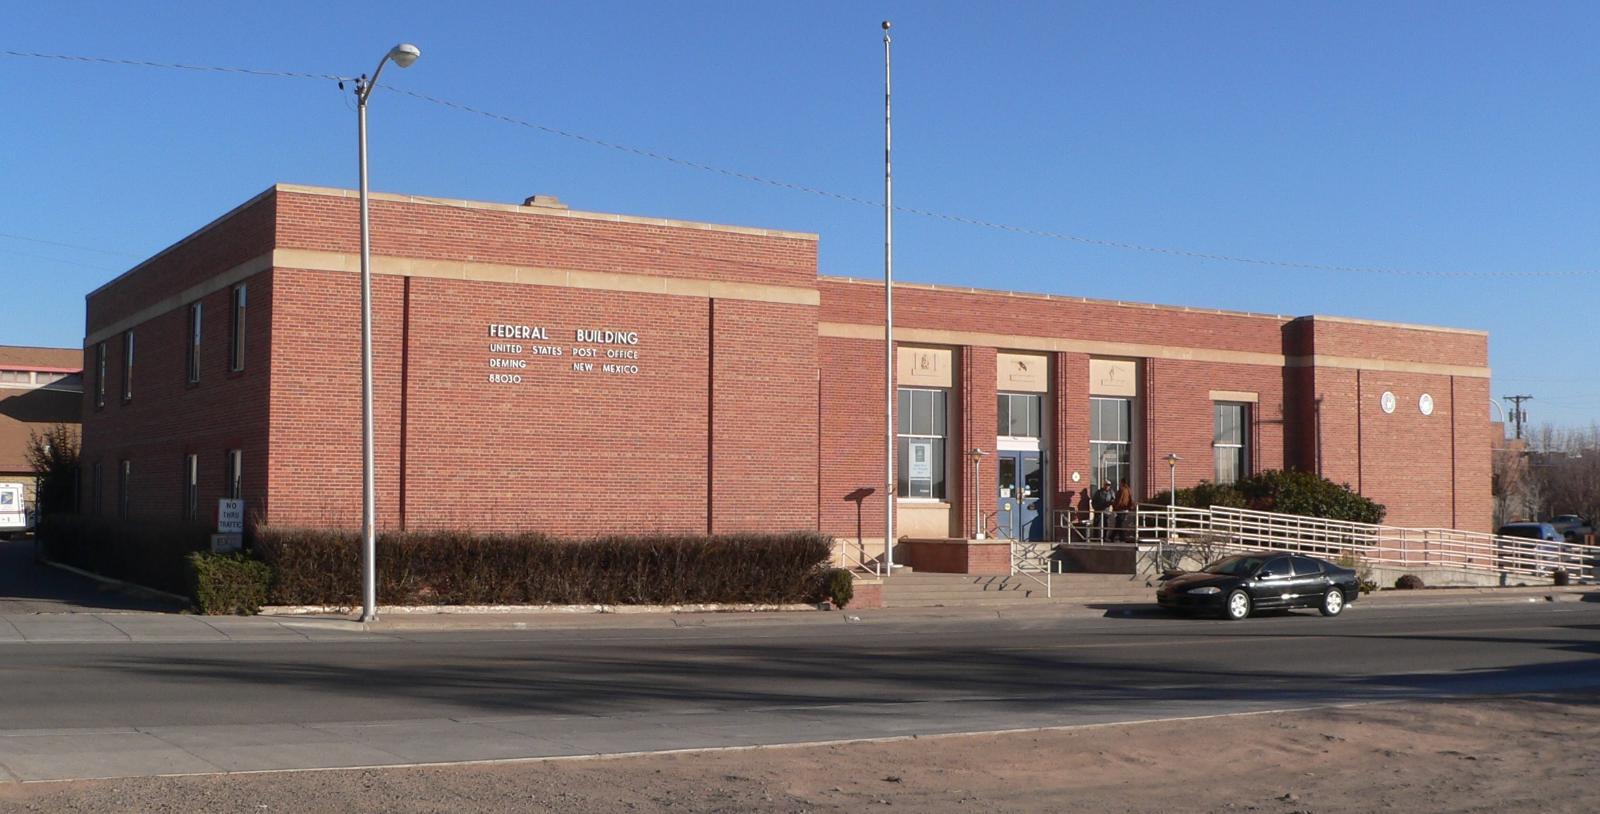
Located near the U.S.–Mexico border in Luna County, Deming is a small but established city with deep agricultural roots. It’s known for its pecan farms, red chile fields, and desert landscapes. The town benefits from a regional hospital, a museum, and decent highway access via I-10, which connects it to Las Cruces and Tucson. Deming’s price peak in 2012 was followed by several years of decline, possibly driven by economic contraction or outmigration. But recent years have seen signs of renewed interest and value stabilization. For buyers open to a slower pace of life and long-term investment, Deming offers both low prices and upward potential.
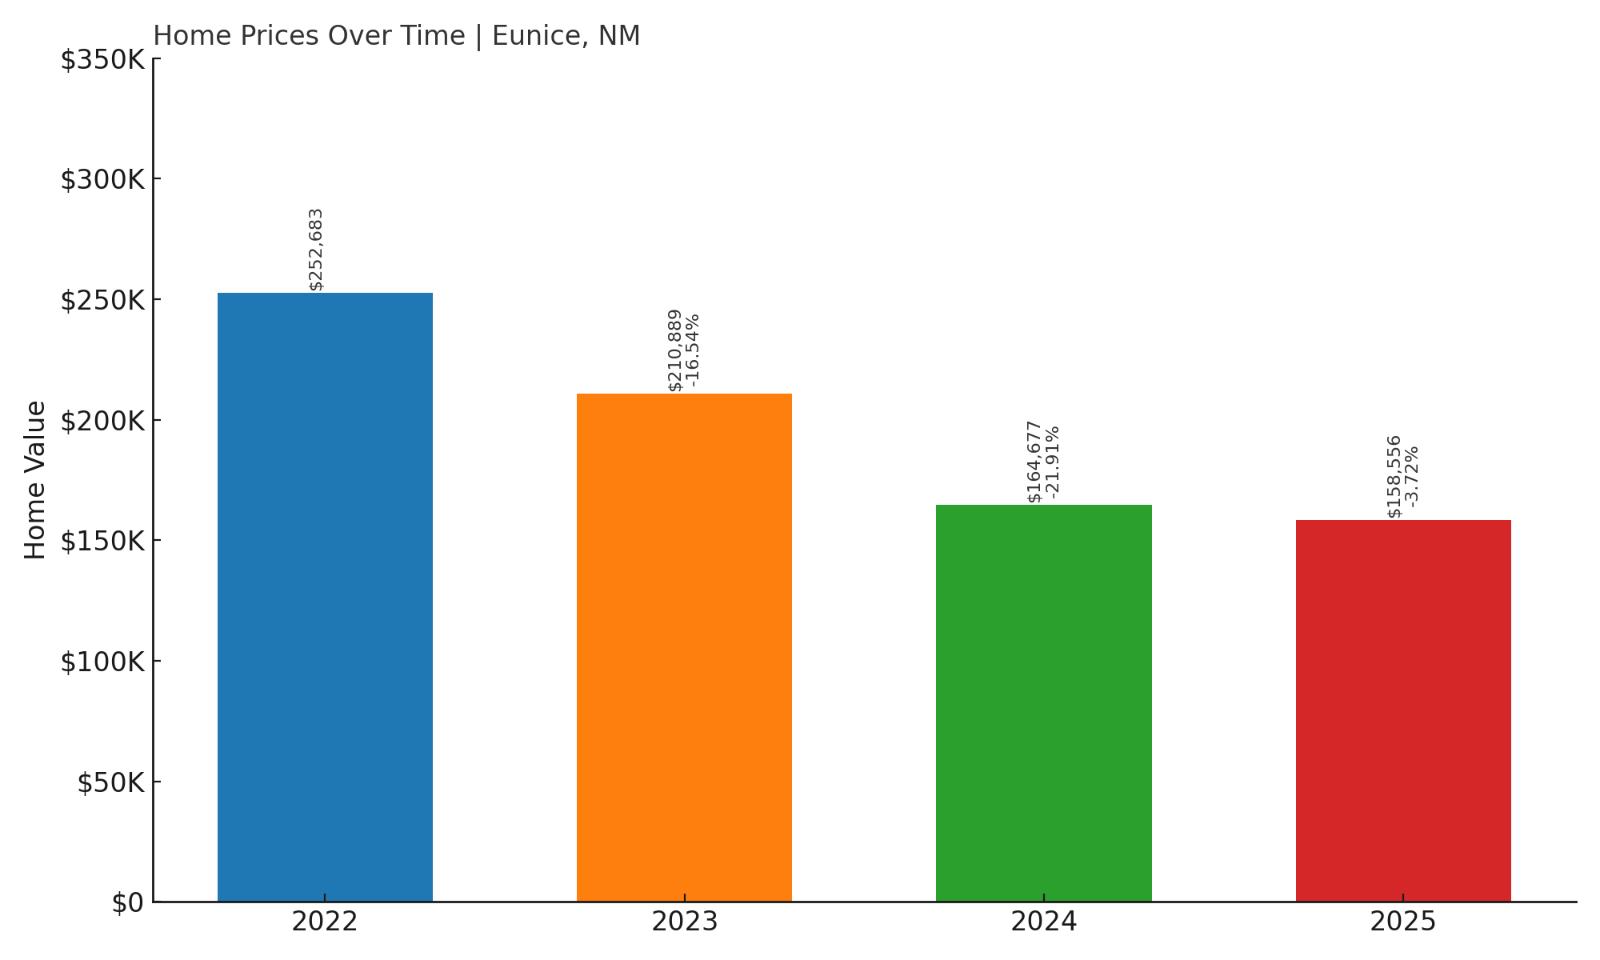
14. Eunice – 37% Home Price Decrease Since 2022
🔥 Would you like to save this?
- 2010: N/A
- 2011: N/A
- 2012: N/A
- 2013: N/A
- 2014: N/A
- 2015: N/A
- 2016: N/A
- 2017: N/A
- 2018: N/A
- 2019: N/A
- 2020: N/A
- 2021: N/A
- 2022: $252,683
- 2023: $210,889 (-$41,794, -16.54% from previous year)
- 2024: $164,677 (-$46,213, -21.91% from previous year)
- 2025: $158,556 (-$6,121, -3.72% from previous year)
Eunice has experienced a striking 37% decline in home values since 2022. After peaking above $250,000, prices have dropped year after year, settling around $158,000 in 2025. This rapid contraction makes it one of the most volatile housing markets on this list—and potentially a compelling value for bargain-seekers.
Eunice – A Boom-Bust Oil Town Now Offering Bargains

Located in southeastern New Mexico near the Texas border, Eunice is heavily tied to the oil and gas industry. When energy prices are strong, the town sees a surge in housing demand—reflected in the sky-high values of 2022. But like many energy towns, prices can fall just as fast when demand cools or jobs vanish. While the recent plunge may deter some, it also presents an opportunity. Those with ties to the energy sector—or investors willing to bet on a rebound—might find low-priced homes in Eunice to be a calculated risk. It’s a classic case of high risk, high potential reward, and a reminder of how deeply local economies affect real estate values.
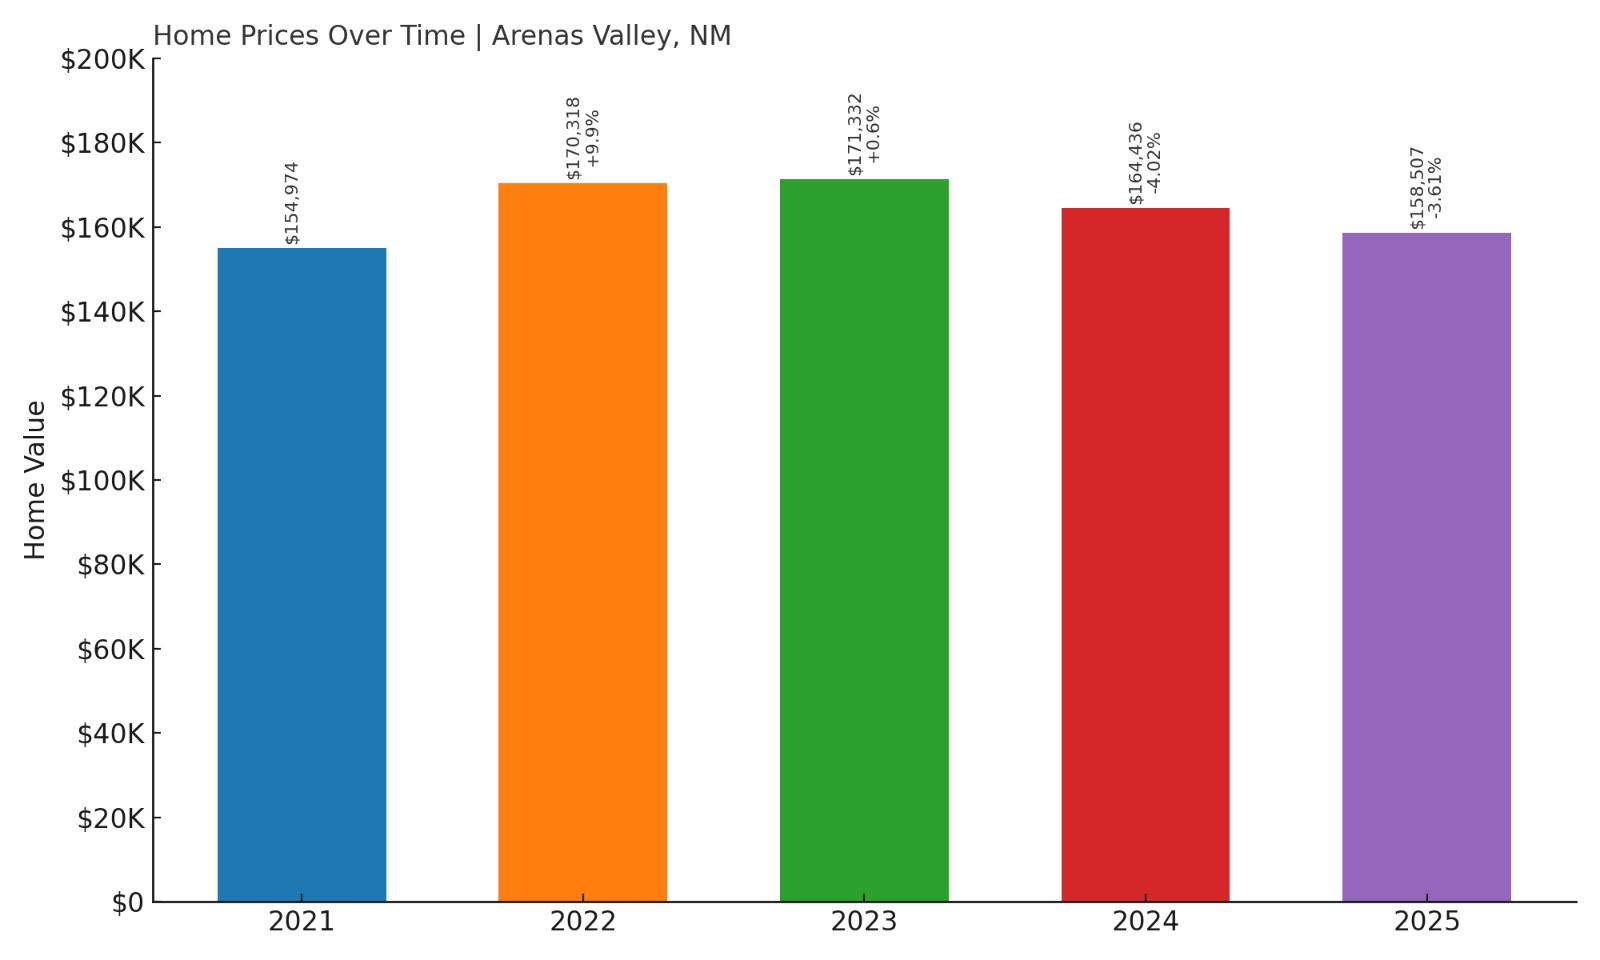
13. Arenas Valley – 2.5% Home Price Decrease Since 2022
- 2010: N/A
- 2011: N/A
- 2012: N/A
- 2013: N/A
- 2014: N/A
- 2015: N/A
- 2016: N/A
- 2017: N/A
- 2018: N/A
- 2019: N/A
- 2020: N/A
- 2021: $154,974
- 2022: $170,318 (+$15,344, +9.9% from previous year)
- 2023: $171,332 (+$1,014, +0.6% from previous year)
- 2024: $164,436 (-$6,896, -4.02% from previous year)
- 2025: $158,507 (-$5,928, -3.61% from previous year)
Arenas Valley’s prices rose steadily from 2021 to 2023 before dipping nearly 7% over the last two years. The total decline from its 2022 peak is about 2.5%. With prices now under $160,000, the area offers affordability within reach of Silver City and its amenities.
Arenas Valley – Rural Living with Quick Access to Silver City
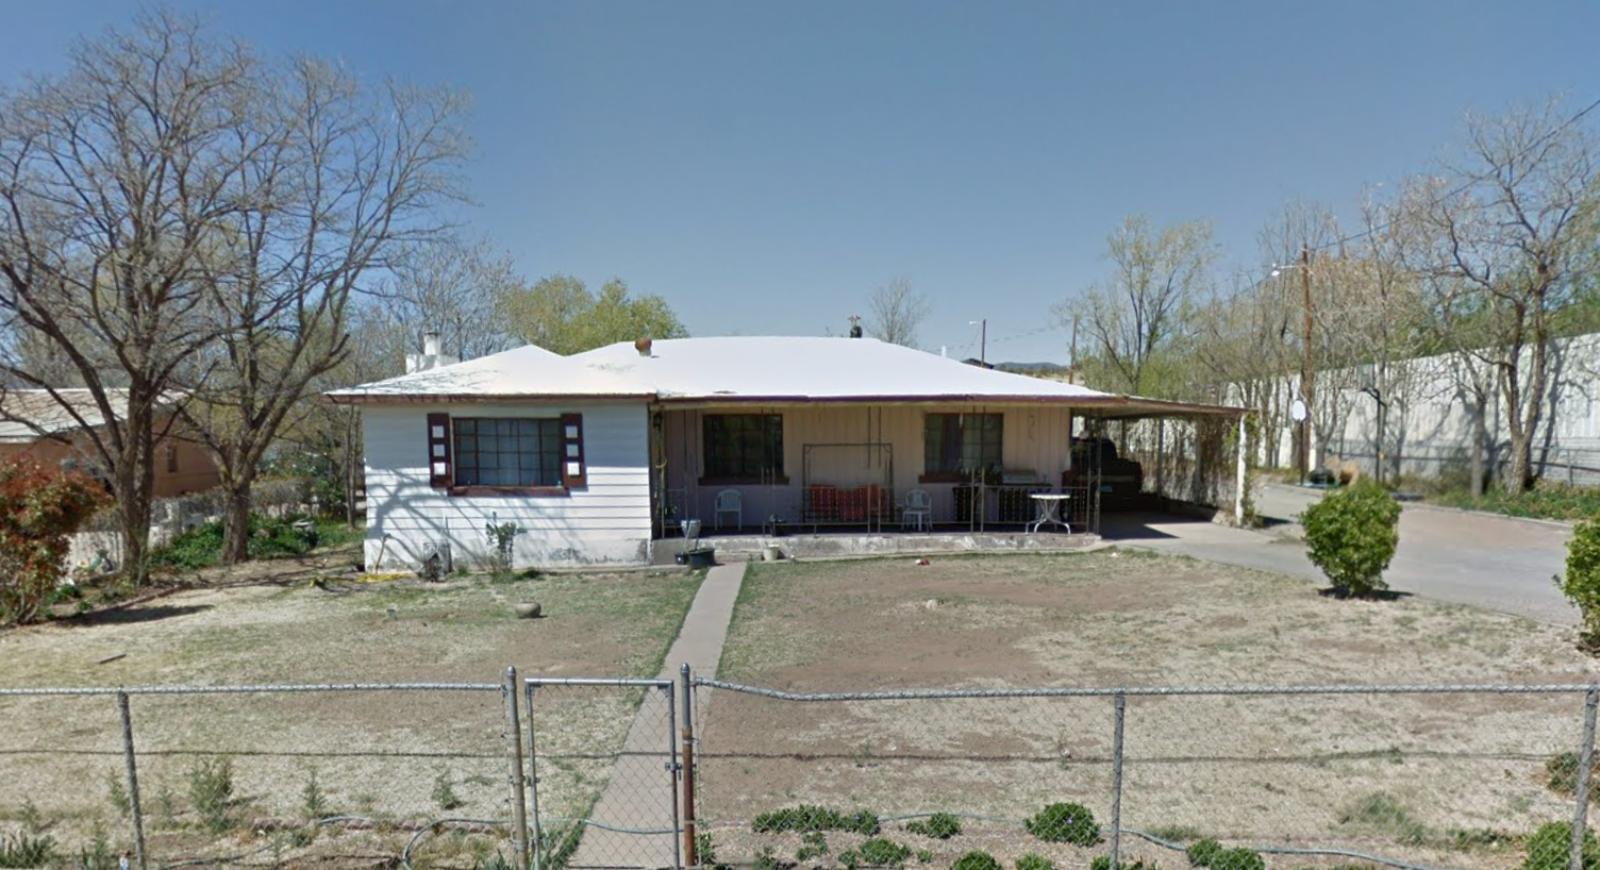
Arenas Valley sits just a few minutes outside of Silver City in Grant County. Though it’s unincorporated, it has become a popular bedroom community for people who work or study in Silver City but prefer a more rural setting. It’s known for peaceful neighborhoods, big skies, and plenty of elbow room. The recent price drops may be more of a correction than a sign of distress. With low property taxes and access to Western New Mexico University and Gila National Forest, Arenas Valley remains an attractive spot for retirees and remote workers. It’s a rural town that offers convenience without crowding or sky-high prices.
12. Truth or Consequences – 12% Home Price Increase Since 2011

- 2010: N/A
- 2011: $138,851
- 2012: $130,781 (-$8,071, -5.81% from previous year)
- 2013: $115,553 (-$15,228, -11.64% from previous year)
- 2014: $113,449 (-$2,104, -1.82% from previous year)
- 2015: $103,087 (-$10,362, -9.13% from previous year)
- 2016: $102,228 (-$859, -0.83% from previous year)
- 2017: $99,980 (-$2,247, -2.2% from previous year)
- 2018: $98,654 (-$1,326, -1.33% from previous year)
- 2019: $102,486 (+$3,832, +3.88% from previous year)
- 2020: N/A
- 2021: $127,986
- 2022: $145,616 (+$17,631, +13.78% from previous year)
- 2023: $149,425 (+$3,808, +2.62% from previous year)
- 2024: $155,755 (+$6,331, +4.24% from previous year)
- 2025: $156,764 (+$1,009, +0.65% from previous year)
Truth or Consequences saw a steep decline in prices from 2011 through 2017, but the market has since rebounded strongly. Home values are up about 12% since 2011 and now average around $156,700. The last few years have brought consistent growth and a clear upward trend.
Truth or Consequences – Hot Springs, Cool Prices
Originally named Hot Springs, this quirky town near Elephant Butte Lake remains one of New Mexico’s most distinctive destinations. Its bathhouses, historic downtown, and affordable housing attract retirees and artists alike. The town has enjoyed something of a renaissance in recent years as out-of-staters look for unique places with low costs and natural charm. The housing market reflects that growing appeal. After years of decline, prices began climbing again around 2018 and have picked up steam since 2021. With its walkable neighborhoods, mountain views, and a tourism trickle that keeps the economy afloat, Truth or Consequences has quietly become one of the state’s most interesting—and accessible—housing markets.
11. Raton – 31.2% Home Price Increase Since 2010
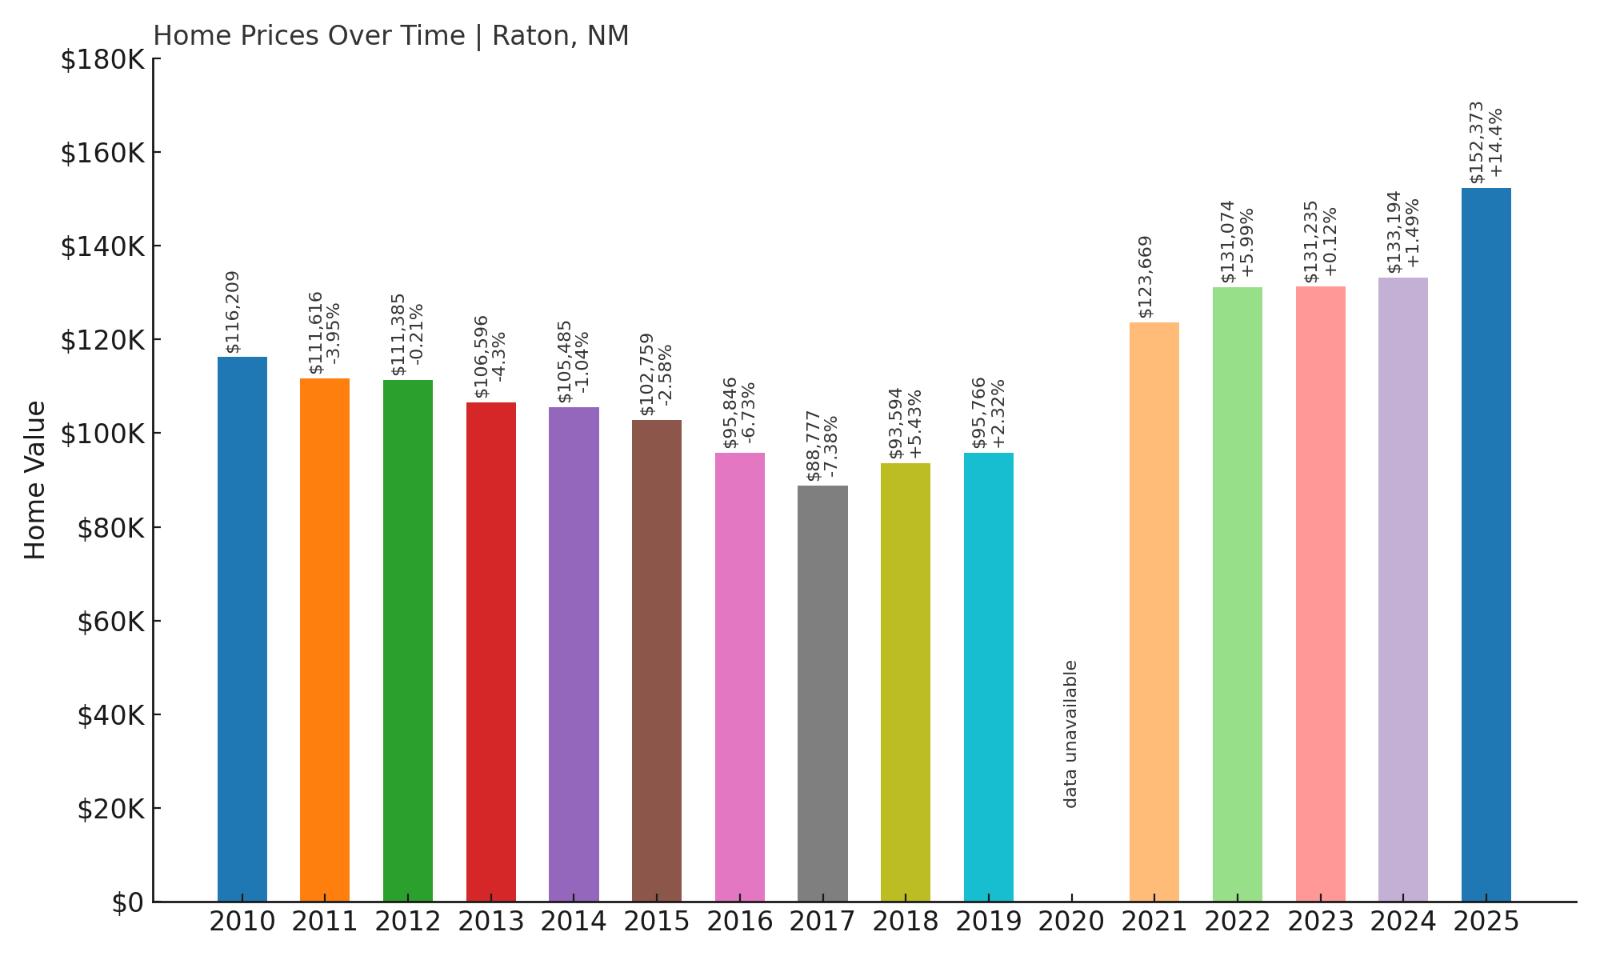
- 2010: $116,209
- 2011: $111,616 (-$4,592, -3.95% from previous year)
- 2012: $111,385 (-$231, -0.21% from previous year)
- 2013: $106,596 (-$4,789, -4.3% from previous year)
- 2014: $105,485 (-$1,111, -1.04% from previous year)
- 2015: $102,759 (-$2,726, -2.58% from previous year)
- 2016: $95,846 (-$6,913, -6.73% from previous year)
- 2017: $88,777 (-$7,069, -7.38% from previous year)
- 2018: $93,594 (+$4,817, +5.43% from previous year)
- 2019: $95,766 (+$2,173, +2.32% from previous year)
- 2020: N/A
- 2021: $123,669
- 2022: $131,074 (+$7,405, +5.99% from previous year)
- 2023: $131,235 (+$161, +0.12% from previous year)
- 2024: $133,194 (+$1,959, +1.49% from previous year)
- 2025: $152,373 (+$19,179, +14.4% from previous year)
Raton’s market endured a long decline from 2010 to 2017 but has staged an impressive recovery. Prices are now over 30% higher than they were 15 years ago, with most gains coming in the last 5 years. Home values in 2025 stand at about $152,000, keeping the town firmly in the affordable range.
Raton – Affordable Mountain Living Near the Colorado Border
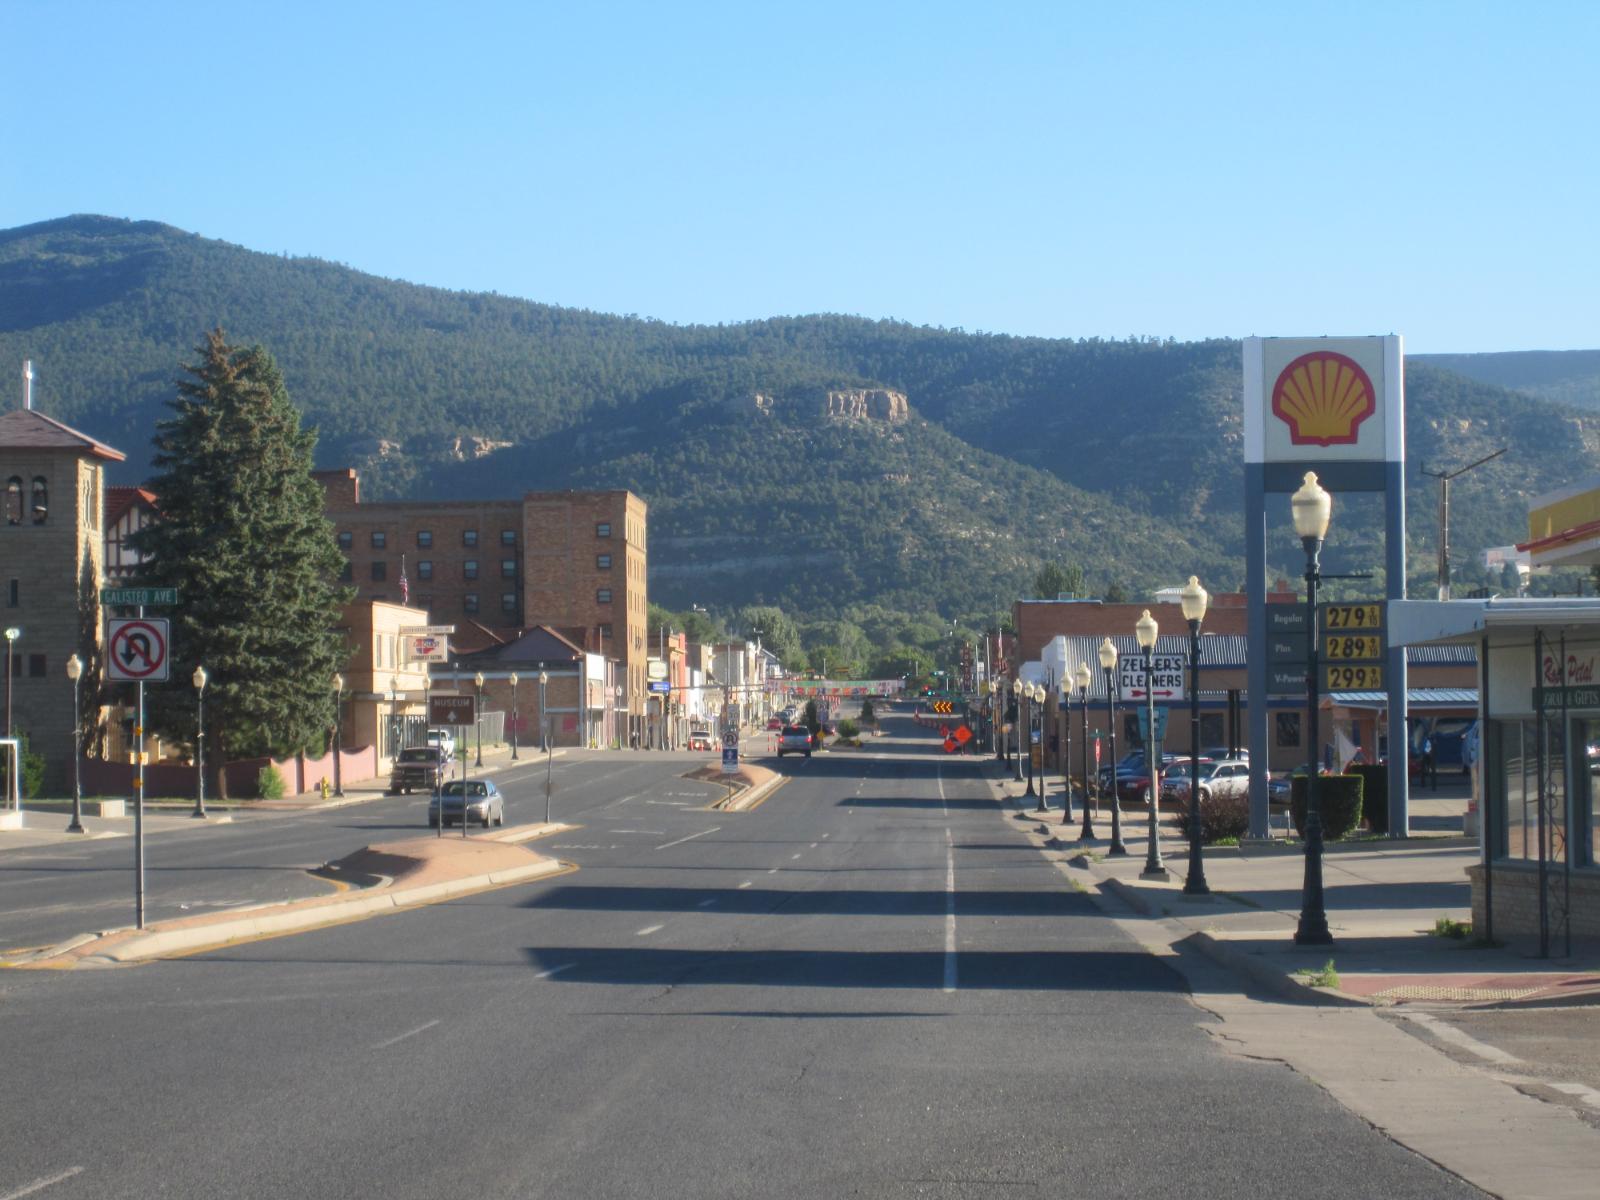
Raton sits in northeastern New Mexico, right off I-25 and just south of the Colorado state line. Surrounded by scenic peaks and mesas, it offers mountain-town charm without the sky-high prices of its northern neighbors. Raton is known for its historic train depot, outdoor recreation, and small-town character. Home prices here stayed depressed for much of the 2010s, but recent growth suggests a turnaround. That may be due to increased demand from Colorado buyers looking for value just across the border. Raton’s affordability, scenic setting, and improving price trends make it an increasingly attractive option for buyers priced out of the Front Range.
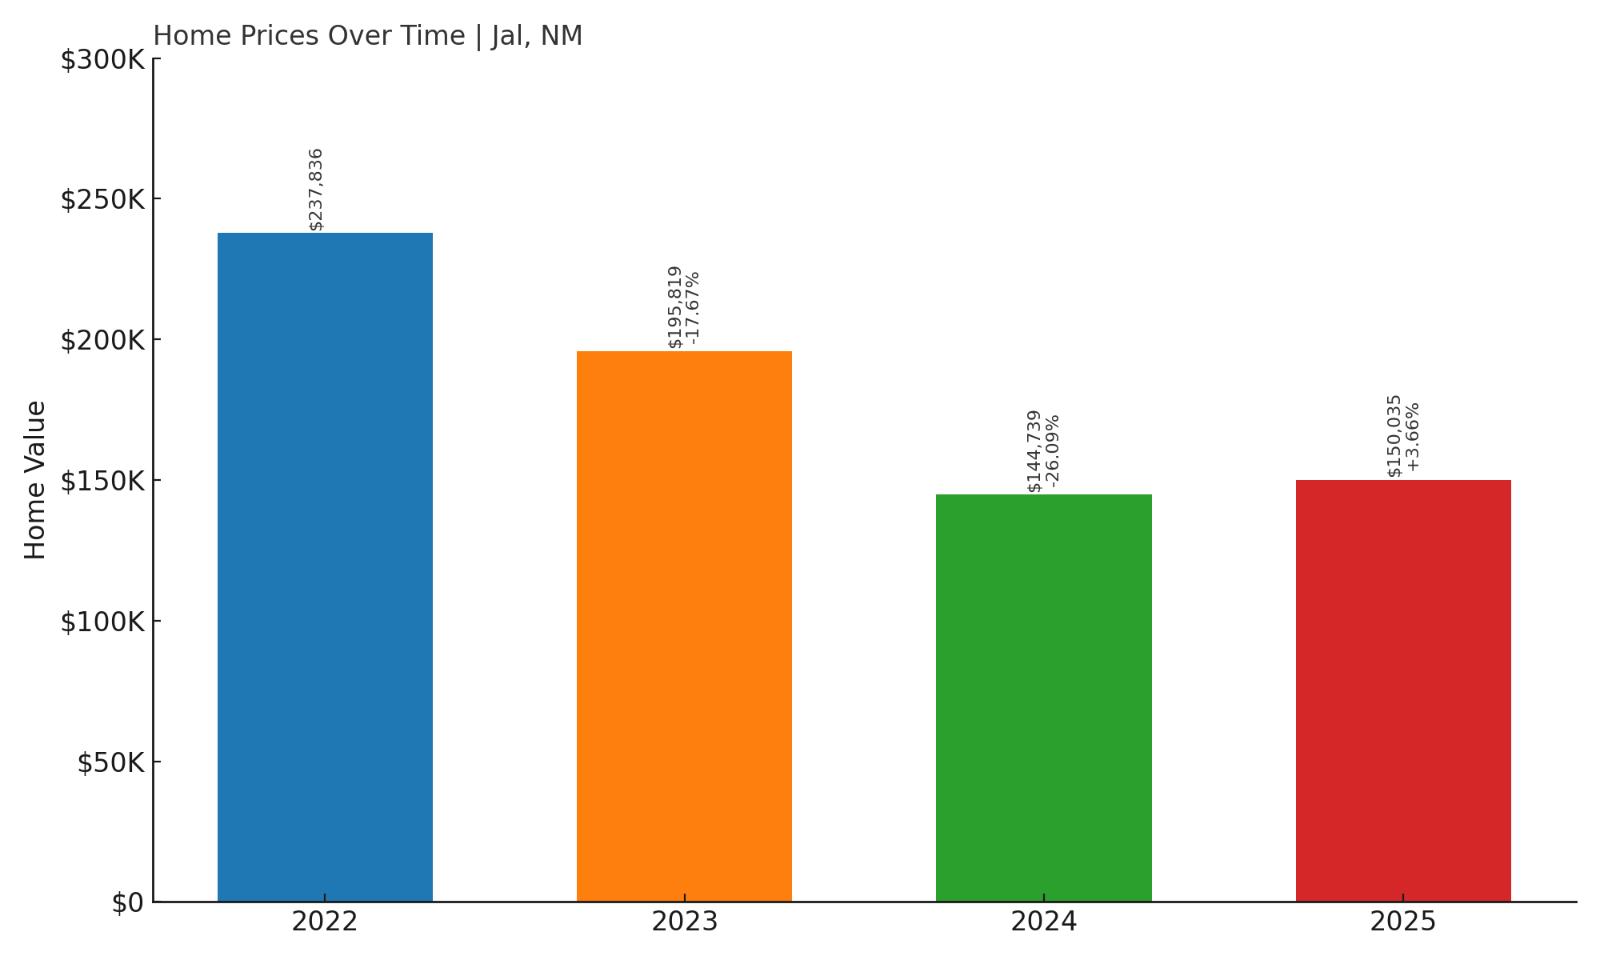
10. Jal – 36.9% Home Price Decrease Since 2022
- 2010: N/A
- 2011: N/A
- 2012: N/A
- 2013: N/A
- 2014: N/A
- 2015: N/A
- 2016: N/A
- 2017: N/A
- 2018: N/A
- 2019: N/A
- 2020: N/A
- 2021: N/A
- 2022: $237,836
- 2023: $195,819 (-$42,017, -17.67% from previous year)
- 2024: $144,739 (-$51,080, -26.09% from previous year)
- 2025: $150,035 (+$5,296, +3.66% from previous year)
Jal has seen a dramatic swing in home prices, falling nearly 37% since its 2022 peak. After a steep decline in both 2023 and 2024, 2025 brings a modest rebound, with prices back up to $150,000. Despite the volatility, Jal remains one of the more affordable towns in southeastern New Mexico, and its recent uptick may hint at stabilization or renewed interest.
Jal – Oil Country Recovery and Price Volatility
Jal is a small but historically significant oil town nestled along the Texas border in Lea County. It’s a place where economic booms and busts are closely tied to the energy sector, and that connection is evident in the recent housing data. When oil prices soared in the early 2020s, so did Jal’s home values, reaching nearly $240,000. But as the energy market cooled and jobs disappeared, prices crashed just as quickly, losing more than $90,000 in value over two years. Today, Jal is in recovery mode. Local infrastructure, including schools and public services, has improved thanks to oil revenues, and some residents are choosing to ride out the economic swings. The town is quiet, remote, and ideal for people working in the oilfields or looking for low-cost housing in a high-earning region. It may not offer the recreational perks of northern New Mexico towns, but Jal’s affordability and potential for sharp rebounds make it a place to watch for bold investors or returning residents.
9. Grants – 50.2% Home Price Increase Since 2016

- 2010: N/A
- 2011: N/A
- 2012: N/A
- 2013: N/A
- 2014: N/A
- 2015: N/A
- 2016: $98,471
- 2017: $86,362 (-$12,109, -12.3% from previous year)
- 2018: $90,110 (+$3,748, +4.34% from previous year)
- 2019: $98,653 (+$8,543, +9.48% from previous year)
- 2020: N/A
- 2021: $117,575
- 2022: $137,081 (+$19,507, +16.59% from previous year)
- 2023: $137,911 (+$830, +0.61% from previous year)
- 2024: $141,381 (+$3,470, +2.52% from previous year)
- 2025: $147,850 (+$6,469, +4.58% from previous year)
Grants has seen impressive price growth over the past decade, particularly since 2016. Despite a dip in 2017, the market recovered and has gained momentum, with values now topping $147,000. These steady gains indicate a growing demand for housing and improved economic conditions, positioning Grants as one of the state’s more stable and affordable options.
Grants – Steady Growth in a Gateway to the Outdoors
Located along historic Route 66, Grants has reinvented itself over the years, moving from a mining-based economy to one supported by tourism, education, and healthcare. The town sits just west of Albuquerque and is surrounded by the scenic beauty of El Malpais National Monument and the Cibola National Forest, making it an appealing home base for outdoor lovers. Its economy is anchored by a regional hospital and corrections facility, providing stable employment to the local population. Grants’ housing market tells a story of resilience. After a temporary dip in 2017, prices climbed steadily through the pandemic era and into 2025. The average home price is still well below national levels, but the consistent growth shows that Grants is on the radar for both local buyers and transplants. Its mix of low cost, regional access, and natural surroundings continue to drive modest but meaningful increases in home values.
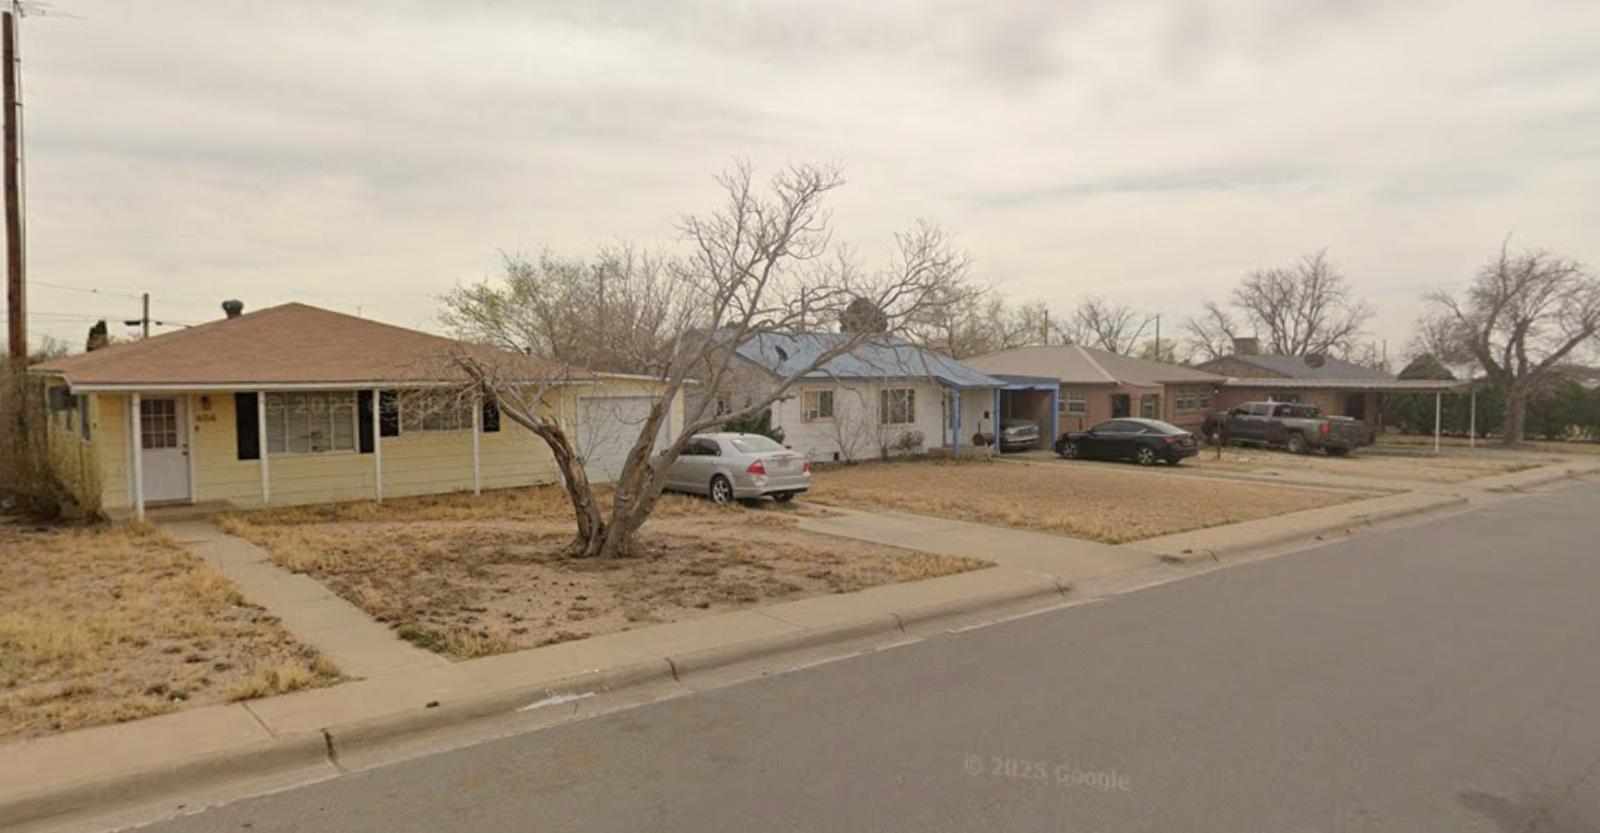
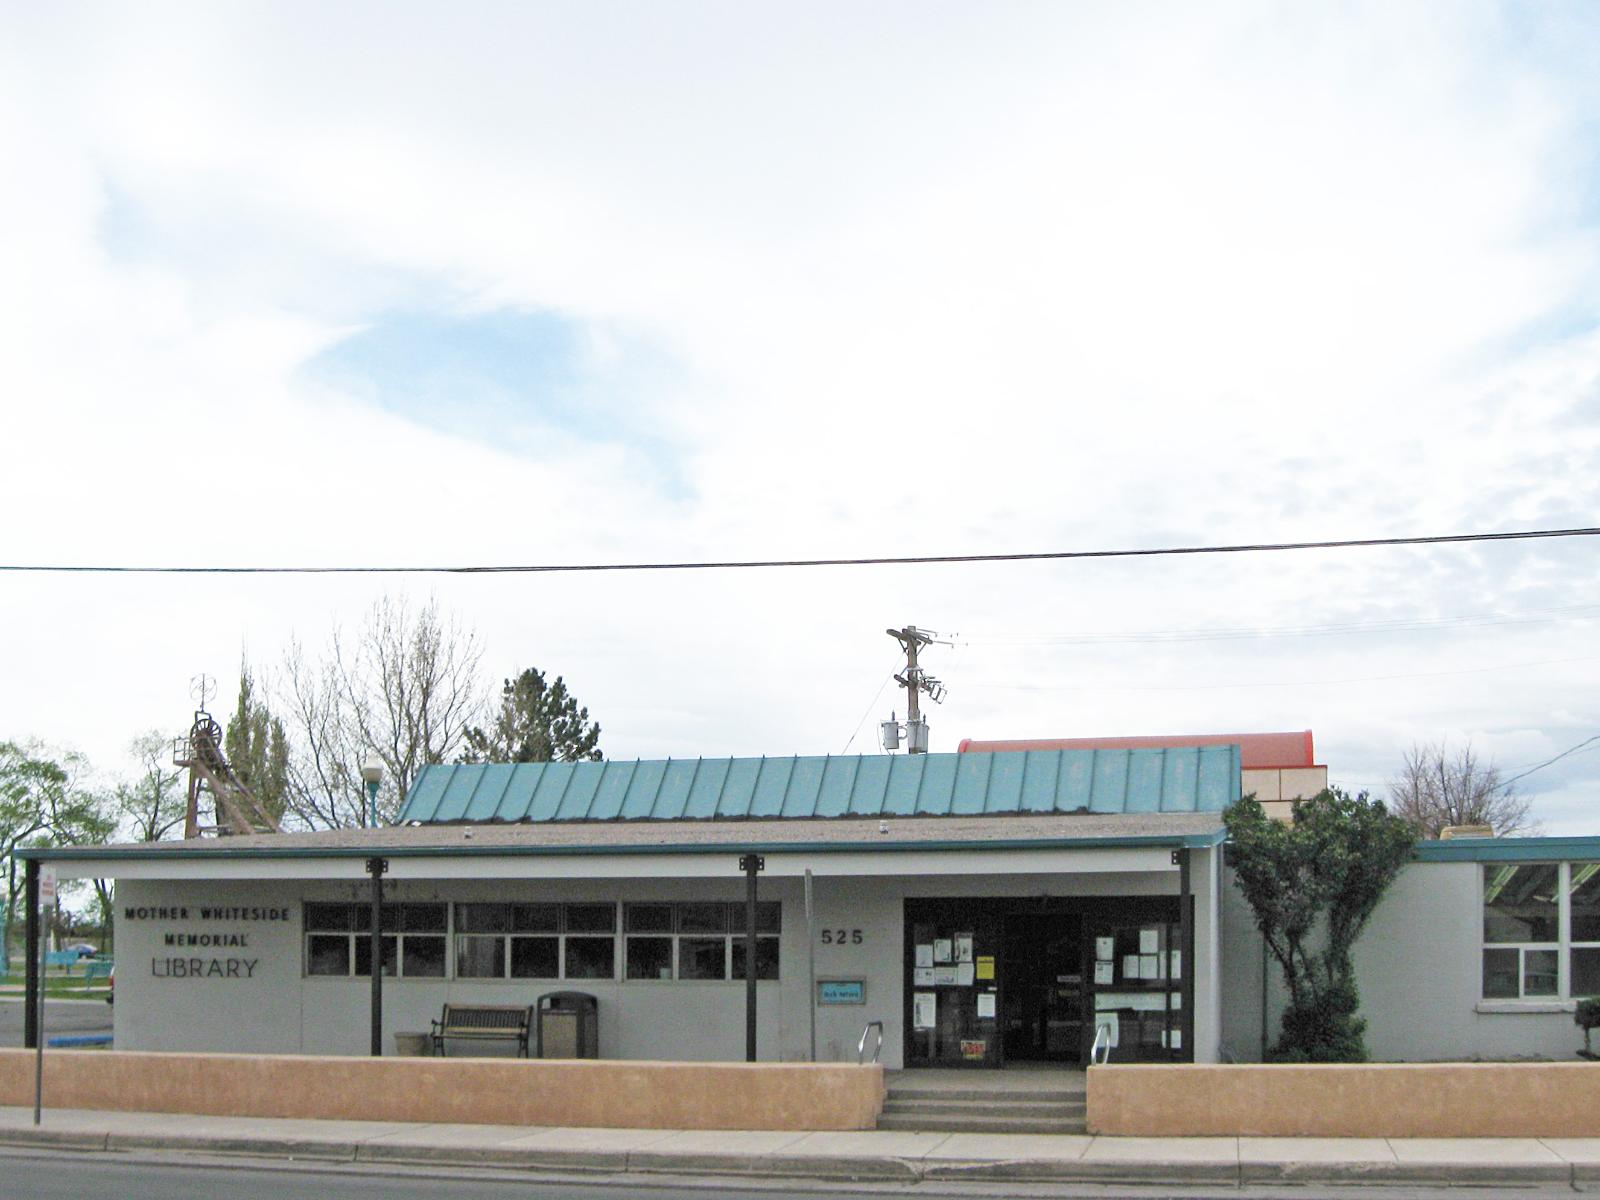
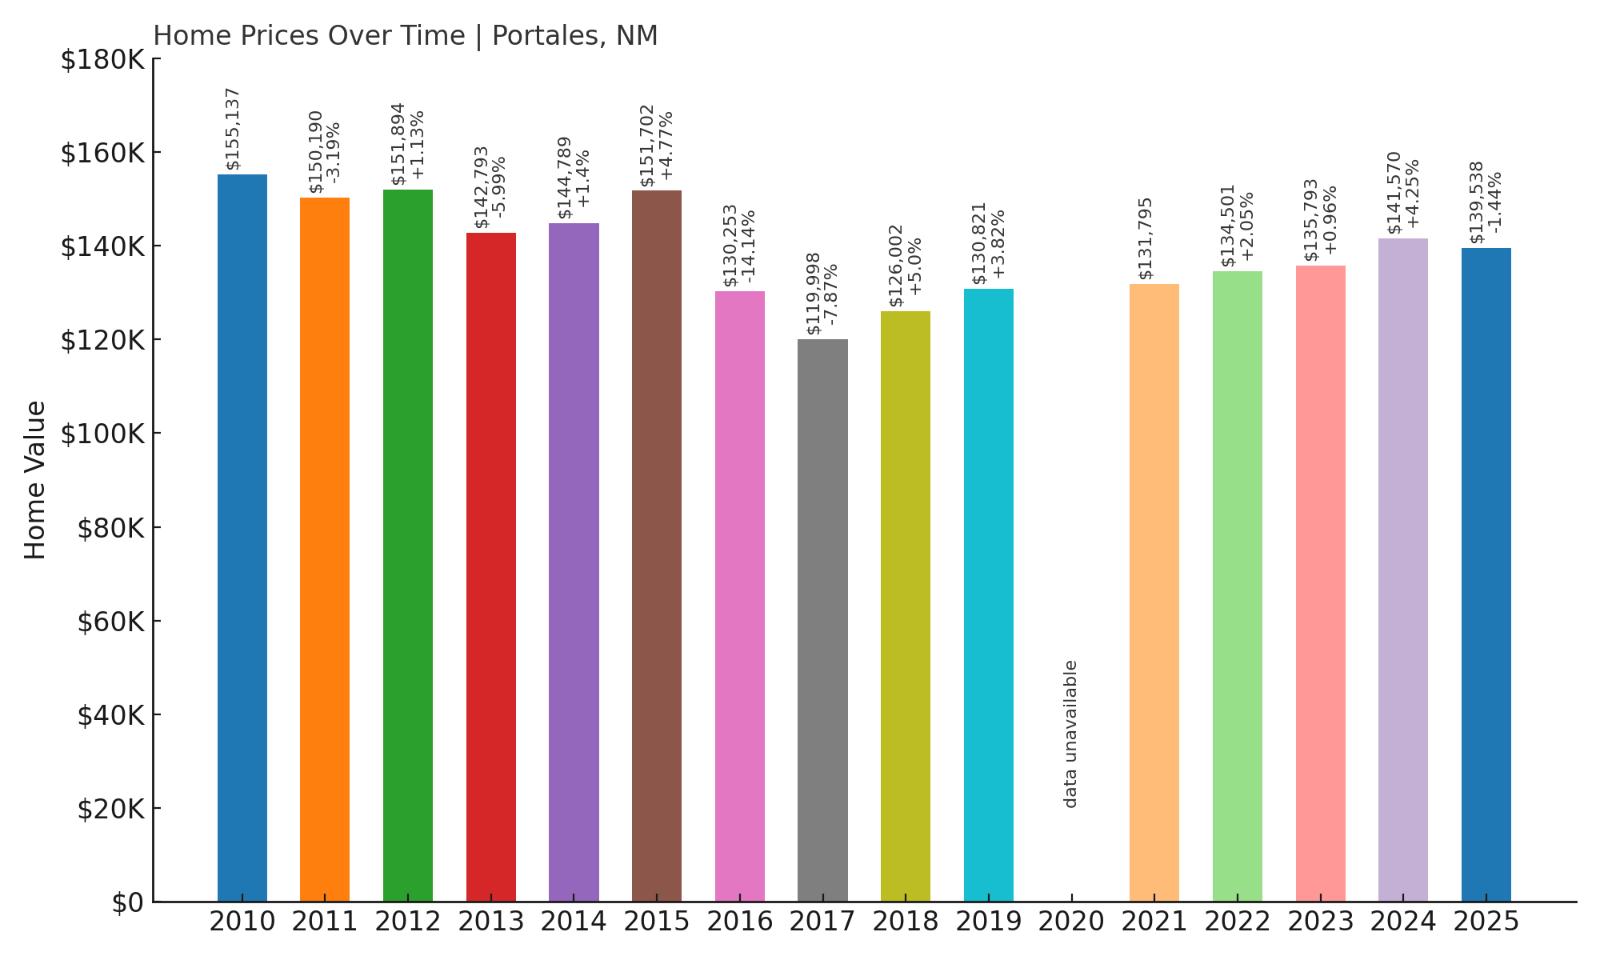
8. Portales – 10% Home Price Decrease Since 2010
🔥 Would you like to save this?
- 2010: $155,137
- 2011: $150,190 (-$4,947, -3.19% from previous year)
- 2012: $151,894 (+$1,704, +1.13% from previous year)
- 2013: $142,793 (-$9,100, -5.99% from previous year)
- 2014: $144,789 (+$1,996, +1.4% from previous year)
- 2015: $151,702 (+$6,913, +4.77% from previous year)
- 2016: $130,253 (-$21,449, -14.14% from previous year)
- 2017: $119,998 (-$10,255, -7.87% from previous year)
- 2018: $126,002 (+$6,004, +5.0% from previous year)
- 2019: $130,821 (+$4,819, +3.82% from previous year)
- 2020: N/A
- 2021: $131,795
- 2022: $134,501 (+$2,707, +2.05% from previous year)
- 2023: $135,793 (+$1,292, +0.96% from previous year)
- 2024: $141,570 (+$5,777, +4.25% from previous year)
- 2025: $139,538 (-$2,032, -1.44% from previous year)
Portales has seen modest ups and downs over the last decade and a half, with its average home price decreasing roughly 10% since 2010. After a deep slump in the mid-2010s, the market showed signs of recovery between 2018 and 2024, though 2025 brings a slight decline. Despite that, values remain steady around $139,500—offering affordability with potential for future growth.
Portales – College Town Prices Without the College-Town Costs
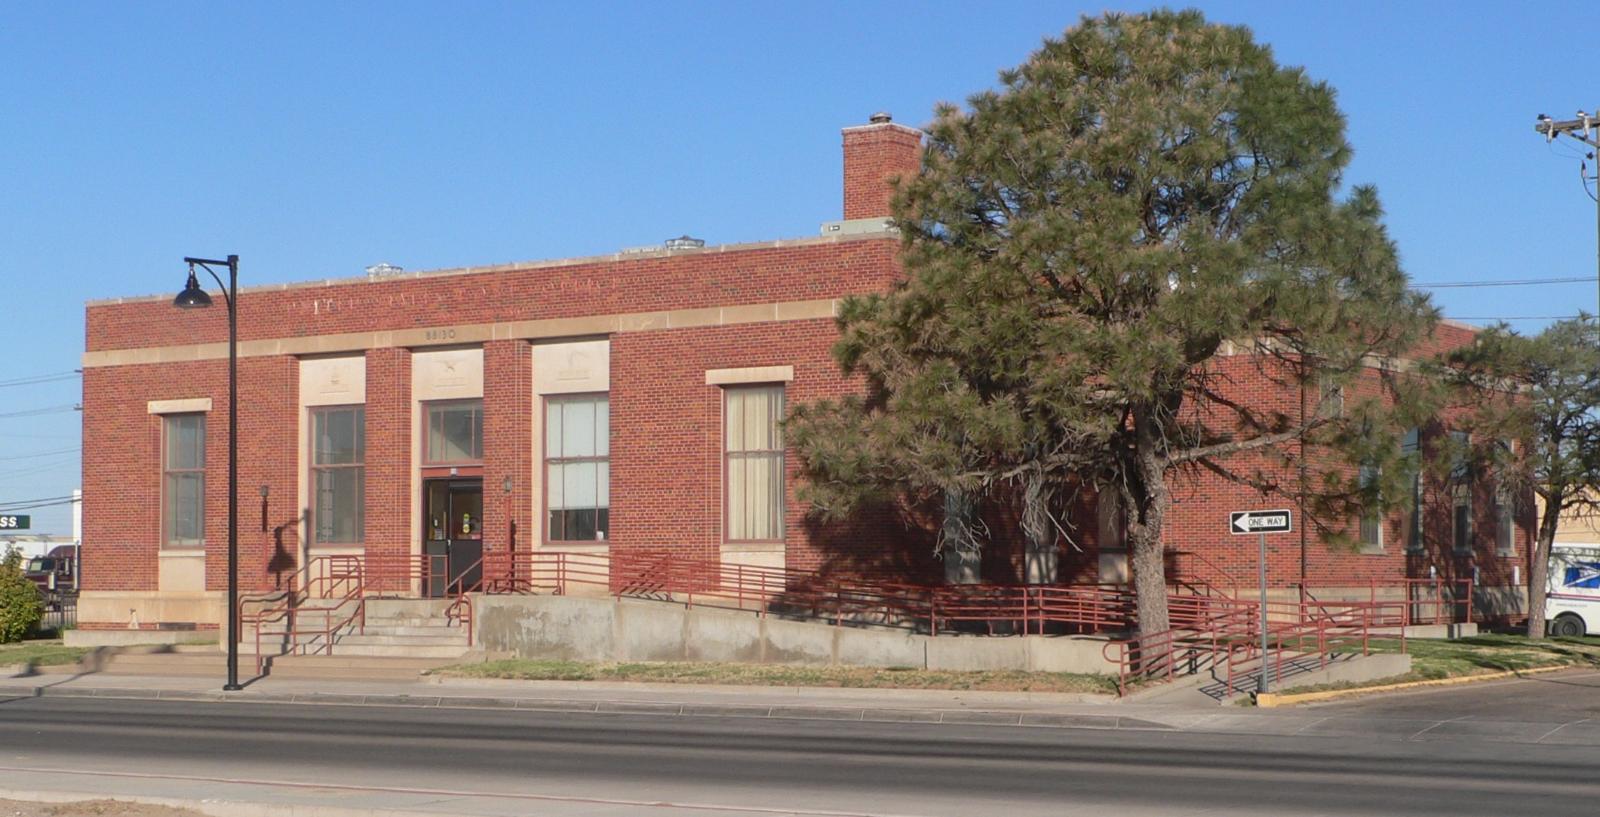
Portales is home to Eastern New Mexico University and balances small-town charm with an active student and academic population. This unique mix contributes to a stable rental market and a relatively diverse local economy. While agriculture still plays a major role—particularly dairy and peanut farming—the university and supporting services help smooth out market volatility that plagues some nearby towns. The town offers excellent value for buyers, with access to amenities like schools, parks, and cultural activities without the cost spikes often seen in other college towns. The recent downturn in prices could reflect market normalization rather than long-term decline. For buyers looking for affordability in an active, youthful community, Portales is a smart option with room to grow.
7. Dexter – 9% Home Price Increase Since 2018

- 2010: N/A
- 2011: N/A
- 2012: N/A
- 2013: N/A
- 2014: N/A
- 2015: N/A
- 2016: N/A
- 2017: N/A
- 2018: $125,619
- 2019: $141,156 (+$15,537, +12.37% from previous year)
- 2020: N/A
- 2021: $175,269
- 2022: $176,730 (+$1,461, +0.83% from previous year)
- 2023: $156,739 (-$19,991, -11.31% from previous year)
- 2024: $129,331 (-$27,408, -17.49% from previous year)
- 2025: $137,129 (+$7,798, +6.03% from previous year)
Dexter’s home prices surged from 2018 through 2022, then underwent a sharp correction. After falling steeply for two years, values are now back on the rise, ending 2025 at $137,129. That marks an overall increase of about 9% since 2018—impressive for a small town still recovering from recent volatility.
Dexter – A Rural Retreat on the Mend
Dexter is a compact agricultural town just south of Roswell, nestled along the Pecos River in Chaves County. It’s home to a tight-knit community and a quiet lifestyle that appeals to both families and retirees. With local schools, a handful of shops, and plenty of open space, Dexter offers a rural lifestyle without being completely isolated. Many residents commute to Roswell for work while enjoying Dexter’s slower pace and lower housing costs. The housing data reflects that push-pull dynamic. Rapid appreciation in the early 2020s may have priced out some buyers, leading to the recent correction. However, the latest uptick in 2025 suggests renewed confidence in the market. For those seeking low-cost property near a mid-sized city, Dexter is worth a closer look—particularly now that prices seem to be stabilizing again.
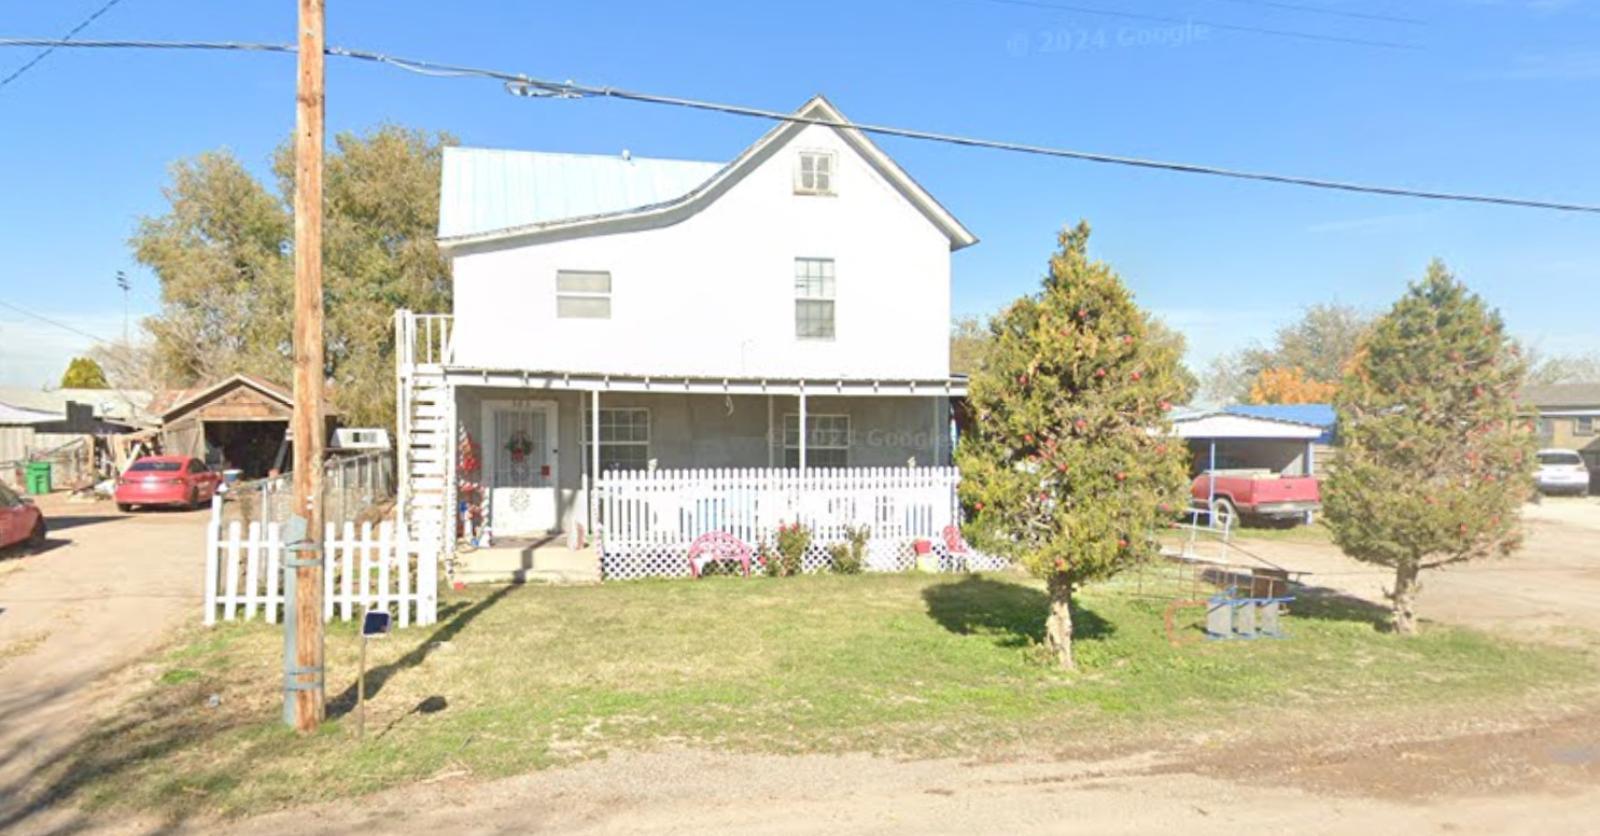
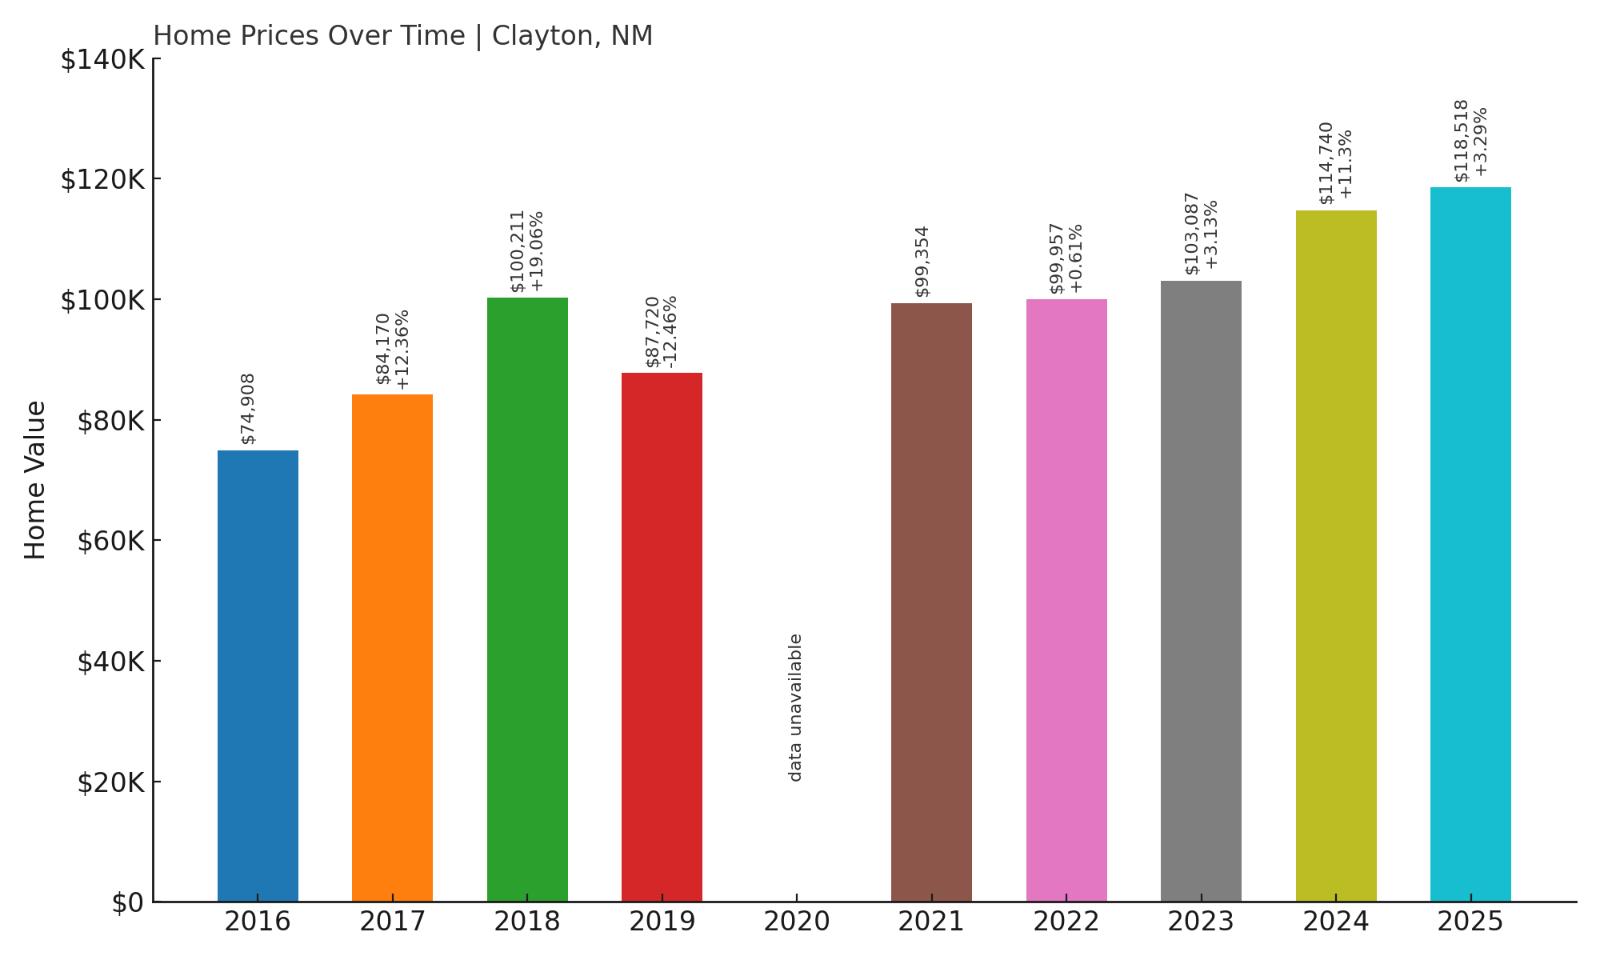
6. Clayton – 58.2% Home Price Increase Since 2016
- 2010: N/A
- 2011: N/A
- 2012: N/A
- 2013: N/A
- 2014: N/A
- 2015: N/A
- 2016: $74,908
- 2017: $84,170 (+$9,262, +12.36% from previous year)
- 2018: $100,211 (+$16,041, +19.06% from previous year)
- 2019: $87,720 (-$12,490, -12.46% from previous year)
- 2020: N/A
- 2021: $99,354
- 2022: $99,957 (+$603, +0.61% from previous year)
- 2023: $103,087 (+$3,130, +3.13% from previous year)
- 2024: $114,740 (+$11,653, +11.3% from previous year)
- 2025: $118,518 (+$3,778, +3.29% from previous year)
Clayton’s home prices have increased by more than 58% since 2016, driven largely by strong gains in 2017, 2018, and again in 2024. Despite a brief downturn in 2019, the market has shown steady growth overall. With current values around $118,500, Clayton remains one of the more affordable markets in northeastern New Mexico with a strong upward trend.
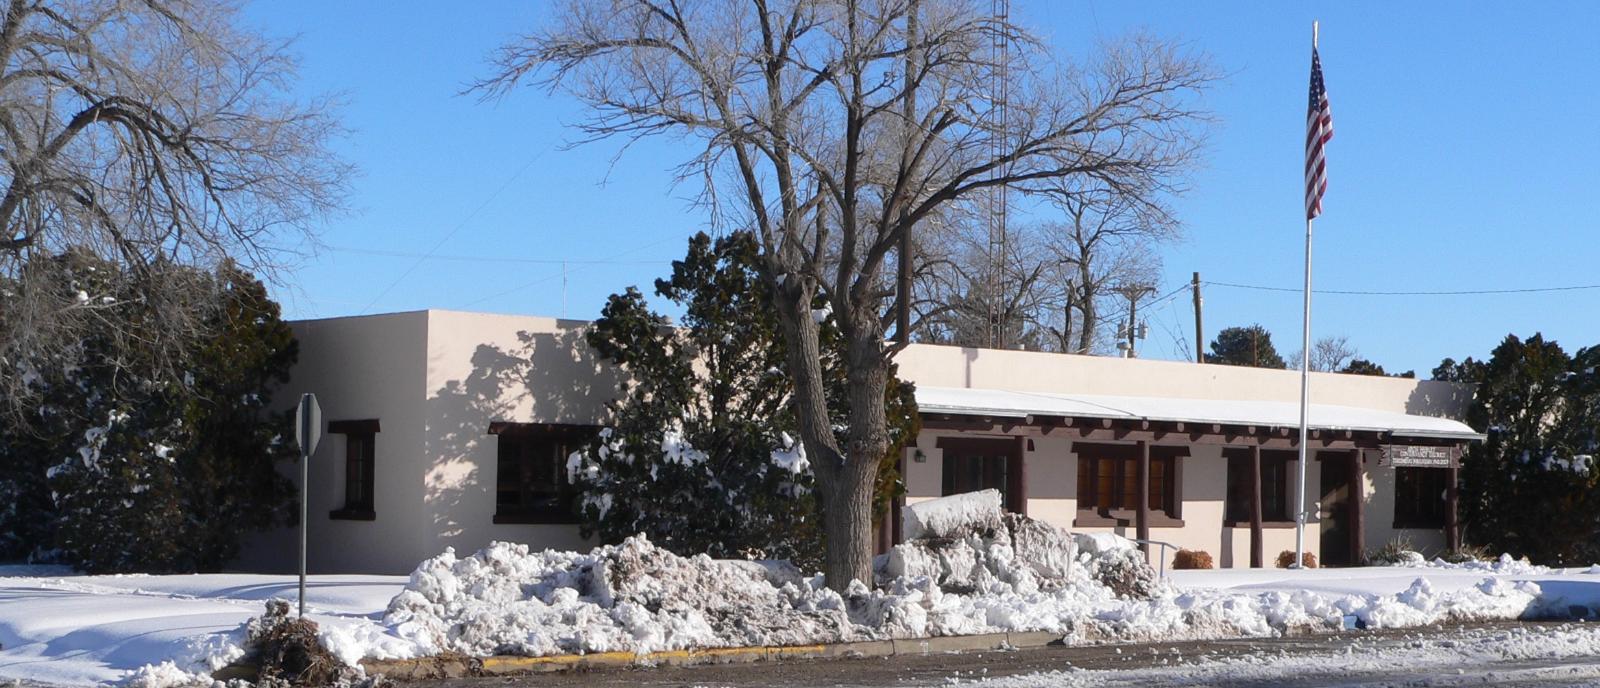
Clayton – Gateway Town with a Growing Market
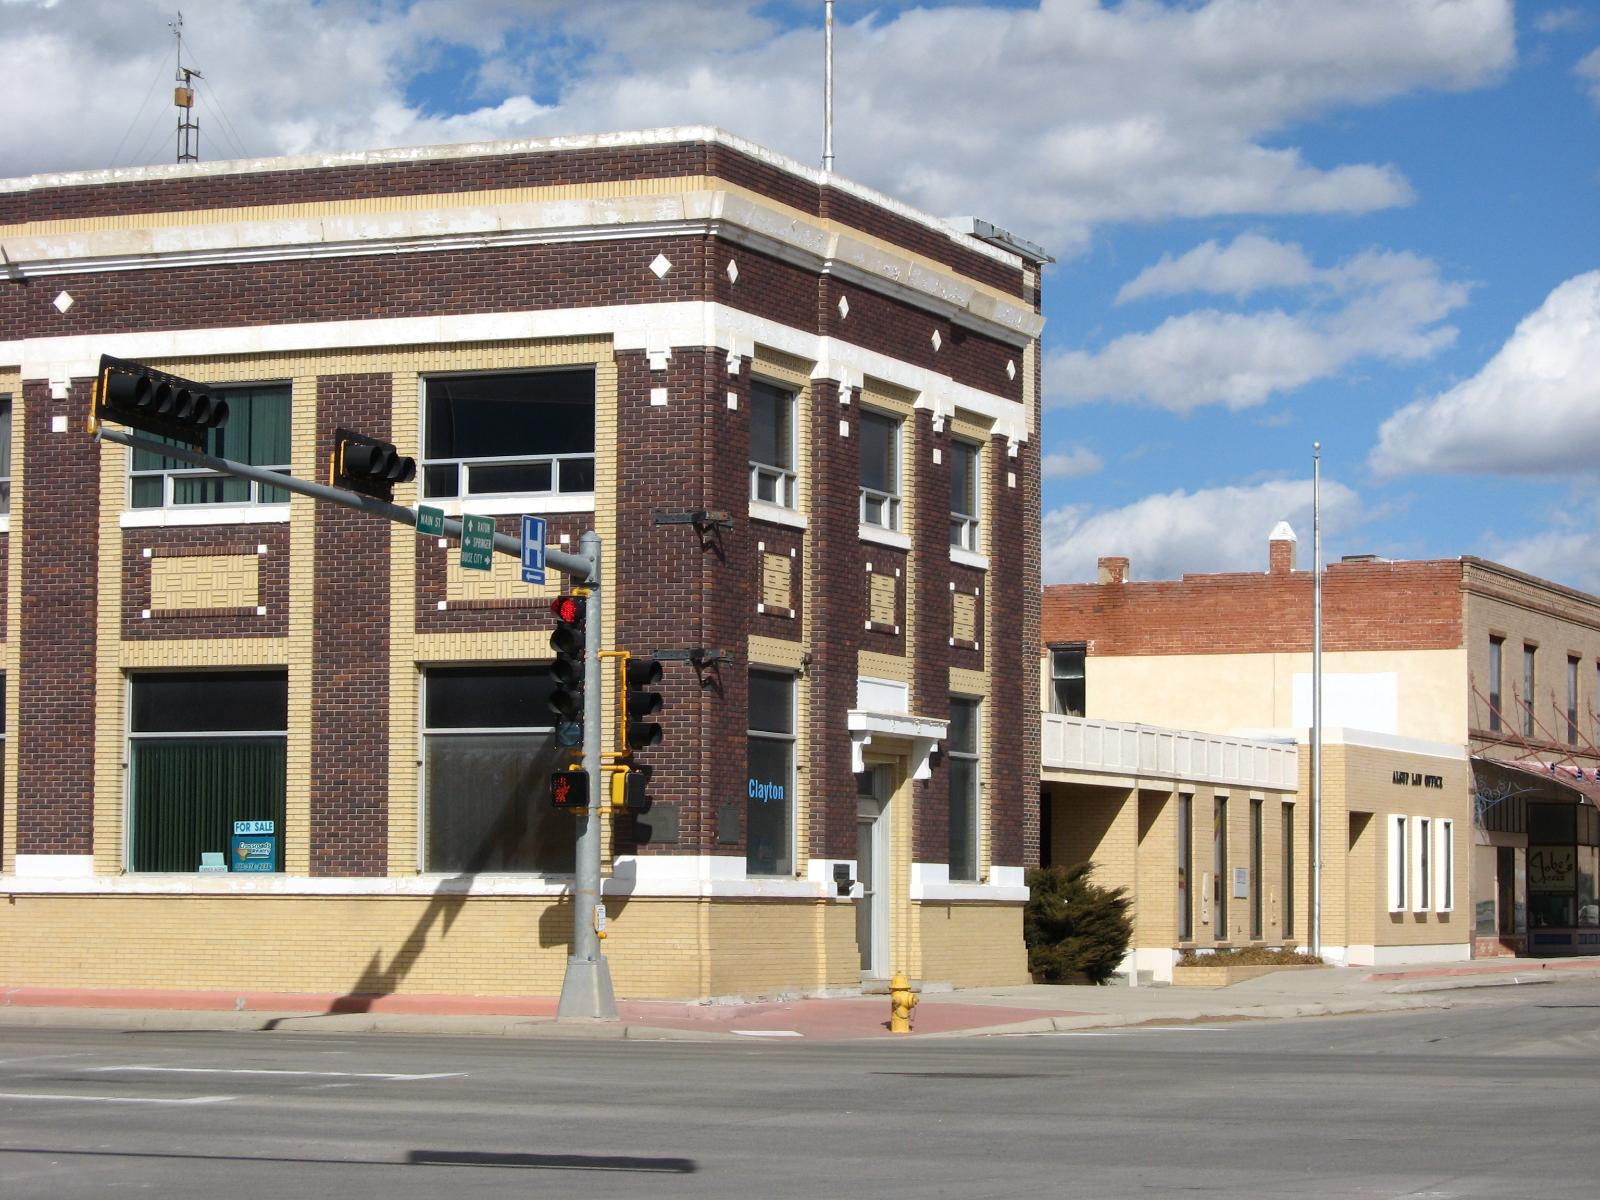
Clayton sits in the far northeastern corner of New Mexico, near the Oklahoma and Texas borders. Its location at the junction of U.S. Highways 64 and 87 makes it a regional waypoint for travelers and truckers alike. The town has a mix of history, agriculture, and tourism, with attractions like Clayton Lake State Park and Capulin Volcano National Monument just a short drive away. It serves as the county seat of Union County and provides essential services to a wide rural region. The local housing market has become increasingly appealing due to its affordability and gradual price gains. While not flashy or fast-growing, Clayton offers a solid value proposition for those looking to escape big-city prices while maintaining a foot in small-town community life. With housing still under $120K, the upward trend suggests room for more appreciation as interest grows in rural living and remote work.
5. Hurley – 42.4% Home Price Increase Since 2016

- 2010: N/A
- 2011: N/A
- 2012: N/A
- 2013: N/A
- 2014: N/A
- 2015: N/A
- 2016: $74,736
- 2017: $67,004 (-$7,733, -10.35% from previous year)
- 2018: $71,913 (+$4,909, +7.33% from previous year)
- 2019: $74,170 (+$2,258, +3.14% from previous year)
- 2020: N/A
- 2021: $87,224
- 2022: $102,156 (+$14,932, +17.12% from previous year)
- 2023: $114,073 (+$11,917, +11.67% from previous year)
- 2024: $116,633 (+$2,560, +2.24% from previous year)
- 2025: $106,500 (-$10,134, -8.69% from previous year)
Hurley has seen its home values grow over 42% since 2016, despite a notable drop in 2025. The town enjoyed strong appreciation from 2021 through 2023, gaining momentum during a broader statewide upswing. Even with the recent decline, current prices near $106,500 keep it among the most affordable towns in New Mexico—and still far above where it was just a few years ago.
Hurley – Mining Roots and Modern Affordability
Hurley is a historic mining town in Grant County, closely tied to the copper industry that once dominated southwestern New Mexico. While its mining days have slowed, the town remains a modest and quiet community not far from Silver City. Its housing stock consists mainly of smaller, older homes, many originally built for workers. These homes are increasingly seen as affordable starter properties or rentals. The surge in prices through 2023 may have been driven by spillover from Silver City or renewed regional interest. Still, 2025’s downturn suggests that Hurley is sensitive to local employment shifts and broader market corrections. Despite the volatility, Hurley’s long-term affordability and historic charm make it a candidate for low-cost living in a scenic, high-desert setting—particularly for buyers who value space and simplicity over urban amenities.
4. Bayard – 89.2% Home Price Increase Since 2016

- 2010: N/A
- 2011: N/A
- 2012: N/A
- 2013: N/A
- 2014: N/A
- 2015: N/A
- 2016: $53,326
- 2017: $60,856 (+$7,530, +14.12% from previous year)
- 2018: $68,420 (+$7,564, +12.43% from previous year)
- 2019: $77,099 (+$8,679, +12.68% from previous year)
- 2020: N/A
- 2021: $95,103
- 2022: $107,512 (+$12,409, +13.05% from previous year)
- 2023: $117,732 (+$10,220, +9.51% from previous year)
- 2024: $110,253 (-$7,480, -6.35% from previous year)
- 2025: $100,907 (-$9,345, -8.48% from previous year)
Bayard’s home prices have soared nearly 90% since 2016, making it one of the fastest-appreciating markets on this list. Even with back-to-back declines in 2024 and 2025, the town remains significantly ahead of where it started. Average values now hover around $100,900, solidly within reach for budget-conscious buyers.
Bayard – Big Growth in a Small Mining Town
🔥 Would you like to save this?
Bayard is located in the Mimbres Valley, not far from Hurley and Silver City, and shares a similar copper mining legacy. The town is small but lively, with a population under 2,500 and access to basic amenities, schools, and healthcare. Its location near the Gila National Forest also makes it attractive for outdoor lovers seeking affordability and open space. The sharp rise in home values may be tied to interest from both retirees and buyers priced out of larger markets. Bayard’s compact size and community-oriented feel make it attractive for those seeking simplicity without isolation. While prices have cooled in the last two years, the town’s long-term trajectory suggests resilience, especially if regional economic trends continue improving. Bayard offers both historical roots and fresh potential—at a price that still beats most of the state.
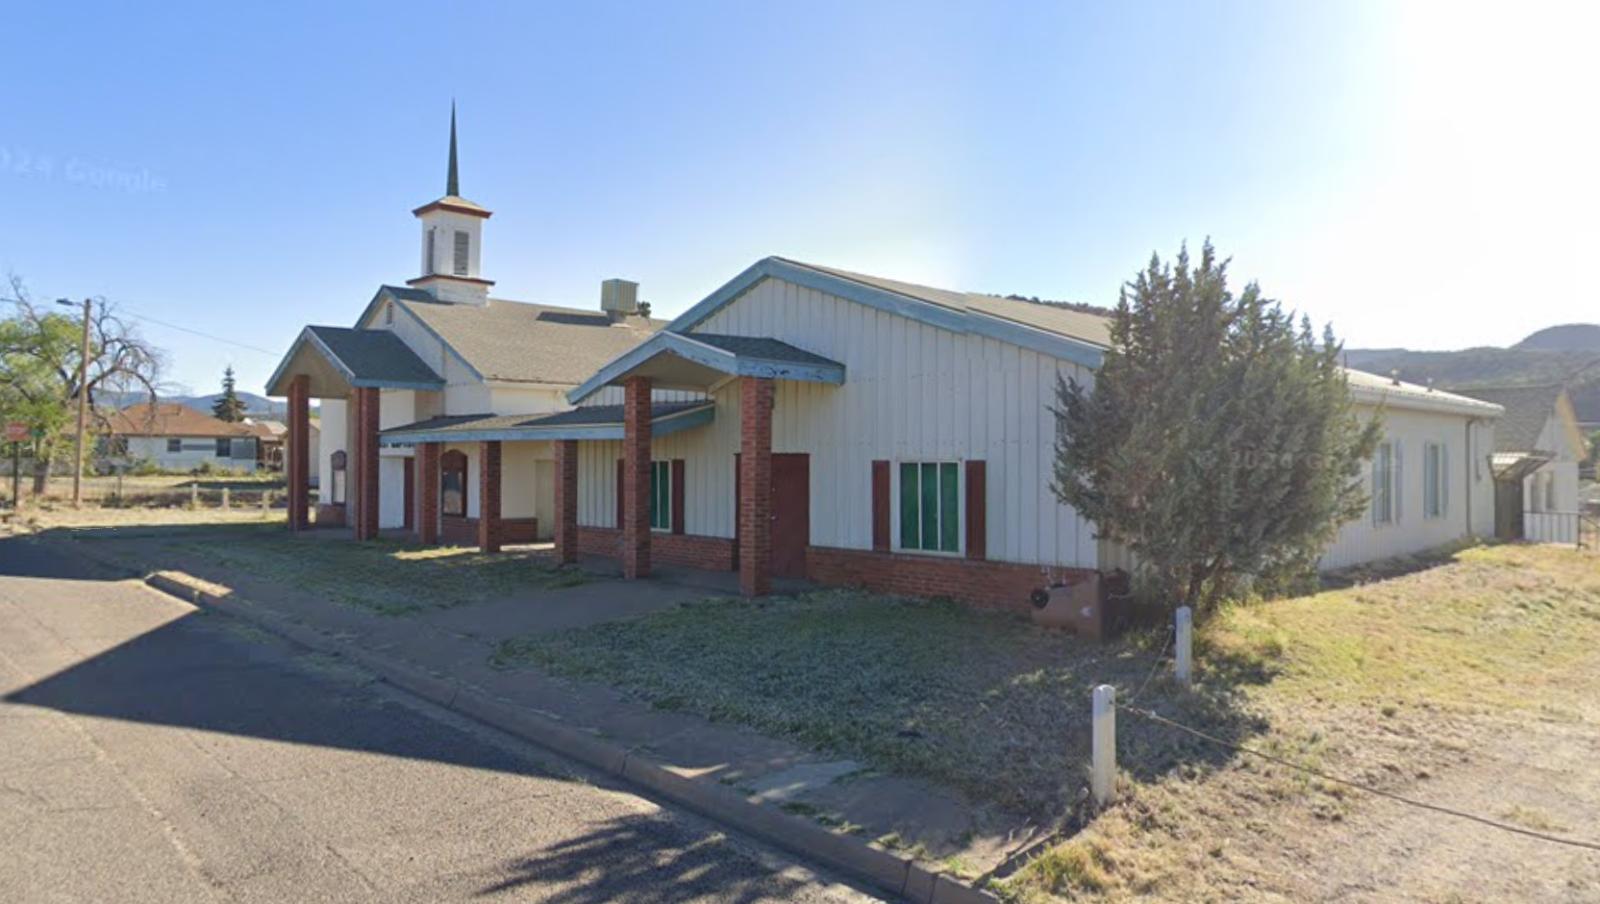
3. Fort Sumner – 16.5% Home Price Decrease Since 2022
- 2010: N/A
- 2011: N/A
- 2012: N/A
- 2013: N/A
- 2014: N/A
- 2015: N/A
- 2016: N/A
- 2017: N/A
- 2018: N/A
- 2019: N/A
- 2020: N/A
- 2021: N/A
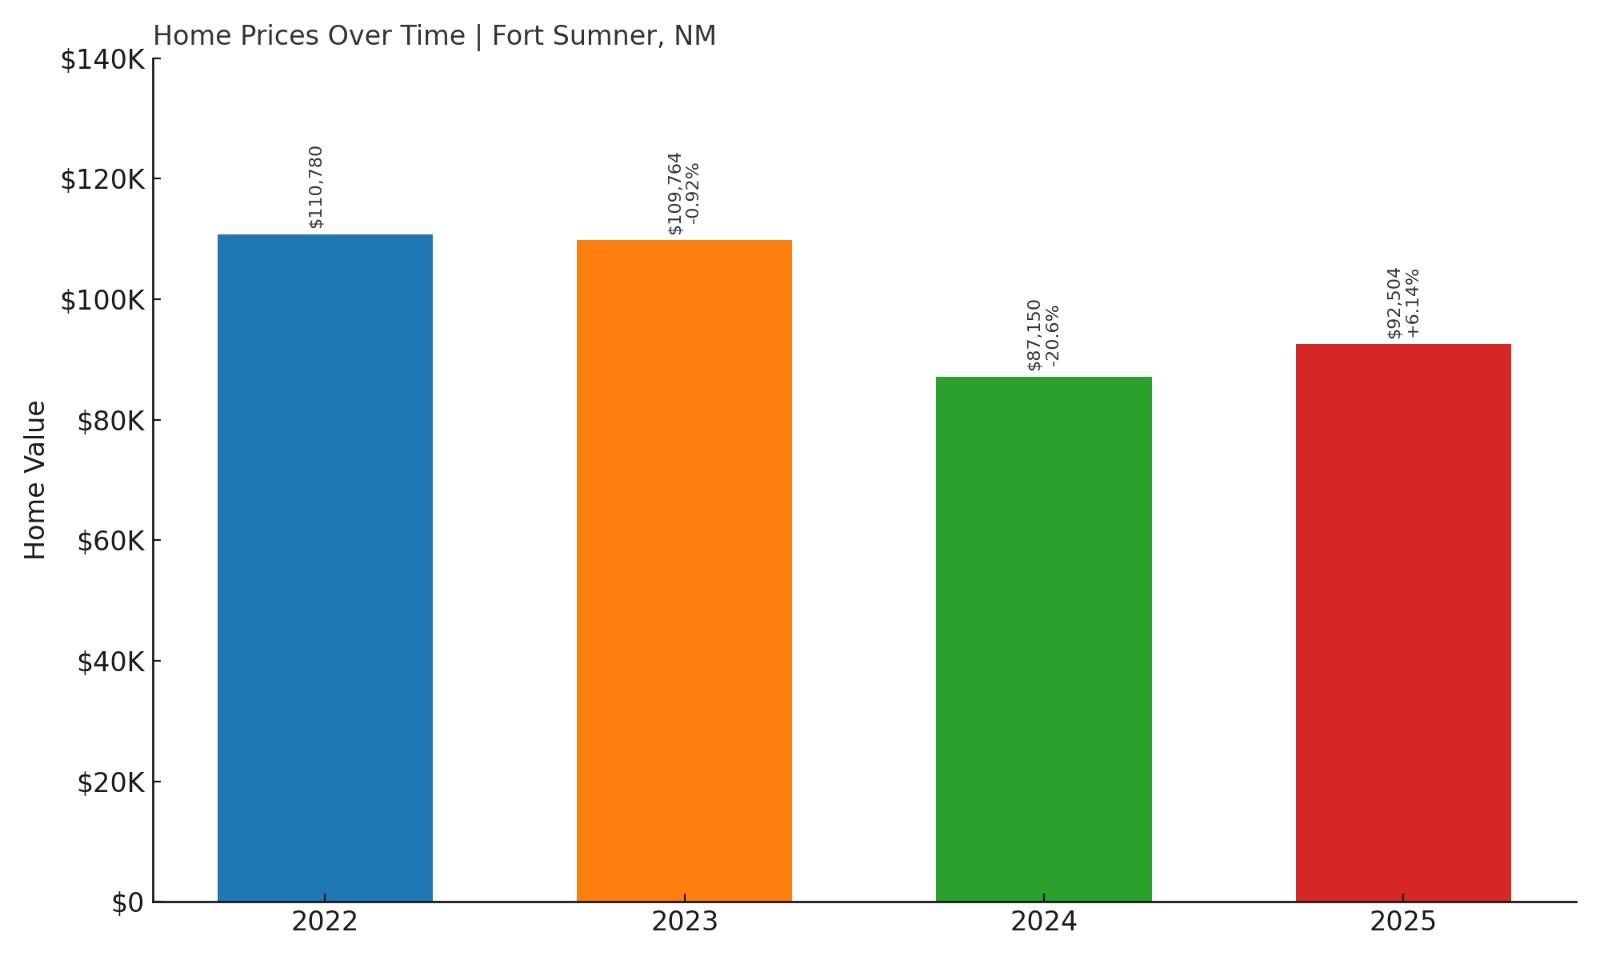
- 2022: $110,780
- 2023: $109,764 (-$1,016, -0.92% from previous year)
- 2024: $87,150 (-$22,614, -20.6% from previous year)
- 2025: $92,504 (+$5,354, +6.14% from previous year)
Fort Sumner’s housing market has taken a hit since 2022, with prices falling over 16% by 2025. After a sharp correction in 2024, the town has seen a small rebound, suggesting the market may be regaining its footing. At under $93,000, Fort Sumner remains one of the most affordable places in the entire state.
Fort Sumner – Historic Landmark Town with Low Housing Costs
Best known as the final resting place of Billy the Kid, Fort Sumner blends Old West history with the realities of rural New Mexico life. Located in De Baca County, the town serves as a local center for agriculture and historical tourism. Its modest population and small-town setting give it a quiet, tight-knit feel, far from the bustle of larger cities. The sharp decline in home values in 2024 may have stemmed from local economic shifts or cooling demand, but the bounce-back in 2025 hints that the market may be bottoming out. While limited amenities could be a drawback for some buyers, Fort Sumner’s affordability and historical charm keep it on the radar for retirees and history enthusiasts alike. It’s a town where the cost of living is low, and the connection to New Mexico’s heritage runs deep.
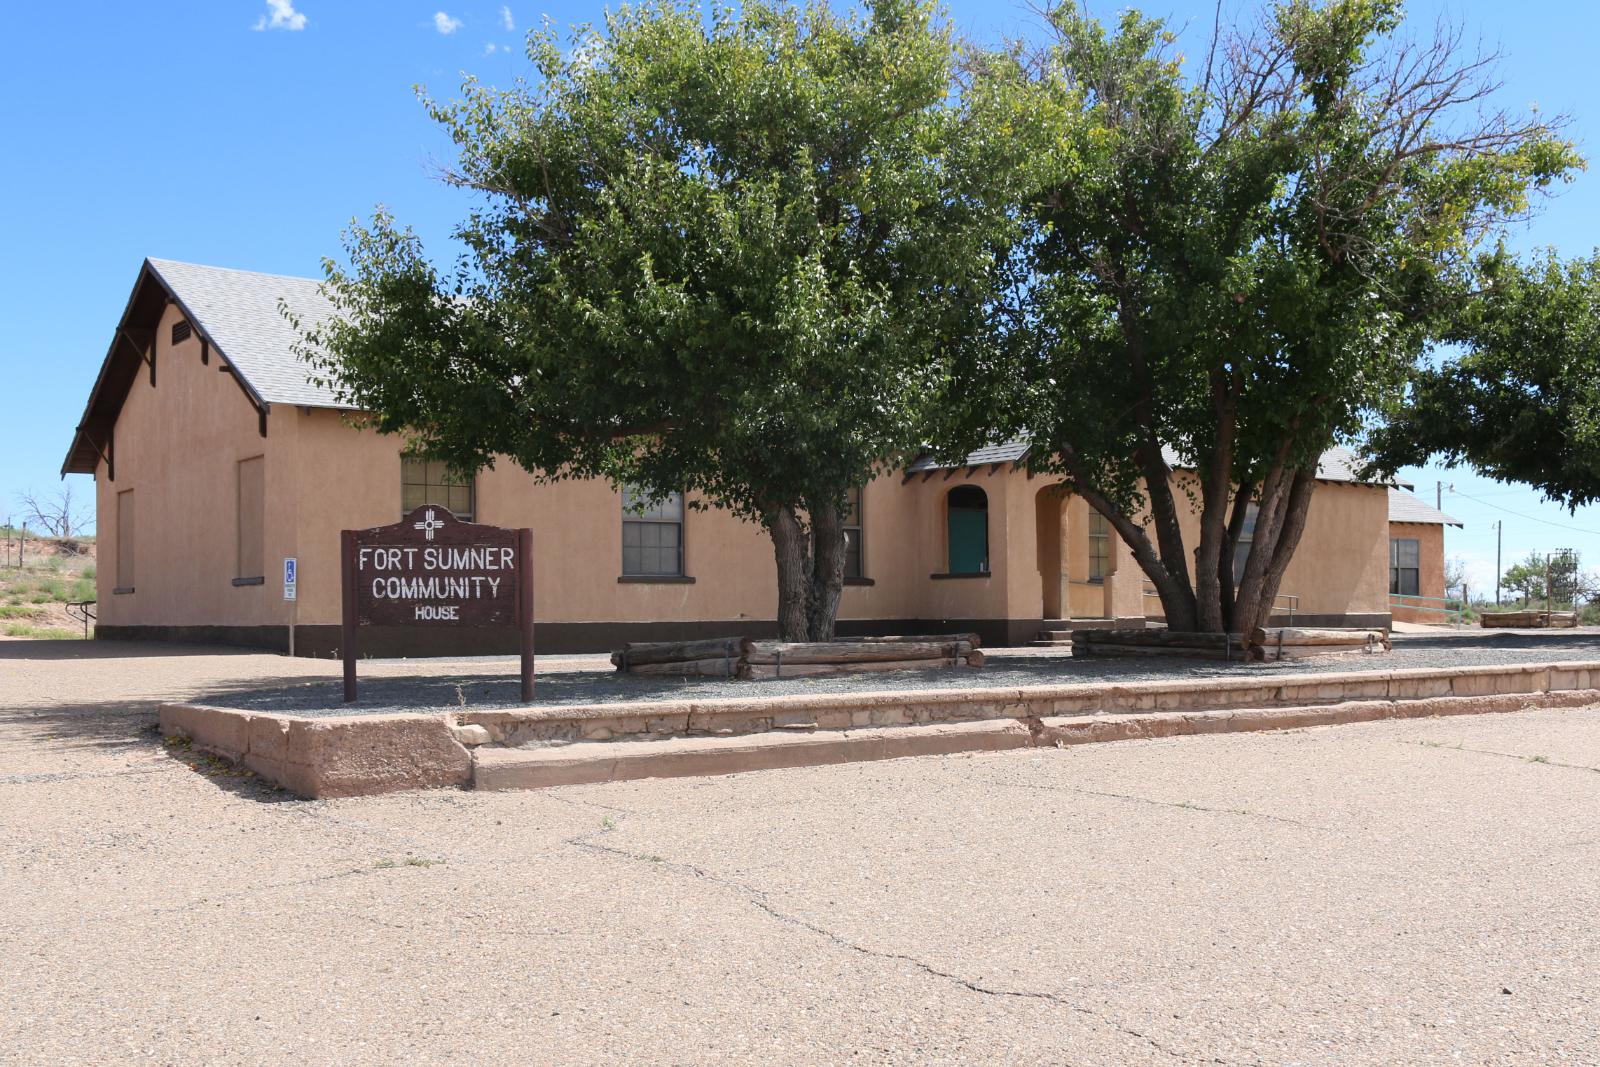
2. Santa Clara – 17.4% Home Price Decrease Since 2022
- 2010: N/A
- 2011: N/A
- 2012: N/A
- 2013: N/A
- 2014: N/A
- 2015: N/A
- 2016: N/A
- 2017: N/A
- 2018: N/A
- 2019: N/A
- 2020: N/A
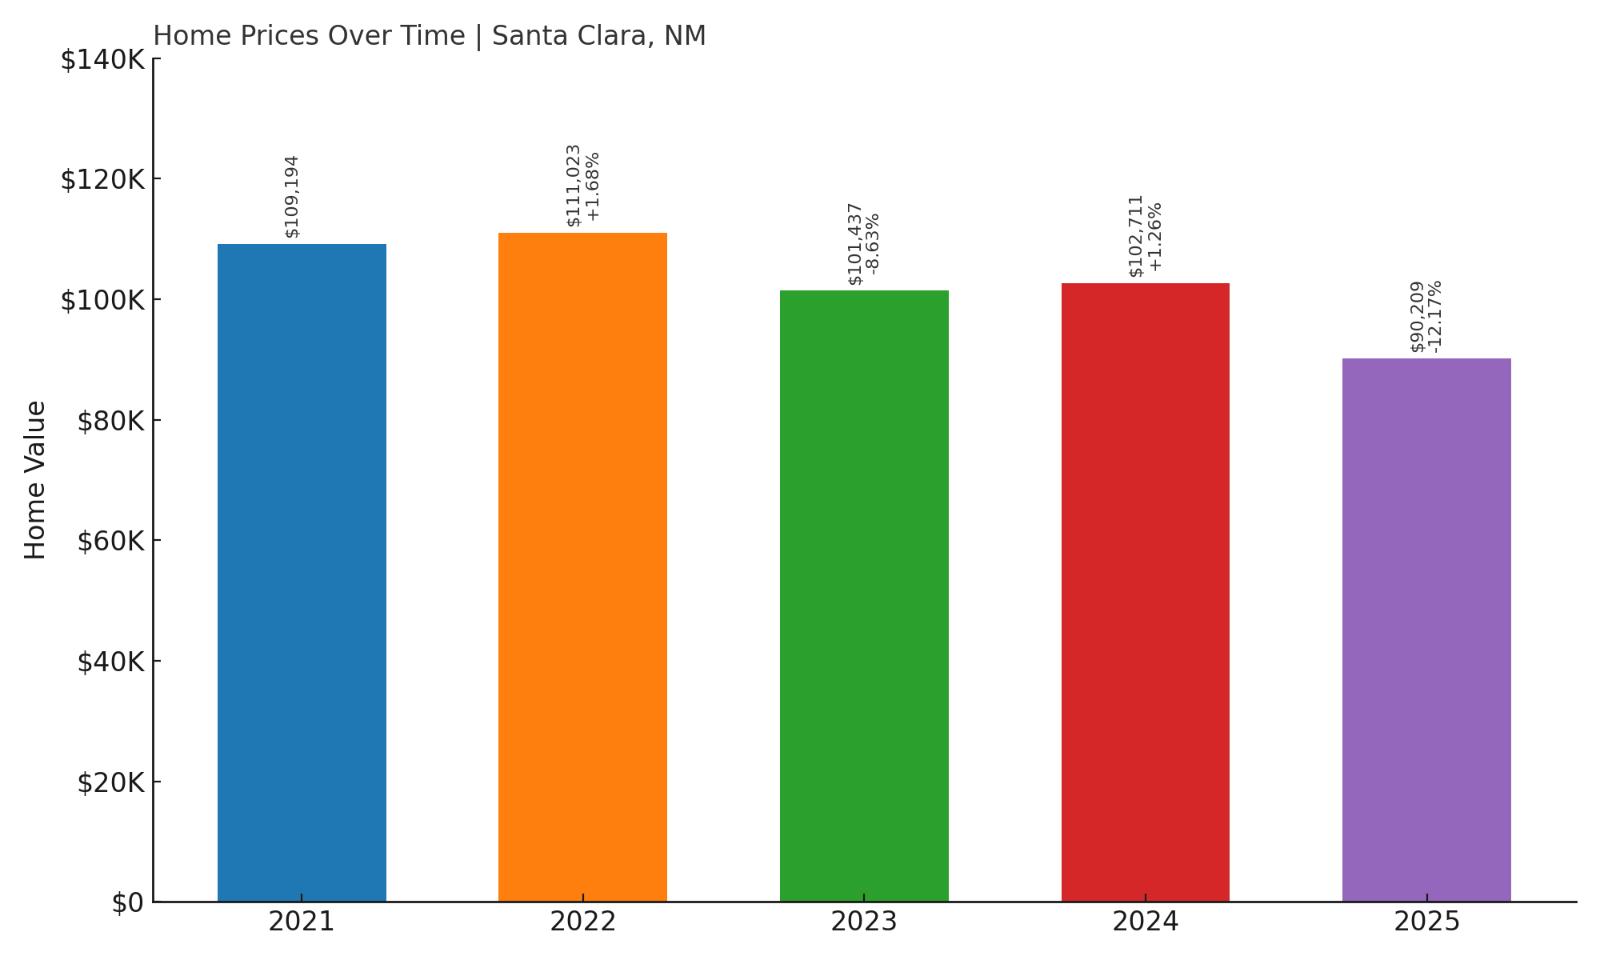
- 2021: $109,194
- 2022: $111,023 (+$1,829, +1.68% from previous year)
- 2023: $101,437 (-$9,586, -8.63% from previous year)
- 2024: $102,711 (+$1,274, +1.26% from previous year)
- 2025: $90,209 (-$12,502, -12.17% from previous year)
Santa Clara’s housing market has dropped nearly 17.4% since its 2022 high, with 2025 bringing its lowest average value in recent years. Despite that, current prices near $90,000 are still within reach for many buyers. The town’s price fluctuations are steep but reflect broader shifts in supply and demand across Grant County.
Santa Clara – A Copper Corridor Town with Budget-Friendly Homes
Located near Bayard and Silver City, Santa Clara shares the region’s mining legacy and serves as a quiet, residential alternative to its neighbors. It is home to a small but active population, and while employment opportunities are limited within the town, its proximity to larger communities offers access to jobs, healthcare, and shopping. The town’s affordability makes it attractive to first-time buyers or those on fixed incomes. Like others in the area, Santa Clara’s home values peaked during the pandemic-driven market surge and have since declined. That said, the town continues to offer solid value for its price, with homes that are often move-in ready and set in peaceful neighborhoods. For those comfortable with a small-town pace and looking to stretch their housing budget, Santa Clara is a viable and historically rich option.
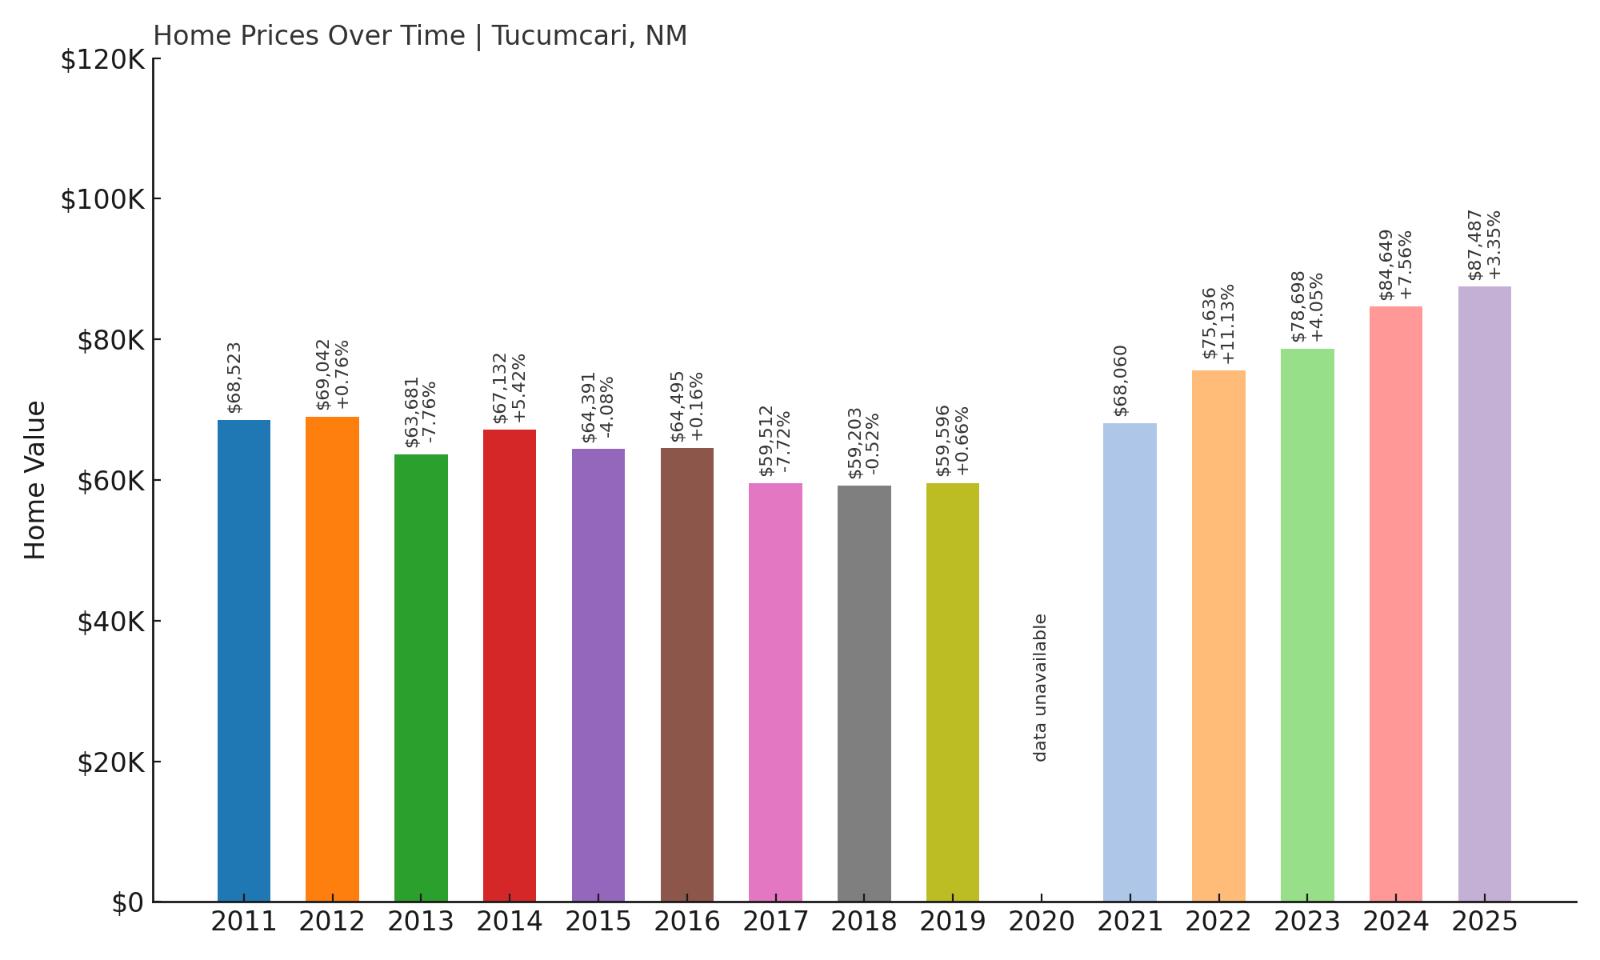
1. Tucumcari – 27.7% Home Price Increase Since 2011
- 2010: N/A
- 2011: $68,523
- 2012: $69,042 (+$519, +0.76% from previous year)
- 2013: $63,681 (-$5,361, -7.76% from previous year)
- 2014: $67,132 (+$3,452, +5.42% from previous year)
- 2015: $64,391 (-$2,742, -4.08% from previous year)
- 2016: $64,495 (+$104, +0.16% from previous year)
- 2017: $59,512 (-$4,982, -7.72% from previous year)
- 2018: $59,203 (-$309, -0.52% from previous year)
- 2019: $59,596 (+$393, +0.66% from previous year)
- 2020: N/A
- 2021: $68,060
- 2022: $75,636 (+$7,576, +11.13% from previous year)
- 2023: $78,698 (+$3,062, +4.05% from previous year)
- 2024: $84,649 (+$5,951, +7.56% from previous year)
- 2025: $87,487 (+$2,838, +3.35% from previous year)
Tucumcari has experienced a 27.7% increase in home prices since 2011, with most of that growth occurring in the last five years. The town’s current home value of around $87,500 makes it the most affordable housing market on this list. Its consistent, if modest, growth pattern stands out in a region full of market swings.
Tucumcari – Route 66 Resilience and Low Cost of Living
Tucumcari is a town steeped in Americana, with neon signs and vintage motels lining its famous Route 66 stretch. While the highway’s heyday has long passed, Tucumcari has carved out a new identity as a low-cost hub for retirees, artists, and small-town enthusiasts. Located in Quay County in eastern New Mexico, it has a population of just over 5,000 and a cost of living that remains well below the national average. The town’s housing market is a reflection of its steady, no-frills character. While growth has been slow, it has been reliable, with prices trending upward since 2018. With average values under $90,000, Tucumcari offers unbeatable value for buyers looking to settle in a place with deep roots, a strong sense of community, and a gentle pace of life. It may not be booming—but for many, that’s precisely the appeal.