🔥 Would you like to save this?
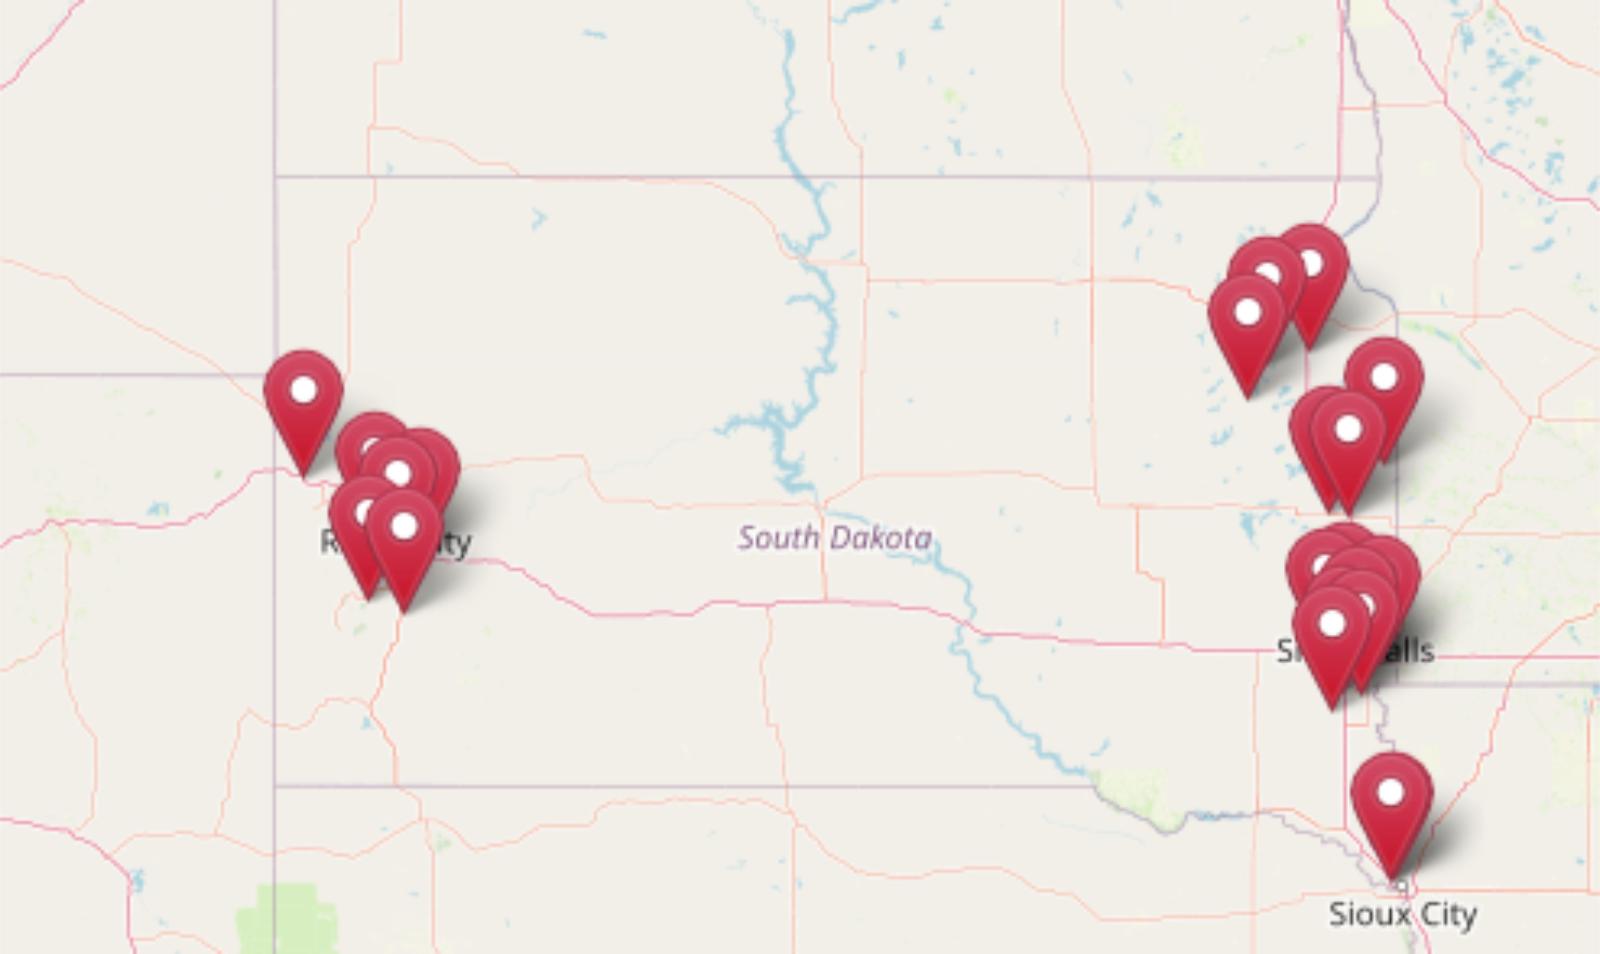
South Dakota might not seem like a state with million-dollar views—but home prices in some towns are rising fast. According to the Zillow Home Value Index, these 21 communities now rank among the most expensive places to buy property in the state. Some have seen prices more than double over the past decade, with average values now climbing past $400,000 and even $500,000.
In-migration, remote work, and demand for vacation homes have all played a role. In some towns, the change has been steady; in others, it’s been sudden. But one thing is clear: South Dakota’s most sought-after housing markets don’t look so cheap anymore.
In order to come up with the very specific design ideas, we create most designs with the assistance of state-of-the-art AI interior design software. Also, assume links that take you off the site are affiliate links such as links to Amazon. this means we may earn a commission if you buy something.
21. Hartford – 137% Home Price Increase Since 2011
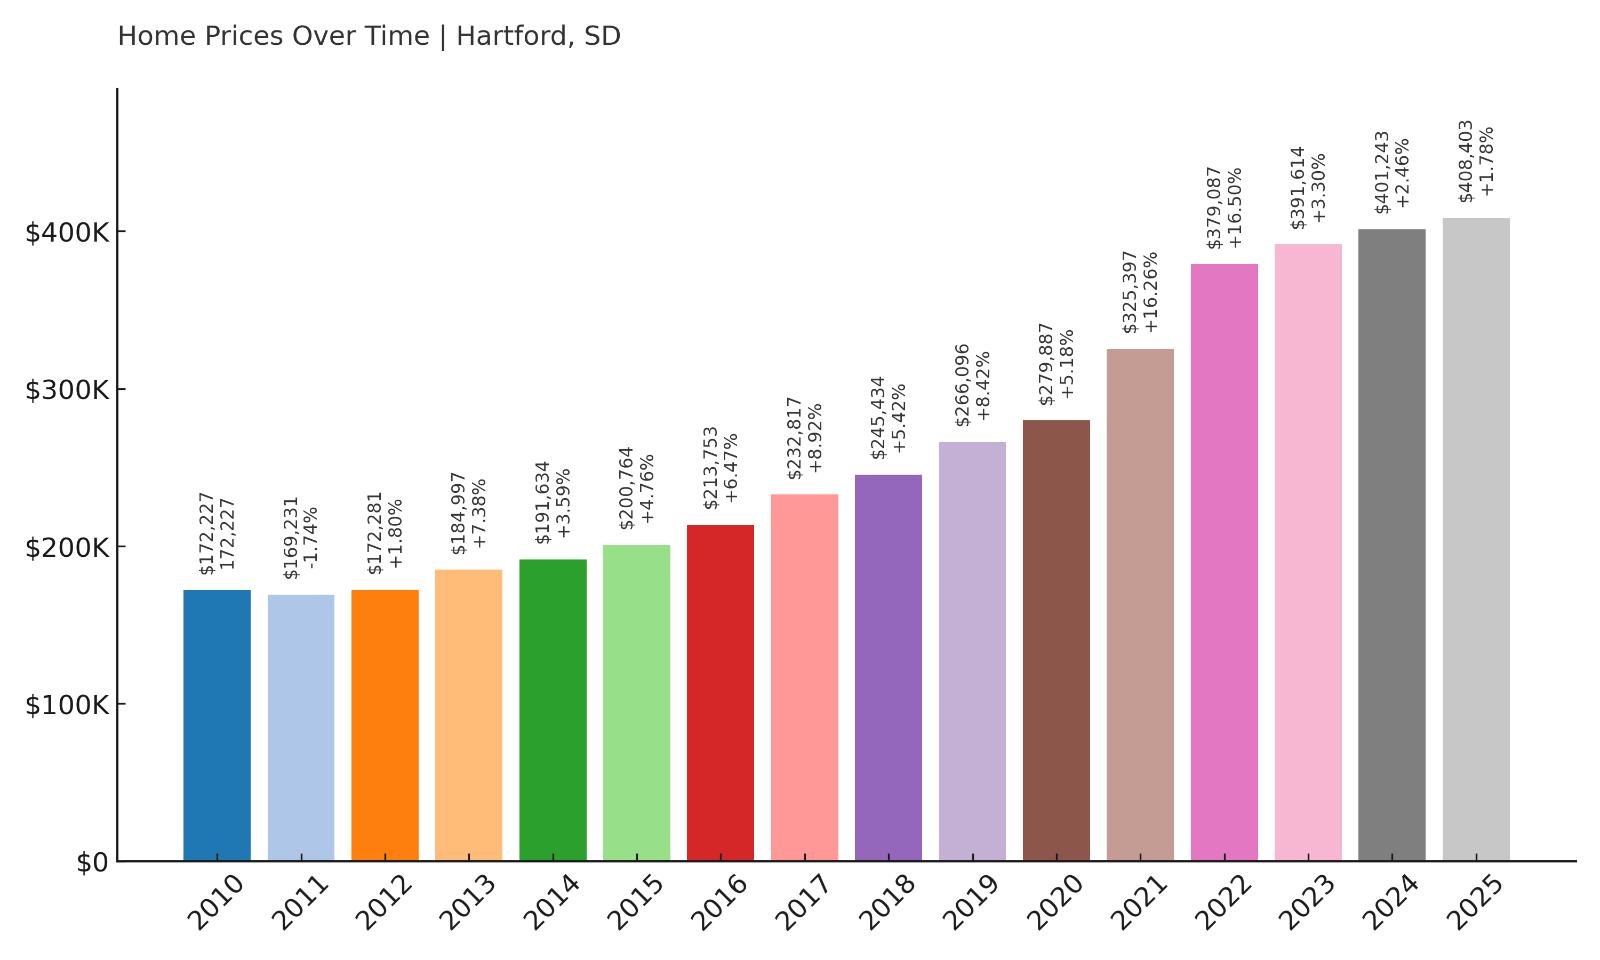
- 2010: $172,227
- 2011: $169,231 (-$2,996, -1.74% from previous year)
- 2012: $172,281 (+$3,050, +1.80% from previous year)
- 2013: $184,997 (+$12,716, +7.38% from previous year)
- 2014: $191,634 (+$6,637, +3.59% from previous year)
- 2015: $200,764 (+$9,131, +4.76% from previous year)
- 2016: $213,753 (+$12,989, +6.47% from previous year)
- 2017: $232,817 (+$19,064, +8.92% from previous year)
- 2018: $245,434 (+$12,617, +5.42% from previous year)
- 2019: $266,096 (+$20,662, +8.42% from previous year)
- 2020: $279,887 (+$13,792, +5.18% from previous year)
- 2021: $325,397 (+$45,509, +16.26% from previous year)
- 2022: $379,087 (+$53,690, +16.50% from previous year)
- 2023: $391,614 (+$12,527, +3.30% from previous year)
- 2024: $401,243 (+$9,629, +2.46% from previous year)
- 2025: $408,403 (+$7,160, +1.78% from previous year)
Home prices in Hartford have increased significantly over the past 14 years, rising from $169,231 in 2011 to $408,403 in 2025. That’s a 137% increase, with the most dramatic jumps occurring between 2020 and 2022, when prices shot up by over $99,000 in just two years. More recent gains have slowed slightly, suggesting the market may be cooling, but values are still trending upward year-over-year. This long-term growth places Hartford firmly among the top 21 most expensive towns in South Dakota.
Hartford – Rapid Growth on the Edge of Sioux Falls
Located just 20 minutes west of Sioux Falls, Hartford has increasingly become a go-to spot for buyers who want a quieter setting without losing easy access to the metro area. As Sioux Falls has grown and housing has tightened, Hartford’s appeal as a nearby alternative has surged. The town offers a mix of newer subdivisions, small-town amenities, and open space, making it especially popular with families and commuters. Its schools are part of the West Central School District, which is well-regarded locally, and the town’s community infrastructure has been steadily improving alongside population growth. Proximity to I-90 keeps it well connected, while still allowing for a more suburban feel than what’s found in the city core.
The price trajectory here tells a story of suburban expansion. After moderate growth throughout the 2010s, Hartford saw a major acceleration during the post-2020 housing boom. Home prices surged more than 35% between 2020 and 2022 alone. That momentum has since eased, but prices remain elevated, signaling ongoing demand. With newer housing developments continuing to expand and buyer interest remaining steady, Hartford’s position on this list is no surprise. While it may not be South Dakota’s most expensive market overall, it’s one of the clearest examples of how spillover growth from a major city can transform a nearby town into a high-value housing destination.
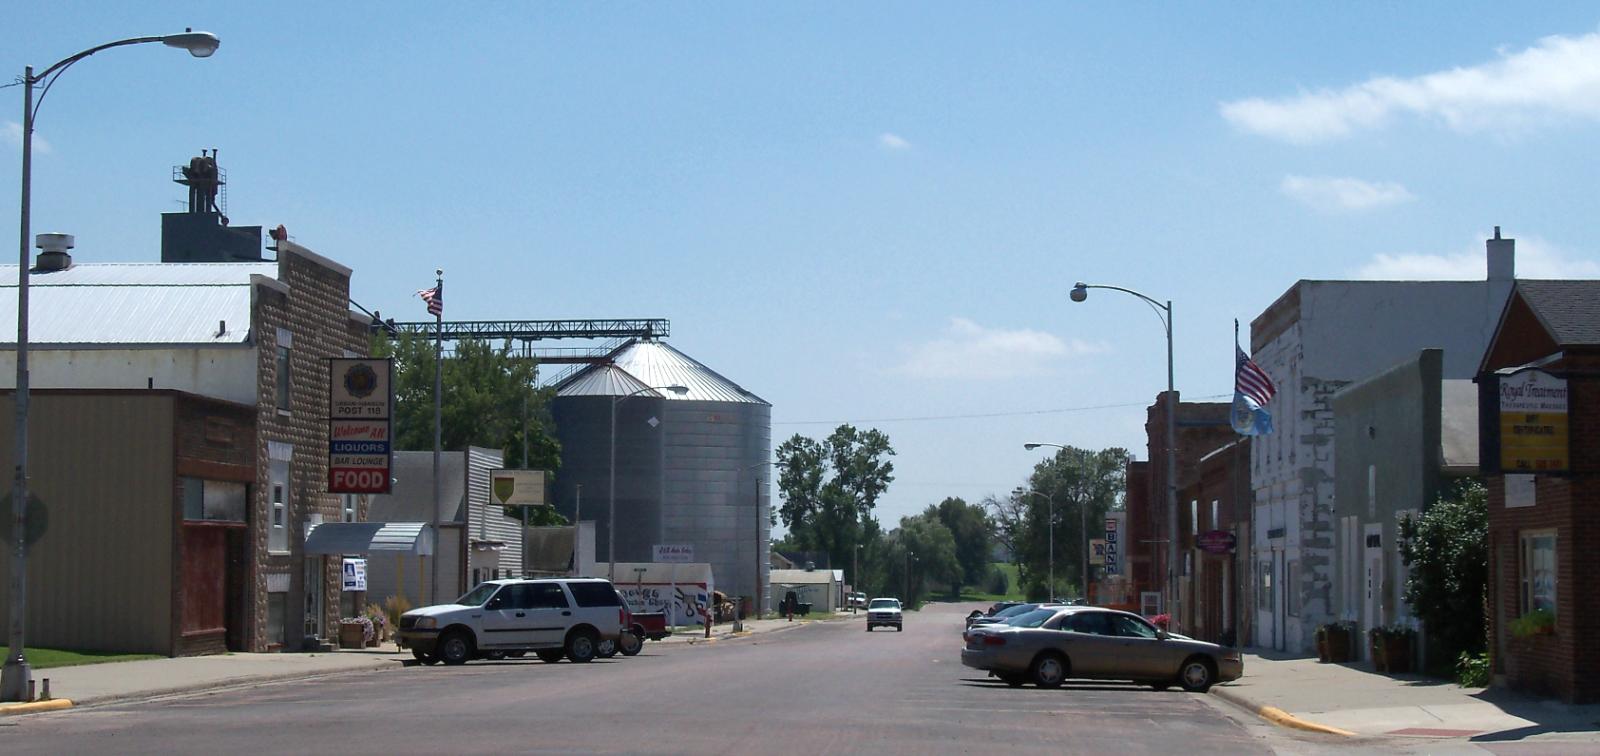
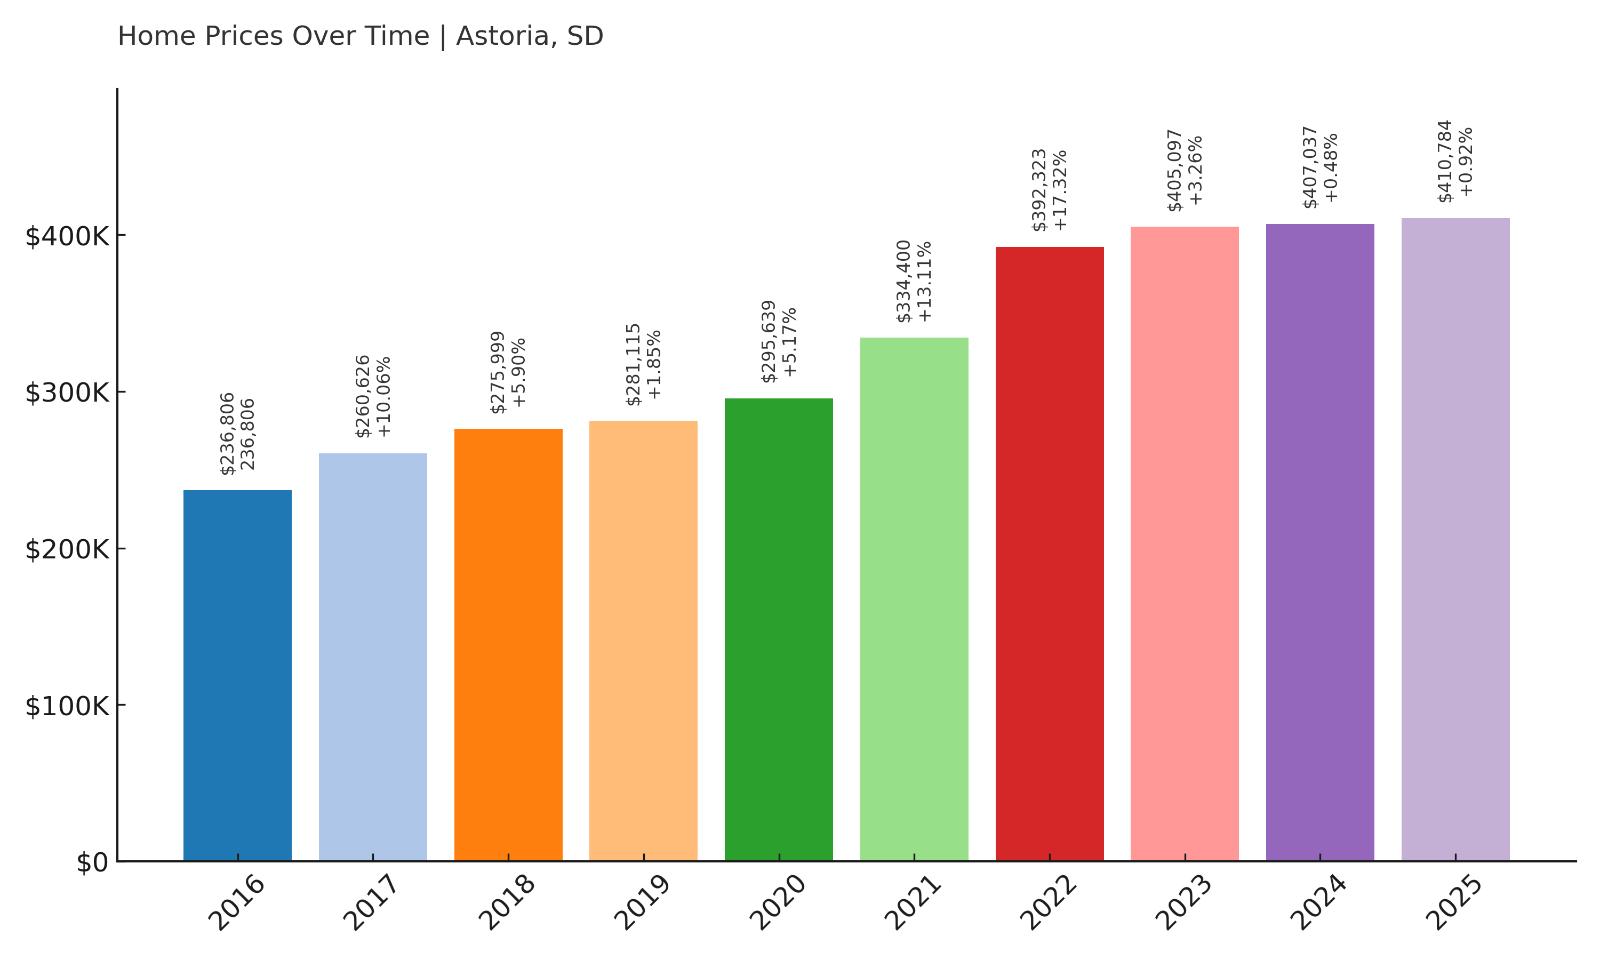
20. Astoria – 73% Home Price Increase Since 2016
- 2010: N/A
- 2011: N/A
- 2012: N/A
- 2013: N/A
- 2014: N/A
- 2015: N/A
- 2016: $236,806
- 2017: $260,626 (+$23,820, +10.06% from previous year)
- 2018: $275,999 (+$15,373, +5.90% from previous year)
- 2019: $281,115 (+$5,116, +1.85% from previous year)
- 2020: $295,639 (+$14,524, +5.17% from previous year)
- 2021: $334,400 (+$38,761, +13.11% from previous year)
- 2022: $392,323 (+$57,922, +17.32% from previous year)
- 2023: $405,097 (+$12,774, +3.26% from previous year)
- 2024: $407,037 (+$1,940, +0.48% from previous year)
- 2025: $410,784 (+$3,747, +0.92% from previous year)
In Astoria, home prices have grown steadily since 2016, rising from $236,806 to $410,784—a total increase of 73% in just under a decade. Most of that growth happened between 2020 and 2022, when prices jumped nearly $97,000 in two years. More recently, the market has plateaued slightly, with yearly increases of less than 1% between 2023 and 2025. Still, the town holds its spot among the top 20 highest-priced housing markets in the state.
Astoria – A Quiet Community With Big Price Gains
Astoria is a small community in Deuel County, situated in the far eastern part of South Dakota. While it’s not a household name, its proximity to the Minnesota border makes it a potential draw for buyers looking to move out of denser areas while retaining access to nearby jobs. Its rural charm and quiet environment have likely made it attractive for retirees and remote workers alike—especially since the pandemic shifted preferences toward less crowded spaces. Though amenities are limited, residents enjoy open landscapes, low crime, and the pace of rural living, all without being too far from Watertown or Brookings.
What stands out in the data is the pace of appreciation over a short timeframe. Between 2020 and 2022 alone, prices jumped more than 30%, a remarkable rate for such a small town. That spike likely reflects both post-COVID migration patterns and a tightening inventory in the region. While price growth has cooled since, current values remain historically high. As more South Dakota buyers look beyond traditional urban centers, towns like Astoria may continue to see slow but steady upward movement, especially if remote work continues to shape where people choose to live.
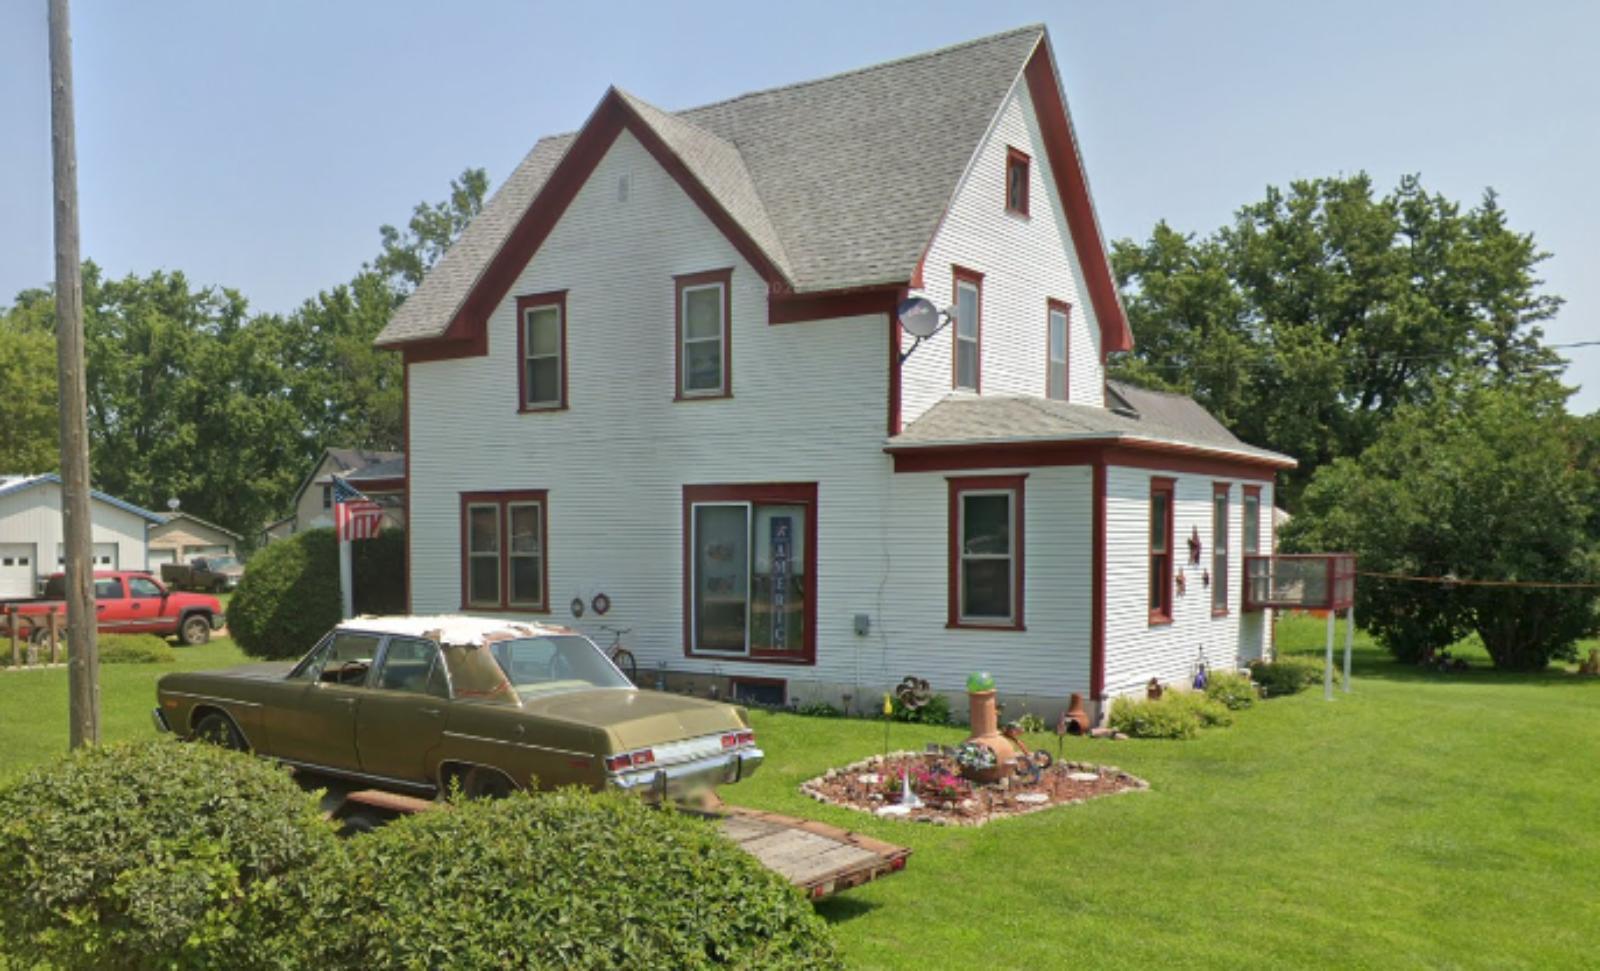
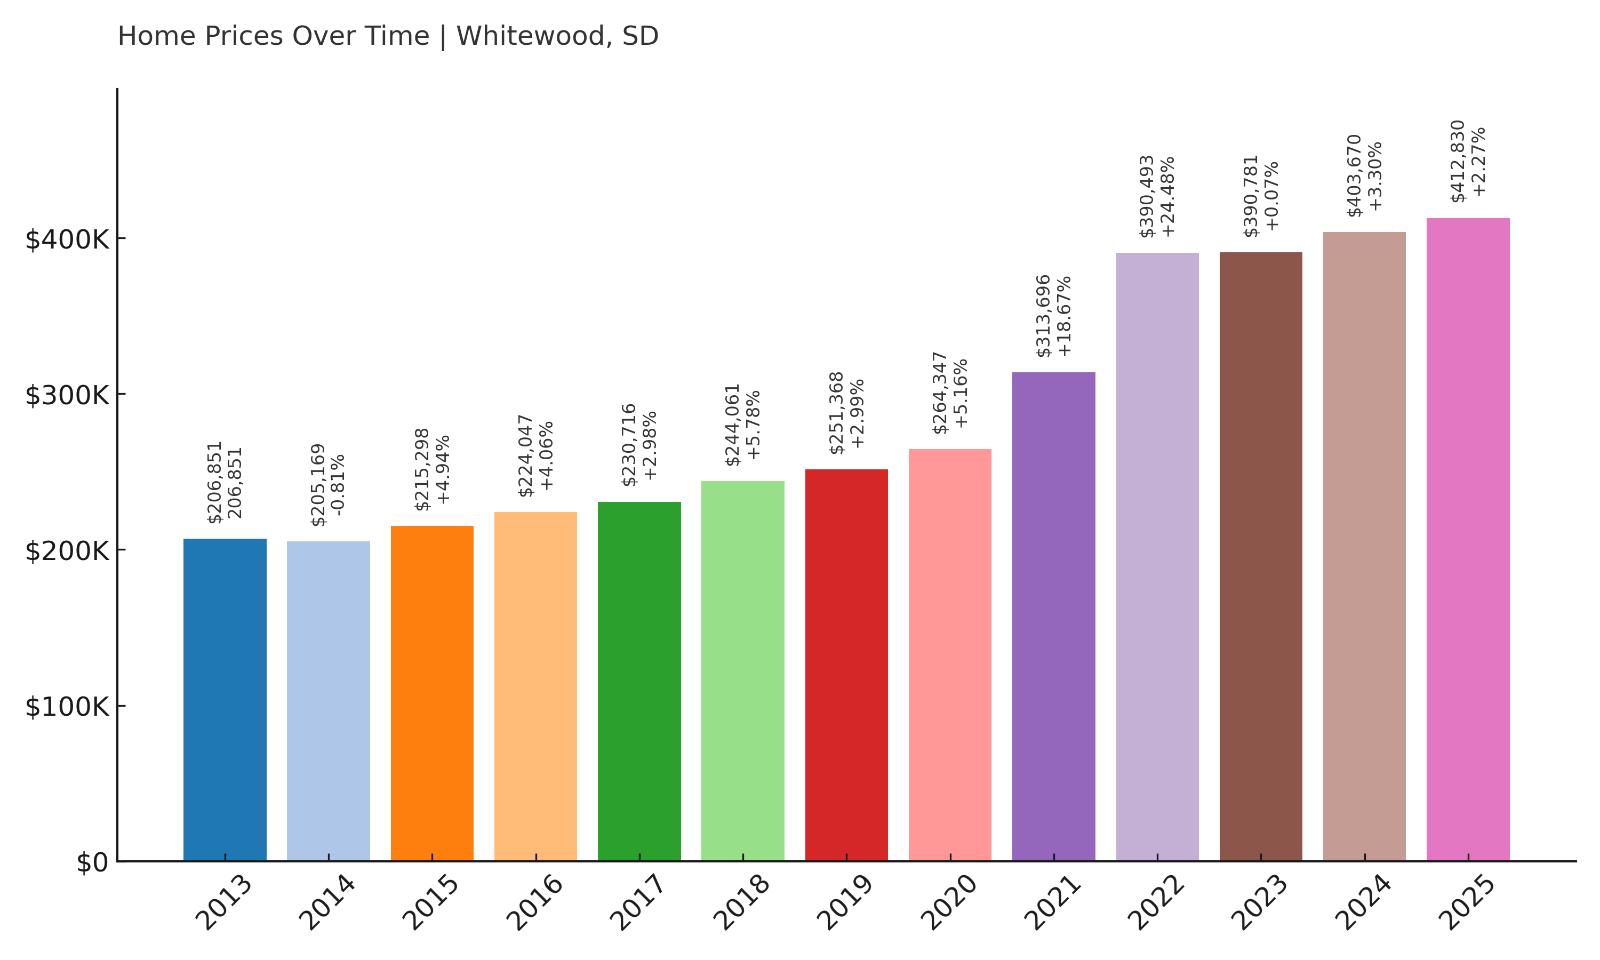
19. Whitewood – 100% Home Price Increase Since 2013
- 2010: N/A
- 2011: N/A
- 2012: N/A
- 2013: $206,851
- 2014: $205,169 (-$1,681, -0.81% from previous year)
- 2015: $215,298 (+$10,129, +4.94% from previous year)
- 2016: $224,047 (+$8,749, +4.06% from previous year)
- 2017: $230,716 (+$6,669, +2.98% from previous year)
- 2018: $244,061 (+$13,345, +5.78% from previous year)
- 2019: $251,368 (+$7,307, +2.99% from previous year)
- 2020: $264,347 (+$12,979, +5.16% from previous year)
- 2021: $313,696 (+$49,350, +18.67% from previous year)
- 2022: $390,493 (+$76,797, +24.48% from previous year)
- 2023: $390,781 (+$288, +0.07% from previous year)
- 2024: $403,670 (+$12,889, +3.30% from previous year)
- 2025: $412,830 (+$9,159, +2.27% from previous year)
Home values in Whitewood have doubled since 2013, climbing from $206,851 to $412,830 by 2025. A sharp upswing occurred between 2020 and 2022, when home prices rose by more than $125,000 in just two years. Growth has been more modest since, but values continue to increase. With a 100% price increase over a 12-year period, Whitewood ranks among the fastest-appreciating towns in western South Dakota.
Whitewood – Quiet Western Town With Rising Appeal
Whitewood sits in the Black Hills region of western South Dakota, not far from Deadwood and Sturgis. While it has long flown under the radar, its proximity to some of the state’s biggest tourist destinations and scenic drives has made it increasingly attractive to out-of-state buyers. The area offers mountain views, open land, and a tight-knit rural feel that appeals to both second-home buyers and those relocating for a slower lifestyle. Whitewood’s access to I-90 makes regional travel convenient, and it’s well-positioned for those who want access to the Black Hills without the price tags of resort towns like Lead or Custer.
The housing data shows a gradual rise for much of the 2010s, followed by a major jump starting in 2020. That mirrors patterns seen in other mountain-adjacent markets nationwide. Inventory remains tight, which has helped sustain higher prices even as other parts of the country see declines. With interest in South Dakota’s natural beauty and outdoor lifestyle still going strong, towns like Whitewood may continue to benefit from buyer demand, particularly from those priced out of better-known Black Hills locations.
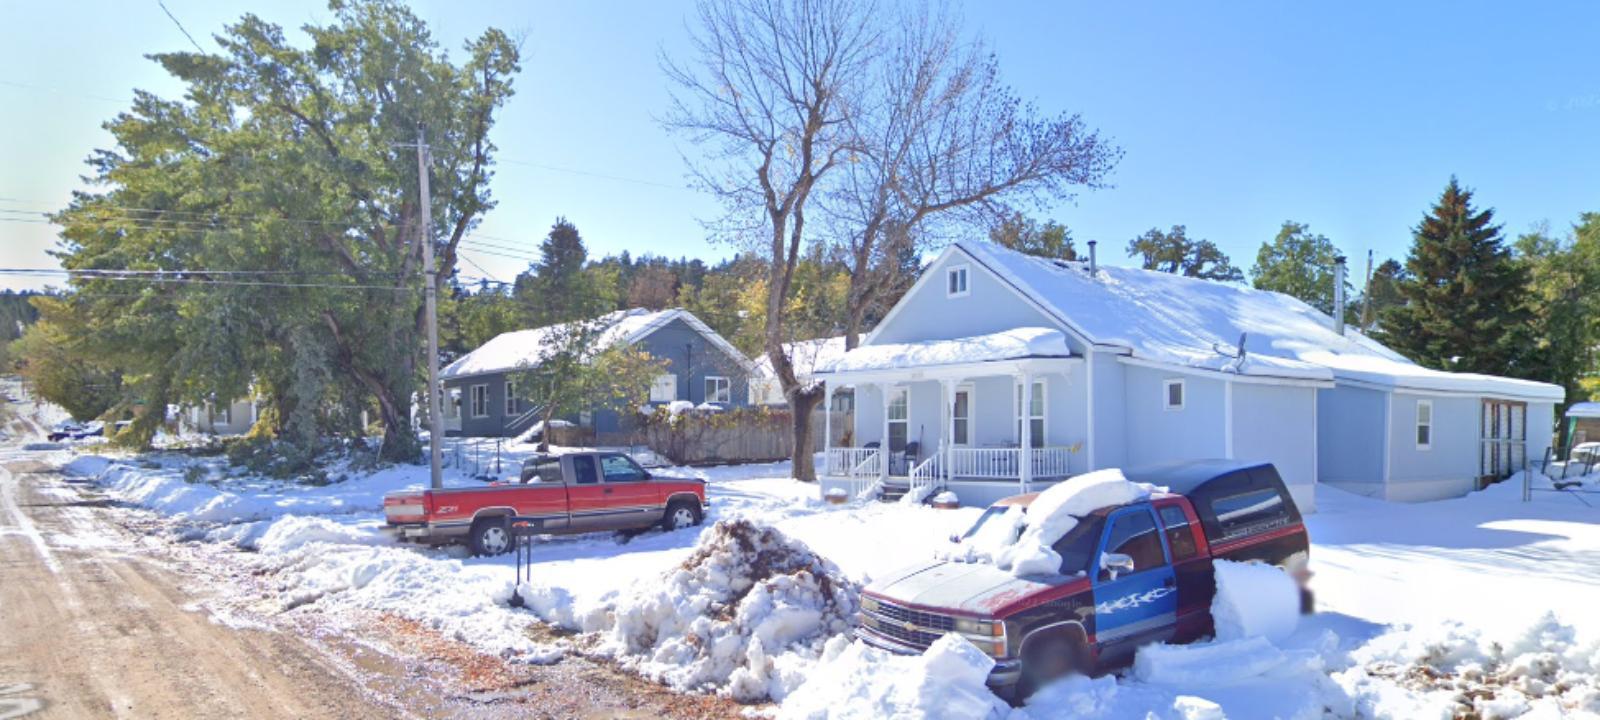
18. New Underwood – 130% Home Price Increase Since 2014
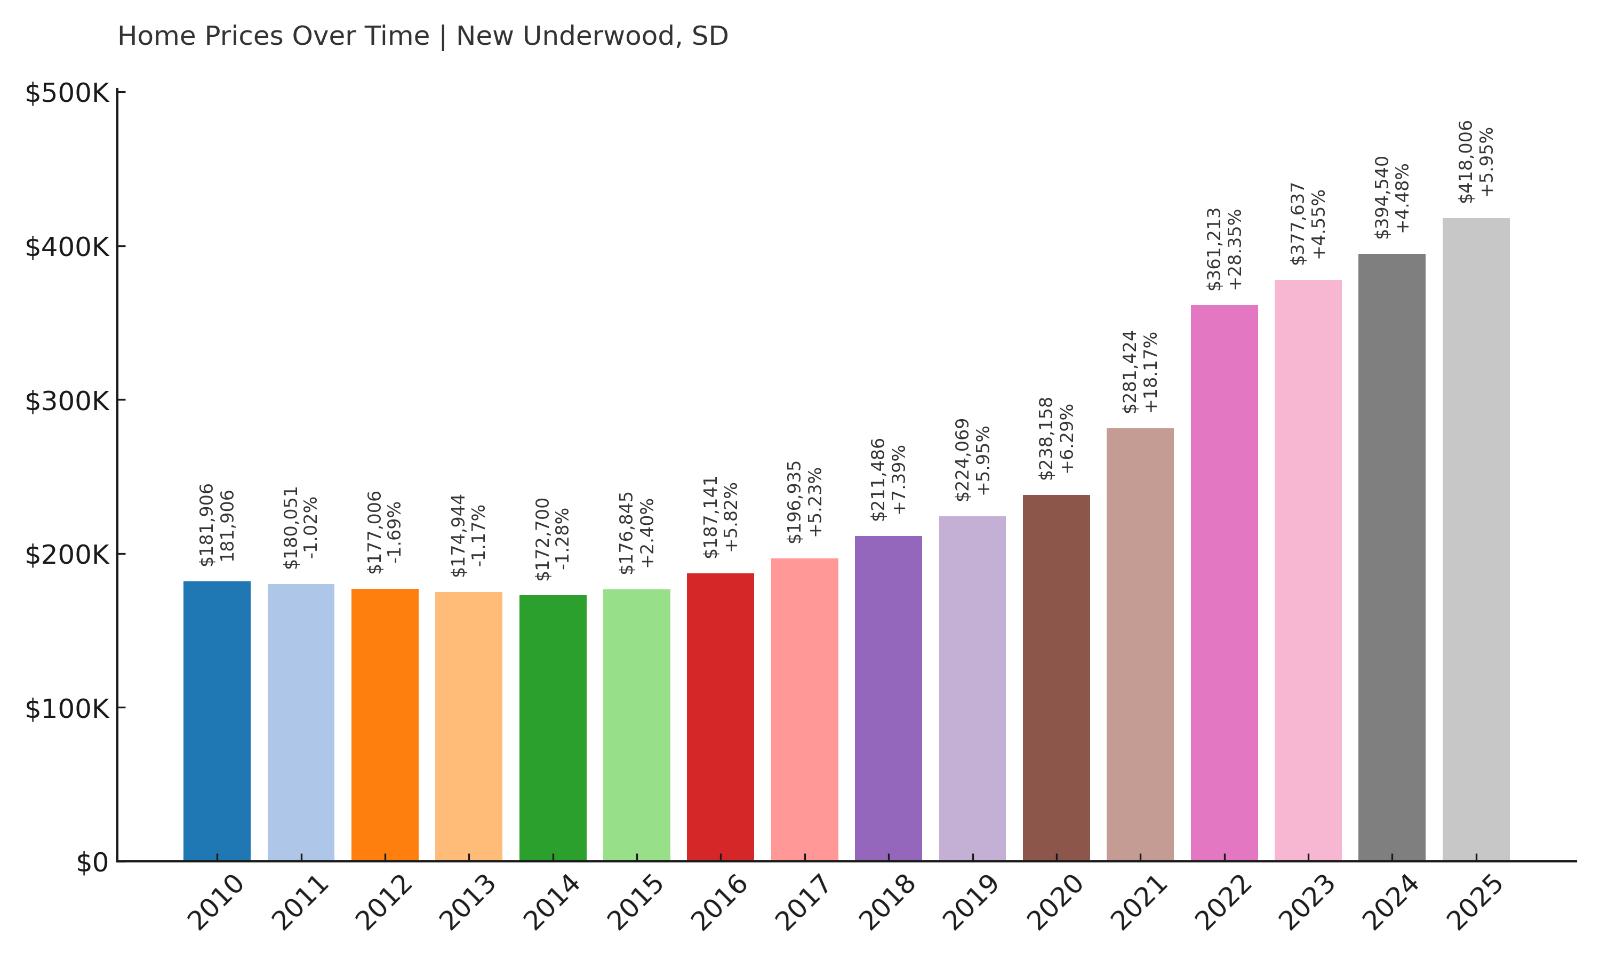
- 2010: $181,906
- 2011: $180,051 (-$1,855, -1.02% from previous year)
- 2012: $177,006 (-$3,045, -1.69% from previous year)
- 2013: $174,944 (-$2,063, -1.17% from previous year)
- 2014: $172,700 (-$2,244, -1.28% from previous year)
- 2015: $176,845 (+$4,145, +2.40% from previous year)
- 2016: $187,141 (+$10,296, +5.82% from previous year)
- 2017: $196,935 (+$9,794, +5.23% from previous year)
- 2018: $211,486 (+$14,552, +7.39% from previous year)
- 2019: $224,069 (+$12,582, +5.95% from previous year)
- 2020: $238,158 (+$14,089, +6.29% from previous year)
- 2021: $281,424 (+$43,266, +18.17% from previous year)
- 2022: $361,213 (+$79,789, +28.35% from previous year)
- 2023: $377,637 (+$16,425, +4.55% from previous year)
- 2024: $394,540 (+$16,902, +4.48% from previous year)
- 2025: $418,006 (+$23,466, +5.95% from previous year)
New Underwood has experienced a substantial 130% rise in home values since 2014, growing from just $172,700 to $418,006 by 2025. Much of that increase has taken place in the last five years, with prices accelerating rapidly from 2020 onward. After a period of stagnation in the early 2010s, the town has firmly joined the ranks of South Dakota’s more expensive real estate markets.
New Underwood – From Slow Start to Price Surge
Located about 20 miles east of Rapid City in Pennington County, New Underwood is a small but growing community that has gained attention for its affordability and proximity to the Black Hills region. With easy access to Highway 14 and I-90, it’s become increasingly attractive to homebuyers looking to stay within commuting range of Rapid City while enjoying lower housing density and small-town living. The community is home to basic services, a school district, and a tight-knit population that values space and simplicity. Its quiet location and open landscapes have made it a natural fit for people looking to relocate post-pandemic.
What’s remarkable is how dramatically prices have shifted here in just a few short years. Between 2020 and 2022, the average home value jumped over $120,000—an increase of more than 50%. That spike outpaces many larger towns and reflects how buyers are increasingly looking toward outlying areas for value. Unlike more expensive Black Hills towns where inventory is tight, New Underwood still offers room to grow. With continuing demand from regional commuters and new transplants, it seems likely that home prices will remain on a steady upward path.
17. North Sioux City – 72% Home Price Increase Since 2010
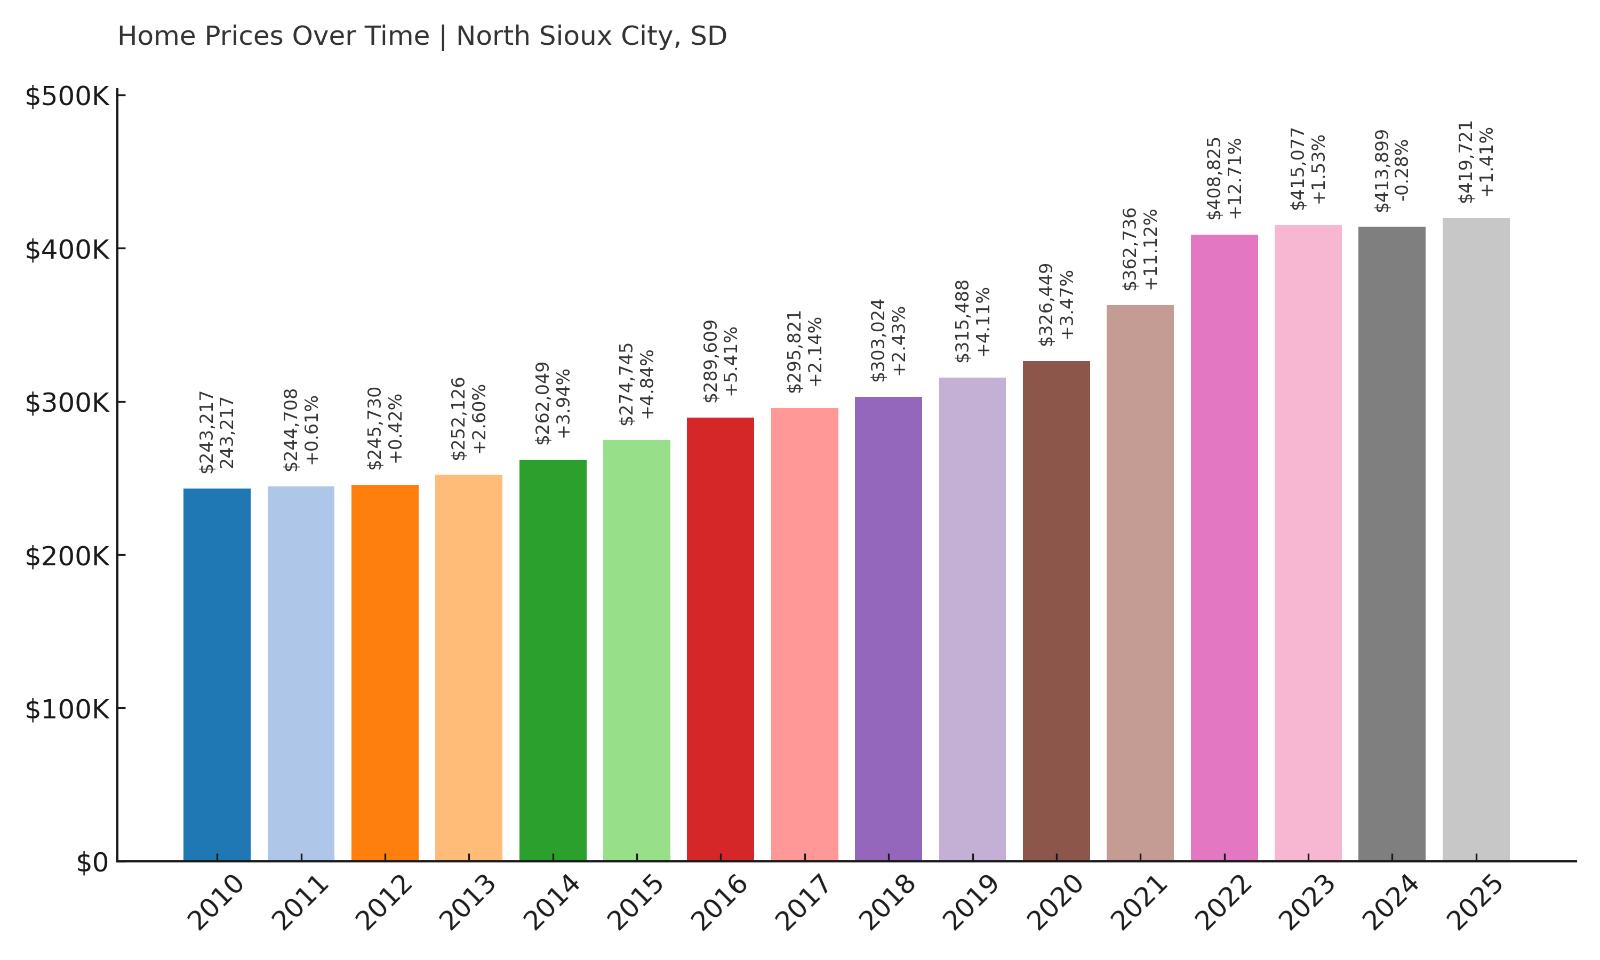
- 2010: $243,217
- 2011: $244,708 (+$1,491, +0.61% from previous year)
- 2012: $245,730 (+$1,022, +0.42% from previous year)
- 2013: $252,126 (+$6,396, +2.60% from previous year)
- 2014: $262,049 (+$9,923, +3.94% from previous year)
- 2015: $274,745 (+$12,696, +4.84% from previous year)
- 2016: $289,609 (+$14,864, +5.41% from previous year)
- 2017: $295,821 (+$6,212, +2.14% from previous year)
- 2018: $303,024 (+$7,203, +2.43% from previous year)
- 2019: $315,488 (+$12,464, +4.11% from previous year)
- 2020: $326,449 (+$10,961, +3.47% from previous year)
- 2021: $362,736 (+$36,287, +11.12% from previous year)
- 2022: $408,825 (+$46,089, +12.71% from previous year)
- 2023: $415,077 (+$6,252, +1.53% from previous year)
- 2024: $413,899 (-$1,179, -0.28% from previous year)
- 2025: $419,721 (+$5,822, +1.41% from previous year)
Home values in North Sioux City have grown by 72% since 2010, climbing from $243,217 to $419,721 in 2025. Growth was steady throughout the 2010s, with stronger acceleration seen during the 2020–2022 housing boom. Although the pace has slowed, and even dipped slightly in 2024, the overall trend remains upward, cementing the town’s spot in South Dakota’s list of highest-value markets.
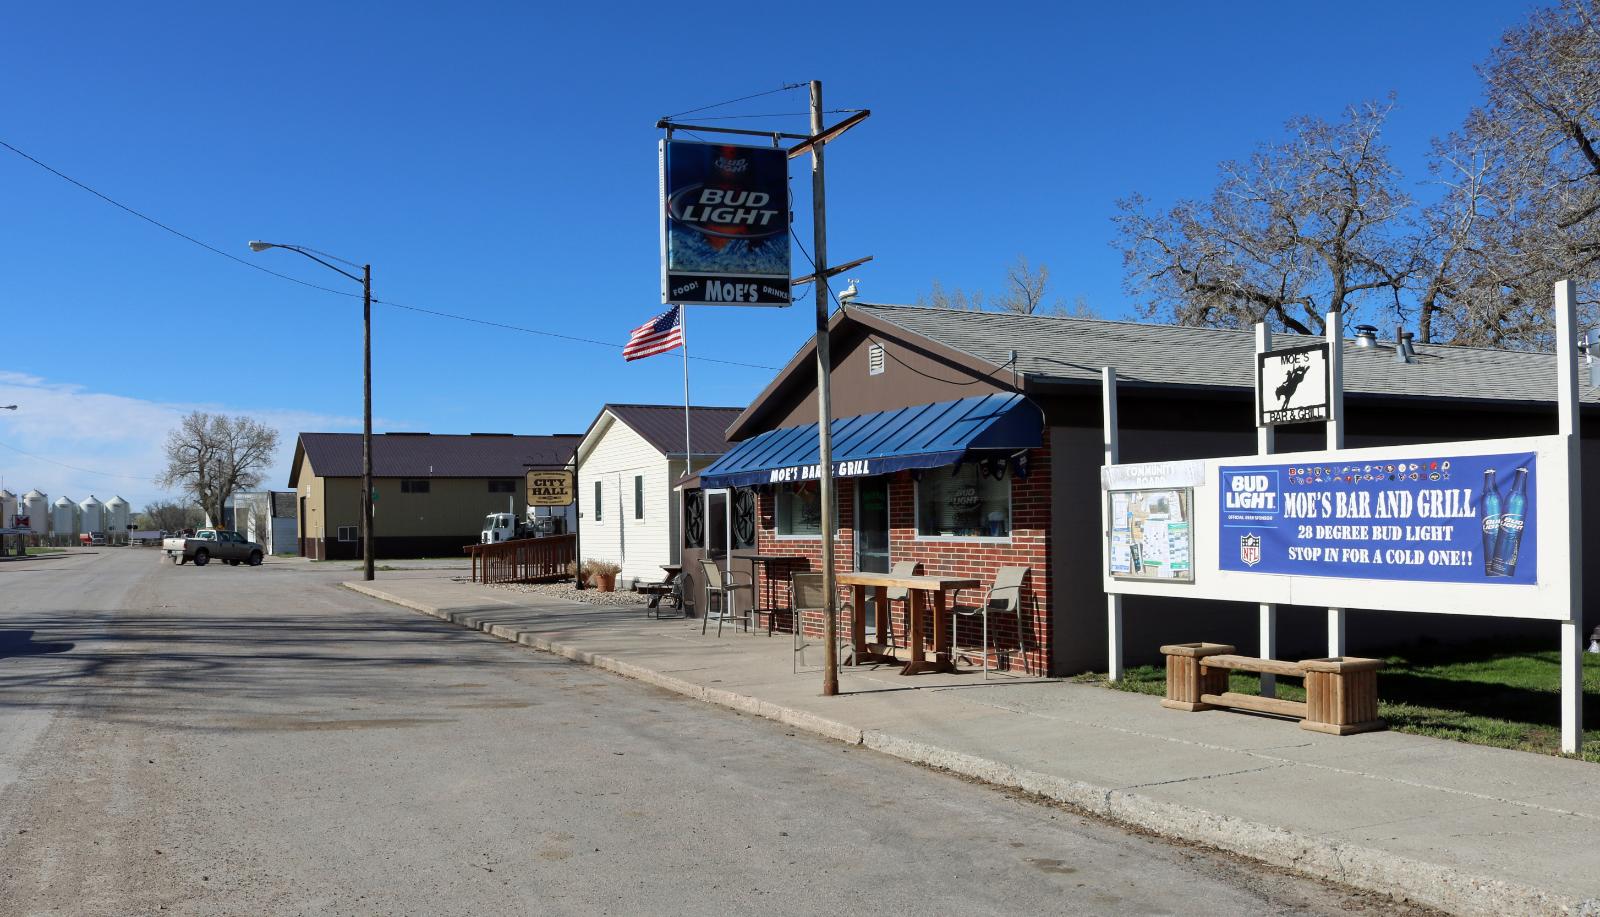
North Sioux City – A Tri-State Gateway With Staying Power
North Sioux City is located at the southeastern tip of South Dakota, right on the border with Iowa and Nebraska. Its unique position at the junction of three states makes it a strategic location for commerce, commuting, and regional trade. The town serves as a satellite to the larger Sioux City metro area, offering residents access to city amenities while maintaining a quieter, more suburban atmosphere. With easy access to I-29 and a strong local economy, it’s been an appealing place for both businesses and homebuyers for decades.
Housing price data reflects that stability and long-term interest. The town posted modest annual gains for most of the 2010s, then saw double-digit increases between 2020 and 2022, likely due to heightened demand and regional economic growth. North Sioux City doesn’t rely on tourism or seasonal activity to support its market—home values here are driven more by job access, family-friendly neighborhoods, and consistent demand. With a mix of older homes and new developments, the town has something to offer a wide range of buyers, and the continued growth in average home values suggests that confidence in the area remains strong.
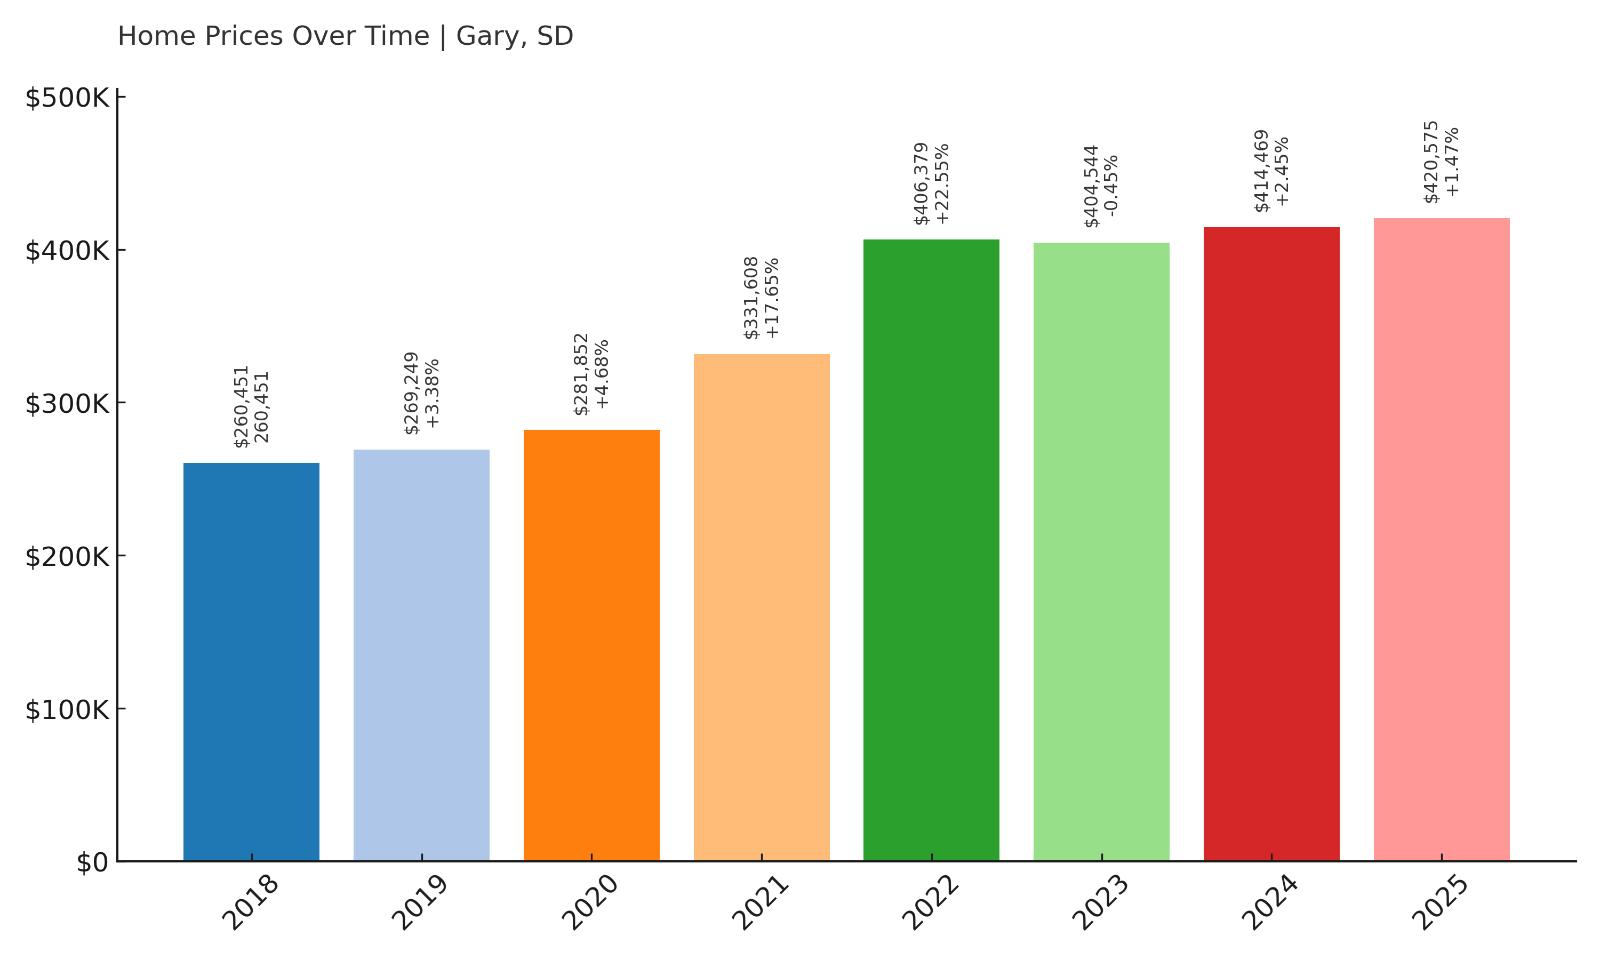
16. Gary – 61% Home Price Increase Since 2018
- 2010: N/A
- 2011: N/A
- 2012: N/A
- 2013: N/A
- 2014: N/A
- 2015: N/A
- 2016: N/A
- 2017: N/A
- 2018: $260,451
- 2019: $269,249 (+$8,798, +3.38% from previous year)
- 2020: $281,852 (+$12,603, +4.68% from previous year)
- 2021: $331,608 (+$49,756, +17.65% from previous year)
- 2022: $406,379 (+$74,771, +22.55% from previous year)
- 2023: $404,544 (-$1,835, -0.45% from previous year)
- 2024: $414,469 (+$9,925, +2.45% from previous year)
- 2025: $420,575 (+$6,106, +1.47% from previous year)
Gary’s home values have increased steadily since 2018, jumping from $260,451 to $420,575 by 2025—an overall rise of 61%. The strongest growth occurred between 2020 and 2022, when prices surged by more than $124,000 in just two years. That rapid appreciation was followed by a minor correction in 2023, which has since stabilized with modest annual gains. While the price increases are no longer as explosive, values remain far above pre-pandemic levels, suggesting long-term confidence in this rural market. Gary may not be a name that appears on most relocation shortlists, but the numbers show it has become one of the most expensive towns per square foot in eastern South Dakota. The town’s real estate market now commands prices on par with far larger communities, a notable shift in just a few short years. With such a strong recent performance, Gary’s inclusion among the state’s highest-priced markets is well earned.
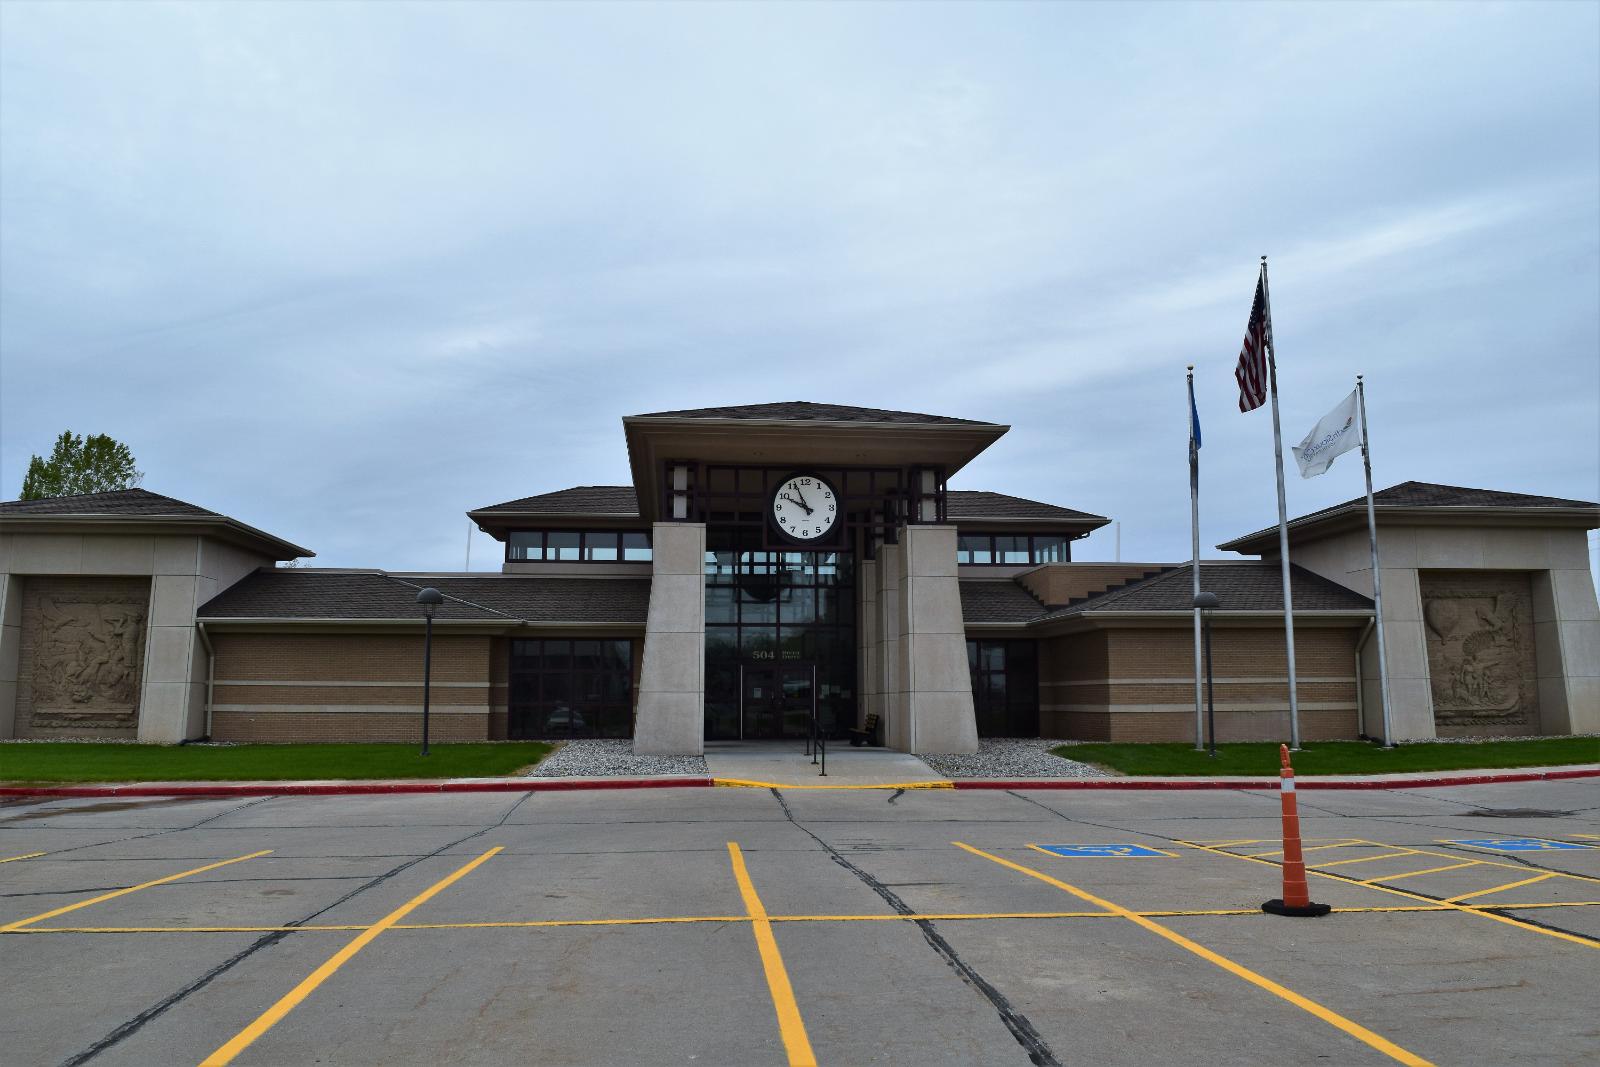
Gary – Quiet Border Town With a Sudden Market Surge
Gary is a small, low-profile town tucked along the eastern edge of South Dakota in Deuel County, within a few miles of the Minnesota border. Its location is rural, peaceful, and largely agricultural, with broad fields and minimal commercial development. But for all its simplicity, Gary has seen a massive rise in home values—a trend that would’ve been nearly impossible to predict just a decade ago. What likely fueled this transformation was a mix of remote work migration, cross-border interest from Minnesota buyers seeking cheaper property, and the broader pandemic-era shift toward rural living. People who previously overlooked towns like Gary started seeing them as viable options, especially if they could work from home and still enjoy open land and quiet surroundings. Compared to even modest Minnesota suburbs, Gary’s price-per-acre was once a bargain—but the influx of demand closed that gap rapidly during 2020–2022. The $75K jump in 2022 alone reflects just how intense that buyer pressure became in a short window of time.
What makes Gary’s housing market especially notable is how high prices have remained even after the peak years of growth passed. Following the slight dip in 2023, some towns across the country saw values fall further or flatten—but Gary bounced back quickly, adding another $6,000 in 2025. This pattern suggests the market wasn’t just speculative; buyers are staying, and demand is still present. The area’s appeal lies not in flashy amenities or big-name employers but in its consistent lifestyle offering: quiet neighborhoods, wide-open space, and low overhead. As regional metros grow more congested and pricey, small towns like Gary may continue to see appreciation that defies their population size. For anyone tracking rural market trends, Gary now serves as a compelling case study in how overlooked places can quickly become high-demand real estate zones when broader economic forces shift in their favor.
15. Summerset – 89% Home Price Increase Since 2016
🔥 Would you like to save this?
- 2010: N/A
- 2011: N/A
- 2012: N/A
- 2013: N/A
- 2014: N/A
- 2015: N/A
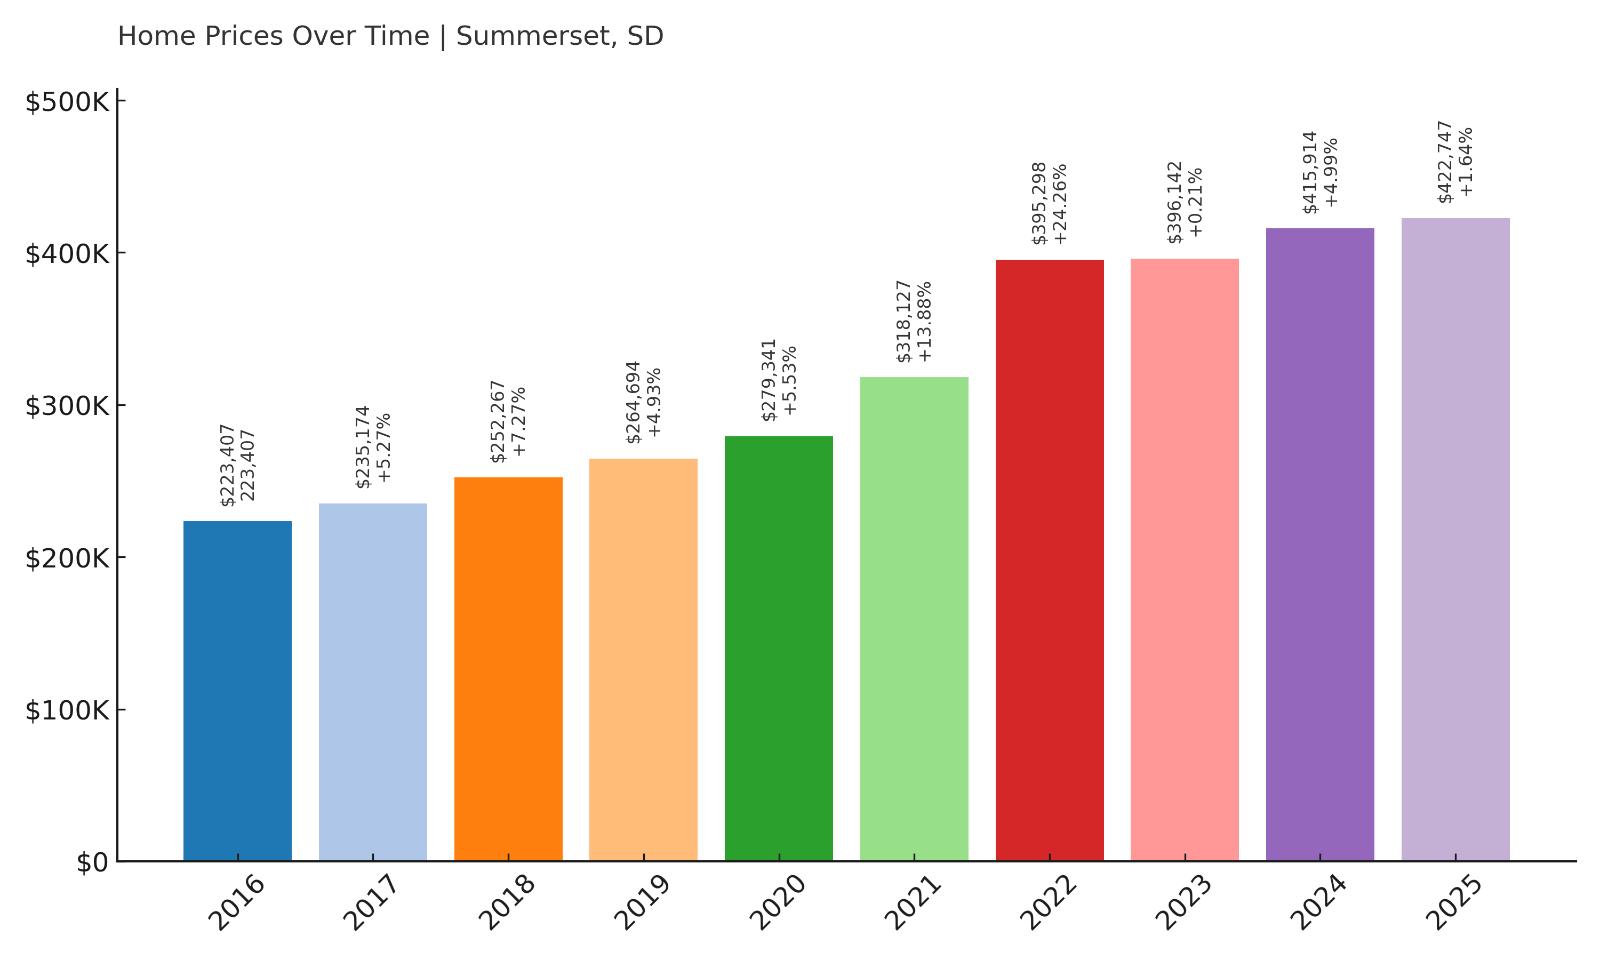
- 2016: $223,407
- 2017: $235,174 (+$11,767, +5.27% from previous year)
- 2018: $252,267 (+$17,093, +7.27% from previous year)
- 2019: $264,694 (+$12,427, +4.93% from previous year)
- 2020: $279,341 (+$14,648, +5.53% from previous year)
- 2021: $318,127 (+$38,785, +13.88% from previous year)
- 2022: $395,298 (+$77,172, +24.26% from previous year)
- 2023: $396,142 (+$844, +0.21% from previous year)
- 2024: $415,914 (+$19,772, +4.99% from previous year)
- 2025: $422,747 (+$6,833, +1.64% from previous year)
Home prices in Summerset have risen by 89% since 2016, moving from $223,407 to $422,747 over nine years. While the early years showed steady growth, most of the appreciation occurred during 2020 to 2022, when prices jumped nearly $116,000 in just two years. Since then, the market has cooled but continued on an upward path, with smaller annual gains. The town now holds a firm position among South Dakota’s top 15 most expensive housing markets.
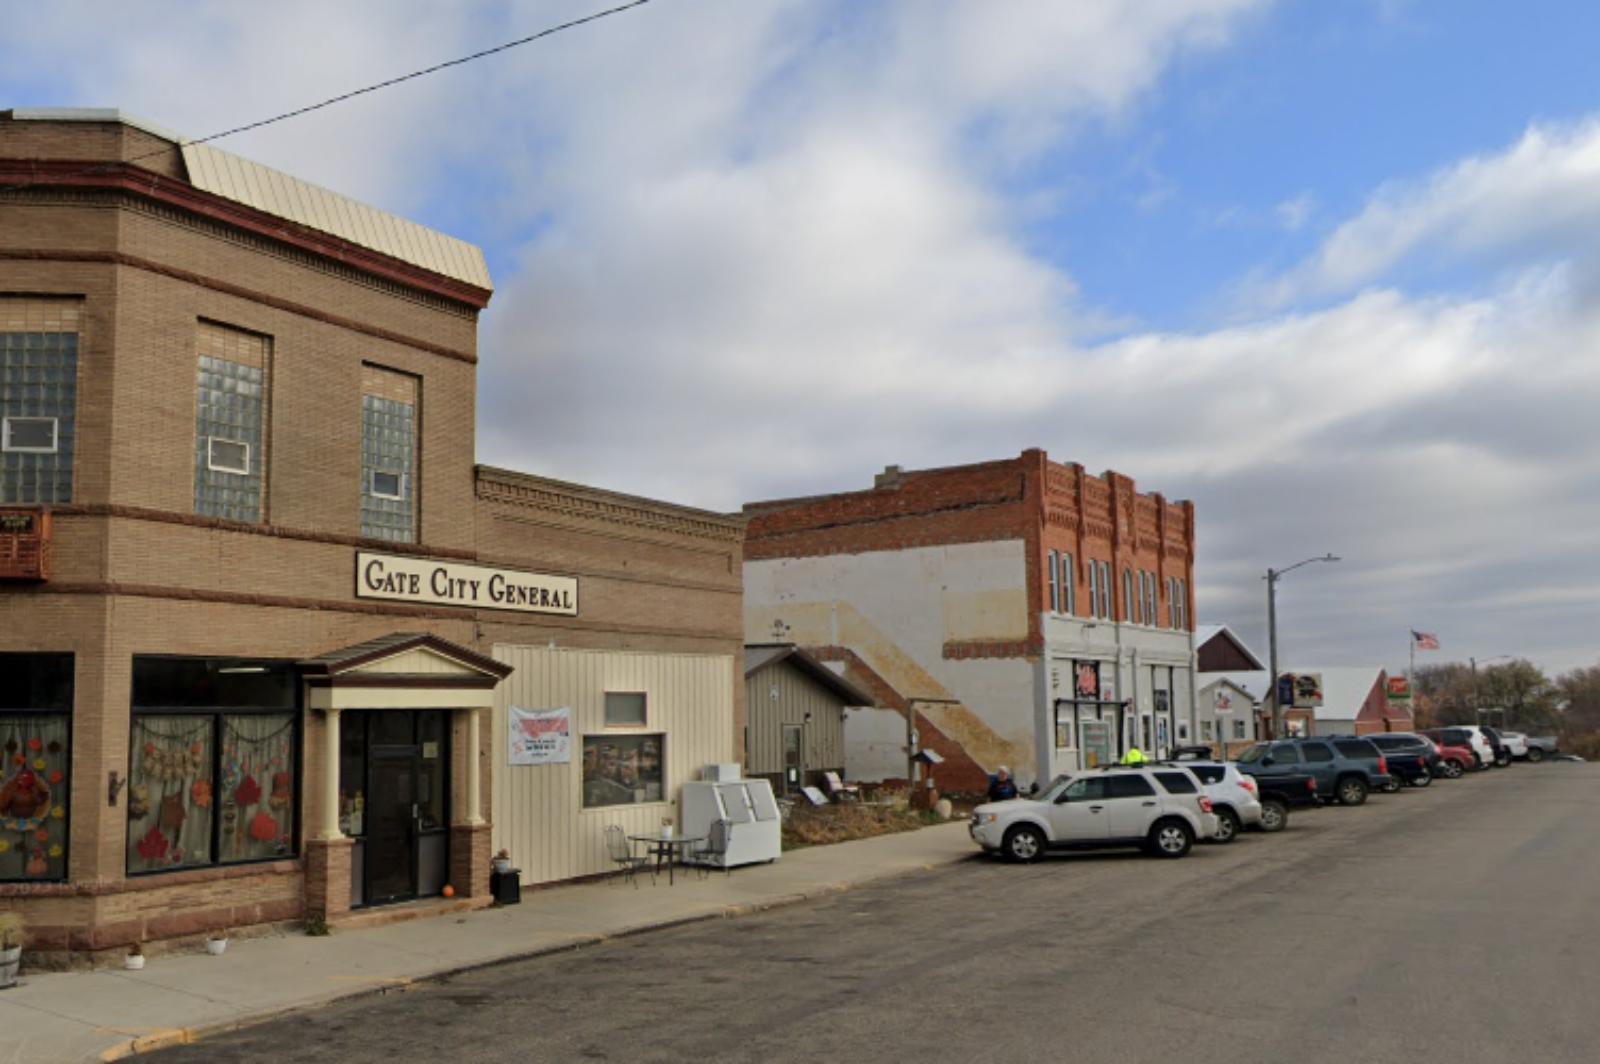
Summerset – Suburban Expansion in the Foothills
Summerset is one of the fastest-growing suburban areas in western South Dakota, positioned just northwest of Rapid City in Meade County. Its location at the junction of I-90 and Highway 79 gives it an ideal position for commuters, making it an increasingly attractive option for people working in Rapid City who want more space and newer homes. What started as a quiet residential extension has now become a well-established bedroom community with its own schools, civic facilities, and shopping areas. The local government has invested in roads, utilities, and zoning that accommodate continued residential growth. With development-friendly policies and a strong local demand for housing, Summerset has grown quickly, and its home prices have followed. Many buyers are drawn to the town’s blend of affordability and proximity to the Black Hills without being immersed in tourism or traffic.
The numbers confirm just how intense that growth has been. Prices remained steady and manageable through the 2010s, but when demand surged in 2020, Summerset became a breakout market. The 24% rise in 2022 alone is one of the steepest single-year increases in the region. Since then, while the pace has calmed, values have continued to rise—showing staying power rather than fragility. Builders have responded by expanding neighborhoods and adding inventory, yet prices remain high due to the steady inflow of families and retirees. As long as Rapid City’s economy stays strong and housing demand stretches outward, Summerset will likely remain one of the top suburban markets in western South Dakota.
14. Deadwood – 114% Home Price Increase Since 2013
- 2010: N/A
- 2011: N/A
- 2012: N/A
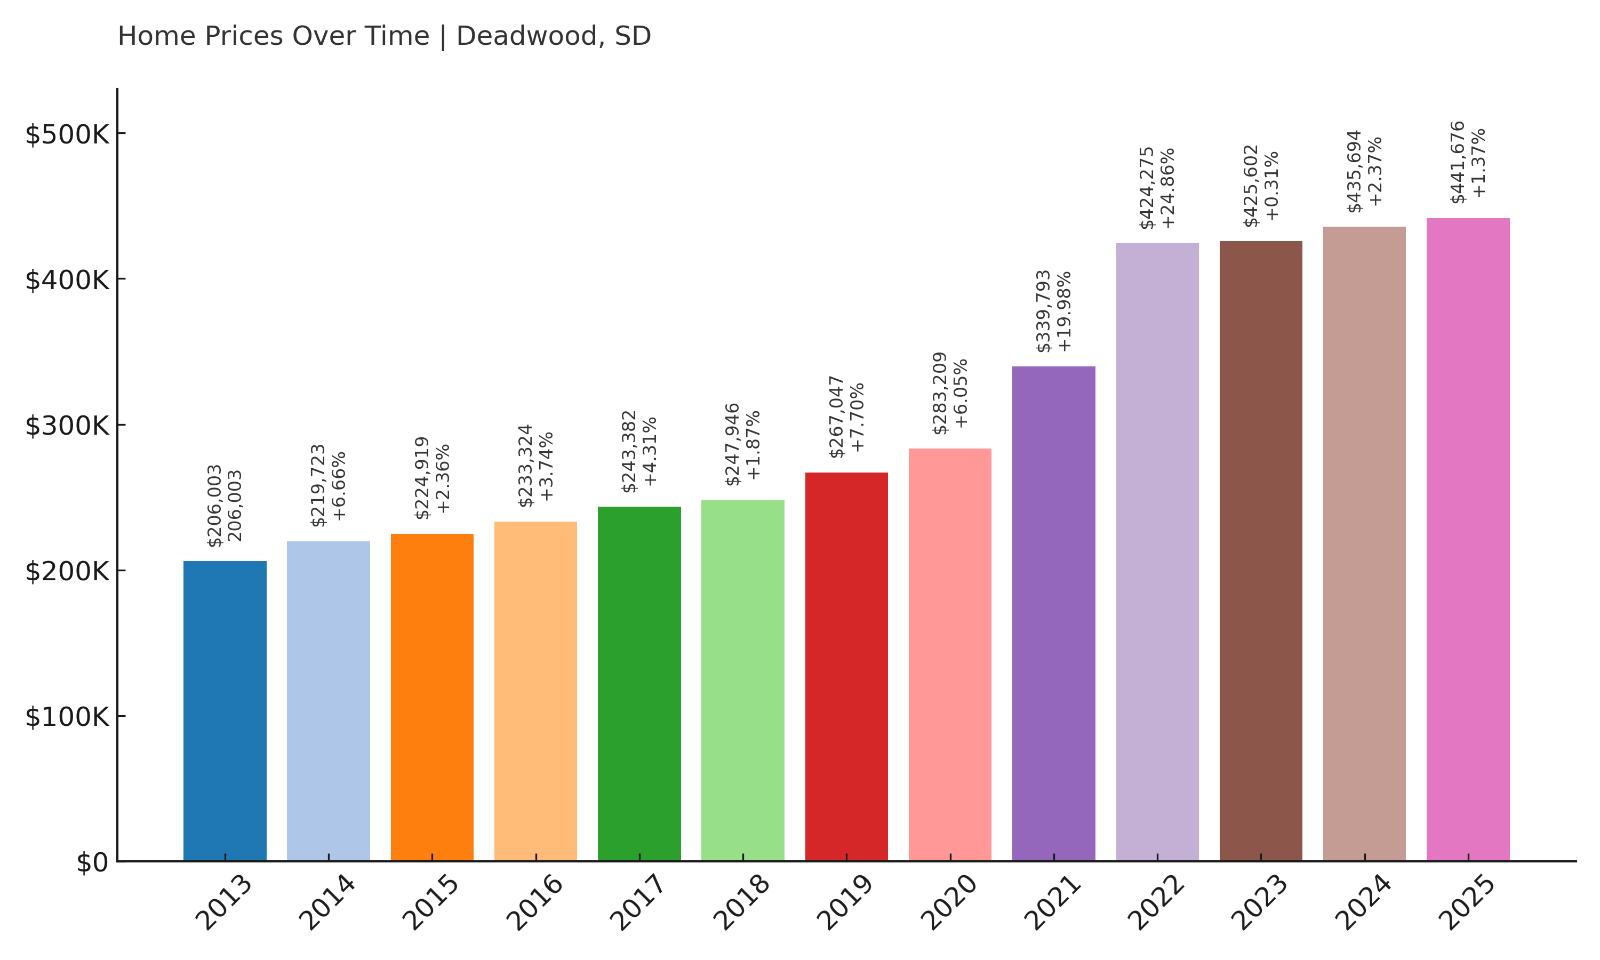
- 2013: $206,003
- 2014: $219,723 (+$13,721, +6.66% from previous year)
- 2015: $224,919 (+$5,196, +2.36% from previous year)
- 2016: $233,324 (+$8,405, +3.74% from previous year)
- 2017: $243,382 (+$10,058, +4.31% from previous year)
- 2018: $247,946 (+$4,563, +1.87% from previous year)
- 2019: $267,047 (+$19,101, +7.70% from previous year)
- 2020: $283,209 (+$16,163, +6.05% from previous year)
- 2021: $339,793 (+$56,583, +19.98% from previous year)
- 2022: $424,275 (+$84,482, +24.86% from previous year)
- 2023: $425,602 (+$1,327, +0.31% from previous year)
- 2024: $435,694 (+$10,091, +2.37% from previous year)
- 2025: $441,676 (+$5,983, +1.37% from previous year)
Since 2013, home prices in Deadwood have risen from $206,003 to $441,676, marking a 114% increase over twelve years. Most of the acceleration occurred between 2020 and 2022, when prices jumped by over $140,000. Though recent growth has slowed, home values have remained high and continue to inch upward each year, showing strong long-term resilience.
Deadwood – Historic Allure With Modern Demand
Deadwood is one of South Dakota’s most iconic towns, known for its rich mining history, Wild West heritage, and status as a National Historic Landmark. Located deep in the Black Hills, the town draws thousands of tourists every year—but it’s also become an increasingly popular place to own property. Unlike resort towns that rise and fall with seasonal interest, Deadwood maintains year-round demand thanks to its unique character, local events, and permanent amenities. Its tightly controlled zoning and preservation efforts mean that available housing is limited, and new development is often restricted. That scarcity plays a big role in pushing up prices, especially for homes with historic value or desirable downtown locations. Deadwood’s old mining cottages, restored Victorians, and tucked-away cabins now command a premium, especially among out-of-state buyers seeking unique homes with character and strong Airbnb potential.
The housing data supports the town’s long-term appeal. Price gains in the 2010s were steady, but the real boom came after 2020, when national buyers started looking toward lifestyle-rich towns with charm and natural beauty. Between 2020 and 2022 alone, values rose by nearly 50%, one of the sharpest increases in the state. While the growth has calmed since, prices have not fallen—instead, they’ve held strong with modest gains in 2024 and 2025. This suggests that Deadwood’s appeal isn’t just a trend; it’s structural. With continued tourism, a strong short-term rental market, and limited inventory, Deadwood is likely to remain one of the Black Hills’ most valuable real estate locations for years to come.
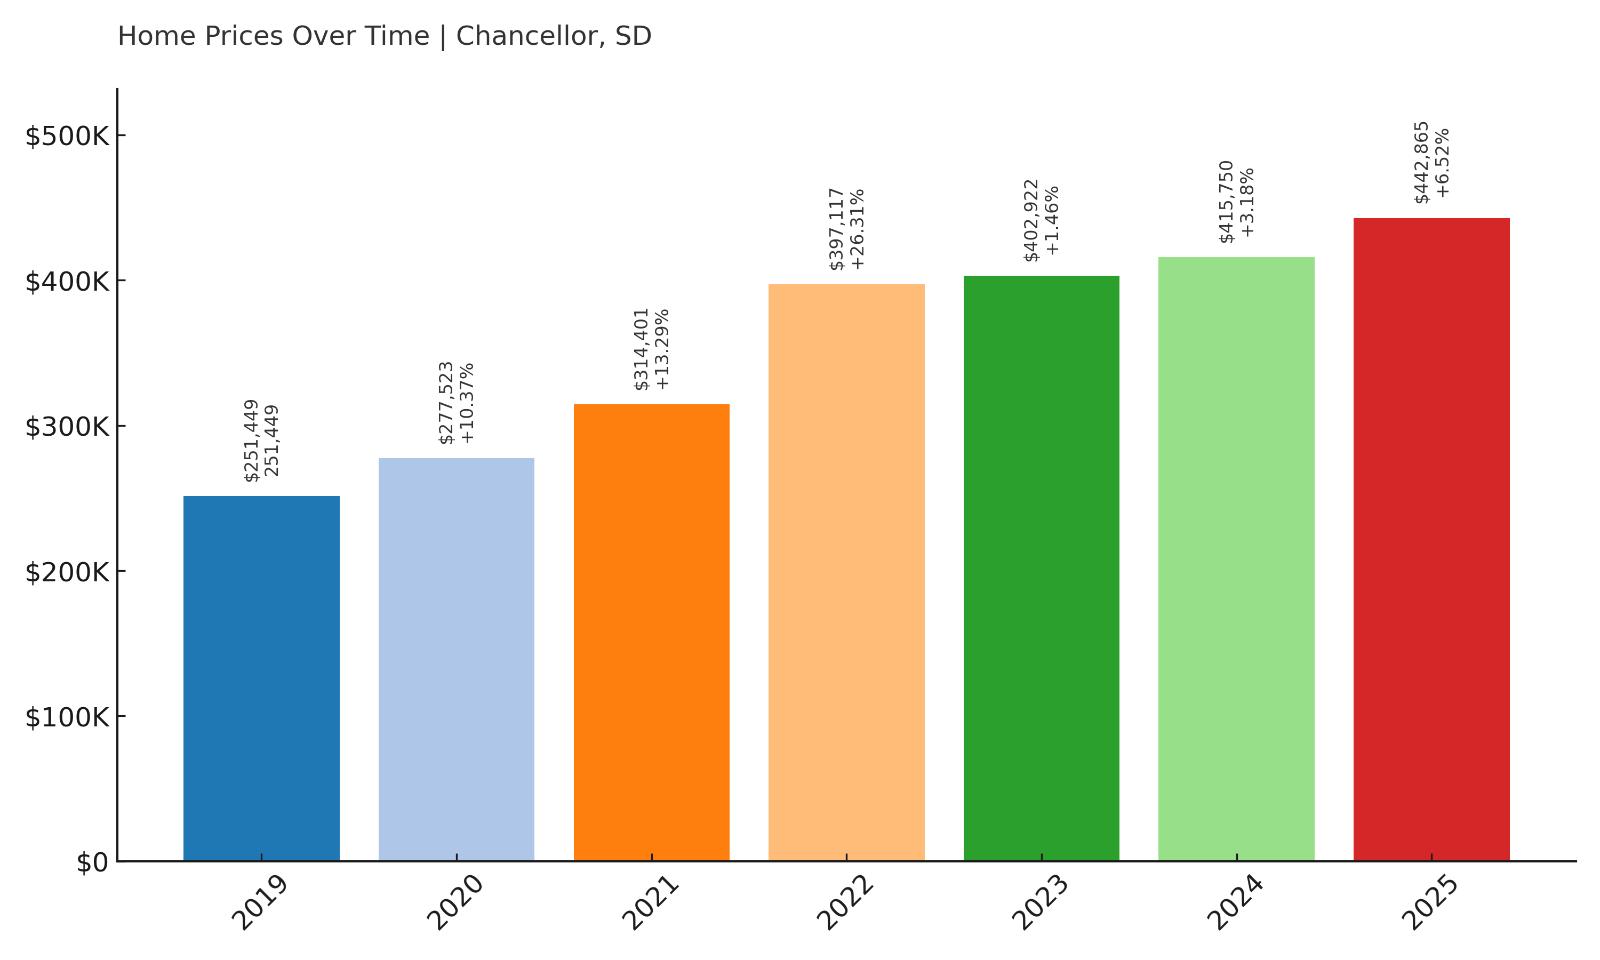
13. Chancellor – 76% Home Price Increase Since 2019
- 2010: N/A
- 2011: N/A
- 2012: N/A
- 2013: N/A
- 2014: N/A
- 2015: N/A
- 2016: N/A
- 2017: N/A
- 2018: N/A
- 2019: $251,449
- 2020: $277,523 (+$26,074, +10.37% from previous year)
- 2021: $314,401 (+$36,878, +13.29% from previous year)
- 2022: $397,117 (+$82,716, +26.31% from previous year)
- 2023: $402,922 (+$5,805, +1.46% from previous year)
- 2024: $415,750 (+$12,827, +3.18% from previous year)
- 2025: $442,865 (+$27,116, +6.52% from previous year)
Chancellor has seen its average home value rise from $251,449 in 2019 to $442,865 in 2025, a 76% increase in just six years. Most of this surge occurred from 2020 through 2022, with a notable $145,000 jump during that short window. Even as growth slowed, the town has maintained consistent year-over-year gains, showing ongoing buyer interest and a robust market.
Chancellor – Small Town With Big Momentum
Located southwest of Sioux Falls in Turner County, Chancellor is one of those towns that quietly built momentum during the post-2020 housing boom. With a population under 300, it offers a deeply rural environment, yet remains within commuting distance of one of South Dakota’s largest job centers. That combination has made Chancellor increasingly attractive to remote workers and young families seeking affordability, land, and peace of mind. It’s also within reach of Highway 18 and other regional routes, keeping it connected without compromising its quiet charm. Many homes in Chancellor sit on larger lots, and its small housing inventory means that demand can quickly outstrip supply—especially when a new listing hits the market. Local infrastructure is modest but sufficient, and community cohesion remains one of its main draws.
The price data suggests this isn’t just speculative growth. Chancellor saw sustained appreciation through 2020–2022, but unlike some towns, it hasn’t dipped since. Prices rose again in 2024 and 2025, even as interest rates cooled the national market. That resilience may come from the town’s appeal to in-state buyers looking for alternatives to Sioux Falls or Harrisburg. Chancellor’s low density, quiet roads, and community-driven lifestyle all make it an increasingly rare commodity in a fast-changing real estate landscape. With no sign of overdevelopment and demand still outpacing supply, Chancellor may continue to outshine its small footprint with outsized price gains.
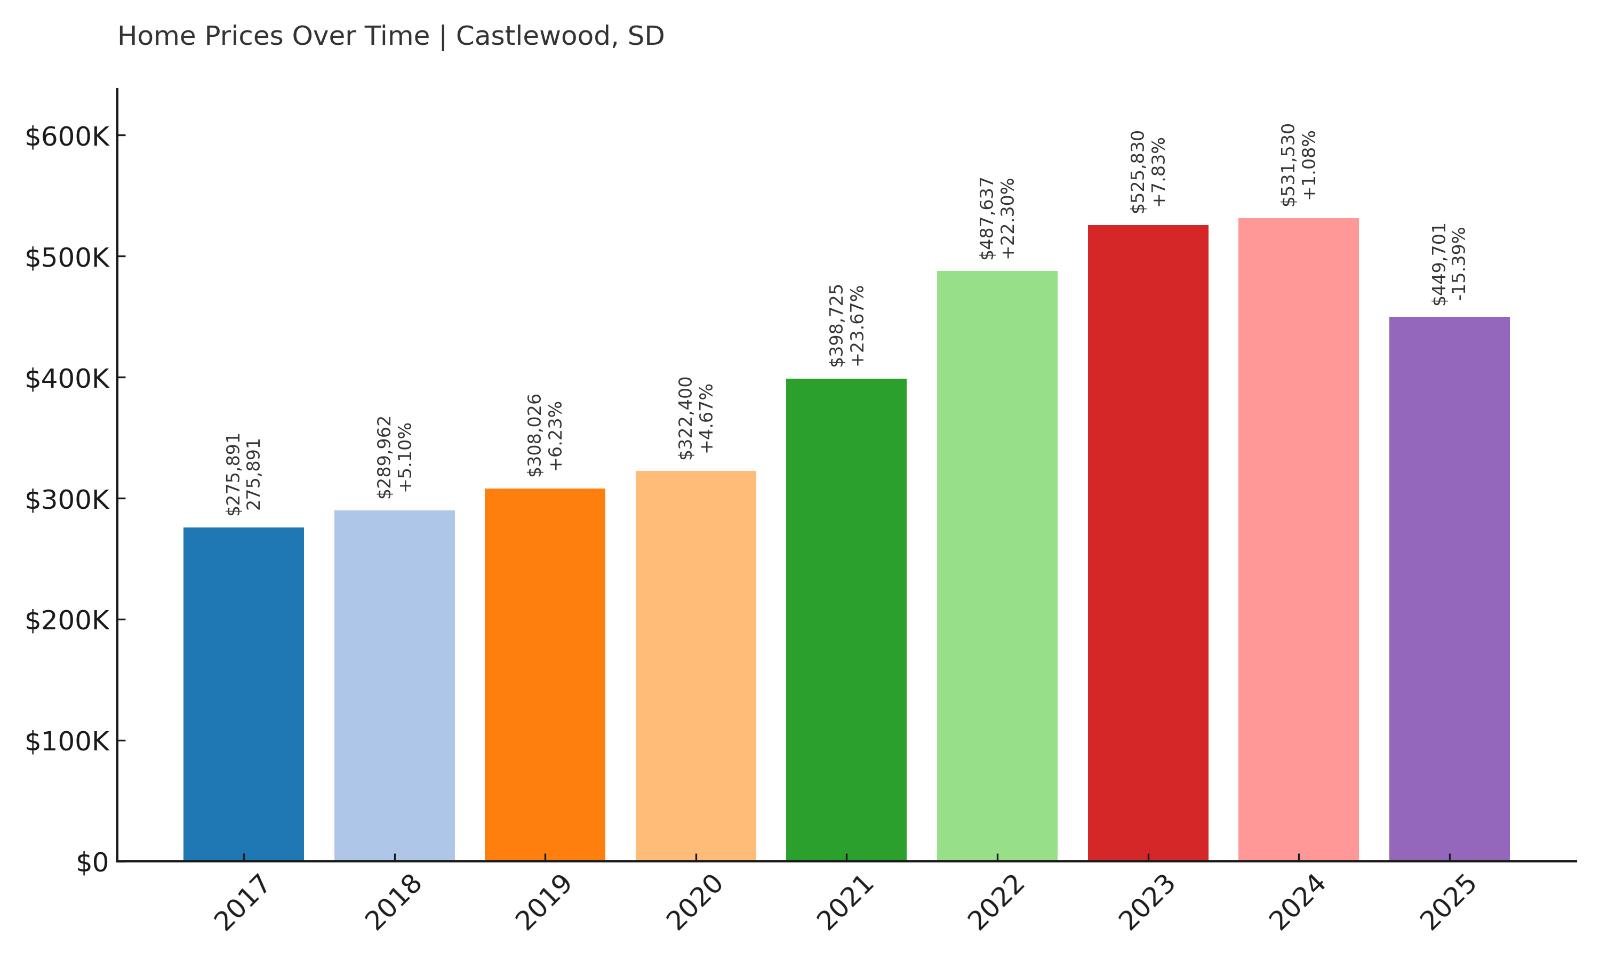
12. Castlewood – 63% Home Price Increase Since 2017
- 2010: N/A
- 2011: N/A
- 2012: N/A
- 2013: N/A
- 2014: N/A
- 2015: N/A
- 2016: N/A
- 2017: $275,891
- 2018: $289,962 (+$14,071, +5.10% from previous year)
- 2019: $308,026 (+$18,064, +6.23% from previous year)
- 2020: $322,400 (+$14,375, +4.67% from previous year)
- 2021: $398,725 (+$76,324, +23.67% from previous year)
- 2022: $487,637 (+$88,912, +22.30% from previous year)
- 2023: $525,830 (+$38,193, +7.83% from previous year)
- 2024: $531,530 (+$5,700, +1.08% from previous year)
- 2025: $449,701 (-$81,829, -15.39% from previous year)
Castlewood saw home prices jump from $275,891 in 2017 to $449,701 in 2025, marking a 63% increase. The peak came in 2023, with values topping $525,000, but prices dropped sharply in 2025—losing over $80,000 in one year. Even so, the town remains one of the highest-priced markets in eastern South Dakota, and its long-term trend still reflects strong appreciation.
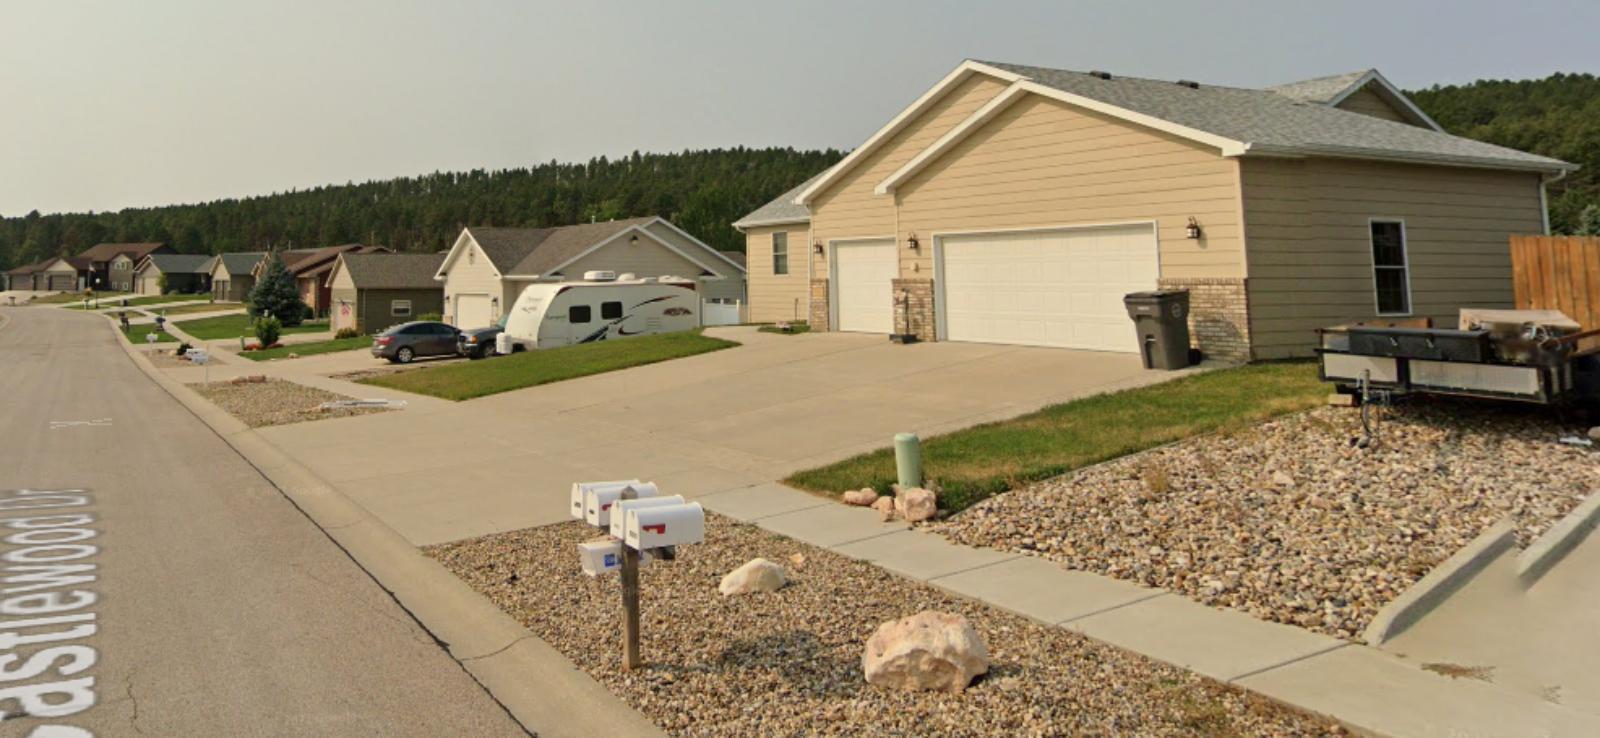
Castlewood – Booming Then Balancing
Castlewood is a small town in Hamlin County, positioned northeast of Lake Poinsett and within easy reach of Watertown. It’s known for its strong school district, quiet residential feel, and access to lakes and recreation. The combination of rural appeal and decent infrastructure made it a magnet for buyers during the pandemic housing boom. Homes here typically offer more space than what you’d find in larger cities, and that space became a premium between 2020 and 2022. Inventory was extremely limited, which contributed to rapid price escalation. As bidding wars swept across small-town South Dakota, Castlewood became one of the hottest names on the regional real estate radar.
The price decline in 2025 reflects a broader cooling after an unsustainable run-up. But unlike weaker markets, Castlewood’s drop seems to be more about correction than collapse. Even after the dip, average prices are still far higher than anything seen pre-2020. The town’s desirability remains intact, particularly for families who want good schools and proximity to both recreation and job centers. If prices stabilize in the next year or two, Castlewood may once again become one of the most sought-after housing markets in the region—especially if the post-boom reset makes it more accessible to mid-range buyers.
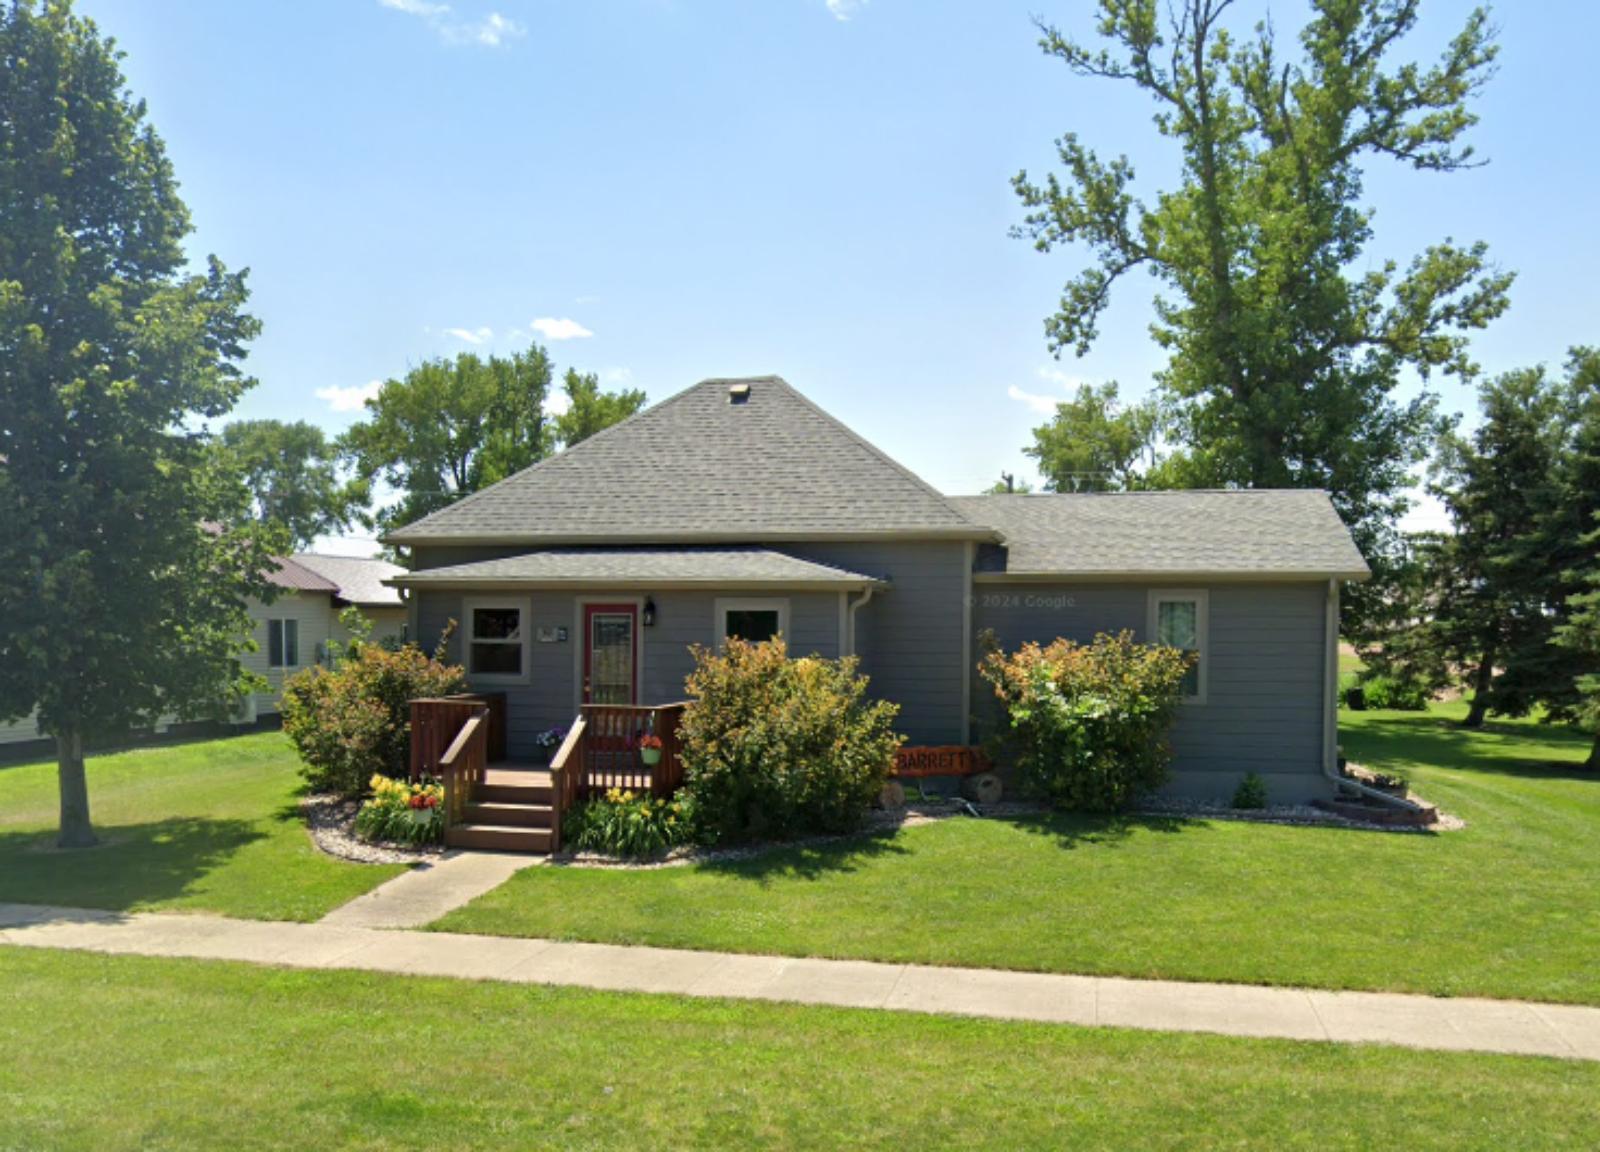
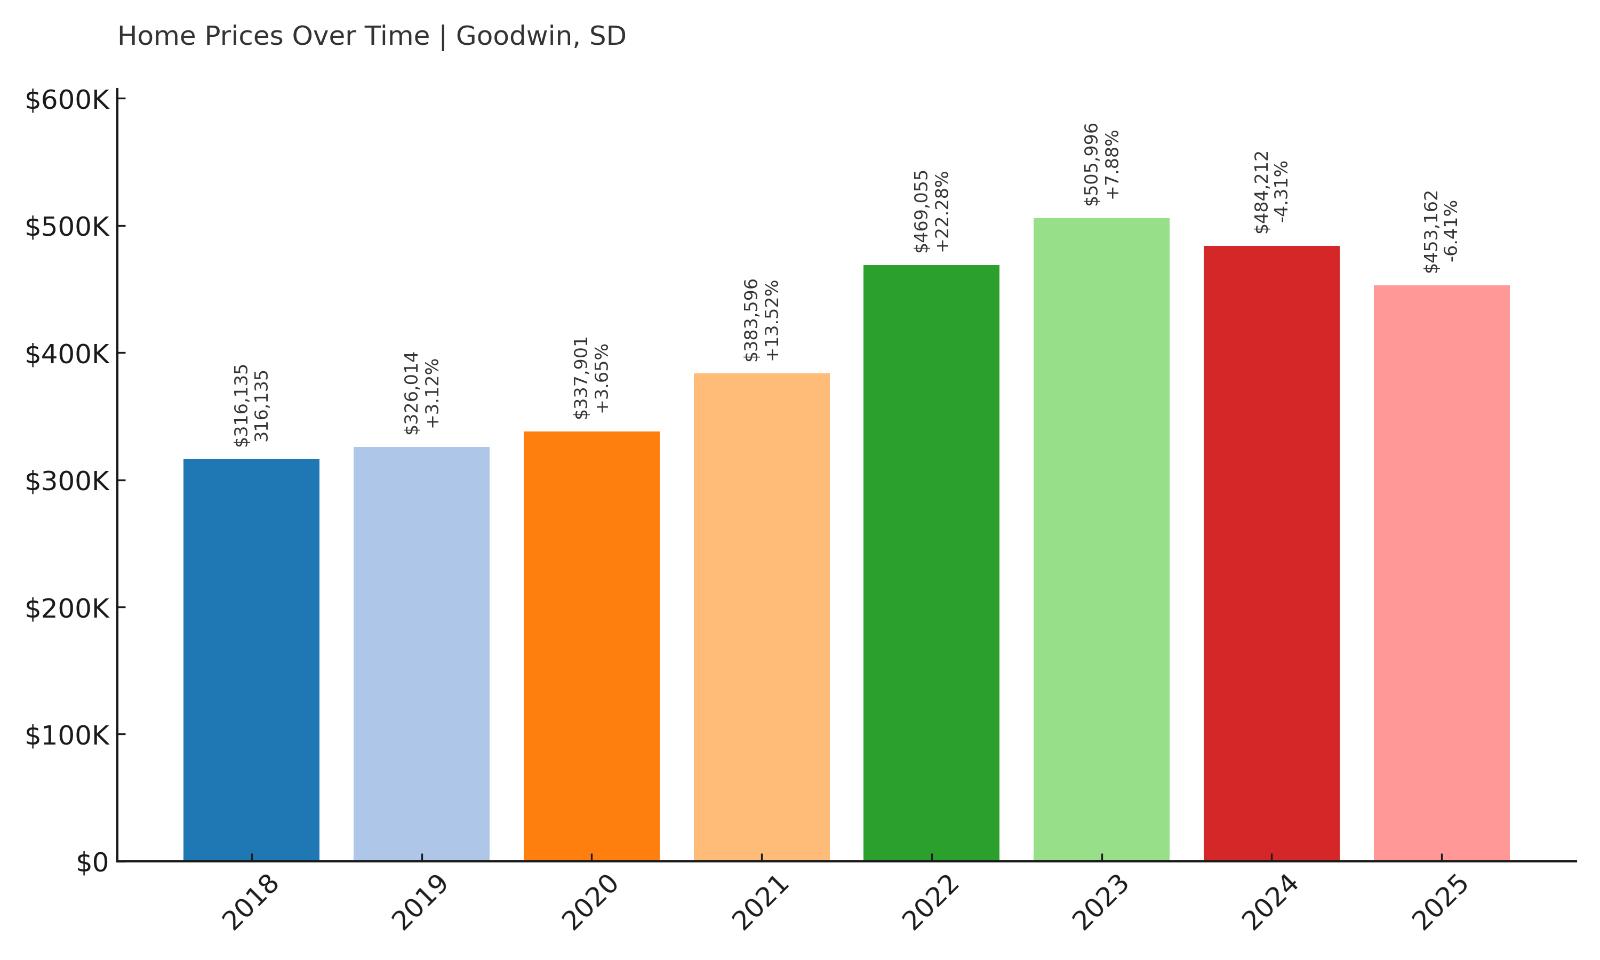
11. Goodwin – 43% Home Price Increase Since 2018
- 2010: N/A
- 2011: N/A
- 2012: N/A
- 2013: N/A
- 2014: N/A
- 2015: N/A
- 2016: N/A
- 2017: N/A
- 2018: $316,135
- 2019: $326,014 (+$9,879, +3.12% from previous year)
- 2020: $337,901 (+$11,887, +3.65% from previous year)
- 2021: $383,596 (+$45,694, +13.52% from previous year)
- 2022: $469,055 (+$85,460, +22.28% from previous year)
- 2023: $505,996 (+$36,940, +7.88% from previous year)
- 2024: $484,212 (-$21,784, -4.31% from previous year)
- 2025: $453,162 (-$31,050, -6.41% from previous year)
Goodwin’s housing market rose from $316,135 in 2018 to a peak of $505,996 in 2023, before falling to $453,162 in 2025. This still marks a 43% increase over the seven-year span. The recent two-year correction has shaved off some of the gains, but overall price levels remain historically elevated and firmly in the top half of South Dakota’s most expensive towns.
Goodwin – Small Town Market With a Post-Boom Pullback
Located in Deuel County in far eastern South Dakota, Goodwin is a quiet rural town with limited commercial activity but strong ties to nearby Watertown and the surrounding lakes region. Its location makes it a desirable spot for buyers seeking solitude without sacrificing access to larger services. During the housing surge of the early 2020s, this combination made Goodwin one of the region’s top performers. With few listings and rising demand from both in-state and out-of-state buyers, home prices took off rapidly. The town’s low inventory meant that nearly every sale nudged the average price higher. For a few years, it became a hot target for people priced out of the bigger markets or looking for peaceful, spacious homes in South Dakota’s open plains.
The drop in home values in 2024 and 2025 likely reflects the recalibration that many overheated towns have seen since the pandemic-era peak. Even so, the broader trend suggests that the town still holds long-term value. It remains connected to a solid regional economy, has access to lakes and land, and offers buyers a lifestyle that’s become increasingly rare. Goodwin may not return to its 2023 price peak right away, but its fundamentals remain sound. And for buyers entering the market now, it may offer a better deal than it has in years—making it worth watching as conditions stabilize.
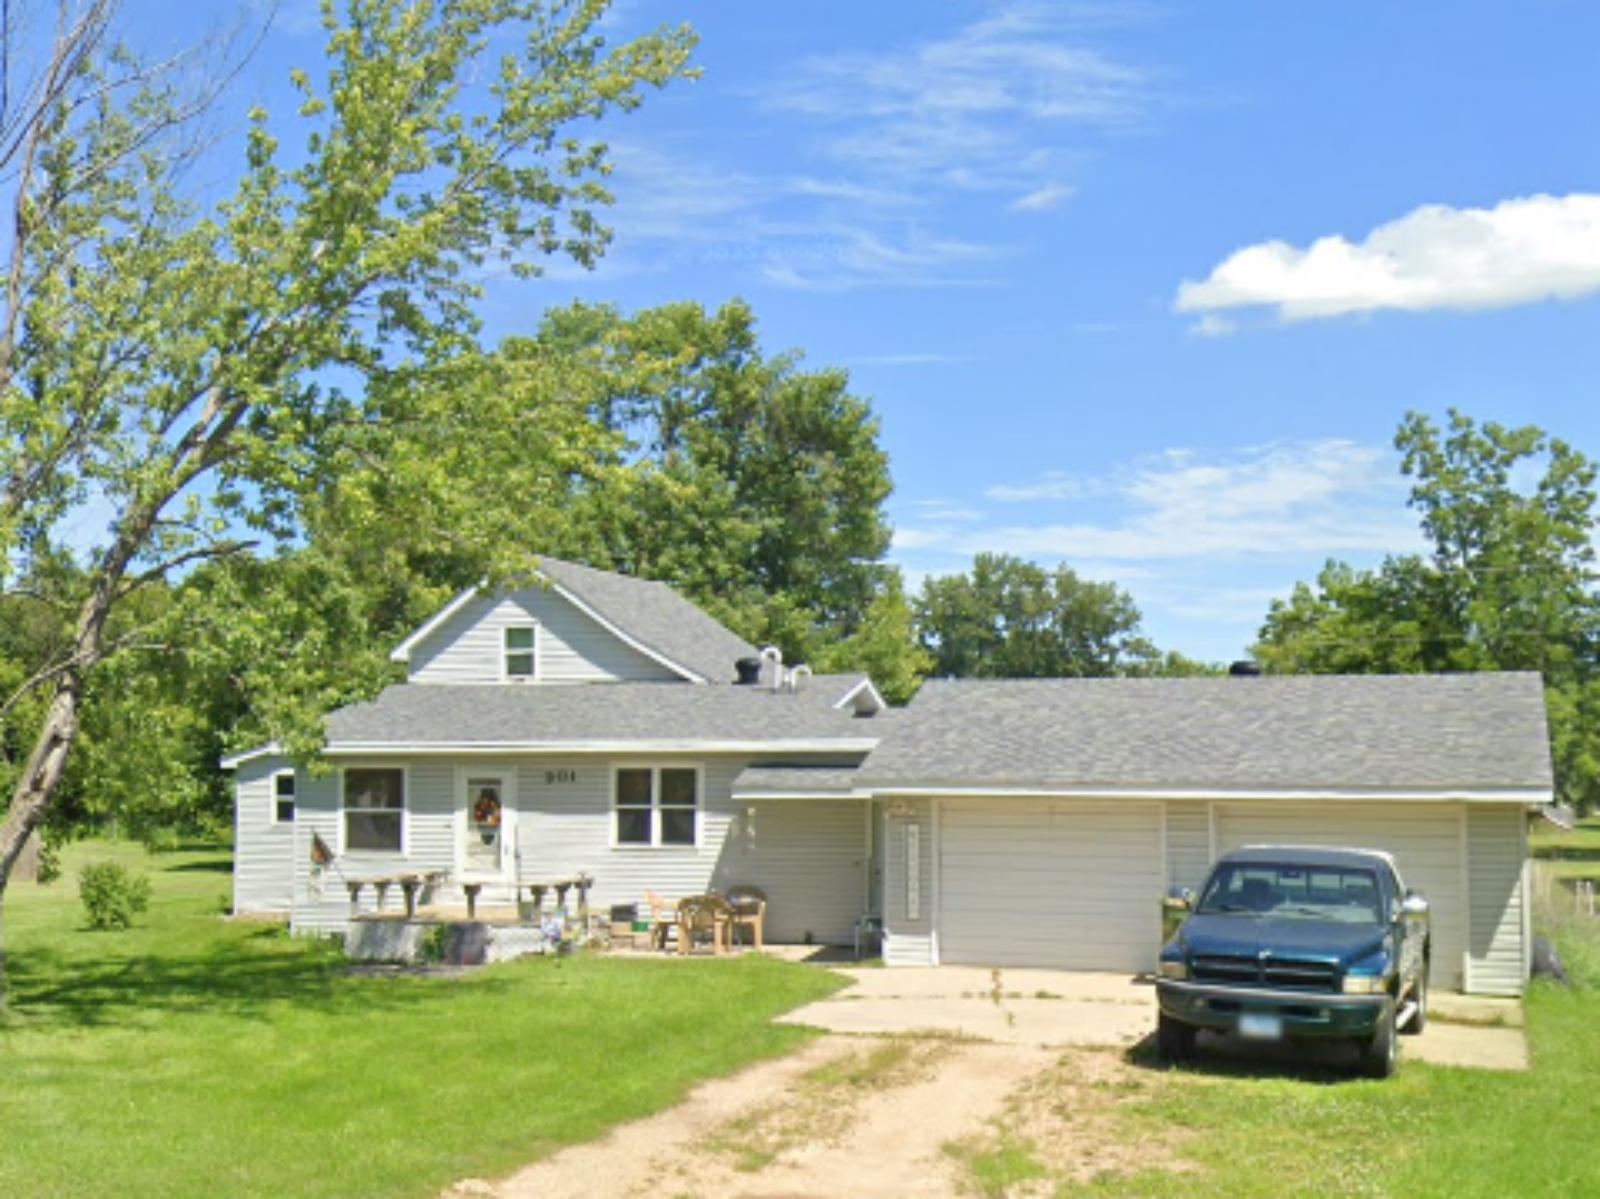
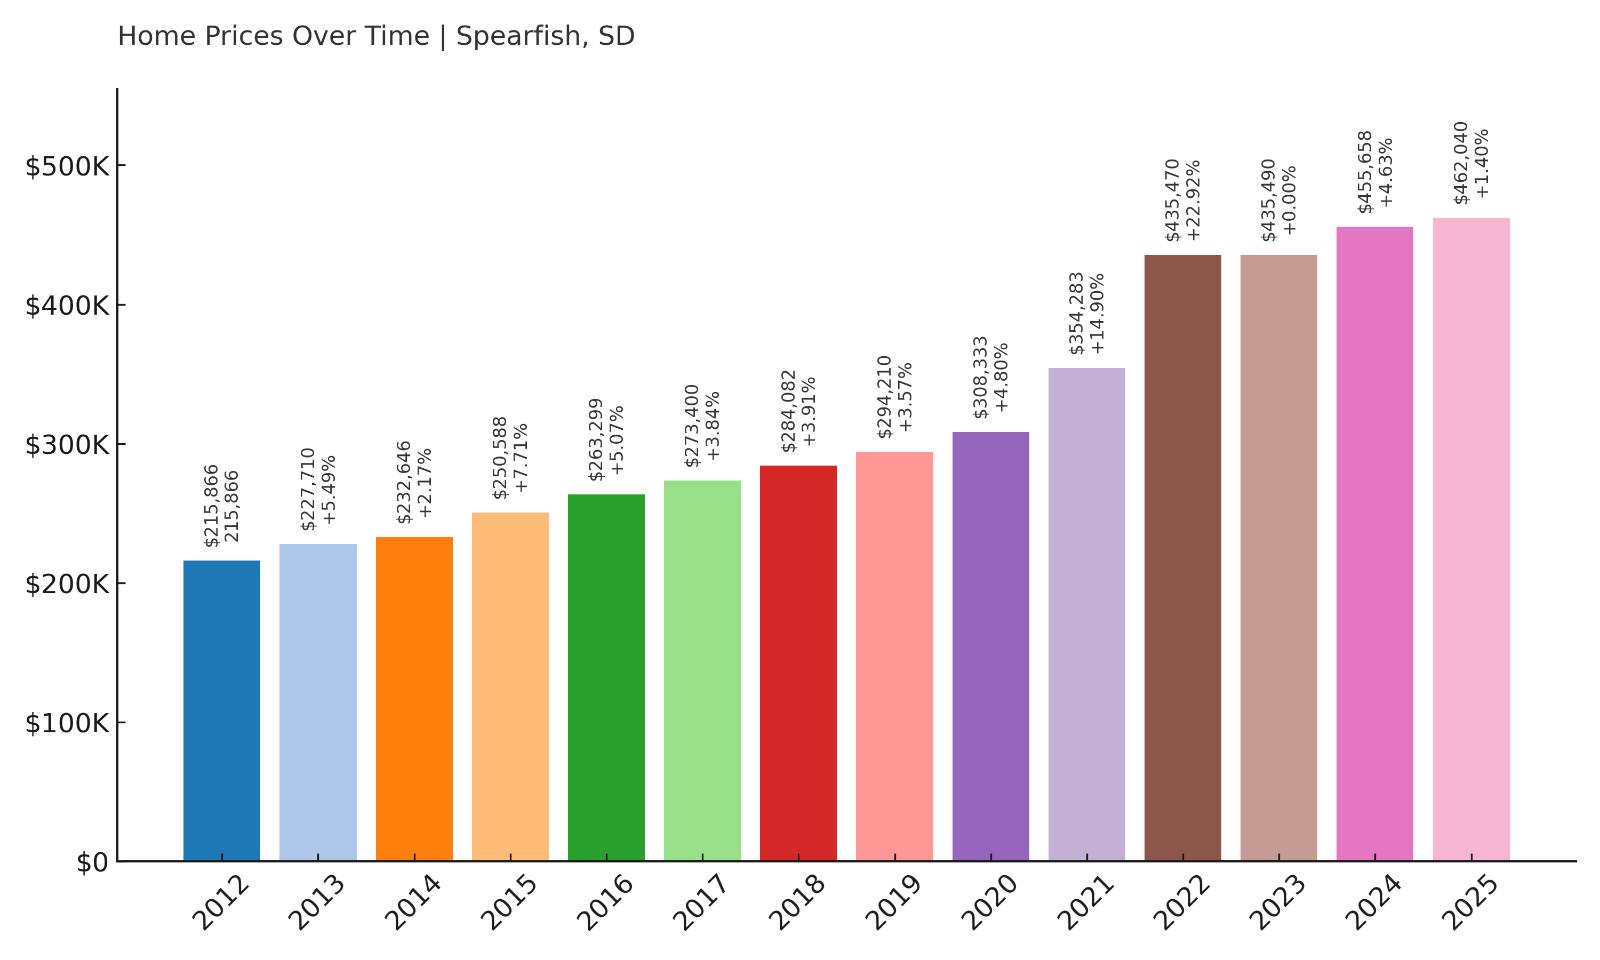
10. Spearfish – 114% Home Price Increase Since 2012
- 2010: N/A
- 2011: N/A
- 2012: $215,866
- 2013: $227,710 (+$11,844, +5.49% from previous year)
- 2014: $232,646 (+$4,936, +2.17% from previous year)
- 2015: $250,588 (+$17,941, +7.71% from previous year)
- 2016: $263,299 (+$12,711, +5.07% from previous year)
- 2017: $273,400 (+$10,101, +3.84% from previous year)
- 2018: $284,082 (+$10,682, +3.91% from previous year)
- 2019: $294,210 (+$10,128, +3.57% from previous year)
- 2020: $308,333 (+$14,123, +4.80% from previous year)
- 2021: $354,283 (+$45,950, +14.90% from previous year)
- 2022: $435,470 (+$81,187, +22.92% from previous year)
- 2023: $435,490 (+$20, +0.00% from previous year)
- 2024: $455,658 (+$20,167, +4.63% from previous year)
- 2025: $462,040 (+$6,382, +1.40% from previous year)
Home prices in Spearfish have more than doubled since 2012, climbing from $215,866 to $462,040 in 2025—a total increase of 114%. The biggest spikes occurred from 2020 to 2022, when prices rose by over $127,000 in just two years. Even after a flat 2023, the market rebounded in 2024 and continues to rise modestly, confirming Spearfish’s place as one of the most in-demand towns in the Black Hills.
Spearfish – A University Town Anchored by Nature
Located along the northern edge of the Black Hills, Spearfish blends small-town comfort with outdoor access, higher education, and year-round amenities. It’s home to Black Hills State University, which helps drive both population stability and economic activity. Beyond academics, the town’s surrounding natural attractions—Spearfish Canyon, waterfalls, hiking trails—make it a dream for outdoor enthusiasts. The historic downtown core remains vibrant, filled with independent shops, breweries, and cafes. This mix of college-town energy and natural beauty has steadily attracted buyers from both in-state and beyond, particularly retirees and remote workers who appreciate the slower pace but still want an active lifestyle. Its elevation and clean air add to the allure, making it one of South Dakota’s most livable towns.
What sets Spearfish apart is its resilience. While many towns saw price declines after peaking in 2022, Spearfish flatlined for only one year before prices picked back up in 2024. That stability hints at strong fundamentals—consistent demand, low vacancy, and a limited but desirable housing stock. New construction has tried to keep pace, but the geography around Spearfish limits how far and fast development can spread. That built-in scarcity adds value to existing homes. As outdoor-focused living becomes more desirable nationwide, Spearfish’s combination of scenery, education, and quality of life will likely keep its housing market on solid ground—even if the explosive gains of the early 2020s are behind it.
9. Hill City – 150% Home Price Increase Since 2012
🔥 Would you like to save this?
- 2010: $214,819
- 2011: $208,764 (-$6,055, -2.82% from previous year)
- 2012: $186,196 (-$22,568, -10.81% from previous year)
- 2013: $198,228 (+$12,032, +6.46% from previous year)
- 2014: $206,059 (+$7,831, +3.95% from previous year)
- 2015: $212,590 (+$6,530, +3.17% from previous year)
- 2016: $217,505 (+$4,915, +2.31% from previous year)
- 2017: $229,084 (+$11,579, +5.32% from previous year)
- 2018: $244,024 (+$14,940, +6.52% from previous year)
- 2019: $259,050 (+$15,027, +6.16% from previous year)
- 2020: $276,653 (+$17,602, +6.79% from previous year)
- 2021: $343,793 (+$67,141, +24.27% from previous year)
- 2022: $433,460 (+$89,667, +26.08% from previous year)
- 2023: $439,503 (+$6,043, +1.39% from previous year)
- 2024: $453,153 (+$13,650, +3.11% from previous year)
- 2025: $464,853 (+$11,700, +2.58% from previous year)
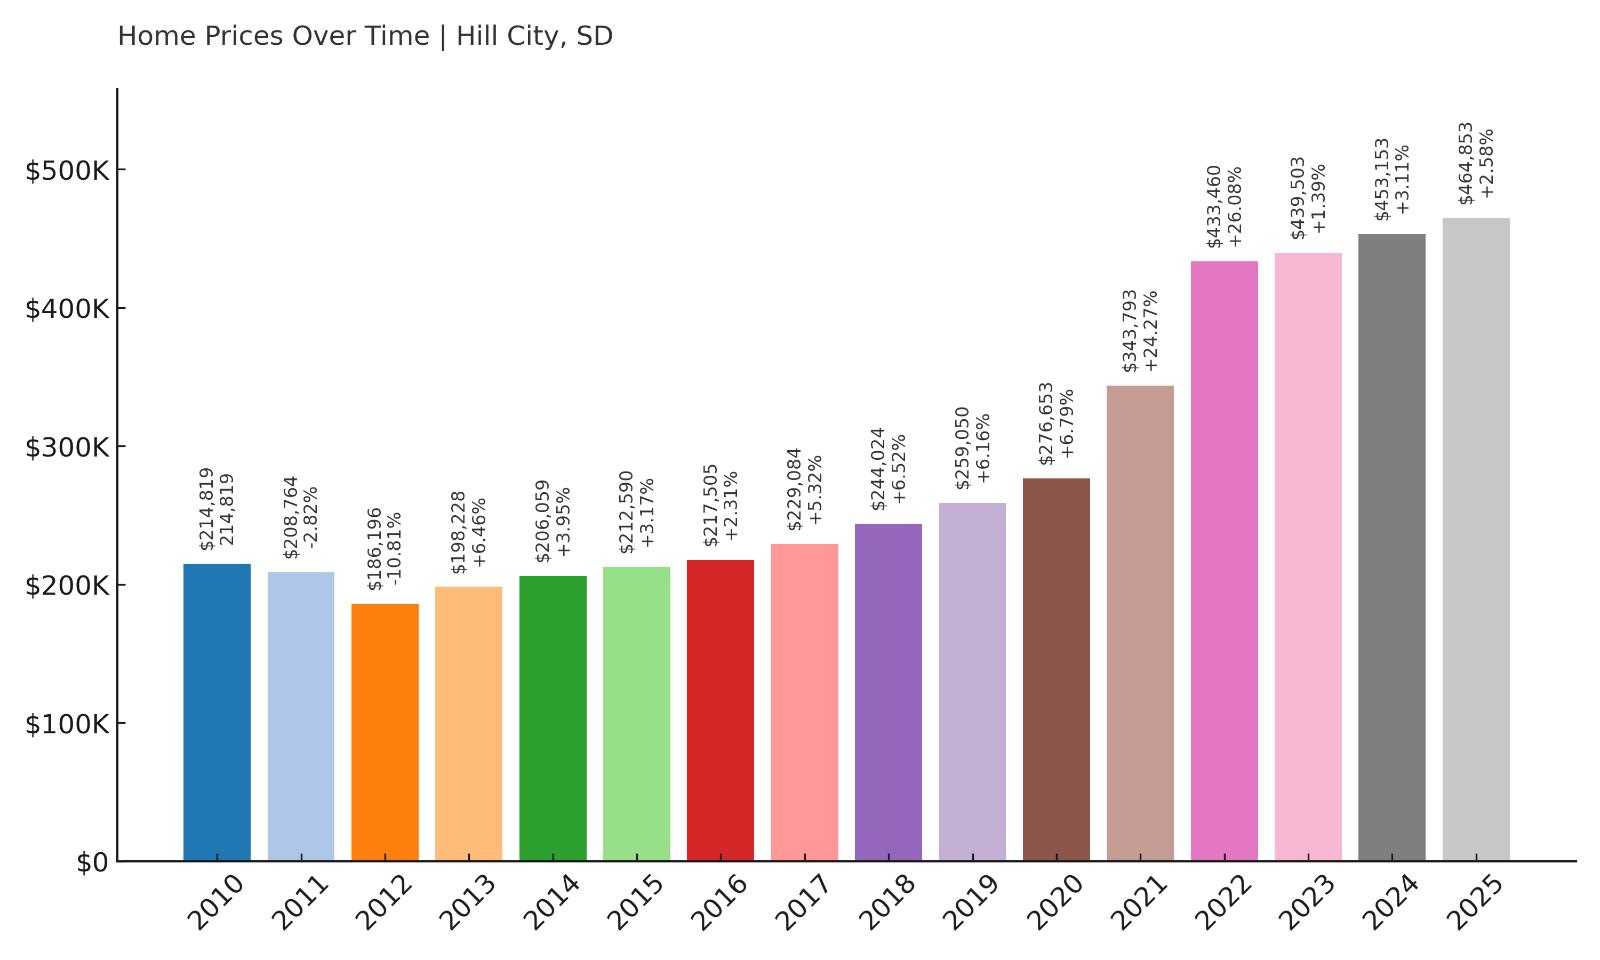
Hill City has seen prices climb from $186,196 in 2012 to $464,853 in 2025—an increase of over 150%. This rapid appreciation has been especially sharp since 2020, with home values gaining more than $180,000 in five years. While recent growth has leveled off, the market continues to post steady gains, placing Hill City firmly among the top 10 most expensive towns in the state.
Hill City – Gateway to South Dakota’s Most Famous Landmarks

Hill City is one of the best-located towns in the Black Hills, just minutes from Mount Rushmore, Crazy Horse Memorial, and Custer State Park. Its scenic beauty and central location have made it a top choice for both full-time residents and second-home buyers. The town’s charming downtown, walkable streets, and boutique shops cater to visitors, but it’s also home to a growing number of permanent residents who enjoy the combination of nature and culture. Hill City maintains a small population and a relaxed pace of life, while offering access to world-class hiking, mountain biking, and outdoor recreation. The school district is small but well-regarded, and the local economy benefits from tourism, the arts, and seasonal events. All of this supports strong demand for housing, despite the town’s compact footprint and limited supply of available land.
The sharp rise in prices since 2020 underscores Hill City’s evolution from a tourist stop to a premium destination. Between 2020 and 2022 alone, average home prices jumped more than $156,000. Even now, with market pressures easing elsewhere, Hill City’s values are holding steady—a sign of long-term demand rather than short-term spikes. Inventory remains tight, and buyers are often competing for a handful of available listings, particularly those with views or proximity to the historic district. As the Black Hills region continues to attract visitors and retirees alike, Hill City is positioned to maintain its high-value status well into the future. It’s not just about the views—it’s about location, charm, and long-term livability.
8. Custer – 164% Home Price Increase Since 2012
- 2010: N/A
- 2011: N/A
- 2012: $178,714
- 2013: $190,419 (+$11,705, +6.55% from previous year)
- 2014: $197,183 (+$6,764, +3.55% from previous year)
- 2015: $214,389 (+$17,206, +8.73% from previous year)
- 2016: $225,077 (+$10,687, +4.98% from previous year)
- 2017: $236,646 (+$11,570, +5.14% from previous year)
- 2018: $249,509 (+$12,862, +5.44% from previous year)
- 2019: $277,943 (+$28,435, +11.40% from previous year)
- 2020: $298,385 (+$20,442, +7.35% from previous year)
- 2021: $348,445 (+$50,061, +16.78% from previous year)
- 2022: $427,159 (+$78,714, +22.59% from previous year)
- 2023: $445,449 (+$18,290, +4.28% from previous year)
- 2024: $453,627 (+$8,178, +1.84% from previous year)
- 2025: $472,006 (+$18,379, +4.05% from previous year)
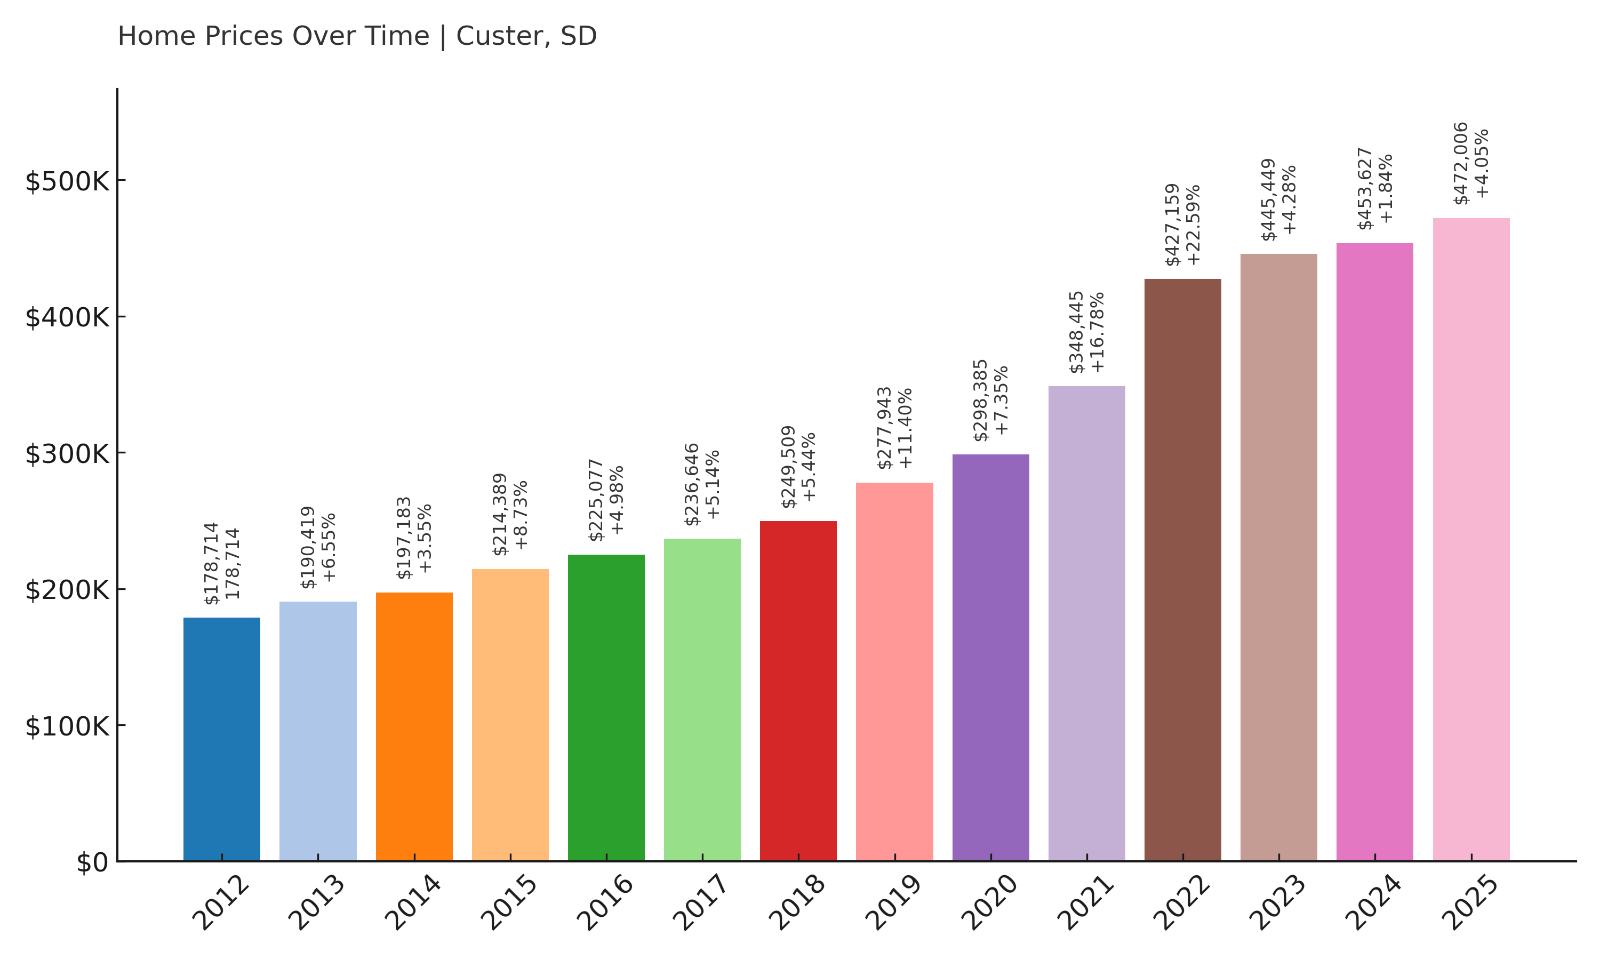
Since 2012, Custer’s average home price has risen by a massive 164%, jumping from $178,714 to $472,006. Growth was particularly intense between 2020 and 2022, when values surged more than $128,000 in two years. Even now, prices continue to climb steadily year-over-year, confirming strong, ongoing demand in this Black Hills community.
Custer – Outdoor Access and Year-Round Community
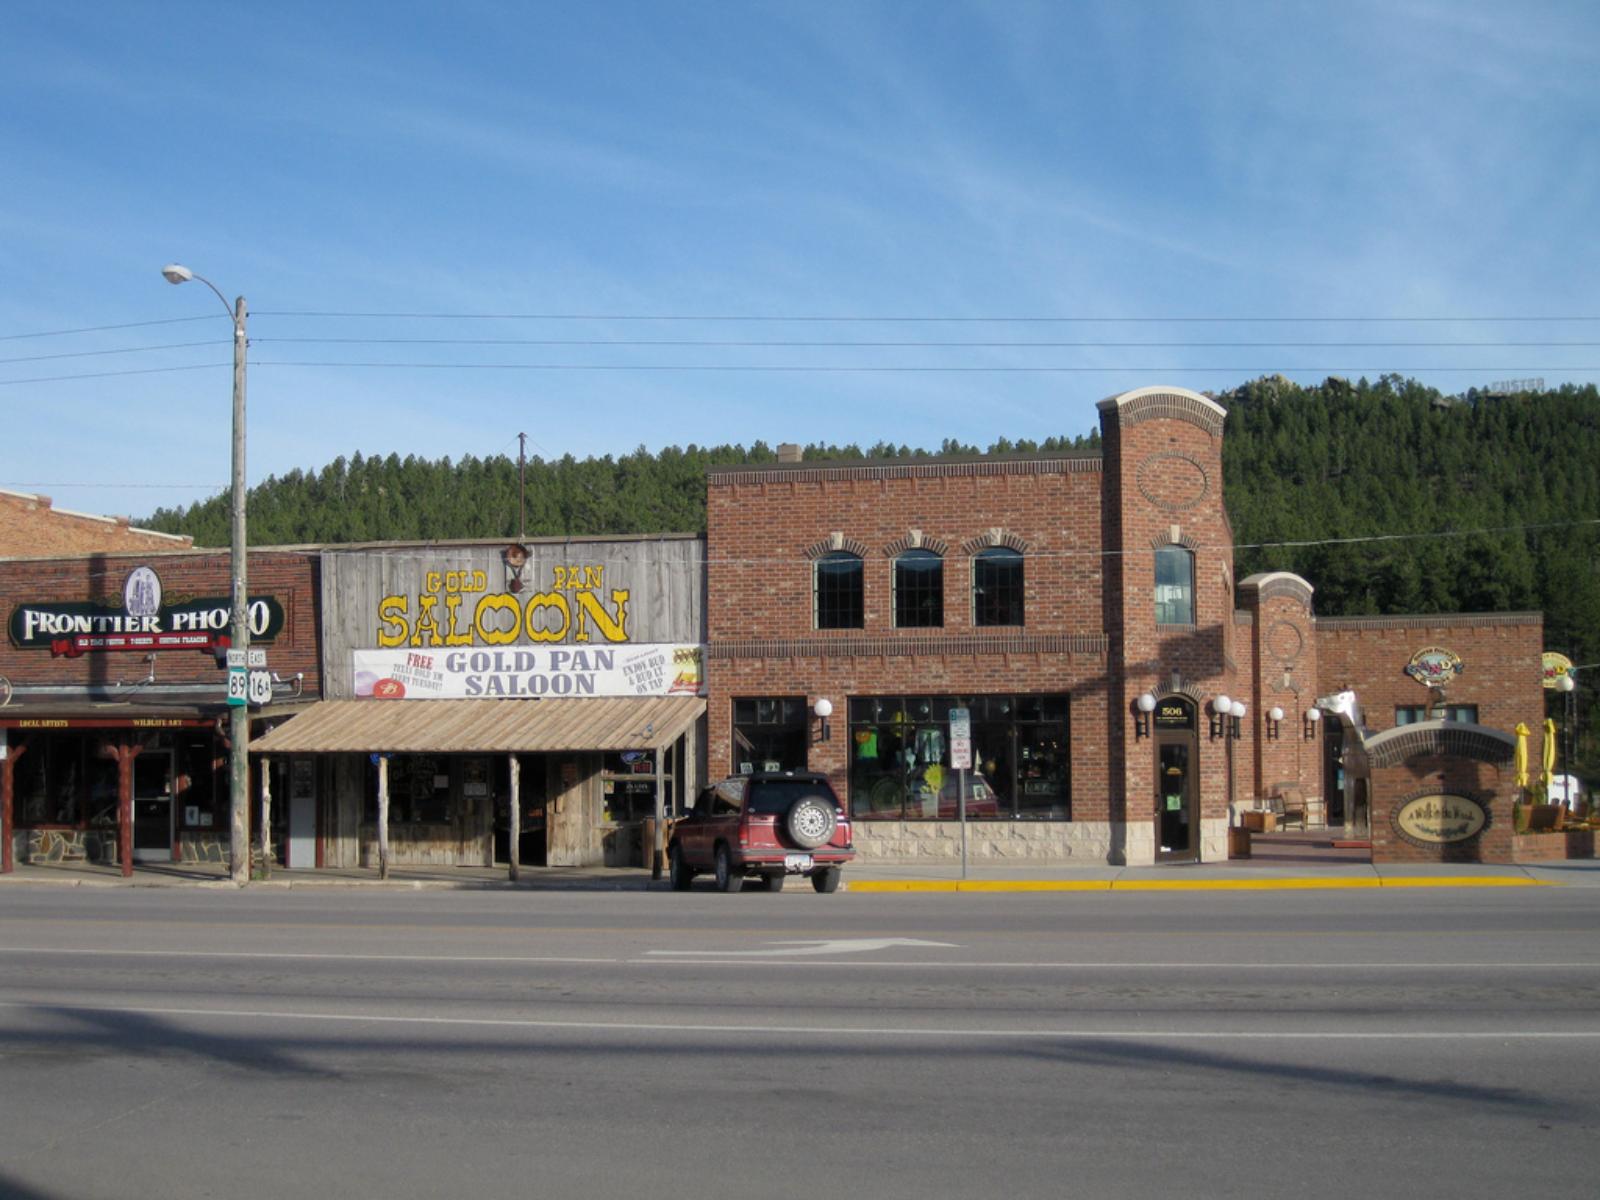
Custer is a cornerstone town of the Black Hills region, surrounded by pine forests, hiking trails, and some of the most scenic terrain in the state. Unlike smaller seasonal towns, Custer maintains a year-round population and a functioning economy that doesn’t rely solely on tourism. That makes it a rarity among South Dakota’s mountain towns. It offers full public services, a strong school district, and access to Custer State Park within minutes. The town center has an authentic small-town feel with locally owned diners, hardware stores, and art galleries. Custer’s charm lies in its balance—rustic enough for nature lovers, but practical enough for full-time living. That balance has kept demand high, especially among buyers seeking second homes or planning for retirement in the Black Hills.
The housing numbers tell a story of consistency and strength. After years of modest growth in the 2010s, Custer exploded in popularity post-2020. The town added nearly $150,000 to its average home value between 2020 and 2023. Unlike more speculative markets, prices here haven’t dropped—instead, they’ve kept climbing, albeit at a slower pace. There’s limited room for expansion due to topography and protected land, which places a cap on new construction and adds long-term value to existing homes. As demand outpaces supply and interest in outdoor lifestyle living grows, Custer is positioned to remain one of the state’s top-tier housing markets for years to come.
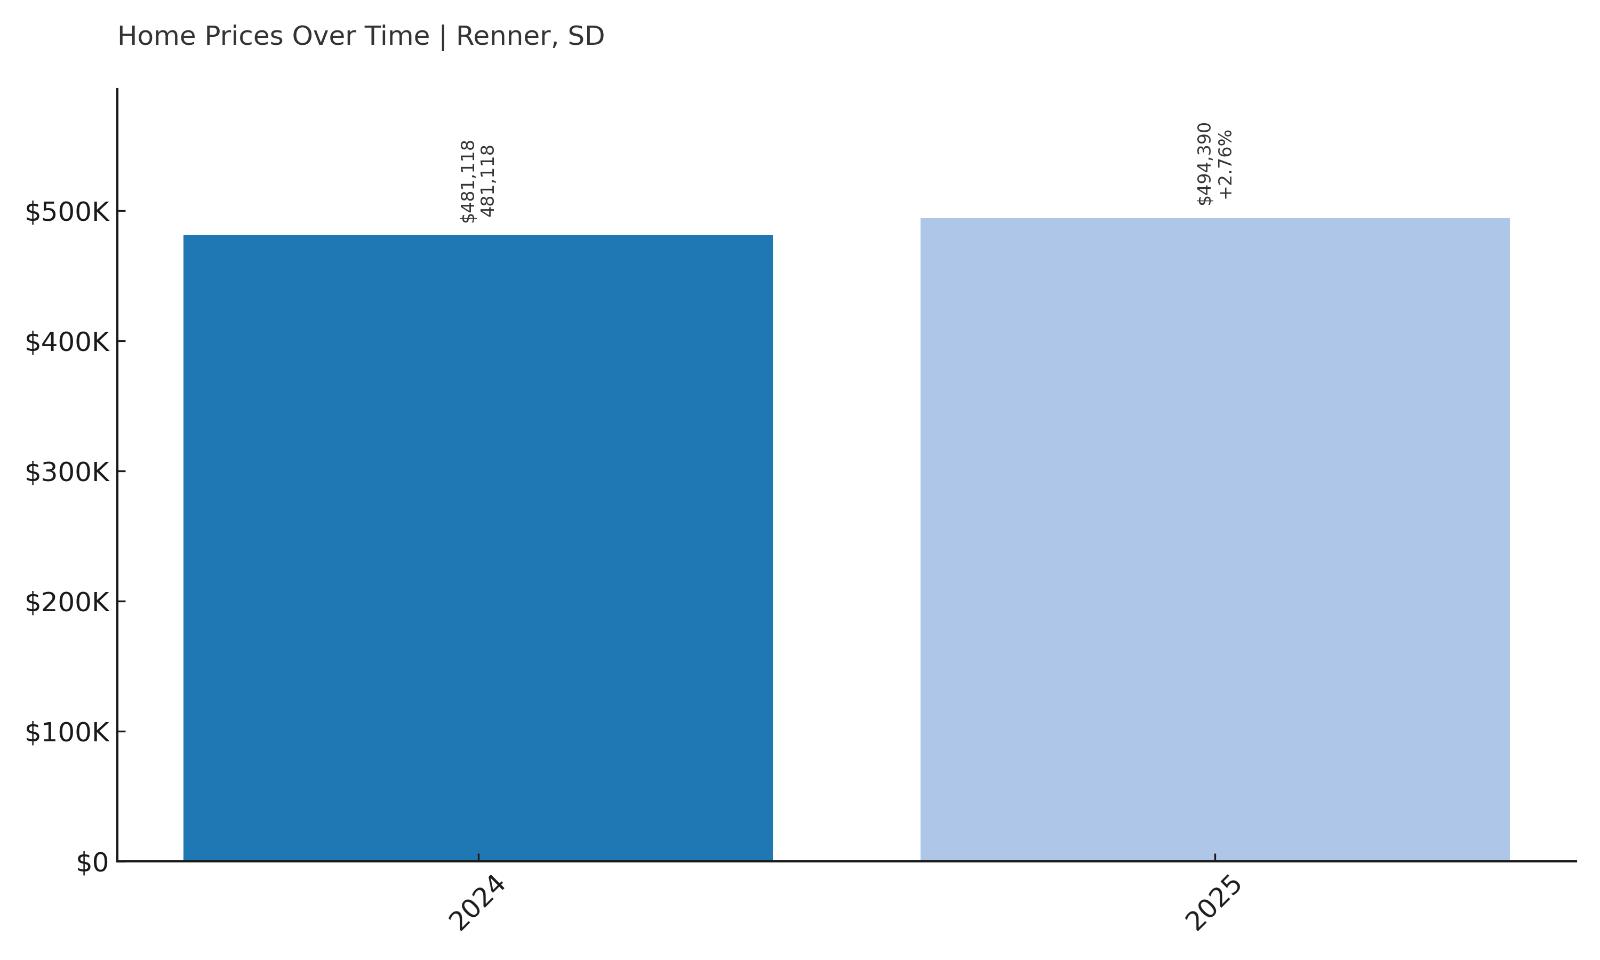
7. Renner – 2.76% Home Price Increase Since 2024
- 2010: N/A
- 2011: N/A
- 2012: N/A
- 2013: N/A
- 2014: N/A
- 2015: N/A
- 2016: N/A
- 2017: N/A
- 2018: N/A
- 2019: N/A
- 2020: N/A
- 2021: N/A
- 2022: N/A
- 2023: N/A
- 2024: $481,118
- 2025: $494,390 (+$13,272, +2.76% from previous year)
Renner has only one year of recorded home price growth in the dataset, with values increasing from $481,118 in 2024 to $494,390 in 2025. That’s a modest but positive 2.76% rise over the past year, placing it among South Dakota’s highest-priced towns by current value, despite the limited historical trend data.
Renner – High Values Just Outside Sioux Falls

Renner is a small, unincorporated community in Minnehaha County, just north of Sioux Falls. Its location makes it essentially a quiet residential pocket on the edge of the metro area, giving it access to all the services and employment of Sioux Falls without the congestion of city living. The town offers a rural feel while still being close to schools, shopping centers, and medical services. That proximity, combined with a high rate of homeownership and limited housing stock, helps support strong home values. Many properties in Renner feature larger lots or acreage, attracting buyers who want space without sacrificing urban convenience. It’s this blend that has allowed Renner to quietly maintain some of the highest average home prices in the state, even with limited turnover.
While full historical price data isn’t available, the current price point places Renner in rare territory for South Dakota. Its closeness to Sioux Falls—a city with one of the strongest housing markets in the Midwest—offers a protective halo effect. As development spreads outward, towns like Renner benefit from rising demand and scarcity of buildable land. Even with a small footprint and little visibility, Renner has become a quiet contender for serious buyers who value space, privacy, and access. Its recent price increase may be modest, but it reflects confidence in a market that’s likely to remain tight and valuable for the foreseeable future.
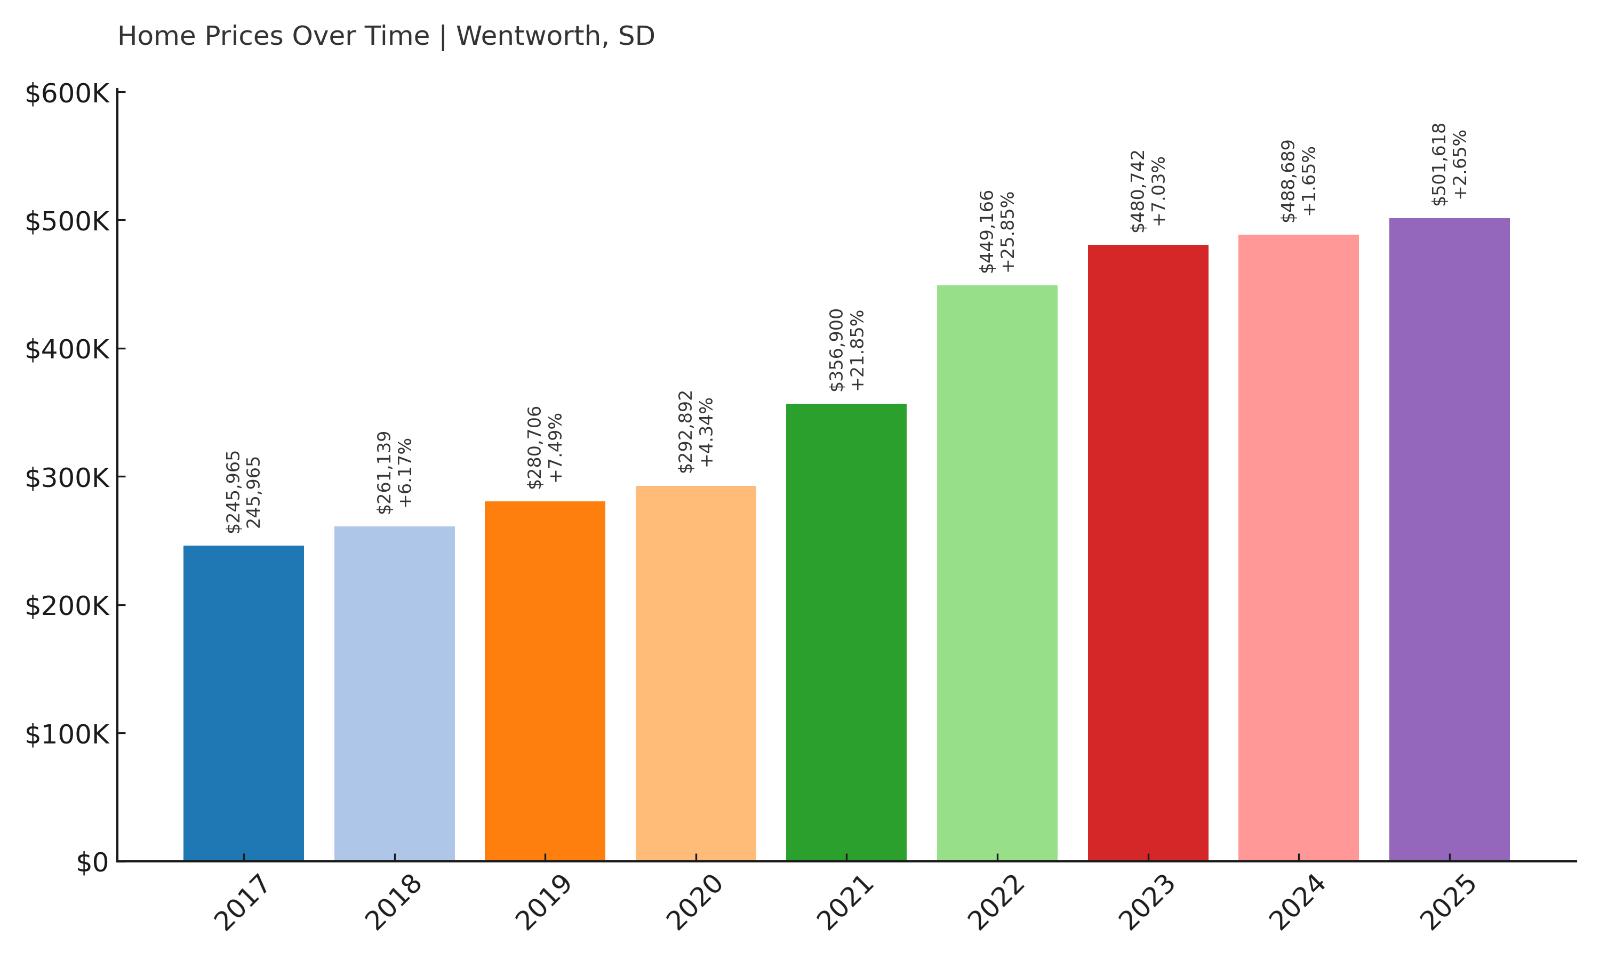
6. Wentworth – 104% Home Price Increase Since 2017
- 2010: N/A
- 2011: N/A
- 2012: N/A
- 2013: N/A
- 2014: N/A
- 2015: N/A
- 2016: N/A
- 2017: $245,965
- 2018: $261,139 (+$15,174, +6.17% from previous year)
- 2019: $280,706 (+$19,566, +7.49% from previous year)
- 2020: $292,892 (+$12,186, +4.34% from previous year)
- 2021: $356,900 (+$64,007, +21.85% from previous year)
- 2022: $449,166 (+$92,266, +25.85% from previous year)
- 2023: $480,742 (+$31,576, +7.03% from previous year)
- 2024: $488,689 (+$7,947, +1.65% from previous year)
- 2025: $501,618 (+$12,929, +2.65% from previous year)
Wentworth has experienced more than a doubling of its home values since 2017, rising from $245,965 to $501,618 by 2025—a 104% increase over eight years. The steepest gains occurred between 2020 and 2022, when prices surged nearly $156,000 in just two years. Though growth has slowed in recent years, the market continues to move upward with moderate annual gains, signaling lasting interest and a strong long-term trajectory.
Wentworth – A Lakeside Market That Keeps Gaining Value
Wentworth is located in Lake County and sits just a few miles from Lake Madison—one of eastern South Dakota’s most popular recreational areas. The town itself is small and quiet, but its proximity to the lake and surrounding vacation homes has pushed demand steadily upward. What began as a hidden location for seasonal cabins has grown into a year-round market where buyers compete for homes with water access or scenic views. The rising popularity of hybrid and remote work has further amplified this demand, as more people are able to live in lifestyle-first locations without sacrificing job opportunities. For many buyers, Wentworth represents the perfect balance of tranquility, space, and outdoor living—not to mention access to fishing, boating, and shoreline amenities just minutes from home.
The dramatic surge in home values after 2020 was driven by a combination of low inventory, strong buyer demand, and lifestyle shifts. Between 2020 and 2022 alone, values rose over 50%, putting Wentworth on the radar for serious homebuyers and investors alike. Even though the pace of growth has tapered, the upward trend continues, suggesting long-term stability in this high-demand market. As lakefront towns grow increasingly rare and buyers look for more affordable alternatives to Minnesota’s lake country, Wentworth is well-positioned to remain a top-tier destination for high-value South Dakota housing.
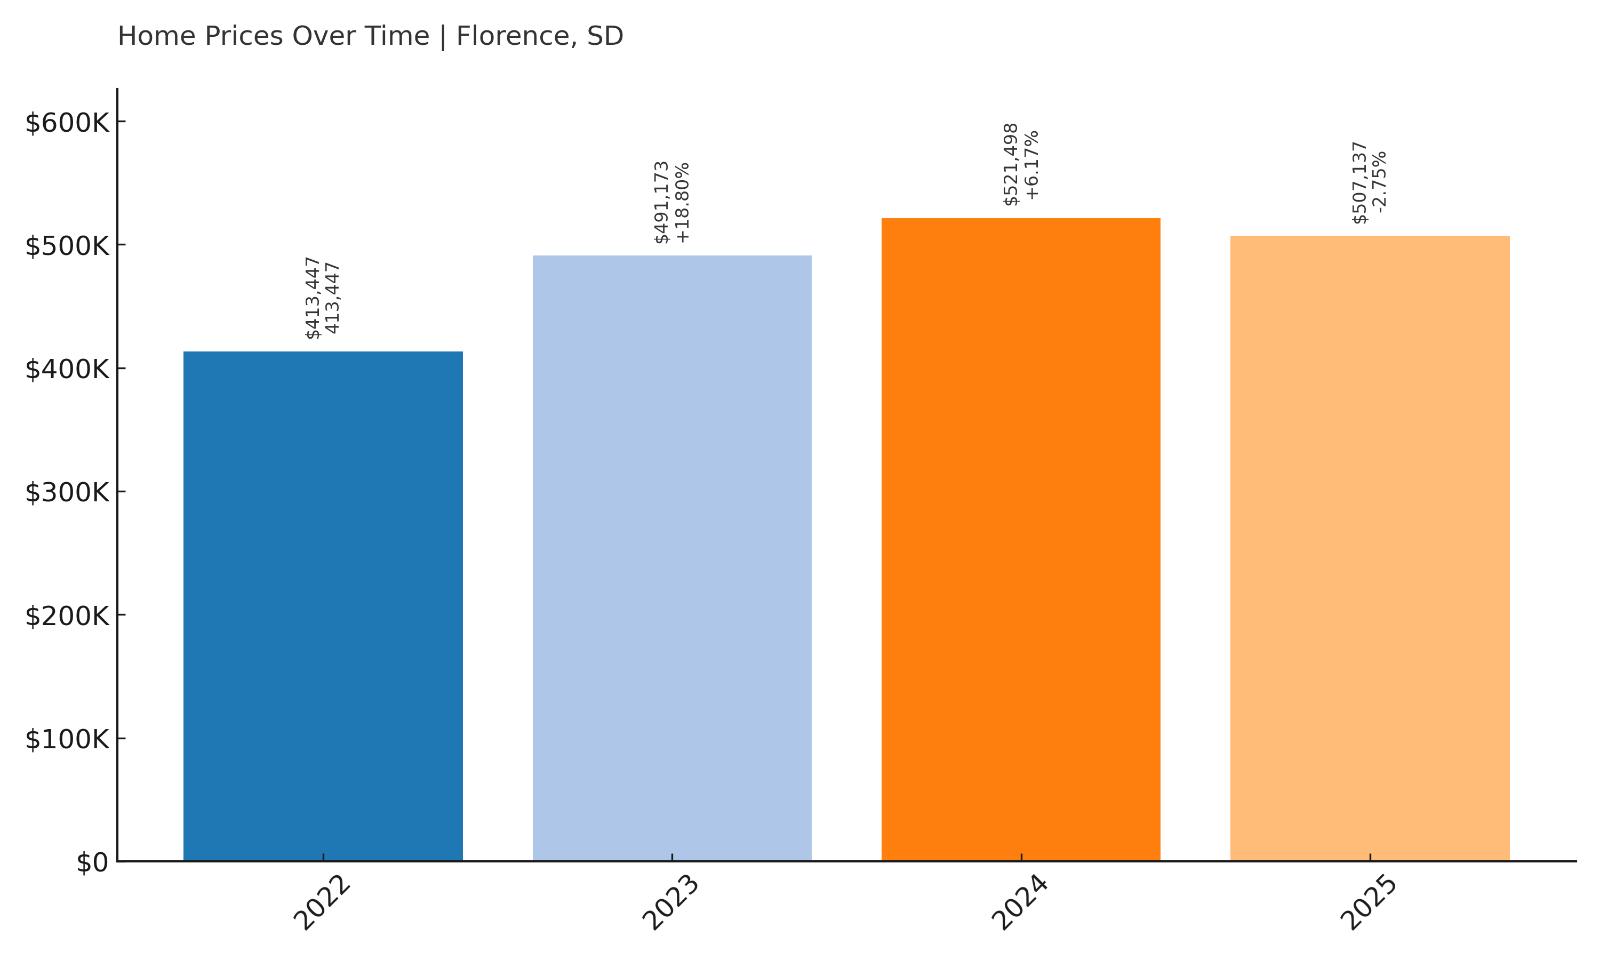
5. Florence – 22.7% Home Price Increase Since 2022
- 2010: N/A
- 2011: N/A
- 2012: N/A
- 2013: N/A
- 2014: N/A
- 2015: N/A
- 2016: N/A
- 2017: N/A
- 2018: N/A
- 2019: N/A
- 2020: N/A
- 2021: N/A
- 2022: $413,447
- 2023: $491,173 (+$77,727, +18.80% from previous year)
- 2024: $521,498 (+$30,325, +6.17% from previous year)
- 2025: $507,137 (-$14,361, -2.75% from previous year)
Florence saw a 22.7% increase in average home value between 2022 and 2025, rising from $413,447 to $507,137. The most significant growth occurred in 2023, with an 18.8% surge in just one year. Although there was a dip in 2025, the town remains one of South Dakota’s highest-priced communities, thanks to its short but sharp appreciation streak.
Florence – Rapid Gains in a Small Community
🔥 Would you like to save this?
Florence is a small town located in Codington County, near the edges of the Watertown micropolitan area. While it hasn’t historically been viewed as a luxury market, its limited housing stock and proximity to regional job centers have helped push up prices quickly in recent years. The town appeals to buyers looking for peace and space, often with larger plots of land than what’s available in nearby urban centers. As Watertown expands and demand for housing spreads outward, Florence has become an appealing alternative for families, retirees, and even remote workers who want a quieter lifestyle without being too far removed from schools and services. Its modest size also means there are very few listings at any given time, which drives up competition when homes do hit the market.
Florence’s dramatic price increase in 2023 caught attention, but it likely reflects both organic demand and scarcity. The 2.75% decline in 2025 may simply represent a return to balance after an overheated market year. What remains clear is that the town has joined a new tier of valuation in eastern South Dakota, especially among buyers willing to trade proximity for privacy. Continued interest in the area—and broader trends pushing people out of cities—could sustain Florence’s elevated pricing for years to come, even if the most aggressive growth is already behind it.
4. Hermosa – 193% Home Price Increase Since 2012
- 2010: N/A
- 2011: N/A
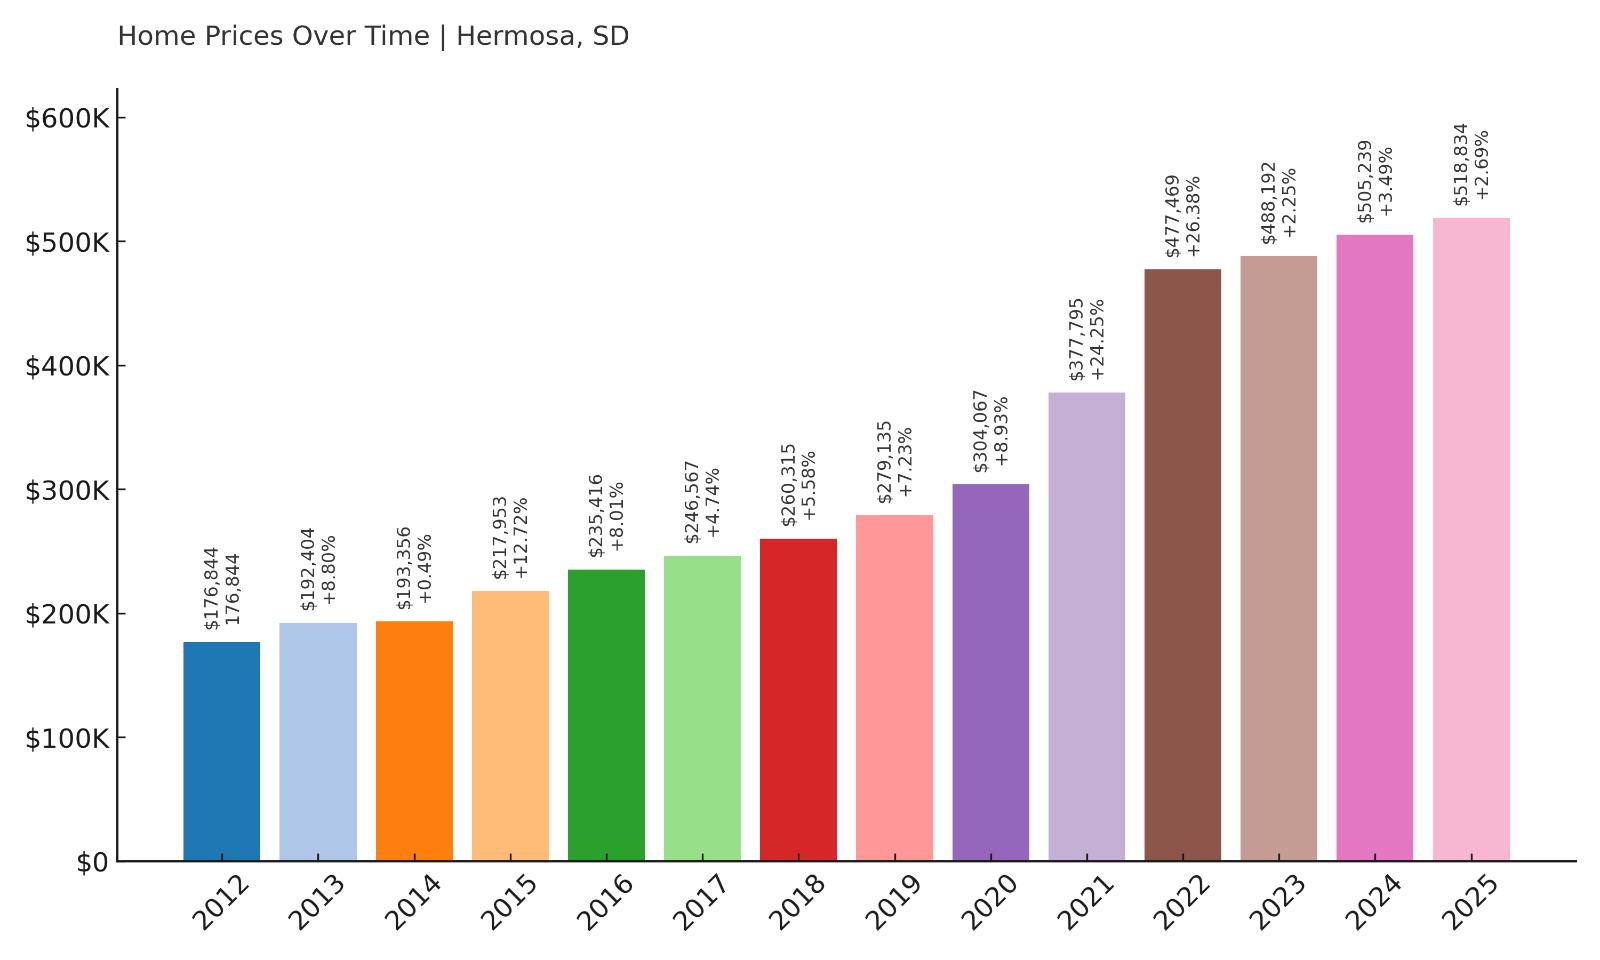
- 2012: $176,844
- 2013: $192,404 (+$15,559, +8.80% from previous year)
- 2014: $193,356 (+$952, +0.49% from previous year)
- 2015: $217,953 (+$24,597, +12.72% from previous year)
- 2016: $235,416 (+$17,463, +8.01% from previous year)
- 2017: $246,567 (+$11,151, +4.74% from previous year)
- 2018: $260,315 (+$13,748, +5.58% from previous year)
- 2019: $279,135 (+$18,820, +7.23% from previous year)
- 2020: $304,067 (+$24,932, +8.93% from previous year)
- 2021: $377,795 (+$73,728, +24.25% from previous year)
- 2022: $477,469 (+$99,674, +26.38% from previous year)
- 2023: $488,192 (+$10,724, +2.25% from previous year)
- 2024: $505,239 (+$17,046, +3.49% from previous year)
- 2025: $518,834 (+$13,596, +2.69% from previous year)
Hermosa’s home values have nearly tripled since 2012, rising from $176,844 to $518,834 by 2025—a total increase of 193%. The sharpest growth occurred between 2020 and 2022, with more than $170,000 added in just two years. Prices have continued to rise since, albeit more slowly, underscoring Hermosa’s long-term strength as a premium Black Hills market.
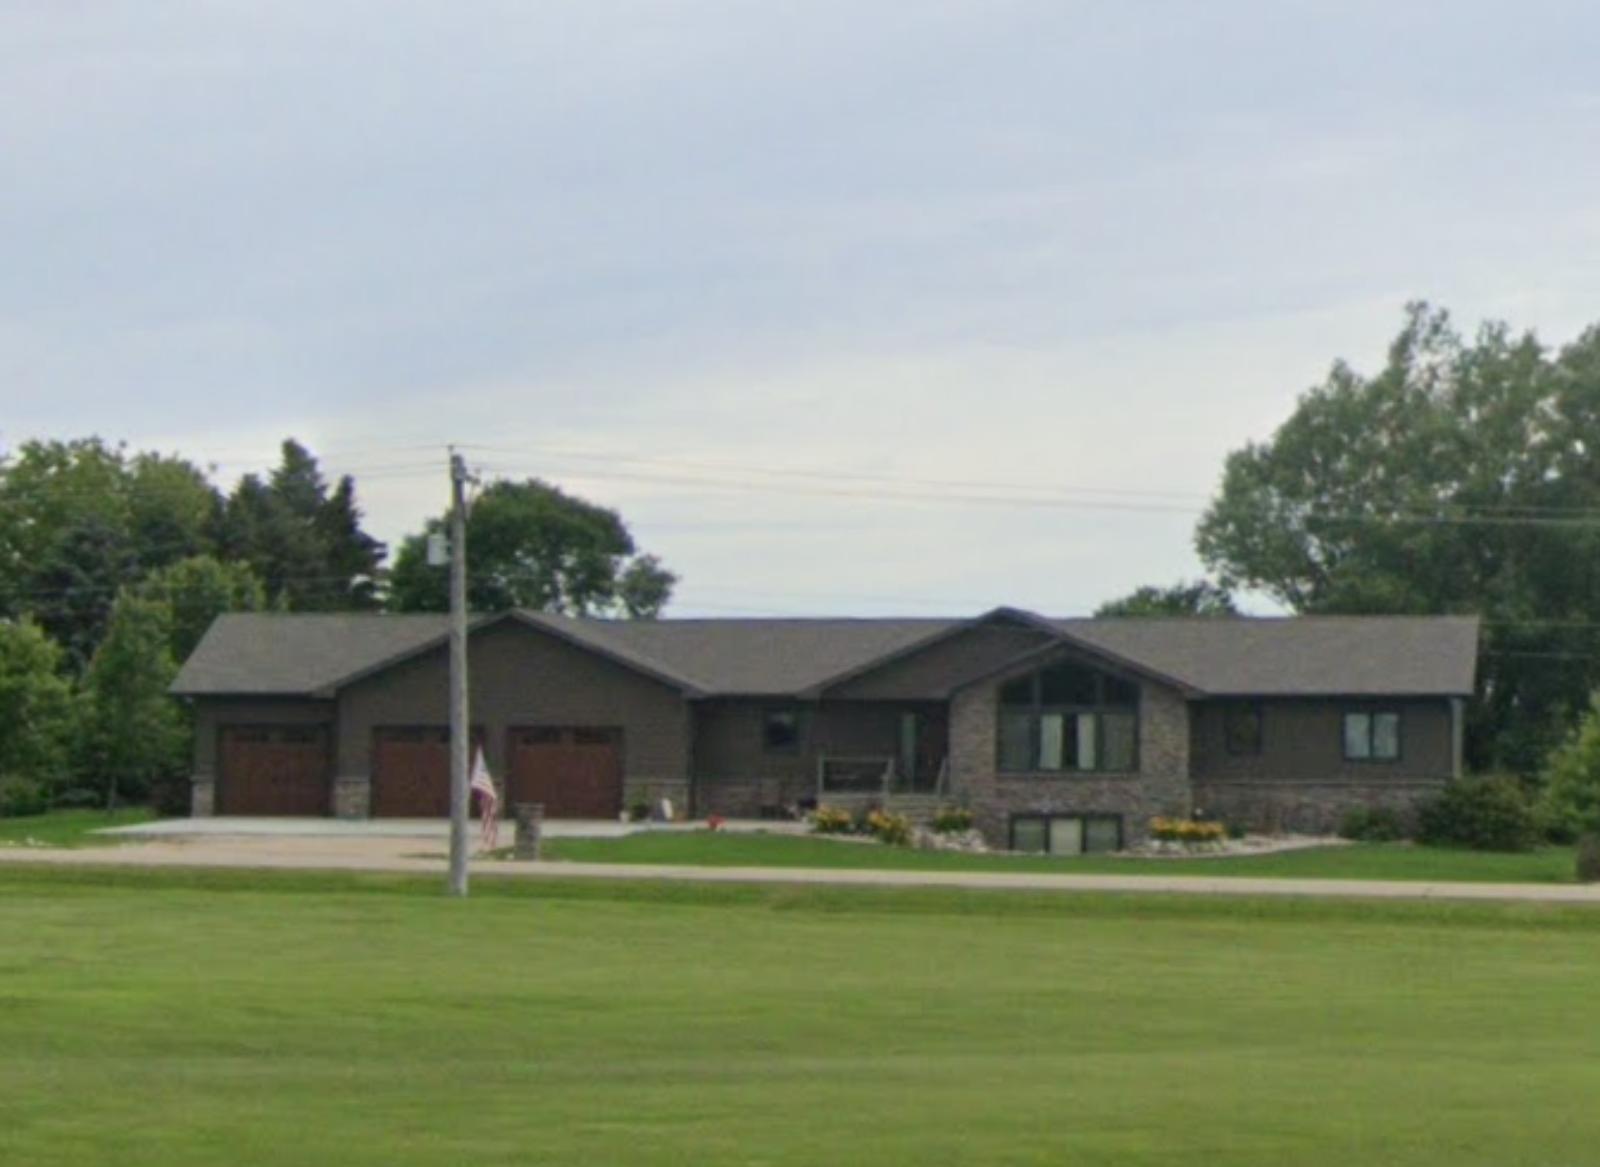
Hermosa – Rising Quickly in the Foothills
Hermosa is located along Highway 79, just south of Rapid City and within easy reach of Custer State Park. It offers stunning views, a gateway to the Black Hills, and a quieter alternative to towns like Keystone or Hill City. While Hermosa was once considered off-the-radar, its affordability relative to neighboring hotspots—and excellent access to hiking, camping, and fishing—have helped transform it into a serious contender for both full-time residents and investors. With its own school district, agricultural land, and scenic rural properties, the town appeals to buyers looking for privacy and lifestyle rather than urban convenience. That demand has pushed prices steadily upward, especially since 2020, when a flood of new buyers entered the South Dakota market.
The dramatic run-up in values during the pandemic years wasn’t a fluke—it reflected shifting tastes and a recognition of Hermosa’s geographic advantage. Since then, home prices have continued rising, albeit at a slower rate, as the town settles into its new pricing tier. At over $500,000 average, Hermosa now competes directly with long-established mountain towns. Limited land, strong outdoor appeal, and stable demand suggest this upward pressure will persist. For buyers and sellers alike, Hermosa now represents one of the most dynamic property markets in the region.
3. Henry – 66% Home Price Increase Since 2016
- 2010: N/A
- 2011: N/A
- 2012: N/A
- 2013: N/A
- 2014: N/A
- 2015: N/A
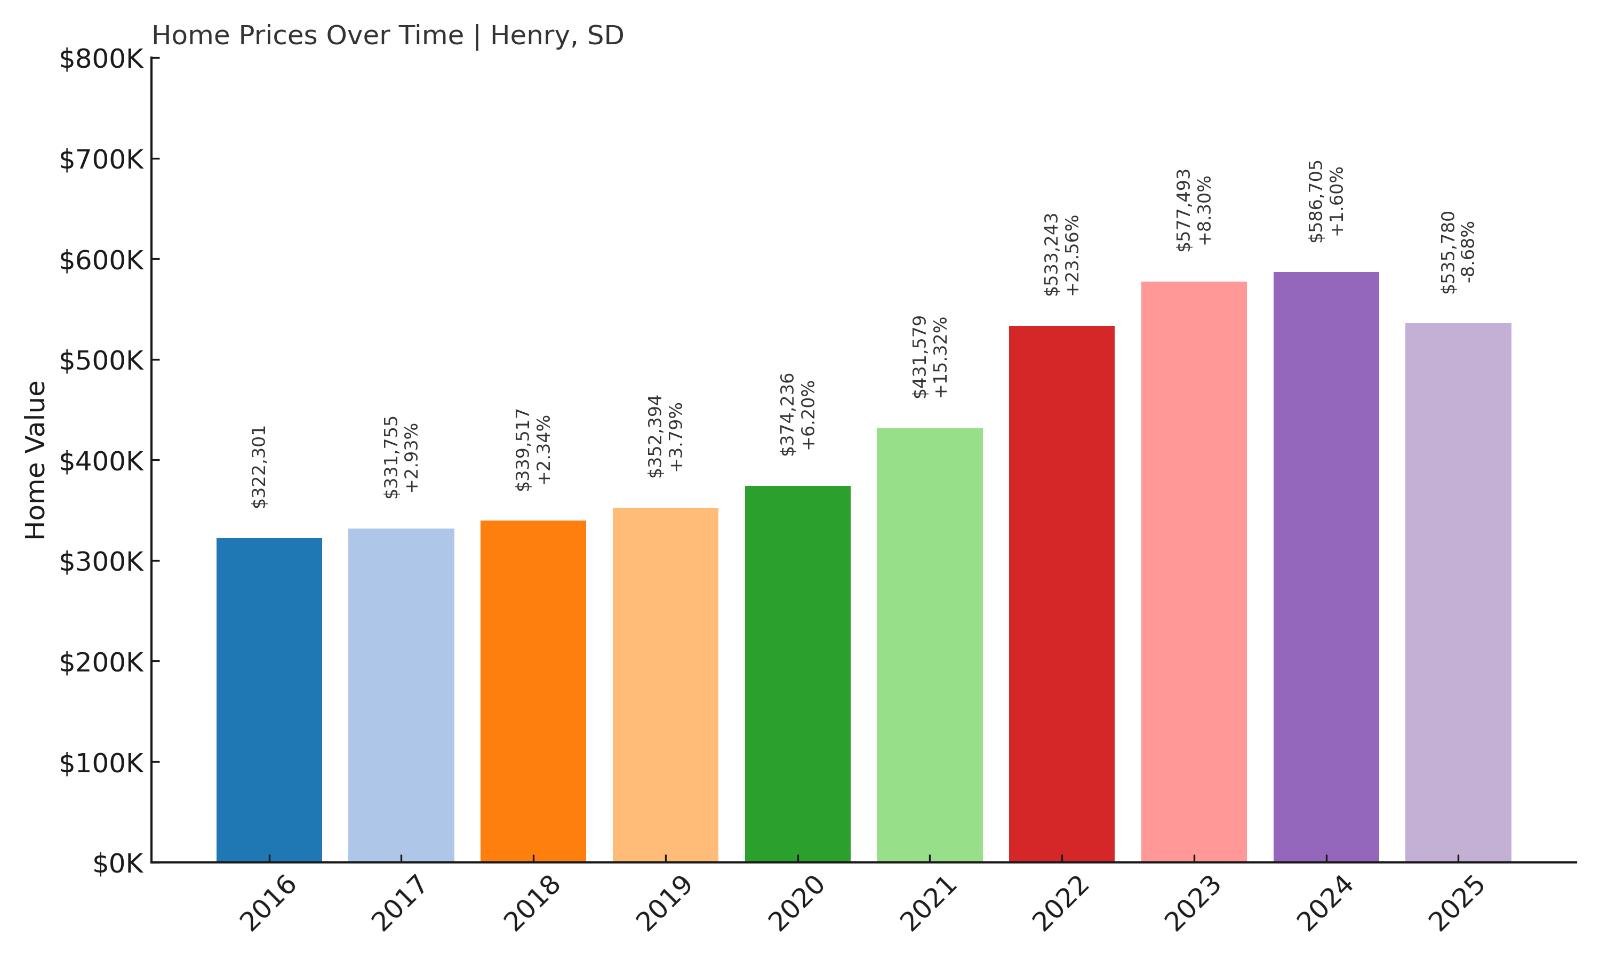
- 2016: $322,301
- 2017: $331,755 (+$9,454, +2.93%)
- 2018: $339,517 (+$7,762, +2.34%)
- 2019: $352,394 (+$12,877, +3.79%)
- 2020: $374,236 (+$21,841, +6.20%)
- 2021: $431,579 (+$57,343, +15.32%)
- 2022: $533,243 (+$101,665, +23.56%)
- 2023: $577,493 (+$44,250, +8.30%)
- 2024: $586,705 (+$9,212, +1.60%)
- 2025: $535,780 (-$50,925, -8.68%)
Henry’s home values grew significantly between 2016 and 2023, rising by 79% over that period. Prices peaked in 2023 at $577,493 before falling in both 2024 and 2025 — ending the most recent year at $535,780. That still marks a 66% increase from its 2016 value of $322,301. The sharpest growth came during the post-2020 housing boom, with back-to-back double-digit jumps in 2021 and 2022. However, recent price declines suggest a possible cooling trend after a period of aggressive gains.
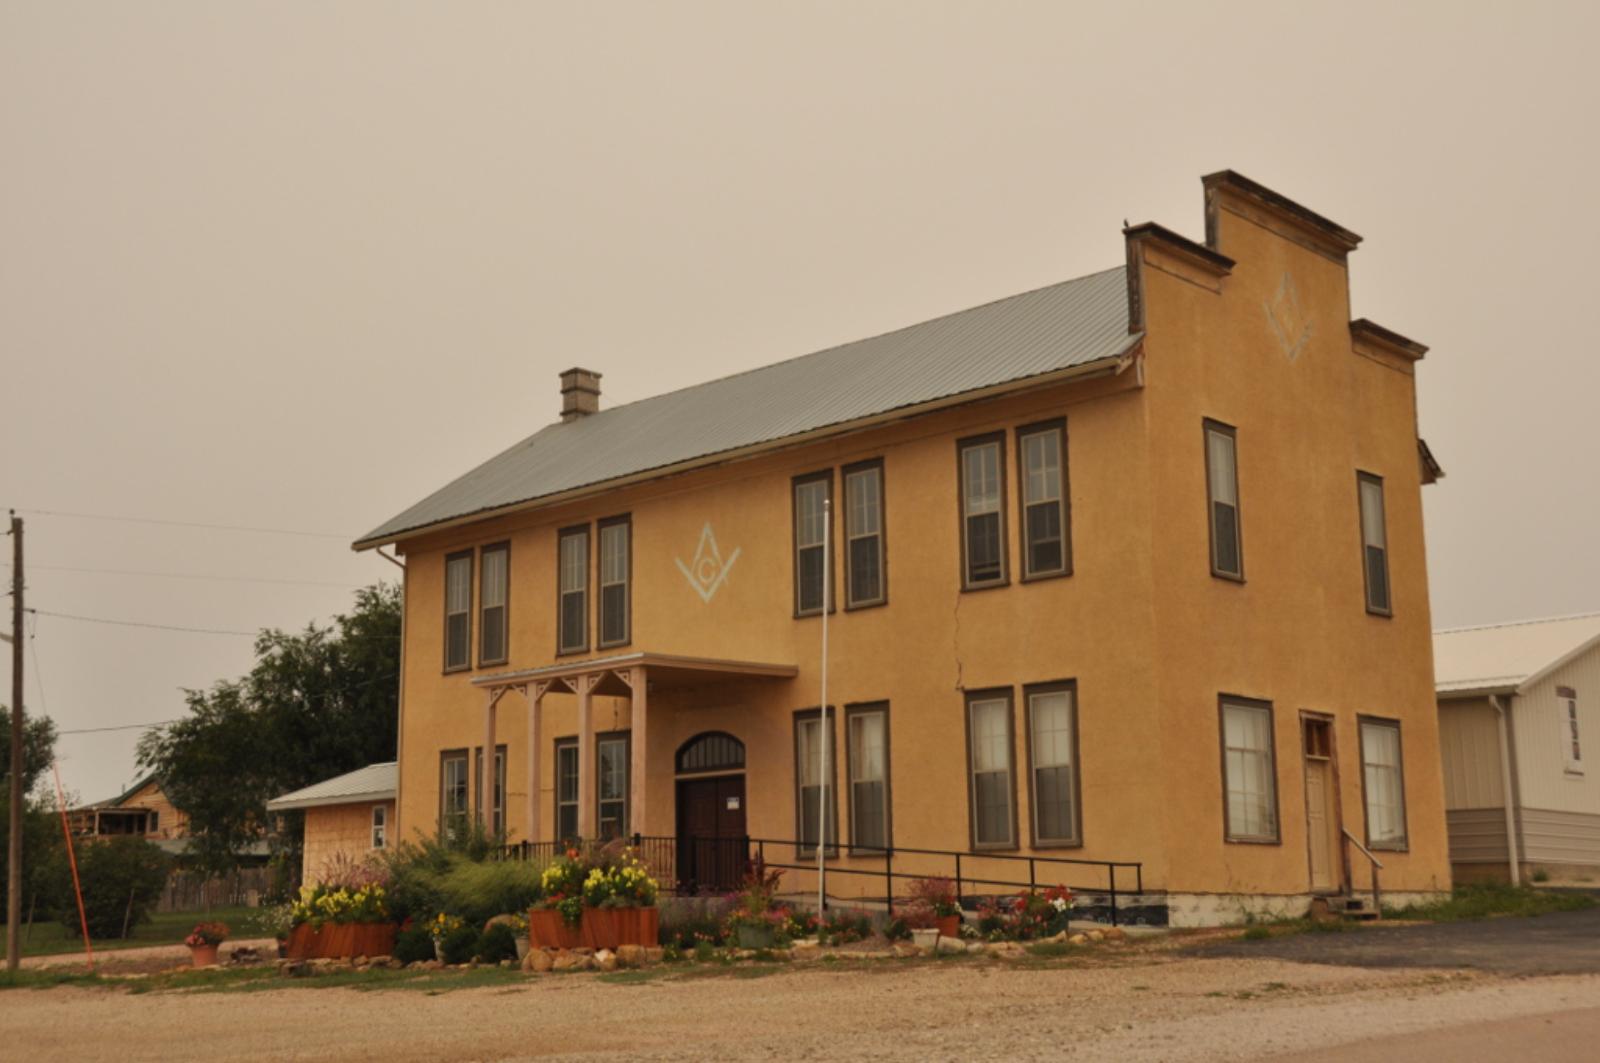
Henry – Rapid Appreciation Followed by Correction
Henry is a small town in Codington County in the northeast part of South Dakota. While it has traditionally been a modest agricultural community, recent years brought a surprising surge in housing prices, likely fueled by a wave of relocations during the pandemic era and limited local inventory. The town’s proximity to Watertown and access to rural open space may have contributed to demand for homes among those seeking a quieter pace of life with room to grow. This pushed prices steadily higher through 2021 and 2022, before peaking in 2023. With such a narrow housing market, even a small shift in demand can drive big swings in price — both up and down.
While Henry’s price history shows impressive appreciation in a short period, the 2024 and 2025 drops point to a potential market correction. These fluctuations highlight the volatility that can come with small towns where data is sensitive to limited sales activity. For buyers, that might present opportunity or risk, depending on market timing. Despite the recent dip, Henry’s values remain well above their pre-2020 levels, and its quiet setting could continue to appeal to remote workers or retirees if prices stabilize in the near future.
2. South Shore – 24% Home Price Decrease Since 2022
- 2010: N/A
- 2011: N/A
- 2012: N/A
- 2013: N/A
- 2014: N/A
- 2015: N/A
- 2016: N/A
- 2017: N/A
- 2018: N/A
- 2019: N/A
- 2020: N/A
- 2021: N/A
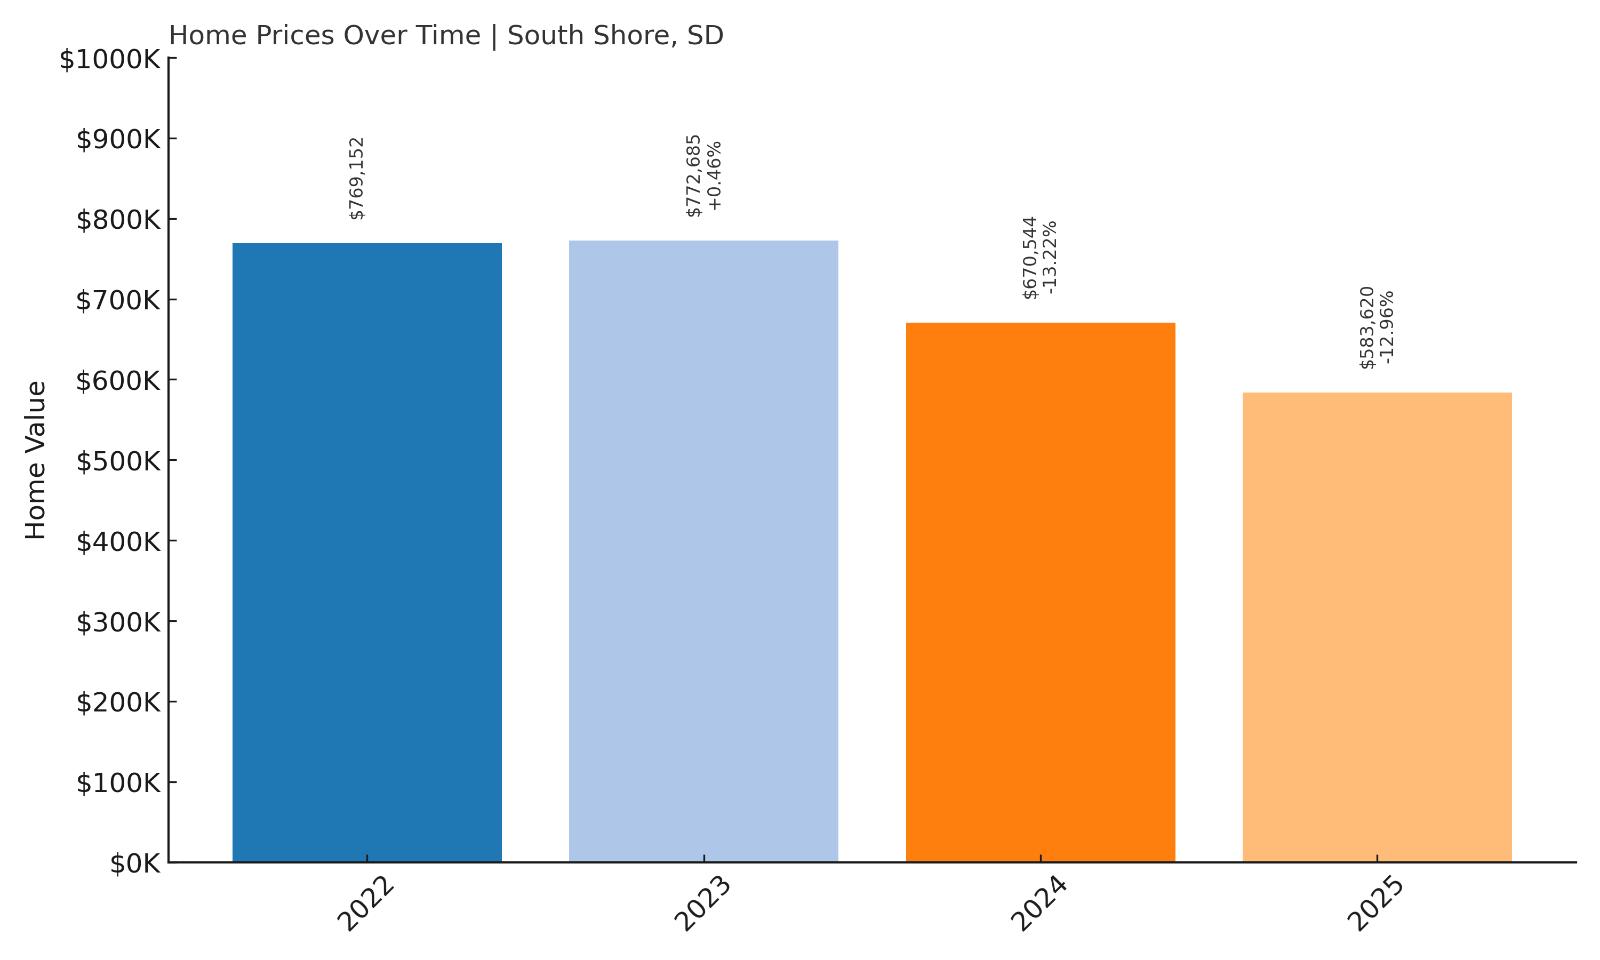
- 2022: $769,152
- 2023: $772,685 (+$3,533, +0.46%)
- 2024: $670,544 (-$102,140, -13.22%)
- 2025: $583,620 (-$86,925, -12.96%)
South Shore saw one of the most dramatic reversals in the state. After reaching an extraordinary peak of $772,685 in 2023, home values have dropped by nearly 24% in just two years. As of May 2025, the average home in South Shore is valued at $583,620. This steep decline follows a brief but significant surge, and while values are still very high compared to most towns in South Dakota, the downward trend raises questions about sustainability and long-term demand in this market.
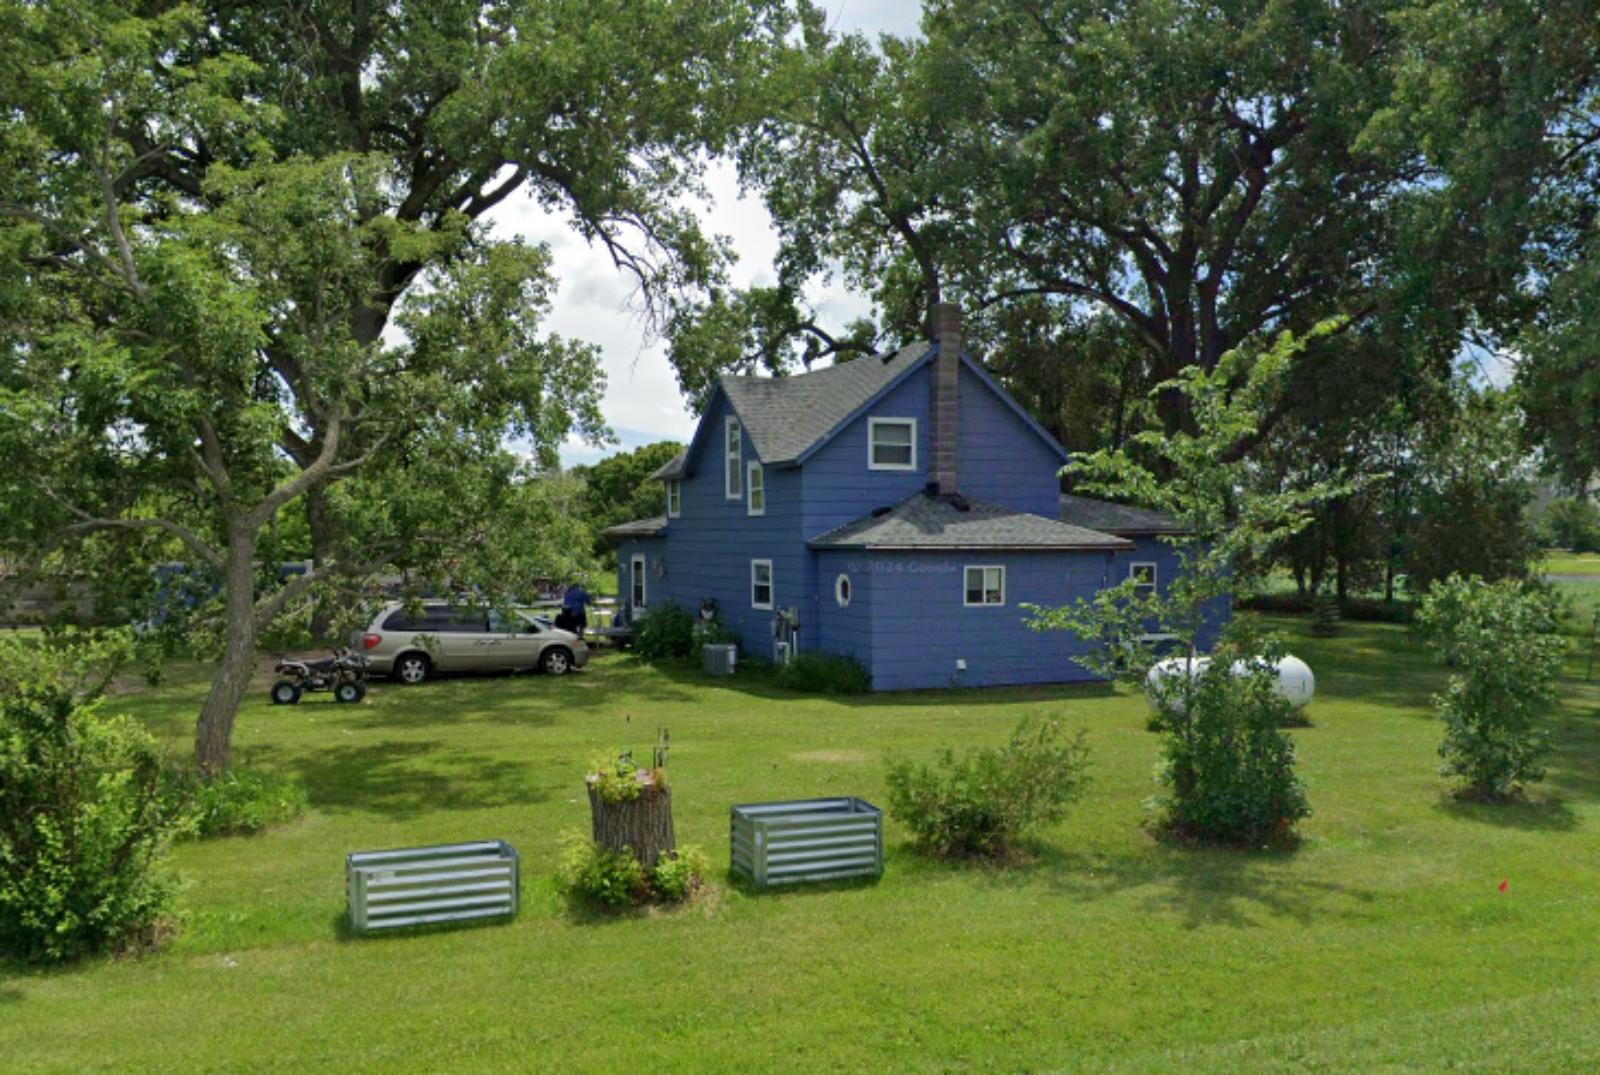
South Shore – A Price Peak That Didn’t Last
South Shore, located in Codington County near the shores of Punished Woman Lake, isn’t a large town, but it briefly commanded one of the highest average home prices in the entire state. This was likely due to a combination of factors — including extremely limited housing inventory, high-end lakefront property sales, and pandemic-era buyer interest in rural scenic areas. The 2022 price surge seems to have been an outlier, driven more by short-term demand spikes than sustained growth fundamentals. The following years saw steep pullbacks, suggesting that the market overshot and has since corrected.
Despite the correction, South Shore remains among the most expensive markets in South Dakota, due in part to its niche appeal. Properties with direct lake access or views still command a premium, though prices have normalized somewhat. Whether the town can stabilize in the coming years will depend on whether recent declines reflect a one-time adjustment or signal a longer-term cooling. For buyers, the drop may create opportunity, but it’s also a cautionary tale about volatility in smaller markets.
1. Keystone – 187% Home Price Increase Since 2010
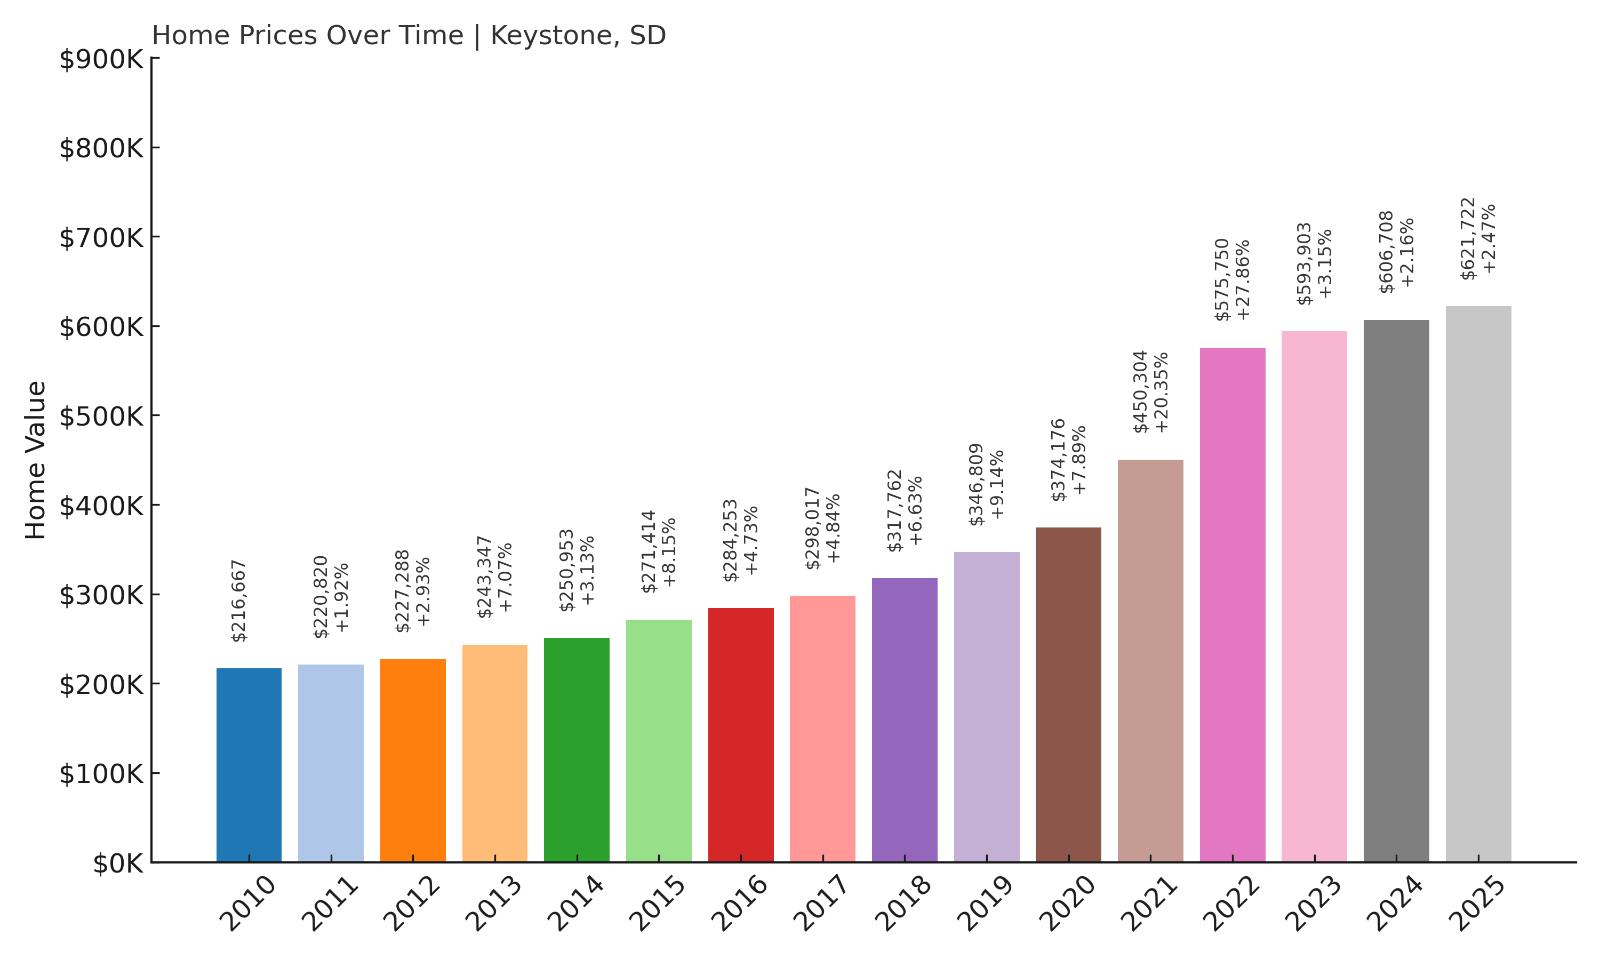
- 2010: $216,667
- 2011: $220,820 (+$4,153, +1.92%)
- 2012: $227,288 (+$6,468, +2.93%)
- 2013: $243,347 (+$16,058, +7.07%)
- 2014: $250,953 (+$7,607, +3.13%)
- 2015: $271,414 (+$20,460, +8.15%)
- 2016: $284,253 (+$12,839, +4.73%)
- 2017: $298,017 (+$13,764, +4.84%)
- 2018: $317,762 (+$19,746, +6.63%)
- 2019: $346,809 (+$29,047, +9.14%)
- 2020: $374,176 (+$27,367, +7.89%)
- 2021: $450,304 (+$76,128, +20.35%)
- 2022: $575,750 (+$125,447, +27.86%)
- 2023: $593,903 (+$18,153, +3.15%)
- 2024: $606,708 (+$12,804, +2.16%)
- 2025: $621,722 (+$15,014, +2.47%)
Keystone has experienced a massive 187% increase in home prices since 2010 — growing from $216,667 to $621,722 in just 15 years. The steepest climbs happened between 2020 and 2022, when the market surged by more than $200K in just two years. While growth has cooled since then, prices have continued inching upward through 2025. With consistent increases almost every year and multiple years of double-digit growth, Keystone stands firmly at the top of the state’s housing market.
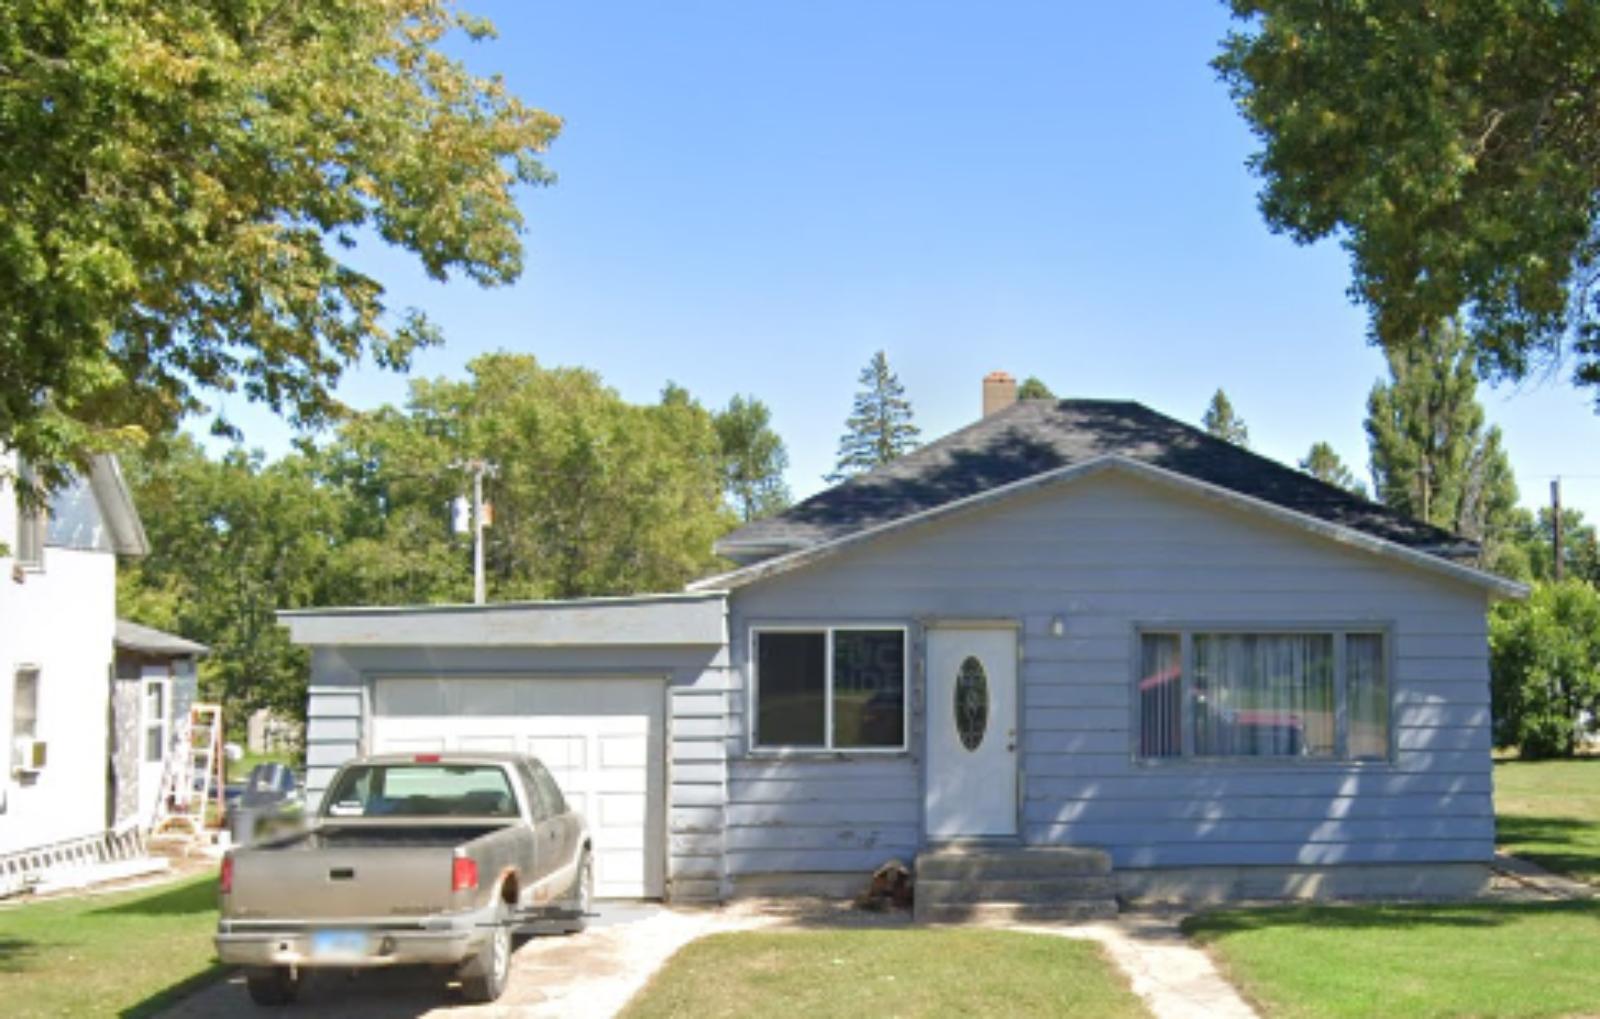
Keystone – At the Foot of Mount Rushmore and the Peak of Home Prices
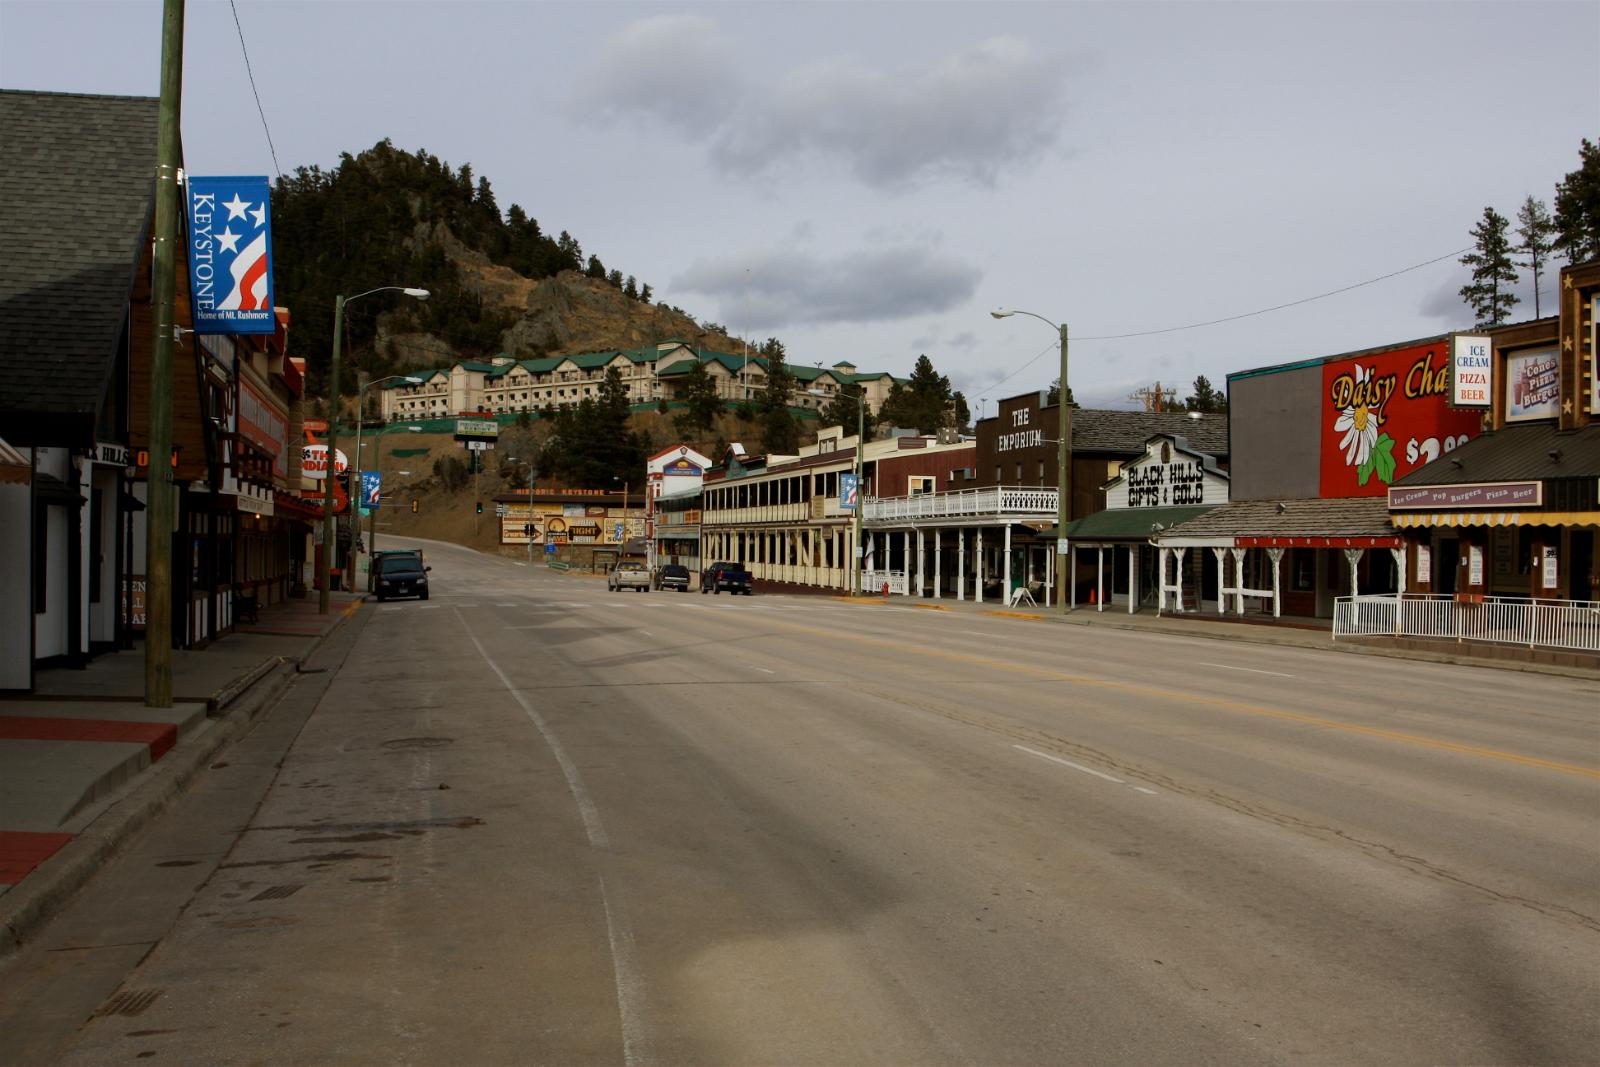
Home to Mount Rushmore National Memorial, Keystone is one of South Dakota’s most visited towns. Its position as a tourist hub in the Black Hills — with scenic views, historical attractions, and thriving summer foot traffic — has fueled a red-hot real estate market. Investors, short-term rental owners, and vacation homebuyers have all driven demand, particularly after 2020 when travel rebounded and remote work made second homes more attractive. This demand translated into huge jumps in property value, especially in 2021 and 2022, when annual increases exceeded $75,000 and even crossed the six-figure mark.
Even after that boom, the town continues to appreciate, with 2025 prices hitting over $620K on average. That’s nearly triple the value in 2010. Unlike other towns that saw pullbacks, Keystone’s popularity and limited developable land have helped maintain its high valuations. It’s now the most expensive housing market in South Dakota — a reflection of both its national profile and local scarcity. For prospective buyers or investors, Keystone’s appeal is clear — but it also comes with a steep price tag that shows no signs of reversing.


