🔥 Would you like to save this?
Oklahoma isn’t just about wide-open spaces anymore—try wide-open wallets. The Zillow Home Value Index shows property prices climbing fast across 32 towns where buyers are now paying premium prices for a slice of the Sooner State. From lakefront retreats to suburban enclaves, many of these communities have seen prices quietly double since 2010. Whether you’re buying, selling, or just nosy, this list reveals where Oklahoma’s real estate market is serving up sticker shock in 2025.
32. Luther – 149% Home Price Increase Since 2010
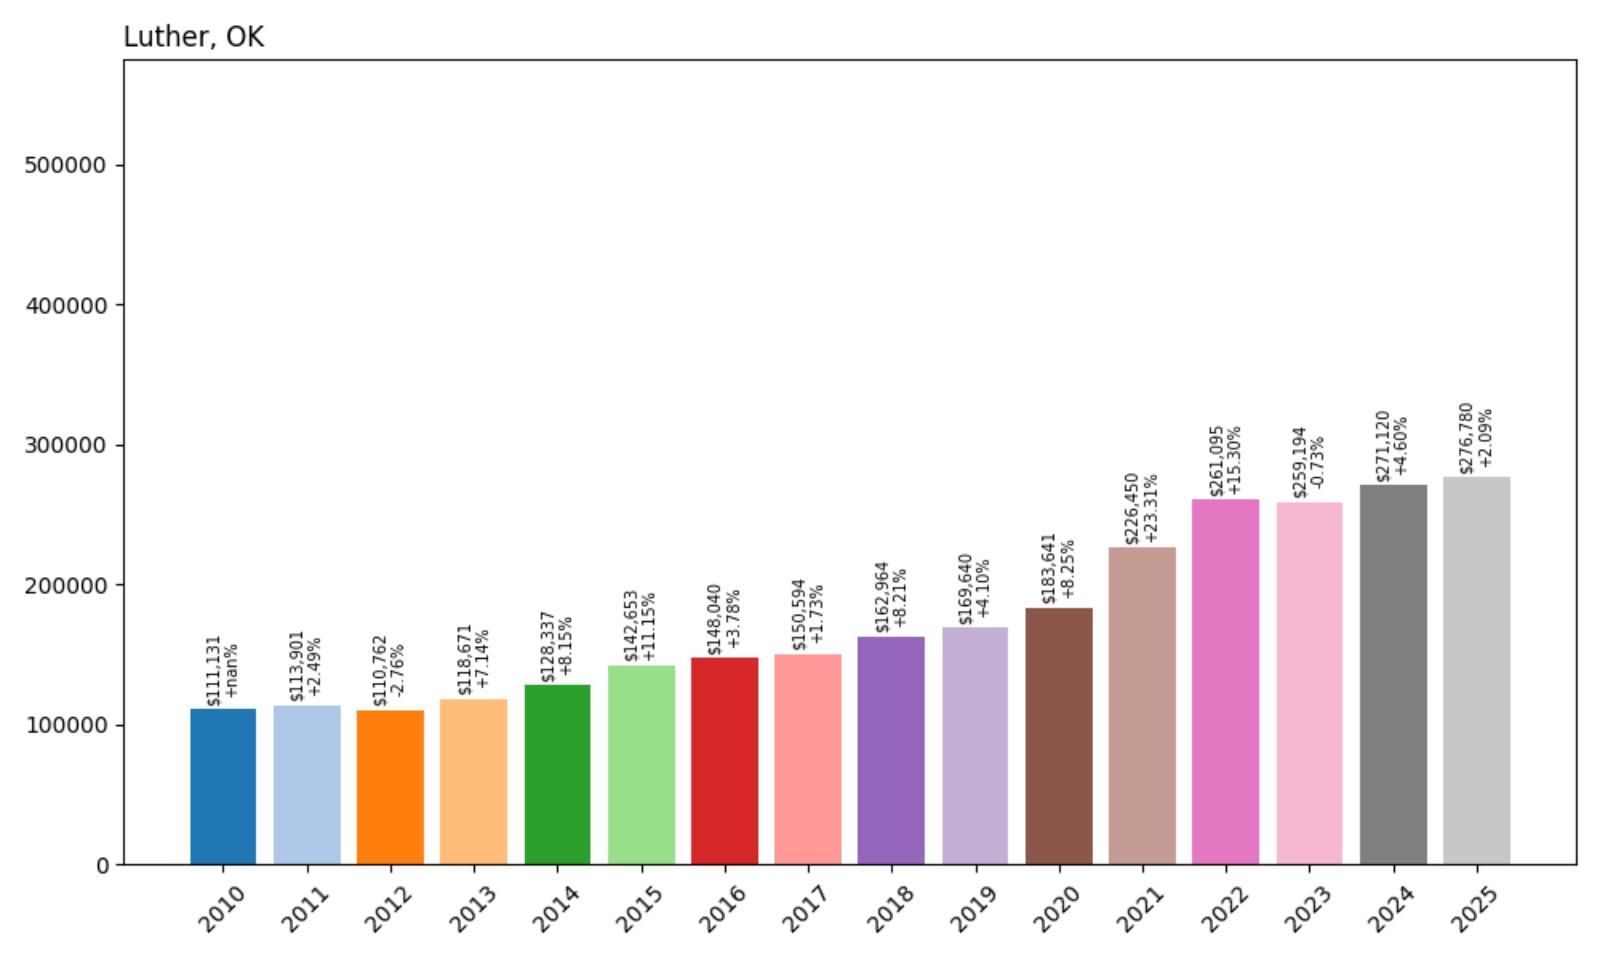
- 2010: $111,131
- 2011: $113,901 (+$2,770, +2.49% from previous year)
- 2012: $110,762 (−$3,139, −2.76% from previous year)
- 2013: $118,671 (+$7,909, +7.14% from previous year)
- 2014: $128,337 (+$9,666, +8.15% from previous year)
- 2015: $142,653 (+$14,316, +11.15% from previous year)
- 2016: $148,040 (+$5,387, +3.78% from previous year)
- 2017: $150,594 (+$2,555, +1.73% from previous year)
- 2018: $162,964 (+$12,370, +8.21% from previous year)
- 2019: $169,640 (+$6,676, +4.10% from previous year)
- 2020: $183,641 (+$14,001, +8.25% from previous year)
- 2021: $226,450 (+$42,809, +23.31% from previous year)
- 2022: $261,095 (+$34,645, +15.30% from previous year)
- 2023: $259,194 (−$1,901, −0.73% from previous year)
- 2024: $271,120 (+$11,926, +4.60% from previous year)
- 2025: $276,780 (+$5,660, +2.09% from previous year)
Since 2010, home values in Luther have surged by nearly 150%, rising from just over $111,000 to nearly $277,000 in 2025. The most dramatic uptick occurred between 2020 and 2022, when prices shot up by more than $77,000 in just two years. Even with a minor dip in 2023, the long-term trajectory remains sharply upward. This sustained growth points to increasing interest in the area, potentially from buyers seeking more space or looking for alternatives to denser parts of the Oklahoma City metro.
In order to come up with the very specific design ideas, we create most designs with the assistance of state-of-the-art AI interior design software.
Luther – A Rural Town With Big Momentum
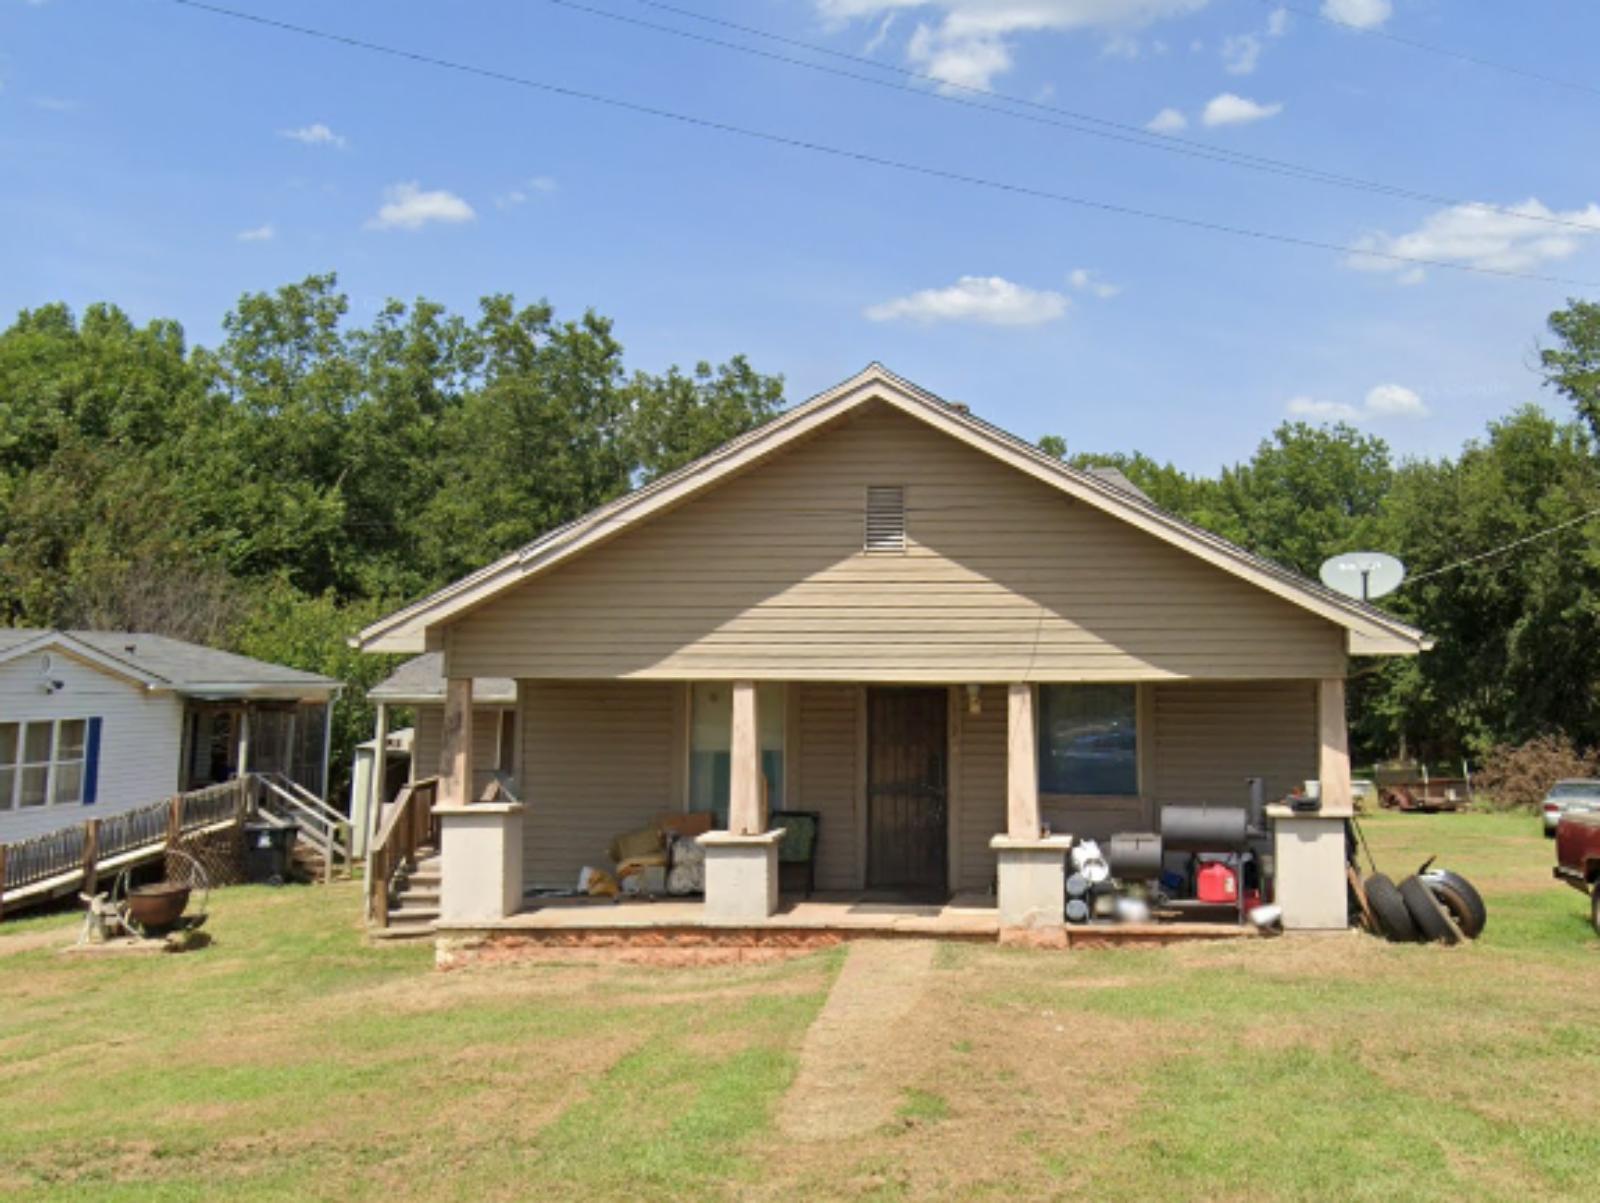
Luther is located northeast of Oklahoma City and has evolved from a quiet rural community into a small town with growing real estate appeal. The area benefits from proximity to Route 66 and the Turner Turnpike, making it accessible for commuters and remote workers alike. While it still retains its countryside charm, the rise in property values suggests increasing investment and residential development nearby. The town’s growth is driven partly by people seeking quieter lifestyles without sacrificing access to urban amenities.
Despite its size, Luther has gained attention thanks to new housing activity, expanding infrastructure, and attractive land prices in earlier years. As Oklahoma City’s reach extends outward, towns like Luther are seeing steady pressure from buyers priced out of inner-city neighborhoods. The town’s sharp appreciation since 2020 reflects those broader shifts in buyer demand, and it will be worth watching whether this trend sustains or stabilizes in the coming years.
31. Westport – 134% Home Price Increase Since 2010
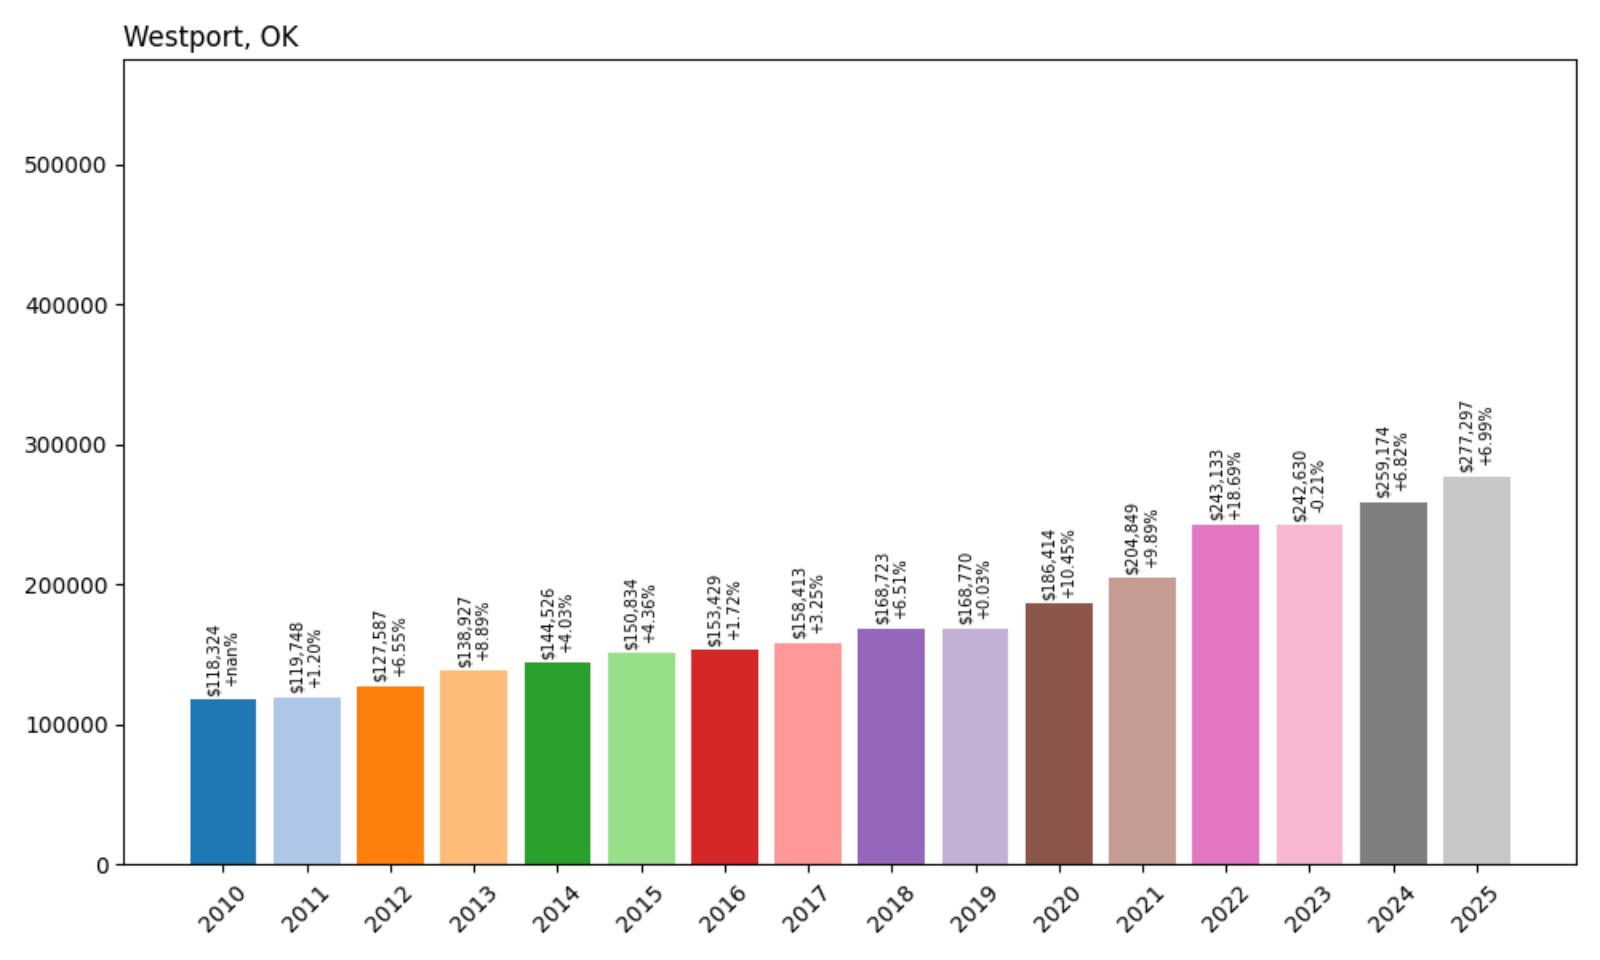
- 2010: $118,324
- 2011: $119,748 (+$1,424, +1.20% from previous year)
- 2012: $127,587 (+$7,839, +6.55% from previous year)
- 2013: $138,927 (+$11,340, +8.89% from previous year)
- 2014: $144,526 (+$5,599, +4.03% from previous year)
- 2015: $150,834 (+$6,308, +4.36% from previous year)
- 2016: $153,429 (+$2,595, +1.72% from previous year)
- 2017: $158,413 (+$4,984, +3.25% from previous year)
- 2018: $168,723 (+$10,310, +6.51% from previous year)
- 2019: $168,770 (+$47, +0.03% from previous year)
- 2020: $186,414 (+$17,644, +10.45% from previous year)
- 2021: $204,849 (+$18,435, +9.89% from previous year)
- 2022: $243,133 (+$38,285, +18.69% from previous year)
- 2023: $242,630 (−$504, −0.21% from previous year)
- 2024: $259,174 (+$16,544, +6.82% from previous year)
- 2025: $277,297 (+$18,123, +6.99% from previous year)
Westport’s home prices have more than doubled over the past 15 years, rising from roughly $118,000 in 2010 to over $277,000 in 2025. Much of this appreciation happened post-2020, with prices jumping nearly $90,000 from 2020 to 2025 alone. The market has remained resilient, showing strong recovery after a minor dip in 2023. These trends suggest growing desirability, perhaps driven by its lakeside location and proximity to Tulsa’s economic activity.
Westport – Lakeside Living Driving Strong Demand

Westport sits along Keystone Lake in northeastern Oklahoma, offering scenic lakefront properties and a peaceful residential environment. The town attracts buyers who value nature, water recreation, and quiet surroundings without being too far from larger cities like Tulsa. Waterfront access and outdoor activities such as boating and fishing are huge draws for second-home buyers and retirees alike.
Its modest size hasn’t slowed demand. In fact, being tucked away near the lake may have insulated Westport from the volatility experienced in more urban markets. The sharp post-2020 growth reflects both broader real estate trends and the town’s niche appeal. Given its location and amenities, continued upward price pressure is likely unless inventory expands significantly.
30. Collinsville – 73% Home Price Increase Since 2010
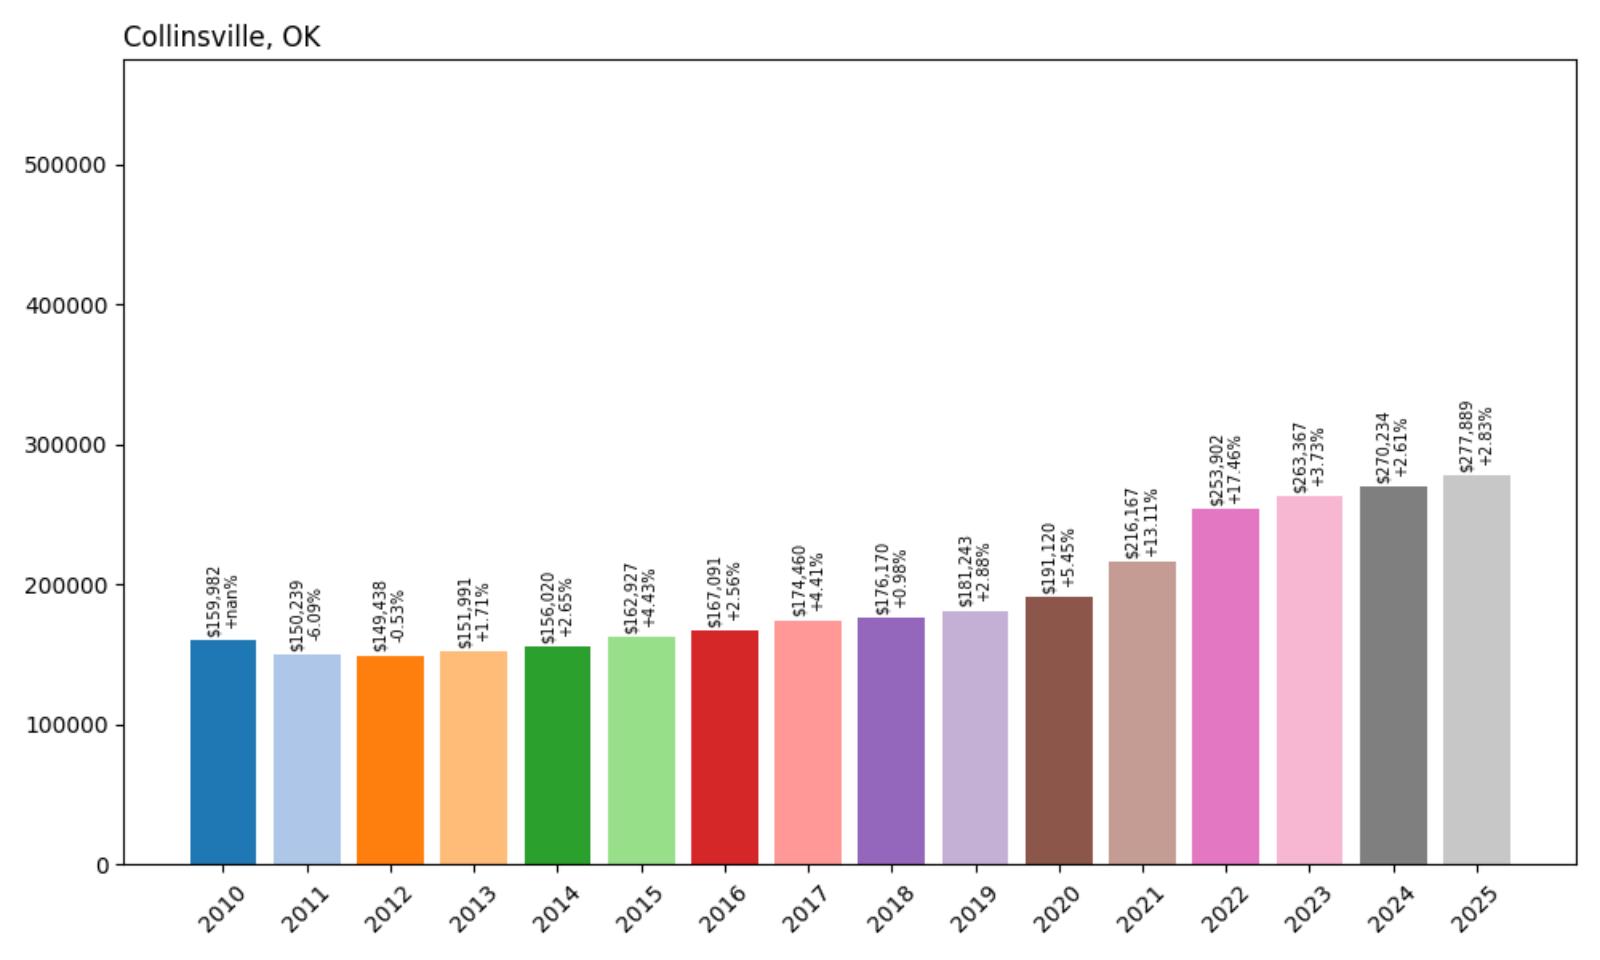
- 2010: $159,982
- 2011: $150,239 (−$9,743, −6.09% from previous year)
- 2012: $149,438 (−$801, −0.53% from previous year)
- 2013: $151,991 (+$2,553, +1.71% from previous year)
- 2014: $156,020 (+$4,030, +2.65% from previous year)
- 2015: $162,927 (+$6,907, +4.43% from previous year)
- 2016: $167,091 (+$4,164, +2.56% from previous year)
- 2017: $174,460 (+$7,368, +4.41% from previous year)
- 2018: $176,170 (+$1,710, +0.98% from previous year)
- 2019: $181,243 (+$5,073, +2.88% from previous year)
- 2020: $191,120 (+$9,877, +5.45% from previous year)
- 2021: $216,167 (+$25,047, +13.11% from previous year)
- 2022: $253,902 (+$37,735, +17.46% from previous year)
- 2023: $263,367 (+$9,465, +3.73% from previous year)
- 2024: $270,234 (+$6,867, +2.61% from previous year)
- 2025: $277,889 (+$7,655, +2.83% from previous year)
Collinsville has seen home values rise more than 70% since 2010, with much of the increase occurring in the last five years. The pandemic era marked a clear inflection point, pushing prices from around $191,000 in 2020 to nearly $278,000 by 2025. The town’s consistent year-over-year growth — even through slower national trends — speaks to underlying local demand and continued development in the area.
Collinsville – A Steady Climb Fueled by Location
Located north of Tulsa, Collinsville benefits from its place within the Tulsa metro area while maintaining its own small-town identity. The town is known for its family-friendly atmosphere, good schools, and access to employment hubs. Its proximity to Highway 169 makes commuting manageable, drawing buyers who want suburban life without sacrificing connectivity.
Unlike some boomtowns that experienced sharp swings, Collinsville’s growth has been more measured. The consistent upward movement in prices suggests long-term confidence from homeowners and investors alike. With its blend of accessibility and community character, Collinsville is positioned as a reliable market in northeast Oklahoma.
29. Mustang – 78% Home Price Increase Since 2010
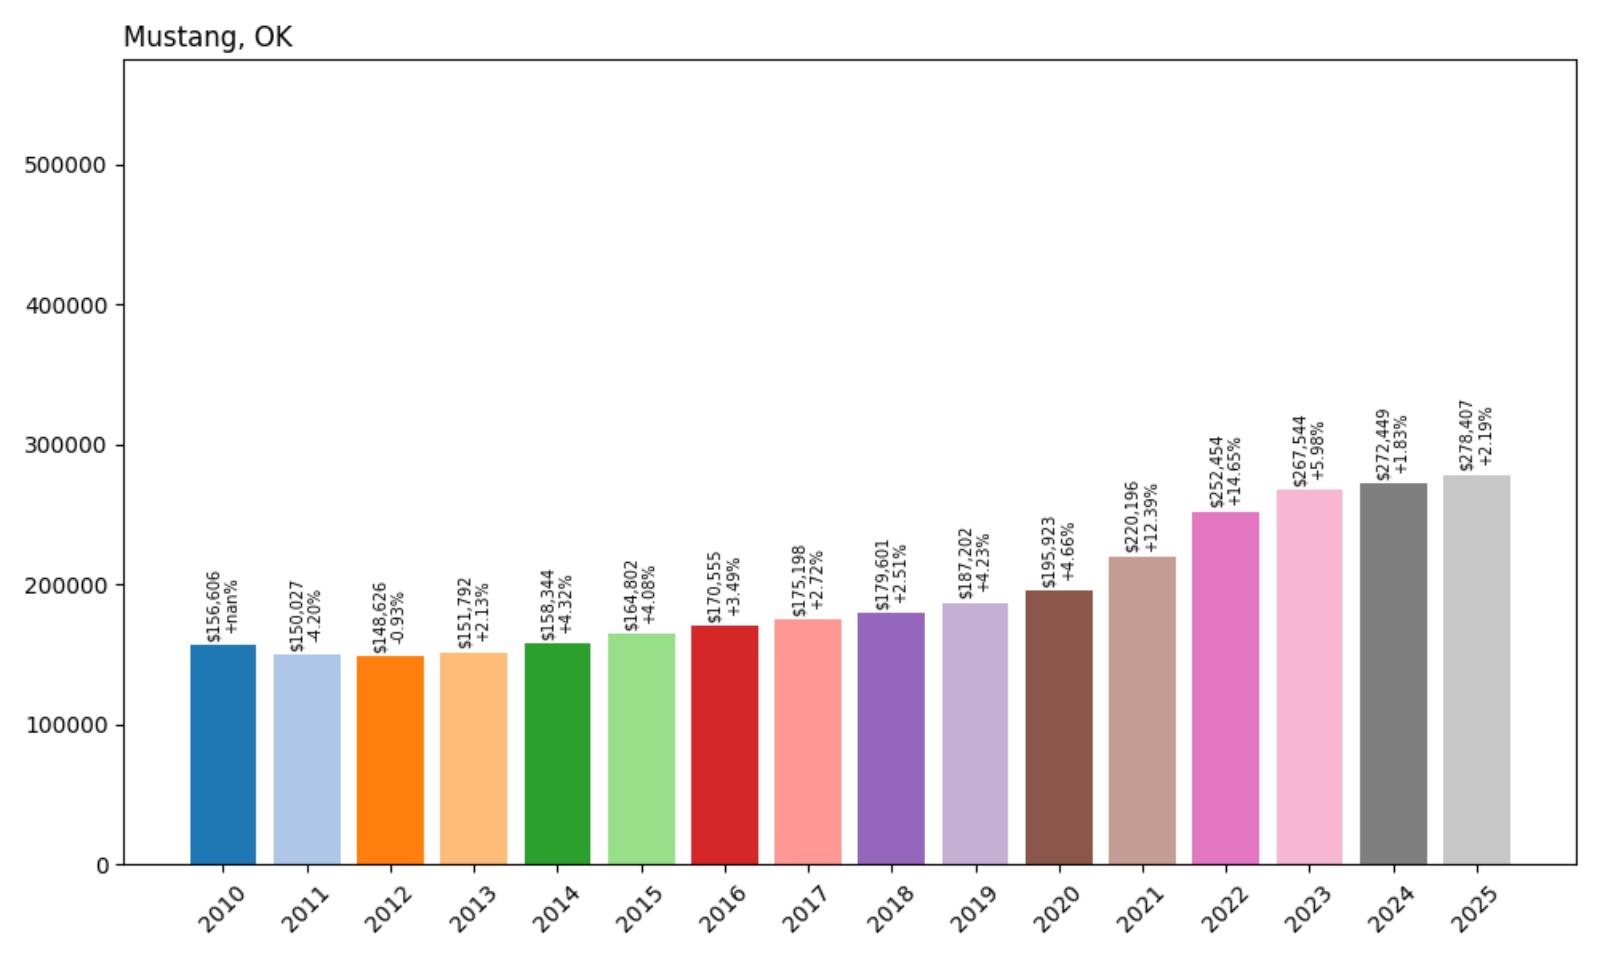
- 2010: $156,606
- 2011: $150,027 (−$6,580, −4.20% from previous year)
- 2012: $148,626 (−$1,400, −0.93% from previous year)
- 2013: $151,792 (+$3,166, +2.13% from previous year)
- 2014: $158,344 (+$6,551, +4.32% from previous year)
- 2015: $164,802 (+$6,458, +4.08% from previous year)
- 2016: $170,555 (+$5,753, +3.49% from previous year)
- 2017: $175,198 (+$4,643, +2.72% from previous year)
- 2018: $179,601 (+$4,403, +2.51% from previous year)
- 2019: $187,202 (+$7,601, +4.23% from previous year)
- 2020: $195,923 (+$8,721, +4.66% from previous year)
- 2021: $220,196 (+$24,274, +12.39% from previous year)
- 2022: $252,454 (+$32,257, +14.65% from previous year)
- 2023: $267,544 (+$15,090, +5.98% from previous year)
- 2024: $272,449 (+$4,905, +1.83% from previous year)
- 2025: $278,407 (+$5,959, +2.19% from previous year)
From under $157,000 in 2010 to more than $278,000 in 2025, Mustang has added over $120,000 in average home value over the past 15 years. The sharpest growth occurred between 2020 and 2022, when prices leapt by over $56,000 in just two years. Though the pace has moderated, Mustang continues to edge upward — a sign of ongoing housing demand and market confidence.
Mustang – Growing Fast With Room to Expand

West of Oklahoma City, Mustang has emerged as one of the fastest-growing suburbs in Canadian County. With strong schools, newer housing developments, and a family-friendly vibe, it’s an attractive choice for homebuyers looking for more space while staying within commuting range of the city. Mustang has also seen retail and infrastructure growth, further boosting its livability and long-term appeal.
The town’s affordability compared to central OKC neighborhoods continues to pull in buyers, but rising prices may soon challenge that perception. Still, its upward momentum feels sustainable thanks to available land, a proactive city government, and a steady stream of new residents. For those looking for a high-growth suburban market, Mustang has clearly made its mark.
28. Washington – 107% Home Price Increase Since 2010
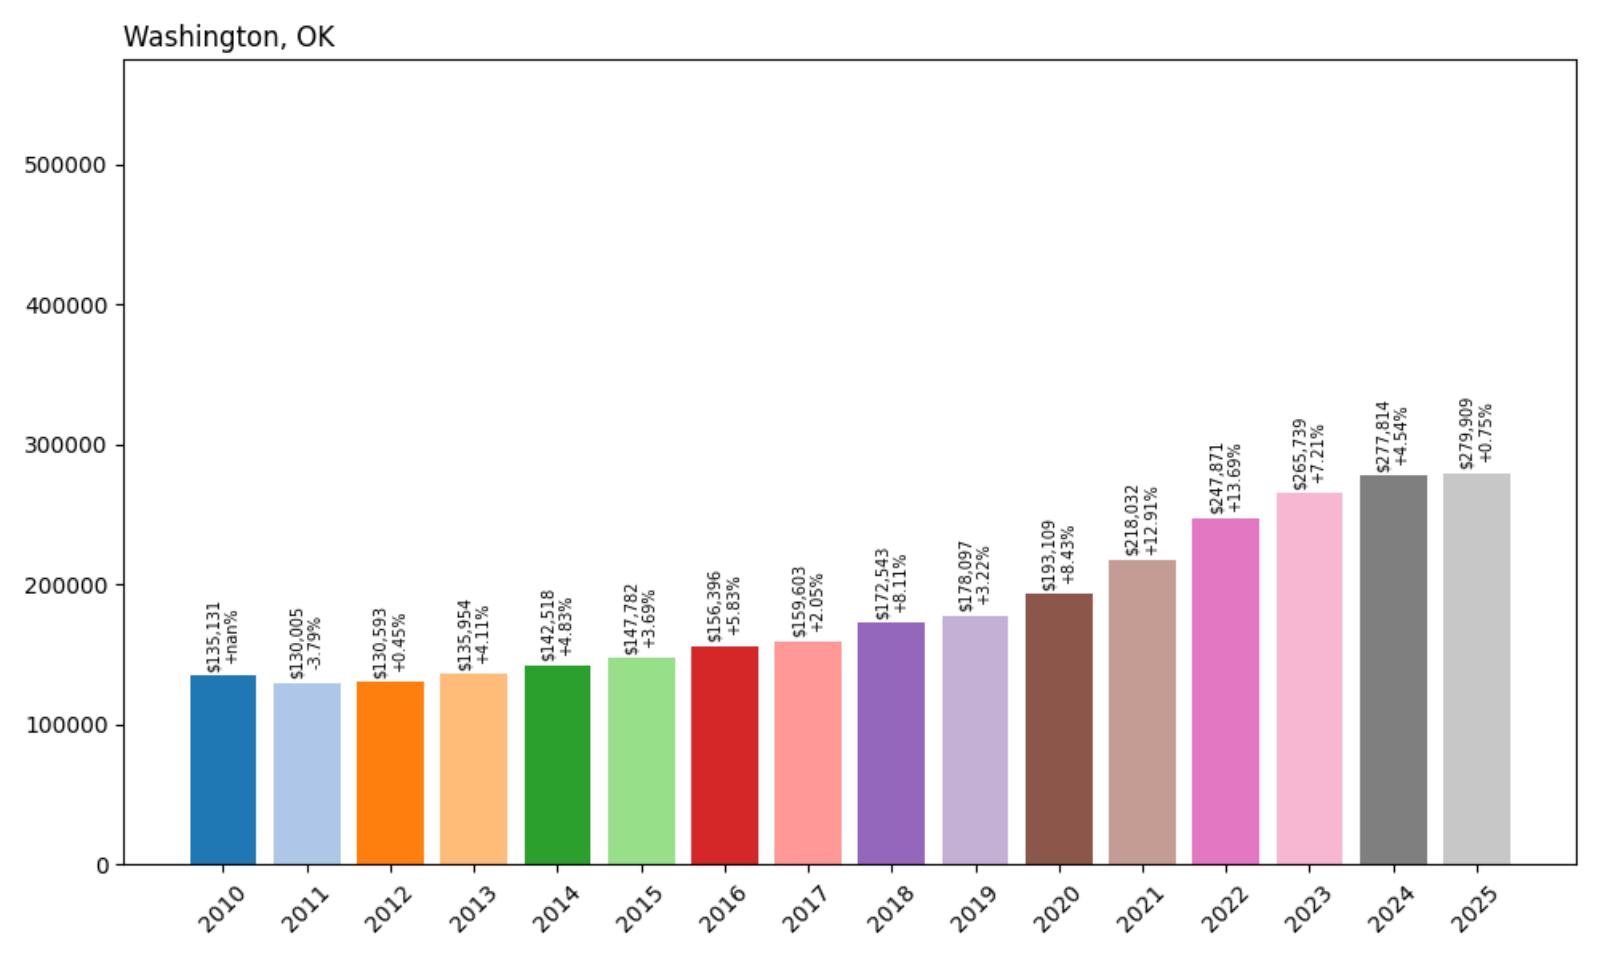
- 2010: $135,131
- 2011: $130,005 (−$5,125, −3.79% from previous year)
- 2012: $130,593 (+$587, +0.45% from previous year)
- 2013: $135,954 (+$5,361, +4.11% from previous year)
- 2014: $142,518 (+$6,564, +4.83% from previous year)
- 2015: $147,782 (+$5,264, +3.69% from previous year)
- 2016: $156,396 (+$8,615, +5.83% from previous year)
- 2017: $159,603 (+$3,206, +2.05% from previous year)
- 2018: $172,543 (+$12,941, +8.11% from previous year)
- 2019: $178,097 (+$5,554, +3.22% from previous year)
- 2020: $193,109 (+$15,012, +8.43% from previous year)
- 2021: $218,032 (+$24,923, +12.91% from previous year)
- 2022: $247,871 (+$29,839, +13.69% from previous year)
- 2023: $265,739 (+$17,868, +7.21% from previous year)
- 2024: $277,814 (+$12,075, +4.54% from previous year)
- 2025: $279,909 (+$2,095, +0.75% from previous year)
Washington has more than doubled its average home value since 2010, climbing from around $135,000 to nearly $280,000 in 2025. The years between 2020 and 2022 were particularly notable, with back-to-back double-digit increases. Even as the pace cooled recently, the market remains near record highs — a strong indicator of sustained demand in the area.
Washington – Small-Town Life With Rising Prices
Washington sits in McClain County, just south of Norman, and offers a classic small-town atmosphere with convenient access to larger cities. Its proximity to I-35 makes it an appealing location for commuters and those looking for a slower pace without giving up connectivity. The town also benefits from a well-rated school system and a tight-knit community feel.
Recent price surges align with broader trends in exurban growth, where buyers are seeking more space and affordability outside major metros. Washington’s rural character and growing popularity make it a clear example of these shifting patterns. With limited housing inventory and strong interest, upward pressure on prices could persist if demand remains strong in the coming years.
27. Broken Arrow – 73% Home Price Increase Since 2010

- 2010: $164,322
- 2011: $155,649 (−$8,672, −5.28% from previous year)
- 2012: $156,171 (+$521, +0.33% from previous year)
- 2013: $159,837 (+$3,666, +2.35% from previous year)
- 2014: $162,685 (+$2,848, +1.78% from previous year)
- 2015: $169,688 (+$7,003, +4.30% from previous year)
- 2016: $173,403 (+$3,715, +2.19% from previous year)
- 2017: $180,501 (+$7,098, +4.09% from previous year)
- 2018: $183,257 (+$2,756, +1.53% from previous year)
- 2019: $187,808 (+$4,552, +2.48% from previous year)
- 2020: $198,458 (+$10,649, +5.67% from previous year)
- 2021: $226,591 (+$28,133, +14.18% from previous year)
- 2022: $264,357 (+$37,766, +16.67% from previous year)
- 2023: $271,553 (+$7,195, +2.72% from previous year)
- 2024: $278,393 (+$6,841, +2.52% from previous year)
- 2025: $284,893 (+$6,500, +2.33% from previous year)
Broken Arrow’s housing market has seen a steady and impressive climb, with average home values growing from $164,322 in 2010 to $284,893 in 2025. That’s a 73% increase over 15 years. Much of this growth came in the 2020–2022 period, when buyers surged into suburban markets across the country. Even now, prices continue to tick up year after year, suggesting that demand in the area remains strong and stable.
Broken Arrow – Tulsa’s Largest Suburb Keeps Expanding
Broken Arrow, the largest suburb of Tulsa, has long been a magnet for families and professionals looking for newer housing, good schools, and a strong sense of community. With a population that now exceeds 115,000, the city offers everything from big-box retail to local charm, making it a destination in its own right. Its school system consistently ranks well in the state, which helps drive continued interest in its housing market.
The city’s location just southeast of Tulsa gives it both convenience and space. Development has steadily pushed outward, especially in recent years as remote work allowed more families to leave urban cores. With modern subdivisions, parks, and an active downtown revitalization effort, Broken Arrow’s growth trajectory seems far from over. The housing price gains reflect both the local amenities and broader regional growth around Tulsa.
26. Oologah – 81% Home Price Increase Since 2010

🔥 Would you like to save this?
- 2010: $160,141
- 2011: $157,720 (−$2,421, −1.51% from previous year)
- 2012: $149,327 (−$8,393, −5.32% from previous year)
- 2013: $151,692 (+$2,365, +1.58% from previous year)
- 2014: $155,418 (+$3,725, +2.46% from previous year)
- 2015: $160,741 (+$5,323, +3.43% from previous year)
- 2016: $169,913 (+$9,172, +5.71% from previous year)
- 2017: $173,765 (+$3,852, +2.27% from previous year)
- 2018: $179,553 (+$5,788, +3.33% from previous year)
- 2019: $187,985 (+$8,432, +4.70% from previous year)
- 2020: $195,664 (+$7,679, +4.09% from previous year)
- 2021: $230,966 (+$35,302, +18.04% from previous year)
- 2022: $265,073 (+$34,107, +14.77% from previous year)
- 2023: $272,797 (+$7,724, +2.91% from previous year)
- 2024: $280,583 (+$7,786, +2.85% from previous year)
- 2025: $289,246 (+$8,663, +3.09% from previous year)
Oologah’s housing market has appreciated 81% since 2010, and the climb has been especially steep since 2020. Between 2020 and 2022 alone, home values jumped nearly $70,000. Prices have continued to rise year-over-year, with the average home now valued just under $290,000 in 2025. These gains suggest an area that’s attracting consistent interest from buyers looking for space and value near the Tulsa metro.
Oologah – A Lake Town on the Rise

Oologah is located in Rogers County, near the shores of Oologah Lake, one of northeast Oklahoma’s premier recreational destinations. The town’s lakeside lifestyle and proximity to the Tulsa area make it attractive to a mix of retirees, commuters, and vacation home buyers. Though still relatively small, the area has seen steady development, particularly in residential subdivisions and lake-adjacent properties.
Part of Oologah’s appeal lies in its balance of affordability and access to outdoor amenities. Families are drawn to the local school district and the small-town environment. The surge in home values since 2020 reflects broader trends in rural and semi-rural markets gaining popularity, but Oologah’s consistent growth hints at long-term staying power beyond that initial wave of interest.
25. Porter – 82% Home Price Increase Since 2010
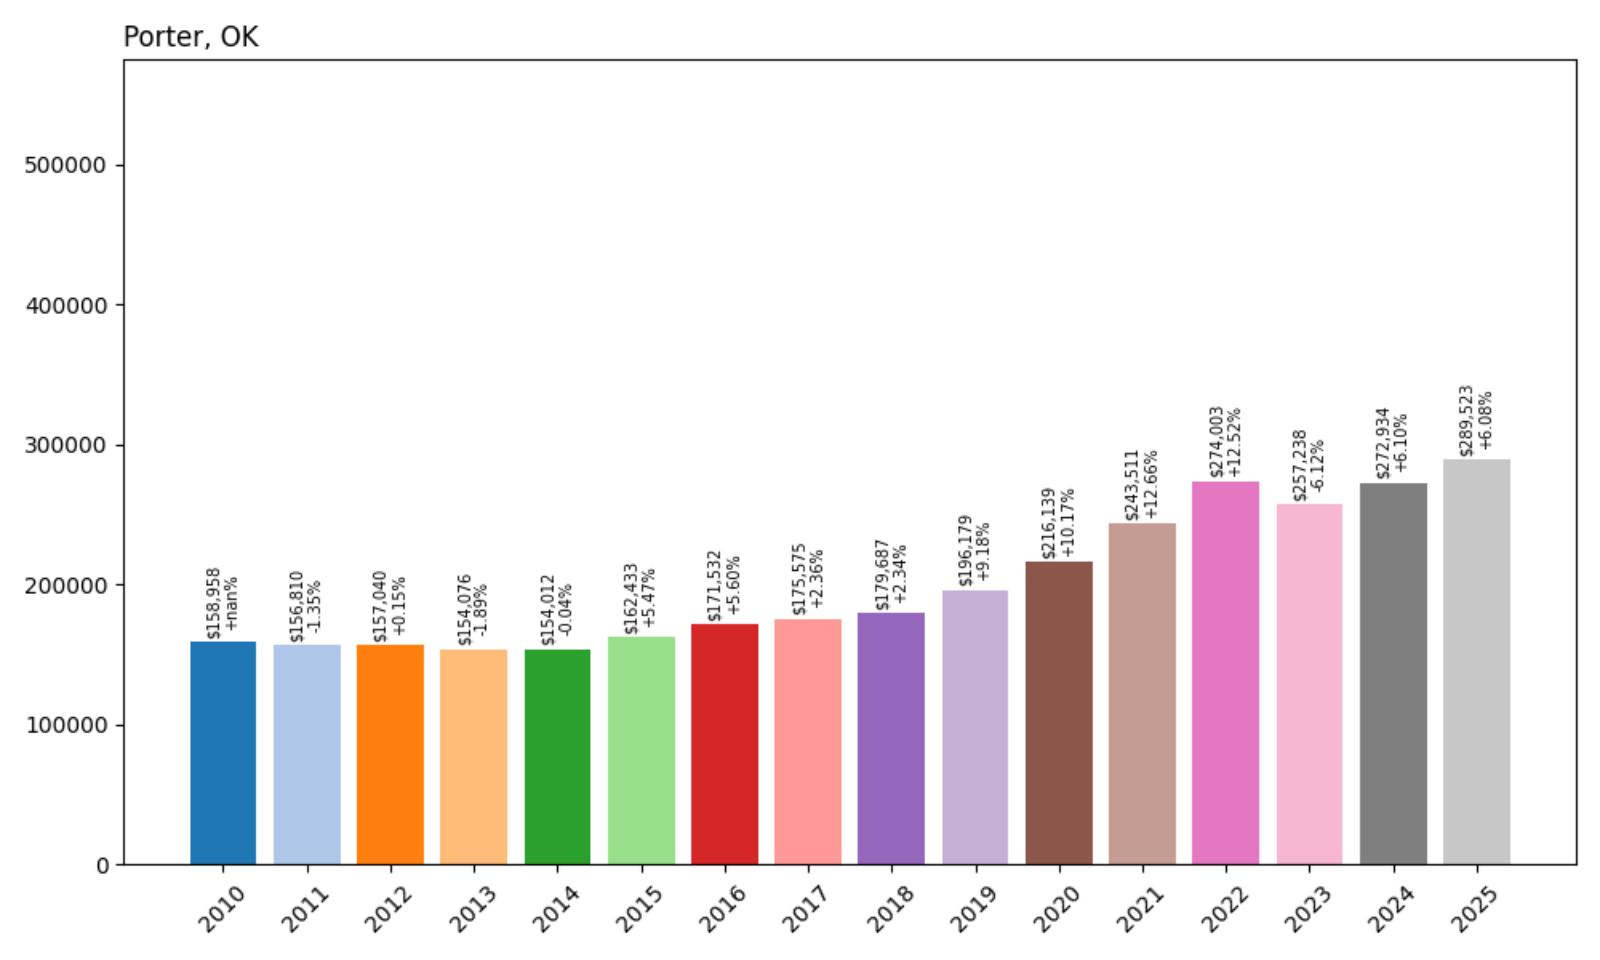
- 2010: $158,958
- 2011: $156,810 (−$2,148, −1.35% from previous year)
- 2012: $157,040 (+$230, +0.15% from previous year)
- 2013: $154,076 (−$2,964, −1.89% from previous year)
- 2014: $154,012 (−$64, −0.04% from previous year)
- 2015: $162,433 (+$8,420, +5.47% from previous year)
- 2016: $171,532 (+$9,099, +5.60% from previous year)
- 2017: $175,575 (+$4,043, +2.36% from previous year)
- 2018: $179,687 (+$4,111, +2.34% from previous year)
- 2019: $196,179 (+$16,492, +9.18% from previous year)
- 2020: $216,139 (+$19,961, +10.17% from previous year)
- 2021: $243,511 (+$27,372, +12.66% from previous year)
- 2022: $274,003 (+$30,491, +12.52% from previous year)
- 2023: $257,238 (−$16,764, −6.12% from previous year)
- 2024: $272,934 (+$15,696, +6.10% from previous year)
- 2025: $289,523 (+$16,589, +6.08% from previous year)
Porter has seen an 82% increase in home values since 2010, with a significant spike between 2020 and 2022. Prices dipped slightly in 2023 but quickly bounced back, reaching $289,523 in 2025. The quick recovery suggests that the local housing market is resilient, supported by long-term demand and perhaps a limited inventory that keeps prices high even during national slowdowns.
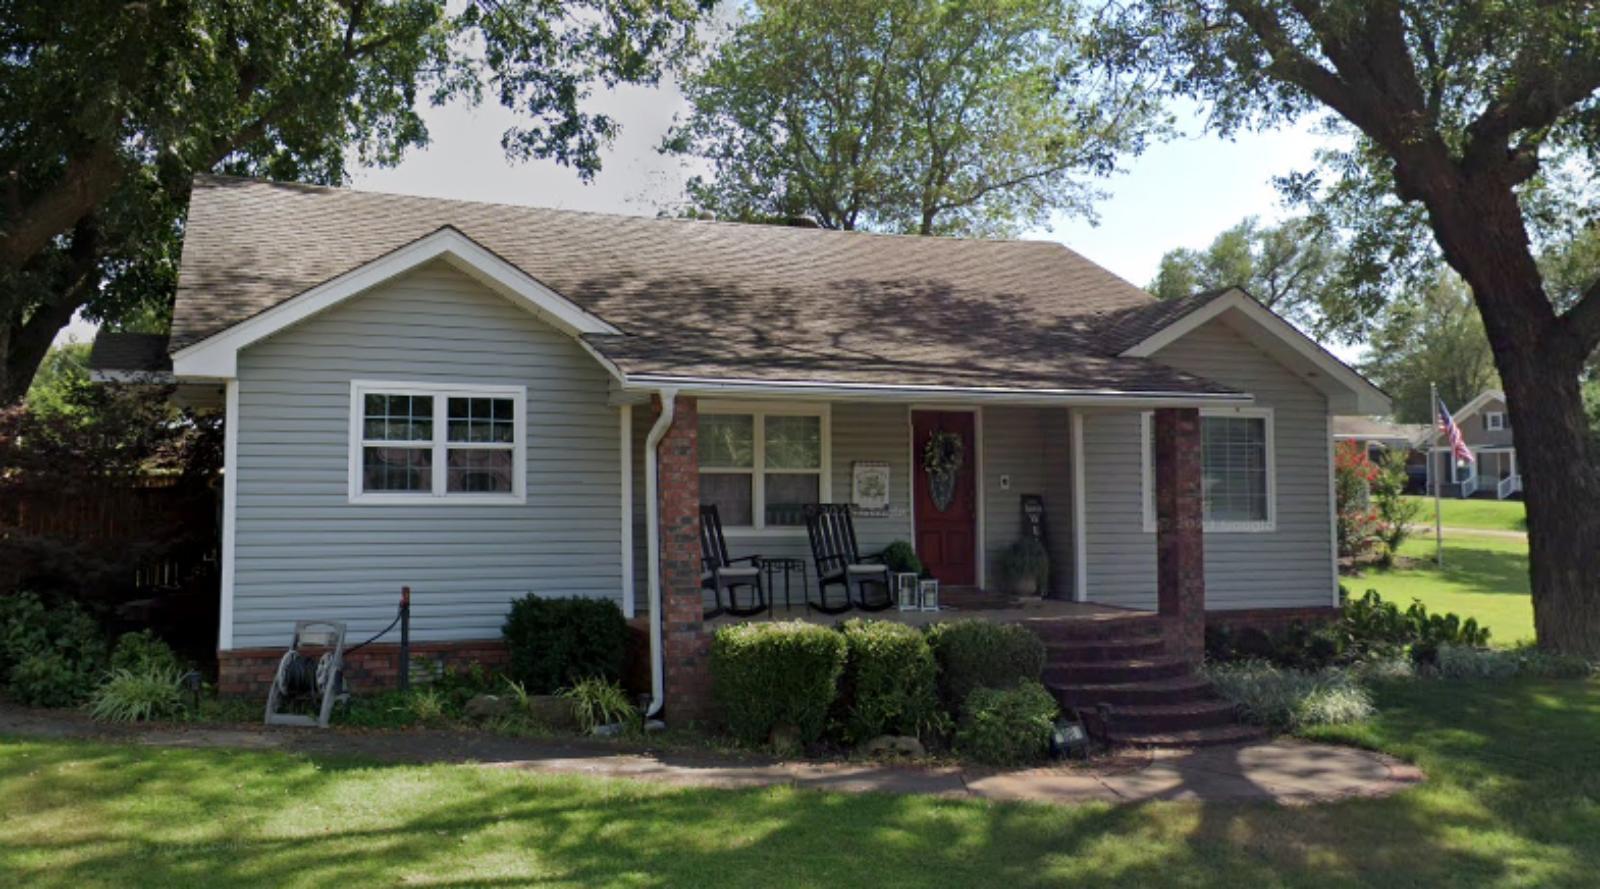
Porter – Small But Steadily Climbing
Porter is a small town in Wagoner County, often associated with its agriculture—especially peaches, thanks to the annual Porter Peach Festival. Despite its modest size, Porter has seen consistent home value growth due to its close proximity to larger markets like Muskogee and Tulsa. It appeals to buyers looking for small-town charm with easy access to urban amenities.
The post-2020 boom mirrors trends seen in many rural towns that suddenly became more attractive to remote workers and retirees. The temporary dip in 2023 could reflect cooling from that wave, but the rebound in 2024 and 2025 suggests that demand remains solid. With its community traditions and access to key highways, Porter’s real estate market continues to punch above its weight.
24. Medicine Park – 145% Home Price Increase Since 2010
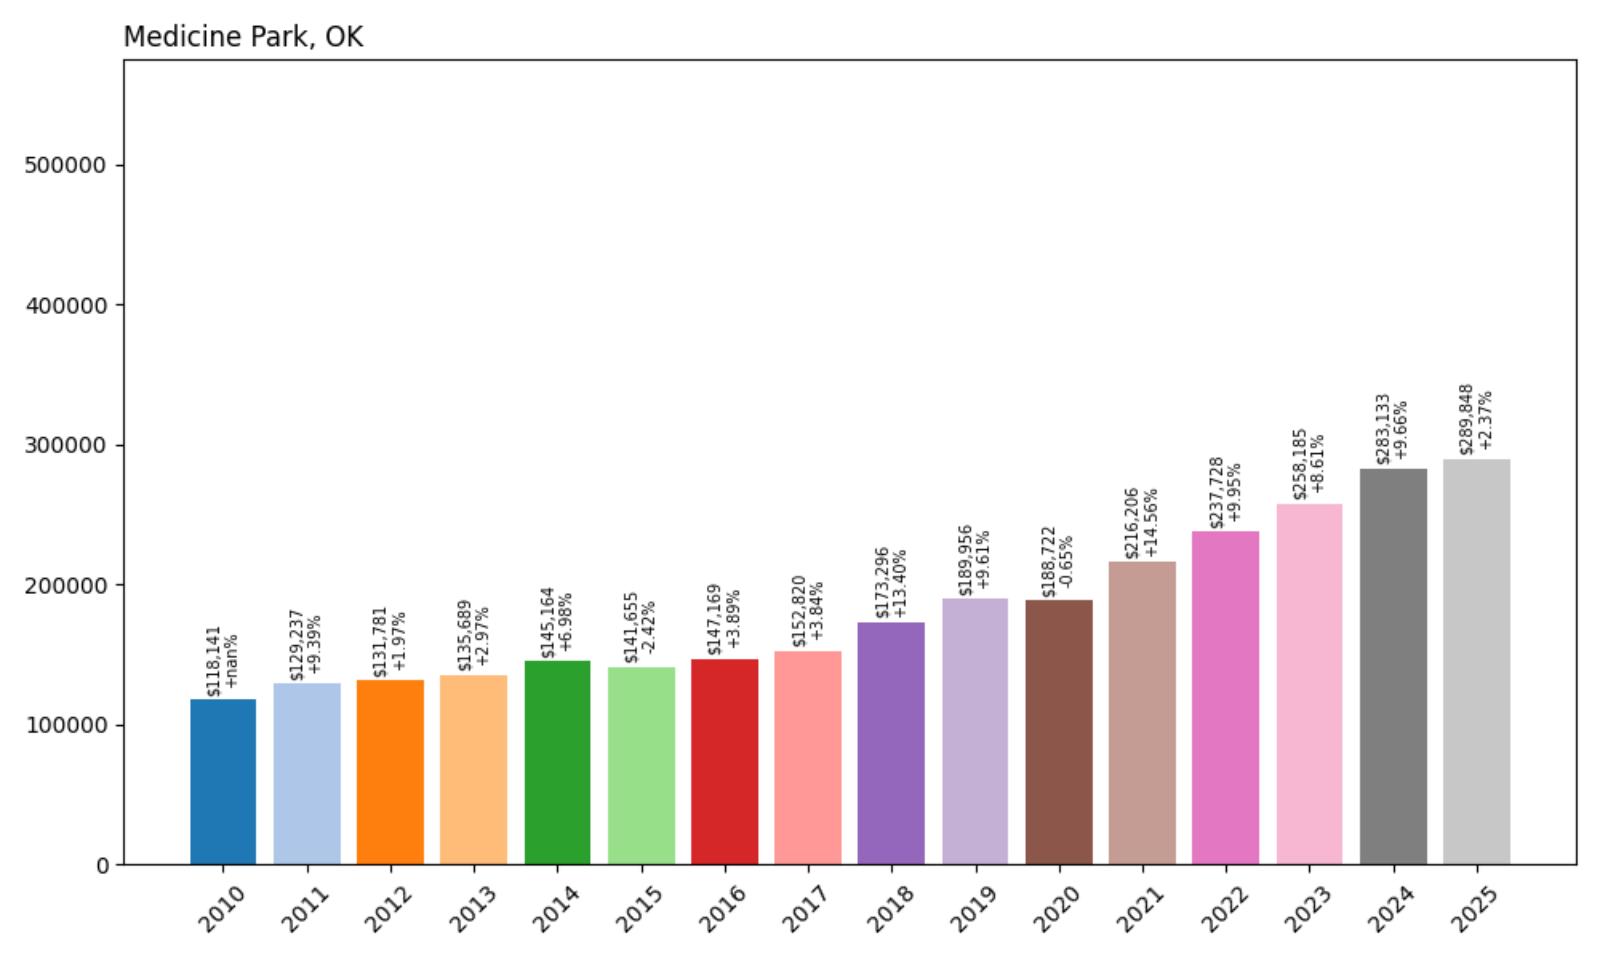
- 2010: $118,141
- 2011: $129,237 (+$11,096, +9.39% from previous year)
- 2012: $131,781 (+$2,544, +1.97% from previous year)
- 2013: $135,689 (+$3,908, +2.97% from previous year)
- 2014: $145,164 (+$9,476, +6.98% from previous year)
- 2015: $141,655 (−$3,509, −2.42% from previous year)
- 2016: $147,169 (+$5,514, +3.89% from previous year)
- 2017: $152,820 (+$5,650, +3.84% from previous year)
- 2018: $173,296 (+$20,477, +13.40% from previous year)
- 2019: $189,956 (+$16,660, +9.61% from previous year)
- 2020: $188,722 (−$1,234, −0.65% from previous year)
- 2021: $216,206 (+$27,484, +14.56% from previous year)
- 2022: $237,728 (+$21,522, +9.95% from previous year)
- 2023: $258,185 (+$20,457, +8.61% from previous year)
- 2024: $283,133 (+$24,948, +9.66% from previous year)
- 2025: $289,848 (+$6,715, +2.37% from previous year)
Medicine Park has seen one of the strongest appreciation trends in the state, with home values jumping 145% since 2010. The town has gained more than $170,000 in average value over 15 years. Prices have risen nearly every year, with particularly large jumps after 2020. The consistency and strength of the growth reflect the town’s growing reputation as a desirable place to live and visit.
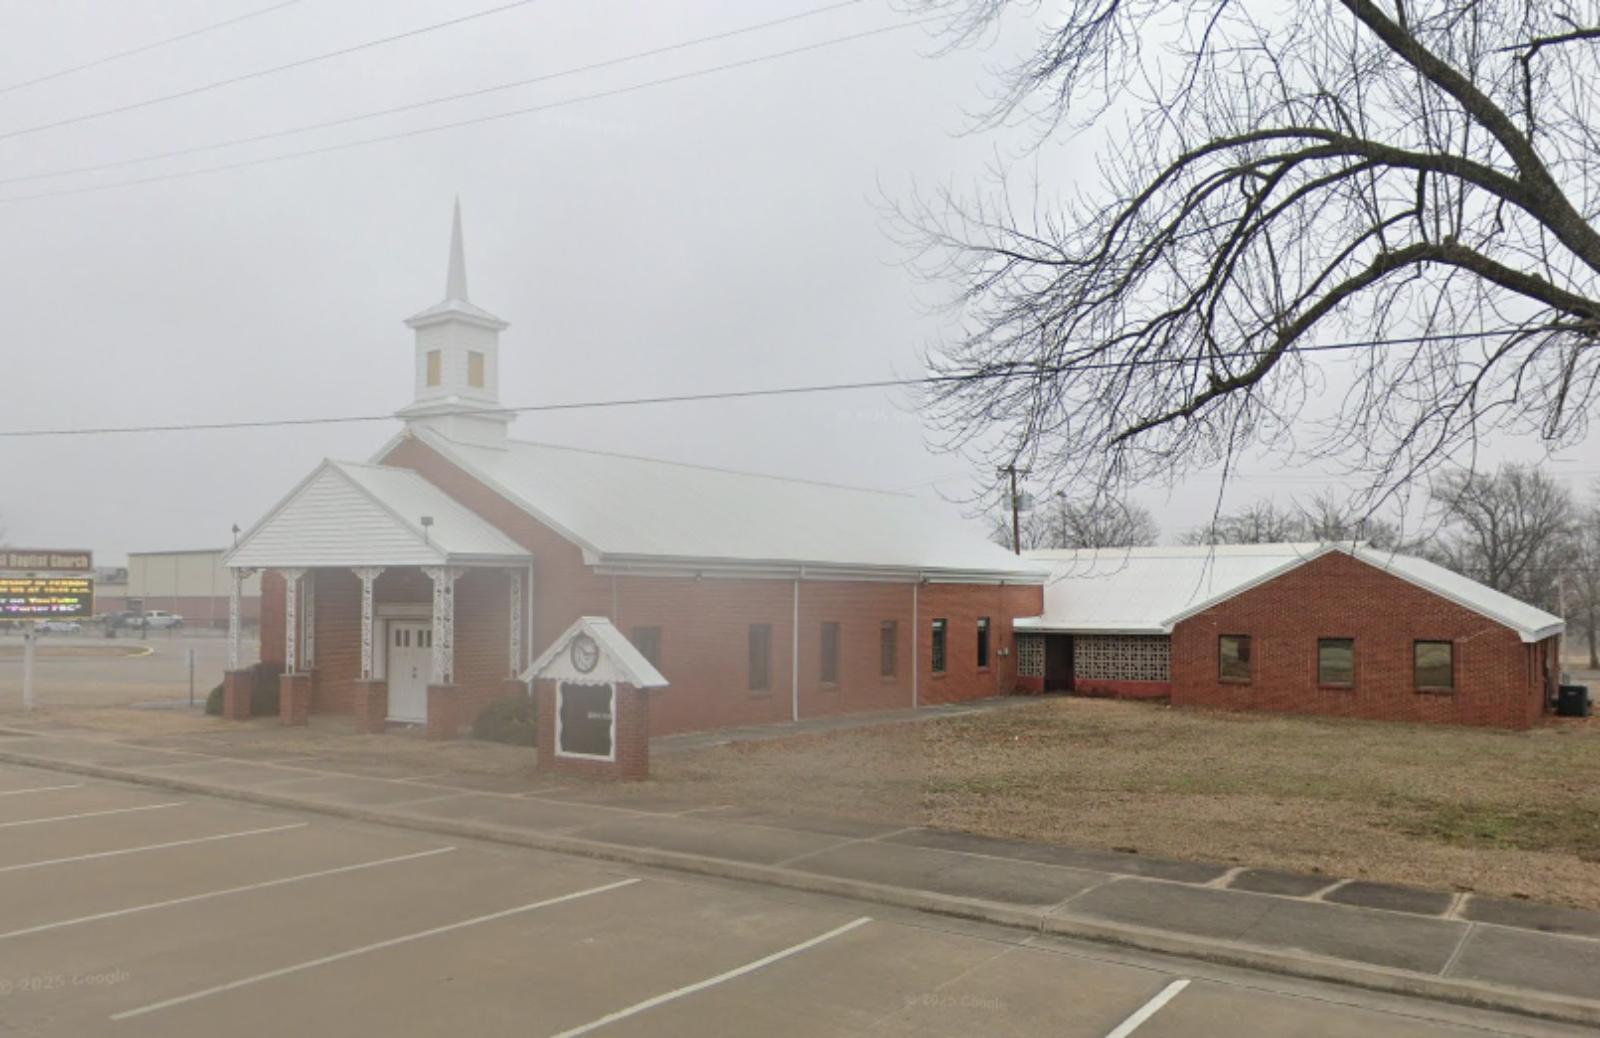
Medicine Park – Scenic Charm Turning Into Real Estate Gold
Medicine Park, nestled in the Wichita Mountains near Lawton, is one of Oklahoma’s most picturesque towns. Originally developed as a resort community in the early 1900s, it retains its cobblestone architecture and historic appeal. In recent years, it has transformed into a thriving destination with local shops, trails, and riverside cabins that appeal to tourists and residents alike.
The real estate market here has become increasingly competitive, especially for those seeking vacation rentals or retirement homes with a view. The sharp increases in price are tied to this transformation—where once Medicine Park was sleepy and overlooked, it’s now one of the state’s most in-demand rural markets. Limited inventory and unique appeal will likely keep upward pressure on prices in the future.
23. Elgin – 58% Home Price Increase Since 2010

- 2010: $183,962
- 2011: $182,126 (−$1,836, −1.00% from previous year)
- 2012: $182,214 (+$88, +0.05% from previous year)
- 2013: $184,104 (+$1,889, +1.04% from previous year)
- 2014: $186,515 (+$2,411, +1.31% from previous year)
- 2015: $189,660 (+$3,146, +1.69% from previous year)
- 2016: $191,713 (+$2,052, +1.08% from previous year)
- 2017: $192,320 (+$607, +0.32% from previous year)
- 2018: $196,306 (+$3,986, +2.07% from previous year)
- 2019: $204,469 (+$8,163, +4.16% from previous year)
- 2020: $207,538 (+$3,069, +1.50% from previous year)
- 2021: $230,359 (+$22,821, +11.00% from previous year)
- 2022: $261,185 (+$30,825, +13.38% from previous year)
- 2023: $271,871 (+$10,686, +4.09% from previous year)
- 2024: $279,739 (+$7,868, +2.89% from previous year)
- 2025: $290,465 (+$10,726, +3.83% from previous year)
Elgin’s housing market has grown steadily, increasing by 58% from 2010 to 2025. From $183,962 in 2010 to $290,465 in 2025, the town has added over $100,000 in value. While growth before 2020 was slow and steady, the post-pandemic market brought rapid acceleration, with double-digit gains in 2021 and 2022. The market has remained stable since, continuing its upward trend through 2025.
Elgin – Growth Fueled by Fort Sill Proximity
Located just north of Lawton and adjacent to Fort Sill, Elgin benefits greatly from its military ties. It’s a popular choice for service members, defense contractors, and families who want a quieter, more suburban feel than Lawton offers. The strong school district and ongoing housing development have also helped drive consistent demand for homes in the area.
Elgin’s accessibility via I-44 and its steady local economy make it a dependable place to buy property. As military housing demand remains constant and the broader Lawton metro continues to evolve, Elgin’s real estate market is positioned for further, if measured, appreciation. The town’s appeal lies in its combination of community, schools, and access — and the numbers reflect that growing interest.
22. Grove – 100% Home Price Increase Since 2010

- 2010: $147,079
- 2011: $143,397 (−$3,682, −2.50% from previous year)
- 2012: $147,761 (+$4,365, +3.04% from previous year)
- 2013: $151,498 (+$3,737, +2.53% from previous year)
- 2014: $159,564 (+$8,066, +5.32% from previous year)
- 2015: $158,441 (−$1,123, −0.70% from previous year)
- 2016: $163,299 (+$4,858, +3.07% from previous year)
- 2017: $162,599 (−$700, −0.43% from previous year)
- 2018: $169,207 (+$6,608, +4.06% from previous year)
- 2019: $174,713 (+$5,505, +3.25% from previous year)
- 2020: $184,980 (+$10,268, +5.88% from previous year)
- 2021: $227,162 (+$42,181, +22.80% from previous year)
- 2022: $271,460 (+$44,299, +19.50% from previous year)
- 2023: $274,730 (+$3,270, +1.20% from previous year)
- 2024: $284,405 (+$9,675, +3.52% from previous year)
- 2025: $293,764 (+$9,359, +3.29% from previous year)
Grove has doubled its average home price since 2010, climbing from $147,079 to $293,764 in 2025. The most dramatic growth occurred between 2020 and 2022, when values skyrocketed by over $86,000 in just two years. While the market has since cooled, the climb continues at a more moderate pace, and the 100% gain over 15 years signals strong long-term demand in the area.
Grove – Grand Lake’s Premier Community
Situated on the northeastern edge of Grand Lake o’ the Cherokees, Grove is one of Oklahoma’s most scenic lakefront towns. It’s a major destination for retirees, boaters, and second-home buyers, offering a wide mix of recreational amenities and a vibrant local economy. The lakefront access, along with newer developments and a growing medical presence, has helped fuel consistent housing demand.
Grove’s affordability relative to other lake communities has historically been a draw, but rising home prices suggest its reputation is catching up to its amenities. The steep gains during the pandemic era mirror national interest in waterfront and rural properties, and Grove stood out as a high-value option. With limited buildable land around the lake, prices could continue to rise due to supply constraints and steady buyer interest.
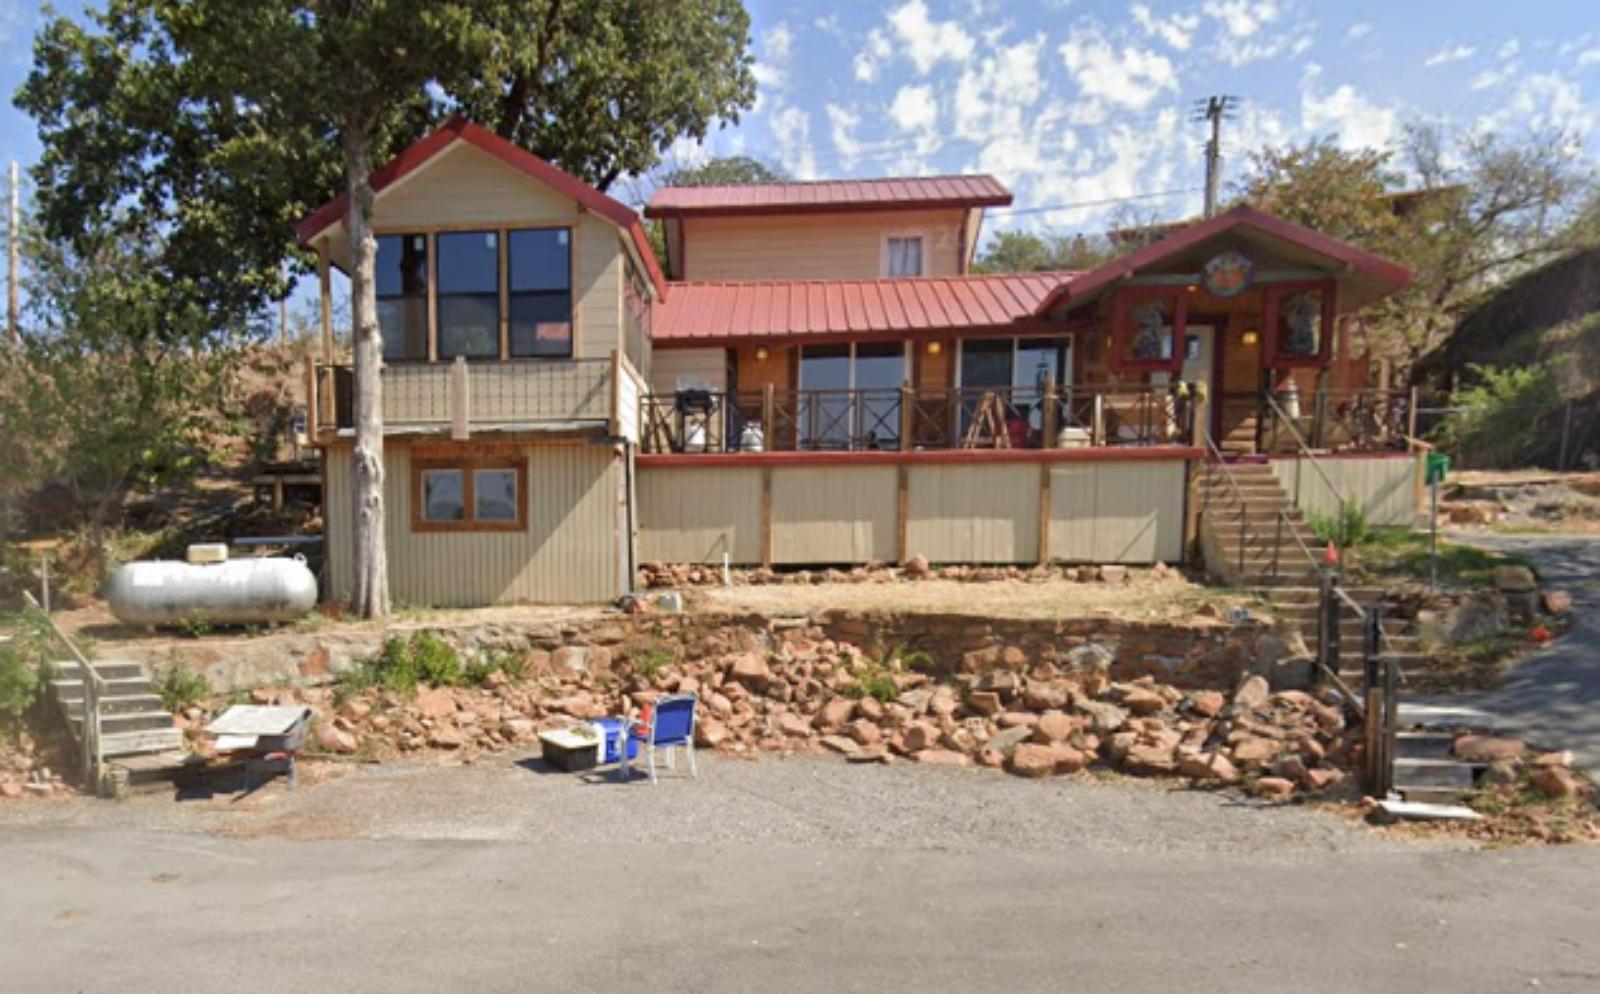
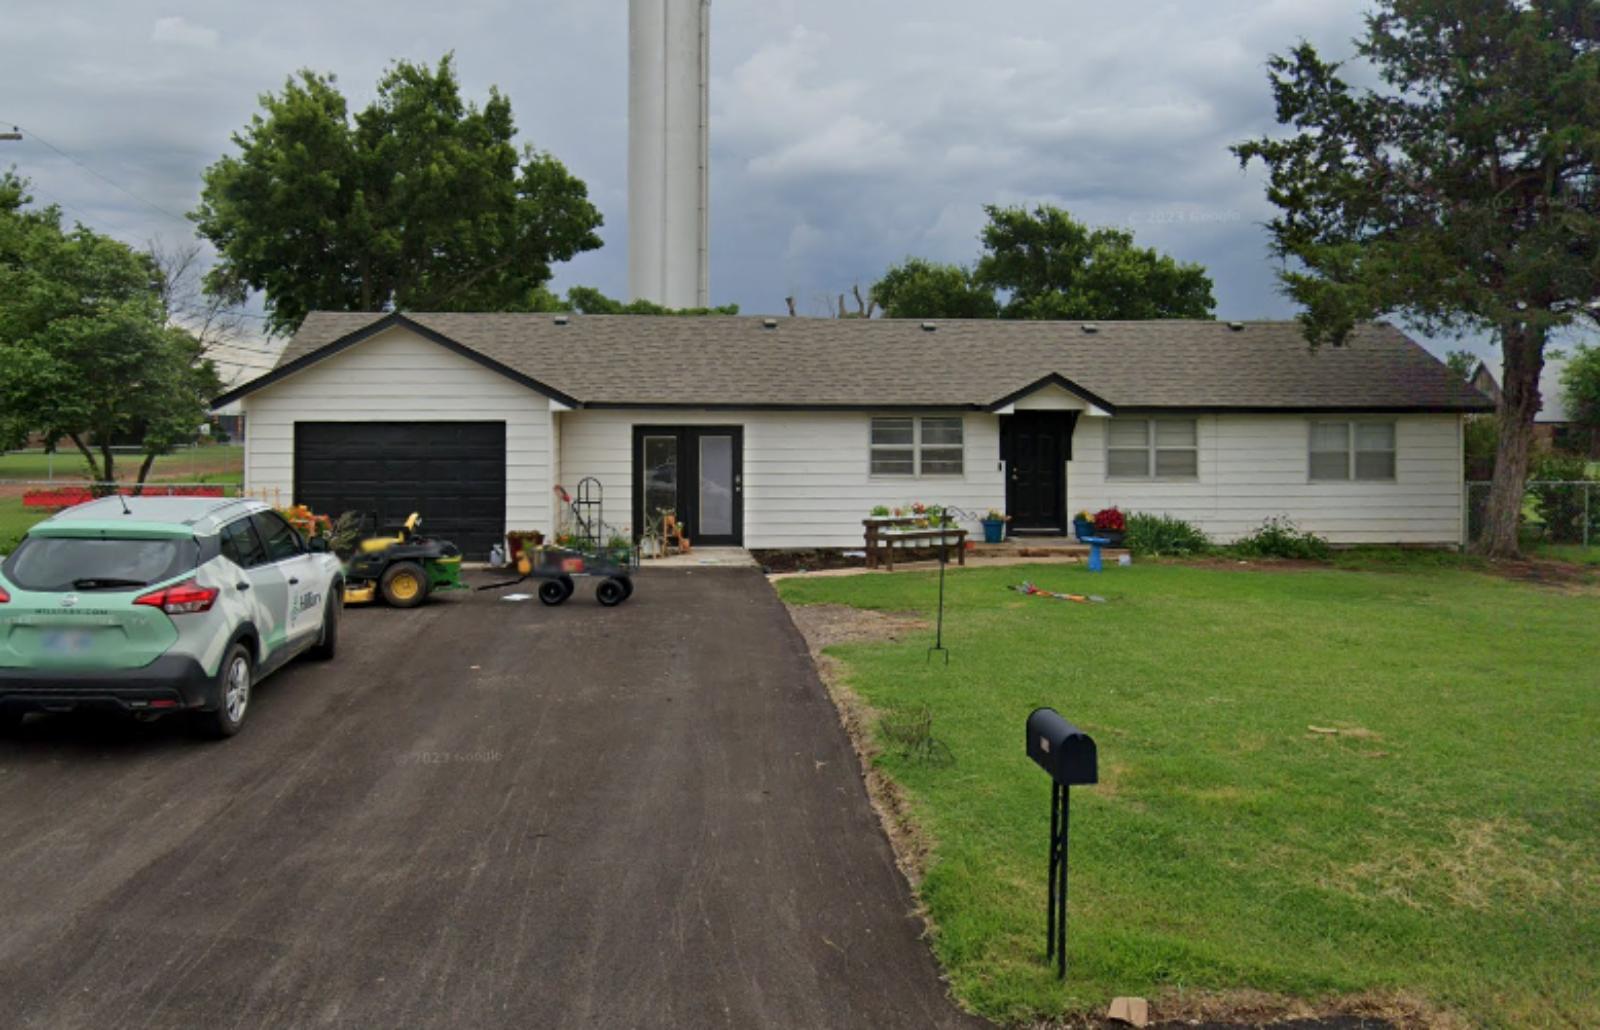
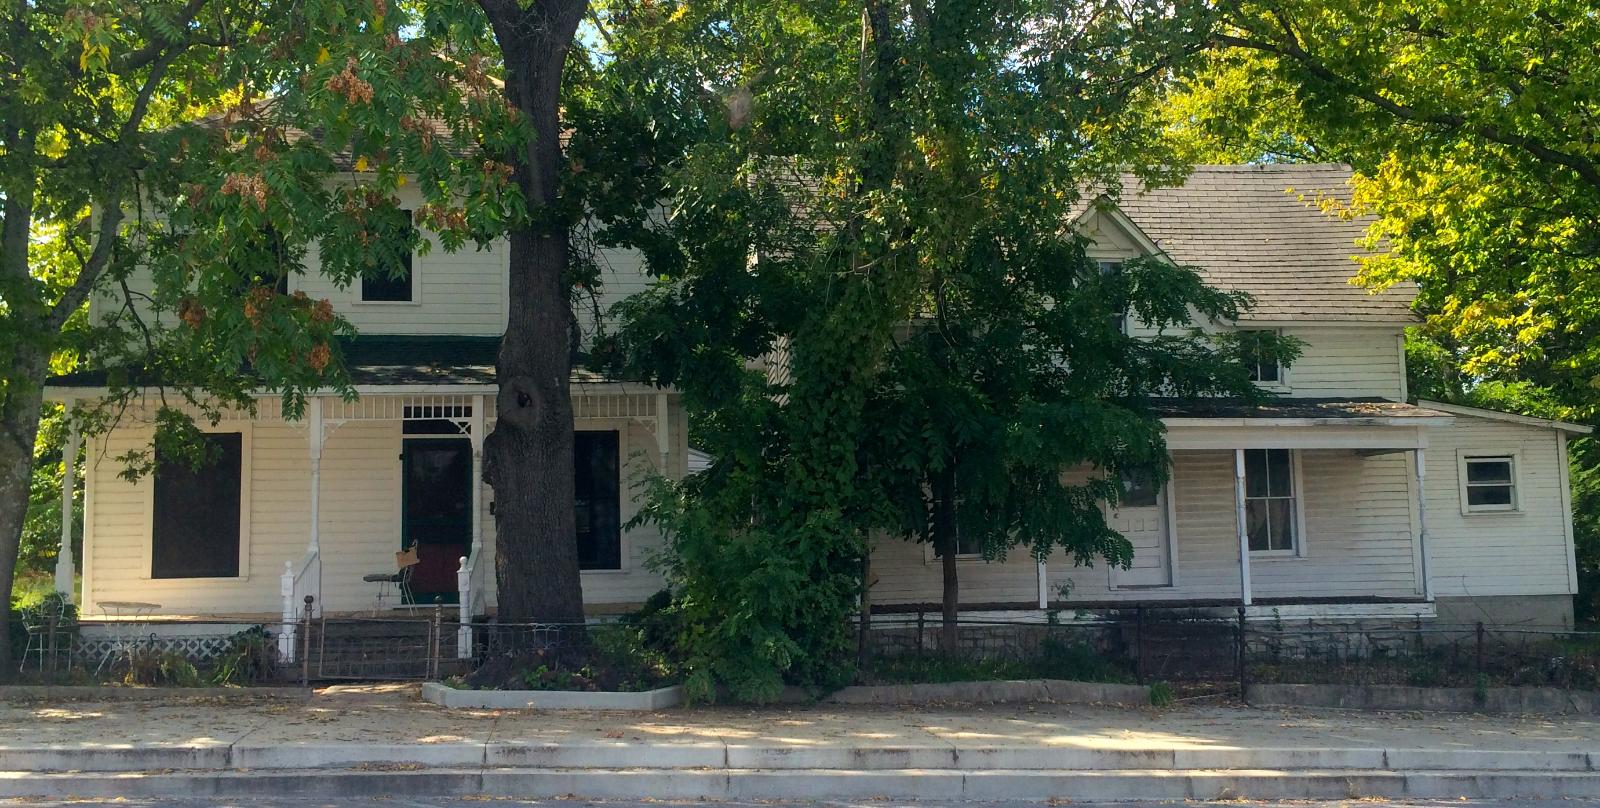
21. Newcastle – 84% Home Price Increase Since 2010
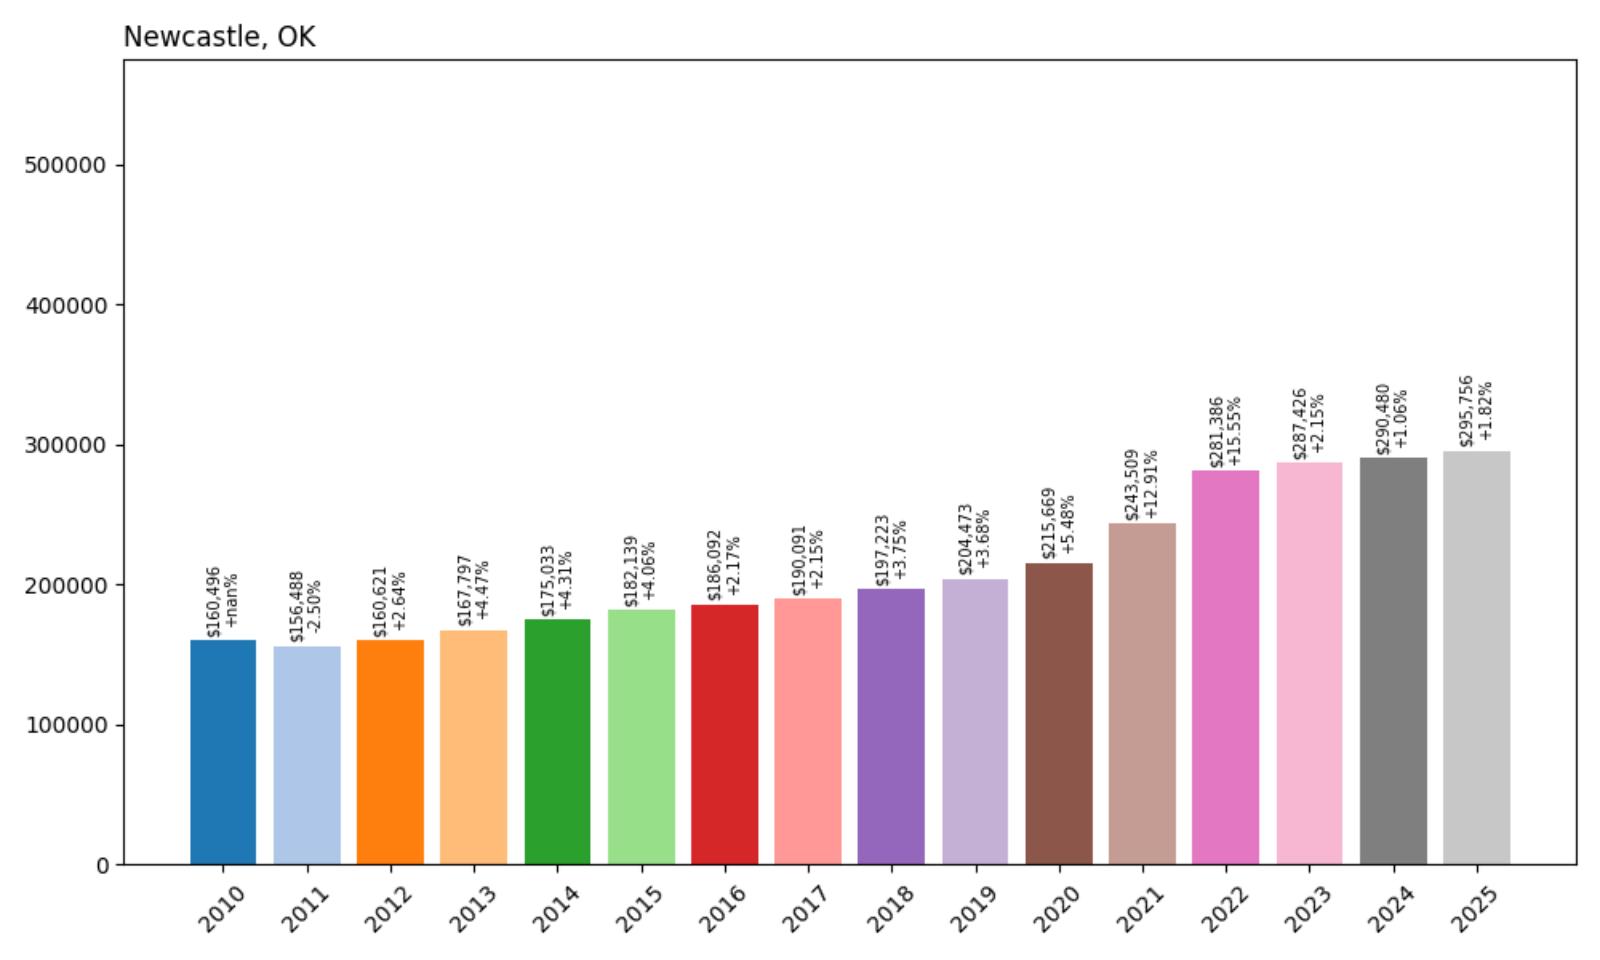
- 2010: $160,496
- 2011: $156,488 (−$4,009, −2.50% from previous year)
- 2012: $160,621 (+$4,134, +2.64% from previous year)
- 2013: $167,797 (+$7,176, +4.47% from previous year)
- 2014: $175,033 (+$7,235, +4.31% from previous year)
- 2015: $182,139 (+$7,106, +4.06% from previous year)
- 2016: $186,092 (+$3,954, +2.17% from previous year)
- 2017: $190,091 (+$3,998, +2.15% from previous year)
- 2018: $197,223 (+$7,132, +3.75% from previous year)
- 2019: $204,473 (+$7,250, +3.68% from previous year)
- 2020: $215,669 (+$11,196, +5.48% from previous year)
- 2021: $243,509 (+$27,839, +12.91% from previous year)
- 2022: $281,386 (+$37,877, +15.55% from previous year)
- 2023: $287,426 (+$6,040, +2.15% from previous year)
- 2024: $290,480 (+$3,055, +1.06% from previous year)
- 2025: $295,756 (+$5,275, +1.82% from previous year)
Newcastle has seen an 84% rise in home values over the last 15 years, starting at $160,496 in 2010 and reaching $295,756 in 2025. While year-to-year growth was steady early on, the biggest jumps came between 2020 and 2022, when prices rose nearly $66,000. Since then, growth has slowed but remained positive, showing strong baseline demand even in a cooling broader market.
Newcastle – A Growing City in the OKC Metro

Located in McClain County, Newcastle is one of the fastest-growing cities in the Oklahoma City metropolitan area. It’s become popular among families and professionals seeking larger homes, suburban amenities, and a relatively easy commute into downtown OKC. Over the past decade, the city has seen new neighborhoods, improved roads, and increasing retail development, all of which have supported its housing boom.
Newcastle’s location along the I-44 and I-35 corridors makes it a strategic choice for both commuters and businesses. Its solid public schools and moderate taxes add to the appeal. The sharp rise in prices from 2020 to 2022 june reflect broader metro expansion, but continued investment in infrastructure suggests the growth story here is far from over. Newcastle is one to watch in Oklahoma’s evolving housing landscape.
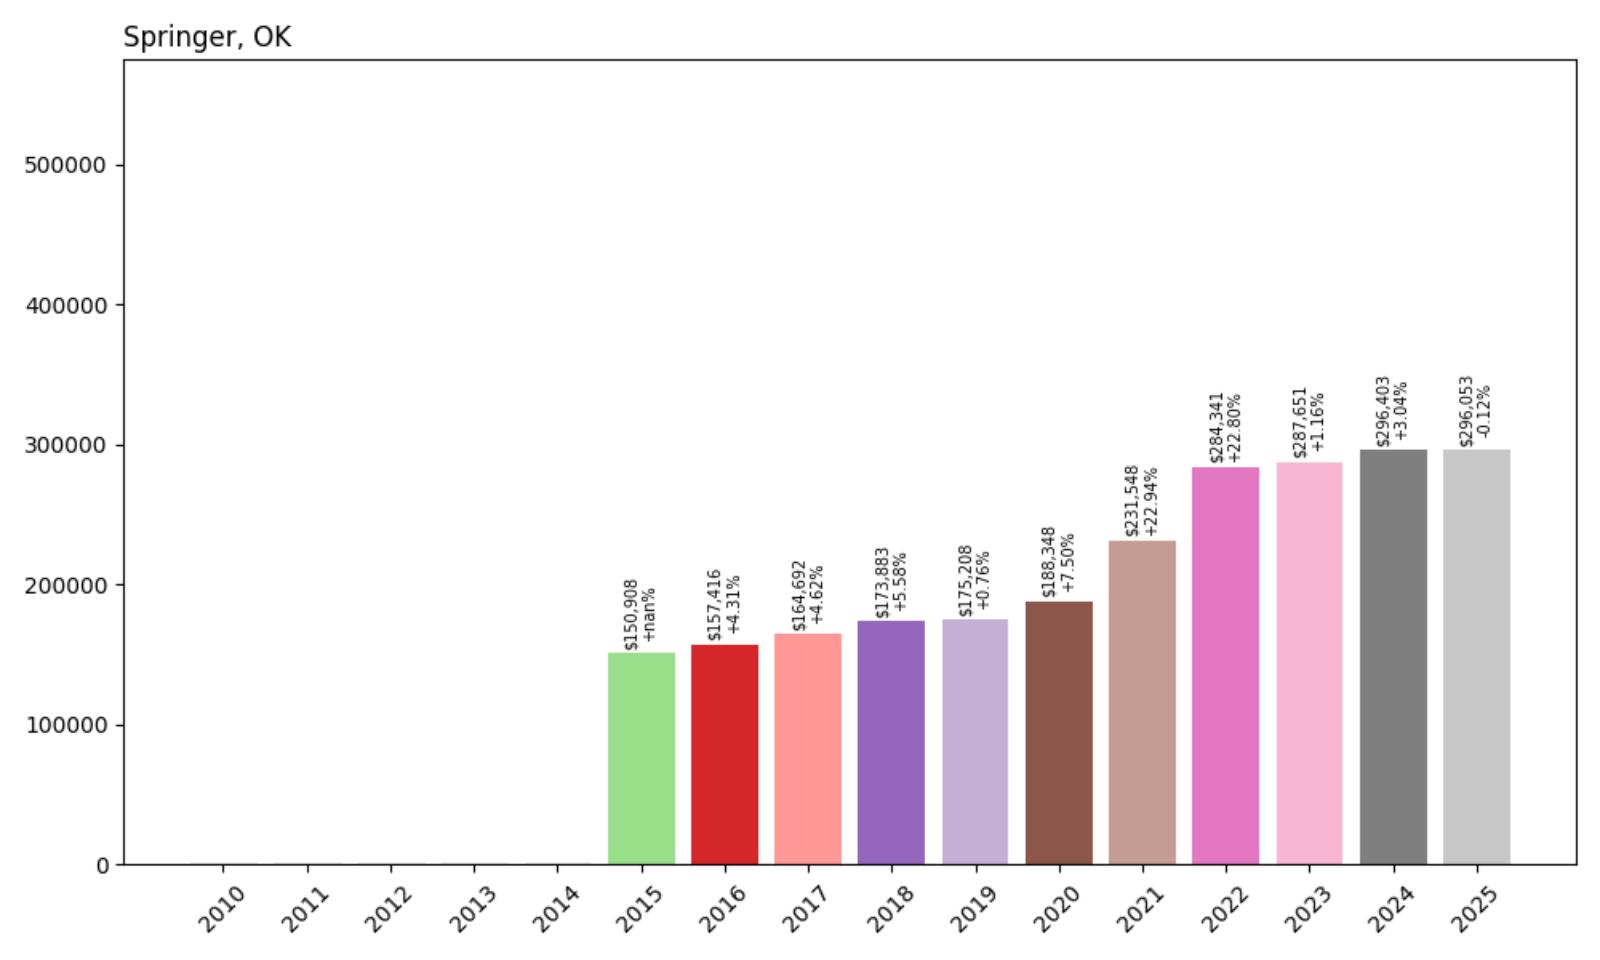
20. Springer – 96% Home Price Increase Since 2015
🔥 Would you like to save this?
- 2010: $NA
- 2011: $NA
- 2012: $NA
- 2013: $NA
- 2014: $NA
- 2015: $150,908
- 2016: $157,416 (+$6,508, +4.31% from previous year)
- 2017: $164,692 (+$7,276, +4.62% from previous year)
- 2018: $173,883 (+$9,191, +5.58% from previous year)
- 2019: $175,208 (+$1,325, +0.76% from previous year)
- 2020: $188,348 (+$13,140, +7.50% from previous year)
- 2021: $231,548 (+$43,200, +22.94% from previous year)
- 2022: $284,341 (+$52,794, +22.80% from previous year)
- 2023: $287,651 (+$3,309, +1.16% from previous year)
- 2024: $296,403 (+$8,752, +3.04% from previous year)
- 2025: $296,053 (−$349, −0.12% from previous year)
Springer has nearly doubled in home value since 2015, rising from $150,908 to $296,053 by 2025. While early years were marked by consistent mid-single-digit growth, the town saw explosive gains from 2020 through 2022. Prices have since leveled off slightly, with a tiny dip in 2025, but overall values remain high — a near 96% increase in just a decade.
Springer – A Quiet Town With Surprising Momentum
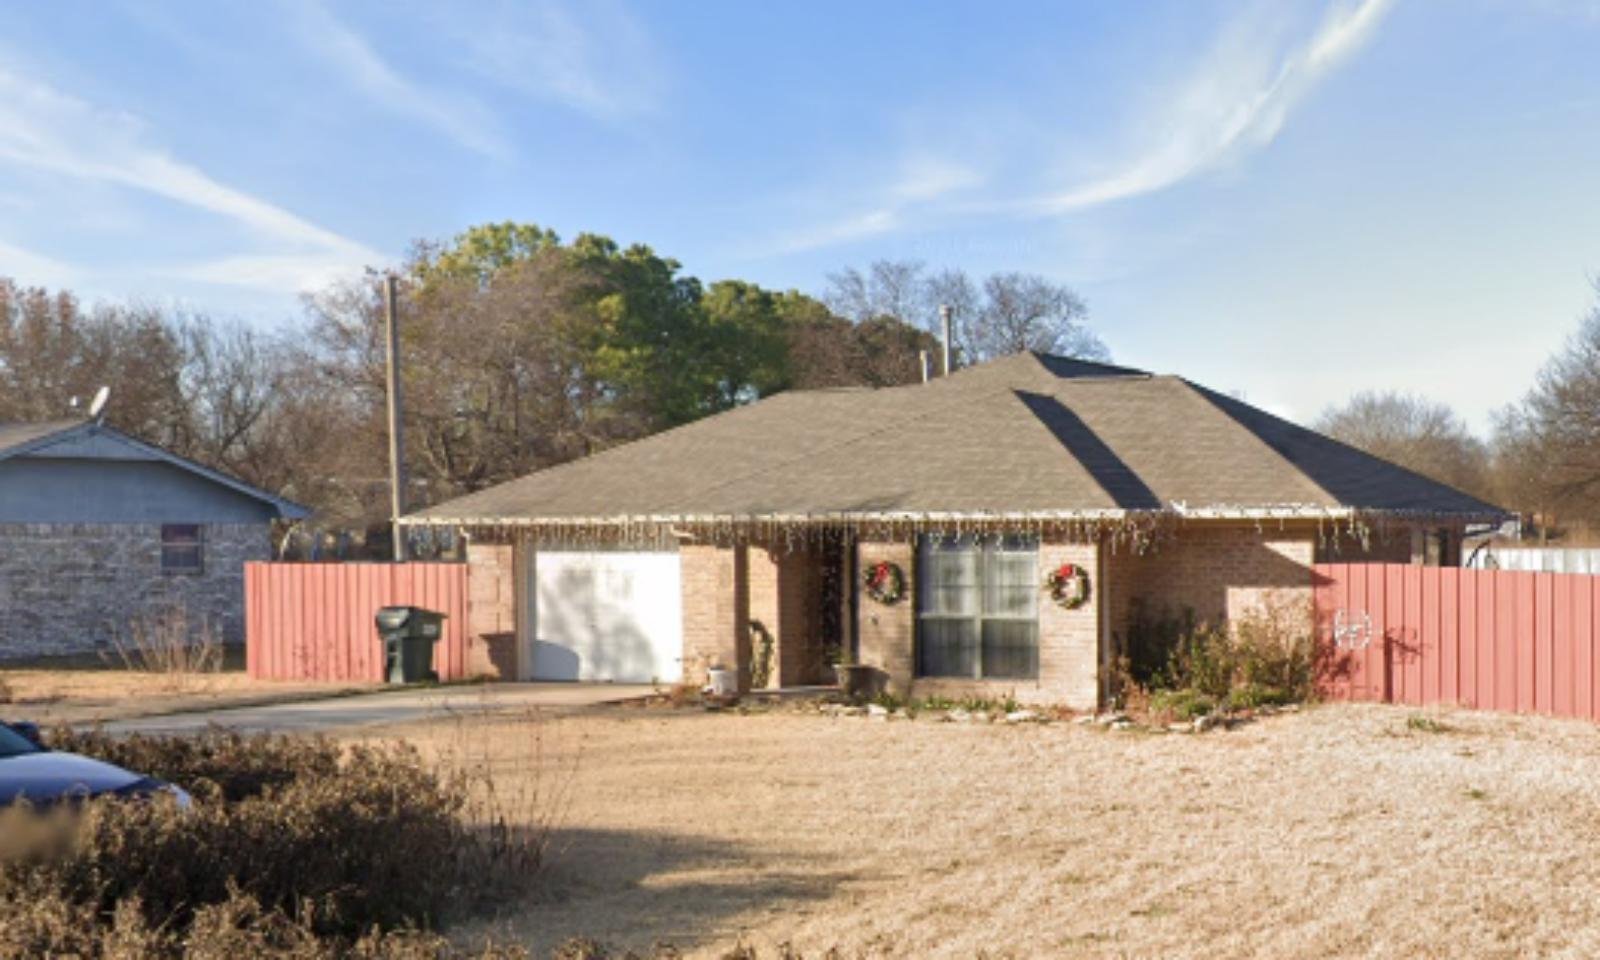
Springer, in Carter County, is a small town near Ardmore that has seen outsized price growth over the past few years. Its proximity to I-35 and Lake Murray has made it more attractive for buyers looking for affordable property with access to outdoor recreation and regional job centers. It’s also close to the Chickasaw National Recreation Area and other destinations that appeal to weekenders and retirees.
Though small in population, Springer’s surge in home values reflects a broader trend of rural and exurban growth across southern Oklahoma. With limited inventory and relatively little new construction, even moderate demand can push prices significantly higher. Whether this is a temporary market shift or part of a longer-term transformation remains to be seen — but Springer has certainly carved out a spot on the map.
19. Forest Park – 91% Home Price Increase Since 2010

- 2010: $155,215
- 2011: $155,573 (+$358, +0.23% from previous year)
- 2012: $157,381 (+$1,808, +1.16% from previous year)
- 2013: $162,327 (+$4,946, +3.14% from previous year)
- 2014: $176,703 (+$14,376, +8.86% from previous year)
- 2015: $190,979 (+$14,275, +8.08% from previous year)
- 2016: $188,543 (−$2,436, −1.28% from previous year)
- 2017: $191,194 (+$2,651, +1.41% from previous year)
- 2018: $203,353 (+$12,159, +6.36% from previous year)
- 2019: $209,512 (+$6,159, +3.03% from previous year)
- 2020: $219,524 (+$10,012, +4.78% from previous year)
- 2021: $250,010 (+$30,486, +13.89% from previous year)
- 2022: $284,830 (+$34,819, +13.93% from previous year)
- 2023: $292,590 (+$7,761, +2.72% from previous year)
- 2024: $287,193 (−$5,397, −1.84% from previous year)
- 2025: $296,237 (+$9,044, +3.15% from previous year)
Forest Park has witnessed a 91% rise in home values over the last 15 years, starting at $155,215 in 2010 and climbing to $296,237 by 2025. The sharpest acceleration occurred during the post-pandemic housing surge, particularly from 2020 to 2022, when values jumped by over $65,000. Though the market experienced a minor correction in 2024, it quickly rebounded the following year. This upward movement demonstrates strong underlying demand and buyer confidence in this small, established community.
Forest Park – Quiet Elegance Just Minutes From Downtown OKC
Forest Park is a small, predominantly residential town tucked within Oklahoma County, directly northeast of Oklahoma City. What makes Forest Park unique is its semi-rural character combined with near-instant access to downtown OKC via I-35 and NE 36th Street. Mature trees, large lots, and a tranquil setting attract buyers looking for a more peaceful lifestyle without sacrificing proximity to the urban core. Homes here range from modest ranch-style houses to larger estates, and the town has seen steady interest from professionals, retirees, and long-time residents alike. In many ways, Forest Park acts as a greenbelt buffer for the metro — offering low-density living that feels worlds away despite being just a few miles from downtown amenities.
The town’s real estate values reflect this balance of seclusion and access. As Oklahoma City has expanded, Forest Park has become an increasingly attractive option for those who want space and privacy without a long commute. This demand has fueled notable price growth in recent years, especially during the post-2020 suburban housing shift. With limited new construction and an established residential footprint, available inventory tends to be tight — helping support consistently high price appreciation. Forest Park’s restrained development and classic charm will likely continue to make it a standout among OKC’s premium neighborhoods.
18. Bennington – 252% Home Price Increase Since 2010
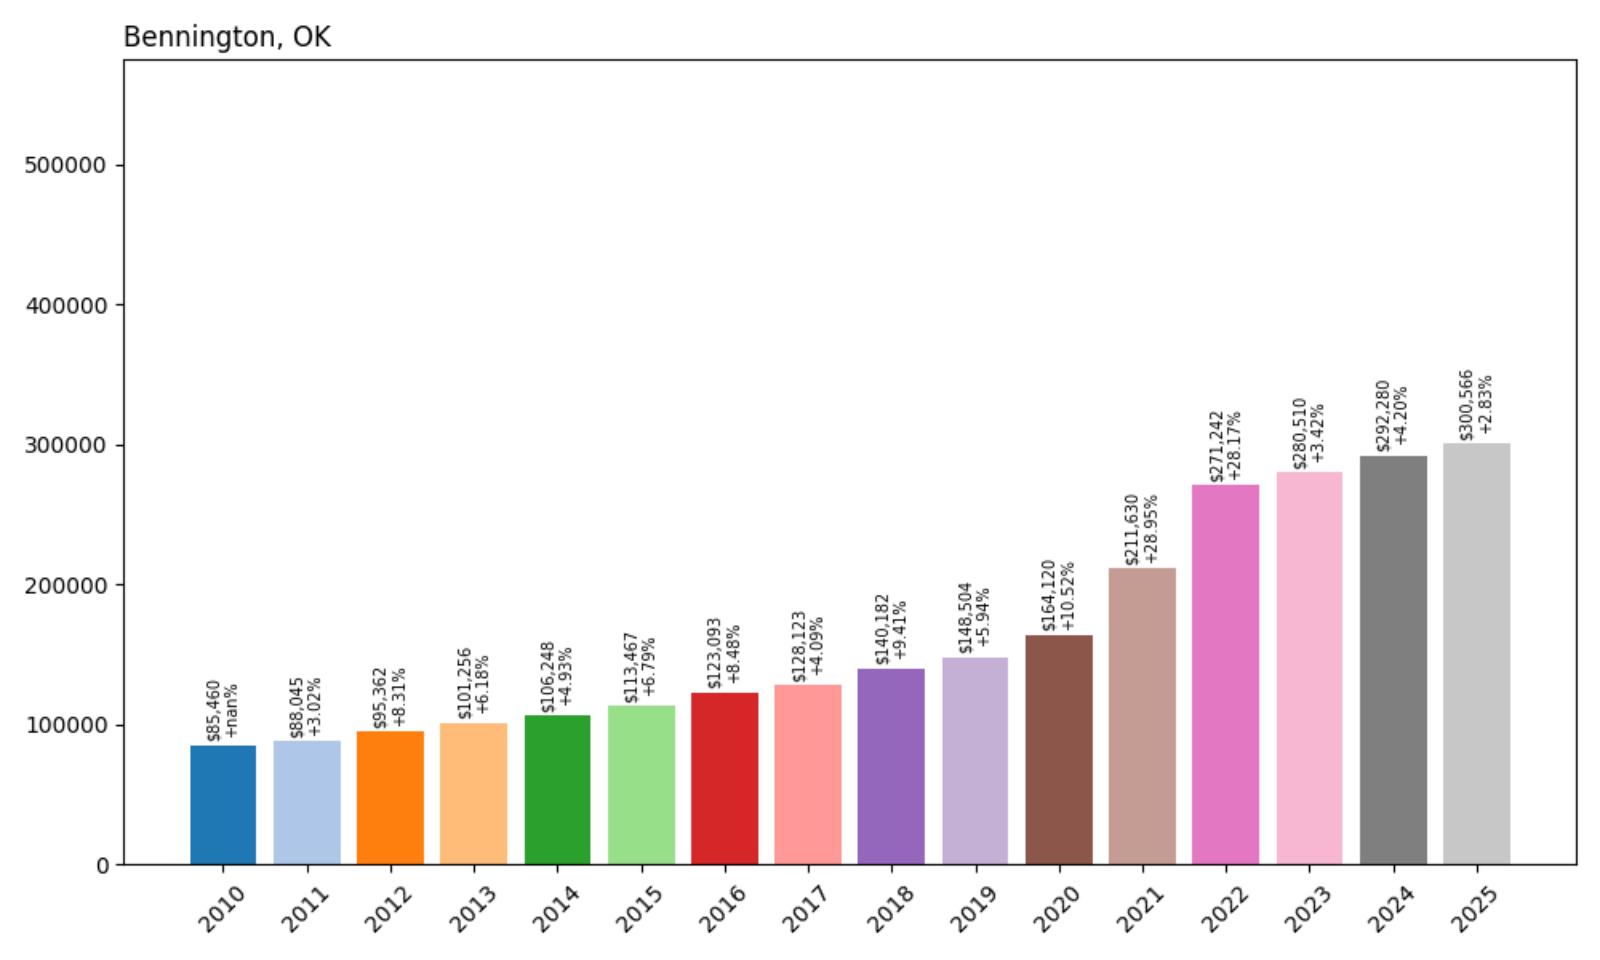
- 2010: $85,460
- 2011: $88,045 (+$2,585, +3.02% from previous year)
- 2012: $95,362 (+$7,318, +8.31% from previous year)
- 2013: $101,256 (+$5,894, +6.18% from previous year)
- 2014: $106,248 (+$4,992, +4.93% from previous year)
- 2015: $113,467 (+$7,219, +6.79% from previous year)
- 2016: $123,093 (+$9,626, +8.48% from previous year)
- 2017: $128,123 (+$5,030, +4.09% from previous year)
- 2018: $140,182 (+$12,059, +9.41% from previous year)
- 2019: $148,504 (+$8,322, +5.94% from previous year)
- 2020: $164,120 (+$15,615, +10.52% from previous year)
- 2021: $211,630 (+$47,511, +28.95% from previous year)
- 2022: $271,242 (+$59,612, +28.17% from previous year)
- 2023: $280,510 (+$9,268, +3.42% from previous year)
- 2024: $292,280 (+$11,771, +4.20% from previous year)
- 2025: $300,566 (+$8,286, +2.83% from previous year)
Bennington stands out in Oklahoma’s housing market with a staggering 252% increase in home prices since 2010. The average home value has climbed from $85,460 to over $300,000 in just 15 years, driven by enormous year-over-year growth starting in 2020. Between 2020 and 2022 alone, values surged by over $107,000 — a reflection of sudden market demand and increased visibility for this small town in Bryan County.
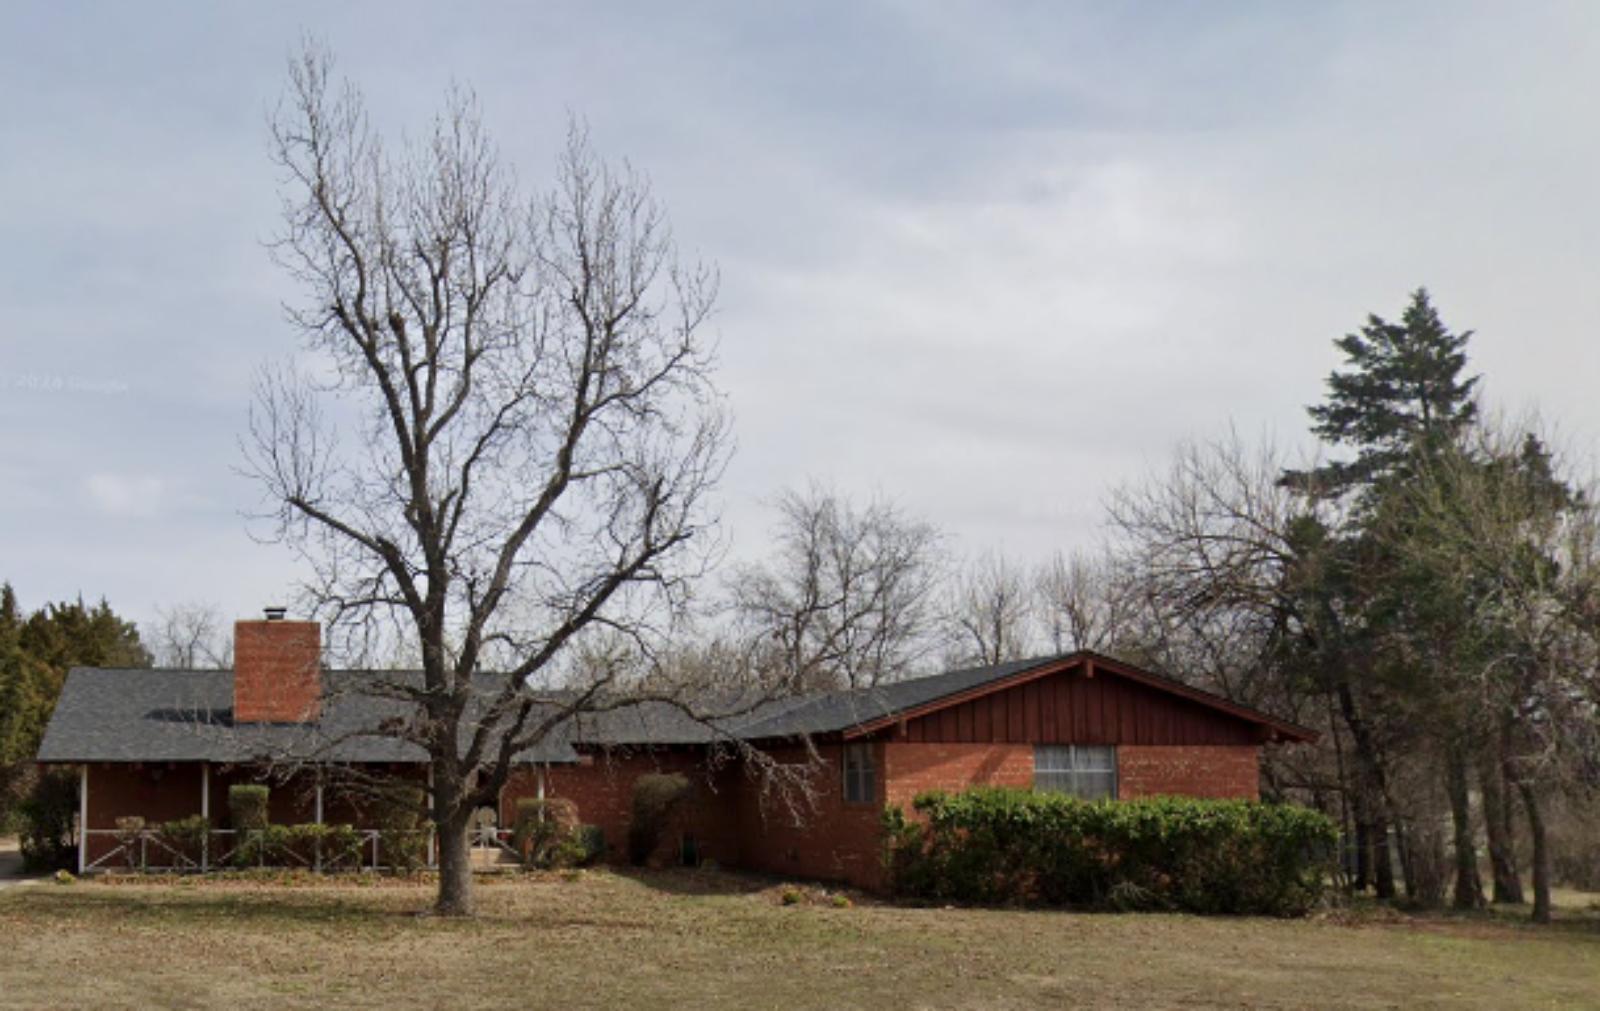
Bennington – From Rural Roots to Record-Setting Growth
Bennington is a small town in southeastern Oklahoma, located in Bryan County not far from Durant and the Texas border. Once best known for its agricultural history and quiet surroundings, Bennington is now catching attention as one of the fastest-appreciating housing markets in the state. Its proximity to the rapidly developing Choctaw Nation headquarters in Durant has increased demand for housing in surrounding communities, including Bennington. As infrastructure improves and more people are priced out of larger cities, this once-sleepy town has seen a sharp influx of buyer interest. It’s also benefitting from buyers who want access to Texoma-area amenities without Texas-level home prices.
The town’s real estate transformation is especially striking when you consider how low home values were just 10 years ago. Affordable land, a lack of large-scale development, and spillover growth from Durant and Texas markets have all played roles in fueling Bennington’s meteoric rise. The town still retains its rural charm, but it’s clear that investors and homebuyers have recognized its potential. If the current trends continue — and if infrastructure and broadband expansion keep pace — Bennington may see even greater attention in the coming decade.
17. Choctaw – 83% Home Price Increase Since 2010

- 2010: $164,690
- 2011: $161,087 (−$3,603, −2.19% from previous year)
- 2012: $158,929 (−$2,158, −1.34% from previous year)
- 2013: $163,998 (+$5,069, +3.19% from previous year)
- 2014: $168,712 (+$4,715, +2.87% from previous year)
- 2015: $179,034 (+$10,321, +6.12% from previous year)
- 2016: $181,570 (+$2,536, +1.42% from previous year)
- 2017: $184,775 (+$3,205, +1.77% from previous year)
- 2018: $194,743 (+$9,968, +5.39% from previous year)
- 2019: $204,450 (+$9,707, +4.98% from previous year)
- 2020: $214,561 (+$10,112, +4.95% from previous year)
- 2021: $243,760 (+$29,199, +13.61% from previous year)
- 2022: $278,455 (+$34,695, +14.23% from previous year)
- 2023: $288,447 (+$9,992, +3.59% from previous year)
- 2024: $295,469 (+$7,022, +2.43% from previous year)
- 2025: $300,918 (+$5,449, +1.84% from previous year)
Choctaw’s housing prices have grown by 83% over the past 15 years, jumping from roughly $165,000 in 2010 to just over $300,000 by 2025. A particularly strong run from 2020 to 2022 saw prices climb by more than $63,000 in just two years. Though the pace has slowed slightly since then, home values continue to trend upward — indicating lasting appeal among buyers seeking suburban comfort with easy city access.
Choctaw – Affordable Suburb With Long-Term Appeal
Choctaw is one of Oklahoma County’s oldest towns and a longstanding suburban alternative for people working in Oklahoma City. Located along the eastern edge of the metro, it offers larger lots, established neighborhoods, and a slower pace of life compared to the inner city. Residents here value the town’s balance between rural openness and modern amenities. It’s close enough for commuters to reach downtown OKC in under 30 minutes, but far enough out to escape traffic and congestion. That blend has kept demand strong, especially among families and older homeowners looking for space without sacrificing convenience.
Choctaw’s price growth since 2010 has been steady, and its surge during the pandemic housing boom only accelerated what was already happening. With quality public schools, proximity to Tinker Air Force Base, and steady infrastructure improvements, the town remains one of the most desirable pockets in eastern Oklahoma County. Unlike some communities where growth has come with rapid change, Choctaw has managed to retain its local identity while continuing to attract new residents. As long as housing remains relatively limited and local amenities expand, Choctaw’s housing market is likely to remain on solid footing.
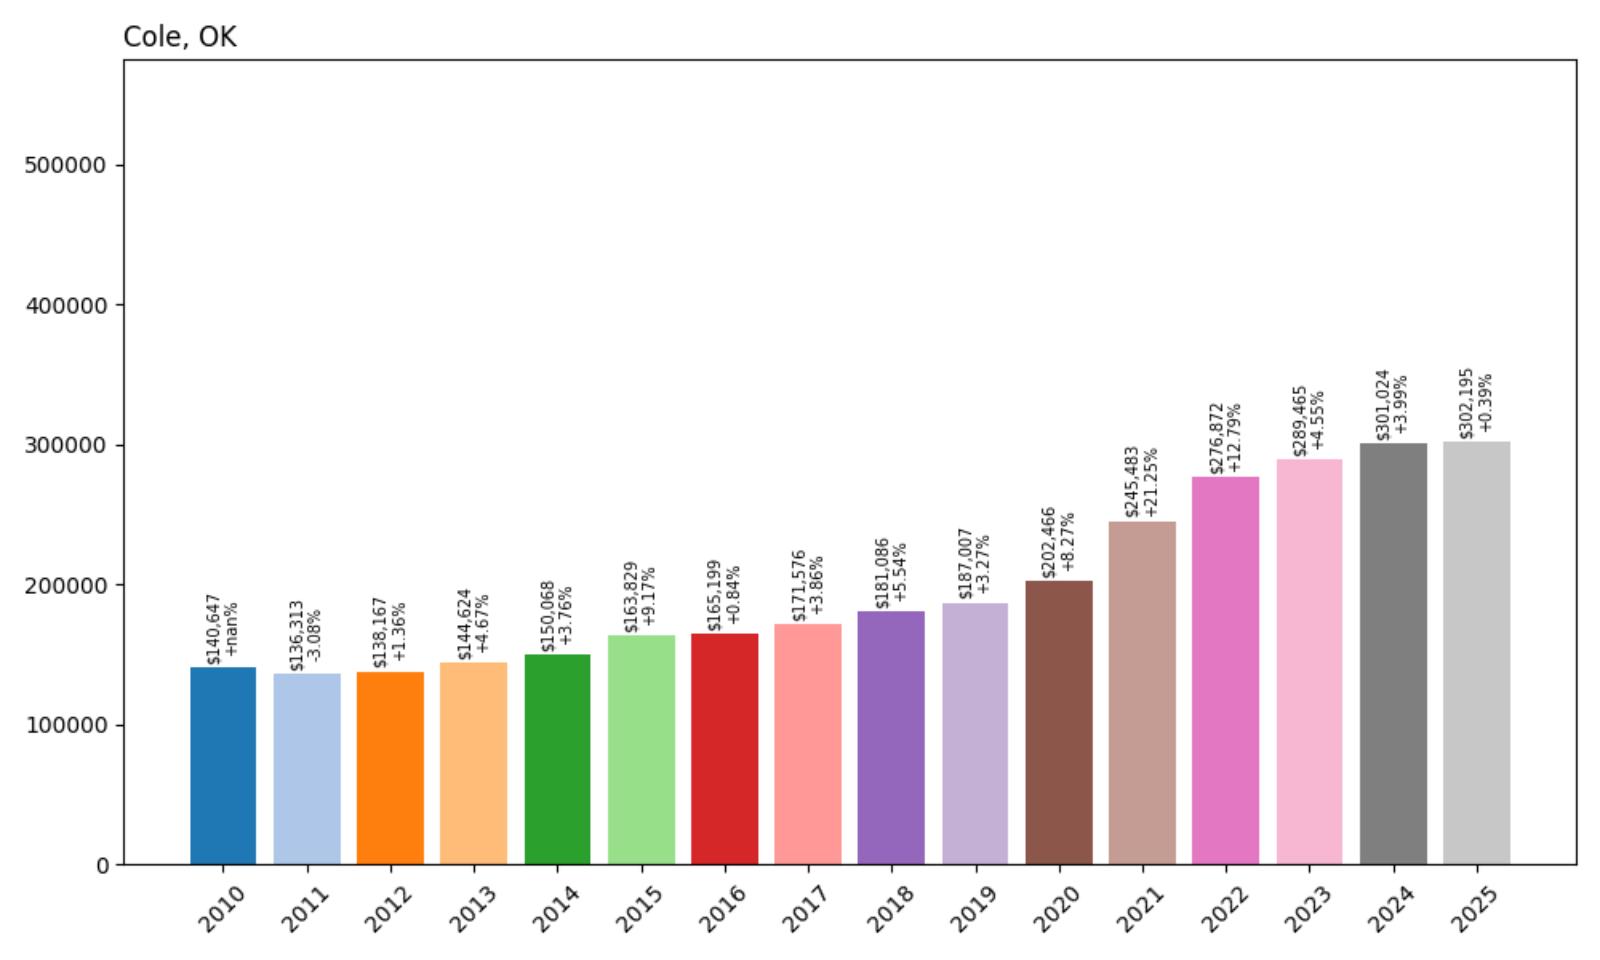
16. Cole – 115% Home Price Increase Since 2010
- 2010: $140,647
- 2011: $136,313 (−$4,334, −3.08% from previous year)
- 2012: $138,167 (+$1,855, +1.36% from previous year)
- 2013: $144,624 (+$6,456, +4.67% from previous year)
- 2014: $150,068 (+$5,444, +3.76% from previous year)
- 2015: $163,829 (+$13,761, +9.17% from previous year)
- 2016: $165,199 (+$1,371, +0.84% from previous year)
- 2017: $171,576 (+$6,377, +3.86% from previous year)
- 2018: $181,086 (+$9,510, +5.54% from previous year)
- 2019: $187,007 (+$5,921, +3.27% from previous year)
- 2020: $202,466 (+$15,459, +8.27% from previous year)
- 2021: $245,483 (+$43,017, +21.25% from previous year)
- 2022: $276,872 (+$31,389, +12.79% from previous year)
- 2023: $289,465 (+$12,593, +4.55% from previous year)
- 2024: $301,024 (+$11,559, +3.99% from previous year)
- 2025: $302,195 (+$1,171, +0.39% from previous year)
Cole’s housing market has more than doubled in value since 2010, with home prices climbing from just under $141,000 to over $302,000 by 2025. That’s a 115% increase over 15 years. Much of that growth occurred between 2020 and 2022, when values jumped nearly $74,000. Though 2025 saw just a modest increase, the broader upward trajectory highlights lasting demand and market strength in this small town.
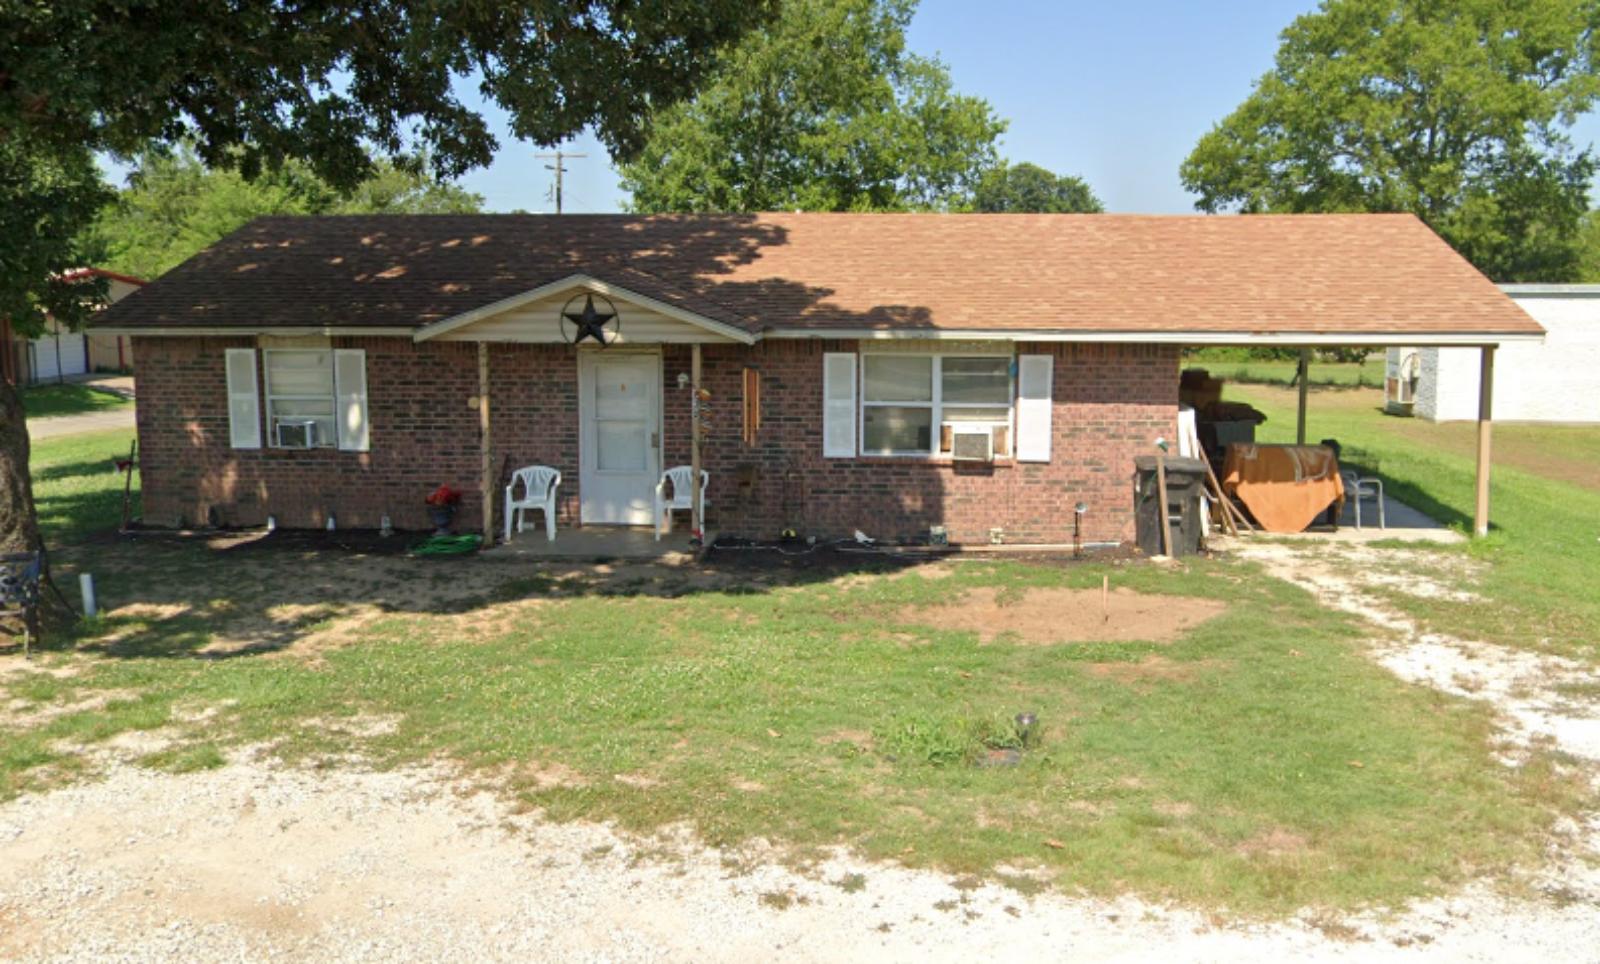
Cole – Quiet Country Living With Surging Demand
🔥 Would you like to save this?
Located in McClain County south of Norman, Cole offers rural serenity just outside the reach of Oklahoma City’s urban sprawl. The town is known for its wide open spaces, scattered ranch-style homes, and the kind of peace and quiet that’s getting harder to find. Despite its small population, Cole has become an increasingly popular choice for buyers who want land, privacy, and the potential to build — all without straying too far from the conveniences of city life. As the OKC metro grows outward, towns like Cole are seeing a wave of new interest from families, remote workers, and retirees.
The post-2020 housing boom put Cole firmly on the radar, with double-digit annual price gains becoming the norm for several years in a row. While growth has slowed in the most recent year, the market remains near record highs, and the town’s low density and large plots mean that inventory is always tight. Cole’s appeal lies in its simplicity: no hustle, no hype, just a lot of value and a lot of space. As long as people continue to look for affordability paired with quiet living, towns like Cole will continue to thrive in Oklahoma’s evolving housing market.
15. Owasso – 67% Home Price Increase Since 2010
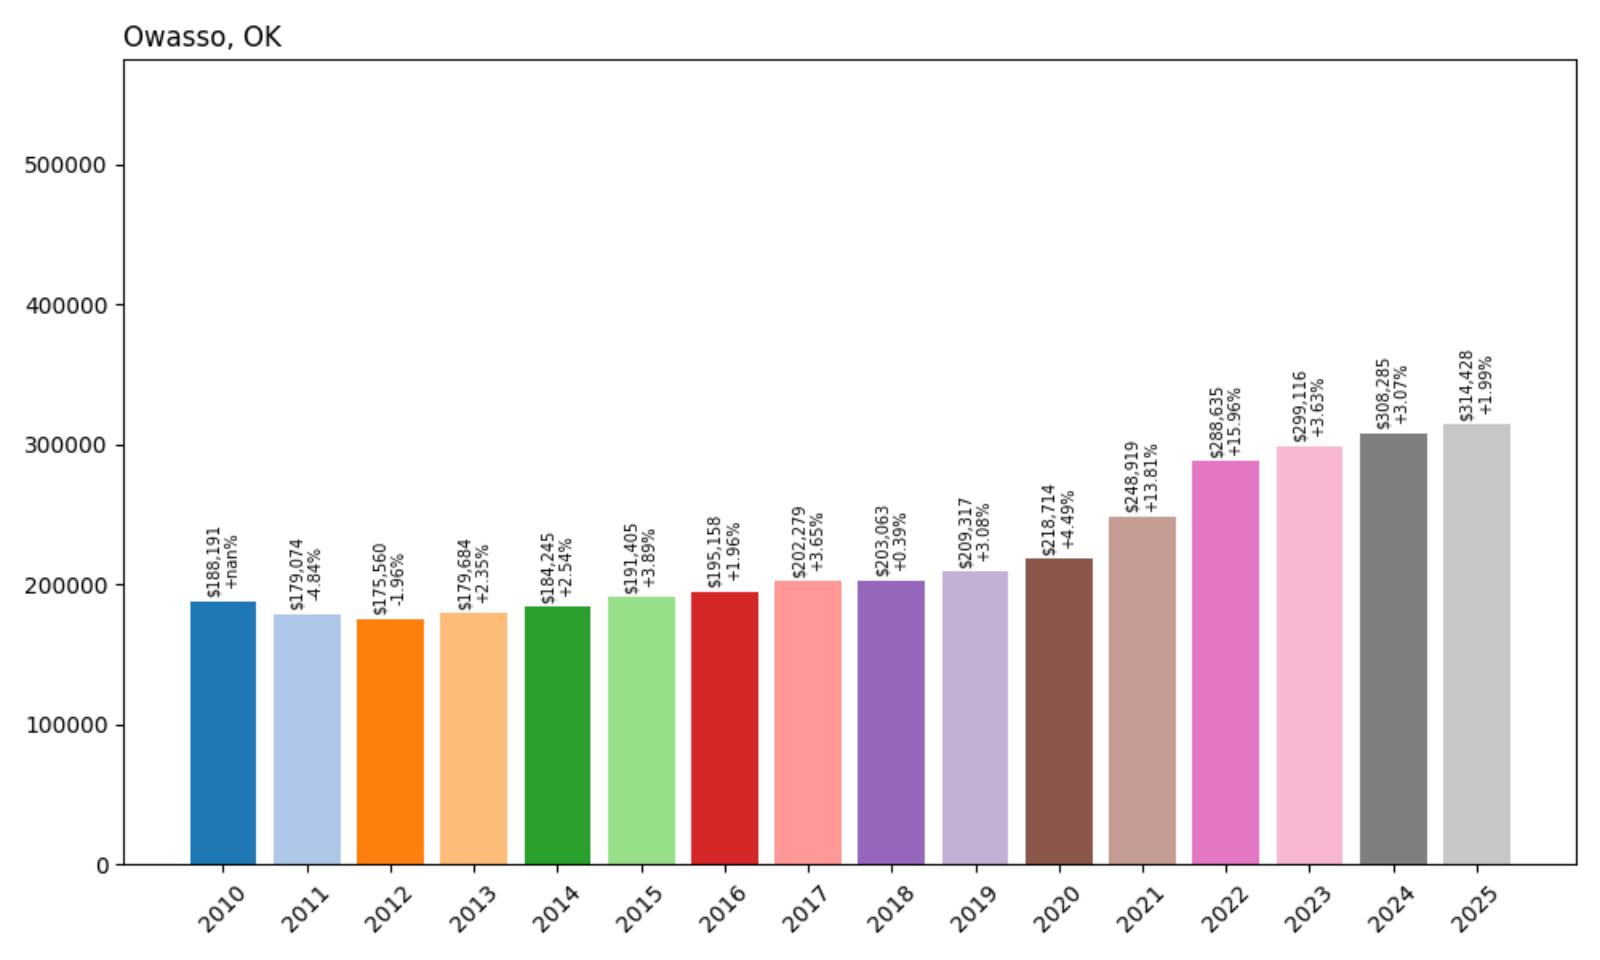
- 2010: $188,191
- 2011: $179,074 (−$9,117, −4.84% from previous year)
- 2012: $175,560 (−$3,514, −1.96% from previous year)
- 2013: $179,684 (+$4,124, +2.35% from previous year)
- 2014: $184,245 (+$4,561, +2.54% from previous year)
- 2015: $191,405 (+$7,160, +3.89% from previous year)
- 2016: $195,158 (+$3,753, +1.96% from previous year)
- 2017: $202,279 (+$7,120, +3.65% from previous year)
- 2018: $203,063 (+$784, +0.39% from previous year)
- 2019: $209,317 (+$6,254, +3.08% from previous year)
- 2020: $218,714 (+$9,398, +4.49% from previous year)
- 2021: $248,919 (+$30,205, +13.81% from previous year)
- 2022: $288,635 (+$39,716, +15.96% from previous year)
- 2023: $299,116 (+$10,480, +3.63% from previous year)
- 2024: $308,285 (+$9,169, +3.07% from previous year)
- 2025: $314,428 (+$6,143, +1.99% from previous year)
Owasso’s home prices have climbed steadily over the past 15 years, with a 67% overall increase since 2010. Prices dipped slightly in the early 2010s but quickly recovered and accelerated post-2020. The biggest jumps came during the pandemic housing surge, where values shot up more than $69,000 between 2020 and 2022 alone. With the 2025 average price sitting at $314,428, Owasso remains one of the more expensive and desirable housing markets in the Tulsa metro area.
Owasso – A Tulsa Suburb with Staying Power
Owasso is a growing city in Rogers and Tulsa counties, known for its high-quality schools, modern amenities, and excellent connectivity to the Tulsa metro. Families are drawn to the area for its safe neighborhoods, retail developments, and robust public infrastructure. Over the past two decades, Owasso has expanded dramatically, with new subdivisions, commercial centers, and public facilities. Despite its growth, the town has maintained a strong sense of community and livability, which continues to attract homebuyers from across northeastern Oklahoma.
The city’s rising home prices reflect both local demand and long-term development trends. The proximity to Tulsa International Airport, major employers, and top-rated schools has created sustained interest among professionals and families alike. Even as interest rates fluctuate, Owasso’s well-rounded appeal — combining suburban comfort with urban convenience — keeps its housing market resilient. With limited undeveloped land remaining and a strong local economy, Owasso is likely to remain one of the Tulsa area’s top-performing real estate markets for years to come.
14. Blanchard, OK — Home Prices Rose +107.7% from 2010 to 2025

- 2010: $153,960
- 2011: $150,527 (−$3,433, −2.23% from previous year)
- 2012: $153,309 (+$2,782, +1.85% from previous year)
- 2013: $160,174 (+$6,865, +4.48% from previous year)
- 2014: $166,868 (+$6,694, +4.18% from previous year)
- 2015: $175,308 (+$8,440, +5.06% from previous year)
- 2016: $179,431 (+$4,123, +2.35% from previous year)
- 2017: $184,586 (+$5,155, +2.87% from previous year)
- 2018: $192,158 (+$7,571, +4.10% from previous year)
- 2019: $201,040 (+$8,883, +4.62% from previous year)
- 2020: $212,576 (+$11,536, +5.74% from previous year)
- 2021: $243,190 (+$30,614, +14.40% from previous year)
- 2022: $284,617 (+$41,427, +17.03% from previous year)
- 2023: $298,196 (+$13,579, +4.77% from previous year)
- 2024: $309,867 (+$11,671, +3.91% from previous year)
- 2025: $319,856 (+$9,989, +3.22% from previous year)
From 2010 to 2025, home values in Blanchard more than doubled, rising from just under $154,000 to nearly $320,000. That’s a +107.7% increase over 15 years, with steady gains every year after a minor dip in 2011. The most notable acceleration occurred between 2020 and 2022, when values jumped over $70,000 in just two years. The pace has since stabilized, but the sustained growth has firmly placed Blanchard among Oklahoma’s more expensive housing markets.
Blanchard — A Suburban Growth Magnet
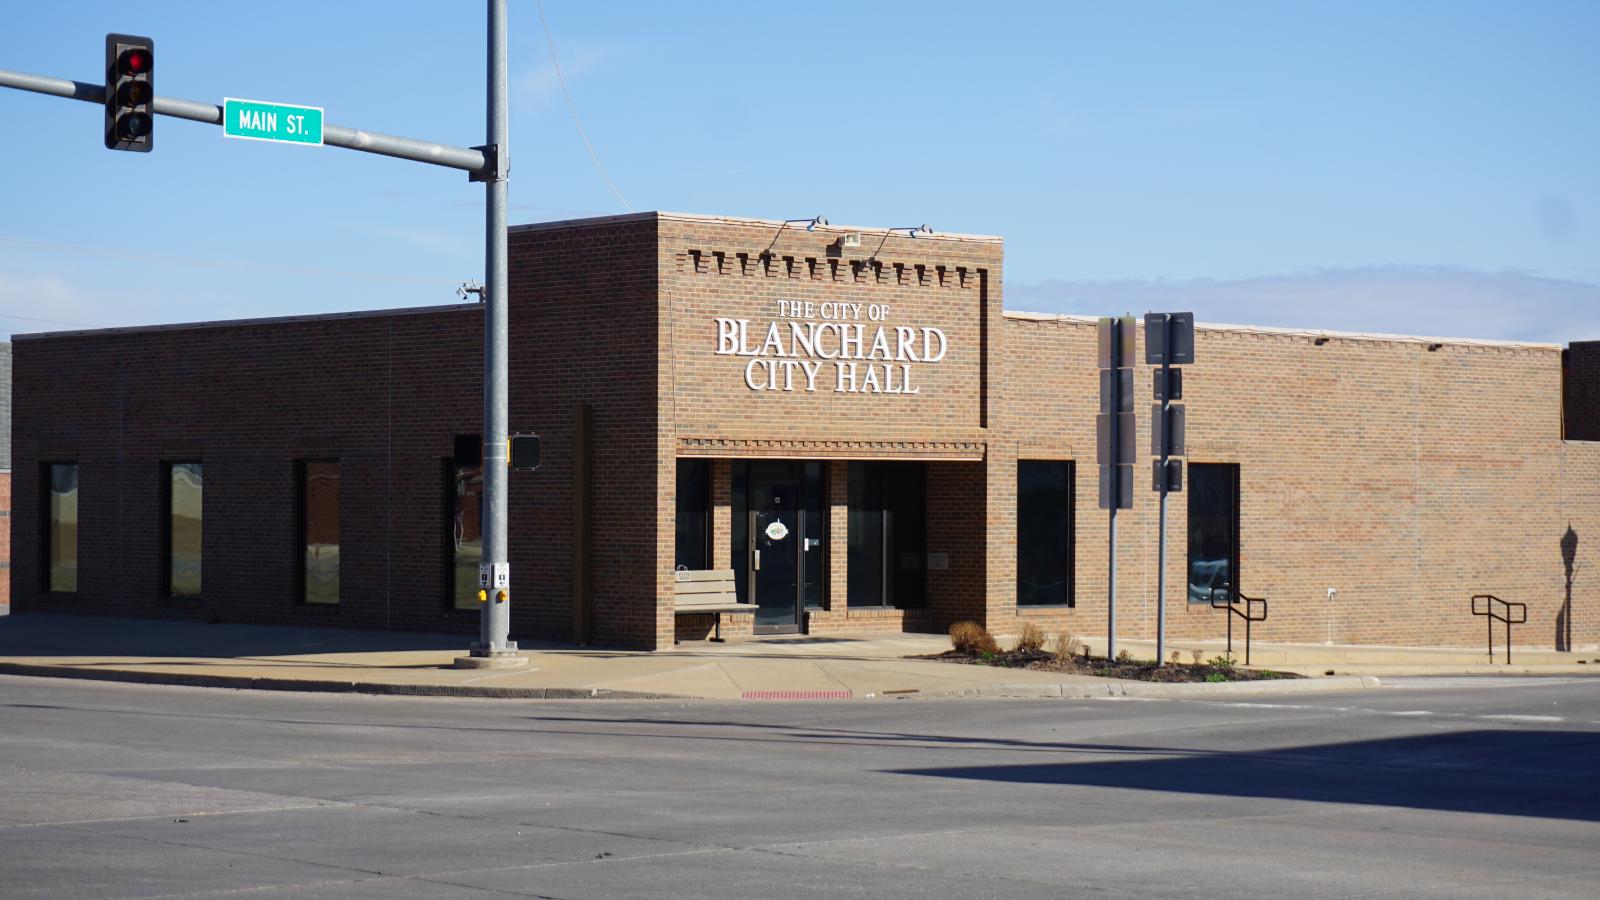
Blanchard has steadily evolved into a residential haven for those seeking proximity to Oklahoma City without sacrificing space or serenity. The town’s appeal lies in its blend of rural charm and suburban infrastructure, making it attractive for families and commuters alike. With new subdivisions cropping up over the past decade, demand has increased while inventory has struggled to keep pace. Schools in the Blanchard Public School District have also seen consistent improvement, adding another layer of appeal for young families considering a move.
The home price trajectory in Blanchard reflects both organic local demand and spillover from the OKC metro. Between 2020 and 2022, prices surged over 33%, driven by pandemic-era migration trends, record-low interest rates, and a rush for more space. Unlike speculative booms seen elsewhere, Blanchard’s growth has largely been underpinned by owner-occupants and developers targeting long-term livability. The recent cooling to ~3% annual growth suggests the town may now be in a healthier, more sustainable phase of its market cycle.
13. Tuttle, OK — Home Prices Rose +100.1% from 2010 to 2025
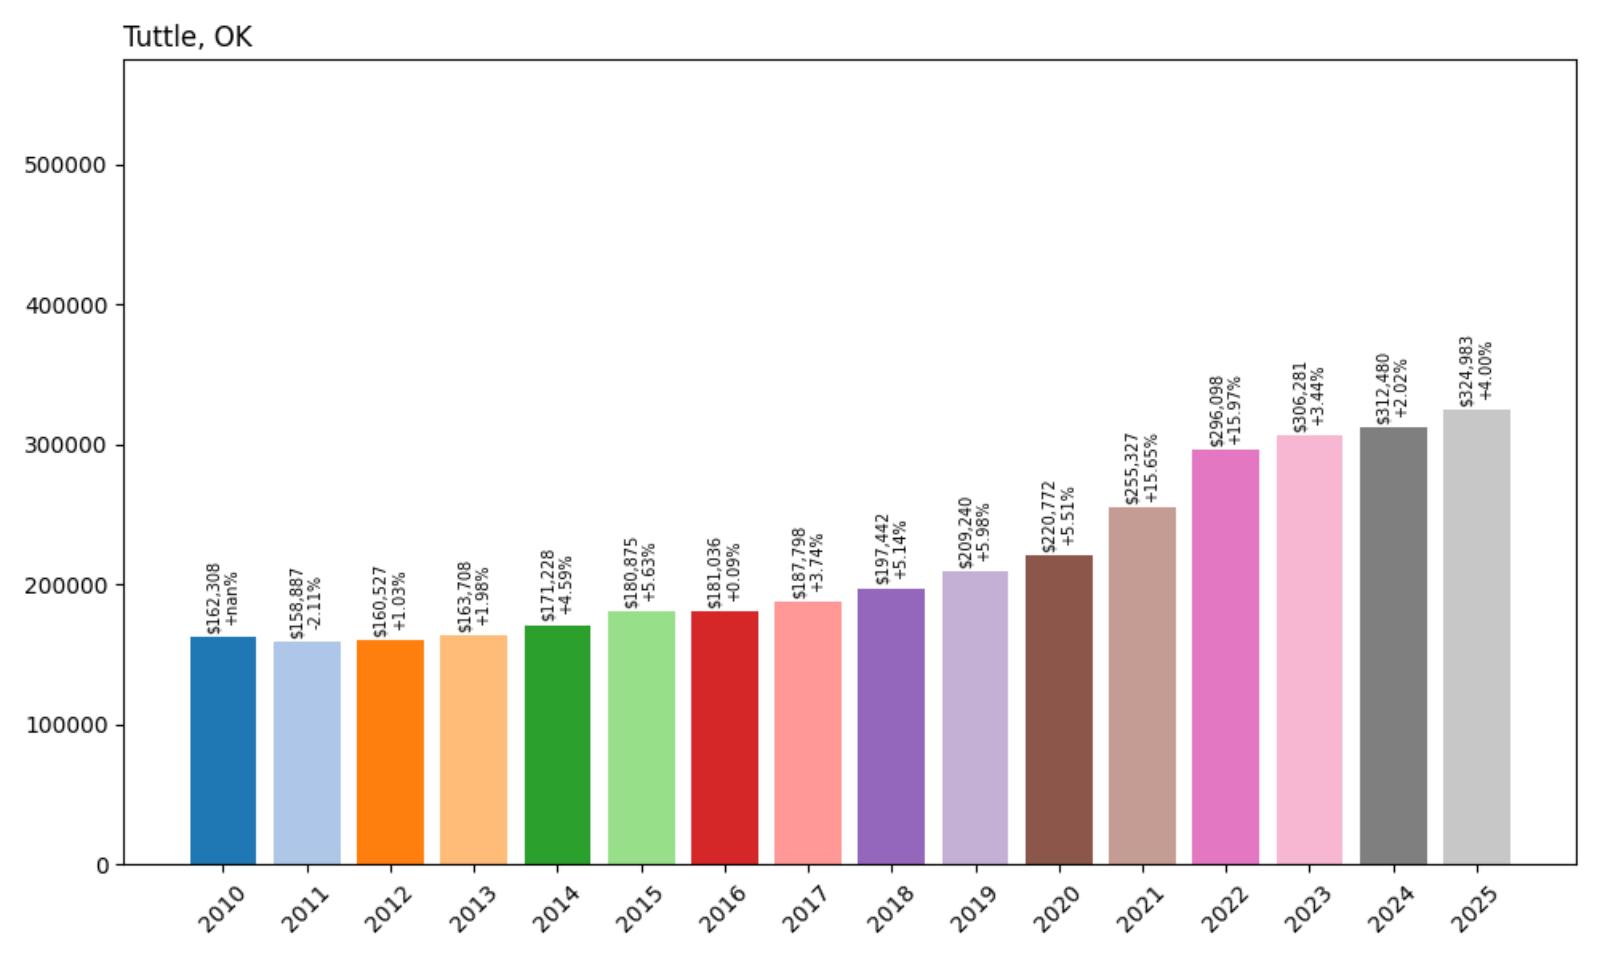
- 2010: $162,308
- 2011: $158,887 (−$3,421, −2.11% from previous year)
- 2012: $160,527 (+$1,640, +1.03% from previous year)
- 2013: $163,708 (+$3,180, +1.98% from previous year)
- 2014: $171,228 (+$7,521, +4.59% from previous year)
- 2015: $180,875 (+$9,647, +5.63% from previous year)
- 2016: $181,036 (+$161, +0.09% from previous year)
- 2017: $187,798 (+$6,762, +3.74% from previous year)
- 2018: $197,442 (+$9,645, +5.14% from previous year)
- 2019: $209,240 (+$11,798, +5.98% from previous year)
- 2020: $220,772 (+$11,532, +5.51% from previous year)
- 2021: $255,327 (+$34,555, +15.65% from previous year)
- 2022: $296,098 (+$40,771, +15.97% from previous year)
- 2023: $306,281 (+$10,183, +3.44% from previous year)
- 2024: $312,480 (+$6,199, +2.02% from previous year)
- 2025: $324,983 (+$12,503, +4.00% from previous year)
Tuttle’s housing market has doubled in value since 2010, rising from $162,308 to $324,983 in 2025 — a cumulative increase of +100.1%. While the early years showed modest single-digit growth, the town saw significant upward momentum during the 2020–2022 period, including a +15.97% leap in 2022 alone. The pace has slowed since, suggesting a shift toward a more balanced market, but long-term homeowners have seen substantial gains over the past decade and a half.
Tuttle — Steady Growth in a Small-Town Setting
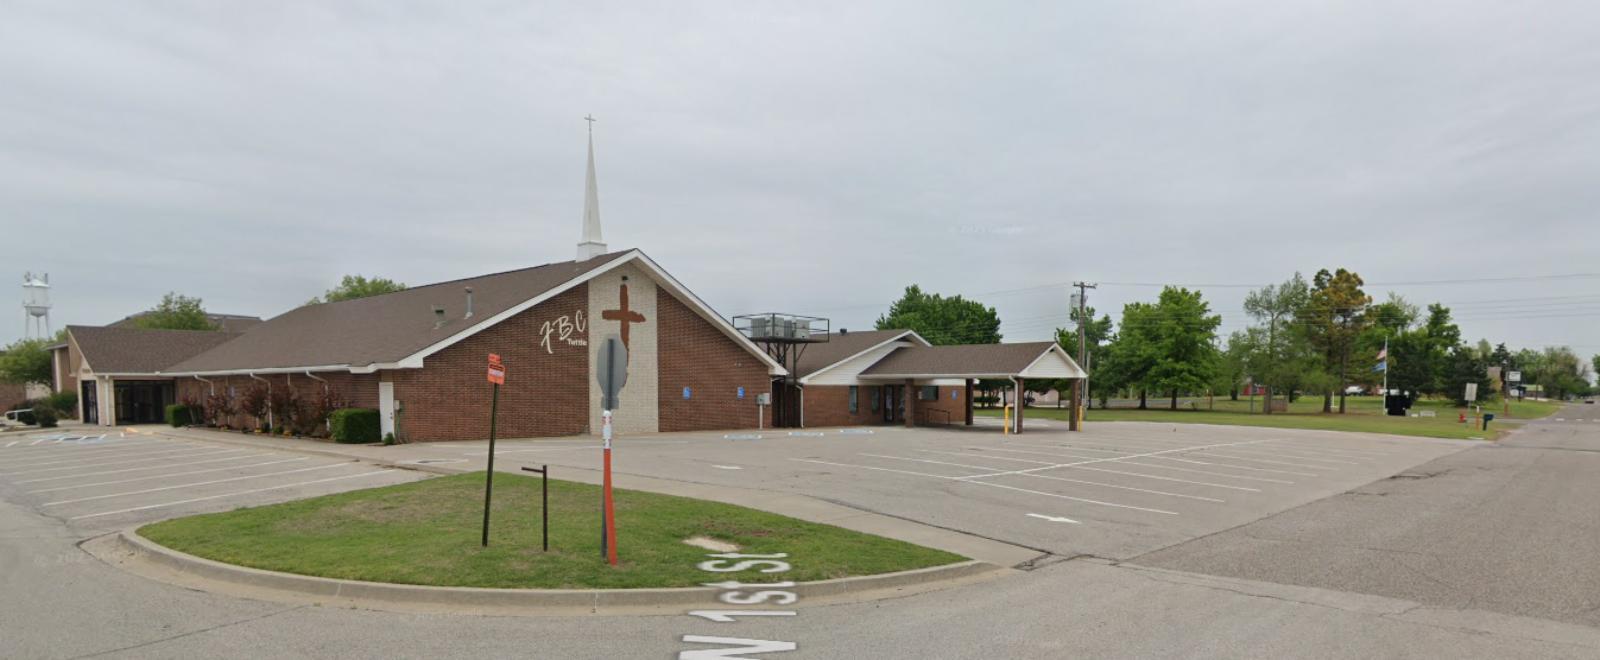
Tuttle’s strong price growth story is rooted in its strategic location between Oklahoma City and Norman, offering a compelling mix of quiet rural living and commuter access. The town has benefited from a gradual but consistent rise in new housing development and population inflow, particularly from buyers priced out of the OKC metro. Tuttle Public Schools are a notable draw, frequently outperforming state averages, which has further boosted the area’s family appeal. Infrastructure upgrades along SH-37 have also helped improve connectivity and catalyze residential growth.
The explosive gains between 2020 and 2022 reflect broader regional trends—pandemic migration, low interest rates, and a desire for larger homes outside urban cores. Yet Tuttle’s subsequent cooldown to more modest growth (around 2–4% annually since 2023) is actually a healthy signal. It suggests the town’s home values are now settling into a more sustainable long-term trajectory. With ample land available and solid civic planning, Tuttle remains well-positioned to attract steady housing demand without the overheating seen in flashier suburbs.
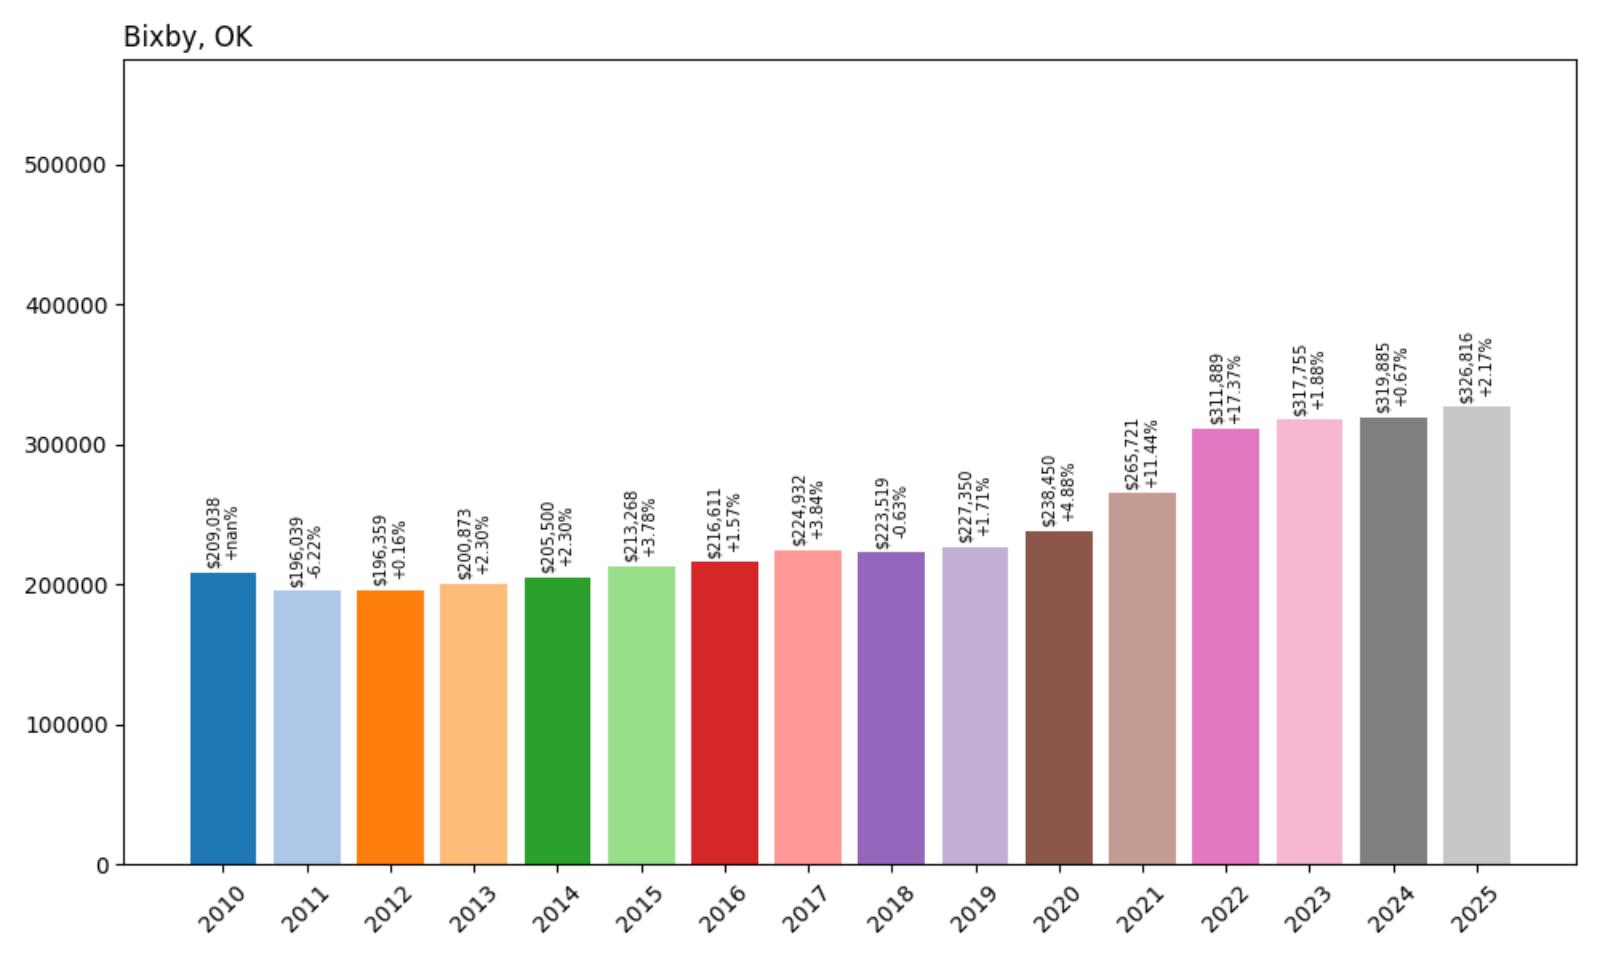
12. Bixby, OK — Home Prices Rose +56.3% from 2010 to 2025
- 2010: $209,038
- 2011: $196,039 (−$12,999, −6.22% from previous year)
- 2012: $196,359 (+$320, +0.16% from previous year)
- 2013: $200,873 (+$4,514, +2.30% from previous year)
- 2014: $205,500 (+$4,627, +2.30% from previous year)
- 2015: $213,268 (+$7,768, +3.78% from previous year)
- 2016: $216,611 (+$3,342, +1.57% from previous year)
- 2017: $224,932 (+$8,322, +3.84% from previous year)
- 2018: $223,519 (−$1,413, −0.63% from previous year)
- 2019: $227,350 (+$3,830, +1.71% from previous year)
- 2020: $238,450 (+$11,100, +4.88% from previous year)
- 2021: $265,721 (+$27,271, +11.44% from previous year)
- 2022: $311,889 (+$46,168, +17.37% from previous year)
- 2023: $317,755 (+$5,866, +1.88% from previous year)
- 2024: $319,885 (+$2,129, +0.67% from previous year)
- 2025: $326,816 (+$6,931, +2.17% from previous year)
Bixby home prices have grown from $209,038 in 2010 to $326,816 in 2025, marking a total increase of +56.3%. After a notable drop in 2011, the market rebounded gradually with steady low-single-digit growth. The most dramatic jumps occurred during 2021 and 2022 — a period when home values surged more than +28% in just two years. Price growth has since leveled off, with moderate annual increases under 3% over the last three years.
Bixby — Tulsa’s Fastest-Growing Suburban Star
Bixby has carved out a reputation as one of Tulsa’s most desirable suburbs, thanks to a rare blend of excellent schools, strong community planning, and upscale new developments. The appeal lies in its balance: families can find larger homes and top-tier amenities without sacrificing access to employment centers in Tulsa proper. The city’s investments in parks, riverfront improvements, and high-end retail have made it a lifestyle destination as much as a commuter town. All of this has translated into high demand and long-term price resilience.
The home price explosion during the early 2020s mirrored a broader suburban rush as remote work enabled buyers to prioritize space and quality of life. Bixby stood out because of its ready supply of newer homes, good broadband infrastructure, and ongoing school expansion projects. While recent price growth has slowed to below 3% annually, this tapering is not a sign of weakness. Instead, it reflects a market that’s matured quickly — and now commands prices that reflect both scarcity and sustained buyer interest. For investors and families alike, Bixby remains a robust long-term play.
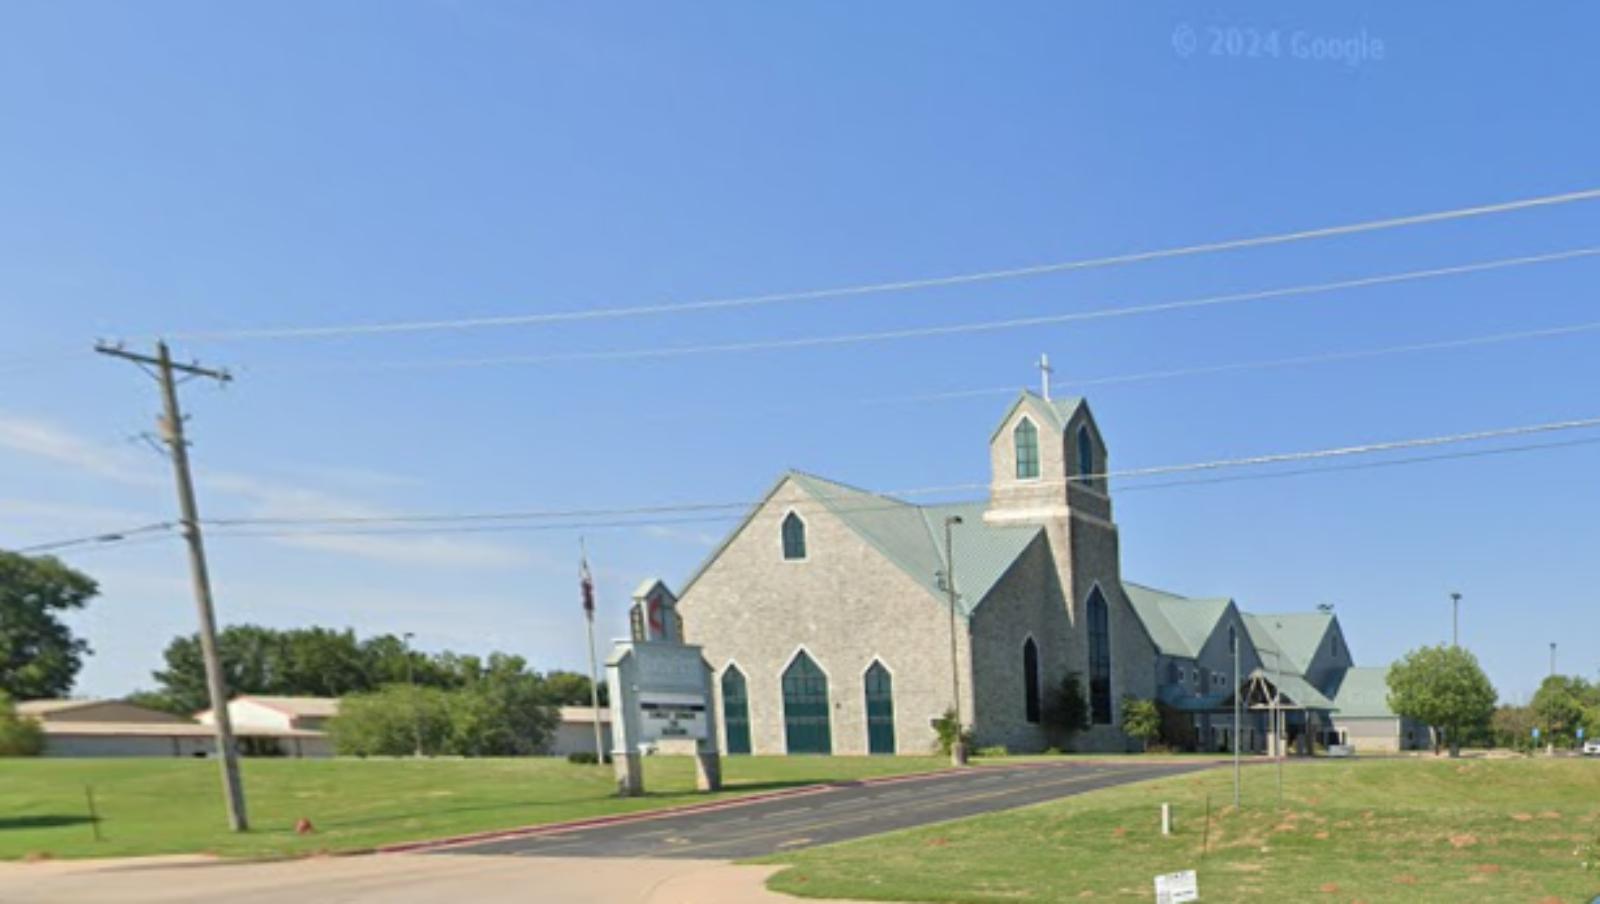
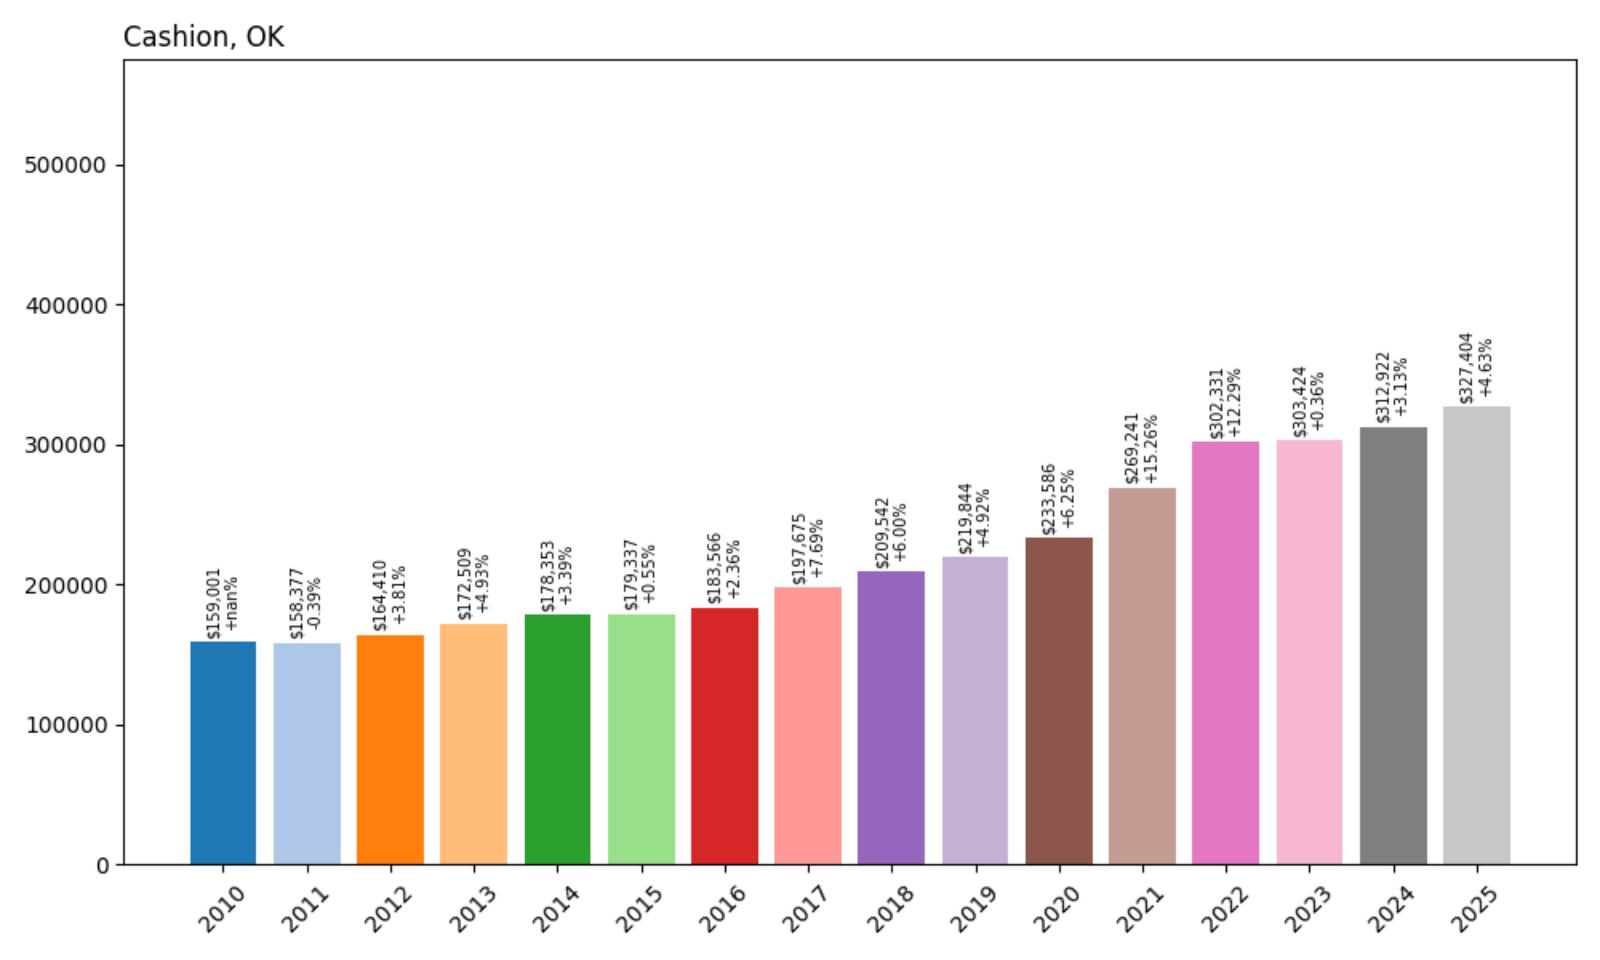
11. Cashion, OK — Home Prices Rose +105.9% from 2010 to 2025
- 2010: $159,001
- 2011: $158,377 (−$624, −0.39% from previous year)
- 2012: $164,410 (+$6,033, +3.81% from previous year)
- 2013: $172,509 (+$8,099, +4.93% from previous year)
- 2014: $178,353 (+$5,844, +3.39% from previous year)
- 2015: $179,337 (+$984, +0.55% from previous year)
- 2016: $183,566 (+$4,229, +2.36% from previous year)
- 2017: $197,675 (+$14,109, +7.69% from previous year)
- 2018: $209,542 (+$11,867, +6.00% from previous year)
- 2019: $219,844 (+$10,302, +4.92% from previous year)
- 2020: $233,586 (+$13,742, +6.25% from previous year)
- 2021: $269,241 (+$35,656, +15.26% from previous year)
- 2022: $302,331 (+$33,090, +12.29% from previous year)
- 2023: $303,424 (+$1,093, +0.36% from previous year)
- 2024: $312,922 (+$9,498, +3.13% from previous year)
- 2025: $327,404 (+$14,482, +4.63% from previous year)
Between 2010 and 2025, Cashion’s median home value more than doubled, climbing from $159,001 to $327,404 — an increase of +105.9%. For much of the 2010s, appreciation remained modest and steady, with annual increases mostly hovering between 2% and 5%. The major inflection point came during 2020–2022, when prices jumped more than $68,000 in just two years. Since then, the pace has normalized, with gains between 0.36% and 4.63% over the last few years.
Cashion — Small-Town Living with Big-Time Growth
Cashion is a textbook example of how small towns near major metros can experience outsized price growth. Located northwest of Oklahoma City, this quiet community offers acreage, open skies, and a rural atmosphere — all within commuting range of urban jobs. The town’s appeal skyrocketed in the early 2020s, particularly as pandemic-era buyers sought more space and distance from dense urban centers. Cashion’s school district, known for strong performance and community pride, only added to the draw for families leaving the city behind.
The rapid price increase during the early 2020s was partly driven by new construction and surging land value as developers eyed future expansion. What’s remarkable is that even after a brief plateau in 2023, prices resumed a healthy climb. This suggests that demand hasn’t softened; rather, the market paused after a high-growth sprint. For prospective buyers, Cashion presents a rare opportunity to get in early on what still feels like an under-the-radar market. Its combination of space, schools, and proximity continues to make it one of central Oklahoma’s strongest long-term bets.
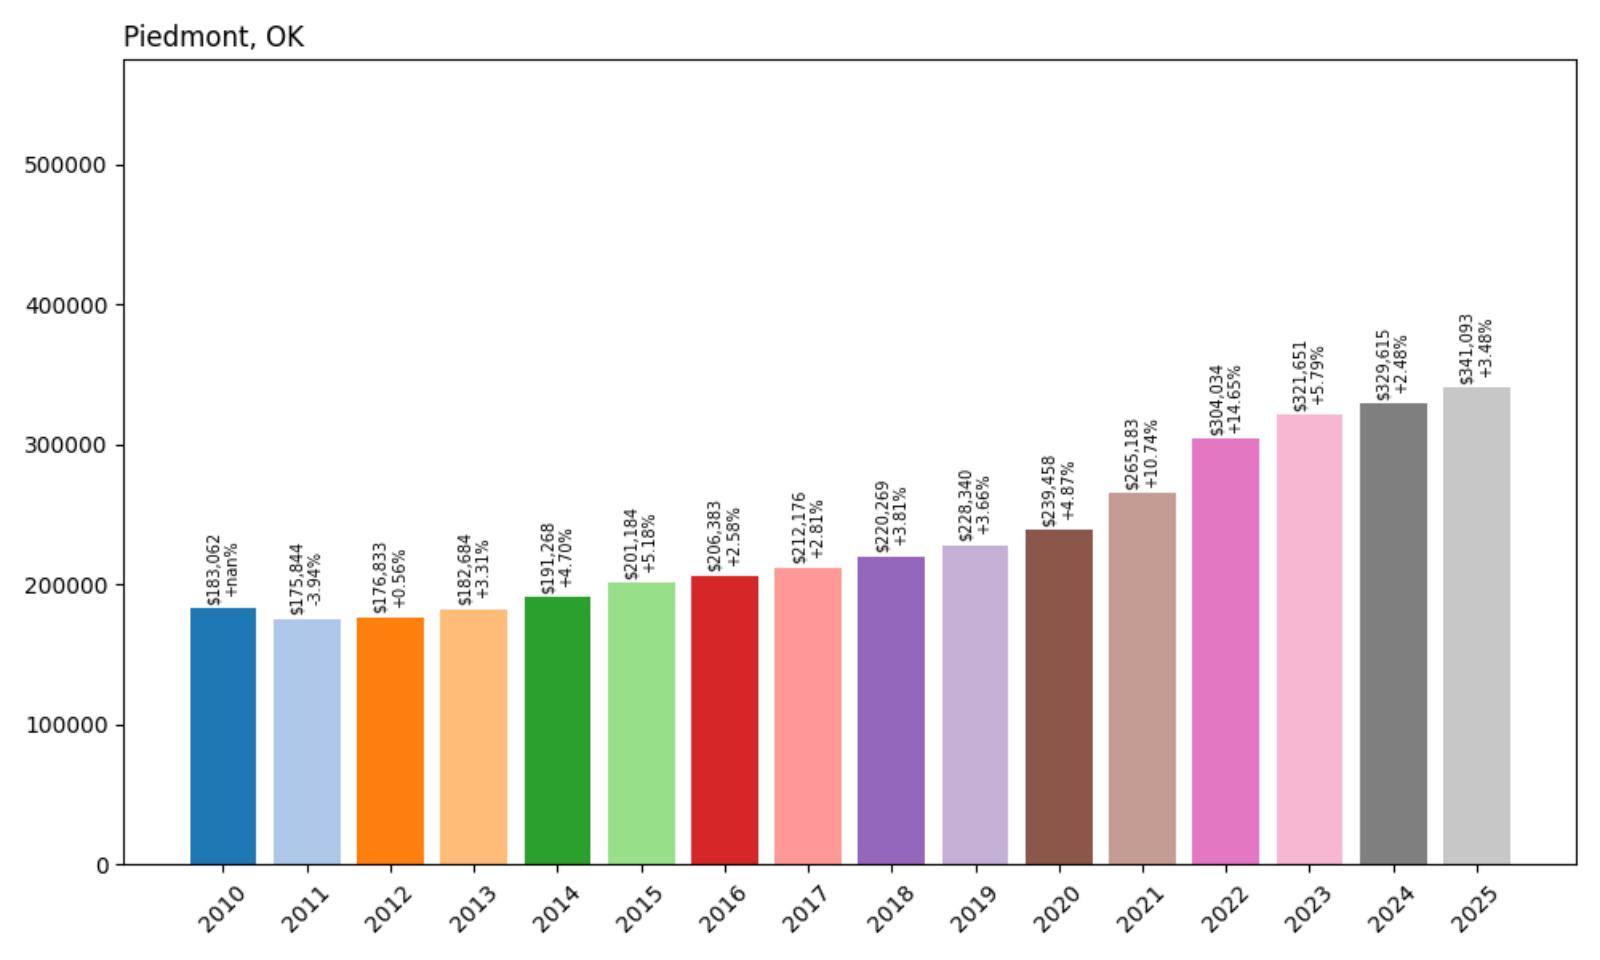
10. Piedmont, OK — Home Prices Rose +86.3% from 2010 to 2025
- 2010: $183,062
- 2011: $175,844 (−$7,219, −3.94% from previous year)
- 2012: $176,833 (+$989, +0.56% from previous year)
- 2013: $182,684 (+$5,852, +3.31% from previous year)
- 2014: $191,268 (+$8,583, +4.70% from previous year)
- 2015: $201,184 (+$9,916, +5.18% from previous year)
- 2016: $206,383 (+$5,200, +2.58% from previous year)
- 2017: $212,176 (+$5,792, +2.81% from previous year)
- 2018: $220,269 (+$8,093, +3.81% from previous year)
- 2019: $228,340 (+$8,071, +3.66% from previous year)
- 2020: $239,458 (+$11,118, +4.87% from previous year)
- 2021: $265,183 (+$25,725, +10.74% from previous year)
- 2022: $304,034 (+$38,851, +14.65% from previous year)
- 2023: $321,651 (+$17,617, +5.79% from previous year)
- 2024: $329,615 (+$7,964, +2.48% from previous year)
- 2025: $341,093 (+$11,479, +3.48% from previous year)
Piedmont’s home values have risen from $183,062 in 2010 to $341,093 in 2025, marking an overall increase of +86.3% in 15 years. The market saw steady, low-to-mid single-digit annual gains throughout the 2010s, with prices generally increasing at a sustainable clip. However, between 2020 and 2022, appreciation dramatically accelerated — prices jumped nearly $65,000 over that two-year span. While growth moderated slightly afterward, it remained positive through 2025, signaling continued strength.
Piedmont — A Suburban Oasis with Room to Grow
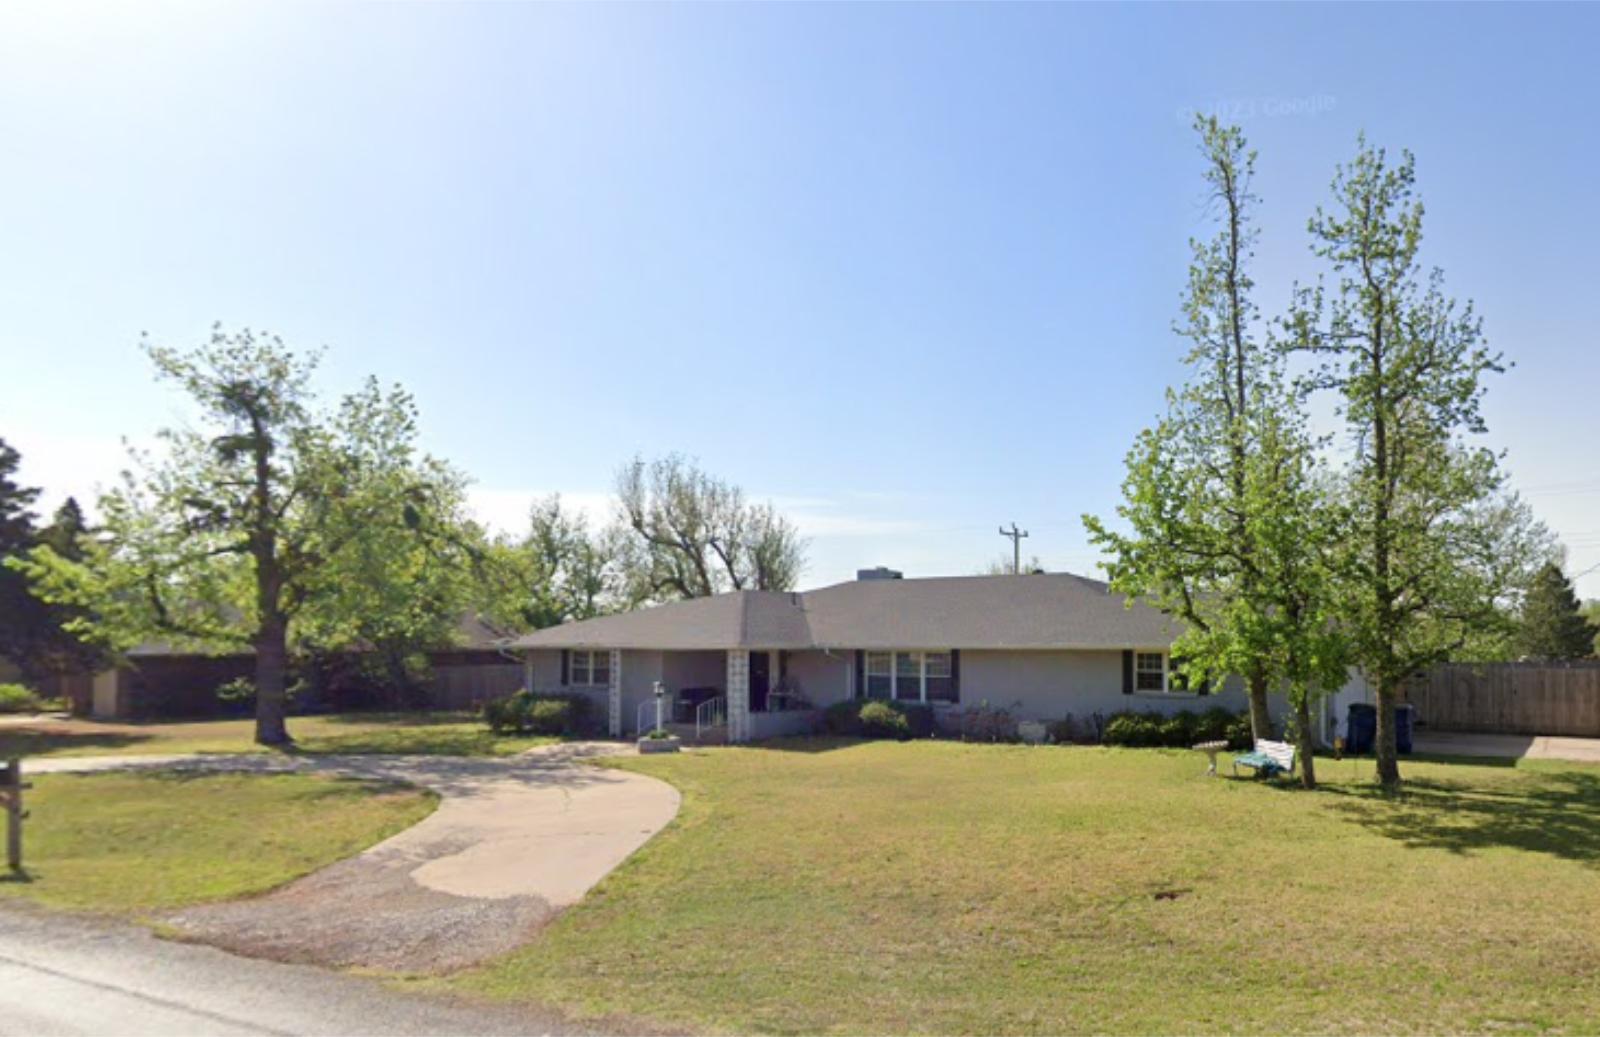
Piedmont sits just northwest of Oklahoma City and has long been favored for its semi-rural charm paired with urban proximity. Families are drawn by its excellent public schools and safe, family-friendly neighborhoods, while retirees and telecommuters appreciate the peaceful lifestyle and larger lots. As infrastructure expanded and connectivity to the metro improved, more buyers saw Piedmont as a viable alternative to inner-ring suburbs — especially during the post-pandemic shift toward space and privacy.
What’s made Piedmont especially resilient is its ability to scale with demand. Unlike landlocked areas, Piedmont has been able to grow its housing stock without dramatically altering its character. The town has welcomed controlled development and maintained zoning that supports both residential growth and open land preservation. With demand still outpacing supply, and new neighborhoods offering modern builds at competitive prices, Piedmont continues to be one of Oklahoma’s most attractive upmarket suburban options — ideal for those seeking value and lifestyle in one package.
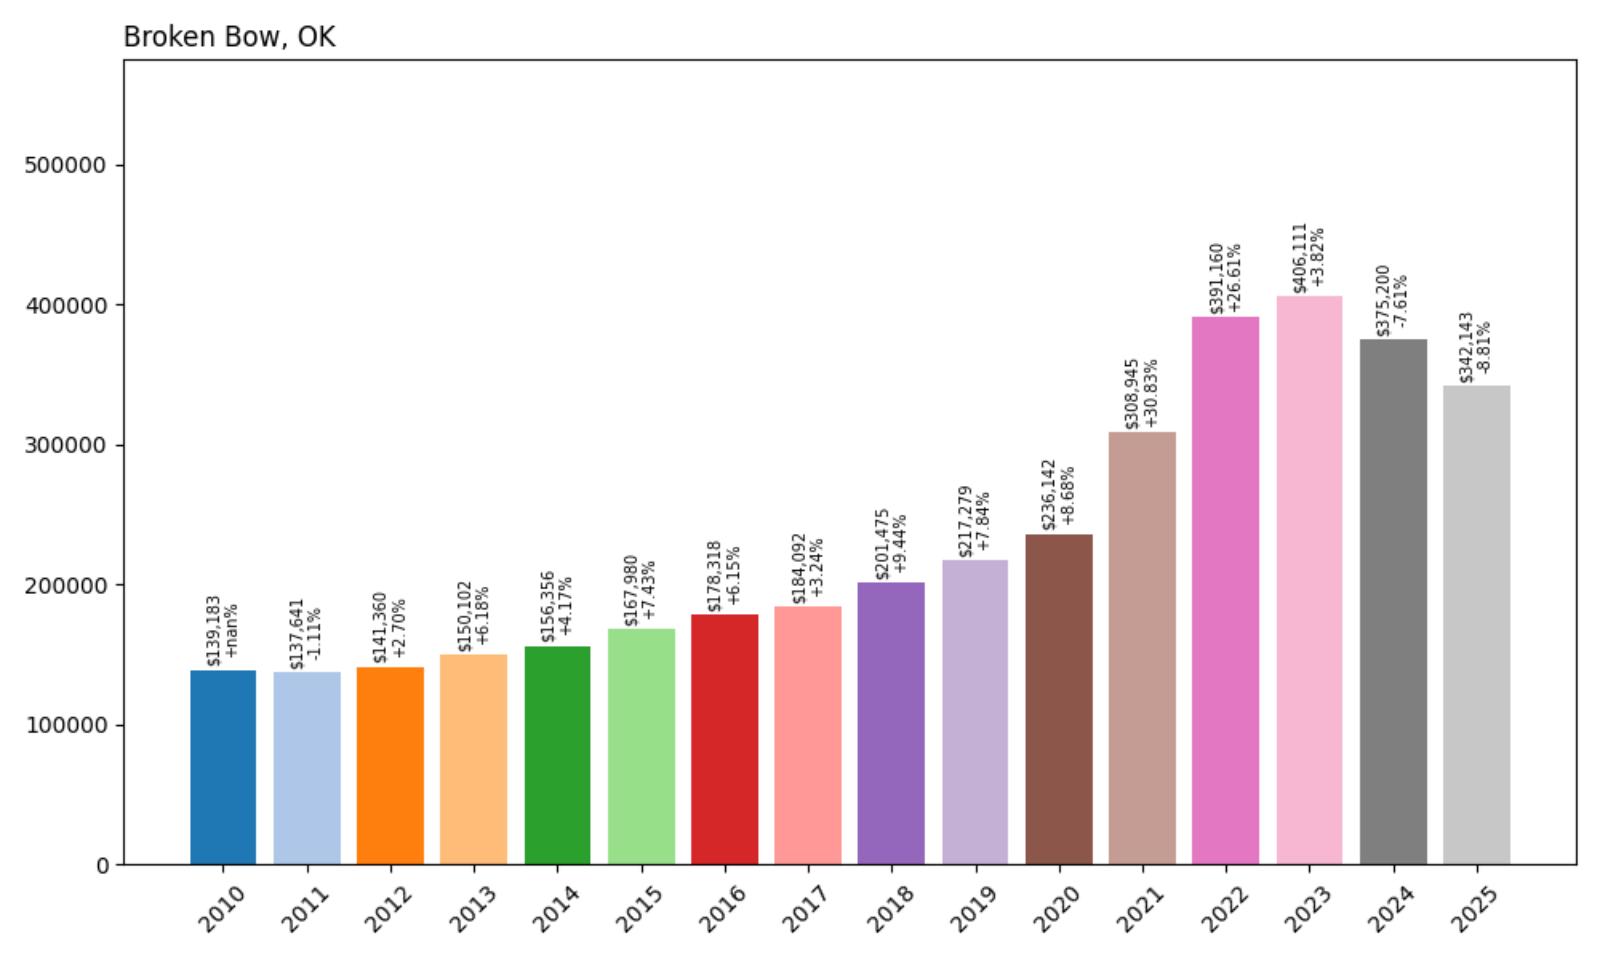
9. Broken Bow, OK — Home Prices Rose +145.9% from 2010 to 2025
- 2010: $139,183
- 2011: $137,641 (−$1,542, −1.11% from previous year)
- 2012: $141,360 (+$3,719, +2.70% from previous year)
- 2013: $150,102 (+$8,742, +6.18% from previous year)
- 2014: $156,356 (+$6,254, +4.17% from previous year)
- 2015: $167,980 (+$11,624, +7.43% from previous year)
- 2016: $178,318 (+$10,338, +6.15% from previous year)
- 2017: $184,092 (+$5,774, +3.24% from previous year)
- 2018: $201,475 (+$17,383, +9.44% from previous year)
- 2019: $217,279 (+$15,804, +7.84% from previous year)
- 2020: $236,142 (+$18,863, +8.68% from previous year)
- 2021: $308,945 (+$72,803, +30.83% from previous year)
- 2022: $391,160 (+$82,215, +26.61% from previous year)
- 2023: $406,111 (+$14,951, +3.82% from previous year)
- 2024: $375,200 (−$30,911, −7.61% from previous year)
- 2025: $342,143 (−$33,057, −8.81% from previous year)
Broken Bow’s housing market experienced a remarkable boom over the last decade and a half. From $139,183 in 2010, prices surged to $342,143 by 2025 — an astonishing +145.9% increase. The most dramatic growth occurred from 2020 to 2022, when home values skyrocketed nearly $155,000 in just two years, driven by rapid tourism expansion and rising second-home demand. However, after reaching a peak of $406,111 in 2023, the market corrected sharply with two consecutive annual declines through 2025.
Broken Bow — A Tourism-Driven Market with Volatility
Broken Bow is unlike many Oklahoma towns in that its economy is heavily powered by tourism. Nestled near Beavers Bend State Park, the area is famous for cabin rentals, outdoor recreation, and weekend getaways — especially for visitors from Texas and Arkansas. As remote work surged during the pandemic and vacation rental platforms like Airbnb gained traction, Broken Bow became a hotspot for investors purchasing short-term rental cabins, dramatically increasing local home prices. This influx of investor demand pushed real estate beyond the means of many local buyers.
But what goes up fast can also correct swiftly. Recent years have shown signs of cooling — the 2024 and 2025 price drops reflect saturation in the vacation rental market, higher interest rates, and increased regulatory scrutiny around short-term rentals. Yet Broken Bow’s long-term outlook remains tied to its natural beauty and recreation economy. If the town can manage growth sustainably while preserving its outdoor appeal, demand may rebound. For now, the market is adjusting, offering potential opportunities for buyers seeking entry at more reasonable valuations following a period of explosive — and unsustainable — gains.
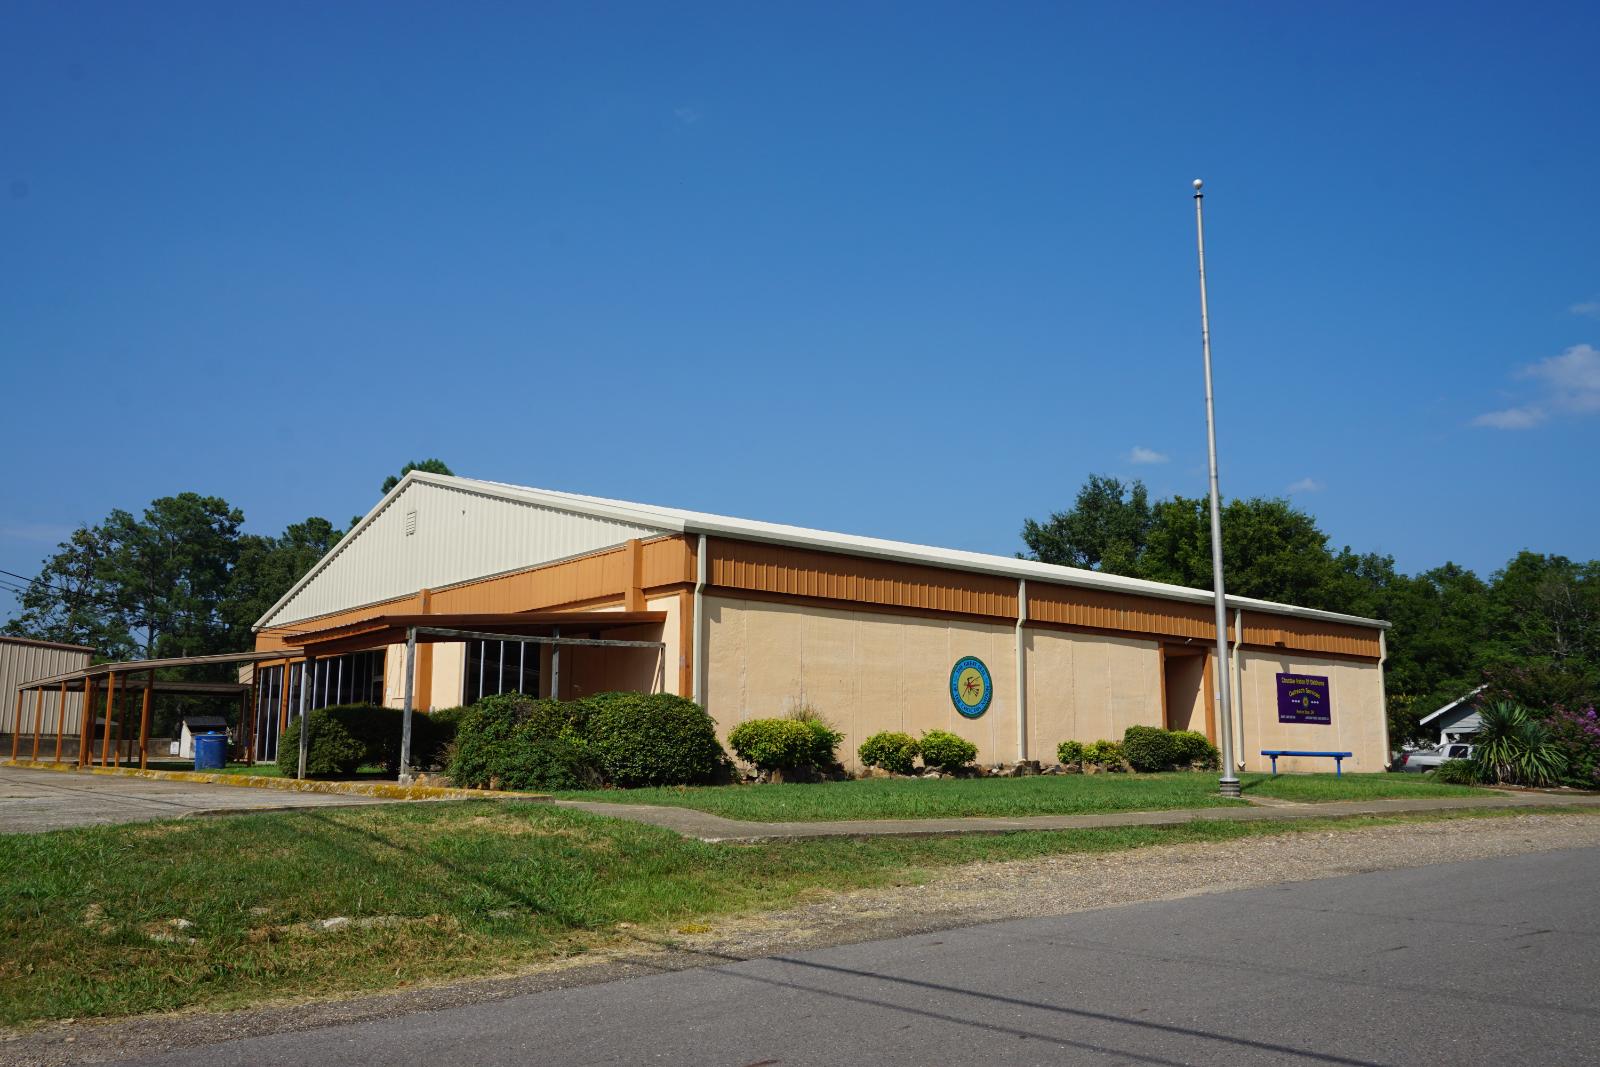
8. Jenks, OK — Home Prices Rose +62.1% from 2010 to 2025
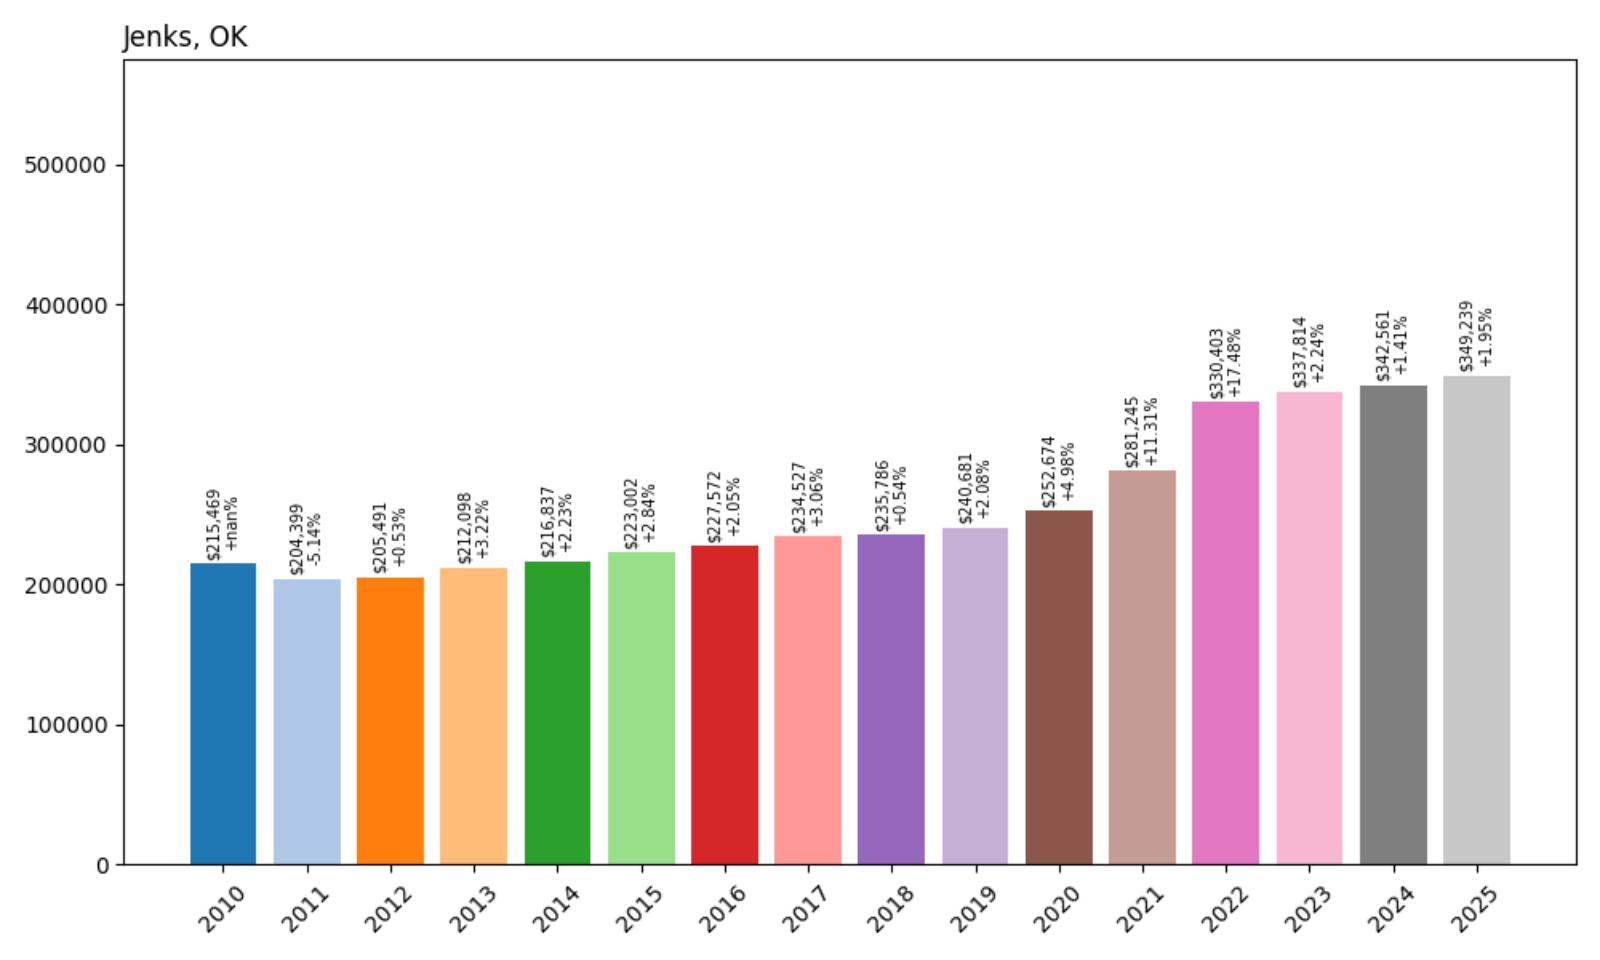
- 2010: $215,469
- 2011: $204,399 (−$11,070, −5.14% from previous year)
- 2012: $205,491 (+$1,093, +0.53% from previous year)
- 2013: $212,098 (+$6,607, +3.22% from previous year)
- 2014: $216,837 (+$4,739, +2.23% from previous year)
- 2015: $223,002 (+$6,165, +2.84% from previous year)
- 2016: $227,572 (+$4,570, +2.05% from previous year)
- 2017: $234,527 (+$6,956, +3.06% from previous year)
- 2018: $235,786 (+$1,258, +0.54% from previous year)
- 2019: $240,681 (+$4,895, +2.08% from previous year)
- 2020: $252,674 (+$11,993, +4.98% from previous year)
- 2021: $281,245 (+$28,571, +11.31% from previous year)
- 2022: $330,403 (+$49,158, +17.48% from previous year)
- 2023: $337,814 (+$7,411, +2.24% from previous year)
- 2024: $342,561 (+$4,748, +1.41% from previous year)
- 2025: $349,239 (+$6,678, +1.95% from previous year)
Home prices in Jenks climbed from $215,469 in 2010 to $349,239 in 2025, a solid +62.1% increase. Though the market began with a slight dip in 2011, it quickly regained momentum, growing steadily throughout the 2010s. The most rapid appreciation occurred in the pandemic boom years of 2020–2022, when prices soared nearly 31% in just two years. Since then, price growth has moderated, with low single-digit increases from 2023 to 2025, signaling a return to market stability.
Jenks — Steady Growth in a Family-Friendly Suburb
Jenks is a consistently high-demand suburb of Tulsa, known for its excellent schools, well-planned neighborhoods, and family-oriented amenities. The area’s real estate market reflects this appeal — not prone to wild swings, but driven by reliable local demand and quality-of-life factors. Its proximity to the Arkansas River and scenic walking trails, as well as cultural spots like the Oklahoma Aquarium, continue to attract both local homebuyers and new families relocating from other parts of the state.
What’s particularly notable about Jenks is its ability to maintain value through economic cycles. Even during more volatile periods like 2020–2022, the town’s appreciation was healthy rather than overheated. Now, with year-over-year gains settling into a modest 1–2% range, Jenks appears to be entering a phase of normalized, sustainable growth. That makes it appealing for buyers seeking long-term stability, and for investors looking to avoid markets prone to boom-and-bust behavior. While the double-digit growth years may be behind, Jenks’ solid fundamentals continue to support long-term value.
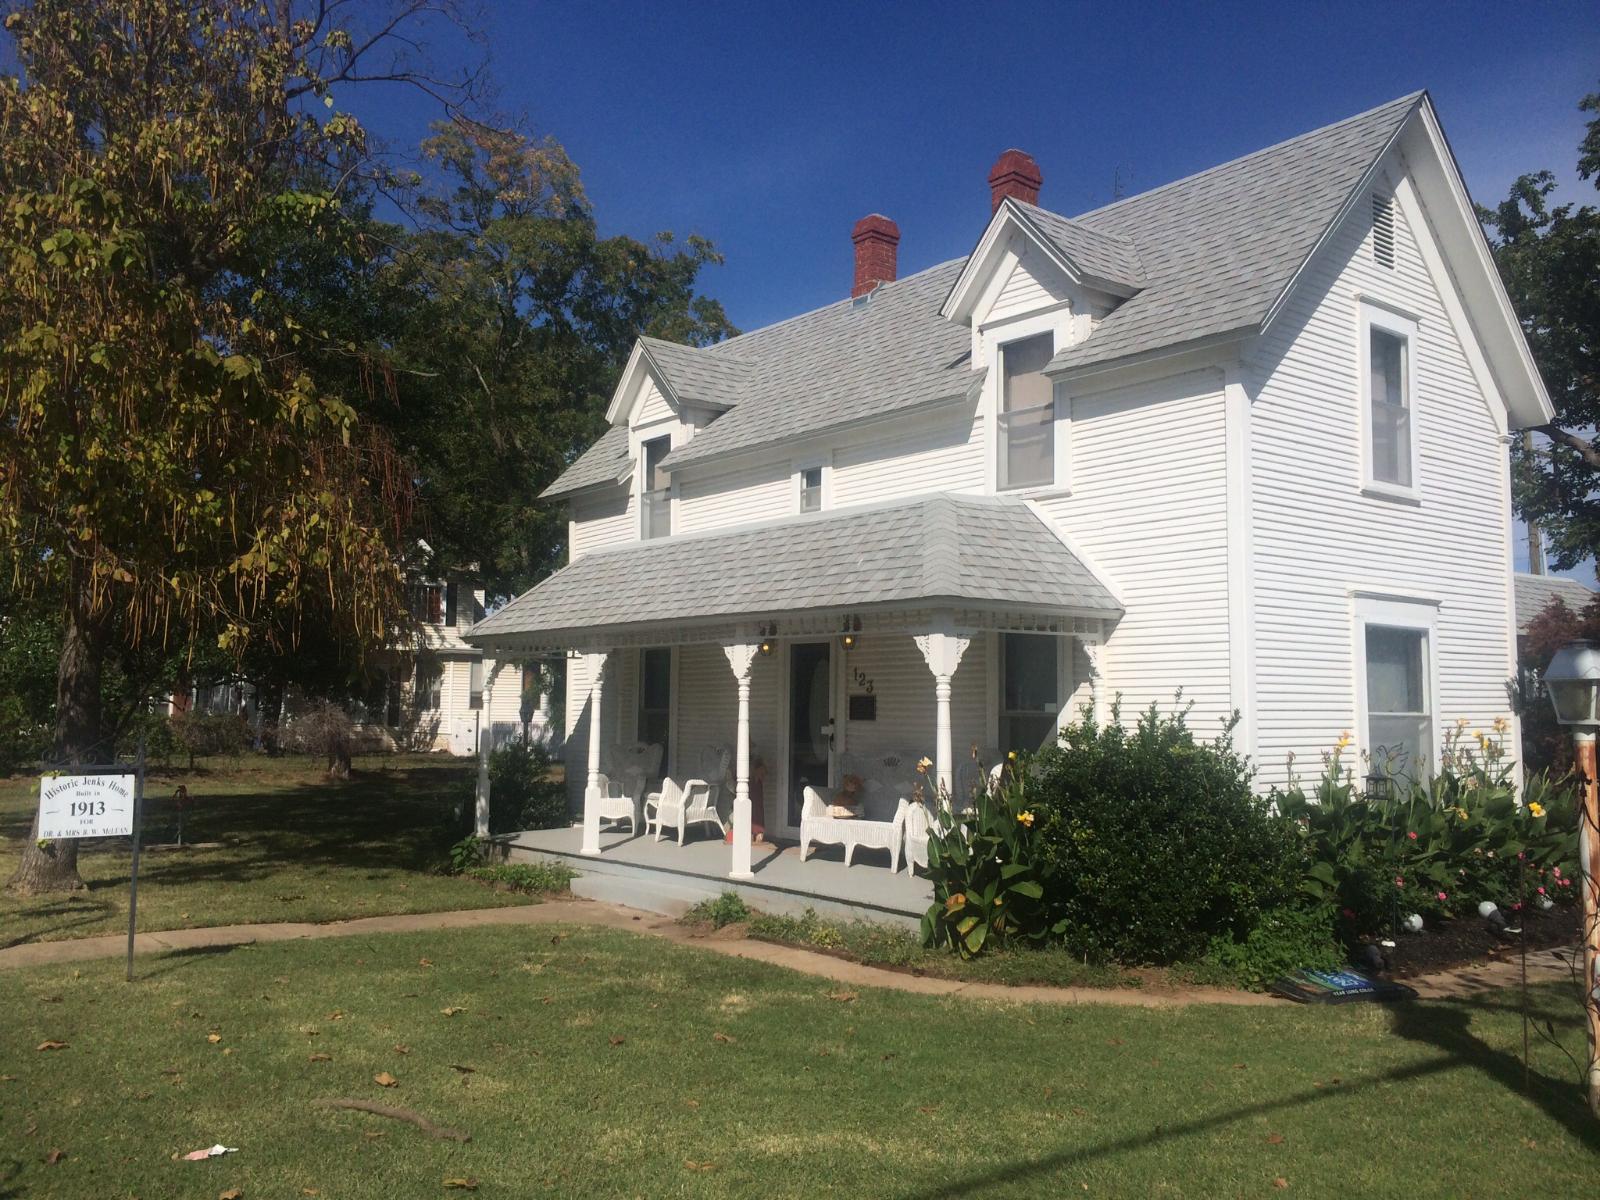
7. Edmond, OK — Home Prices Rose +62.5% from 2010 to 2025
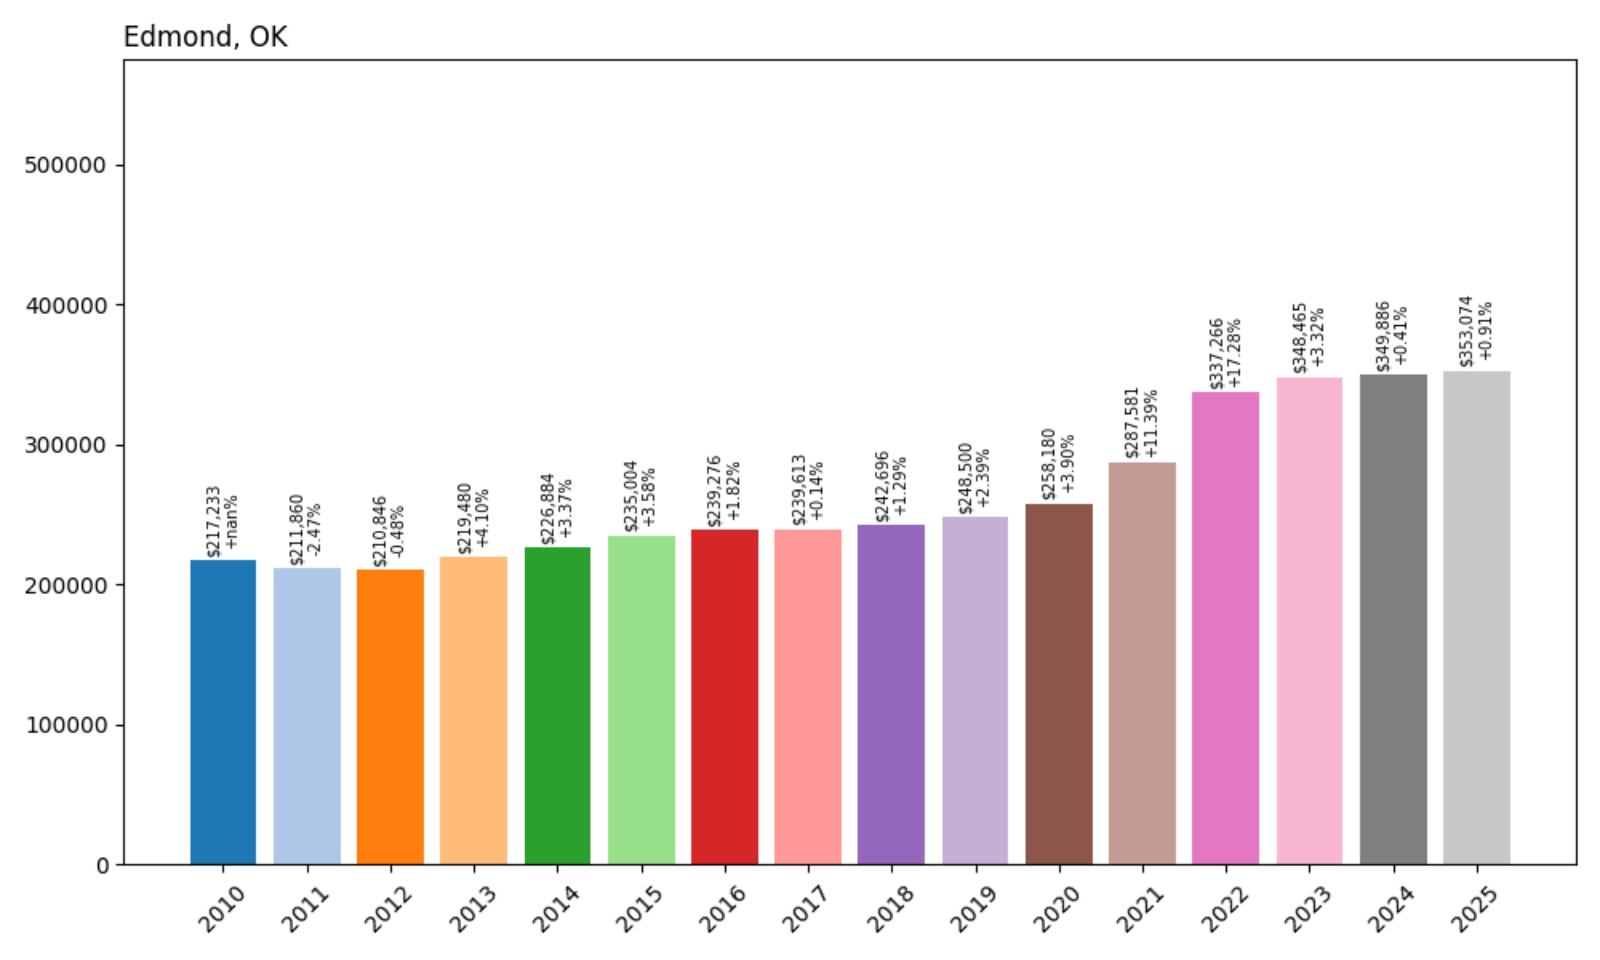
- 2010: $217,233
- 2011: $211,860 (−$5,372, −2.47% from previous year)
- 2012: $210,846 (−$1,015, −0.48% from previous year)
- 2013: $219,480 (+$8,635, +4.10% from previous year)
- 2014: $226,884 (+$7,404, +3.37% from previous year)
- 2015: $235,004 (+$8,119, +3.58% from previous year)
- 2016: $239,276 (+$4,272, +1.82% from previous year)
- 2017: $239,613 (+$337, +0.14% from previous year)
- 2018: $242,696 (+$3,083, +1.29% from previous year)
- 2019: $248,500 (+$5,804, +2.39% from previous year)
- 2020: $258,180 (+$9,681, +3.90% from previous year)
- 2021: $287,581 (+$29,400, +11.39% from previous year)
- 2022: $337,266 (+$49,685, +17.28% from previous year)
- 2023: $348,465 (+$11,199, +3.32% from previous year)
- 2024: $349,886 (+$1,420, +0.41% from previous year)
- 2025: $353,074 (+$3,189, +0.91% from previous year)
Edmond’s home values grew from $217,233 in 2010 to $353,074 in 2025, marking a respectable +62.5% increase over the 15-year period. The early 2010s saw mild corrections, but the town rebounded strongly starting in 2013. While much of the growth was steady and gradual, a notable price spike occurred between 2020 and 2022, when the market surged by over 30%. Price appreciation has since cooled, with marginal growth over the last three years signaling a more mature and balanced market.
Edmond — Stability and Upscale Living in the OKC Metro
Edmond is one of the most desirable communities in the Oklahoma City metro, thanks to its strong school system, affluent neighborhoods, and a well-developed mix of shopping, parks, and restaurants. This long-standing demand for Edmond homes has helped buffer the town from extreme volatility. Buyers are often drawn to its clean suburban layout and the combination of family-oriented charm with upscale amenities — including golf courses, lakeside developments, and access to high-performing public schools.
While the explosive growth during the pandemic-era housing boom pushed prices sharply upward, Edmond has transitioned into a phase of steady moderation. Appreciation since 2023 has remained below 1% annually, suggesting that prices are now more closely tied to income growth and buyer affordability. For families and investors looking for a market with both long-term upward trajectory and low crash risk, Edmond remains a top-tier option in Oklahoma. Its combination of livability and resilience continues to support healthy demand even as statewide trends soften.
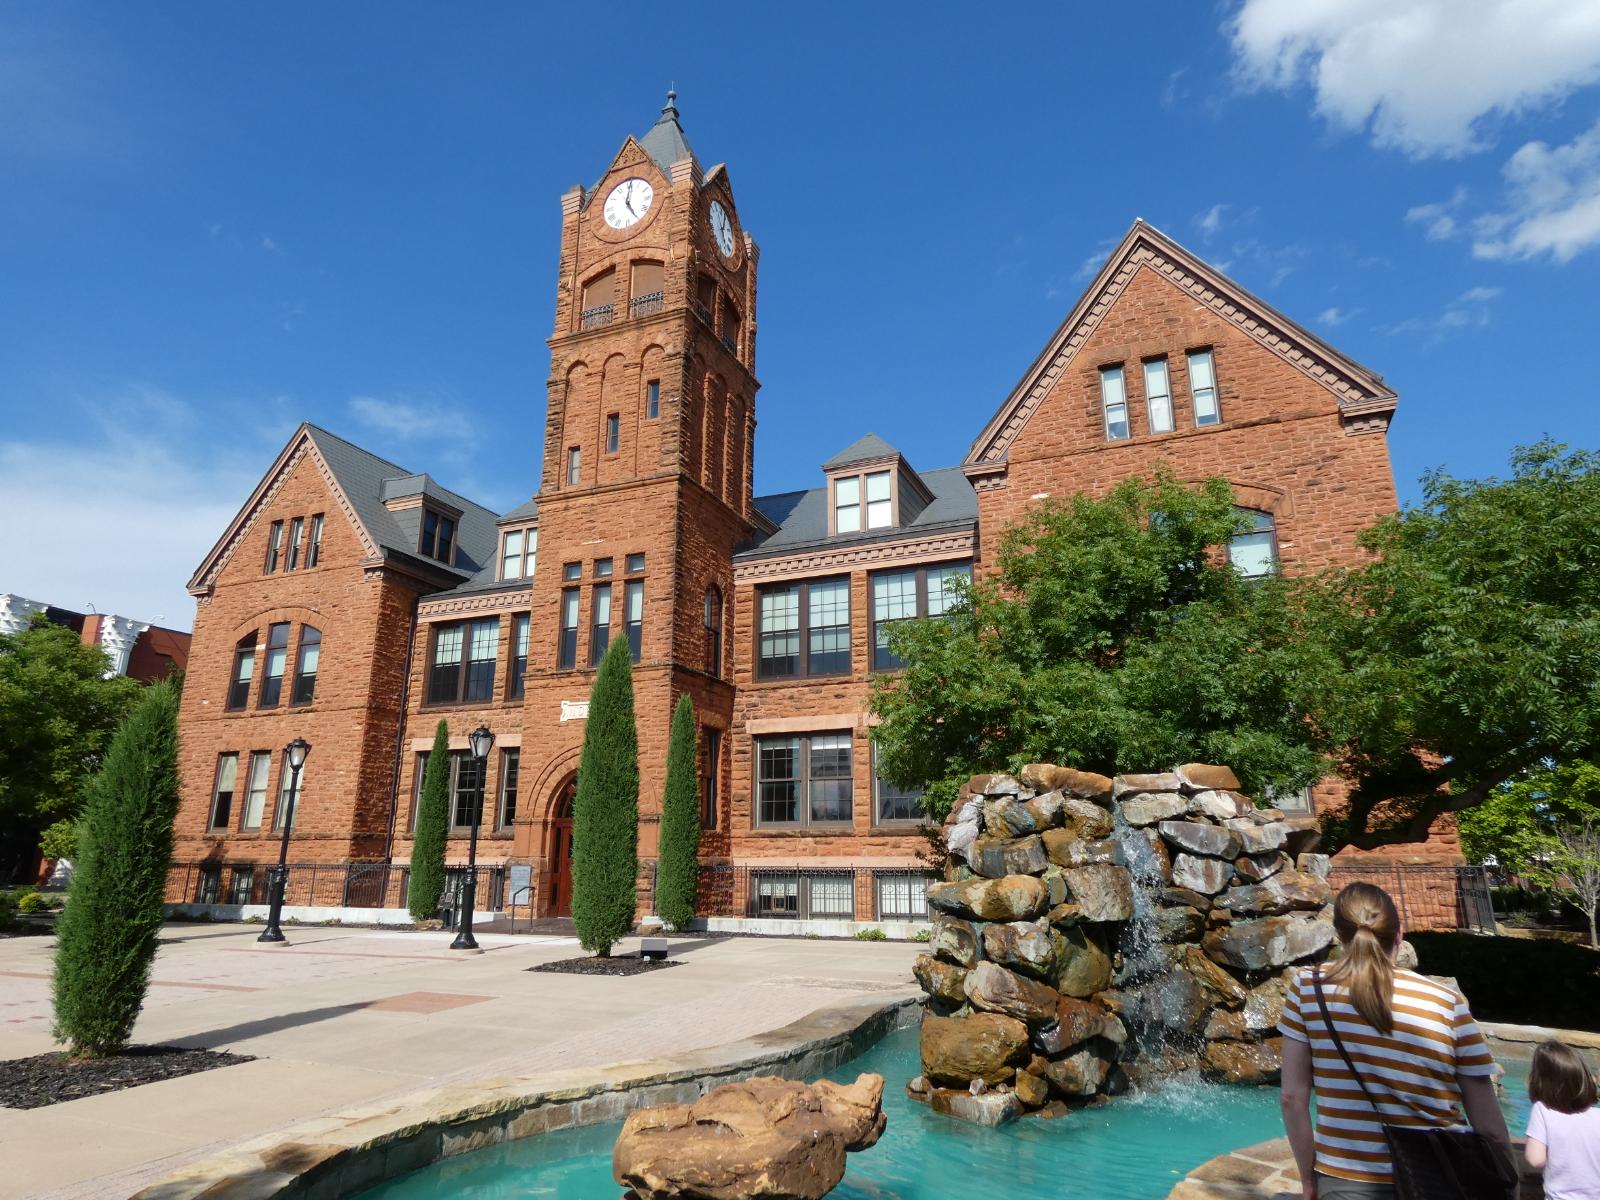
6. Afton, OK — Home Prices Rose +123.3% from 2010 to 2025
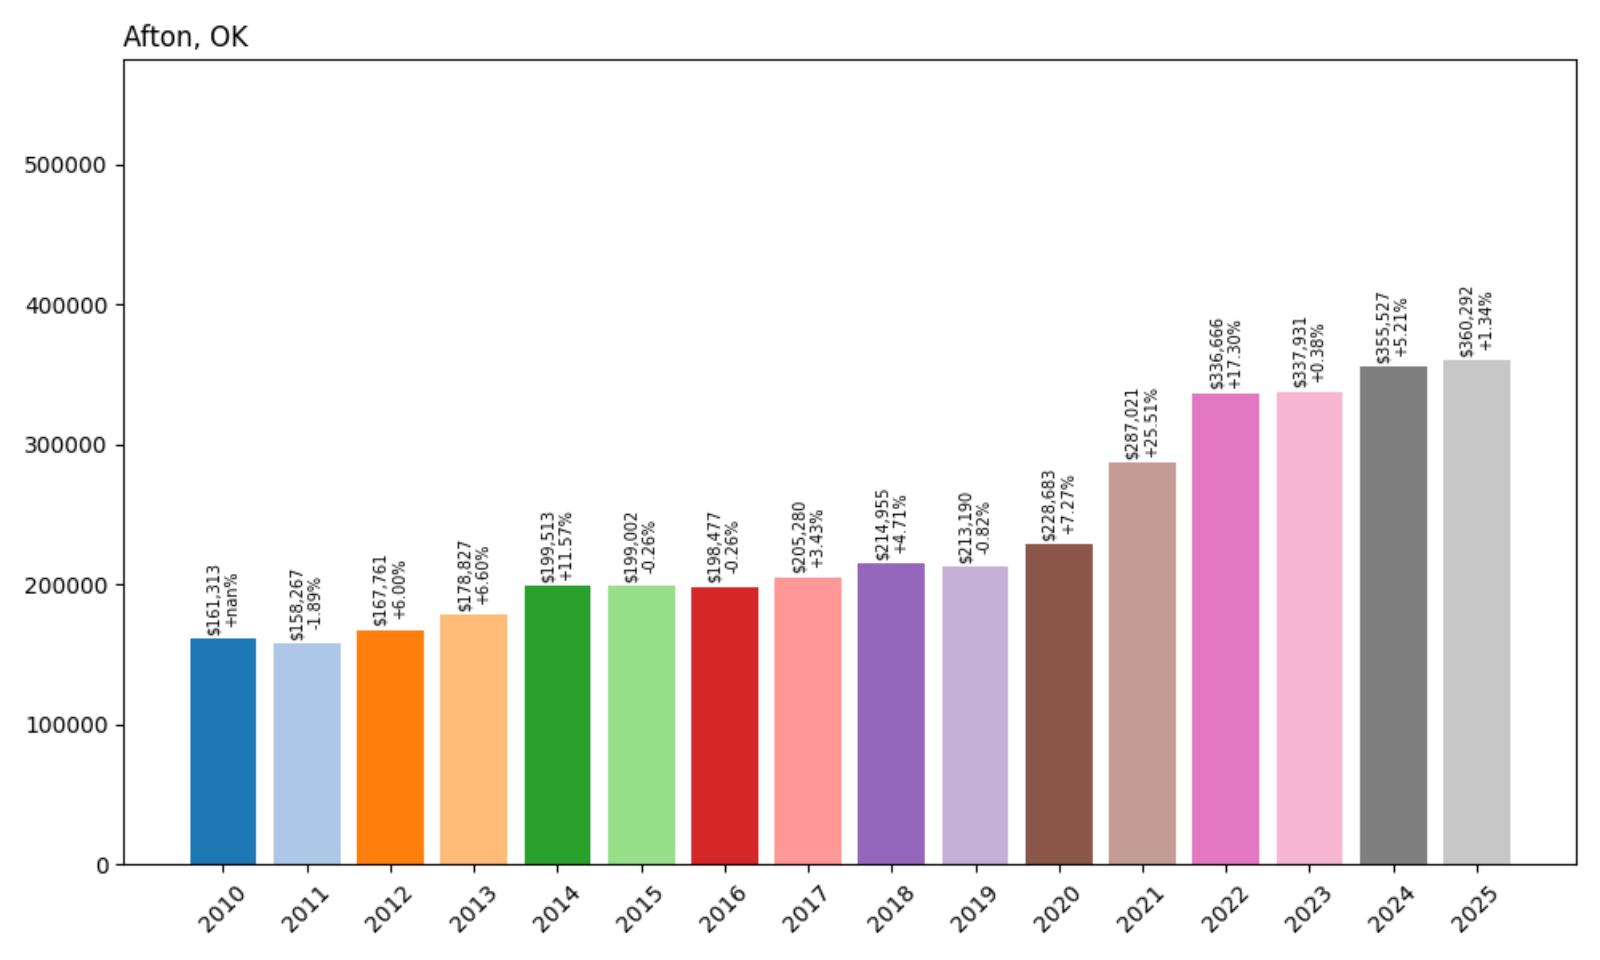
- 2010: $161,313
- 2011: $158,267 (−$3,045, −1.89% from previous year)
- 2012: $167,761 (+$9,494, +6.00% from previous year)
- 2013: $178,827 (+$11,066, +6.60% from previous year)
- 2014: $199,513 (+$20,686, +11.57% from previous year)
- 2015: $199,002 (−$510, −0.26% from previous year)
- 2016: $198,477 (−$525, −0.26% from previous year)
- 2017: $205,280 (+$6,803, +3.43% from previous year)
- 2018: $214,955 (+$9,675, +4.71% from previous year)
- 2019: $213,190 (−$1,765, −0.82% from previous year)
- 2020: $228,683 (+$15,493, +7.27% from previous year)
- 2021: $287,021 (+$58,338, +25.51% from previous year)
- 2022: $336,666 (+$49,645, +17.30% from previous year)
- 2023: $337,931 (+$1,265, +0.38% from previous year)
- 2024: $355,527 (+$17,597, +5.21% from previous year)
- 2025: $360,292 (+$4,765, +1.34% from previous year)
Afton home values have more than doubled in the last 15 years, climbing from $161,313 in 2010 to $360,292 in 2025 — a substantial +123.3% appreciation. Though prices experienced a few brief corrections in 2015–2016 and again in 2019, the market quickly regained momentum. The most striking surge came during the post-2020 boom, with prices soaring nearly 50% between 2020 and 2022. Since then, growth has moderated, with just a 1.34% uptick from 2024 to 2025.
Afton — High Demand Along Grand Lake Shores
Afton’s significant price growth is closely tied to its lakeside location near Grand Lake O’ the Cherokees, a popular destination for both tourists and second-home buyers. With its marinas, waterfront homes, and recreational appeal, Afton attracts out-of-town investors and retirees seeking vacation-style living. This demand has fueled robust real estate activity, even during years when the broader rural housing market slowed. As Grand Lake tourism continues to thrive, the appeal of lakeside property in Afton remains strong, particularly for those seeking investment or seasonal use.
In recent years, Afton has also attracted attention for its affordability relative to other lake towns, prompting greater activity in the build-to-rent and fixer-upper segments. While the explosive growth seen in 2021 and 2022 has tempered, the steady rise in prices since 2023 suggests that the market has found a more sustainable pace. Local economic stability, combined with strong recreational demand, continues to support Afton’s long-term real estate value, especially among buyers who value lake access, privacy, and rural charm.
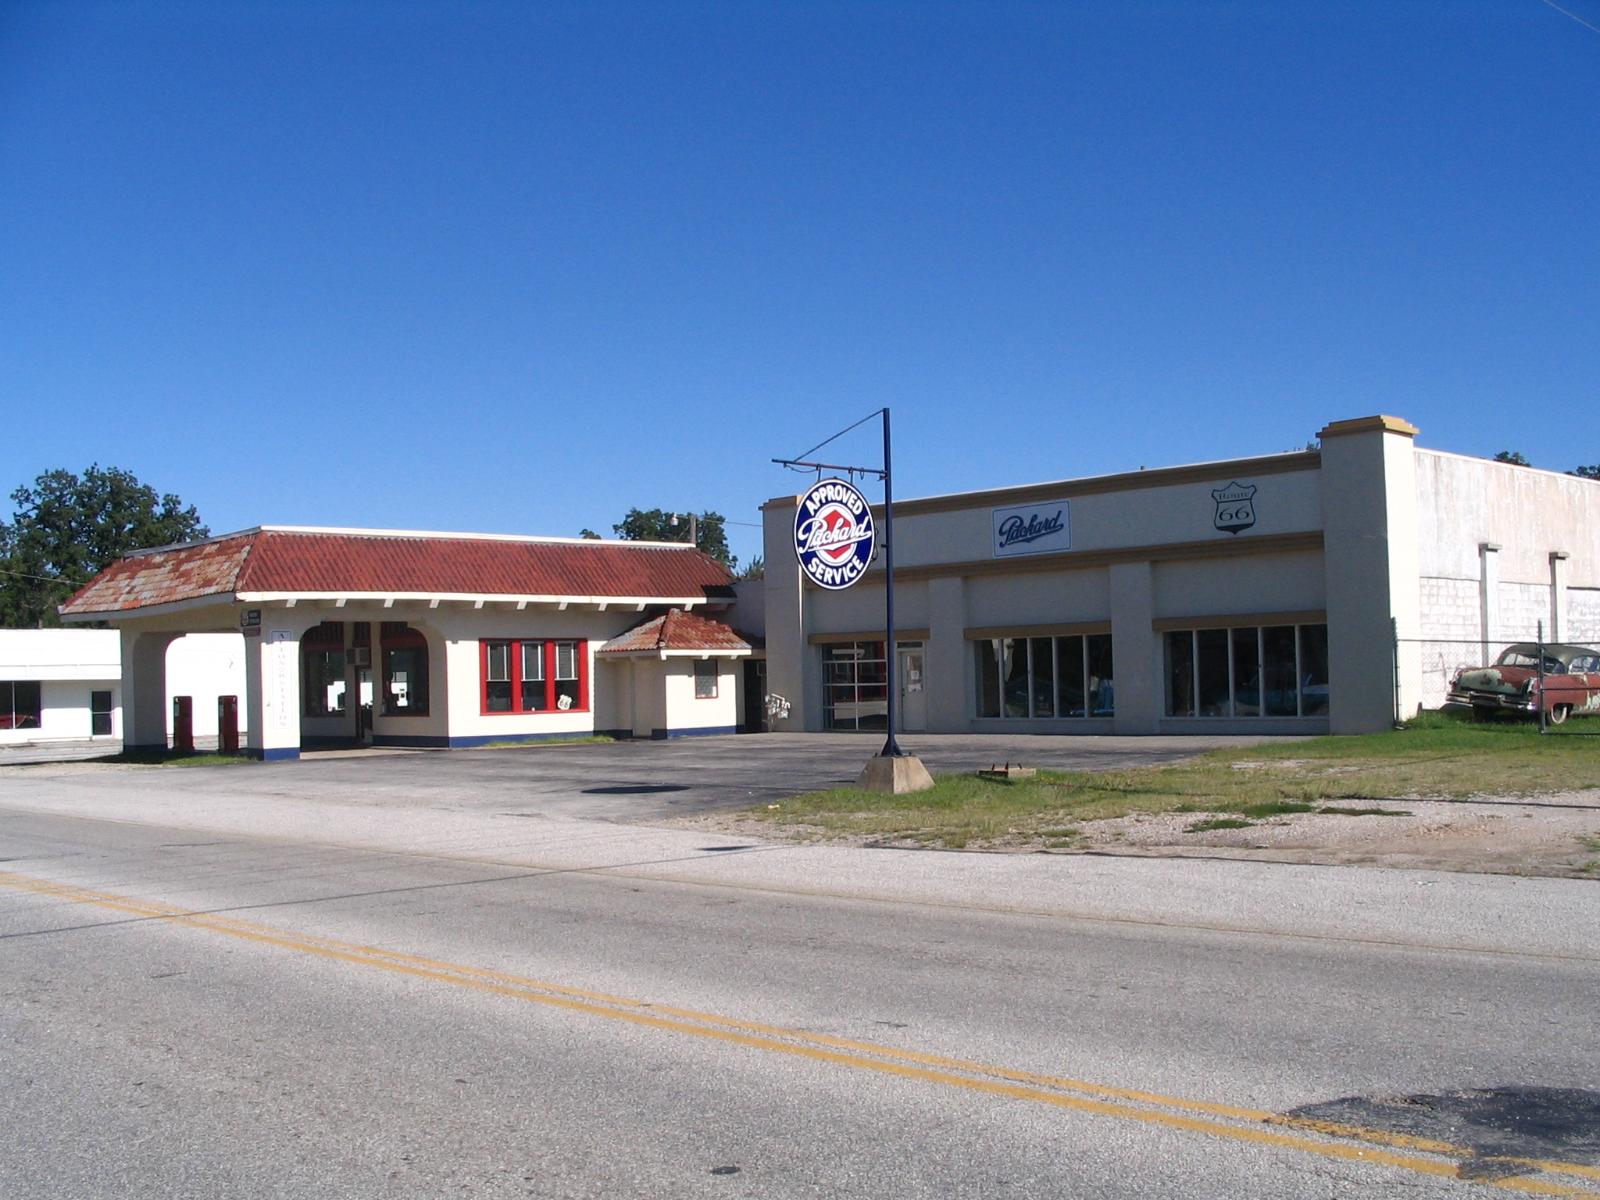
5. Jones, OK — Home Prices Rose +124.9% from 2010 to 2025
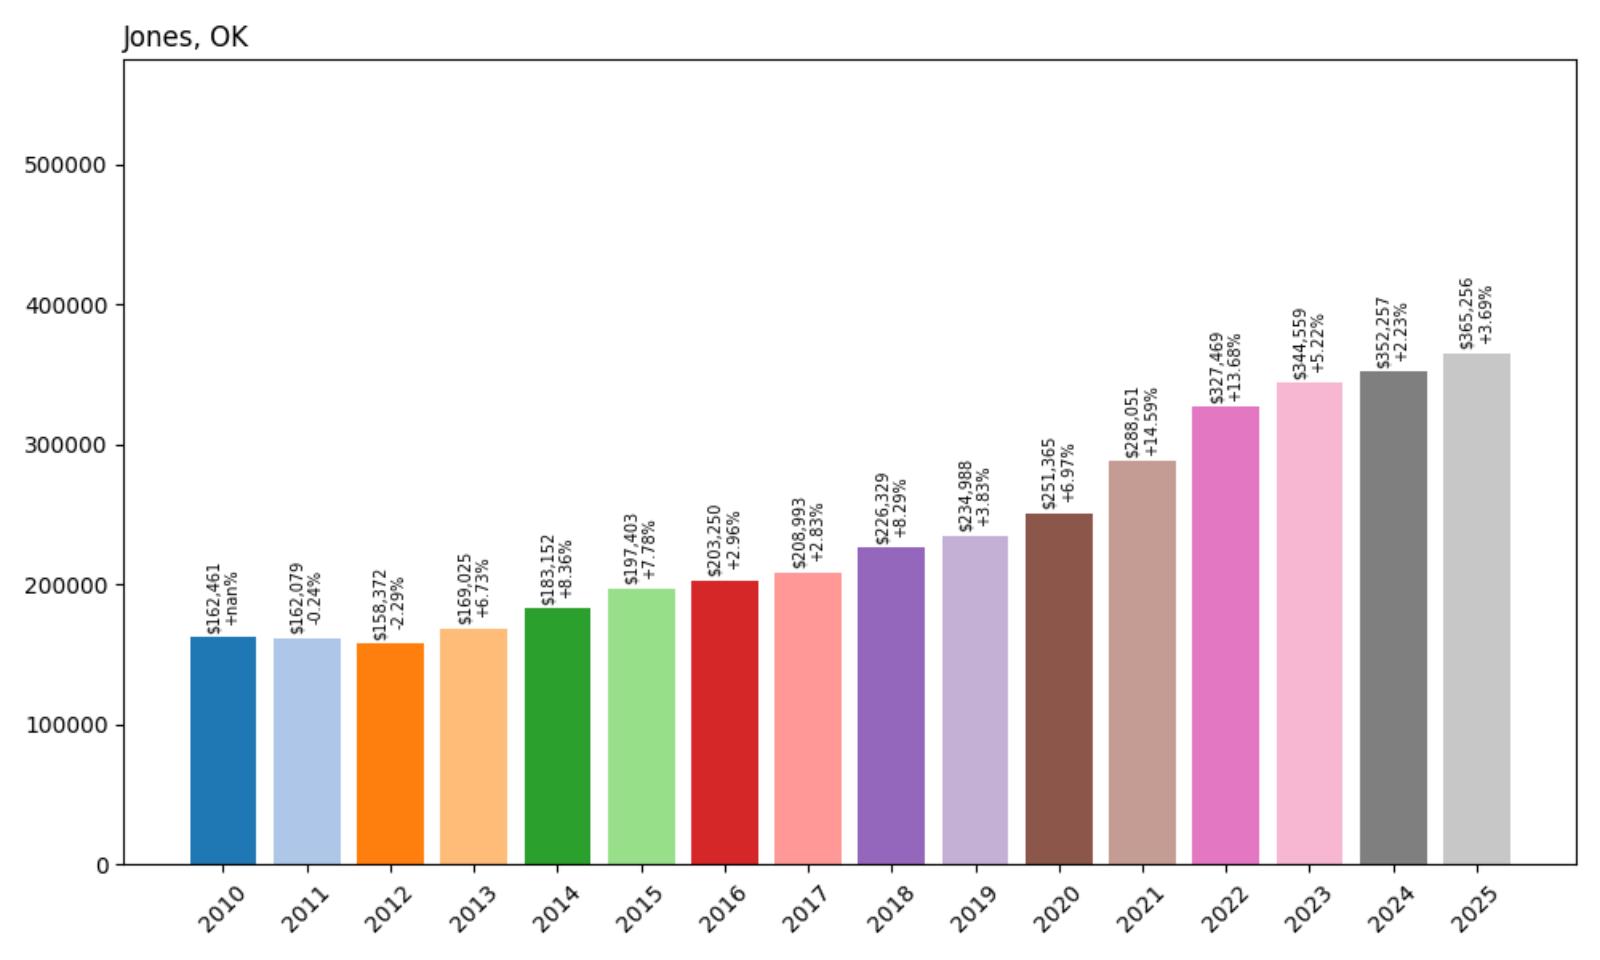
- 2010: $162,461
- 2011: $162,079 (−$382, −0.24% from previous year)
- 2012: $158,372 (−$3,707, −2.29% from previous year)
- 2013: $169,025 (+$10,653, +6.73% from previous year)
- 2014: $183,152 (+$14,127, +8.36% from previous year)
- 2015: $197,403 (+$14,251, +7.78% from previous year)
- 2016: $203,250 (+$5,846, +2.96% from previous year)
- 2017: $208,993 (+$5,744, +2.83% from previous year)
- 2018: $226,329 (+$17,335, +8.29% from previous year)
- 2019: $234,988 (+$8,660, +3.83% from previous year)
- 2020: $251,365 (+$16,377, +6.97% from previous year)
- 2021: $288,051 (+$36,685, +14.59% from previous year)
- 2022: $327,469 (+$39,419, +13.68% from previous year)
- 2023: $344,559 (+$17,090, +5.22% from previous year)
- 2024: $352,257 (+$7,698, +2.23% from previous year)
- 2025: $365,256 (+$12,999, +3.69% from previous year)
From $162,461 in 2010 to $365,256 in 2025, home values in Jones have risen by nearly +125%, reflecting one of the strongest growth trends among Oklahoma towns in its price tier. The early 2010s brought modest price corrections, but the town quickly rebounded with steady annual increases. The largest surges came in the early 2020s, particularly from 2020 through 2022 when prices jumped more than $75,000 over just two years.
Jones — Rural Proximity to Oklahoma City Drives Growth
Jones’ rapid appreciation can be attributed to its unique position just east of Oklahoma City — far enough to retain a peaceful, rural character, yet close enough to benefit from metro-area economic growth. This balance makes it an attractive destination for commuters, retirees, and buyers seeking larger lots or small-acreage properties. The pandemic-era migration toward more spacious living only amplified this appeal, spurring new builds and upward pressure on prices.
Additionally, Jones has seen incremental improvements in infrastructure and public amenities, making it increasingly viable as a long-term residence rather than just a rural outpost. While prices have stabilized slightly since 2023, the town’s desirability continues to grow thanks to low crime rates, access to green space, and strong community values. As urban sprawl continues eastward, Jones is likely to see continued, though more measured, appreciation in the coming years.
4. Cedar Valley, OK — Home Prices Rose +84.1% from 2010 to 2025
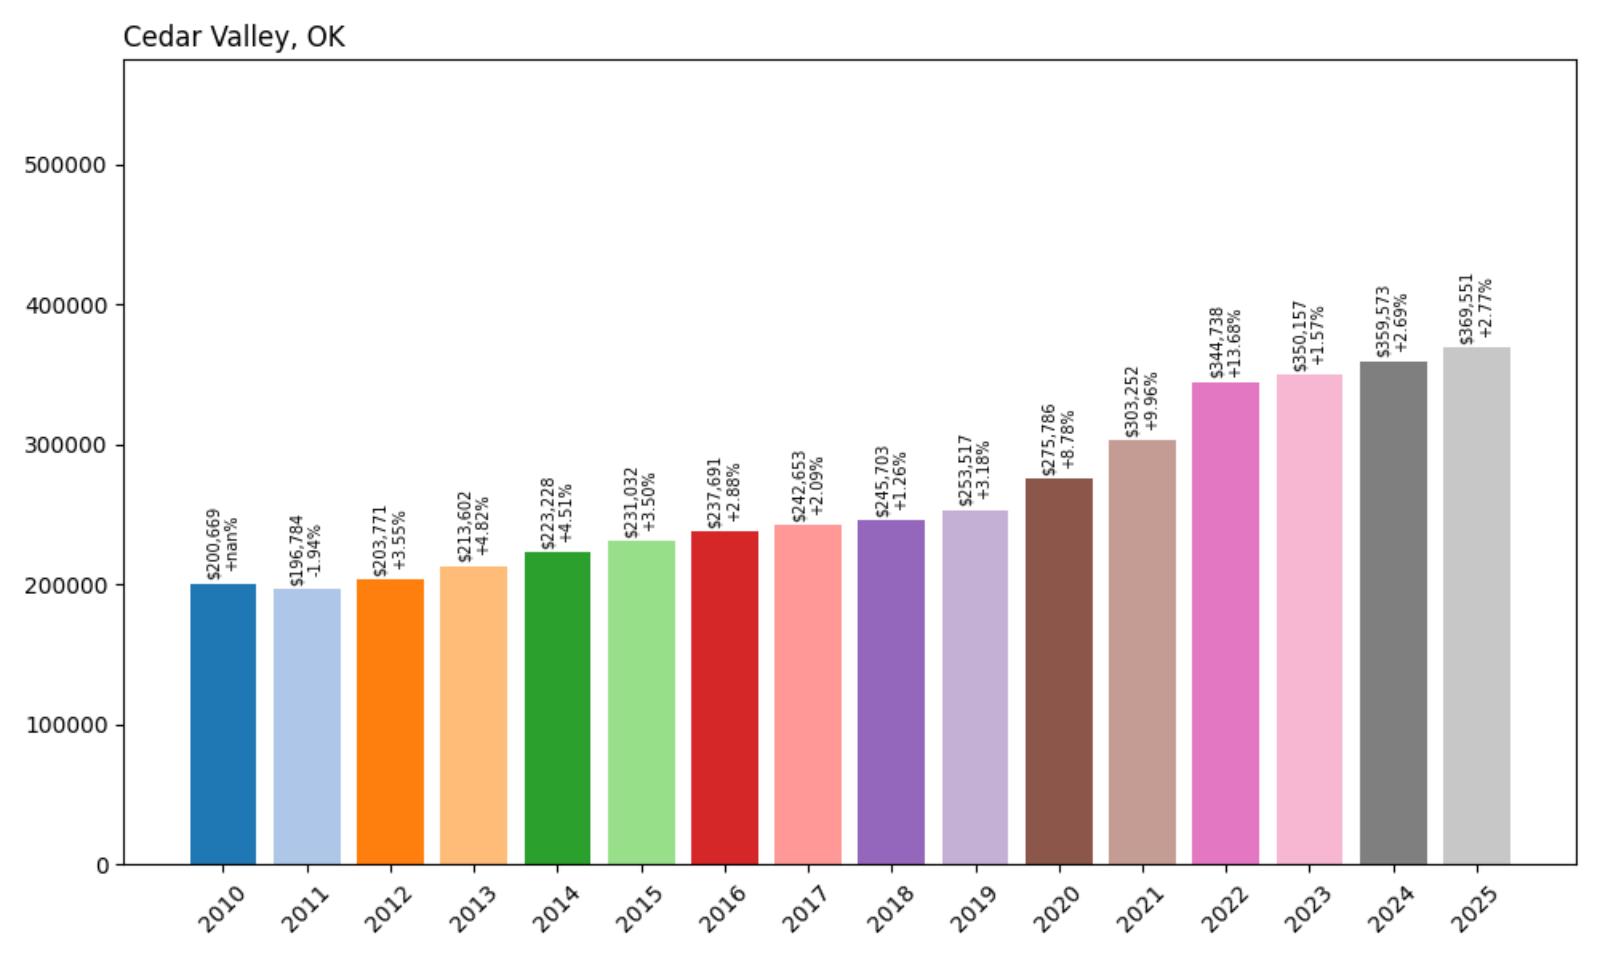
- 2010: $200,669
- 2011: $196,784 (−$3,885, −1.94% from previous year)
- 2012: $203,771 (+$6,987, +3.55% from previous year)
- 2013: $213,602 (+$9,832, +4.82% from previous year)
- 2014: $223,228 (+$9,625, +4.51% from previous year)
- 2015: $231,032 (+$7,804, +3.50% from previous year)
- 2016: $237,691 (+$6,660, +2.88% from previous year)
- 2017: $242,653 (+$4,961, +2.09% from previous year)
- 2018: $245,703 (+$3,051, +1.26% from previous year)
- 2019: $253,517 (+$7,814, +3.18% from previous year)
- 2020: $275,786 (+$22,269, +8.78% from previous year)
- 2021: $303,252 (+$27,466, +9.96% from previous year)
- 2022: $344,738 (+$41,485, +13.68% from previous year)
- 2023: $350,157 (+$5,419, +1.57% from previous year)
- 2024: $359,573 (+$9,417, +2.69% from previous year)
- 2025: $369,551 (+$9,978, +2.77% from previous year)
Cedar Valley saw its average home value grow from $200,669 in 2010 to $369,551 in 2025 — an impressive increase of +84.1%. While early growth was relatively stable, the town experienced significant appreciation beginning in 2020, with consecutive years of double-digit percentage gains. Price increases peaked in 2022, driven by shifting buyer preferences toward low-density, high-amenity suburbs during the pandemic housing boom.
Cedar Valley — Golf-Centric Living Meets Suburban Expansion
Nestled in Logan County, Cedar Valley is best known for its golf-centric layout and spacious rural ambiance. The town has built its identity around the Cedar Valley Golf Club and adjacent residential developments, which attract retirees and working professionals seeking quiet surroundings without sacrificing access to Edmond or Oklahoma City. As suburban development continues to push northward, Cedar Valley’s premium on privacy and green space has translated into rising property values.
The area’s infrastructure has also improved, with better road connectivity and access to nearby schools and shopping. Unlike more densely built suburbs, Cedar Valley offers expansive homesites and a community feel that resonates with buyers looking for lifestyle upgrades. Its home price trajectory reflects both organic demand and limited housing stock, suggesting that barring a market correction, Cedar Valley is likely to remain one of Oklahoma’s higher-end small towns for the foreseeable future.
3. Goldsby, OK — Home Prices Rose +109.3% from 2010 to 2025
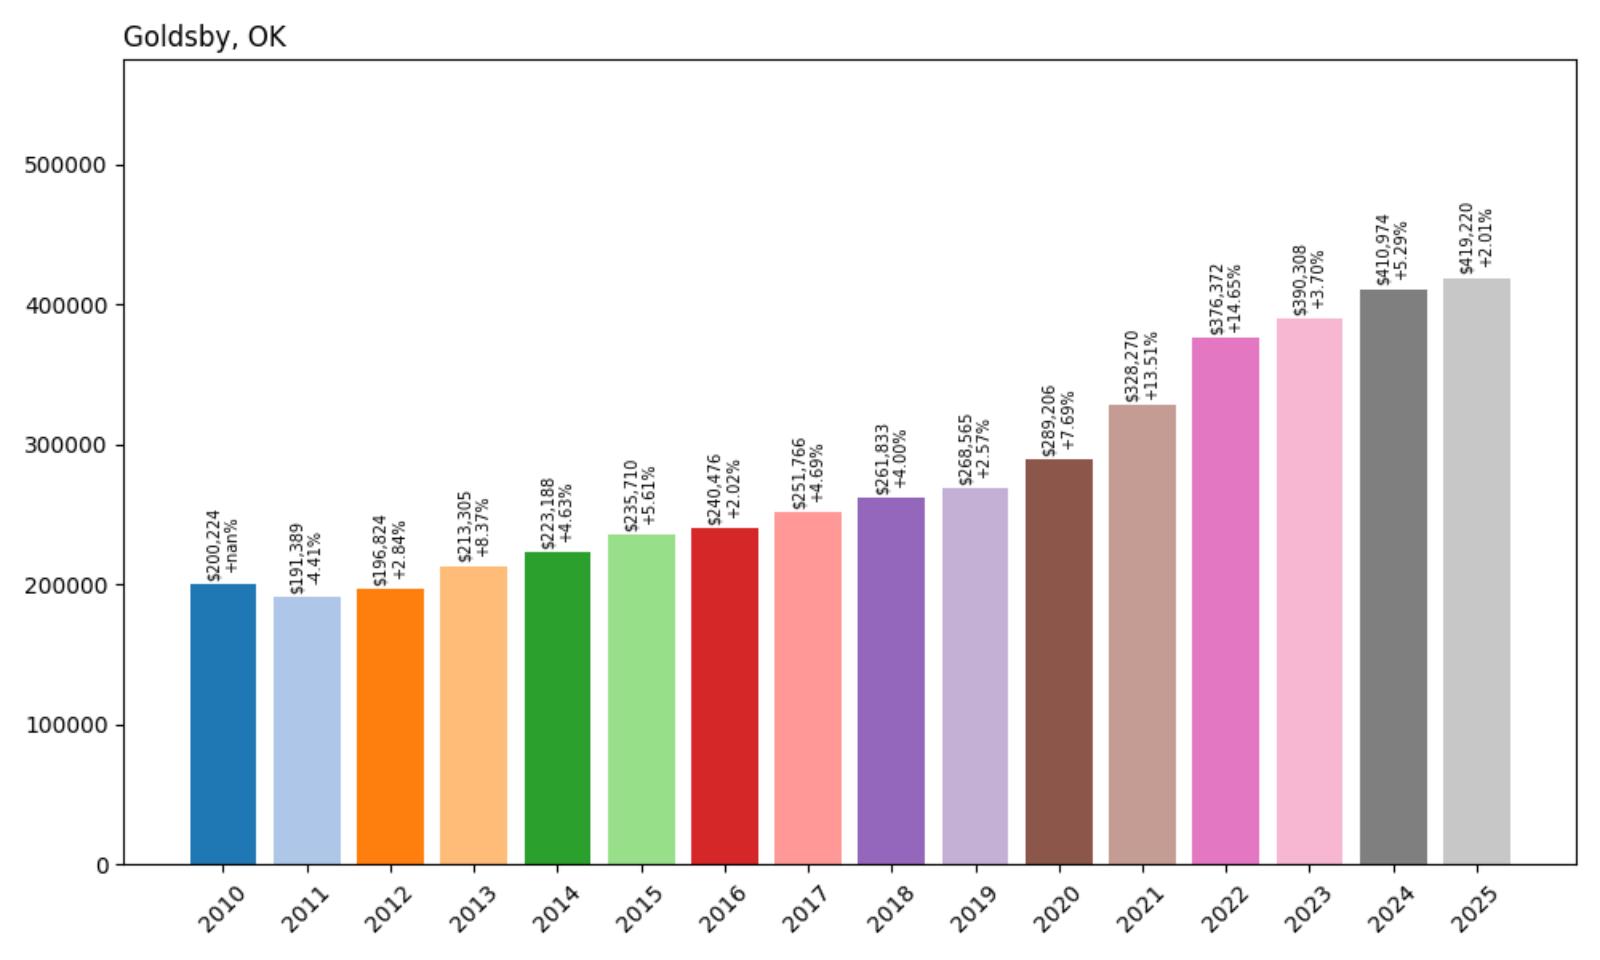
- 2010: $200,224
- 2011: $191,389 (−$8,836, −4.41% from previous year)
- 2012: $196,824 (+$5,435, +2.84% from previous year)
- 2013: $213,305 (+$16,481, +8.37% from previous year)
- 2014: $223,188 (+$9,883, +4.63% from previous year)
- 2015: $235,710 (+$12,523, +5.61% from previous year)
- 2016: $240,476 (+$4,765, +2.02% from previous year)
- 2017: $251,766 (+$11,290, +4.69% from previous year)
- 2018: $261,833 (+$10,068, +4.00% from previous year)
- 2019: $268,565 (+$6,732, +2.57% from previous year)
- 2020: $289,206 (+$20,640, +7.69% from previous year)
- 2021: $328,270 (+$39,064, +13.51% from previous year)
- 2022: $376,372 (+$48,102, +14.65% from previous year)
- 2023: $390,308 (+$13,937, +3.70% from previous year)
- 2024: $410,974 (+$20,666, +5.29% from previous year)
- 2025: $419,220 (+$8,247, +2.01% from previous year)
Goldsby experienced a significant rise in property values over the past 15 years, with average home prices more than doubling from $200,224 in 2010 to $419,220 in 2025 — a +109.3% increase. The pace of appreciation accelerated notably during the 2020–2022 period, when remote work trends and a surge in demand for rural-suburban hybrids pushed prices sharply higher. Although growth has moderated recently, the town’s upward momentum remains strong.
Goldsby — Rural Charm with Big Accessibility
Goldsby offers a compelling mix of rural atmosphere and metropolitan convenience. Located in McClain County just south of Norman, it has become a top choice for buyers seeking space, privacy, and proximity to I-35. This has attracted a broad demographic ranging from professionals working in Oklahoma City to families wanting to escape city congestion without losing access to amenities. Goldsby’s development has been steady but intentional, preserving its open feel while embracing gradual residential expansion.
The town’s substantial increase in home values also reflects its growing reputation as a high-quality residential zone. Properties here often come with larger lots and newer construction, giving buyers more for their money compared to older urban neighborhoods. Recent price stability in 2023 and 2024 signals a shift toward equilibrium, but with ongoing interest from both local and out-of-state buyers, Goldsby continues to command premium valuations for its unique blend of space and access.
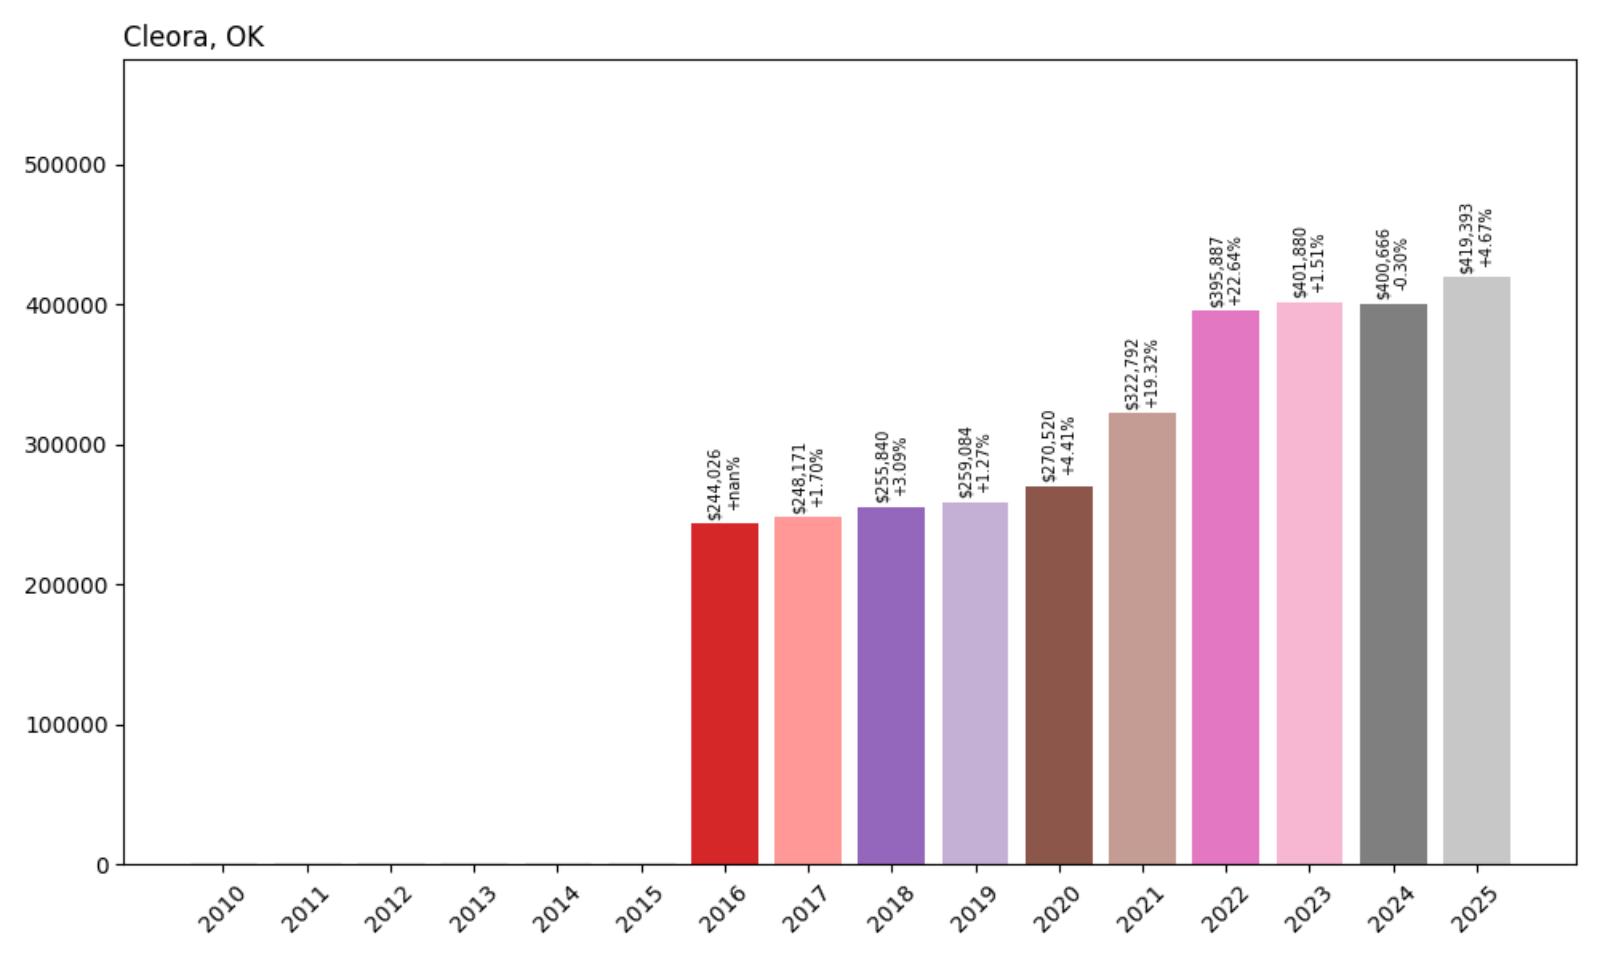
2. Cleora, OK — Home Prices Rose +71.8% from 2016 to 2025
- 2010: N/A
- 2011: N/A
- 2012: N/A
- 2013: N/A
- 2014: N/A
- 2015: N/A
- 2016: $244,026
- 2017: $248,171 (+$4,145, +1.70% from previous year)
- 2018: $255,840 (+$7,669, +3.09% from previous year)
- 2019: $259,084 (+$3,243, +1.27% from previous year)
- 2020: $270,520 (+$11,436, +4.41% from previous year)
- 2021: $322,792 (+$52,273, +19.32% from previous year)
- 2022: $395,887 (+$73,095, +22.64% from previous year)
- 2023: $401,880 (+$5,992, +1.51% from previous year)
- 2024: $400,666 (−$1,213, −0.30% from previous year)
- 2025: $419,393 (+$18,727, +4.67% from previous year)
Since 2016, Cleora’s home values have jumped from $244,026 to $419,393 — an impressive +71.8% increase over nine years. The most aggressive gains occurred between 2020 and 2022, where price jumps of over 19% and 22% respectively pushed the town into the upper echelon of Oklahoma’s most expensive housing markets. Though there was a minor dip in 2024, the rebound in 2025 reaffirmed the strength of long-term demand in the area.
Cleora — Grand Lake’s Hidden Real Estate Gem
Situated on the northeastern edge of Grand Lake O’ the Cherokees, Cleora blends lakefront tranquility with upscale appeal. This unincorporated community in Delaware County has long been a favorite for second-home buyers, retirees, and vacationers drawn to the area’s natural beauty. The dramatic price rise during the early 2020s was driven by pandemic-era buyers seeking remote, scenic locales — and Cleora delivered in spades with its spacious lots, water access, and relative privacy. Many of the homes here are custom-built or luxury-adjacent, often commanding premium prices due to lake frontage or panoramic views.
Unlike many Oklahoma towns, Cleora’s real estate market is closely tied to seasonal tourism and out-of-town demand. The area’s limited inventory has kept supply tight, contributing to the rapid appreciation seen in the Zillow Home Value Index during the 2021–2022 surge. While 2023 and 2024 saw a plateau, the 2025 uptick reflects sustained interest in lakeside living. As Grand Lake continues to grow in popularity for recreation and investment, Cleora’s position as a premium destination — with high resale potential and natural charm — is likely to hold strong.
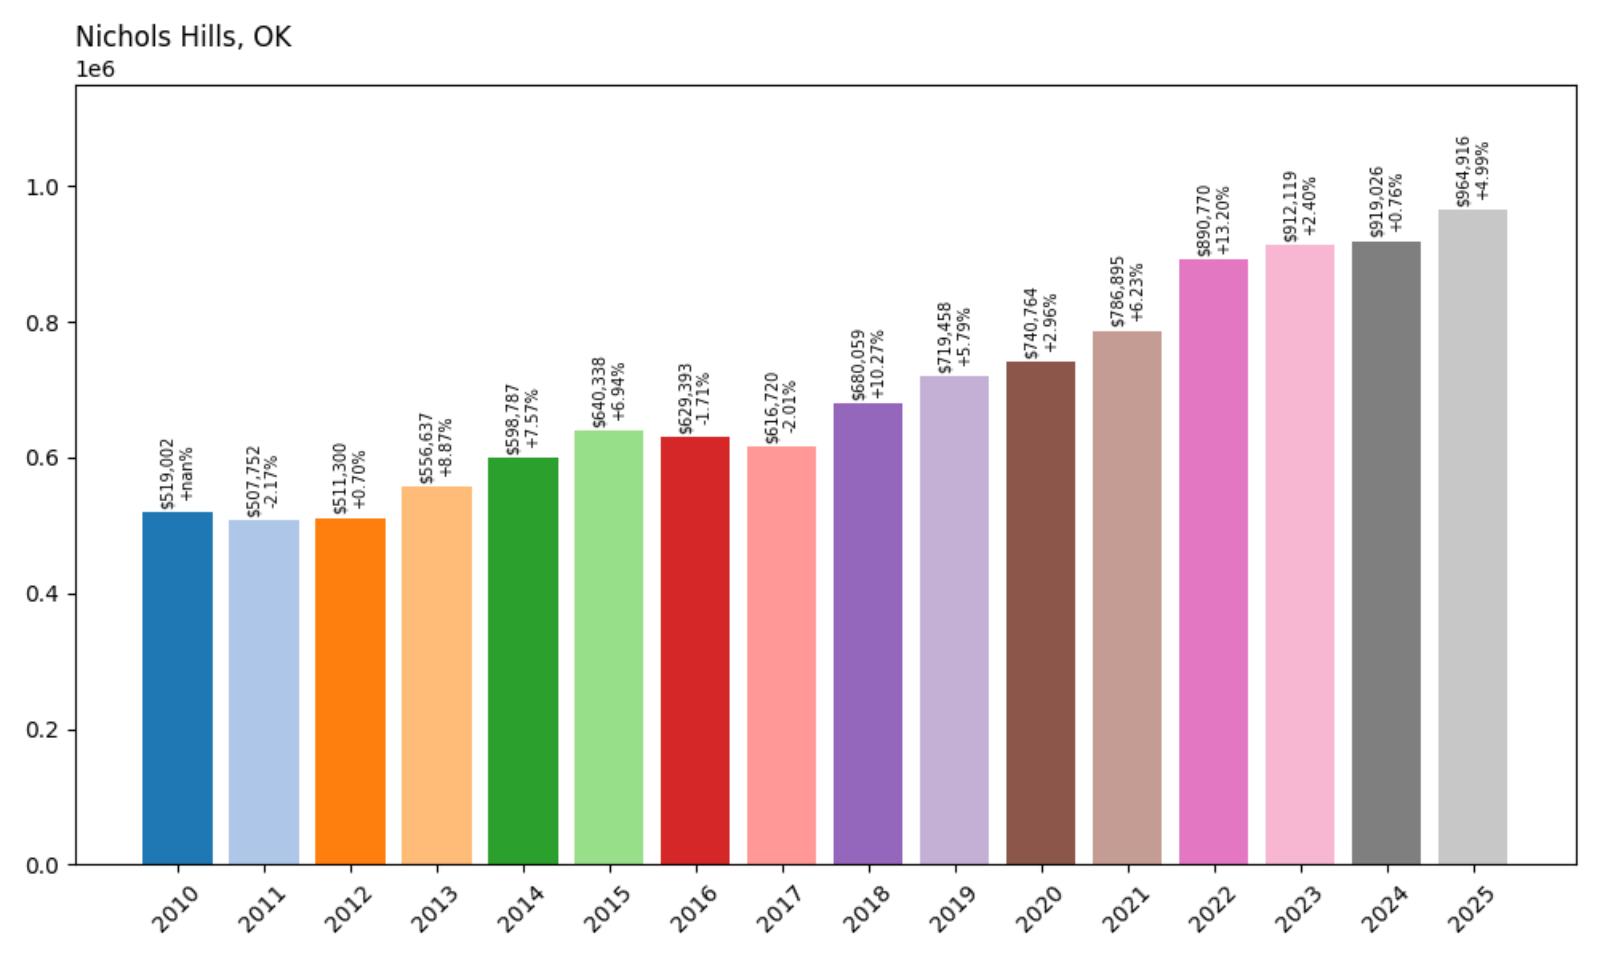
1. Nichols Hills, OK — Home Prices Rose +85.9% from 2010 to 2025
- 2010: $519,002
- 2011: $507,752 (−$11,250, −2.17% from previous year)
- 2012: $511,300 (+$3,547, +0.70% from previous year)
- 2013: $556,637 (+$45,337, +8.87% from previous year)
- 2014: $598,787 (+$42,150, +7.57% from previous year)
- 2015: $640,338 (+$41,551, +6.94% from previous year)
- 2016: $629,393 (−$10,945, −1.71% from previous year)
- 2017: $616,720 (−$12,673, −2.01% from previous year)
- 2018: $680,059 (+$63,339, +10.27% from previous year)
- 2019: $719,458 (+$39,399, +5.79% from previous year)
- 2020: $740,764 (+$21,306, +2.96% from previous year)
- 2021: $786,895 (+$46,131, +6.23% from previous year)
- 2022: $890,770 (+$103,876, +13.20% from previous year)
- 2023: $912,119 (+$21,349, +2.40% from previous year)
- 2024: $919,026 (+$6,906, +0.76% from previous year)
- 2025: $964,916 (+$45,891, +4.99% from previous year)
Nichols Hills tops the list as the most expensive housing market in Oklahoma, with prices skyrocketing from $519,002 in 2010 to $964,916 in 2025 — a commanding +85.9% rise. Though the town experienced a few mild dips between 2015 and 2017, its premium real estate market rebounded with strength, especially between 2018 and 2022. The triple-digit price surge in 2022 alone (+$103,876) was one of the highest year-over-year gains across the entire state.
Nichols Hills — Oklahoma’s Luxury Real Estate Capital
Located just northwest of Oklahoma City, Nichols Hills is synonymous with wealth, prestige, and exclusivity. The town was master-planned in the early 20th century and has retained its upscale character through zoning laws, manicured landscaping, and architectural distinction. Home to some of the state’s wealthiest residents, the community boasts high-end boutiques, luxury spas, and tree-lined streets filled with historic mansions and designer homes. The market here has proven resilient across economic cycles, largely due to a constant demand for elite, centrally located real estate near the city’s economic hubs.
Zillow’s data shows that even during years of modest statewide growth, Nichols Hills maintained high valuation levels, buoyed by prestige and limited inventory. Its steady performance in the post-pandemic housing boom is a testament to its enduring appeal. High property taxes and luxury pricing haven’t slowed interest — if anything, they’ve become status markers for affluent buyers. As Oklahoma’s broader housing market matures, Nichols Hills is expected to remain a beacon of stability and distinction, offering investment-grade returns alongside one of the most desirable lifestyles in the state.


