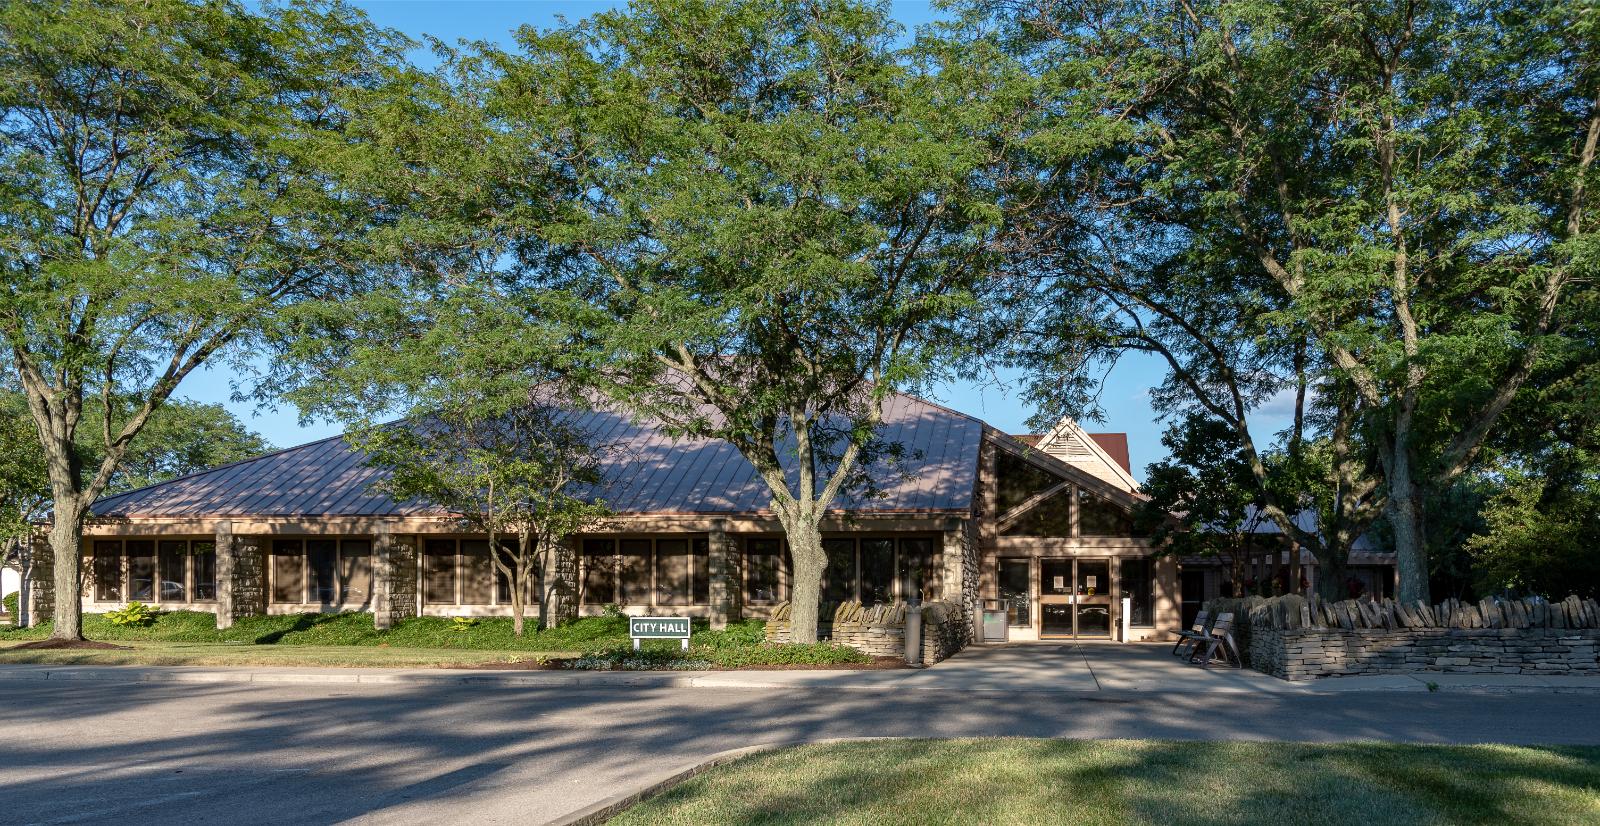
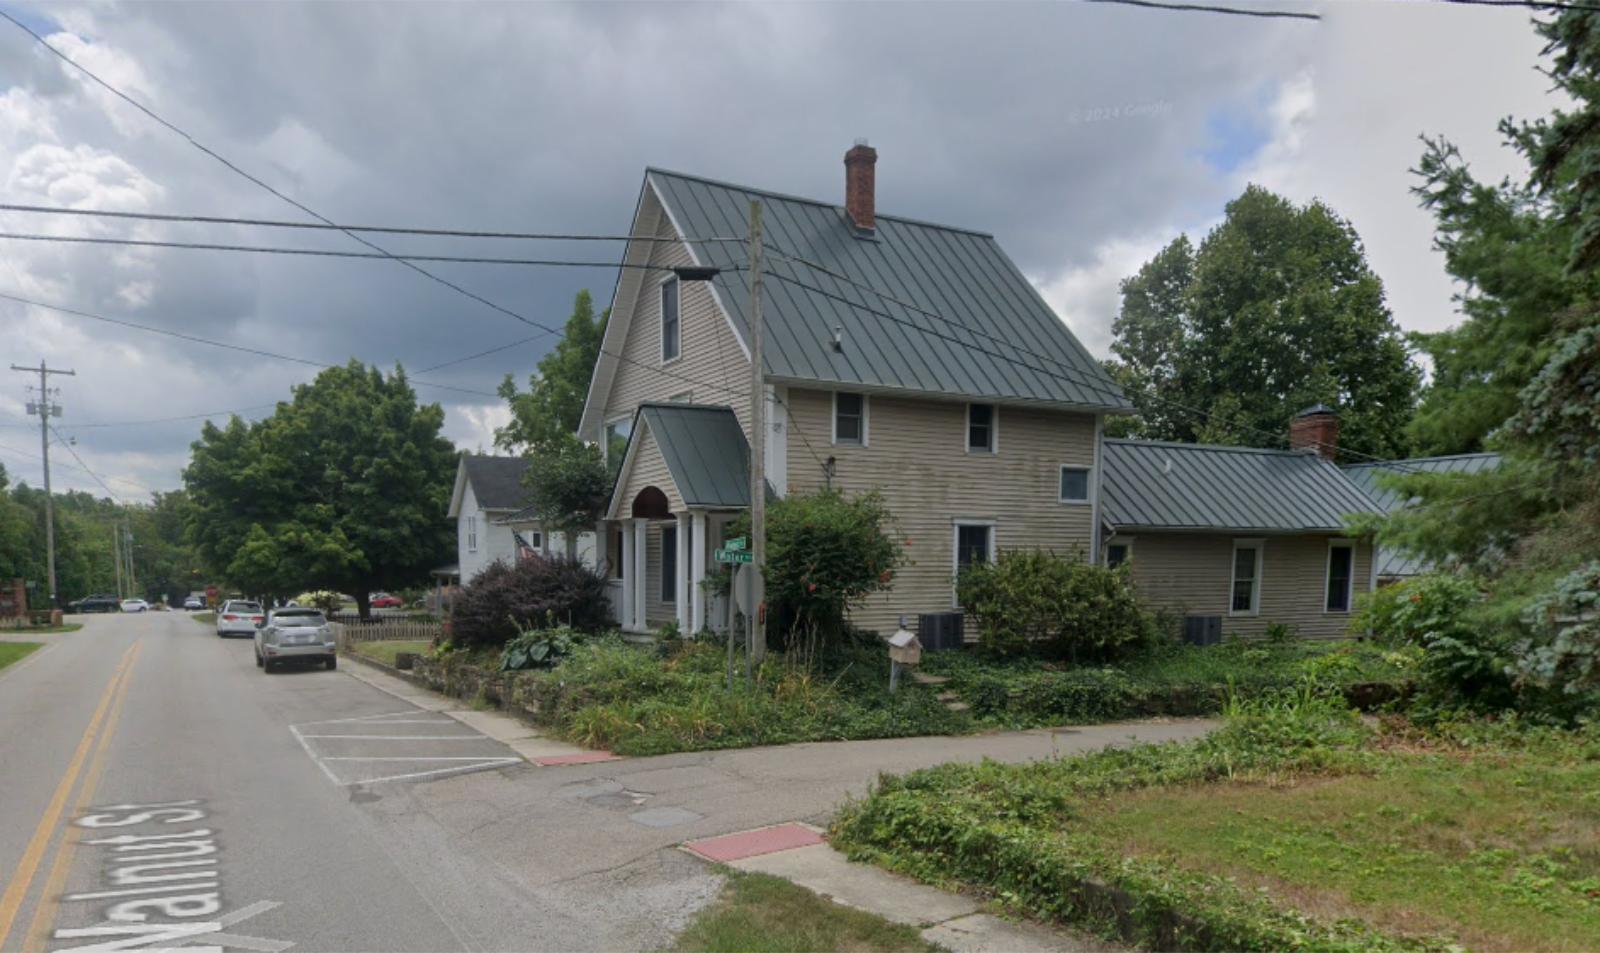
Think Ohio’s all affordable homes and quiet suburbs? Not anymore. The Zillow Home Value Index shows 31 towns across the Buckeye State where property prices now push past half a million—and in some cases, much higher. From upscale suburbs to hidden enclaves near Cleveland and Cincinnati, these towns prove that Ohio’s top-tier housing market isn’t holding back. Whether prices climbed steadily over the past decade or spiked during the pandemic years, these are the places where homebuyers now need deep pockets just to get a key.
31. Mason – 103% Home Price Increase Since 2011
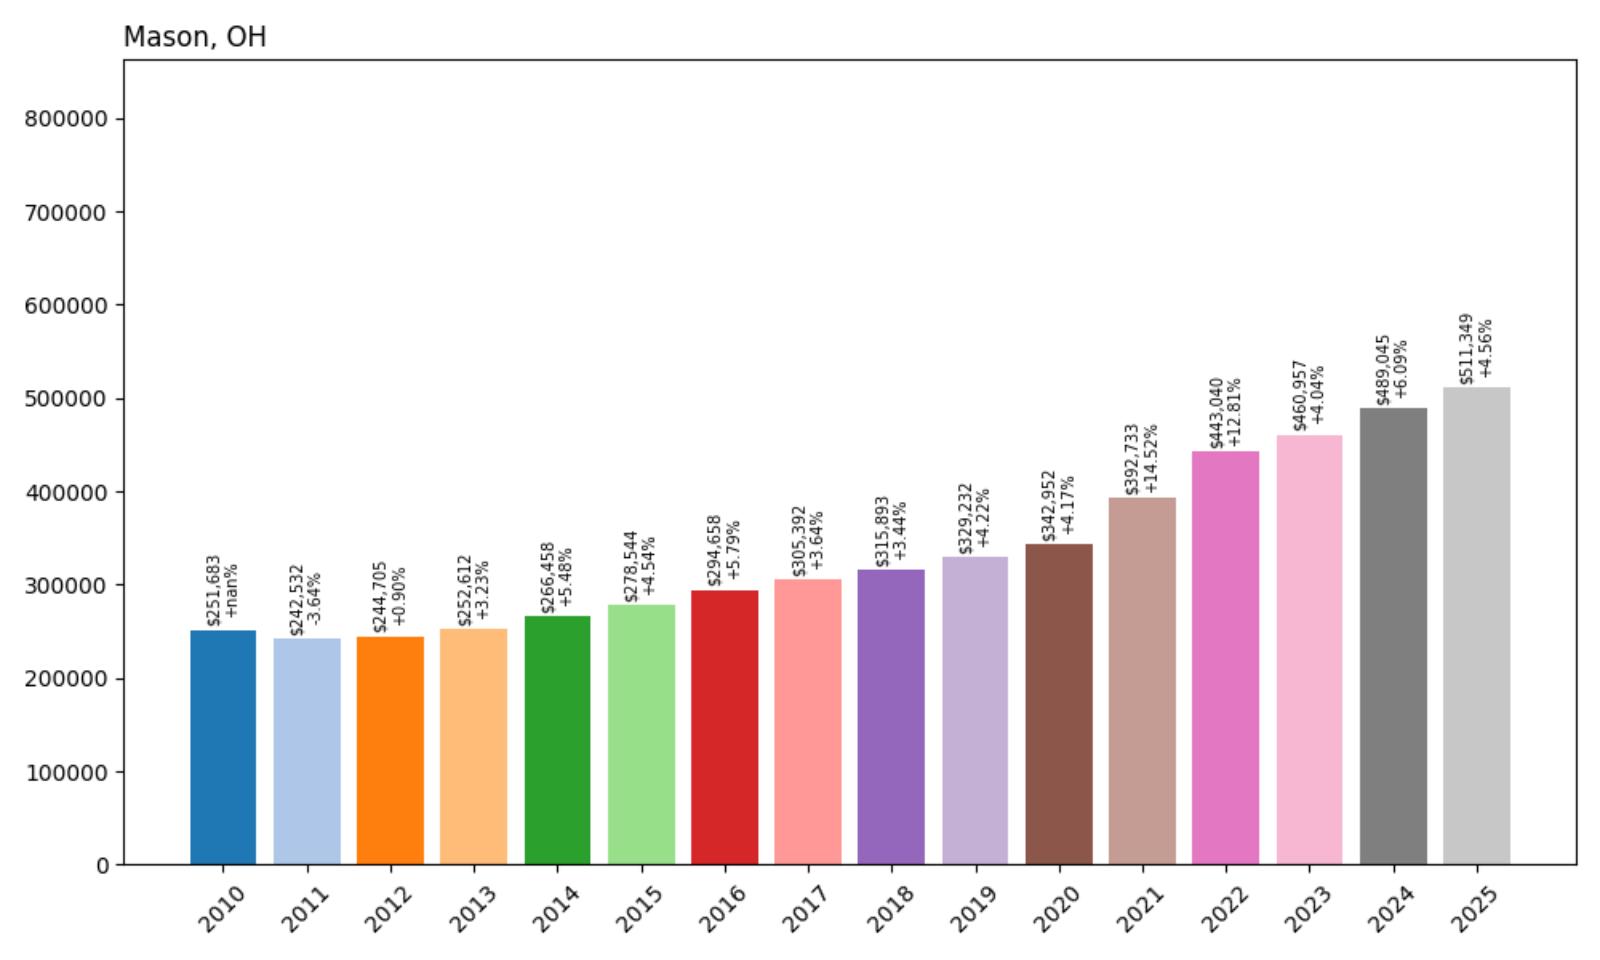
- 2010: $251,683
- 2011: $242,532 (−$9,151, −3.64% from previous year)
- 2012: $244,705 (+$2,172, +0.90% from previous year)
- 2013: $252,612 (+$7,907, +3.23% from previous year)
- 2014: $266,458 (+$13,847, +5.48% from previous year)
- 2015: $278,544 (+$12,085, +4.54% from previous year)
- 2016: $294,658 (+$16,114, +5.79% from previous year)
- 2017: $305,392 (+$10,734, +3.64% from previous year)
- 2018: $315,893 (+$10,500, +3.44% from previous year)
- 2019: $329,232 (+$13,339, +4.22% from previous year)
- 2020: $342,952 (+$13,720, +4.17% from previous year)
- 2021: $392,733 (+$49,781, +14.52% from previous year)
- 2022: $443,040 (+$50,307, +12.81% from previous year)
- 2023: $460,957 (+$17,917, +4.04% from previous year)
- 2024: $489,045 (+$28,088, +6.09% from previous year)
- 2025: $511,349 (+$22,304, +4.56% from previous year)
Home prices in Mason have more than doubled since 2011, climbing from $242,532 to $511,349 in just 14 years. The town experienced steady annual increases through the 2010s, with a major boost during the 2021–2022 period when prices jumped by over $100,000 in just two years. Growth has slowed in recent years but remained healthy, with modest but consistent increases leading up to 2025. Mason’s housing market reflects both long-term demand and a brief surge driven by broader market conditions during the post-pandemic years.
Mason – Suburban Stability Meets Steady Demand
Mason is one of southwest Ohio’s most sought-after suburbs, located about 25 miles north of downtown Cincinnati. Known for its top-rated schools and family-friendly neighborhoods, the city has long been a magnet for homebuyers seeking suburban comfort with easy metro access. Large employers like Procter & Gamble and Kings Island also contribute to a stable economic base, supporting housing demand across economic cycles. The town’s parks, low crime rate, and active community life have made it a consistent favorite for relocation, contributing to its long-term price growth.
What sets Mason apart is its combination of growth without volatility. While some Ohio towns saw erratic spikes, Mason’s climb has been methodical. The biggest gains came in 2021 and 2022, when many suburban areas across the country surged due to remote work trends and record-low interest rates. Since then, the market has cooled but not contracted. With prices now averaging above $500,000, Mason offers a case study in how suburban infrastructure and public amenities can underpin long-term real estate value.
30. Sugarcreek – 78% Home Price Increase Since 2011

- 2010: $287,759
- 2011: $277,017 (−$10,742, −3.73% from previous year)
- 2012: $283,300 (+$6,283, +2.27% from previous year)
- 2013: $295,275 (+$11,975, +4.23% from previous year)
- 2014: $305,002 (+$9,727, +3.29% from previous year)
- 2015: $313,709 (+$8,707, +2.85% from previous year)
- 2016: $322,434 (+$8,725, +2.78% from previous year)
- 2017: $331,233 (+$8,799, +2.73% from previous year)
- 2018: $345,648 (+$14,415, +4.35% from previous year)
- 2019: $360,509 (+$14,862, +4.30% from previous year)
- 2020: $374,434 (+$13,925, +3.86% from previous year)
- 2021: $421,266 (+$46,831, +12.51% from previous year)
- 2022: $465,089 (+$43,823, +10.40% from previous year)
- 2023: $477,936 (+$12,847, +2.76% from previous year)
- 2024: $496,752 (+$18,815, +3.94% from previous year)
- 2025: $513,033 (+$16,281, +3.28% from previous year)
Sugarcreek’s housing market has seen a steady upward trend, with home prices increasing 78% from $277,017 in 2011 to $513,033 in 2025. Growth during the 2010s was gradual, with low single-digit gains year after year. A noticeable acceleration occurred in 2021 and 2022, coinciding with a statewide housing boom. Since then, appreciation has returned to slower rates, though prices continue to climb modestly each year. This long-term resilience makes Sugarcreek one of Ohio’s more stable upscale markets.
Sugarcreek – Amish Country Meets Market Growth
Located in Tuscarawas County, Sugarcreek is often called the “Little Switzerland of Ohio,” known for its blend of Amish heritage and scenic charm. The area’s tourism appeal, traditional craftsmanship, and local manufacturing base have supported consistent population retention and modest economic expansion. While not a fast-growth metro suburb, Sugarcreek attracts buyers seeking peaceful surroundings, custom homes, and larger plots—all factors that support stable long-term value.
Its real estate profile reflects that blend of appeal and stability. Most of the market activity centers around single-family homes, often owner-built or custom-constructed. There hasn’t been an explosion in new development, which has helped prevent oversupply and protect property values. As urban buyers look for quieter, character-rich towns with good infrastructure, Sugarcreek has emerged as a niche but dependable housing market with prices comfortably clearing the $500K threshold in 2025.
29. Boston Heights – 76% Home Price Increase Since 2012

- 2010: $300,357
- 2011: $297,028 (−$3,329, −1.11% from previous year)
- 2012: $287,278 (−$9,750, −3.28% from previous year)
- 2013: $298,686 (+$11,408, +3.97% from previous year)
- 2014: $314,604 (+$15,918, +5.33% from previous year)
- 2015: $324,195 (+$9,591, +3.05% from previous year)
- 2016: $333,648 (+$9,452, +2.92% from previous year)
- 2017: $347,363 (+$13,716, +4.11% from previous year)
- 2018: $363,326 (+$15,963, +4.60% from previous year)
- 2019: $373,177 (+$9,850, +2.71% from previous year)
- 2020: $380,888 (+$7,712, +2.07% from previous year)
- 2021: $429,048 (+$48,159, +12.64% from previous year)
- 2022: $475,100 (+$46,053, +10.73% from previous year)
- 2023: $493,085 (+$17,985, +3.79% from previous year)
- 2024: $505,791 (+$12,706, +2.58% from previous year)
- 2025: $524,486 (+$18,694, +3.70% from previous year)
Boston Heights has seen home prices rise by 76% since its 2012 low of $287,278, reaching $524,486 in 2025. The housing market here has grown gradually and consistently, with a particularly sharp spike between 2020 and 2022. Despite economic fluctuations, prices have stayed on a positive trajectory almost every year since 2013. Current values put Boston Heights among northeast Ohio’s most expensive residential communities.
Boston Heights – A Small Town With Big Appeal
Set along the edge of Cuyahoga Valley National Park, Boston Heights offers a unique combination of rural tranquility and upscale housing. Located between Akron and Cleveland, it appeals to commuters and nature lovers alike. The town has strict zoning laws and limited development, which has helped preserve its green space and kept the real estate market tight. That constraint on supply is part of what’s driven prices up steadily since the mid-2010s.
Despite its small size, Boston Heights attracts high-income buyers looking for seclusion without sacrificing access to urban jobs. Large homes, often on generous lots, are the norm here. The recent price surge from 2020 to 2022 mirrors statewide trends but is also rooted in long-standing demand for the town’s privacy and natural surroundings. Even with slower growth in 2024–2025, prices remain strong, and the long-term trajectory shows no signs of reversal.
28. Montrose-Ghent – 81% Home Price Increase Since 2012
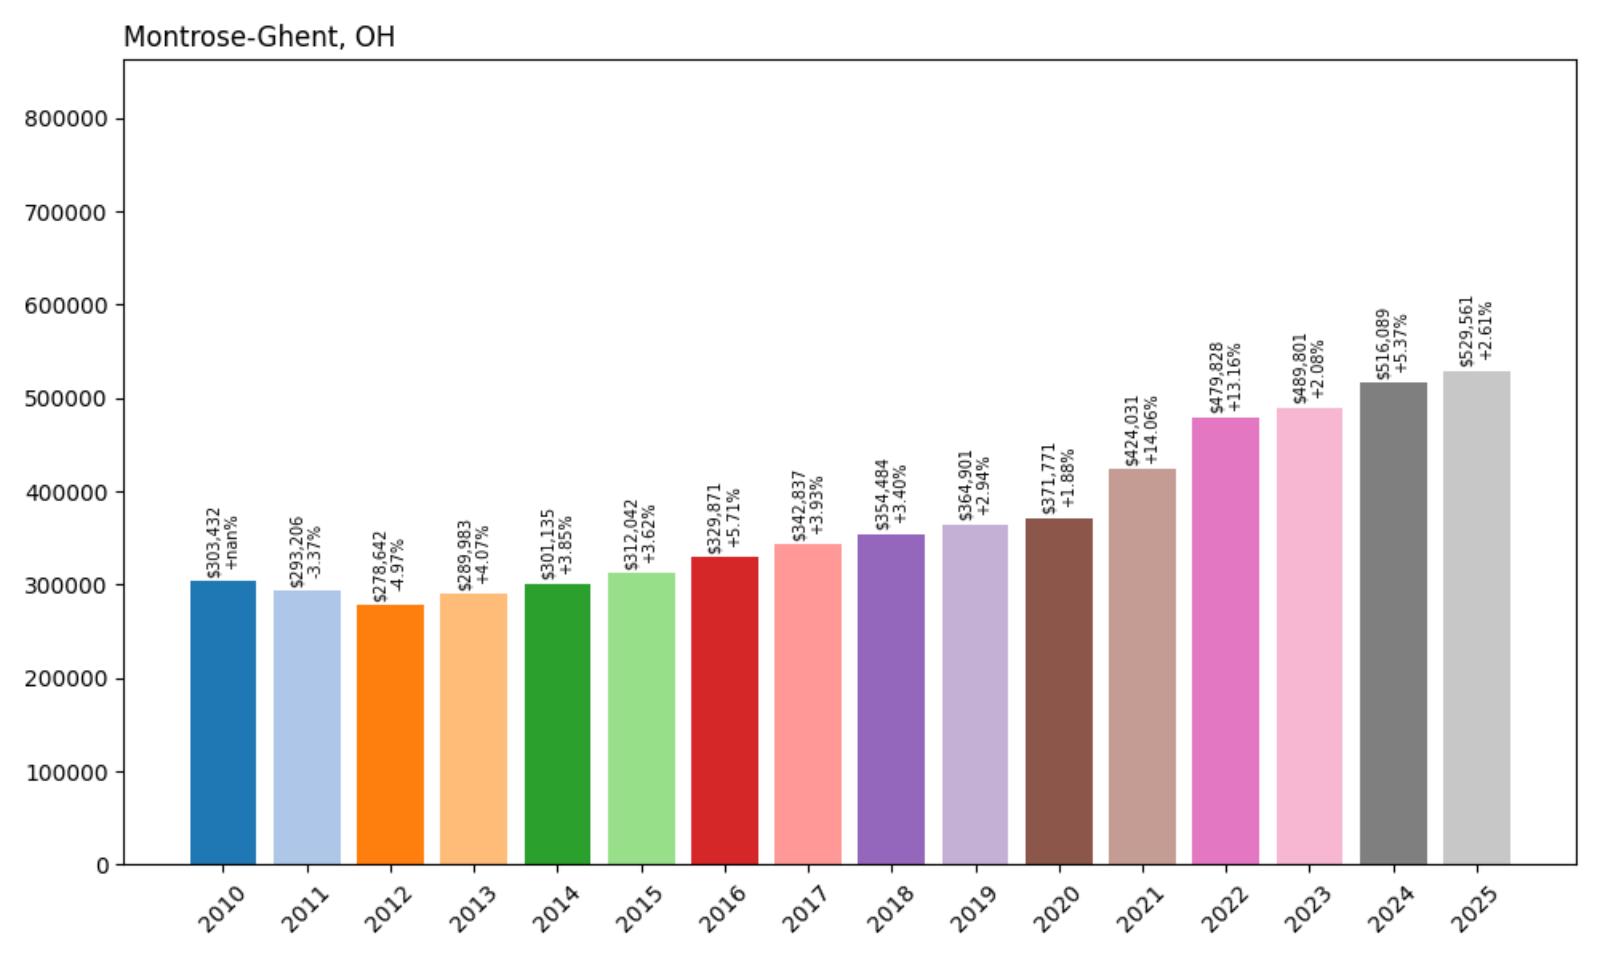
- 2010: $303,432
- 2011: $293,206 (−$10,226, −3.37% from previous year)
- 2012: $278,642 (−$14,565, −4.97% from previous year)
- 2013: $289,983 (+$11,341, +4.07% from previous year)
- 2014: $301,135 (+$11,152, +3.85% from previous year)
- 2015: $312,042 (+$10,907, +3.62% from previous year)
- 2016: $329,871 (+$17,829, +5.71% from previous year)
- 2017: $342,837 (+$12,965, +3.93% from previous year)
- 2018: $354,484 (+$11,647, +3.40% from previous year)
- 2019: $364,901 (+$10,418, +2.94% from previous year)
- 2020: $371,771 (+$6,869, +1.88% from previous year)
- 2021: $424,031 (+$52,260, +14.06% from previous year)
- 2022: $479,828 (+$55,798, +13.16% from previous year)
- 2023: $489,801 (+$9,972, +2.08% from previous year)
- 2024: $516,089 (+$26,289, +5.37% from previous year)
- 2025: $529,561 (+$13,472, +2.61% from previous year)
Montrose-Ghent has seen an 81% rise in home values since 2012, with the average price climbing from $278,642 to $529,561. While the early 2010s showed cautious recovery, the acceleration from 2020 through 2022 was dramatic, with gains over $100,000 in just two years. Since then, the pace has returned to moderate growth, but prices remain well above their pre-pandemic trendline. Montrose-Ghent’s solid economic base and strategic location continue to support its higher-end real estate market.
Montrose-Ghent – Akron’s Upscale Retail Hub
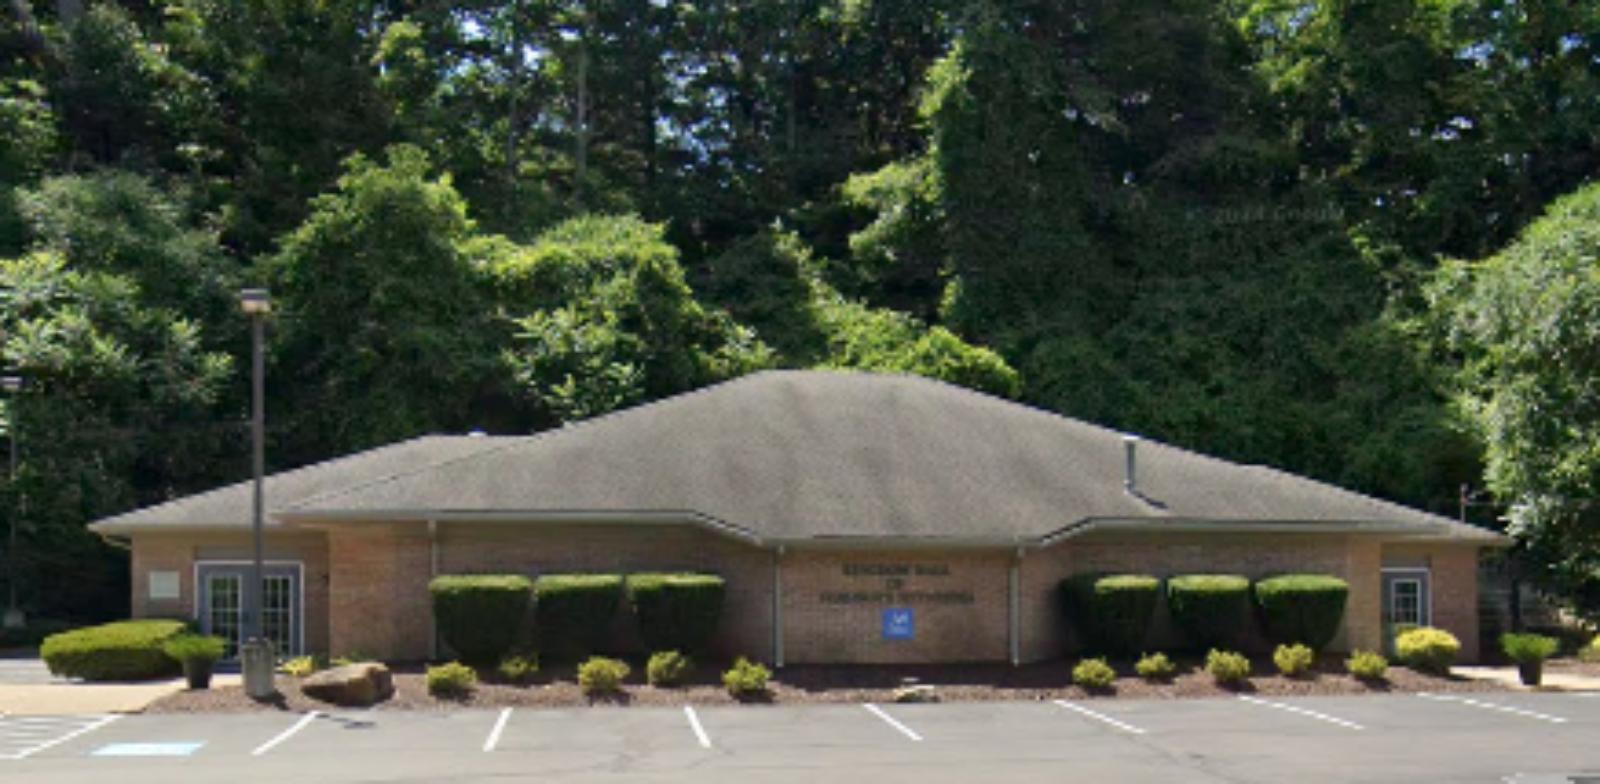
Montrose-Ghent straddles the border of Summit County’s suburban and rural zones and is known for its commercial corridors and stately neighborhoods. As a popular area for both shopping and living, it has grown steadily in value without becoming overdeveloped. Proximity to I-77 and Route 18 provides excellent connectivity to downtown Akron and Cleveland, making it a prime location for professionals and families looking for suburban luxury with access to urban employment centers.
Beyond the shopping plazas, Montrose-Ghent is filled with quiet, tree-lined subdivisions and well-built homes on large lots. School quality and healthcare access are additional draws. Its price surge from 2020–2022 mirrors the broader Ohio boom, but the foundation for growth was laid much earlier. Controlled development, a diverse housing stock, and strong local demand have kept prices buoyant into 2025, with values now stabilizing in the $500K+ range.
27. Kenwood – 144% Home Price Increase Since 2012
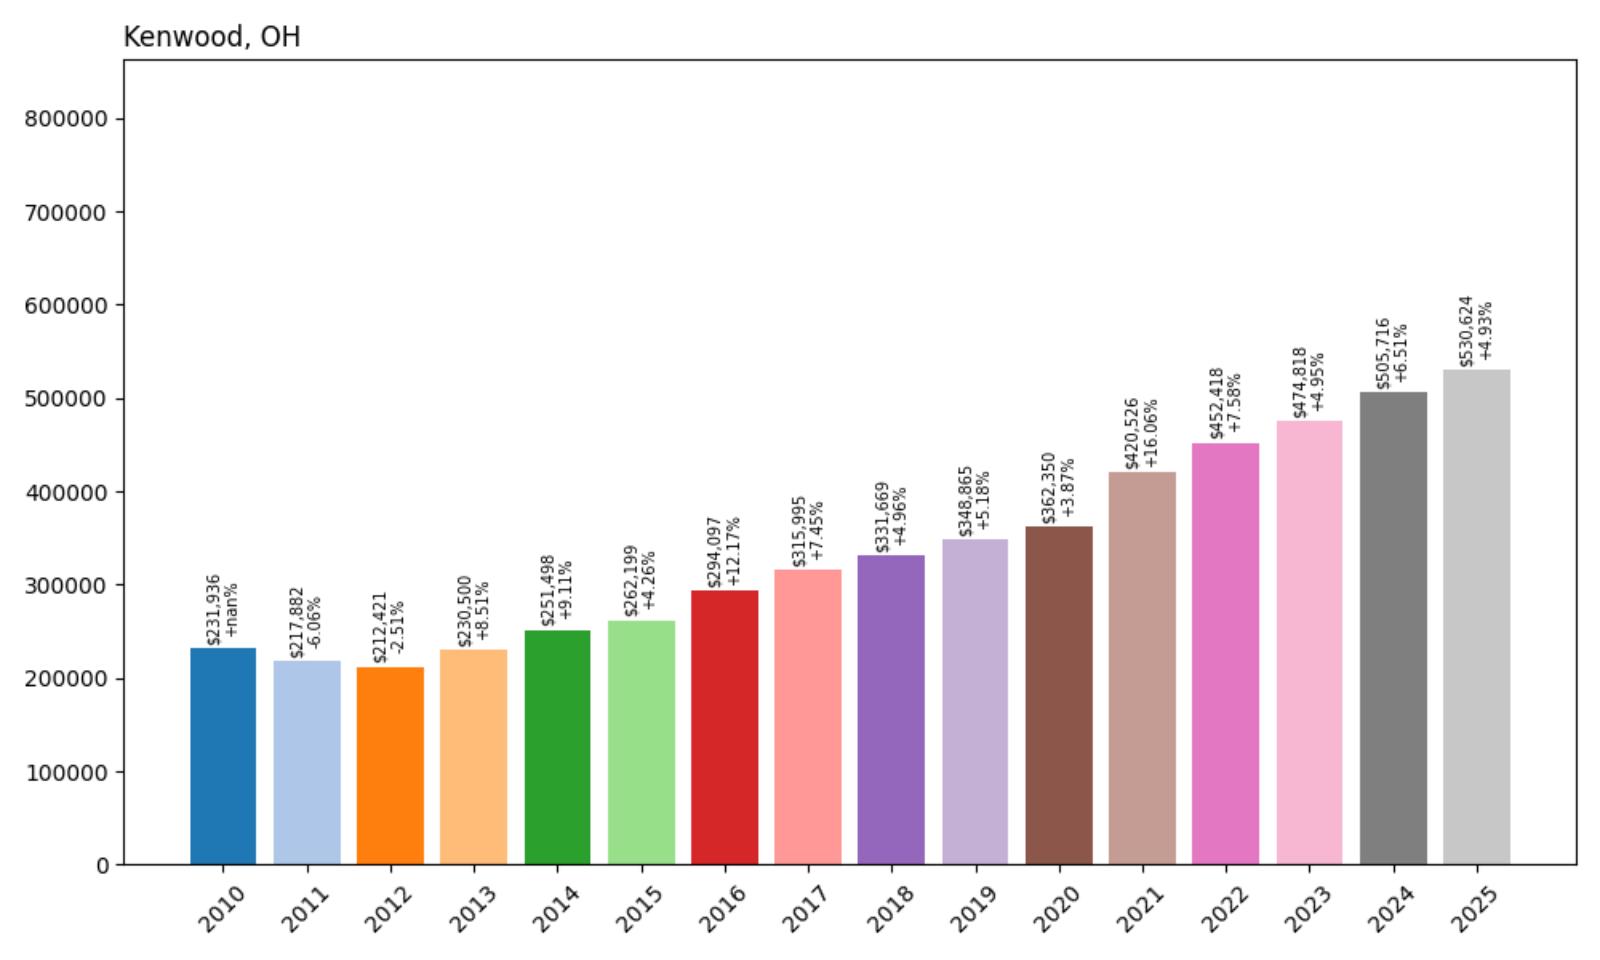
- 2010: $231,936
- 2011: $217,882 (−$14,054, −6.06% from previous year)
- 2012: $212,421 (−$5,461, −2.51% from previous year)
- 2013: $230,500 (+$18,079, +8.51% from previous year)
- 2014: $251,498 (+$20,998, +9.11% from previous year)
- 2015: $262,199 (+$10,701, +4.26% from previous year)
- 2016: $294,097 (+$31,898, +12.17% from previous year)
- 2017: $315,995 (+$21,897, +7.45% from previous year)
- 2018: $331,669 (+$15,674, +4.96% from previous year)
- 2019: $348,865 (+$17,196, +5.18% from previous year)
- 2020: $362,350 (+$13,485, +3.87% from previous year)
- 2021: $420,526 (+$58,177, +16.06% from previous year)
- 2022: $452,418 (+$31,892, +7.58% from previous year)
- 2023: $474,818 (+$22,400, +4.95% from previous year)
- 2024: $505,716 (+$30,897, +6.51% from previous year)
- 2025: $530,624 (+$24,908, +4.93% from previous year)
Kenwood’s real estate market has soared, with home values increasing 144% from $212,421 in 2012 to $530,624 in 2025. The strongest gains came in two waves: an initial boom from 2013 to 2017, and a second surge from 2020 to 2022. Even in slower years, Kenwood’s prices rose steadily, signaling lasting demand and economic resilience. The town now comfortably sits in Ohio’s top third for home values.
Kenwood – A Retail Powerhouse with Strong Housing Demand
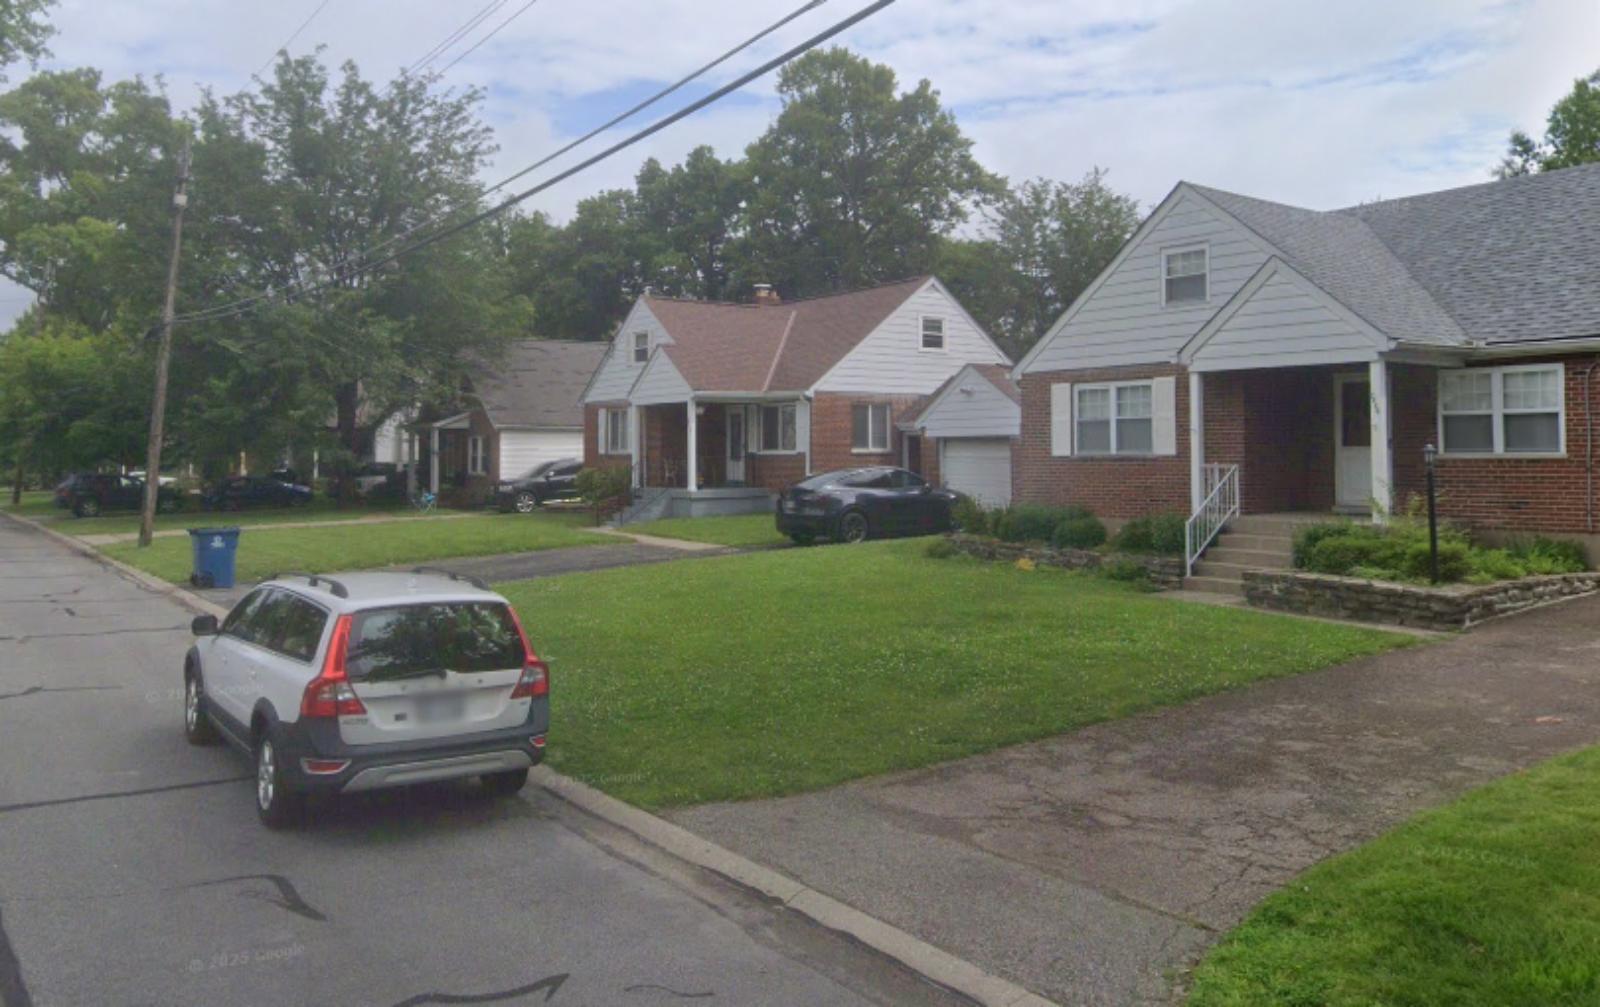
Kenwood is a high-traffic suburb of Cincinnati, best known for the Kenwood Towne Centre—a regional shopping anchor. But the residential neighborhoods behind the commercial façade are quiet, well-kept, and consistently in demand. The area attracts affluent buyers who value proximity to retail, schools, and medical services, along with short commutes to downtown Cincinnati via I-71.
As retail rebounded post-COVID, so did Kenwood’s home values. The rise of hybrid work models made its location even more appealing, balancing suburban comfort with business access. Home styles range from mid-century ranches to new-build colonials, and inventory tends to move quickly. Price gains above $100,000 in the past five years suggest strong buyer interest and relatively tight supply. As of 2025, it continues to be one of Cincinnati’s most sought-after addresses.
26. Turpin Hills – 104% Home Price Increase Since 2012
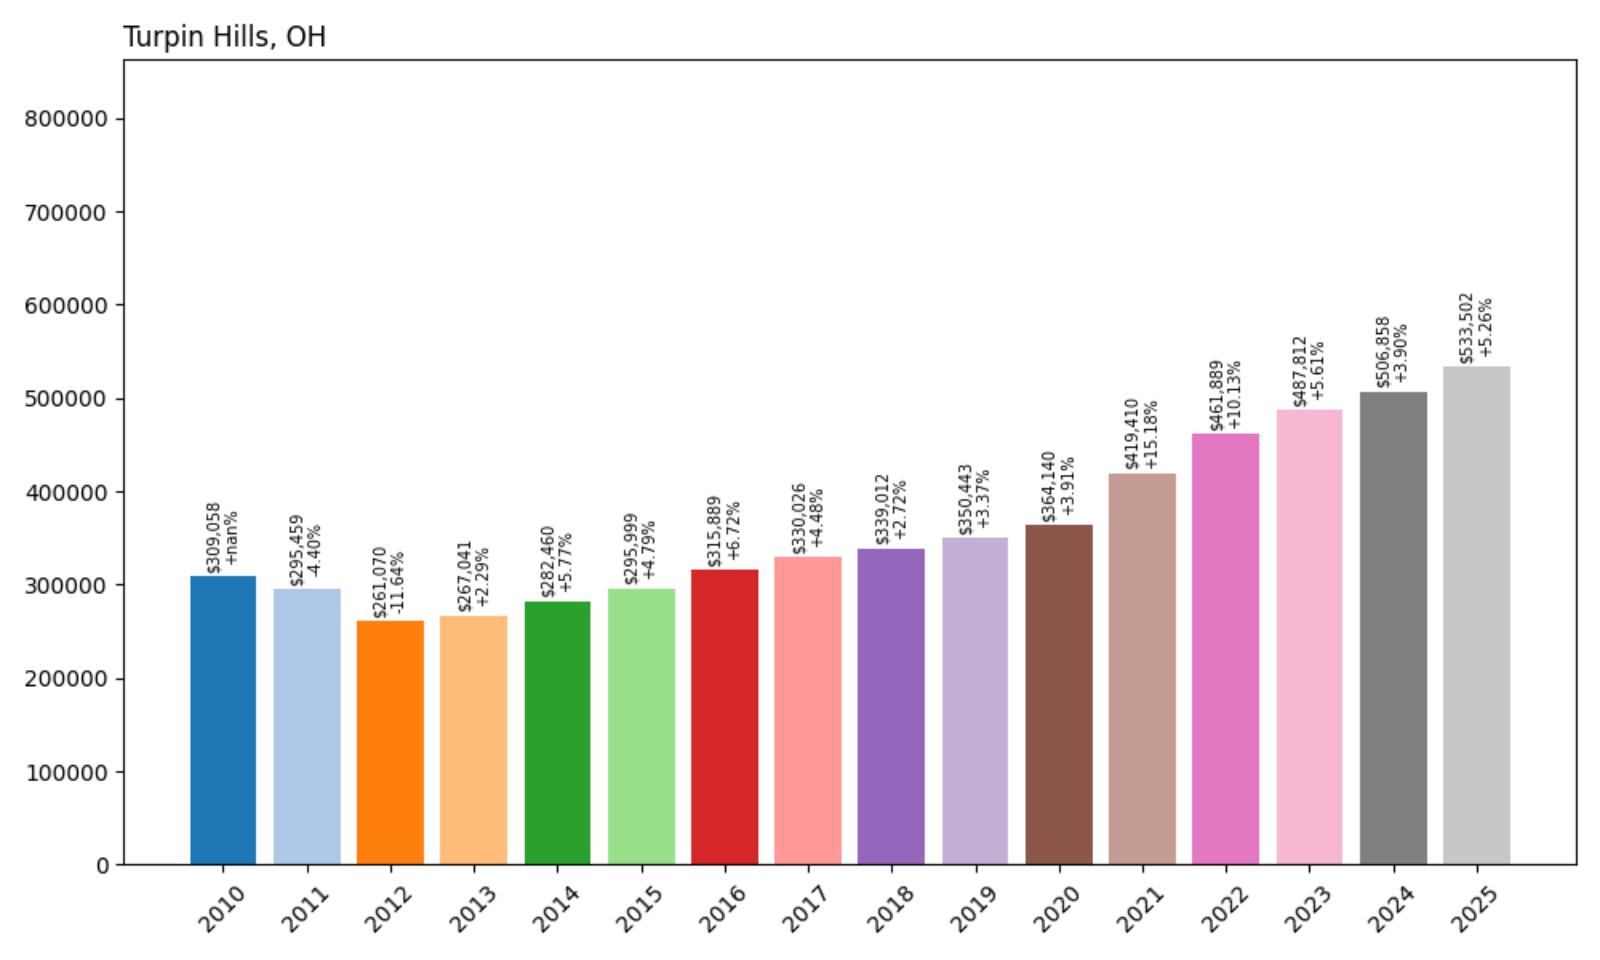
- 2010: $309,058
- 2011: $295,459 (−$13,600, −4.40% from previous year)
- 2012: $261,070 (−$34,388, −11.64% from previous year)
- 2013: $267,041 (+$5,971, +2.29% from previous year)
- 2014: $282,460 (+$15,419, +5.77% from previous year)
- 2015: $295,999 (+$13,539, +4.79% from previous year)
- 2016: $315,889 (+$19,890, +6.72% from previous year)
- 2017: $330,026 (+$14,137, +4.48% from previous year)
- 2018: $339,012 (+$8,986, +2.72% from previous year)
- 2019: $350,443 (+$11,431, +3.37% from previous year)
- 2020: $364,140 (+$13,697, +3.91% from previous year)
- 2021: $419,410 (+$55,271, +15.18% from previous year)
- 2022: $461,889 (+$42,479, +10.13% from previous year)
- 2023: $487,812 (+$25,923, +5.61% from previous year)
- 2024: $506,858 (+$19,046, +3.90% from previous year)
- 2025: $533,502 (+$26,645, +5.26% from previous year)
Turpin Hills saw a significant drop in home prices from 2010 to 2012 but has rebounded with over 100% growth since then. After bottoming out at $261,070, the town’s average price now stands at $533,502 in 2025. Growth was slow and steady until 2021, when it jumped by over $55,000 in a single year. That momentum has continued, albeit more moderately, keeping Turpin Hills in the upper tier of Cincinnati’s suburban market.
Turpin Hills – Comeback Suburb With Staying Power
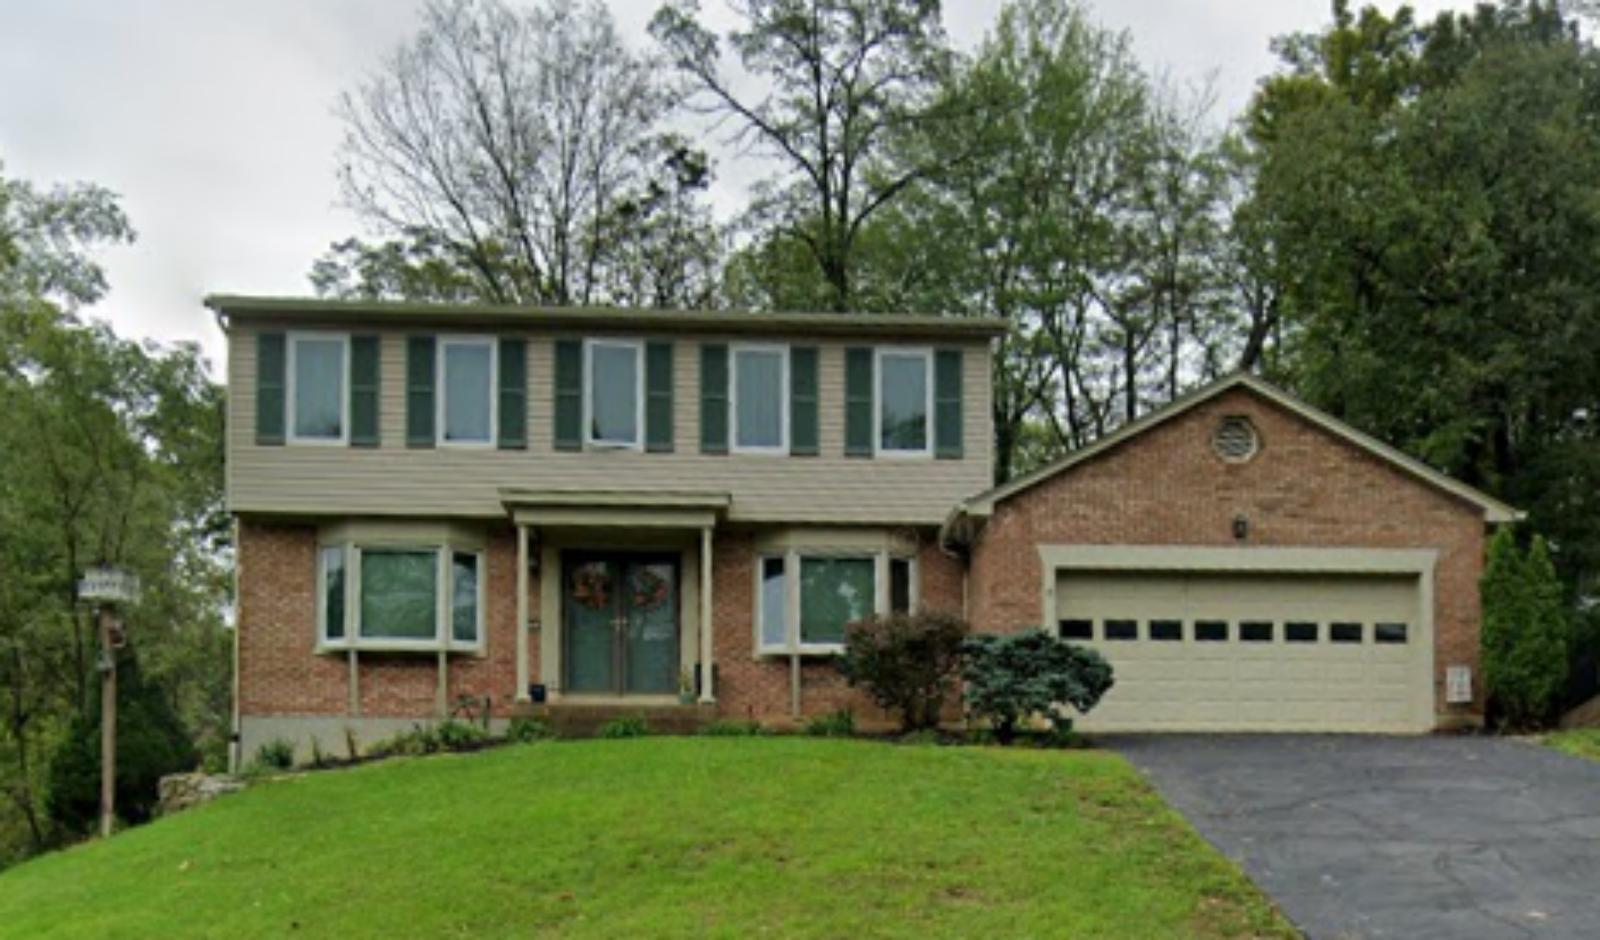
Located in Anderson Township on the east side of Cincinnati, Turpin Hills is a quiet, tree-covered neighborhood known for its winding roads, large lots, and mid-century homes. Though it faced soft demand in the early 2010s, a mix of new buyers, school improvements, and remote work trends helped revive interest in the area. Easy access to downtown via US-50 and proximity to the Little Miami River Trail add to the community’s appeal.
The neighborhood’s mature trees, minimal commercial traffic, and active civic association have helped maintain its residential character. As buyers grew wary of crowded metro cores post-2020, Turpin Hills saw renewed interest from families and remote professionals alike. With prices now over half a million and still rising, the neighborhood has firmly re-established itself as one of Anderson Township’s most desirable enclaves.
25. Madeira – 115% Home Price Increase Since 2012
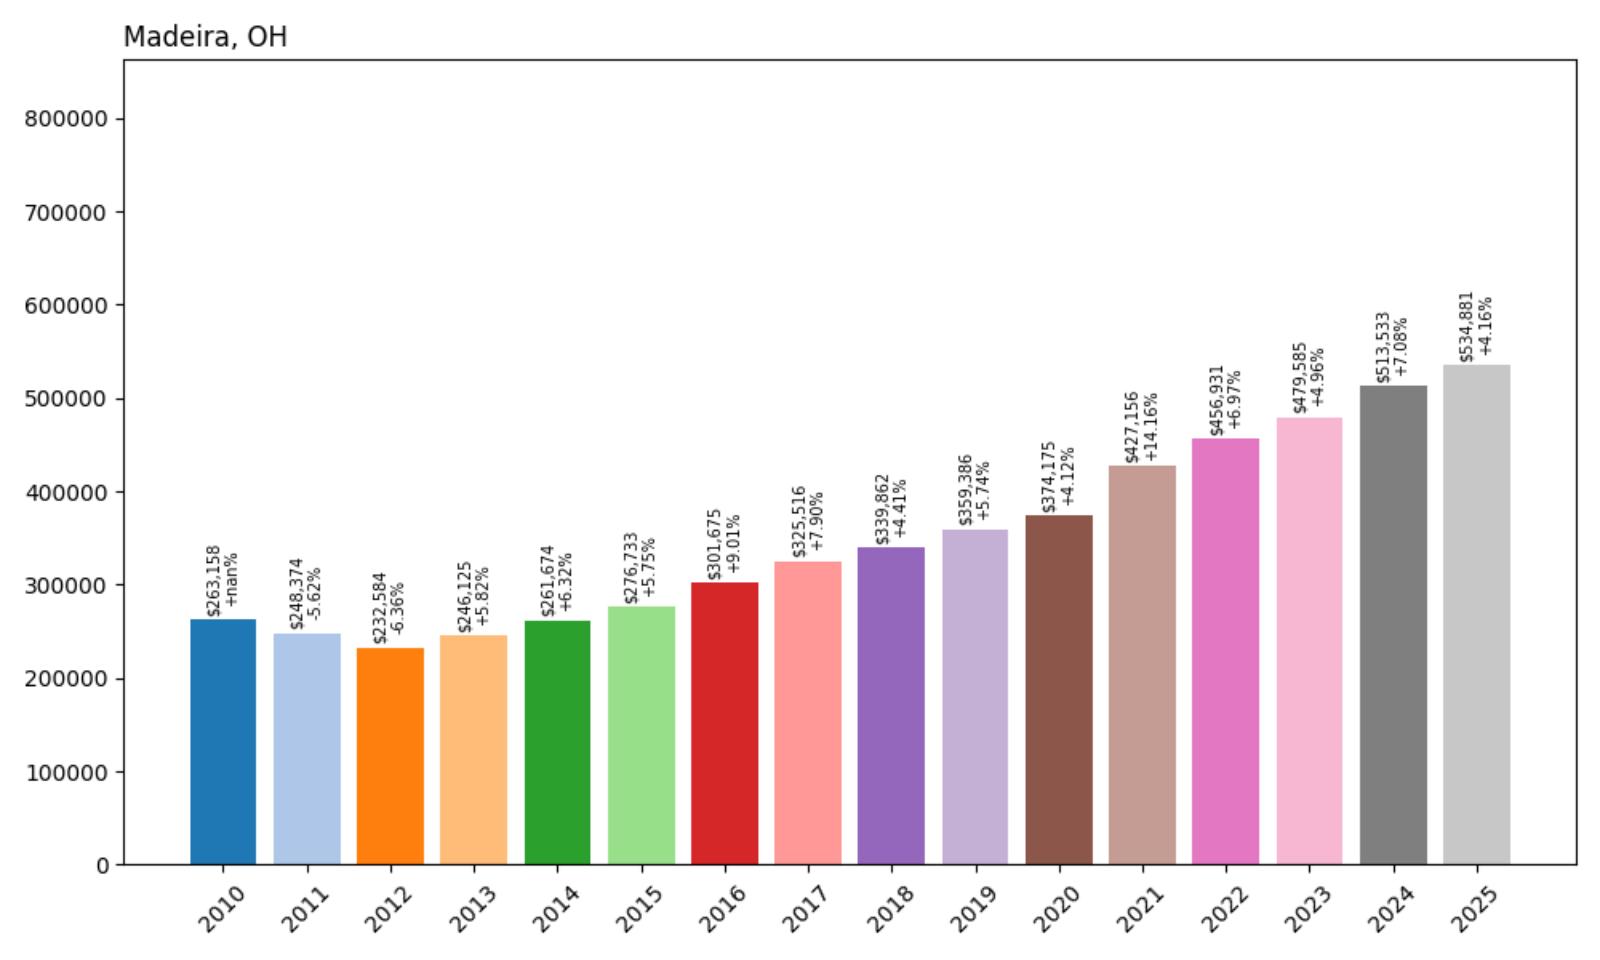
- 2010: $263,158
- 2011: $248,374 (−$14,784, −5.62% from previous year)
- 2012: $232,584 (−$15,790, −6.36% from previous year)
- 2013: $246,125 (+$13,540, +5.82% from previous year)
- 2014: $261,674 (+$15,549, +6.32% from previous year)
- 2015: $276,733 (+$15,059, +5.75% from previous year)
- 2016: $301,675 (+$24,941, +9.01% from previous year)
- 2017: $325,516 (+$23,842, +7.90% from previous year)
- 2018: $339,862 (+$14,345, +4.41% from previous year)
- 2019: $359,386 (+$19,524, +5.74% from previous year)
- 2020: $374,175 (+$14,789, +4.12% from previous year)
- 2021: $427,156 (+$52,981, +14.16% from previous year)
- 2022: $456,931 (+$29,775, +6.97% from previous year)
- 2023: $479,585 (+$22,653, +4.96% from previous year)
- 2024: $513,533 (+$33,949, +7.08% from previous year)
- 2025: $534,881 (+$21,347, +4.16% from previous year)
Madeira’s housing market more than doubled in value from 2012 to 2025, growing from $232,584 to $534,881. The strongest years came in 2016 and again in 2021, when prices jumped by over $75,000 combined. Annual appreciation has remained consistent since 2013, signaling durable demand and a robust local market. The town now ranks among the most reliably appreciating suburbs in the state.
Madeira – Timeless Suburb with Consistent Demand
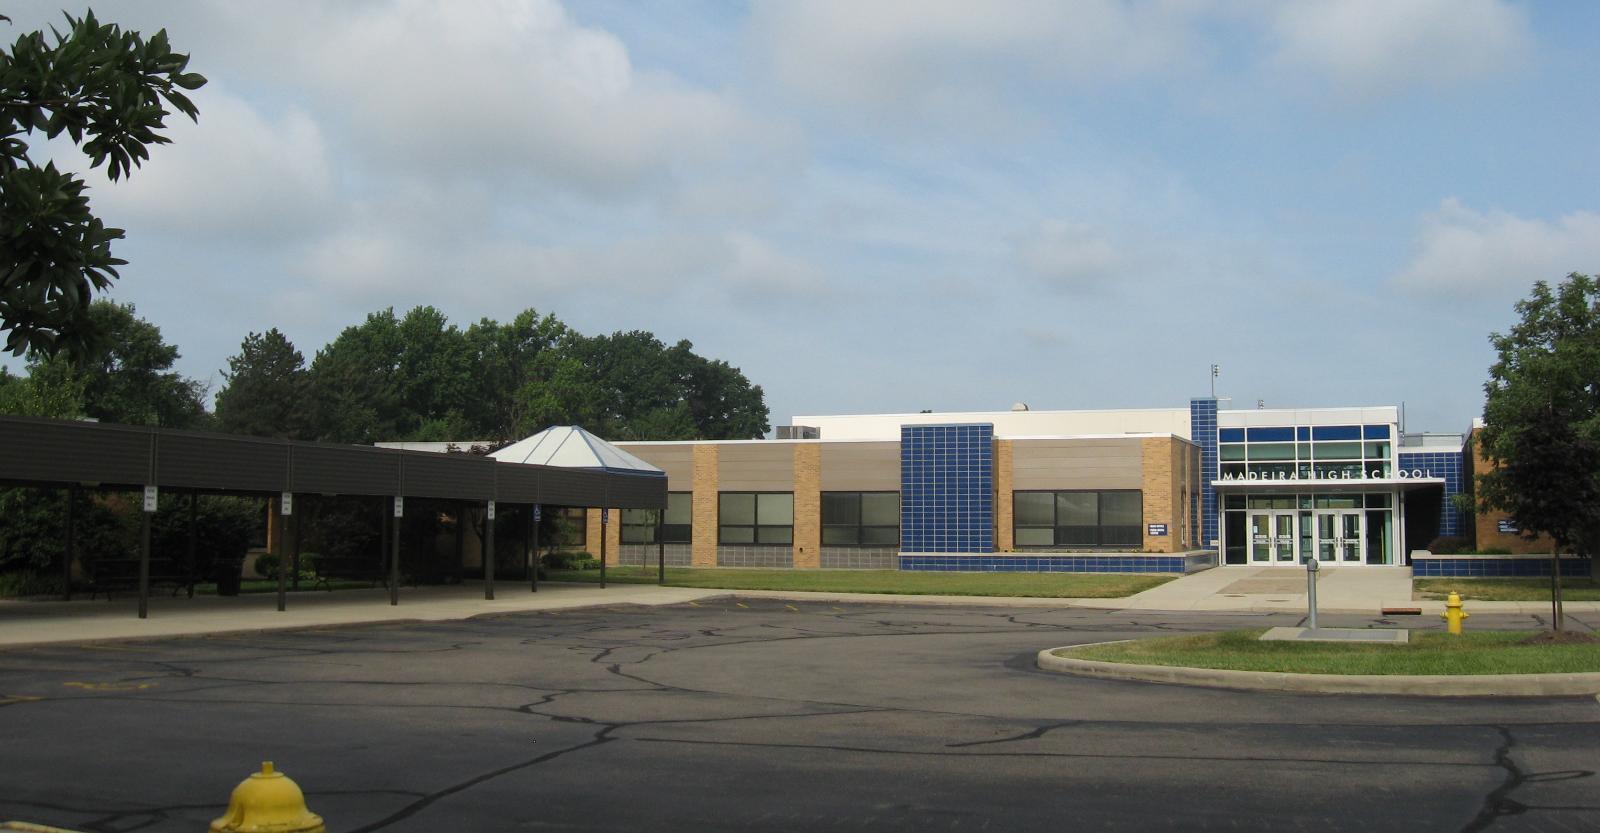
Madeira is a beloved suburb just northeast of Cincinnati, prized for its walkability, quaint downtown, and excellent public schools. The housing stock here is a mix of early 20th-century charmers and modern rebuilds, giving buyers plenty of options. Home turnover is relatively low, which limits inventory and keeps prices elevated even during slower markets. Madeira consistently ranks as one of Ohio’s best places to raise a family.
Its success isn’t flashy—but it’s reliable. The community has steadily attracted professionals, retirees, and families for over a decade. Its well-regarded Madeira City Schools district remains a major driver of housing interest, and the proximity to downtown Cincinnati via I-71 or Kenwood Road adds to the convenience. With home prices now clearing $530,000 and no signs of excess inventory, Madeira stands out for its blend of small-town warmth and big-city access.
24. Plain City – 108% Home Price Increase Since 2012
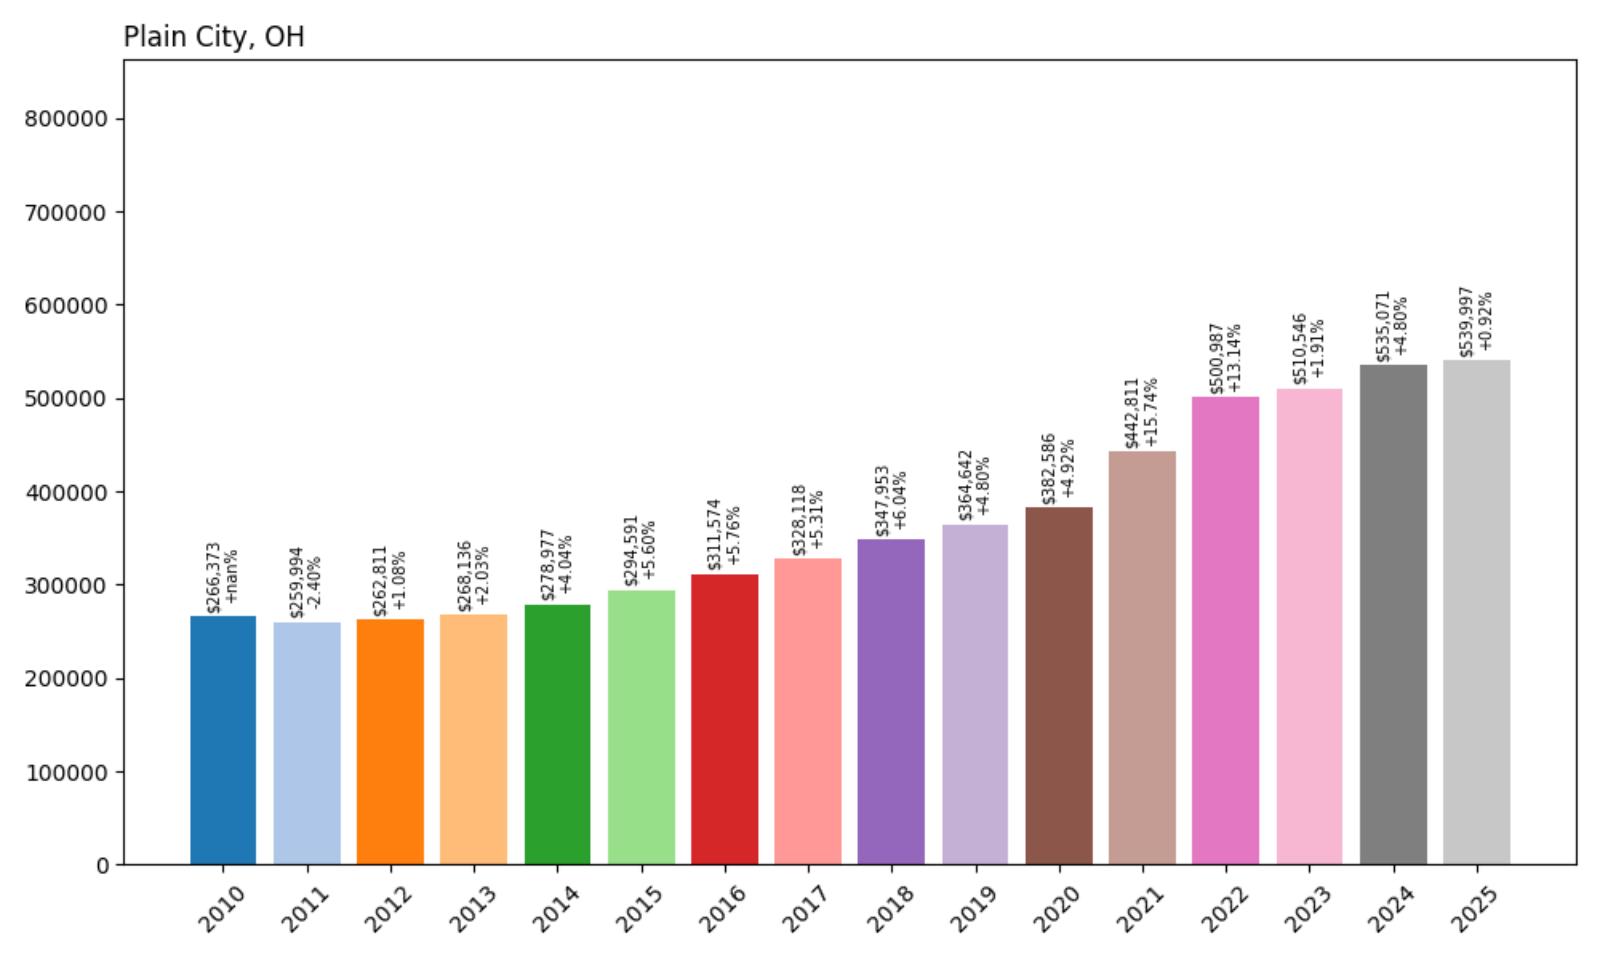
- 2010: $266,373
- 2011: $259,994 (−$6,380, −2.40% from previous year)
- 2012: $262,811 (+$2,818, +1.08% from previous year)
- 2013: $268,136 (+$5,325, +2.03% from previous year)
- 2014: $278,977 (+$10,841, +4.04% from previous year)
- 2015: $294,591 (+$15,614, +5.60% from previous year)
- 2016: $311,574 (+$16,983, +5.76% from previous year)
- 2017: $328,118 (+$16,544, +5.31% from previous year)
- 2018: $347,953 (+$19,835, +6.04% from previous year)
- 2019: $364,642 (+$16,689, +4.80% from previous year)
- 2020: $382,586 (+$17,944, +4.92% from previous year)
- 2021: $442,811 (+$60,225, +15.74% from previous year)
- 2022: $500,987 (+$58,176, +13.14% from previous year)
- 2023: $510,546 (+$9,559, +1.91% from previous year)
- 2024: $535,071 (+$24,525, +4.80% from previous year)
- 2025: $539,997 (+$4,927, +0.92% from previous year)
Plain City’s housing market has seen steady and significant growth since 2012, with prices rising from $262,811 to $539,997 by 2025—more than doubling in just over a decade. The gains have been especially strong since 2020, when home values jumped by more than $120,000 in just two years. Though price growth slowed in 2023–2025, the overall upward trend shows lasting appeal and strong demand in this corner of Ohio.
Plain City – Rural Roots With Suburban Appeal
Plain City sits at the edge of the Columbus metro area, straddling Madison and Union counties. Historically rural and heavily agricultural, it has seen a transformation in the last two decades as suburban expansion has pushed outward. New residential developments and a growing population have brought a wave of demand, while the town has worked to preserve its small-town charm and historical identity.
One of Plain City’s strengths lies in its location—just close enough to Columbus for commuters, yet distant enough to maintain lower density and wide open spaces. That balance has attracted buyers from across Central Ohio, especially families seeking newer homes on larger lots. While annual price growth has tapered off, values have remained high, indicating continued buyer interest even as the regional market stabilizes.
23. Hudson – 91% Home Price Increase Since 2012
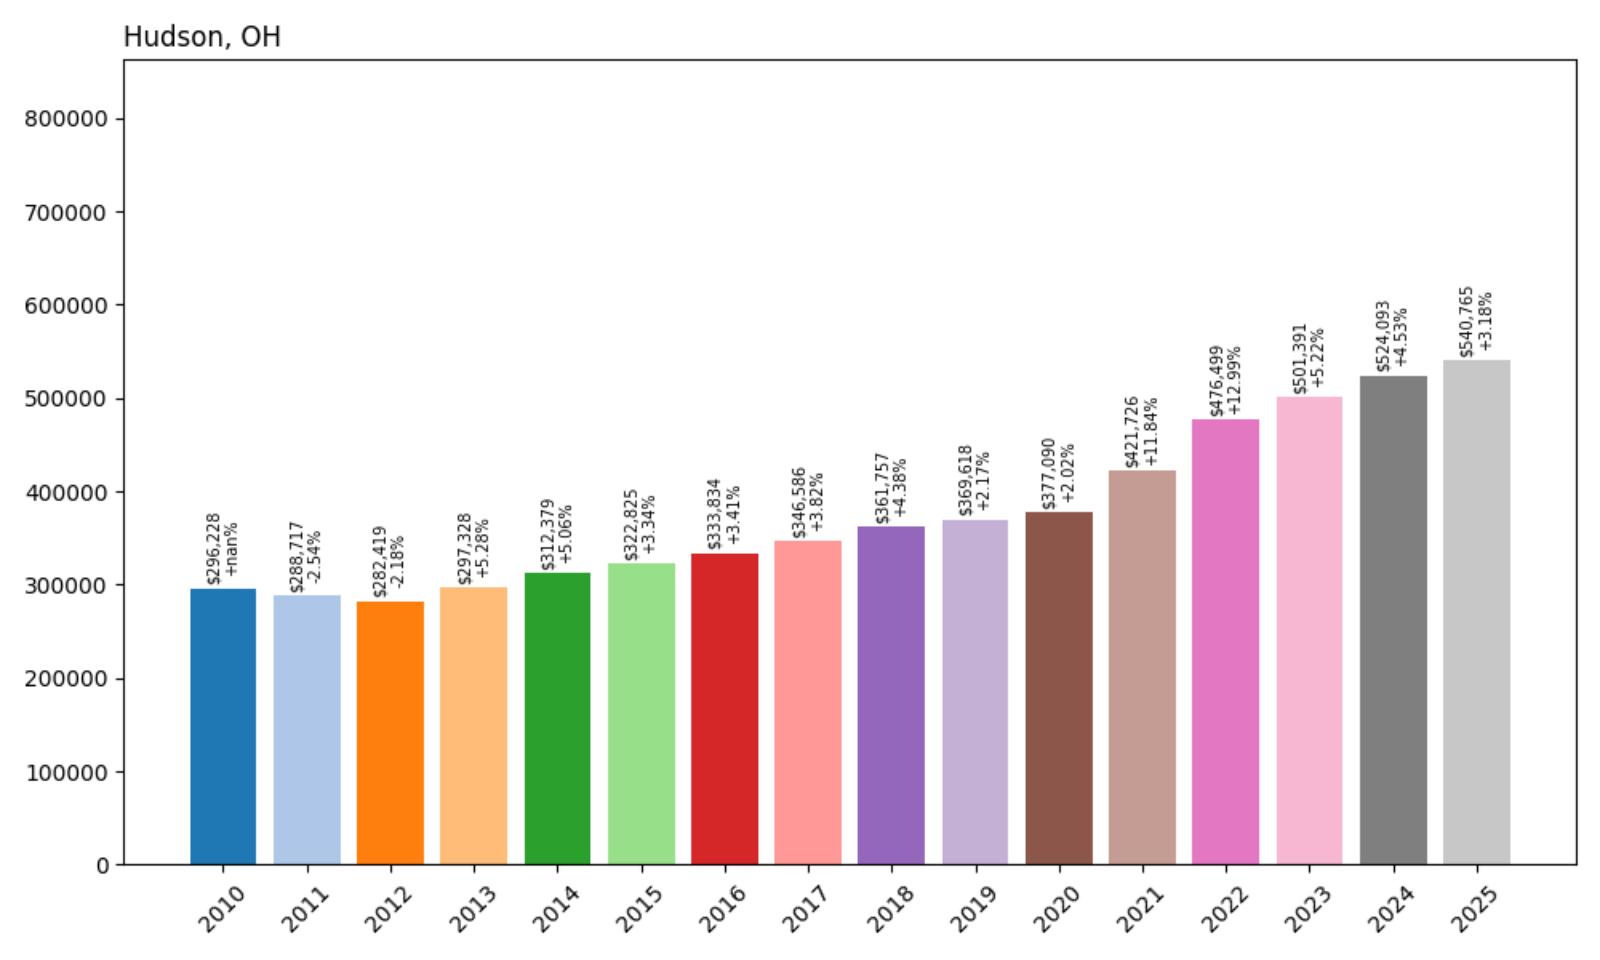
- 2010: $296,228
- 2011: $288,717 (−$7,512, −2.54% from previous year)
- 2012: $282,419 (−$6,298, −2.18% from previous year)
- 2013: $297,328 (+$14,909, +5.28% from previous year)
- 2014: $312,379 (+$15,051, +5.06% from previous year)
- 2015: $322,825 (+$10,446, +3.34% from previous year)
- 2016: $333,834 (+$11,009, +3.41% from previous year)
- 2017: $346,586 (+$12,751, +3.82% from previous year)
- 2018: $361,757 (+$15,171, +4.38% from previous year)
- 2019: $369,618 (+$7,861, +2.17% from previous year)
- 2020: $377,090 (+$7,472, +2.02% from previous year)
- 2021: $421,726 (+$44,636, +11.84% from previous year)
- 2022: $476,499 (+$54,773, +12.99% from previous year)
- 2023: $501,391 (+$24,892, +5.22% from previous year)
- 2024: $524,093 (+$22,702, +4.53% from previous year)
- 2025: $540,765 (+$16,673, +3.18% from previous year)
Hudson home values have grown from $282,419 in 2012 to $540,765 in 2025, marking a 91% increase. The early 2010s were defined by steady growth, but the real surge came between 2020 and 2022, when prices rose by nearly $100,000. Even as the broader market cooled, Hudson remained a high-demand area, with property values continuing to climb year-over-year through 2025.
Hudson – Historic Elegance and Strong Public Schools
Located between Akron and Cleveland, Hudson is one of northeast Ohio’s most prestigious towns. Its walkable downtown, historic architecture, and high-performing public schools have long made it a desirable place to live. Hudson’s school district regularly ranks among the best in the state, and its classic New England-style town center gives it a charm few Ohio towns can match.
The pandemic-era shift toward larger homes and small-town living only accelerated interest in Hudson. Families seeking space, stability, and community amenities found it here. With limited land for new development and consistently strong demand, home values have risen at a steady clip. The town’s combination of heritage and affluence continues to attract buyers in 2025, keeping Hudson among Ohio’s most valuable real estate markets.
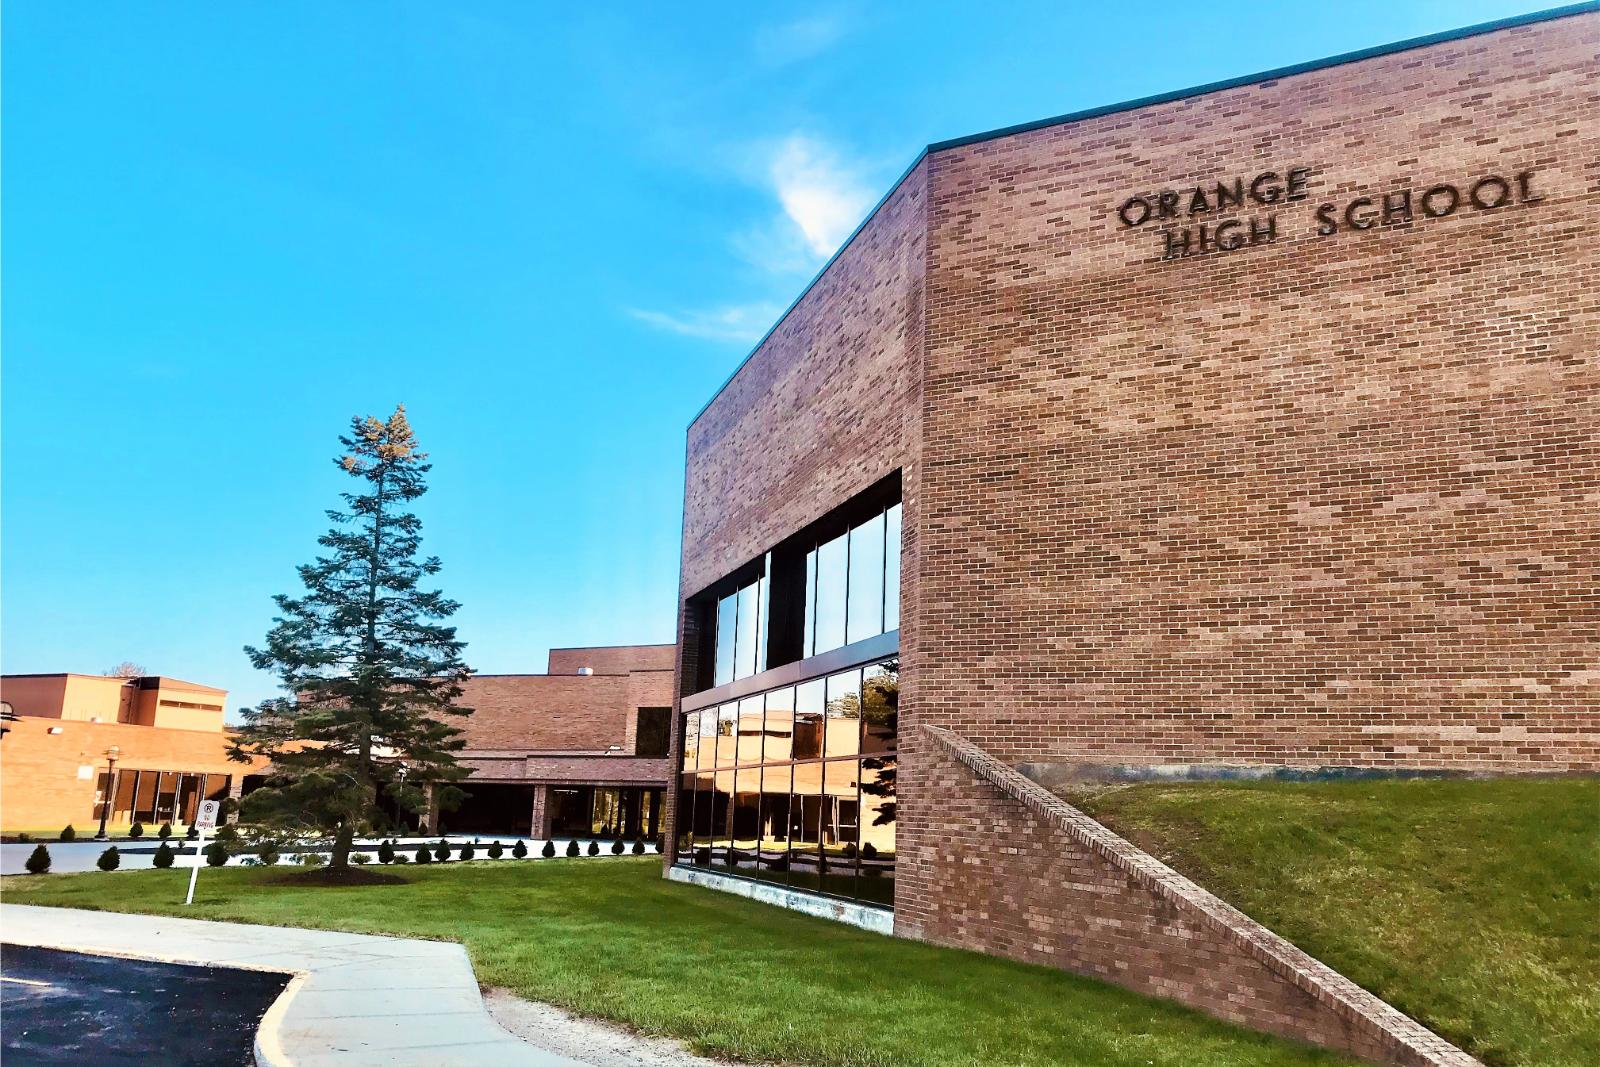
22. Orange – 94% Home Price Increase Since 2012
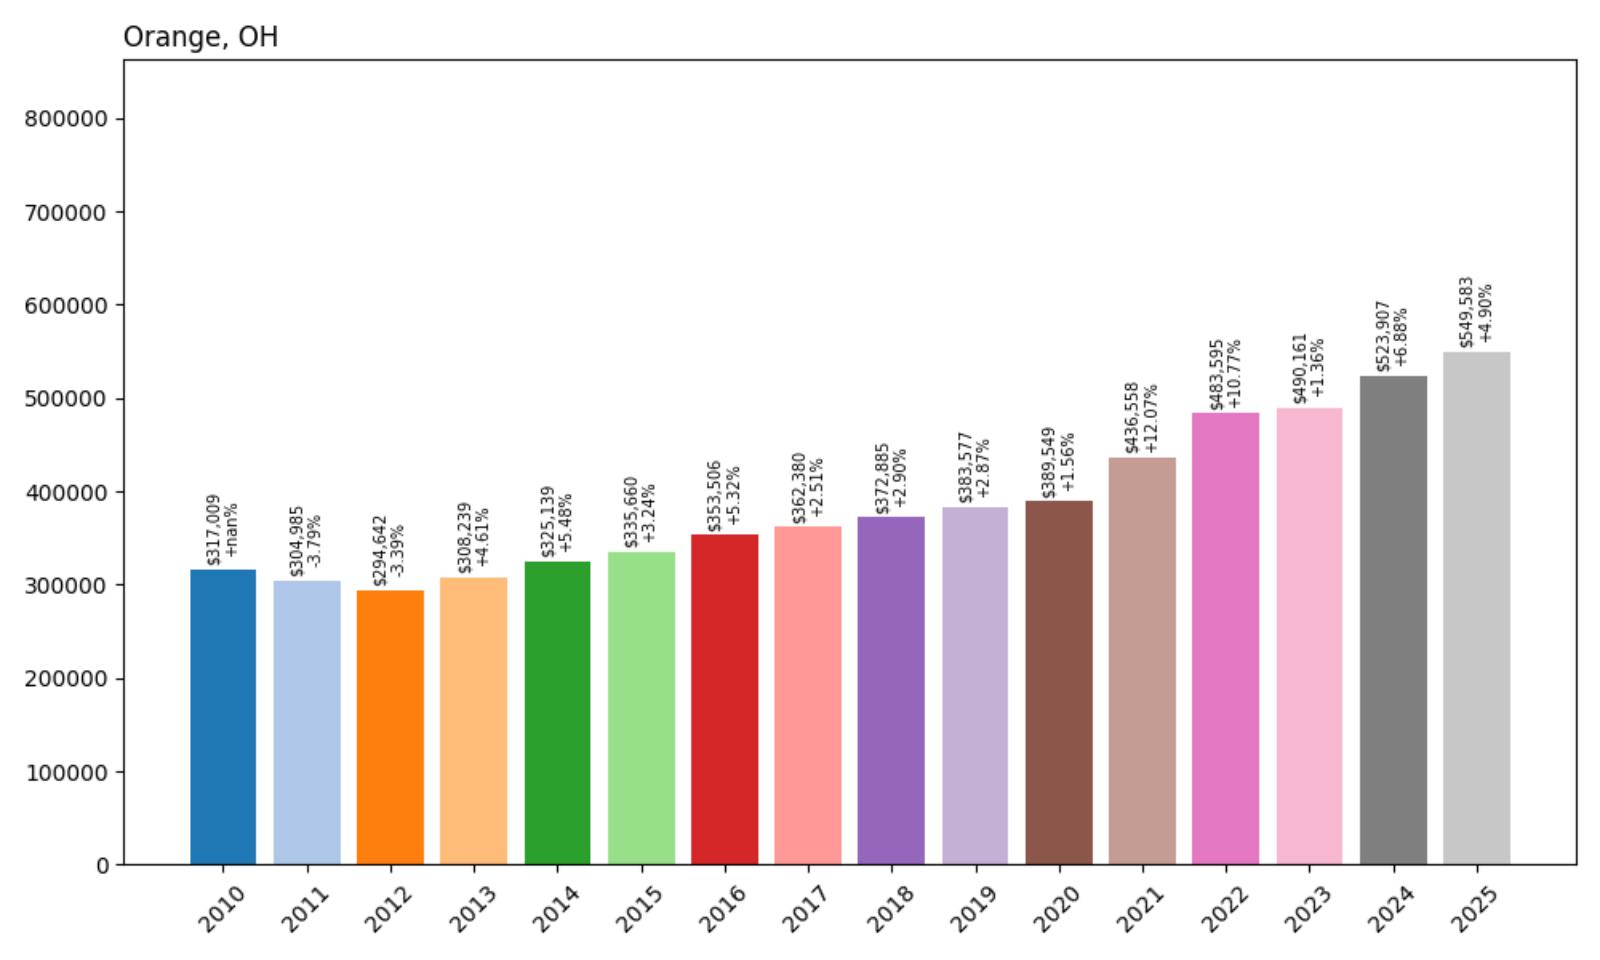
- 2010: $317,009
- 2011: $304,985 (−$12,024, −3.79% from previous year)
- 2012: $294,642 (−$10,343, −3.39% from previous year)
- 2013: $308,239 (+$13,597, +4.61% from previous year)
- 2014: $325,139 (+$16,900, +5.48% from previous year)
- 2015: $335,660 (+$10,521, +3.24% from previous year)
- 2016: $353,506 (+$17,846, +5.32% from previous year)
- 2017: $362,380 (+$8,873, +2.51% from previous year)
- 2018: $372,885 (+$10,505, +2.90% from previous year)
- 2019: $383,577 (+$10,692, +2.87% from previous year)
- 2020: $389,549 (+$5,973, +1.56% from previous year)
- 2021: $436,558 (+$47,009, +12.07% from previous year)
- 2022: $483,595 (+$47,037, +10.77% from previous year)
- 2023: $490,161 (+$6,566, +1.36% from previous year)
- 2024: $523,907 (+$33,746, +6.88% from previous year)
- 2025: $549,583 (+$25,676, +4.90% from previous year)
Orange’s housing market has grown substantially since 2012, with home values rising from $294,642 to $549,583—a 94% increase. While the gains were steady through the 2010s, they accelerated sharply in 2021 and 2022. Even with slower appreciation more recently, the town’s home prices remain on an upward trend, reflecting its high desirability in the greater Cleveland area.
Orange – East Side Living With Upscale Character
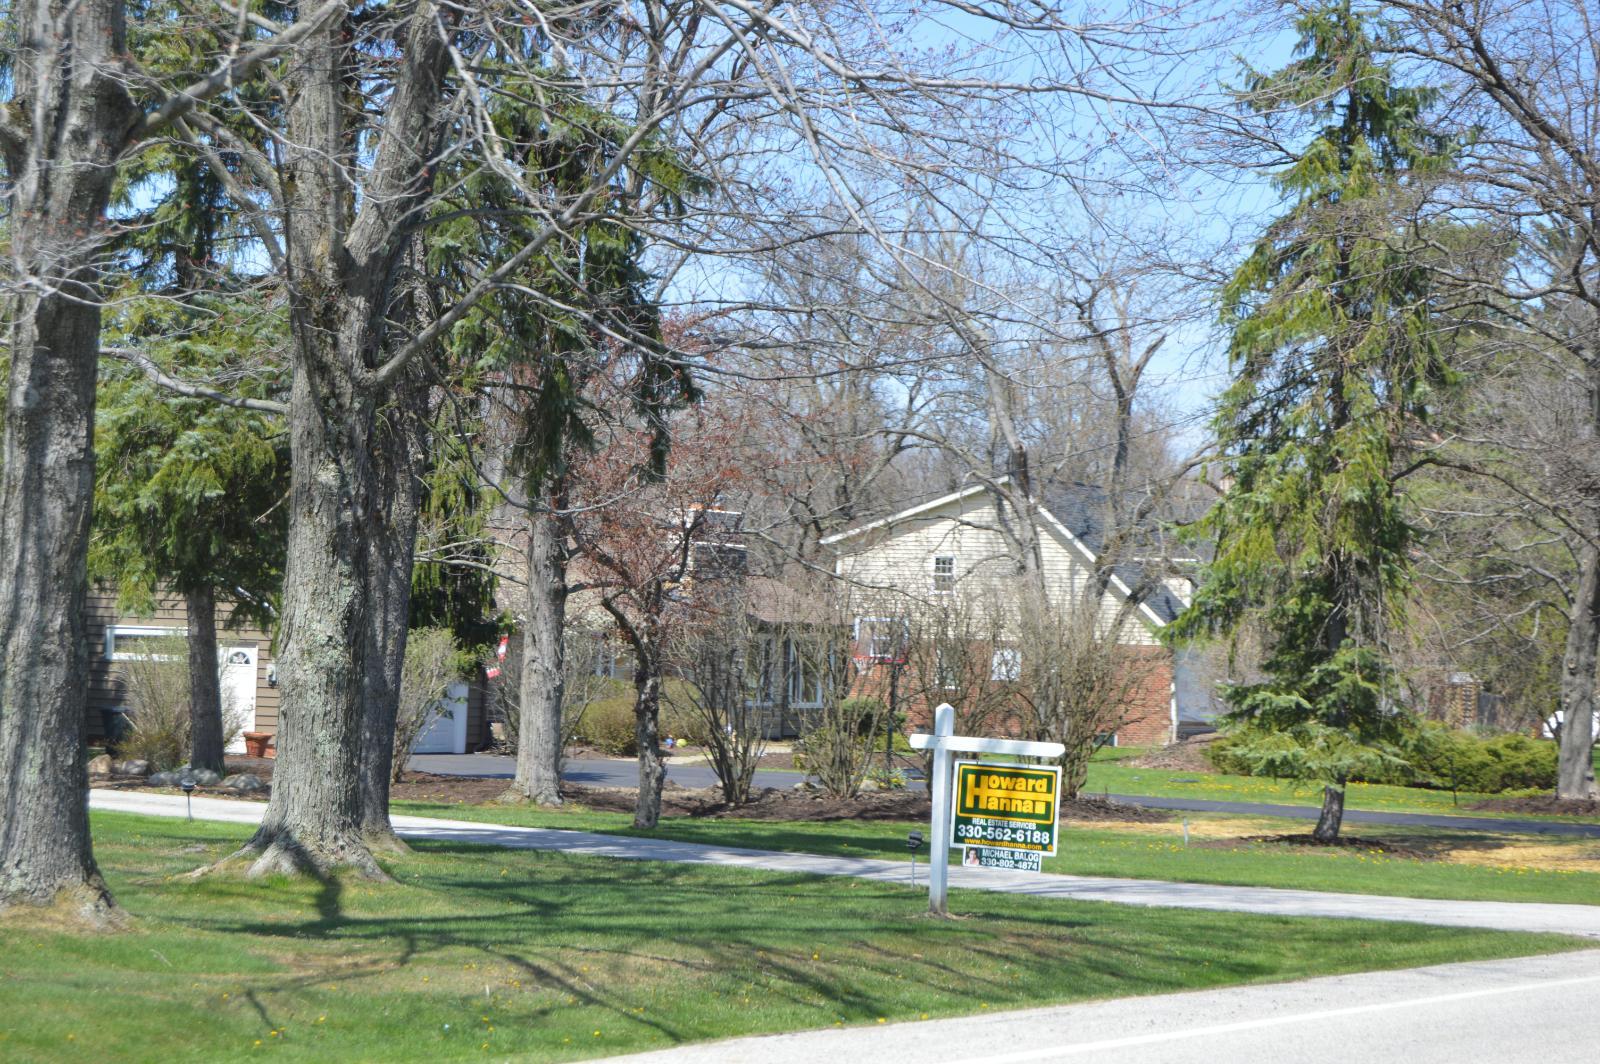
Situated in Cuyahoga County near Beachwood, Orange is part of a cluster of affluent suburbs known for their excellent schools and spacious homes. The town has attracted a mix of professionals, retirees, and executives who appreciate its low-density layout, quick freeway access, and access to private and public schooling options. Its residential zones are carefully planned, offering both newer builds and mature properties.
The surge in prices post-2020 reflects both regional demand and Orange’s growing reputation as a quiet luxury alternative to more crowded metro centers. Close proximity to top hospitals, Cleveland Clinic campuses, and major business corridors further boosts its appeal. With homes now routinely topping half a million dollars, Orange holds its place as one of the most expensive and exclusive towns in Northeast Ohio.
21. Dry Run – 96% Home Price Increase Since 2012
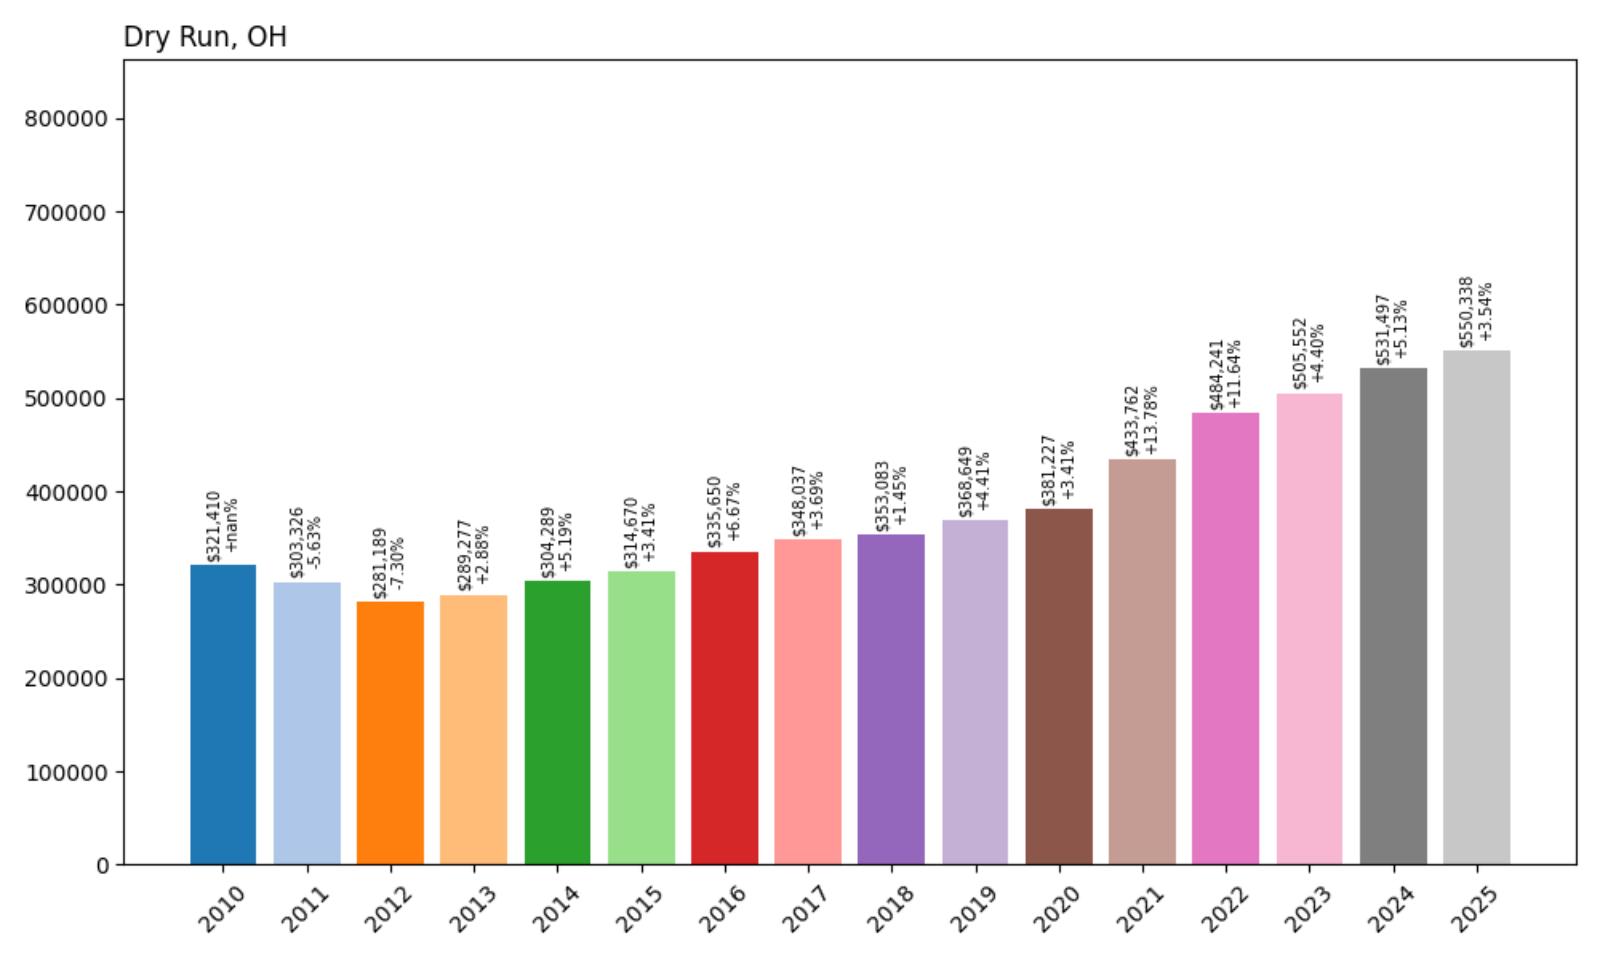
- 2010: $321,410
- 2011: $303,326 (−$18,084, −5.63% from previous year)
- 2012: $281,189 (−$22,137, −7.30% from previous year)
- 2013: $289,277 (+$8,088, +2.88% from previous year)
- 2014: $304,289 (+$15,011, +5.19% from previous year)
- 2015: $314,670 (+$10,382, +3.41% from previous year)
- 2016: $335,650 (+$20,980, +6.67% from previous year)
- 2017: $348,037 (+$12,386, +3.69% from previous year)
- 2018: $353,083 (+$5,046, +1.45% from previous year)
- 2019: $368,649 (+$15,567, +4.41% from previous year)
- 2020: $381,227 (+$12,578, +3.41% from previous year)
- 2021: $433,762 (+$52,535, +13.78% from previous year)
- 2022: $484,241 (+$50,479, +11.64% from previous year)
- 2023: $505,552 (+$21,311, +4.40% from previous year)
- 2024: $531,497 (+$25,945, +5.13% from previous year)
- 2025: $550,338 (+$18,841, +3.54% from previous year)
Dry Run has bounced back strongly from its early-2010s slump, with home values climbing 96% since 2012. After hitting a low of $281,189 in 2012, prices have steadily increased to $550,338 by 2025. The town saw its biggest gains from 2020 to 2022, though even recent years have shown healthy appreciation. This steady climb places Dry Run firmly within Ohio’s high-value housing tier.
Dry Run – Scenic, Quiet, and Rising Fast
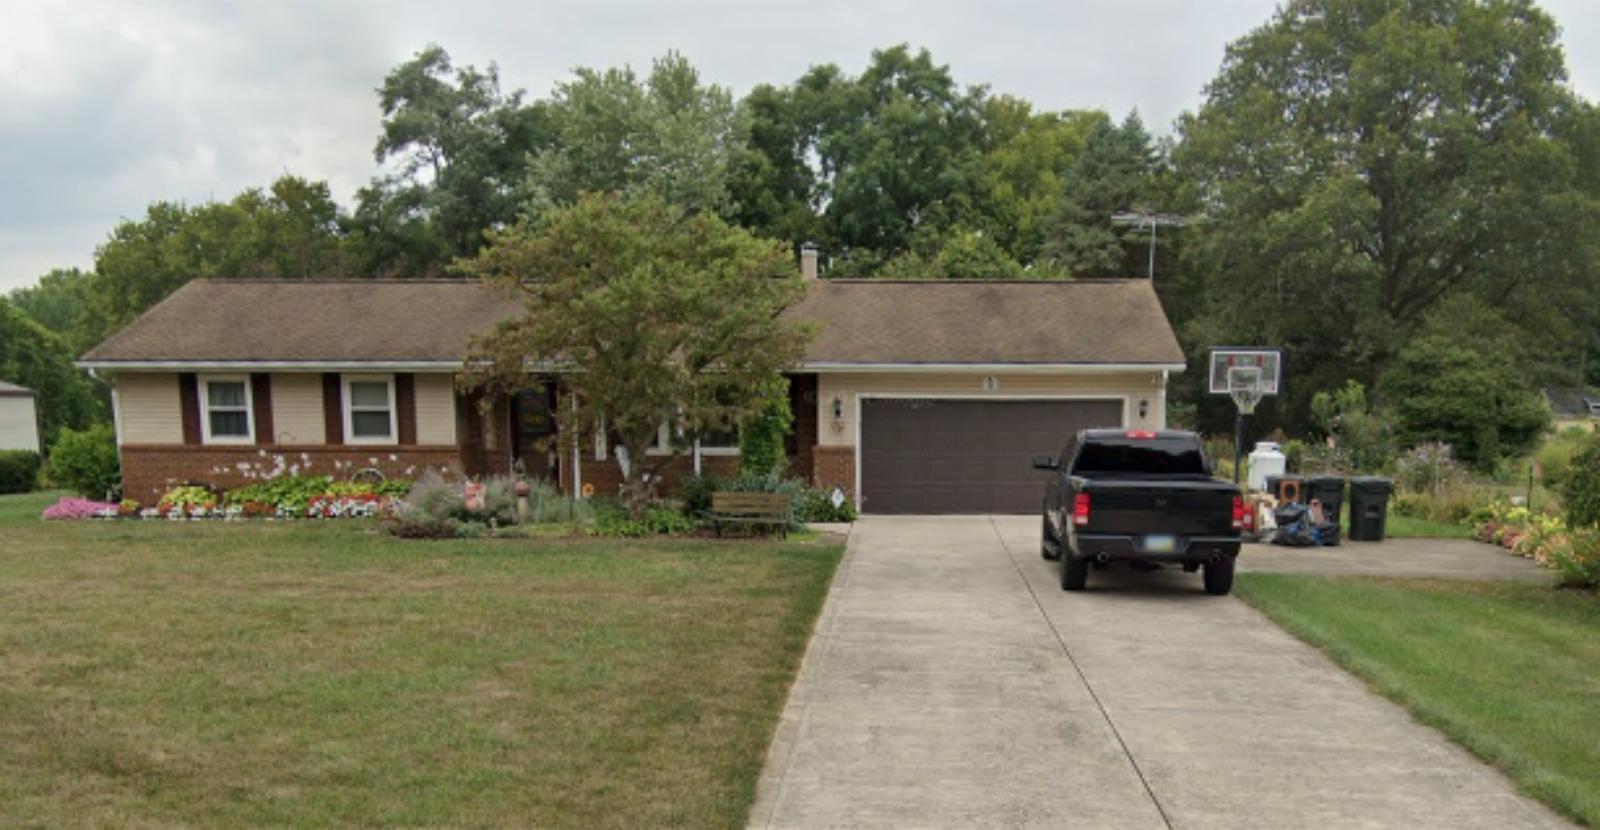
Nestled in Hamilton County near Anderson Township, Dry Run is a semi-rural area with an upscale edge. Known for its green landscapes, large homes, and peaceful vibe, it appeals to buyers looking for space and privacy without venturing too far from Cincinnati. The community isn’t heavily commercial, which keeps the feel residential and tight-knit.
Its housing stock features a mix of custom homes and traditional single-family builds, many of which offer generous acreage. The post-pandemic push toward larger, more isolated homes brought renewed interest to the area, helping boost home values significantly. As of 2025, Dry Run’s housing market remains strong, buoyed by limited inventory and a continued desire for suburban tranquility paired with metro convenience.
20. Grandview Heights – 58% Home Price Increase Since 2016
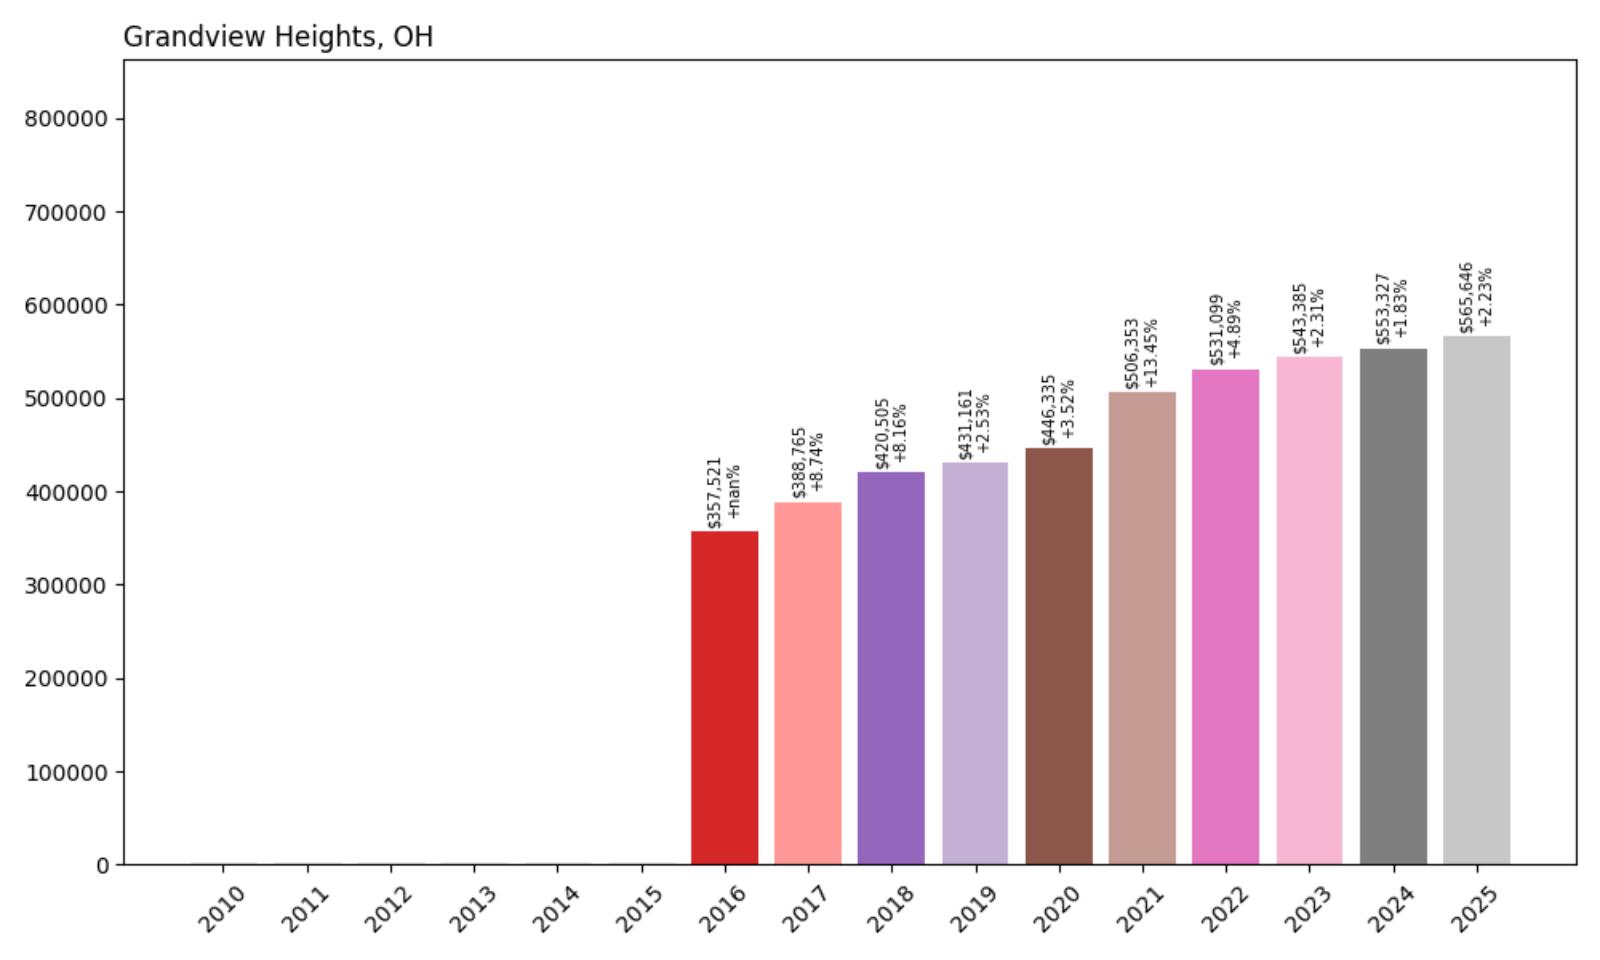
- 2010: $NA
- 2011: $NA
- 2012: $NA
- 2013: $NA
- 2014: $NA
- 2015: $NA
- 2016: $357,521
- 2017: $388,765 (+$31,244, +8.74% from previous year)
- 2018: $420,505 (+$31,740, +8.16% from previous year)
- 2019: $431,161 (+$10,656, +2.53% from previous year)
- 2020: $446,335 (+$15,174, +3.52% from previous year)
- 2021: $506,353 (+$60,018, +13.45% from previous year)
- 2022: $531,099 (+$24,746, +4.89% from previous year)
- 2023: $543,385 (+$12,286, +2.31% from previous year)
- 2024: $553,327 (+$9,942, +1.83% from previous year)
- 2025: $565,646 (+$12,319, +2.23% from previous year)
Since 2016, Grandview Heights has seen a 58% increase in home values, growing from $357,521 to $565,646 in 2025. The strongest growth period came between 2020 and 2021, when home values surged by over $60,000 in a single year. While the pace of appreciation has slowed in recent years, the consistent gains reflect steady demand for this centrally located Columbus suburb.
Grandview Heights – Columbus Proximity with a Neighborhood Feel
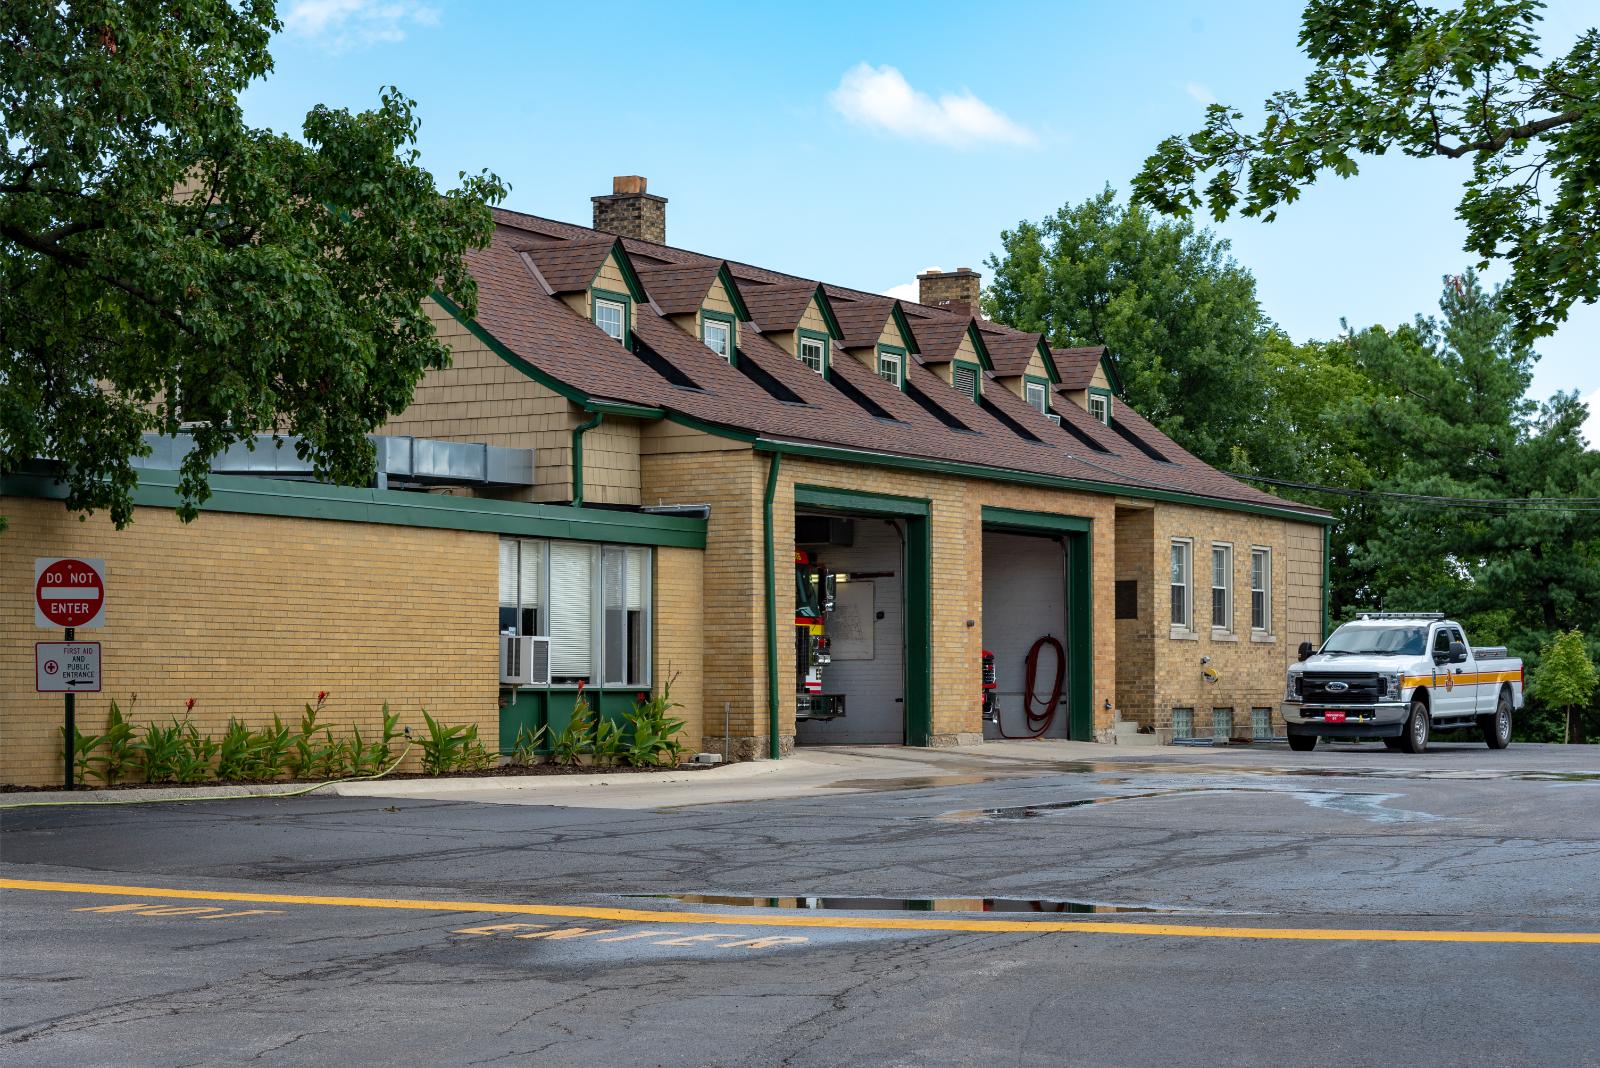
Grandview Heights is a well-established, walkable neighborhood just west of downtown Columbus. Known for its tree-lined streets, strong public schools, and locally owned shops, the city attracts a broad range of residents—from young professionals to retirees. Its proximity to Ohio State University, major hospitals, and central business districts makes it especially attractive for those seeking short commutes without sacrificing lifestyle.
Grandview’s residential market features a mix of historic homes, bungalows, and newer infill projects. The city has seen thoughtful redevelopment over the past decade, adding new apartment and condo options while maintaining its close-knit atmosphere. As a result, demand continues to outpace supply, keeping prices high even as other markets cool. With home values now above $560,000, Grandview remains one of the most desirable places to live in the Columbus metro area.
19. Powell – 96% Home Price Increase Since 2012

- 2010: $296,825
- 2011: $289,790 (−$7,034, −2.37% from previous year)
- 2012: $292,732 (+$2,941, +1.02% from previous year)
- 2013: $308,390 (+$15,659, +5.35% from previous year)
- 2014: $325,499 (+$17,109, +5.55% from previous year)
- 2015: $337,718 (+$12,218, +3.75% from previous year)
- 2016: $351,959 (+$14,242, +4.22% from previous year)
- 2017: $365,396 (+$13,436, +3.82% from previous year)
- 2018: $381,298 (+$15,902, +4.35% from previous year)
- 2019: $392,397 (+$11,099, +2.91% from previous year)
- 2020: $409,122 (+$16,725, +4.26% from previous year)
- 2021: $468,147 (+$59,025, +14.43% from previous year)
- 2022: $532,847 (+$64,700, +13.82% from previous year)
- 2023: $546,475 (+$13,628, +2.56% from previous year)
- 2024: $563,762 (+$17,287, +3.16% from previous year)
- 2025: $572,912 (+$9,150, +1.62% from previous year)
Powell’s home prices have nearly doubled since 2012, rising from $292,732 to $572,912 in 2025. Most of this growth has occurred over the past five years, particularly in 2021 and 2022, when prices surged by more than $120,000. Even as appreciation has slowed in recent years, the town has held onto its gains, remaining one of the highest-value areas in Central Ohio.
Powell – Family-Friendly Growth in the Columbus Suburbs
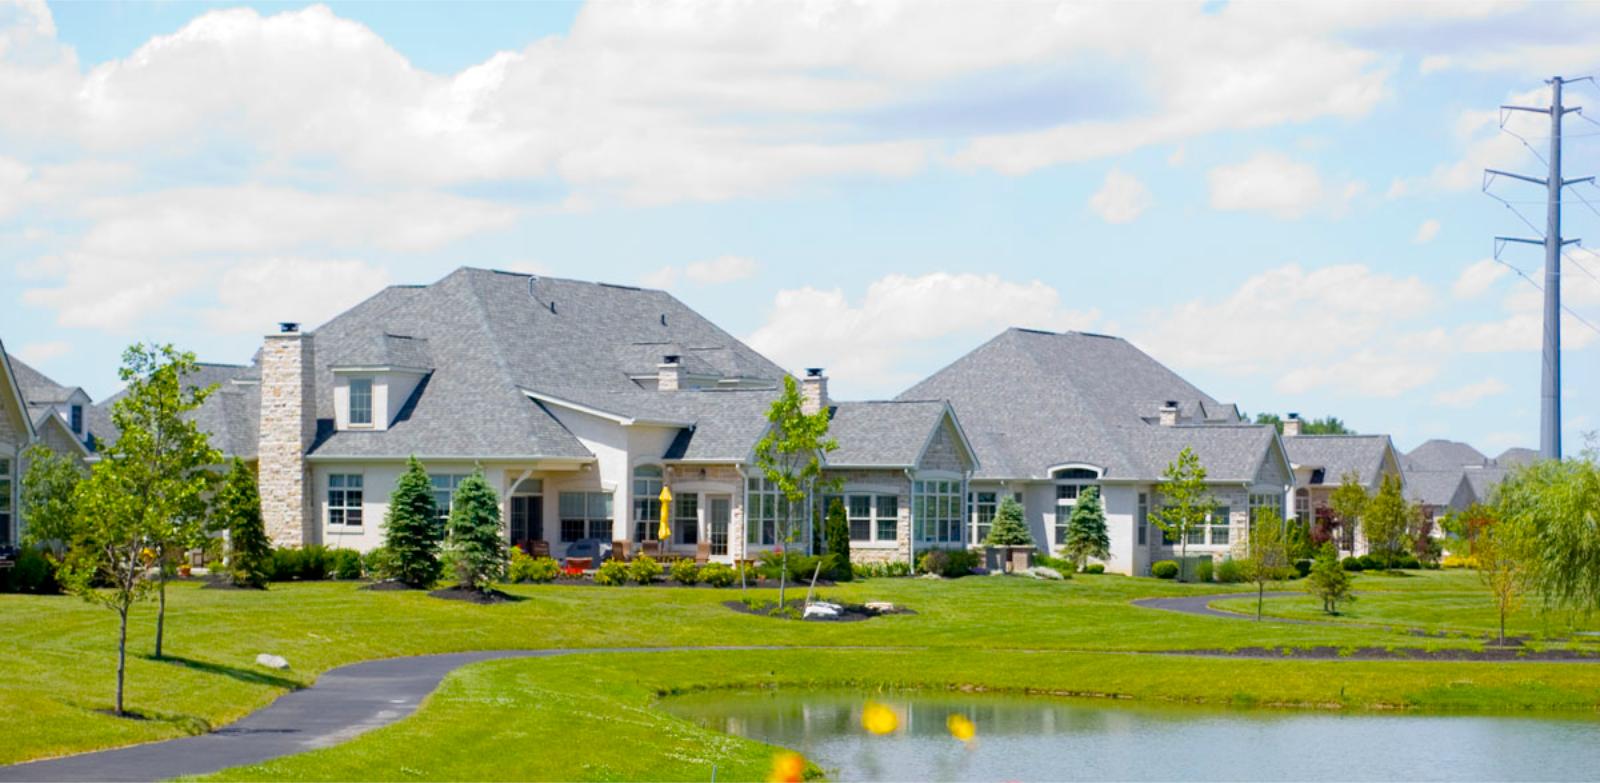
Located in Delaware County north of Columbus, Powell is a classic suburban success story. Known for its excellent schools, low crime rates, and well-planned neighborhoods, Powell attracts families looking for stability and space. The local housing stock includes everything from starter homes to luxury estates, with many newer developments built since the early 2000s.
In recent years, Powell has benefited from population growth in the Columbus metro area. Easy access to major highways, a thriving job market, and a steady stream of public and private investment have helped maintain housing demand. As of 2025, the average home price is over $570,000, cementing Powell’s status as one of the most desirable—and expensive—places to live in the region.
18. Dublin – 103% Home Price Increase Since 2012
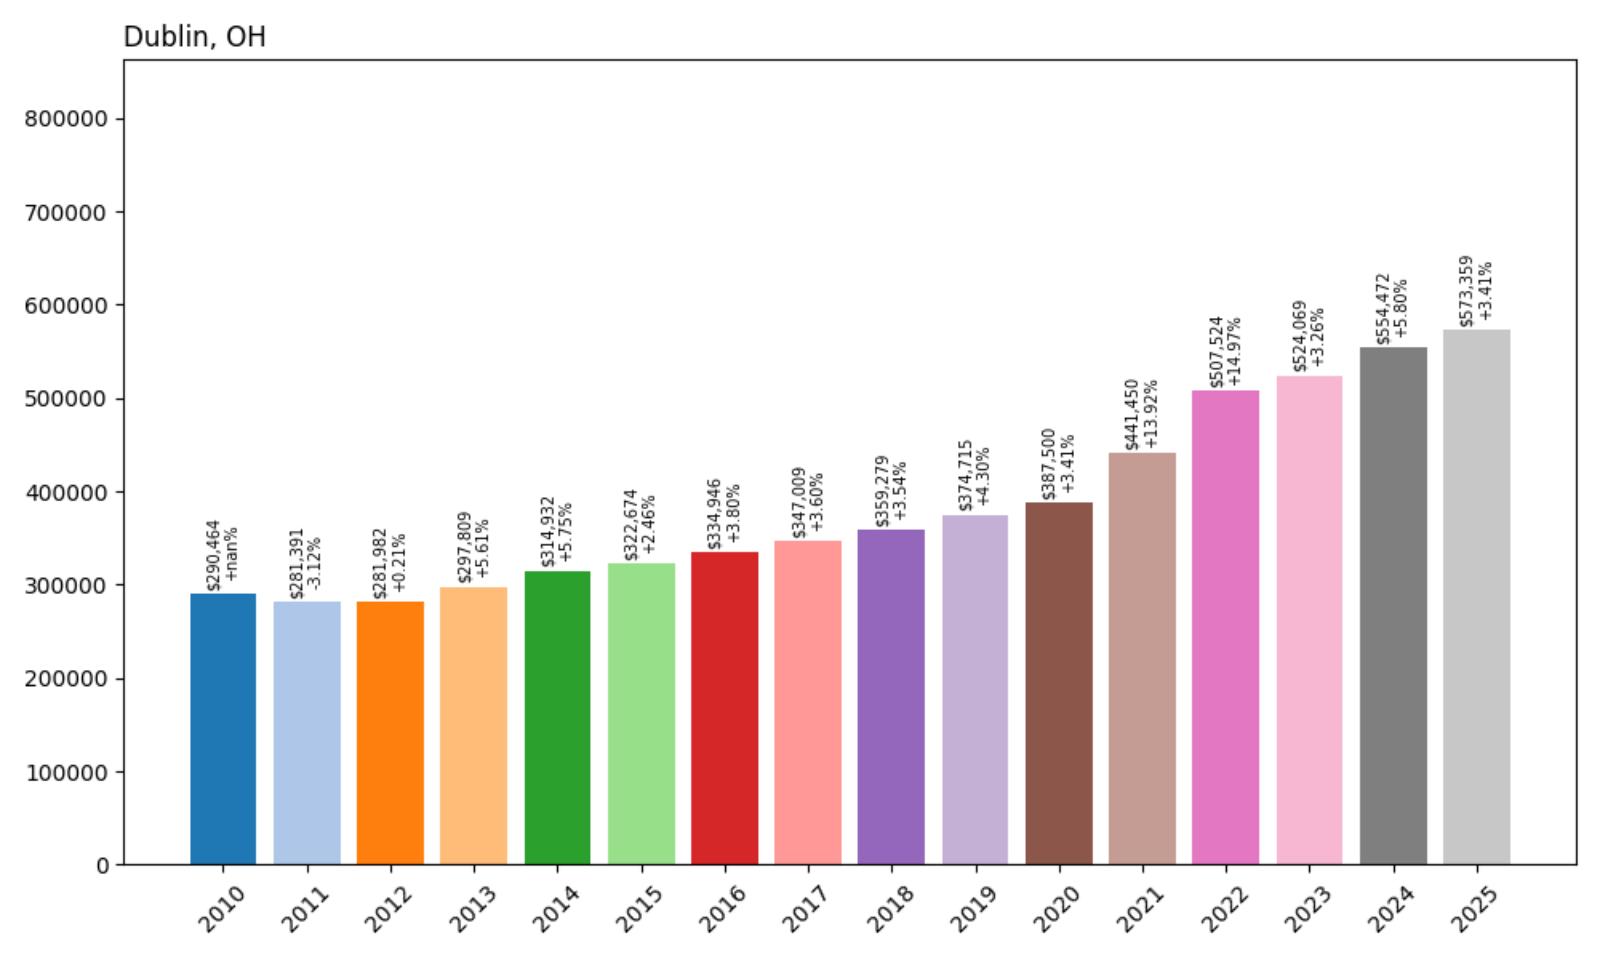
- 2010: $290,464
- 2011: $281,391 (−$9,073, −3.12% from previous year)
- 2012: $281,982 (+$591, +0.21% from previous year)
- 2013: $297,809 (+$15,827, +5.61% from previous year)
- 2014: $314,932 (+$17,123, +5.75% from previous year)
- 2015: $322,674 (+$7,743, +2.46% from previous year)
- 2016: $334,946 (+$12,272, +3.80% from previous year)
- 2017: $347,009 (+$12,063, +3.60% from previous year)
- 2018: $359,279 (+$12,270, +3.54% from previous year)
- 2019: $374,715 (+$15,436, +4.30% from previous year)
- 2020: $387,500 (+$12,784, +3.41% from previous year)
- 2021: $441,450 (+$53,950, +13.92% from previous year)
- 2022: $507,524 (+$66,074, +14.97% from previous year)
- 2023: $524,069 (+$16,545, +3.26% from previous year)
- 2024: $554,472 (+$30,403, +5.80% from previous year)
- 2025: $573,359 (+$18,887, +3.41% from previous year)
Dublin’s home values have increased 103% since 2012, growing from $281,982 to $573,359 in 2025. While the 2010s brought steady appreciation, the period from 2020 to 2022 saw the fastest growth, with values rising by over $120,000. Price increases have moderated since then, but the market remains solid, reflecting ongoing demand and low inventory in this high-performing Columbus suburb.
Dublin – Tech, Schools, and a High-Quality Lifestyle
Hunting Valley Town Image
Dublin is one of Central Ohio’s most affluent and well-developed cities. Located northwest of Columbus, it is home to numerous tech companies, expansive parks, and one of the state’s most respected school districts. The city’s investments in infrastructure, walkable town centers, and cultural amenities have made it a model for modern suburban development.
Dublin’s housing market reflects these advantages. Large, well-maintained homes are common, and new construction continues to expand the city’s footprint. The population is growing steadily, attracting both families and professionals seeking access to quality schools and high-paying jobs. With home prices now approaching $575,000, Dublin remains one of Ohio’s most coveted addresses.
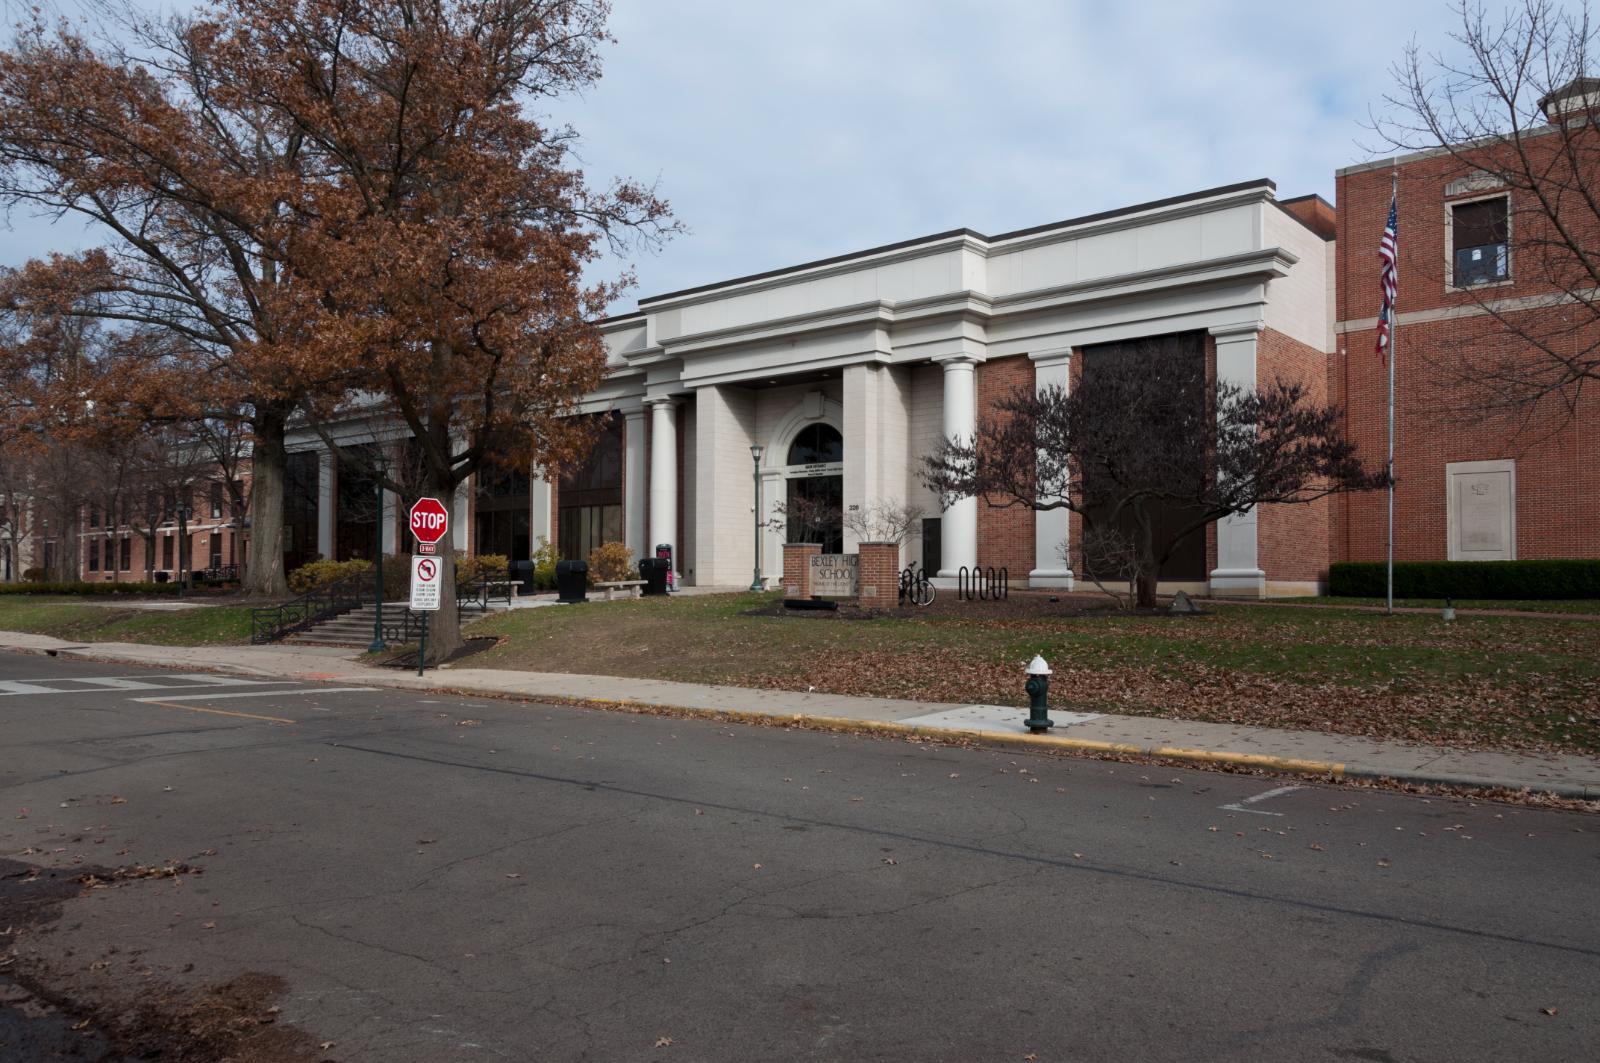
17. Bexley – 129% Home Price Increase Since 2012
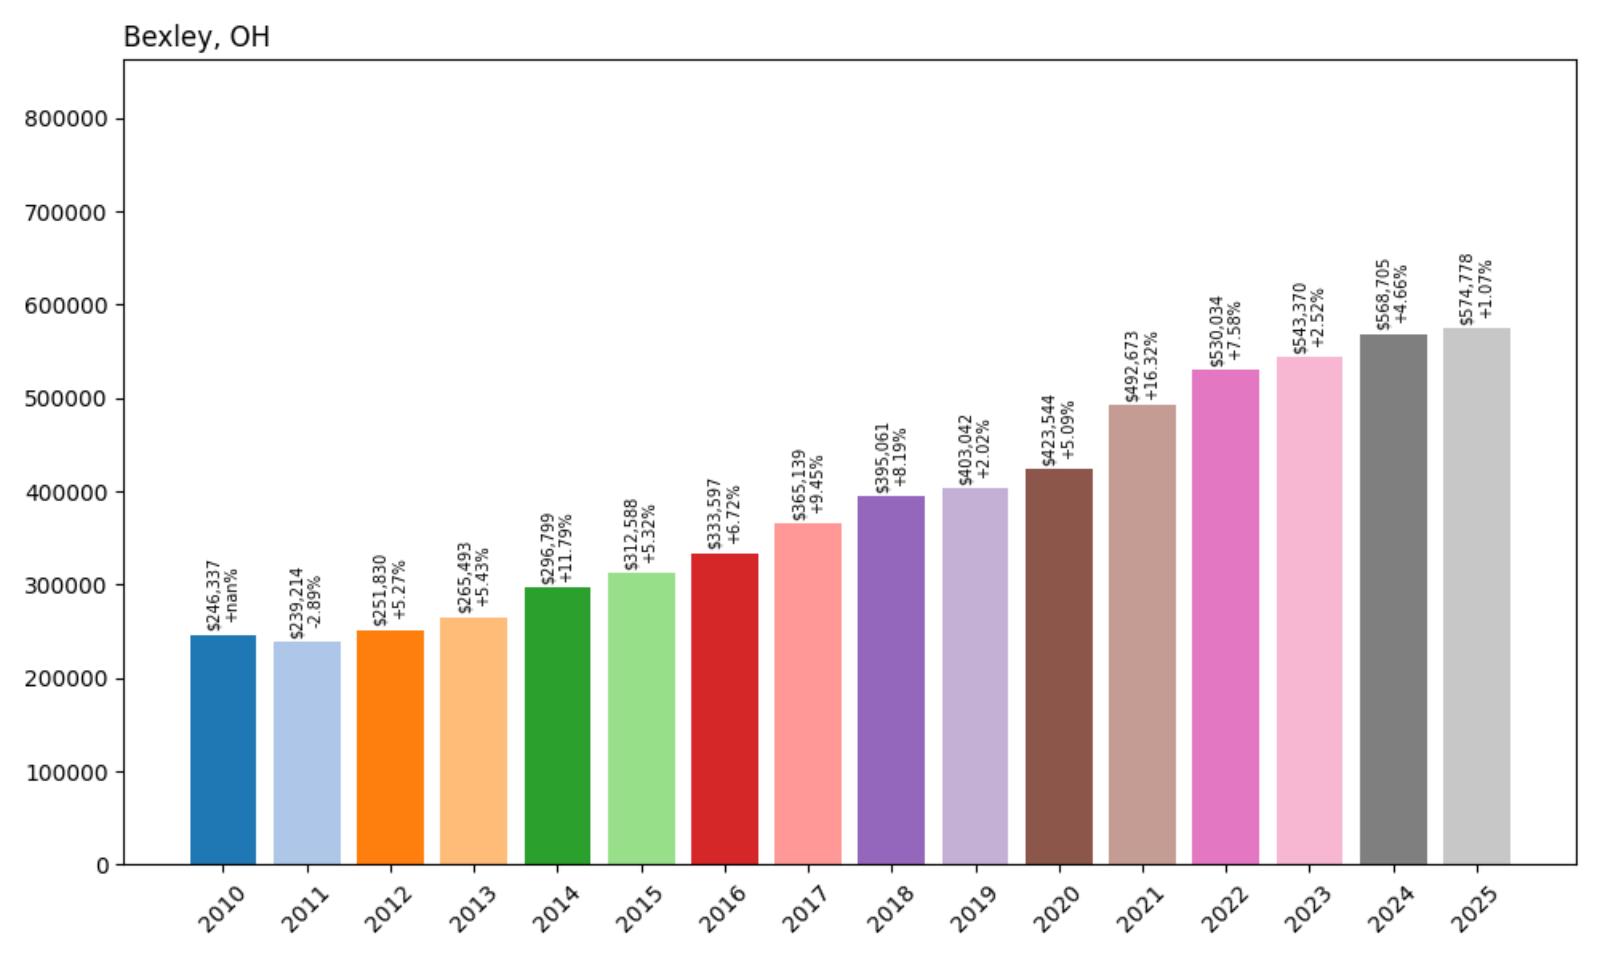
- 2010: $246,337
- 2011: $239,214 (−$7,123, −2.89% from previous year)
- 2012: $251,830 (+$12,616, +5.27% from previous year)
- 2013: $265,493 (+$13,664, +5.43% from previous year)
- 2014: $296,799 (+$31,306, +11.79% from previous year)
- 2015: $312,588 (+$15,789, +5.32% from previous year)
- 2016: $333,597 (+$21,009, +6.72% from previous year)
- 2017: $365,139 (+$31,541, +9.45% from previous year)
- 2018: $395,061 (+$29,922, +8.19% from previous year)
- 2019: $403,042 (+$7,981, +2.02% from previous year)
- 2020: $423,544 (+$20,502, +5.09% from previous year)
- 2021: $492,673 (+$69,130, +16.32% from previous year)
- 2022: $530,034 (+$37,360, +7.58% from previous year)
- 2023: $543,370 (+$13,336, +2.52% from previous year)
- 2024: $568,705 (+$25,335, +4.66% from previous year)
- 2025: $574,778 (+$6,072, +1.07% from previous year)
Bexley has experienced one of the strongest price surges among Ohio’s high-end communities, with home values rising 129% since 2012. After starting at $251,830, prices now average $574,778. The largest gains occurred between 2020 and 2022, but even in more recent years, Bexley has continued to see appreciation, cementing its place near the top of Columbus’s housing ladder.
Bexley – Prestige and Architecture in the Urban Core
Bexley is an inner-ring suburb of Columbus, renowned for its stately homes, tree-lined avenues, and cultural institutions. Home to Capital University and a strong private school network, the city has long attracted academics, executives, and professionals who appreciate its proximity to downtown without sacrificing quality of life. It’s one of the few Columbus neighborhoods where century-old homes sit on wide lots with manicured lawns.
Housing here isn’t just about location—it’s about character. Bexley’s mix of Tudors, Colonials, and custom estates makes it a visual standout in a metro area dominated by postwar development. Limited inventory and ongoing demand have pushed prices upward, with buyers willing to pay a premium for historic charm and walkability. With values now near $575,000, Bexley continues to command top-dollar interest in Central Ohio.
16. Riverlea – 108% Home Price Increase Since 2012
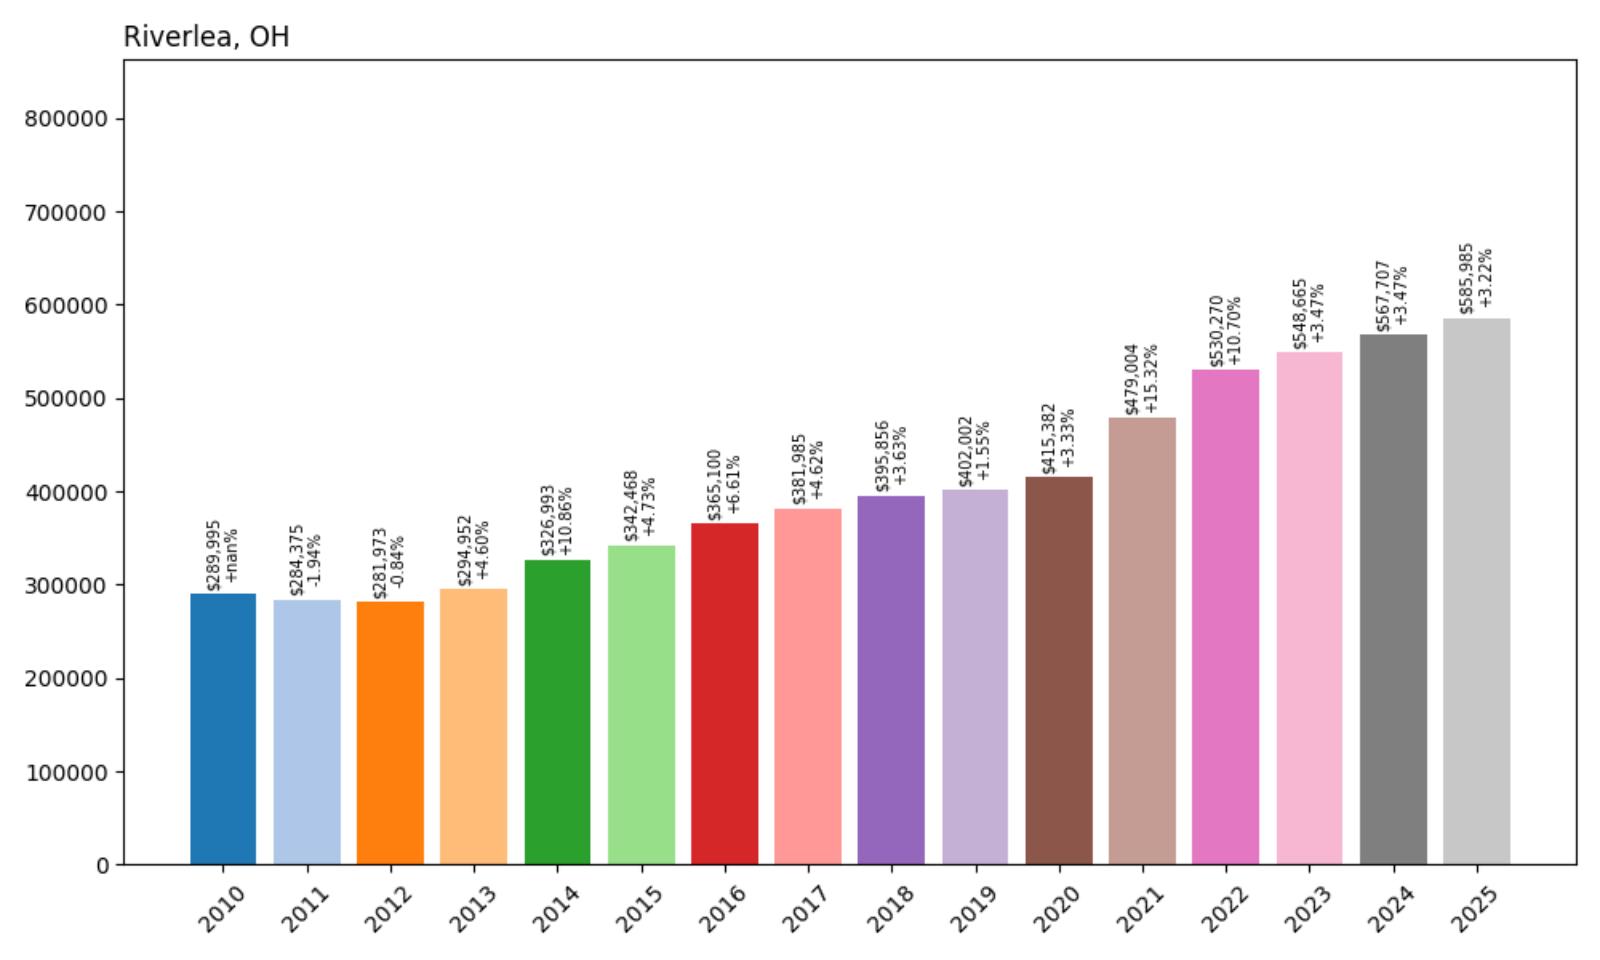
- 2010: $289,995
- 2011: $284,375 (−$5,620, −1.94% from previous year)
- 2012: $281,973 (−$2,402, −0.84% from previous year)
- 2013: $294,952 (+$12,980, +4.60% from previous year)
- 2014: $326,993 (+$32,041, +10.86% from previous year)
- 2015: $342,468 (+$15,475, +4.73% from previous year)
- 2016: $365,100 (+$22,632, +6.61% from previous year)
- 2017: $381,985 (+$16,885, +4.62% from previous year)
- 2018: $395,856 (+$13,871, +3.63% from previous year)
- 2019: $402,002 (+$6,146, +1.55% from previous year)
- 2020: $415,382 (+$13,380, +3.33% from previous year)
- 2021: $479,004 (+$63,622, +15.32% from previous year)
- 2022: $530,270 (+$51,266, +10.70% from previous year)
- 2023: $548,665 (+$18,395, +3.47% from previous year)
- 2024: $567,707 (+$19,043, +3.47% from previous year)
- 2025: $585,985 (+$18,278, +3.22% from previous year)
Riverlea’s home prices have more than doubled since 2012, climbing from $281,973 to $585,985 by 2025—a 108% increase. The town saw especially strong growth between 2020 and 2022, with back-to-back annual gains exceeding $50,000. While growth has moderated since, prices have continued to rise, reflecting the enduring appeal of this small and exclusive enclave.
Riverlea – A Hidden Residential Pocket in Greater Columbus
Riverlea is one of the smallest incorporated communities in Ohio, tucked into Franklin County and surrounded entirely by Worthington. Its quiet residential streets, large lots, and absence of commercial zoning make it a rare find within the Columbus metro. The village is prized for its privacy, classic architecture, and tree-lined setting along the Olentangy River.
Because of its tiny footprint, housing supply in Riverlea is extremely limited, which helps keep demand—and prices—consistently high. The homes here tend to be larger and older, with many dating back to the early 20th century. Residents benefit from Worthington Schools and proximity to downtown Columbus, but enjoy a level of seclusion that’s increasingly rare in urban-adjacent suburbs. In 2025, Riverlea remains one of the most exclusive and expensive small-town housing markets in Central Ohio.
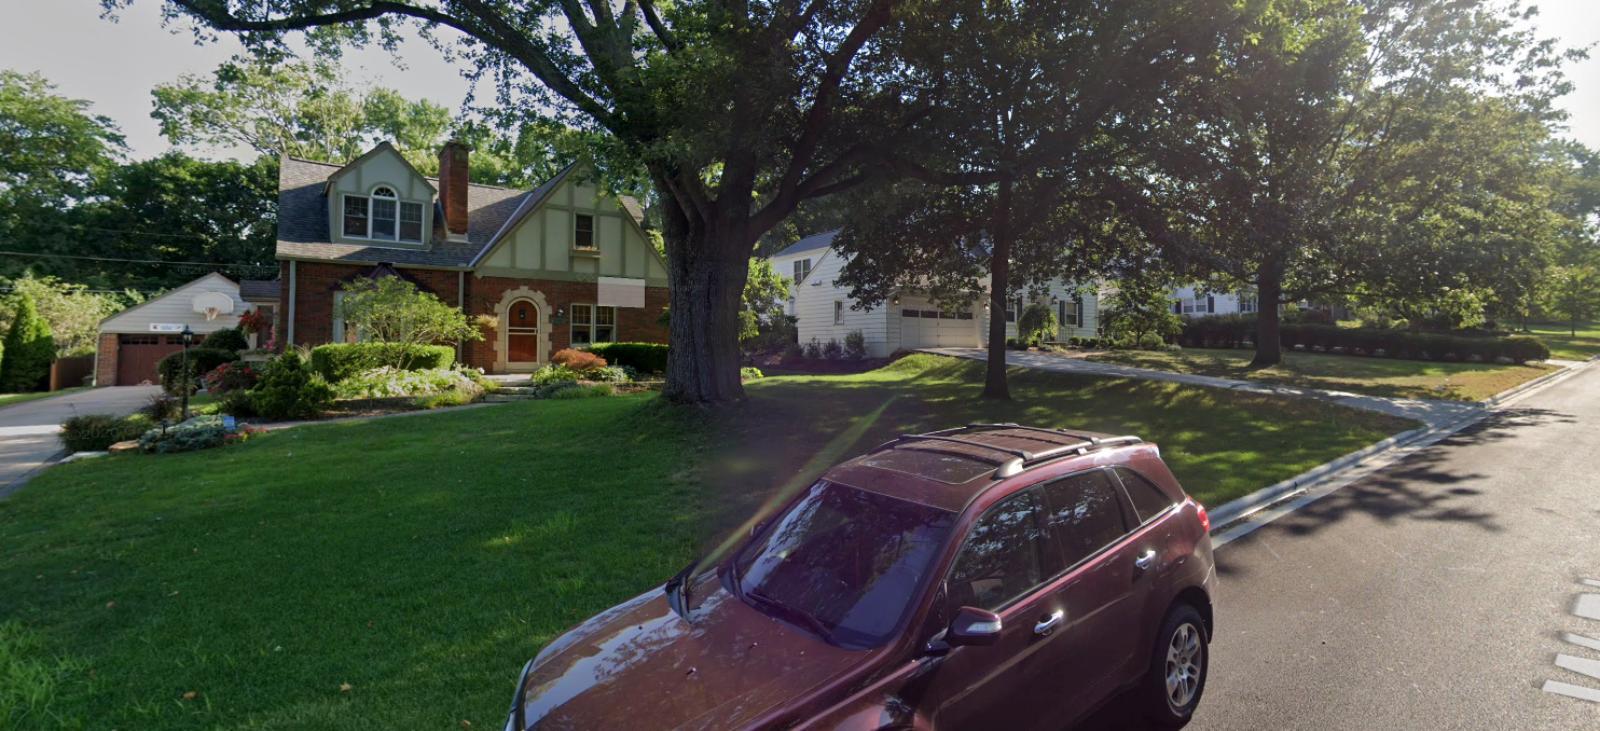
15. Amberley – 107.4% Home Price Increase Since 2011
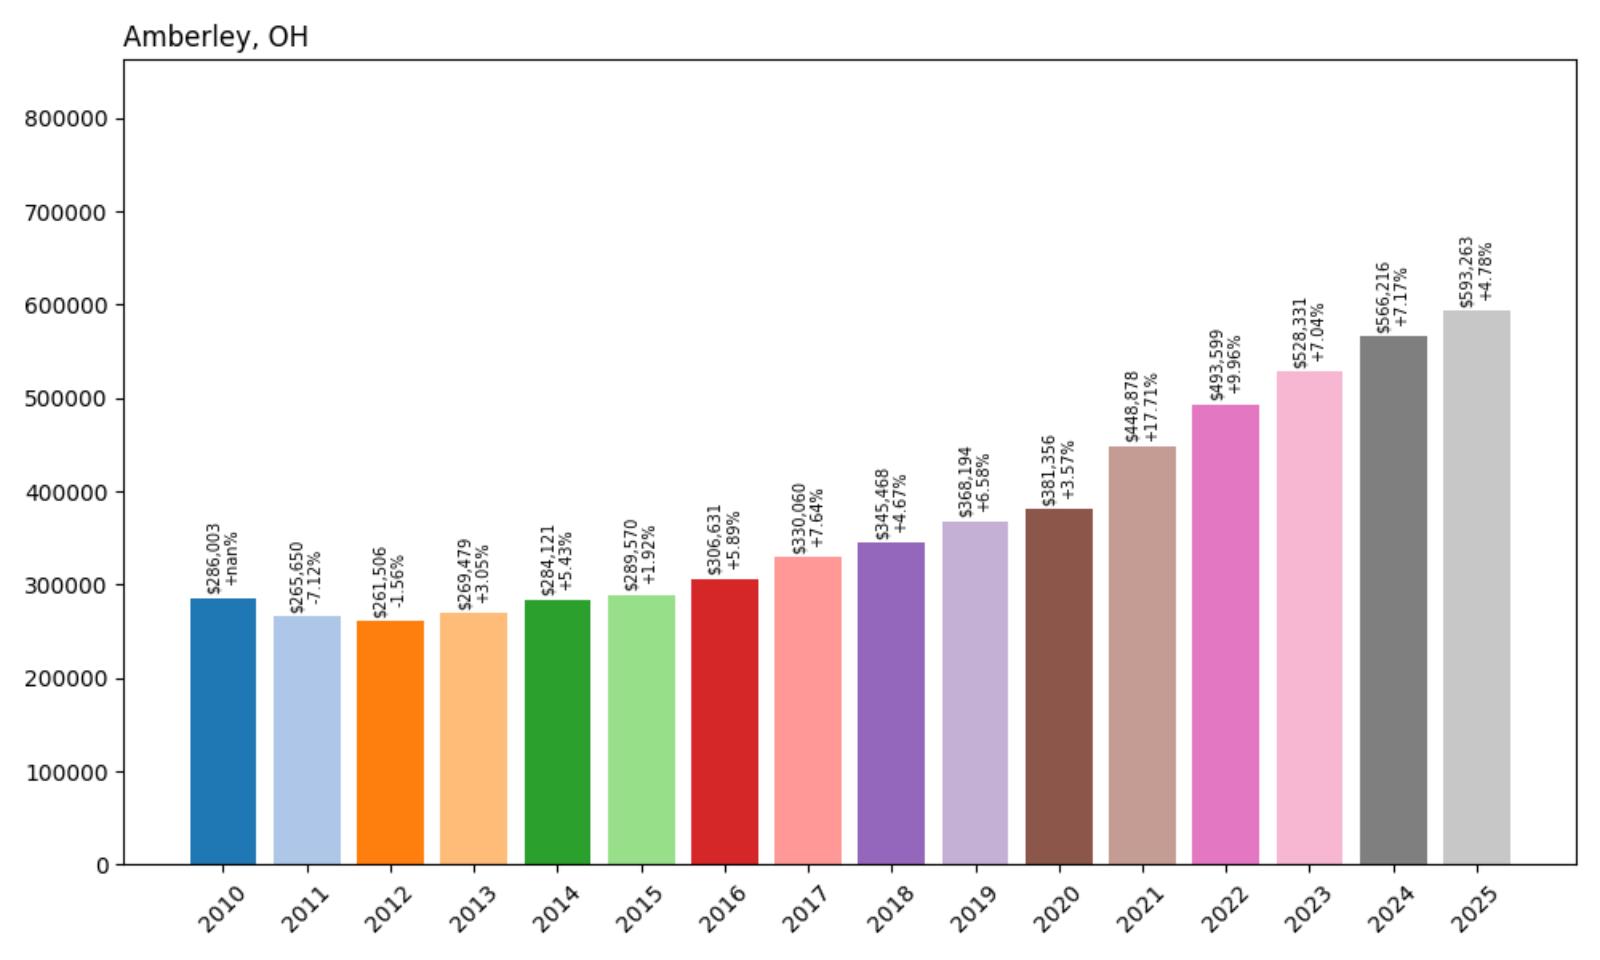
- 2010: $286,003
- 2011: $265,650
- 2012: $261,506
- 2013: $269,479
- 2014: $284,121
- 2015: $289,570
- 2016: $306,631
- 2017: $330,060
- 2018: $345,468
- 2019: $368,194
- 2020: $381,356
- 2021: $448,878
- 2022: $493,599
- 2023: $528,331
- 2024: $566,216
- 2025: $593,263
Home values in Amberley have seen a notable 107.4% increase since 2011, rising from $265,650 to $593,263 in 2025. After a dip in the early 2010s, values steadily climbed year-over-year, especially after 2020 when pandemic-related housing demand pushed prices higher. Even in the more recent years, Amberley has maintained solid momentum, adding nearly $65,000 in value between 2022 and 2025. This consistent growth suggests a stable and desirable local housing market with long-term appreciation potential.
Amberley – Steady Gains in a Peaceful Suburb
Amberley, a quiet village nestled just north of Cincinnati, has quietly become one of the most desirable suburbs in Hamilton County. Known for its leafy streets, large lots, and family-friendly atmosphere, the village offers a suburban feel with easy access to city amenities. Its proximity to major highways like I-71 and I-75 makes commuting simple, while the community itself prioritizes green space, with French Park and other nature areas dotting the landscape. The lack of commercial sprawl adds to its residential appeal, and with only a few thousand residents, the housing stock remains limited and in high demand. As homebuyers look for stability and quality of life, Amberley continues to attract attention.
The impressive price appreciation in Amberley is rooted in both demand and zoning. With larger homes and more restrictive development rules, new supply hasn’t kept up with interest, which keeps prices strong. The boom in remote work also added to Amberley’s appeal, allowing buyers to prioritize living in peaceful, well-maintained areas over more urban spots. Local school options and proximity to top-rated private institutions add further value, especially for families. The 2021 surge of over $67,000 in just one year is a clear example of how Amberley captured regional buying power during a competitive market wave and hasn’t let go of those gains since.
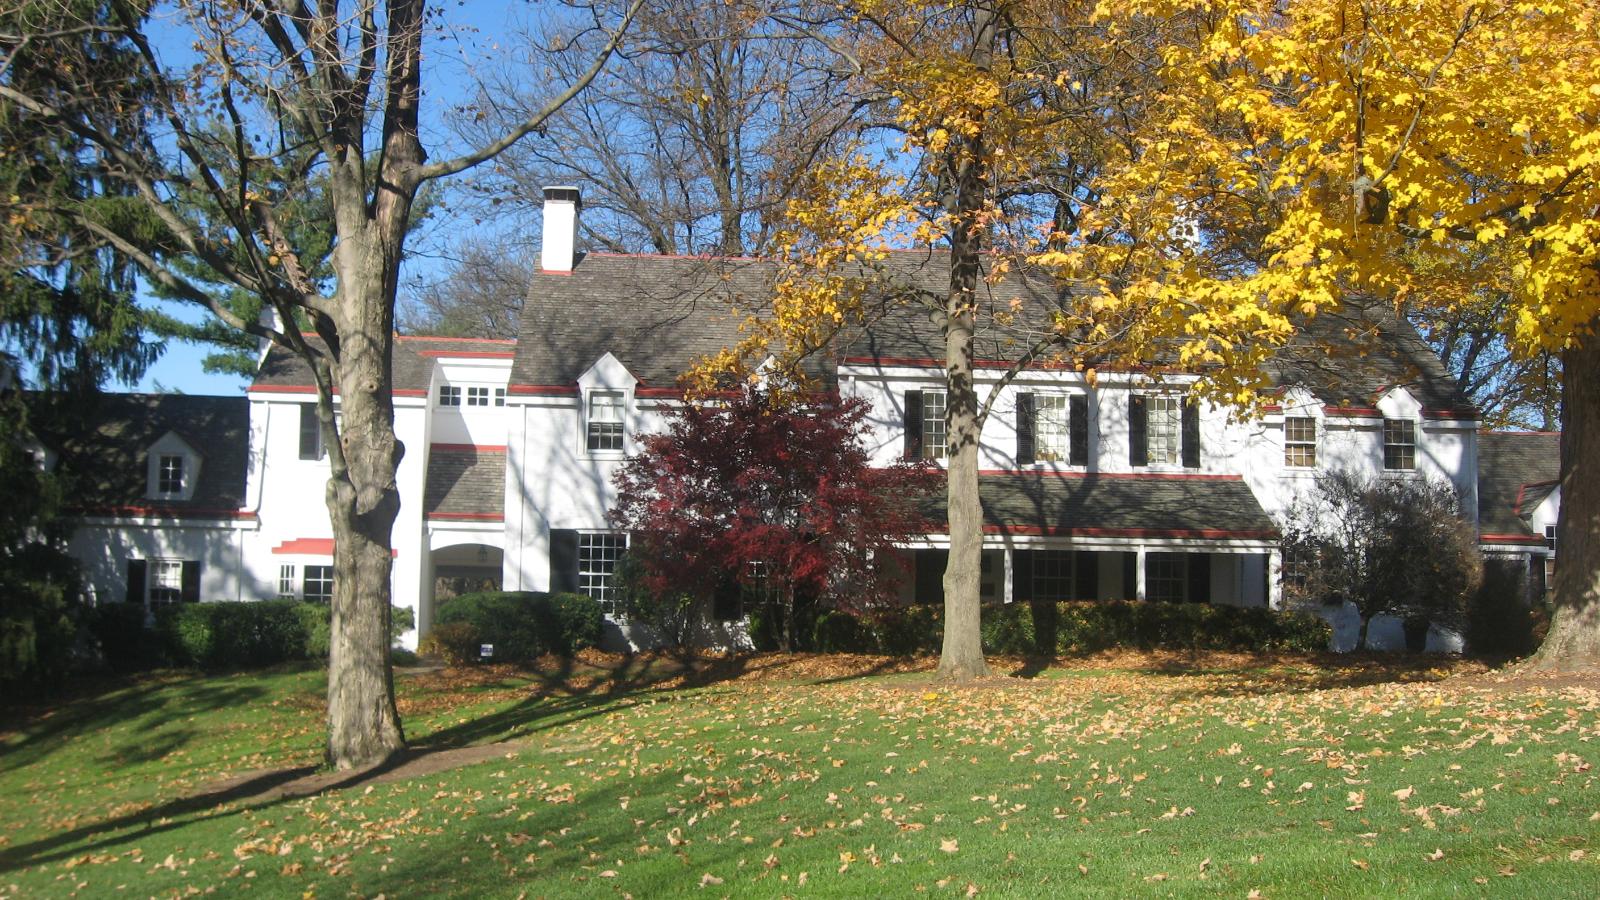
14. New Albany – 102.9% Home Price Increase Since 2011
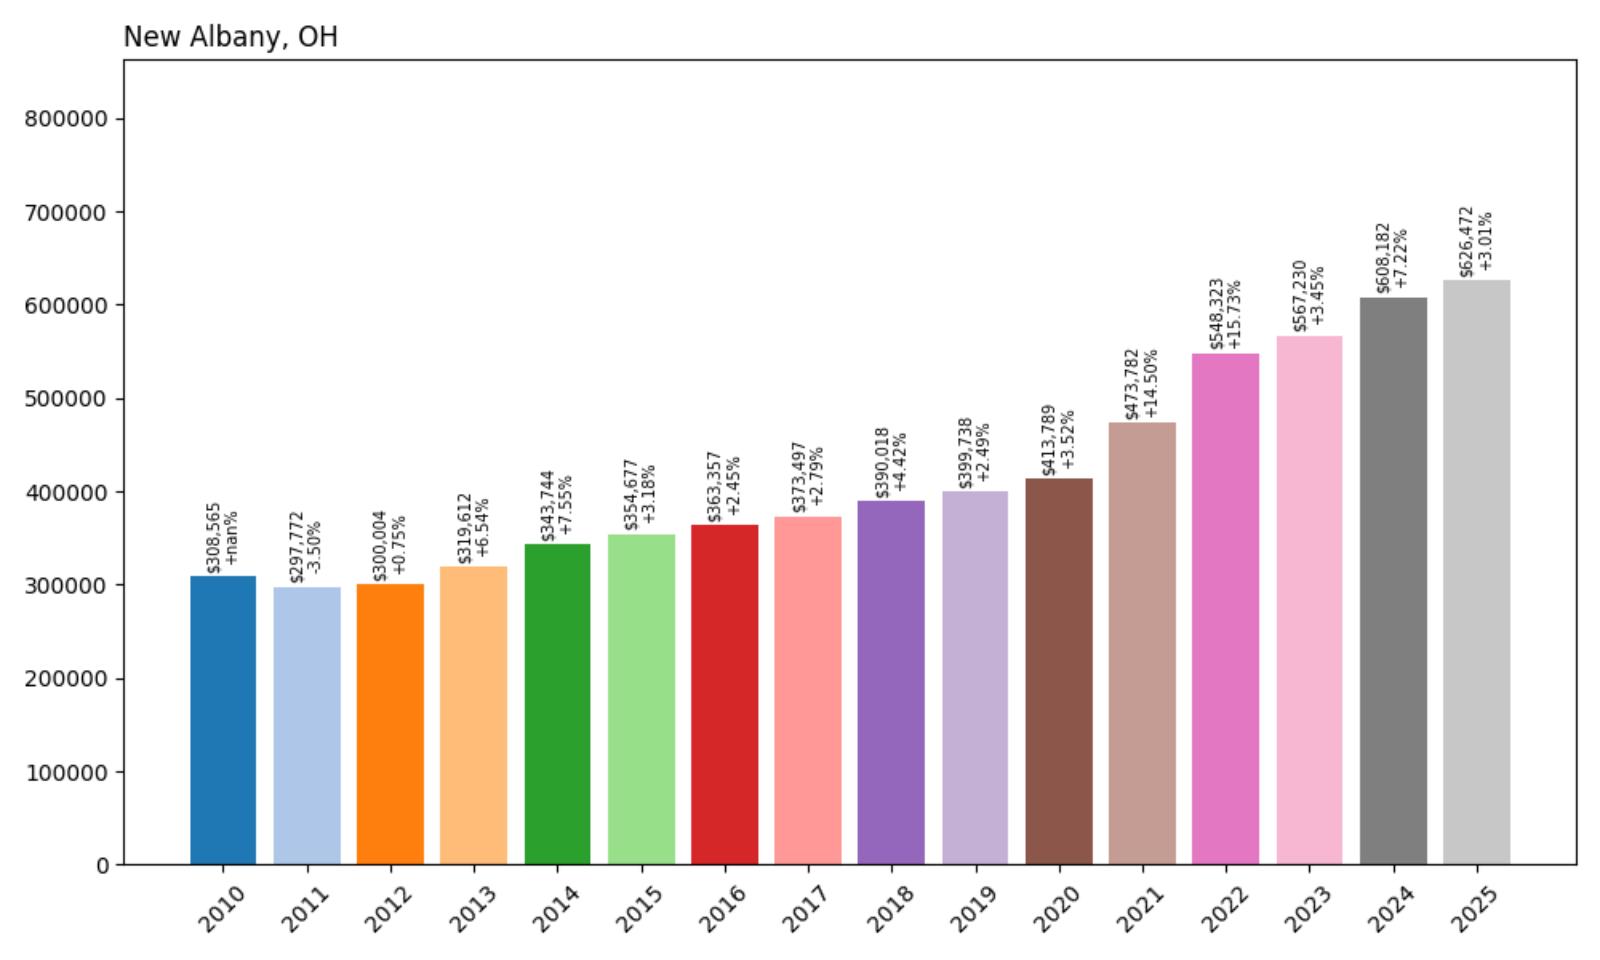
- 2010: $308,565
- 2011: $297,772
- 2012: $300,004
- 2013: $319,612
- 2014: $343,744
- 2015: $354,677
- 2016: $363,357
- 2017: $373,497
- 2018: $390,018
- 2019: $399,738
- 2020: $413,789
- 2021: $473,782
- 2022: $548,323
- 2023: $567,230
- 2024: $608,182
- 2025: $626,472
New Albany’s home values have more than doubled in just 14 years, with the average price rising from $297,772 in 2011 to $626,472 in 2025. That 102.9% gain reflects a powerful mix of suburban demand and New Albany’s well-known status as one of central Ohio’s most upscale communities. Price jumps in 2021 and 2022 added nearly $135,000 in just two years, driven by new development and an influx of high-income households.
New Albany – Elite Living and Top-Tier Amenities
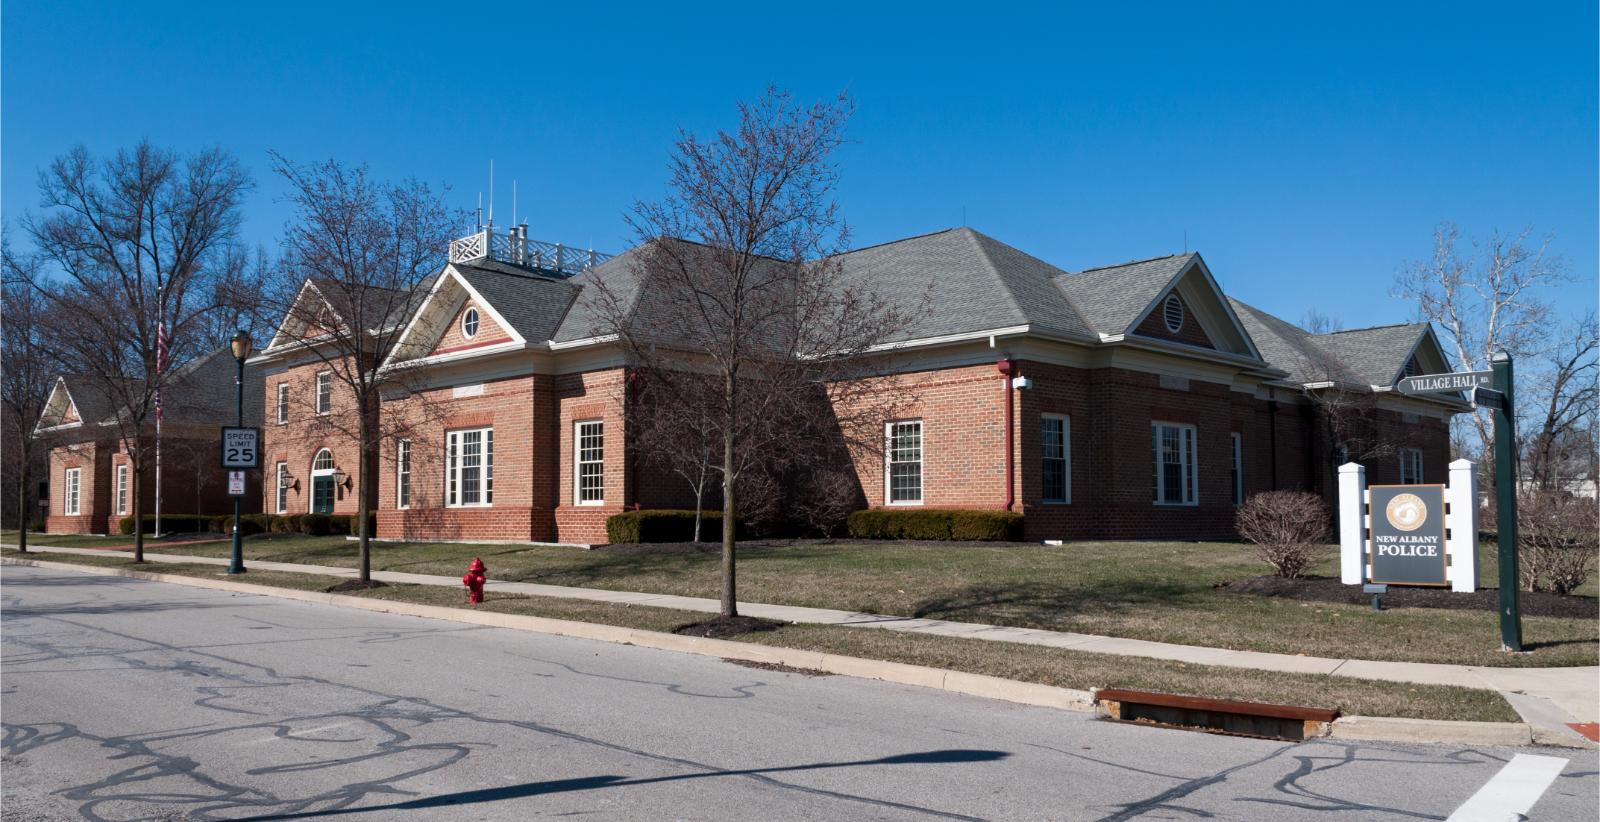
New Albany is often cited as one of Ohio’s premier planned communities, and for good reason. Located northeast of Columbus, it blends upscale residential neighborhoods with corporate campuses, high-performing schools, and meticulous design standards. The town has benefited significantly from its proximity to the Intel semiconductor site under construction in Licking County, drawing in talent and boosting regional prestige. Wide boulevards, pedestrian paths, and curated retail areas help distinguish New Albany from typical suburbs, giving it a distinctly modern and intentional feel.
From a housing perspective, New Albany appeals to buyers looking for luxury and predictability. Homes here are generally newer, larger, and meticulously maintained, driving up baseline values. It also benefits from a strong school system and strategic investments in civic infrastructure. The leap in prices between 2020 and 2022—up more than $134,000—wasn’t a fluke; it coincided with national attention on central Ohio’s growth corridor and speculative interest ahead of tech industry expansion. Even with growth slowing to single digits in recent years, New Albany remains firmly among Ohio’s most expensive and competitive towns.
13. Upper Arlington – 125% Home Price Increase Since 2011
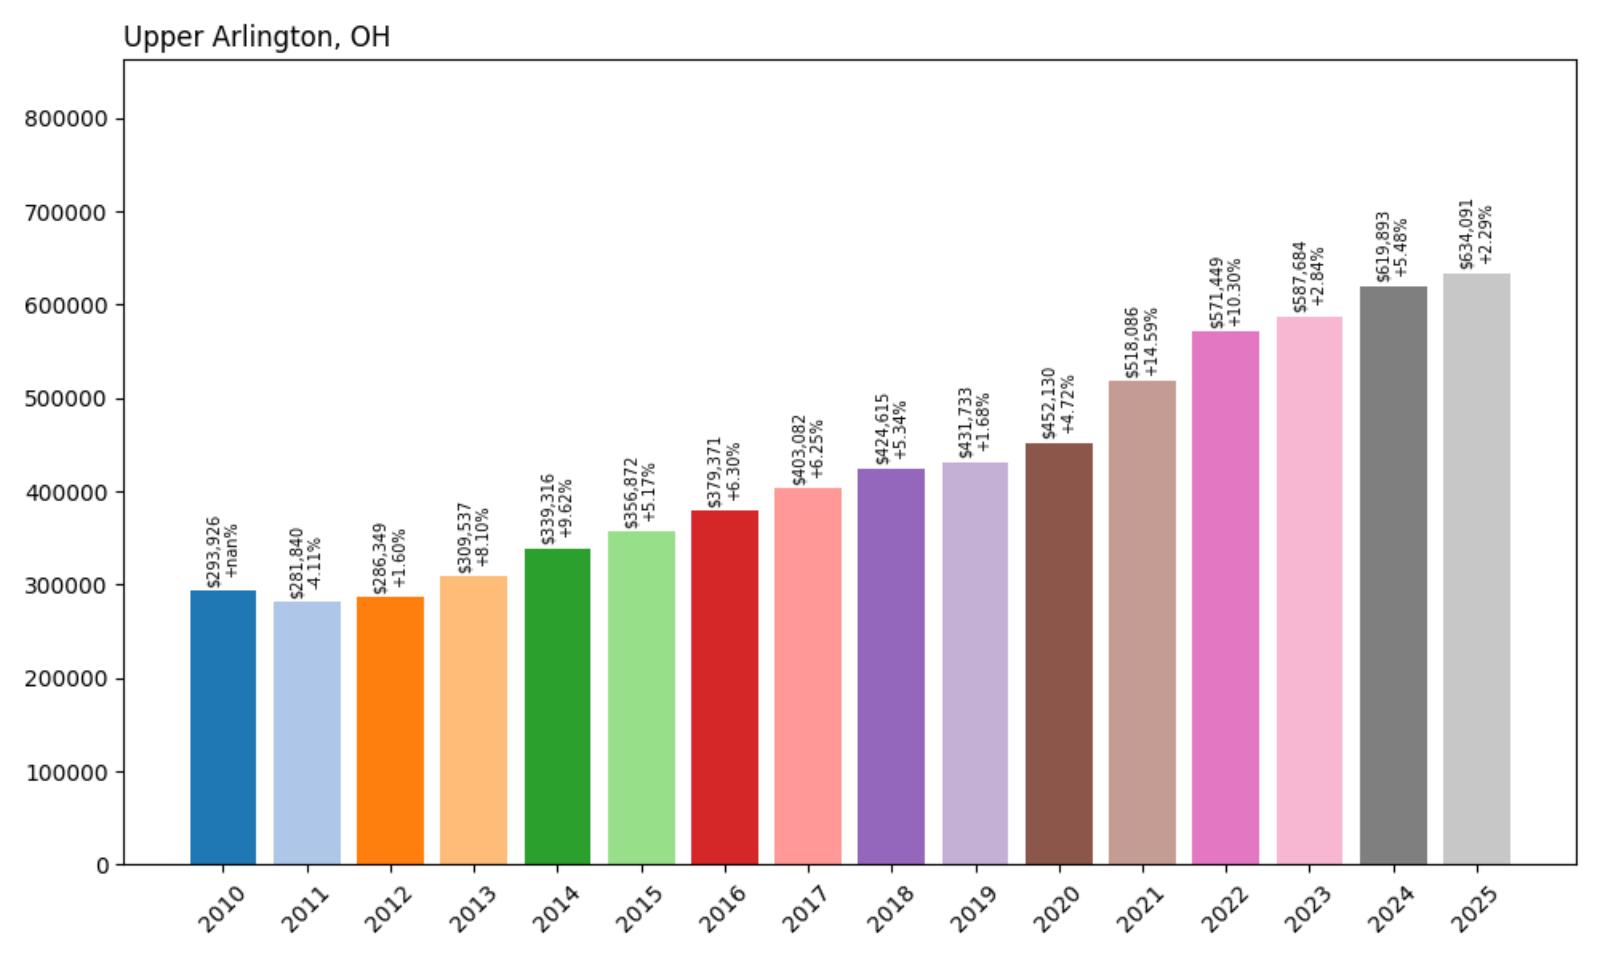
- 2010: $293,926
- 2011: $281,840
- 2012: $286,349
- 2013: $309,537
- 2014: $339,316
- 2015: $356,872
- 2016: $379,371
- 2017: $403,082
- 2018: $424,615
- 2019: $431,733
- 2020: $452,130
- 2021: $518,086
- 2022: $571,449
- 2023: $587,684
- 2024: $619,893
- 2025: $634,091
Upper Arlington’s average home price jumped from $281,840 in 2011 to $634,091 in 2025, a 125% increase that places it among the top gainers in the Columbus metro. Prices rose steadily, with particularly strong momentum between 2020 and 2022. Even with modest growth in the last two years, values remain high, confirming Upper Arlington’s status as one of central Ohio’s most stable and sought-after areas.
Upper Arlington – Historic Charm Meets Modern Growth
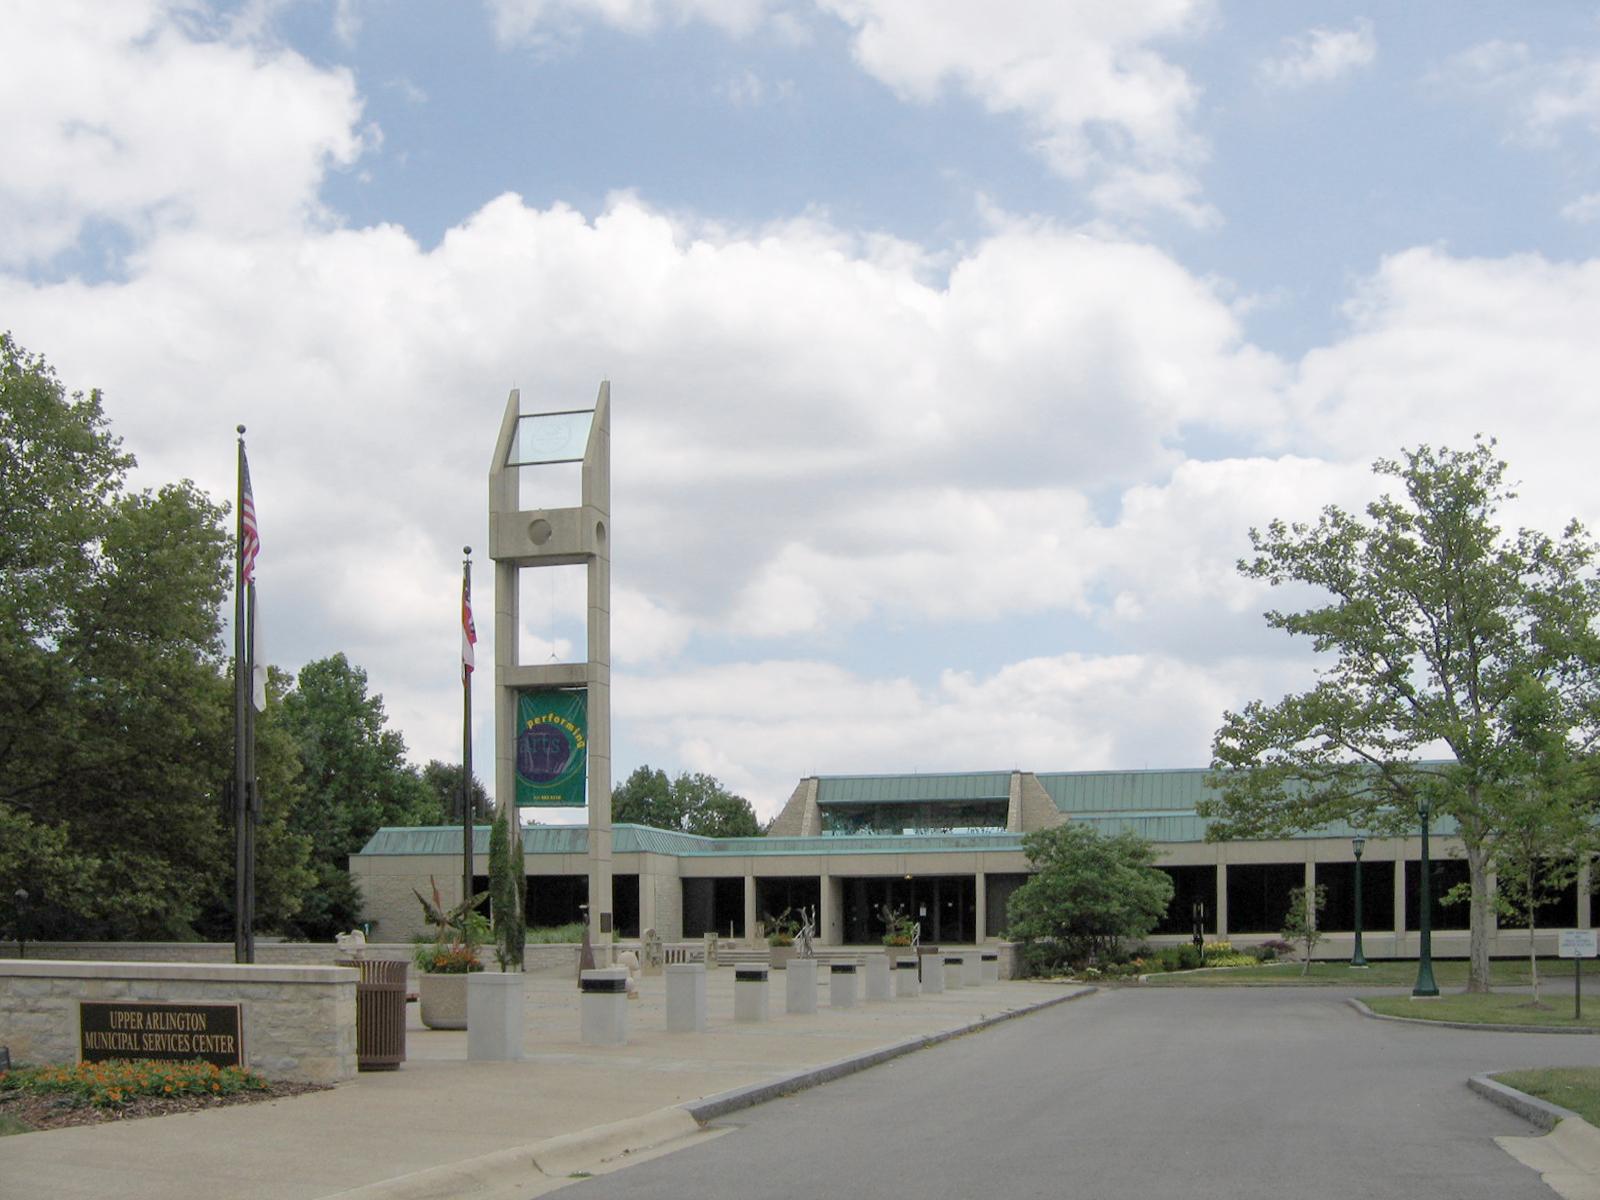
Located directly northwest of downtown Columbus, Upper Arlington offers a rare blend of historic neighborhoods and top-rated public services. Known for its classic architecture, tree-lined streets, and excellent schools, the city has long attracted professionals, families, and retirees alike. Its location near Ohio State University and the Scioto River provides easy access to employment and recreation, while a proactive city government keeps infrastructure and services ahead of the curve. These strengths have translated into sustained housing demand and rising values, particularly in the post-2020 real estate boom.
From a pricing standpoint, Upper Arlington’s market has matured steadily. Even before the pandemic, values were already climbing thanks to limited land availability and careful redevelopment policies. As demand surged regionally in 2021, local home prices leapt by more than $65,000 in a single year, followed by strong gains in 2022. Unlike newer suburbs, Upper Arlington’s appeal lies in its stability, walkability, and proximity to the urban core—factors that continue to push buyers toward this well-established enclave despite its premium price tag.
12. Galena – 105.7% Home Price Increase Since 2011
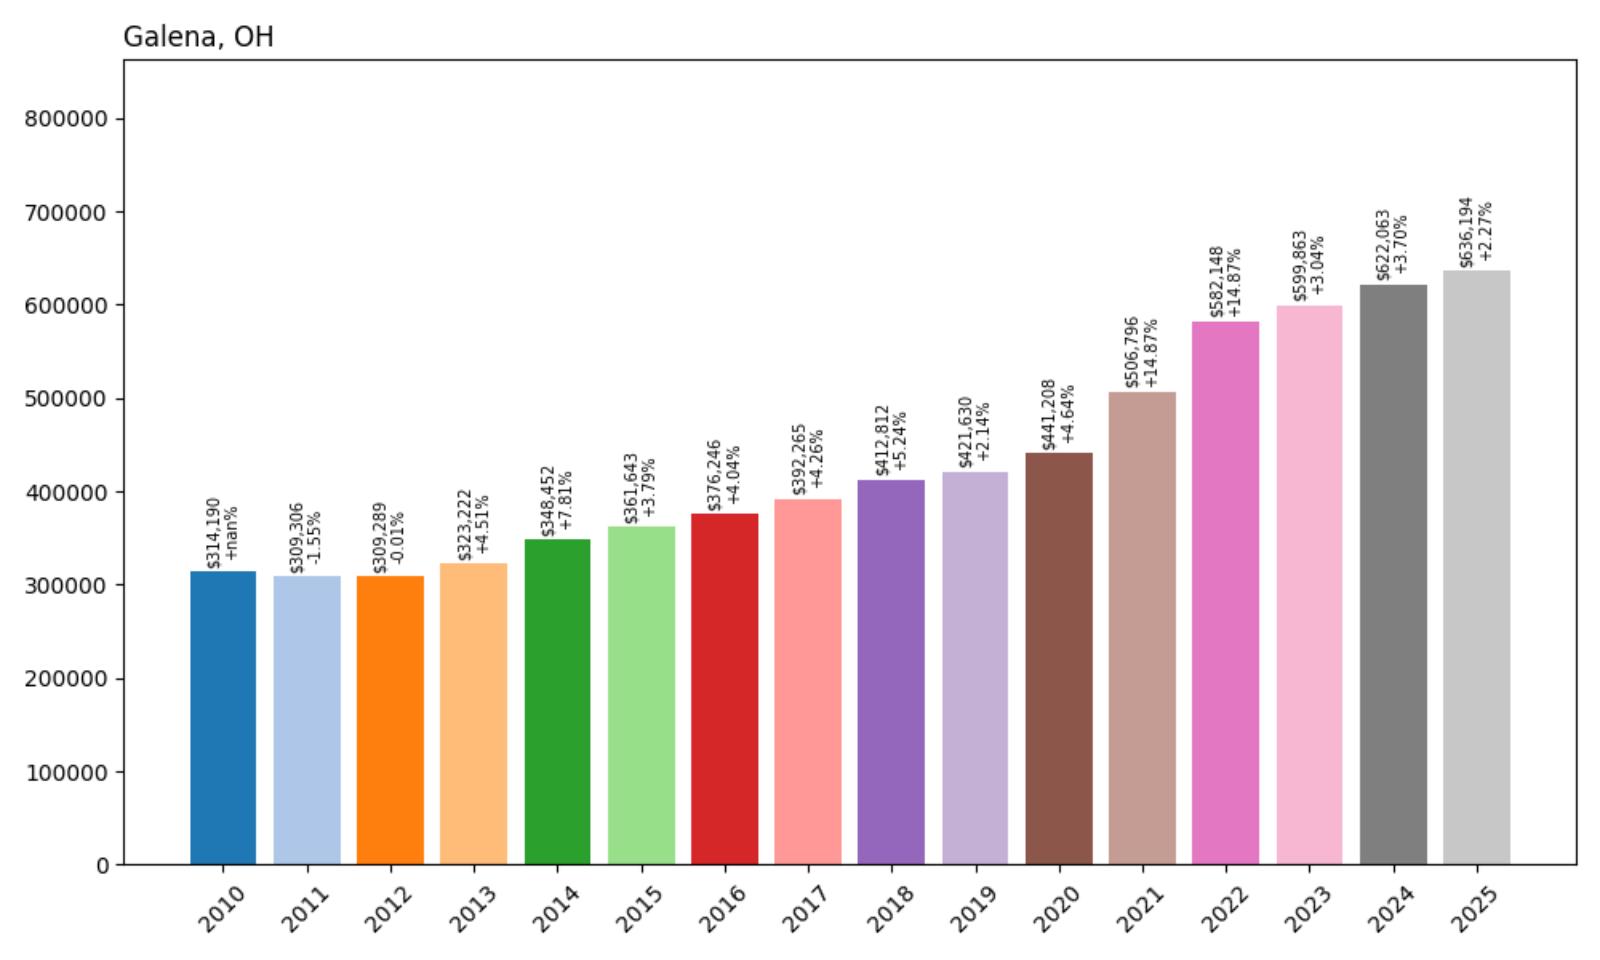
- 2010: $314,190
- 2011: $309,306
- 2012: $309,289
- 2013: $323,222
- 2014: $348,452
- 2015: $361,643
- 2016: $376,246
- 2017: $392,265
- 2018: $412,812
- 2019: $421,630
- 2020: $441,208
- 2021: $506,796
- 2022: $582,148
- 2023: $599,863
- 2024: $622,063
- 2025: $636,194
Galena home prices have surged from $309,306 in 2011 to $636,194 in 2025—a 105.7% increase. This village northeast of Columbus has experienced some of the fastest growth in Delaware County. Gains during 2021 and 2022 alone added more than $140,000 in value, reflecting high demand for upscale suburban living near fast-growing employment centers.
Galena – Growth Fueled by Location and New Construction
Galena may be small in population, but it has become a major force in central Ohio’s housing scene. Located near the Hoover Reservoir and within the Big Walnut School District, the village appeals to families seeking space, quiet, and quality education. Recent residential developments have transformed Galena into a prime spot for new construction, with spacious homes and modern amenities drawing interest from both local and out-of-state buyers. Its proximity to Polaris, Intel’s planned site in New Albany, and the SR-3 corridor only boosts its convenience and long-term appeal.
Unlike older communities limited by aging infrastructure, Galena has been able to grow quickly without compromising livability. New neighborhoods are designed with walking trails, green space, and community features that reflect current buyer preferences. These characteristics helped Galena post one of the strongest runs in central Ohio during the early 2020s, with double-digit annual gains. And though appreciation has slowed slightly since 2023, values remain at record highs thanks to continued construction and interest in Delaware County’s high-growth corridor.
11. Montgomery – 100.6% Home Price Increase Since 2012
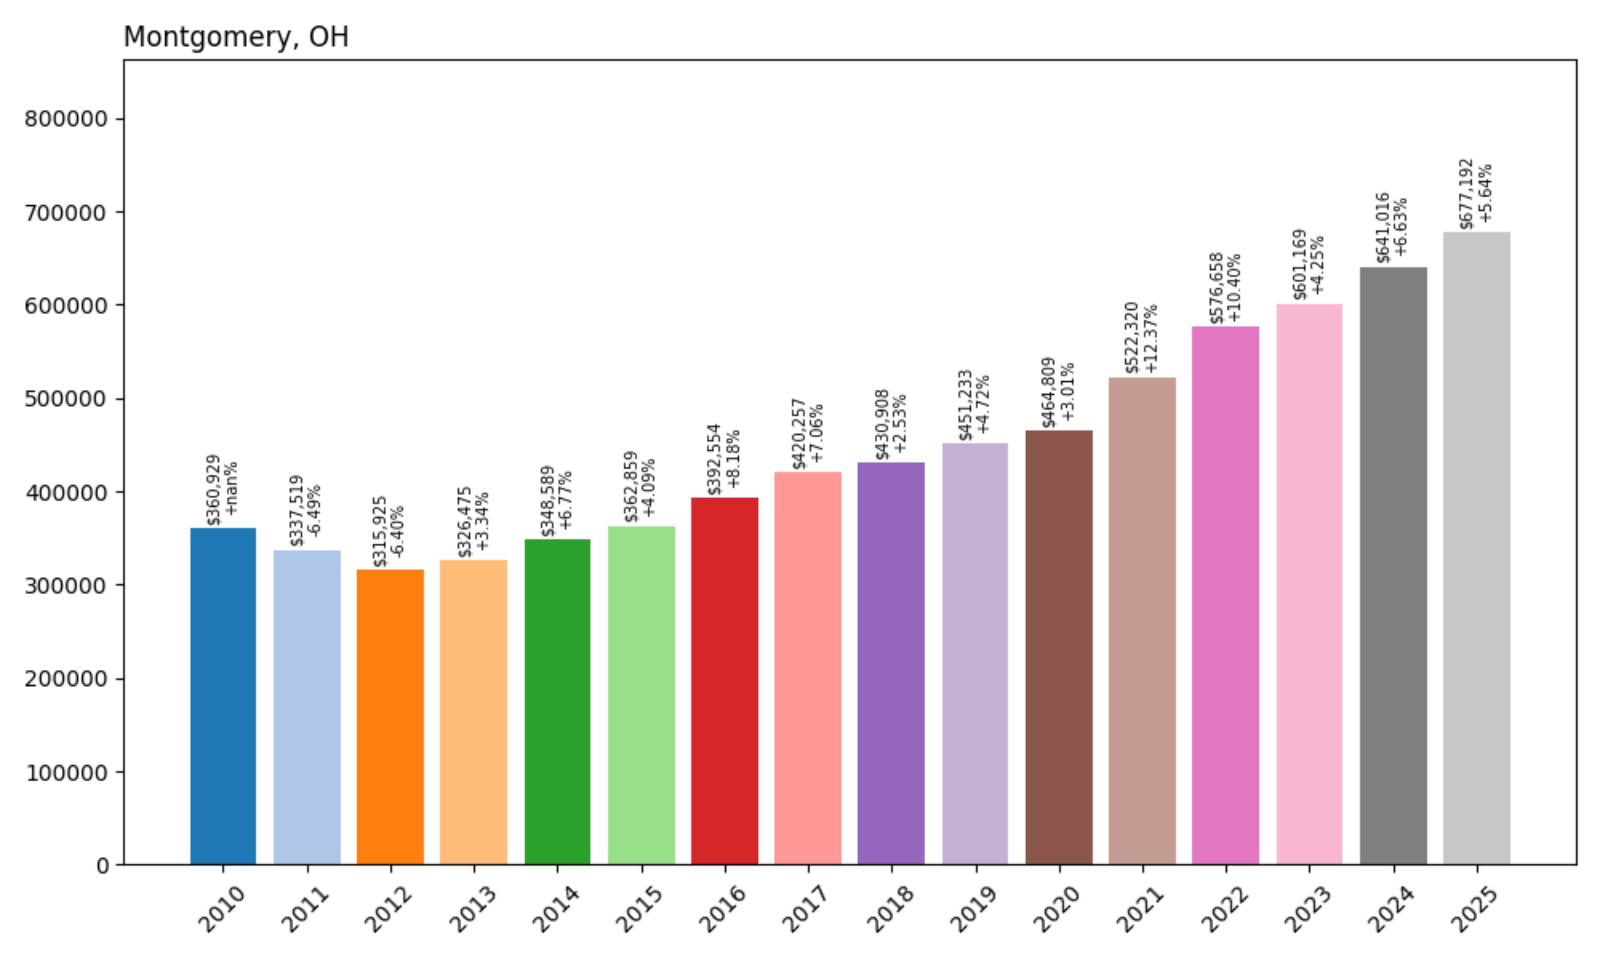
- 2010: $360,929
- 2011: $337,519
- 2012: $315,925
- 2013: $326,475
- 2014: $348,589
- 2015: $362,859
- 2016: $392,554
- 2017: $420,257
- 2018: $430,908
- 2019: $451,233
- 2020: $464,809
- 2021: $522,320
- 2022: $576,658
- 2023: $601,169
- 2024: $641,016
- 2025: $677,192
Montgomery has doubled its average home price since 2012, growing from $315,925 to $677,192 in 2025—a 100.6% increase. The town saw especially strong jumps after 2020, gaining more than $150,000 in just five years. The consistent growth pattern reflects Montgomery’s strong local economy, stable real estate stock, and continued appeal among Cincinnati-area buyers.
Montgomery – Cincinnati Suburb With Staying Power
Montgomery is a northern suburb of Cincinnati that consistently ranks among the region’s most desirable places to live. With a walkable town center, strong public schools, and a wide range of restaurants and retail, it combines the charm of a small town with the convenience of modern amenities. Historic preservation is a priority here, with older homes mixed alongside high-end newer construction. Buyers are drawn to Montgomery not just for aesthetics, but for community stability, low crime rates, and proximity to I-275 and I-71 for commuting ease.
The post-2020 price acceleration in Montgomery speaks to how it has maintained desirability across economic cycles. While other areas may have experienced volatility, Montgomery’s gains were steady and well-supported by fundamentals. Between 2020 and 2025, the average home price rose over $212,000. This wasn’t speculative—it was driven by real buyer interest in a community that offers both livability and long-term value. With limited buildable land and consistent buyer demand, Montgomery is likely to remain one of Ohio’s most resilient housing markets well into the future.
10. Pepper Pike – 75.9% Home Price Increase Since 2011
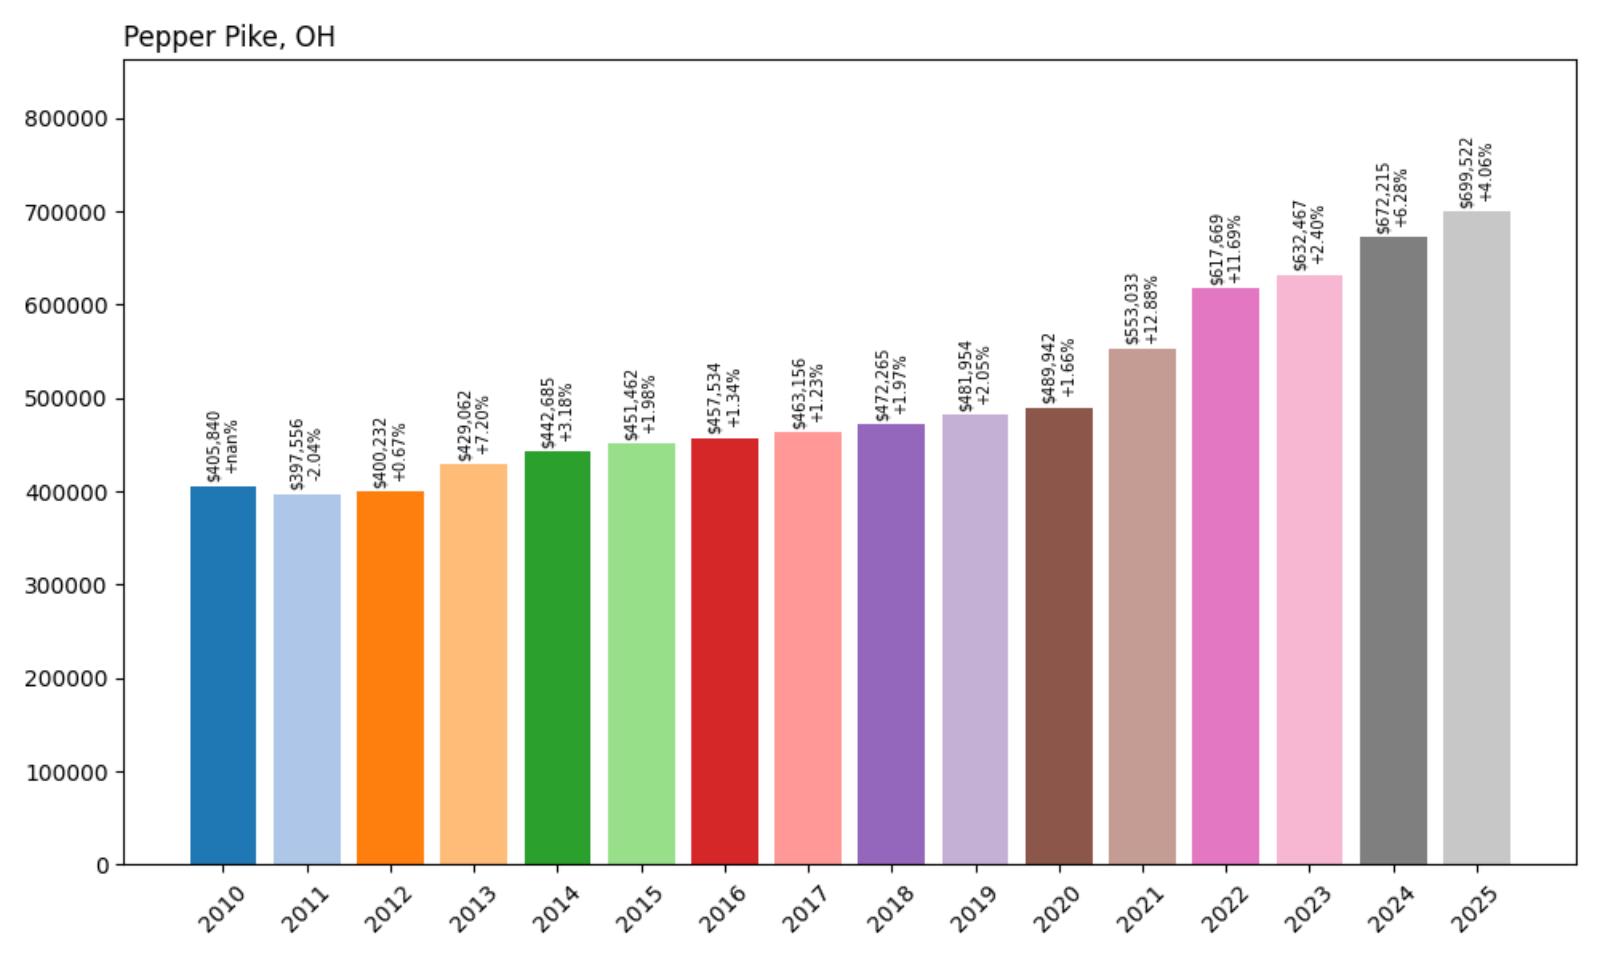
- 2010: $405,840
- 2011: $397,556
- 2012: $400,232
- 2013: $429,062
- 2014: $442,685
- 2015: $451,462
- 2016: $457,534
- 2017: $463,156
- 2018: $472,265
- 2019: $481,954
- 2020: $489,942
- 2021: $553,033
- 2022: $617,669
- 2023: $632,467
- 2024: $672,215
- 2025: $699,522
Pepper Pike’s home prices have climbed from $397,556 in 2011 to $699,522 in 2025, a 75.9% increase over 14 years. Though growth was modest in the early 2010s, the town saw a notable surge between 2020 and 2022, gaining nearly $128,000 in just two years. Even with a return to slower appreciation in recent years, prices have remained on an upward trajectory in this affluent Cleveland suburb.
Pepper Pike – Prestige and Privacy in the East Side Suburbs
Pepper Pike stands out as one of northeast Ohio’s most exclusive communities, known for its sprawling estates, wooded lots, and privacy-focused zoning. The city, located just east of Cleveland, attracts high-income professionals and retirees seeking quiet luxury. Its location near the I-271 corridor provides convenience without compromising serenity. Many homes here are custom builds with generous square footage, contributing to higher price points and consistent buyer interest even in shifting markets.
The massive gains seen in 2021 and 2022 reflect how Pepper Pike benefited from the migration of buyers seeking more space during the remote-work boom. The architectural variety—from mid-century modern to stately colonials—also draws a unique set of home shoppers. While annual price growth has slowed to more moderate levels, the long-term appeal of Pepper Pike remains tied to its exclusivity, excellent schools, and proximity to institutions like the Cleveland Clinic and University Hospitals. Homes here are rarely on the market long, and the town’s housing stock continues to command a premium.
9. Moreland Hills – 86.4% Home Price Increase Since 2011
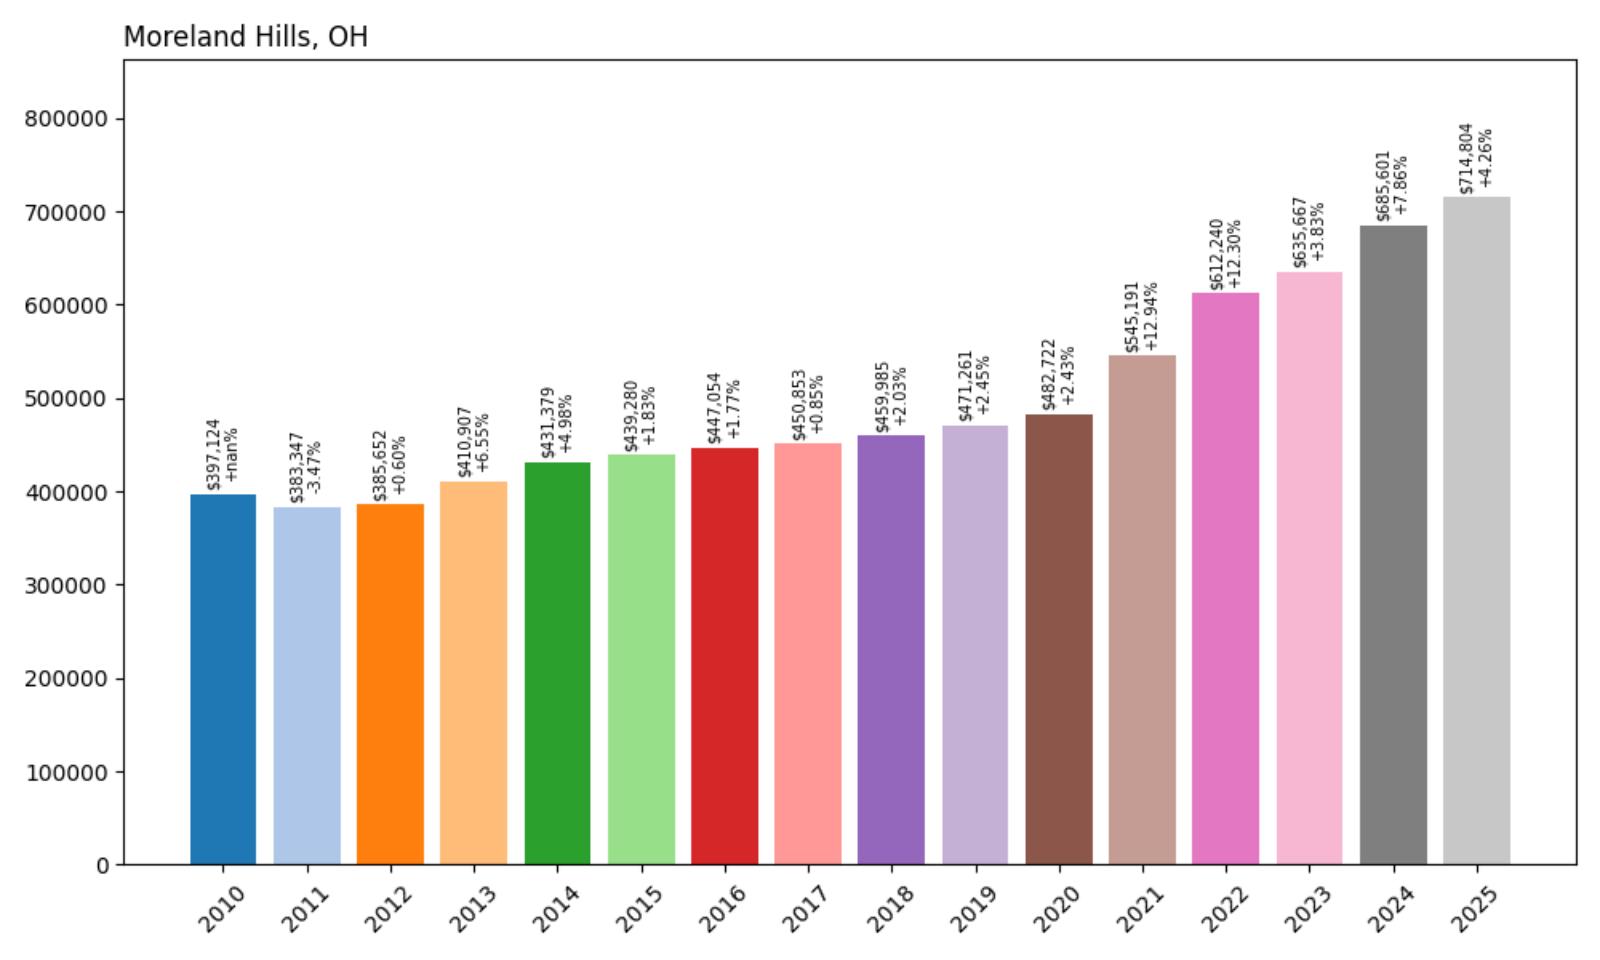
- 2010: $397,124
- 2011: $383,347
- 2012: $385,652
- 2013: $410,907
- 2014: $431,379
- 2015: $439,280
- 2016: $447,054
- 2017: $450,853
- 2018: $459,985
- 2019: $471,261
- 2020: $482,722
- 2021: $545,191
- 2022: $612,240
- 2023: $635,667
- 2024: $685,601
- 2025: $714,804
Since 2011, Moreland Hills has seen its average home price rise by 86.4%, jumping from $383,347 to $714,804. Much of this growth has come in recent years, particularly between 2020 and 2025, during which time prices soared by over $230,000. The town’s strong real estate fundamentals and location in a coveted east side suburb have helped it maintain momentum well into the mid-2020s.
Moreland Hills – Upscale Living on Spacious Grounds
Moreland Hills offers a rare combination of rural charm and suburban luxury. This quiet suburb, located near Pepper Pike and Chagrin Falls, is known for its large parcels, winding roads, and woodland views. It’s a place where privacy and nature are highly valued, and where new development is carefully managed to preserve the area’s character. With top-rated schools and easy access to upscale shopping and dining in nearby areas, Moreland Hills consistently appeals to high-net-worth buyers looking for space and elegance.
The substantial rise in home values since 2020 speaks to shifting buyer preferences toward more secluded, high-quality homes with acreage. Many of the homes in Moreland Hills are custom-designed and feature premium finishes, which contributes to elevated price points. The market here is less about volume and more about exclusivity, and the strong appreciation reflects a community that has benefitted from steady demand and limited supply. As long as northeast Ohio’s affluent households continue to prioritize quality over density, Moreland Hills is likely to remain a standout.
8. Marble Cliff – 53.3% Home Price Increase Since 2016
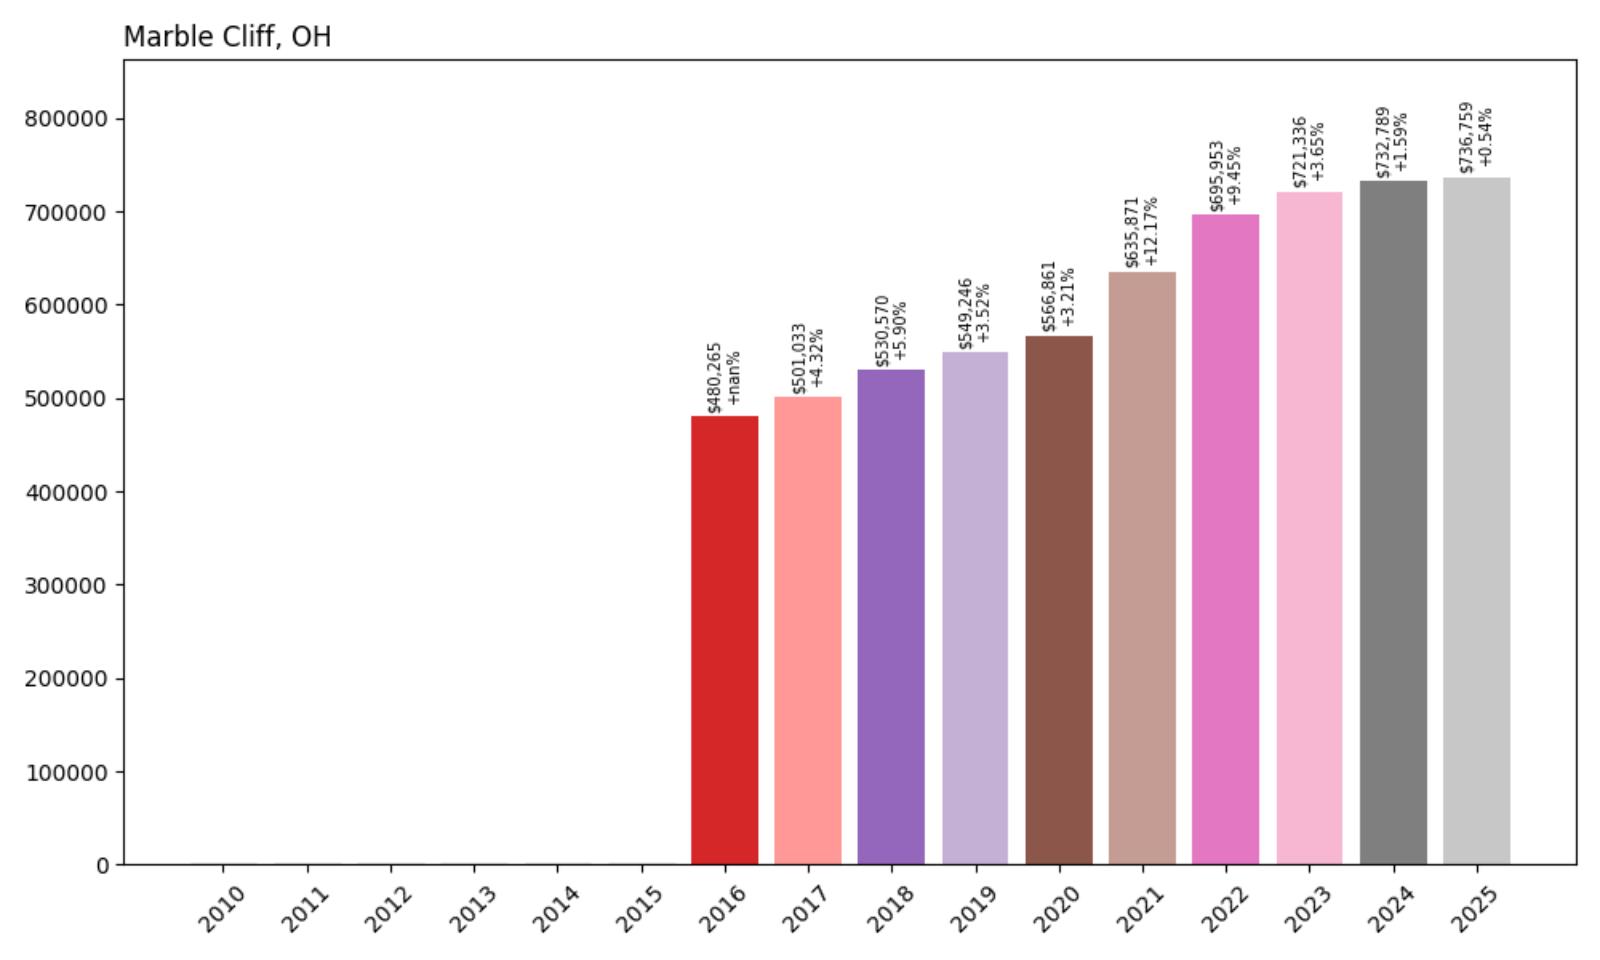
- 2010: N/A
- 2011: N/A
- 2012: N/A
- 2013: N/A
- 2014: N/A
- 2015: N/A
- 2016: $480,265
- 2017: $501,033
- 2018: $530,570
- 2019: $549,246
- 2020: $566,861
- 2021: $635,871
- 2022: $695,953
- 2023: $721,336
- 2024: $732,789
- 2025: $736,759
Marble Cliff’s home prices have jumped 53.3% since 2016, growing from $480,265 to $736,759 by 2025. Though data before 2016 isn’t available, the price trajectory in recent years clearly places this small Columbus suburb among the state’s most elite housing markets. Most of the appreciation occurred between 2020 and 2022, as demand surged for inner-ring suburbs with historic charm and proximity to downtown amenities.
Marble Cliff – Small Size, Big Prestige
Despite covering less than one square mile, Marble Cliff packs in tremendous character and exclusivity. Tucked between Grandview Heights and Upper Arlington, this tiny village enjoys an unbeatable location near the heart of Columbus while preserving a distinctly residential feel. Tree-lined streets, early 20th-century architecture, and strict zoning keep the community quiet, refined, and in high demand. The village’s limited number of homes ensures that turnover is rare, and when properties do hit the market, they attract substantial attention.
Recent home price gains reflect a combination of scarcity and desirability. Marble Cliff lacks space for major new development, and homeowners often stay for decades, reducing inventory. The 2021–2022 surge of over $120,000 mirrors broader urban-suburban migration trends, but with a twist: buyers in Marble Cliff are often paying a premium for historical charm and walkable access to top neighborhoods. While growth has cooled to under 1% annually, values remain elevated, signaling that demand still far outweighs supply in this boutique suburb.
7. Terrace Park – 88.9% Home Price Increase Since 2011
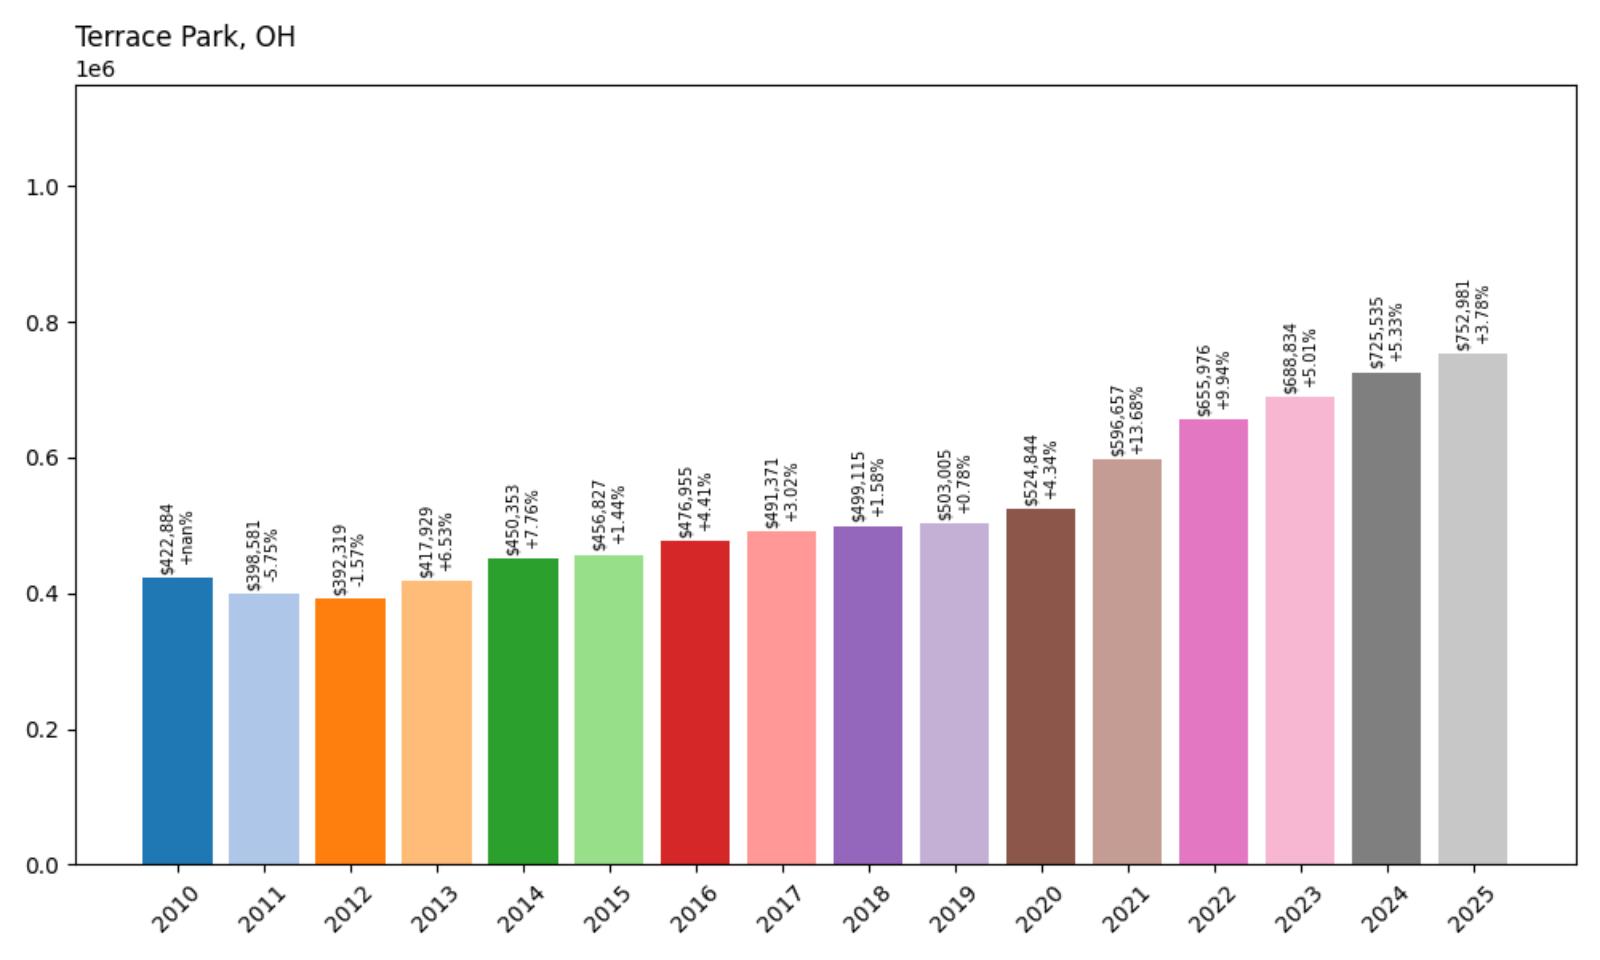
- 2010: $422,884
- 2011: $398,581
- 2012: $392,319
- 2013: $417,929
- 2014: $450,353
- 2015: $456,827
- 2016: $476,955
- 2017: $491,371
- 2018: $499,115
- 2019: $503,005
- 2020: $524,844
- 2021: $596,657
- 2022: $655,976
- 2023: $688,834
- 2024: $725,535
- 2025: $752,981
Terrace Park home values have grown from $398,581 in 2011 to $752,981 in 2025—a substantial 88.9% increase. The largest spikes occurred from 2020 to 2022, during which the village added over $130,000 in average value. Even in more recent years, appreciation has remained consistent, with values increasing another $64,000 between 2023 and 2025.
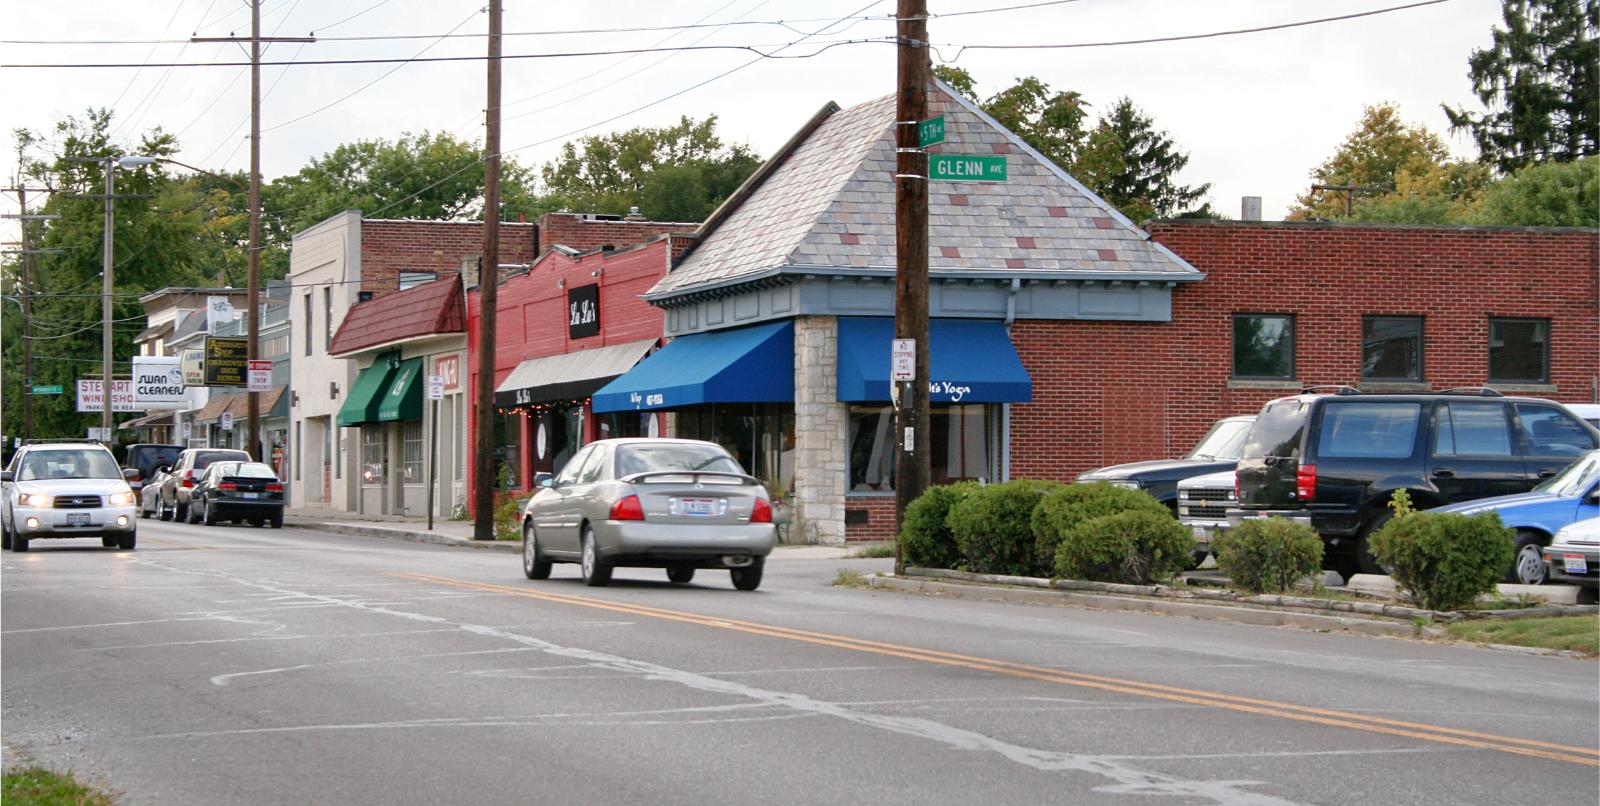
Terrace Park – River Views and Tight-Knit Community
Terrace Park is a picturesque village along the Little Miami River, known for its strong sense of community and excellent schools. Just 20 minutes from downtown Cincinnati, the town blends small-town charm with big-city access. Its compact footprint, historic homes, and abundant green space have made it one of the most sought-after areas in the eastern suburbs. Community events, block parties, and walkable neighborhoods foster a unique lifestyle that has helped home values soar.
Terrace Park’s housing market is characterized by limited supply and high demand. Most properties are detached single-family homes, many with character and updates that align with premium price tags. Between 2020 and 2022, the village added nearly $131,000 in average home value, reflecting both local confidence and broader regional trends. While more recent gains have slowed to about 3–5% annually, the underlying fundamentals remain strong. Terrace Park remains a top choice for families seeking quality living with an authentic village feel.
6. Waite Hill – 60.3% Home Price Increase Since 2011
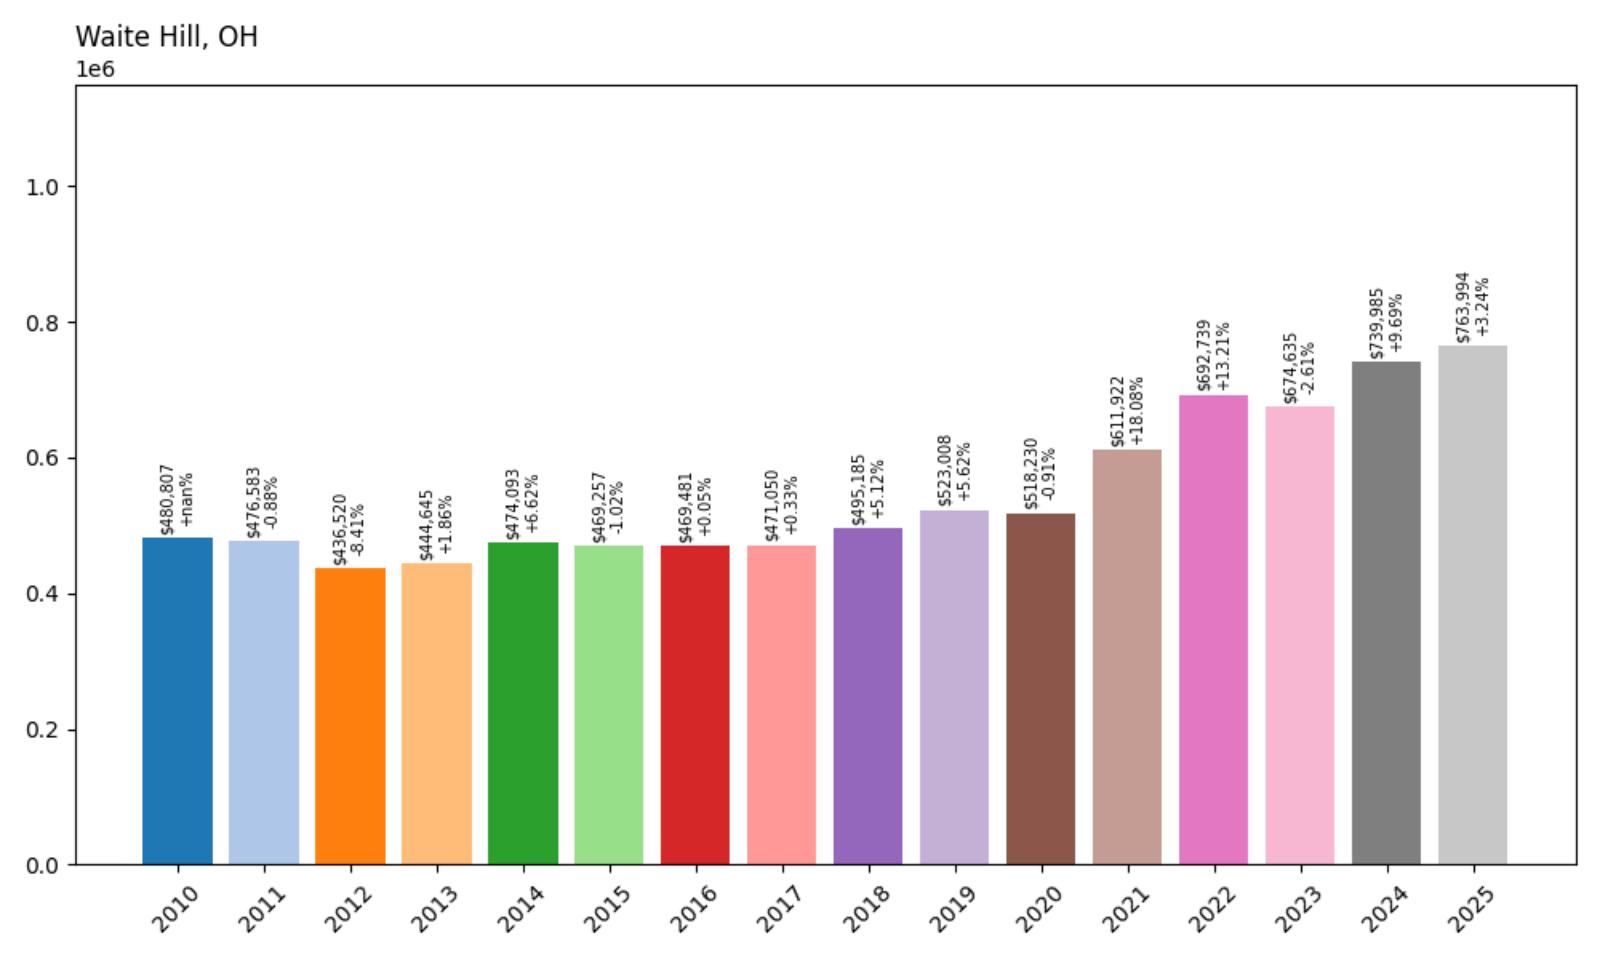
- 2010: $480,807
- 2011: $476,583
- 2012: $436,520
- 2013: $444,645
- 2014: $474,093
- 2015: $469,257
- 2016: $469,481
- 2017: $471,050
- 2018: $495,185
- 2019: $523,008
- 2020: $518,230
- 2021: $611,922
- 2022: $692,739
- 2023: $674,635
- 2024: $739,985
- 2025: $763,994
Waite Hill’s home prices have risen from $476,583 in 2011 to $763,994 in 2025, marking a 60.3% increase. Price volatility has defined this market, with brief declines followed by sharp gains—particularly the nearly $94,000 jump in 2021. While the market dipped slightly in 2023, it rebounded strongly with two consecutive years of solid growth.
Waite Hill – Rural Tranquility With Luxury Appeal
Waite Hill is a semi-rural enclave in Lake County where estate-style living meets natural beauty. Known for its rolling terrain, forested acreage, and equestrian properties, Waite Hill is home to some of northeast Ohio’s most exclusive residences. Large lots and architectural distinction set this village apart, attracting buyers looking for privacy without sacrificing proximity to Cleveland’s east side business districts. Zoning regulations keep density low, helping preserve the area’s pastoral ambiance and high property values.
Despite modest dips in a few years, the broader trajectory in Waite Hill has been one of long-term appreciation. The village experienced a strong surge in 2021 and 2022—gaining over $173,000 in just two years. Recent years show a return to steadier growth, but the fundamentals remain robust. There is little new construction here, and turnover is limited. Waite Hill’s real estate market is small, but it commands attention—and price premiums—due to its unique blend of rural aesthetics and high-end housing stock.
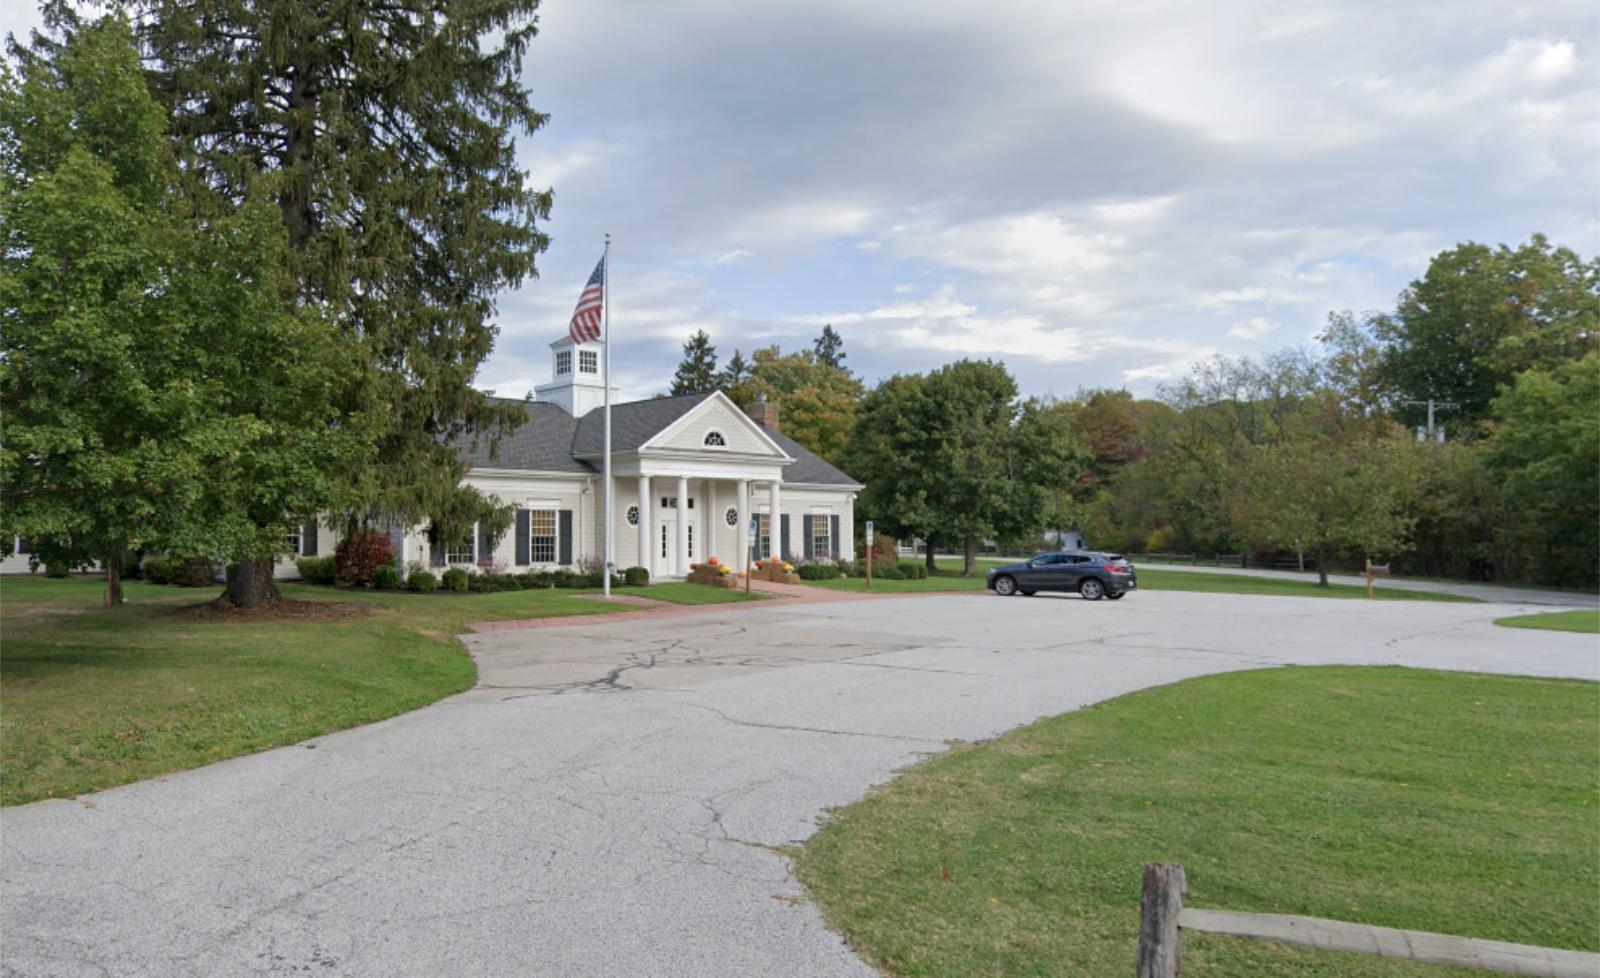
5. Gates Mills – 61.1% Home Price Increase Since 2010
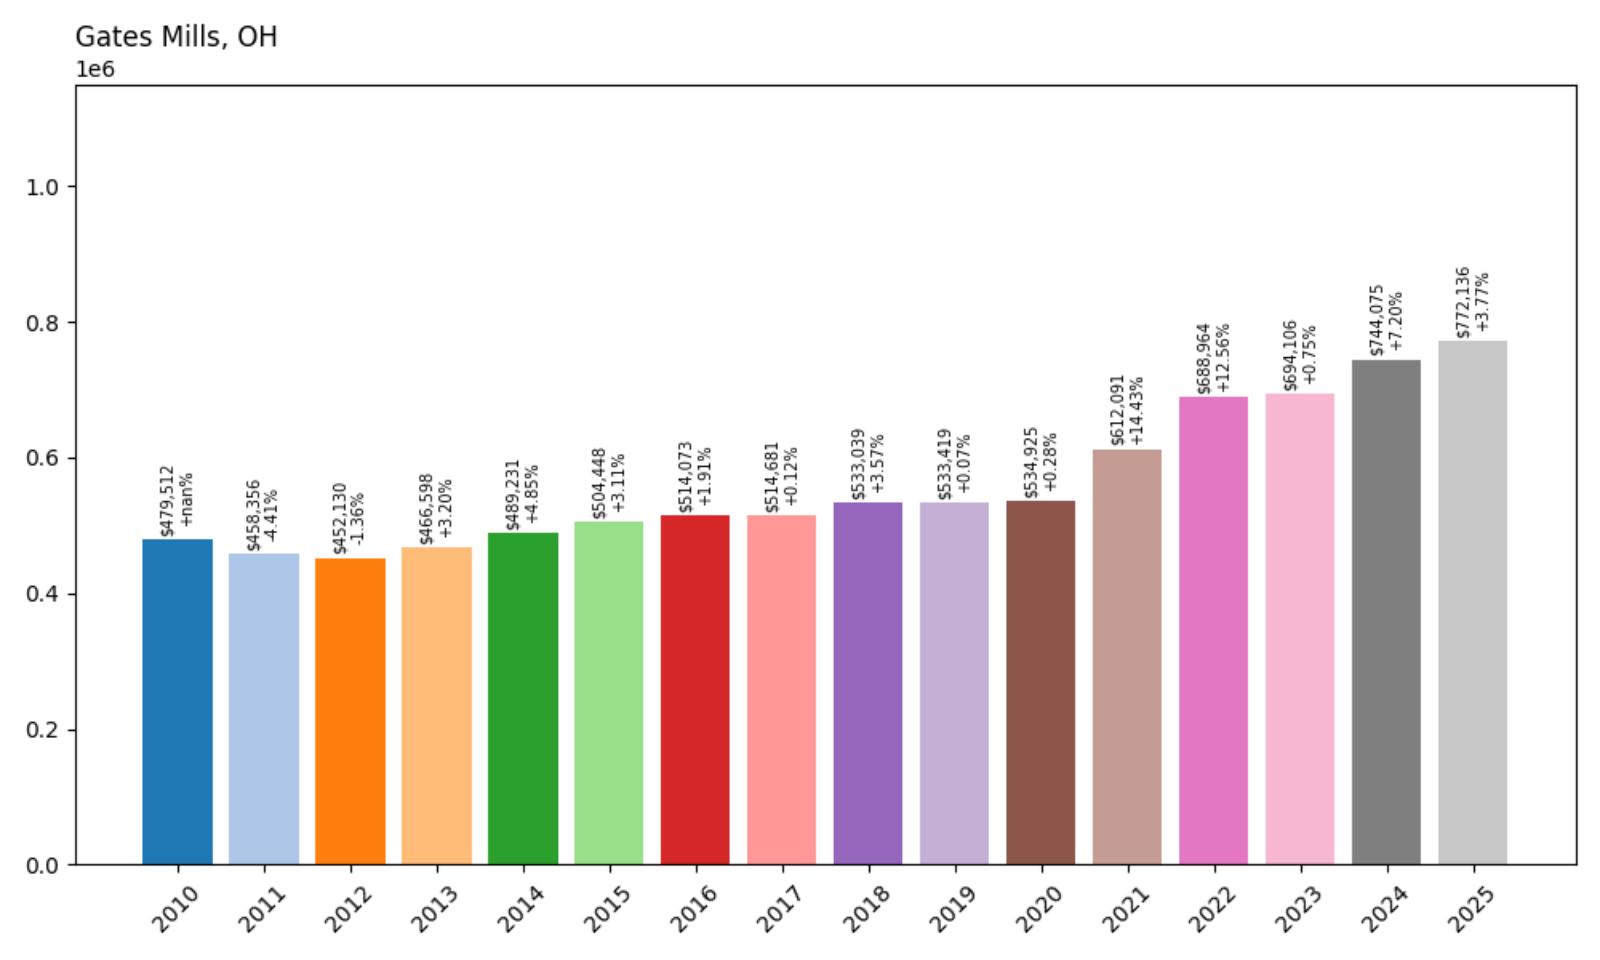
- 2010: $479,512
- 2011: $458,356
- 2012: $452,130
- 2013: $466,598
- 2014: $489,231
- 2015: $504,448
- 2016: $514,073
- 2017: $514,681
- 2018: $533,039
- 2019: $533,419
- 2020: $534,925
- 2021: $612,091
- 2022: $688,964
- 2023: $694,106
- 2024: $744,075
- 2025: $772,136
Gates Mills has seen a home price jump of 61.1% between 2010 and 2025, rising from $479,512 to $772,136. Most of this growth occurred after 2020, when values jumped by more than $75,000 in a single year. While the 2010s saw relatively slow increases—averaging just 1-3% annually—the post-2020 period brought more aggressive appreciation, likely influenced by increased demand in suburban communities with large lots and luxury homes.
Gates Mills – Historic Charm and Exclusive Living
Located in Cuyahoga County, Gates Mills is an affluent village known for its estate-style homes, quiet wooded streets, and proximity to Cleveland. The town has long been popular with professionals and retirees seeking a more secluded lifestyle without sacrificing access to urban amenities. Its preservation of historic architecture and commitment to large-lot zoning has limited new development, which in turn contributes to price stability and long-term value appreciation. The Chagrin River meanders through the area, adding natural beauty that appeals to buyers looking for both prestige and tranquility.
Recent price growth has been driven by renewed interest in high-end suburban living, especially after 2020. The town’s consistent investment in green space, safety, and quality public schools makes it particularly attractive to high-income families. According to Zillow, luxury home markets like Gates Mills often weather downturns better than average, which may help explain the strong pricing trend post-2020. Limited housing supply and rising construction costs have also played a role in maintaining upward price pressure into 2025.
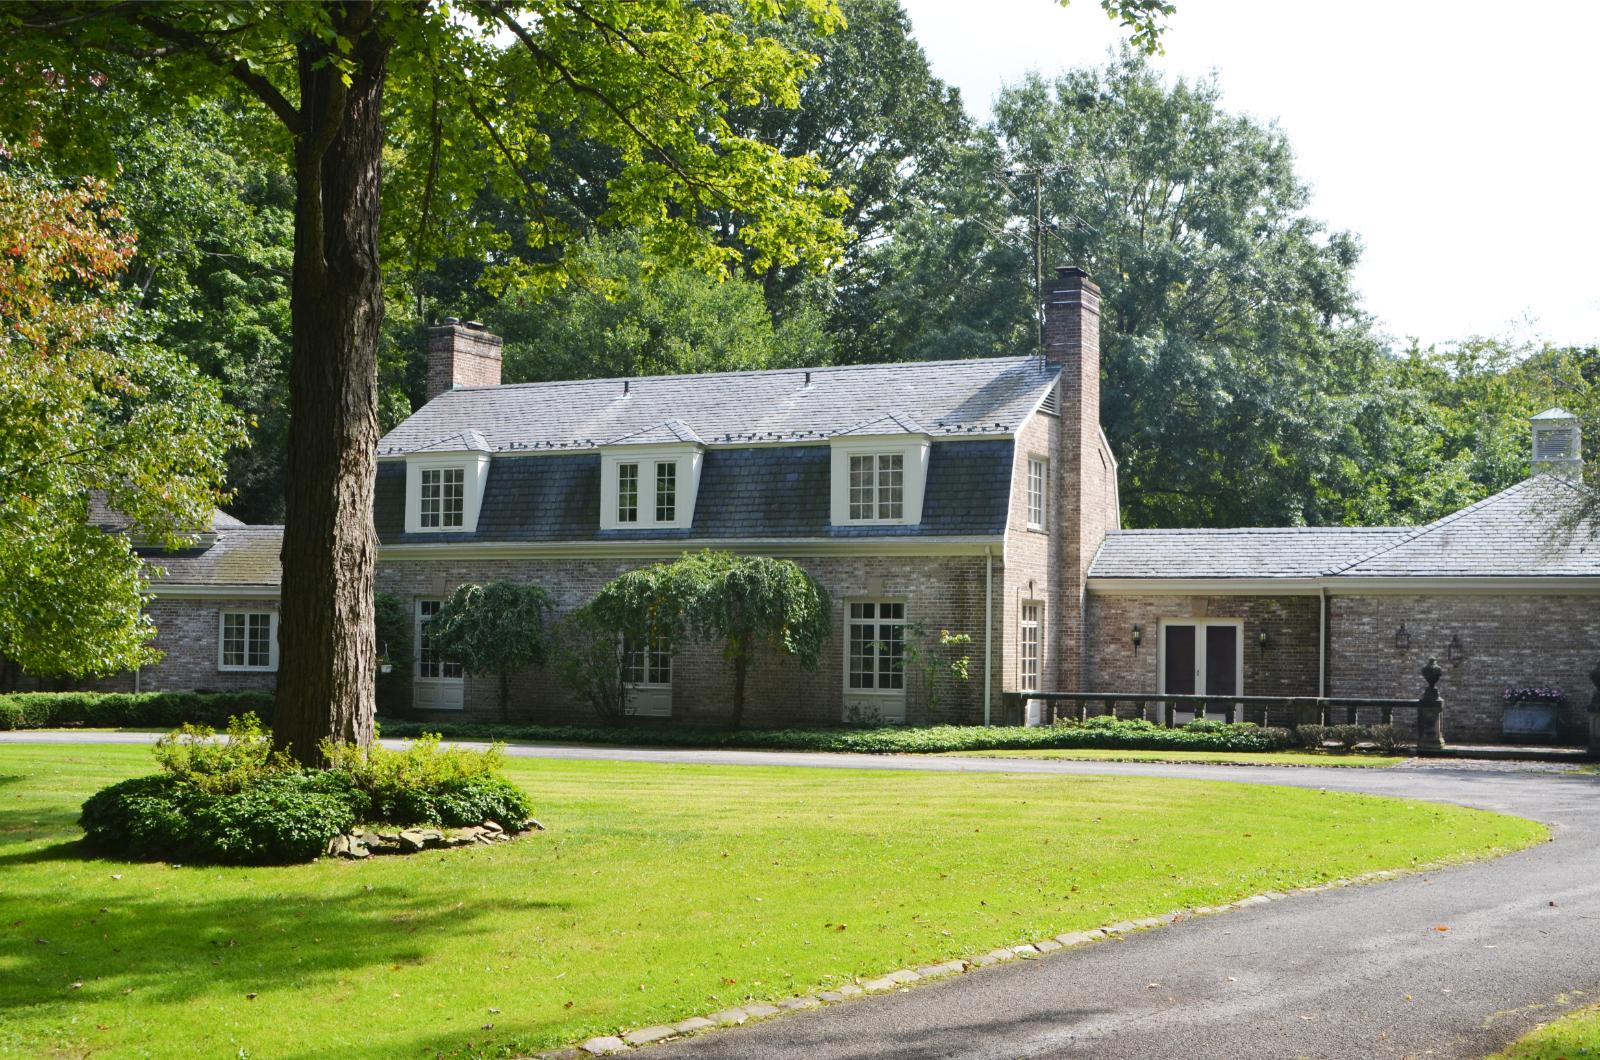
4. Kirtland Hills – 67.9% Home Price Increase Since 2010
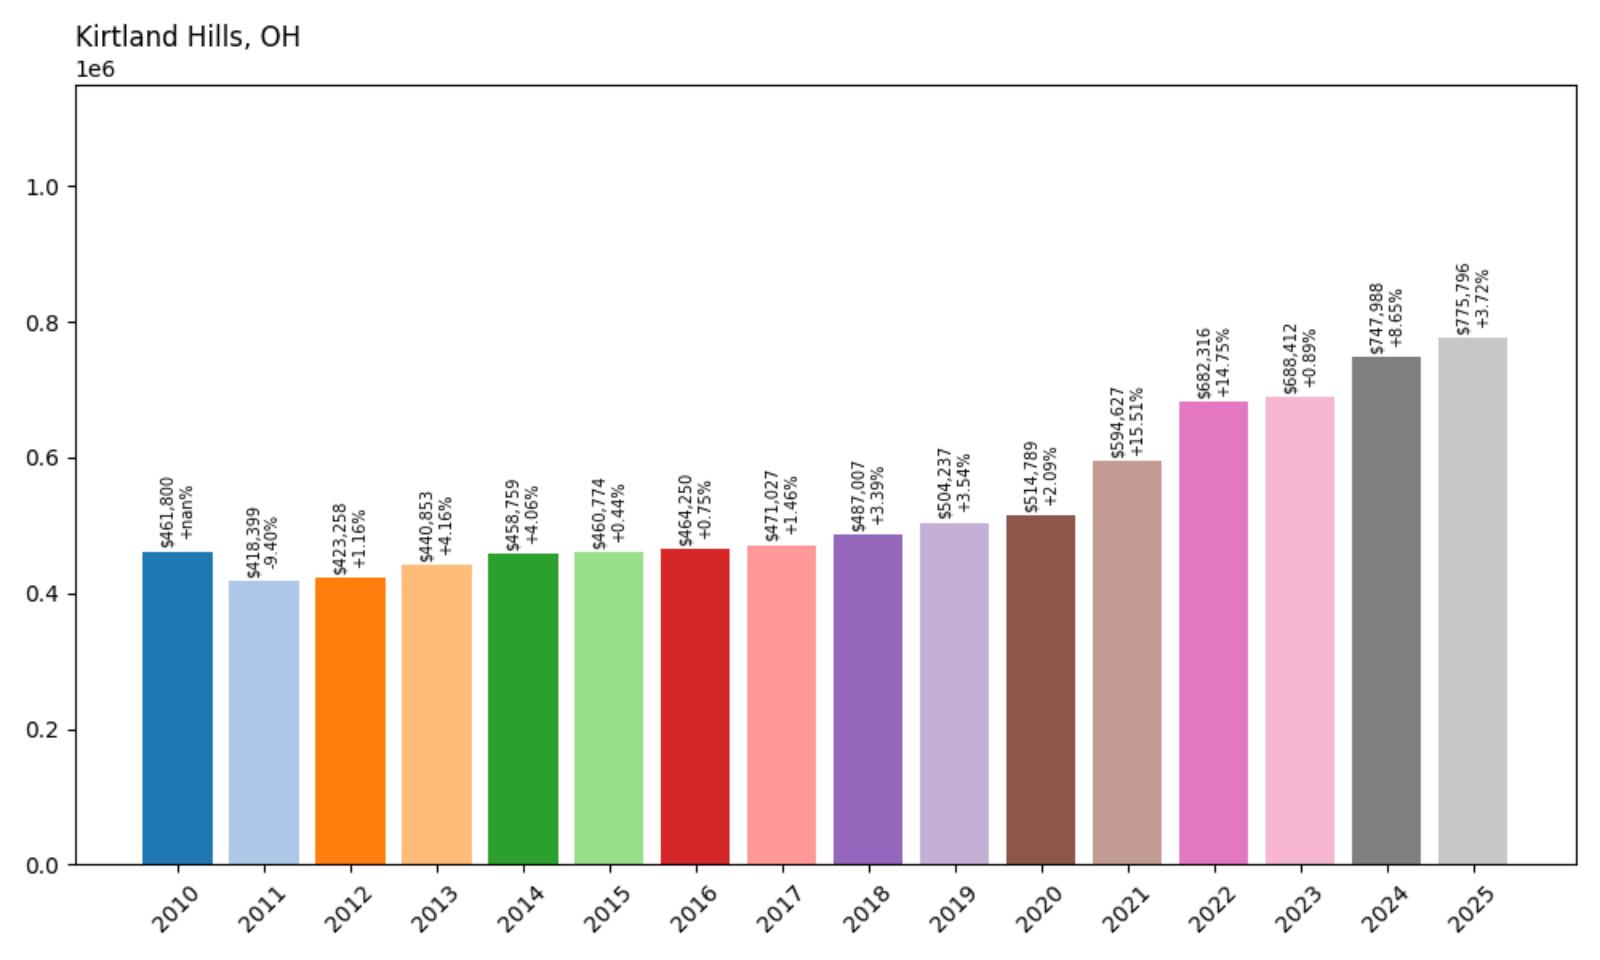
- 2010: $461,800
- 2011: $418,399
- 2012: $423,258
- 2013: $440,853
- 2014: $458,759
- 2015: $460,774
- 2016: $464,250
- 2017: $471,027
- 2018: $487,007
- 2019: $504,237
- 2020: $514,789
- 2021: $594,627
- 2022: $682,316
- 2023: $688,412
- 2024: $747,988
- 2025: $775,796
Between 2010 and 2025, Kirtland Hills experienced a home value increase of 67.9%. Home prices grew from $461,800 to $775,796, with the most significant jumps occurring after 2020. The gains from 2021 to 2022 alone totaled nearly $88,000. This leap reflects heightened demand for secluded upscale properties and estate living amid broader economic shifts favoring low-density communities.
Kirtland Hills – Estate Living Near Lake County’s Core
Kirtland Hills offers sprawling properties, forested terrain, and a semi-rural feel just a short drive from the more developed areas of Lake County. With a population under 1,000, it’s a town that caters to residents seeking privacy, space, and exclusivity. The presence of private schools, equestrian facilities, and strong municipal protections against overdevelopment all contribute to its high desirability among wealthy buyers. Price growth in recent years is a result of both limited housing stock and a growing demand for luxury rural real estate options in Northeast Ohio.
The upward trend also reflects a statewide pattern of suburban wealth migration since the pandemic. Many Ohio families have traded city proximity for more land and tranquility, and Kirtland Hills fits that profile perfectly. In addition to scenic views and larger homes, the area benefits from low crime rates and close access to the Holden Arboretum and Lake Erie shoreline. These amenities likely helped insulate the market from volatility and contributed to the sharp price appreciation seen in the early 2020s.
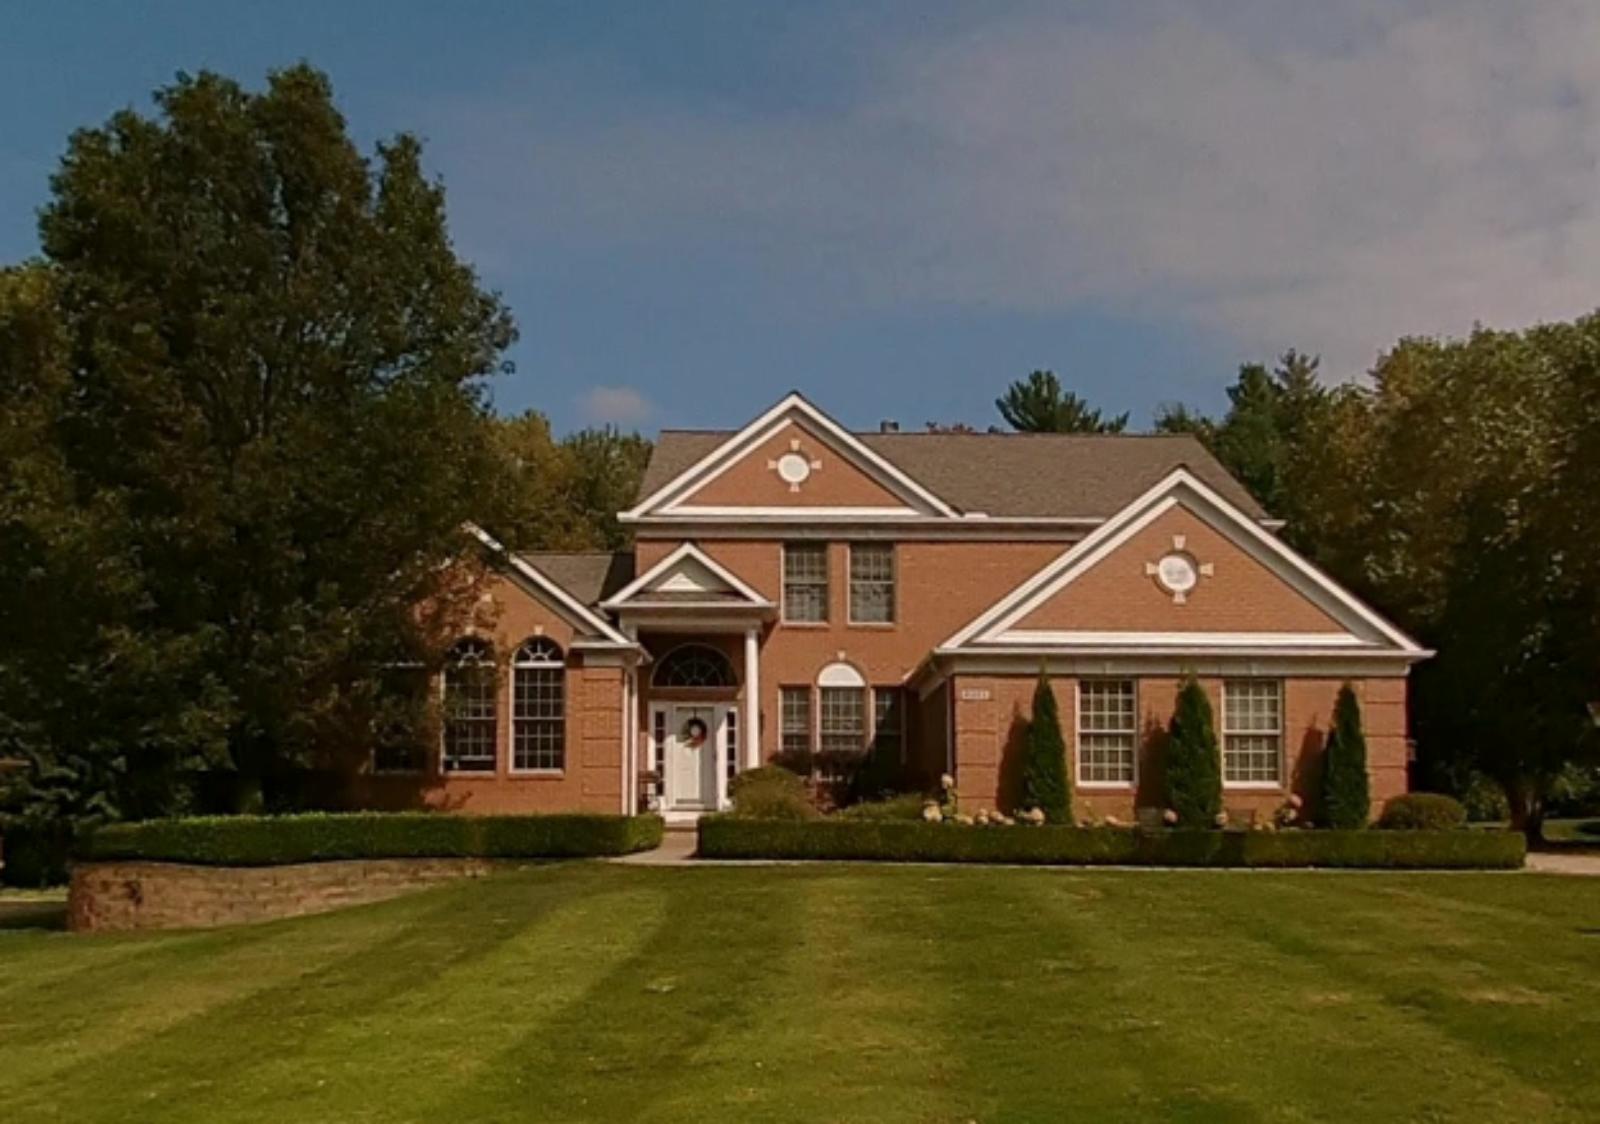
3. Bentleyville – 53.4% Home Price Increase Since 2010
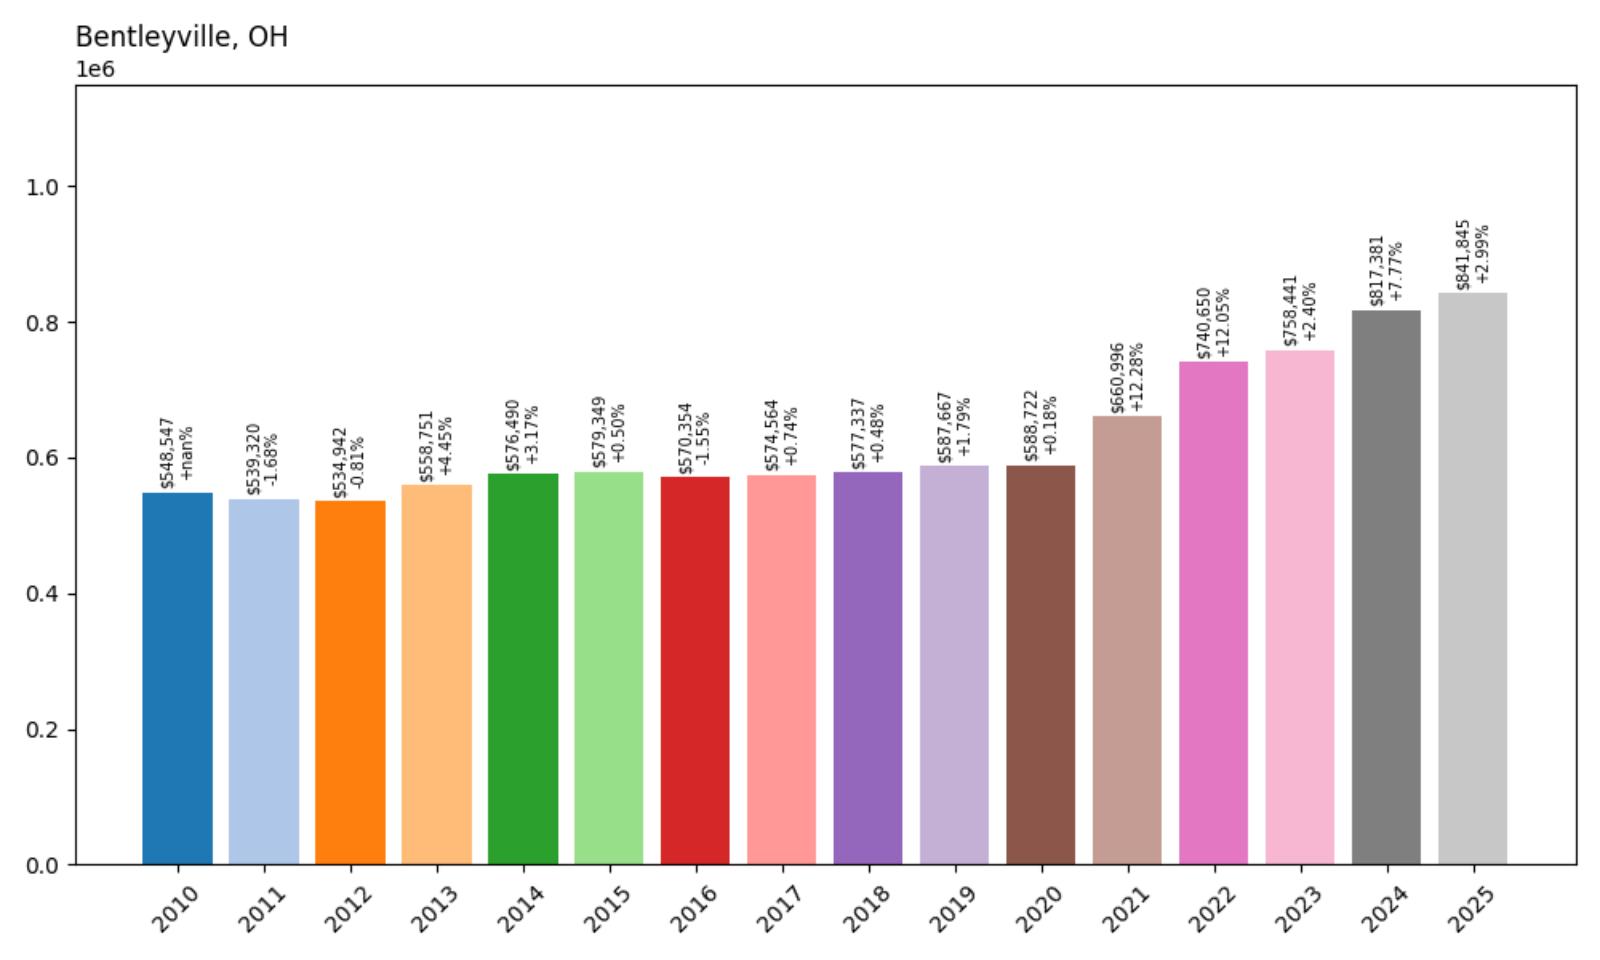
- 2010: $548,547
- 2011: $539,320
- 2012: $534,942
- 2013: $558,751
- 2014: $576,490
- 2015: $579,349
- 2016: $570,354
- 2017: $574,564
- 2018: $577,337
- 2019: $587,667
- 2020: $588,722
- 2021: $660,996
- 2022: $740,650
- 2023: $758,441
- 2024: $817,381
- 2025: $841,845
Home prices in Bentleyville rose from $548,547 in 2010 to $841,845 in 2025—a 53.4% increase. Most of the appreciation happened between 2020 and 2024, when the village saw sharp upward momentum in pricing due to rising demand for its spacious and wooded housing stock. Price growth slowed somewhat in 2025, but values remain well above pre-pandemic levels.
Bentleyville – Quiet Growth in the Chagrin Valley
Bentleyville sits in Cuyahoga County’s scenic Chagrin Valley region, and is often overshadowed by neighboring Chagrin Falls. Yet, it offers some of the most desirable residential settings in Greater Cleveland, with winding roads, large wooded lots, and proximity to protected nature areas. Zoning restrictions and the lack of commercial development ensure a quiet environment and minimal traffic. These qualities became even more attractive to homebuyers in the wake of the remote work boom, contributing to Bentleyville’s dramatic home price increases from 2020 onward.
While price growth was modest in the earlier 2010s, the sharp spikes between 2021 and 2024 reflect a rush of demand. Zillow data suggests high-end homes in Bentleyville often go quickly once listed, especially when featuring premium amenities like pools, home offices, and expansive acreage. The village’s proximity to Metroparks and easy access to downtown Cleveland via nearby highways adds to its long-term appeal for well-off buyers looking for tranquility within reach of urban life.
2. Hunting Valley – 53.7% Home Price Increase Since 2010
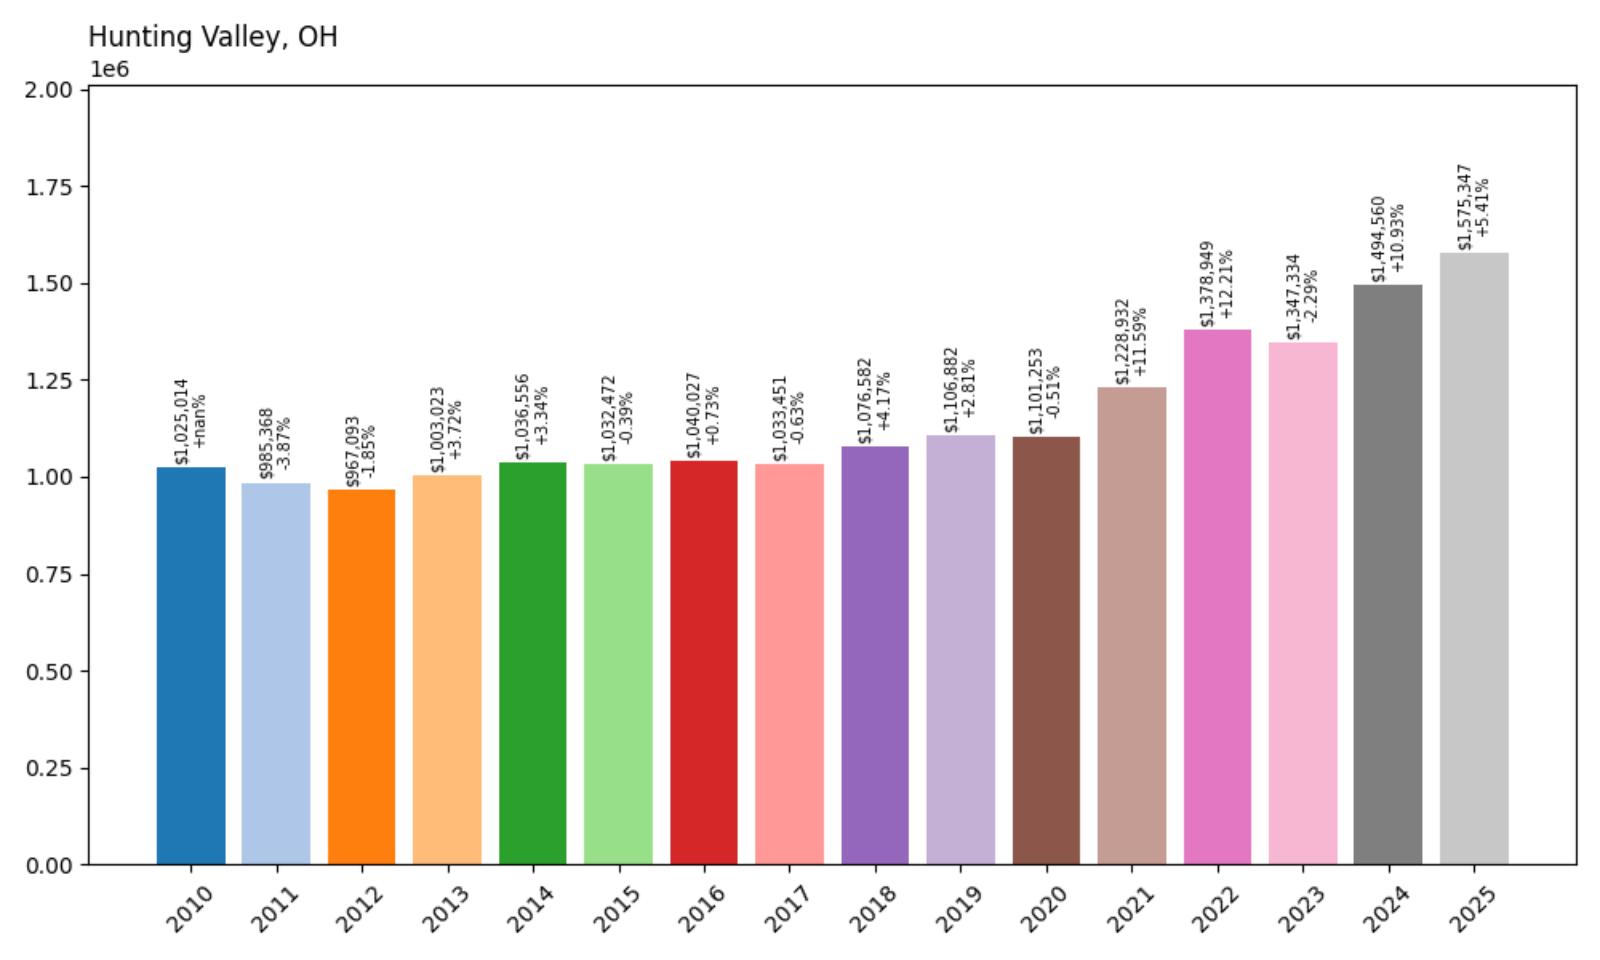
- 2010: $1,025,014
- 2011: $985,368 (−$39,646, −3.87% from previous year)
- 2012: $967,093 (−$18,275, −1.85% from previous year)
- 2013: $1,003,023 (+$35,930, +3.72% from previous year)
- 2014: $1,036,556 (+$33,533, +3.34% from previous year)
- 2015: $1,032,472 (−$4,084, −0.39% from previous year)
- 2016: $1,040,027 (+$7,555, +0.73% from previous year)
- 2017: $1,033,451 (−$6,576, −0.63% from previous year)
- 2018: $1,076,582 (+$43,131, +4.17% from previous year)
- 2019: $1,106,882 (+$30,300, +2.81% from previous year)
- 2020: $1,101,253 (−$5,630, −0.51% from previous year)
- 2021: $1,228,932 (+$127,679, +11.59% from previous year)
- 2022: $1,378,949 (+$150,018, +12.21% from previous year)
- 2023: $1,347,334 (−$31,615, −2.29% from previous year)
- 2024: $1,494,560 (+$147,226, +10.93% from previous year)
- 2025: $1,575,347 (+$80,788, +5.41% from previous year)
Hunting Valley saw its home values climb from $1,025,014 in 2010 to $1,575,347 in 2025—an impressive 53.7% increase. While the early 2010s included a few setbacks and mild contractions, the long-term trend has been clearly upward. The strongest years came between 2020 and 2022, when annual gains exceeded 10%, peaking at over $150,000 in one year alone. Despite a small dip in 2023, the market quickly recovered with strong double-digit appreciation again in 2024. The continued rise in 2025 indicates this town remains in high demand, with price growth holding steady even amid broader market volatility.
Hunting Valley – Ultra-Luxury Homes and Expansive Estates
Hunting Valley is known across Ohio for its exclusive, estate-style homes and wide expanses of rolling countryside. Located just east of Cleveland, this village blends privacy with proximity to top-tier amenities in neighboring suburbs like Pepper Pike and Moreland Hills. Many properties here span several acres and include custom architecture, private gates, equestrian facilities, and mature forests. It’s no surprise that such a rare combination of natural beauty and affluence has driven steady demand over the years. The dramatic jumps in value during the 2020s were fueled in part by out-of-state buyers seeking spacious, remote luxury properties during the pandemic and beyond.
The 53.7% price increase since 2010 reflects both the scarcity of available homes and the consistent interest from affluent buyers. As one of the wealthiest communities in Ohio, Hunting Valley benefits from limited housing inventory, exceptional school districts, and preservation-focused zoning. Unlike more volatile markets, the appreciation here is underpinned by long-term desirability rather than rapid speculative growth. Even in years when values temporarily dipped, the town quickly rebounded. With nearly every property here offering both seclusion and status, Hunting Valley remains a premier destination for those seeking the pinnacle of Ohio real estate.
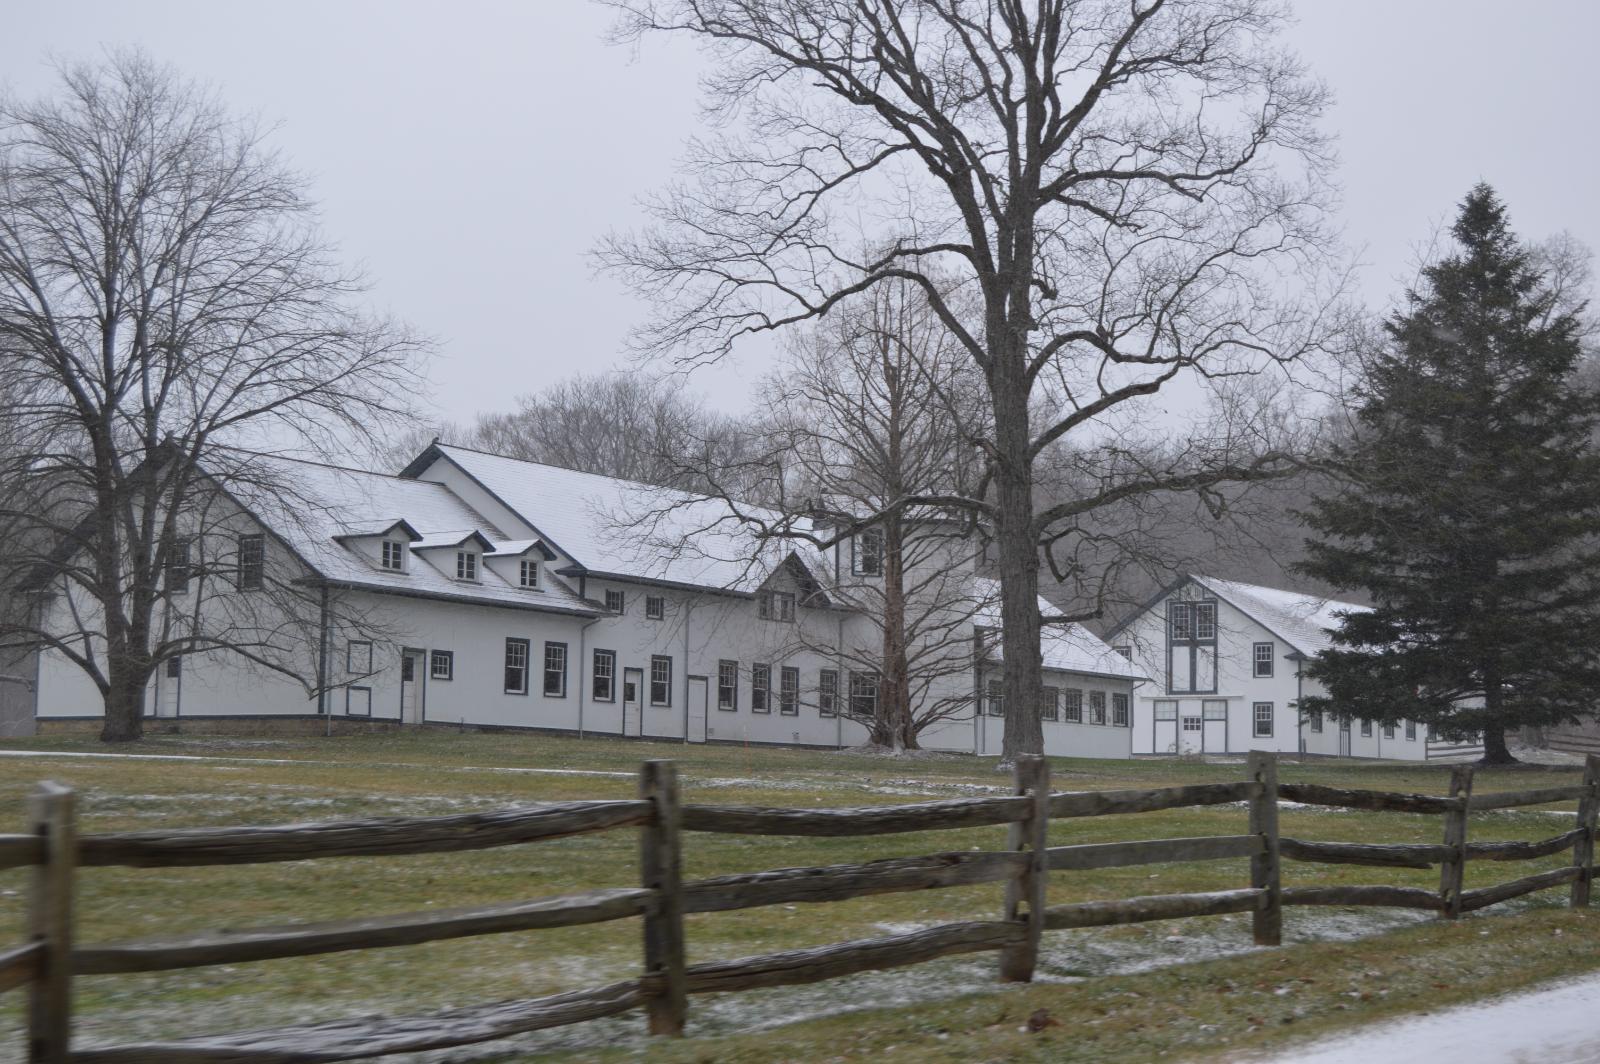
1. The Village of Indian Hill – 55.9% Home Price Increase Since 2010
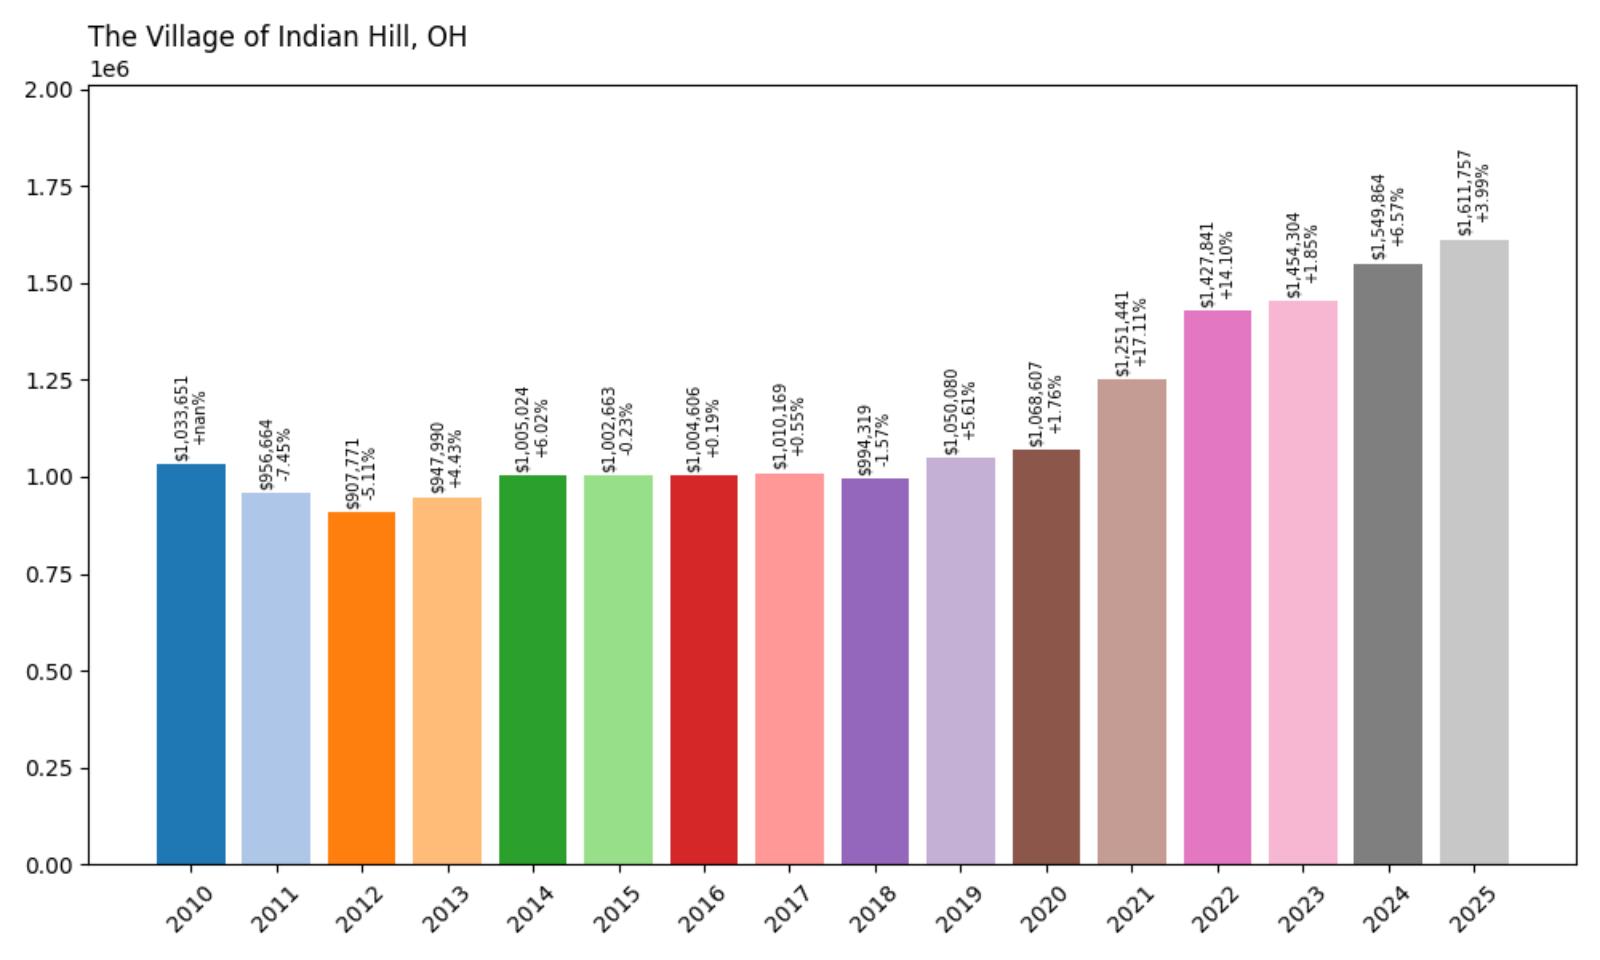
- 2010: $1,033,651
- 2011: $956,664 (−$76,987, −7.45% from previous year)
- 2012: $907,771 (−$48,893, −5.11% from previous year)
- 2013: $947,990 (+$40,219, +4.43% from previous year)
- 2014: $1,005,024 (+$57,034, +6.02% from previous year)
- 2015: $1,002,663 (−$2,361, −0.23% from previous year)
- 2016: $1,004,606 (+$1,943, +0.19% from previous year)
- 2017: $1,010,169 (+$5,563, +0.55% from previous year)
- 2018: $994,319 (−$15,850, −1.57% from previous year)
- 2019: $1,050,080 (+$55,761, +5.61% from previous year)
- 2020: $1,068,607 (+$18,527, +1.76% from previous year)
- 2021: $1,251,441 (+$182,834, +17.11% from previous year)
- 2022: $1,427,841 (+$176,401, +14.10% from previous year)
- 2023: $1,454,304 (+$26,463, +1.85% from previous year)
- 2024: $1,549,864 (+$95,560, +6.57% from previous year)
- 2025: $1,611,757 (+$61,894, +3.99% from previous year)
Home prices in The Village of Indian Hill have climbed 55.9% since 2010, rising from just over $1 million to $1.61 million in 2025. Despite some initial declines between 2010 and 2012, values rebounded quickly and steadily gained momentum throughout the 2010s. The biggest leaps came in 2021 and 2022, when the market surged by over $350,000 across two years. Even with some plateauing in 2023, appreciation resumed strongly by 2024 and 2025. These trends underscore Indian Hill’s reputation as one of the most sought-after—and resilient—housing markets in the state.
The Village of Indian Hill – Cincinnati’s Prestigious Suburban Enclave
The Village of Indian Hill is often described as the crown jewel of Cincinnati’s suburbs. This affluent community sits northeast of the city, offering residents expansive lots, elegant homes, and a semi-rural charm that’s increasingly rare near major metro areas. Many of its homes are custom-built estates nestled into tree-lined properties, often spanning several acres. The village’s zoning laws strictly preserve the low-density, residential character, ensuring that new construction does not dilute the town’s peaceful, private ambiance. With easy access to Cincinnati’s top private schools, country clubs, and high-end shopping districts, Indian Hill combines luxury living with exceptional convenience.
The steady growth in property values here is supported by both its exclusivity and its amenities. The 2021 and 2022 spikes reflect a wave of demand from high-income households seeking space and comfort during uncertain times. Even as broader markets have cooled, Indian Hill’s appeal remains strong due to its prestige, history, and limited supply. Few communities in Ohio offer the same combination of wooded estates, architectural sophistication, and proximity to a major city. For buyers seeking long-term value, Indian Hill continues to stand out as a prime location—where homes are more than just property; they’re legacy investments.