Zillow Home Value Index data reveals that some Ohio towns are still bucking the statewide price surge. In these 18 communities—ranging from quiet rural villages to outer-ring suburbs—home prices remain surprisingly low in 2025. While other markets have climbed fast, these spots continue to offer real value for buyers looking for affordability, stability, or untapped potential. Year-over-year data shows how these towns have held steady or grown slowly, making them standouts for budget-conscious buyers.
18. Glouster – 127% Home Price Increase Since 2010
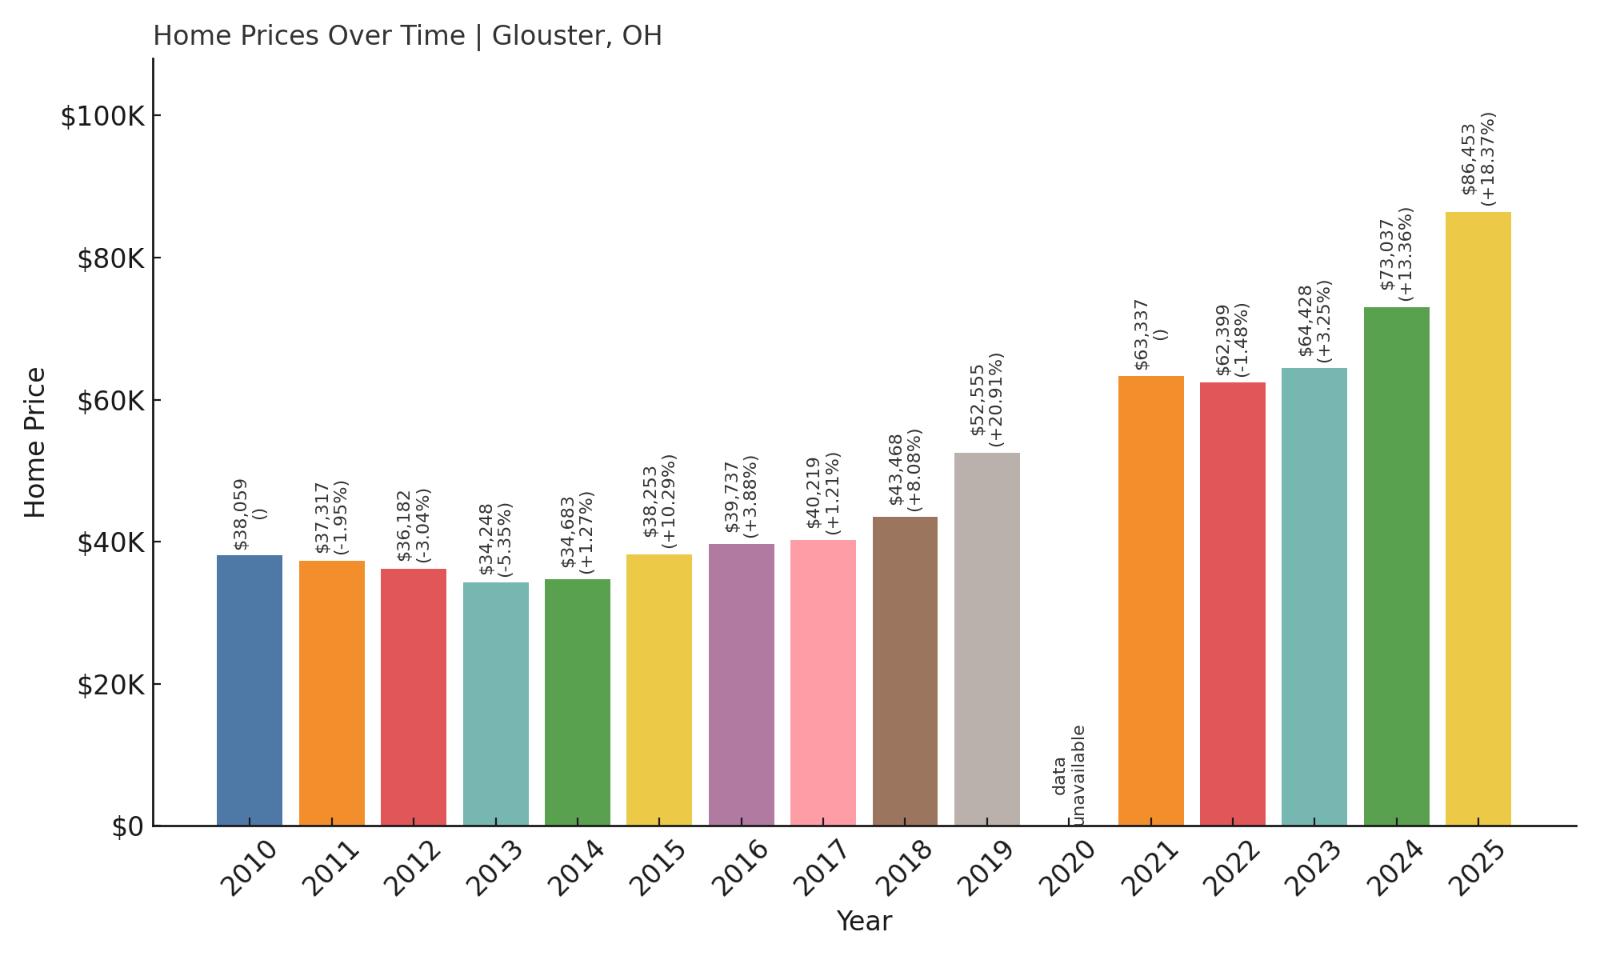
- 2010: $38,059
- 2011: $37,317 ($-742, -1.95% from previous year)
- 2012: $36,182 ($-1,135, -3.04% from previous year)
- 2013: $34,248 ($-1,934, -5.35% from previous year)
- 2014: $34,683 (+$435, +1.27% from previous year)
- 2015: $38,253 (+$3,570, +10.29% from previous year)
- 2016: $39,737 (+$1,484, +3.88% from previous year)
- 2017: $40,219 (+$482, +1.21% from previous year)
- 2018: $43,468 (+$3,249, +8.08% from previous year)
- 2019: $52,555 (+$9,087, +20.91% from previous year)
- 2020: N/A
- 2021: $63,337
- 2022: $62,399 ($-938, -1.48% from previous year)
- 2023: $64,428 (+$2,029, +3.25% from previous year)
- 2024: $73,037 (+$8,609, +13.36% from previous year)
- 2025: $86,453 (+$13,416, +18.37% from previous year)
Glouster has seen an impressive 127% rise in home prices since 2010, with a steady upward trend especially in the last five years. While the town faced stagnation earlier on, recent years have seen rapid appreciation, likely driven by a mix of affordability and regional interest. The current median price of $86,453 still places it among Ohio’s most budget-friendly options.
Glouster – A Quiet Corner With Big Price Gains
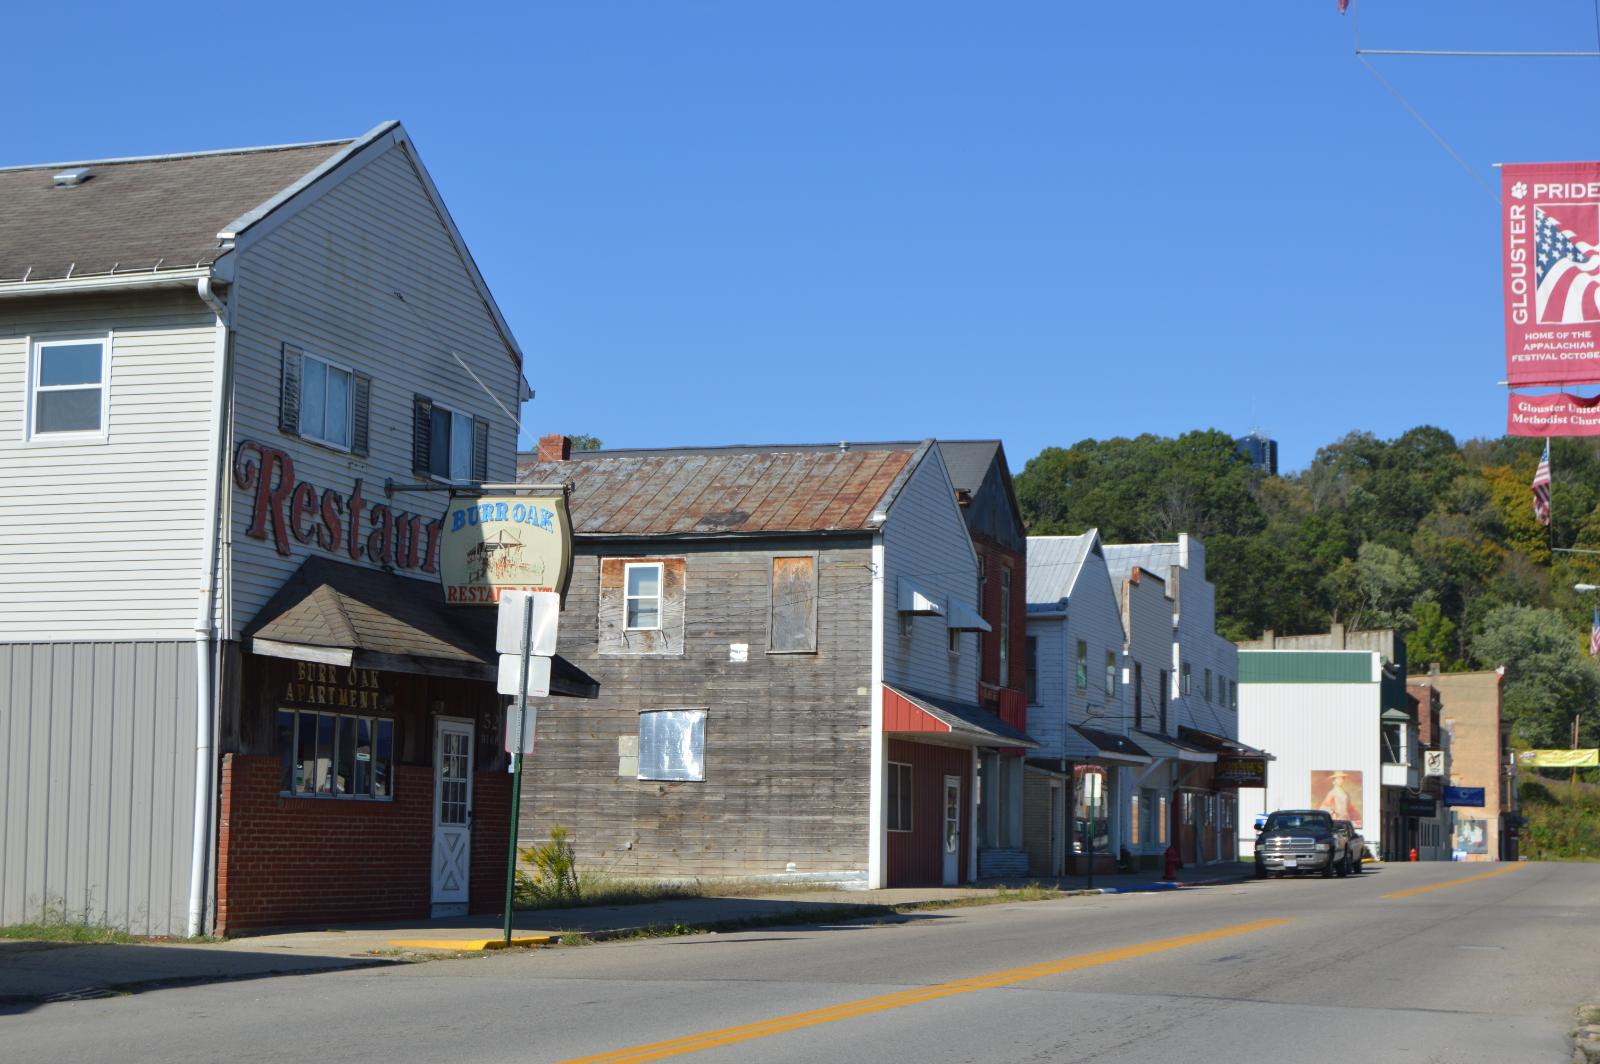
Nestled in Athens County, Glouster is a former mining town surrounded by the rolling hills of southeastern Ohio. The town has stayed under the radar but has recently become attractive to buyers seeking peace, outdoor access, and very low home prices. The proximity to Burr Oak State Park and affordable housing has contributed to its recent boost in value.
Despite the price increase, Glouster still offers homes at prices well below state and national averages. Local amenities are modest, but that hasn’t stopped interest from bargain-seekers and investors looking for upside in Ohio’s less saturated markets.
17. Brilliant – 81% Home Price Increase Since 2016

- 2010: N/A
- 2011: N/A
- 2012: N/A
- 2013: N/A
- 2014: N/A
- 2015: N/A
- 2016: $47,405
- 2017: $48,970 (+$1,565, +3.30% from previous year)
- 2018: $51,116 (+$2,146, +4.38% from previous year)
- 2019: $53,695 (+$2,579, +5.05% from previous year)
- 2020: N/A
- 2021: $66,169
- 2022: $67,403 (+$1,234, +1.86% from previous year)
- 2023: $68,103 (+$700, +1.04% from previous year)
- 2024: $83,482 (+$15,379, +22.58% from previous year)
- 2025: $85,932 (+$2,450, +2.93% from previous year)
Brilliant, Ohio has seen a solid 81% growth in home values since 2016. The most notable jump came in 2024, when prices surged more than 22%. Even after the spike, the town’s current median price of $85,932 still keeps it within reach for budget-minded buyers.
Brilliant – A Modest Market on the Rise

Located in Jefferson County along the Ohio River, Brilliant is a small town with a quiet charm and deep industrial roots. Its affordability makes it attractive to families and retirees who prefer low-maintenance living with basic conveniences nearby. While not flashy, its recent surge suggests growing interest from buyers priced out of larger nearby cities.
The town benefits from easy access to US Route 7 and neighboring markets like Steubenville and Wheeling, WV. Though amenities are sparse, its affordability and recent appreciation make it one to watch for value-driven home seekers.
16. Mingo Junction – 71% Home Price Increase Since 2016

- 2010: N/A
- 2011: N/A
- 2012: N/A
- 2013: N/A
- 2014: N/A
- 2015: N/A
- 2016: $49,847
- 2017: $48,196 ($-1,651, -3.31% from previous year)
- 2018: $51,179 (+$2,983, +6.19% from previous year)
- 2019: $53,886 (+$2,707, +5.29% from previous year)
- 2020: N/A
- 2021: $69,983
- 2022: $72,580 (+$2,597, +3.71% from previous year)
- 2023: $71,827 ($-753, -1.04% from previous year)
- 2024: $80,496 (+$8,669, +12.07% from previous year)
- 2025: $85,182 (+$4,686, +5.82% from previous year)
Home values in Mingo Junction have climbed steadily, growing over 71% since 2016. A surge from 2021 onward brought significant appreciation, with values nearing $85K in 2025. This points to a resurgence of interest in a long-overlooked river town.
Mingo Junction – Steady Growth From Steel Town Roots
Once a booming steel town, Mingo Junction has seen efforts to reimagine itself over the past decade. Its location on the Ohio River in Jefferson County, just south of Steubenville, offers industrial charm, scenic river views, and low housing costs. The area appeals to blue-collar workers and families seeking space without high costs.
Although job opportunities are limited, the town’s home values are rising steadily — a possible sign that outside investment or affordability-driven migration may be playing a role. Homes remain affordable, but those looking to buy may want to act before prices move further upward.
15. McGuffey – 5% Home Price Increase Since 2024

- 2010: N/A
- 2011: N/A
- 2012: N/A
- 2013: N/A
- 2014: N/A
- 2015: N/A
- 2016: N/A
- 2017: N/A
- 2018: N/A
- 2019: N/A
- 2020: N/A
- 2021: N/A
- 2022: N/A
- 2023: N/A
- 2024: $81,162
- 2025: $85,047 (+$3,885, +4.79% from previous year)
Data is limited for McGuffey, but from what we can observe, home prices rose nearly 5% between 2024 and 2025. That modest increase brings current values just above $85K, putting the village in line with many other affordable towns in rural Ohio.
McGuffey – A Quiet Village With Modest Movement
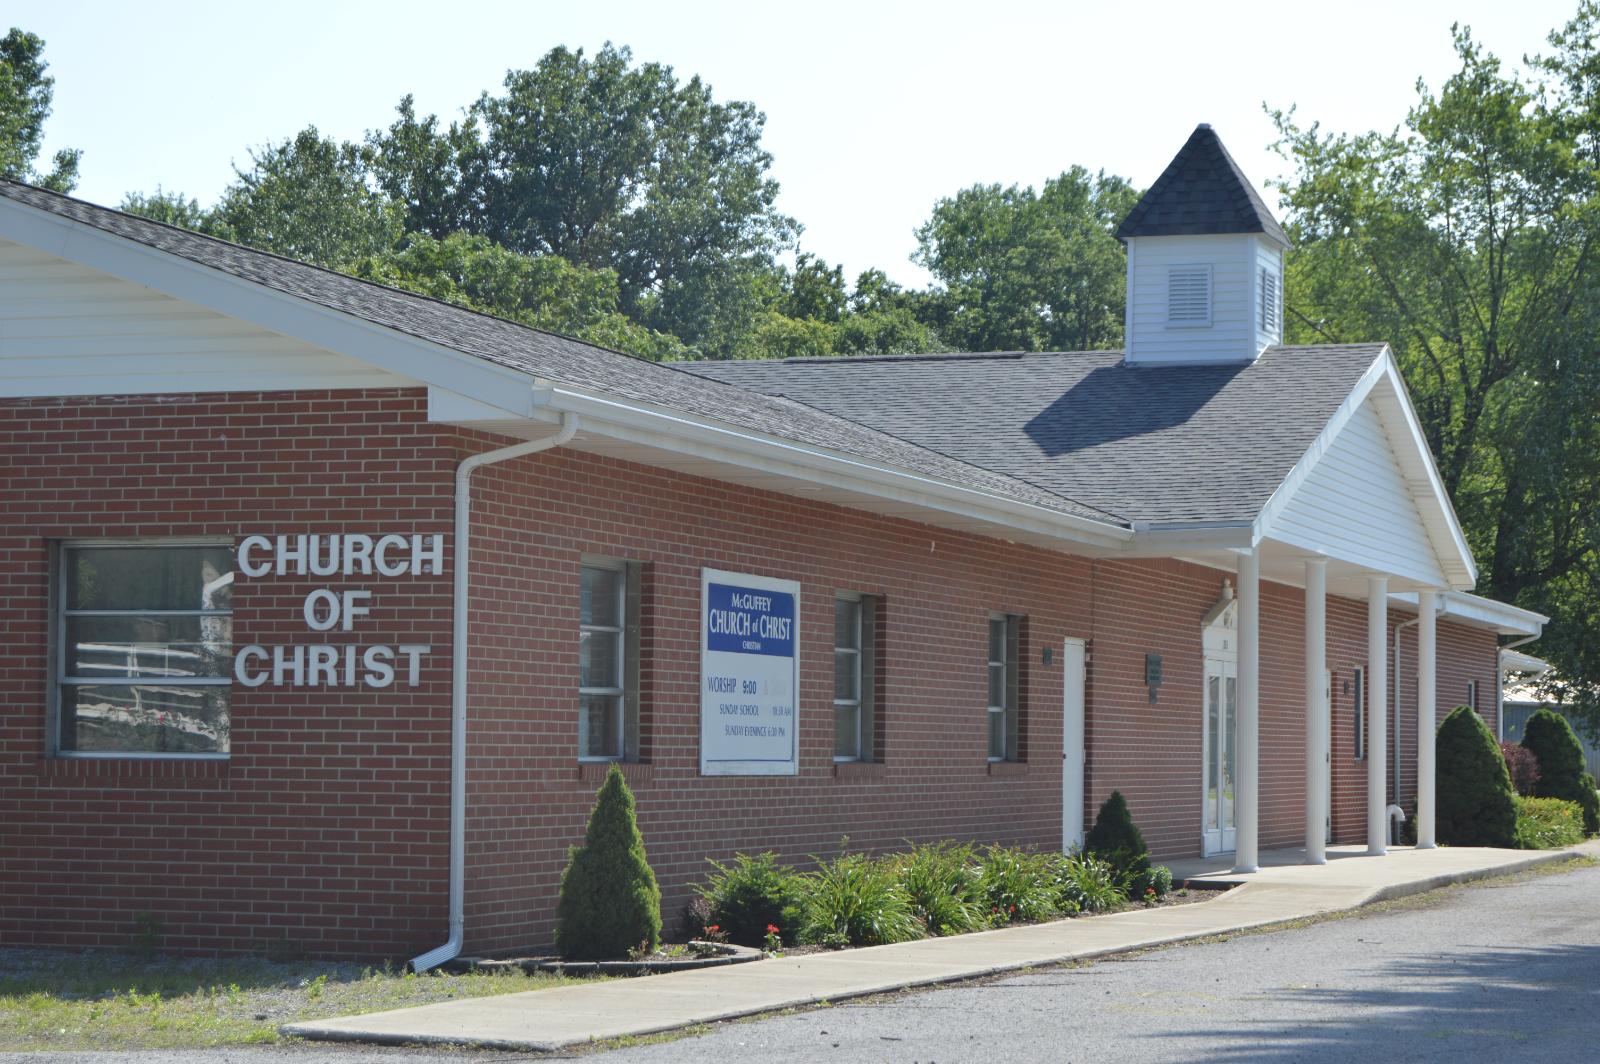
McGuffey, located in Hardin County, is a small and peaceful village with a population under 500. It’s known for its low cost of living and tight-knit community. Limited development keeps the area quiet and affordable.
Although the price increase has been small so far, McGuffey could become more appealing as housing costs rise elsewhere. Its affordability and charm make it a steady — if sleepy — option for those looking to stretch their housing dollar.
14. Dillonvale – 51% Home Price Increase Since 2016

- 2010: N/A
- 2011: N/A
- 2012: N/A
- 2013: N/A
- 2014: N/A
- 2015: N/A
- 2016: $56,341
- 2017: $55,253 ($-1,088, -1.93% from previous year)
- 2018: $58,474 (+$3,221, +5.83% from previous year)
- 2019: $58,954 (+$480, +0.82% from previous year)
- 2020: N/A
- 2021: $70,517
- 2022: $75,147 (+$4,630, +6.57% from previous year)
- 2023: $70,897 ($-4,250, -5.66% from previous year)
- 2024: $81,387 (+$10,490, +14.80% from previous year)
- 2025: $84,956 (+$3,569, +4.39% from previous year)
Prices in Dillonvale are up more than 51% since 2016, with especially sharp increases recorded in 2024. Despite recent volatility, the town remains an affordable choice in the southeastern corner of Ohio.
Dillonvale – A Community On the Rebound

Dillonvale is a small town in Jefferson County that has slowly rebuilt its real estate market in recent years. Once a coal mining hub, the town now offers modest housing, a rural atmosphere, and a low cost of living that draws retirees and working-class families alike.
Though amenities are limited, Dillonvale’s peaceful setting and proximity to natural attractions make it appealing to those looking for quiet living at accessible prices. The 2024 jump in value could indicate rising interest from outside buyers or improved infrastructure and demand.
13. Fort McKinley – 203% Home Price Increase Since 2010

- 2010: $27,961
- 2011: $27,818 ($-143, -0.51% from previous year)
- 2012: $26,519 ($-1,299, -4.67% from previous year)
- 2013: $27,492 (+$973, +3.67% from previous year)
- 2014: $27,348 ($-144, -0.52% from previous year)
- 2015: $28,445 (+$1,097, +4.01% from previous year)
- 2016: $26,376 ($-2,069, -7.27% from previous year)
- 2017: $31,081 (+$4,705, +17.84% from previous year)
- 2018: $36,874 (+$5,793, +18.64% from previous year)
- 2019: $42,723 (+$5,849, +15.86% from previous year)
- 2020: N/A
- 2021: $60,556
- 2022: $67,656 (+$7,100, +11.72% from previous year)
- 2023: $65,965 ($-1,691, -2.50% from previous year)
- 2024: $80,572 (+$14,607, +22.14% from previous year)
- 2025: $84,822 (+$4,250, +5.27% from previous year)
Fort McKinley has experienced a massive 203% increase in home values since 2010. After a sluggish start, prices began climbing in the late 2010s, with especially sharp gains during 2021–2024. At $84,822, it still offers surprising affordability given the growth it’s seen.
Fort McKinley – Sharp Growth Near Dayton
Located just northwest of Dayton, Fort McKinley is a small census-designated area that has seen revitalization in recent years. Its location offers quick access to the city while maintaining a suburban, residential feel. The community is attractive to commuters and first-time buyers who need affordability within reach of Dayton jobs.
Infrastructure improvements and regional migration patterns have played a part in boosting Fort McKinley’s home values. While prices have risen fast, the area remains one of the cheapest in the region — a key reason demand continues to grow.
12. Bergholz – 59% Home Price Increase Since 2016

- 2010: N/A
- 2011: N/A
- 2012: N/A
- 2013: N/A
- 2014: N/A
- 2015: N/A
- 2016: $53,360
- 2017: $57,568 (+$4,208, +7.89% from previous year)
- 2018: $60,870 (+$3,302, +5.74% from previous year)
- 2019: $63,212 (+$2,342, +3.85% from previous year)
- 2020: N/A
- 2021: $74,494
- 2022: $74,904 (+$410, +0.55% from previous year)
- 2023: $75,487 (+$583, +0.78% from previous year)
- 2024: $81,977 (+$6,490, +8.60% from previous year)
- 2025: $84,814 (+$2,837, +3.46% from previous year)
Bergholz has seen a steady climb in home values since 2016, with a 59% overall increase. It’s a quiet village with affordable housing and slow but consistent growth, offering long-term value to buyers seeking stability in a rural market.
Bergholz – Consistent Gains in a Rural Setting
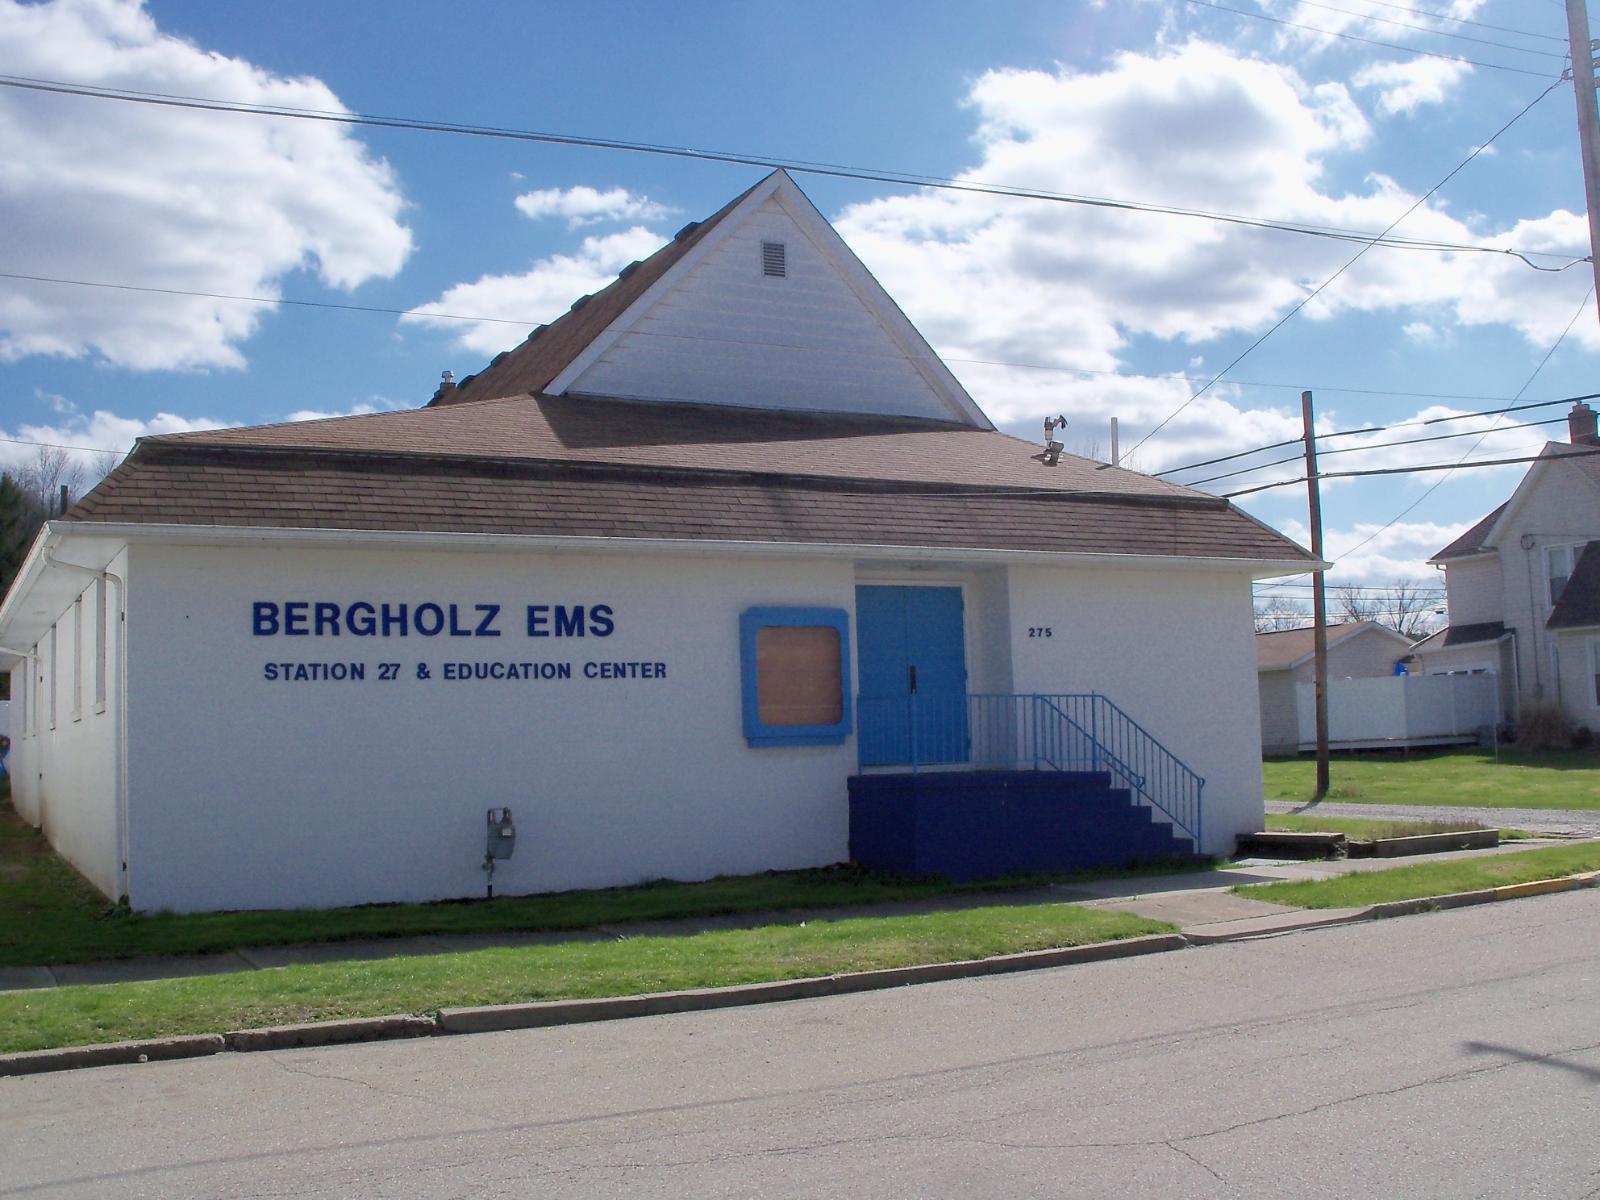
Bergholz, a small village in Jefferson County, offers a peaceful lifestyle away from urban bustle. It’s surrounded by rolling hills and farmland, and most residents appreciate its calm and community-focused atmosphere. The housing stock includes older, modest homes that appeal to first-time buyers or retirees.
While not growing fast in population, the village has attracted interest as an affordable place to live within commuting range of Steubenville and Canton. Its slow and steady price increases make it a dependable bet for long-term buyers who want affordability without surprises.
11. Masury – 108% Home Price Increase Since 2010

- 2010: $40,565
- 2011: $37,166 ($-3,399, -8.38% from previous year)
- 2012: $34,949 ($-2,217, -5.97% from previous year)
- 2013: $35,089 (+$140, +0.40% from previous year)
- 2014: $35,438 (+$349, +0.99% from previous year)
- 2015: $37,551 (+$2,113, +5.96% from previous year)
- 2016: $39,918 (+$2,367, +6.30% from previous year)
- 2017: $42,460 (+$2,542, +6.37% from previous year)
- 2018: $45,418 (+$2,958, +6.97% from previous year)
- 2019: $50,373 (+$4,955, +10.91% from previous year)
- 2020: N/A
- 2021: $64,313
- 2022: $72,567 (+$8,254, +12.83% from previous year)
- 2023: $70,814 ($-1,753, -2.42% from previous year)
- 2024: $78,121 (+$7,307, +10.32% from previous year)
- 2025: $84,516 (+$6,395, +8.19% from previous year)
Masury has seen a notable 108% growth in home values since 2010, driven by regular year-over-year gains and a few strong jumps in the 2020s. Prices continue to climb steadily, landing just below $85,000 in 2025.
Masury – A Quiet Community With Strong Momentum
Masury is an unincorporated community in Trumbull County near the Pennsylvania border. It shares close ties with Brookfield Township and is part of the Youngstown–Warren–Boardman metro area. Despite its small size, Masury is appealing for its combination of low home prices and proximity to bigger cities.
With its location near major roads and access to basic services, Masury has become increasingly attractive to those seeking value without isolation. Its consistent home price appreciation underscores growing interest from across the border and within Ohio alike.
10. Portsmouth – 39% Home Price Increase Since 2010

- 2010: $58,307
- 2011: $61,949 (+$3,642, +6.25% from previous year)
- 2012: $57,574 ($-4,375, -7.06% from previous year)
- 2013: $52,758 ($-4,816, -8.36% from previous year)
- 2014: $53,487 (+$729, +1.38% from previous year)
- 2015: $54,266 (+$779, +1.46% from previous year)
- 2016: $50,182 ($-4,084, -7.53% from previous year)
- 2017: $54,482 (+$4,300, +8.57% from previous year)
- 2018: $50,834 ($-3,648, -6.70% from previous year)
- 2019: $56,130 (+$5,296, +10.42% from previous year)
- 2020: N/A
- 2021: $61,935
- 2022: $70,731 (+$8,796, +14.20% from previous year)
- 2023: $69,551 ($-1,180, -1.67% from previous year)
- 2024: $77,968 (+$8,417, +12.10% from previous year)
- 2025: $80,940 (+$2,972, +3.81% from previous year)
Portsmouth’s home prices have grown nearly 40% since 2010, marked by a few dips and recoveries over the years. As of 2025, median values have climbed just above $80K, keeping this southern Ohio city among the more affordable in the state.
Portsmouth – Resilient Values in a River City
Portsmouth sits along the Ohio River and has a rich history tied to shipping, manufacturing, and railroads. Though it has faced economic challenges, the city remains a cultural hub in Scioto County with art museums, murals, and a strong community spirit.
Housing in Portsmouth offers a mix of architectural styles and remains accessible to a broad range of buyers. Its recent uptick in prices could reflect regional revitalization efforts, though affordability continues to be a defining draw.
9. Belle Valley – 58% Home Price Increase Since 2018
- 2010: N/A
- 2011: N/A
- 2012: N/A
- 2013: N/A
- 2014: N/A
- 2015: N/A
- 2016: N/A
- 2017: N/A
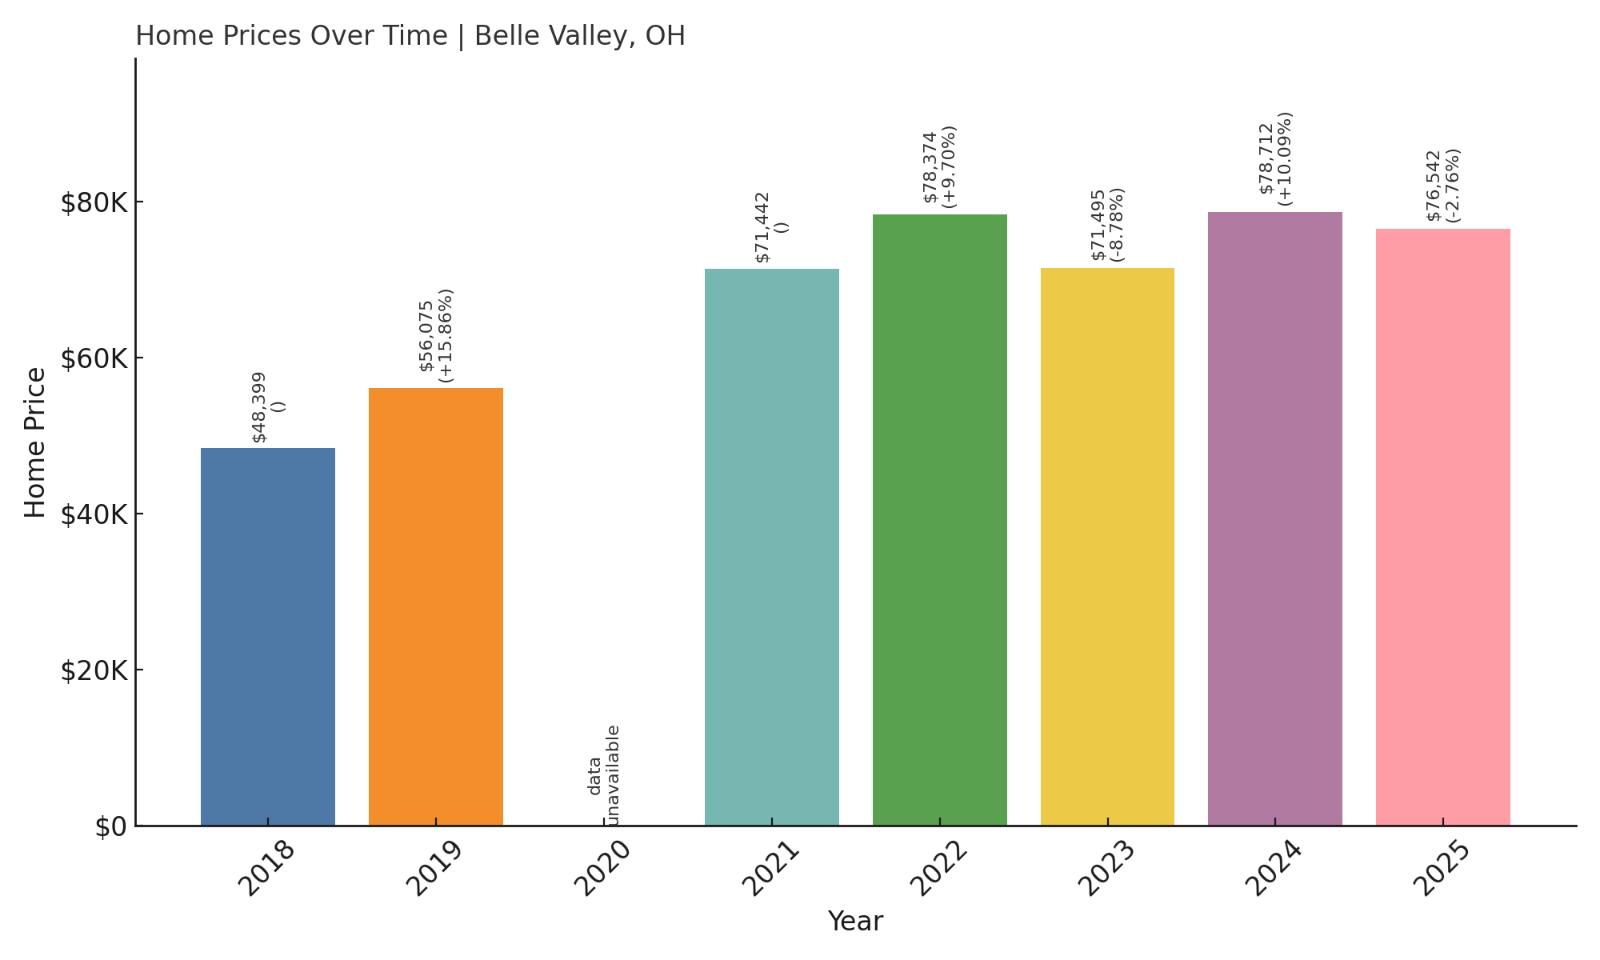
- 2018: $48,399
- 2019: $56,075 (+$7,676, +15.86% from previous year)
- 2020: N/A
- 2021: $71,442
- 2022: $78,374 (+$6,932, +9.70% from previous year)
- 2023: $71,495 ($-6,879, -8.78% from previous year)
- 2024: $78,712 (+$7,217, +10.09% from previous year)
- 2025: $76,542 ($-2,170, -2.76% from previous year)
Belle Valley’s housing market has grown 58% since 2018, with several double-digit annual increases and brief dips. The current median home price of $76,542 shows the town’s relative affordability even after years of appreciation.
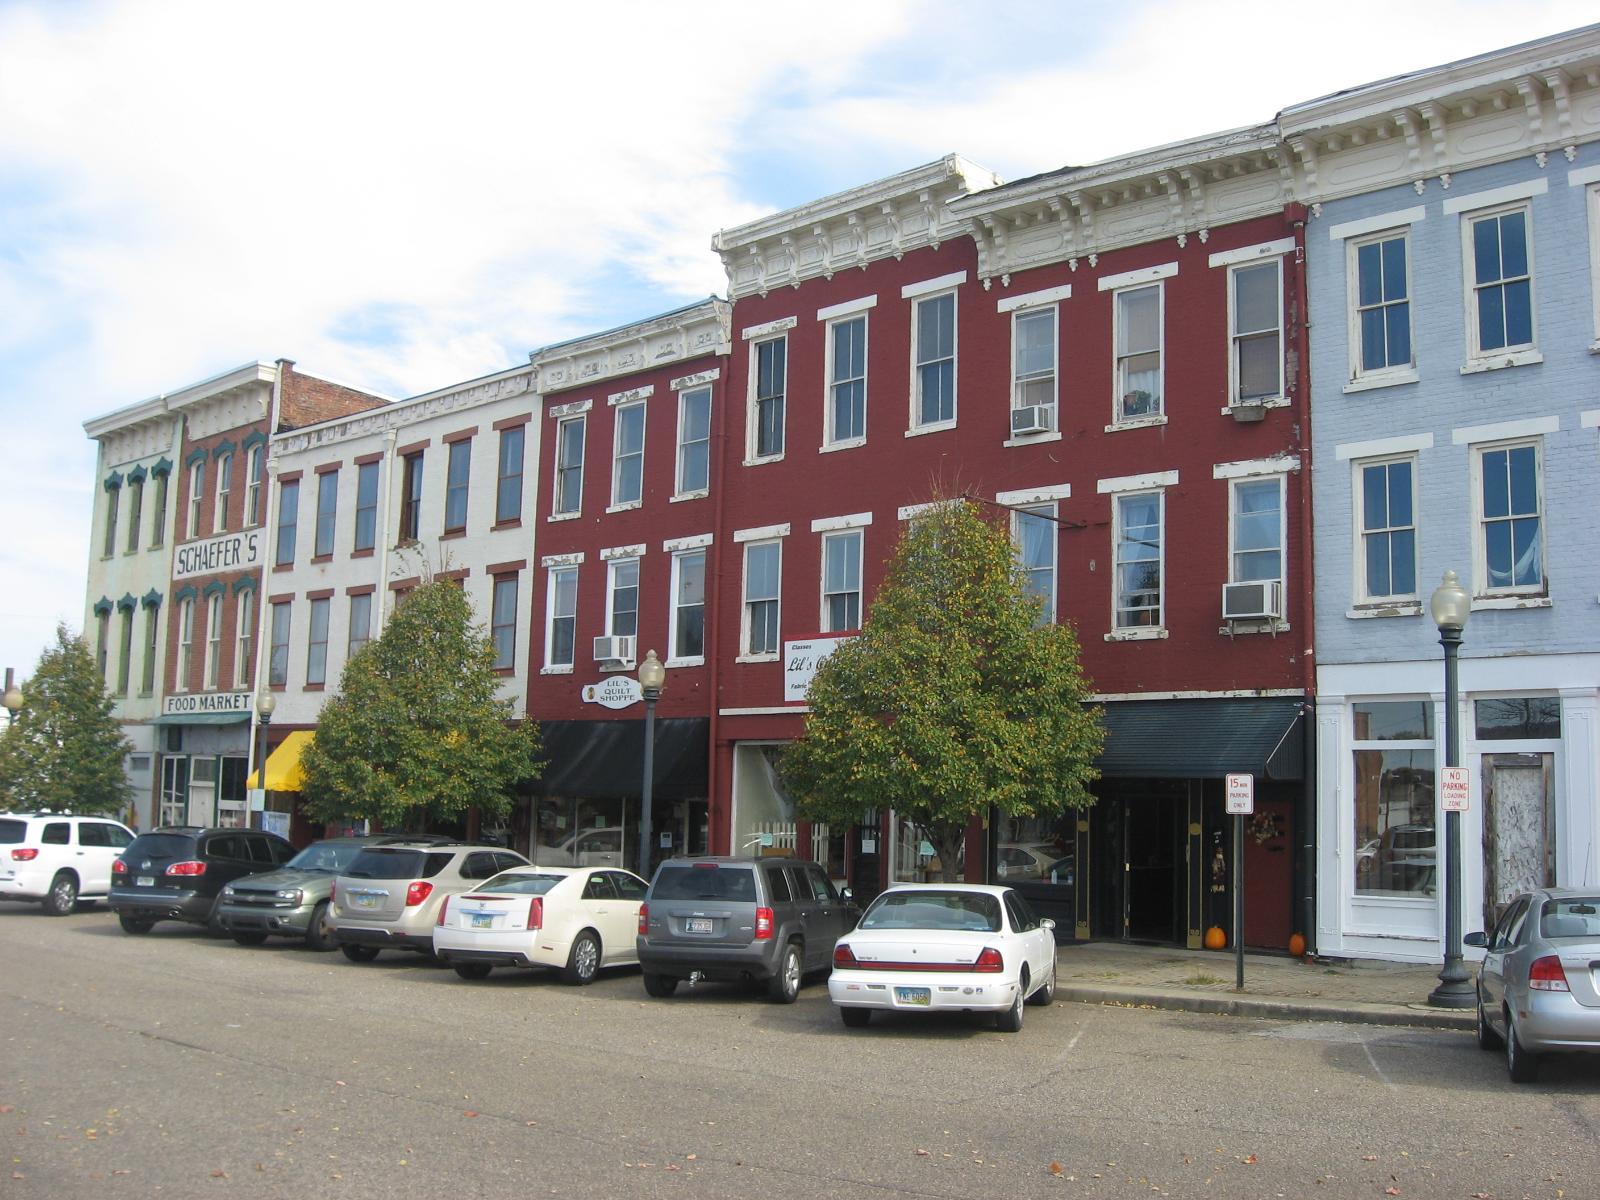
Belle Valley – Rural Calm With Affordable Prices
Belle Valley is located in Noble County in southeast Ohio and offers a laid-back lifestyle in a mostly rural setting. It’s popular among residents seeking a slower pace and more land for their money. Despite its small size, Belle Valley has seen a noticeable uptick in housing demand in recent years.
Local amenities are basic, but its proximity to Caldwell and scenic surroundings help maintain modest but consistent interest. For budget-conscious homebuyers looking for simplicity and space, Belle Valley is still a strong contender.
8. East Cleveland – 128% Home Price Increase Since 2013
- 2010: N/A
- 2011: N/A
- 2012: N/A
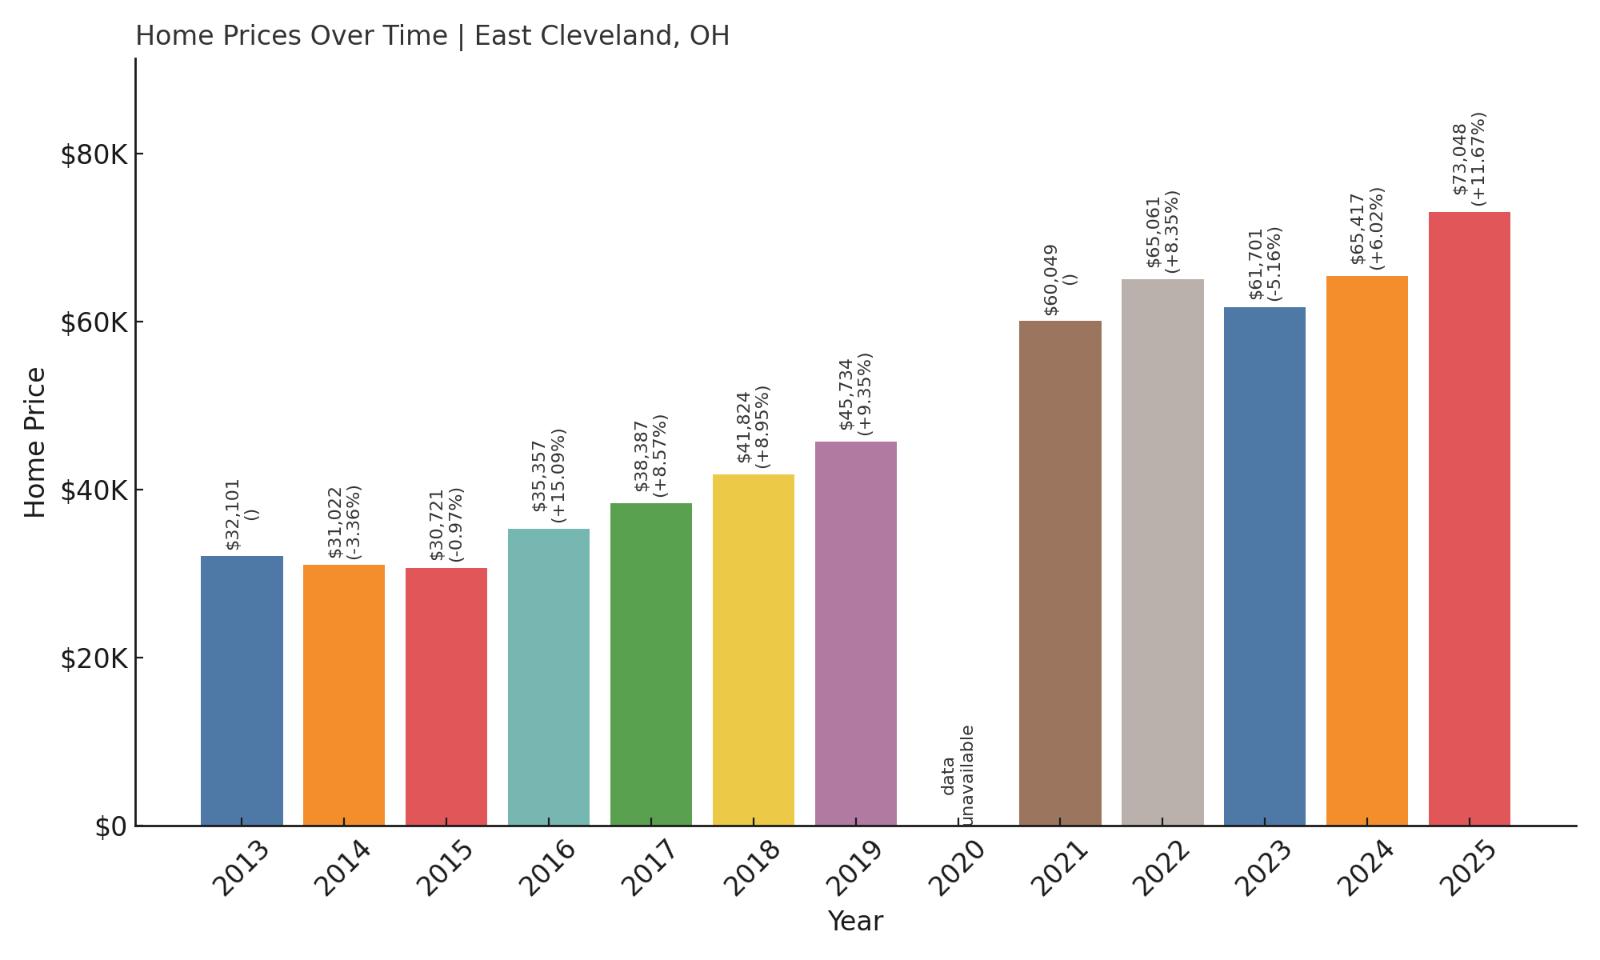
- 2013: $32,101
- 2014: $31,022 ($-1,079, -3.36% from previous year)
- 2015: $30,721 ($-301, -0.97% from previous year)
- 2016: $35,357 (+$4,636, +15.09% from previous year)
- 2017: $38,387 (+$3,030, +8.57% from previous year)
- 2018: $41,824 (+$3,437, +8.95% from previous year)
- 2019: $45,734 (+$3,910, +9.35% from previous year)
- 2020: N/A
- 2021: $60,049
- 2022: $65,061 (+$5,012, +8.35% from previous year)
- 2023: $61,701 ($-3,360, -5.16% from previous year)
- 2024: $65,417 (+$3,716, +6.02% from previous year)
- 2025: $73,048 (+$7,631, +11.67% from previous year)
East Cleveland’s home prices have jumped by 128% since 2013, recovering from a long period of disinvestment. Despite recent volatility, 2025 prices remain affordable and show that this inner-ring suburb is on the rebound.
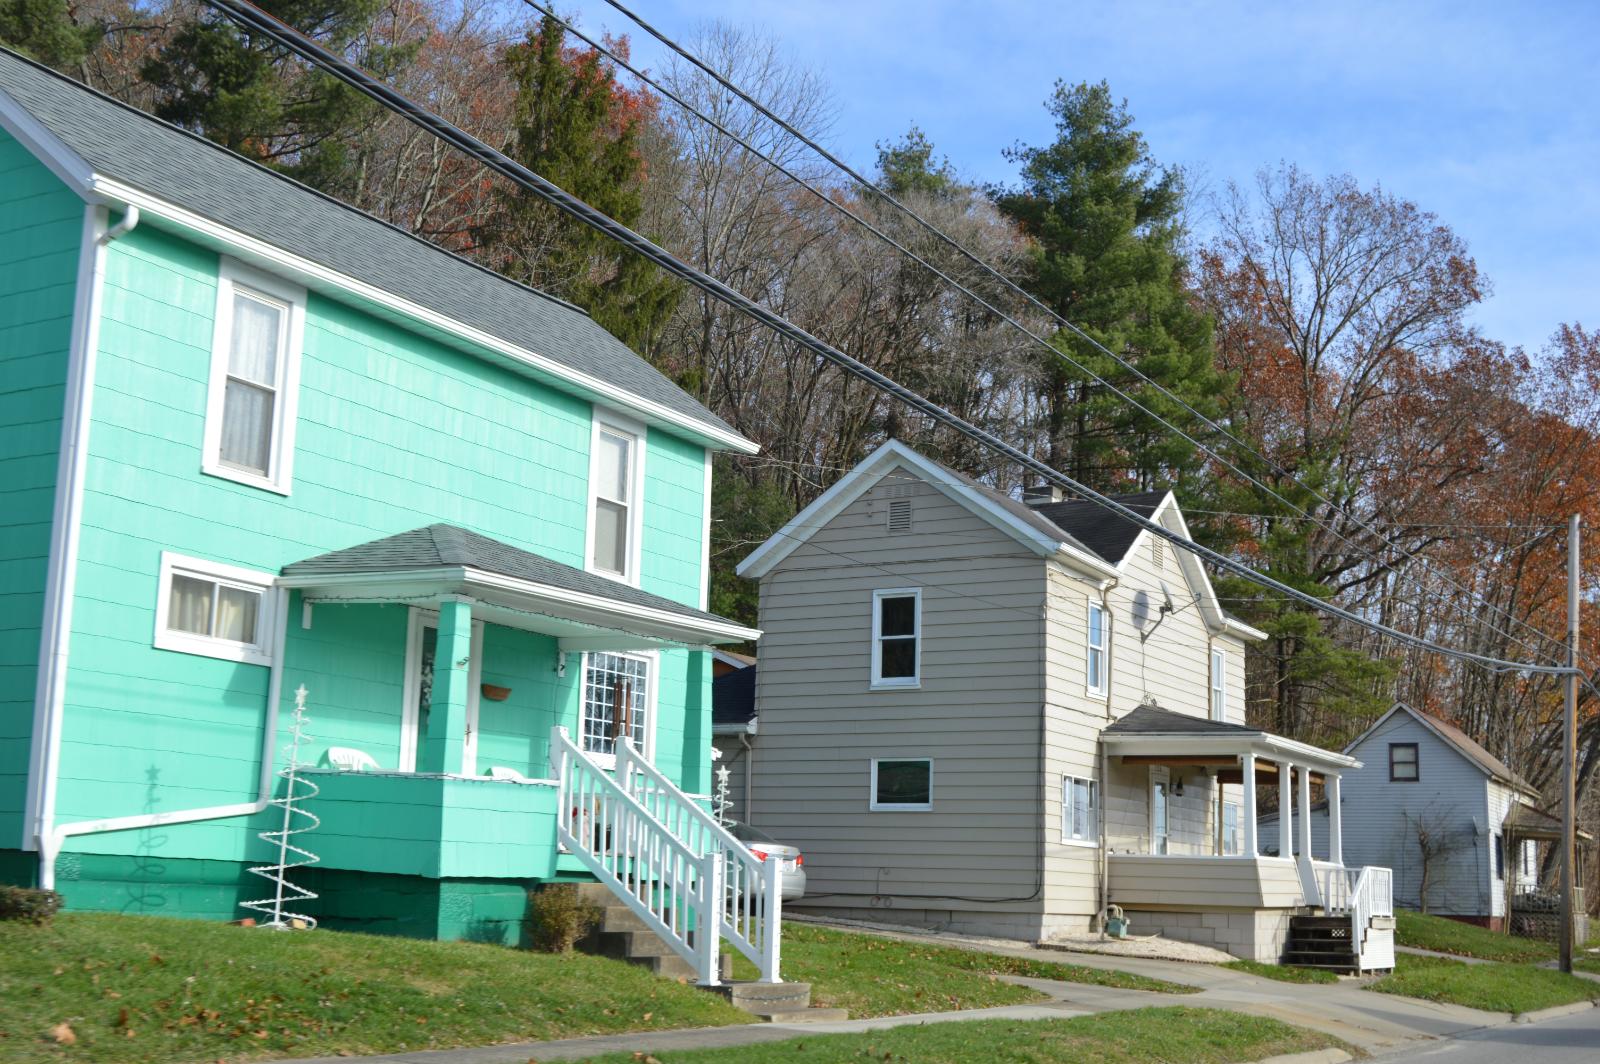
East Cleveland – Inner-City Affordability With Upside
Once a thriving suburb, East Cleveland has faced significant challenges in recent decades. However, with its location adjacent to University Circle and Cleveland’s major cultural institutions, the area is beginning to see signs of renewal. Affordable homes and increasing investment have helped push home values upward.
Though the area still faces infrastructure and economic hurdles, East Cleveland offers one of the lowest entry points for buyers looking near a major metro. Price gains in recent years suggest improving perception and potential for growth.
7. Coal Grove – 38% Home Price Increase Since 2010

- 2010: $52,809
- 2011: $55,086 (+$2,277, +4.31% from previous year)
- 2012: $55,873 (+$787, +1.43% from previous year)
- 2013: $60,860 (+$4,987, +8.93% from previous year)
- 2014: $60,802 ($-58, -0.10% from previous year)
- 2015: $60,254 ($-548, -0.90% from previous year)
- 2016: $59,326 ($-928, -1.54% from previous year)
- 2017: $59,768 (+$442, +0.75% from previous year)
- 2018: $60,593 (+$825, +1.38% from previous year)
- 2019: $58,890 ($-1,703, -2.81% from previous year)
- 2020: N/A
- 2021: $76,500
- 2022: $76,317 ($-183, -0.24% from previous year)
- 2023: $73,505 ($-2,812, -3.68% from previous year)
- 2024: $72,056 ($-1,449, -1.97% from previous year)
- 2025: $72,985 (+$929, +1.29% from previous year)
Coal Grove’s home prices have increased 38% since 2010. The market has been mostly stable, with slight ups and downs, but remains one of the most affordable in the state at just under $73,000 in 2025.
Coal Grove – Southern Comfort With Budget-Friendly Homes
Located along the Ohio River in Lawrence County, Coal Grove is a compact village near Ironton and Ashland, KY. It’s a quiet residential community that appeals to families and retirees alike, with scenic views and low home prices.
The housing market here has remained resilient but modest, offering a consistent option for buyers seeking affordability and riverfront access without urban congestion. It continues to be a dependable low-cost housing option in southern Ohio.
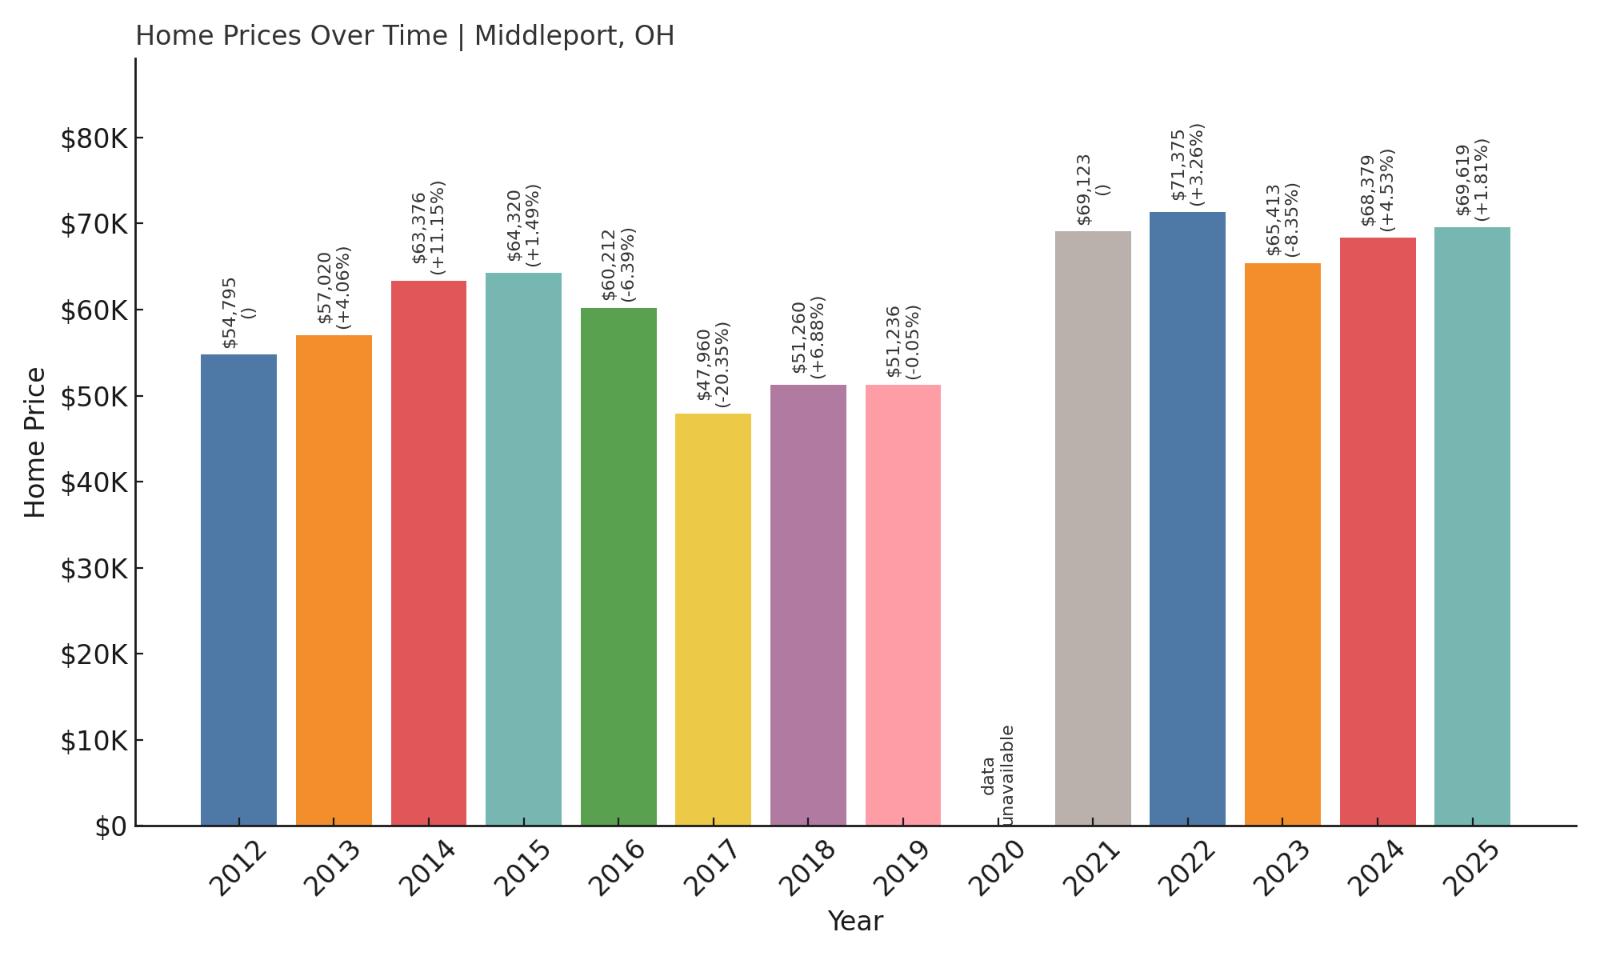
6. Middleport – 27% Home Price Increase Since 2012
- 2010: N/A
- 2011: N/A
- 2012: $54,795
- 2013: $57,020 (+$2,225, +4.06% from previous year)
- 2014: $63,376 (+$6,356, +11.15% from previous year)
- 2015: $64,320 (+$944, +1.49% from previous year)
- 2016: $60,212 ($-4,108, -6.39% from previous year)
- 2017: $47,960 ($-12,252, -20.35% from previous year)
- 2018: $51,260 (+$3,300, +6.88% from previous year)
- 2019: $51,236 ($-24, -0.05% from previous year)
- 2020: N/A
- 2021: $69,123
- 2022: $71,375 (+$2,252, +3.26% from previous year)
- 2023: $65,413 ($-5,962, -8.35% from previous year)
- 2024: $68,379 (+$2,966, +4.53% from previous year)
- 2025: $69,619 (+$1,240, +1.81% from previous year)
Middleport’s prices have risen by 27% since 2012, despite significant dips in the mid-2010s. Today, home values hover around $69,600, giving this Ohio River village continued appeal for buyers on a budget.
Middleport – A Riverfront Village With Resilient Value

Situated along the Ohio River in Meigs County, Middleport has deep roots as a river town and coal port. Today it’s known for its quiet streets, vintage architecture, and affordability. Its housing market reflects the ups and downs of local industry but has remained attractive to budget-conscious buyers.
With its waterfront charm and historic downtown, Middleport continues to draw interest from buyers who want a scenic home environment at an accessible price point. Even with fluctuations, it’s retained long-term value and community character.
5. New Boston – 51% Home Price Increase Since 2010

- 2010: $46,136
- 2011: $46,015 ($-121, -0.26% from previous year)
- 2012: $44,824 ($-1,191, -2.59% from previous year)
- 2013: $42,308 ($-2,516, -5.61% from previous year)
- 2014: $44,118 (+$1,810, +4.28% from previous year)
- 2015: $46,839 (+$2,721, +6.17% from previous year)
- 2016: $45,204 ($-1,635, -3.49% from previous year)
- 2017: $47,638 (+$2,434, +5.38% from previous year)
- 2018: $45,726 ($-1,912, -4.01% from previous year)
- 2019: $47,353 (+$1,627, +3.56% from previous year)
- 2020: N/A
- 2021: $54,111
- 2022: $60,648 (+$6,537, +12.08% from previous year)
- 2023: $58,252 ($-2,396, -3.95% from previous year)
- 2024: $69,115 (+$10,863, +18.65% from previous year)
- 2025: $69,615 (+$500, +0.72% from previous year)
New Boston has seen a 51% price increase since 2010, marked by both steady growth and occasional pullbacks. In 2025, the median home price sits just under $70K, keeping it firmly within the most affordable in Ohio.
New Boston – Affordable Living Near the River
Located just west of Portsmouth in Scioto County, New Boston blends small-town ease with access to shopping and services. It’s known for having some of the most accessible housing in the region, especially for working-class families and retirees.
With modest home values and recent appreciation, the town offers a solid option for buyers seeking stability and low entry costs. While job opportunities are limited, New Boston remains one of the most practical housing markets in southern Ohio.
4. Youngstown – 115% Home Price Increase Since 2010
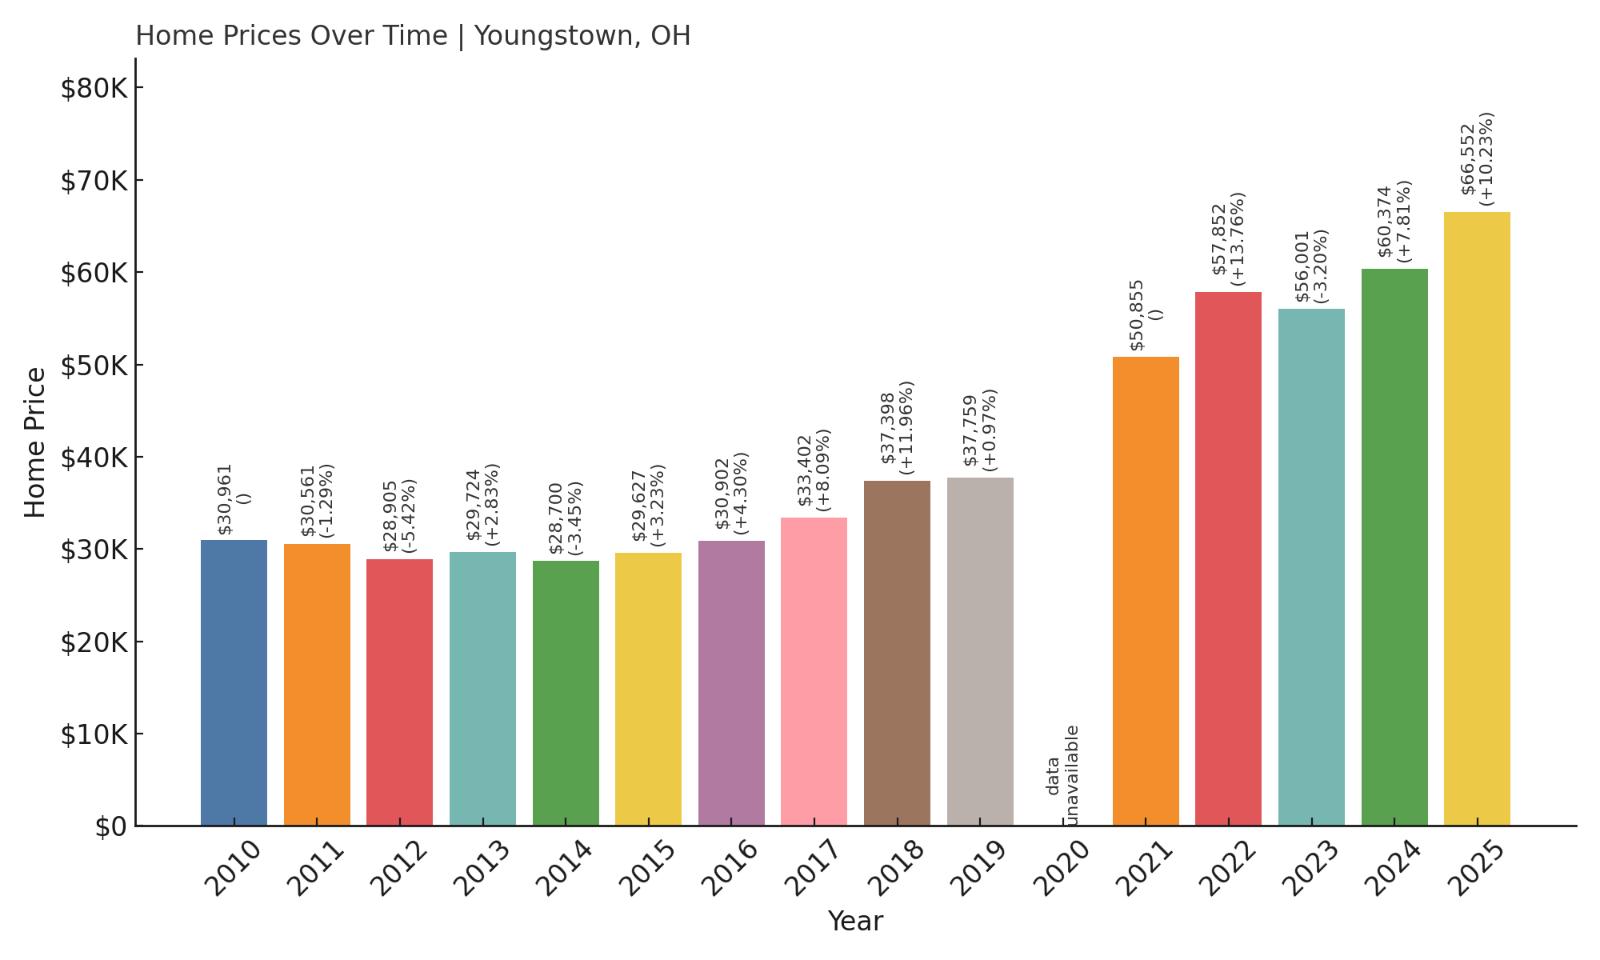
- 2010: $30,961
- 2011: $30,561 ($-400, -1.29% from previous year)
- 2012: $28,905 ($-1,656, -5.42% from previous year)
- 2013: $29,724 (+$819, +2.83% from previous year)
- 2014: $28,700 ($-1,024, -3.45% from previous year)
- 2015: $29,627 (+$927, +3.23% from previous year)
- 2016: $30,902 (+$1,275, +4.30% from previous year)
- 2017: $33,402 (+$2,500, +8.09% from previous year)
- 2018: $37,398 (+$3,996, +11.96% from previous year)
- 2019: $37,759 (+$361, +0.97% from previous year)
- 2020: N/A
- 2021: $50,855
- 2022: $57,852 (+$6,997, +13.76% from previous year)
- 2023: $56,001 ($-1,851, -3.20% from previous year)
- 2024: $60,374 (+$4,373, +7.81% from previous year)
- 2025: $66,552 (+$6,178, +10.23% from previous year)
Youngstown’s home values have climbed 115% since 2010, showing a significant rebound from post-industrial lows. With median prices still under $67K, it remains one of the cheapest metro markets in the country.
Youngstown – Big City Feel, Small Town Prices

Youngstown, the seat of Mahoning County, has undergone a long and bumpy transition from its steel manufacturing heyday. But in recent years, new investments, cultural institutions, and a growing university presence have helped breathe life back into its neighborhoods.
The affordability here is striking. While other cities climb past $200K, Youngstown remains accessible, especially for first-time buyers and investors looking for upside. Its mix of older homes and new development makes it a unique value in the Midwest.
3. Andover – 109% Home Price Increase Since 2010

- 2010: $29,497
- 2011: $28,704 ($-793, -2.69% from previous year)
- 2012: $28,690 ($-14, -0.05% from previous year)
- 2013: $30,640 (+$1,950, +6.80% from previous year)
- 2014: $31,631 (+$991, +3.23% from previous year)
- 2015: $31,851 (+$220, +0.70% from previous year)
- 2016: $33,454 (+$1,603, +5.03% from previous year)
- 2017: $34,265 (+$811, +2.42% from previous year)
- 2018: $36,364 (+$2,099, +6.13% from previous year)
- 2019: $37,870 (+$1,506, +4.14% from previous year)
- 2020: N/A
- 2021: $48,072
- 2022: $53,227 (+$5,155, +10.72% from previous year)
- 2023: $55,148 (+$1,921, +3.61% from previous year)
- 2024: $57,301 (+$2,153, +3.90% from previous year)
- 2025: $61,612 (+$4,311, +7.52% from previous year)
Home prices in Andover have more than doubled since 2010, growing by 109%. Even so, they remain among the lowest in the state, with a median of just over $61,000 in 2025.
Andover – Steady Growth in Ohio’s Northeast

Andover is a quiet village in Ashtabula County, not far from Pymatuning Lake. Its appeal lies in outdoor recreation and affordability. The community draws a mix of retirees, seasonal residents, and locals who value space and simplicity.
The real estate market has moved upward in small, consistent steps. Buyers looking for a weekend retreat or a peaceful year-round home will find a lot to like in this low-cost lakeside region.
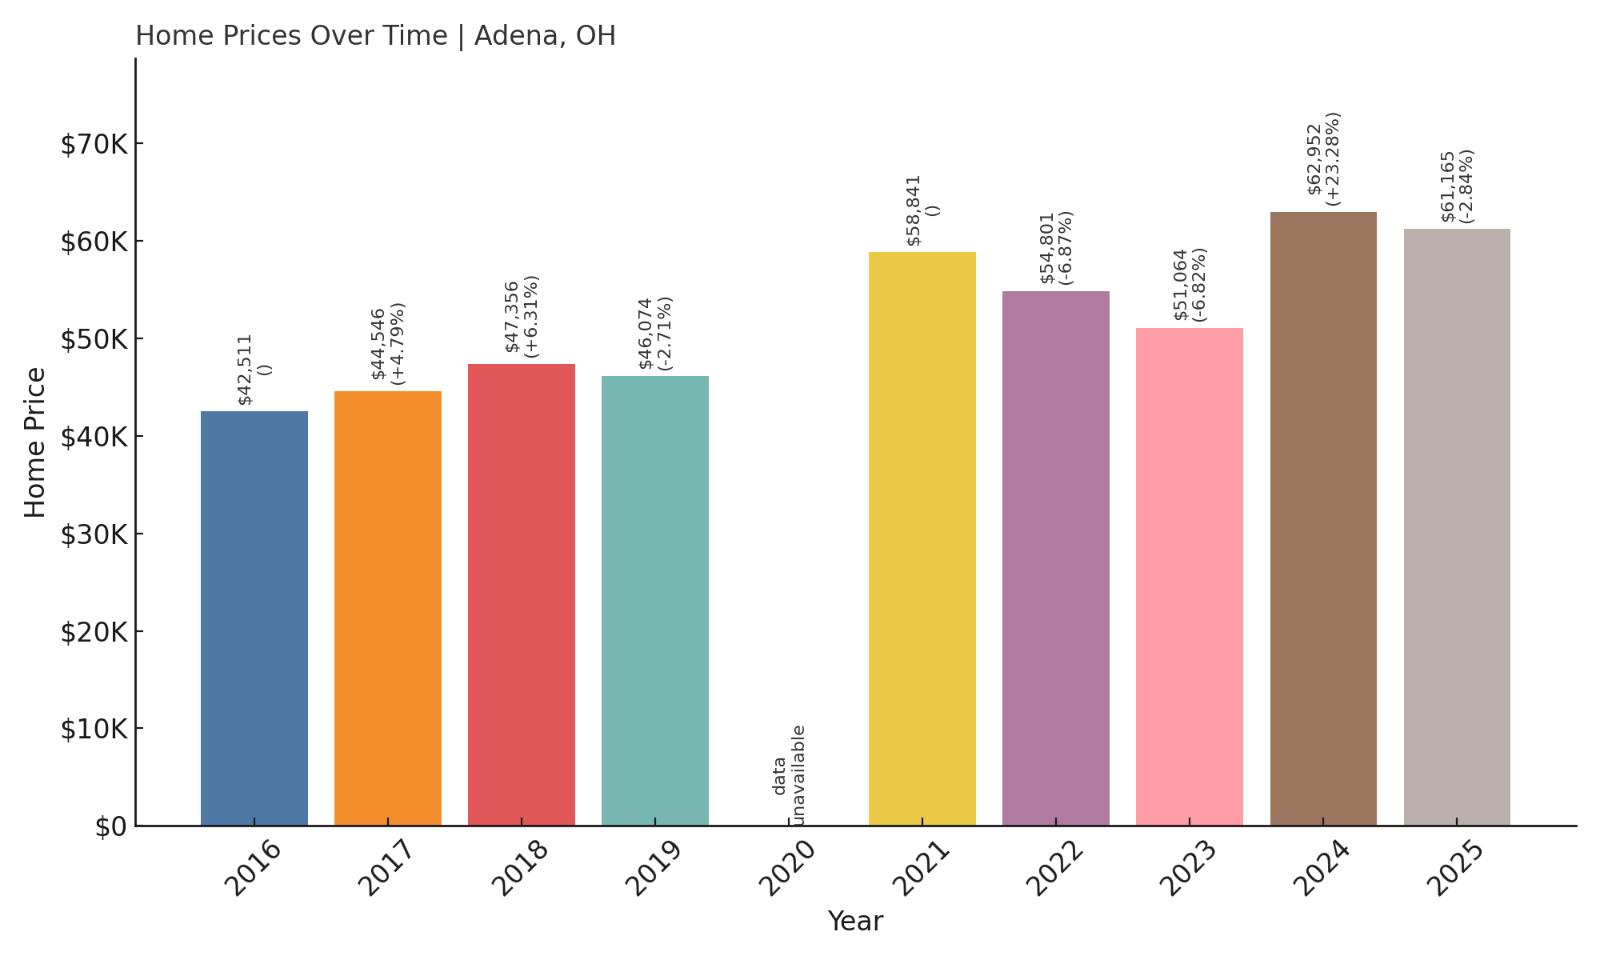
2. Adena – 44% Home Price Increase Since 2016
- 2010: N/A
- 2011: N/A
- 2012: N/A
- 2013: N/A
- 2014: N/A
- 2015: N/A
- 2016: $42,511
- 2017: $44,546 (+$2,035, +4.79% from previous year)
- 2018: $47,356 (+$2,810, +6.31% from previous year)
- 2019: $46,074 ($-1,282, -2.71% from previous year)
- 2020: N/A
- 2021: $58,841
- 2022: $54,801 ($-4,040, -6.87% from previous year)
- 2023: $51,064 ($-3,737, -6.82% from previous year)
- 2024: $62,952 (+$11,888, +23.28% from previous year)
- 2025: $61,165 ($-1,787, -2.84% from previous year)
Adena’s market has seen a 44% increase since 2016, despite recent volatility. The 2024 surge helped offset prior losses, putting median prices near $61,000 in 2025.
Adena – Big Swings in a Small Village
Located in Harrison and Jefferson counties, Adena is a tiny village with a rich coal mining past. Its housing stock is mostly historic, modestly sized homes that have drawn attention for their low entry costs.
Although the market has been uneven, 2024’s growth signals possible renewed demand or investment. For buyers seeking extremely low prices and don’t mind rural living, Adena is worth a closer look.
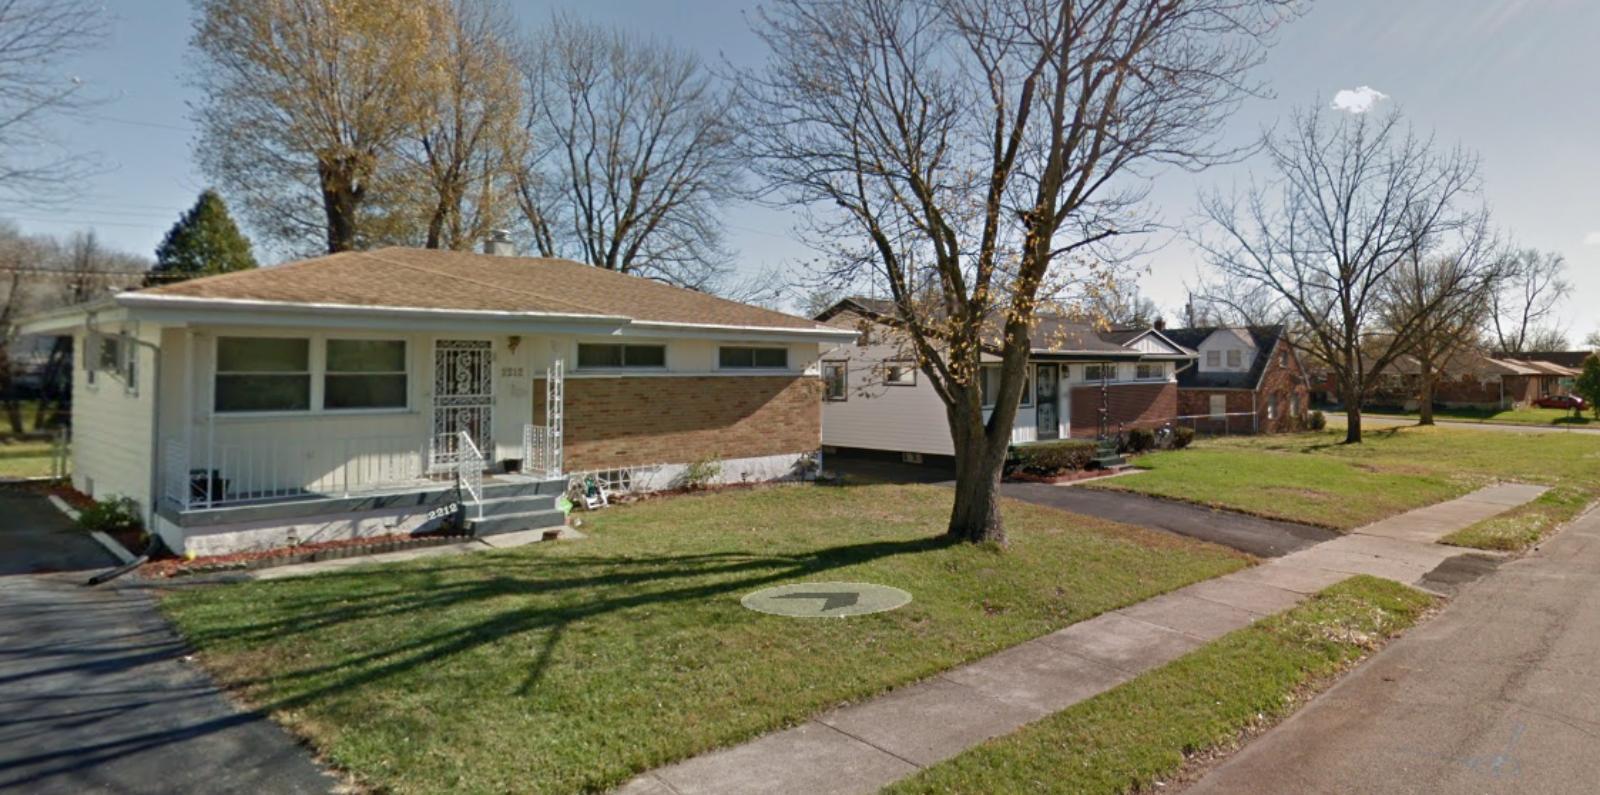
1. Drexel – 77% Home Price Increase Since 2016

- 2010: N/A
- 2011: N/A
- 2012: N/A
- 2013: N/A
- 2014: N/A
- 2015: N/A
- 2016: $31,919
- 2017: $31,171 ($-748, -2.34% from previous year)
- 2018: $35,455 (+$4,284, +13.74% from previous year)
- 2019: $41,838 (+$6,383, +18.00% from previous year)
- 2020: N/A
- 2021: $50,522
- 2022: $57,514 (+$6,992, +13.84% from previous year)
- 2023: $51,385 ($-6,129, -10.66% from previous year)
- 2024: $61,891 (+$10,506, +20.45% from previous year)
- 2025: $56,504 ($-5,387, -8.70% from previous year)
Drexel tops the list for affordability, with a 77% increase since 2016 but still offering a median home value of just $56,504 in 2025. It’s the most affordable housing market among the towns surveyed.
Drexel – Ohio’s Cheapest Market in 2025

Drexel is a small community in Montgomery County just west of Dayton. It’s an unincorporated area with aging infrastructure, limited amenities, and a shrinking population — all factors that have helped keep home prices low.
Despite the challenges, price growth in 2018, 2019, and 2024 shows periodic spikes in activity. For bargain hunters and investors, Drexel represents a true bottom-dollar opportunity in the state.