🔥 Would you like to save this?
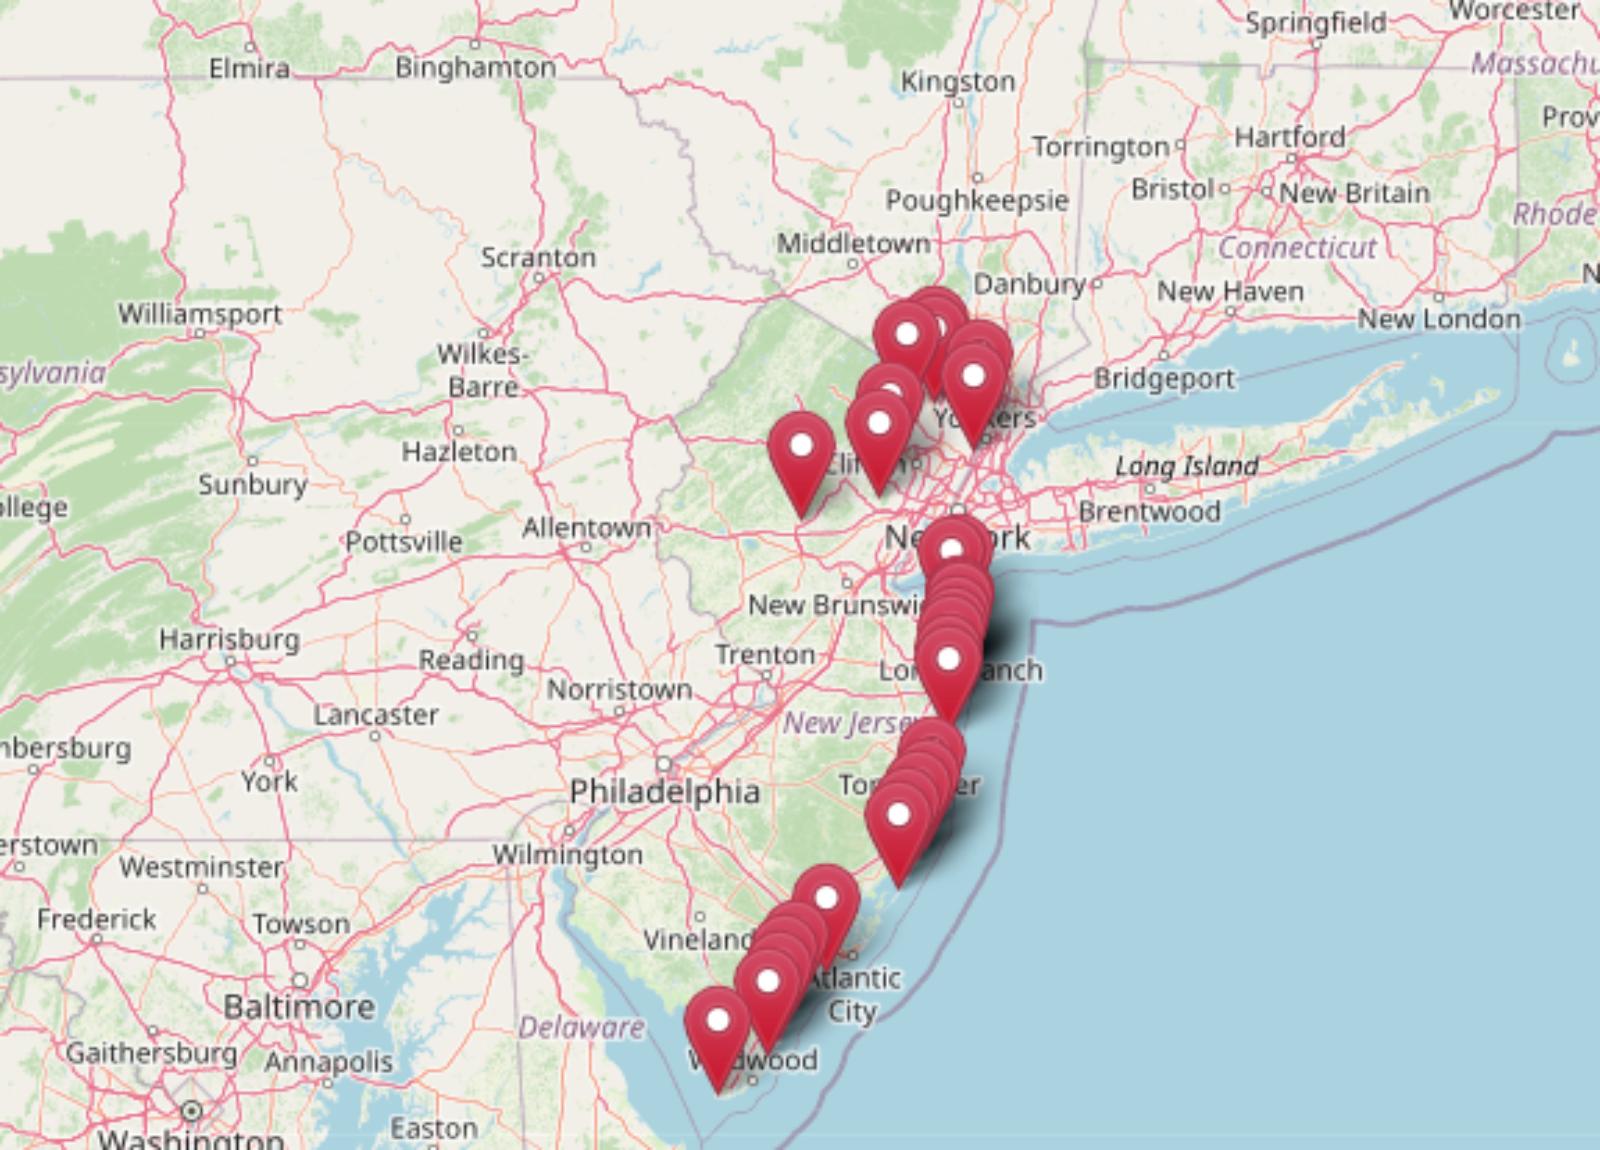
New Jersey’s real estate scene isn’t just expensive—it’s outrageous in all the best (and worst) ways. The Zillow Home Value Index reveals 30 towns where home prices have rocketed so high they’d make Manhattan blush. From posh shore enclaves with oceanfront views to commuter-friendly suburbs where the lawns are large and the mortgages larger, these are the towns pricing out average buyers one six-figure jump at a time. Some climbed slow and steady, others shot up overnight—but all 30 are proof that in Jersey, location doesn’t just matter… it costs.
30. Spring Lake – 113.6% Home Price Increase Since 2012
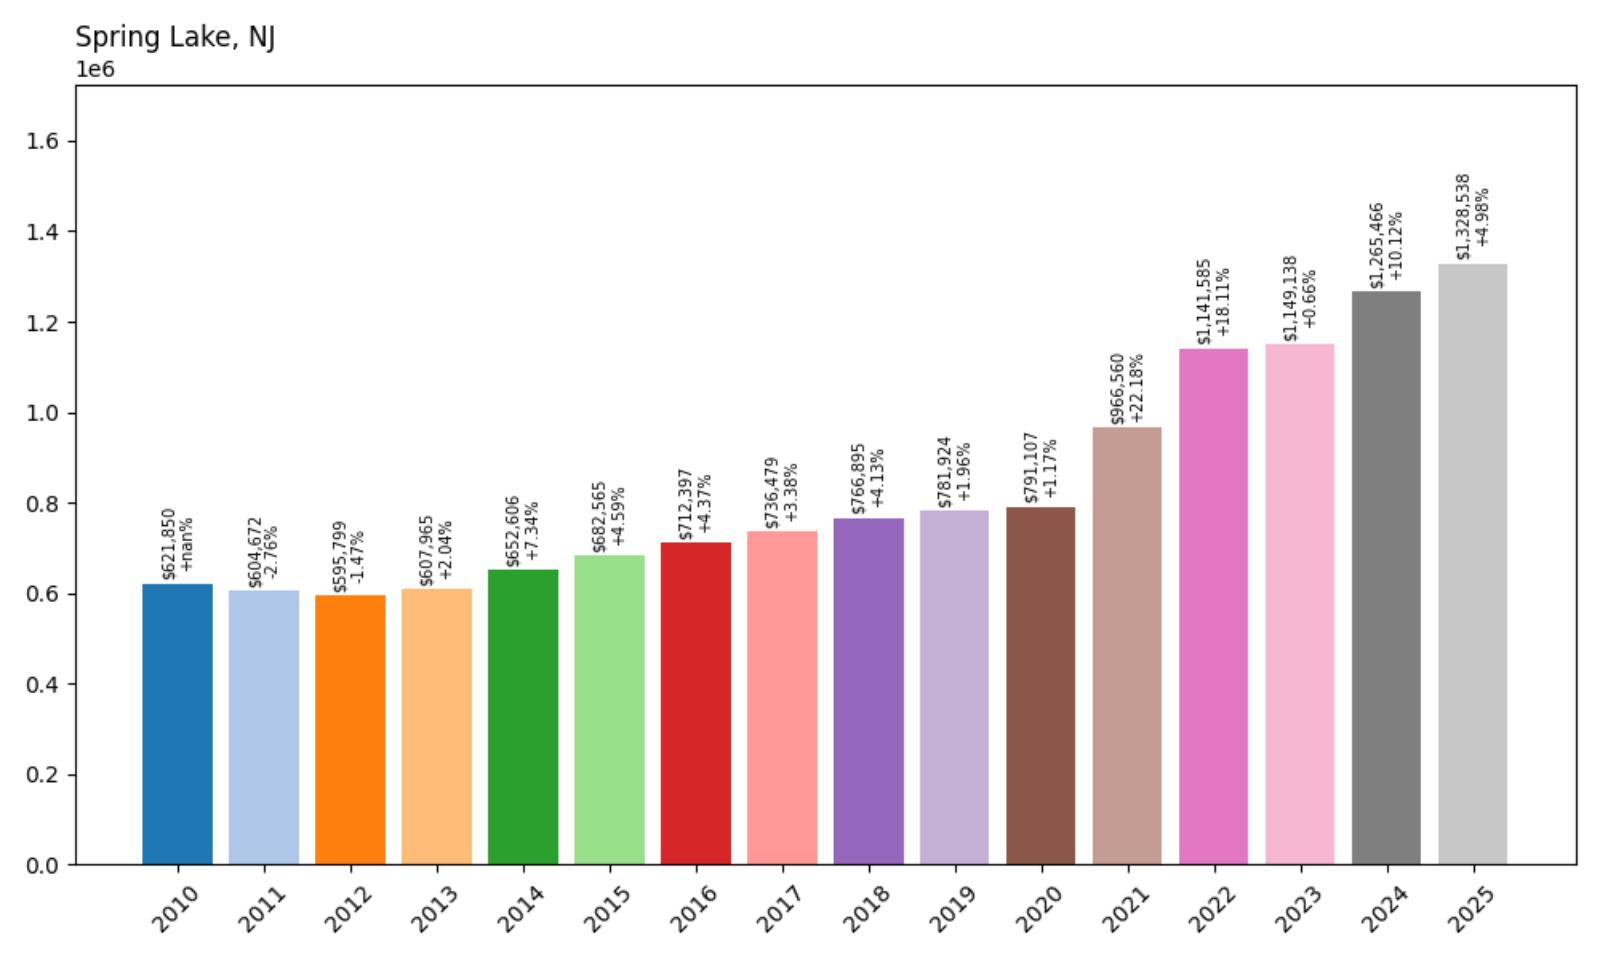
- 2010: $621,850
- 2011: $604,672 (−$17,178, −2.76% from previous year)
- 2012: $595,799 (−$8,872, −1.47% from previous year)
- 2013: $607,965 (+$12,165, +2.04% from previous year)
- 2014: $652,606 (+$44,641, +7.34% from previous year)
- 2015: $682,565 (+$29,960, +4.59% from previous year)
- 2016: $712,397 (+$29,831, +4.37% from previous year)
- 2017: $736,479 (+$24,082, +3.38% from previous year)
- 2018: $766,895 (+$30,416, +4.13% from previous year)
- 2019: $781,924 (+$15,029, +1.96% from previous year)
- 2020: $791,107 (+$9,184, +1.17% from previous year)
- 2021: $966,560 (+$175,452, +22.18% from previous year)
- 2022: $1,141,585 (+$175,026, +18.11% from previous year)
- 2023: $1,149,138 (+$7,553, +0.66% from previous year)
- 2024: $1,265,466 (+$116,328, +10.12% from previous year)
- 2025: $1,328,538 (+$63,071, +4.98% from previous year)
Spring Lake’s property values more than doubled between 2012 and 2025, rising 113.6% over 13 years. The biggest jumps came after 2020, with especially large gains in 2021 and 2022. Though price increases have since moderated, the upward trend has remained strong. As of June 2025, the average home in Spring Lake now costs $1.33 million, a clear reflection of its enduring desirability among affluent buyers.
In order to come up with the very specific design ideas, we create most designs with the assistance of state-of-the-art AI interior design software. Also, assume links that take you off the site are affiliate links such as links to Amazon. this means we may earn a commission if you buy something.
Spring Lake – Luxury Market with Long-Term Demand
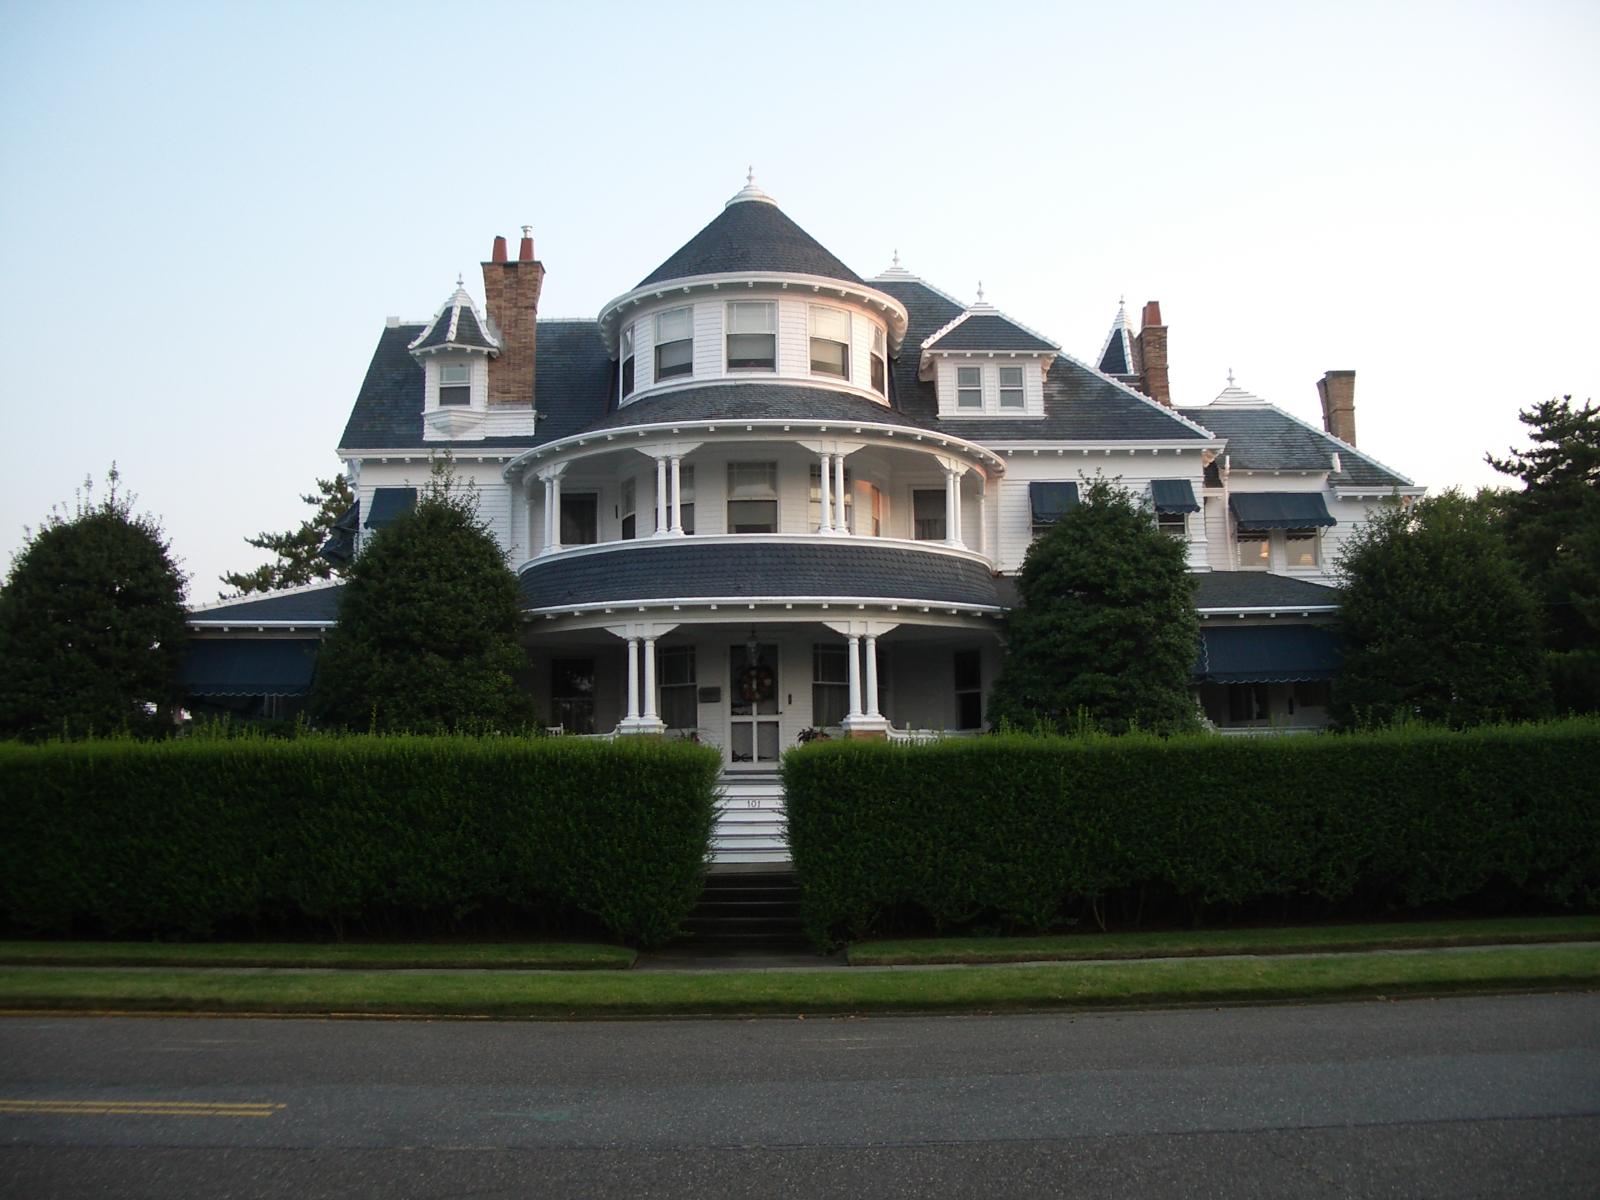
Often referred to as the “Jewel of the Jersey Shore,” Spring Lake boasts oceanfront mansions, manicured streets, and a charming downtown. This Monmouth County community has long been a magnet for high-net-worth individuals seeking refined living near the coast. The town’s historic character and strict zoning policies have limited new development, keeping housing inventory tight and values elevated.
Homebuyers in Spring Lake often pay a premium for privacy and aesthetic charm, supported by top-tier public services and beach access. Demand surged during the pandemic as buyers fled cities for more space and seaside air, and while the market cooled briefly in 2023, it rebounded quickly. With prices now stabilizing above the $1.3 million mark, Spring Lake remains one of New Jersey’s most exclusive zip codes, and that status doesn’t appear to be changing anytime soon.
29. Upper Saddle River – 52.8% Home Price Increase Since 2012
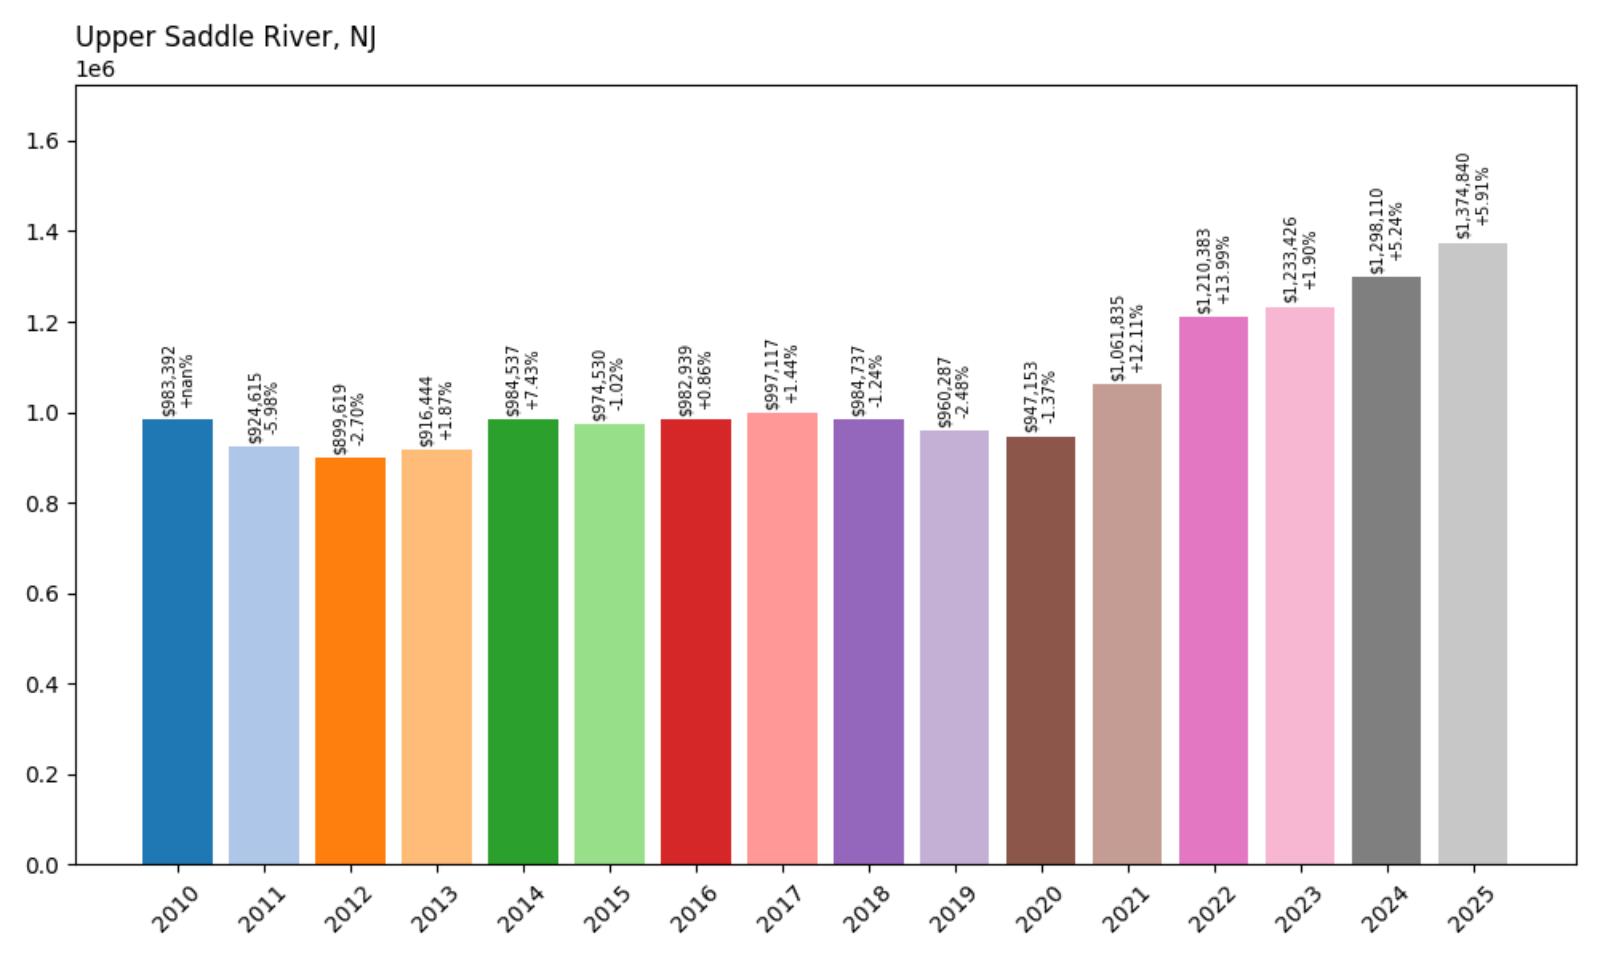
- 2010: $983,392
- 2011: $924,615 (−$58,777, −5.98% from previous year)
- 2012: $899,619 (−$24,996, −2.70% from previous year)
- 2013: $916,444 (+$16,825, +1.87% from previous year)
- 2014: $984,537 (+$68,093, +7.43% from previous year)
- 2015: $974,530 (−$10,007, −1.02% from previous year)
- 2016: $982,939 (+$8,409, +0.86% from previous year)
- 2017: $997,117 (+$14,178, +1.44% from previous year)
- 2018: $984,737 (−$12,380, −1.24% from previous year)
- 2019: $960,287 (−$24,449, −2.48% from previous year)
- 2020: $947,153 (−$13,135, −1.37% from previous year)
- 2021: $1,061,835 (+$114,682, +12.11% from previous year)
- 2022: $1,210,383 (+$148,548, +13.99% from previous year)
- 2023: $1,233,426 (+$23,042, +1.90% from previous year)
- 2024: $1,298,110 (+$64,684, +5.24% from previous year)
- 2025: $1,374,840 (+$76,730, +5.91% from previous year)
Upper Saddle River’s housing market has climbed 52.8% since 2012, rising from $899,619 to $1,374,840. The pace was slow through most of the 2010s, but a sharp uptick began in 2021 and carried through the mid-2020s. Price growth has been steady in the last three years, suggesting a balanced but robust luxury market with sustained demand.
Upper Saddle River – A Bergen County Staple
Nestled in northern Bergen County, Upper Saddle River is a suburban enclave known for its large homes, scenic lots, and quiet neighborhoods. It appeals to families and professionals who want access to top-ranked schools and proximity to New York City while enjoying a spacious, suburban environment. Limited commercial development and large zoning lots help maintain the area’s upscale feel.
The town’s relatively stable prices during economic fluctuations are a testament to its long-term appeal. While its price gains aren’t as explosive as coastal towns, Upper Saddle River offers consistency and quality, which keeps the market competitive. As of June 2025, prices continue to trend upward, and with minimal buildable land left, that trend is expected to persist.
28. Sea Isle City – 147.9% Home Price Increase Since 2011
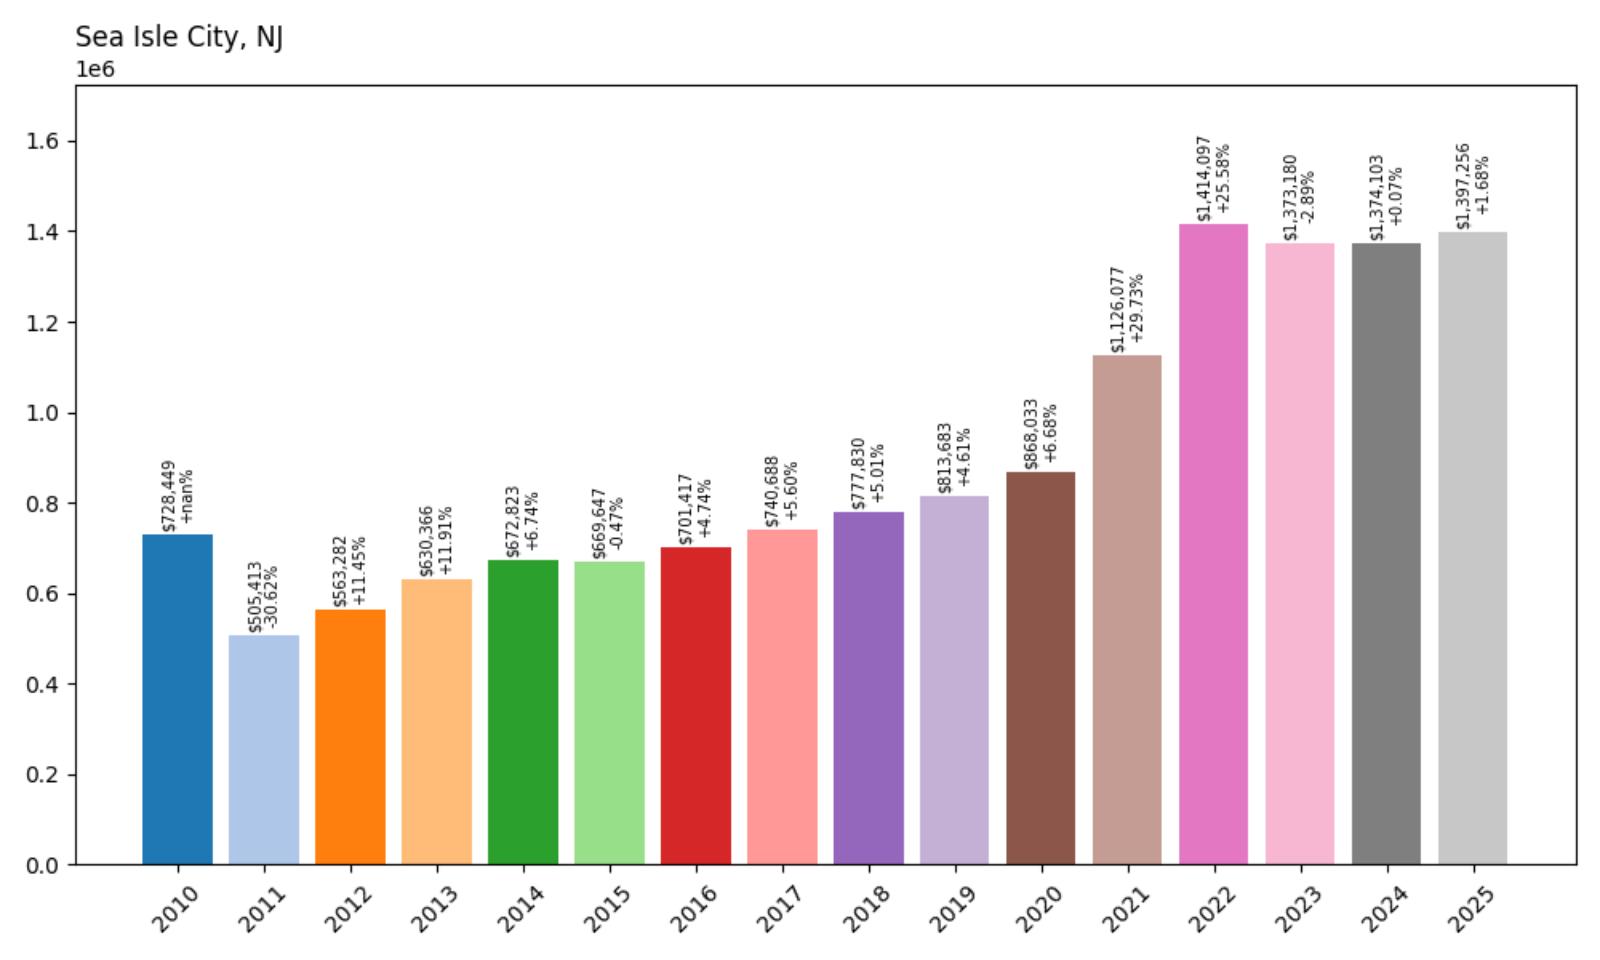
- 2010: $728,449
- 2011: $505,413 (−$223,036, −30.62% from previous year)
- 2012: $563,282 (+$57,869, +11.45% from previous year)
- 2013: $630,366 (+$67,084, +11.91% from previous year)
- 2014: $672,823 (+$42,457, +6.74% from previous year)
- 2015: $669,647 (−$3,176, −0.47% from previous year)
- 2016: $701,417 (+$31,770, +4.74% from previous year)
- 2017: $740,688 (+$39,271, +5.60% from previous year)
- 2018: $777,830 (+$37,142, +5.01% from previous year)
- 2019: $813,683 (+$35,852, +4.61% from previous year)
- 2020: $868,033 (+$54,350, +6.68% from previous year)
- 2021: $1,126,077 (+$258,044, +29.73% from previous year)
- 2022: $1,414,097 (+$288,021, +25.58% from previous year)
- 2023: $1,373,180 (−$40,917, −2.89% from previous year)
- 2024: $1,374,103 (+$923, +0.07% from previous year)
- 2025: $1,397,256 (+$23,152, +1.68% from previous year)
Sea Isle City home values soared 147.9% from their post-recession low of $505,413 in 2011 to $1,397,256 in 2025. Prices surged especially hard after 2020, jumping more than 25% in both 2021 and 2022 alone. While the market dipped slightly in 2023, it rebounded with slow and steady gains in the following two years. This long-term growth trajectory reflects strong seasonal interest and sustained second-home demand in this beachside town.
Sea Isle City – High Demand and Limited Supply
Sea Isle City has long been a destination for vacationers seeking a mix of family-friendly amenities and beachfront charm. Located in Cape May County, it offers a well-developed boardwalk, sandy beaches, and an array of restaurants and bars that draw thousands each summer. Unlike some other seasonal towns, Sea Isle benefits from a strong rental market, which adds investment appeal for buyers seeking income-generating properties. The town’s commitment to improving its infrastructure and storm resilience has also boosted confidence among homebuyers who view it as a long-term bet.
From a real estate standpoint, Sea Isle City has very limited inventory. Most available land is already built on, and tight zoning rules limit new high-density development. This scarcity—combined with a wave of post-pandemic migration toward coastal living—pushed prices upward at a dramatic pace. Many of the homes here are modern rebuilds or extensively renovated, which further elevates the local price point. Looking forward, demand is likely to remain high, especially among retirees and second-home seekers who want proximity to the beach without the density of bigger shore towns.
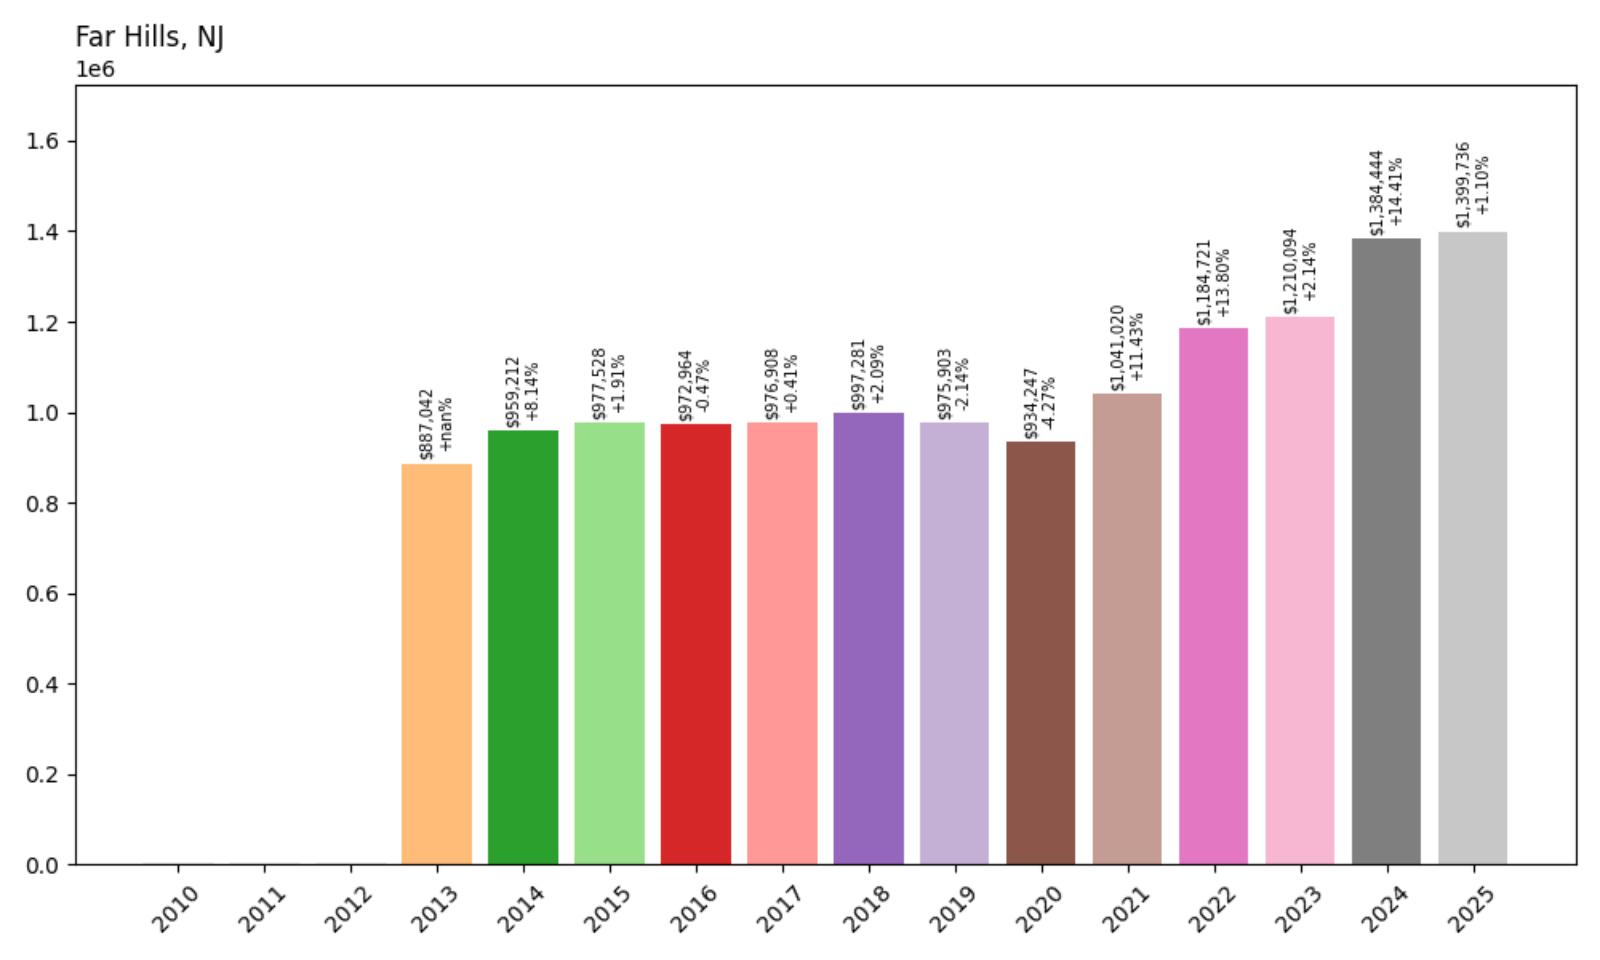
27. Far Hills – 57.8% Home Price Increase Since 2013
- 2010: N/A
- 2011: N/A
- 2012: N/A
- 2013: $887,042
- 2014: $959,212 (+$72,170, +8.14% from previous year)
- 2015: $977,528 (+$18,316, +1.91% from previous year)
- 2016: $972,964 (−$4,564, −0.47% from previous year)
- 2017: $976,908 (+$3,944, +0.41% from previous year)
- 2018: $997,281 (+$20,373, +2.09% from previous year)
- 2019: $975,903 (−$21,379, −2.14% from previous year)
- 2020: $934,247 (−$41,656, −4.27% from previous year)
- 2021: $1,041,020 (+$106,773, +11.43% from previous year)
- 2022: $1,184,721 (+$143,701, +13.80% from previous year)
- 2023: $1,210,094 (+$25,373, +2.14% from previous year)
- 2024: $1,384,444 (+$174,350, +14.41% from previous year)
- 2025: $1,399,736 (+$15,293, +1.10% from previous year)
Far Hills has seen its home prices rise by nearly 58% since 2013, climbing from $887,042 to $1,399,736 by mid-2025. While much of this growth occurred in the last five years, particularly in 2021 and 2022, the market has shown a consistent upward pattern. The town’s luxury rural setting and strategic location have attracted high-income buyers who value privacy and exclusivity more than urban convenience.
Far Hills – Rural Wealth and Quiet Luxury
Situated in Somerset County, Far Hills is a quintessential country estate town. With rolling farmland, large wooded lots, and strict preservation efforts, it attracts buyers looking for space and seclusion. It’s also home to private clubs, horse farms, and scenic vistas—making it a favorite among equestrian enthusiasts and legacy wealth families. Despite its rural feel, Far Hills offers quick access to NJ Transit lines and major highways, making it viable for executives commuting to Manhattan or nearby business hubs. The lack of commercial sprawl helps protect property values, and most homes are custom builds with significant acreage, reinforcing the town’s exclusive character.
The town’s price recovery post-2020 is particularly noteworthy, as buyers turned toward open space and larger homes with home-office potential. That lifestyle shift benefited Far Hills enormously. While 2023 and 2025 saw more modest gains, the substantial increases in 2021, 2022, and 2024 anchored long-term value appreciation. Buyers here are generally not first-timers; they’re purchasing for generational use or long-term estate holdings. That dynamic creates a less volatile market and keeps supply low. As high-end rural living becomes more desirable, Far Hills is poised to retain its elite status in New Jersey’s housing market.
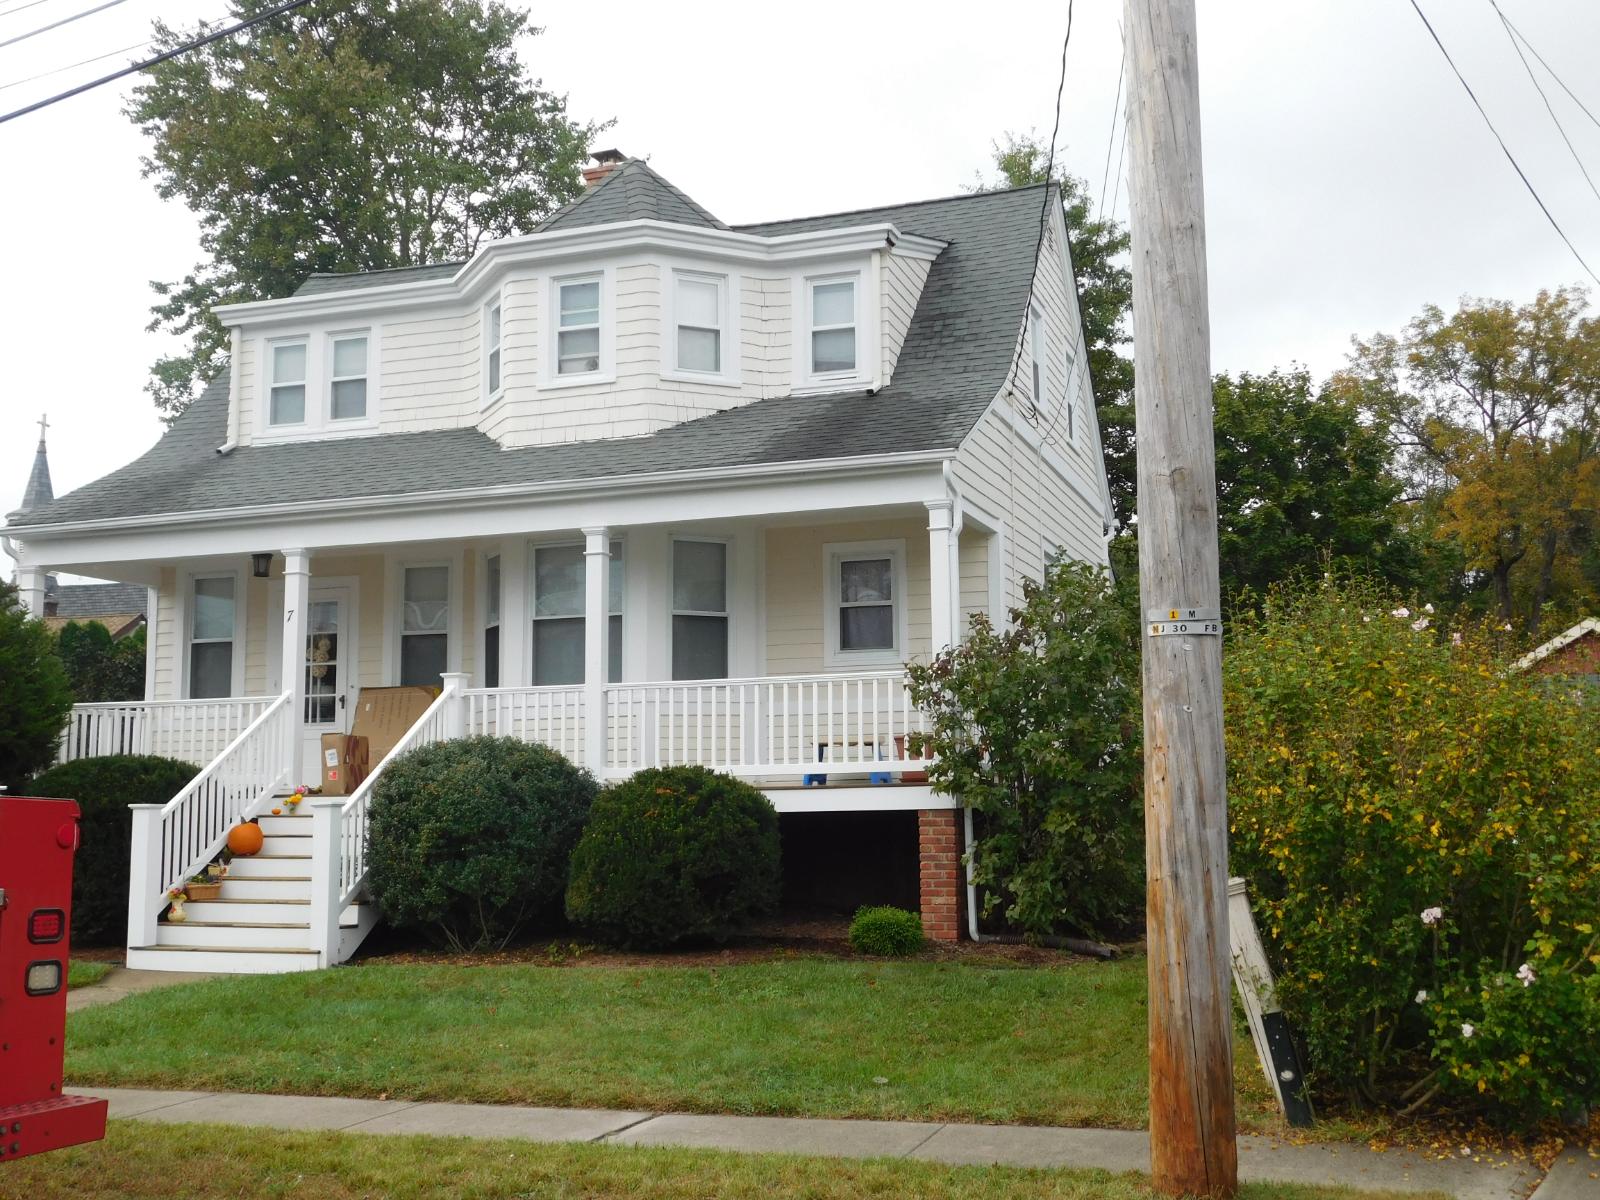
26. Fair Haven – 133.1% Home Price Increase Since 2012
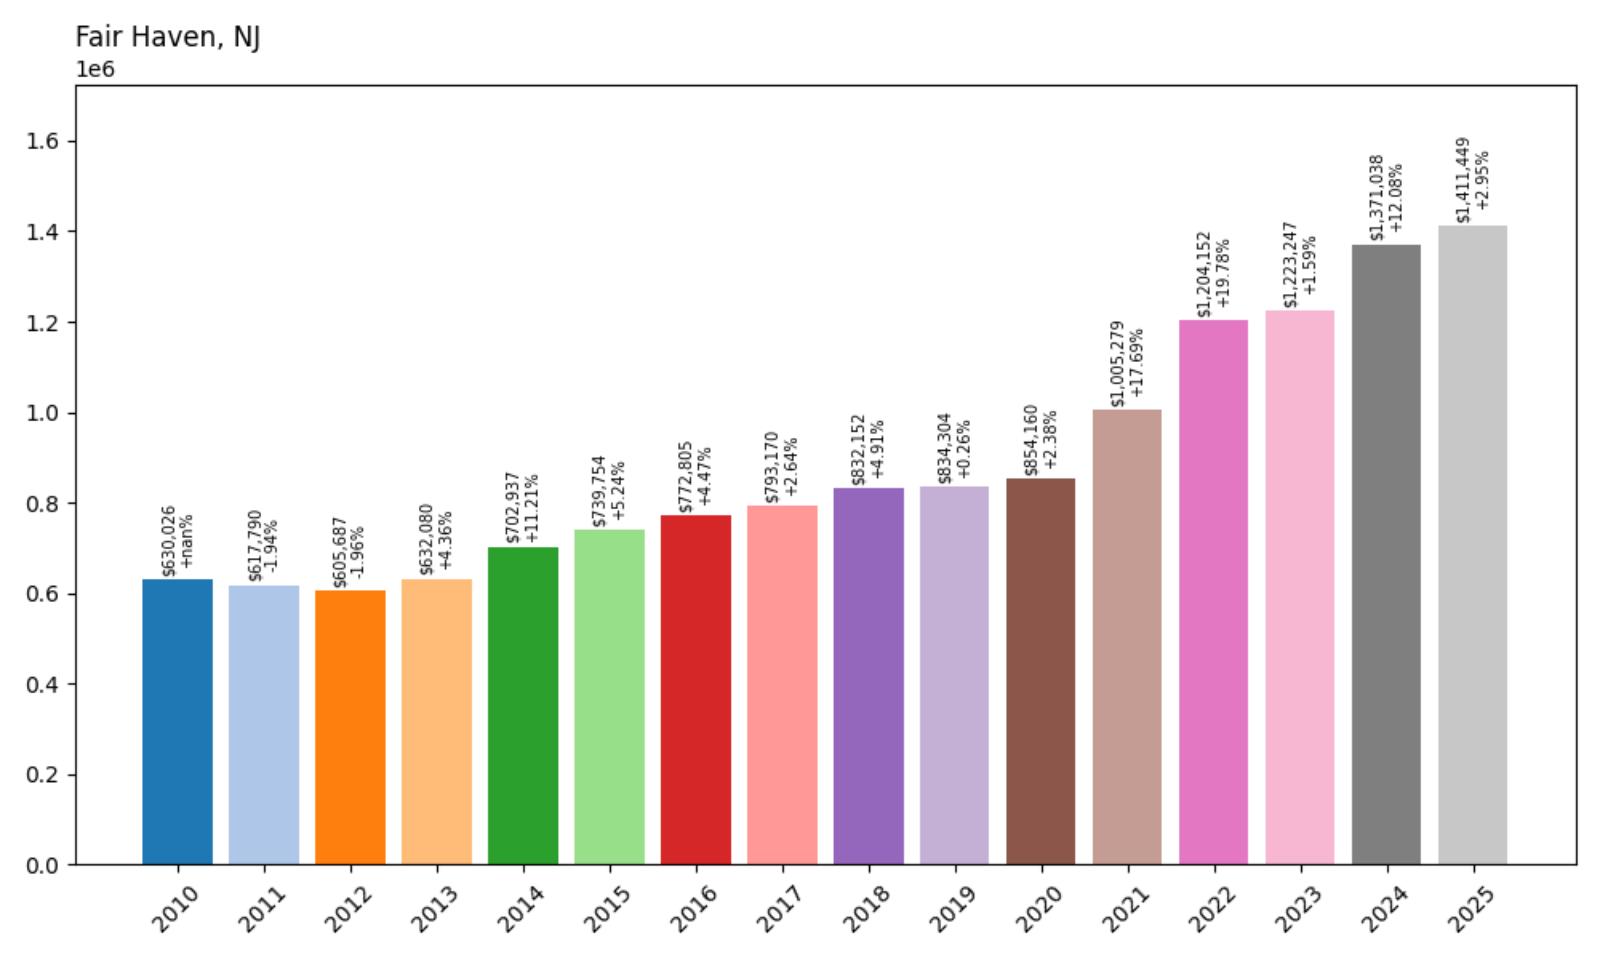
- 2010: $630,026
- 2011: $617,790 (−$12,235, −1.94% from previous year)
- 2012: $605,687 (−$12,103, −1.96% from previous year)
- 2013: $632,080 (+$26,393, +4.36% from previous year)
- 2014: $702,937 (+$70,856, +11.21% from previous year)
- 2015: $739,754 (+$36,818, +5.24% from previous year)
- 2016: $772,805 (+$33,051, +4.47% from previous year)
- 2017: $793,170 (+$20,365, +2.64% from previous year)
- 2018: $832,152 (+$38,981, +4.91% from previous year)
- 2019: $834,304 (+$2,152, +0.26% from previous year)
- 2020: $854,160 (+$19,857, +2.38% from previous year)
- 2021: $1,005,279 (+$151,119, +17.69% from previous year)
- 2022: $1,204,152 (+$198,872, +19.78% from previous year)
- 2023: $1,223,247 (+$19,096, +1.59% from previous year)
- 2024: $1,371,038 (+$147,791, +12.08% from previous year)
- 2025: $1,411,449 (+$40,411, +2.95% from previous year)
Fair Haven home values have increased 133.1% since 2012, jumping from $605,687 to $1,411,449 by 2025. Prices rose steadily through the 2010s, but appreciation accelerated significantly after 2020. The town’s housing market posted some of its strongest gains in 2021 and 2022, followed by more moderate growth in the most recent years. The town’s combination of lifestyle amenities and family-oriented appeal has helped maintain its position as one of Monmouth County’s most competitive real estate markets.
Fair Haven – Riverfront Living with a Small-Town Feel
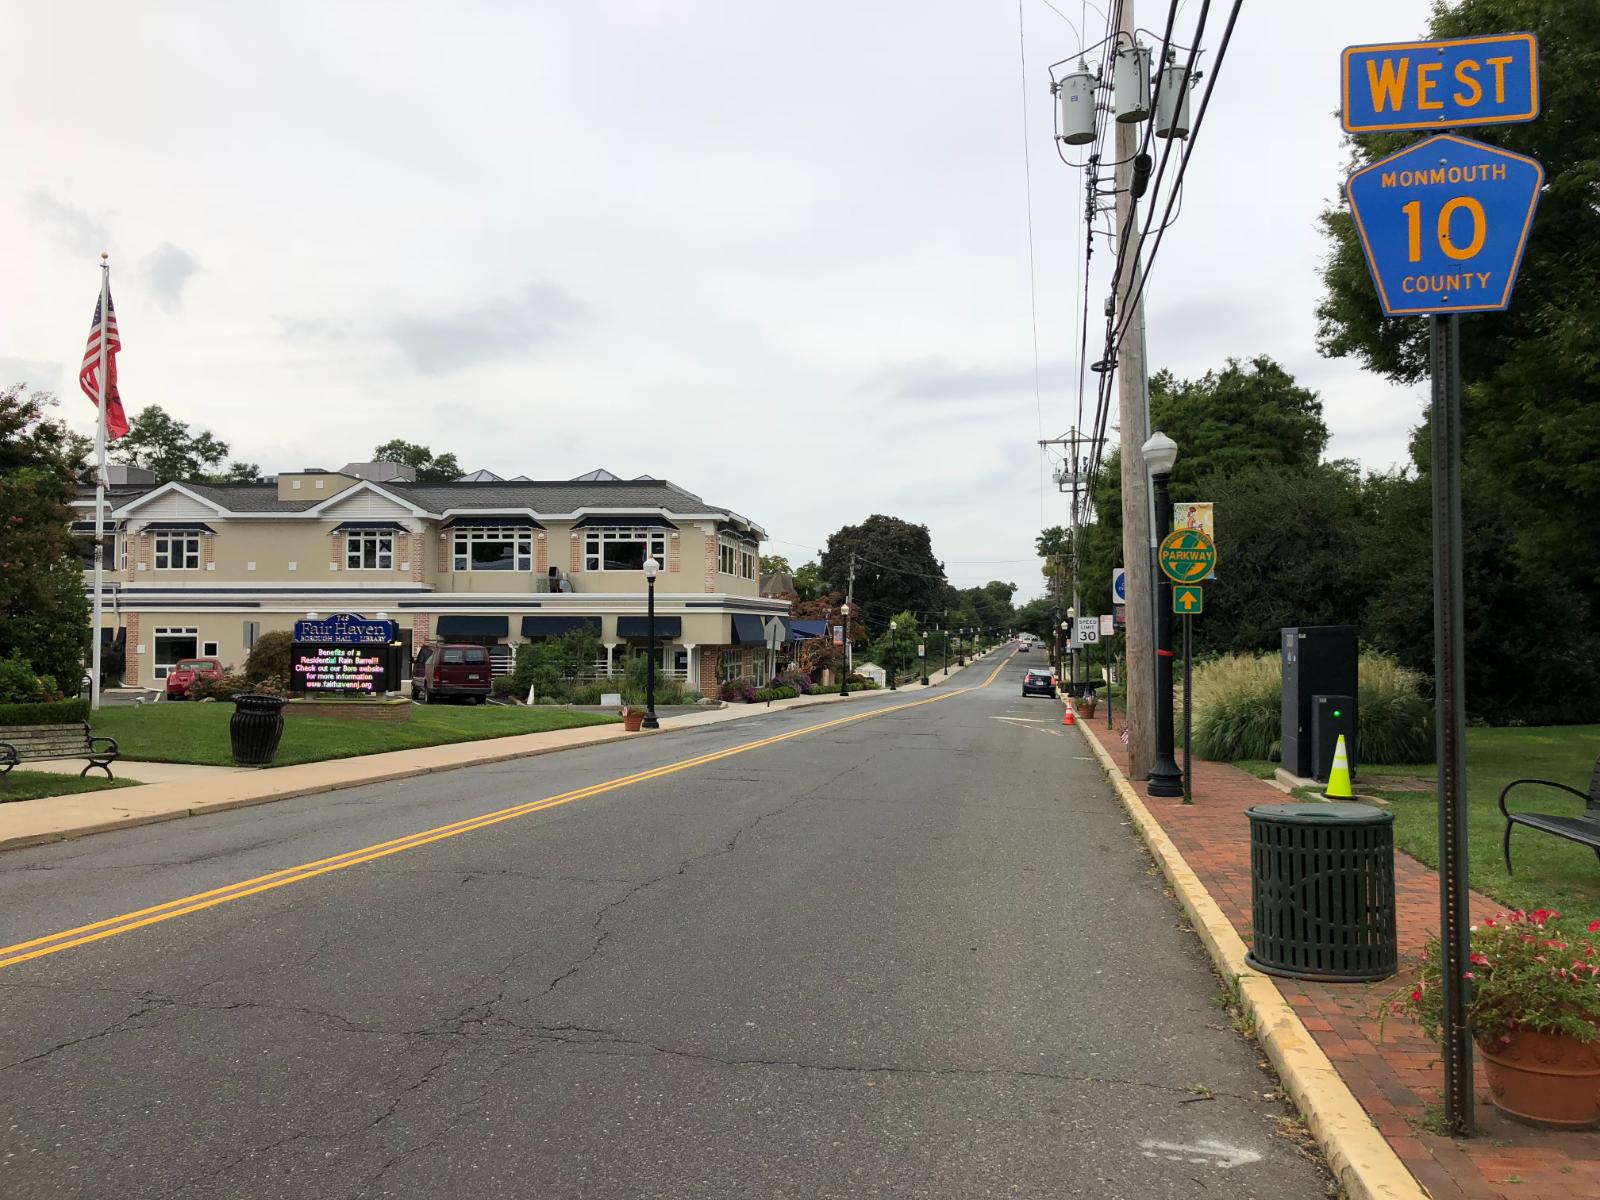
Fair Haven sits along the Navesink River in Monmouth County and has long been regarded as one of the best places in New Jersey to raise a family. With top-tier public schools, an involved community, and a walkable downtown full of shops, restaurants, and parks, it offers a highly sought-after quality of life. Buyers here often choose Fair Haven over flashier shore towns because it offers real neighborhood continuity—kids walk to school, neighbors know each other, and town events foster a strong sense of community. It also enjoys close proximity to Red Bank and multiple ferry and train options for commuters headed to Manhattan.
The housing stock consists primarily of well-kept single-family homes, many of which have been expanded or rebuilt to meet modern tastes. New construction is limited, keeping inventory tight and competition high during the spring buying season. The town has seen increased interest from NYC transplants since 2020, many of whom were drawn by the chance to get more space without sacrificing access to urban culture. Fair Haven’s price trends reflect both this surge in demand and the enduring value of its schools, location, and local charm. In a state full of competitive towns, Fair Haven continues to stand out for all the right reasons.
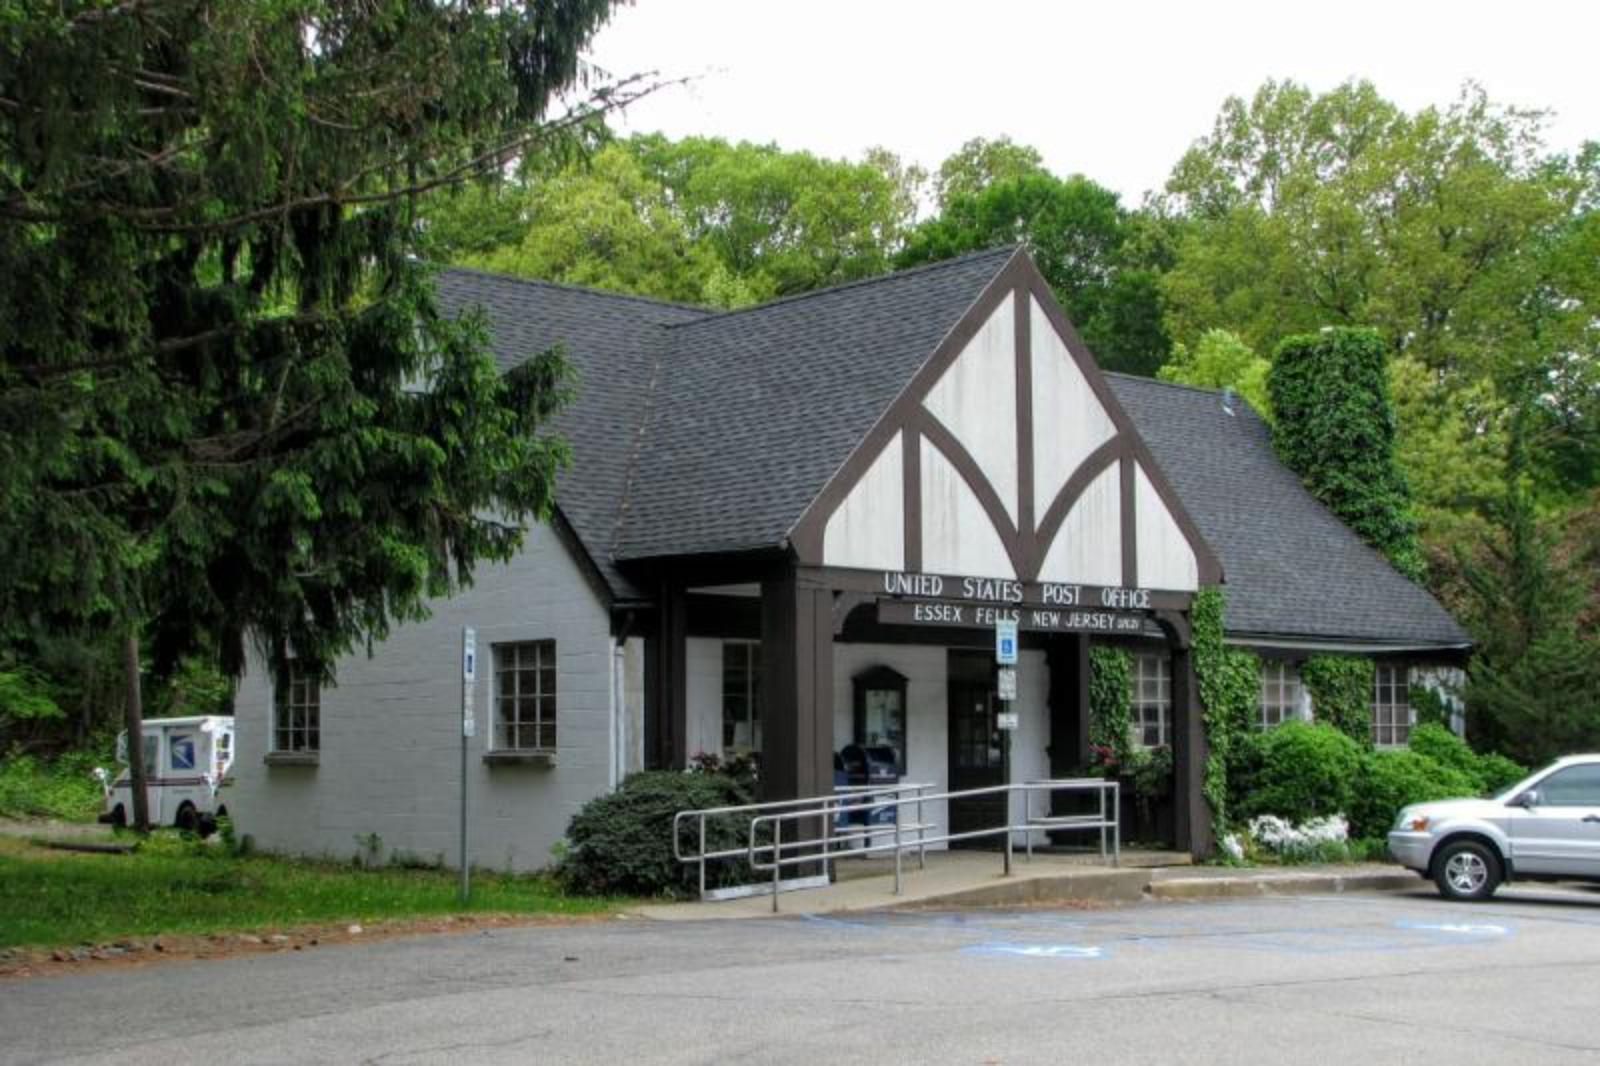
25. Essex Fells – 88.4% Home Price Increase Since 2012
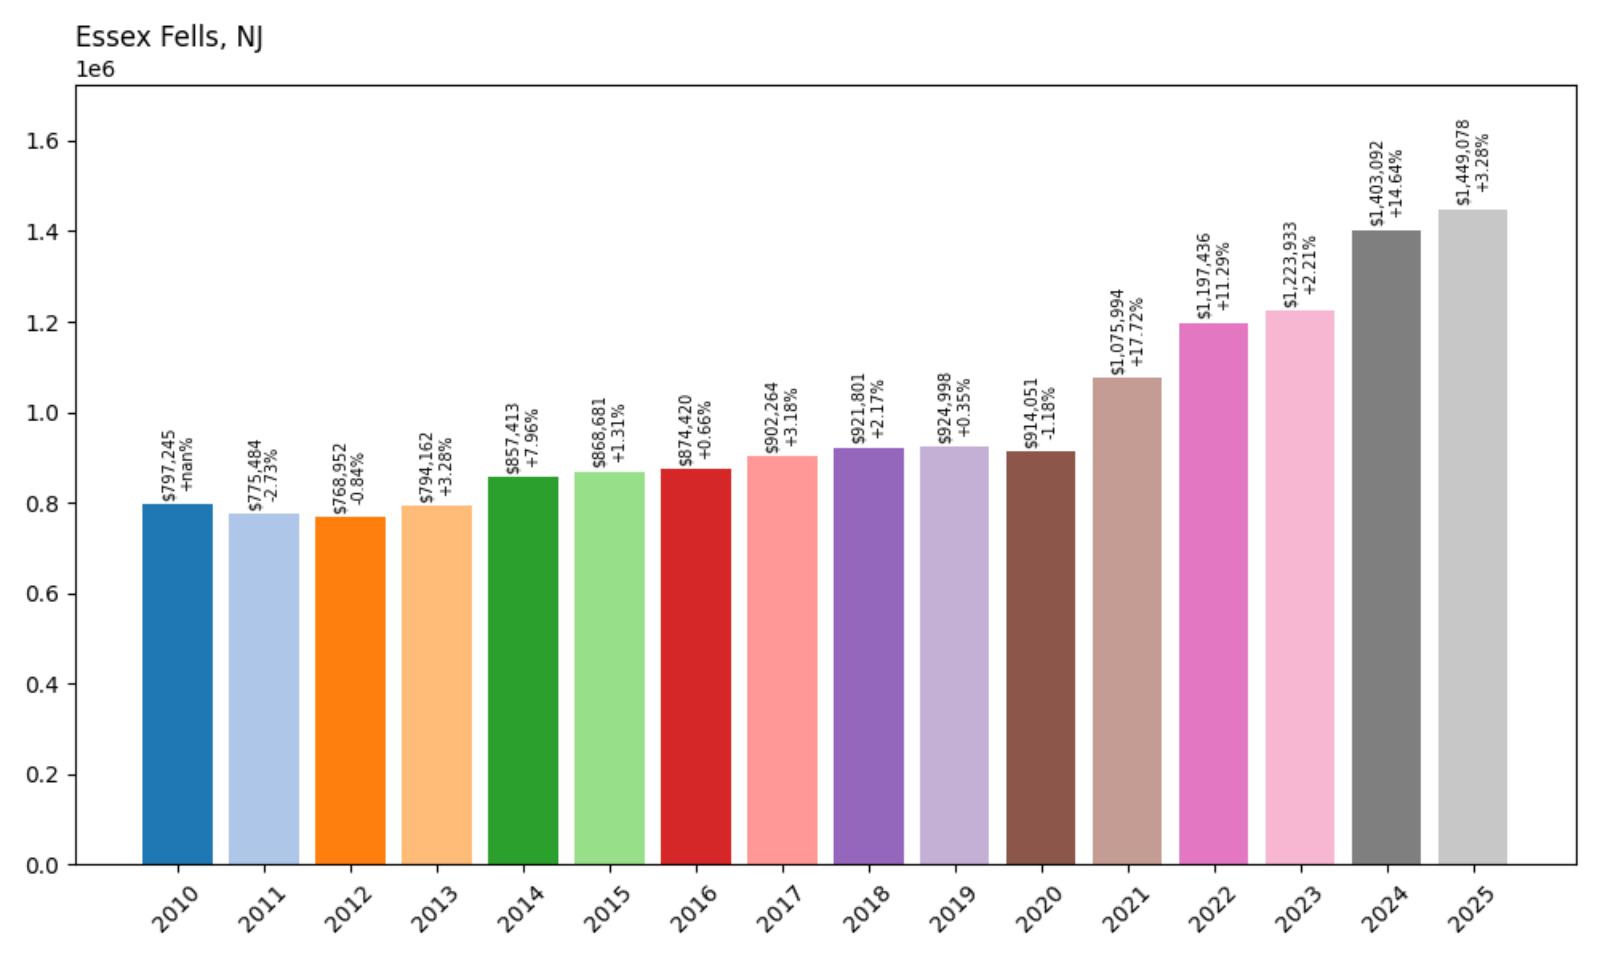
- 2010: $797,245
- 2011: $775,484 (−$21,761, −2.73% from previous year)
- 2012: $768,952 (−$6,531, −0.84% from previous year)
- 2013: $794,162 (+$25,210, +3.28% from previous year)
- 2014: $857,413 (+$63,251, +7.96% from previous year)
- 2015: $868,681 (+$11,268, +1.31% from previous year)
- 2016: $874,420 (+$5,739, +0.66% from previous year)
- 2017: $902,264 (+$27,844, +3.18% from previous year)
- 2018: $921,801 (+$19,536, +2.17% from previous year)
- 2019: $924,998 (+$3,197, +0.35% from previous year)
- 2020: $914,051 (−$10,946, −1.18% from previous year)
- 2021: $1,075,994 (+$161,943, +17.72% from previous year)
- 2022: $1,197,436 (+$121,442, +11.29% from previous year)
- 2023: $1,223,933 (+$26,496, +2.21% from previous year)
- 2024: $1,403,092 (+$179,159, +14.64% from previous year)
- 2025: $1,449,078 (+$45,986, +3.28% from previous year)
Home prices in Essex Fells have increased by nearly 88.4% since 2012, rising from $768,952 to $1,449,078 in 2025. While growth was modest through most of the 2010s, the post-2020 period brought accelerated appreciation, including double-digit gains in 2021, 2022, and 2024. This surge reflects a renewed demand for high-end homes in low-density, historically affluent communities like Essex Fells.
Essex Fells – Private, Prestigious, and Historic
Essex Fells is one of the most exclusive communities in Essex County, known for its historic mansions, winding roads, and complete lack of commercial development. The borough has no downtown or retail corridor—just large, elegant homes tucked among wooded lots and private roads. It’s a deliberate design choice that preserves a unique sense of privacy and seclusion, making it especially attractive to high-income buyers looking for tranquility and long-term value. The public school system is highly rated, and most residents enjoy quick access to major highways and NJ Transit options to Manhattan.
The housing stock in Essex Fells tends to be larger and older, with many properties dating back to the early 20th century. These homes are frequently renovated but rarely torn down, preserving architectural continuity that adds to the area’s character. Demand here isn’t driven by trends—it’s built on legacy wealth, limited inventory, and a reputation for exclusivity. While prices jumped sharply during the pandemic migration wave, the community has retained its appeal as buyers prioritize space, schools, and a refined suburban setting. In Essex Fells, the value is just as much in the lifestyle as it is in the real estate.
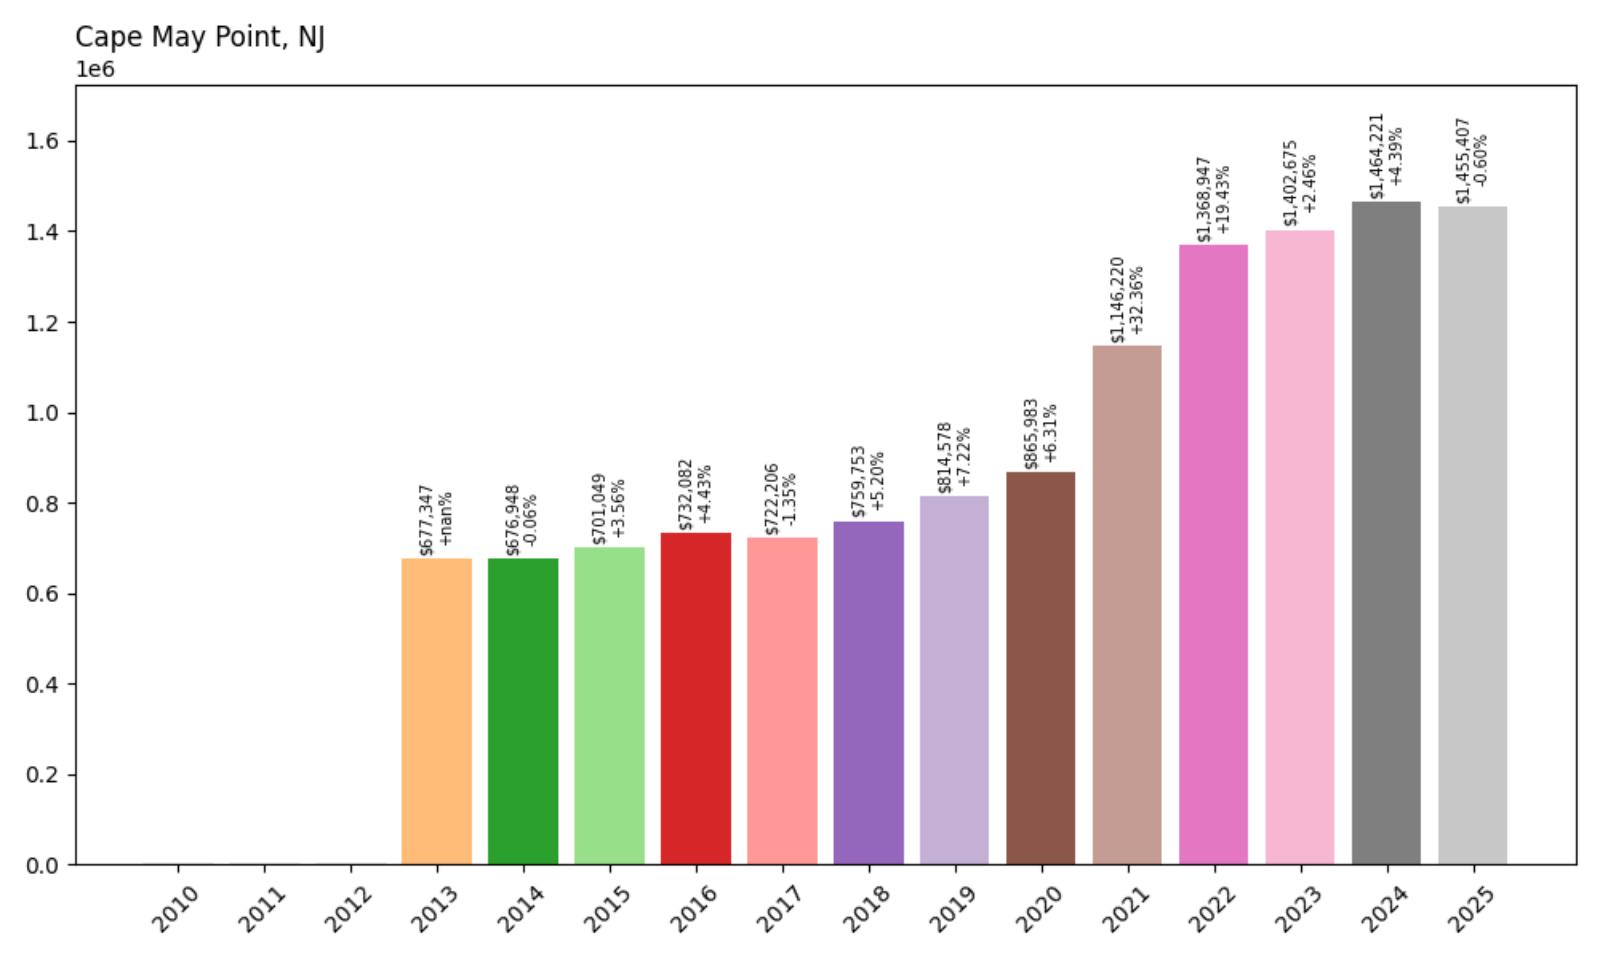
24. Cape May Point – 106.1% Home Price Increase Since 2013
🔥 Would you like to save this?
- 2010: N/A
- 2011: N/A
- 2012: N/A
- 2013: $677,347
- 2014: $676,948 (−$400, −0.06% from previous year)
- 2015: $701,049 (+$24,102, +3.56% from previous year)
- 2016: $732,082 (+$31,033, +4.43% from previous year)
- 2017: $722,206 (−$9,876, −1.35% from previous year)
- 2018: $759,753 (+$37,547, +5.20% from previous year)
- 2019: $814,578 (+$54,825, +7.22% from previous year)
- 2020: $865,983 (+$51,406, +6.31% from previous year)
- 2021: $1,146,220 (+$280,237, +32.36% from previous year)
- 2022: $1,368,947 (+$222,727, +19.43% from previous year)
- 2023: $1,402,675 (+$33,728, +2.46% from previous year)
- 2024: $1,464,221 (+$61,546, +4.39% from previous year)
- 2025: $1,455,407 (−$8,813, −0.60% from previous year)
Cape May Point saw home values jump by over 106% since 2013, going from $677,347 to $1,455,407 by 2025. The most dramatic appreciation came during the 2021–2022 housing boom, which added more than $500,000 in just two years. While the pace has cooled since, prices remain well above their pre-pandemic levels and continue to reflect strong buyer interest in secluded, beach-access towns.
Cape May Point – Hidden Shores and High Prices
Situated at the southernmost tip of New Jersey, Cape May Point is a quiet, almost secretive beach community with no commercial sprawl and a tiny year-round population. Its appeal lies in that very seclusion—no boardwalks, no high-rises, just charming cottages, nature preserves, and uninterrupted shoreline. The borough is a favorite among artists, academics, and professionals seeking calm coastal escapes. Bird watchers flock here during migration seasons, adding to its distinct local character. With building restricted and land scarce, the housing stock is finite—and that scarcity has been the key driver of long-term price growth.
Homebuyers in Cape May Point aren’t just buying a house—they’re buying a place in a truly unique ecosystem. The proximity to Cape May proper provides access to restaurants and shops, while Cape May Point retains its tranquil atmosphere. The surge in values during 2021 and 2022 was driven by remote workers and second-home buyers who prized this solitude during uncertain times. Even though 2025 brought a slight decline, values remain high, and the area’s strict development rules will likely continue to keep demand ahead of supply. In a world that’s always rushing, Cape May Point offers something money can’t easily buy: stillness.
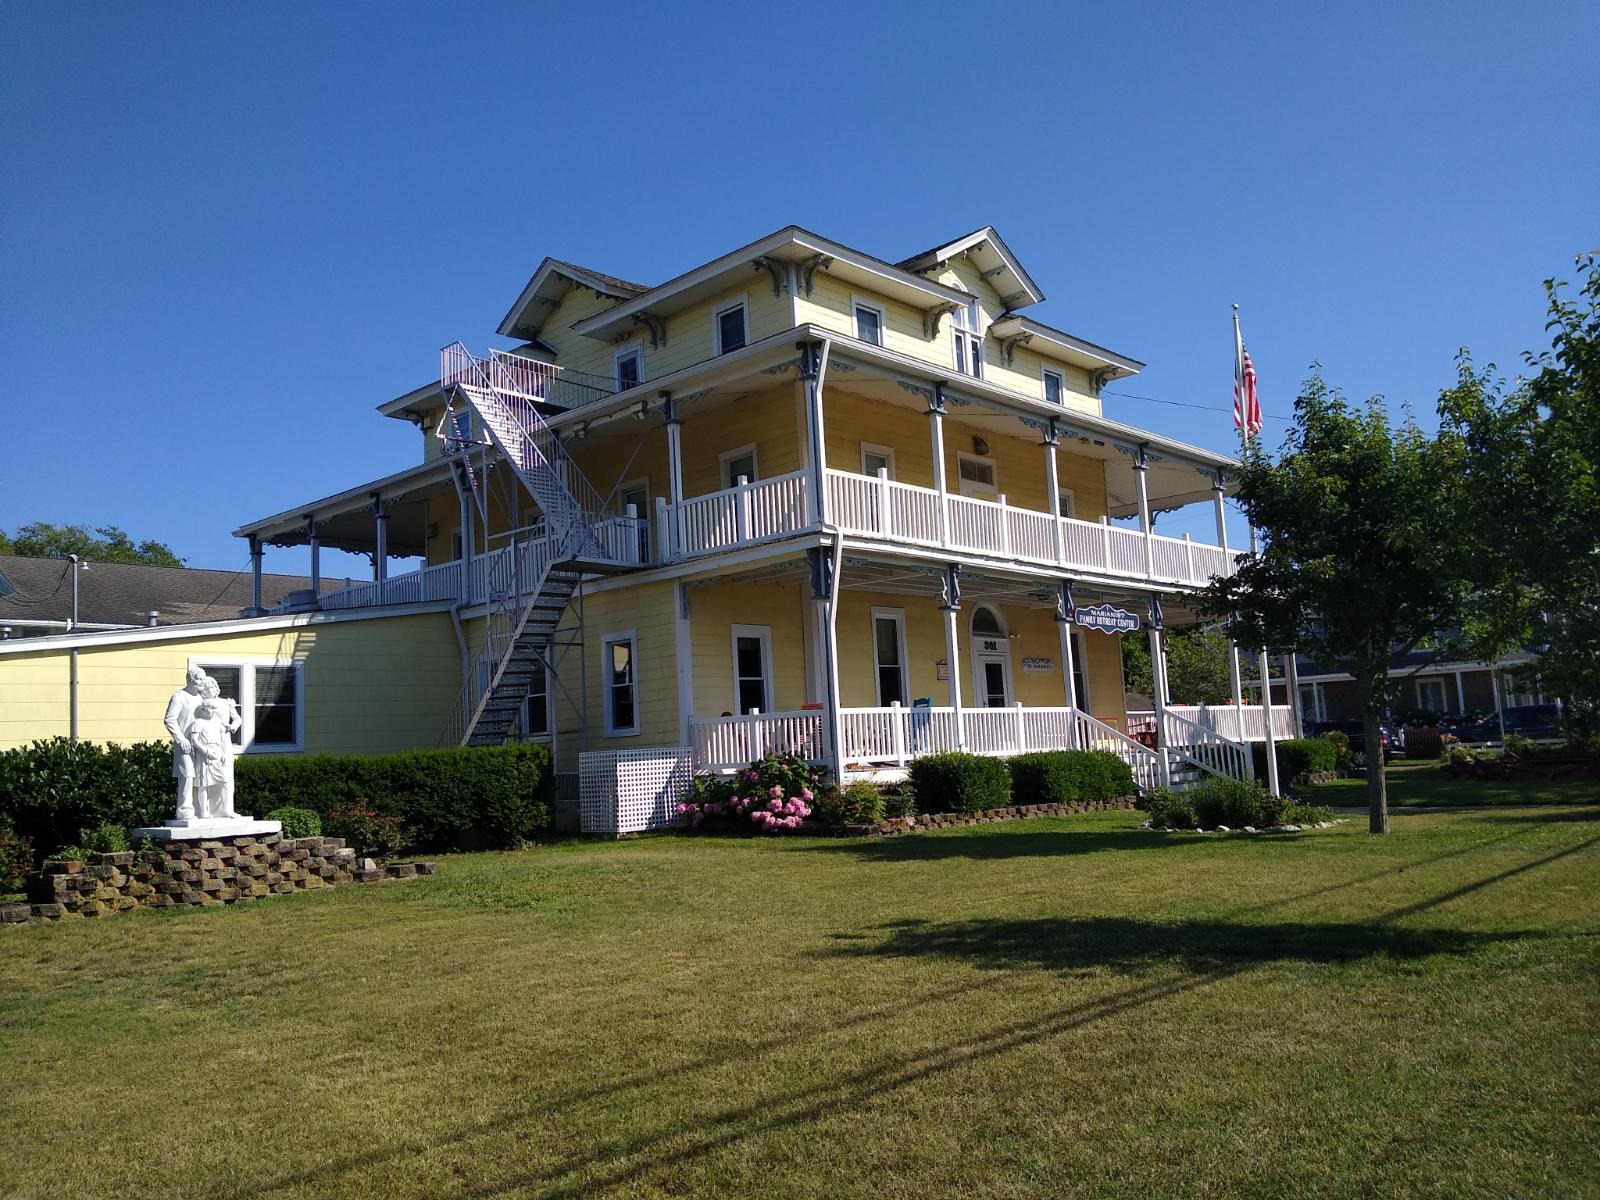
23. Longport – 100.5% Home Price Increase Since 2012
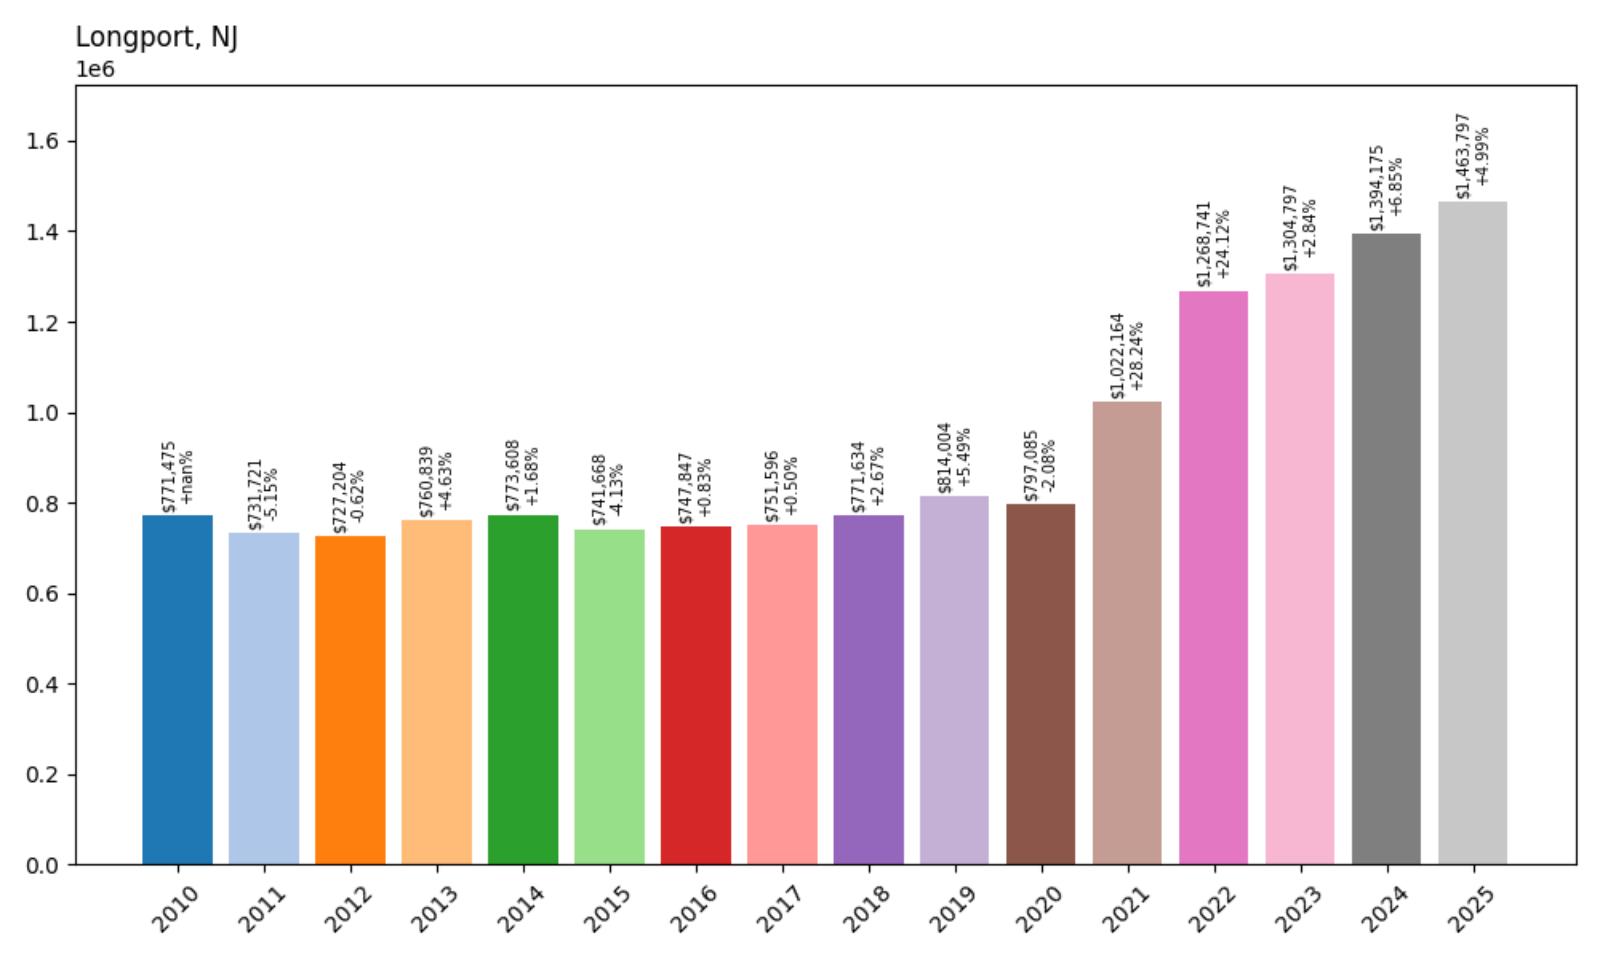
- 2010: $771,475
- 2011: $731,721 (−$39,754, −5.15% from previous year)
- 2012: $727,204 (−$4,517, −0.62% from previous year)
- 2013: $760,839 (+$33,635, +4.63% from previous year)
- 2014: $773,608 (+$12,769, +1.68% from previous year)
- 2015: $741,668 (−$31,940, −4.13% from previous year)
- 2016: $747,847 (+$6,179, +0.83% from previous year)
- 2017: $751,596 (+$3,749, +0.50% from previous year)
- 2018: $771,634 (+$20,039, +2.67% from previous year)
- 2019: $814,004 (+$42,369, +5.49% from previous year)
- 2020: $797,085 (−$16,918, −2.08% from previous year)
- 2021: $1,022,164 (+$225,079, +28.24% from previous year)
- 2022: $1,268,741 (+$246,577, +24.12% from previous year)
- 2023: $1,304,797 (+$36,056, +2.84% from previous year)
- 2024: $1,394,175 (+$89,378, +6.85% from previous year)
- 2025: $1,463,797 (+$69,622, +4.99% from previous year)
Longport home prices have doubled since 2012, jumping from $727,204 to $1,463,797—a 100.5% increase. The market remained steady through the 2010s before experiencing an explosive jump starting in 2021. Though the annual gains have moderated slightly, values have continued climbing into 2025, solidifying Longport’s spot as a prime South Jersey beachfront community.
Longport – Exclusive, Quiet, and Beach-Forward
Located at the southern tip of Absecon Island, Longport is known for its serene residential atmosphere and limited commercial activity. Unlike its neighboring resort towns like Atlantic City and Margate, Longport favors large single-family homes, quiet beaches, and a year-round sense of calm. This makes it especially popular among older buyers, second-home seekers, and families who want privacy without sacrificing access to the shore. With minimal rental traffic and few short-term visitors, it retains a unique residential character that continues to attract loyal buyers.
Inventory in Longport is perpetually tight, with few teardown opportunities and even fewer new developments. That has kept supply low and competition high, especially after the post-2020 shift toward remote work and lifestyle upgrades. The 2021–2022 boom transformed the local market, and prices have remained strong ever since. With limited land and enduring demand from repeat buyers, Longport is expected to remain one of the most stable and desirable communities on the Jersey Shore. For many, it offers the best of coastal living without the crowds.
22. Interlaken – 162.1% Home Price Increase Since 2012
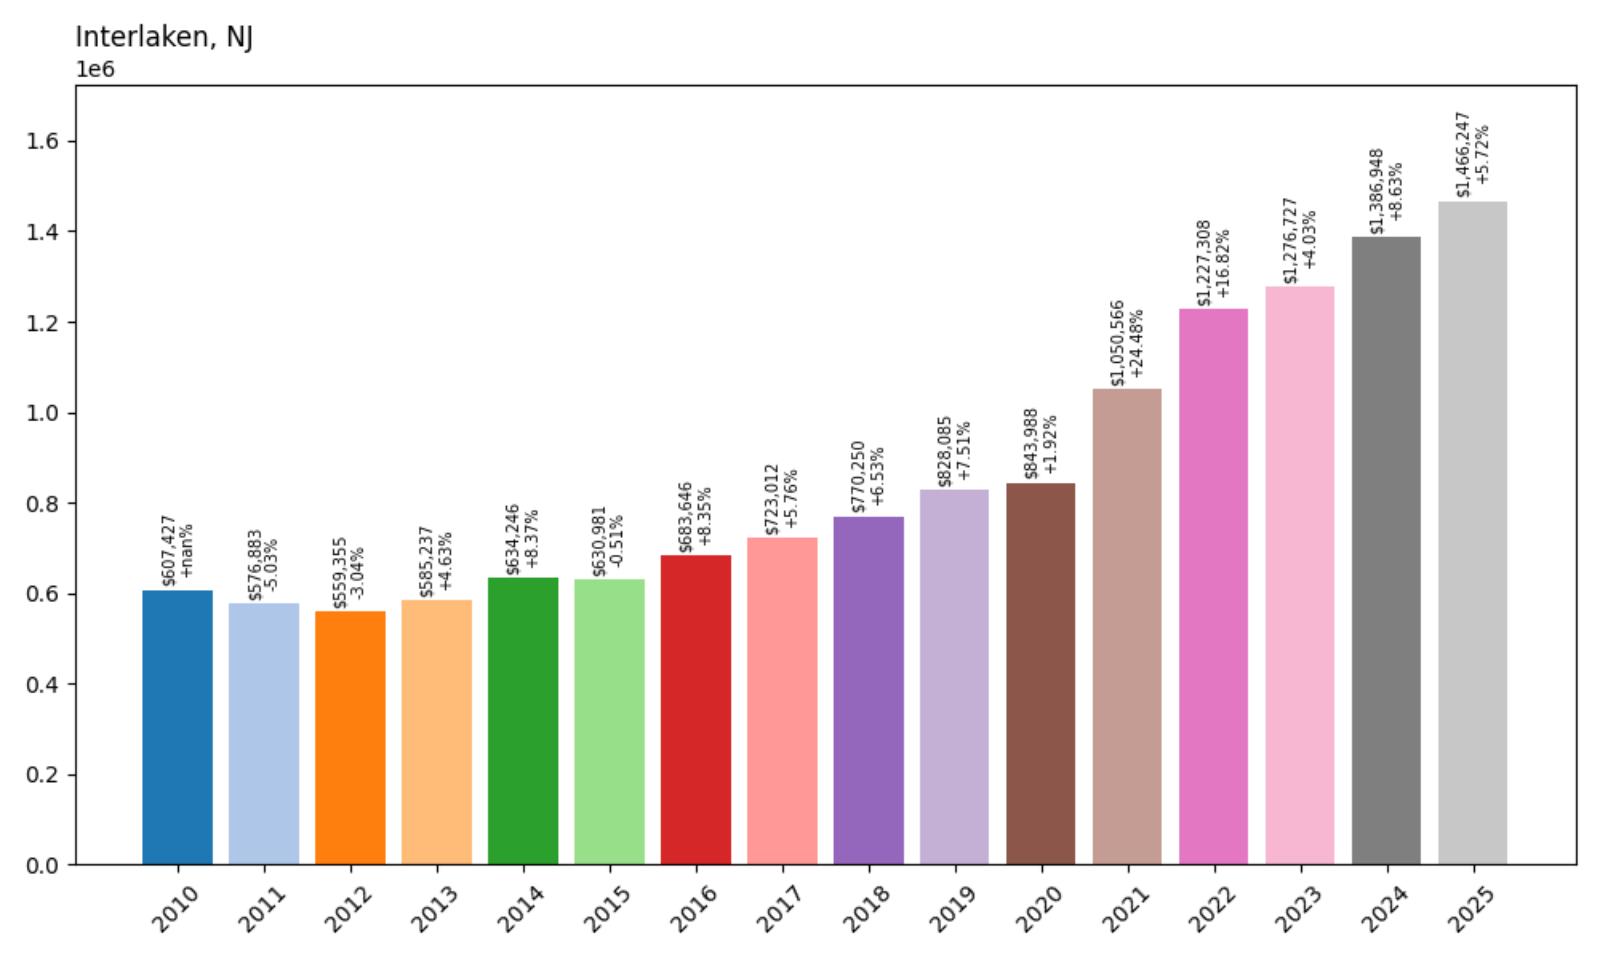
- 2010: $607,427
- 2011: $576,883 (−$30,545, −5.03% from previous year)
- 2012: $559,355 (−$17,528, −3.04% from previous year)
- 2013: $585,237 (+$25,882, +4.63% from previous year)
- 2014: $634,246 (+$49,009, +8.37% from previous year)
- 2015: $630,981 (−$3,266, −0.51% from previous year)
- 2016: $683,646 (+$52,665, +8.35% from previous year)
- 2017: $723,012 (+$39,366, +5.76% from previous year)
- 2018: $770,250 (+$47,237, +6.53% from previous year)
- 2019: $828,085 (+$57,836, +7.51% from previous year)
- 2020: $843,988 (+$15,902, +1.92% from previous year)
- 2021: $1,050,566 (+$206,578, +24.48% from previous year)
- 2022: $1,227,308 (+$176,742, +16.82% from previous year)
- 2023: $1,276,727 (+$49,419, +4.03% from previous year)
- 2024: $1,386,948 (+$110,221, +8.63% from previous year)
- 2025: $1,466,247 (+$79,299, +5.72% from previous year)
Interlaken’s home values have skyrocketed 162.1% since 2012, growing from $559,355 to $1,466,247 in just over a decade. The town posted double-digit gains in both 2021 and 2022, and continued to rise consistently into 2025. Unlike more volatile beach markets, Interlaken has seen stable appreciation rooted in its unique inland-coastal appeal and extremely limited housing inventory.
Interlaken – Quiet and Quaint, Just Off the Shore
Despite being just a stone’s throw from the Atlantic Ocean, Interlaken maintains a quiet, residential character that sets it apart from the buzz of neighboring towns like Asbury Park. The borough is less than half a square mile in size and is entirely residential—there are no commercial buildings, no restaurants, and no hotels. This zoning ensures that the peaceful, village-like atmosphere remains intact, and it’s one of the biggest reasons why buyers are drawn here. With Deal Lake wrapping around much of the town, waterfront and waterview properties are common, further boosting real estate values.
Many homes in Interlaken date back to the early 1900s and have been carefully preserved or upgraded, creating a charming mix of historic architecture and modern comforts. The town’s location provides easy access to the beach without the congestion and noise, offering the best of both coastal and suburban living. The small population and low turnover mean listings are rare—and when homes do hit the market, they often attract multiple offers. That competition, combined with the borough’s unique appeal, has helped push home prices into the upper tier of Monmouth County’s housing market.
21. Surf City – 115.1% Home Price Increase Since 2012
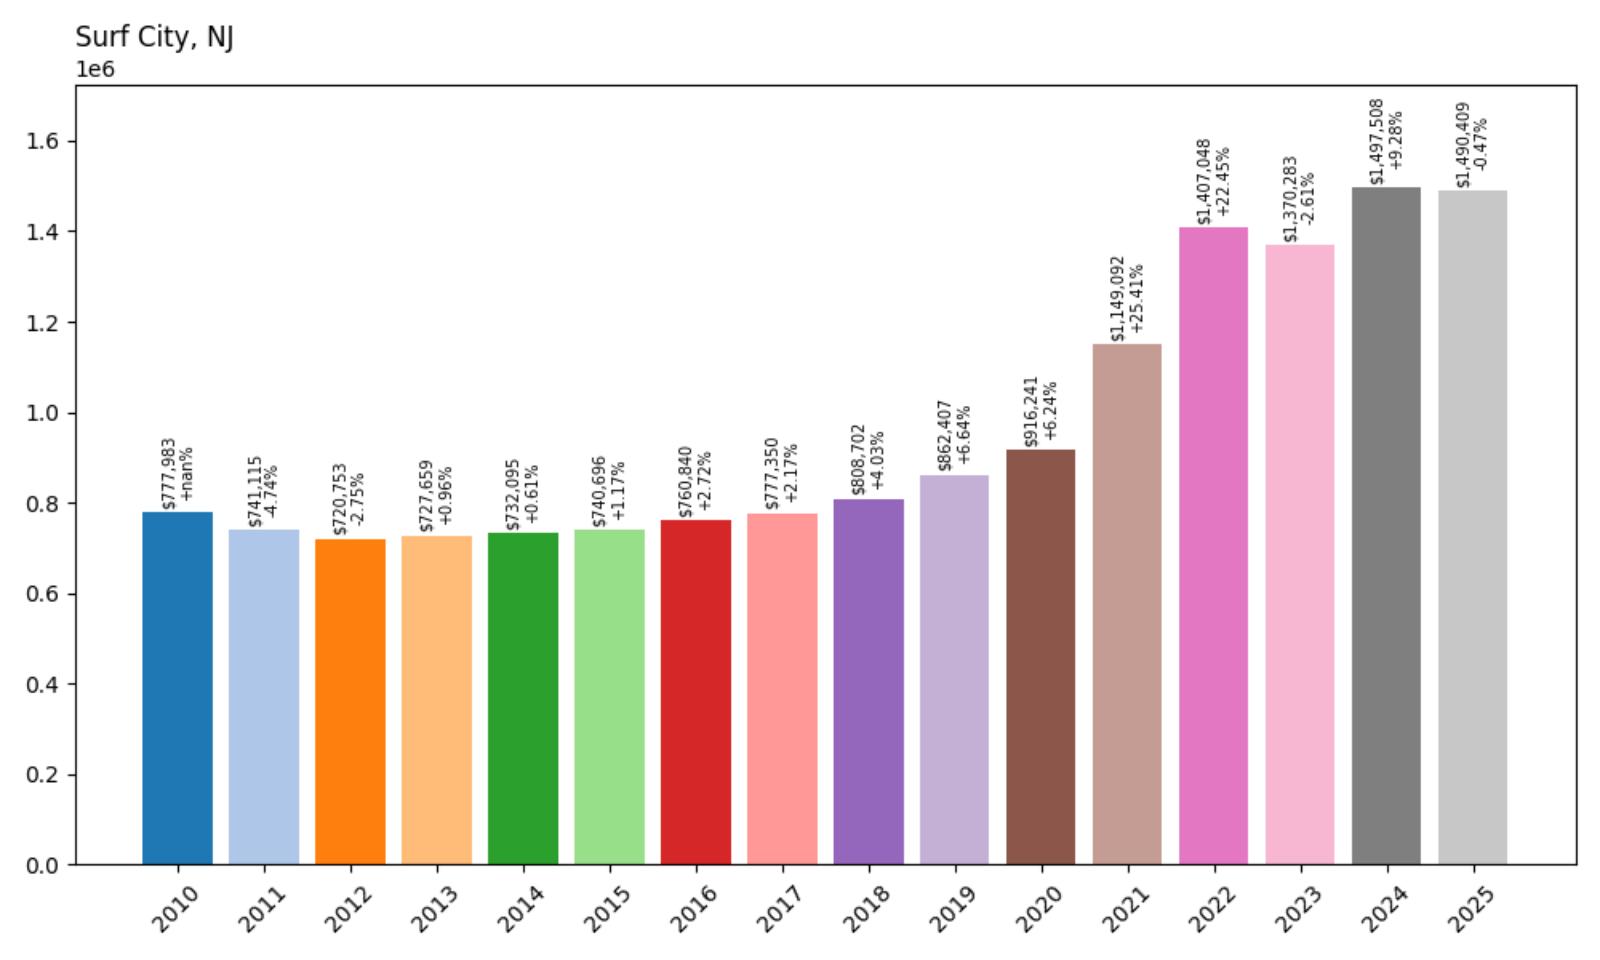
- 2010: $777,983
- 2011: $741,115 (−$36,867, −4.74% from previous year)
- 2012: $720,753 (−$20,362, −2.75% from previous year)
- 2013: $727,659 (+$6,906, +0.96% from previous year)
- 2014: $732,095 (+$4,436, +0.61% from previous year)
- 2015: $740,696 (+$8,601, +1.17% from previous year)
- 2016: $760,840 (+$20,144, +2.72% from previous year)
- 2017: $777,350 (+$16,510, +2.17% from previous year)
- 2018: $808,702 (+$31,352, +4.03% from previous year)
- 2019: $862,407 (+$53,704, +6.64% from previous year)
- 2020: $916,241 (+$53,834, +6.24% from previous year)
- 2021: $1,149,092 (+$232,852, +25.41% from previous year)
- 2022: $1,407,048 (+$257,956, +22.45% from previous year)
- 2023: $1,370,283 (−$36,765, −2.61% from previous year)
- 2024: $1,497,508 (+$127,226, +9.28% from previous year)
- 2025: $1,490,409 (−$7,099, −0.47% from previous year)
Surf City’s property values have jumped 115.1% since 2012, with average home prices moving from $720,753 to $1,490,409. The biggest surges came during 2021 and 2022, when post-pandemic demand sent values soaring. While the last two years brought some price fluctuation, Surf City remains one of the most desirable—and expensive—communities on Long Beach Island.
Surf City – A Shore Classic with Enduring Demand
Situated at the heart of Long Beach Island, Surf City combines classic beach-town charm with solid year-round livability. It’s one of the more developed parts of the island, offering a small business district, restaurants, bakeries, and art galleries, all within walking distance of the beach. That mix of convenience and coastal appeal makes it popular with both full-time residents and second-home buyers. The town also offers bay access, attracting boaters and paddleboarders in addition to beachgoers. Housing here includes everything from traditional shore bungalows to modern custom homes, giving buyers a range of options—but all at a premium.
Inventory in Surf City remains tight, with most buyers purchasing existing homes or undertaking major renovations. Zoning laws and the island’s physical constraints limit new development, so price increases have largely been driven by competition for limited space. During the 2021–2022 boom, homes here saw six-figure annual appreciation in some cases. While 2023 brought a minor correction, 2024 rebounded sharply, and 2025 saw only a slight dip. The town’s balance of walkability, amenities, and strong rental potential means Surf City will likely remain in high demand, regardless of short-term market cycles.
20. Barnegat Light – 115.9% Home Price Increase Since 2012
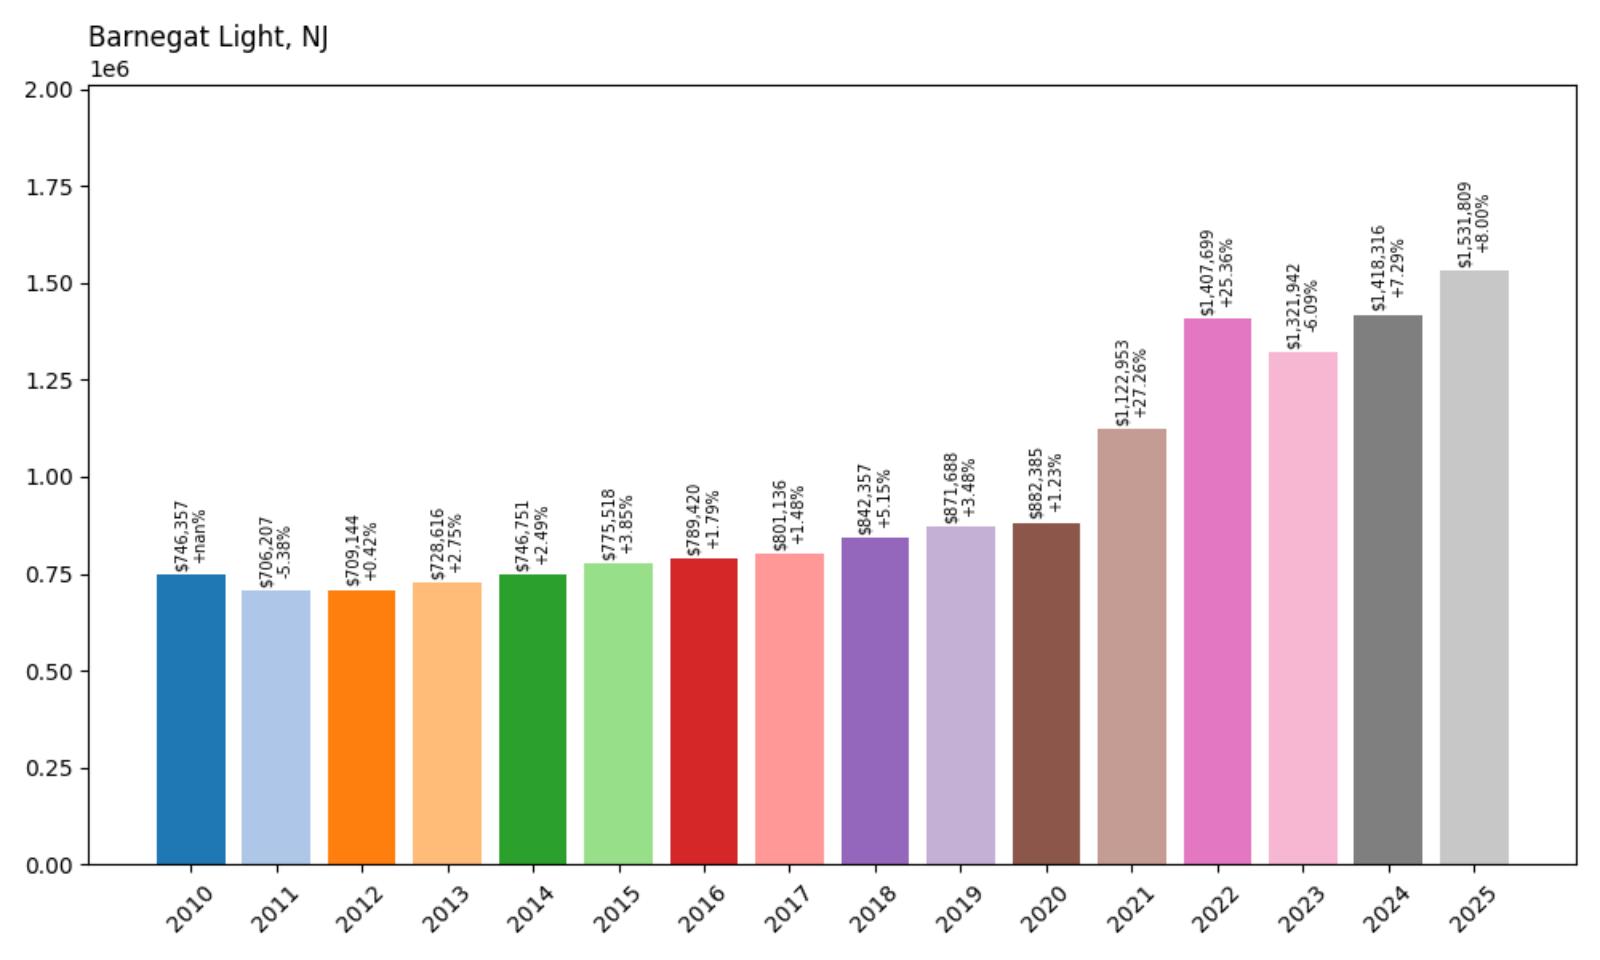
- 2010: $746,357
- 2011: $706,207 (−$40,150, −5.38% from previous year)
- 2012: $709,144 (+$2,937, +0.42% from previous year)
- 2013: $728,616 (+$19,472, +2.75% from previous year)
- 2014: $746,751 (+$18,134, +2.49% from previous year)
- 2015: $775,518 (+$28,767, +3.85% from previous year)
- 2016: $789,420 (+$13,902, +1.79% from previous year)
- 2017: $801,136 (+$11,716, +1.48% from previous year)
- 2018: $842,357 (+$41,221, +5.15% from previous year)
- 2019: $871,688 (+$29,331, +3.48% from previous year)
- 2020: $882,385 (+$10,697, +1.23% from previous year)
- 2021: $1,122,953 (+$240,568, +27.26% from previous year)
- 2022: $1,407,699 (+$284,746, +25.36% from previous year)
- 2023: $1,321,942 (−$85,757, −6.09% from previous year)
- 2024: $1,418,316 (+$96,374, +7.29% from previous year)
- 2025: $1,531,809 (+$113,493, +8.00% from previous year)
Since 2012, Barnegat Light’s home prices have increased by 115.9%, reaching $1,531,809 in 2025. The largest growth occurred during the 2021–2022 surge, but even after a market correction in 2023, prices rebounded strongly in the following two years. Today, this lighthouse town is among the most expensive on Long Beach Island, reflecting its enduring appeal and limited supply.
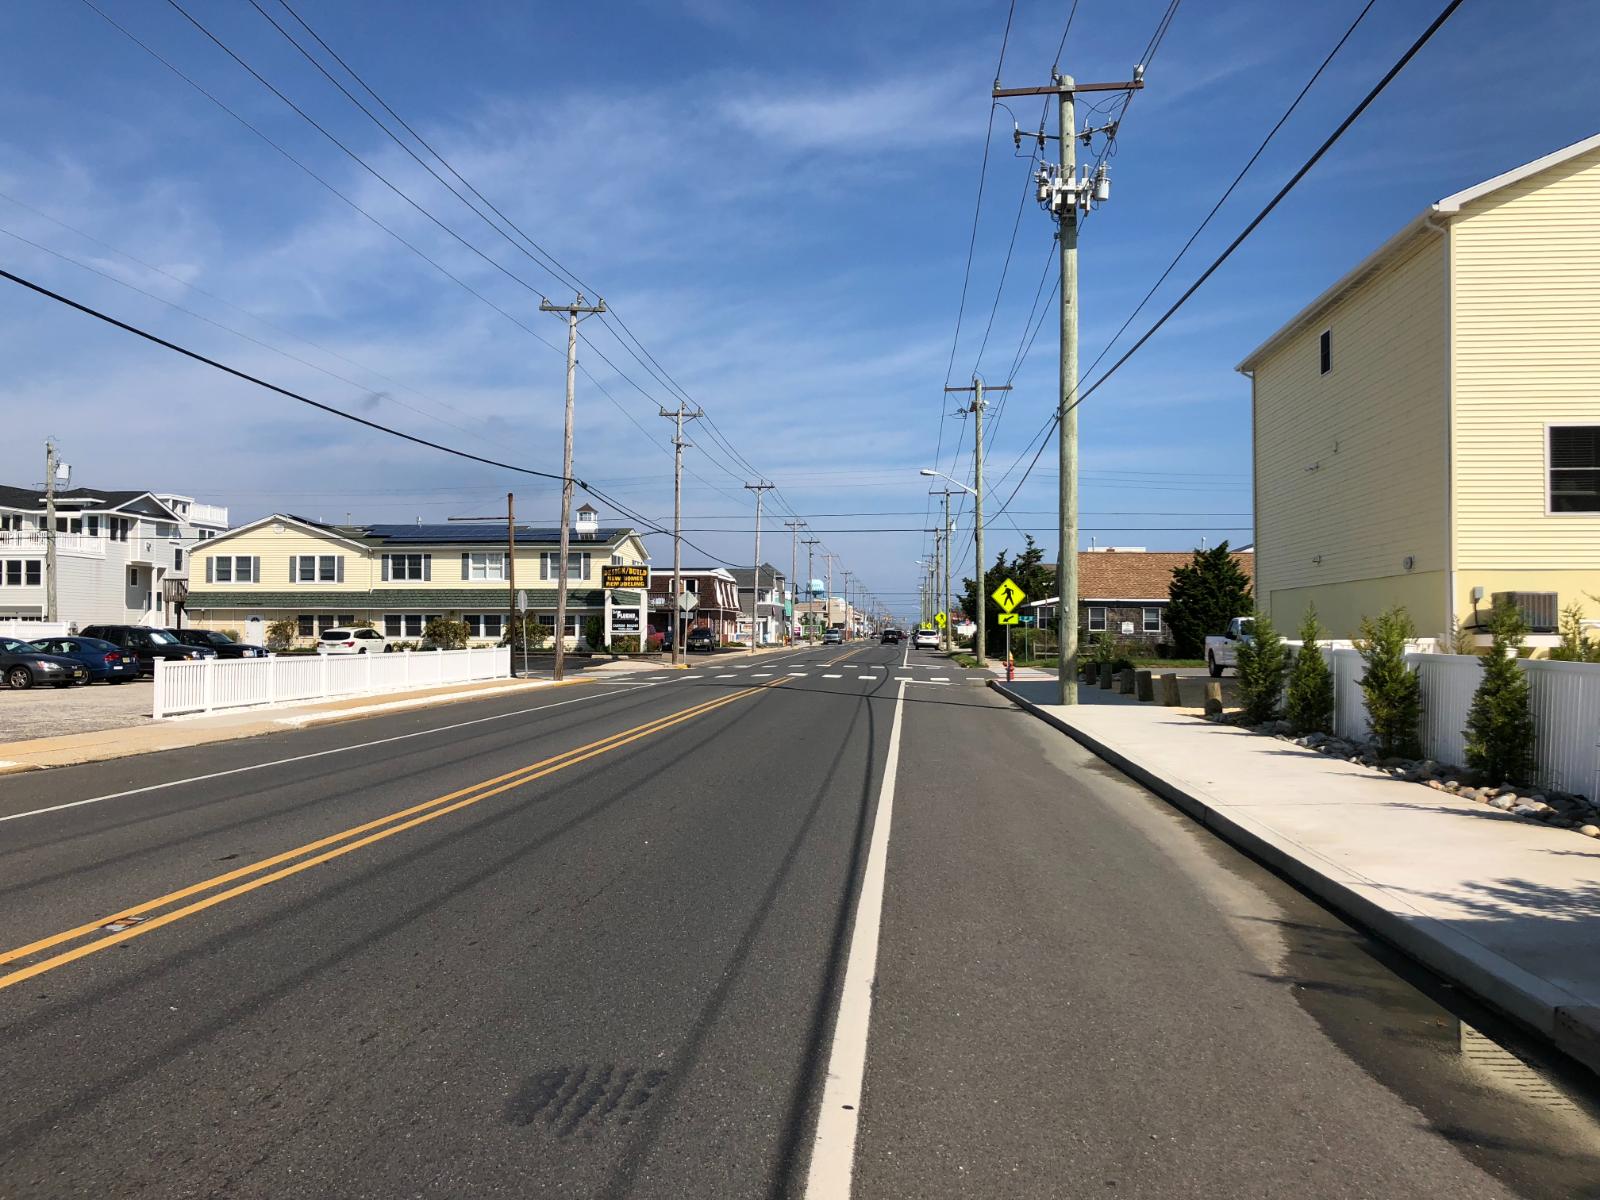
Barnegat Light – Scenic Solitude on the Northern Tip
Barnegat Light sits at the northernmost end of Long Beach Island, home to the historic Barnegat Lighthouse and some of the most scenic, less crowded beaches in the region. The town is known for its dune preservation, wide beaches, and laid-back atmosphere. Unlike the central and southern portions of the island, Barnegat Light has fewer rental properties and more full-time residents, giving it a slower pace and more cohesive community feel. The streets are wider, the homes often sit on larger lots, and the views—especially from oceanfront and bayfront homes—are spectacular.
This quiet charm has translated into strong real estate value, particularly among buyers looking for a peaceful escape rather than nightlife or entertainment. The town’s housing stock is a mix of mid-century beach houses and newer luxury builds, with a heavy emphasis on well-maintained custom homes. Supply remains tight due to conservation efforts and the town’s size, which has helped fuel ongoing price increases even during cooler statewide trends. With its natural beauty, privacy, and consistent buyer interest, Barnegat Light continues to be a standout for discerning coastal home seekers.
19. Franklin Lakes – 65.3% Home Price Increase Since 2012
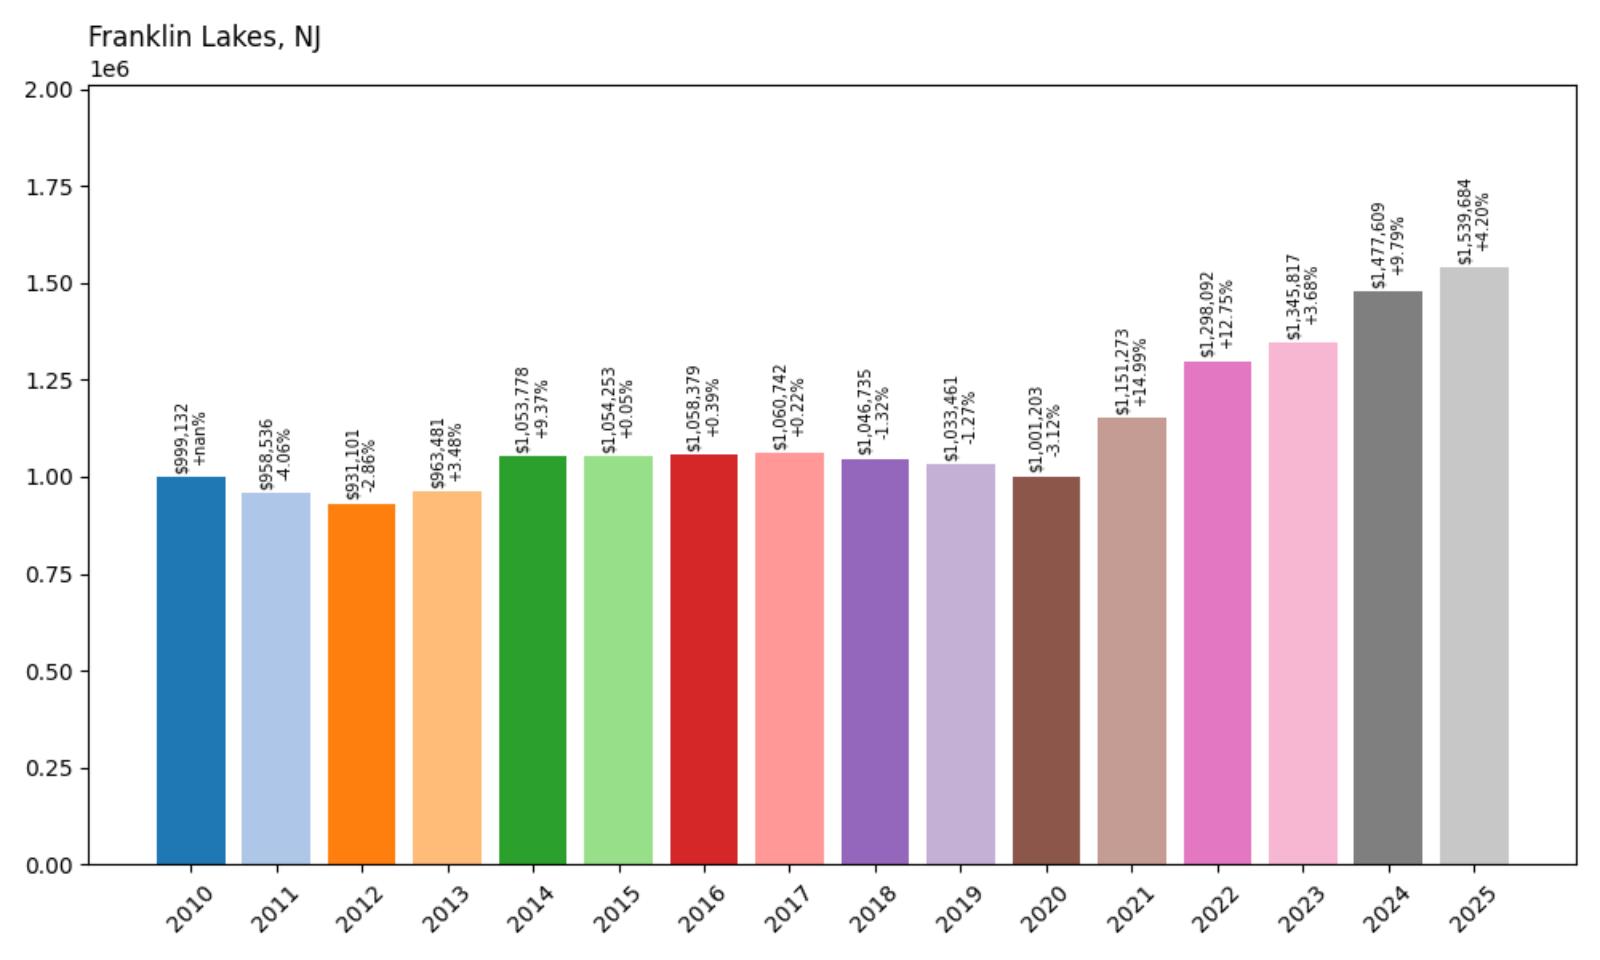
- 2010: $999,132
- 2011: $958,536 (−$40,596, −4.06% from previous year)
- 2012: $931,101 (−$27,435, −2.86% from previous year)
- 2013: $963,481 (+$32,380, +3.48% from previous year)
- 2014: $1,053,778 (+$90,297, +9.37% from previous year)
- 2015: $1,054,253 (+$475, +0.05% from previous year)
- 2016: $1,058,379 (+$4,126, +0.39% from previous year)
- 2017: $1,060,742 (+$2,363, +0.22% from previous year)
- 2018: $1,046,735 (−$14,007, −1.32% from previous year)
- 2019: $1,033,461 (−$13,273, −1.27% from previous year)
- 2020: $1,001,203 (−$32,259, −3.12% from previous year)
- 2021: $1,151,273 (+$150,070, +14.99% from previous year)
- 2022: $1,298,092 (+$146,819, +12.75% from previous year)
- 2023: $1,345,817 (+$47,726, +3.68% from previous year)
- 2024: $1,477,609 (+$131,791, +9.79% from previous year)
- 2025: $1,539,684 (+$62,075, +4.20% from previous year)
Franklin Lakes has seen a 65.3% increase in home prices since 2012, rising from $931,101 to $1,539,684. While early gains were modest, prices surged after 2020 and have stayed strong through 2025. The borough’s luxurious homes, large lots, and stable demand make it a cornerstone of northern New Jersey’s high-end market.
Franklin Lakes – Spacious Living and High-End Appeal
Located in Bergen County, Franklin Lakes is known for its sprawling properties, wooded landscapes, and serene, upscale neighborhoods. It has long been a destination for affluent families and professionals who want space without sacrificing proximity to New York City. The town offers top-rated schools, access to major highways, and a strong community network. Its zoning favors large-lot single-family homes, which has preserved its low-density, suburban character and kept development in check. This balance of space and prestige continues to drive demand from high-income buyers.
The post-pandemic market drove many families out of tighter urban areas and into places like Franklin Lakes. The 2021–2022 price boom marked a turning point, drawing new buyers and boosting values across the board. In addition to newer luxury homes, the town has a large inventory of custom estates, many with pools, tennis courts, and private drives. Though price growth has slowed from the breakneck pace of 2021, it continues to trend upward, reflecting a stable, healthy luxury market. Franklin Lakes remains one of Bergen County’s premier communities and continues to draw buyers seeking space, quality, and long-term value.
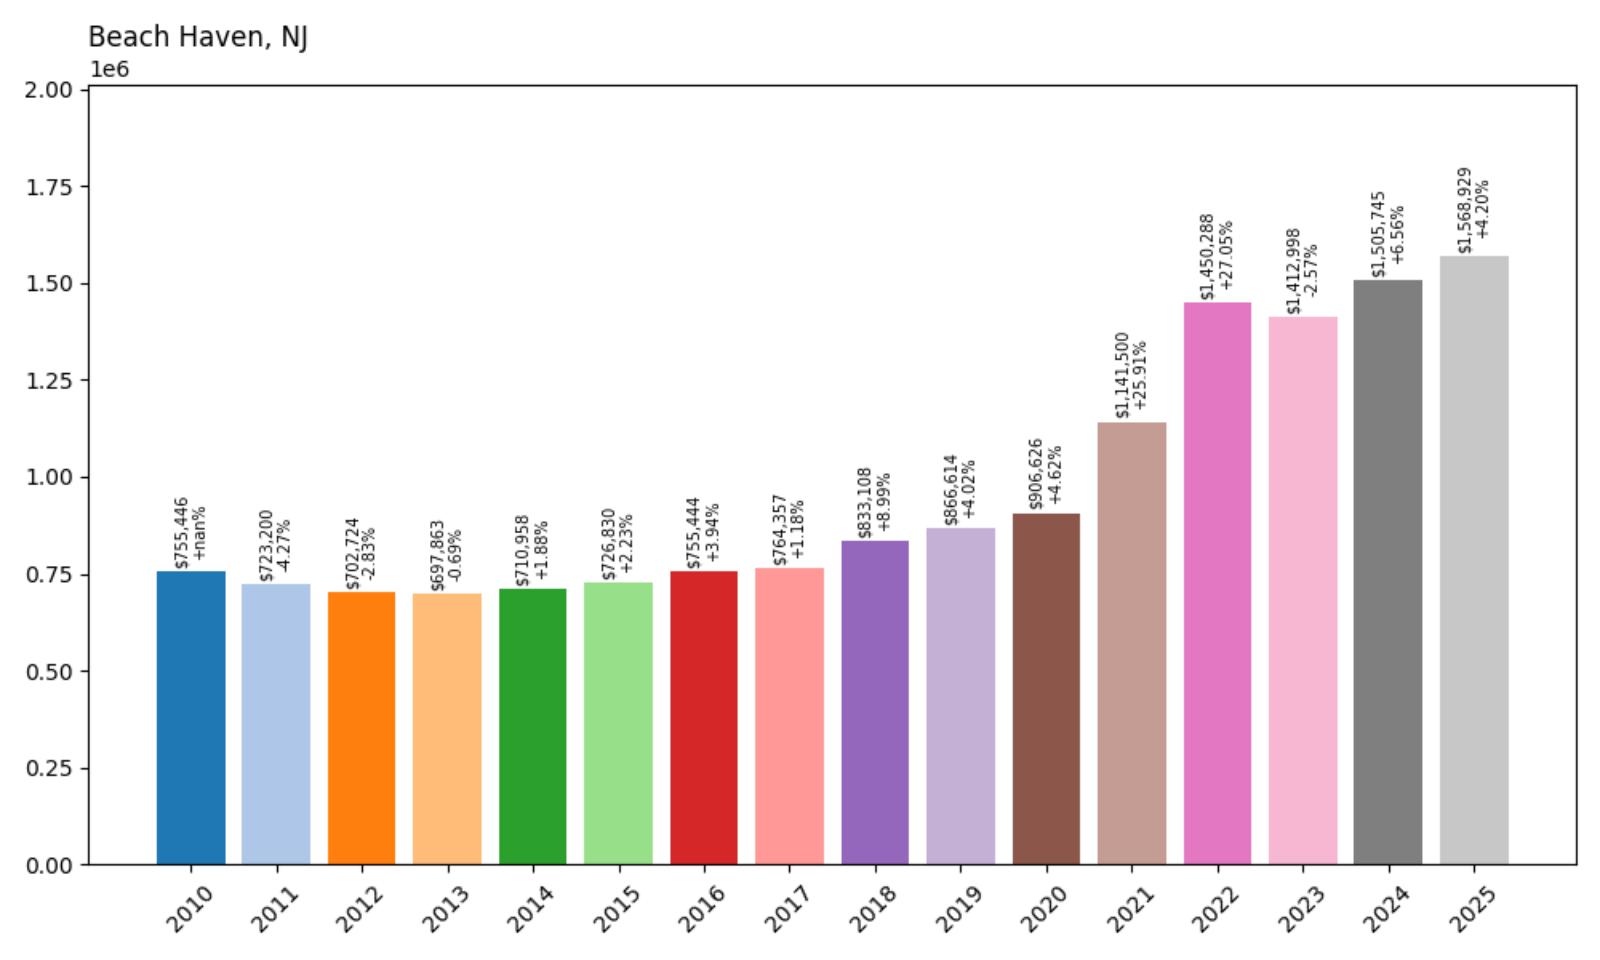
18. Beach Haven – 107.6% Home Price Increase Since 2010
🔥 Would you like to save this?
- 2010: $755,446
- 2011: $723,200 (−$32,246, −4.27% from previous year)
- 2012: $702,724 (−$20,476, −2.83% from previous year)
- 2013: $697,863 (−$4,861, −0.69% from previous year)
- 2014: $710,958 (+$13,095, +1.88% from previous year)
- 2015: $726,830 (+$15,872, +2.23% from previous year)
- 2016: $755,444 (+$28,614, +3.94% from previous year)
- 2017: $764,357 (+$8,913, +1.18% from previous year)
- 2018: $833,108 (+$68,751, +8.99% from previous year)
- 2019: $866,614 (+$33,506, +4.02% from previous year)
- 2020: $906,626 (+$40,012, +4.62% from previous year)
- 2021: $1,141,500 (+$234,875, +25.91% from previous year)
- 2022: $1,450,288 (+$308,788, +27.05% from previous year)
- 2023: $1,412,998 (−$37,290, −2.57% from previous year)
- 2024: $1,505,745 (+$92,747, +6.56% from previous year)
- 2025: $1,568,929 (+$63,184, +4.20% from previous year)
Beach Haven’s home prices have more than doubled since 2010, rising from $755,446 to $1,568,929 by June 2025. While the early years saw only modest fluctuations and some small declines, values began a strong upward trend around 2016. The most dramatic growth came between 2020 and 2022, when prices surged nearly 60% in just two years. Though 2023 brought a small correction, prices quickly bounced back in 2024 and 2025. Overall, the consistent long-term growth highlights the town’s strong desirability and the enduring appeal of coastal real estate in New Jersey.
Beach Haven – Price Boom Fueled by Coastal Demand
Beach Haven, located on the southern end of Long Beach Island, has long been a high-demand destination for buyers looking for classic Jersey Shore charm. Known for its historic Victorian homes, wide sandy beaches, and family-friendly environment, the town has drawn generations of vacationers and second-home seekers. The limited land available for development—surrounded by water on nearly every side—has contributed to a tight housing inventory. This scarcity, paired with rising demand from remote workers and investors, helped push prices higher even during periods when the broader housing market slowed.
Accessibility from the Philadelphia metro area and northern New Jersey adds to Beach Haven’s popularity, making it ideal for weekend homes as well as full-time residences. The pandemic-era real estate surge had an especially pronounced effect here, with home prices jumping over $500,000 in just five years between 2020 and 2025. That surge hasn’t reversed. Recent gains in 2024 and 2025 show continued momentum, likely reflecting growing interest in coastal towns with a strong quality of life. Beach Haven’s price trajectory is a clear example of how desirable location and constrained supply can drive exceptional long-term value growth.
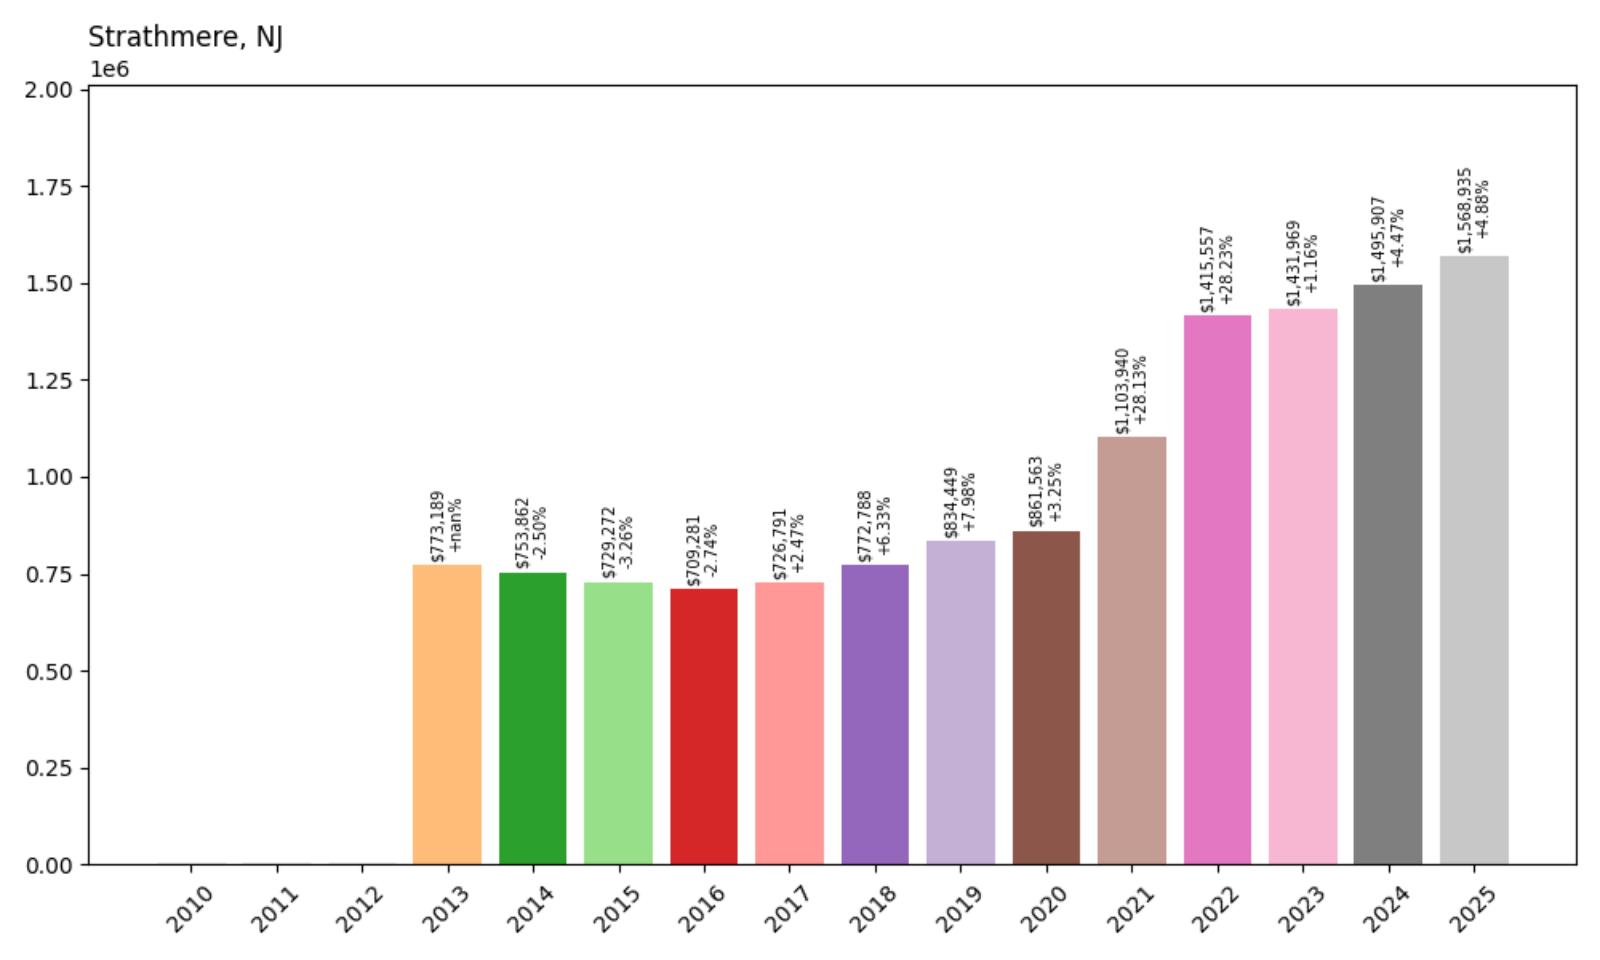
17. Strathmere – 102.8% Home Price Increase Since 2013
- 2010: $NA
- 2011: $NA
- 2012: $NA
- 2013: $773,189
- 2014: $753,862 (−$19,327, −2.50% from previous year)
- 2015: $729,272 (−$24,590, −3.26% from previous year)
- 2016: $709,281 (−$19,991, −2.74% from previous year)
- 2017: $726,791 (+$17,510, +2.47% from previous year)
- 2018: $772,788 (+$45,997, +6.33% from previous year)
- 2019: $834,449 (+$61,661, +7.98% from previous year)
- 2020: $861,563 (+$27,114, +3.25% from previous year)
- 2021: $1,103,940 (+$242,378, +28.13% from previous year)
- 2022: $1,415,557 (+$311,617, +28.23% from previous year)
- 2023: $1,431,969 (+$16,412, +1.16% from previous year)
- 2024: $1,495,907 (+$63,938, +4.47% from previous year)
- 2025: $1,568,935 (+$73,028, +4.88% from previous year)
Strathmere home values rose from $773,189 in 2013 to $1,568,935 in 2025, marking a 102.8% increase. Early years saw minor declines through 2016, but the market rebounded solidly starting in 2017. The real momentum came between 2020 and 2022, with home prices jumping over $550,000 in just two years. While gains have tapered off since, values are still increasing steadily year-over-year. Despite a missing early data record, the clear trend from 2013 onward points to sustained long-term growth fueled by market confidence in this oceanside enclave.
Strathmere – Quiet Shore Town With Soaring Appeal
Strathmere, nestled between Ocean City and Sea Isle City along the southern coast, is one of New Jersey’s lesser-known but highly desirable beach communities. It’s a small and tranquil area with just one main road in and out, creating a tight-knit feel that appeals to buyers seeking privacy and exclusivity. That limited accessibility, combined with a small number of available homes, has kept supply extremely low. As a result, even modest buyer interest can create sharp price shifts, which became especially apparent during the post-2020 housing surge.
The town’s lack of commercialization is a draw for buyers who want to escape the crowded boardwalk scene but still enjoy easy beach access. The homes here are often generationally owned and rarely listed, adding to the sense of scarcity. Because Strathmere has no large developments and few year-round residents, it has a uniquely seasonal rhythm that enhances its appeal for vacation property investors. With prices continuing to rise in 2024 and 2025, despite earlier volatility, Strathmere has shown it’s no longer a sleepy coastal town—it’s a premium investment zone for serious buyers who value location, calm, and long-term appreciation.
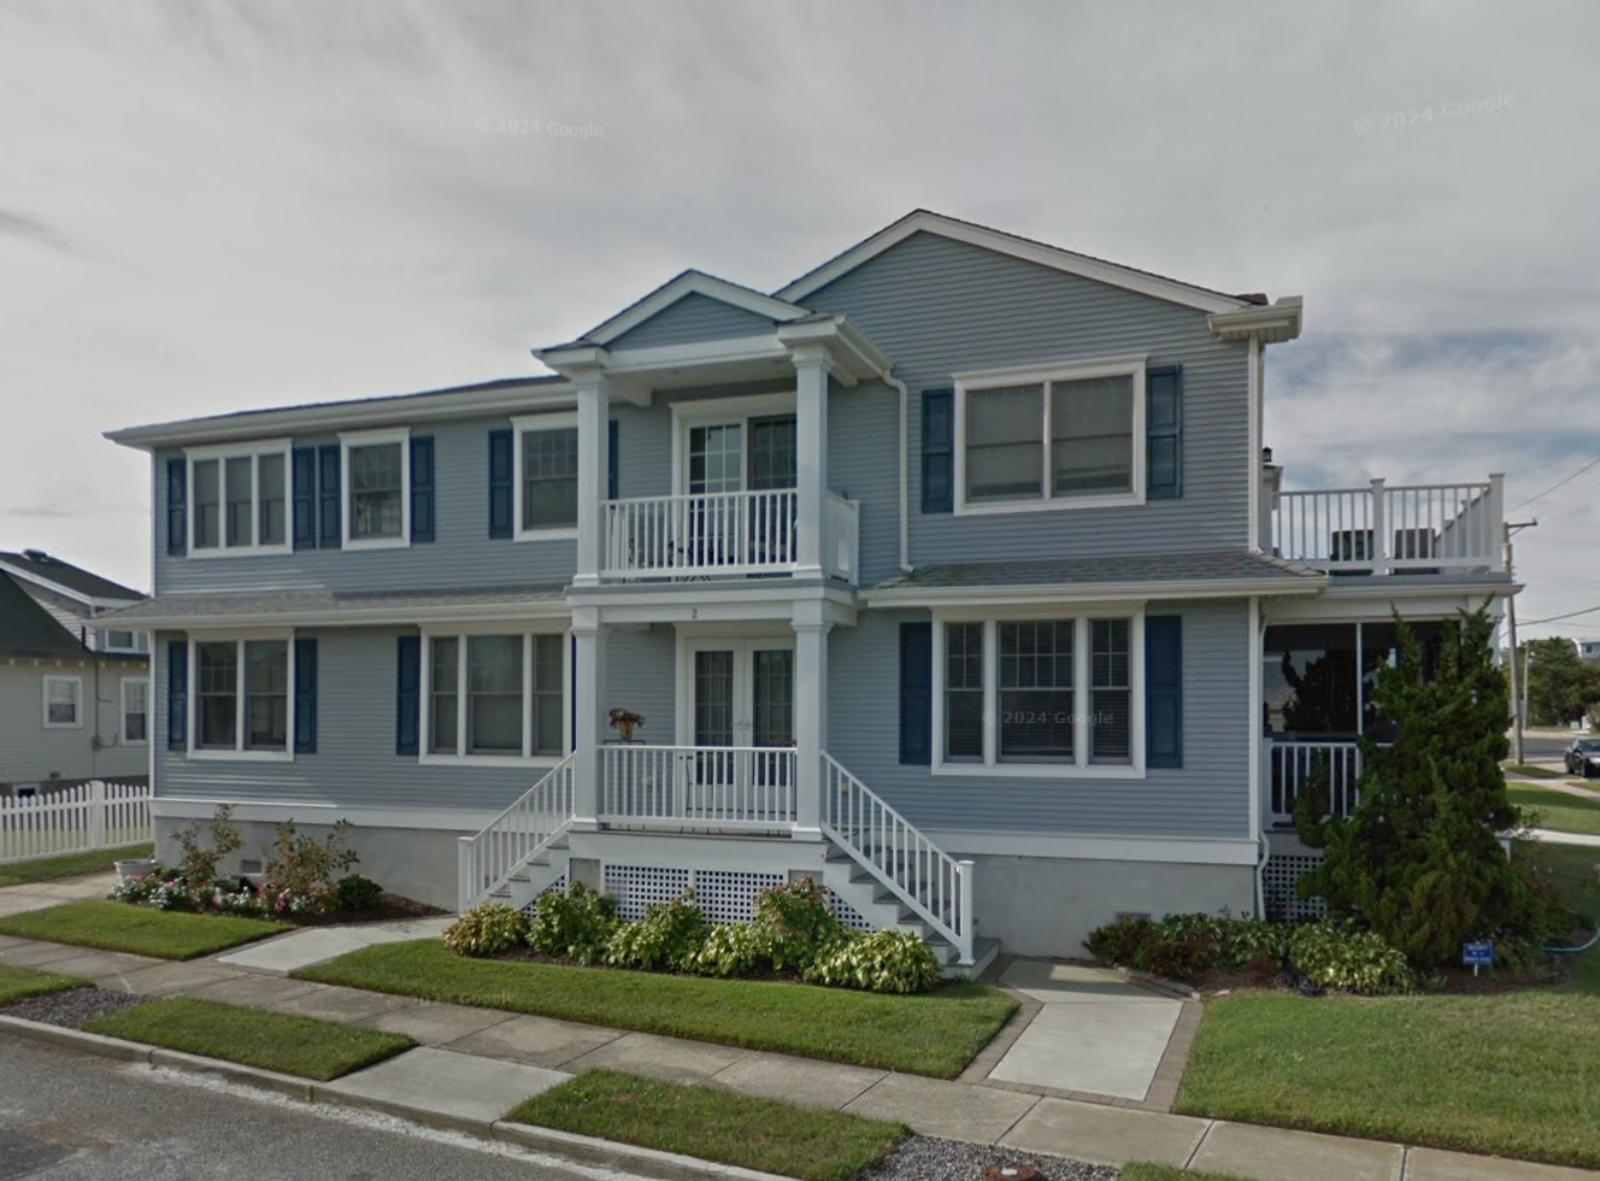
16. Avon-by-the-Sea – 94.3% Home Price Increase Since 2010
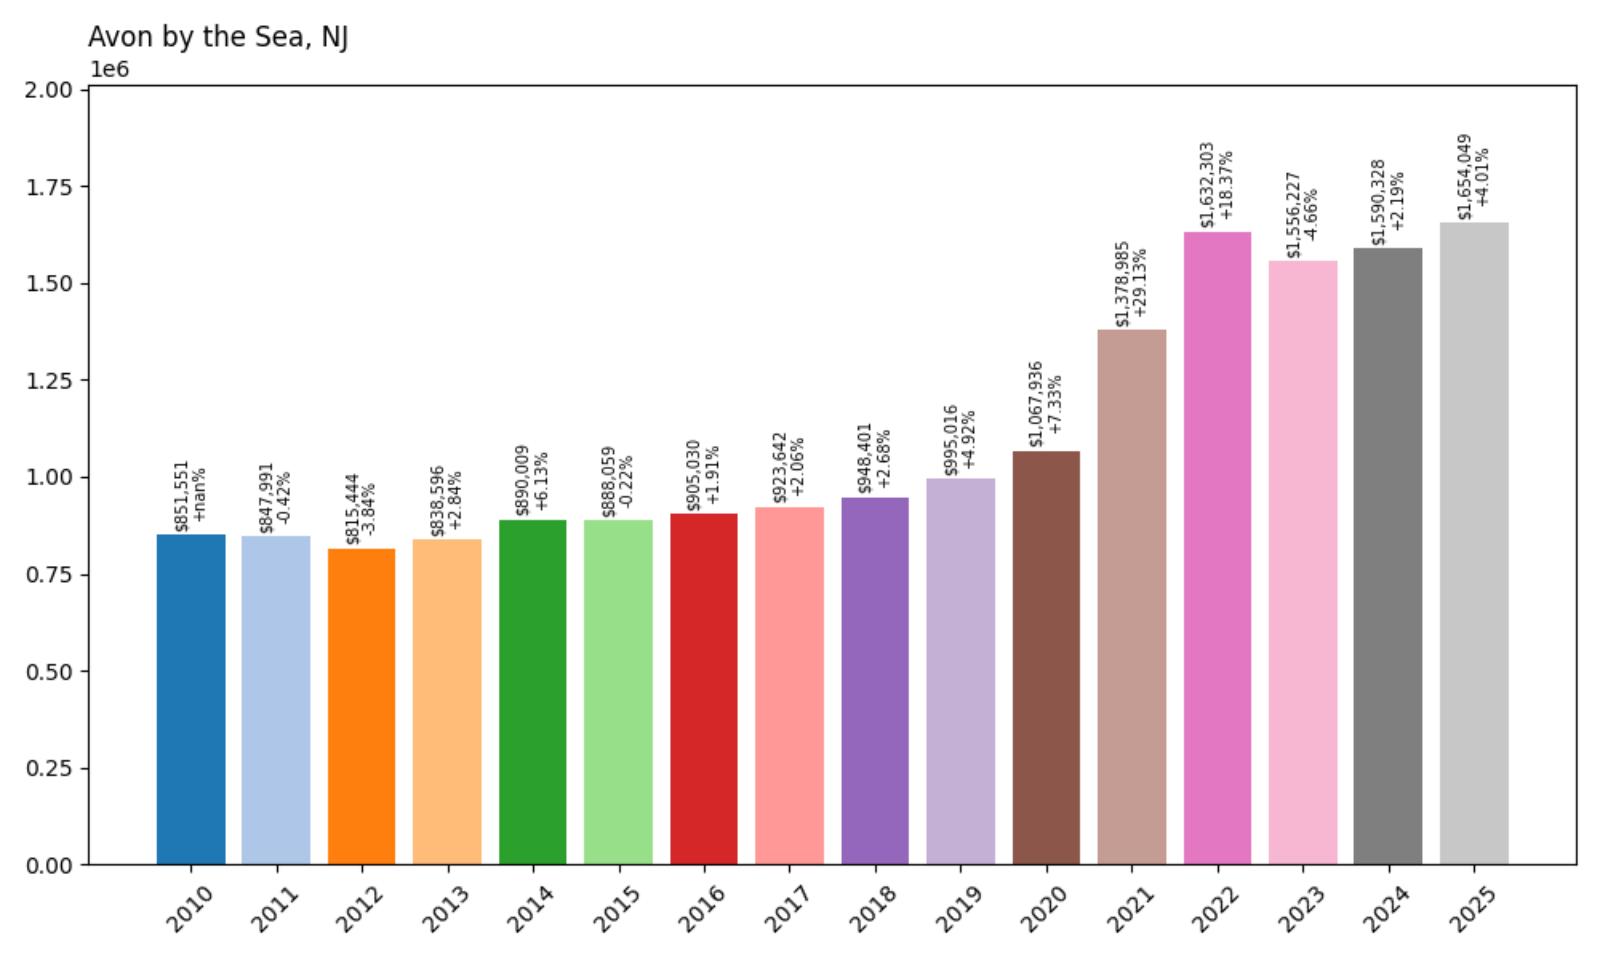
- 2010: $851,551
- 2011: $847,991 (−$3,560, −0.42% from previous year)
- 2012: $815,444 (−$32,547, −3.84% from previous year)
- 2013: $838,596 (+$23,152, +2.84% from previous year)
- 2014: $890,009 (+$51,413, +6.13% from previous year)
- 2015: $888,059 (−$1,950, −0.22% from previous year)
- 2016: $905,030 (+$16,971, +1.91% from previous year)
- 2017: $923,642 (+$18,612, +2.06% from previous year)
- 2018: $948,401 (+$24,760, +2.68% from previous year)
- 2019: $995,016 (+$46,615, +4.92% from previous year)
- 2020: $1,067,936 (+$72,919, +7.33% from previous year)
- 2021: $1,378,985 (+$311,050, +29.13% from previous year)
- 2022: $1,632,303 (+$253,318, +18.37% from previous year)
- 2023: $1,556,227 (−$76,076, −4.66% from previous year)
- 2024: $1,590,328 (+$34,101, +2.19% from previous year)
- 2025: $1,654,049 (+$63,722, +4.01% from previous year)
Home prices in Avon-by-the-Sea jumped from $851,551 in 2010 to $1,654,049 in 2025, a 94.3% increase over the 15-year span. Most of the appreciation came after 2020, with the market surging more than 50% between 2020 and 2022 alone. Even after a small dip in 2023, prices stabilized and continued climbing into 2025. Earlier years were steadier, with only gradual gains and a few flat or negative years. This long-term growth shows strong buyer confidence in Avon-by-the-Sea as a resilient, high-demand shore town, particularly in a post-pandemic market.
Avon-by-the-Sea – Classic Shore Town With Skyrocketing Value
Avon-by-the-Sea is a small but celebrated borough along the Jersey Shore, known for its beautiful boardwalk, well-kept beaches, and quiet residential charm. Located in Monmouth County, it has long attracted buyers looking for a quieter alternative to the busier beach towns nearby. The area is dotted with elegant homes, many built in Victorian and Colonial Revival styles, and the town has strict zoning rules that limit overdevelopment—something that adds to the scarcity and helps protect long-term property values.
The dramatic post-2020 surge in home values reflects both broader demand for coastal living and Avon’s growing reputation as a luxury retreat. With close proximity to NYC commuters and second-home buyers alike, the borough has seen its limited inventory snapped up at premium prices. Even the slight dip in 2023 didn’t hold back momentum for long, with 2024 and 2025 continuing the upward trend. For buyers interested in prestige, charm, and long-term appreciation, Avon-by-the-Sea continues to deliver, year after year.
15. Englewood Cliffs – 64.5% Home Price Increase Since 2010
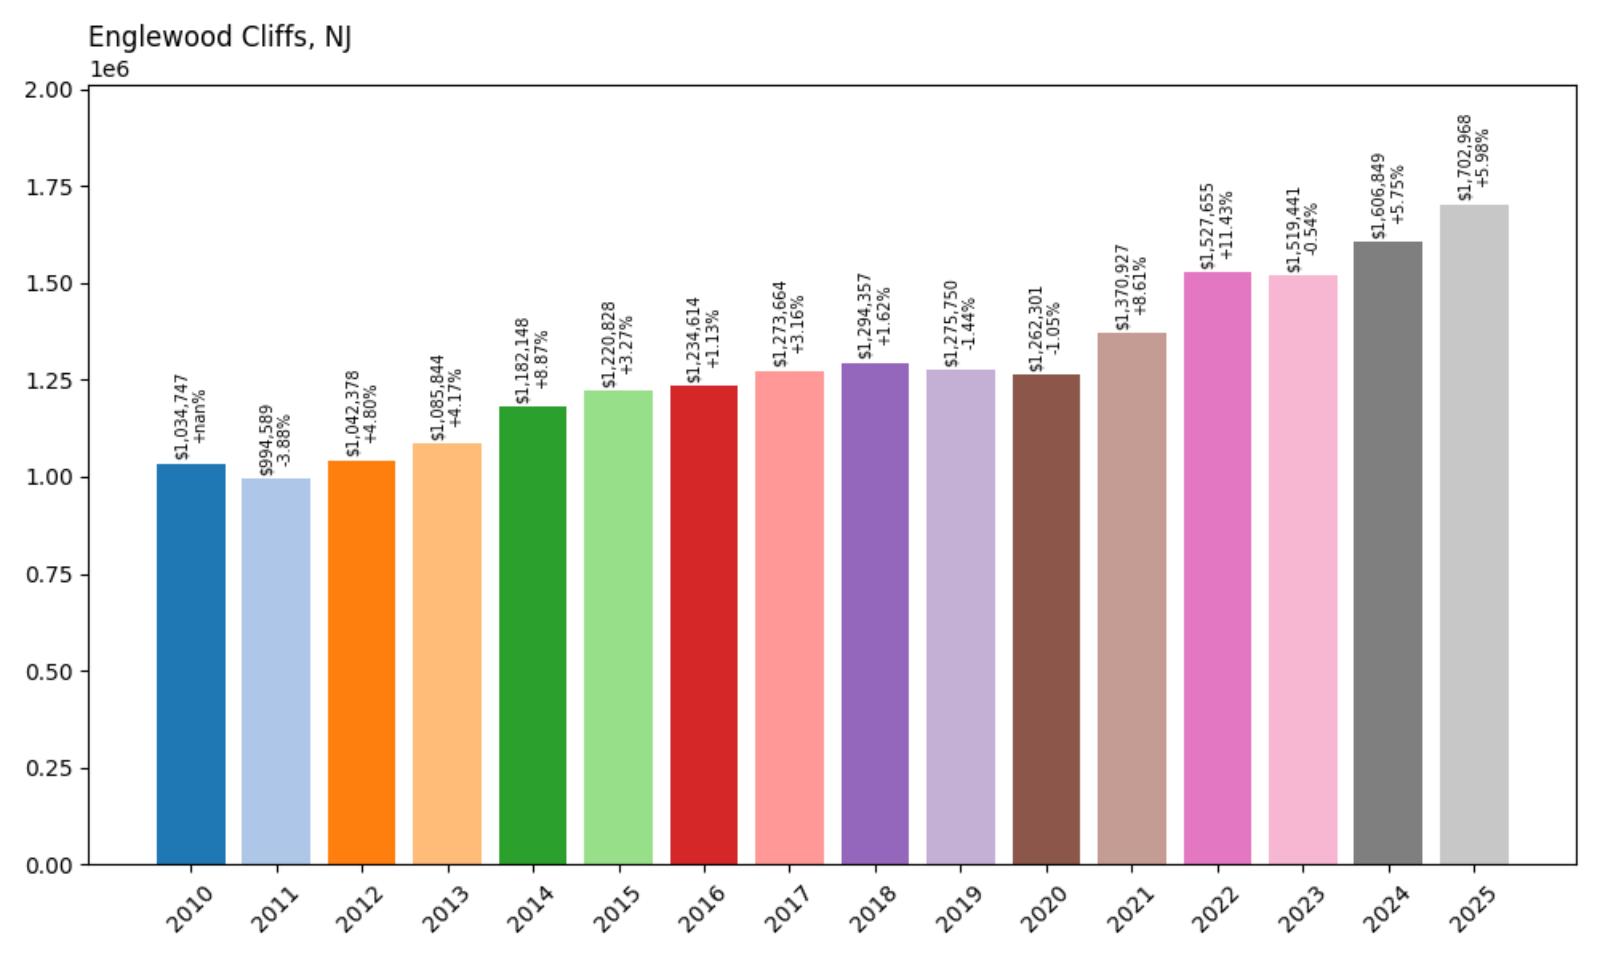
- 2010: $1,034,747
- 2011: $994,589 (−$40,158, −3.88% from previous year)
- 2012: $1,042,378 (+$47,789, +4.80% from previous year)
- 2013: $1,085,844 (+$43,466, +4.17% from previous year)
- 2014: $1,182,148 (+$96,304, +8.87% from previous year)
- 2015: $1,220,828 (+$38,680, +3.27% from previous year)
- 2016: $1,234,614 (+$13,786, +1.13% from previous year)
- 2017: $1,273,664 (+$39,050, +3.16% from previous year)
- 2018: $1,294,357 (+$20,694, +1.62% from previous year)
- 2019: $1,275,750 (−$18,608, −1.44% from previous year)
- 2020: $1,262,301 (−$13,449, −1.05% from previous year)
- 2021: $1,370,927 (+$108,626, +8.61% from previous year)
- 2022: $1,527,655 (+$156,728, +11.43% from previous year)
- 2023: $1,519,441 (−$8,214, −0.54% from previous year)
- 2024: $1,606,849 (+$87,409, +5.75% from previous year)
- 2025: $1,702,968 (+$96,119, +5.98% from previous year)
Englewood Cliffs has seen its home values climb by 64.5% between 2010 and 2025, rising from $1.03 million to just over $1.7 million. Though the town experienced minor dips in 2011, 2019, and 2020, the overall trajectory has been upward. Strong rebounds in 2021 and 2022 helped accelerate growth, adding more than $265,000 in just two years. The past three years have continued this positive trend, with the 2025 price showing a nearly $100,000 increase from the year before. Even with brief corrections, the long-term strength of the market is clear.
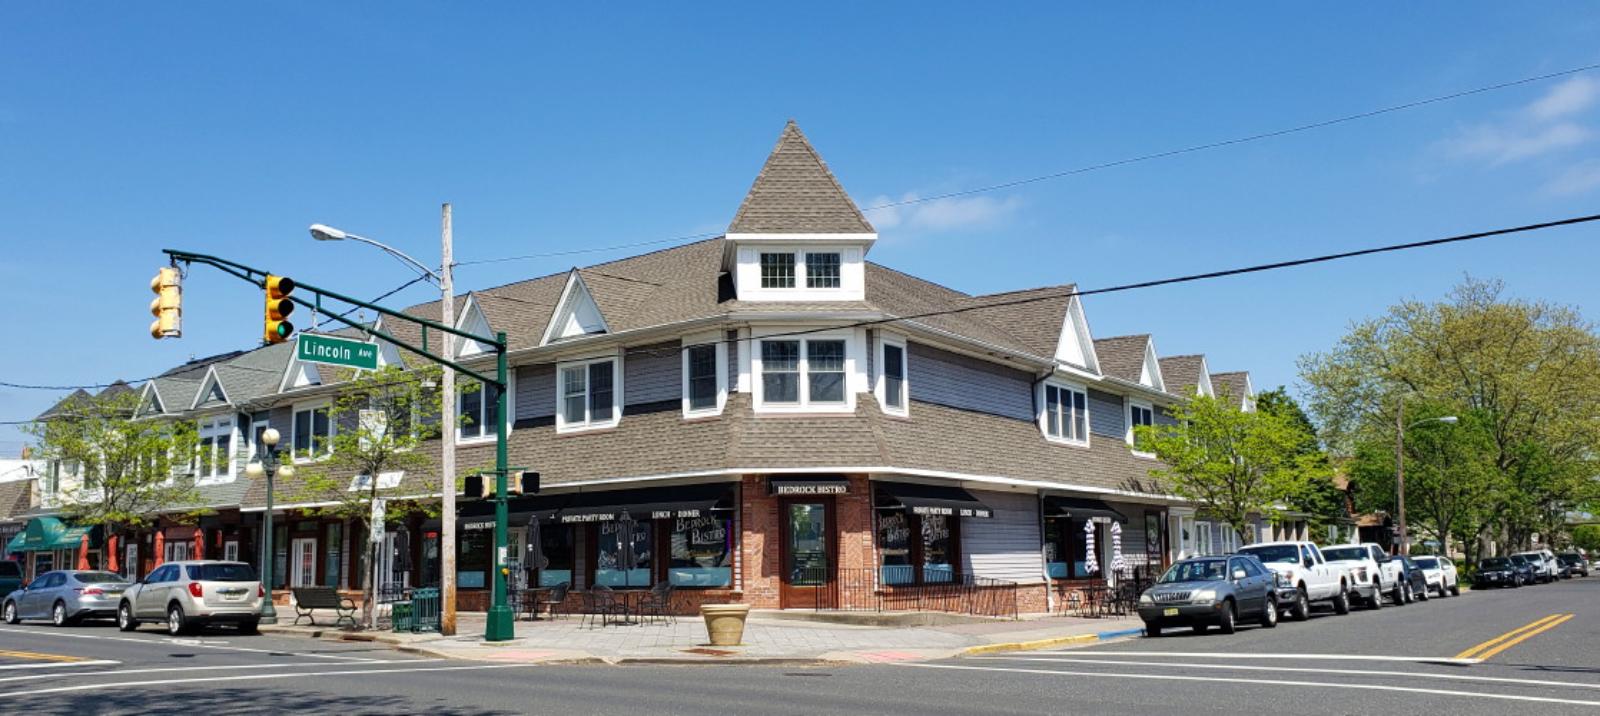
Englewood Cliffs – Prestige and Proximity to Manhattan
Nestled atop the Palisades in Bergen County, Englewood Cliffs stands as one of New Jersey’s most prestigious residential communities. Its elevated perch offers scenic views of the Hudson River and a remarkably short drive to Manhattan—less than 15 minutes via the George Washington Bridge. The town’s real estate market is defined by expansive lots, custom-built luxury homes, and an emphasis on privacy, which together support its consistently high home values. Corporate offices of global brands like LG and Unilever have also anchored the town’s economy, adding further resilience to its property market.
Englewood Cliffs maintains a small-town feel with strictly limited commercial zoning and no high-rise developments, preserving the open, suburban character. The school system is well-regarded, and its low crime rates make it attractive to affluent families and professionals alike. Because the borough has resisted large-scale development, housing supply remains tight—a key factor in the consistent price growth. For homebuyers who want executive living within reach of New York City, Englewood Cliffs continues to offer a rare combination of status, location, and long-term value.
14. Mantoloking – 91.61% Home Price Increase Since 2010
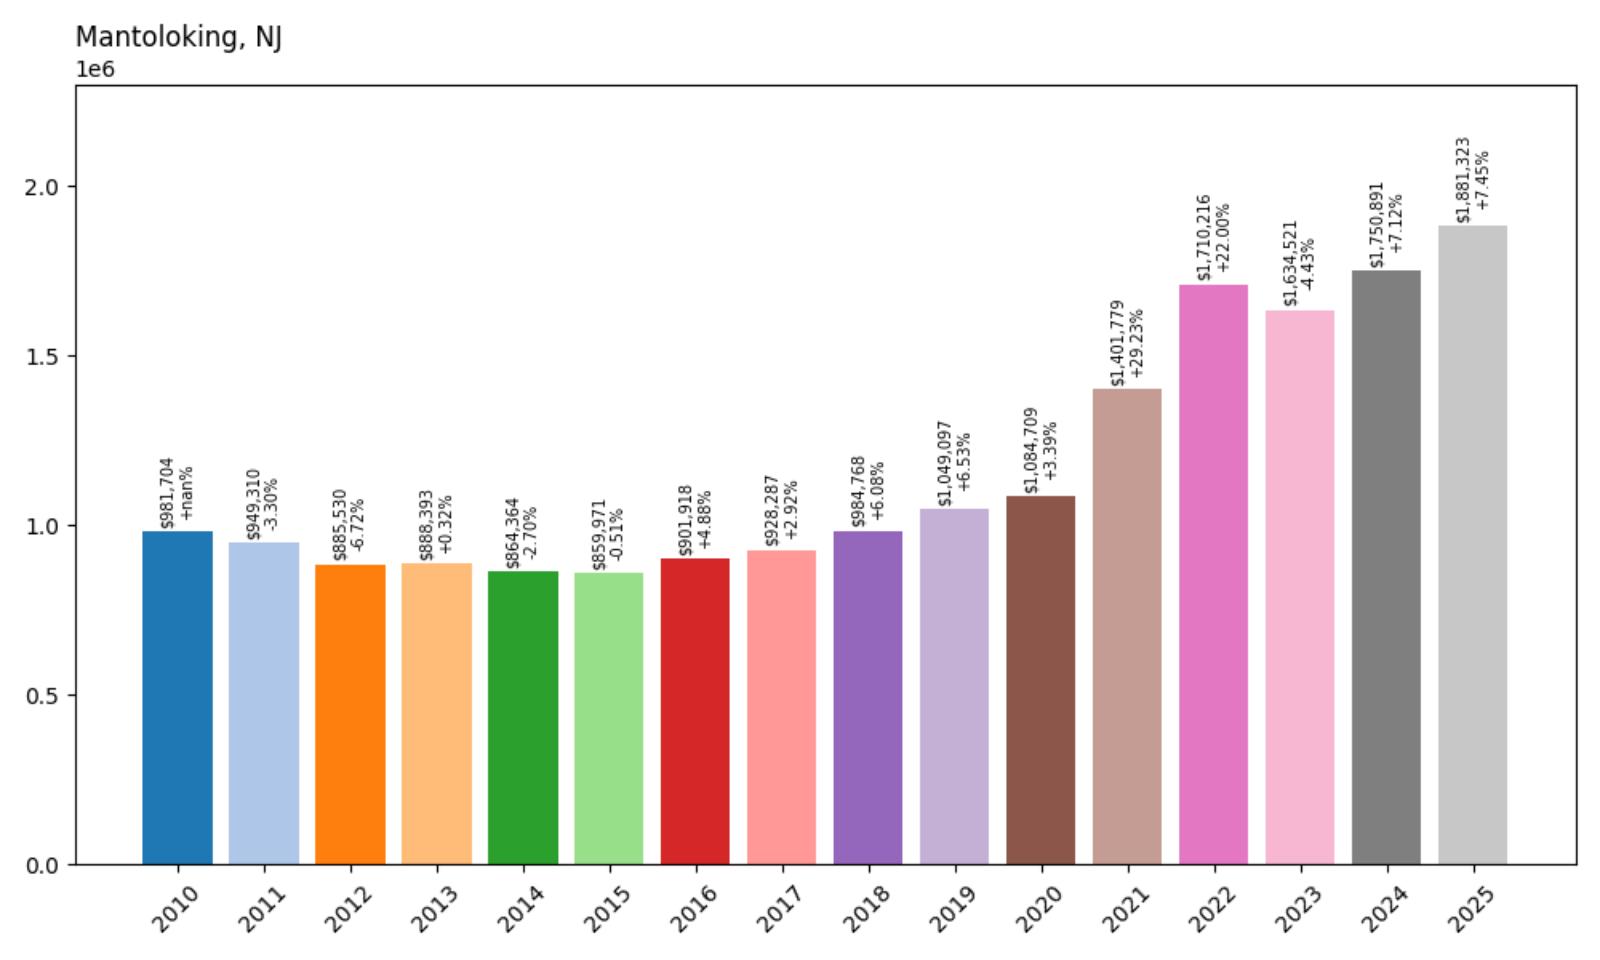
- 2010: $981,704
- 2011: $949,310 (−$32,393, −3.30% from previous year)
- 2012: $885,530 (−$63,780, −6.72% from previous year)
- 2013: $888,393 (+$2,863, +0.32% from previous year)
- 2014: $864,364 (−$24,029, −2.70% from previous year)
- 2015: $859,971 (−$4,392, −0.51% from previous year)
- 2016: $901,918 (+$41,946, +4.88% from previous year)
- 2017: $928,287 (+$26,370, +2.92% from previous year)
- 2018: $984,768 (+$56,480, +6.08% from previous year)
- 2019: $1,049,097 (+$64,330, +6.53% from previous year)
- 2020: $1,084,709 (+$35,612, +3.39% from previous year)
- 2021: $1,401,779 (+$317,070, +29.23% from previous year)
- 2022: $1,710,216 (+$308,437, +22.00% from previous year)
- 2023: $1,634,521 (−$75,695, −4.43% from previous year)
- 2024: $1,750,891 (+$116,370, +7.12% from previous year)
- 2025: $1,881,323 (+$130,432, +7.45% from previous year)
Mantoloking has seen a dramatic rise in property values over the last 15 years, with the median home price increasing by over $899,000 since 2010 — a jump of nearly 92%. While the early 2010s showed a pattern of modest declines, the town rebounded solidly beginning in 2016. A major spike came between 2020 and 2022, with back-to-back years of 29% and 22% growth respectively. Though 2023 saw a modest correction, values quickly recovered in 2024 and 2025. The town’s long-term trend has remained strongly upward.
Mantoloking: A Premier Coastal Enclave
🔥 Would you like to save this?
Mantoloking is one of New Jersey’s most prestigious coastal towns, renowned for its expansive beachfront estates and quiet, exclusive atmosphere. Nestled along the Barnegat Peninsula, the town offers direct ocean access, limited public infrastructure, and strict zoning that preserves its low-density charm. Many properties boast private docks or panoramic views of both the ocean and Barnegat Bay, making them highly desirable among second-home buyers and investors. The town’s limited housing stock and resilience in the face of economic shifts contribute to its consistently strong pricing trends.
Despite its small size, Mantoloking has long attracted high-income buyers seeking privacy, tranquility, and luxury. With proximity to upscale beach communities like Bay Head and access to Route 35, it remains within reach of New York City and North Jersey weekenders. The steep appreciation in home values, especially during the post-pandemic boom, underscores the area’s scarcity and demand. Even after a slight price dip in 2023, the market bounced back swiftly, reinforcing Mantoloking’s status as one of New Jersey’s top-tier real estate enclaves.
13. Long Beach Township – 88.02% Home Price Increase Since 2010
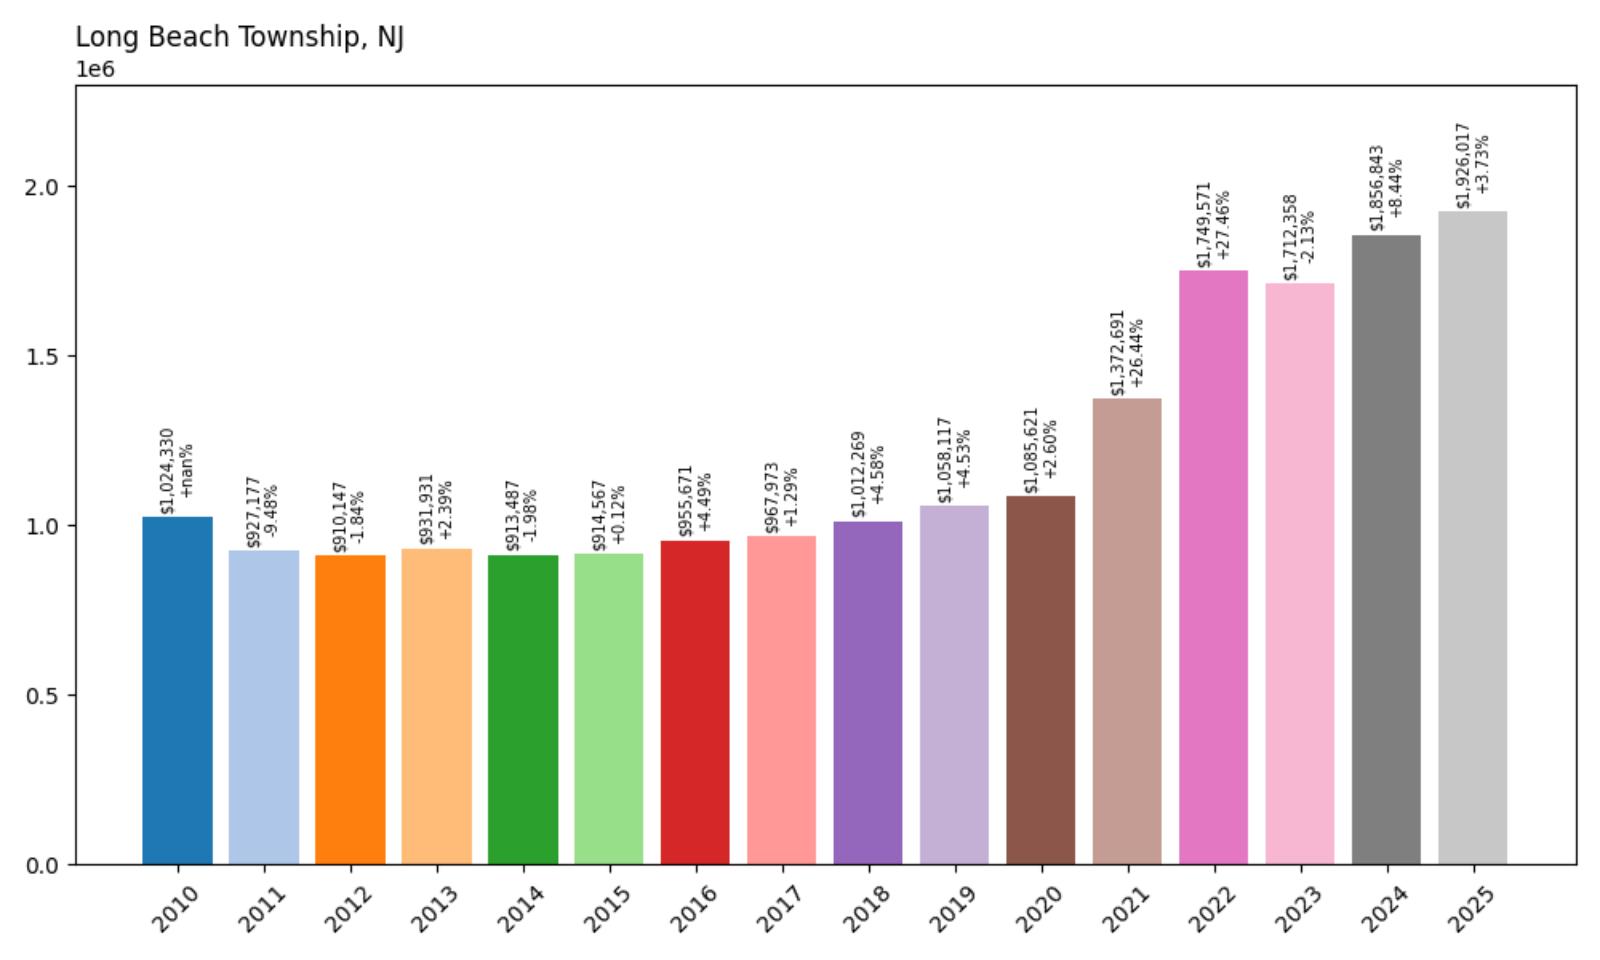
- 2010: $1,024,330
- 2011: $927,177 (−$97,153, −9.48% from previous year)
- 2012: $910,147 (−$17,029, −1.84% from previous year)
- 2013: $931,931 (+$21,784, +2.39% from previous year)
- 2014: $913,487 (−$18,444, −1.98% from previous year)
- 2015: $914,567 (+$1,080, +0.12% from previous year)
- 2016: $955,671 (+$41,104, +4.49% from previous year)
- 2017: $967,973 (+$12,302, +1.29% from previous year)
- 2018: $1,012,269 (+$44,296, +4.58% from previous year)
- 2019: $1,058,117 (+$45,848, +4.53% from previous year)
- 2020: $1,085,621 (+$27,505, +2.60% from previous year)
- 2021: $1,372,691 (+$287,070, +26.44% from previous year)
- 2022: $1,749,571 (+$376,880, +27.46% from previous year)
- 2023: $1,712,358 (−$37,213, −2.13% from previous year)
- 2024: $1,856,843 (+$144,485, +8.44% from previous year)
- 2025: $1,926,017 (+$69,174, +3.73% from previous year)
Home values in Long Beach Township have surged by over 88% since 2010, gaining more than $900,000 across 15 years. The early 2010s saw several minor dips and a sharp drop in 2011, but values began stabilizing around 2015 and grew steadily into the next decade. Major price jumps occurred in 2021 and 2022, with back-to-back double-digit gains fueled by intense demand for coastal property. Though the market cooled slightly in 2023, it quickly rebounded with healthy increases in both 2024 and 2025, continuing a long-term upward trend.
Long Beach Township – Shorefront Growth Driven by Seasonal Demand
Long Beach Township stretches across much of Long Beach Island, offering over 18 miles of shoreline dotted with upscale beach homes, vacation rentals, and second homes. It’s one of the most desirable destinations on the Jersey Shore, and that reputation has translated into strong housing demand and soaring property values. The township’s fragmented neighborhoods, like Loveladies, Brant Beach, and Holgate, offer distinct atmospheres—from quiet and exclusive to vibrant and family-oriented. This variety supports a high degree of real estate activity, particularly during spring and summer buying seasons.
The rapid price increases from 2020 through 2022 reflect surging interest in remote-friendly waterfront living during the pandemic, when buyers poured into coastal towns looking for space, views, and fresh air. Even as the market adjusted slightly in 2023, Long Beach Township showed resilience, with a solid bounce-back the following year. With a limited land footprint, ever-tightening inventory, and a steady stream of affluent buyers from New York, North Jersey, and Pennsylvania, the township’s long-term housing outlook remains robust. Homeowners here are sitting on substantial appreciation, with median values now nearing $2 million.
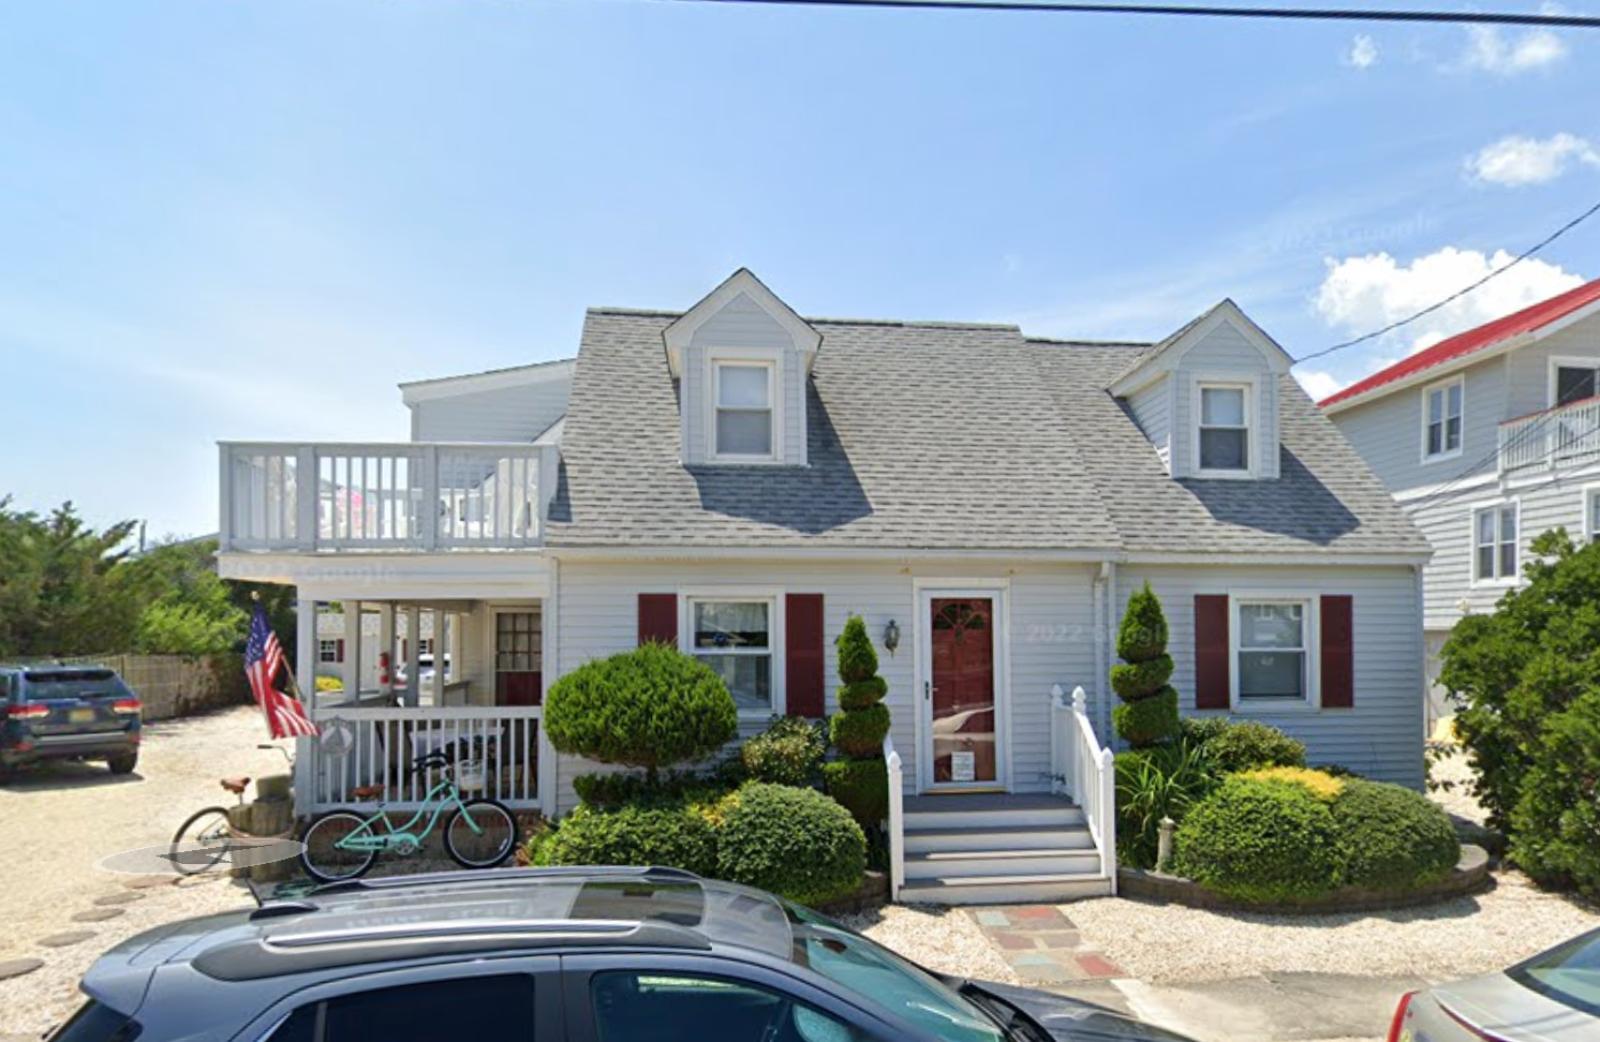
12. Harvey Cedars – 84.37% Home Price Increase Since 2010
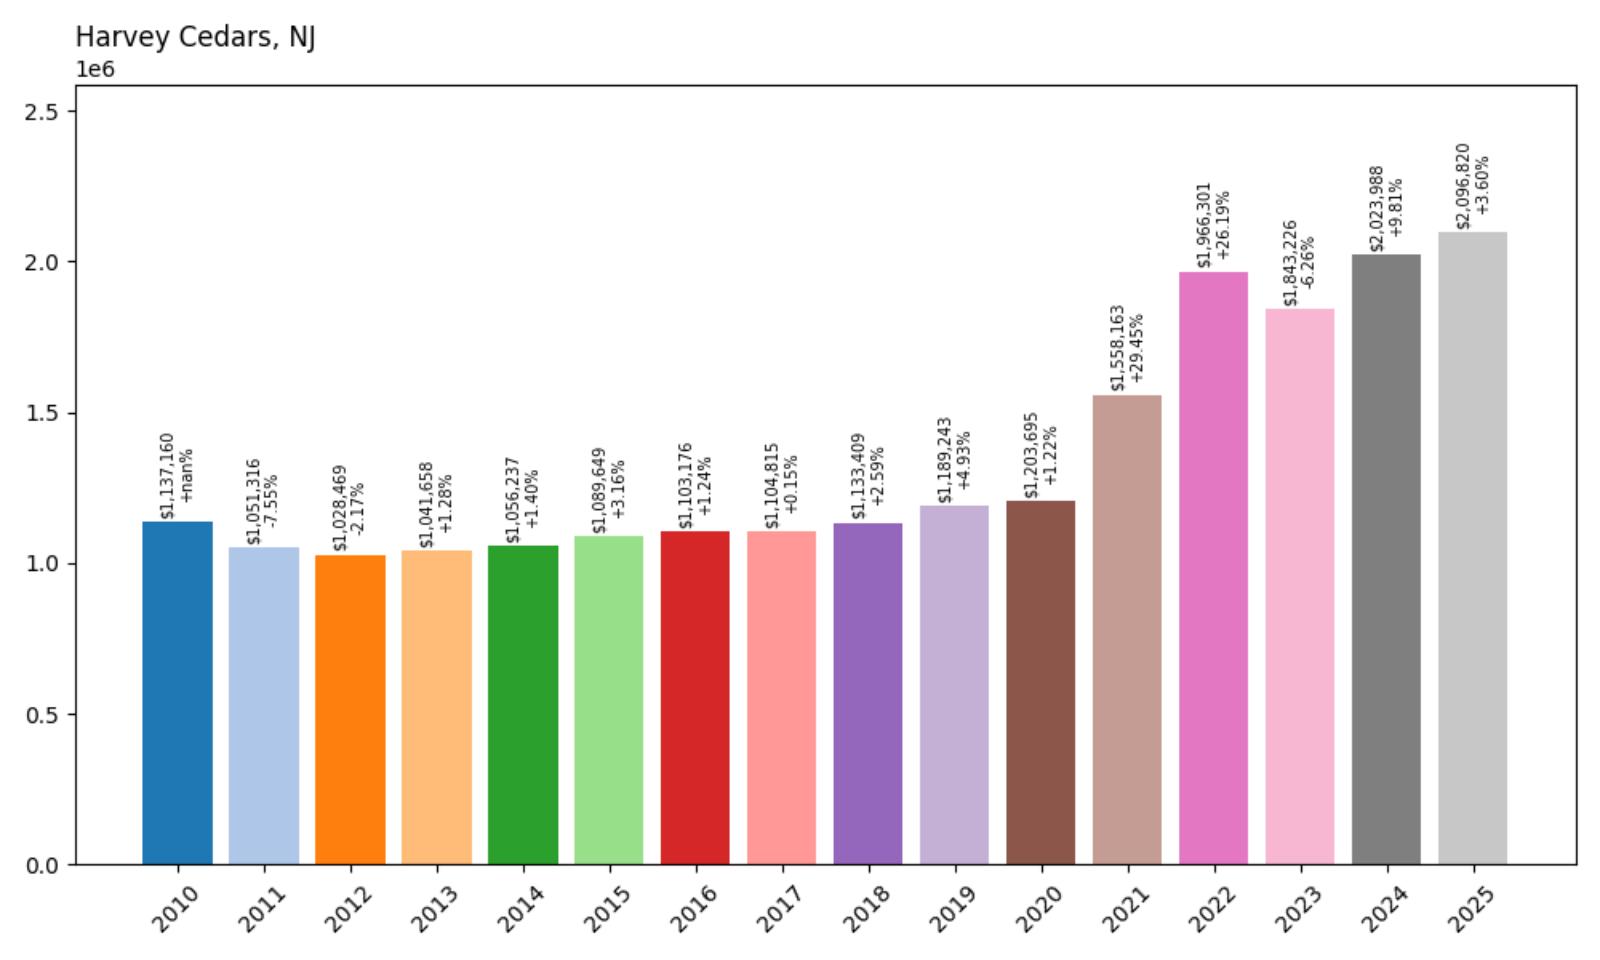
- 2010: $1,137,160
- 2011: $1,051,316 (−$85,844, −7.55% from previous year)
- 2012: $1,028,469 (−$22,847, −2.17% from previous year)
- 2013: $1,041,658 (+$13,190, +1.28% from previous year)
- 2014: $1,056,237 (+$14,579, +1.40% from previous year)
- 2015: $1,089,649 (+$33,412, +3.16% from previous year)
- 2016: $1,103,176 (+$13,527, +1.24% from previous year)
- 2017: $1,104,815 (+$1,638, +0.15% from previous year)
- 2018: $1,133,409 (+$28,594, +2.59% from previous year)
- 2019: $1,189,243 (+$55,834, +4.93% from previous year)
- 2020: $1,203,695 (+$14,452, +1.22% from previous year)
- 2021: $1,558,163 (+$354,469, +29.45% from previous year)
- 2022: $1,966,301 (+$408,138, +26.19% from previous year)
- 2023: $1,843,226 (−$123,075, −6.26% from previous year)
- 2024: $2,023,988 (+$180,762, +9.81% from previous year)
- 2025: $2,096,820 (+$72,832, +3.60% from previous year)
Home prices in Harvey Cedars have risen dramatically since 2010, with an 84% increase amounting to nearly $960,000 in growth. The town saw modest price movement in the early 2010s, with slight dips through 2012 followed by incremental gains until 2020. A dramatic surge arrived in 2021 and 2022, adding more than $760,000 in just two years. While prices dipped in 2023, they quickly rebounded in 2024 and continued to climb into 2025, reflecting sustained buyer demand and long-term appreciation.
Harvey Cedars – Small-Town Prestige with Oceanfront Appeal
Located in the northern half of Long Beach Island, Harvey Cedars is one of the most exclusive seaside enclaves in New Jersey. With a population of just a few hundred year-round residents, it transforms in summer into a haven for second-home owners and affluent vacationers. The housing stock skews heavily toward custom-built luxury properties, many with direct ocean or bay frontage, which helps explain the town’s sky-high home values. Its limited inventory and geographic constraints have led to tight supply and fierce competition when homes do come on the market.
The real estate market here saw explosive growth during and after the pandemic, as remote workers and high-income buyers sought private coastal retreats. The twin surges in 2021 and 2022 added over $760,000 to median values, making Harvey Cedars one of the strongest appreciating markets on the Jersey Shore. Even a pullback in 2023 wasn’t enough to break its upward trajectory, with 2024 and 2025 quickly regaining the momentum. With its quiet charm, low density, and incredible shoreline access, Harvey Cedars continues to rank as one of New Jersey’s most desirable and expensive places to live.
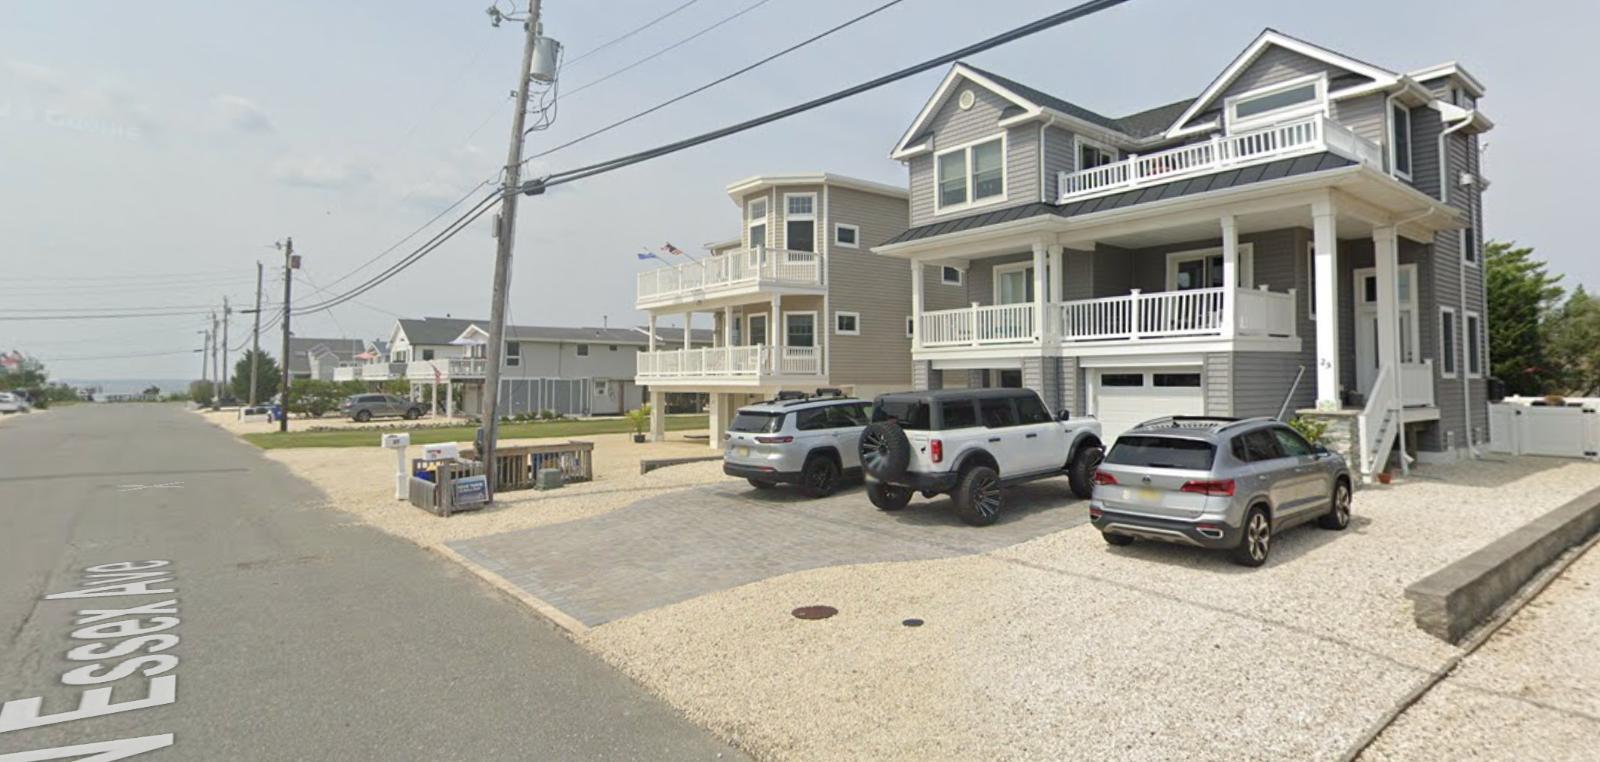
11. Rumson – 90.53% Home Price Increase Since 2010
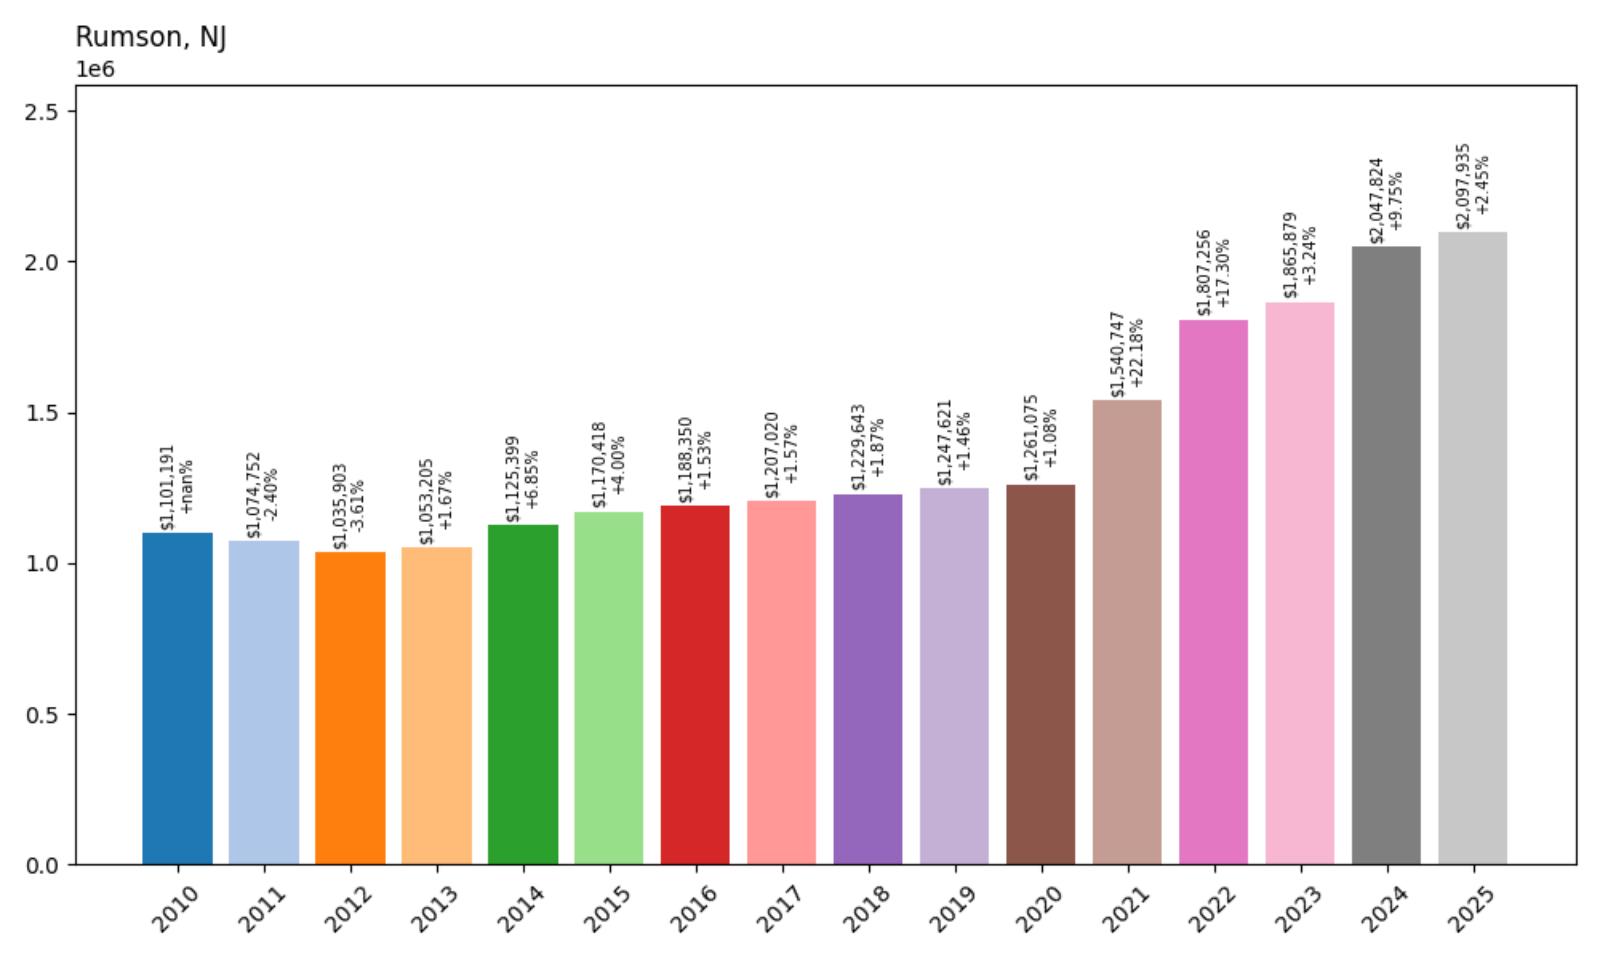
- 2010: $1,101,191
- 2011: $1,074,752 (−$26,439, −2.40% from previous year)
- 2012: $1,035,903 (−$38,849, −3.61% from previous year)
- 2013: $1,053,205 (+$17,301, +1.67% from previous year)
- 2014: $1,125,399 (+$72,194, +6.85% from previous year)
- 2015: $1,170,418 (+$45,019, +4.00% from previous year)
- 2016: $1,188,350 (+$17,931, +1.53% from previous year)
- 2017: $1,207,020 (+$18,671, +1.57% from previous year)
- 2018: $1,229,643 (+$22,622, +1.87% from previous year)
- 2019: $1,247,621 (+$17,979, +1.46% from previous year)
- 2020: $1,261,075 (+$13,454, +1.08% from previous year)
- 2021: $1,540,747 (+$279,671, +22.18% from previous year)
- 2022: $1,807,256 (+$266,509, +17.30% from previous year)
- 2023: $1,865,879 (+$58,623, +3.24% from previous year)
- 2024: $2,047,824 (+$181,945, +9.75% from previous year)
- 2025: $2,097,935 (+$50,111, +2.45% from previous year)
Home prices in Rumson have nearly doubled since 2010, climbing by $996,744 — an impressive 90.5% increase. The early 2010s were relatively flat, with prices hovering around $1.1 million. But beginning in 2021, the market saw a dramatic spike, adding over half a million dollars in just two years. Despite a slight cooling after 2022, the upward momentum resumed in 2024 and continued into 2025, with values now approaching $2.1 million. This trajectory underscores the strength of buyer demand in one of New Jersey’s most prestigious zip codes.
Rumson – A Wealthy Enclave with Generational Appeal
Rumson is one of Monmouth County’s crown jewels, known for its stately homes, riverfront mansions, and quiet, tree-lined streets. With direct access to the Navesink and Shrewsbury Rivers and ferry connections to Manhattan, the town has long attracted affluent commuters and legacy homeowners. Excellent public and private schools, large lot sizes, and a tightly controlled housing inventory keep the market competitive. It’s not uncommon to see multi-million-dollar transactions close quickly, especially when properties offer water views or historic pedigree.
The town’s value trajectory is particularly striking post-2020, when pandemic-era relocations sparked a luxury housing boom. In just five years, Rumson’s home values jumped from $1.2 million to over $2 million, marking it as one of the strongest performers in coastal New Jersey. Unlike more seasonal markets, Rumson’s housing demand is anchored by full-time residents who see the town not just as a retreat, but as a long-term community. That stability, combined with exceptional amenities and limited turnover, helps explain why prices continue to rise even when broader markets slow.
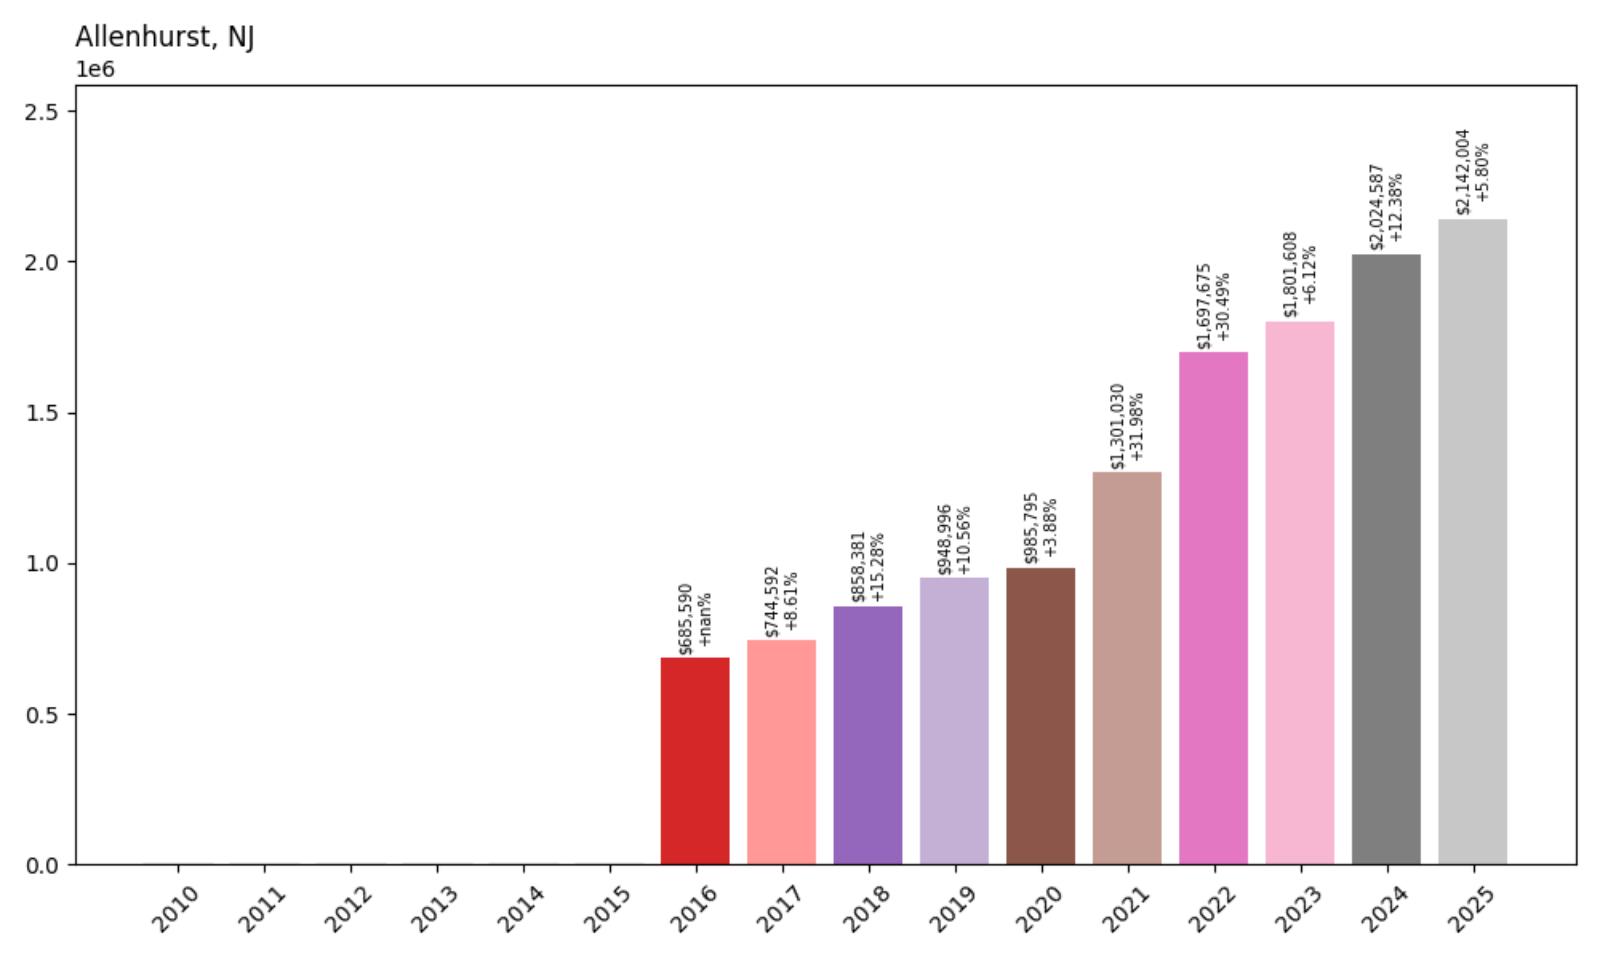
10. Allenhurst – 212.44% Home Price Increase Since 2016
- 2010: N/A
- 2011: N/A
- 2012: N/A
- 2013: N/A
- 2014: N/A
- 2015: N/A
- 2016: $685,590
- 2017: $744,592 (+$59,002, +8.61% from previous year)
- 2018: $858,381 (+$113,789, +15.28% from previous year)
- 2019: $948,996 (+$90,615, +10.56% from previous year)
- 2020: $985,795 (+$36,798, +3.88% from previous year)
- 2021: $1,301,030 (+$315,236, +31.98% from previous year)
- 2022: $1,697,675 (+$396,645, +30.49% from previous year)
- 2023: $1,801,608 (+$103,932, +6.12% from previous year)
- 2024: $2,024,587 (+$222,979, +12.38% from previous year)
- 2025: $2,142,004 (+$117,417, +5.80% from previous year)
Allenhurst’s home prices have soared by over 212% between 2016 and 2025, rising from $685,590 to $2,142,004. After a consistent climb in the late 2010s, growth became particularly intense after 2020, with a remarkable 32% jump in 2021 followed by another 30% gain in 2022. The pace tapered slightly in subsequent years, but values still climbed to over $2.1 million by 2025. These gains stand out sharply in a town where values remained flat or unavailable in the early 2010s, signaling how recent demand has reshaped the market. For buyers, the surge reflects rising scarcity and a premium location along the coast.
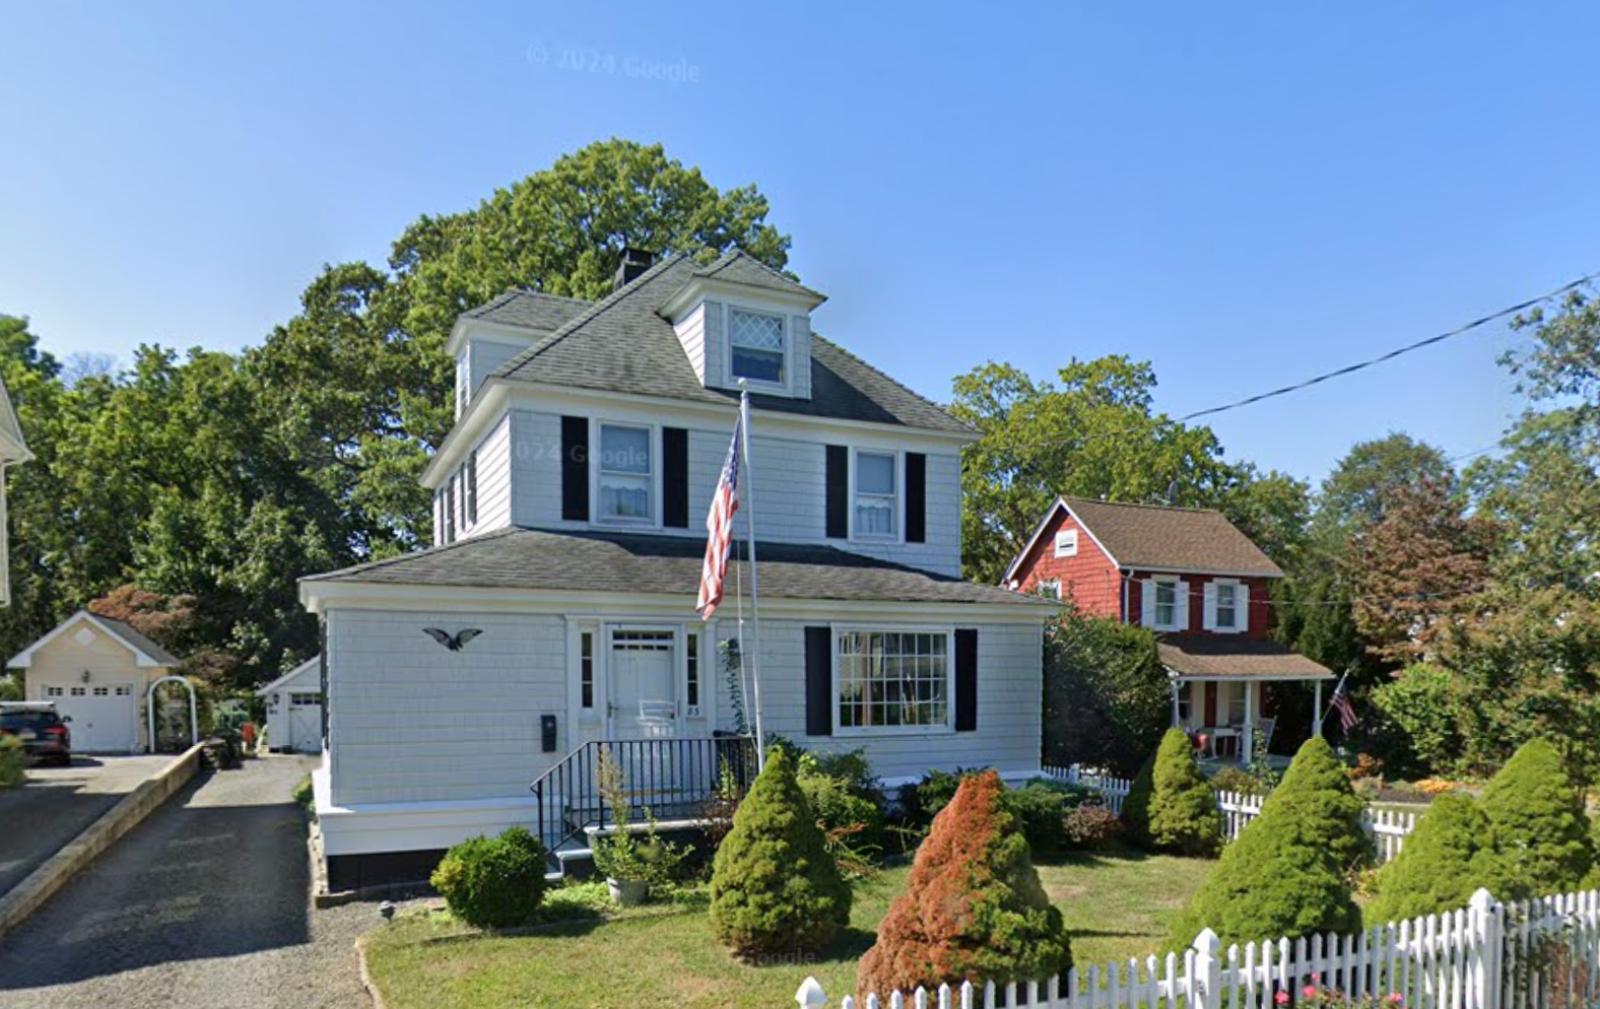
Allenhurst – Coastal Appeal Meets Exclusive Market Pressure
Located in Monmouth County along the Jersey Shore, Allenhurst is a small, elegant borough known for its historic charm and oceanfront access. Its proximity to both Asbury Park and Manhattan makes it a rare blend of coastal serenity and commuter convenience. What truly sets Allenhurst apart is its inventory — or rather, the lack of it. The borough has a tiny footprint and a historic district filled with stately homes, leaving little room for new development. As a result, any shift in demand—like the one seen post-2020—leads to outsized impacts on home prices.
The recent triple-digit gains can be partially attributed to wealthy buyers seeking second homes in exclusive beach towns, particularly during and after the pandemic when remote work allowed affluent families to relocate. Allenhurst, with its manicured streets, private beach clubs, and Gilded Age mansions, fit that bill perfectly. With fewer than 500 residents and extremely low housing turnover, even modest competition among buyers can inflate prices rapidly. That’s clearly been the case in the past five years, cementing Allenhurst’s position as one of New Jersey’s most elite and expensive enclaves.
9. Saddle River – 62.90% Increase in Home Prices Since 2010
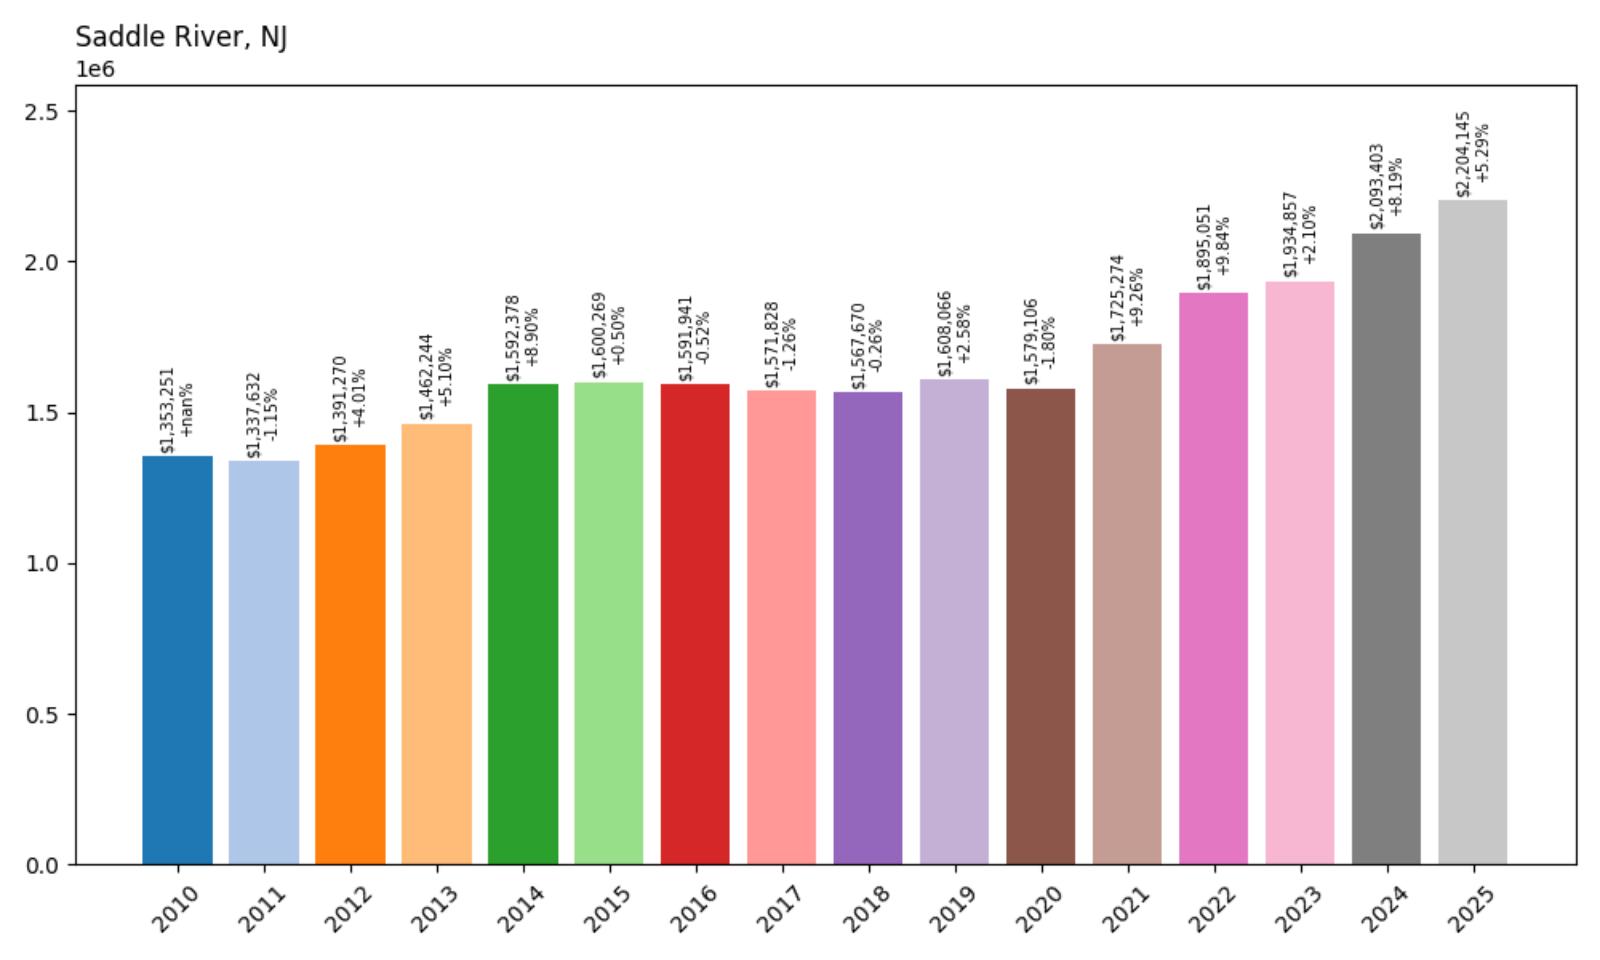
- 2010: $1,353,251
- 2011: $1,337,632 (−$15,619, −1.15% from previous year)
- 2012: $1,391,270 (+$53,639, +4.01% from previous year)
- 2013: $1,462,244 (+$70,973, +5.10% from previous year)
- 2014: $1,592,378 (+$130,134, +8.90% from previous year)
- 2015: $1,600,269 (+$7,891, +0.50% from previous year)
- 2016: $1,591,941 (−$8,327, −0.52% from previous year)
- 2017: $1,571,828 (−$20,113, −1.26% from previous year)
- 2018: $1,567,670 (−$4,158, −0.26% from previous year)
- 2019: $1,608,066 (+$40,395, +2.58% from previous year)
- 2020: $1,579,106 (−$28,959, −1.80% from previous year)
- 2021: $1,725,274 (+$146,167, +9.26% from previous year)
- 2022: $1,895,051 (+$169,778, +9.84% from previous year)
- 2023: $1,934,857 (+$39,806, +2.10% from previous year)
- 2024: $2,093,403 (+$158,546, +8.19% from previous year)
- 2025: $2,204,145 (+$110,742, +5.29% from previous year)
Saddle River has seen home values grow by 62.90% from 2010 to 2025, rising from just over $1.35 million to more than $2.2 million. While growth was uneven—especially during the mid-2010s when values dipped slightly—the last few years have shown renewed upward momentum. The sharpest gains occurred from 2020 onward, with home prices rising more than $600,000 in just five years. This surge reflects the ongoing demand for privacy, estate-sized properties, and luxurious suburban living near New York City.
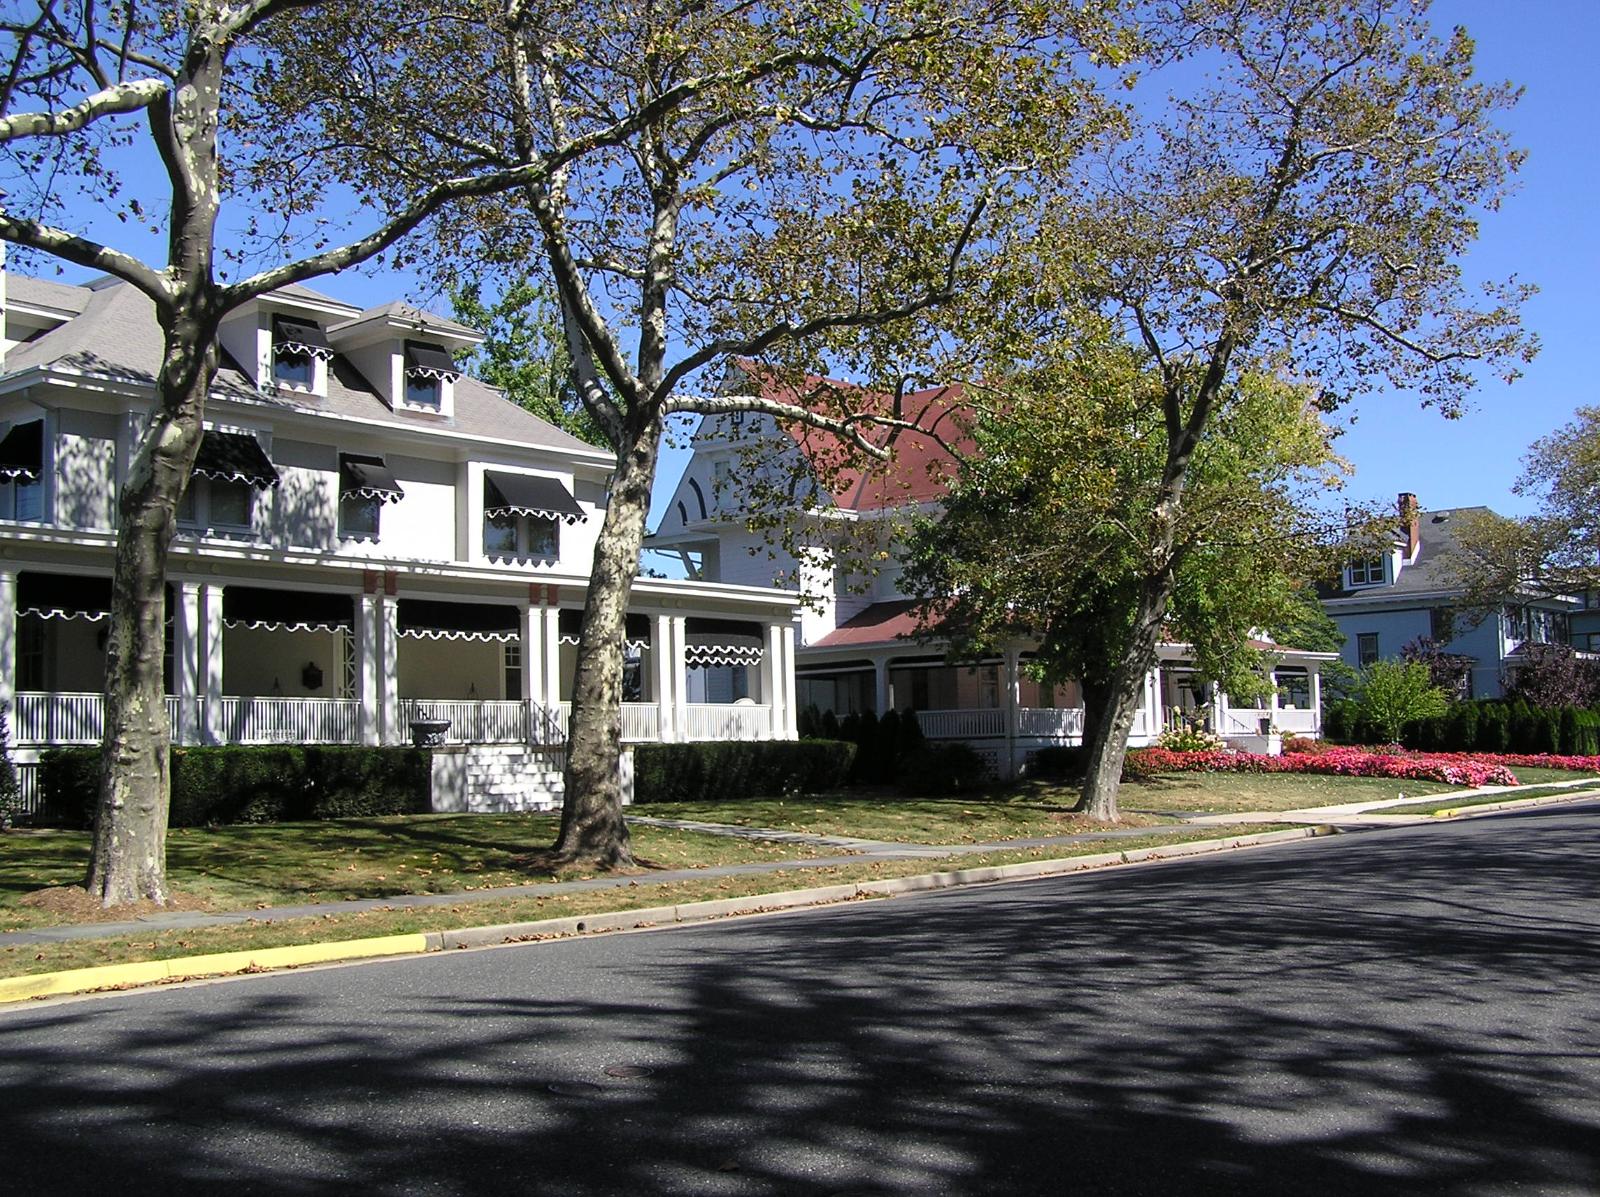
Saddle River – Luxury Estates and Timeless Prestige
Saddle River represents one of New Jersey’s most prestigious residential enclaves, characterized by sprawling properties, equestrian zoning, and a deep-rooted tradition of wealth and exclusivity. Unlike many neighboring towns that have densified over the years, Saddle River has maintained strict zoning that favors large single-family homes on multi-acre lots. This intentional planning has preserved the rural charm and estate atmosphere that continues to attract high-net-worth individuals, celebrities, and C-suite executives.
Despite occasional soft spots in its market, Saddle River has proven remarkably resilient. Its proximity to Manhattan—just over 25 miles—adds to its appeal for buyers seeking privacy without sacrificing access to the city. The town’s housing stock includes everything from modern mansions with luxury amenities to stately colonial and Tudor estates. In the post-pandemic era, the town benefitted from an intensified desire for space, security, and home-office capability, all of which Saddle River offers in abundance. The robust price recovery and continued appreciation through 2025 underline its ongoing status as a crown jewel in Bergen County real estate.
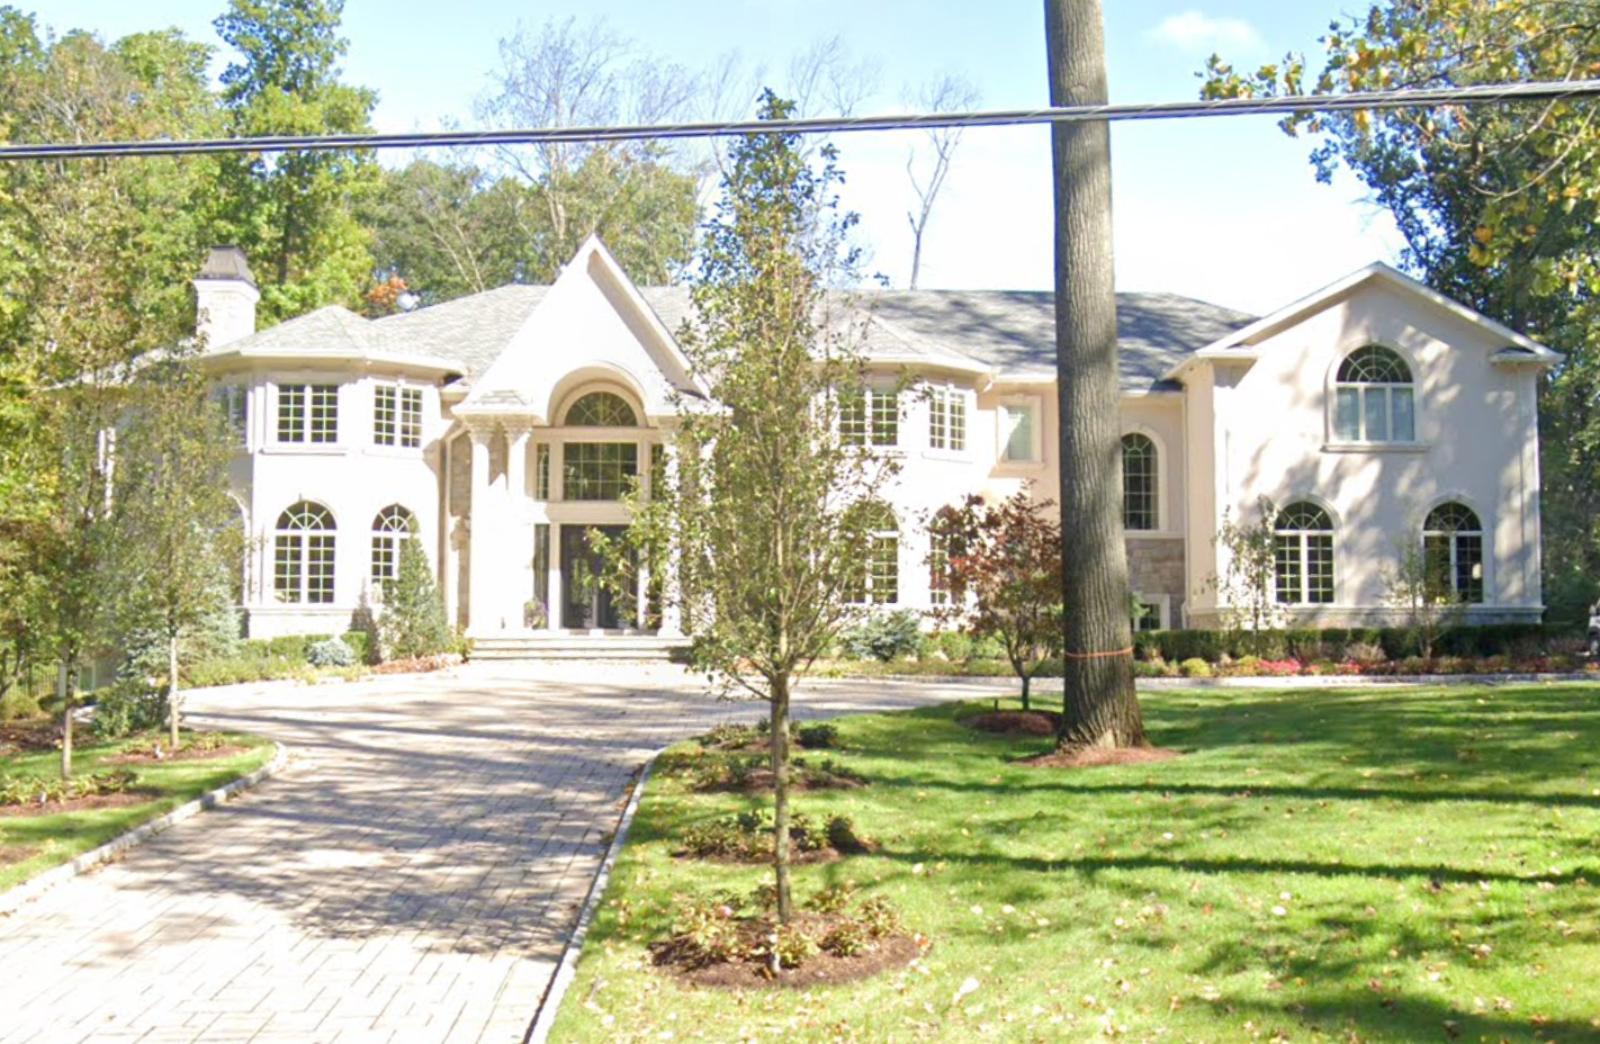
8. Bay Head – 89.94% Increase in Home Prices Since 2010
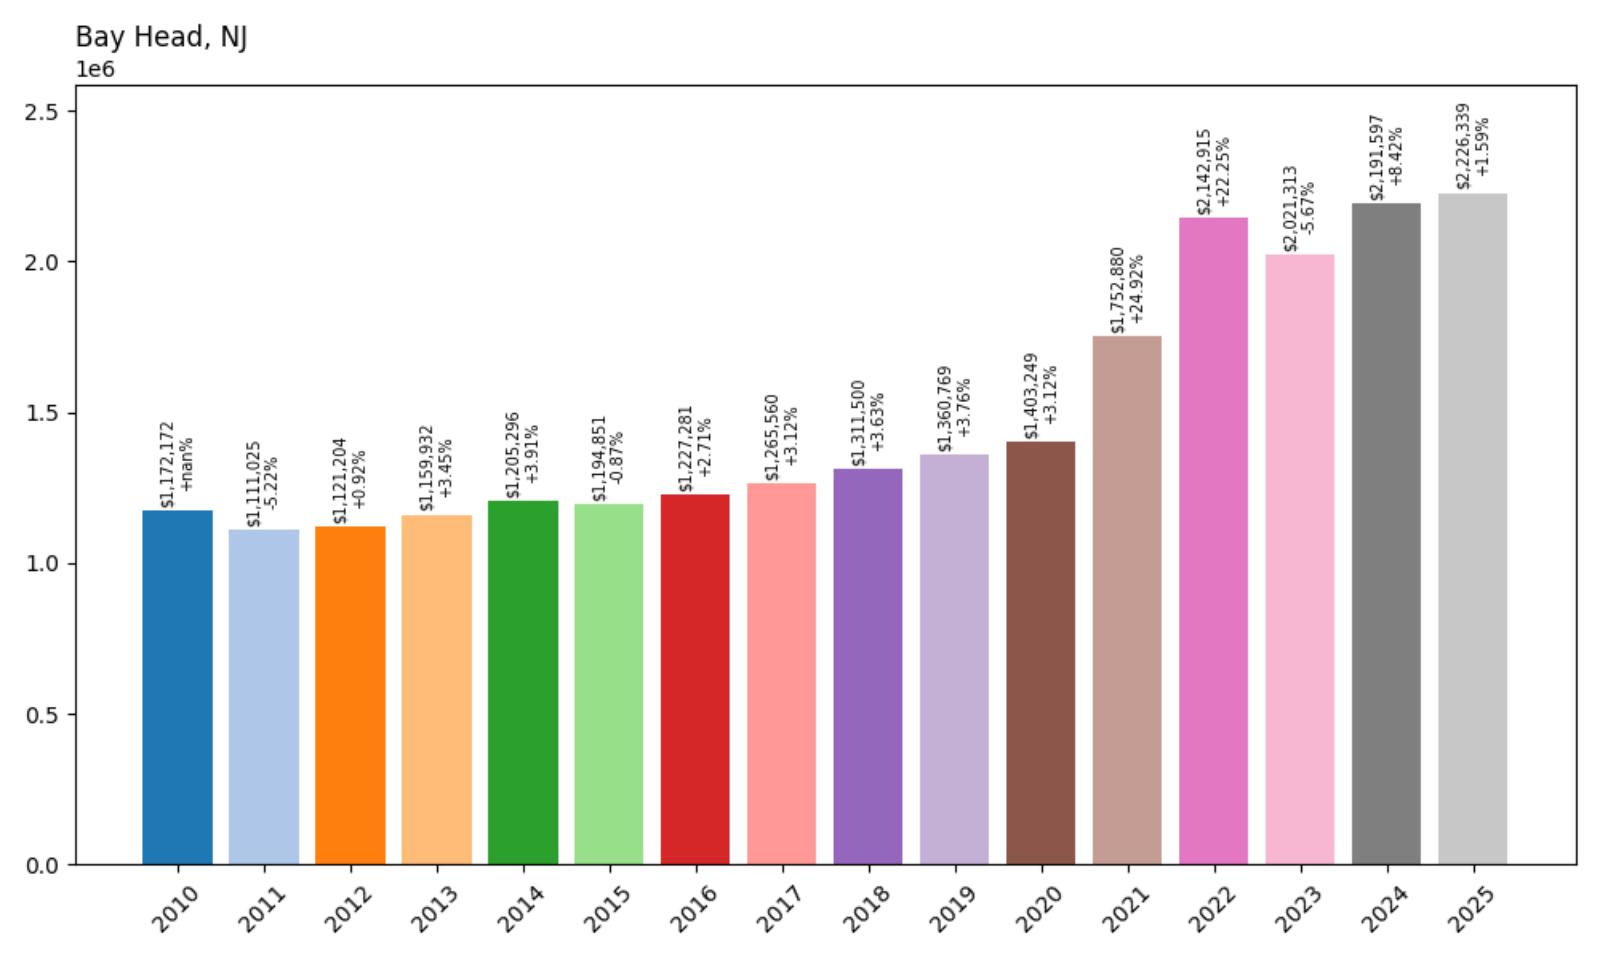
- 2010: $1,172,172
- 2011: $1,111,025 (−$61,147, −5.22% from previous year)
- 2012: $1,121,204 (+$10,179, +0.92% from previous year)
- 2013: $1,159,932 (+$38,728, +3.45% from previous year)
- 2014: $1,205,296 (+$45,364, +3.91% from previous year)
- 2015: $1,194,851 (−$10,444, −0.87% from previous year)
- 2016: $1,227,281 (+$32,430, +2.71% from previous year)
- 2017: $1,265,560 (+$38,279, +3.12% from previous year)
- 2018: $1,311,500 (+$45,940, +3.63% from previous year)
- 2019: $1,360,769 (+$49,269, +3.76% from previous year)
- 2020: $1,403,249 (+$42,480, +3.12% from previous year)
- 2021: $1,752,880 (+$349,630, +24.92% from previous year)
- 2022: $2,142,915 (+$390,036, +22.25% from previous year)
- 2023: $2,021,313 (−$121,602, −5.67% from previous year)
- 2024: $2,191,597 (+$170,283, +8.42% from previous year)
- 2025: $2,226,339 (+$34,742, +1.59% from previous year)
Bay Head has experienced an 89.94% increase in home values from 2010 to 2025, with the average home rising from approximately $1.17 million to over $2.22 million. The market showed steady growth through the 2010s, followed by a dramatic price spike in 2021 and 2022, when values surged by over $739,000 across just two years. Though 2023 brought a slight correction, the market rebounded in the subsequent years. These movements highlight both the volatility and strength of high-end coastal markets in New Jersey’s Monmouth and Ocean County corridor.
Bay Head – Coastal Luxury with Timeless Charm
Bay Head is a small but prestigious borough along the Jersey Shore, known for its upscale beach homes, tree-lined streets, and yacht-filled marinas. It has long attracted affluent buyers seeking a quieter, more refined alternative to New Jersey’s more commercial coastal towns. Much of the local architecture reflects classic New England influences, with many homes featuring wraparound porches, gabled roofs, and sweeping Atlantic Ocean views. The town is deeply committed to preserving its historic character, and that exclusivity helps support its consistently high home values.
Despite fluctuations in annual price growth, the long-term appeal of Bay Head has remained strong. Its limited housing inventory and protected beachfront land create enduring supply constraints that drive up prices. Many buyers here are second-homeowners or cash buyers from the tri-state area, drawn not just by the surf and sand, but also by the town’s tranquil atmosphere and easy access via NJ Transit rail service. As demand for shore properties intensified post-2020, Bay Head became one of the biggest beneficiaries, with values soaring to record highs. Even with recent market normalization, its fundamentals remain rock-solid.
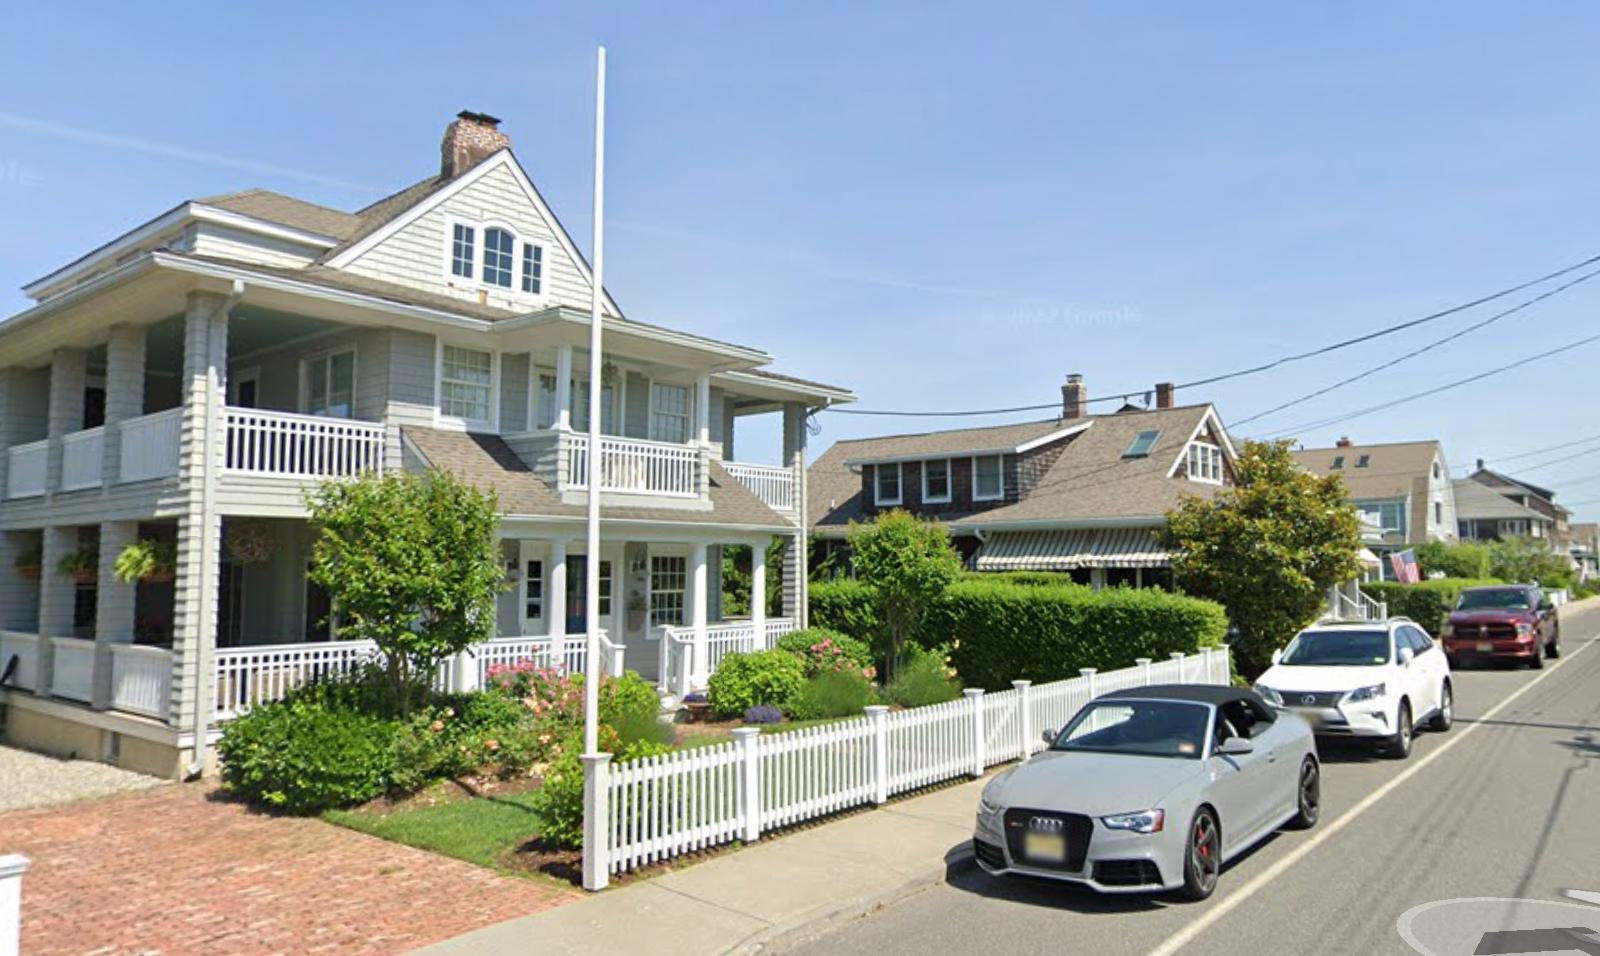
7. Sea Girt – 139.28% Increase in Home Prices Since 2010
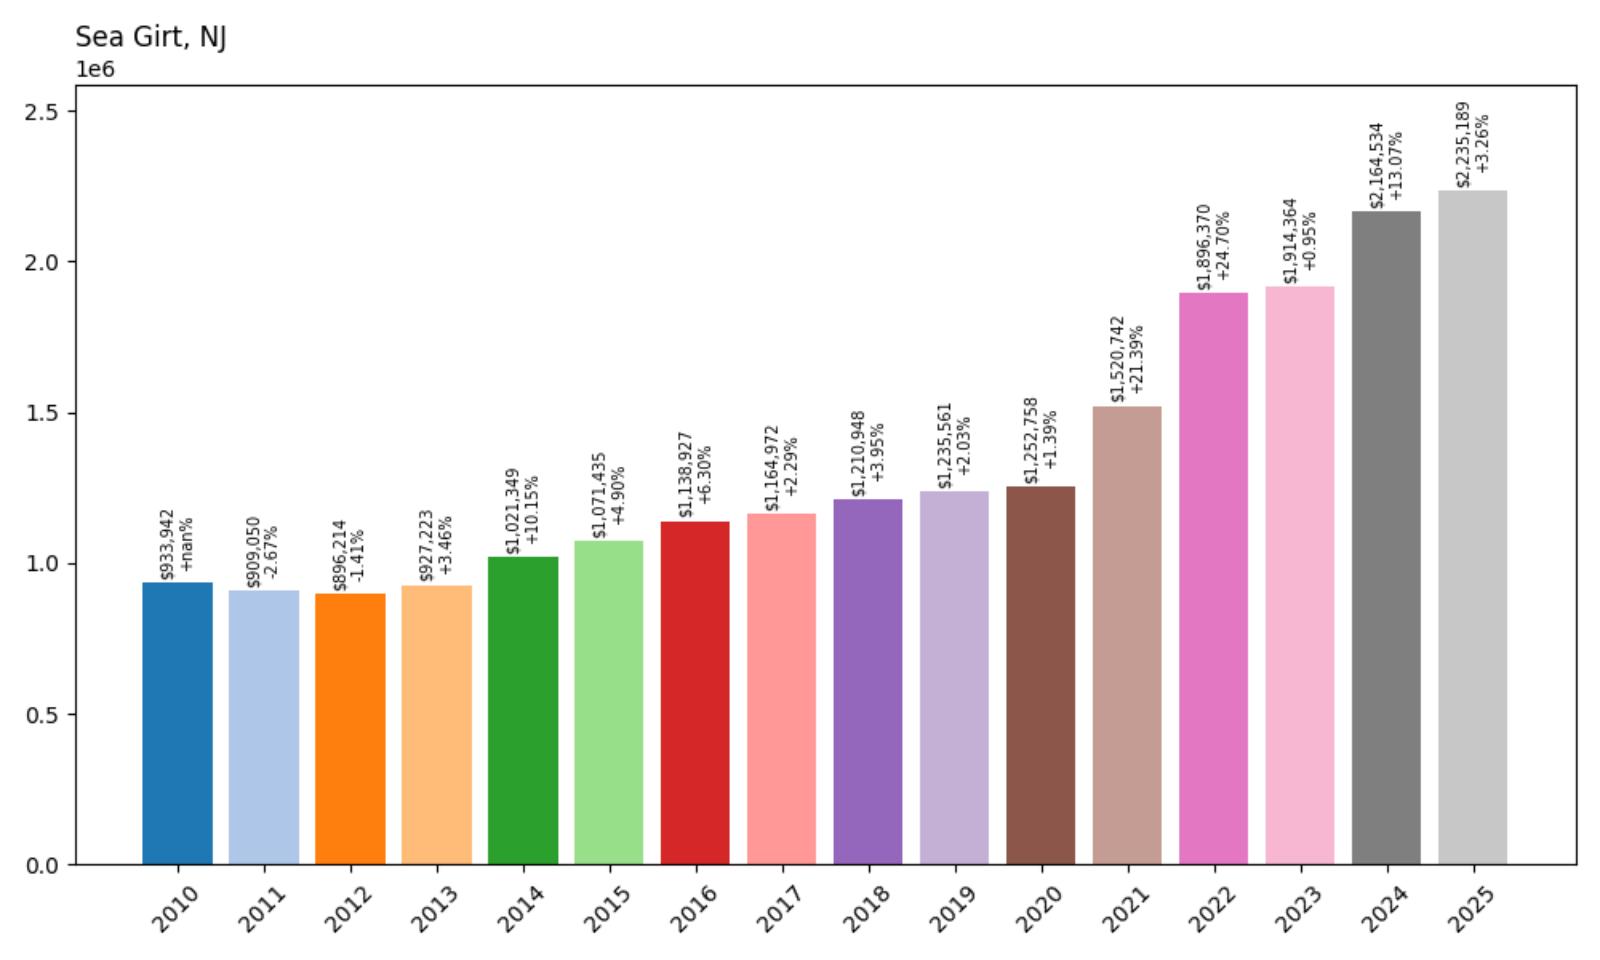
- 2010: $933,942
- 2011: $909,050 (−$24,891, −2.67% from previous year)
- 2012: $896,214 (−$12,836, −1.41% from previous year)
- 2013: $927,223 (+$31,009, +3.46% from previous year)
- 2014: $1,021,349 (+$94,127, +10.15% from previous year)
- 2015: $1,071,435 (+$50,085, +4.90% from previous year)
- 2016: $1,138,927 (+$67,492, +6.30% from previous year)
- 2017: $1,164,972 (+$26,045, +2.29% from previous year)
- 2018: $1,210,948 (+$45,976, +3.95% from previous year)
- 2019: $1,235,561 (+$24,613, +2.03% from previous year)
- 2020: $1,252,758 (+$17,197, +1.39% from previous year)
- 2021: $1,520,742 (+$267,984, +21.39% from previous year)
- 2022: $1,896,370 (+$375,627, +24.70% from previous year)
- 2023: $1,914,364 (+$17,995, +0.95% from previous year)
- 2024: $2,164,534 (+$250,169, +13.07% from previous year)
- 2025: $2,235,189 (+$70,656, +3.26% from previous year)
Since 2010, home values in Sea Girt have soared by a remarkable 139.28%, reflecting the borough’s evolution into one of the most exclusive destinations on the New Jersey coast. The market showed moderate growth through the mid-2010s, followed by explosive gains starting in 2020. Prices leapt from $1.25 million to over $1.89 million in just two years during the pandemic-driven real estate surge. Even after that peak, values continued climbing, landing at over $2.23 million in 2025. This consistent upward trend highlights both investor confidence and lifestyle-driven demand for homes in this idyllic borough.
Sea Girt – Prestigious, Private, and Peaceful
Sea Girt occupies a rarefied spot along the Jersey Shore, attracting discerning buyers with its perfect blend of beachside serenity and small-town elegance. The town features immaculate tree-lined streets, expansive homes, and a laid-back pace that appeals to those seeking a quiet escape from metropolitan chaos. Its namesake boardwalk is a local gem, stretching along pristine beaches, while the town’s historic lighthouse and boutique shops enhance its timeless charm. Strict development rules and limited inventory keep competition high, with buyers often paying premiums for even modest properties that align with the borough’s prestigious identity.
Schools in Sea Girt are highly rated, and the town is a magnet for high-income professionals and second-home buyers alike. Its location—within two hours of New York City—makes it accessible for weekenders while still feeling worlds away. As remote and hybrid work models have gained popularity, more families are planting permanent roots here, pushing home prices even higher. With limited room for new construction and a loyal base of longtime residents, Sea Girt’s housing market remains resilient, exclusive, and emblematic of the kind of real estate security high-end buyers seek along the Atlantic coast.
6. Short Hills – 80.46% Increase in Home Prices Since 2010
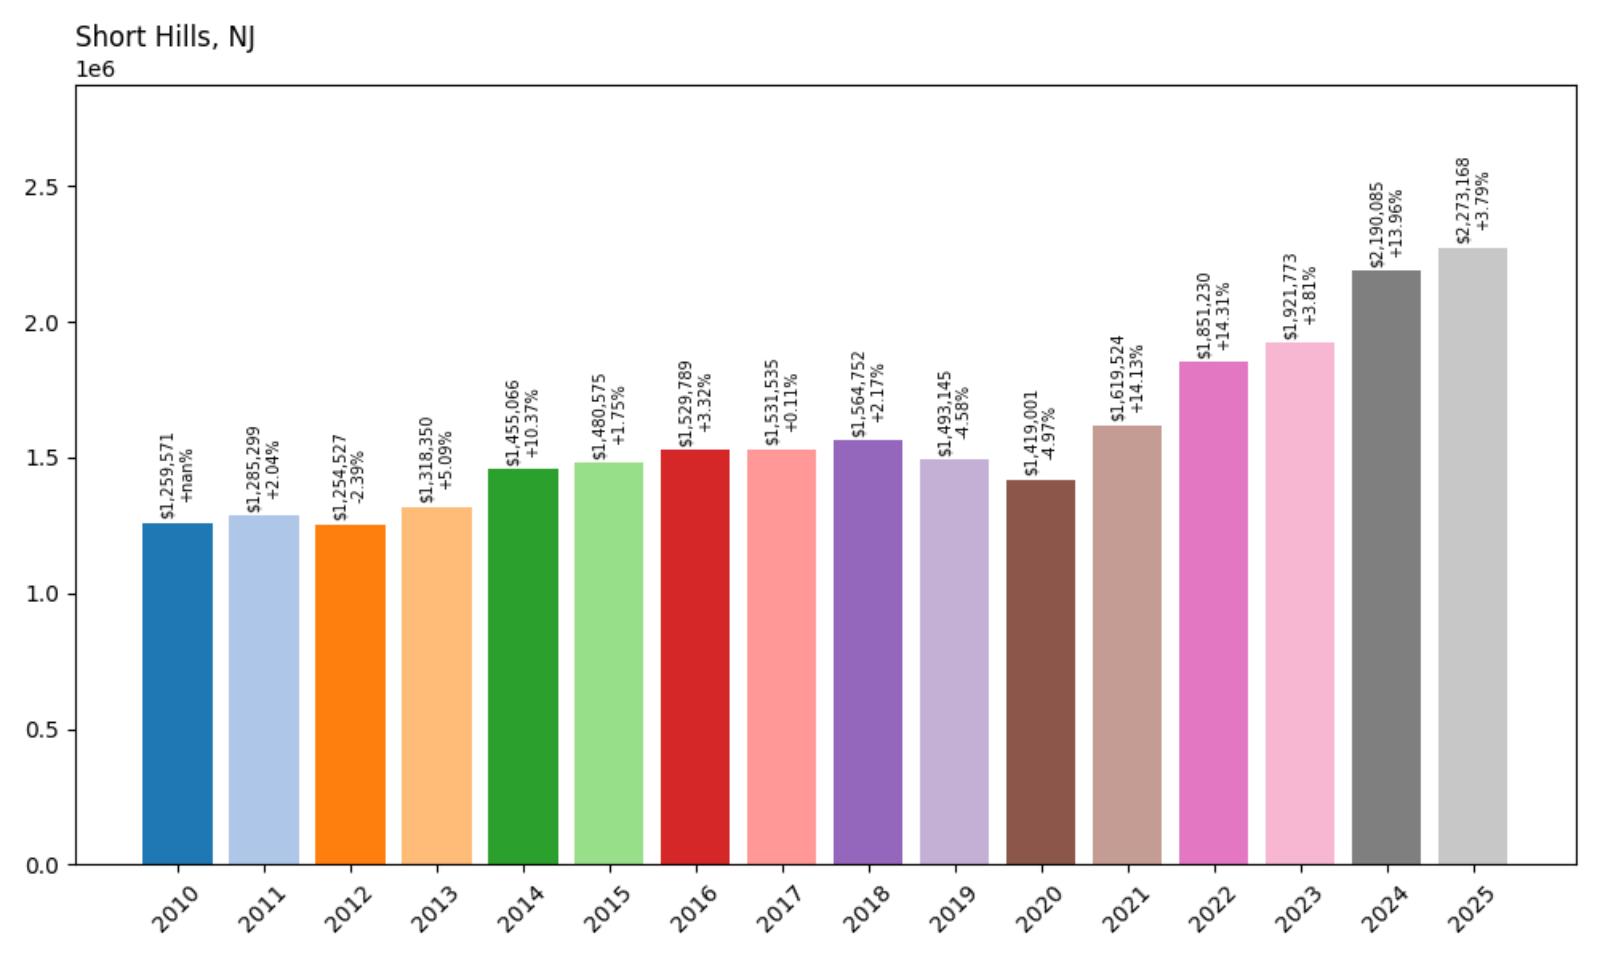
- 2010: $1,259,571
- 2011: $1,285,299 (+$25,728, +2.04% from previous year)
- 2012: $1,254,527 (−$30,773, −2.39% from previous year)
- 2013: $1,318,350 (+$63,823, +5.09% from previous year)
- 2014: $1,455,066 (+$136,716, +10.37% from previous year)
- 2015: $1,480,575 (+$25,509, +1.75% from previous year)
- 2016: $1,529,789 (+$49,213, +3.32% from previous year)
- 2017: $1,531,535 (+$1,747, +0.11% from previous year)
- 2018: $1,564,752 (+$33,217, +2.17% from previous year)
- 2019: $1,493,145 (−$71,607, −4.58% from previous year)
- 2020: $1,419,001 (−$74,144, −4.97% from previous year)
- 2021: $1,619,524 (+$200,522, +14.13% from previous year)
- 2022: $1,851,230 (+$231,706, +14.31% from previous year)
- 2023: $1,921,773 (+$70,543, +3.81% from previous year)
- 2024: $2,190,085 (+$268,313, +13.96% from previous year)
- 2025: $2,273,168 (+$83,082, +3.79% from previous year)
Short Hills has long been a symbol of affluence in New Jersey, and its home price trajectory from 2010 to 2025 reinforces its elite status. Prices climbed from $1.26 million in 2010 to over $2.27 million by 2025—a stunning 80.46% increase over 15 years. After some volatility between 2018 and 2020, the market rebounded sharply with a massive $200K jump in 2021 alone. This dramatic surge was followed by consecutive double-digit gains in 2022 and 2024, showcasing robust buyer interest and limited supply. The steady rise even in cooler market years like 2023 and 2025 suggests long-term resilience rooted in the neighborhood’s unmatched desirability.
Short Hills – Legacy Wealth Meets Modern Prestige
Known for its lush landscapes, sprawling estates, and premier public schools, Short Hills is often regarded as one of the top-tier enclaves in the Garden State. Part of Millburn Township, the area benefits from proximity to Midtown Manhattan via the NJ Transit direct line, making it a prime location for executives and professionals who want suburban serenity without sacrificing access to the city. The community’s strong civic institutions, including an active neighborhood association and tight zoning regulations, help preserve the town’s exclusive character and architectural integrity. Homes here aren’t just properties—they’re long-term investments in one of the most prestigious ZIP codes in New Jersey.
Beyond prestige, Short Hills offers amenities that cater to a discerning clientele. From the world-class Mall at Short Hills to proximity to the South Mountain Reservation, residents enjoy both high-end retail and natural beauty. The public school system consistently ranks among the top in the state, further driving demand. While some towns may experience housing cycles, Short Hills remains on a steady upward trajectory thanks to its limited inventory, historic charm, and continual influx of high-net-worth buyers. In many ways, it encapsulates what buyers seek in post-pandemic suburbia: privacy, status, and enduring value.
5. Stone Harbor – 145.5% Increase in Home Prices Since 2010
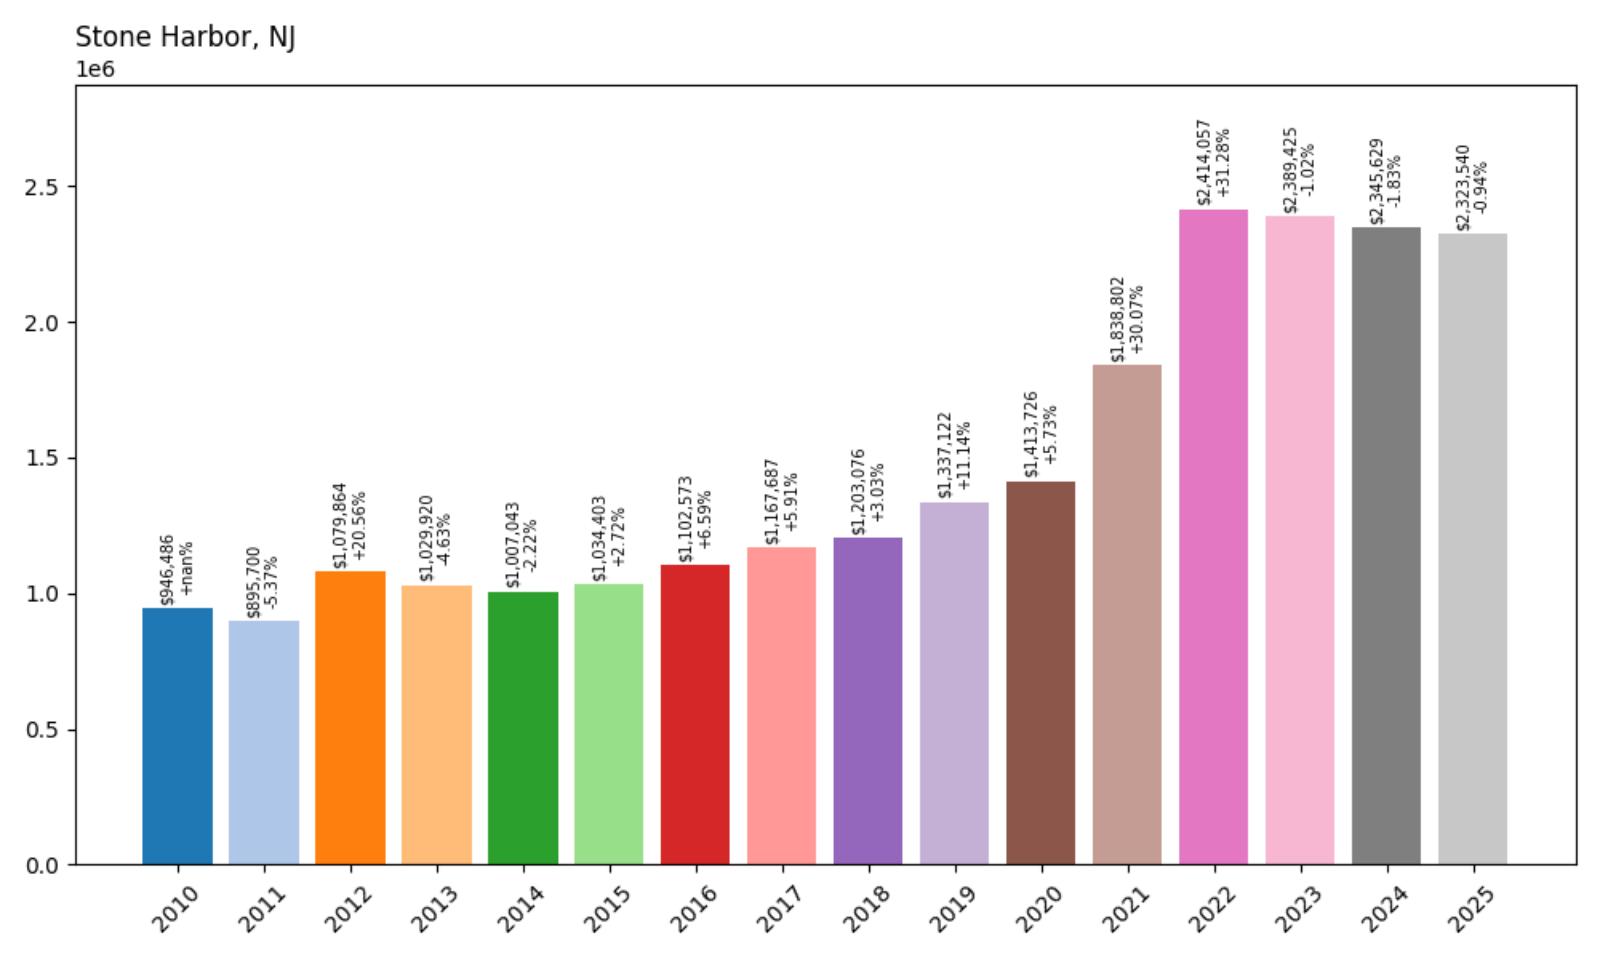
- 2010: $946,486
- 2011: $895,700 (−$50,785, −5.37% from previous year)
- 2012: $1,079,864 (+$184,163, +20.56% from previous year)
- 2013: $1,029,920 (−$49,944, −4.63% from previous year)
- 2014: $1,007,043 (−$22,876, −2.22% from previous year)
- 2015: $1,034,403 (+$27,360, +2.72% from previous year)
- 2016: $1,102,573 (+$68,170, +6.59% from previous year)
- 2017: $1,167,687 (+$65,114, +5.91% from previous year)
- 2018: $1,203,076 (+$35,389, +3.03% from previous year)
- 2019: $1,337,122 (+$134,046, +11.14% from previous year)
- 2020: $1,413,726 (+$76,604, +5.73% from previous year)
- 2021: $1,838,802 (+$425,077, +30.07% from previous year)
- 2022: $2,414,057 (+$575,255, +31.28% from previous year)
- 2023: $2,389,425 (−$24,632, −1.02% from previous year)
- 2024: $2,345,629 (−$43,796, −1.83% from previous year)
- 2025: $2,323,540 (−$22,089, −0.94% from previous year)
Stone Harbor’s real estate market has undergone one of the most significant transformations in New Jersey, with home values increasing by a staggering 145.5% from $946K in 2010 to over $2.32 million in 2025. After a dip in 2011 and again in 2013–2014, the market rebounded strongly with consistent annual appreciation through the rest of the decade. The most dramatic spike came between 2020 and 2022, when prices surged by over $1 million in just two years—fueled by pandemic-era demand for coastal luxury properties. While the last three years have seen modest pullbacks, values remain exceptionally high and reflective of the town’s elite market position.
Stone Harbor – South Jersey’s Jewel of Sophisticated Seaside Living
Located on Seven Mile Island, Stone Harbor is widely considered one of the crown jewels of the Jersey Shore. Its combination of quiet elegance, boutique shopping, and white-sand beaches draws affluent buyers year after year, and the housing market reflects that demand. Unlike some other coastal towns, Stone Harbor offers an upscale experience with strict zoning laws, limited high-density development, and a commitment to preserving its small-town charm. The town’s walkability, peaceful ambiance, and well-maintained residential zones continue to attract second-home buyers from the tri-state area looking for tranquility without sacrificing luxury or convenience.
Stone Harbor’s booming property market has also benefited from high-quality schools, investment in local infrastructure, and the prestige associated with ownership in this exclusive enclave. The town’s careful development planning and scarcity of available land mean that supply remains tight—a dynamic that helps maintain property values even during broader market corrections. Stone Harbor isn’t just another beach town; it’s a destination for generational wealth and legacy properties. With proximity to Avalon and just a short drive from larger resort hubs, the town offers the best of both worlds: refined seclusion with accessible amenities.
4. Avalon – 180.9% Increase in Home Prices Since 2010
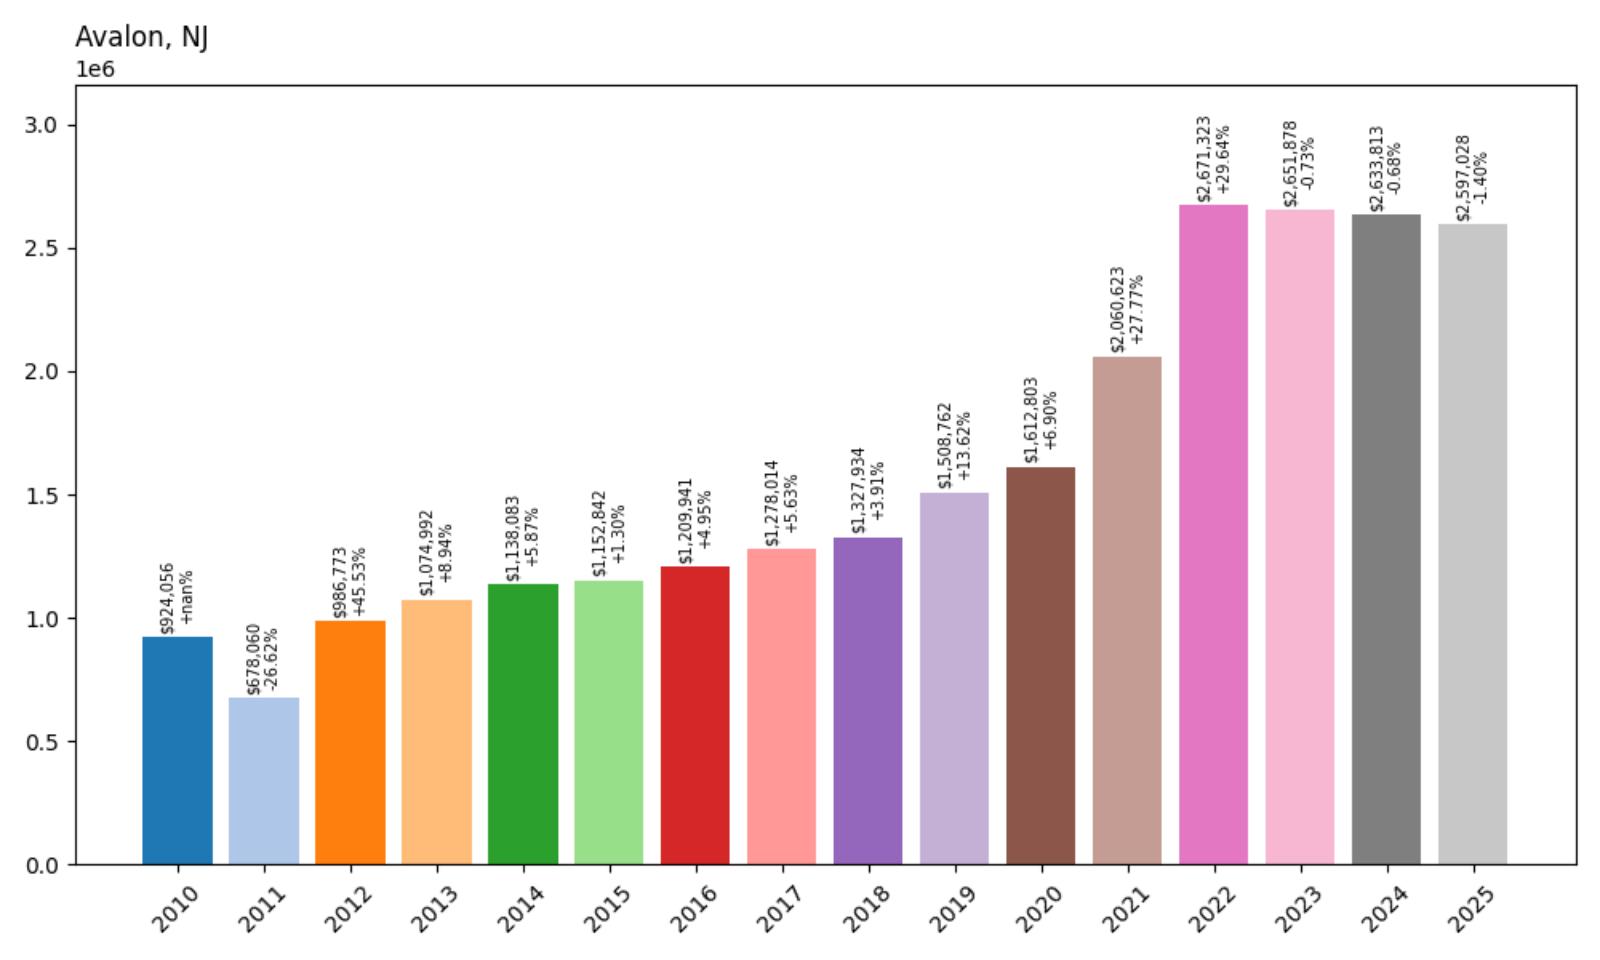
- 2010: $924,056
- 2011: $678,060 (−$245,996, −26.62% from previous year)
- 2012: $986,773 (+$308,713, +45.53% from previous year)
- 2013: $1,074,992 (+$88,219, +8.94% from previous year)
- 2014: $1,138,083 (+$63,092, +5.87% from previous year)
- 2015: $1,152,842 (+$14,758, +1.30% from previous year)
- 2016: $1,209,941 (+$57,100, +4.95% from previous year)
- 2017: $1,278,014 (+$68,072, +5.63% from previous year)
- 2018: $1,327,934 (+$49,920, +3.91% from previous year)
- 2019: $1,508,762 (+$180,828, +13.62% from previous year)
- 2020: $1,612,803 (+$104,041, +6.90% from previous year)
- 2021: $2,060,623 (+$447,820, +27.77% from previous year)
- 2022: $2,671,323 (+$610,700, +29.64% from previous year)
- 2023: $2,651,878 (−$19,444, −0.73% from previous year)
- 2024: $2,633,813 (−$18,065, −0.68% from previous year)
- 2025: $2,597,028 (−$36,785, −1.40% from previous year)
Avalon’s home prices have climbed from $924K in 2010 to nearly $2.6 million in 2025, representing an increase of over 180%. The market experienced extreme volatility in the early 2010s, including a sharp 26.6% decline in 2011, followed by a massive rebound the very next year. This volatility gave way to a more stable upward trend through the rest of the decade, with consistent appreciation and a surge during the pandemic. The years 2021 and 2022 alone saw prices rise by more than $1 million. While values have dipped slightly in the last three years, Avalon remains one of the most coveted and high-value real estate markets in the state.
Avalon – The Epitome of Luxury at the Jersey Shore
Located just south of Stone Harbor on the same barrier island, Avalon is synonymous with luxury, privacy, and premium waterfront living. This upscale beach town is known for its low-density zoning, wide streets, and beautifully landscaped multimillion-dollar homes. Avalon’s real estate market is often considered a bellwether for the broader Jersey Shore, attracting high-net-worth buyers from Philadelphia, New York, and beyond. With few new construction opportunities and intense demand, Avalon’s housing supply remains limited, which puts consistent upward pressure on prices even during cooling market phases.
The town boasts pristine beaches, a charming business district, and a reputation for being impeccably maintained year-round. Avalon is also a popular destination for second-home buyers who are drawn to its quiet elegance and exclusivity. Its proximity to golf clubs, marinas, and fine dining ensures that it appeals to those seeking both leisure and sophistication. The recent plateau in price growth may offer a brief window of opportunity for buyers, but the long-term trajectory suggests that Avalon will continue to be one of New Jersey’s premier luxury destinations for years to come.
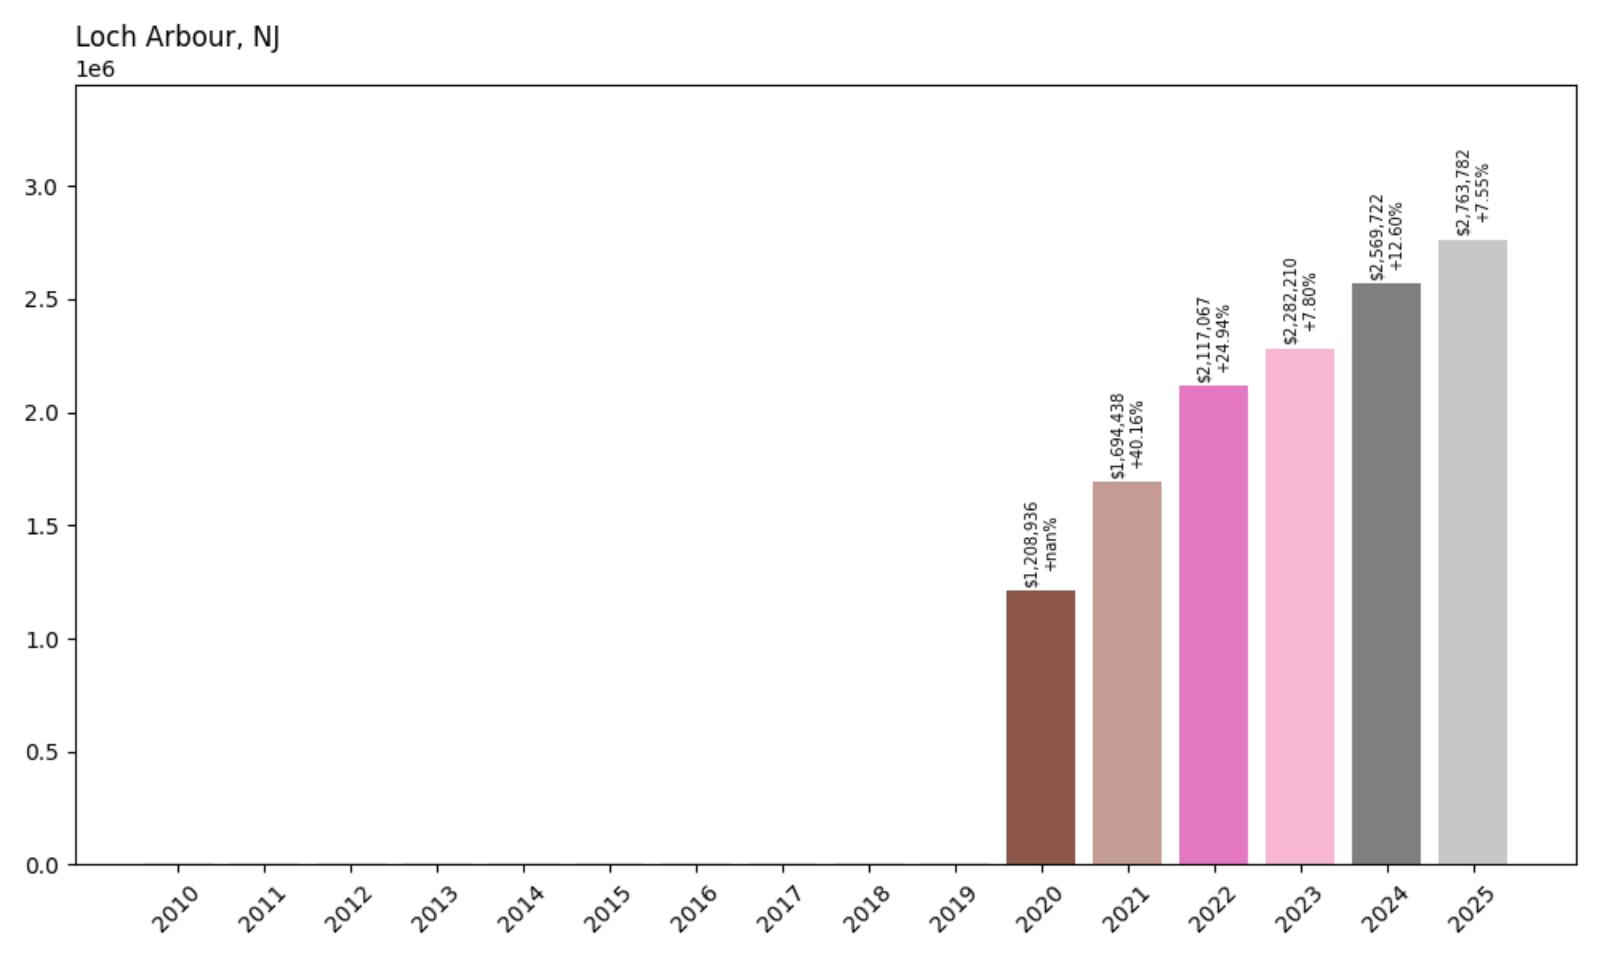
3. Loch Arbour – 128.6% Increase in Home Prices Since 2020
- 2010: $NA
- 2011: $NA
- 2012: $NA
- 2013: $NA
- 2014: $NA
- 2015: $NA
- 2016: $NA
- 2017: $NA
- 2018: $NA
- 2019: $NA
- 2020: $1,208,936
- 2021: $1,694,438 (+$485,502, +40.16% from previous year)
- 2022: $2,117,067 (+$422,629, +24.94% from previous year)
- 2023: $2,282,210 (+$165,143, +7.80% from previous year)
- 2024: $2,569,722 (+$287,512, +12.60% from previous year)
- 2025: $2,763,782 (+$194,060, +7.55% from previous year)
Since 2020, Loch Arbour has experienced a dramatic surge in home prices, nearly doubling in just five years. Starting from $1.2 million, values soared past $2.7 million by 2025—an increase of over 128%. The most explosive growth occurred during the post-pandemic boom in 2021 and 2022, when home values jumped by over $900,000 in just two years. Though the pace of growth has since cooled, the town continues to appreciate at a strong clip, posting steady gains above 7% annually through 2025.
Loch Arbour – A Tiny Enclave with Sky-High Prices
Loch Arbour, one of the smallest municipalities in New Jersey by both area and population, punches far above its weight when it comes to real estate prices. Nestled between Allenhurst and Asbury Park, this charming seaside village boasts just a few dozen homes—but what it lacks in size, it more than makes up for in exclusivity. With direct access to the Atlantic Ocean and a tightly regulated housing supply, properties here are highly sought-after and rarely available. Buyers are typically affluent second-home seekers looking for privacy, beach access, and proximity to upscale amenities without the crowds of larger shore towns.
Despite its minuscule footprint, Loch Arbour offers a unique blend of tranquility and prestige. Its streets are lined with stately homes, manicured lawns, and sweeping views of the water. While the village itself has minimal commercial infrastructure, residents benefit from being minutes away from the restaurants, boutiques, and cultural attractions of neighboring Asbury Park and Deal. The explosive growth in property values post-2020 reflects both heightened demand and the finite nature of Loch Arbour’s housing inventory. For those who can afford it, this tiny borough represents the pinnacle of elite coastal living in Monmouth County.
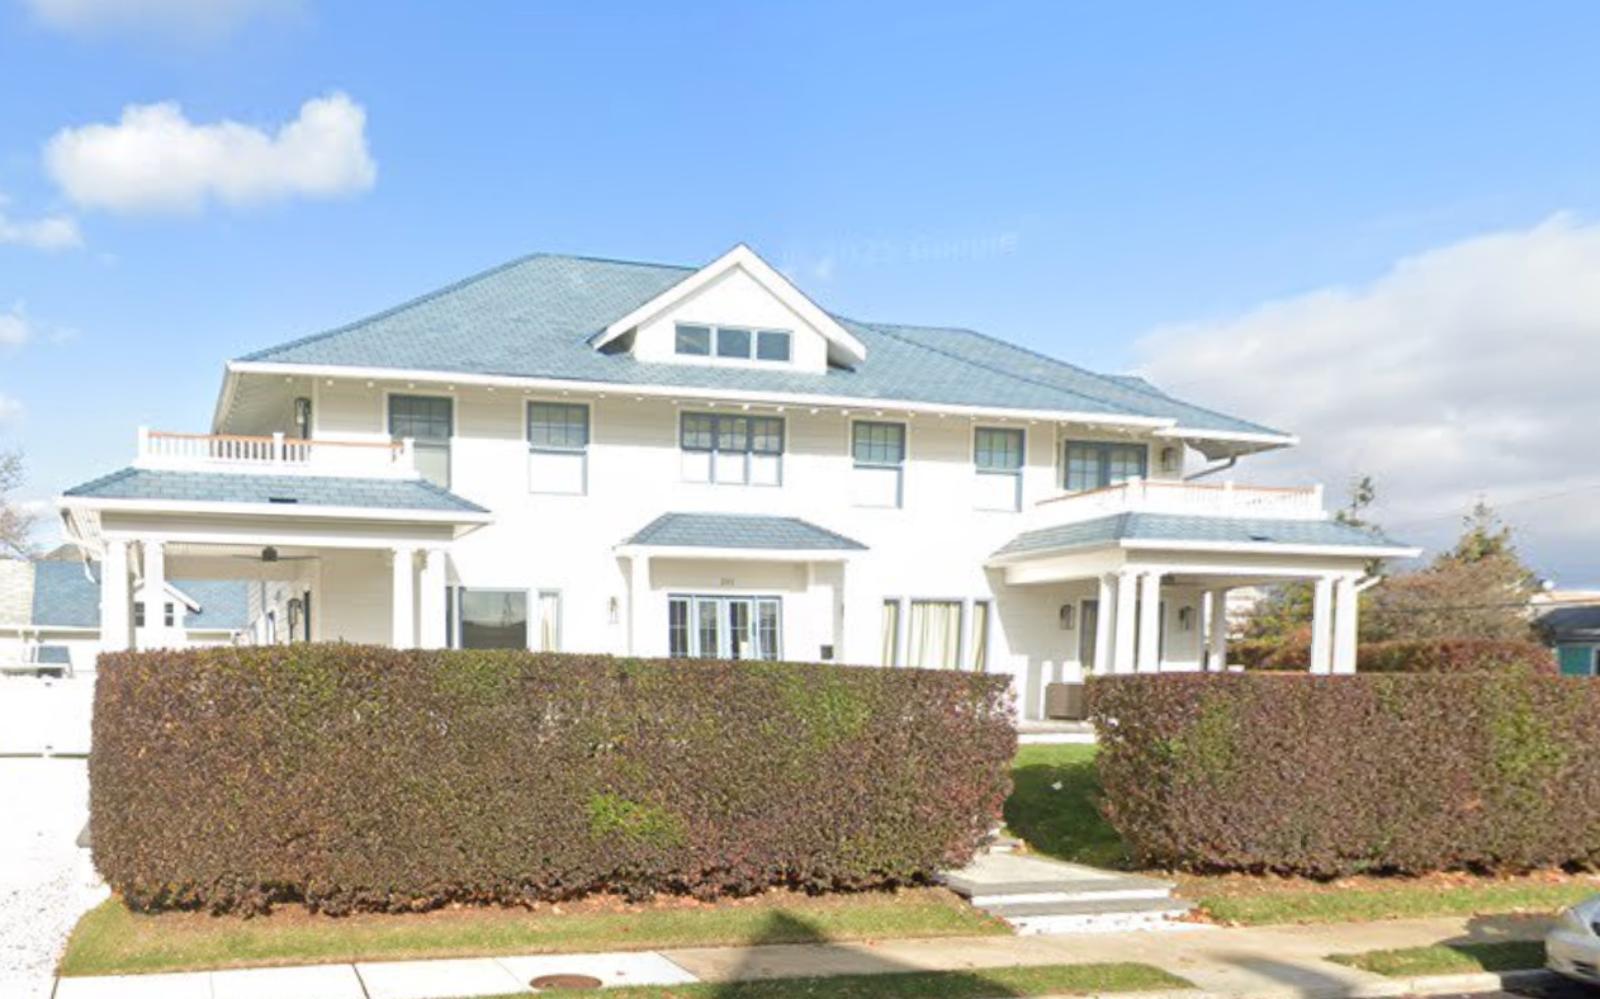
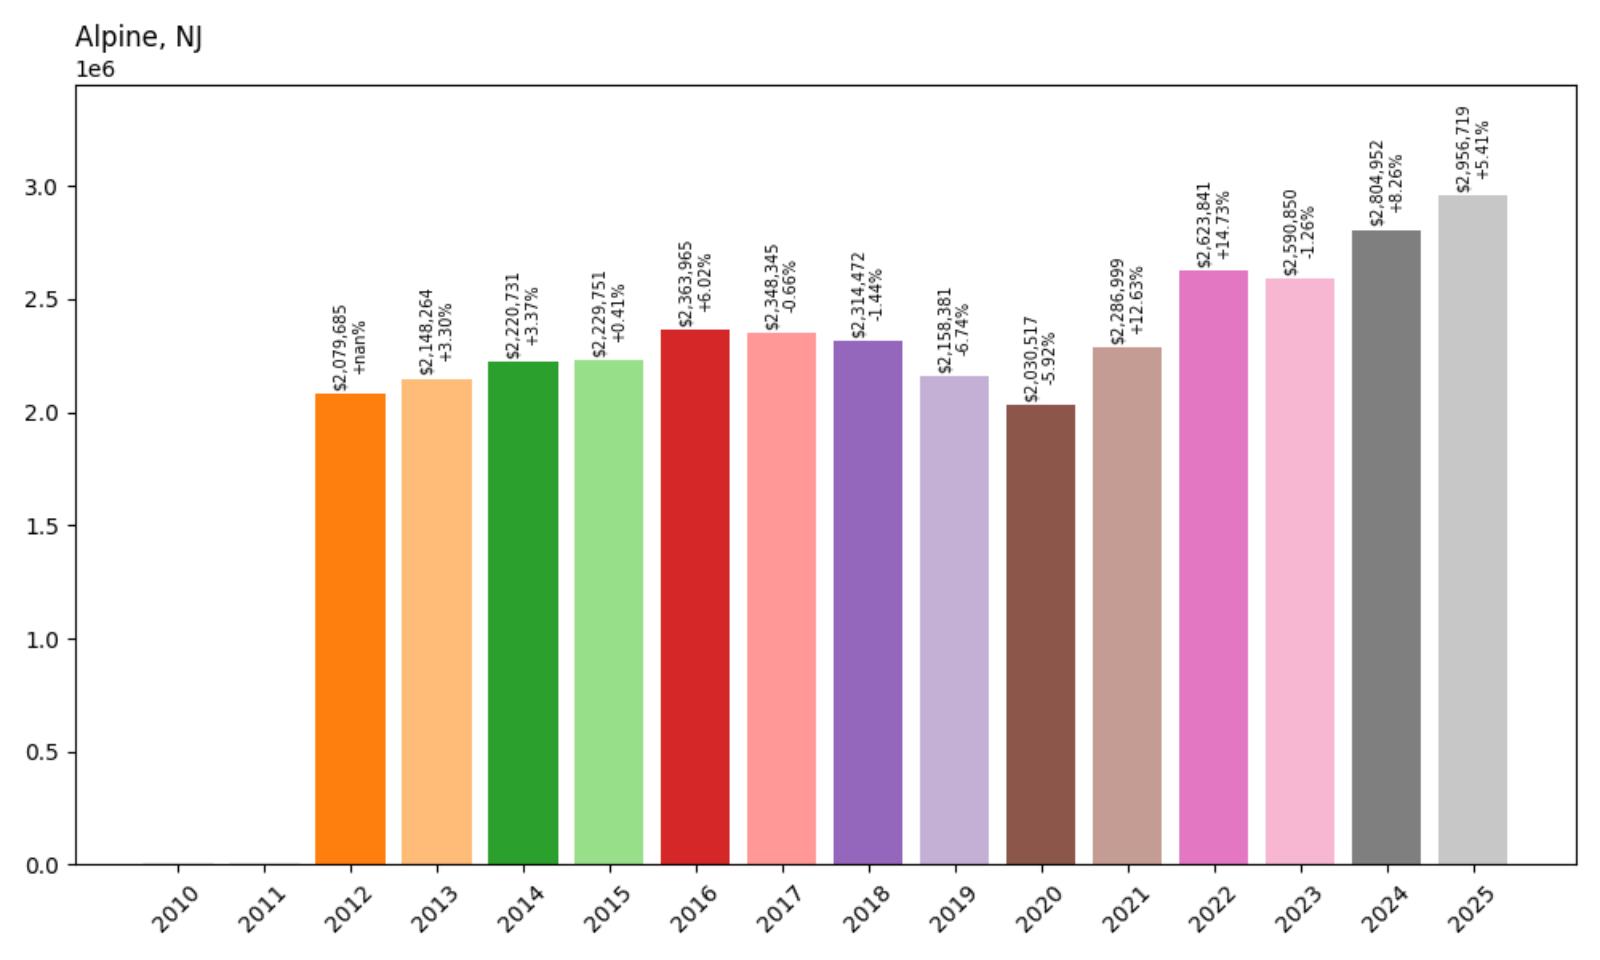
2. Alpine – 42.2% Increase in Home Prices Since 2012
- 2010: $NA
- 2011: $NA
- 2012: $2,079,685
- 2013: $2,148,264 (+$68,580, +3.30% from previous year)
- 2014: $2,220,731 (+$72,466, +3.37% from previous year)
- 2015: $2,229,751 (+$9,020, +0.41% from previous year)
- 2016: $2,363,965 (+$134,214, +6.02% from previous year)
- 2017: $2,348,345 (−$15,620, −0.66% from previous year)
- 2018: $2,314,472 (−$33,872, −1.44% from previous year)
- 2019: $2,158,381 (−$156,092, −6.74% from previous year)
- 2020: $2,030,517 (−$127,864, −5.92% from previous year)
- 2021: $2,286,999 (+$256,482, +12.63% from previous year)
- 2022: $2,623,841 (+$336,841, +14.73% from previous year)
- 2023: $2,590,850 (−$32,990, −1.26% from previous year)
- 2024: $2,804,952 (+$214,101, +8.26% from previous year)
- 2025: $2,956,719 (+$151,768, +5.41% from previous year)
Home prices in Alpine have climbed steadily since 2012, growing by over 42% during that time. The most significant appreciation came in the early 2020s, particularly in 2021 and 2022 when values surged more than $590,000 in just two years. After a brief dip in 2023, prices rebounded again, pushing Alpine’s median home value to nearly $3 million in 2025. Despite some fluctuations in the late 2010s, the long-term trend remains upward in this ultra-exclusive enclave.
Alpine – The Pinnacle of Prestige in Bergen County

Alpine is widely regarded as one of the most luxurious and exclusive residential communities in all of New Jersey—and indeed, the entire United States. Tucked along the Palisades just north of New York City, Alpine combines unmatched privacy, massive estate lots, and celebrity-level seclusion with easy access to Manhattan. Its wooded hillsides and gated compounds attract high-net-worth individuals, executives, and entertainers seeking elite suburban living without sacrificing proximity to the financial capital of the world.
With some homes priced well over $10 million, Alpine’s real estate market operates in a league of its own. Zoning regulations maintain low-density development, further driving up land values, while the lack of a local income tax continues to appeal to ultra-wealthy buyers. Alpine’s combination of exclusivity, prestige, and location creates a near-insatiable demand for its rare listings. While prices dipped slightly before the pandemic, they have since rebounded with force, and the market remains fiercely competitive heading into 2025.
1. Deal – 148% Home Price Increase Since 2010
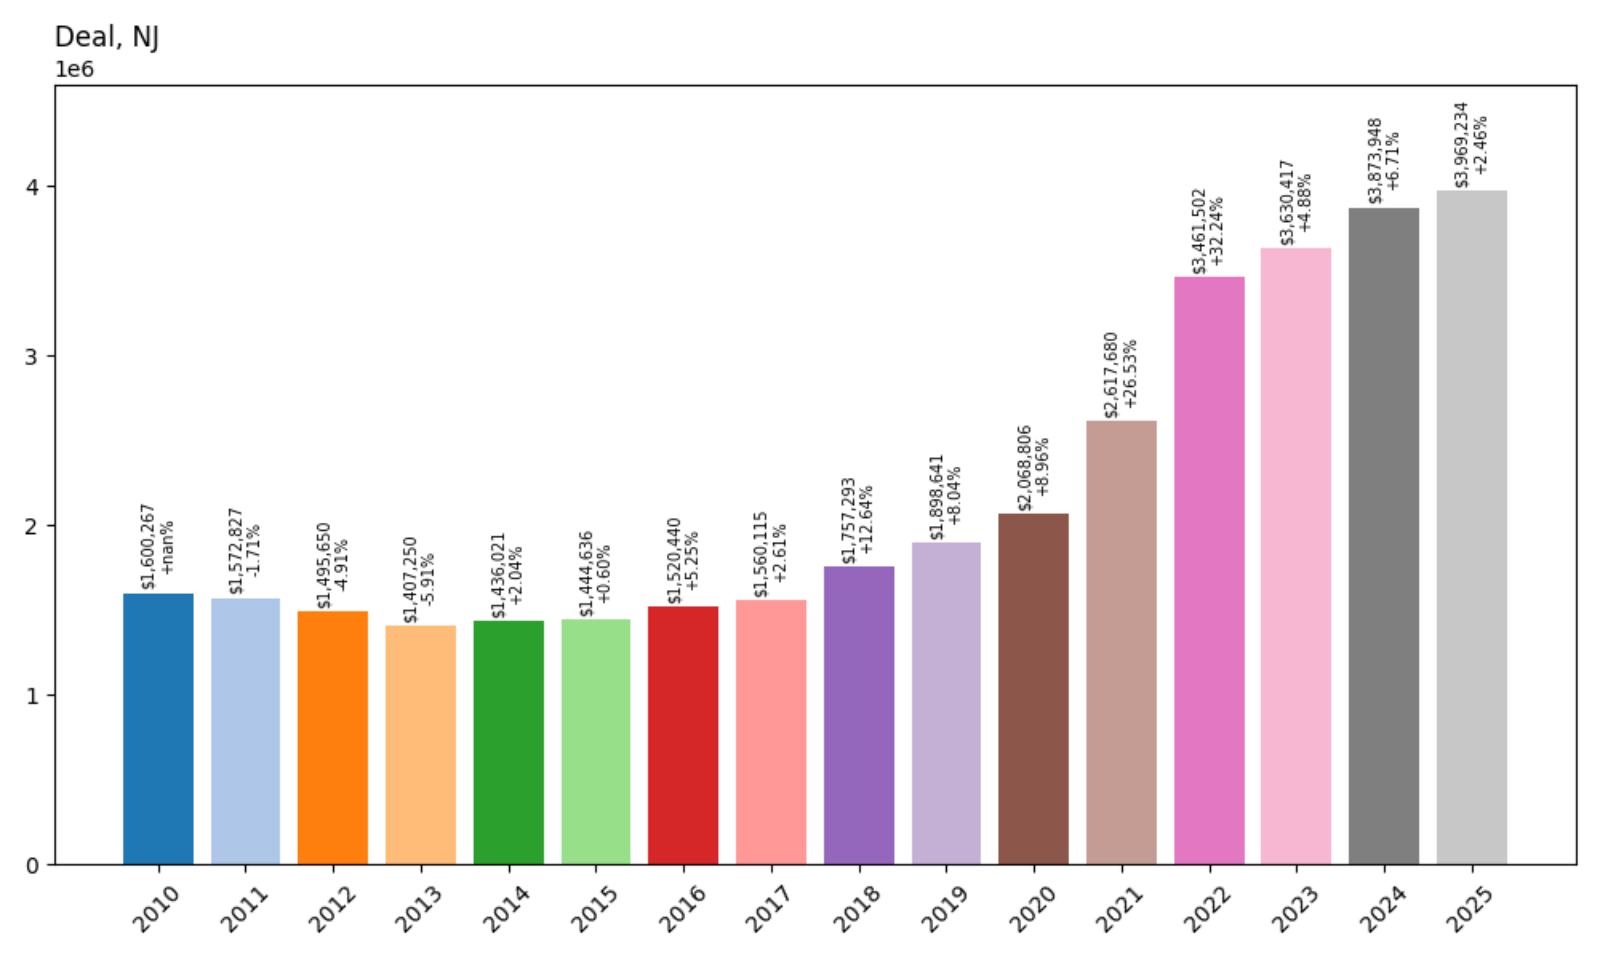
- 2010: $1,600,267
- 2011: $1,572,827 (−$27,440, −1.71% from previous year)
- 2012: $1,495,650 (−$77,177, −4.91% from previous year)
- 2013: $1,407,250 (−$88,399, −5.91% from previous year)
- 2014: $1,436,021 (+$28,771, +2.04% from previous year)
- 2015: $1,444,636 (+$8,615, +0.60% from previous year)
- 2016: $1,520,440 (+$75,804, +5.25% from previous year)
- 2017: $1,560,115 (+$39,675, +2.61% from previous year)
- 2018: $1,757,293 (+$197,178, +12.64% from previous year)
- 2019: $1,898,641 (+$141,348, +8.04% from previous year)
- 2020: $2,068,806 (+$170,165, +8.96% from previous year)
- 2021: $2,617,680 (+$548,874, +26.53% from previous year)
- 2022: $3,461,502 (+$843,822, +32.24% from previous year)
- 2023: $3,630,417 (+$168,915, +4.88% from previous year)
- 2024: $3,873,948 (+$243,531, +6.71% from previous year)
- 2025: $3,969,234 (+$95,286, +2.46% from previous year)
Deal tops the list with an astonishing 148% increase in average home values since 2010. Prices dropped slightly in the early 2010s but began rebounding steadily by 2016. The biggest leap came between 2020 and 2022, when home values surged by more than $1.4 million over just two years. As of June 2025, the average home in Deal costs just under $4 million — a figure that places this oceanfront borough among the most exclusive in the entire Northeast.
Deal – Coastal Prestige and Luxury Estates
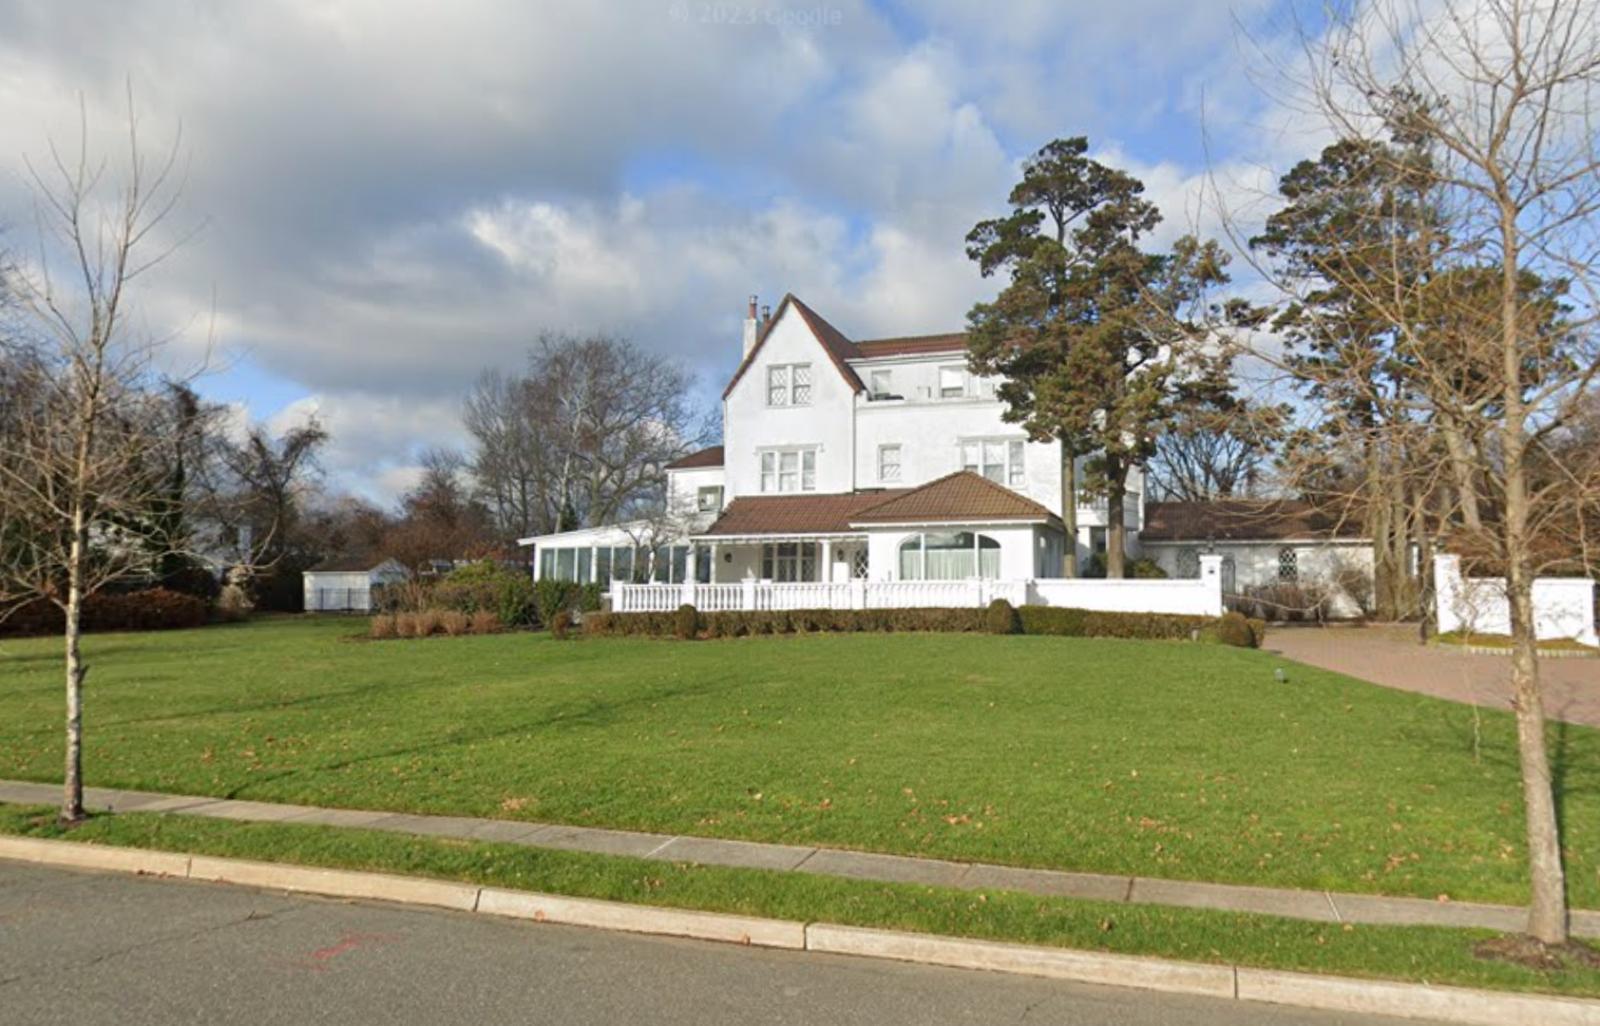
Located along the Jersey Shore in Monmouth County, Deal is synonymous with wealth and exclusivity. It spans less than two square miles but contains some of the most luxurious real estate in New Jersey. This tiny seaside town is known for its enormous oceanfront mansions, large private lots, and quiet residential streets that feel a world away from the bustle of nearby cities. The community has long attracted affluent families, many of whom have second homes here, especially from the New York metro area.
The dramatic price growth in Deal reflects its elite status and tight housing inventory. With limited land, zoning that favors large estates, and high demand from wealthy buyers, prices have had nowhere to go but up. Deal also offers proximity to popular destinations like Asbury Park and Long Branch while maintaining an exclusive, low-profile charm. As prices have surged since 2020, it’s clear that the pandemic-era demand for high-end, private coastal properties gave Deal’s already pricey market another powerful push upward.


