Would you like to save this?
According to the Zillow Home Value Index, home prices in some New Jersey towns have gone absolutely vertical—soaring by six figures, and in many cases, over a million dollars. These 18 spots aren’t just expensive; they’ve become wealth magnets, with years of nonstop appreciation fueled by tight supply, pandemic shifts, and serious buyer demand. From swanky shore towns to hedge-fund-heavy suburbs, this is where money moved—and stayed.
18. Beach Haven – 126% Home Price Increase Since 2012
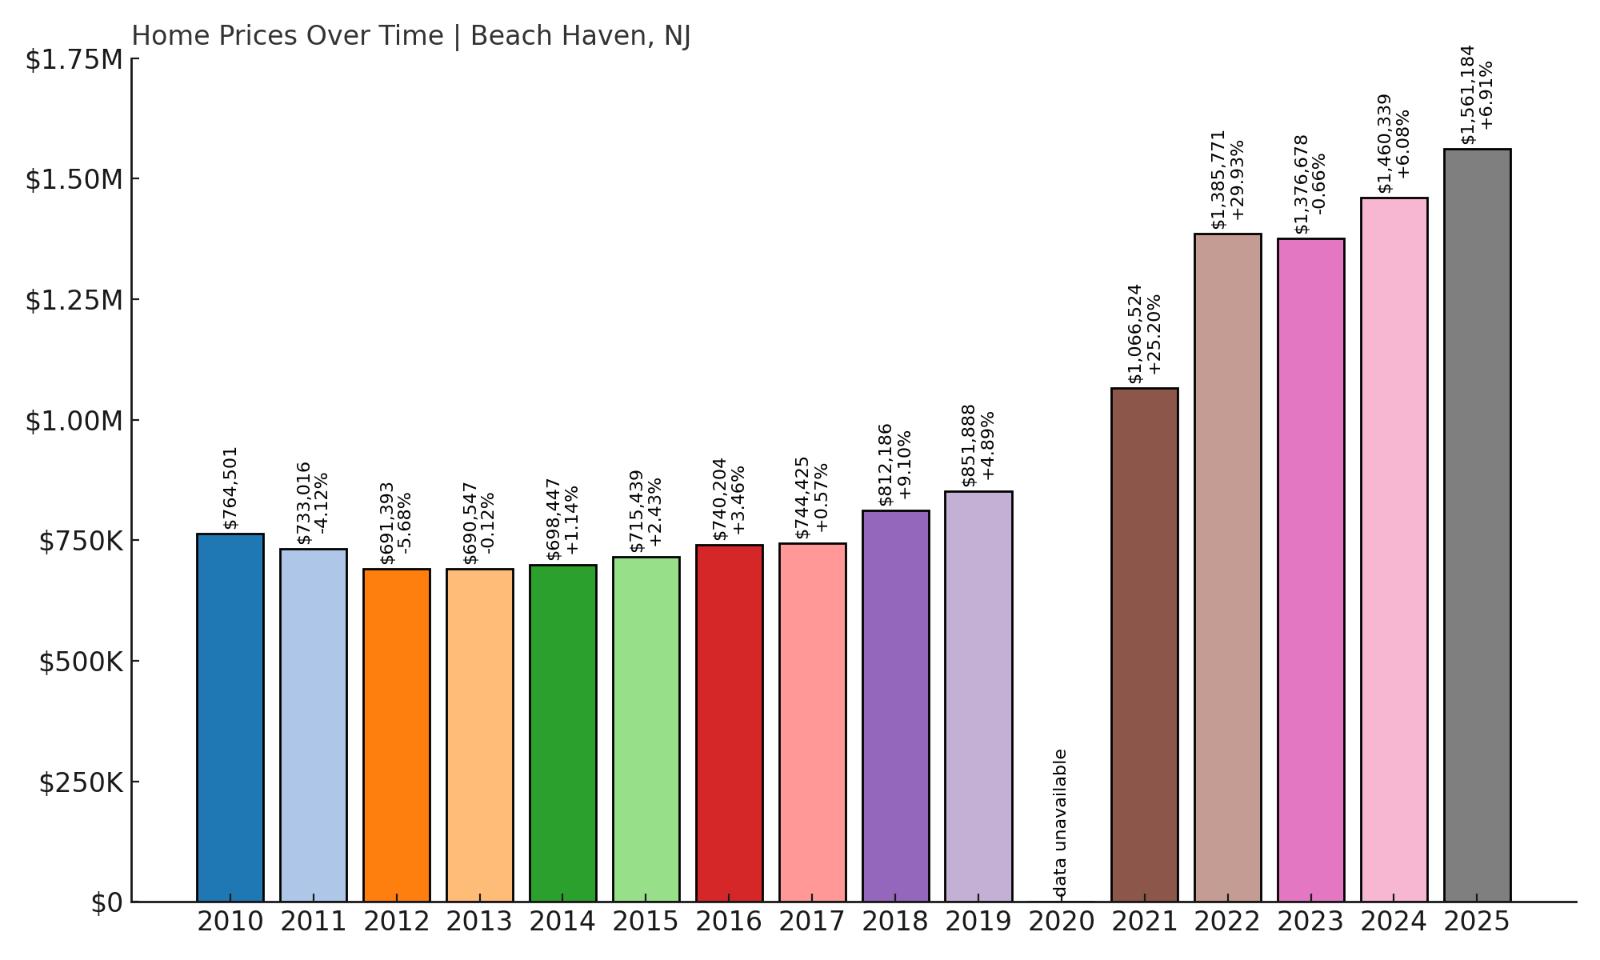
- 2010: $764,501
- 2011: $733,016 (-$31,485, -4.12% from previous year)
- 2012: $691,393 (-$41,623, -5.68% from previous year)
- 2013: $690,547 (-$846, -0.12% from previous year)
- 2014: $698,447 (+$7,901, +1.14% from previous year)
- 2015: $715,439 (+$16,991, +2.43% from previous year)
- 2016: $740,204 (+$24,766, +3.46% from previous year)
- 2017: $744,425 (+$4,221, +0.57% from previous year)
- 2018: $812,186 (+$67,761, +9.10% from previous year)
- 2019: $851,888 (+$39,702, +4.89% from previous year)
- 2020: N/A
- 2021: $1,066,524 (+$214,636, +25.20% from previous year)
- 2022: $1,385,771 (+$319,248, +29.93% from previous year)
- 2023: $1,376,678 (-$9,094, -0.66% from previous year)
- 2024: $1,460,339 (+$83,661, +6.08% from previous year)
- 2025: $1,561,184 (+$100,845, +6.91% from previous year)
Beach Haven’s home values have climbed from $691,393 in 2012 to over $1.56 million in 2025, a 126% increase. The biggest jumps came after 2020, with prices rising sharply during the pandemic real estate boom. Even as growth has stabilized recently, the market continues to edge upward, showing resilience in this high-demand coastal area.
Beach Haven – Oceanfront Charm That Never Fades
Beach Haven sits on Long Beach Island and remains one of New Jersey’s most iconic shore towns. With clean beaches, classic Victorian architecture, and family-friendly attractions, it draws consistent interest from second-home buyers and investors. The borough’s strict zoning and limited space help keep inventory low, fueling long-term appreciation. The town also benefits from a strong seasonal rental market, which adds to its investment appeal. While Hurricane Sandy reshaped some of the island’s housing stock, much of it has been rebuilt with modern standards, driving values even higher. Today, Beach Haven combines historical charm with beachfront luxury—and the prices reflect it.
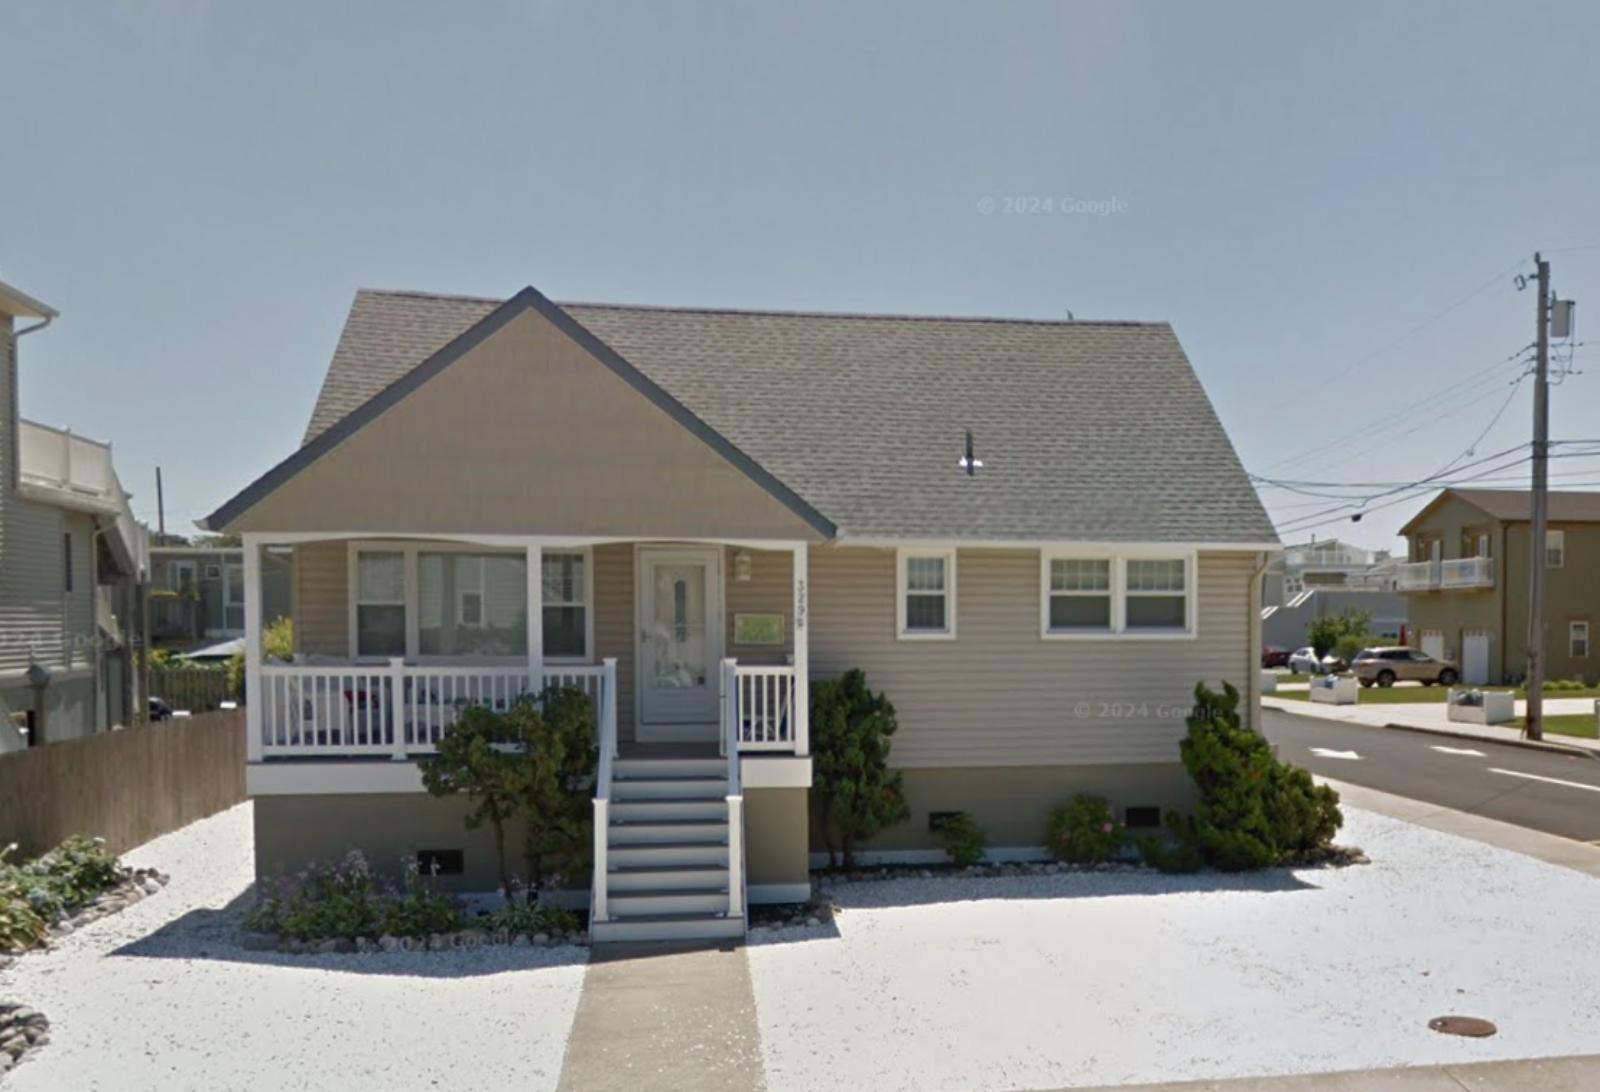
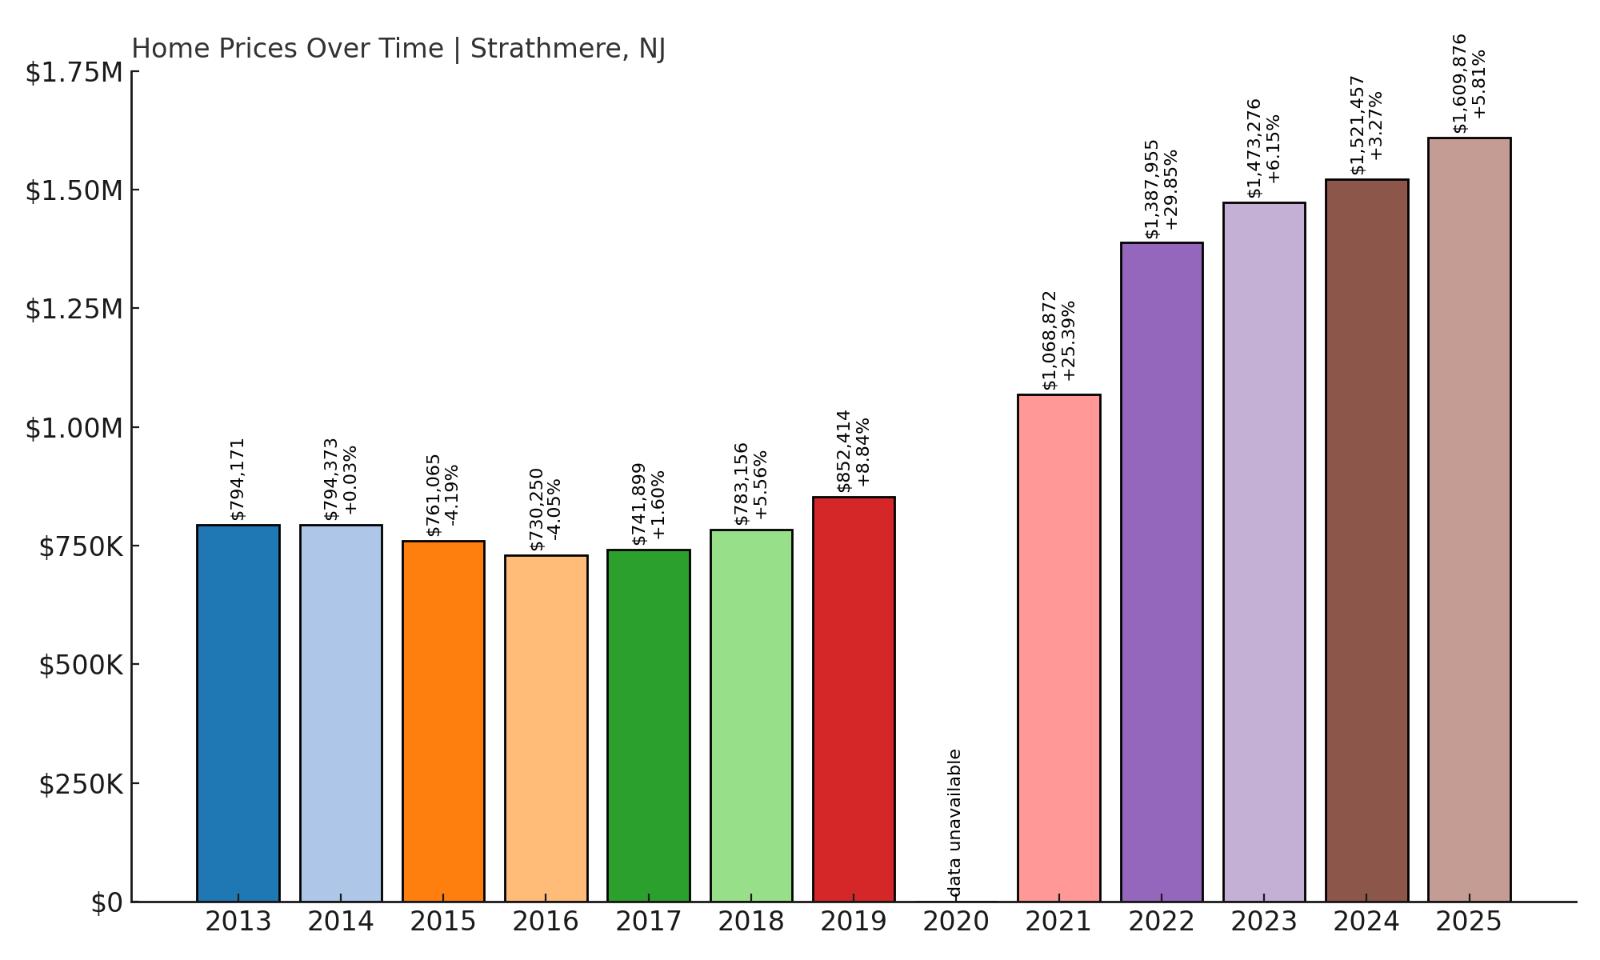
17. Strathmere – 103% Home Price Increase Since 2013
- 2010: N/A
- 2011: N/A
- 2012: N/A
- 2013: $794,171
- 2014: $794,373 (+$202, +0.03% from previous year)
- 2015: $761,065 (-$33,307, -4.19% from previous year)
- 2016: $730,250 (-$30,815, -4.05% from previous year)
- 2017: $741,899 (+$11,649, +1.60% from previous year)
- 2018: $783,156 (+$41,257, +5.56% from previous year)
- 2019: $852,414 (+$69,258, +8.84% from previous year)
- 2020: N/A
- 2021: $1,068,872 (+$216,458, +25.39% from previous year)
- 2022: $1,387,955 (+$319,083, +29.85% from previous year)
- 2023: $1,473,276 (+$85,321, +6.15% from previous year)
- 2024: $1,521,457 (+$48,181, +3.27% from previous year)
- 2025: $1,609,876 (+$88,420, +5.81% from previous year)
Since 2013, home prices in Strathmere have risen from $794,171 to over $1.6 million, an increase of 103%. The steepest climbs came between 2020 and 2022, driven by a rush for oceanfront properties. Despite its small size, the market here continues to outperform many larger towns in the state.
Strathmere – Quiet, Exclusive, and In Demand
Strathmere is a tiny stretch of beachfront between Ocean City and Sea Isle City, often overlooked by casual visitors. Its lack of commercial development, low density, and serene atmosphere are major selling points for high-end buyers seeking privacy and tranquility. Real estate here is extremely limited, which helps explain the steep price growth. This part of Cape May County has very few full-time residents, but it’s become a magnet for wealthy second-home buyers in recent years. With no boardwalk or chain restaurants, Strathmere offers a rare kind of shore town experience—quiet, scenic, and surprisingly upscale. That scarcity and simplicity are exactly what make it so expensive.
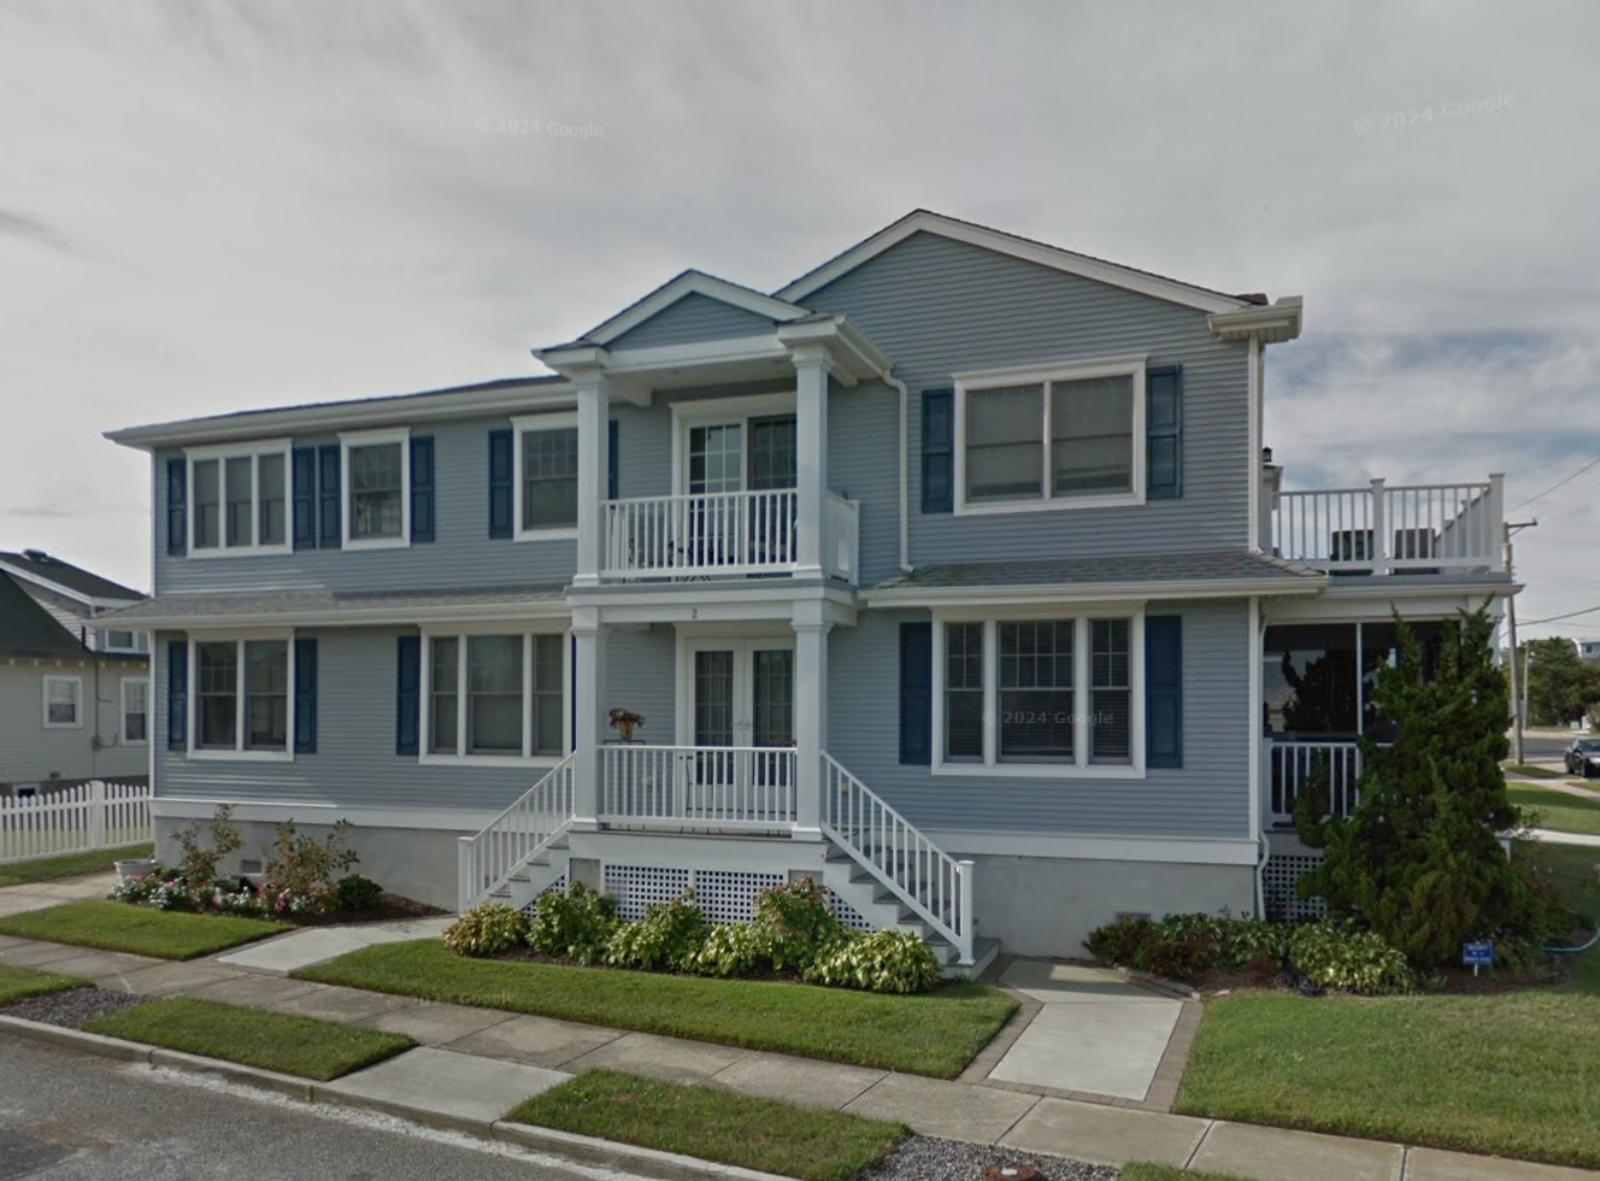
16. Avon by the Sea – 102% Home Price Increase Since 2012
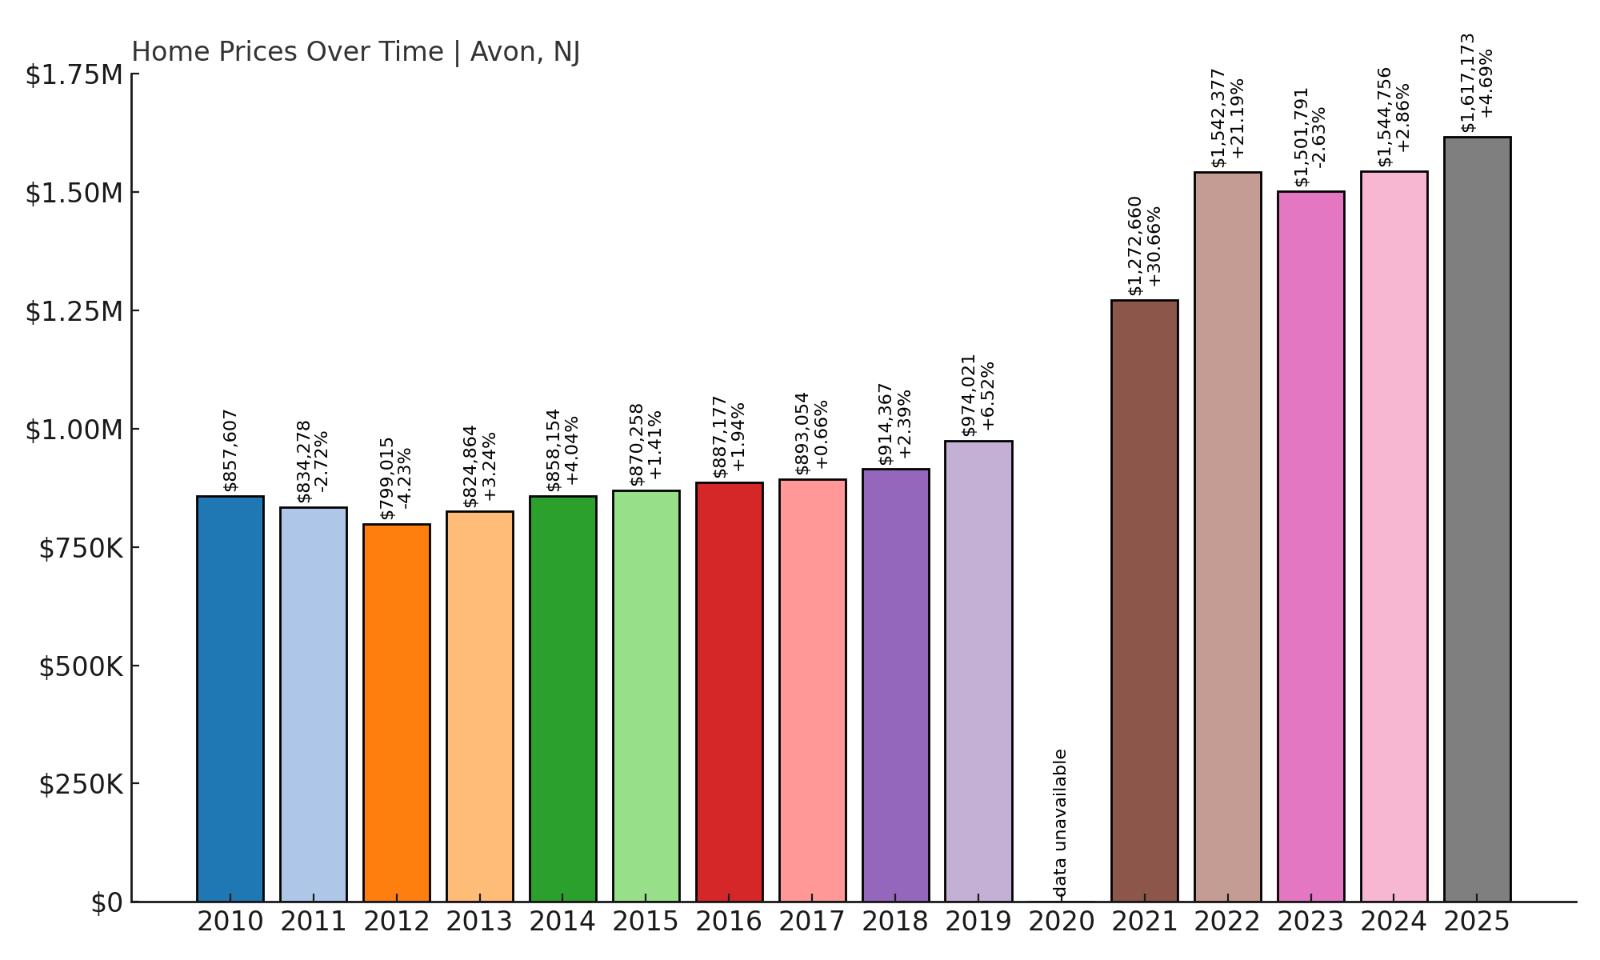
- 2010: $857,607
- 2011: $834,278 (-$23,329, -2.72% from previous year)
- 2012: $799,015 (-$35,263, -4.23% from previous year)
- 2013: $824,864 (+$25,849, +3.24% from previous year)
- 2014: $858,154 (+$33,290, +4.04% from previous year)
- 2015: $870,258 (+$12,104, +1.41% from previous year)
- 2016: $887,177 (+$16,919, +1.94% from previous year)
- 2017: $893,054 (+$5,878, +0.66% from previous year)
- 2018: $914,367 (+$21,312, +2.39% from previous year)
- 2019: $974,021 (+$59,654, +6.52% from previous year)
- 2020: N/A
- 2021: $1,272,660 (+$298,639, +30.66% from previous year)
- 2022: $1,542,377 (+$269,717, +21.19% from previous year)
- 2023: $1,501,791 (-$40,587, -2.63% from previous year)
- 2024: $1,544,756 (+$42,965, +2.86% from previous year)
- 2025: $1,617,173 (+$72,418, +4.69% from previous year)
Avon by the Sea has seen its average home price rise from $799,015 in 2012 to $1.62 million in 2025—more than doubling in just over a decade. The post-2020 surge accounted for the largest gains, but prices have continued to rise, albeit at a slower pace, in the most recent years.
Avon by the Sea – Seaside Living With Historic Flair
Would you like to save this?
This Monmouth County borough is known for its turn-of-the-century homes, tree-lined streets, and easy beach access. It’s a quieter alternative to nearby Asbury Park and draws buyers who want shore living without the crowds. Limited housing turnover and strong local pride help keep values high. With few commercial developments and strict preservation rules, Avon’s charm is well-protected. It’s also highly walkable, making it attractive for retirees and seasonal residents alike. That combination of history, scenery, and market scarcity keeps Avon among the most prized addresses on the Jersey Shore.
15. Englewood Cliffs – 60% Home Price Increase Since 2011
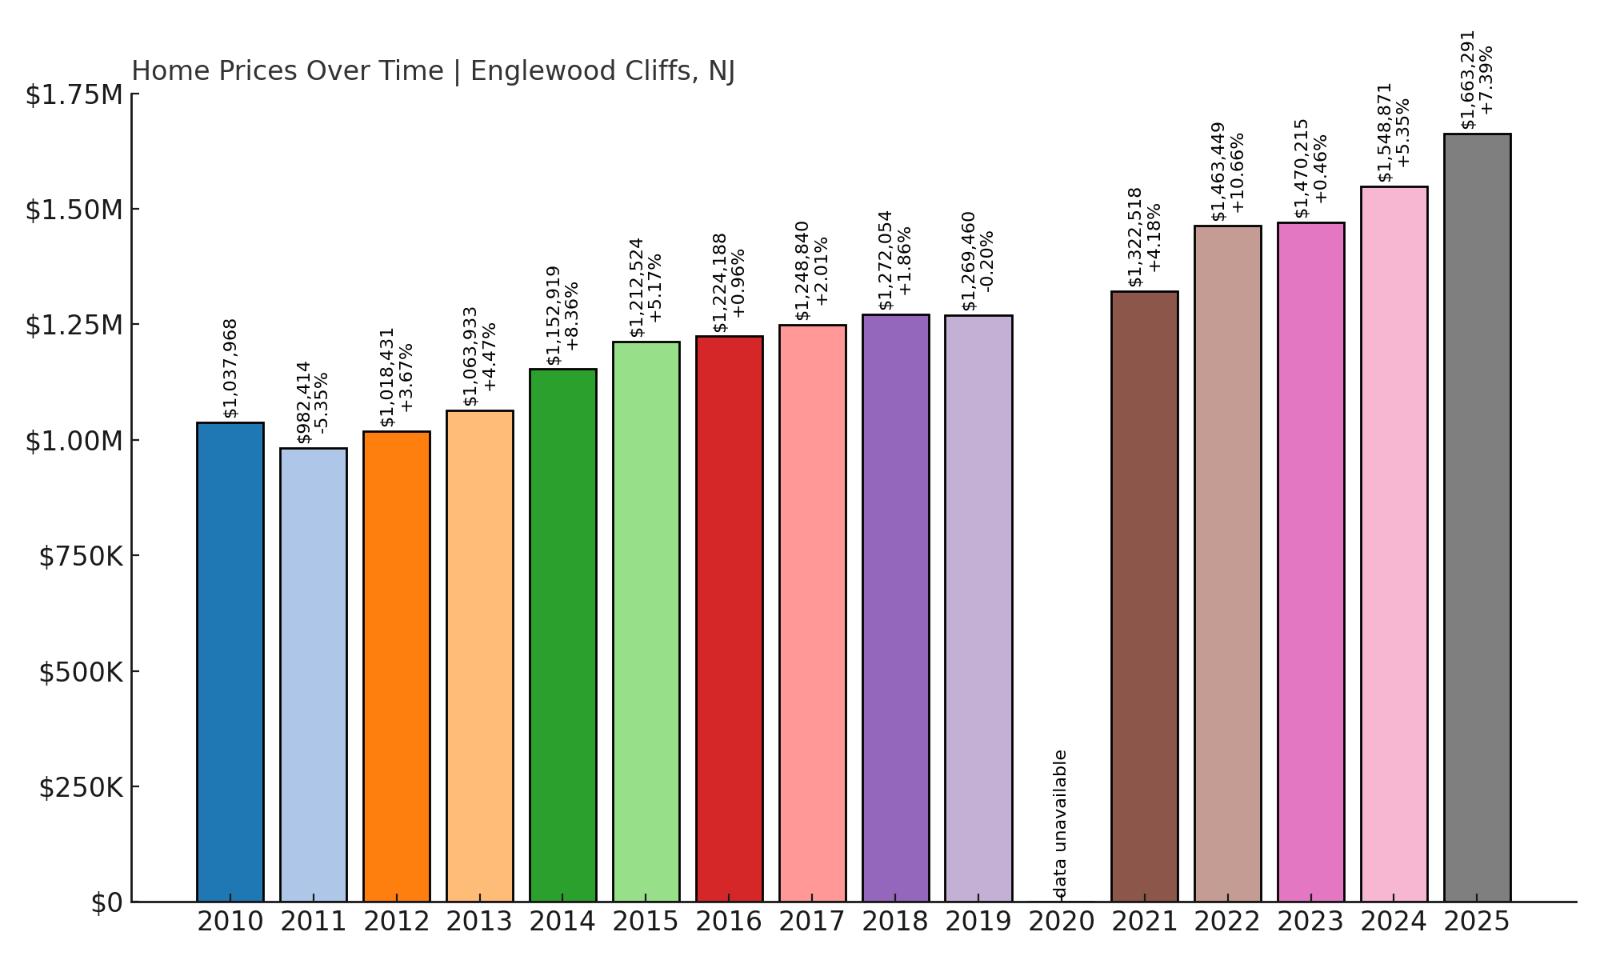
- 2010: $1,037,968
- 2011: $982,414 (-$55,554, -5.35% from previous year)
- 2012: $1,018,431 (+$36,017, +3.67% from previous year)
- 2013: $1,063,933 (+$45,502, +4.47% from previous year)
- 2014: $1,152,919 (+$88,986, +8.36% from previous year)
- 2015: $1,212,524 (+$59,605, +5.17% from previous year)
- 2016: $1,224,188 (+$11,664, +0.96% from previous year)
- 2017: $1,248,840 (+$24,651, +2.01% from previous year)
- 2018: $1,272,054 (+$23,215, +1.86% from previous year)
- 2019: $1,269,460 (-$2,594, -0.20% from previous year)
- 2020: N/A
- 2021: $1,322,518 (+$53,058, +4.18% from previous year)
- 2022: $1,463,449 (+$140,931, +10.66% from previous year)
- 2023: $1,470,215 (+$6,767, +0.46% from previous year)
- 2024: $1,548,871 (+$78,656, +5.35% from previous year)
- 2025: $1,663,291 (+$114,420, +7.39% from previous year)
Home prices in Englewood Cliffs have increased by 60% since 2011, rising from just under $1 million to over $1.66 million. Though less explosive than some shore towns, this Bergen County suburb has shown steady, reliable growth, especially in the post-pandemic years.
Englewood Cliffs – Suburban Prestige Near Manhattan
Englewood Cliffs is a prime residential enclave just across the Hudson River from Manhattan. Known for its quiet streets, luxury properties, and proximity to the George Washington Bridge, it’s a favorite for commuters seeking space and privacy without leaving the metro area. Major corporations like Unilever have also set up shop here, adding to the local affluence. Zoning laws help keep lot sizes generous and development in check, which supports long-term home values. While the town doesn’t have a downtown scene, it offers quick access to both city and nature, including the Palisades cliffs and state parks. With limited housing stock and high demand, prices have stayed on a consistent upward path.
14. Mantoloking – 113% Home Price Increase Since 2012
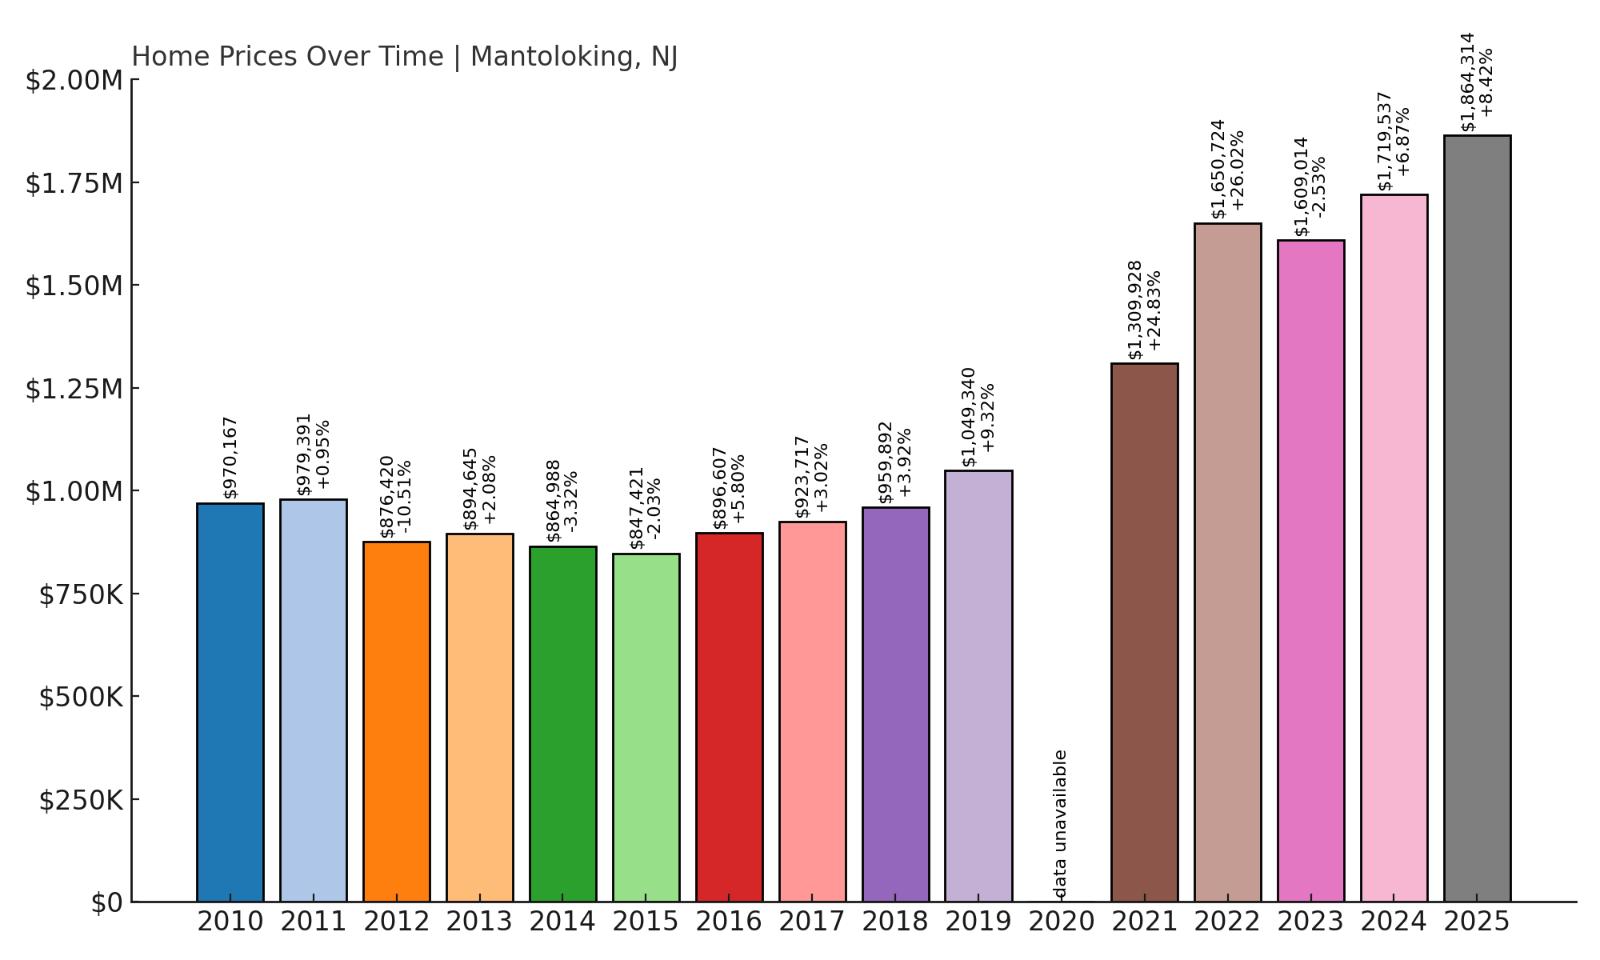
- 2010: $970,167
- 2011: $979,391 (+$9,224, +0.95% from previous year)
- 2012: $876,420 (-$102,971, -10.51% from previous year)
- 2013: $894,645 (+$18,225, +2.08% from previous year)
- 2014: $864,988 (-$29,658, -3.32% from previous year)
- 2015: $847,421 (-$17,567, -2.03% from previous year)
- 2016: $896,607 (+$49,186, +5.80% from previous year)
- 2017: $923,717 (+$27,109, +3.02% from previous year)
- 2018: $959,892 (+$36,175, +3.92% from previous year)
- 2019: $1,049,340 (+$89,448, +9.32% from previous year)
- 2020: N/A
- 2021: $1,309,928 (+$260,588, +24.83% from previous year)
- 2022: $1,650,724 (+$340,797, +26.02% from previous year)
- 2023: $1,609,014 (-$41,710, -2.53% from previous year)
- 2024: $1,719,537 (+$110,524, +6.87% from previous year)
- 2025: $1,864,314 (+$144,776, +8.42% from previous year)
Since 2012, home values in Mantoloking have jumped from $876,420 to $1.86 million—a 113% increase. The strongest growth came after 2020, when demand for waterfront homes surged across New Jersey’s coastal markets. After a dip in 2023, values rebounded quickly, gaining over $255,000 in the next two years. Despite fluctuations, the town’s long-term trend is clearly upward.
Mantoloking – Prestige and Privacy on the Barrier Island
Mantoloking is one of the most exclusive towns along the Jersey Shore, occupying a thin barrier island between the Atlantic Ocean and Barnegat Bay. With a population of fewer than 300 people, this small borough offers unmatched privacy, upscale real estate, and commanding water views in nearly every direction. Many of the homes here are custom-built, and buyers are typically affluent families or seasonal residents seeking seclusion and status. Strict zoning laws and extremely limited land supply create fierce competition for any available listings, and it’s rare for more than a handful of properties to hit the market at once. That scarcity—combined with location—has made Mantoloking one of the most expensive zip codes in the state for decades. Rebuilding efforts after Hurricane Sandy also brought newer, larger homes that pushed average home values even higher. Unlike more developed shore towns, Mantoloking has no commercial center, no boardwalk, and minimal traffic—all intentional choices that appeal to a very specific type of buyer. It’s a place where families invest for generations, not just a few summers, and where private beach access and yacht-ready docks come standard on many properties. Residents enjoy quick access to both Route 35 and the Garden State Parkway, giving them both convenience and coastal quiet. Home price appreciation here reflects more than just market forces—it’s a signal of the town’s longstanding reputation for wealth, exclusivity, and quality of life. Buyers who get in rarely want to leave, which helps explain why prices continue to climb even in years when other markets cool. In Mantoloking, real estate isn’t just valuable—it’s a legacy.
13. Long Beach Township – 115% Home Price Increase Since 2012
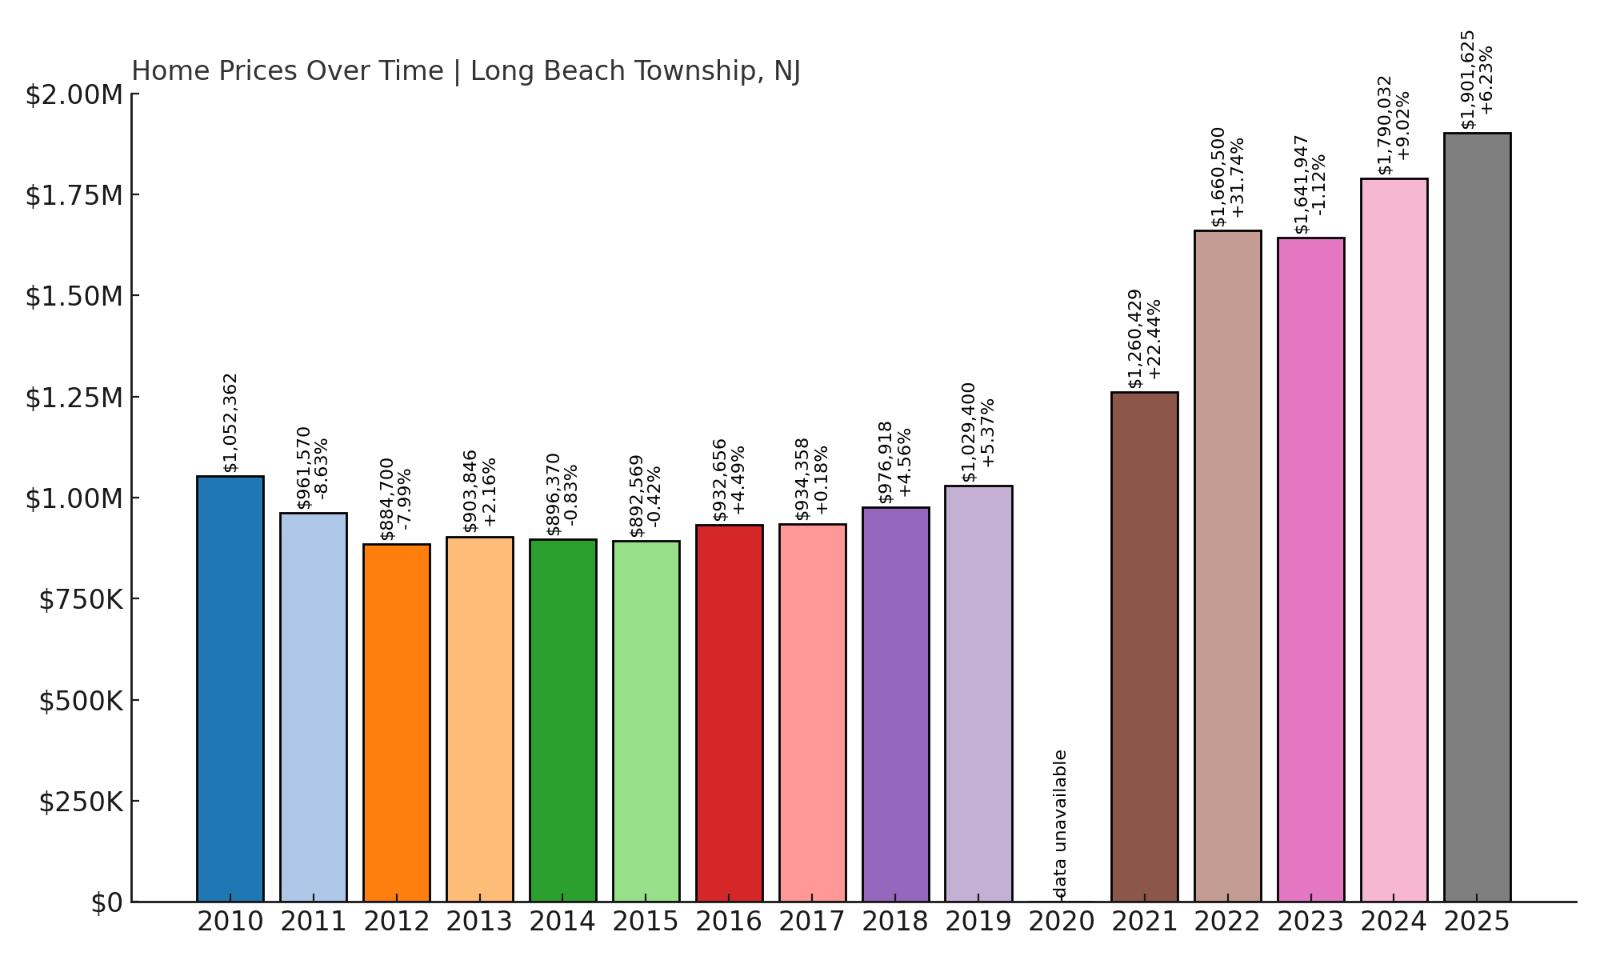
- 2010: $1,052,362
- 2011: $961,570 (-$90,792, -8.63% from previous year)
- 2012: $884,700 (-$76,870, -7.99% from previous year)
- 2013: $903,846 (+$19,146, +2.16% from previous year)
- 2014: $896,370 (-$7,476, -0.83% from previous year)
- 2015: $892,569 (-$3,801, -0.42% from previous year)
- 2016: $932,656 (+$40,088, +4.49% from previous year)
- 2017: $934,358 (+$1,702, +0.18% from previous year)
- 2018: $976,918 (+$42,560, +4.56% from previous year)
- 2019: $1,029,400 (+$52,482, +5.37% from previous year)
- 2020: N/A
- 2021: $1,260,429 (+$231,029, +22.44% from previous year)
- 2022: $1,660,500 (+$400,070, +31.74% from previous year)
- 2023: $1,641,947 (-$18,553, -1.12% from previous year)
- 2024: $1,790,032 (+$148,086, +9.02% from previous year)
- 2025: $1,901,625 (+$111,593, +6.23% from previous year)
Since 2012, home prices in Long Beach Township have more than doubled, rising from $884,700 to over $1.9 million in 2025. That’s a 115% increase in value, driven largely by a huge price leap between 2020 and 2022 when buyers flooded the coastal market. Even with a slight dip in 2023, prices rebounded the next year and remained strong into 2025, showing no signs of long-term slowdown.
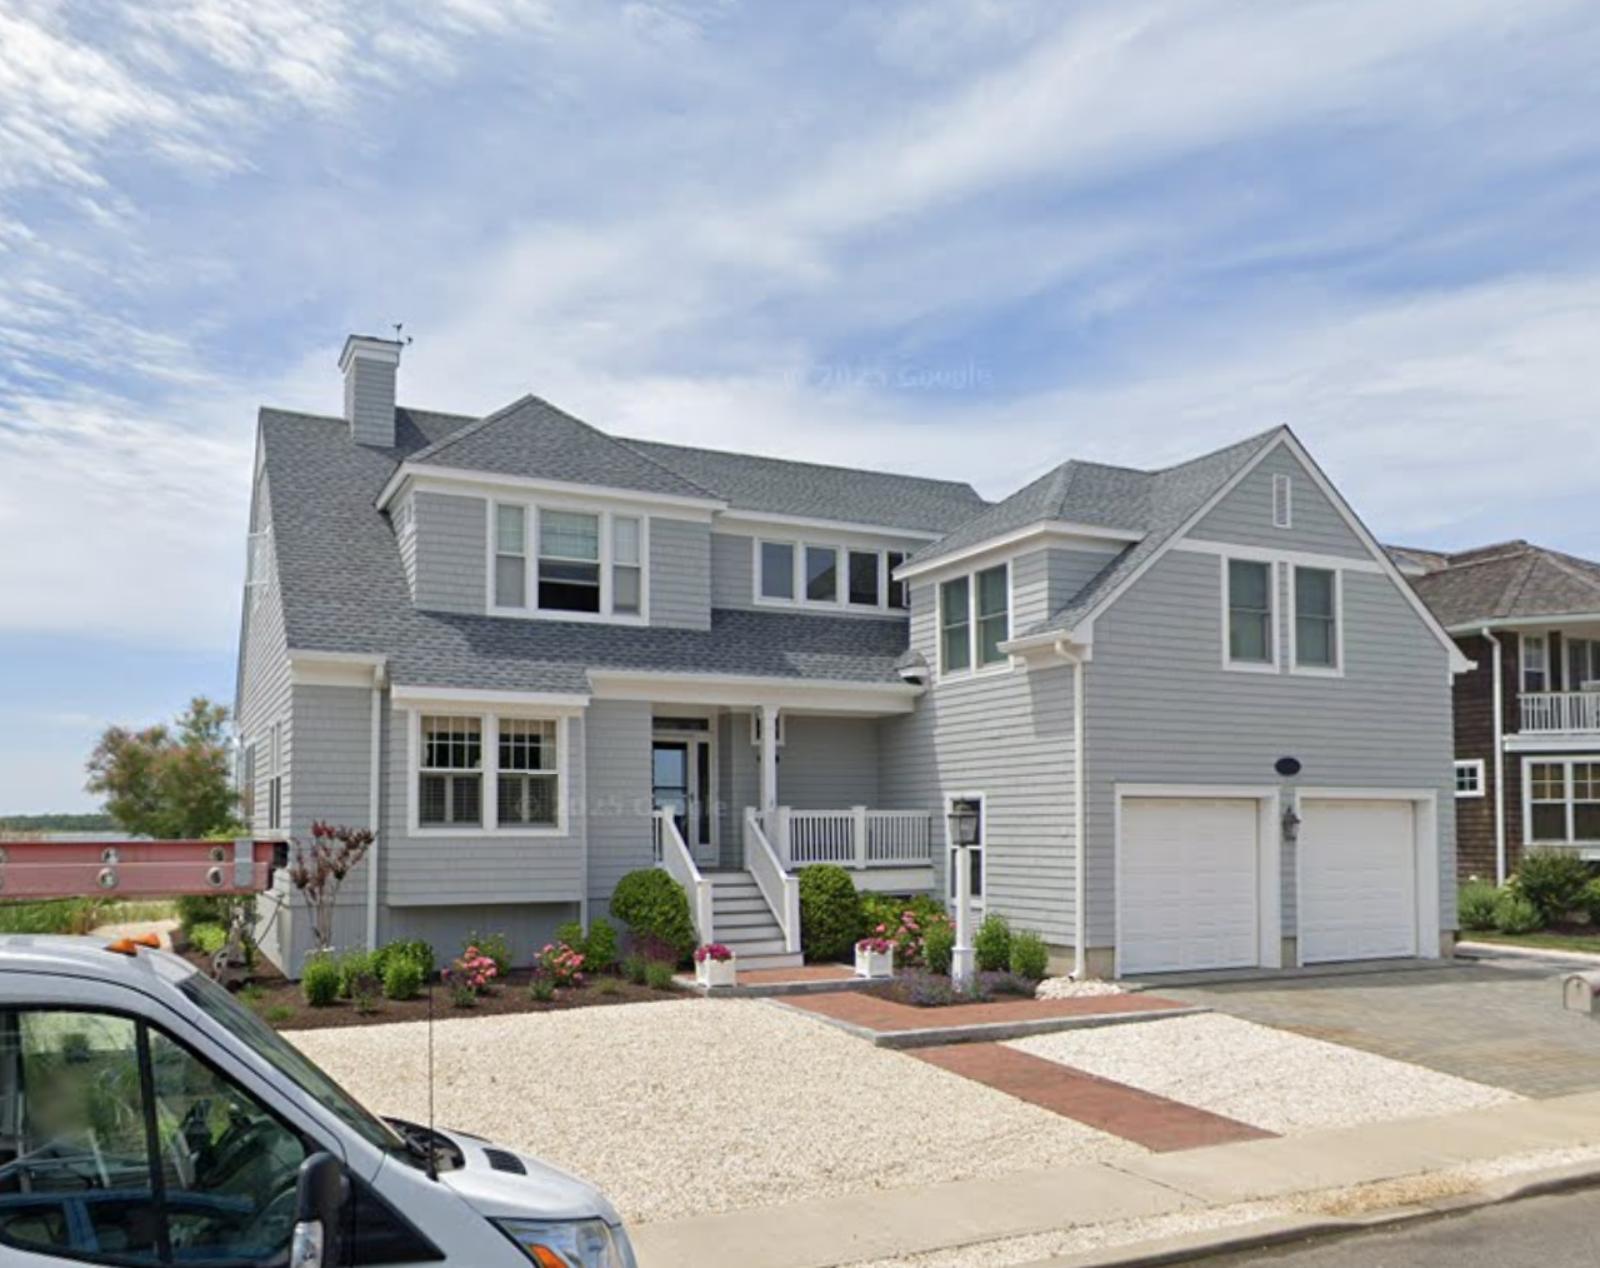
Long Beach Township – Sprawling, Scenic, and Highly Coveted
Covering the majority of Long Beach Island’s landmass, Long Beach Township stretches across several distinct neighborhoods, each offering its own style of coastal living. From Holgate and Brant Beach to Loveladies and North Beach, the township is a patchwork of upscale enclaves with direct beach or bay access. This variety gives buyers flexibility in location, but nearly all parts of town enjoy the same fundamentals: walkable beaches, strong rental potential, and limited development space. The high demand here isn’t seasonal—it’s year-round and increasingly competitive. Many homes are newly rebuilt or elevated post-Sandy, with modern finishes and storm protections that increase their long-term appeal and value. The township also maintains its infrastructure well, including beaches, roads, and public services, which helps retain its desirability. Luxury real estate in Long Beach Township commands a premium, but buyers see long-term value and lifestyle benefits that make the cost worthwhile. Investors are drawn to the area for its strong short-term rental market, while full-time and second-home buyers love the peaceful vibe and low-key beach culture. Unlike busier shore towns, it offers privacy and prestige without excessive noise or crowding. Properties often come with multi-car garages, decks with ocean views, and private beach access. That kind of real estate is in short supply across the state, which helps explain why home values here have outpaced many other parts of New Jersey. With room to grow and sustained interest from high-income buyers, Long Beach Township is expected to remain a top-tier market for years to come.
12. Rumson – 104% Home Price Increase Since 2012
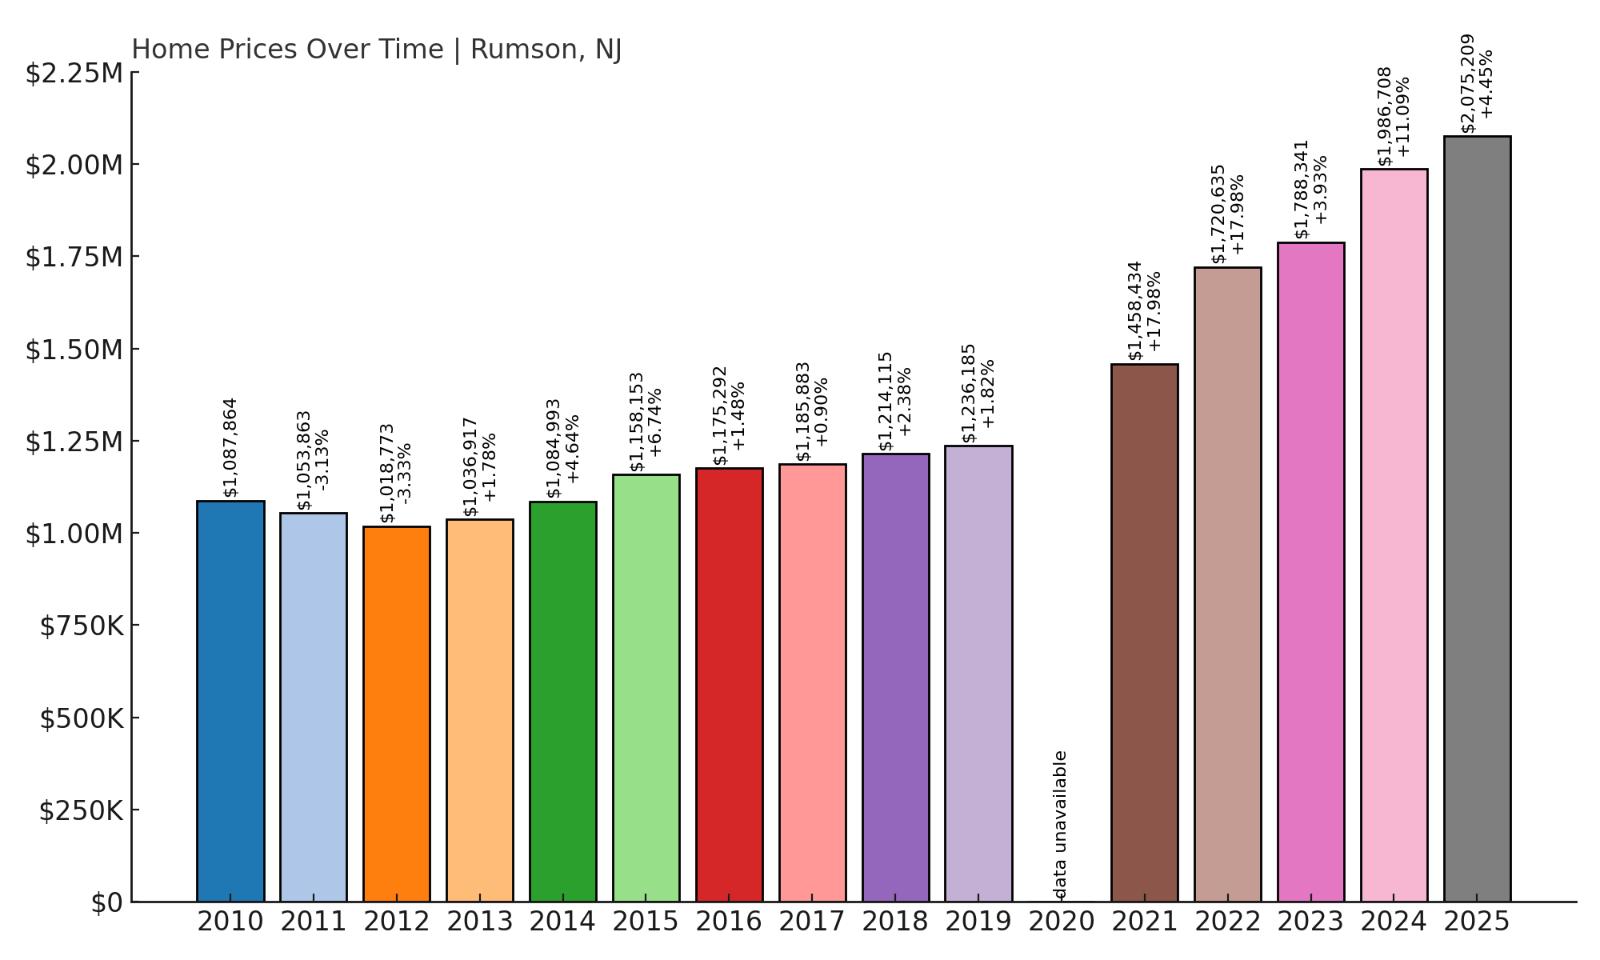
- 2010: $1,087,864
- 2011: $1,053,863 (-$34,001, -3.13% from previous year)
- 2012: $1,018,773 (-$35,090, -3.33% from previous year)
- 2013: $1,036,917 (+$18,144, +1.78% from previous year)
- 2014: $1,084,993 (+$48,076, +4.64% from previous year)
- 2015: $1,158,153 (+$73,159, +6.74% from previous year)
- 2016: $1,175,292 (+$17,140, +1.48% from previous year)
- 2017: $1,185,883 (+$10,590, +0.90% from previous year)
- 2018: $1,214,115 (+$28,233, +2.38% from previous year)
- 2019: $1,236,185 (+$22,069, +1.82% from previous year)
- 2020: N/A
- 2021: $1,458,434 (+$222,249, +17.98% from previous year)
- 2022: $1,720,635 (+$262,201, +17.98% from previous year)
- 2023: $1,788,341 (+$67,706, +3.93% from previous year)
- 2024: $1,986,708 (+$198,368, +11.09% from previous year)
- 2025: $2,075,209 (+$88,501, +4.45% from previous year)
Home values in Rumson have risen from $1,018,773 in 2012 to $2,075,209 in 2025, representing a 104% increase over that period. The town experienced steady year-over-year growth throughout the 2010s, but its most aggressive gains happened after 2020, when the housing market surged nationwide. Over the past four years alone, Rumson added more than $600,000 in average home value, reinforcing its status as one of New Jersey’s elite real estate markets.
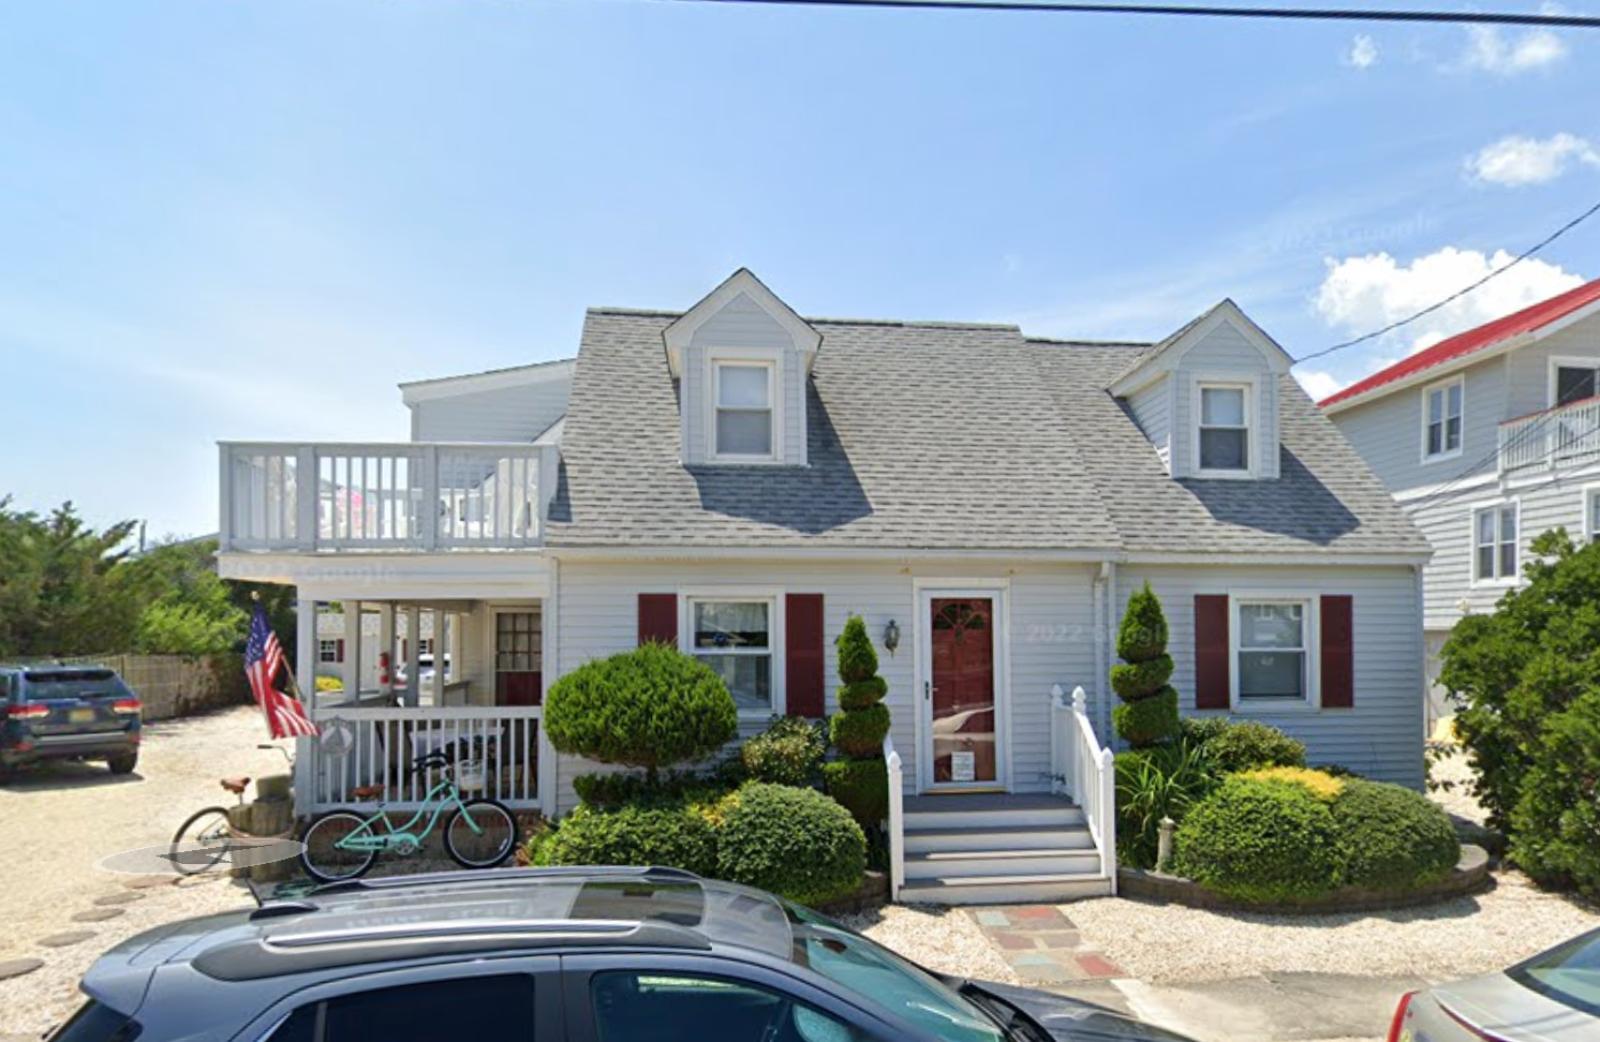
Located in Monmouth County and bordered by the Navesink and Shrewsbury rivers, Rumson is known for its waterfront mansions, top-rated public schools, and serene tree-lined streets. The town has long attracted wealthy professionals, many of whom commute to Manhattan via nearby ferry terminals or train stations. Rumson offers large estate-style homes with historic charm or modern design, often on oversized lots with water views. The town’s strict zoning and historic preservation policies help protect both property values and its unique aesthetic character. Buyers are typically long-term residents rather than house flippers or short-term investors, which creates a stable, low-turnover market that supports appreciation over time. While the town has few commercial areas, it’s close to Red Bank and the Jersey Shore, offering both upscale amenities and outdoor recreation. The surge in home prices since 2020 reflects Rumson’s position as a prime destination for those who want luxury and space without leaving the New York metro region. As remote work became more common, high-income earners sought properties that offered privacy, home office space, and a peaceful lifestyle—all of which Rumson delivers in abundance. This new wave of demand has put upward pressure on prices, especially for waterfront properties and newly renovated homes. Even smaller properties in Rumson command a premium due to school rankings, safety, and limited inventory. With a reputation for stability, elegance, and quiet wealth, Rumson is likely to remain one of New Jersey’s strongest housing markets in the years ahead.
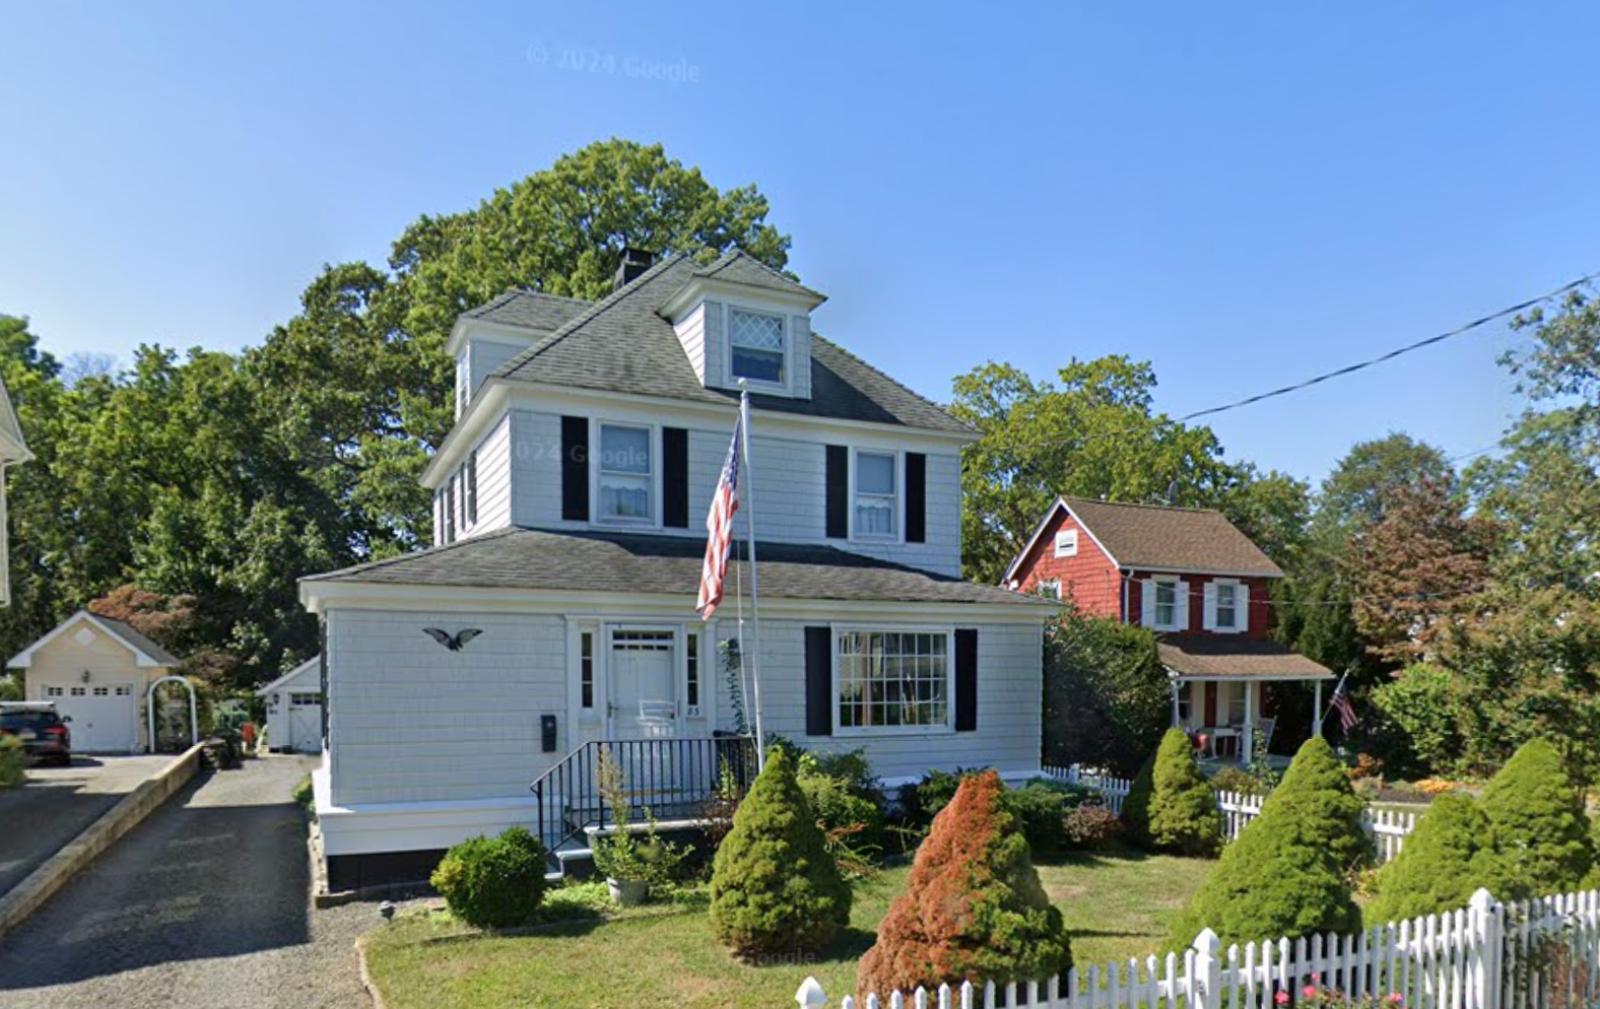
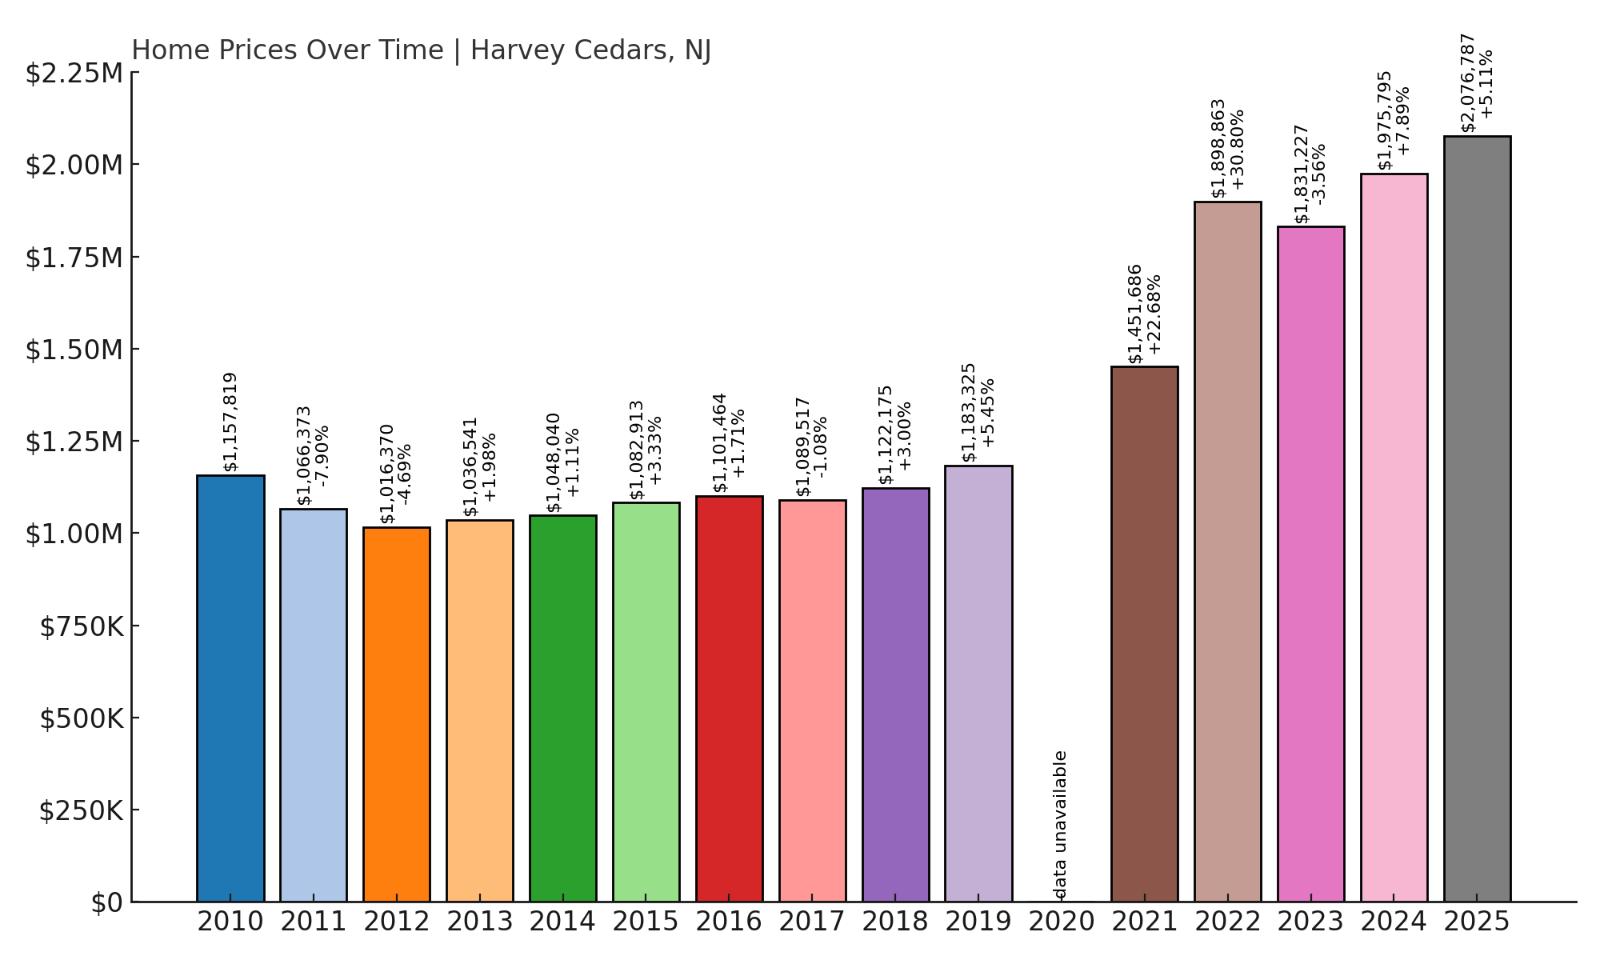
11. Harvey Cedars – 104% Home Price Increase Since 2012
- 2010: $1,157,819
- 2011: $1,066,373 (-$91,446, -7.90% from previous year)
- 2012: $1,016,370 (-$50,003, -4.69% from previous year)
- 2013: $1,036,541 (+$20,171, +1.98% from previous year)
- 2014: $1,048,040 (+$11,498, +1.11% from previous year)
- 2015: $1,082,913 (+$34,873, +3.33% from previous year)
- 2016: $1,101,464 (+$18,552, +1.71% from previous year)
- 2017: $1,089,517 (-$11,947, -1.08% from previous year)
- 2018: $1,122,175 (+$32,658, +3.00% from previous year)
- 2019: $1,183,325 (+$61,150, +5.45% from previous year)
- 2020: N/A
- 2021: $1,451,686 (+$268,361, +22.68% from previous year)
- 2022: $1,898,863 (+$447,177, +30.80% from previous year)
- 2023: $1,831,227 (-$67,636, -3.56% from previous year)
- 2024: $1,975,795 (+$144,568, +7.89% from previous year)
- 2025: $2,076,787 (+$100,993, +5.11% from previous year)
Home prices in Harvey Cedars have grown from $1,016,370 in 2012 to $2,076,787 in 2025, marking a 104% increase. Though prices briefly dipped in 2023, they bounced back strongly the following year, and the overall trend remains firmly upward. Much of the appreciation occurred between 2020 and 2022, when average values jumped by over $700,000 in just two years—a massive gain even by Jersey Shore standards.
Harvey Cedars – Boutique Coastal Living on Long Beach Island
Harvey Cedars is one of the quieter, more residential communities on Long Beach Island, prized for its upscale homes, tight-knit atmosphere, and miles of protected shoreline. Nestled between North Beach and Loveladies, it offers the same beach-and-bay access that defines this barrier island, but with fewer tourists and far less congestion. The borough has long attracted affluent second-home buyers looking for tranquility, natural beauty, and architectural elegance. Many homes in Harvey Cedars are elevated, custom-built residences with rooftop decks, boat docks, and panoramic ocean views. Strict zoning and low turnover mean the housing stock remains relatively small, which contributes to high demand and rising values. Even modest homes here typically command seven-figure price tags, thanks to the area’s consistent popularity and scarcity of listings. The dramatic price increases since 2020 are the result of several converging factors. Pandemic-era migration to less crowded, higher-quality coastal destinations brought a surge of well-financed buyers, many of whom sought remote-work-friendly second homes. That influx created sharp competition for the few available listings and led to multiple years of double-digit appreciation. Today, Harvey Cedars continues to command top-dollar offers, especially for newly constructed homes or those with direct water access. Residents benefit from strong public safety, access to surfing and boating, and a peaceful year-round environment. While the town has little in the way of nightlife or large-scale retail, that’s precisely what many buyers are seeking—privacy, security, and a refined beach lifestyle that only a handful of New Jersey towns can offer at this level.
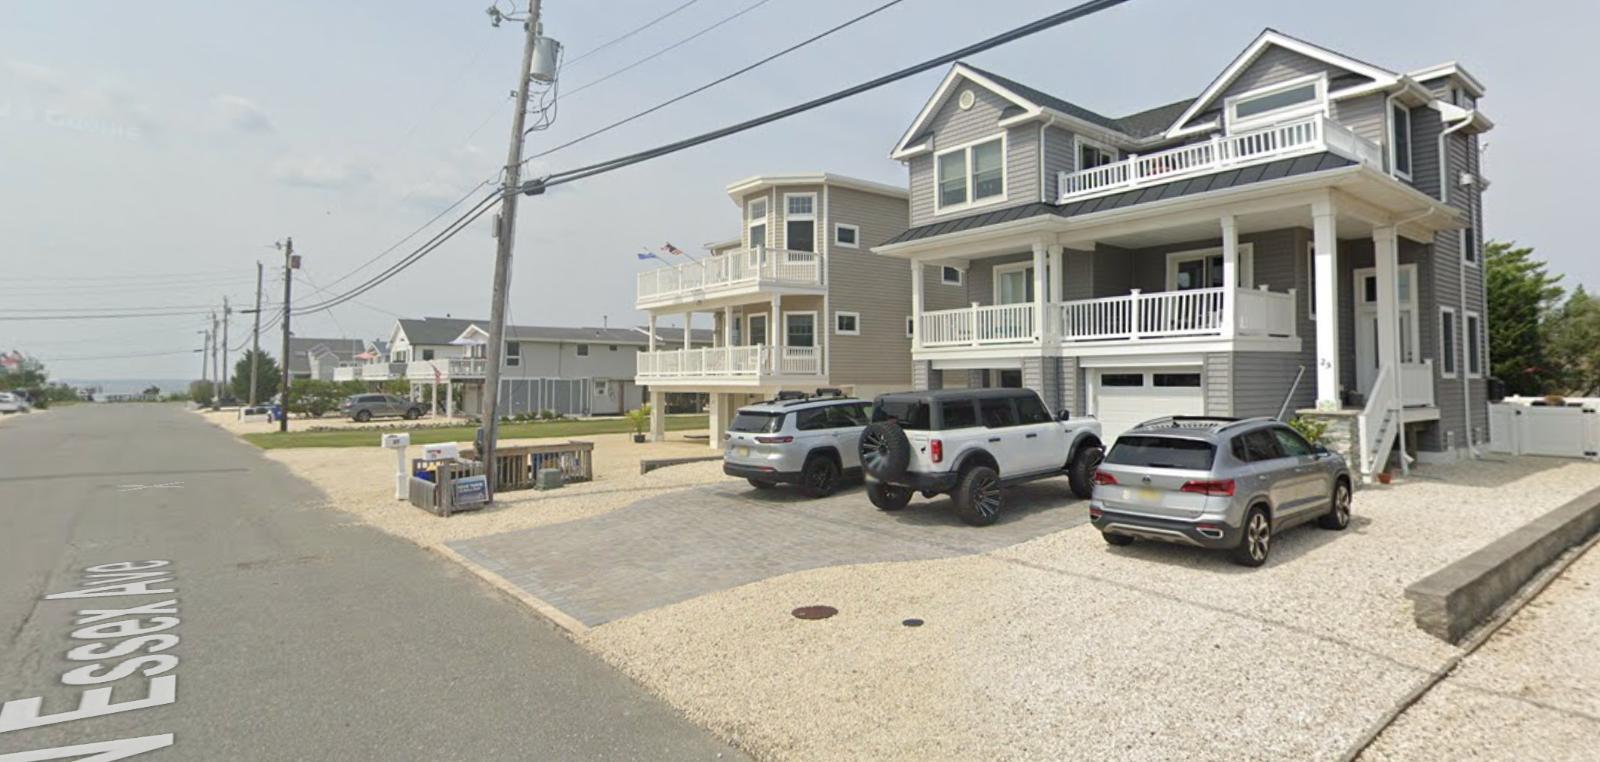
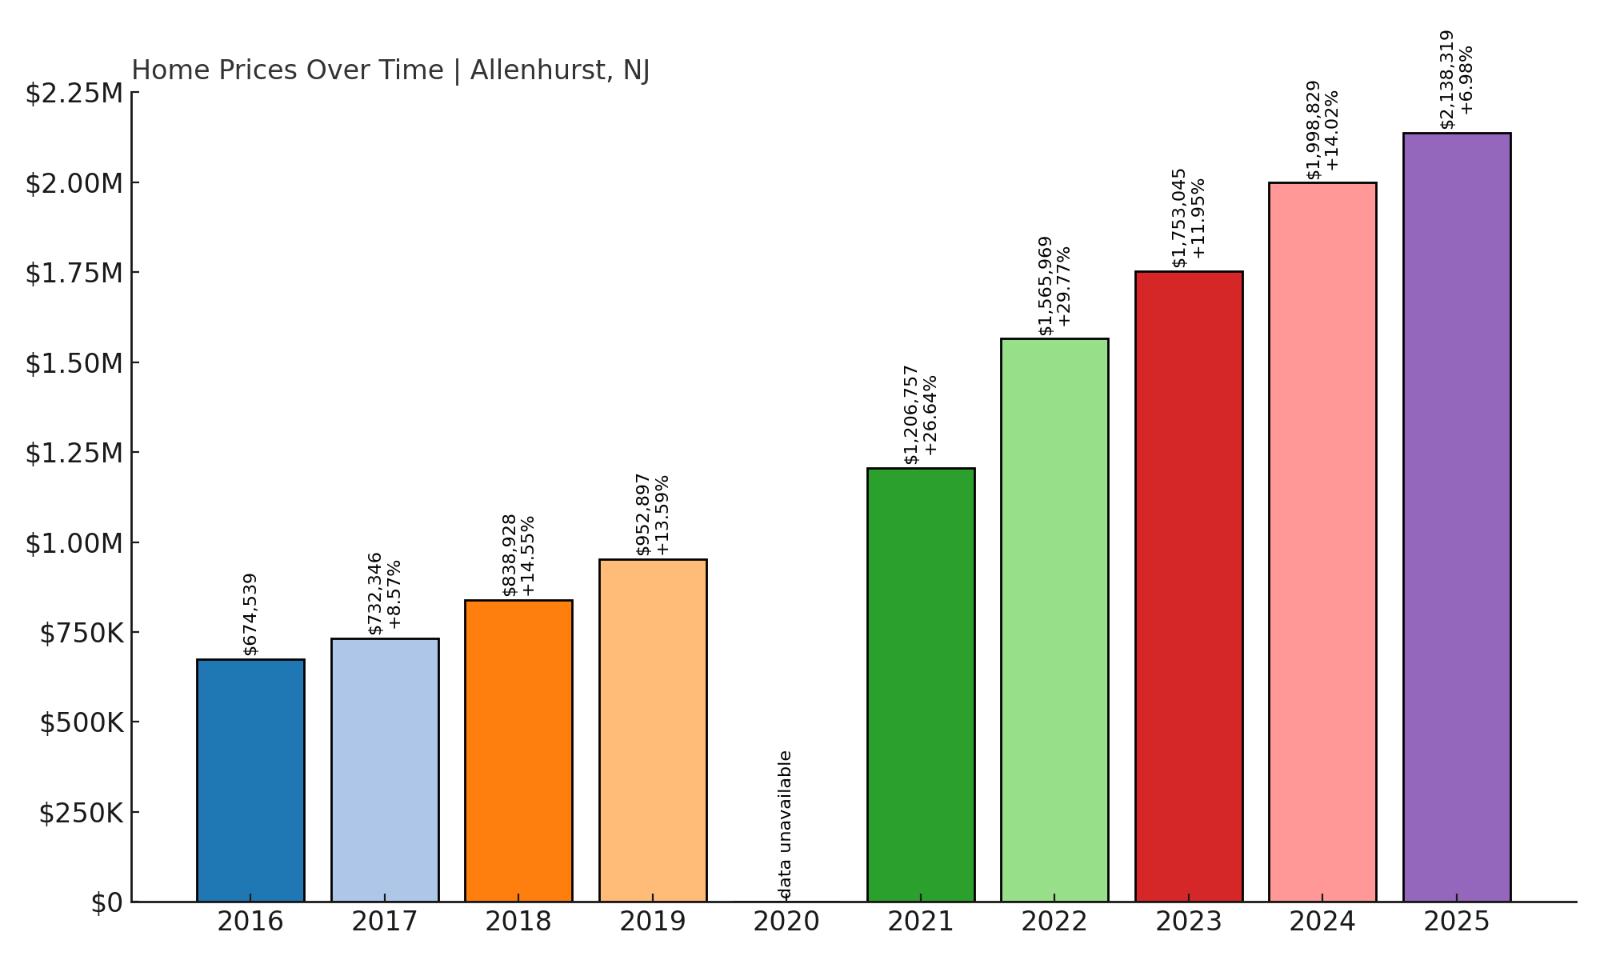
10. Allenhurst – 217% Home Price Increase Since 2016
- 2010: N/A
- 2011: N/A
- 2012: N/A
- 2013: N/A
- 2014: N/A
- 2015: N/A
- 2016: $674,539
- 2017: $732,346 (+$57,807, +8.57% from previous year)
- 2018: $838,928 (+$106,582, +14.55% from previous year)
- 2019: $952,897 (+$113,969, +13.59% from previous year)
- 2020: N/A
- 2021: $1,206,757 (+$253,860, +26.64% from previous year)
- 2022: $1,565,969 (+$359,212, +29.77% from previous year)
- 2023: $1,753,045 (+$187,076, +11.95% from previous year)
- 2024: $1,998,829 (+$245,785, +14.02% from previous year)
- 2025: $2,138,319 (+$139,489, +6.98% from previous year)
Allenhurst has experienced a staggering 217% increase in home values since 2016, climbing from $674,539 to over $2.13 million in 2025. That kind of appreciation is rare even among New Jersey’s most elite towns. The largest spikes occurred between 2020 and 2022, when values nearly doubled in just two years. Prices have continued to rise year after year, with no single annual loss reported in the post-2016 data.
Allenhurst – An Architectural Treasure Near Asbury Park
Allenhurst is a small, exclusive borough in Monmouth County nestled between Deal and Asbury Park. Known for its stunning early 20th-century architecture and large lots, the town is filled with stately homes that reflect a bygone era of grandeur. Many residences are historic estates with manicured lawns, spacious porches, and period details that have been meticulously preserved or restored. The borough also benefits from its own quiet beach, a private cabana club, and a serene, low-traffic environment that appeals to high-net-worth individuals seeking privacy. Inventory is almost always low, and when a property does hit the market, it’s usually priced in the multimillion-dollar range—especially if it’s within walking distance of the beach or Allenhurst train station. The town’s dramatic price appreciation can be traced to both its exclusivity and its strategic location. With direct train access to Manhattan and proximity to both luxury and cultural hubs like Red Bank and Asbury Park, Allenhurst blends prestige with convenience. Its zoning laws limit density and preserve the town’s old-world charm, which adds to its long-term real estate value. This is not a town for speculative investors—homes here often stay in families for generations. That stability, combined with soaring demand from remote workers and legacy buyers, has made Allenhurst one of the fastest-appreciating towns in the state, despite its relatively small size and profile.
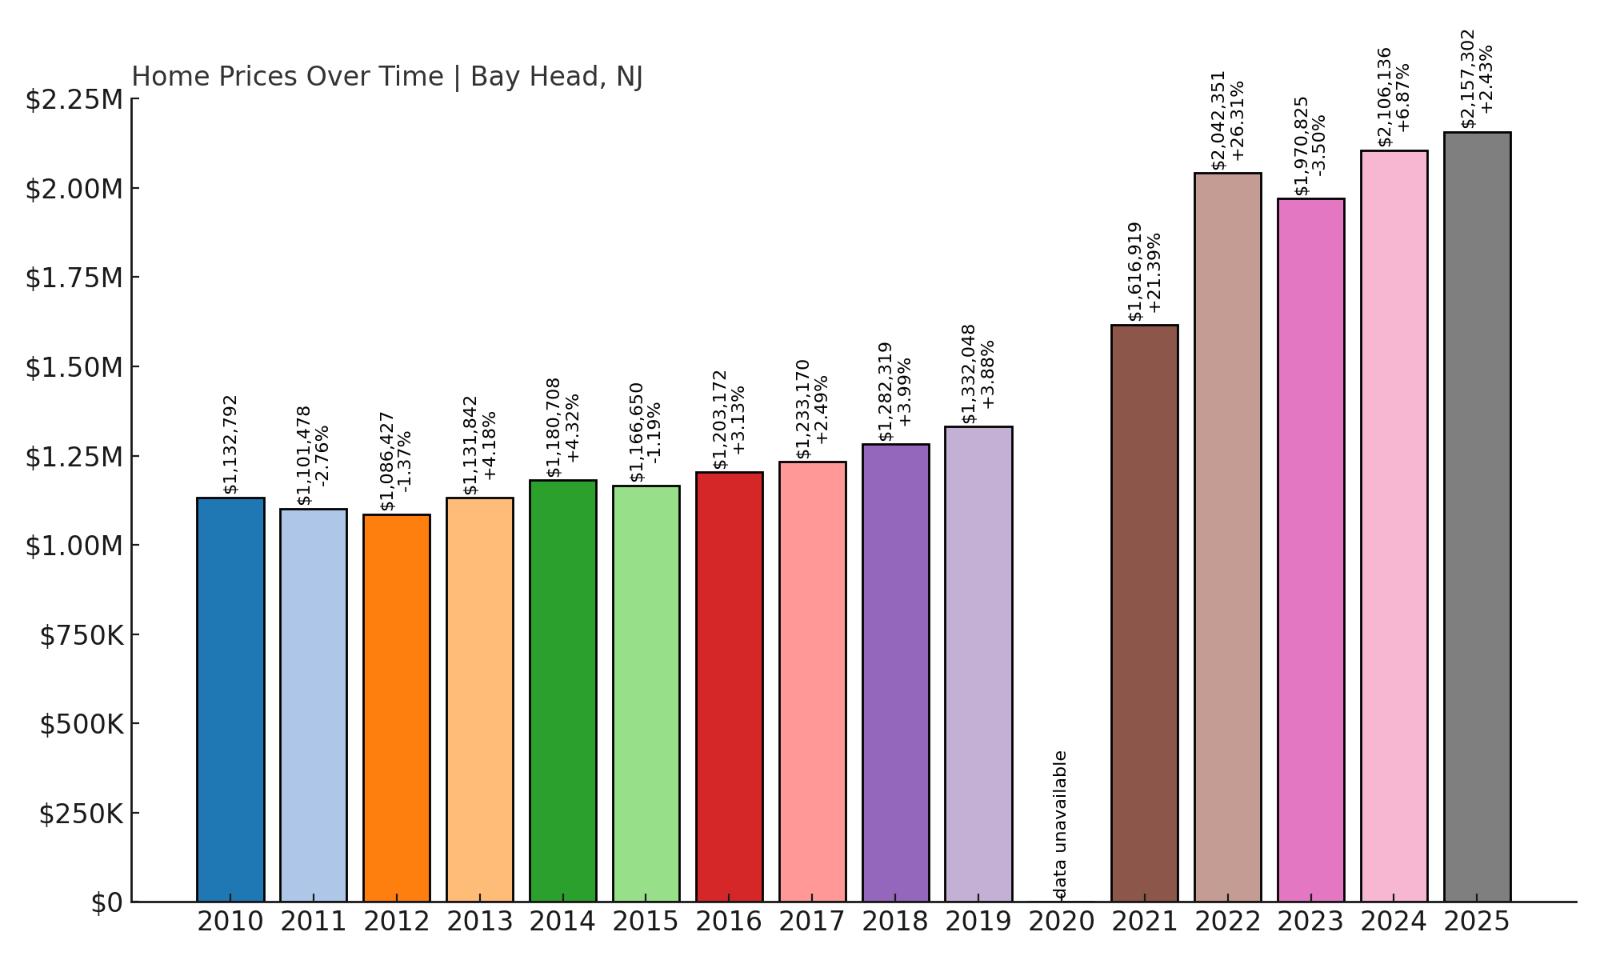
9. Bay Head – 90% Home Price Increase Since 2012
Would you like to save this?
- 2010: $1,132,792
- 2011: $1,101,478 (-$31,313, -2.76% from previous year)
- 2012: $1,086,427 (-$15,052, -1.37% from previous year)
- 2013: $1,131,842 (+$45,415, +4.18% from previous year)
- 2014: $1,180,708 (+$48,865, +4.32% from previous year)
- 2015: $1,166,650 (-$14,058, -1.19% from previous year)
- 2016: $1,203,172 (+$36,523, +3.13% from previous year)
- 2017: $1,233,170 (+$29,998, +2.49% from previous year)
- 2018: $1,282,319 (+$49,148, +3.99% from previous year)
- 2019: $1,332,048 (+$49,729, +3.88% from previous year)
- 2020: N/A
- 2021: $1,616,919 (+$284,871, +21.39% from previous year)
- 2022: $2,042,351 (+$425,433, +26.31% from previous year)
- 2023: $1,970,825 (-$71,526, -3.50% from previous year)
- 2024: $2,106,136 (+$135,310, +6.87% from previous year)
- 2025: $2,157,302 (+$51,167, +2.43% from previous year)
Bay Head’s home values have climbed from $1,086,427 in 2012 to $2,157,302 in 2025, an increase of roughly 90%. The biggest surge occurred between 2020 and 2022, when average prices jumped by over $700,000. While there was a slight drop in 2023, values rebounded the following year and have continued upward into 2025.
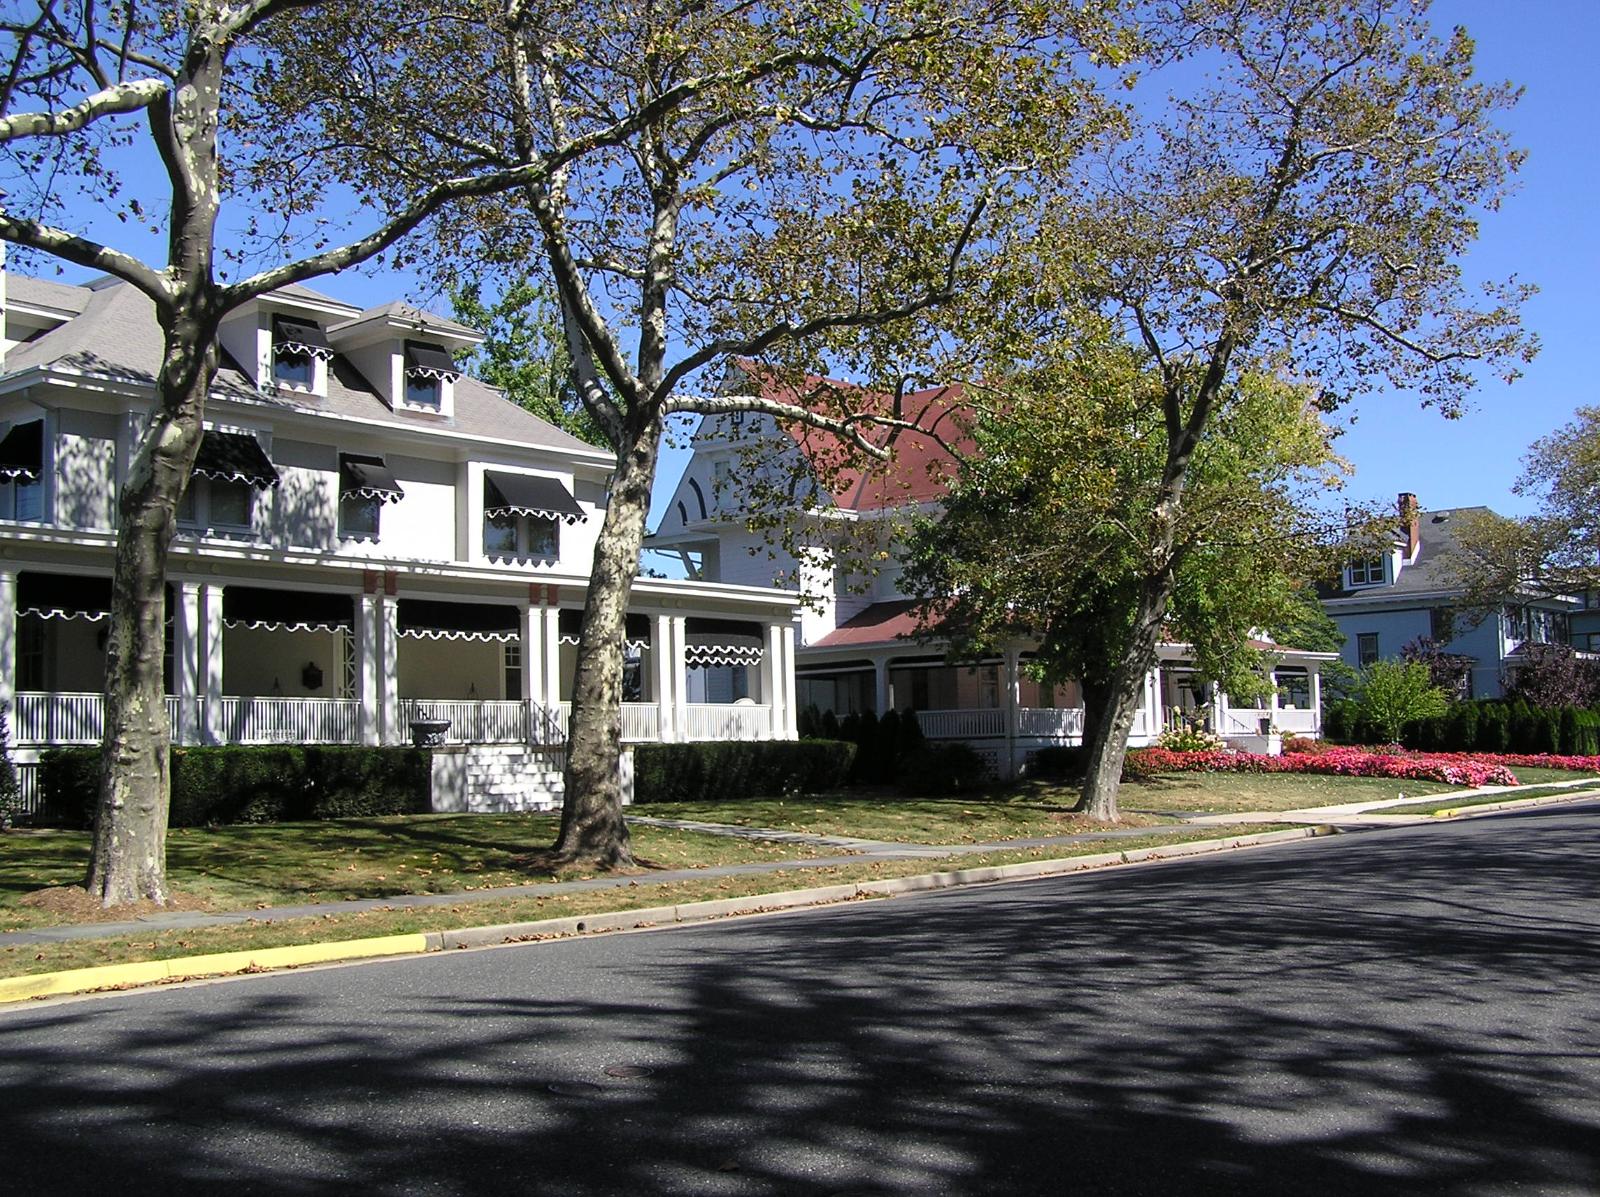
Bay Head – Classic Elegance Along the Oceanfront
Bay Head is one of the most refined and historic communities along the northern Jersey Shore. The town is known for its timeless shingle-style architecture, meticulously landscaped properties, and strong sense of community. With limited commercial development and a strong emphasis on preservation, Bay Head has retained much of its 19th-century charm. Many homes here are located just steps from the Atlantic, and waterfront listings are among the most expensive in the state. The train station offers direct access to New York City, attracting professionals who want a peaceful weekend retreat without a long drive. Residents also benefit from excellent boating opportunities thanks to nearby Barnegat Bay. Demand in Bay Head has remained consistently high because of its reputation for stability and exclusivity. Buyers often include multigenerational families looking to establish roots and high-income professionals purchasing second homes. The town’s emphasis on architectural preservation and controlled development ensures that values remain insulated from oversupply. As more buyers shift focus to lifestyle and legacy properties, Bay Head continues to hold strong as a top-tier coastal market with long-term appeal.
8. Saddle River – 60% Home Price Increase Since 2012
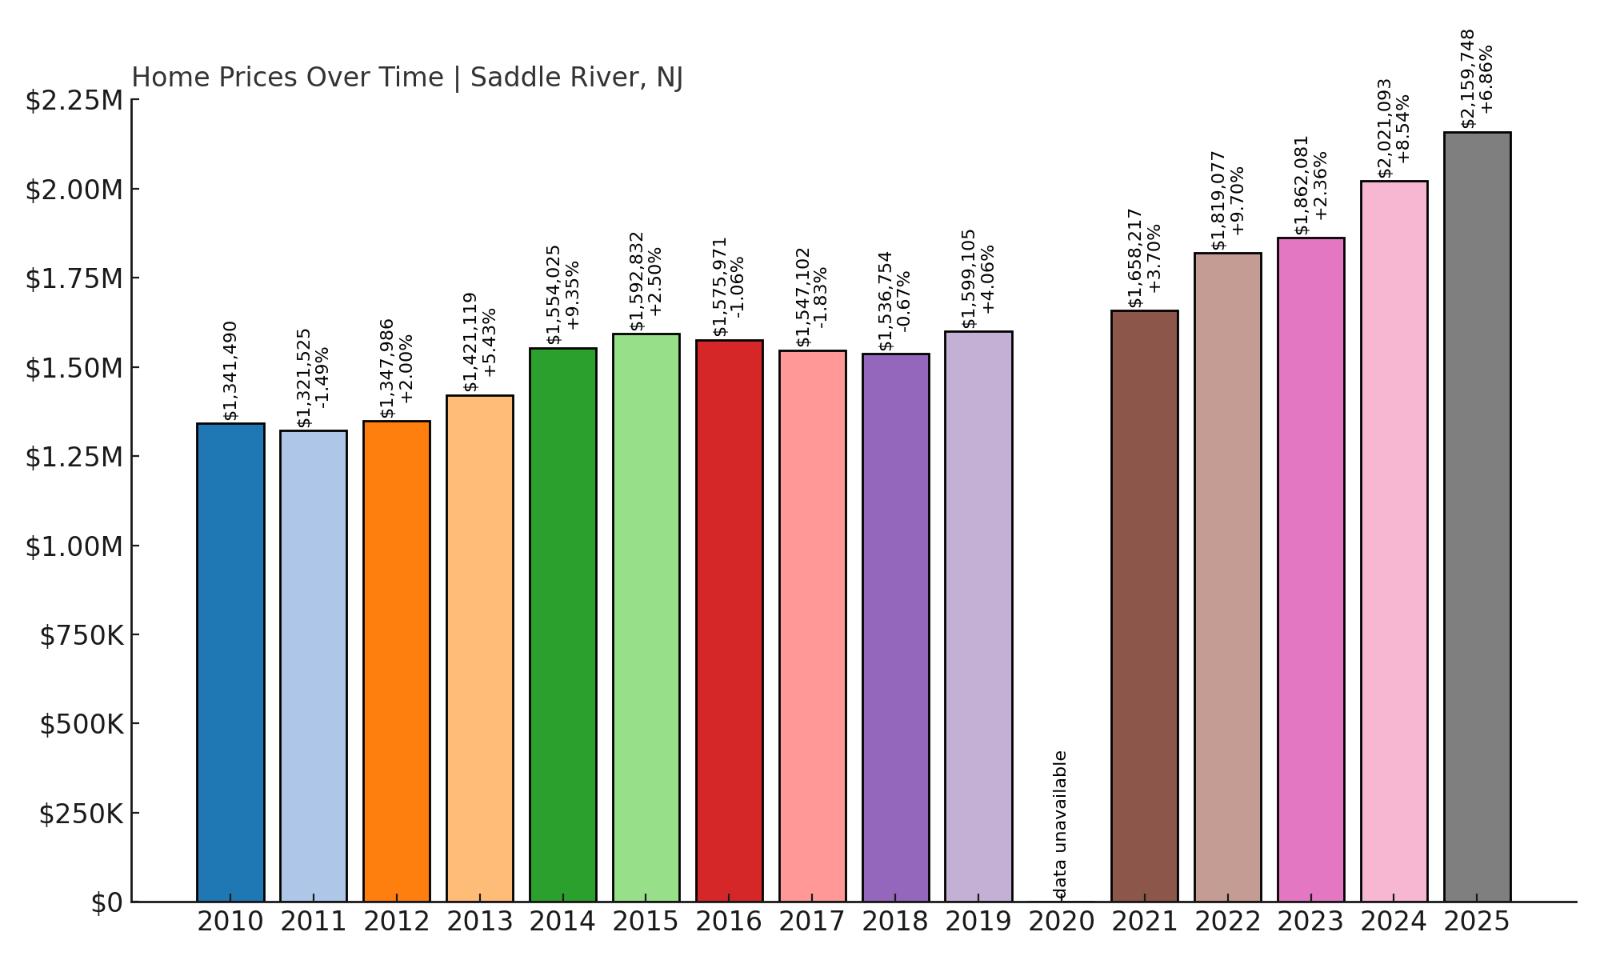
- 2010: $1,341,490
- 2011: $1,321,525 (-$19,965, -1.49% from previous year)
- 2012: $1,347,986 (+$26,461, +2.00% from previous year)
- 2013: $1,421,119 (+$73,133, +5.43% from previous year)
- 2014: $1,554,025 (+$132,906, +9.35% from previous year)
- 2015: $1,592,832 (+$38,807, +2.50% from previous year)
- 2016: $1,575,971 (-$16,861, -1.06% from previous year)
- 2017: $1,547,102 (-$28,869, -1.83% from previous year)
- 2018: $1,536,754 (-$10,347, -0.67% from previous year)
- 2019: $1,599,105 (+$62,351, +4.06% from previous year)
- 2020: N/A
- 2021: $1,658,217 (+$59,111, +3.70% from previous year)
- 2022: $1,819,077 (+$160,860, +9.70% from previous year)
- 2023: $1,862,081 (+$43,004, +2.36% from previous year)
- 2024: $2,021,093 (+$159,012, +8.54% from previous year)
- 2025: $2,159,748 (+$138,655, +6.86% from previous year)
Saddle River’s home prices have increased from $1,347,986 in 2012 to $2,159,748 in 2025, reflecting a 60% growth over that span. The town’s real estate market saw moderate fluctuations in the late 2010s, followed by consistent growth starting in 2020. In the last five years alone, prices have climbed more than $500,000, driven by renewed interest in large-lot suburban living.
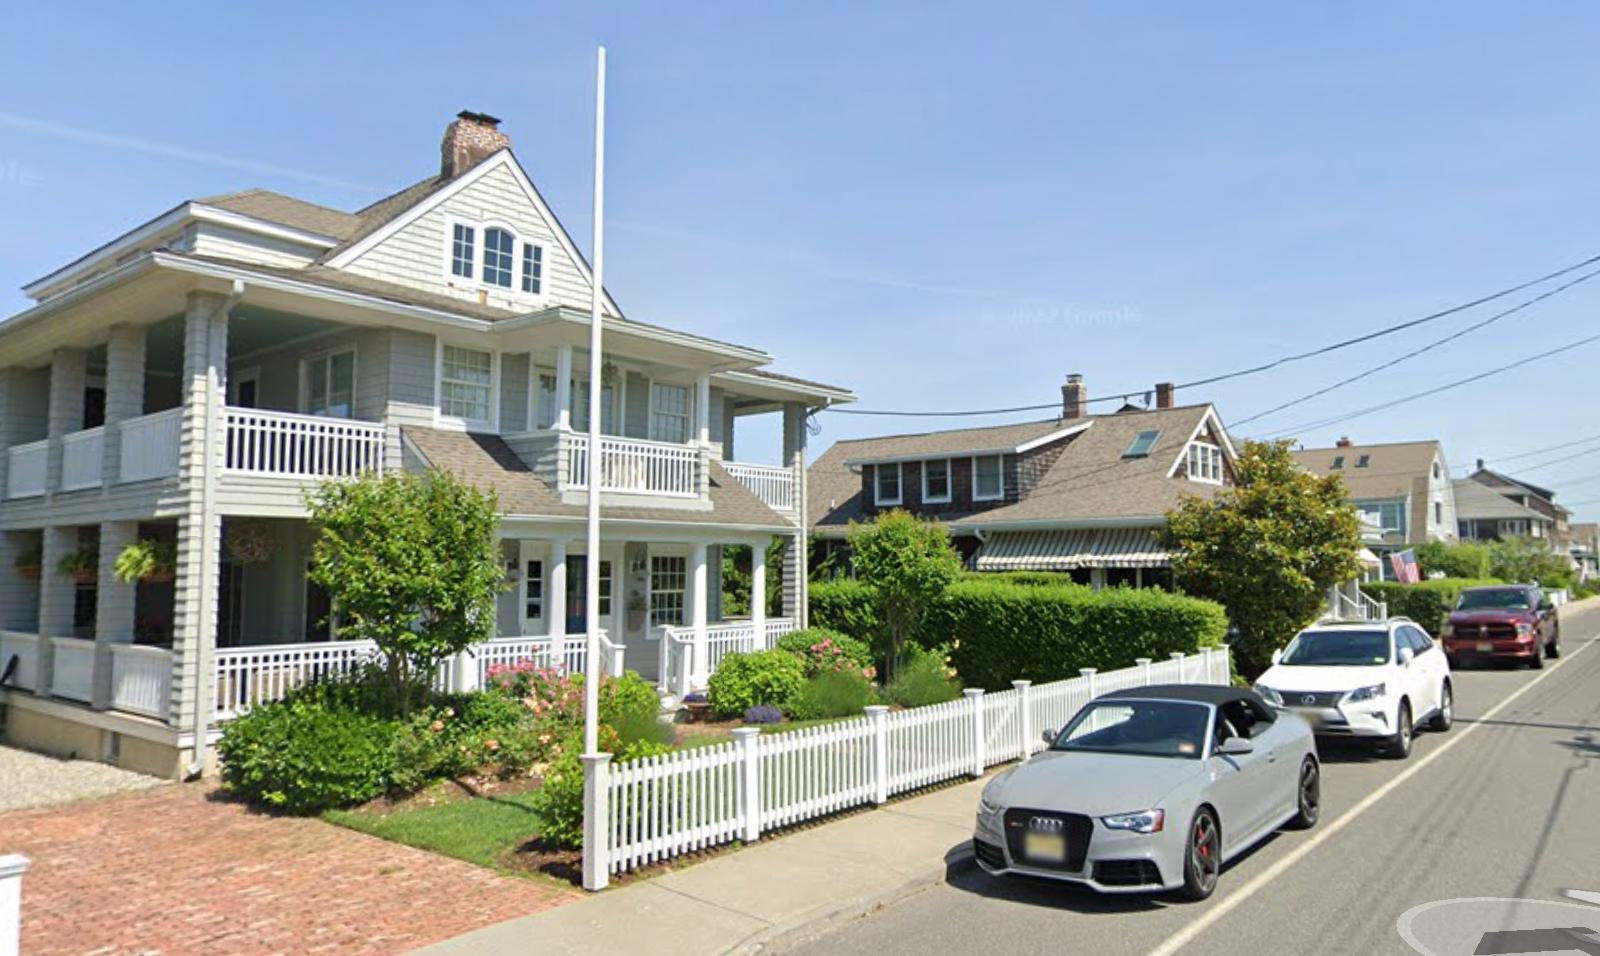
Saddle River – Estate Living Just Outside the City
Tucked away in Bergen County, Saddle River is synonymous with grand estates, wooded lots, and quiet luxury. The town is zoned for single-family homes on large parcels, resulting in a peaceful, spacious setting with very little commercial activity. Its appeal lies in its blend of privacy and accessibility—residents enjoy a secluded environment while remaining within an hour’s drive of Manhattan. Homes here often exceed 5,000 square feet and feature amenities like gated entrances, home theaters, and private pools. The town has long attracted celebrities, business executives, and legacy families looking for discretion and prestige. Saddle River’s consistent home price appreciation can be traced to its enduring status as one of North Jersey’s most affluent addresses. Limited turnover and strict zoning mean new construction is rare, keeping inventory tight. Even during downturns, the town tends to weather market volatility better than most. The surge in post-2020 prices reflects a broader trend toward low-density, high-end suburban communities. For buyers prioritizing space, architecture, and long-term value, Saddle River remains one of New Jersey’s most coveted zip codes.
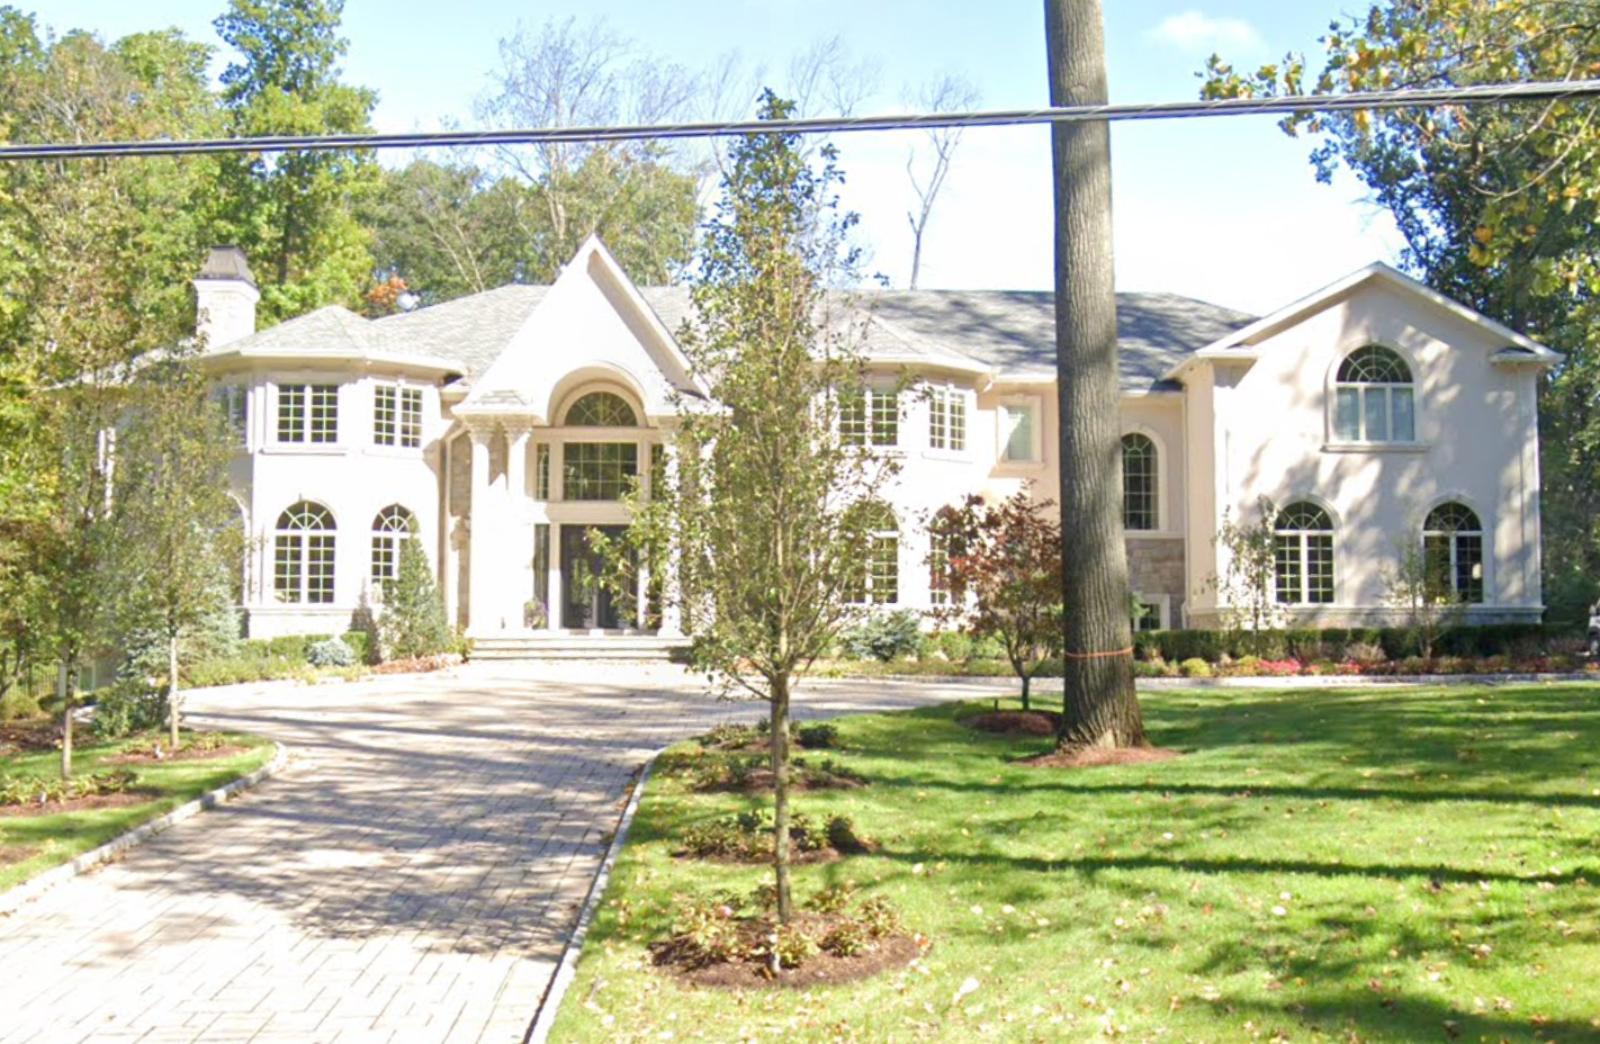
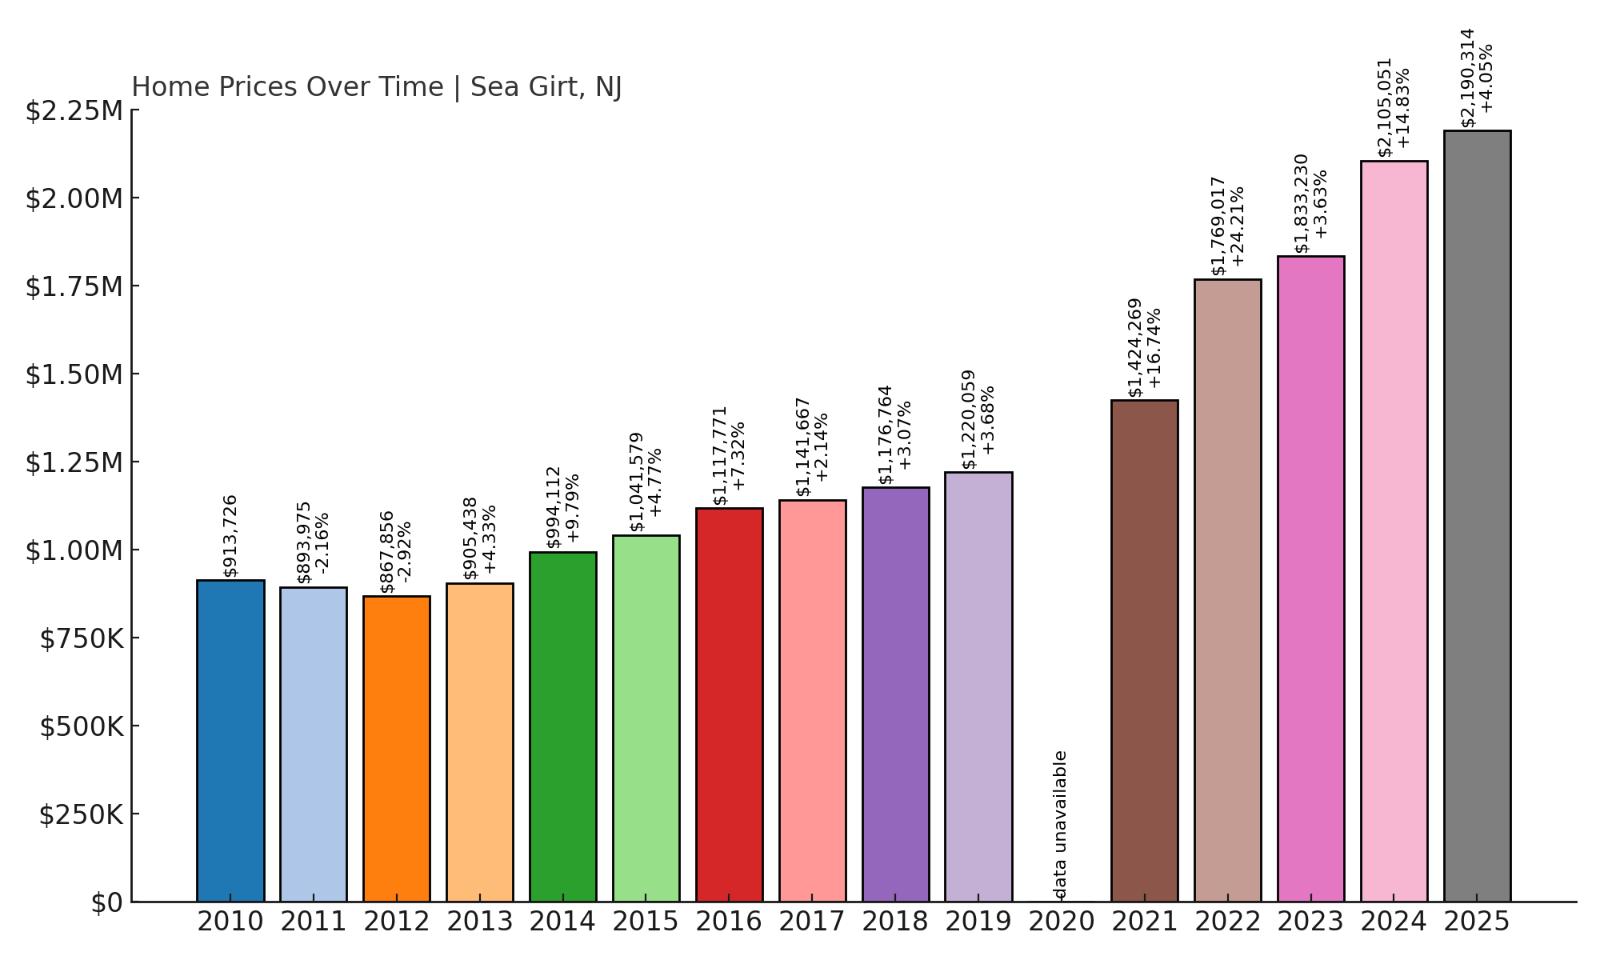
7. Sea Girt – 153% Home Price Increase Since 2012
- 2010: $913,726
- 2011: $893,975 (-$19,750, -2.16% from previous year)
- 2012: $867,856 (-$26,119, -2.92% from previous year)
- 2013: $905,438 (+$37,582, +4.33% from previous year)
- 2014: $994,112 (+$88,674, +9.79% from previous year)
- 2015: $1,041,579 (+$47,467, +4.77% from previous year)
- 2016: $1,117,771 (+$76,192, +7.32% from previous year)
- 2017: $1,141,667 (+$23,896, +2.14% from previous year)
- 2018: $1,176,764 (+$35,097, +3.07% from previous year)
- 2019: $1,220,059 (+$43,295, +3.68% from previous year)
- 2020: N/A
- 2021: $1,424,269 (+$204,210, +16.74% from previous year)
- 2022: $1,769,017 (+$344,748, +24.21% from previous year)
- 2023: $1,833,230 (+$64,213, +3.63% from previous year)
- 2024: $2,105,051 (+$271,821, +14.83% from previous year)
- 2025: $2,190,314 (+$85,263, +4.05% from previous year)
From $867,856 in 2012 to $2,190,314 in 2025, Sea Girt’s housing market has posted a remarkable 153% increase in home prices. Much of that growth occurred after 2020, with a steep two-year climb and continued appreciation in 2023 and beyond. Even with steady growth, prices remain resilient, indicating strong long-term demand.
Sea Girt – Tranquil Beaches and Million-Dollar Curb Appeal
Sea Girt is a compact, upscale borough in Monmouth County, known for its postcard-perfect residential streets and quiet beaches. It’s a place where real estate rarely hits the open market for long, and where each block features well-kept lawns, traditional homes, and coastal serenity. The town’s strong community spirit and small size make it an ideal location for year-round residents as well as second-home buyers. Sea Girt also boasts a well-maintained boardwalk and lighthouse, adding historical charm to an already prestigious setting. Its location just south of Spring Lake enhances its profile, offering the same quality of life with slightly more privacy. High-performing schools, walkable streets, and extremely limited turnover have helped keep Sea Girt’s home values climbing year after year. Buyers are drawn to the mix of small-town intimacy and large-scale property values. Even modest homes here regularly cross the $2 million mark, and the competition for listings remains fierce. With no plans for expansion and a buyer pool that skews toward well-capitalized professionals and retirees, Sea Girt’s value trajectory appears likely to continue upward.
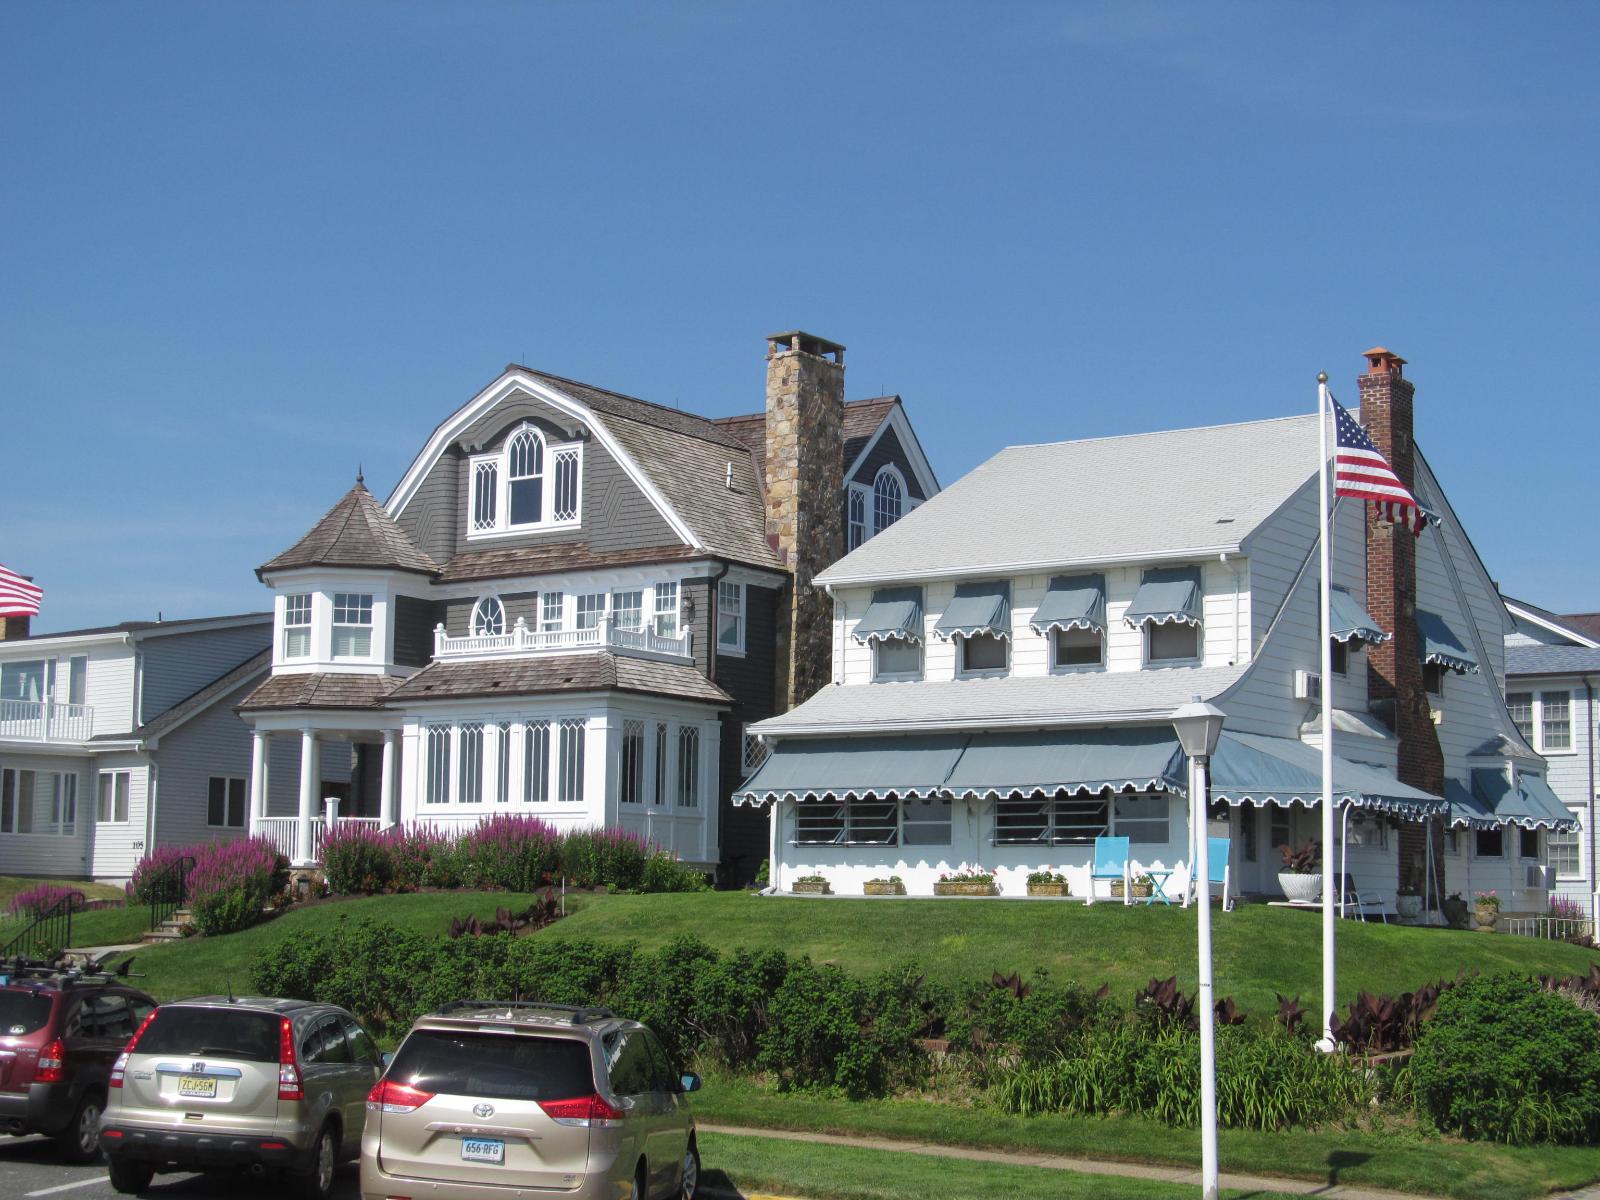
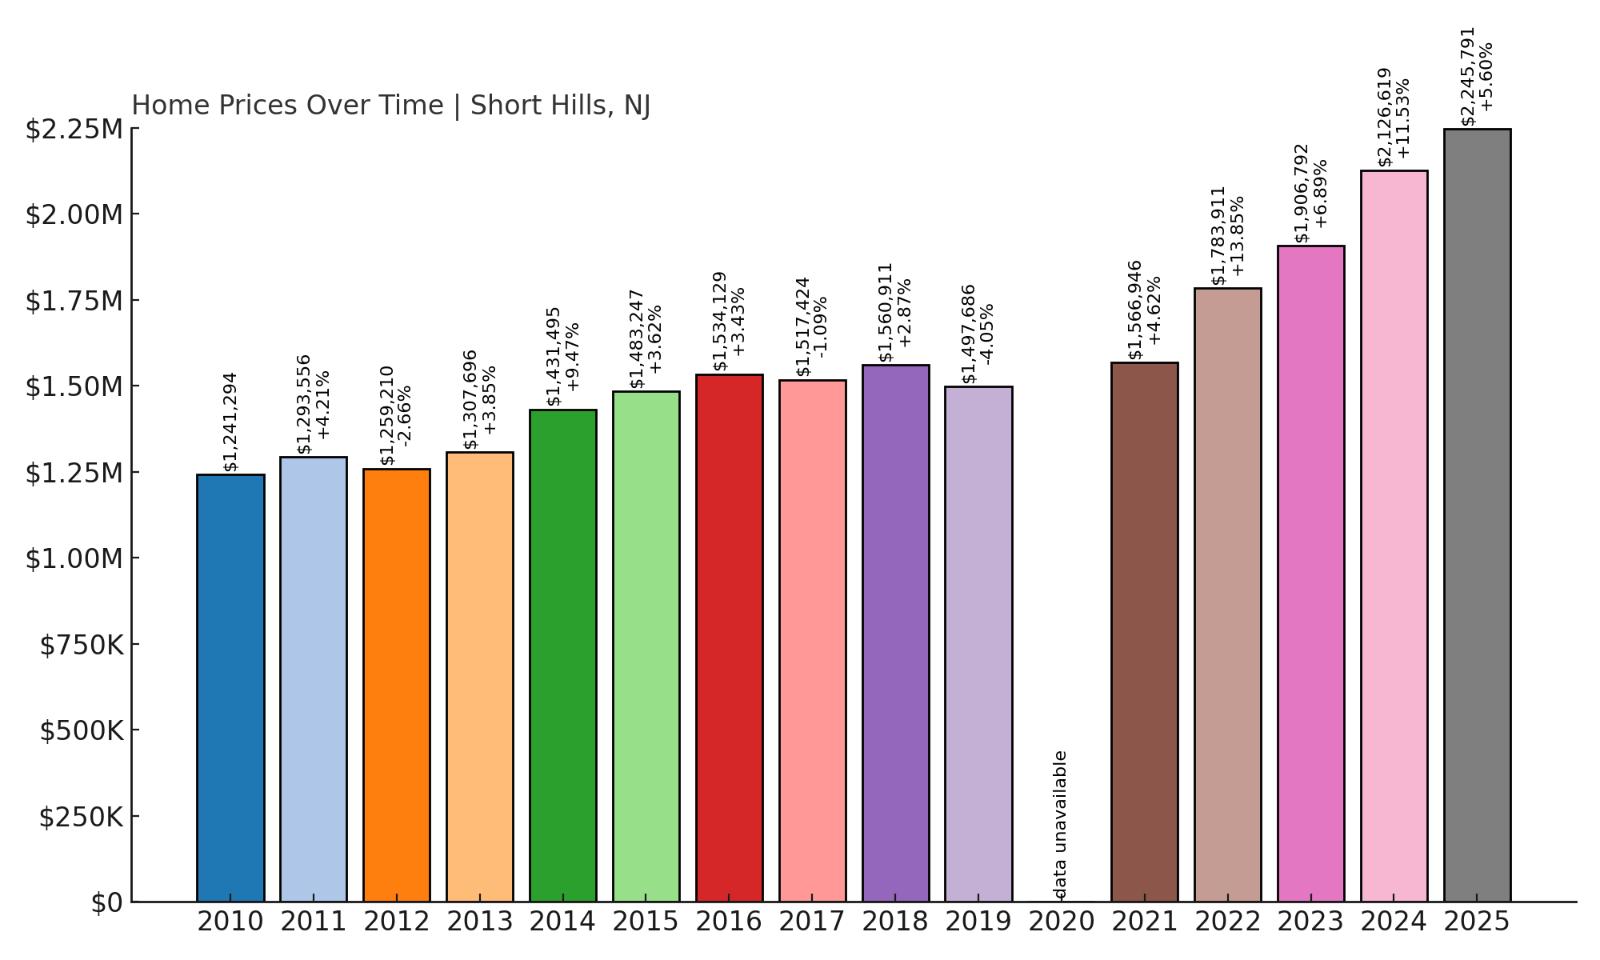
6. Short Hills – 78% Home Price Increase Since 2012
- 2010: $1,241,294
- 2011: $1,293,556 (+$52,262, +4.21% from previous year)
- 2012: $1,259,210 (-$34,345, -2.66% from previous year)
- 2013: $1,307,696 (+$48,485, +3.85% from previous year)
- 2014: $1,431,495 (+$123,799, +9.47% from previous year)
- 2015: $1,483,247 (+$51,752, +3.62% from previous year)
- 2016: $1,534,129 (+$50,882, +3.43% from previous year)
- 2017: $1,517,424 (-$16,705, -1.09% from previous year)
- 2018: $1,560,911 (+$43,487, +2.87% from previous year)
- 2019: $1,497,686 (-$63,225, -4.05% from previous year)
- 2020: N/A
- 2021: $1,566,946 (+$69,260, +4.62% from previous year)
- 2022: $1,783,911 (+$216,965, +13.85% from previous year)
- 2023: $1,906,792 (+$122,881, +6.89% from previous year)
- 2024: $2,126,619 (+$219,827, +11.53% from previous year)
- 2025: $2,245,791 (+$119,172, +5.60% from previous year)
Short Hills has posted a 78% increase in average home prices since 2012, climbing from $1.26 million to $2.25 million in 2025. While the market experienced some fluctuations in the late 2010s, it began rising again after 2020, with notable double-digit growth in 2022 and 2024. Its consistent recovery and sustained buyer interest confirm its position among New Jersey’s most desirable zip codes.
Short Hills – Classic Luxury With City Access
Short Hills, a section of Millburn Township in Essex County, is one of the most prestigious commuter suburbs in the New York metro area. It’s best known for its expansive homes, wooded neighborhoods, and highly ranked public school system. Many buyers are drawn by the NJ Transit direct rail service to Manhattan and the town’s proximity to major highways. The area offers a mix of historic estates and modern luxury homes, often set on large lots with upscale finishes. Residents enjoy quiet streets, a strong sense of community, and close access to the upscale Short Hills Mall, one of the most exclusive shopping centers in the region. Because of strict zoning and limited land, new construction is rare, keeping inventory tight and prices elevated. The post-2020 surge in home values reflects a broader shift in buyer priorities—demand for larger homes, more outdoor space, and flexible work environments favored towns like Short Hills. The town appeals especially to high-earning professionals looking for long-term family residences, rather than speculative flips. As a result, the market has remained stable and competitive, even as some surrounding areas have cooled. With continued interest from finance and tech professionals relocating from New York City, Short Hills remains one of the most stable and high-performing real estate markets in the state.
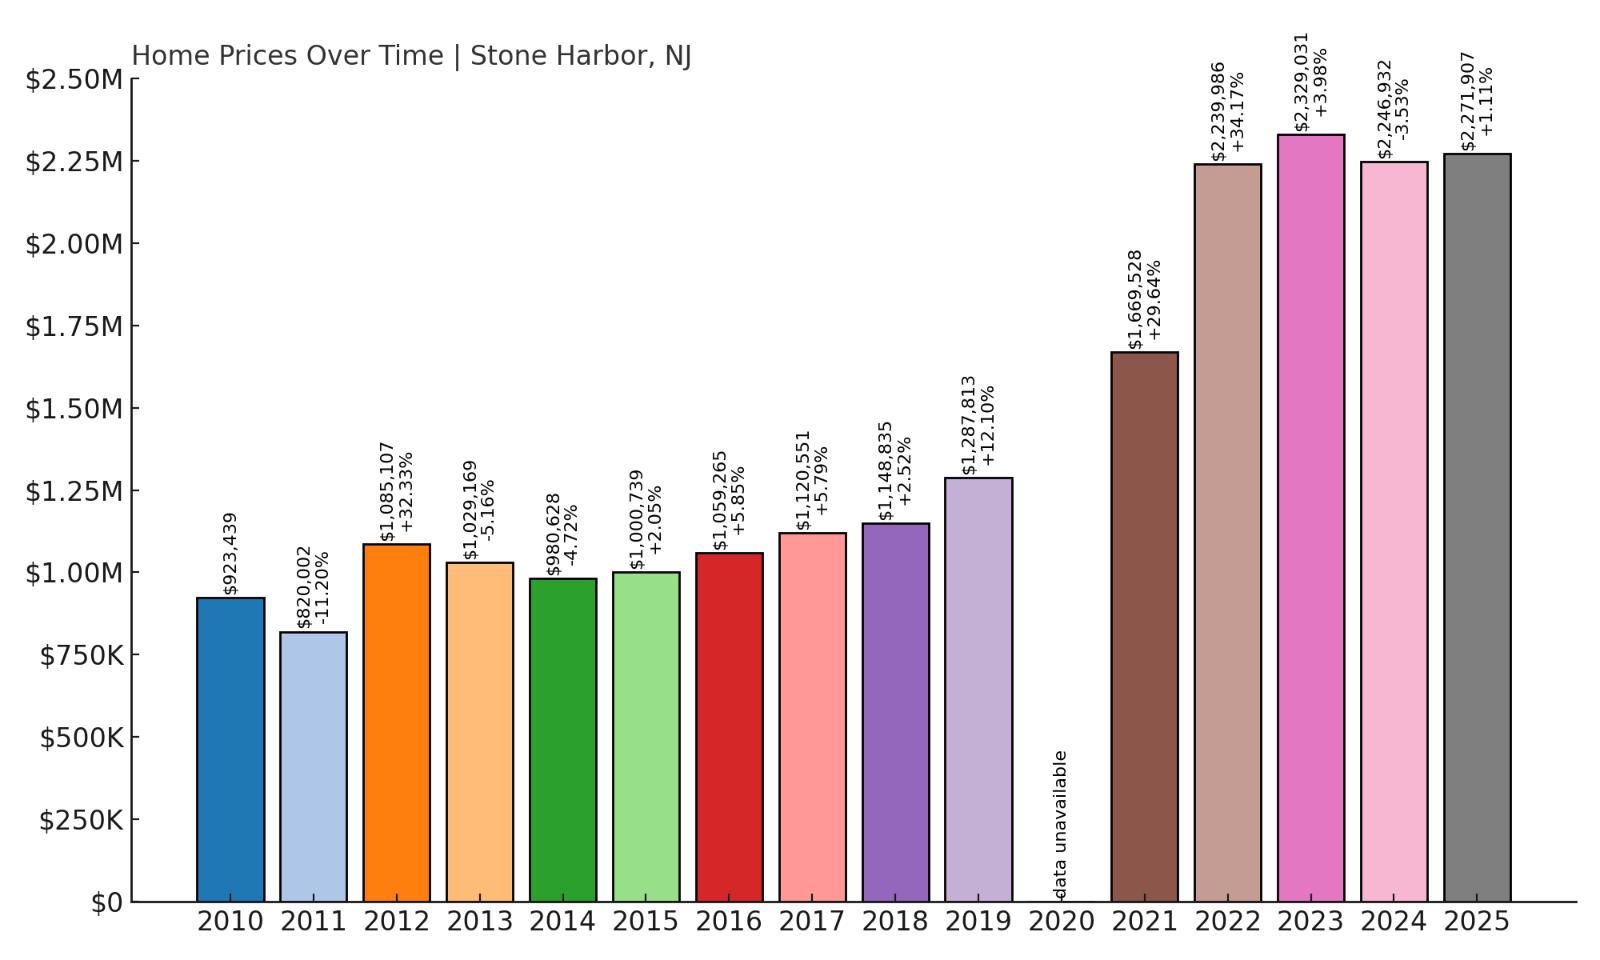
5. Stone Harbor – 109% Home Price Increase Since 2012
- 2010: $923,439
- 2011: $820,002 (-$103,437, -11.20% from previous year)
- 2012: $1,085,107 (+$265,105, +32.33% from previous year)
- 2013: $1,029,169 (-$55,938, -5.16% from previous year)
- 2014: $980,628 (-$48,541, -4.72% from previous year)
- 2015: $1,000,739 (+$20,112, +2.05% from previous year)
- 2016: $1,059,265 (+$58,526, +5.85% from previous year)
- 2017: $1,120,551 (+$61,286, +5.79% from previous year)
- 2018: $1,148,835 (+$28,283, +2.52% from previous year)
- 2019: $1,287,813 (+$138,978, +12.10% from previous year)
- 2020: N/A
- 2021: $1,669,528 (+$381,715, +29.64% from previous year)
- 2022: $2,239,986 (+$570,458, +34.17% from previous year)
- 2023: $2,329,031 (+$89,045, +3.98% from previous year)
- 2024: $2,246,932 (-$82,099, -3.53% from previous year)
- 2025: $2,271,907 (+$24,976, +1.11% from previous year)
Stone Harbor’s home values rose from $1,085,107 in 2012 to $2,271,907 in 2025, a 109% increase. Prices more than doubled in that period, driven heavily by massive gains in 2021 and 2022, when values jumped by nearly $1 million. Though growth has slowed in recent years, Stone Harbor’s property values remain among the highest in the state.
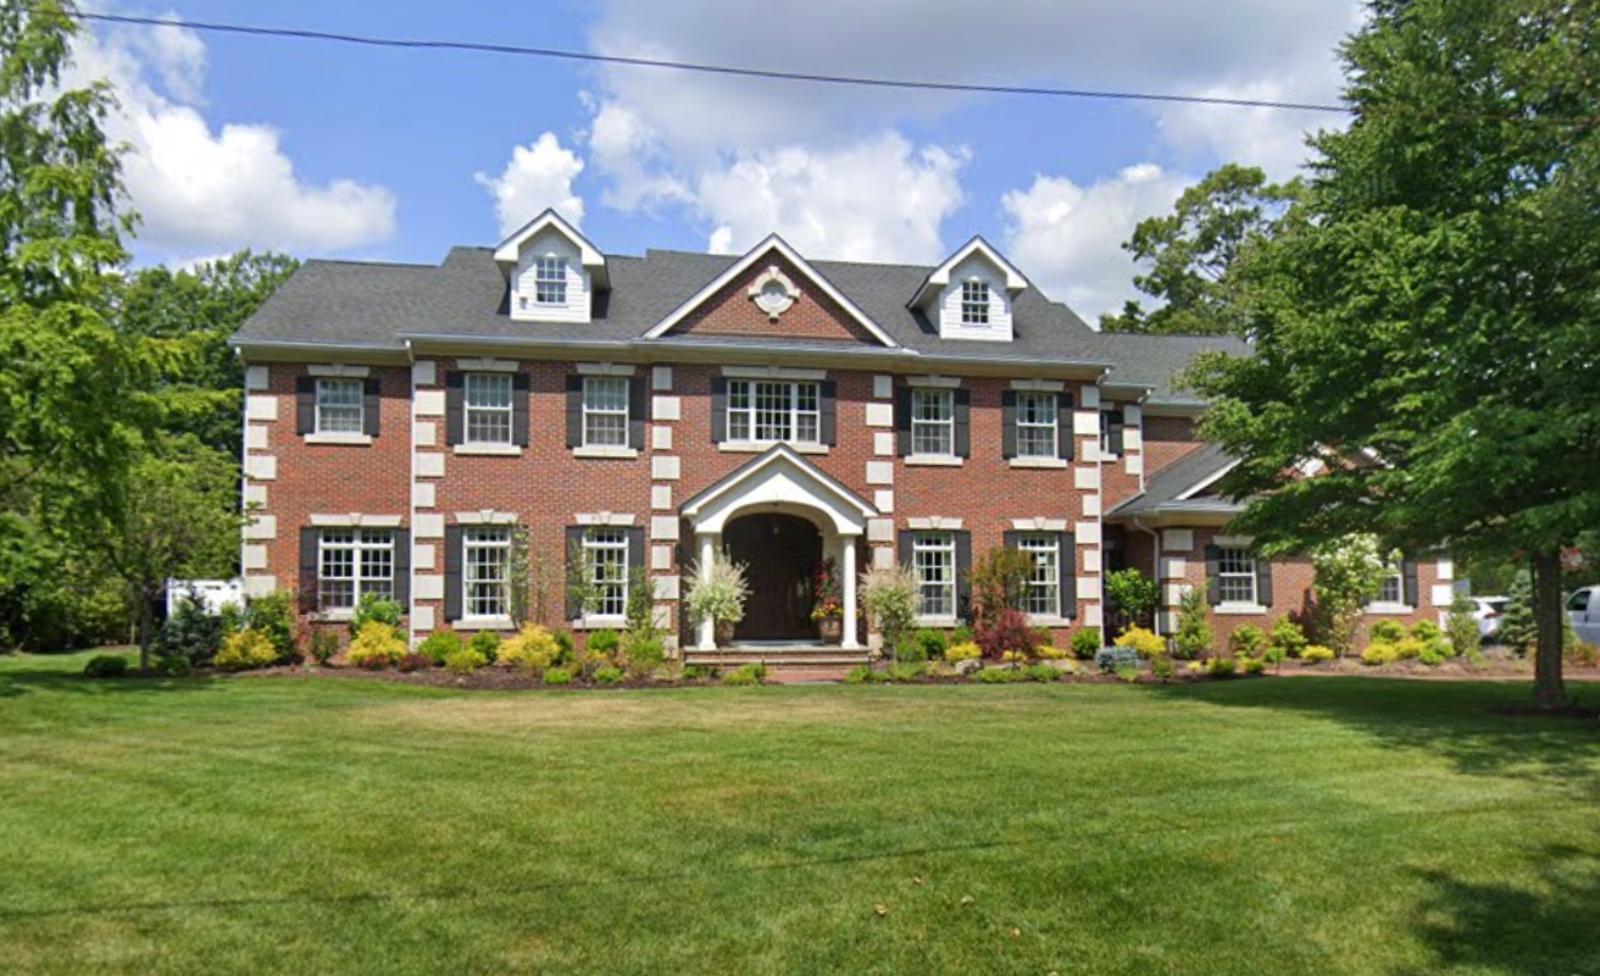
Stone Harbor – Beachfront Wealth in Cape May County
Stone Harbor is one of New Jersey’s most prestigious shore communities, located on the Seven Mile Island in Cape May County. Known for its luxurious oceanfront properties and quiet, upscale atmosphere, the town caters to a wealthy clientele seeking serenity and exclusivity. The downtown area is charming but subdued, featuring high-end boutiques, art galleries, and gourmet restaurants. Zoning regulations limit high-rise construction and overdevelopment, which preserves the borough’s peaceful vibe and drives demand for existing homes. Waterfront estates in Stone Harbor often sell for $4 million or more, making it one of the most expensive coastal markets in the state. The pandemic years fueled demand for second homes, and Stone Harbor’s limited housing supply meant bidding wars became the norm. Even as the market cooled slightly after 2022, values stabilized at record levels. Buyers here are typically long-term investors or families looking for multi-generational beach homes, not flippers or speculators. With little buildable land remaining and consistently high demand, Stone Harbor’s home prices have held firm, reflecting its elite status along the Jersey Shore.
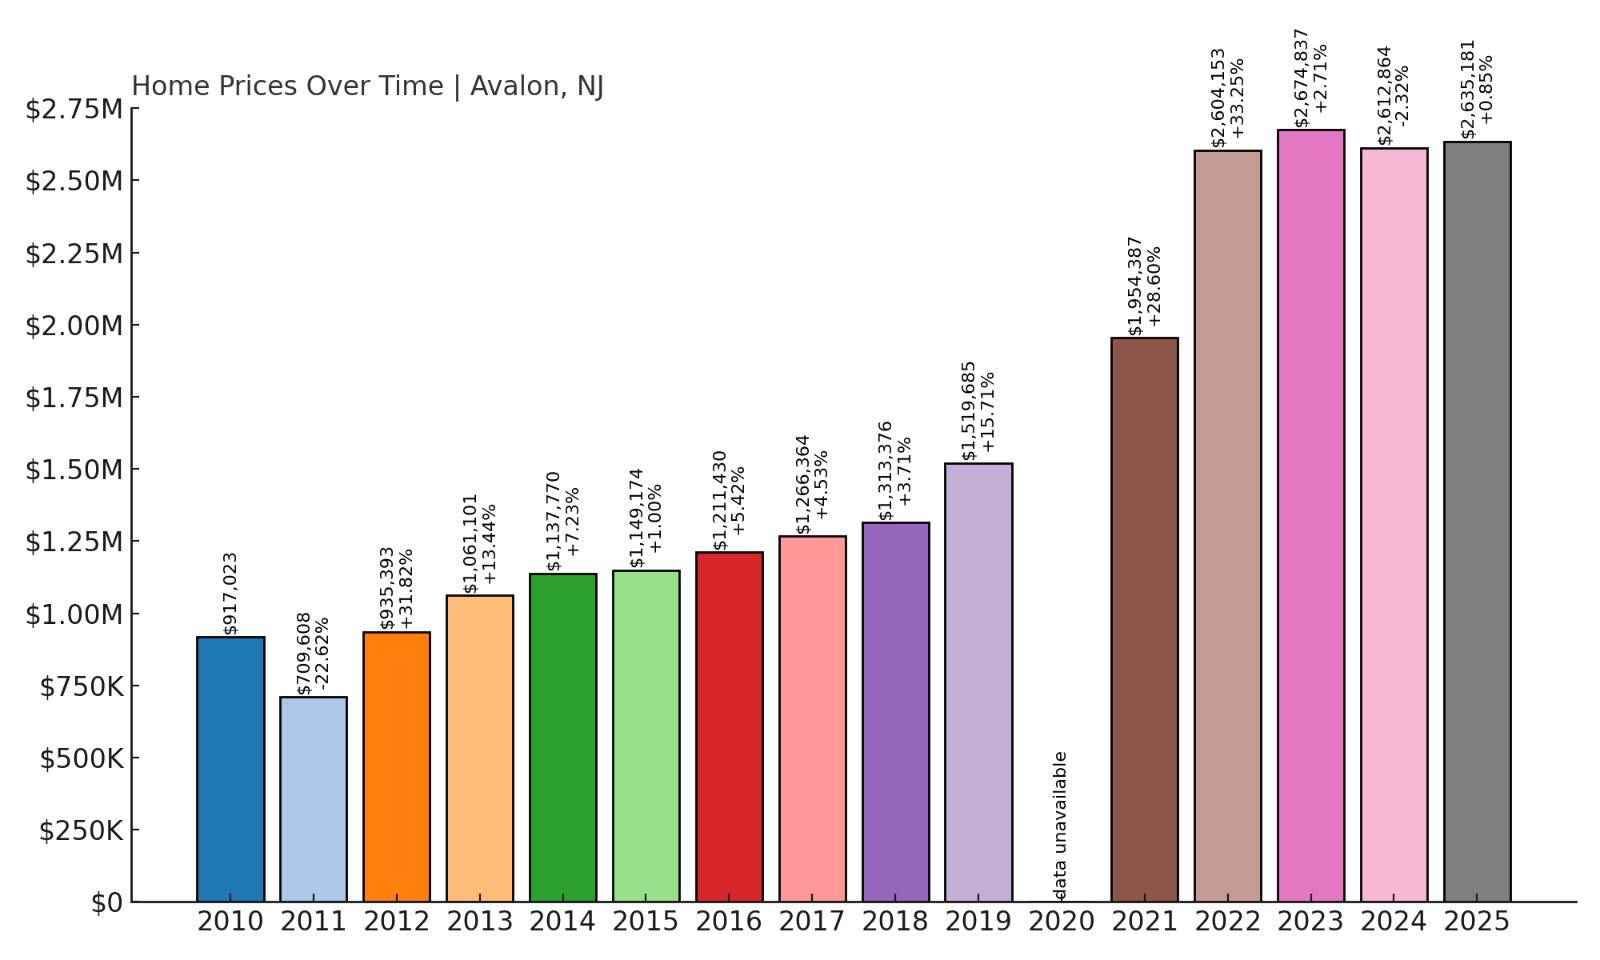
4. Avalon – 182% Home Price Increase Since 2012
- 2010: $917,023
- 2011: $709,608 (-$207,415, -22.62% from previous year)
- 2012: $935,393 (+$225,785, +31.82% from previous year)
- 2013: $1,061,101 (+$125,708, +13.44% from previous year)
- 2014: $1,137,770 (+$76,669, +7.23% from previous year)
- 2015: $1,149,174 (+$11,405, +1.00% from previous year)
- 2016: $1,211,430 (+$62,255, +5.42% from previous year)
- 2017: $1,266,364 (+$54,934, +4.53% from previous year)
- 2018: $1,313,376 (+$47,012, +3.71% from previous year)
- 2019: $1,519,685 (+$206,309, +15.71% from previous year)
- 2020: N/A
- 2021: $1,954,387 (+$434,702, +28.60% from previous year)
- 2022: $2,604,153 (+$649,766, +33.25% from previous year)
- 2023: $2,674,837 (+$70,684, +2.71% from previous year)
- 2024: $2,612,864 (-$61,973, -2.32% from previous year)
- 2025: $2,635,181 (+$22,316, +0.85% from previous year)
From $935,393 in 2012 to $2,635,181 in 2025, Avalon’s home prices have soared by 182%. Much of this growth occurred between 2019 and 2022, when prices skyrocketed by over $1 million in just three years. Even though growth has tapered off, the market remains stable and consistently high.
Avalon – The Crown Jewel of the Jersey Shore
Avalon is synonymous with luxury along New Jersey’s southern coast. Also located on Seven Mile Island, just north of Stone Harbor, Avalon is known for its large custom homes, wide beaches, and yacht-lined bays. It draws wealthy buyers from Philadelphia, New York, and beyond, especially those looking for high-end second homes with strong long-term value. The town’s building codes restrict height and density, preserving a low-key atmosphere even at the height of summer. Its downtown is compact but elegant, with fine dining, boutique shopping, and local arts events that cater to an affluent crowd. Avalon’s real estate market exploded during the pandemic as wealthy buyers competed for ocean and bayfront properties. The combination of limited inventory, remote work flexibility, and a surge in luxury homebuilding sent prices to unprecedented levels. While the sharpest gains may be behind it, Avalon remains a top-tier market with enduring appeal. The homes here are often second or third residences for buyers who treat their purchases as both lifestyle choices and long-term investments.
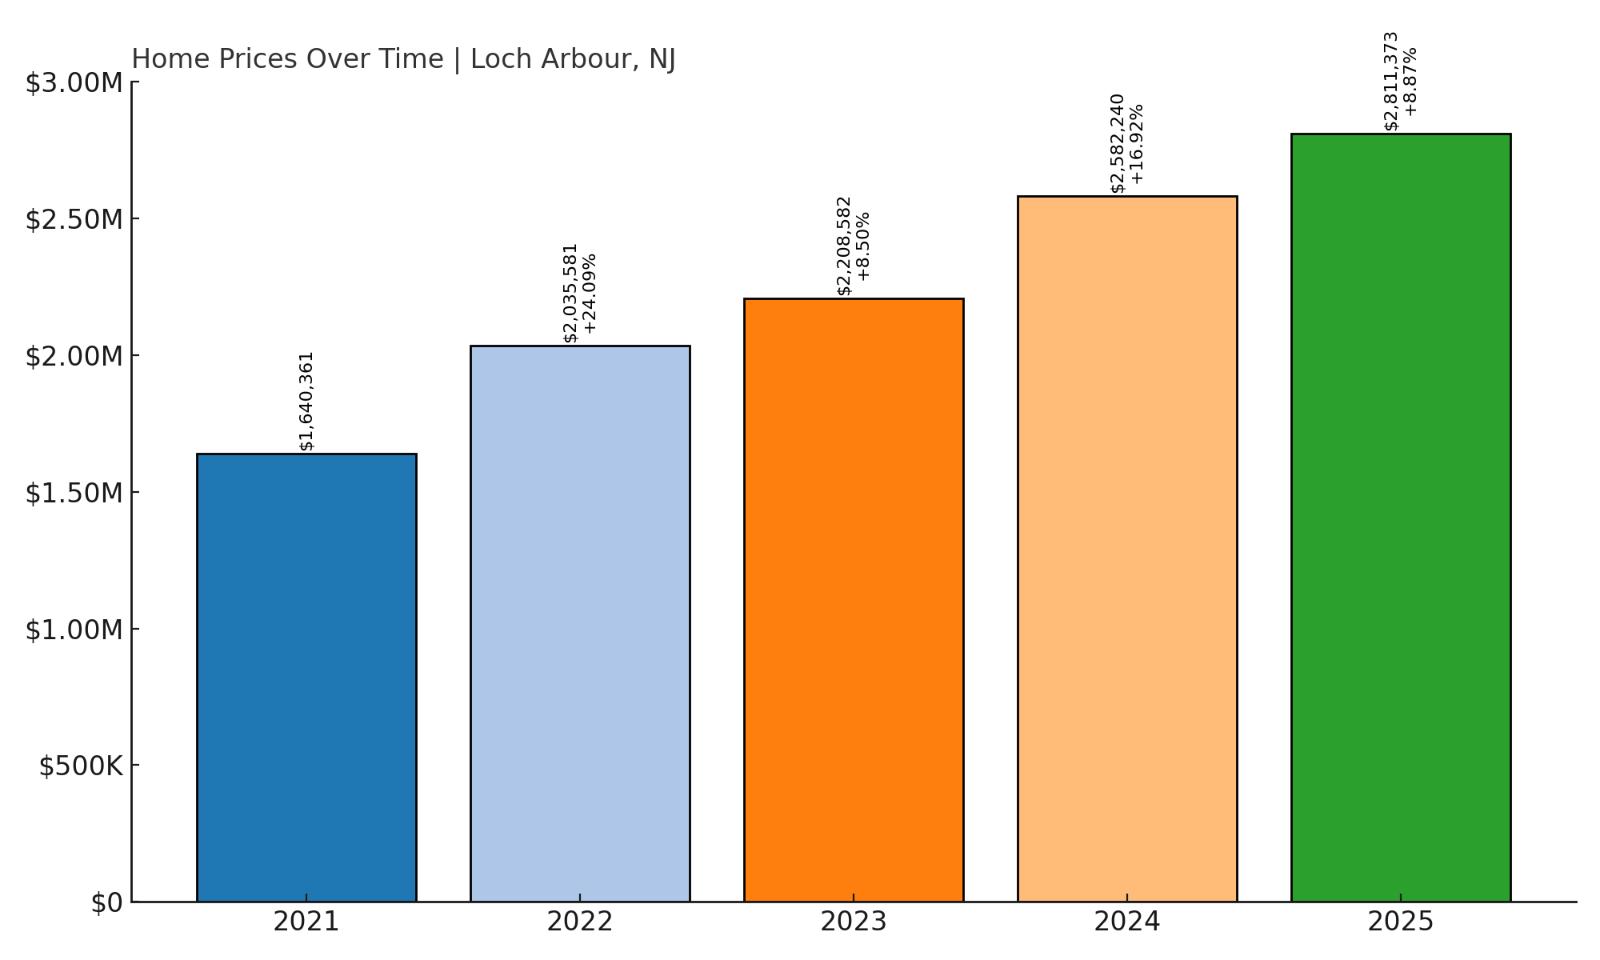
3. Loch Arbour – 71% Home Price Increase Since 2021
- 2010: N/A
- 2011: N/A
- 2012: N/A
- 2013: N/A
- 2014: N/A
- 2015: N/A
- 2016: N/A
- 2017: N/A
- 2018: N/A
- 2019: N/A
- 2020: N/A
- 2021: $1,640,361
- 2022: $2,035,581 (+$395,220, +24.09% from previous year)
- 2023: $2,208,582 (+$173,001, +8.50% from previous year)
- 2024: $2,582,240 (+$373,658, +16.92% from previous year)
- 2025: $2,811,373 (+$229,133, +8.87% from previous year)
Loch Arbour has seen home prices rise by 71% since 2021, one of the steepest short-term gains in the state. From $1.64 million in 2021 to over $2.8 million in 2025, the pace of appreciation has been swift and largely uninterrupted. This rapid growth is striking given the town’s tiny size and limited market activity.
Loch Arbour – A Tiny Borough With Towering Prices
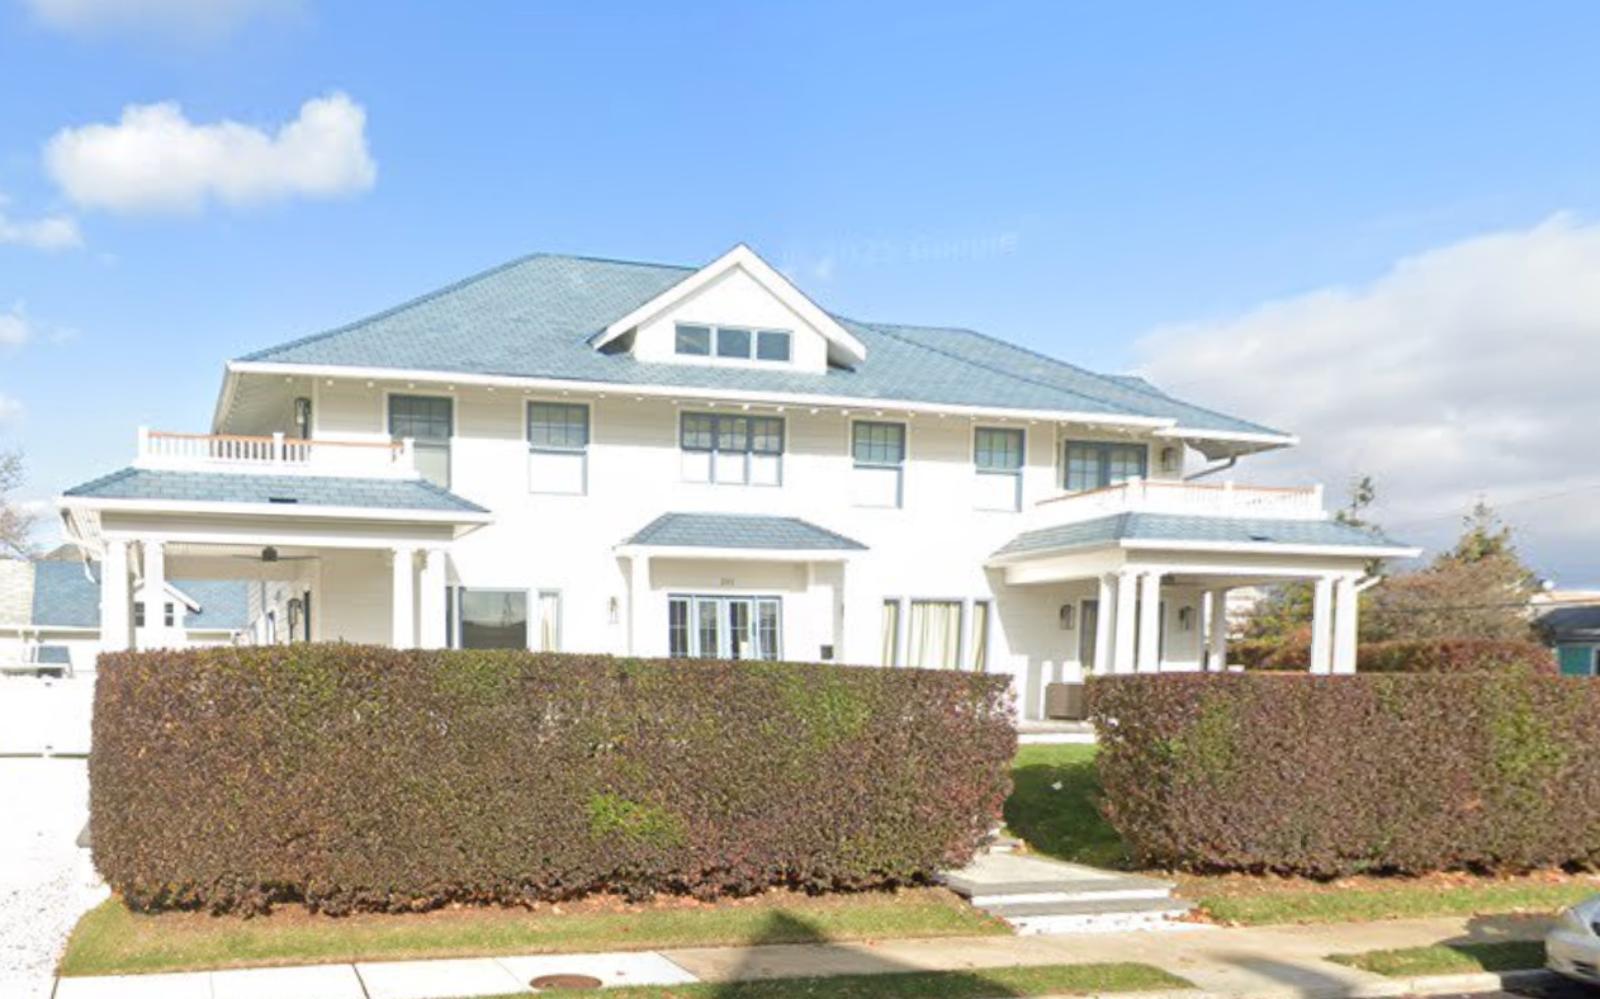
Loch Arbour may be the smallest municipality on this list, but its housing market is one of the most valuable per square foot in the state. Nestled between Allenhurst and Asbury Park in Monmouth County, the borough spans just a few blocks—but those blocks contain some of New Jersey’s most coveted real estate. The oceanfront homes here offer commanding views, high-end finishes, and complete privacy. Loch Arbour’s minimal inventory means homes are rarely available, and when they are, they command a premium. The town’s appeal lies in its exclusivity—fewer than 200 people live here full-time. The dramatic rise in values since 2021 reflects its appeal to luxury buyers who want oceanfront access without the crowds. Because of the town’s size, any new sale can move the market significantly. Recent years have seen an influx of cash buyers seeking out legacy beach properties, further driving up demand. While few homes trade hands in a given year, each sale tends to break local pricing records, helping solidify Loch Arbour’s place among New Jersey’s top-tier housing markets.
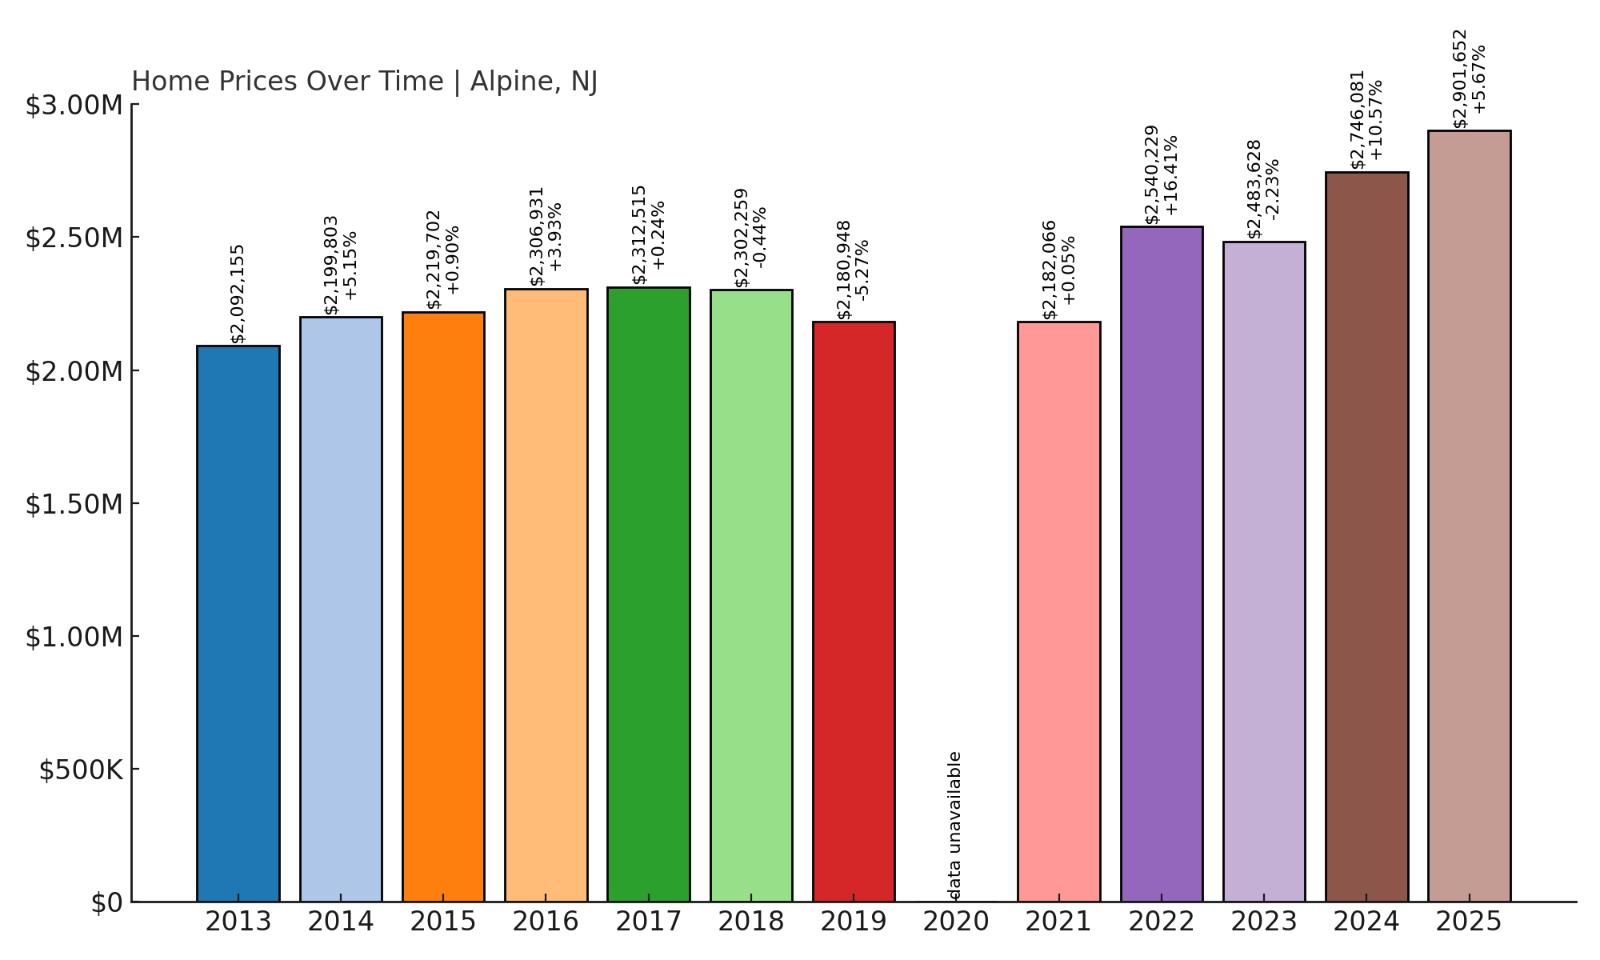
2. Alpine – 38% Home Price Increase Since 2013
- 2010: N/A
- 2011: N/A
- 2012: N/A
- 2013: $2,092,155
- 2014: $2,199,803 (+$107,648, +5.15% from previous year)
- 2015: $2,219,702 (+$19,899, +0.90% from previous year)
- 2016: $2,306,931 (+$87,229, +3.93% from previous year)
- 2017: $2,312,515 (+$5,584, +0.24% from previous year)
- 2018: $2,302,259 (-$10,257, -0.44% from previous year)
- 2019: $2,180,948 (-$121,311, -5.27% from previous year)
- 2020: N/A
- 2021: $2,182,066 (+$1,118, +0.05% from previous year)
- 2022: $2,540,229 (+$358,163, +16.41% from previous year)
- 2023: $2,483,628 (-$56,601, -2.23% from previous year)
- 2024: $2,746,081 (+$262,453, +10.57% from previous year)
- 2025: $2,901,652 (+$155,571, +5.67% from previous year)
Alpine’s home prices have increased from $2,092,155 in 2013 to $2,901,652 in 2025, a 38% gain. While this growth is modest compared to Jersey Shore towns, Alpine remains one of the most expensive zip codes in the country. Prices have remained well above $2 million for more than a decade.
Alpine – High-End Privacy Near Manhattan

Located in Bergen County, Alpine is known for its palatial estates, gated mansions, and sweeping views of the Hudson River. The town has long been a magnet for celebrities, CEOs, and international buyers who value privacy and proximity to Manhattan. Alpine’s homes are among the largest in New Jersey, often spanning over 10,000 square feet with custom architecture and sprawling grounds. Strict zoning laws, oversized lots, and limited development contribute to its exclusivity and consistently high property values. Alpine’s relative price stability during market ups and downs makes it unique among ultra-luxury communities. Buyers here are typically cash buyers, and properties often remain in families for generations. The lack of commercial development and the presence of natural preserves ensure that the town retains its secluded atmosphere. For those who can afford it, Alpine offers unmatched luxury and discretion just 15 miles from midtown Manhattan.
1. Deal – 158% Home Price Increase Since 2012
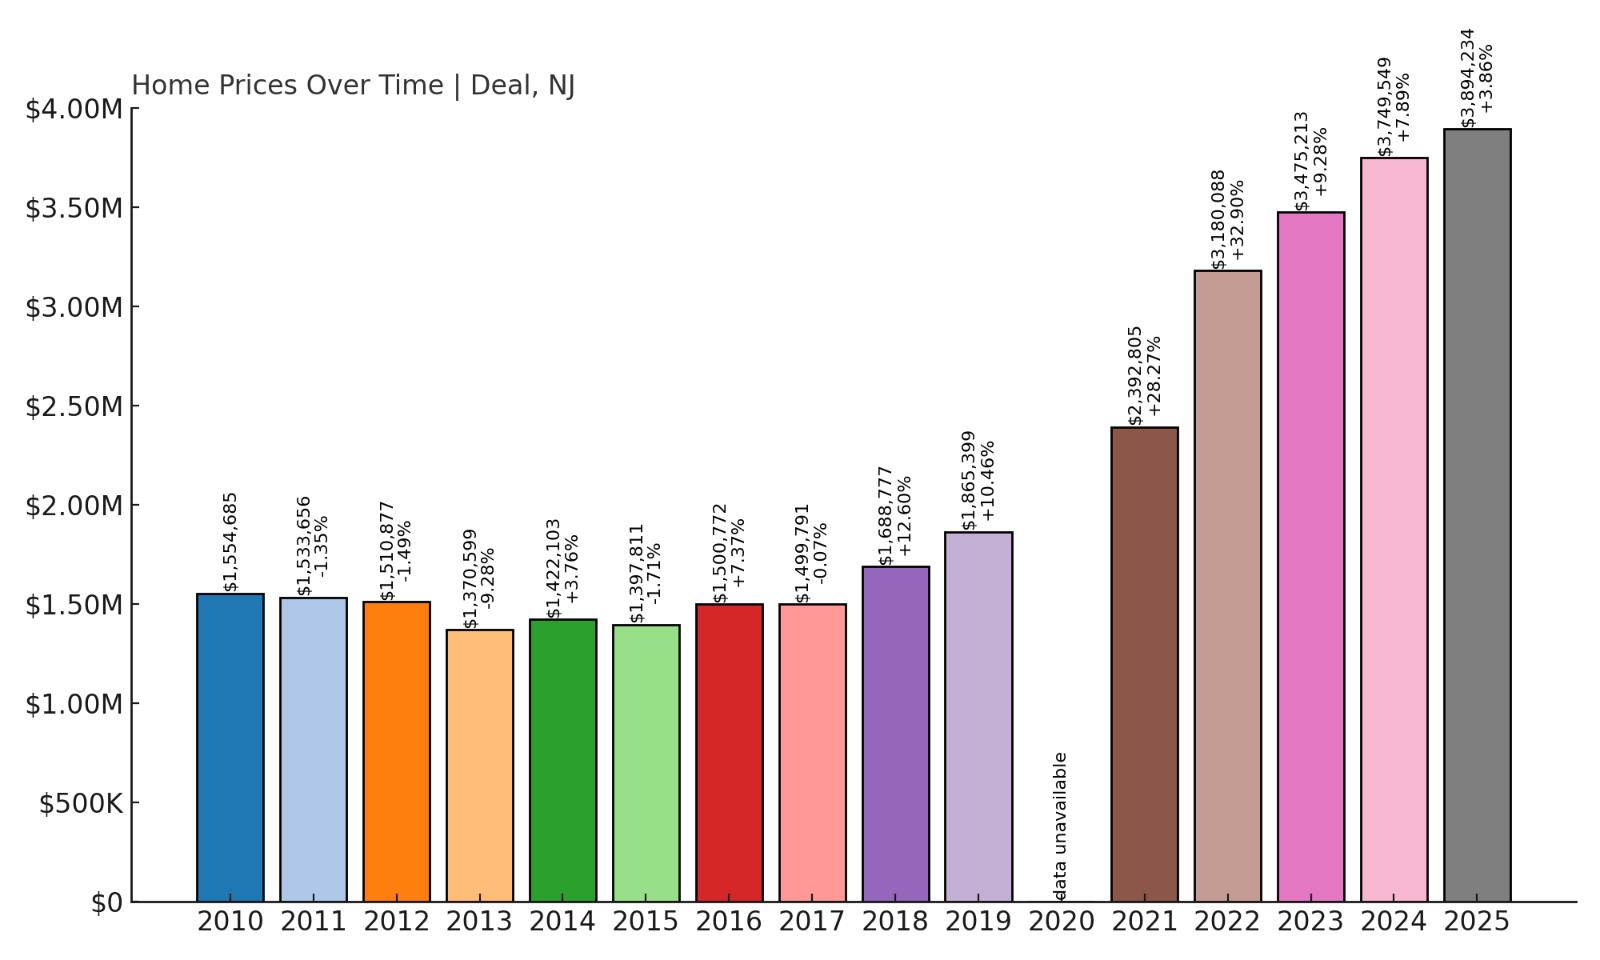
- 2010: $1,554,685
- 2011: $1,533,656 (-$21,030, -1.35% from previous year)
- 2012: $1,510,877 (-$22,778, -1.49% from previous year)
- 2013: $1,370,599 (-$140,279, -9.28% from previous year)
- 2014: $1,422,103 (+$51,504, +3.76% from previous year)
- 2015: $1,397,811 (-$24,292, -1.71% from previous year)
- 2016: $1,500,772 (+$102,961, +7.37% from previous year)
- 2017: $1,499,791 (-$982, -0.07% from previous year)
- 2018: $1,688,777 (+$188,986, +12.60% from previous year)
- 2019: $1,865,399 (+$176,622, +10.46% from previous year)
- 2020: N/A
- 2021: $2,392,805 (+$527,406, +28.27% from previous year)
- 2022: $3,180,088 (+$787,284, +32.90% from previous year)
- 2023: $3,475,213 (+$295,125, +9.28% from previous year)
- 2024: $3,749,549 (+$274,335, +7.89% from previous year)
- 2025: $3,894,234 (+$144,685, +3.86% from previous year)
Home prices in Deal have soared from $1,510,877 in 2012 to $3,894,234 in 2025, a remarkable 158% increase. The town’s real estate market has gained over $2 million in value in just 13 years, with the most rapid growth occurring between 2020 and 2022.
Deal – New Jersey’s Most Expensive Town in 2025
Deal is a small oceanfront borough in Monmouth County with a big reputation for wealth. The town has long been home to prominent business families, particularly from the Syrian Jewish community, and features sprawling estates with beach access, pools, and gated entries. Demand here is intense and inventory is tightly held—homes rarely hit the open market. With oceanfront property in extremely short supply, the few sales that do happen often exceed $4 million or more. Deal’s appeal lies in its seclusion, beach access, and proximity to New York City—just 50 miles away. The pandemic supercharged demand as high-income buyers sought coastal retreats, pushing prices in Deal to record-breaking levels. Even modest properties have crossed the $3 million threshold in recent years. With limited land, no large-scale development, and generational ownership, Deal’s real estate market is expected to stay tight and expensive. It tops this list not just because of price, but because of how much—and how fast—those prices have risen.