🔥 Would you like to save this?
The Zillow Home Value Index makes it clear: New Hampshire has more than just scenic charm—it has some seriously pricey real estate. As of May 2025, these 15 towns rank as the most expensive in the state, with home values that reflect rising demand and long-term growth.
From coastal enclaves to commuter hubs and mountain-view retreats, each town on this list has climbed the price ladder in its own way. We break down the data and spotlight what’s fueling the market in the Granite State’s highest-priced communities.
In order to come up with the very specific design ideas, we create most designs with the assistance of state-of-the-art AI interior design software. Also, assume links that take you off the site are affiliate links such as links to Amazon. this means we may earn a commission if you buy something.
15. Stratham – 135% Home Price Increase Since 2010
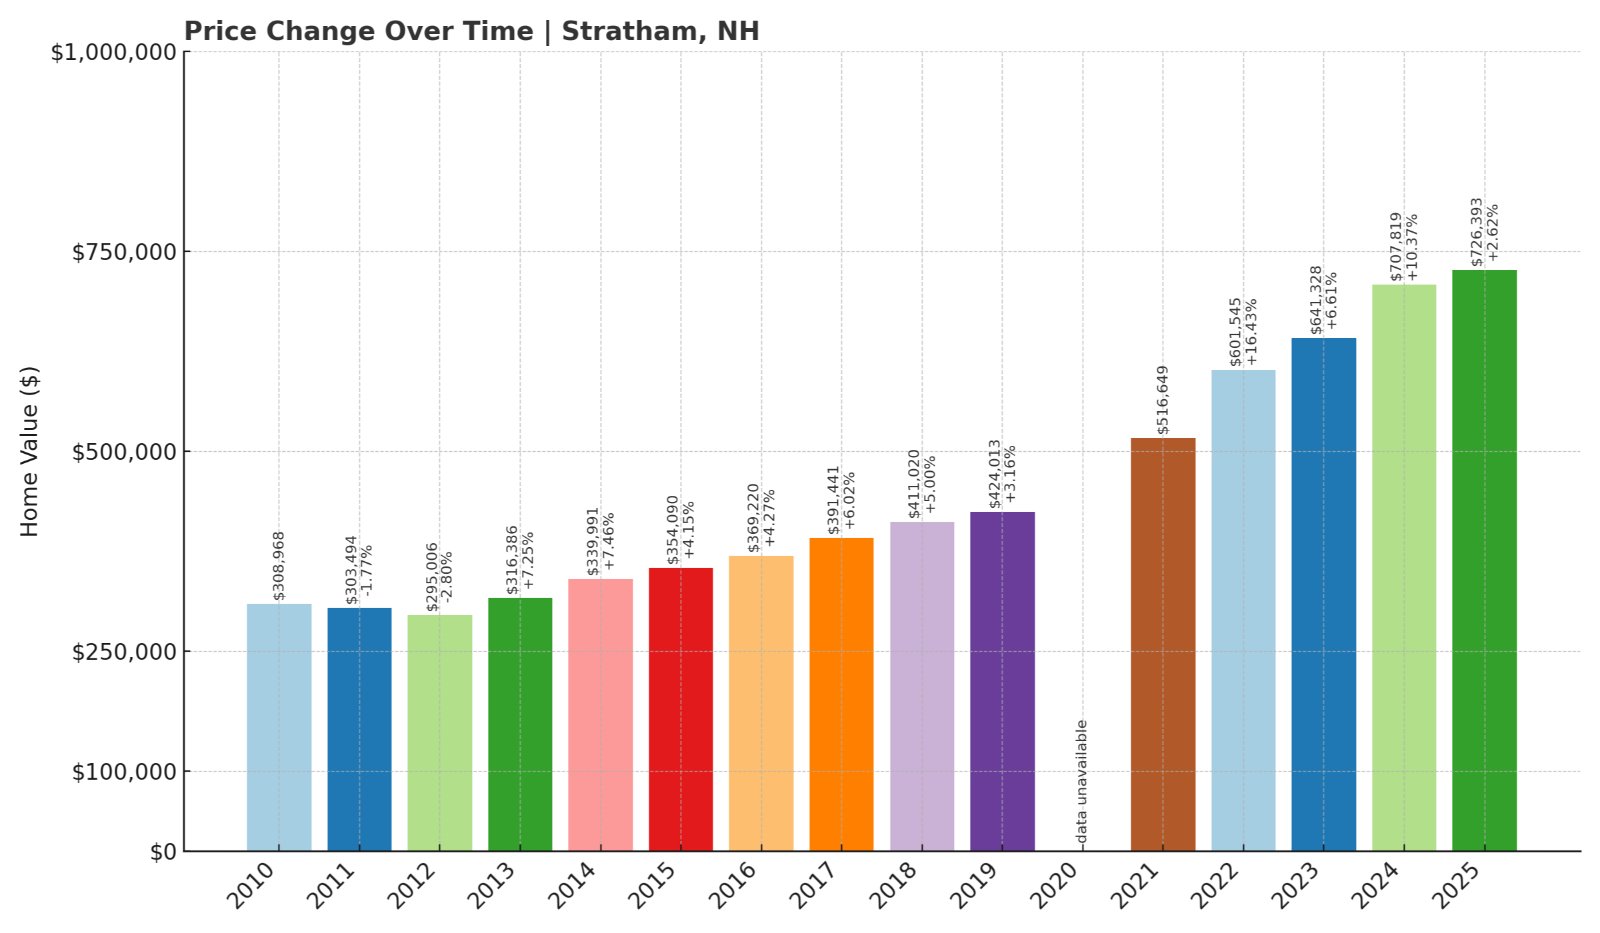
- 2010: $308,968
- 2011: $303,494 (-$5,474, -1.77% from previous year)
- 2012: $295,006 (-$8,488, -2.80% from previous year)
- 2013: $316,386 (+$21,380, +7.25% from previous year)
- 2014: $339,991 (+$23,605, +7.46% from previous year)
- 2015: $354,090 (+$14,099, +4.15% from previous year)
- 2016: $369,220 (+$15,130, +4.27% from previous year)
- 2017: $391,441 (+$22,221, +6.02% from previous year)
- 2018: $411,020 (+$19,579, +5.00% from previous year)
- 2019: $424,013 (+$12,993, +3.16% from previous year)
- 2020: N/A
- 2021: $516,649
- 2022: $601,545 (+$84,896, +16.43% from previous year)
- 2023: $641,328 (+$39,783, +6.61% from previous year)
- 2024: $707,819 (+$66,491, +10.37% from previous year)
- 2025: $726,393 (+$18,574, +2.62% from previous year)
Home prices in Stratham have more than doubled since 2010, rising from just under $309K to over $726K in 2025. The biggest gains came during the post-2020 period, with a surge of nearly 16.5% in 2022 alone. Despite a slow climb in 2025, the long-term growth tells a story of rising demand in this southeastern New Hampshire town.
Stratham – Stable Growth and Strong Location Appeal
Stratham sits in Rockingham County, just a few miles from the coast and close to the Massachusetts border. It’s a short drive to Portsmouth and an easy commute to Boston’s northern suburbs, making it a popular choice for professionals looking for suburban space without giving up city access. The town blends open land, excellent schools, and access to nearby employers.
Much of the recent growth likely reflects regional migration and remote work flexibility, with buyers attracted to the town’s proximity to both seacoast and southern New Hampshire hubs. Inventory has remained tight, and homes here don’t sit long on the market. The climb past the $700K mark in 2024 marks a turning point, solidifying Stratham’s spot among the state’s elite price brackets.
14. Bedford – 111% Home Price Increase Since 2010
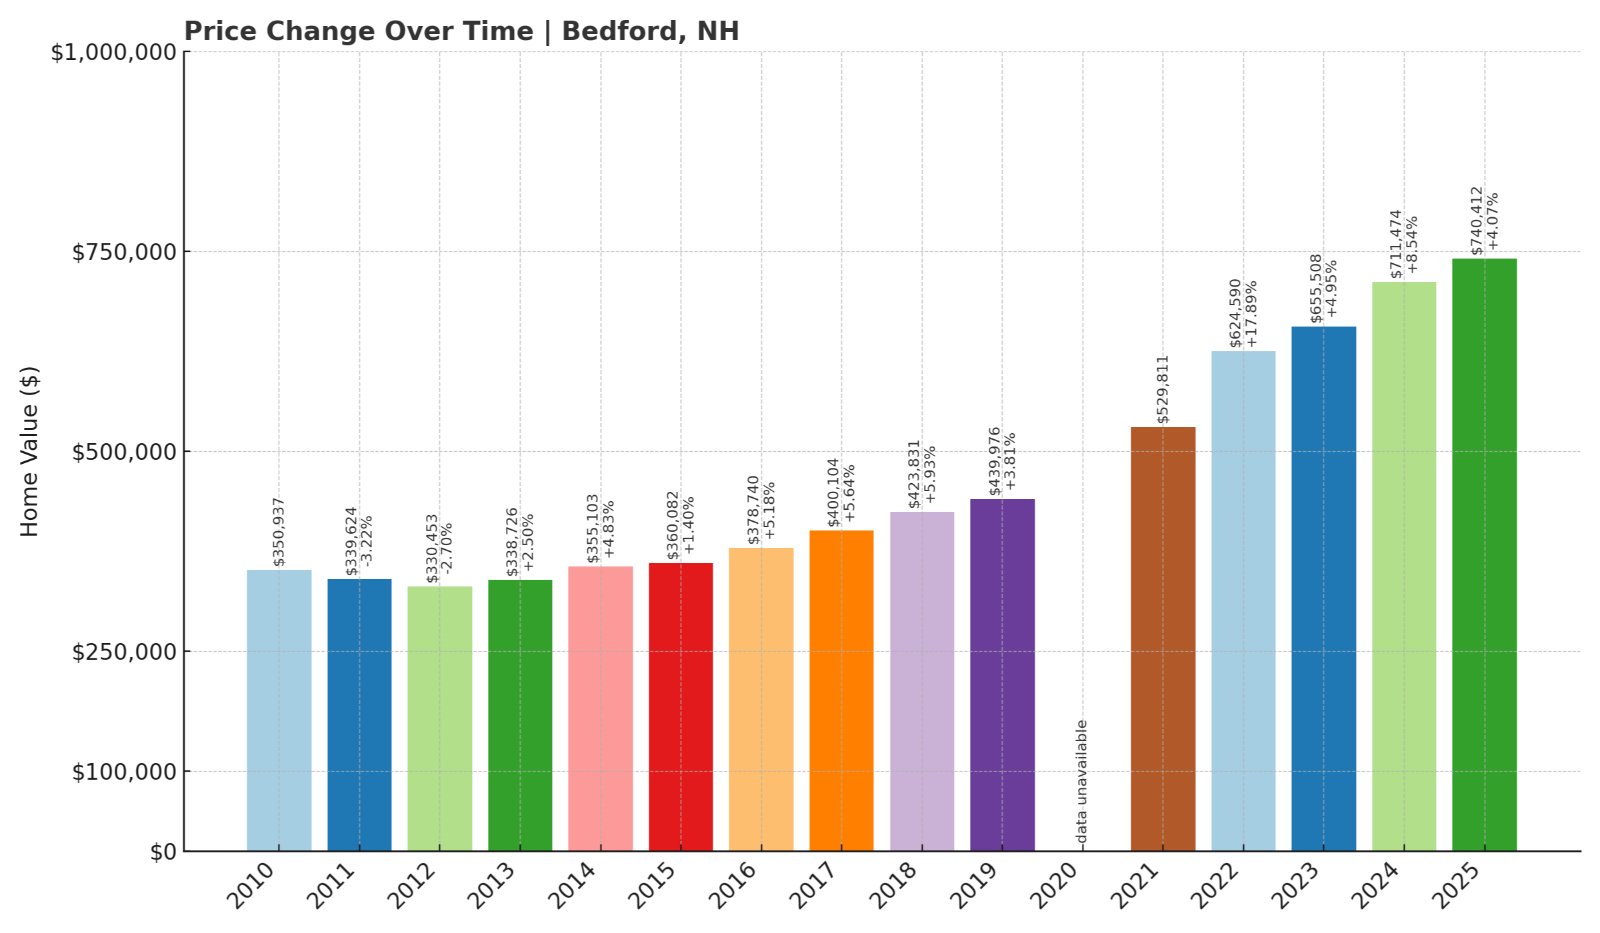
- 2010: $350,937
- 2011: $339,624 (-$11,313, -3.22% from previous year)
- 2012: $330,453 (-$9,171, -2.70% from previous year)
- 2013: $338,726 (+$8,273, +2.50% from previous year)
- 2014: $355,103 (+$16,377, +4.83% from previous year)
- 2015: $360,082 (+$4,979, +1.40% from previous year)
- 2016: $378,740 (+$18,658, +5.18% from previous year)
- 2017: $400,104 (+$21,364, +5.64% from previous year)
- 2018: $423,831 (+$23,727, +5.93% from previous year)
- 2019: $439,976 (+$16,145, +3.81% from previous year)
- 2020: N/A
- 2021: $529,811
- 2022: $624,590 (+$94,779, +17.89% from previous year)
- 2023: $655,508 (+$30,918, +4.95% from previous year)
- 2024: $711,474 (+$55,966, +8.54% from previous year)
- 2025: $740,412 (+$28,938, +4.07% from previous year)
From just under $351K in 2010 to over $740K in 2025, Bedford has seen steady and substantial price appreciation. The town’s strongest year was 2022, when values jumped by nearly 18%. That momentum hasn’t faded, with multi-year gains keeping the town firmly in the top tier of New Hampshire real estate.
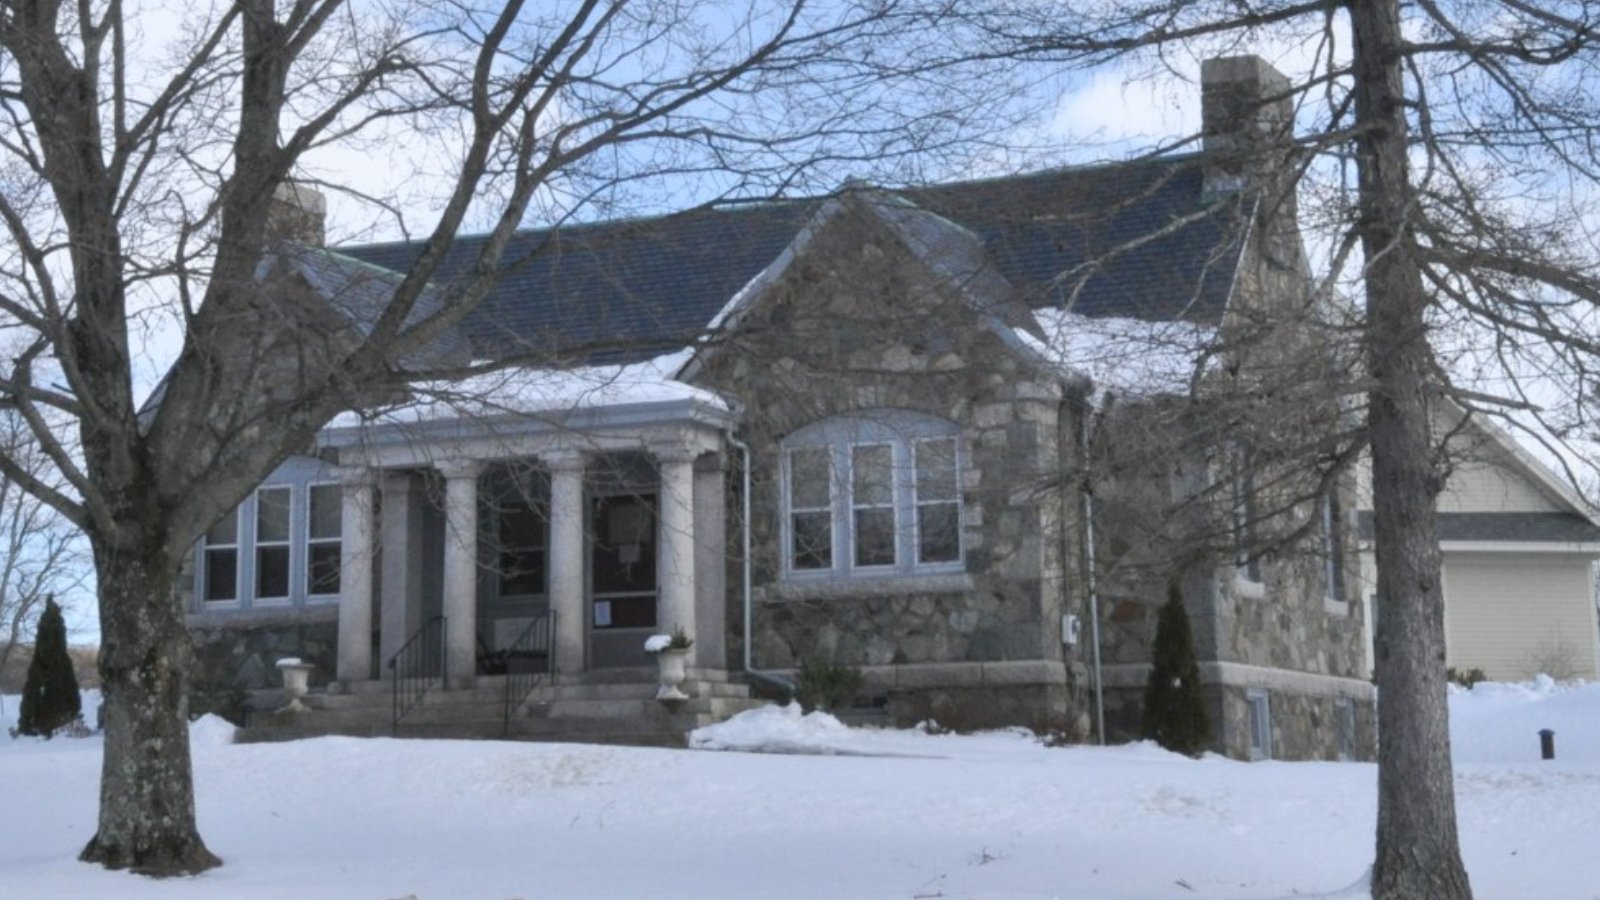
Bedford – High-End Living and Consistent Demand
Located just west of Manchester, Bedford is one of southern New Hampshire’s most in-demand towns. It’s known for excellent public schools, large suburban homes, and a thriving local economy. Major retailers and business centers nearby make it convenient for both families and professionals.
With limited land for new development and strong local income levels, Bedford’s real estate has been on a reliable upward trajectory. Its strong 2022 price spike was likely fueled by pandemic-era relocations and the town’s reputation as a premier address. The average home price here is now pushing three-quarters of a million dollars, and buyer interest remains high.
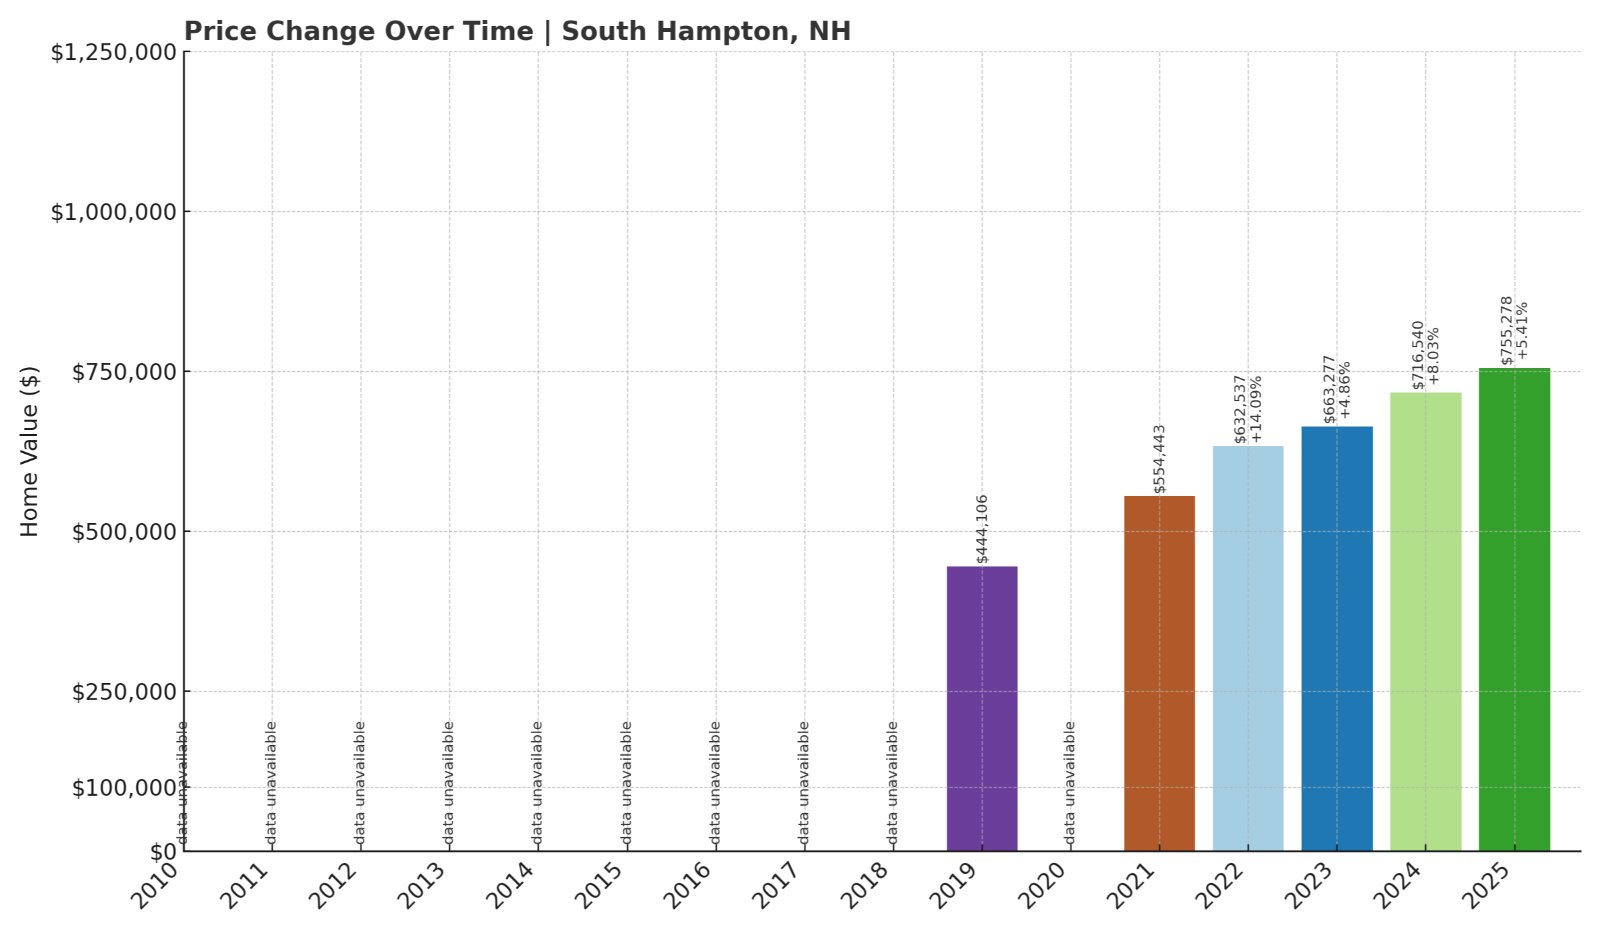
13. South Hampton – 70% Home Price Increase Since 2019
- 2010: N/A
- 2011: N/A
- 2012: N/A
- 2013: N/A
- 2014: N/A
- 2015: N/A
- 2016: N/A
- 2017: N/A
- 2018: N/A
- 2019: $444,106
- 2020: N/A
- 2021: $554,443
- 2022: $632,537 (+$78,094, +14.09% from previous year)
- 2023: $663,277 (+$30,740, +4.86% from previous year)
- 2024: $716,540 (+$53,263, +8.03% from previous year)
- 2025: $755,278 (+$38,738, +5.41% from previous year)
Home values in South Hampton have risen over 70% since 2019, with consistent annual gains since 2021. The growth shows no signs of slowing, and prices now sit just above $755K. This trajectory places the town well within New Hampshire’s most expensive markets.
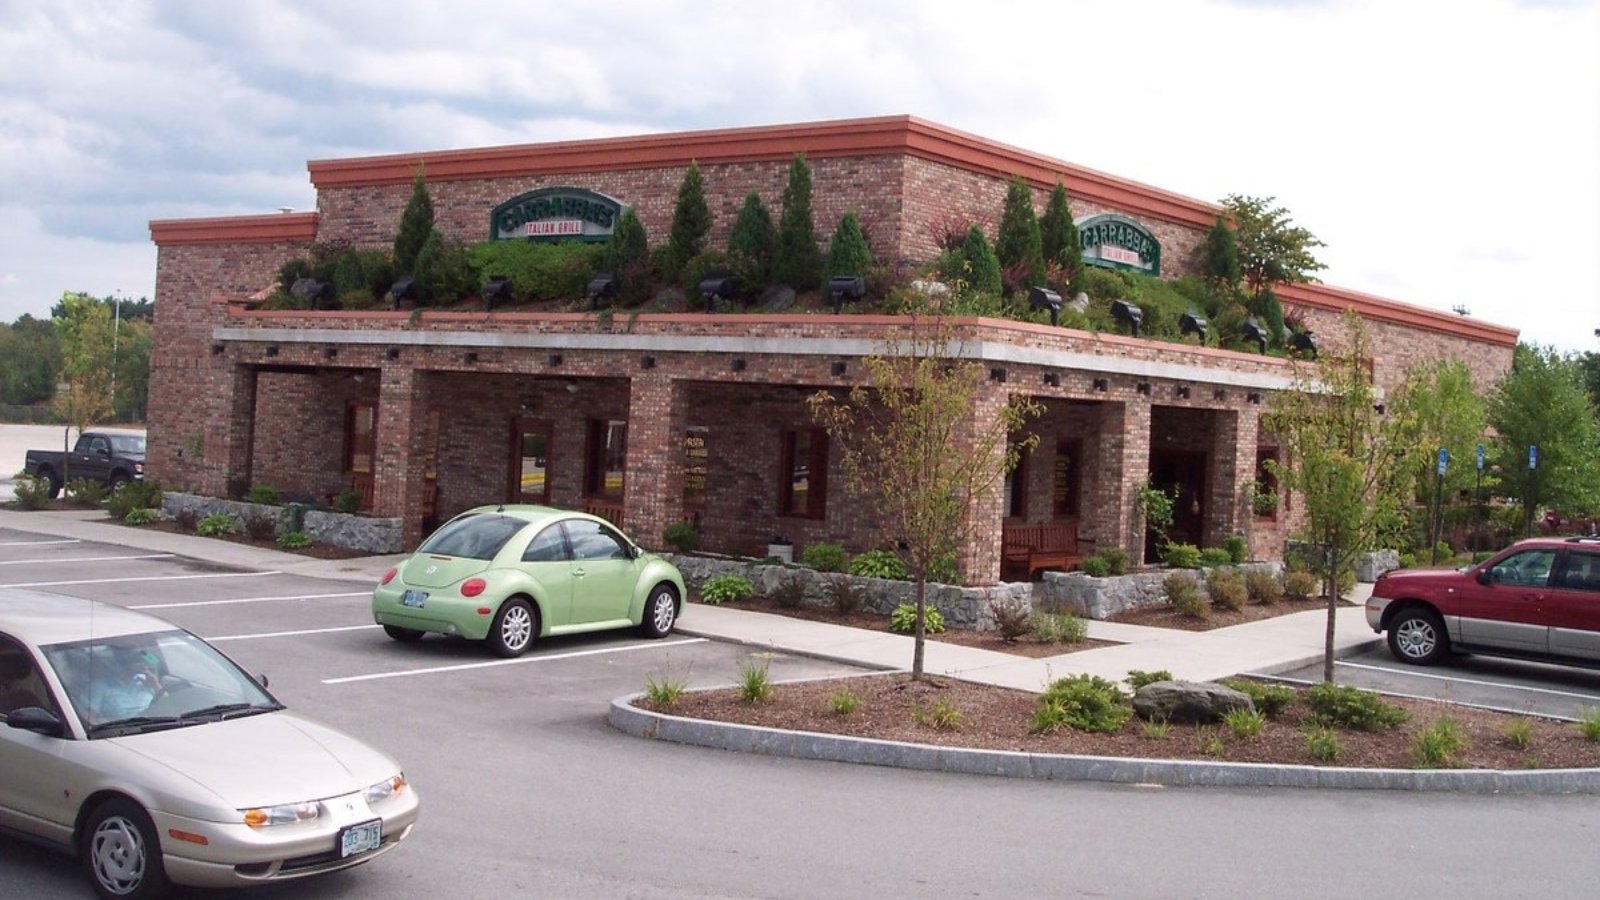
South Hampton – Quiet Roads, Rising Prices
Bordering Massachusetts in the southeastern part of the state, South Hampton is one of New Hampshire’s smaller and lesser-known towns—but its recent price performance is far from modest. With a semi-rural setting and easy access to I-95, the town has caught the eye of buyers looking for space and peace within reach of bigger cities.
Unlike some of its pricier neighbors, South Hampton’s market was relatively quiet in the early 2010s, with few listings and modest turnover. But the recent spike in prices—especially from 2021 onward—suggests the town is benefiting from spillover demand. Its blend of large lots, classic farmhouses, and open land is now commanding premium prices.
12. Portsmouth – 132% Home Price Increase Since 2010
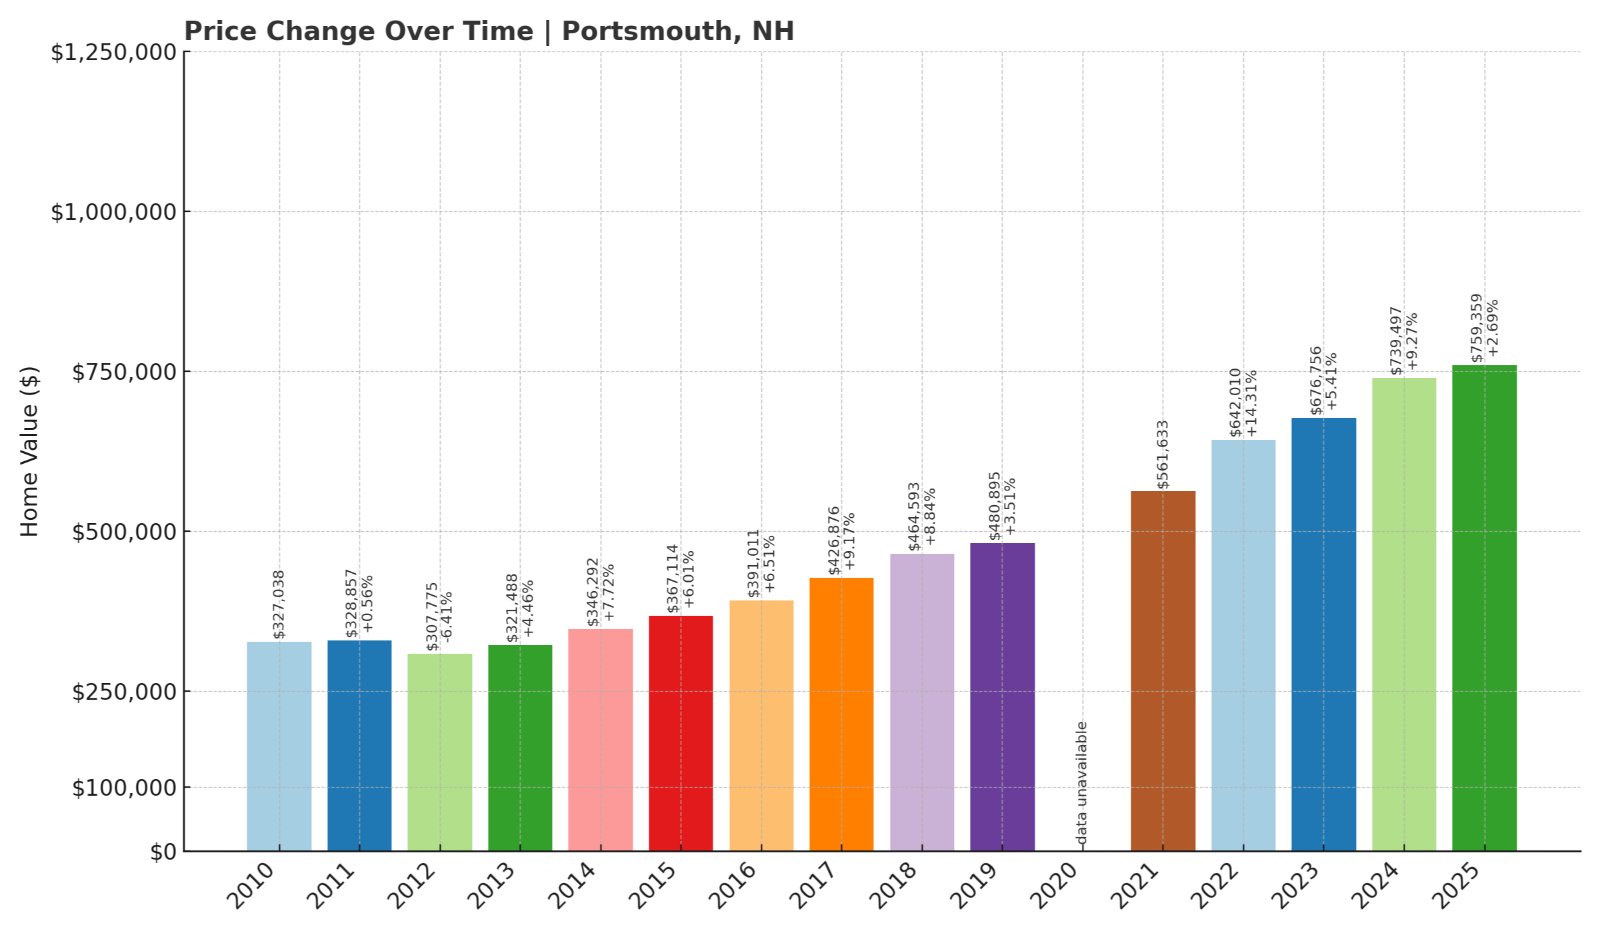
- 2010: $327,038
- 2011: $328,857 (+$1,819, +0.56% from previous year)
- 2012: $307,775 (-$21,082, -6.41% from previous year)
- 2013: $321,488 (+$13,713, +4.46% from previous year)
- 2014: $346,292 (+$24,804, +7.72% from previous year)
- 2015: $367,114 (+$20,822, +6.01% from previous year)
- 2016: $391,011 (+$23,897, +6.51% from previous year)
- 2017: $426,876 (+$35,865, +9.17% from previous year)
- 2018: $464,593 (+$37,717, +8.84% from previous year)
- 2019: $480,895 (+$16,302, +3.51% from previous year)
- 2020: N/A
- 2021: $561,633
- 2022: $642,010 (+$80,377, +14.31% from previous year)
- 2023: $676,756 (+$34,746, +5.41% from previous year)
- 2024: $739,497 (+$62,741, +9.27% from previous year)
- 2025: $759,359 (+$19,862, +2.69% from previous year)
Portsmouth’s home values have surged from just over $327K in 2010 to nearly $760K in 2025. The strongest growth occurred in 2022, but every year since 2013 has added value. As a historic port city with cultural appeal, Portsmouth remains a powerhouse in the state’s housing market.
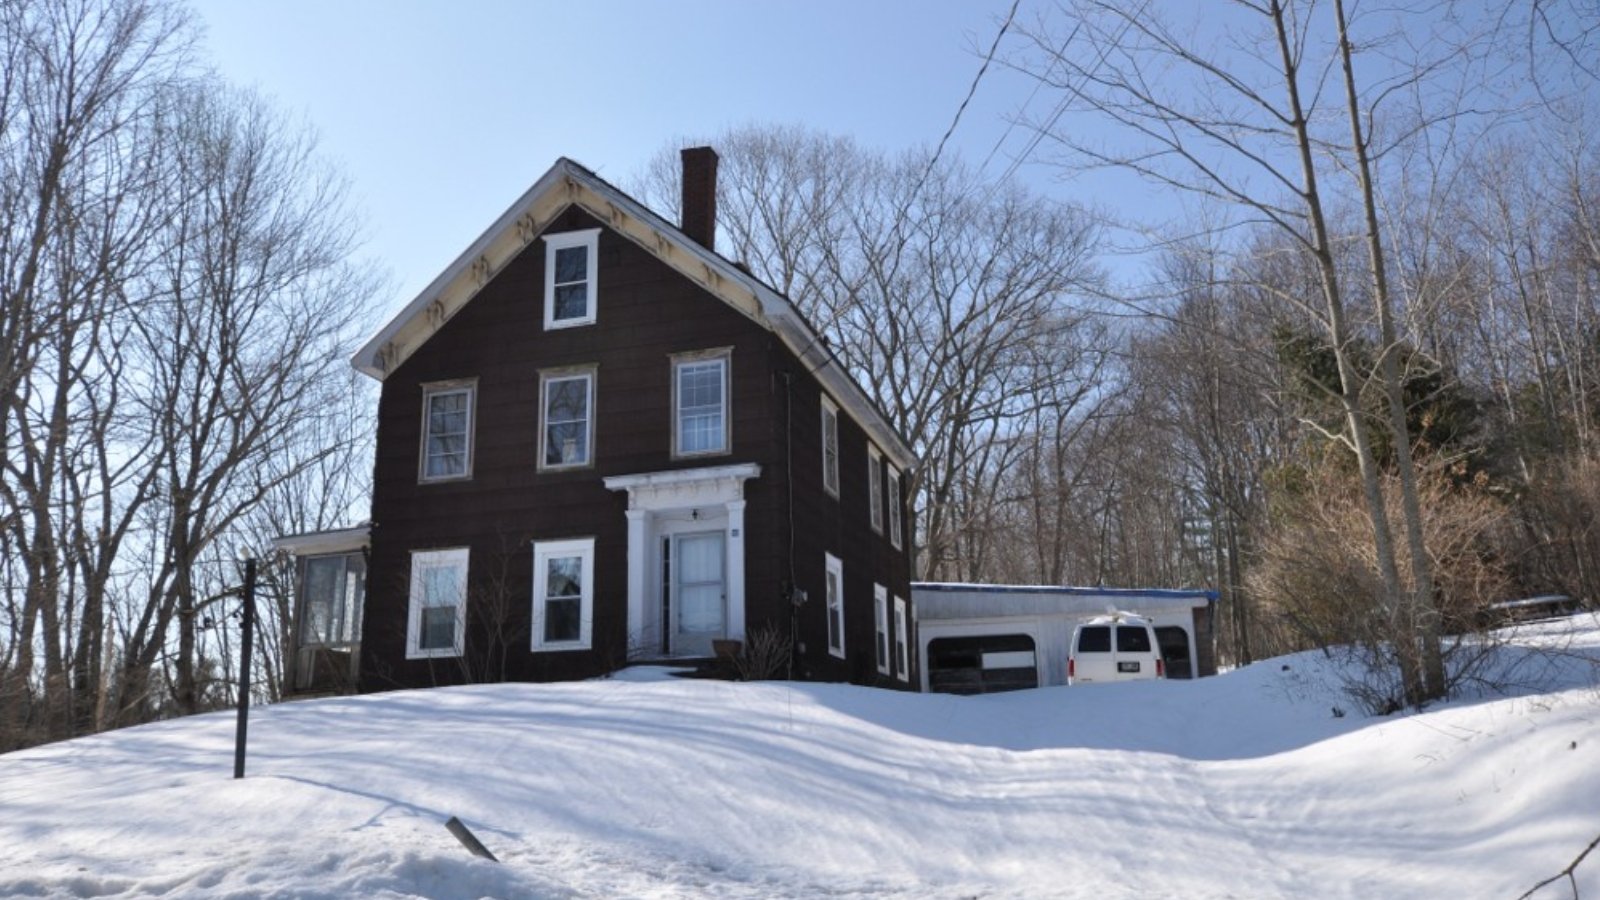
Portsmouth – Coastal Character Meets Modern Demand
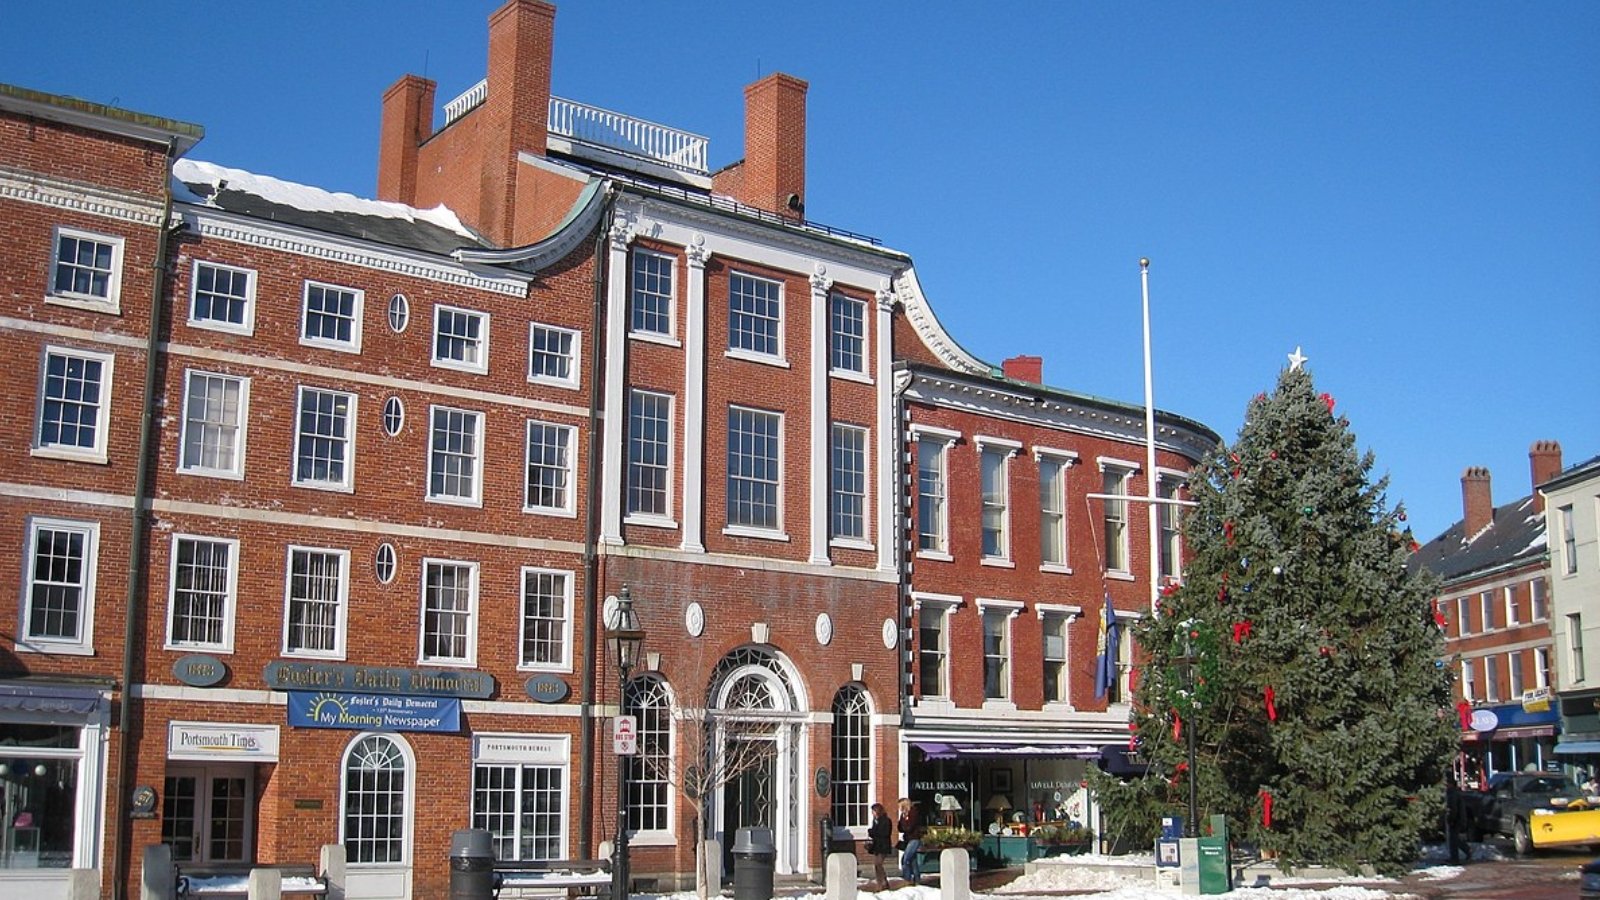
Portsmouth is one of New Hampshire’s best-known destinations, combining historic charm with strong economic vitality. With a walkable downtown, waterfront views, and a healthy tech and tourism sector, it attracts buyers from across New England and beyond.
Limited housing supply and strong rental demand have pushed home values up consistently over the past decade. While the market cooled slightly in 2025, the town’s real estate remains among the most competitive in the state. Portsmouth’s blend of livability and culture keeps prices high and rising.
11. Hollis – 61% Home Price Increase Since 2010
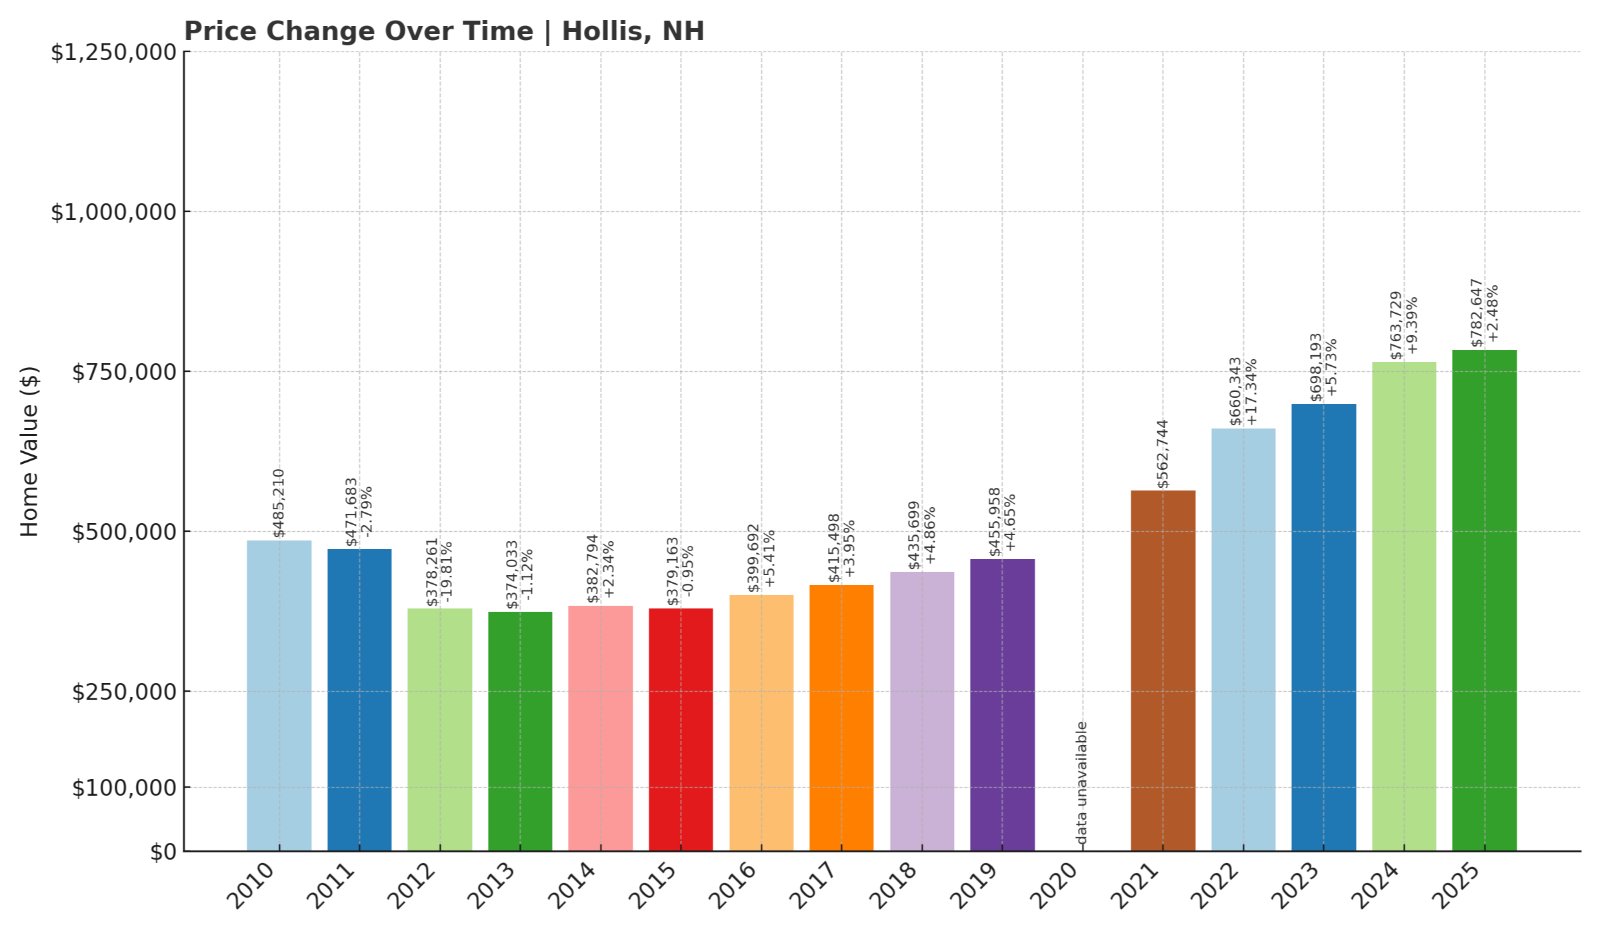
- 2010: $485,210
- 2011: $471,683 (-$13,527, -2.79% from previous year)
- 2012: $378,261 (-$93,422, -19.81% from previous year)
- 2013: $374,033 (-$4,228, -1.12% from previous year)
- 2014: $382,794 (+$8,761, +2.34% from previous year)
- 2015: $379,163 (-$3,631, -0.95% from previous year)
- 2016: $399,692 (+$20,529, +5.41% from previous year)
- 2017: $415,498 (+$15,806, +3.95% from previous year)
- 2018: $435,699 (+$20,201, +4.86% from previous year)
- 2019: $455,958 (+$20,259, +4.65% from previous year)
- 2020: N/A
- 2021: $562,744
- 2022: $660,343 (+$97,599, +17.34% from previous year)
- 2023: $698,193 (+$37,850, +5.73% from previous year)
- 2024: $763,729 (+$65,536, +9.39% from previous year)
- 2025: $782,647 (+$18,918, +2.48% from previous year)
Despite a rocky start in the early 2010s, Hollis home values have climbed steadily since 2016. Prices now average more than $780K, making it one of the priciest towns in the state. A particularly strong surge in 2022 helped accelerate its rise in the rankings.
Hollis – Prestige and Privacy in Southern New Hampshire
Hollis is known for its farmland, colonial homes, and exclusive neighborhoods. Located near Nashua and the Massachusetts line, it draws high-income buyers seeking a mix of quiet living and strong schools. The town’s rural character is preserved through strict zoning, which keeps supply low.
The dramatic drop in value in the early 2010s reflected broader market forces, but recovery came quickly—and growth has been solid ever since. With limited new construction and ongoing interest from Boston-area commuters, Hollis remains a go-to town for those looking to spend big on space and status.
10. Kensington – 111% Home Price Increase Since 2010
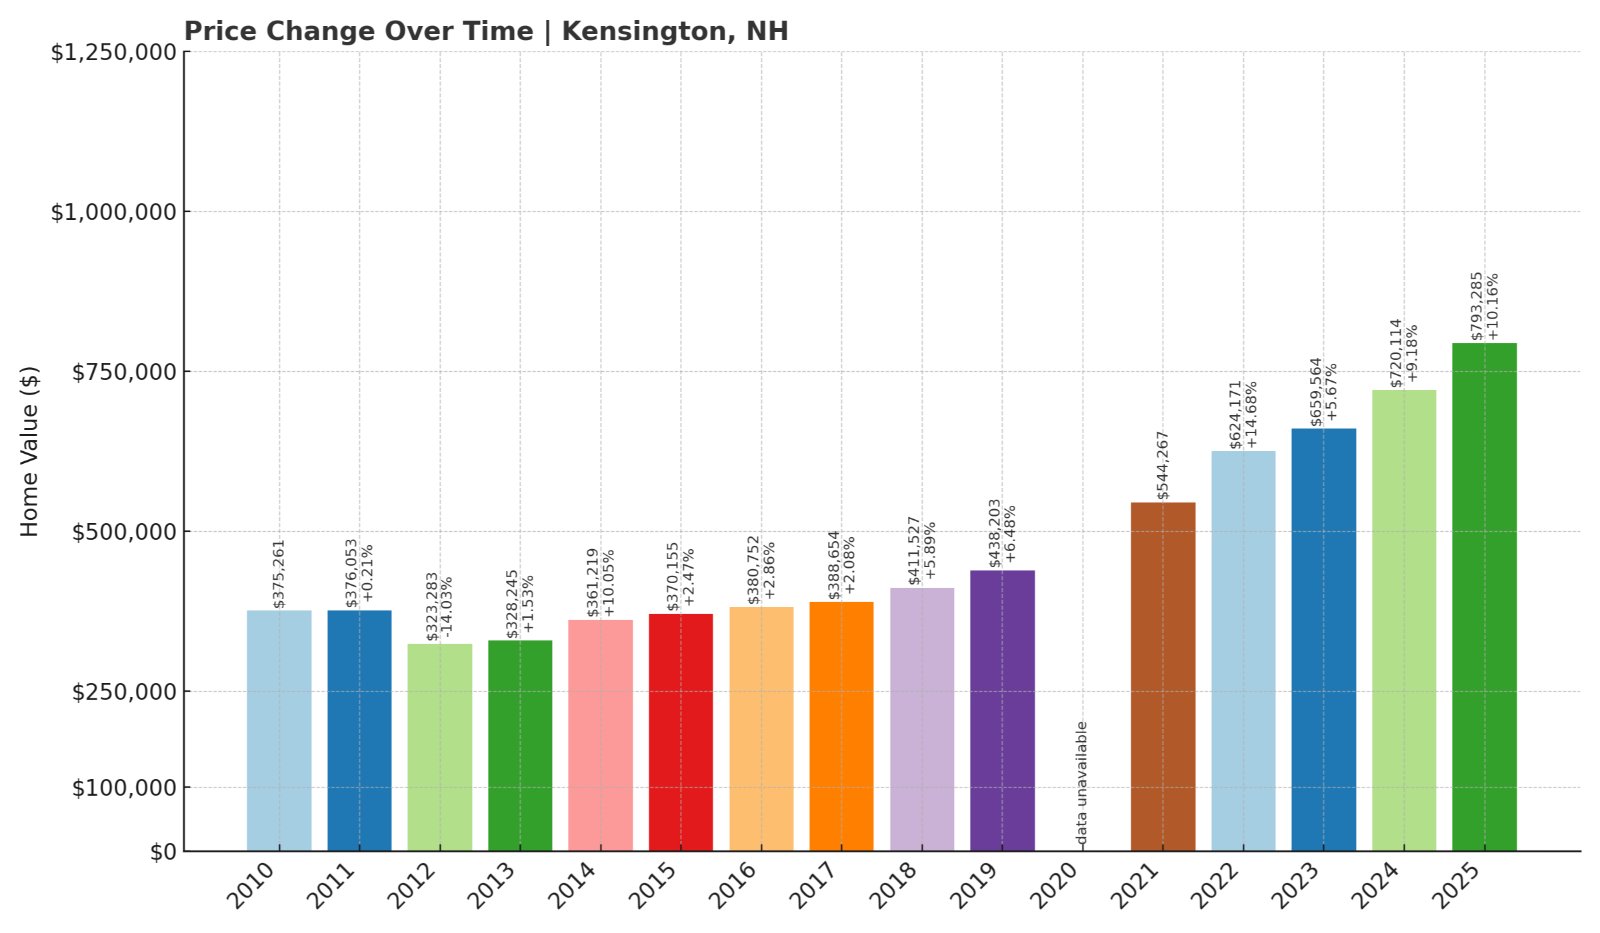
- 2010: $375,261
- 2011: $376,053 (+$792, +0.21% from previous year)
- 2012: $323,283 (-$52,770, -14.03% from previous year)
- 2013: $328,245 (+$4,962, +1.53% from previous year)
- 2014: $361,219 (+$32,974, +10.05% from previous year)
- 2015: $370,155 (+$8,936, +2.47% from previous year)
- 2016: $380,752 (+$10,597, +2.86% from previous year)
- 2017: $388,654 (+$7,902, +2.08% from previous year)
- 2018: $411,527 (+$22,873, +5.89% from previous year)
- 2019: $438,203 (+$26,676, +6.48% from previous year)
- 2020: N/A
- 2021: $544,267
- 2022: $624,171 (+$79,904, +14.68% from previous year)
- 2023: $659,564 (+$35,393, +5.67% from previous year)
- 2024: $720,114 (+$60,550, +9.18% from previous year)
- 2025: $793,285 (+$73,171, +10.16% from previous year)
Kensington’s home prices have more than doubled since 2010, climbing from $375K to just over $793K in 2025. The past five years have brought especially sharp increases, with double-digit gains in both 2022 and 2025. It’s a small town, but the price trends show big market movement.
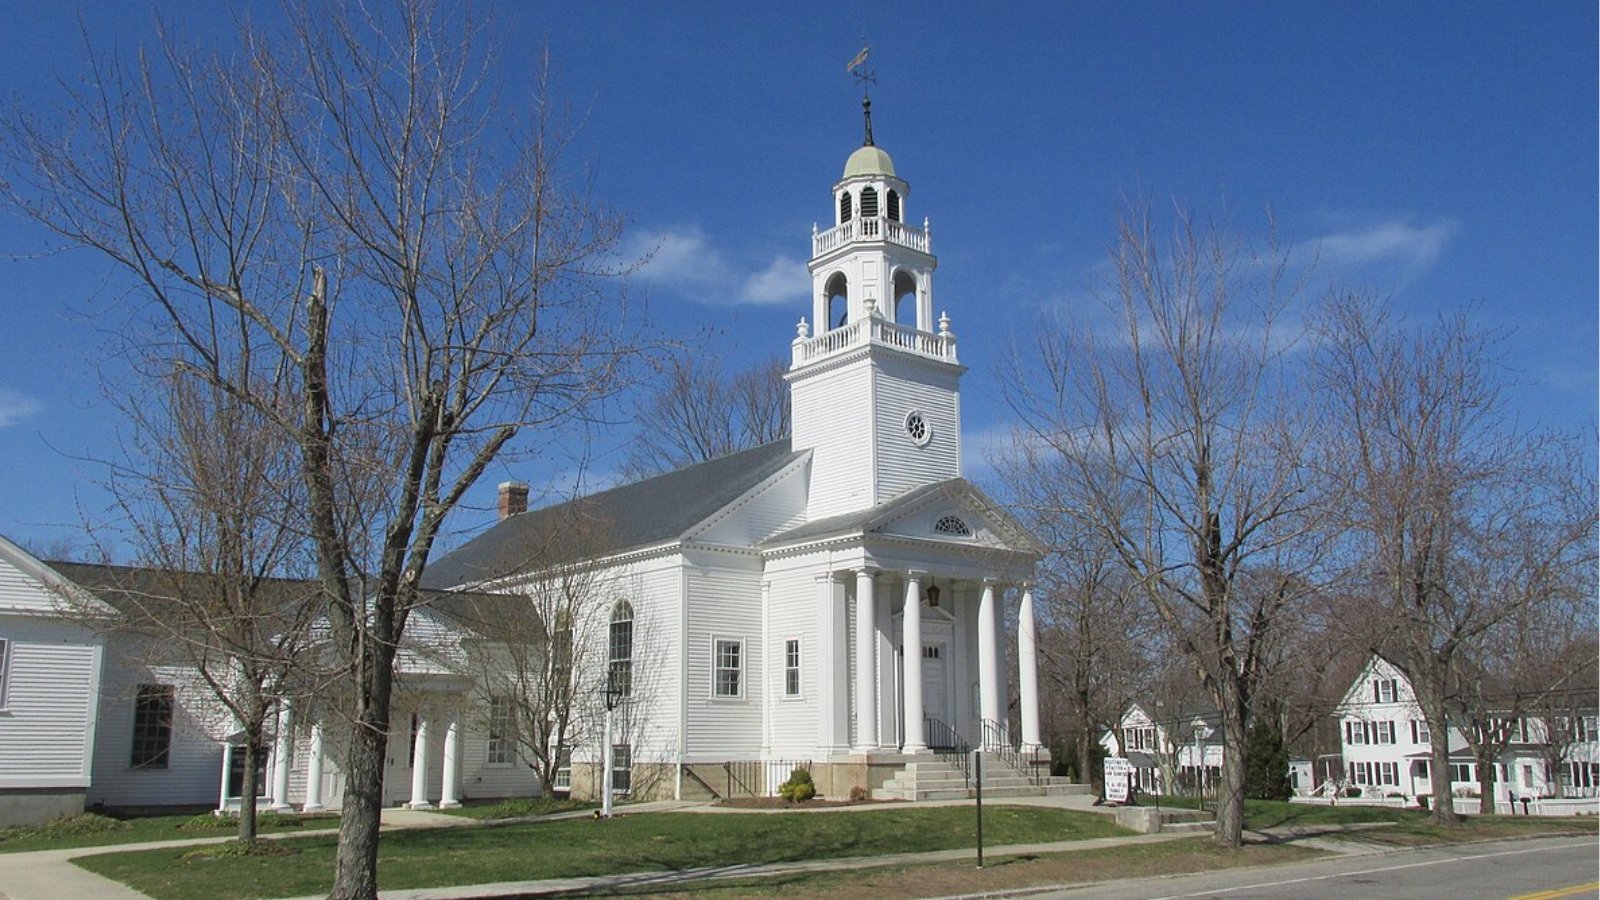
Kensington – Small Town, Soaring Prices
Kensington is a quiet, residential community located just inland from the New Hampshire seacoast. It shares a border with Exeter and sits less than 20 miles from Portsmouth. What it lacks in size, it makes up for in desirability—especially among buyers looking for privacy and rural charm near major routes.
Homes here don’t come on the market often, which creates upward pressure on prices when demand spikes. With fewer than 2,500 residents and limited development, Kensington has become a favorite for those seeking space and exclusivity in southern New Hampshire. The leap in values since 2020 is a clear sign of its rising profile.
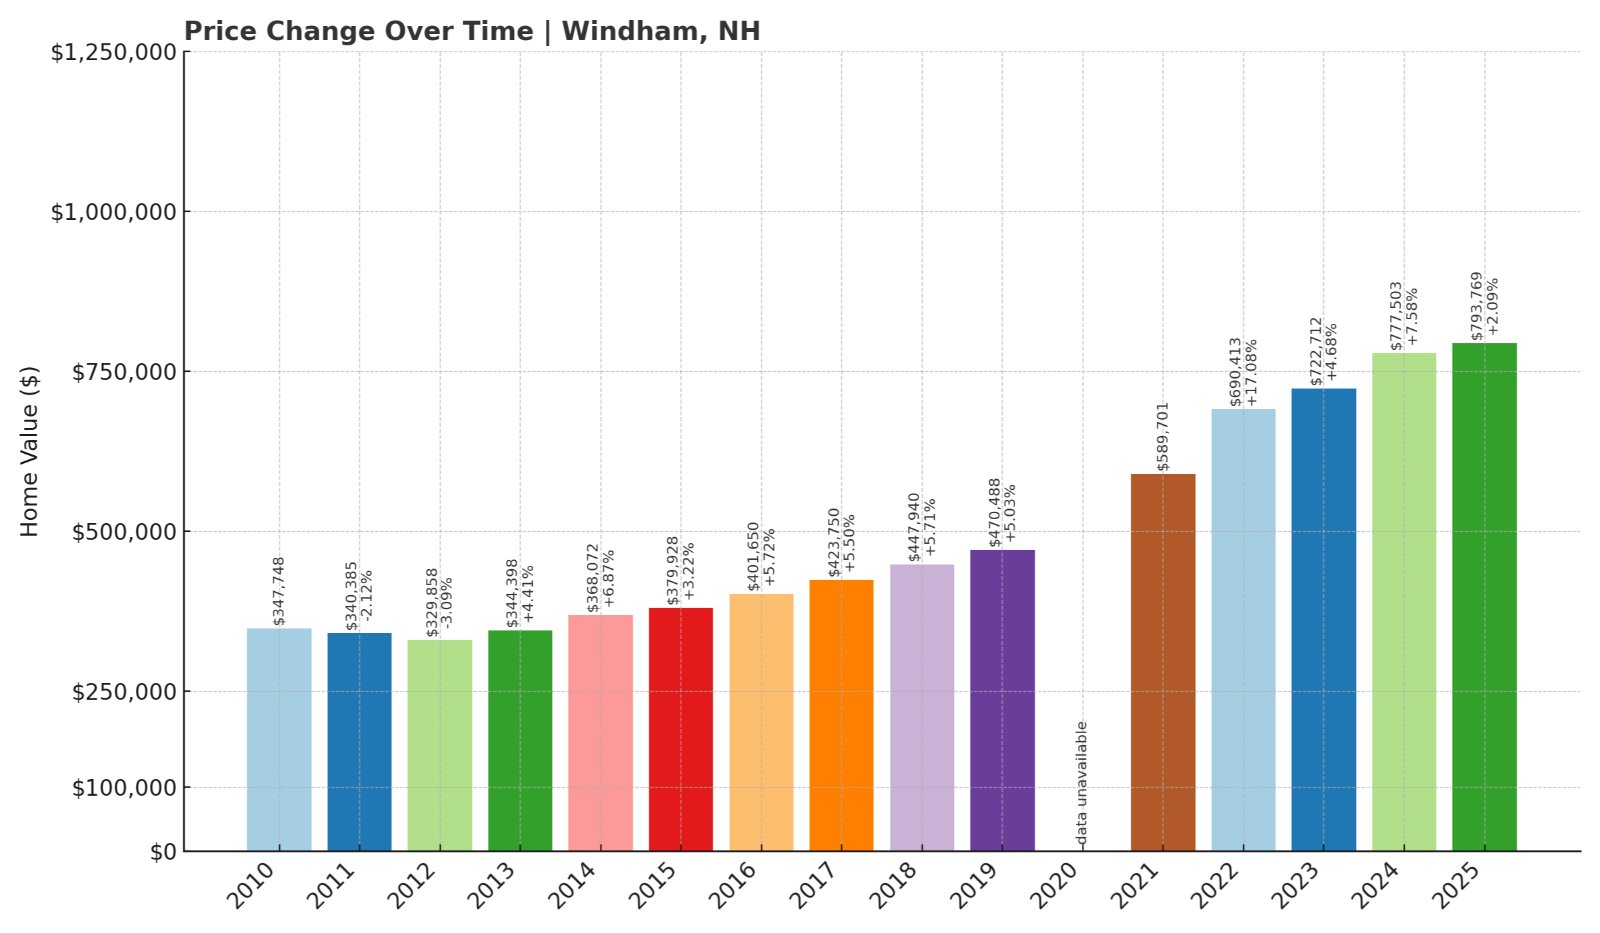
9. Windham – 128% Home Price Increase Since 2010
🔥 Would you like to save this?
- 2010: $347,748
- 2011: $340,385 (-$7,363, -2.12% from previous year)
- 2012: $329,858 (-$10,527, -3.09% from previous year)
- 2013: $344,398 (+$14,540, +4.41% from previous year)
- 2014: $368,072 (+$23,674, +6.87% from previous year)
- 2015: $379,928 (+$11,856, +3.22% from previous year)
- 2016: $401,650 (+$21,722, +5.72% from previous year)
- 2017: $423,750 (+$22,100, +5.50% from previous year)
- 2018: $447,940 (+$24,190, +5.71% from previous year)
- 2019: $470,488 (+$22,548, +5.03% from previous year)
- 2020: N/A
- 2021: $589,701
- 2022: $690,413 (+$100,712, +17.08% from previous year)
- 2023: $722,712 (+$32,299, +4.68% from previous year)
- 2024: $777,503 (+$54,791, +7.58% from previous year)
- 2025: $793,769 (+$16,266, +2.09% from previous year)
Windham’s average home price has risen from under $348K in 2010 to nearly $794K in 2025. Gains have been especially strong since 2021, with a 17% increase in 2022 alone. Even in 2025, the market is holding steady, with modest but continued growth.
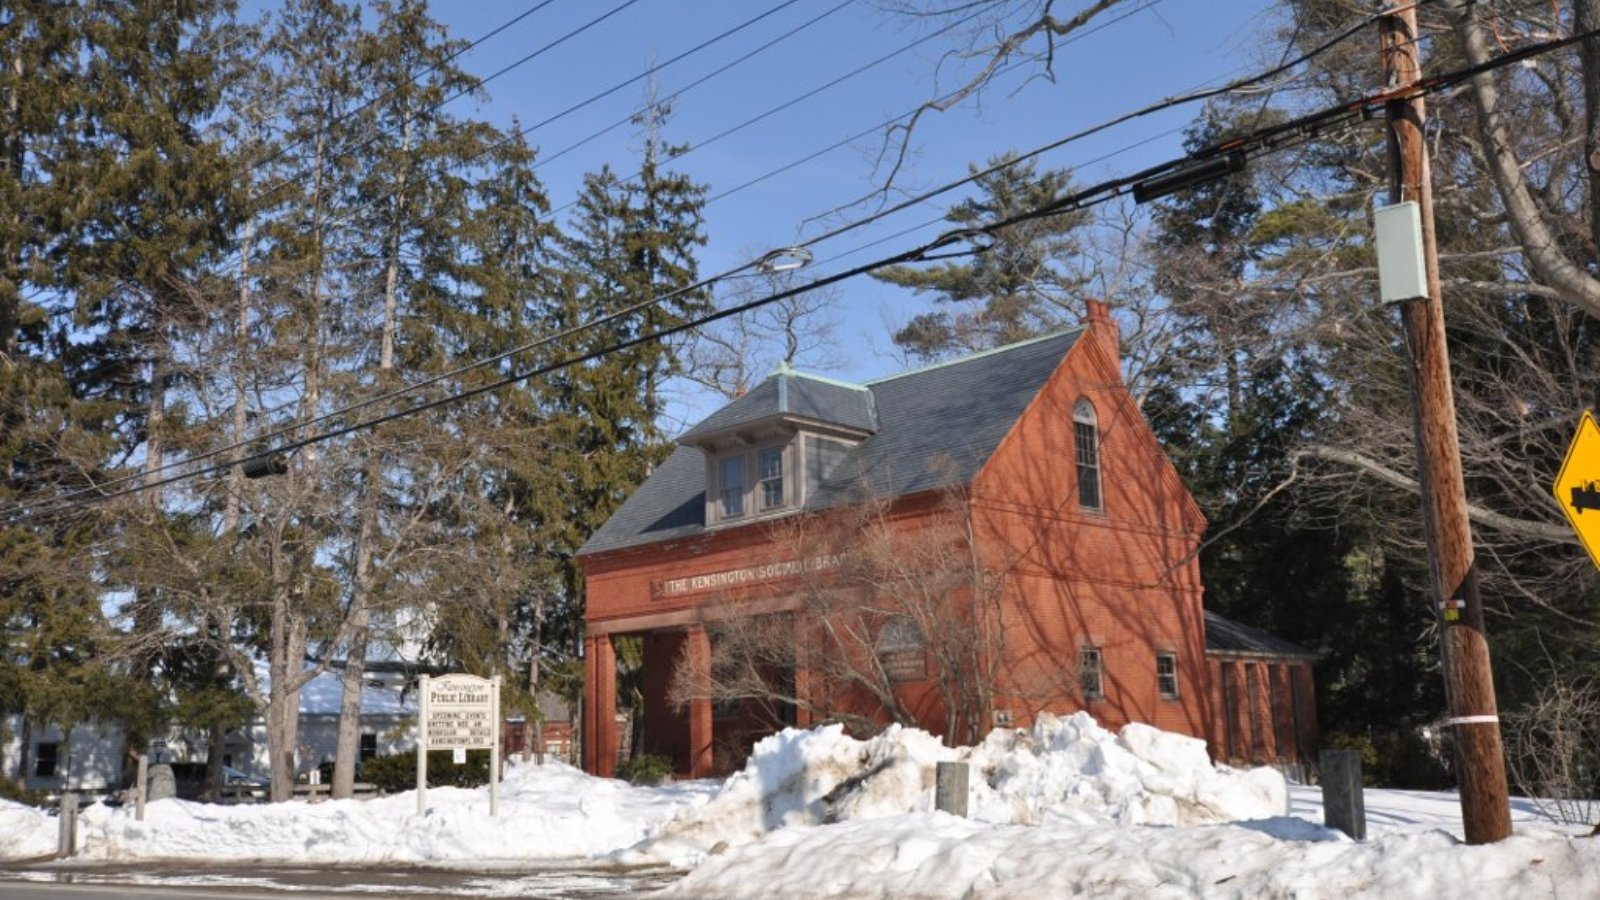
Windham – Big Growth in a Bustling Suburb
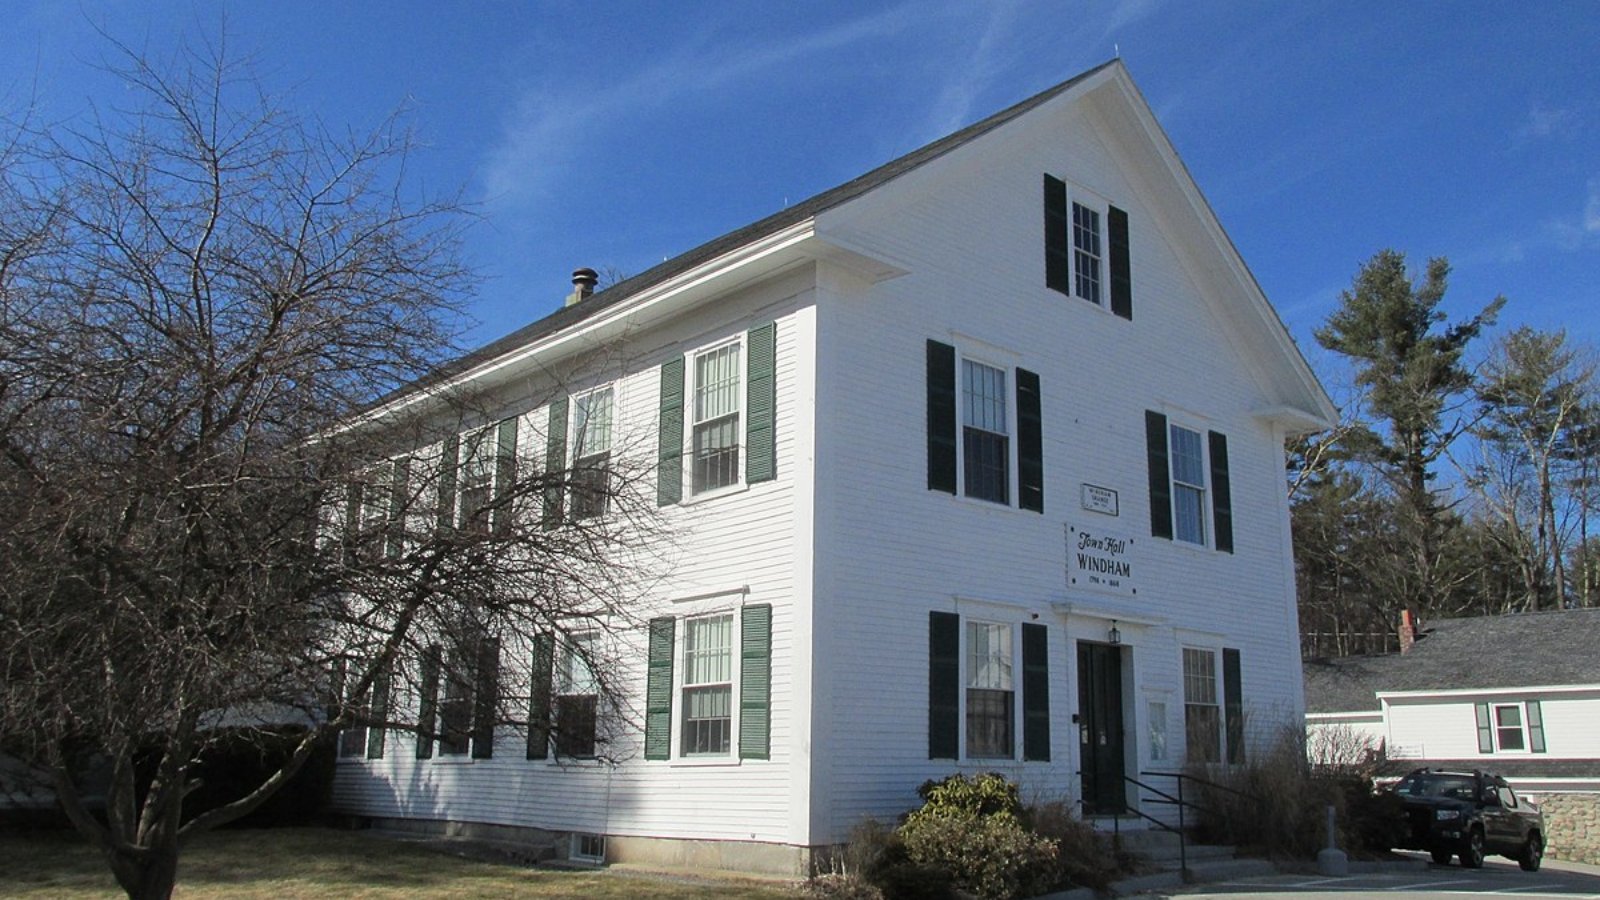
Windham sits in southern New Hampshire, just north of the Massachusetts border. It has become one of the most desirable commuter towns thanks to its school system, proximity to I-93, and growing local amenities. With a population of around 15,000, it’s big enough to offer services while still feeling suburban.
The town saw strong housing demand during the pandemic, and prices took off as buyers competed for limited listings. Continued interest from Massachusetts buyers has helped sustain Windham’s momentum, even as the broader market cools slightly. It remains a top destination for upscale suburban living.
8. Greenland – 137% Home Price Increase Since 2010
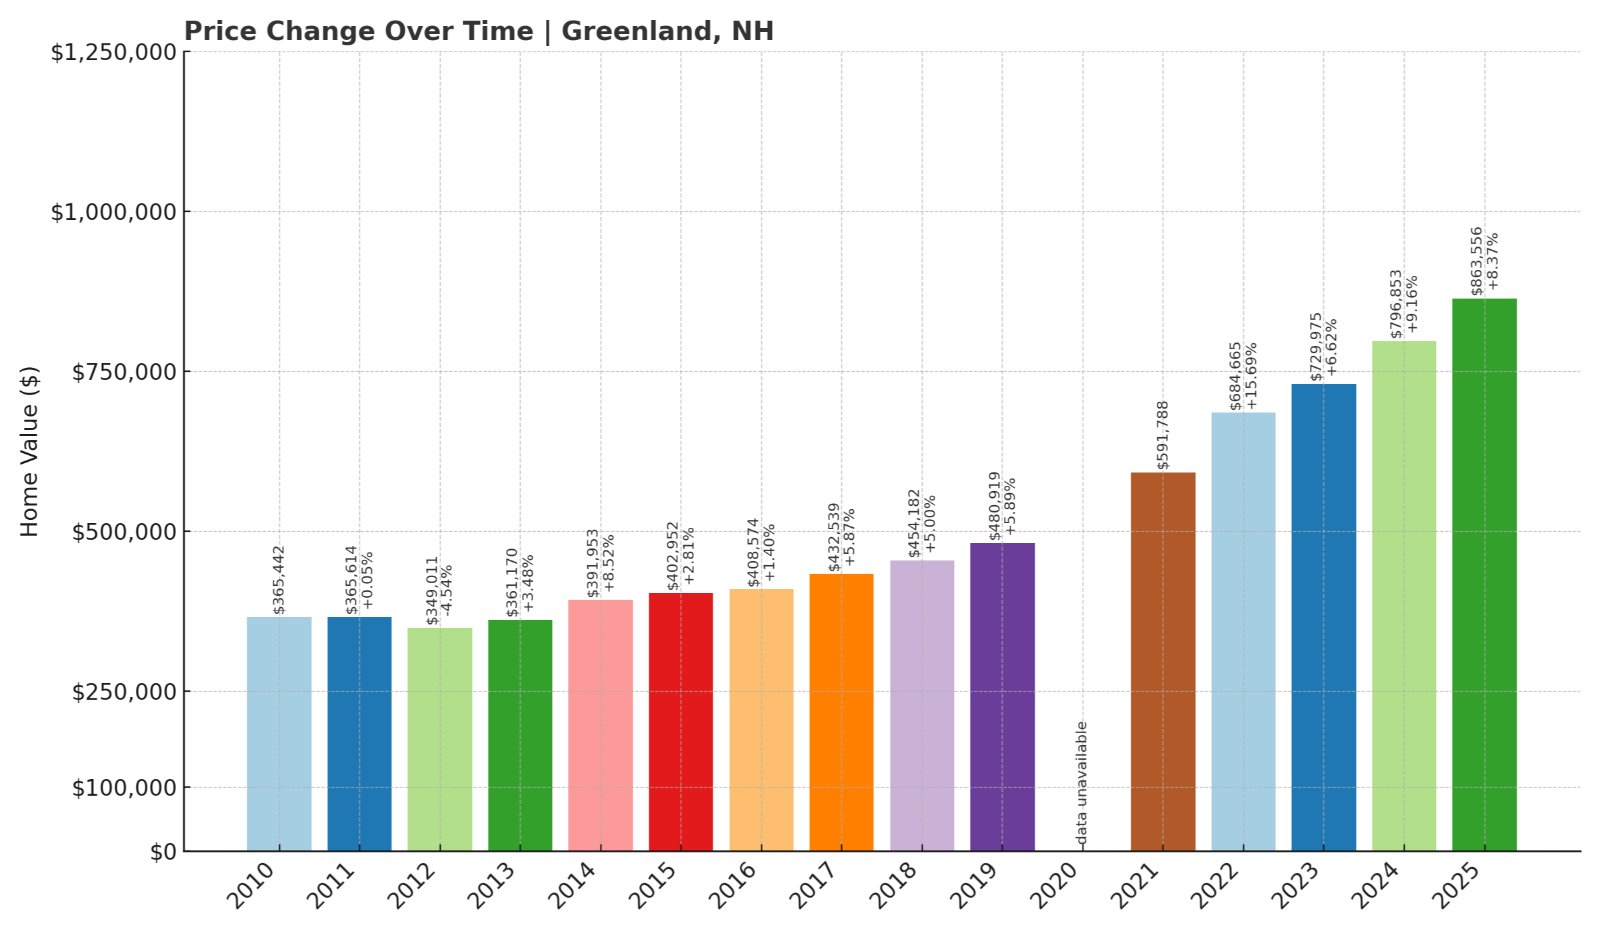
- 2010: $365,442
- 2011: $365,614 (+$172, +0.05% from previous year)
- 2012: $349,011 (-$16,603, -4.54% from previous year)
- 2013: $361,170 (+$12,159, +3.48% from previous year)
- 2014: $391,953 (+$30,783, +8.52% from previous year)
- 2015: $402,952 (+$10,999, +2.81% from previous year)
- 2016: $408,574 (+$5,622, +1.40% from previous year)
- 2017: $432,539 (+$23,965, +5.87% from previous year)
- 2018: $454,182 (+$21,643, +5.00% from previous year)
- 2019: $480,919 (+$26,737, +5.89% from previous year)
- 2020: N/A
- 2021: $591,788
- 2022: $684,665 (+$92,877, +15.69% from previous year)
- 2023: $729,975 (+$45,310, +6.62% from previous year)
- 2024: $796,853 (+$66,878, +9.16% from previous year)
- 2025: $863,556 (+$66,703, +8.37% from previous year)
Greenland’s home prices have grown by nearly 140% since 2010, reaching $863K in 2025. Most of that growth has come since 2021, with three consecutive years of large gains. The town has become one of the Seacoast’s priciest addresses.
Greenland – Rising Along the Seacoast
Located just southwest of Portsmouth, Greenland has long been a desirable spot thanks to its coastal proximity and rural feel. The town blends open space with accessibility, sitting near Route 33 and I-95. It’s a small town with big appeal for buyers seeking quiet without isolation.
Recent growth likely reflects spillover from pricier coastal towns and renewed interest in large lots. Limited housing stock and steady demand have helped lift values sharply in recent years. With prices now approaching $900K, Greenland is one of the fastest-climbing markets in New Hampshire.
7. Newfields – 51% Home Price Increase Since 2010
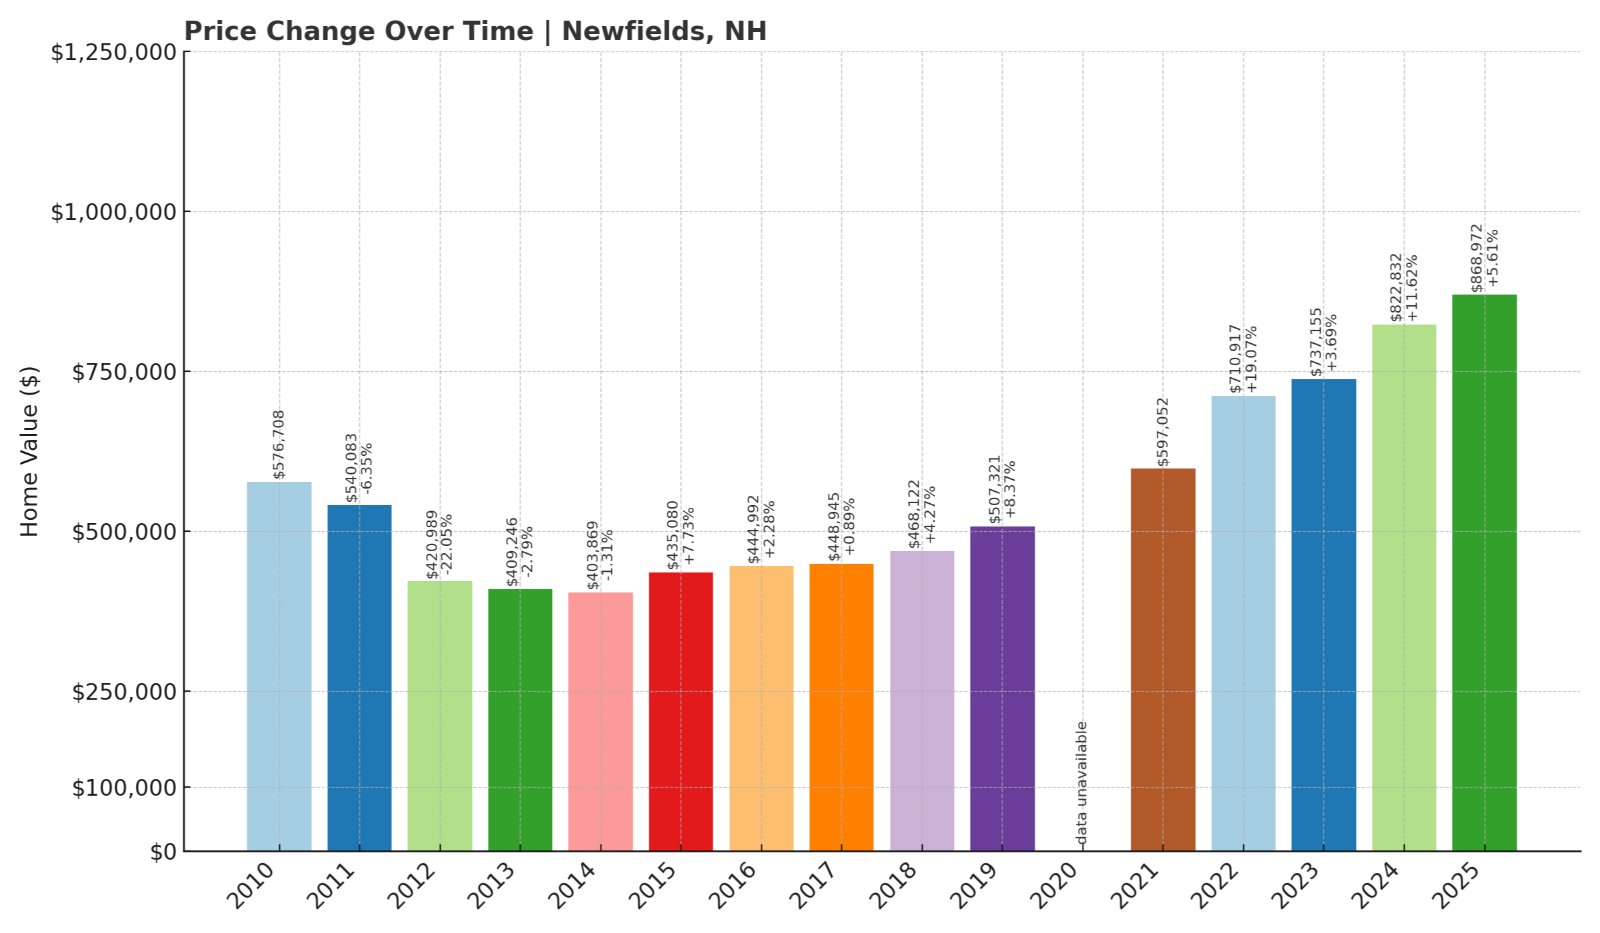
- 2010: $576,708
- 2011: $540,083 (-$36,625, -6.35% from previous year)
- 2012: $420,989 (-$119,094, -22.05% from previous year)
- 2013: $409,246 (-$11,743, -2.79% from previous year)
- 2014: $403,869 (-$5,377, -1.31% from previous year)
- 2015: $435,080 (+$31,211, +7.73% from previous year)
- 2016: $444,992 (+$9,912, +2.28% from previous year)
- 2017: $448,945 (+$3,953, +0.89% from previous year)
- 2018: $468,122 (+$19,177, +4.27% from previous year)
- 2019: $507,321 (+$39,199, +8.37% from previous year)
- 2020: N/A
- 2021: $597,052
- 2022: $710,917 (+$113,865, +19.07% from previous year)
- 2023: $737,155 (+$26,238, +3.69% from previous year)
- 2024: $822,832 (+$85,677, +11.62% from previous year)
- 2025: $868,972 (+$46,140, +5.61% from previous year)
Newfields saw steep declines in the early 2010s, dropping from nearly $577K in 2010 to around $403K by 2014. But since 2015, values have surged—especially post-2020—reaching almost $869K in 2025. The town has now reclaimed and exceeded its previous highs.
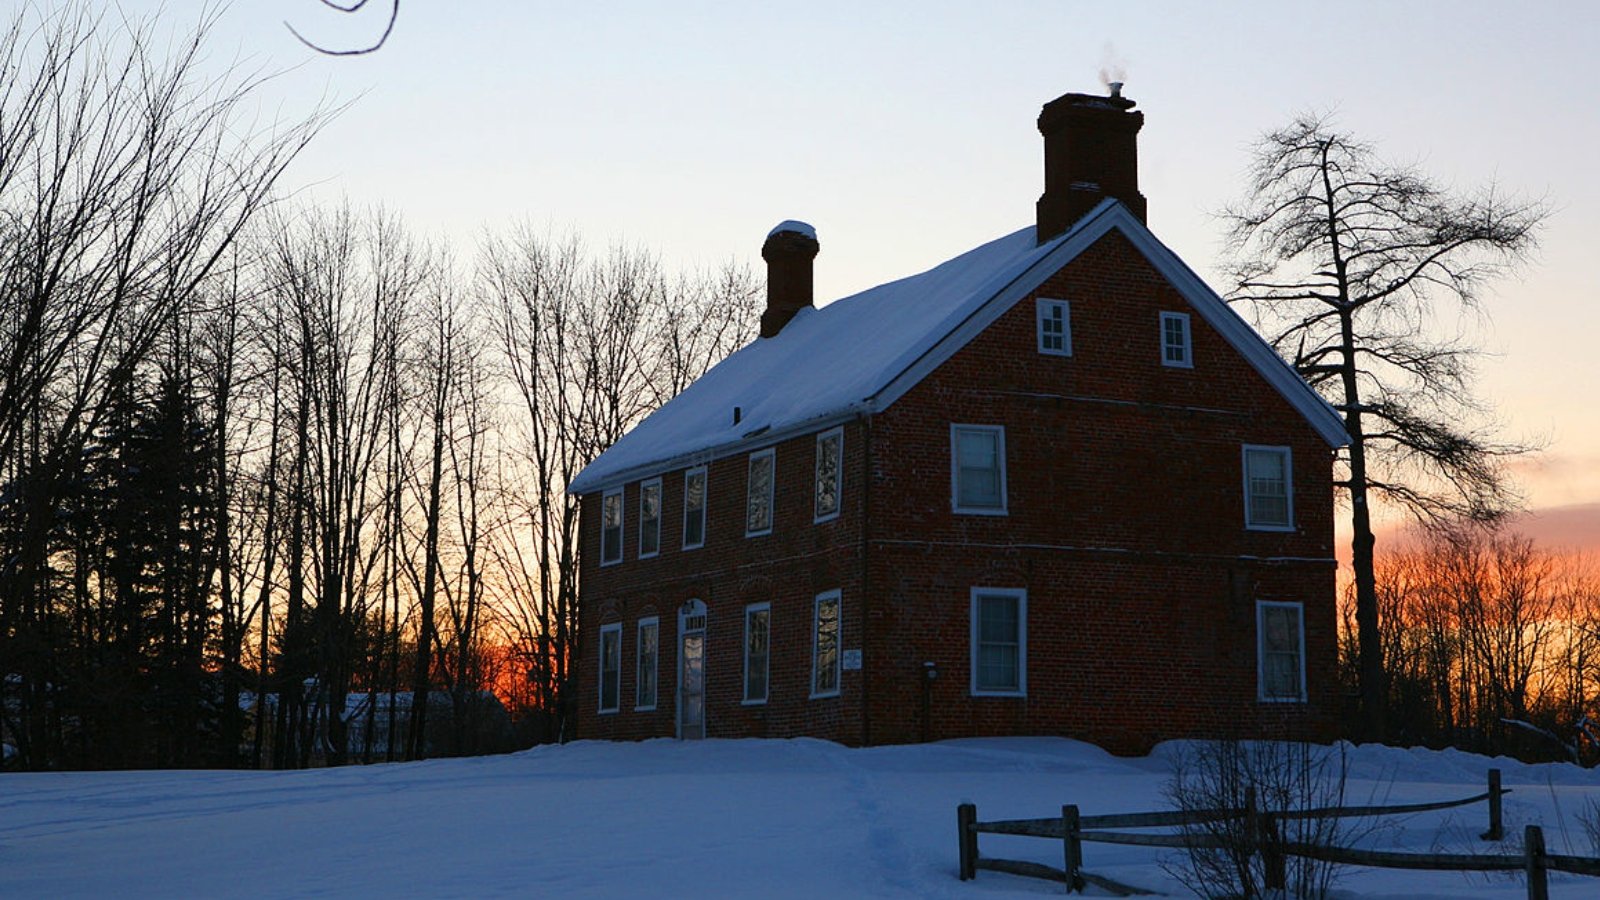
Newfields – A Market That Bounced Back Strong
Newfields is a small town located near Exeter and not far from the coast. It has a strong sense of community and is surrounded by forest and farmland, which adds to its appeal. With easy access to Routes 101 and 108, it’s a quiet commuter-friendly spot that’s stayed off the radar—until recently.
After years of decline, prices have rebounded strongly. Limited turnover and renewed buyer interest have played key roles. With homes now regularly selling above $800K, Newfields has fully transitioned into one of New Hampshire’s higher-end towns.
6. Hampton Falls – 162% Home Price Increase Since 2010
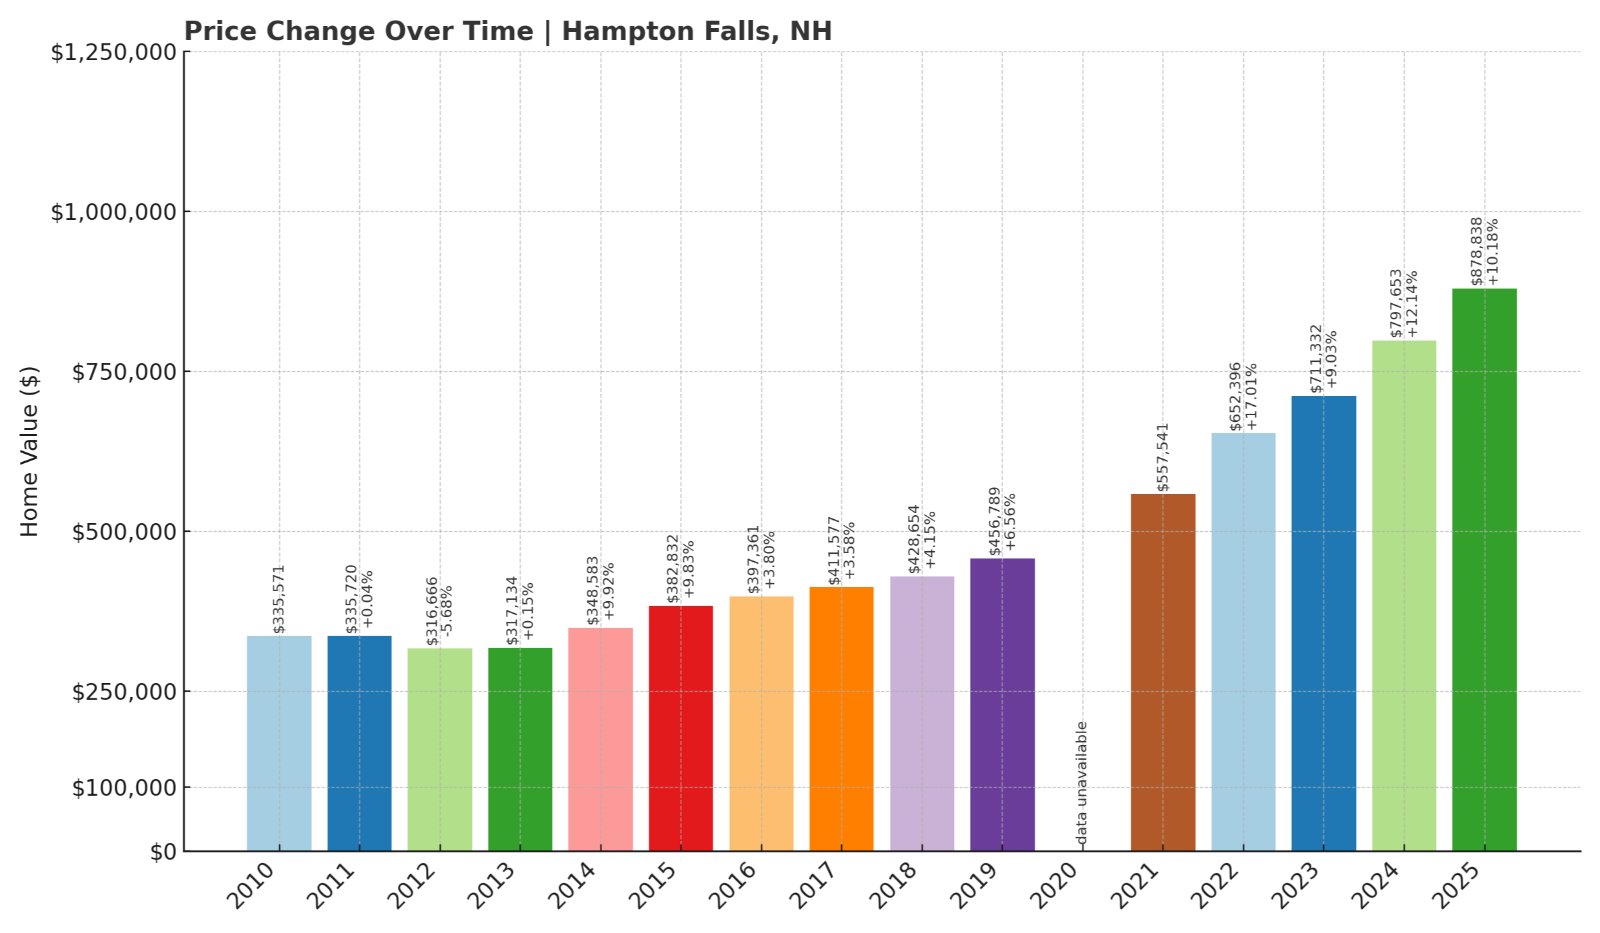
- 2010: $335,571
- 2011: $335,720 (+$149, +0.04% from previous year)
- 2012: $316,666 (-$19,054, -5.68% from previous year)
- 2013: $317,134 (+$468, +0.15% from previous year)
- 2014: $348,583 (+$31,449, +9.92% from previous year)
- 2015: $382,832 (+$34,249, +9.83% from previous year)
- 2016: $397,361 (+$14,529, +3.80% from previous year)
- 2017: $411,577 (+$14,216, +3.58% from previous year)
- 2018: $428,654 (+$17,077, +4.15% from previous year)
- 2019: $456,789 (+$28,135, +6.56% from previous year)
- 2020: N/A
- 2021: $557,541
- 2022: $652,396 (+$94,855, +17.01% from previous year)
- 2023: $711,332 (+$58,936, +9.03% from previous year)
- 2024: $797,653 (+$86,321, +12.14% from previous year)
- 2025: $878,838 (+$81,185, +10.18% from previous year)
Hampton Falls has experienced an extraordinary 162% jump in home values since 2010, with prices now approaching $879K. Since 2021, it has seen three consecutive years of large increases—each well over 9%. This is a small town with some of the biggest numbers on the list.
Hampton Falls – Quiet Prestige with Coastal Access
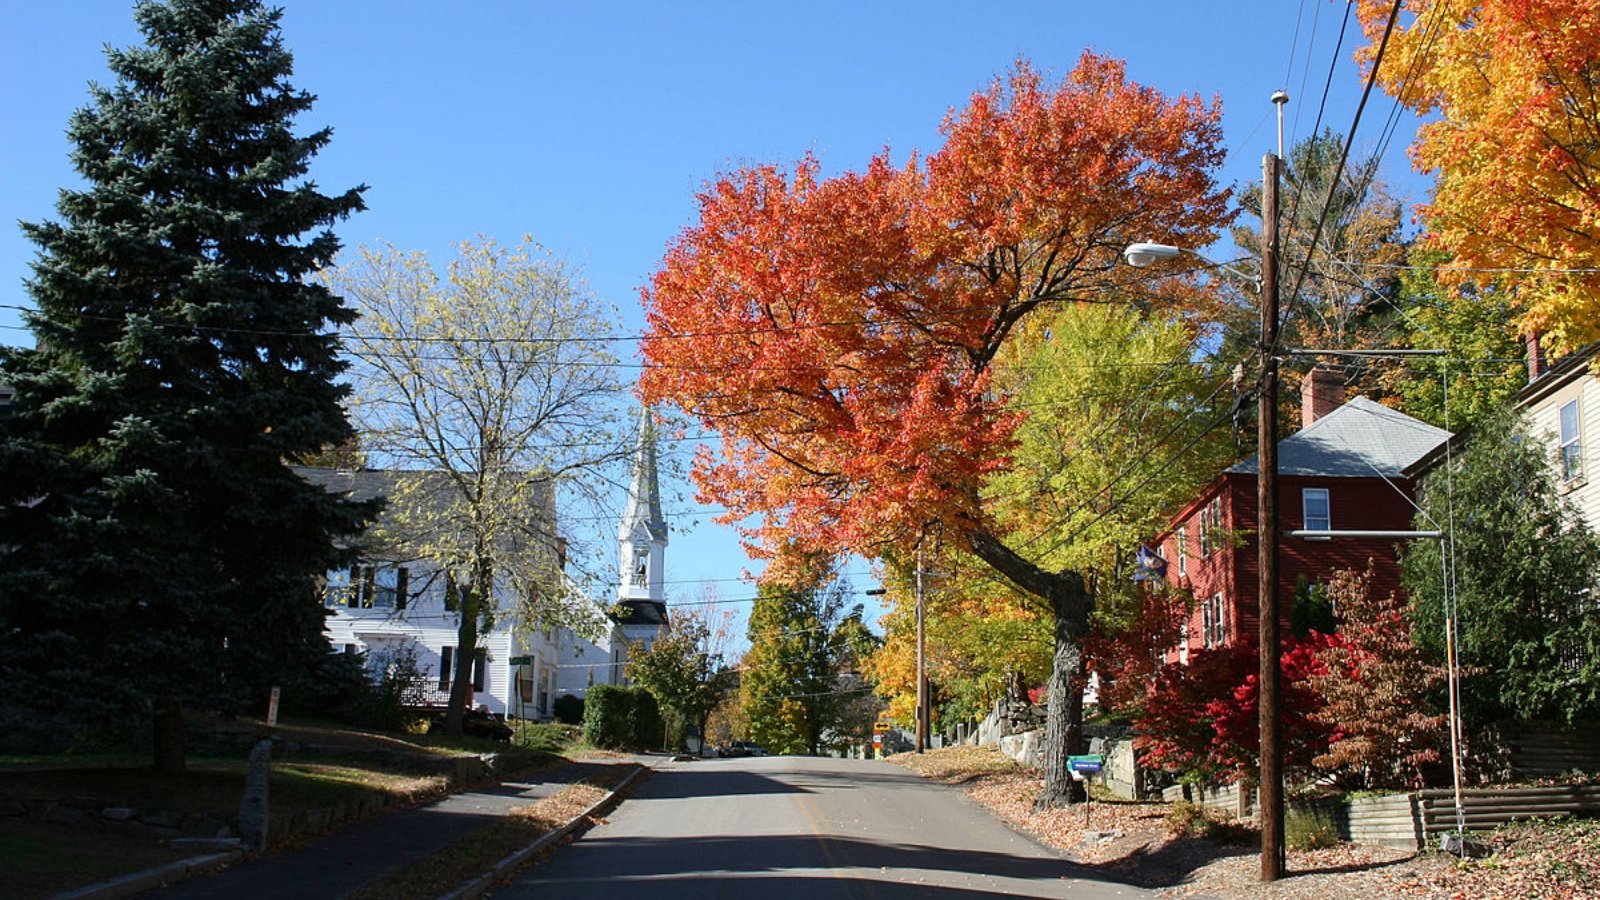
Nestled just inland from the Atlantic, Hampton Falls offers easy access to Route 1 and I-95 while maintaining a distinctly rural, high-end feel. It’s a town of colonial homes, horse farms, and carefully preserved open space. Its location between Seabrook and Exeter adds to its strategic appeal.
Much of the growth since 2021 has been driven by an influx of out-of-state buyers seeking space, privacy, and coastal proximity. With few new homes being built, supply remains tight. The town’s mix of elegance, convenience, and low-key charm has pushed values to record highs.
5. Hanover – 126% Home Price Increase Since 2010
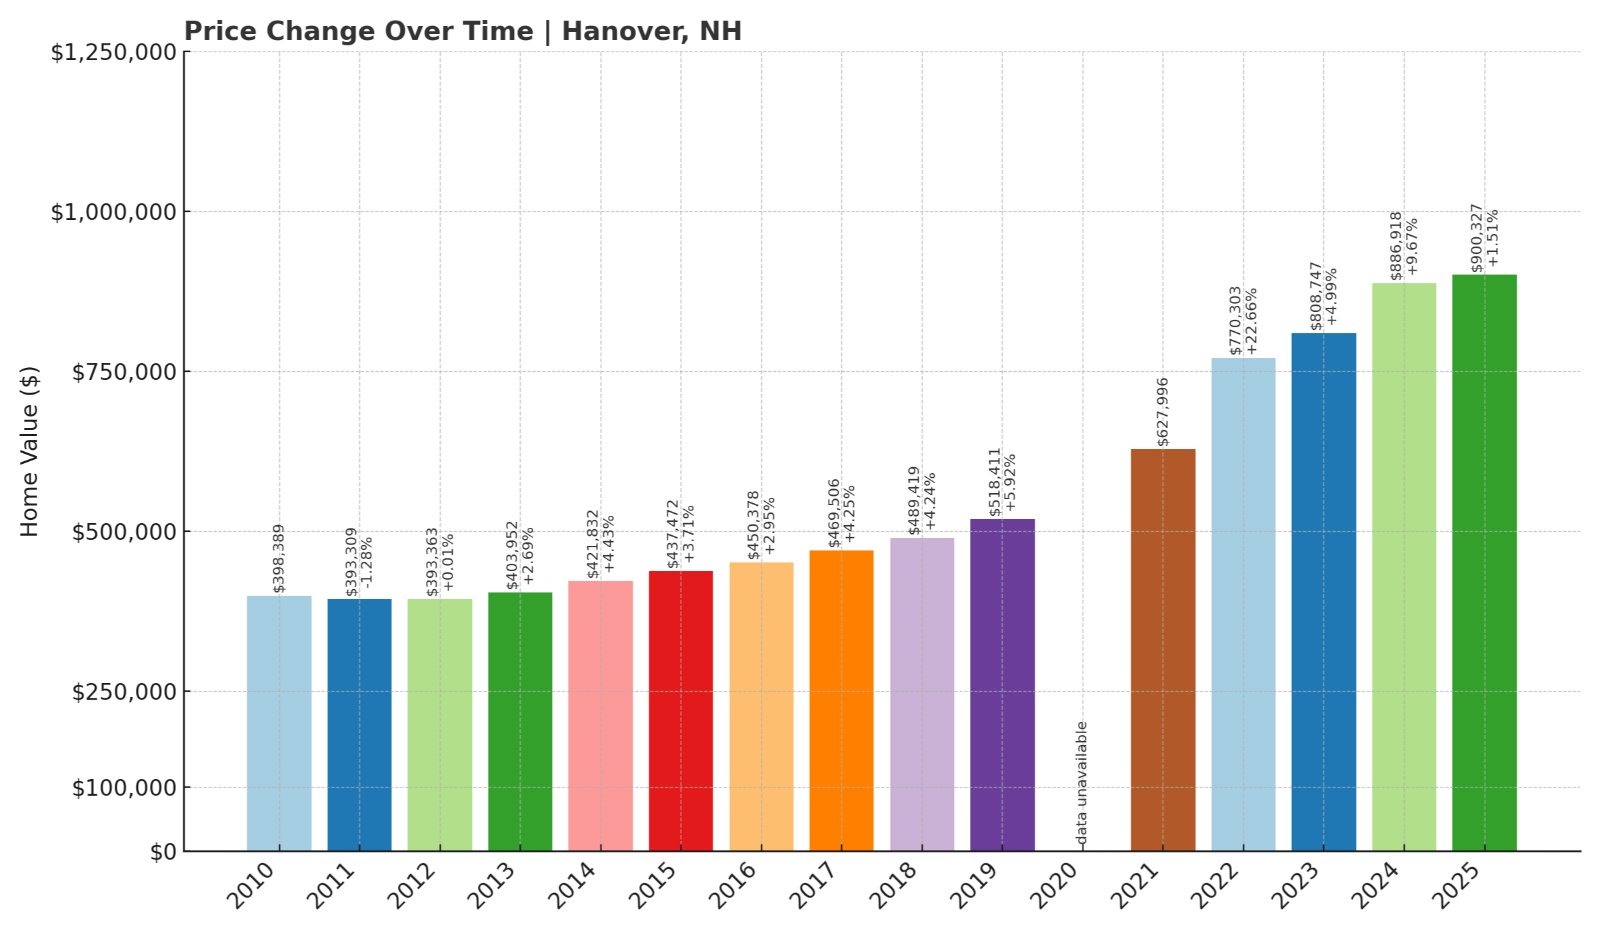
- 2010: $398,389
- 2011: $393,309 (-$5,080, -1.28% from previous year)
- 2012: $393,363 (+$54, +0.01% from previous year)
- 2013: $403,952 (+$10,589, +2.69% from previous year)
- 2014: $421,832 (+$17,880, +4.43% from previous year)
- 2015: $437,472 (+$15,640, +3.71% from previous year)
- 2016: $450,378 (+$12,906, +2.95% from previous year)
- 2017: $469,506 (+$19,128, +4.25% from previous year)
- 2018: $489,419 (+$19,913, +4.24% from previous year)
- 2019: $518,411 (+$28,992, +5.92% from previous year)
- 2020: N/A
- 2021: $627,996
- 2022: $770,303 (+$142,307, +22.66% from previous year)
- 2023: $808,747 (+$38,444, +4.99% from previous year)
- 2024: $886,918 (+$78,171, +9.67% from previous year)
- 2025: $900,327 (+$13,409, +1.51% from previous year)
Hanover’s home prices have jumped from under $400K in 2010 to over $900K in 2025. The largest leap came in 2022, with a massive 22.7% gain. The pace has slowed recently, but the town has firmly cemented its place among the state’s highest-priced markets.
Hanover – Ivy League Prestige and Steady Demand
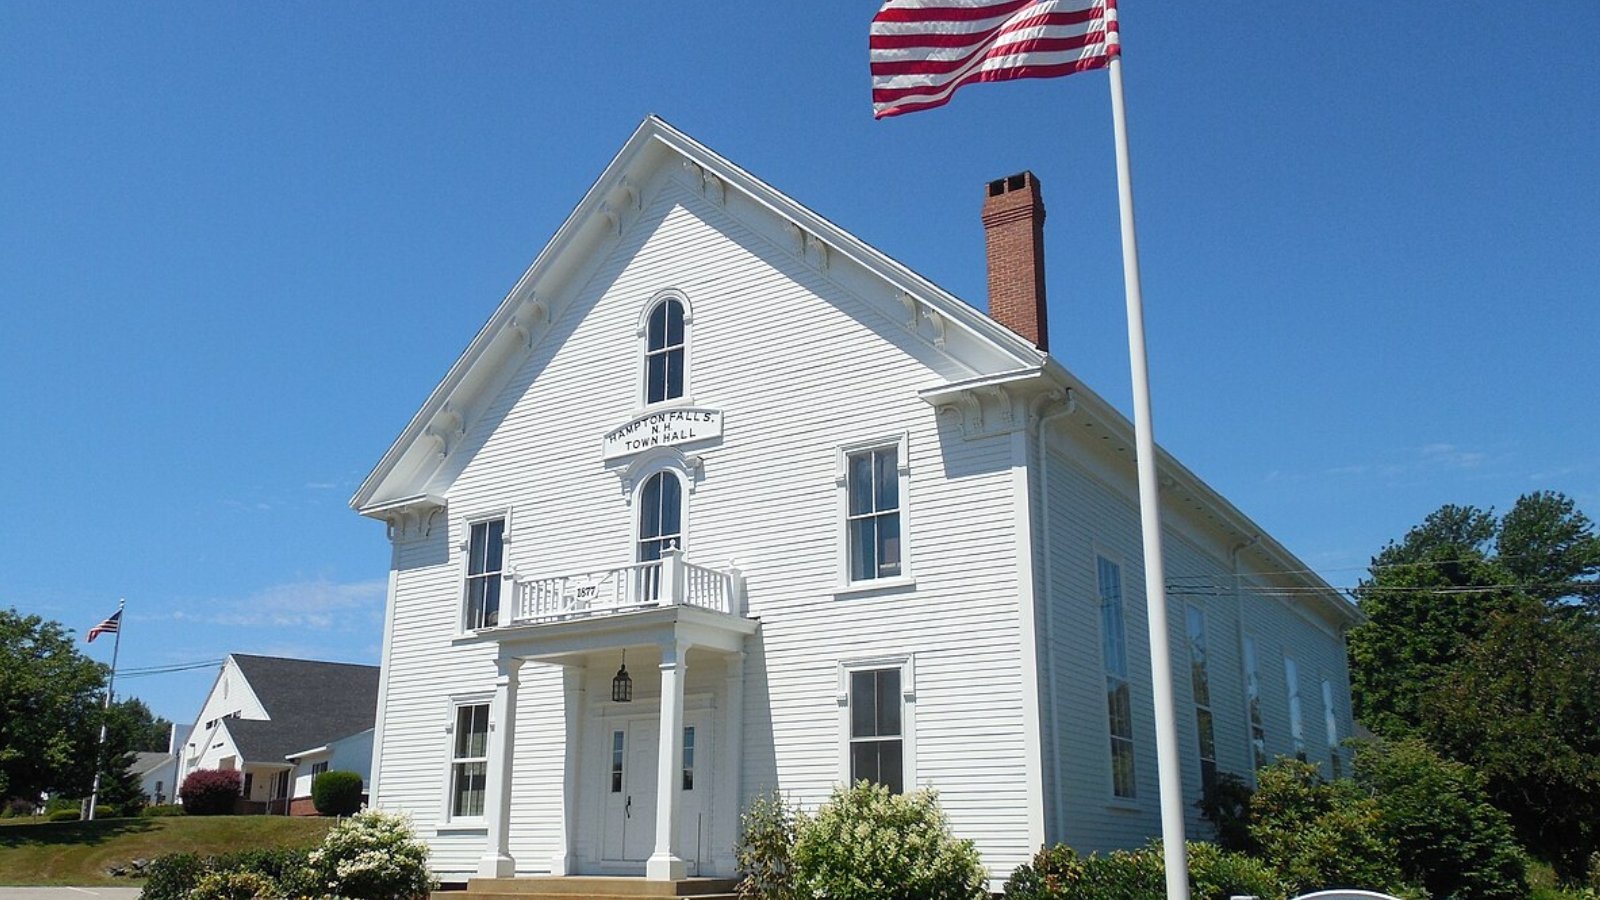
Home to Dartmouth College, Hanover enjoys a unique status in New Hampshire. The presence of the Ivy League school drives consistent demand for housing—both from faculty and affluent buyers drawn to the college-town atmosphere. The Upper Valley location also offers natural beauty and access to outdoor recreation.
Even as other towns saw dramatic swings, Hanover’s growth has been relatively smooth over the past decade. The college anchors the local economy, while Hanover’s cultural and educational appeal keeps buyers interested year-round. In 2025, it continues to be one of the most elite and stable places to buy in New Hampshire.
4. North Hampton – 152% Home Price Increase Since 2010
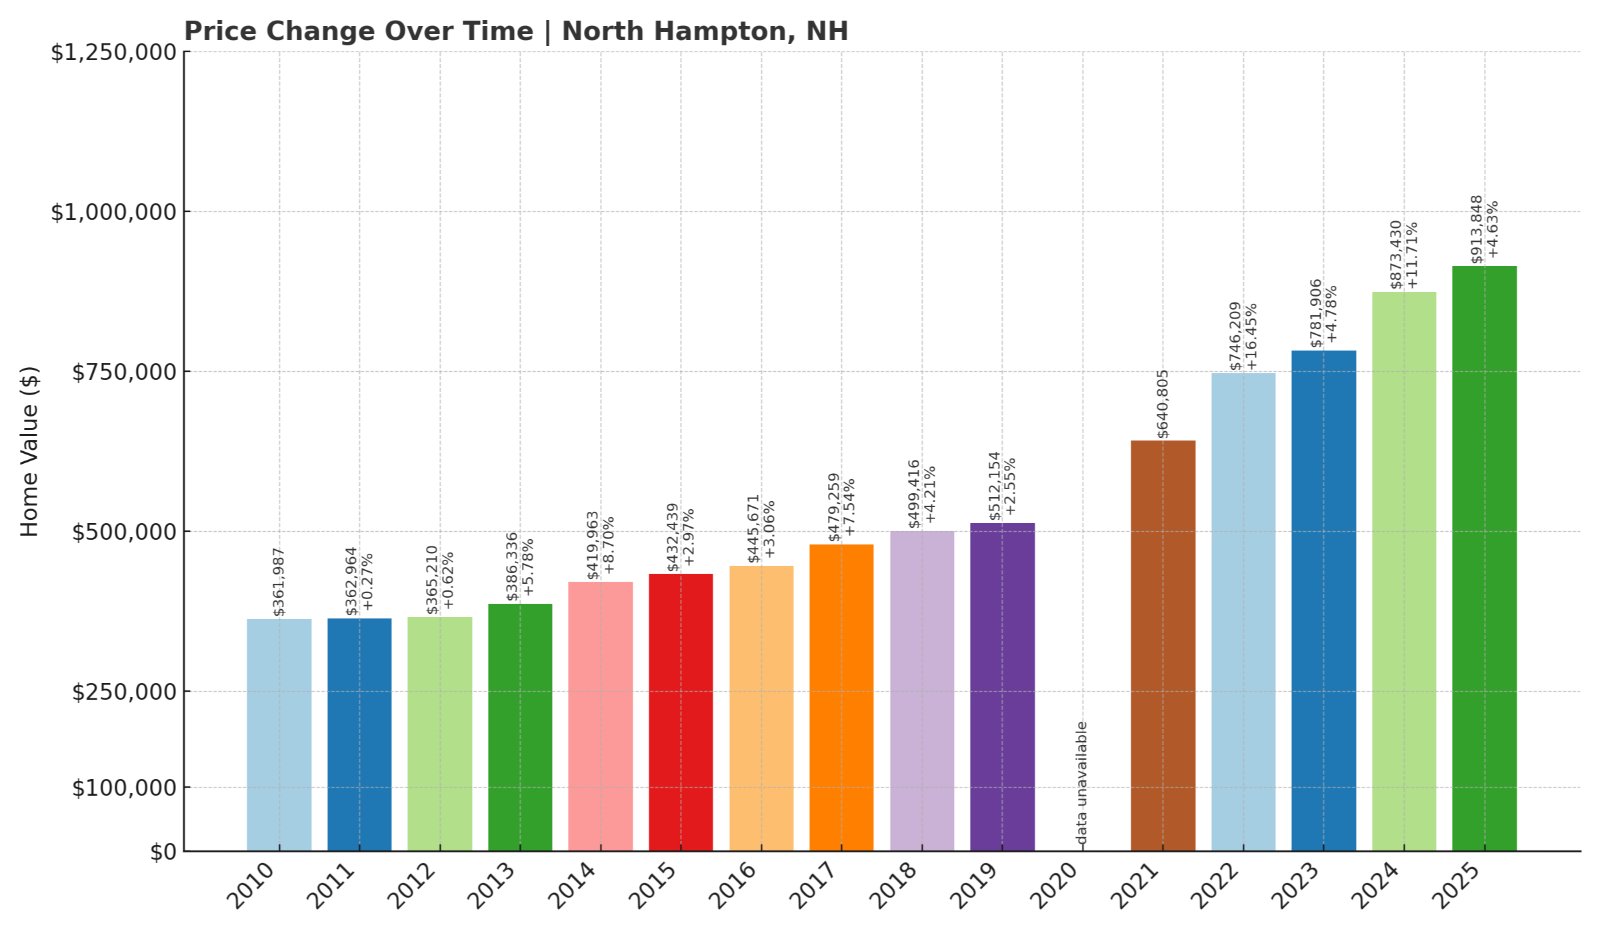
- 2010: $361,987
- 2011: $362,964 (+$977, +0.27% from previous year)
- 2012: $365,210 (+$2,246, +0.62% from previous year)
- 2013: $386,336 (+$21,126, +5.78% from previous year)
- 2014: $419,963 (+$33,627, +8.70% from previous year)
- 2015: $432,439 (+$12,476, +2.97% from previous year)
- 2016: $445,671 (+$13,232, +3.06% from previous year)
- 2017: $479,259 (+$33,588, +7.54% from previous year)
- 2018: $499,416 (+$20,157, +4.21% from previous year)
- 2019: $512,154 (+$12,738, +2.55% from previous year)
- 2020: N/A
- 2021: $640,805
- 2022: $746,209 (+$105,404, +16.45% from previous year)
- 2023: $781,906 (+$35,697, +4.78% from previous year)
- 2024: $873,430 (+$91,524, +11.71% from previous year)
- 2025: $913,848 (+$40,418, +4.63% from previous year)
North Hampton’s home values have more than doubled since 2010, with prices now exceeding $913K. Its strongest gains came post-2020, and the upward trend has continued steadily through 2025. This coastal town is becoming increasingly elite.
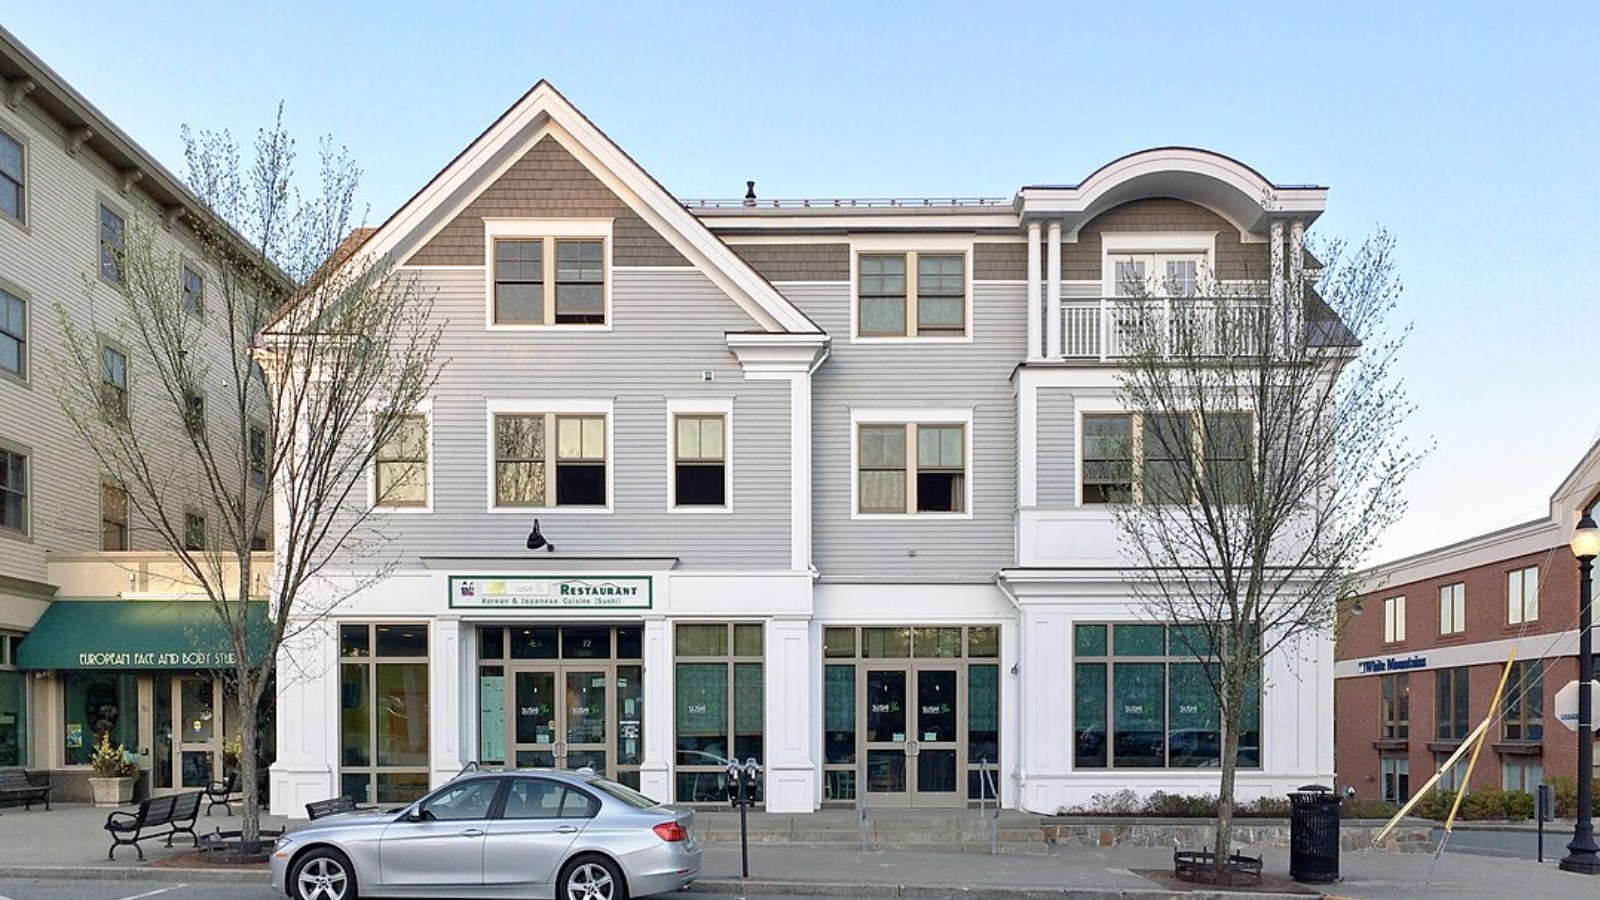
North Hampton – Ocean Breezes, Luxury Prices
Stretching along a short but scenic piece of New Hampshire’s coast, North Hampton is prized for its beaches, backroads, and seclusion. It’s more residential and less commercial than its neighbors, offering a quieter stretch of oceanfront living. That exclusivity comes with a price.
Buyers who want waterfront proximity without the bustle of Hampton Beach often look here. Limited new development, large homes, and location prestige have all helped push values into the top tier of the market. With the median home price closing in on $1 million, North Hampton is now firmly in luxury territory.
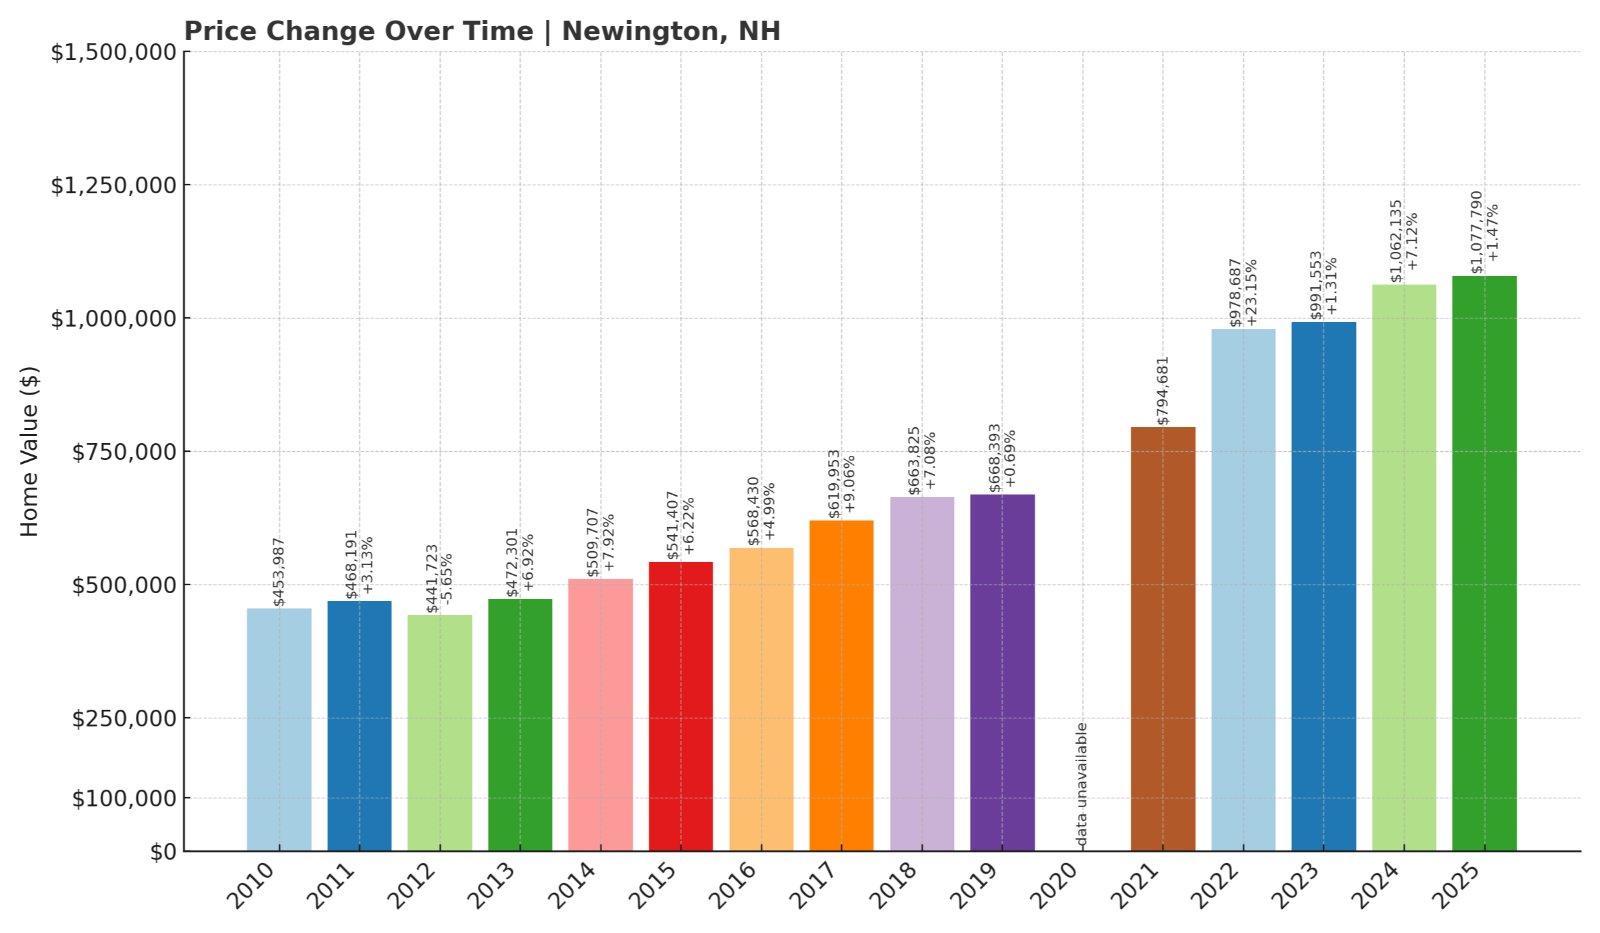
3. Newington – 137% Home Price Increase Since 2010
🔥 Would you like to save this?
- 2010: $453,987
- 2011: $468,191 (+$14,204, +3.13% from previous year)
- 2012: $441,723 (-$26,468, -5.65% from previous year)
- 2013: $472,301 (+$30,578, +6.92% from previous year)
- 2014: $509,707 (+$37,406, +7.92% from previous year)
- 2015: $541,407 (+$31,700, +6.22% from previous year)
- 2016: $568,430 (+$27,023, +4.99% from previous year)
- 2017: $619,953 (+$51,523, +9.06% from previous year)
- 2018: $663,825 (+$43,872, +7.08% from previous year)
- 2019: $668,393 (+$4,568, +0.69% from previous year)
- 2020: N/A
- 2021: $794,681
- 2022: $978,687 (+$184,006, +23.15% from previous year)
- 2023: $991,553 (+$12,866, +1.31% from previous year)
- 2024: $1,062,135 (+$70,582, +7.12% from previous year)
- 2025: $1,077,790 (+$15,655, +1.47% from previous year)
Newington’s home prices have climbed from $454K in 2010 to nearly $1.08 million in 2025. While 2022 was a standout year with a 23% gain, prices have held firm since, adding to its long-term growth and elite status.
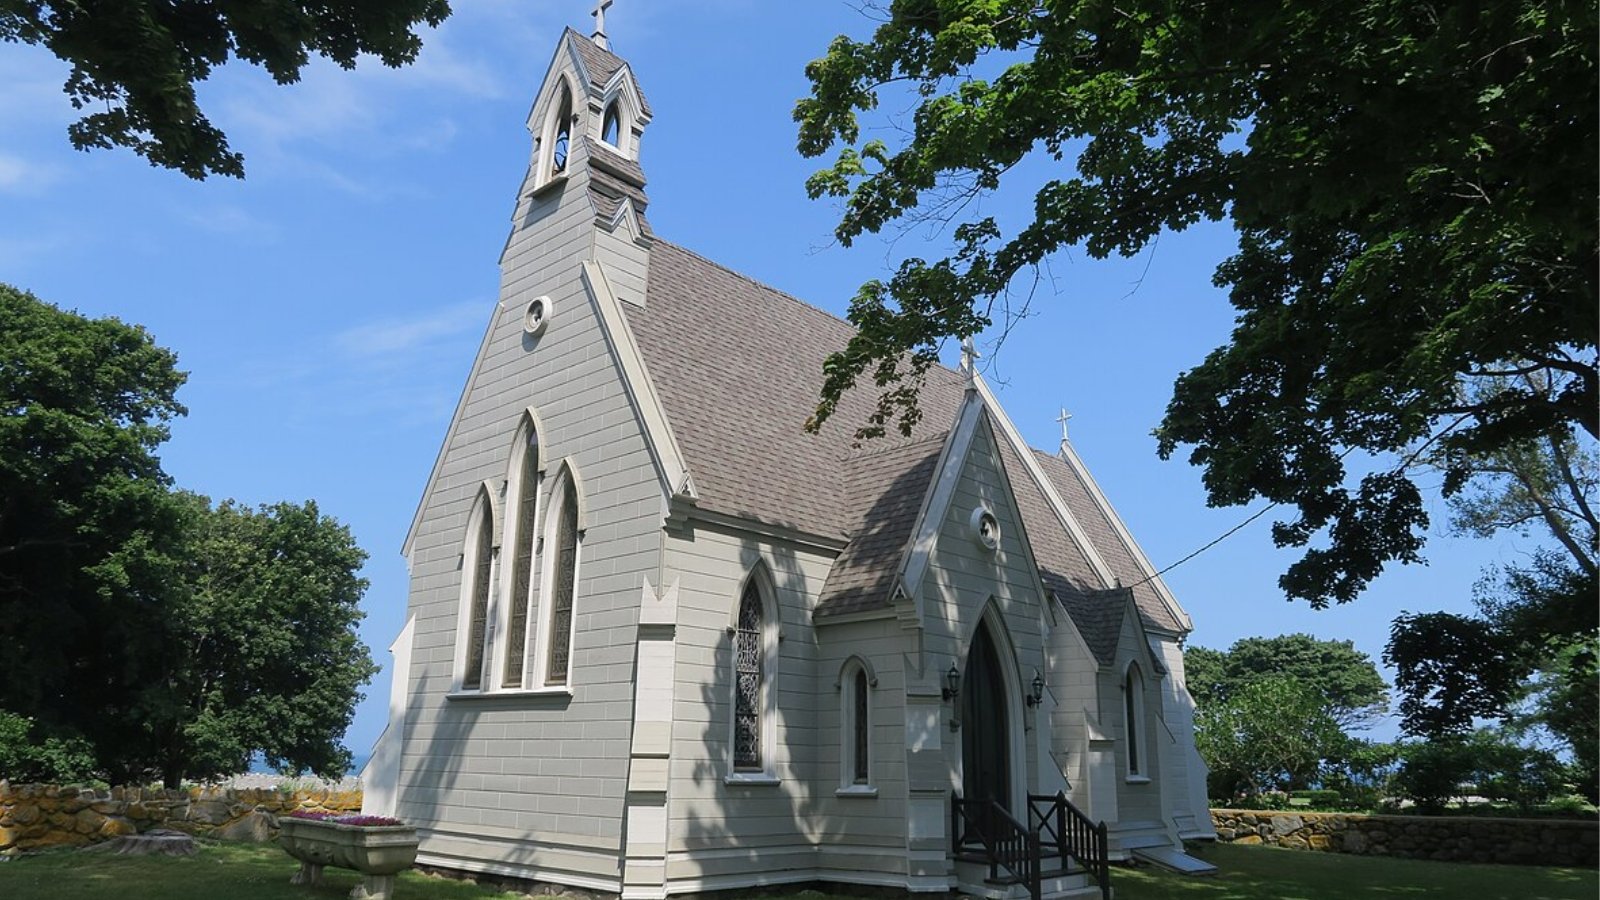
Newington – A Tiny Town with Big Numbers
Newington is a small but strategically located town just west of Portsmouth. Though it has a tiny population, it’s home to commercial developments, waterfront properties, and one of the state’s lowest property tax rates. These factors combine to make it a powerful draw for high-end buyers.
Much of its price growth comes from a limited supply of large homes on oversized lots, as well as demand for quiet living near urban centers. With median home values crossing the $1 million mark, Newington is among the top-tier markets in New Hampshire—and shows no signs of slowing.
2. Rye – 154% Home Price Increase Since 2010
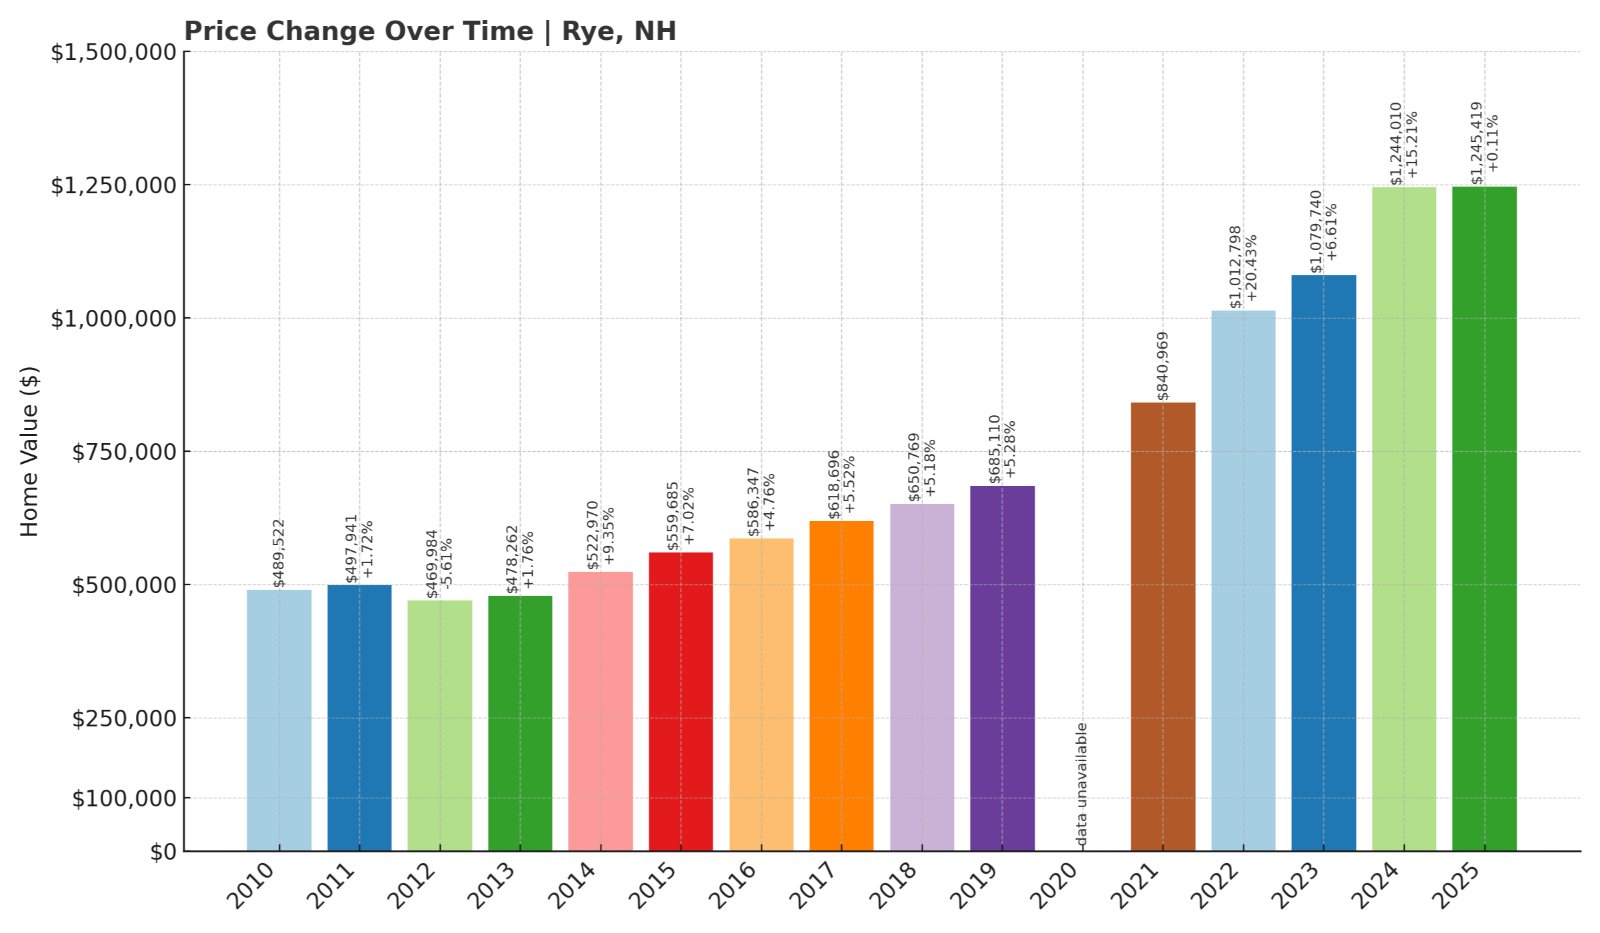
- 2010: $489,522
- 2011: $497,941 (+$8,419, +1.72% from previous year)
- 2012: $469,984 (-$27,957, -5.61% from previous year)
- 2013: $478,262 (+$8,278, +1.76% from previous year)
- 2014: $522,970 (+$44,708, +9.35% from previous year)
- 2015: $559,685 (+$36,715, +7.02% from previous year)
- 2016: $586,347 (+$26,662, +4.76% from previous year)
- 2017: $618,696 (+$32,349, +5.52% from previous year)
- 2018: $650,769 (+$32,073, +5.18% from previous year)
- 2019: $685,110 (+$34,341, +5.28% from previous year)
- 2020: N/A
- 2021: $840,969
- 2022: $1,012,798 (+$171,829, +20.43% from previous year)
- 2023: $1,079,740 (+$66,942, +6.61% from previous year)
- 2024: $1,244,010 (+$164,270, +15.21% from previous year)
- 2025: $1,245,419 (+$1,409, +0.11% from previous year)
Rye’s home prices have risen by more than 154% since 2010, reaching over $1.24 million in 2025. The town saw huge growth in 2022 and 2024, with increases over 20% and 15% in those years. While 2025 was nearly flat, the long-term trend is clear—Rye is one of the most expensive places to live in the state.
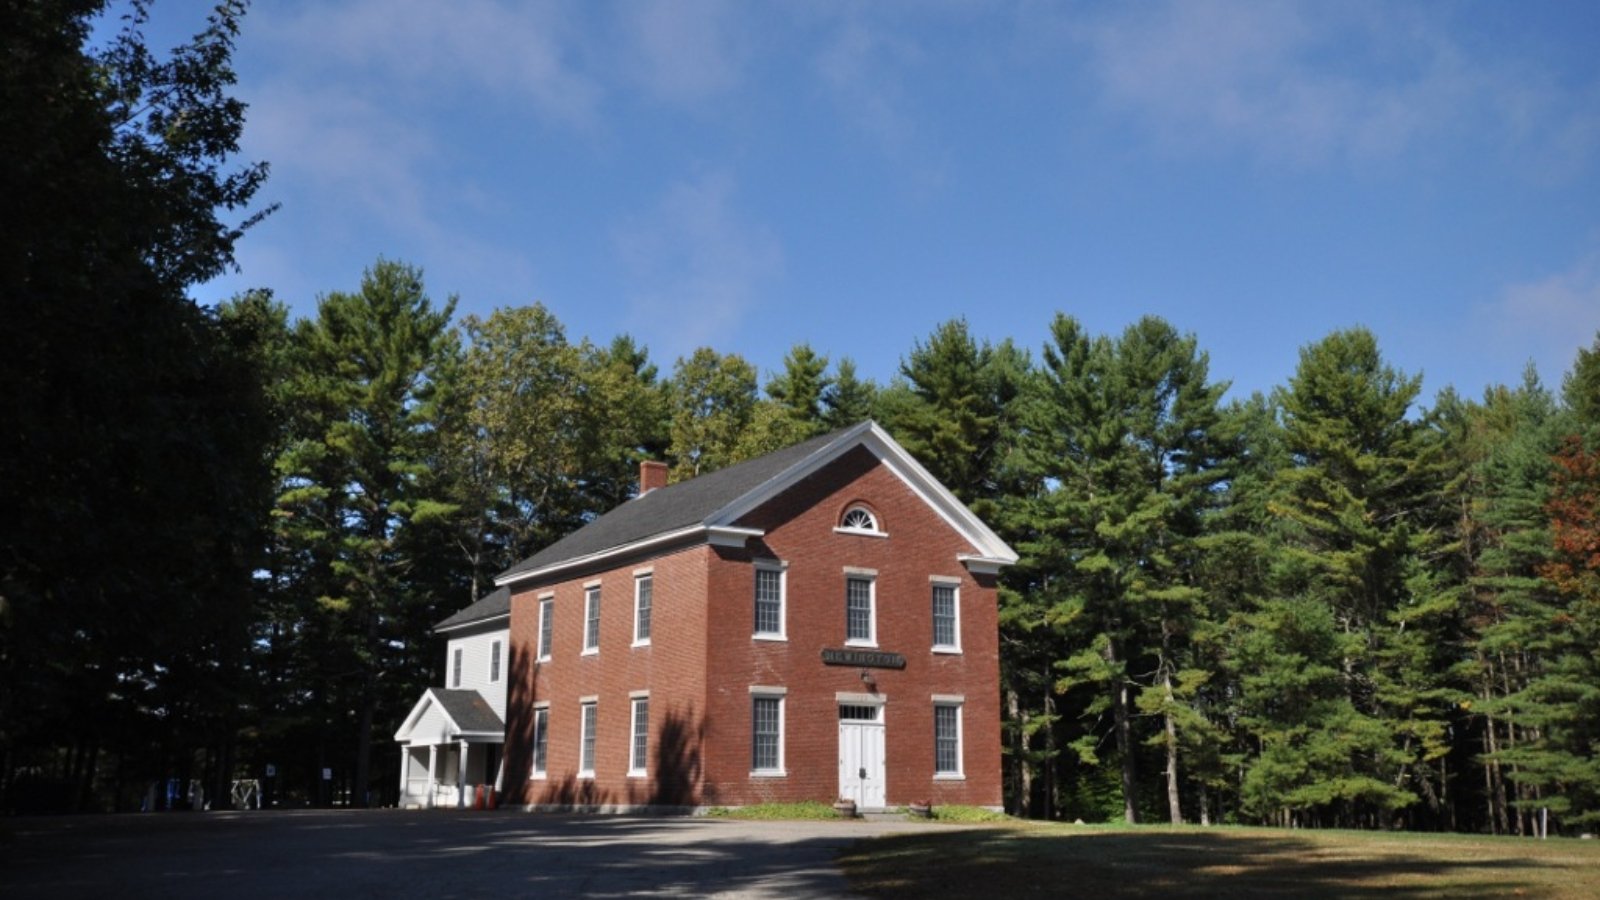
Rye – New Hampshire’s Most Sought-After Shoreline
With the longest stretch of oceanfront in New Hampshire, Rye has always been a desirable location. Unlike neighboring Hampton, Rye offers more privacy, higher-end housing, and less commercial development. The real estate here reflects that exclusivity—with prices well into seven figures.
The sharp jumps in recent years suggest surging demand for coastal homes, especially those with views or walking access to the water. Limited inventory, coupled with Rye’s small-town charm and clean beaches, has helped sustain high prices even as growth slows elsewhere. For buyers seeking elite oceanfront property, Rye continues to top the list.
1. New Castle – 145% Home Price Increase Since 2010
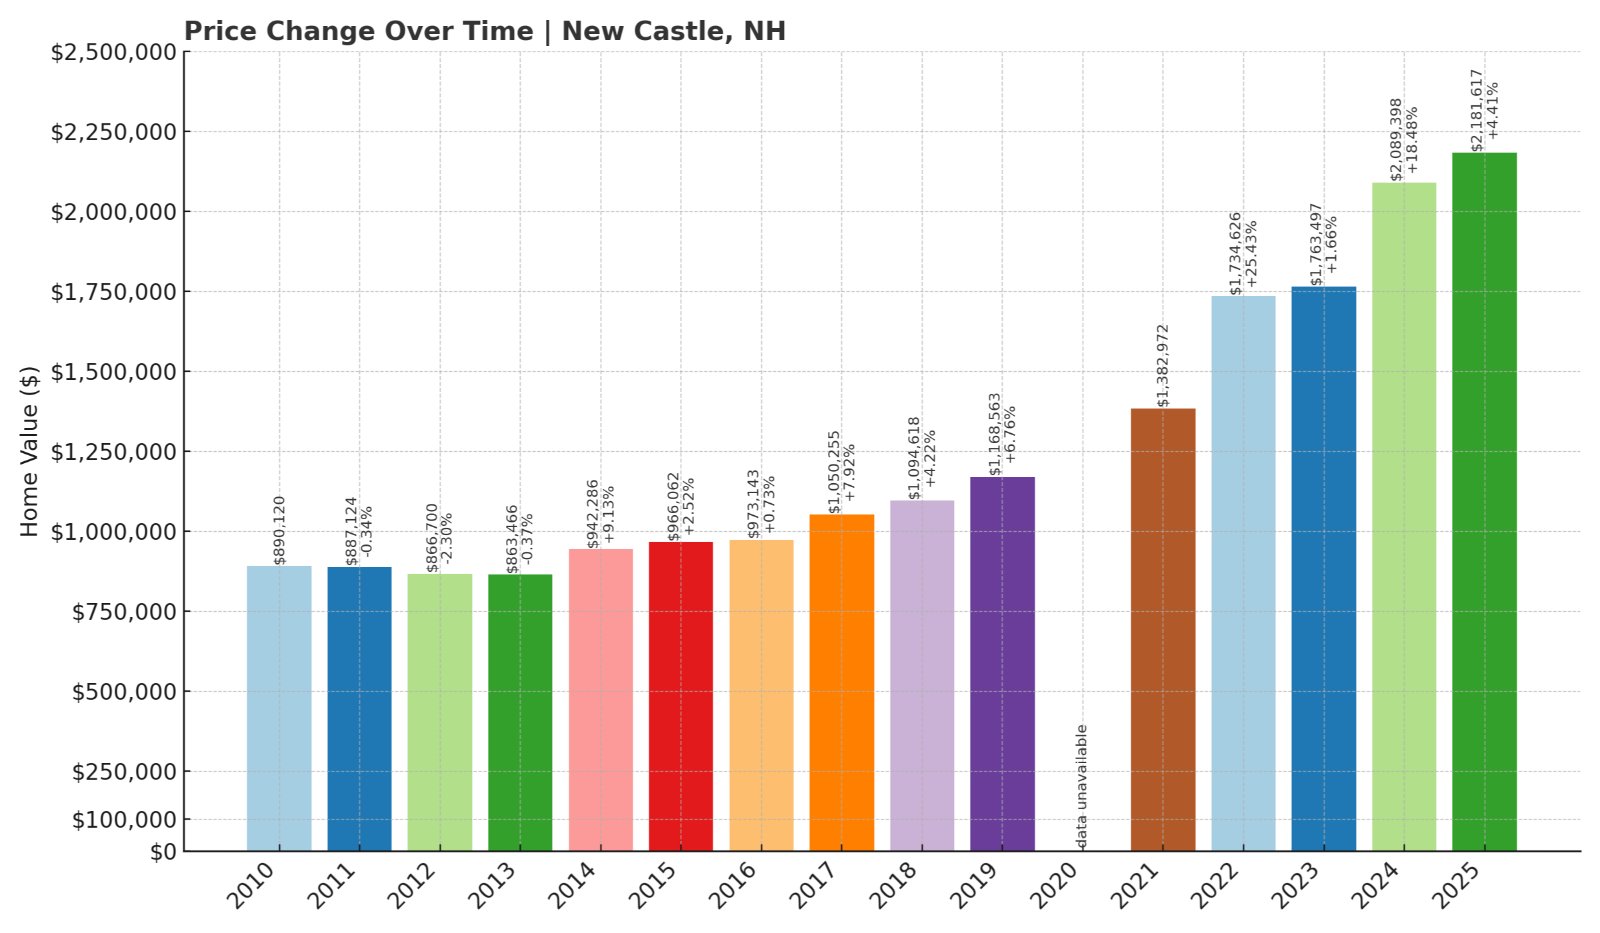
- 2010: $890,120
- 2011: $887,124 (-$2,996, -0.34% from previous year)
- 2012: $866,700 (-$20,424, -2.30% from previous year)
- 2013: $863,466 (-$3,234, -0.37% from previous year)
- 2014: $942,286 (+$78,820, +9.13% from previous year)
- 2015: $966,062 (+$23,776, +2.52% from previous year)
- 2016: $973,143 (+$7,081, +0.73% from previous year)
- 2017: $1,050,255 (+$77,112, +7.92% from previous year)
- 2018: $1,094,618 (+$44,363, +4.22% from previous year)
- 2019: $1,168,563 (+$73,945, +6.76% from previous year)
- 2020: N/A
- 2021: $1,382,972
- 2022: $1,734,626 (+$351,654, +25.43% from previous year)
- 2023: $1,763,497 (+$28,871, +1.66% from previous year)
- 2024: $2,089,398 (+$325,901, +18.48% from previous year)
- 2025: $2,181,617 (+$92,219, +4.41% from previous year)
New Castle has the highest home prices in New Hampshire, with values reaching over $2.18 million in 2025. Since 2010, prices have climbed nearly 145%. Two dramatic jumps—in 2022 and 2024—cemented its top position. Even with growth slowing in 2025, no other town comes close in dollar value.
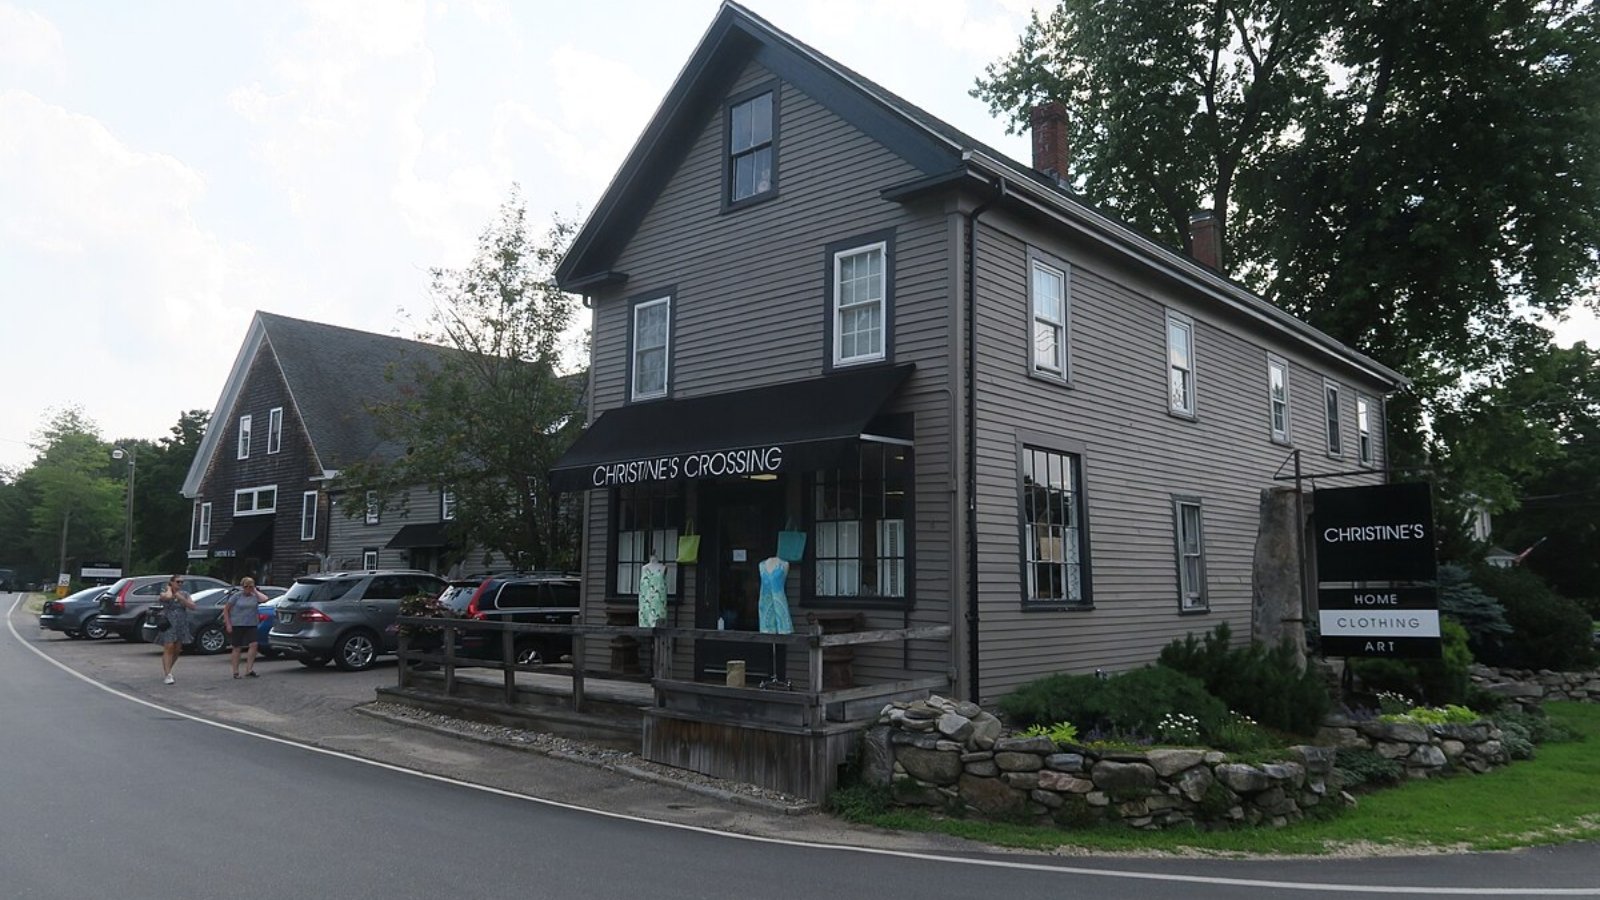
New Castle – Island Prestige and Multi-Million Dollar Views
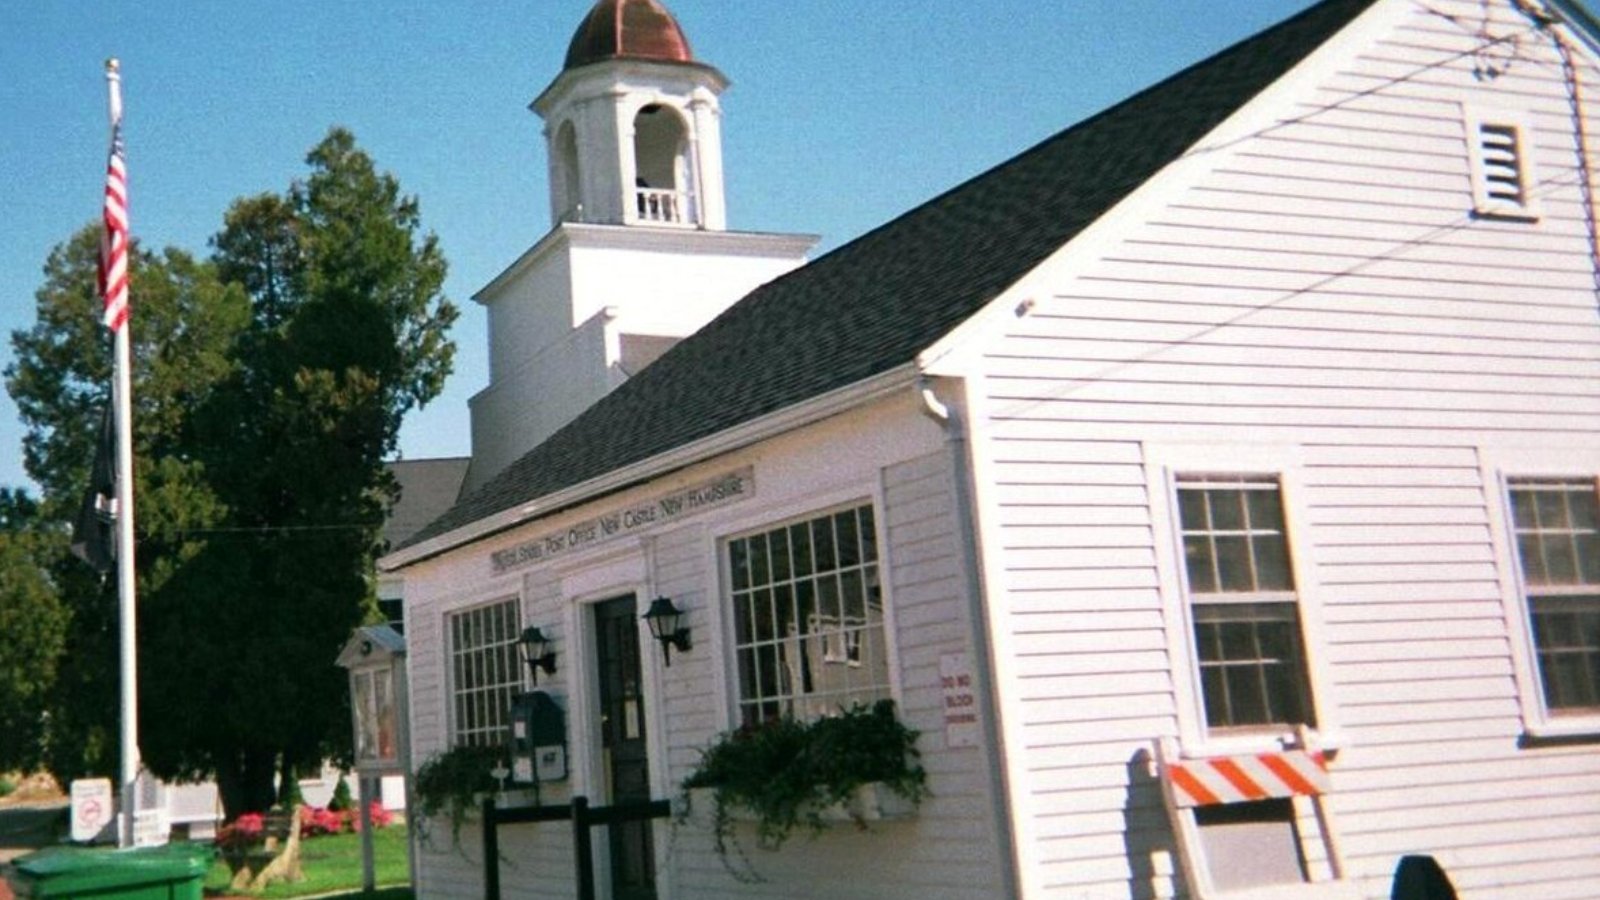
New Castle is the only town in New Hampshire made up entirely of islands. Located just east of Portsmouth and connected to the mainland by bridges, it offers unmatched waterfront scenery, historic charm, and a highly exclusive housing market. With fewer than 1,000 residents, it’s one of the state’s smallest communities—but also the wealthiest by home price.
The town’s limited housing stock, historic properties, and sweeping ocean views make it a perennial favorite among high-net-worth buyers. Home values here soared more than $700K in just two years (2022–2024), and even modest homes regularly list for well over $1 million. In 2025, New Castle sits firmly at the top of the state’s housing market.