🔥 Would you like to save this?
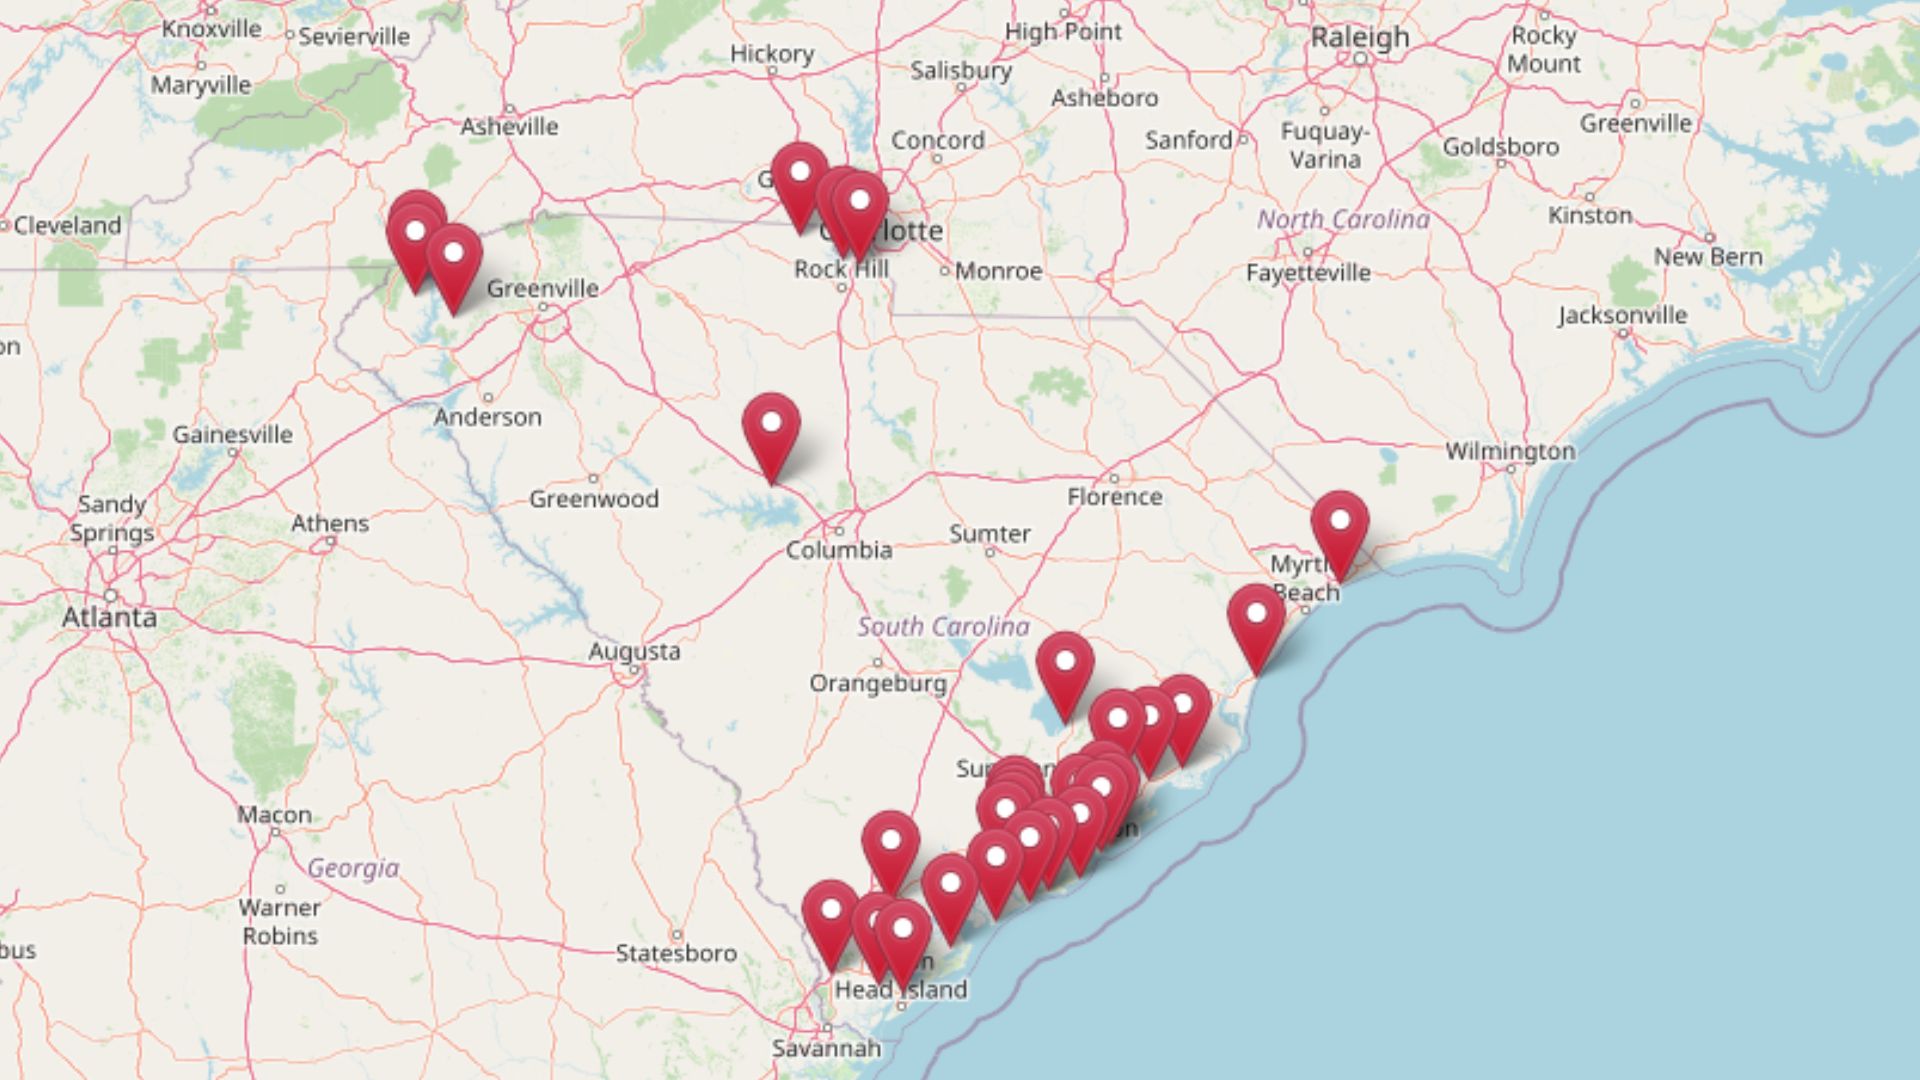
Using the latest Zillow Home Value Index data, we’ve ranked the 30 most expensive towns in South Carolina by current home values and long-term growth since 2010. These places aren’t just pricey—they show sustained demand, scarce supply in coastal markets, and steady migration into high-amenity suburbs.
From Lowcountry islands to Lake Murray and Charlotte-area suburbs, each town on this list has a clear story behind its numbers. Some gained from beach access and second-home demand, others from jobs and schools near fast-growing metros. If you’re buying, investing, or simply curious, the sections below explain where values are highest—and why.
In order to come up with the very specific design ideas, we create most designs with the assistance of state-of-the-art AI interior design software. Also, assume links that take you off the site are affiliate links such as links to Amazon. this means we may earn a commission if you buy something.
30. Clover – 130% Home Price Increase Since 2010
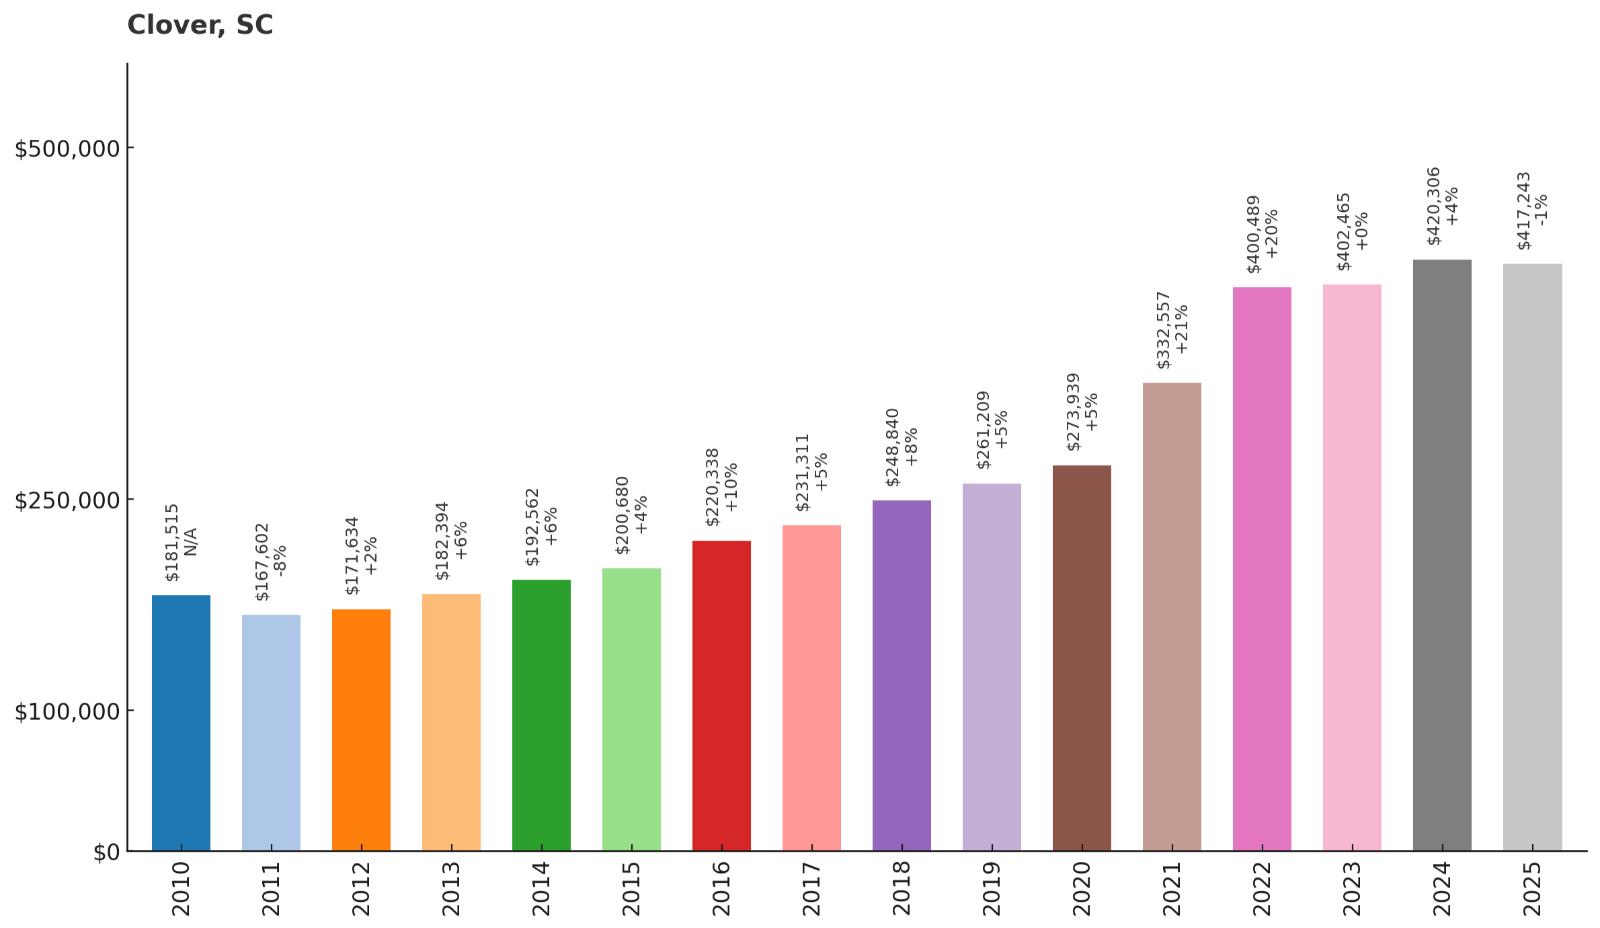
- 2010: $181,515
- 2011: $167,602
- 2012: $171,634
- 2013: $182,394
- 2014: $192,562
- 2015: $200,680
- 2016: $220,338
- 2017: $231,311
- 2018: $248,840
- 2019: $261,209
- 2020: $273,939
- 2021: $332,557
- 2022: $400,489
- 2023: $402,465
- 2024: $420,306
- 2025: $417,243
Clover’s values climbed from about $181,000 in 2010 to more than $417,000 in 2025, marking a long run of steady gains. The sharpest jump came during 2020–2022, when Charlotte’s growth and work-from-home demand lifted suburban prices. Even with a small pullback last year, the trend line still sits far above pre-pandemic levels.
Why Clover?
Why are people willing to pay so much to live here? What’s special about it?
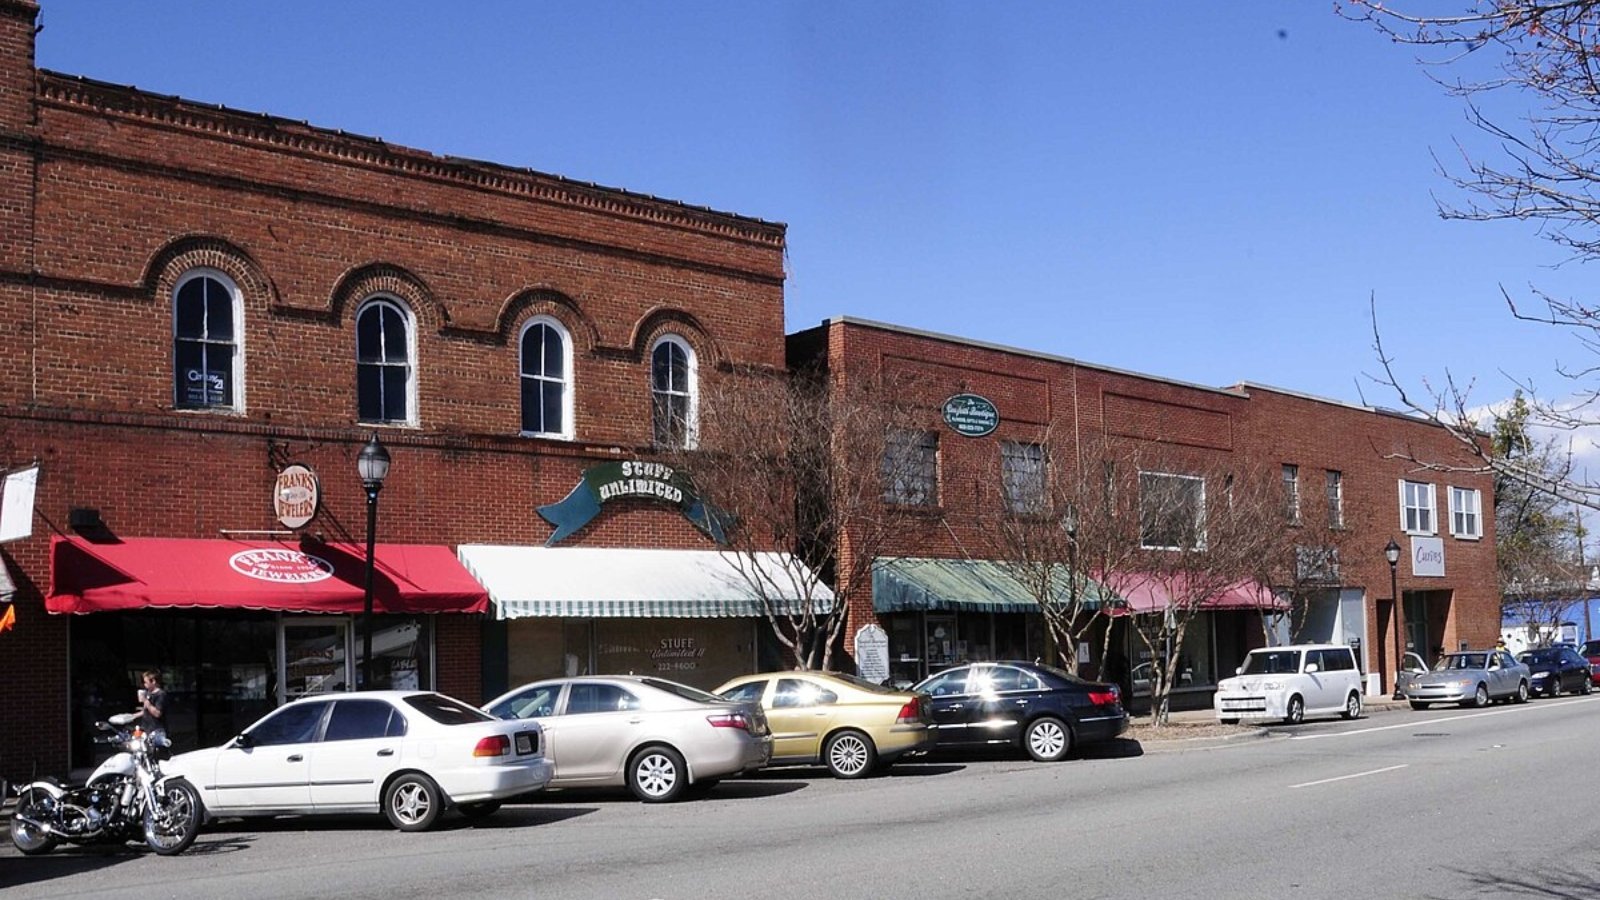
Buyers prize Clover for its small-town feel paired with quick access to Charlotte jobs and entertainment. Lake Wylie’s marinas, parks, and trails add year-round recreation that keeps weekend plans simple. Newer subdivisions mix with established neighborhoods, giving shoppers a range of prices and home styles.
Families point to well-regarded local schools and a strong youth sports scene that builds community. Quiet streets and larger lots appeal to people trading city bustle for more space. With shopping and dining close by in both York County and Mecklenburg County, daily life stays convenient.
How Clover Rose to Prominence
Clover began as a rail stop in the late 1800s and grew steadily with textile employment in the region. Suburban expansion from Charlotte and development around Lake Wylie pushed new rooftops southwest during the 2000s. As commuting patterns widened and remote work expanded, demand accelerated for homes near the state line with room to spread out.
Infrastructure improvements on SC-49 and nearby corridors shortened trips to major employers and shopping hubs. The town encouraged residential projects while keeping its traditional downtown intact. That balance helped Clover keep its small-town identity even as values climbed.
3 Interesting Tidbits
1. Lake Wylie Life – Many neighborhoods sit minutes from launches and waterfront parks, making paddling and fishing part of the weekly routine.
2. Rail-Town Name – Local lore says a water-tank leak once made a clover-shaped patch, inspiring the town’s name.
3. Festivals & Parades – Seasonal events draw big crowds from across York County and keep Main Street lively.
29. Briarcliffe Acres – 96% Home Price Increase Since 2010
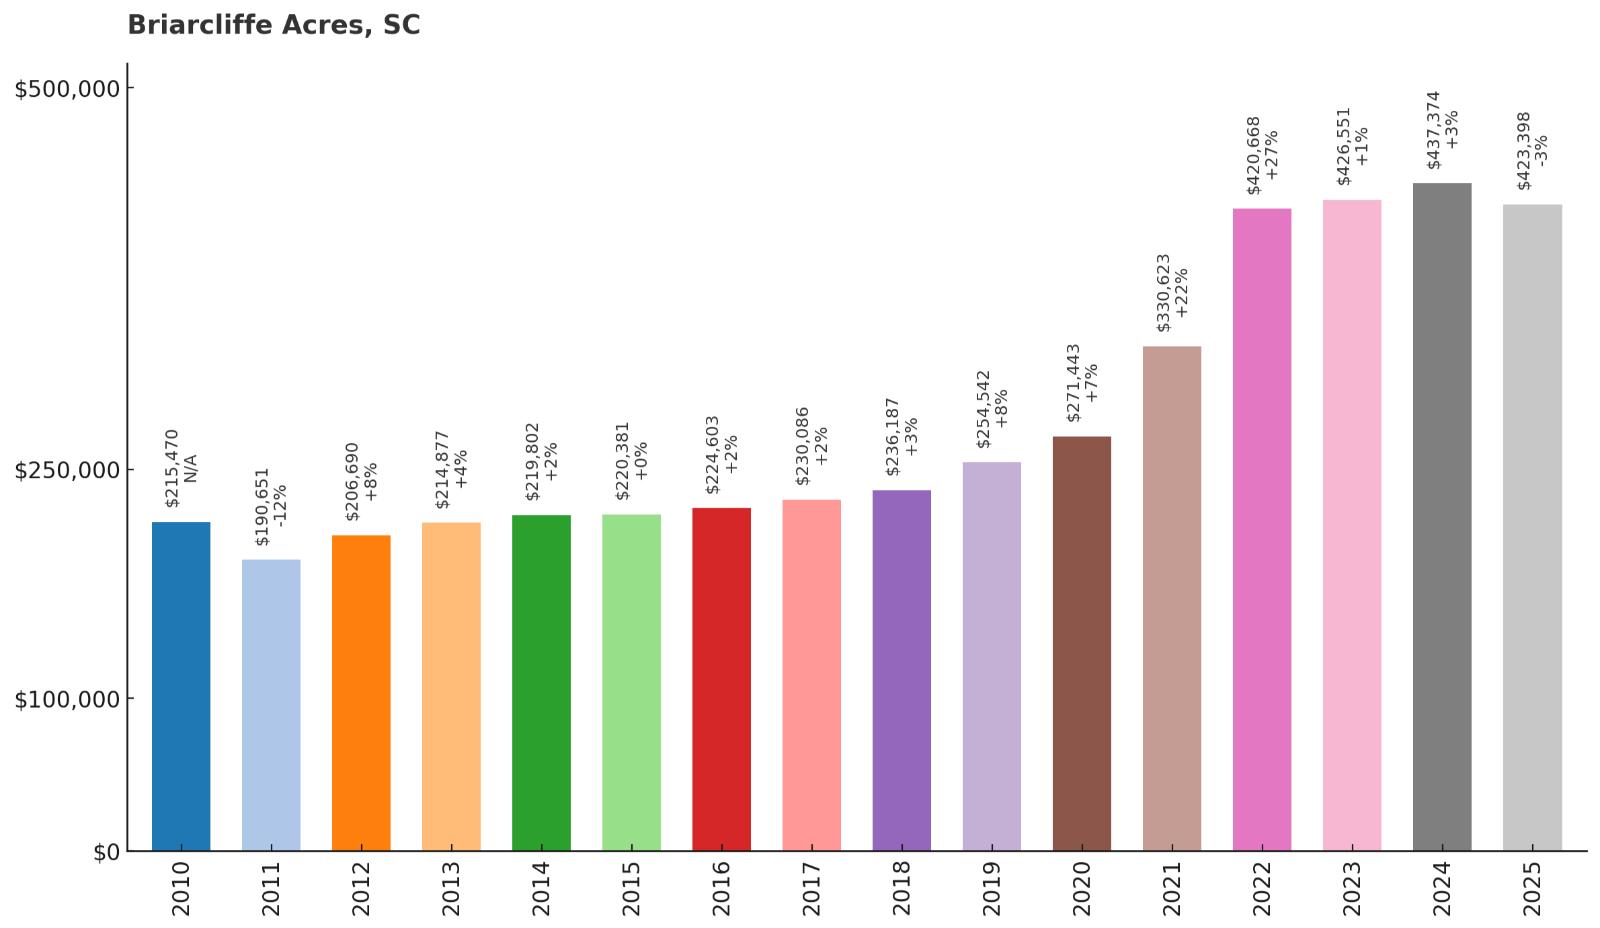
- 2010: $215,470
- 2011: $190,651
- 2012: $206,690
- 2013: $214,877
- 2014: $219,802
- 2015: $220,381
- 2016: $224,603
- 2017: $230,086
- 2018: $236,187
- 2019: $254,542
- 2020: $271,443
- 2021: $330,623
- 2022: $420,668
- 2023: $426,551
- 2024: $437,374
- 2025: $423,398
Values in Briarcliffe Acres have nearly doubled since 2010, cresting above $420,000 in 2022 before easing slightly. The surge reflects strong demand for quiet residential pockets along the Grand Strand. Even with modest year-to-year moves, today’s pricing remains well ahead of the past decade.
Why Briarcliffe Acres?
Why are people willing to pay so much to live here? What’s special about it?
This coastal enclave offers tall pines, wider lots, and a calmer pace between Myrtle Beach and North Myrtle Beach. Residents enjoy quick access to the shore without the bustle of resort strips. The setting feels residential first, with beach days and errands both close at hand.
Homes lean toward established neighborhoods with mature trees and a classic coastal look. Walks feel shaded, bikes roll easily, and morning beach trips start in minutes. For many buyers, that mix of serenity and convenience is hard to replicate elsewhere on the Strand.
How Briarcliffe Acres Rose to Prominence
Planned mid-century as a residential community, Briarcliffe Acres grew alongside the Grand Strand’s vacation economy. As tourism expanded, so did demand for year-round neighborhoods near the ocean yet tucked from the crowds. Over time, the town’s character and lot sizes set it apart from denser beach blocks.
The pandemic era brought new attention from remote workers and second-home buyers. With inventory limited and location prized, prices pushed higher. The result is a stable, mature market with enduring coastal appeal.
3 Interesting Tidbits
1. Canopy Streets – Soaring pines line many roads, creating shade that feels miles from the main tourist areas.
2. Central to Everything – Groceries, healthcare, and entertainment sit just up the road on Highway 17.
3. Quiet Beaches – Residents value nearby stretches of sand that stay calmer than marquee piers and boardwalks.
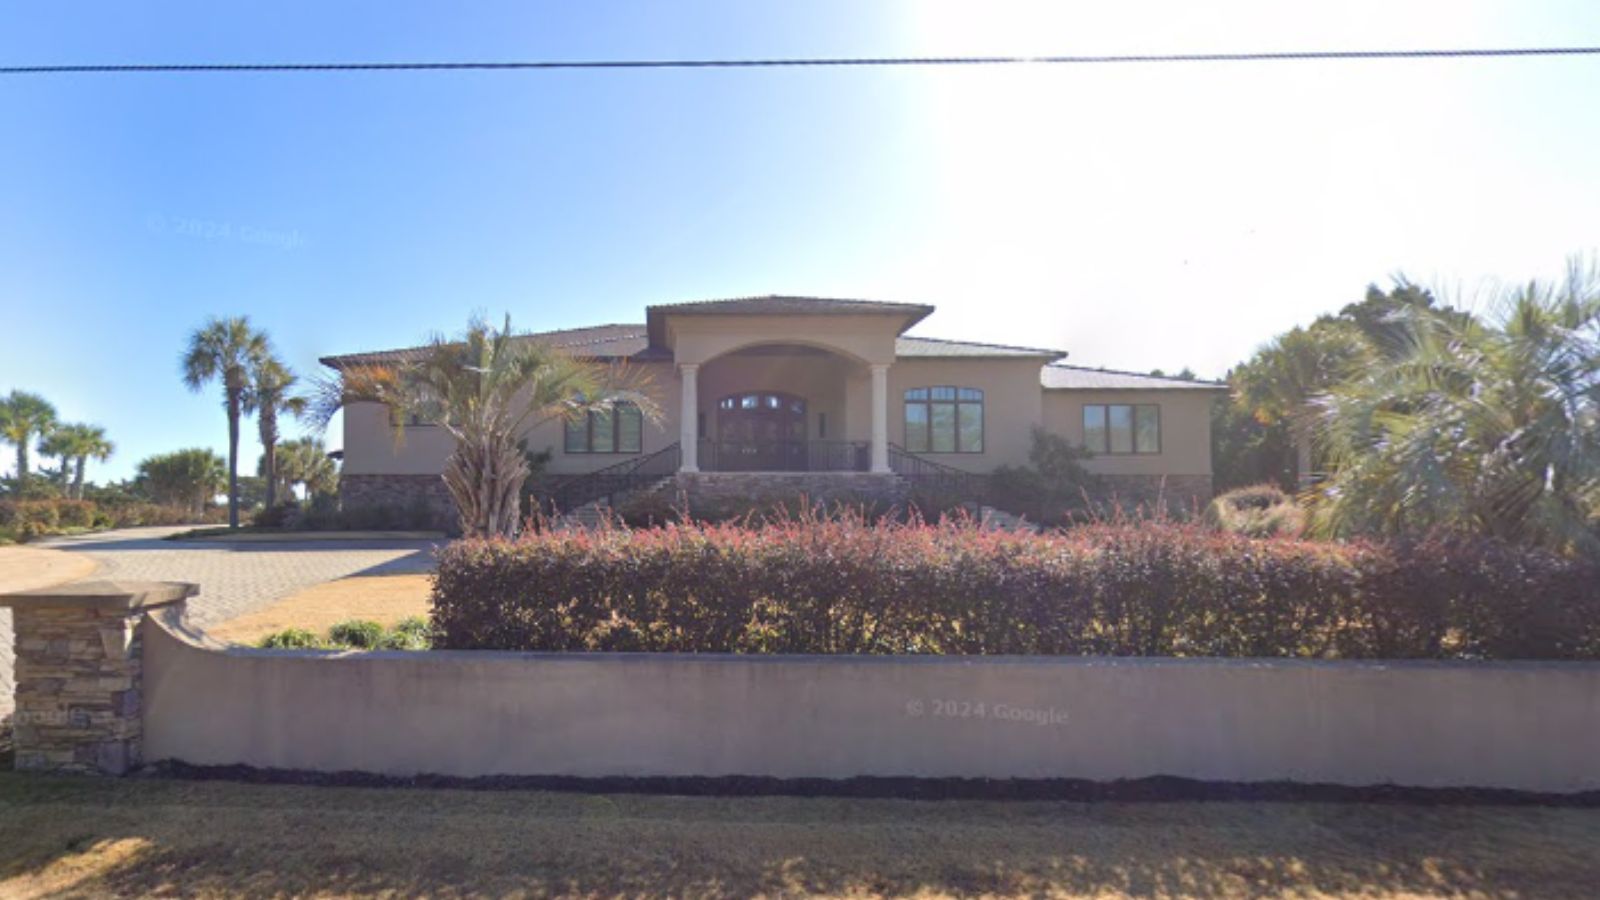
28. Six Mile – 127% Home Price Increase Since 2010
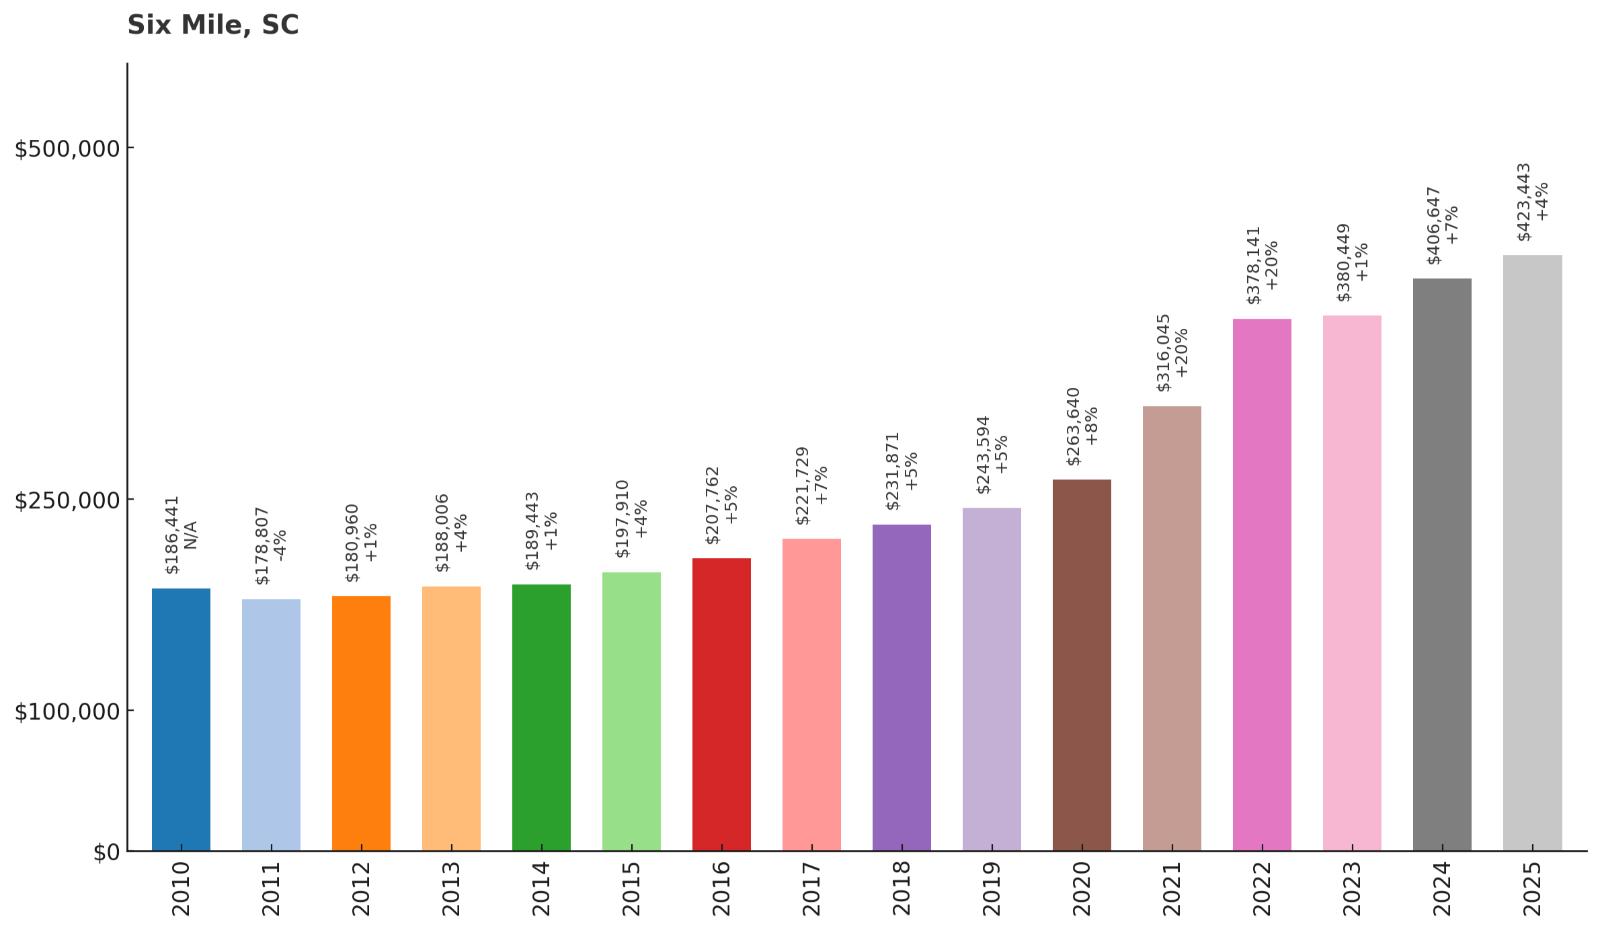
- 2010: $186,441
- 2011: $178,807
- 2012: $180,960
- 2013: $188,006
- 2014: $189,443
- 2015: $197,910
- 2016: $207,762
- 2017: $221,729
- 2018: $231,871
- 2019: $243,594
- 2020: $263,640
- 2021: $316,045
- 2022: $378,141
- 2023: $380,449
- 2024: $406,647
- 2025: $423,443
Six Mile’s median home value has more than doubled since 2010, now topping $423,000. Momentum strengthened after 2020 as buyers sought the foothills, lakes, and an easier pace. Stability since 2023 suggests those pandemic-era gains have largely held.
Why Six Mile?
Why are people willing to pay so much to live here? What’s special about it?
Proximity to Lake Keowee and the Blue Ridge foothills offers weekend adventures without long drives. Clemson University adds jobs, sports, and culture just down the road. Quiet streets, larger parcels, and new construction give shoppers appealing options.
Residents value the small-town setting where local stores still know your name. Trails, fishing spots, and mountain views keep free time outdoors. With Greenville and Anderson within reach, daily commutes stay manageable.
How Six Mile Rose to Prominence
The area’s agricultural roots gave way to residential demand as Upstate job centers grew. Lake Keowee’s development broadened the buyer pool with second-home and retirement interest. Improved roads and regional population gains pulled Six Mile into the growth corridor.
By the late 2010s, steady subdivision activity added inventory while preserving space and views. Remote work boosted the appeal of quiet towns with quick access to water and trails. That recipe has kept values trending upward.
3 Interesting Tidbits
1. Foothills Gateway – The town sits near scenic drives that climb quickly into the mountains.
2. Game Days Nearby – Clemson home games bring energy, rentals, and year-round buzz to local businesses.
3. Small-Town Traditions – Community events and school activities anchor the social calendar.
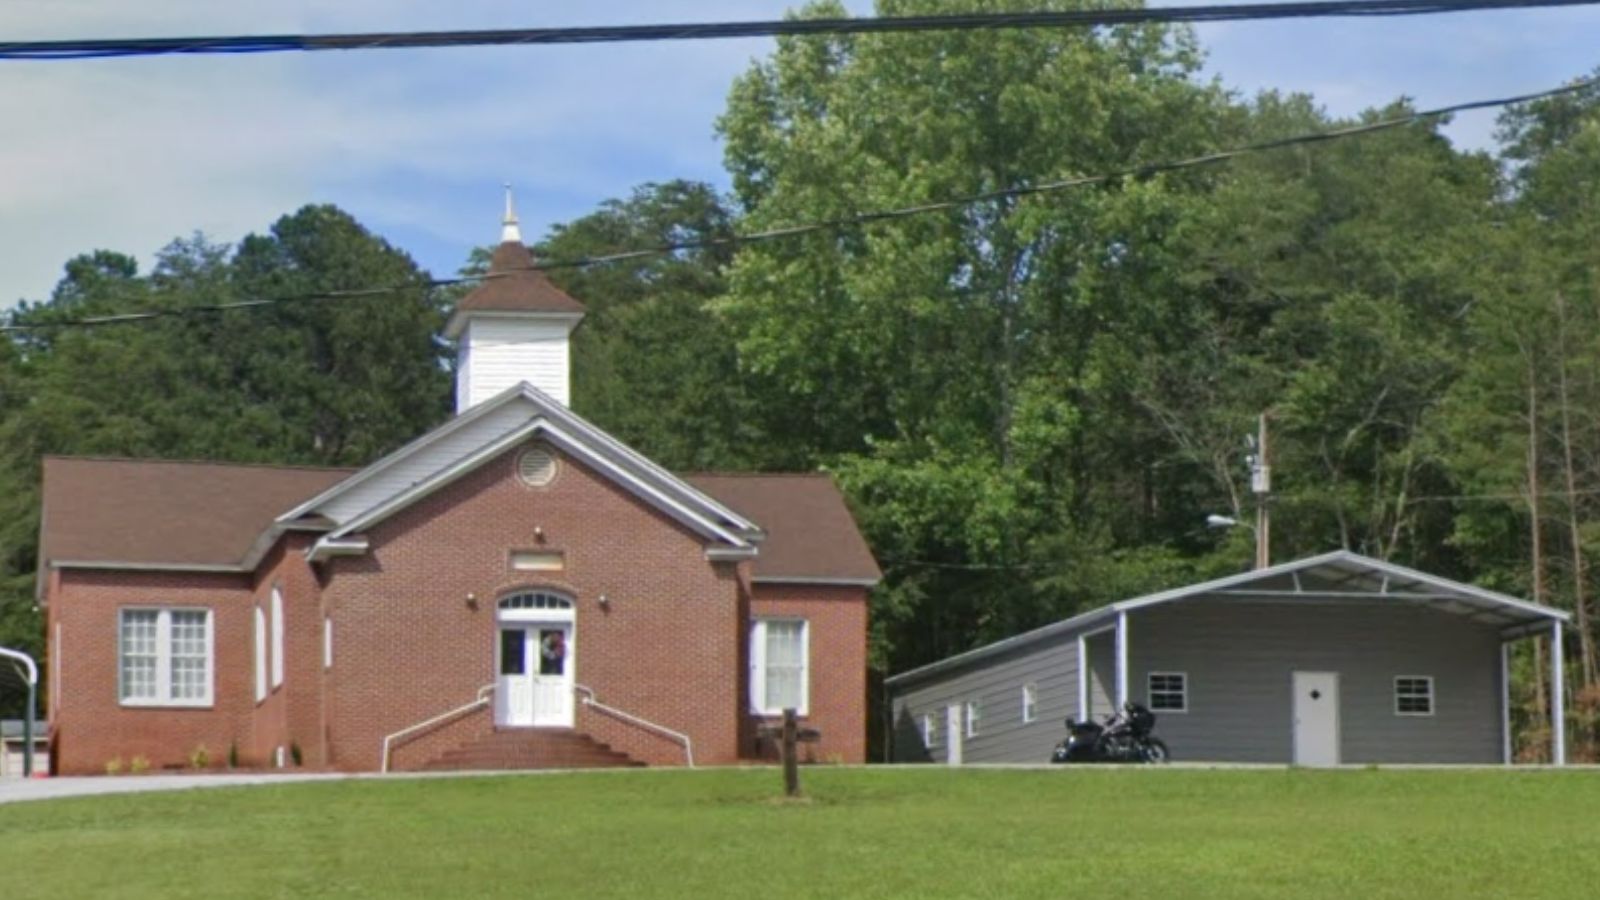
27. Mc Clellanville – 142% Home Price Increase Since 2010
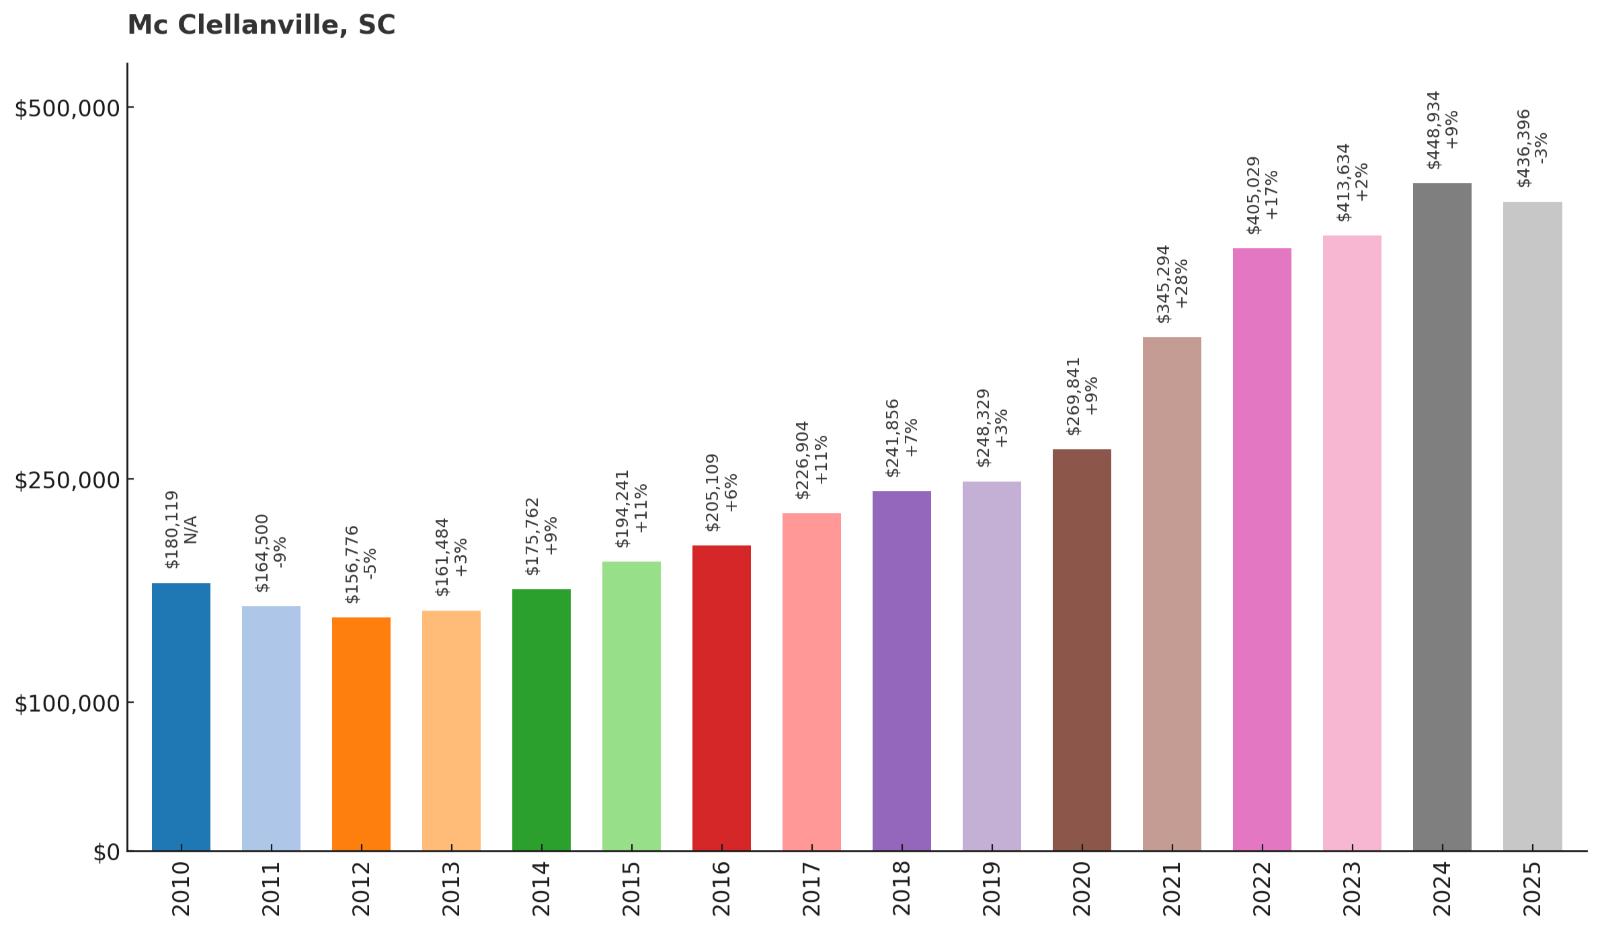
- 2010: $180,119
- 2011: $164,500
- 2012: $156,776
- 2013: $161,484
- 2014: $175,762
- 2015: $194,241
- 2016: $205,109
- 2017: $226,904
- 2018: $241,856
- 2019: $248,329
- 2020: $269,841
- 2021: $345,294
- 2022: $405,029
- 2023: $413,634
- 2024: $448,934
- 2025: $436,396
Mc Clellanville’s median value has surged more than 140% since 2010 as buyers discovered the quiet coastal village vibe. Gains accelerated after 2020, with prices peaking in 2024 before a modest step down. Even so, today’s values sit dramatically above where the decade began.
Why Mc Clellanville?
Why are people willing to pay so much to live here? What’s special about it?
People come for marsh views, shrimp boats, and a slower rhythm that still sits within reach of Charleston. Cape Romain National Wildlife Refuge adds world-class birding, fishing, and boating right offshore. Historic cottages and live oaks create a picture-perfect Lowcountry setting.
Weekends feel like vacations, with dockside sunsets and quiet creeks minutes away. Local seafood, small markets, and a friendly harbor define daily life. For many, that authenticity is worth paying to keep.
How Mc Clellanville Rose to Prominence
The village grew in the 19th century around timber and fishing, then stayed small as the coast developed elsewhere. Conservation areas limited sprawl and preserved the scenery that buyers now seek. As Charleston boomed, those wanting coastal life without city pace headed north.
Improved roads turned day trips into easy commutes a few days a week. Remote workers and second-home buyers added new demand after 2020. Scarcity and charm combined to lift values quickly.
3 Interesting Tidbits
1. Working Waterfront – Shrimping heritage still shapes the docks and local menus.
2. Refuge Next Door – Cape Romain protects barrier islands and wildlife just across the Intracoastal.
3. Live-Oak Avenues – Historic streets frame porches and picket fences under a green canopy.
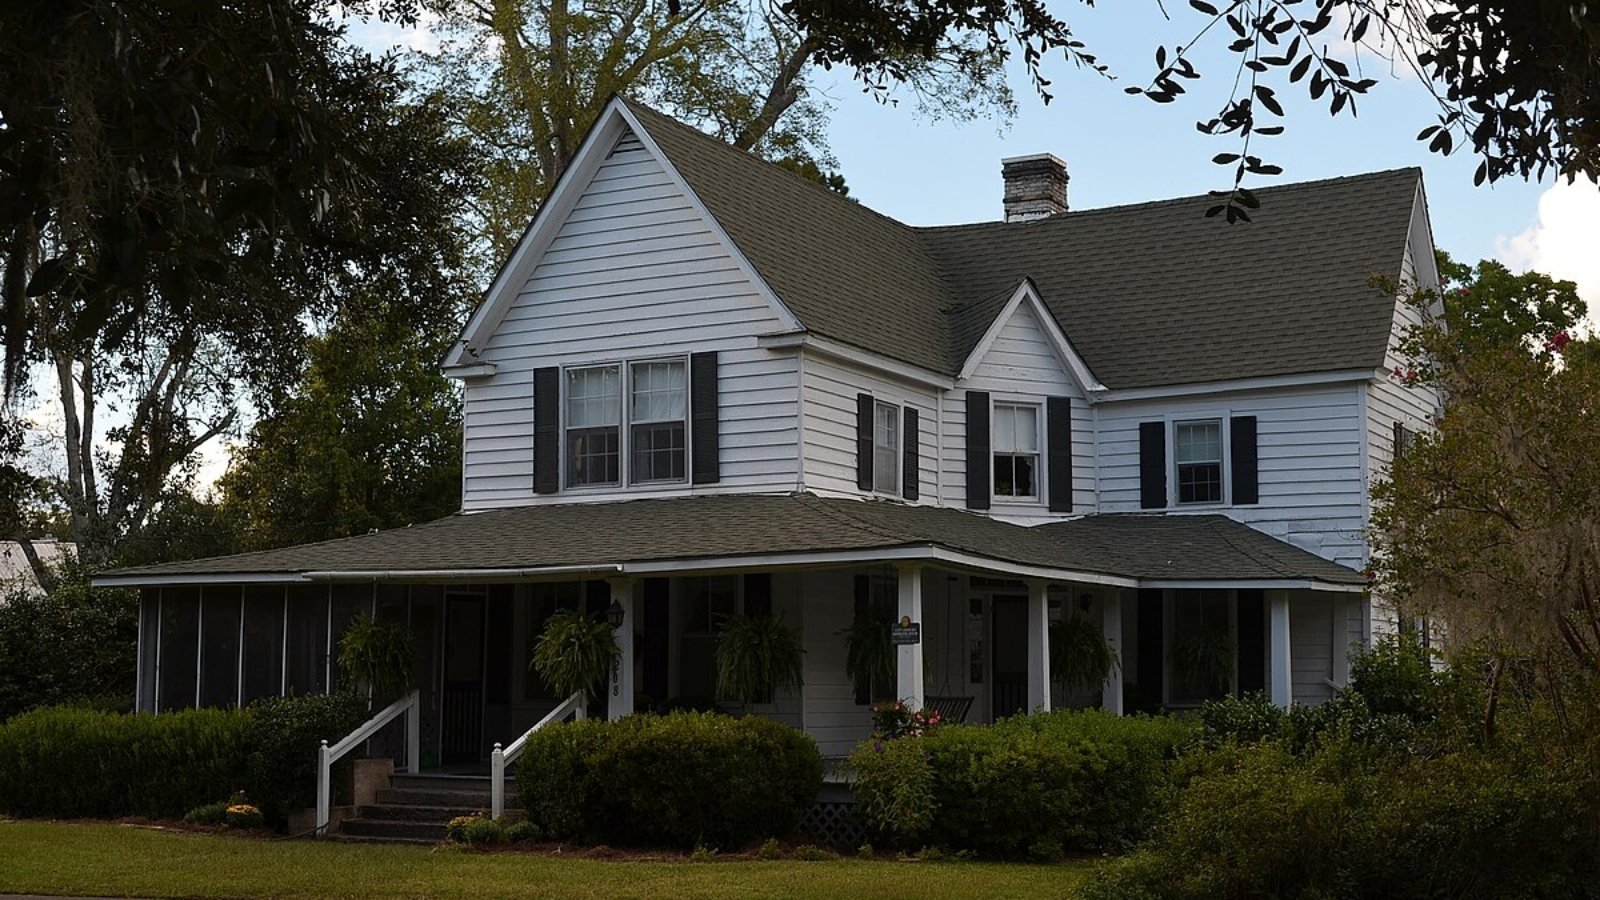
26. Chapin – 95% Home Price Increase Since 2010
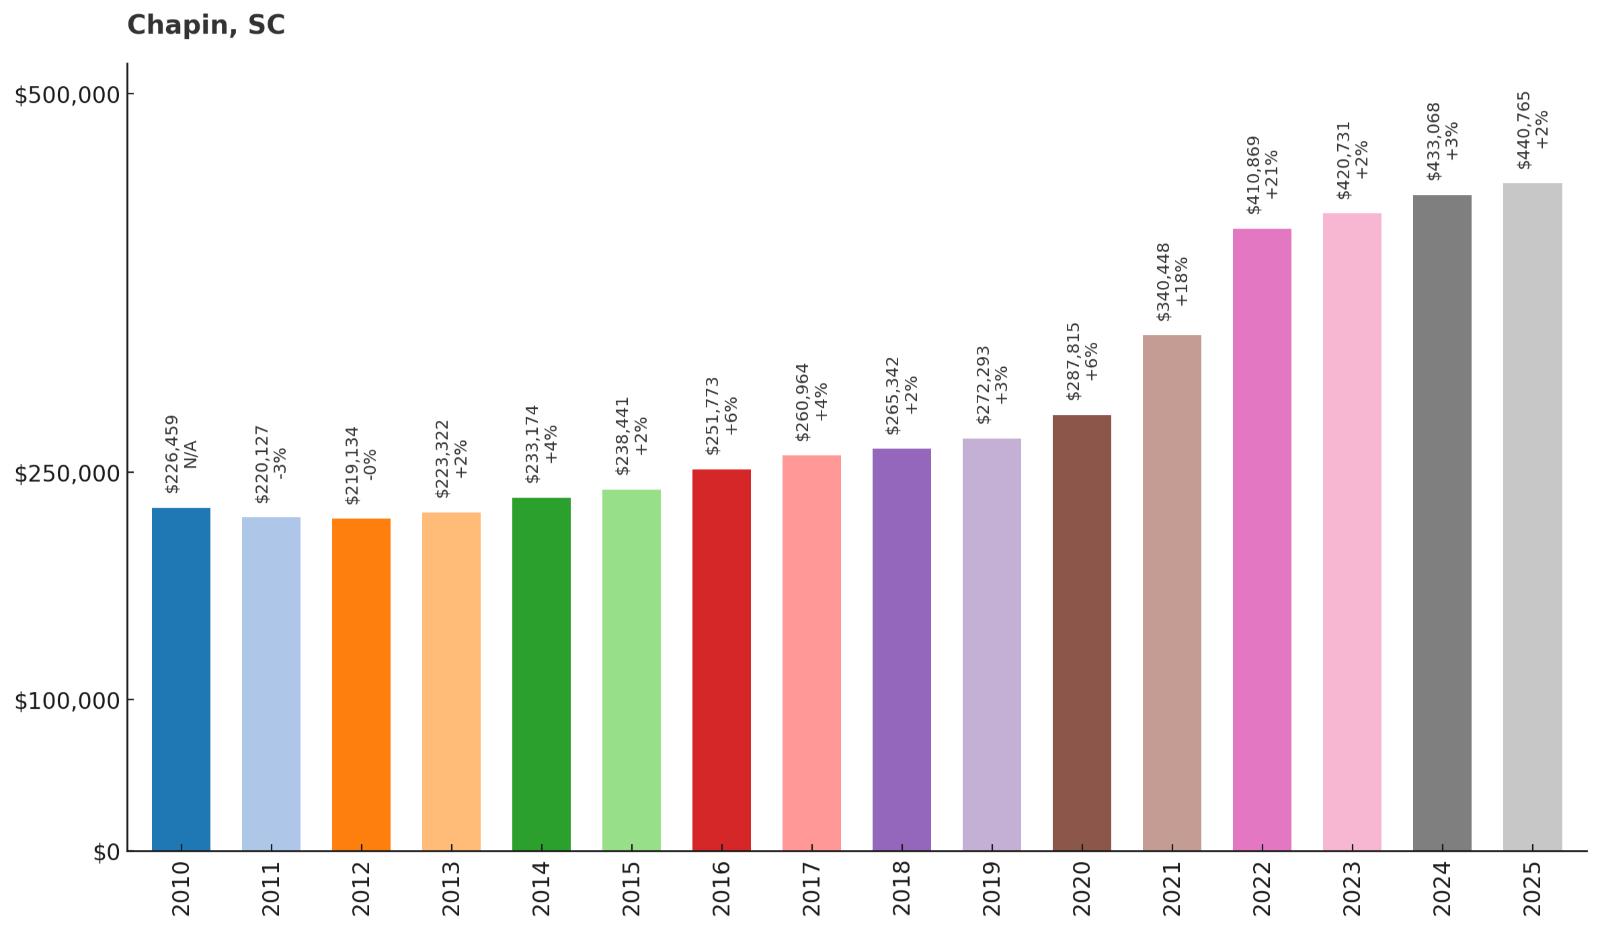
- 2010: $226,459
- 2011: $220,127
- 2012: $219,134
- 2013: $223,322
- 2014: $233,174
- 2015: $238,441
- 2016: $251,773
- 2017: $260,964
- 2018: $265,342
- 2019: $272,293
- 2020: $287,815
- 2021: $340,448
- 2022: $410,869
- 2023: $420,731
- 2024: $433,068
- 2025: $440,765
Chapin’s values have nearly doubled since 2010 on the strength of steady, durable demand. The biggest jump came from 2020 to 2022 as Lake Murray access and suburban space drew buyers. Prices have continued to edge higher since, reflecting a healthy move-up market.
Why Chapin?
Why are people willing to pay so much to live here? What’s special about it?
Lake Murray anchors the lifestyle with fishing, boating, and waterfront parks minutes from most neighborhoods. Families appreciate well-regarded area schools and active youth programs. Newer subdivisions provide modern layouts while older streets keep the small-town core intact.
Commuters reach Columbia’s jobs quickly via I-26, then return to quiet cul-de-sacs by evening. Dining, groceries, and medical offices cluster close to home, cutting errands to minutes. That mix of convenience and recreation keeps Chapin in high demand.
How Chapin Rose to Prominence
The town’s profile rose after Lake Murray’s creation and again during Columbia’s suburban expansion. Residential projects followed the shoreline, attracting buyers who wanted water and space. As growth moved west, Chapin evolved from lake outpost to full-service community.
Through the 2010s, steady in-migration and move-up demand tightened inventory. By the early 2020s, remote work added buyers who valued the lake over city centers. The result is a market with lasting momentum.
3 Interesting Tidbits
1. Capital’s Lake – Lake Murray’s 500+ miles of shoreline power local recreation.
2. Downtown Charm – A compact Main Street hosts festivals, bakeries, and locally owned shops.
3. Quick I-26 Access – Fast freeway links keep commutes and airport trips efficient.
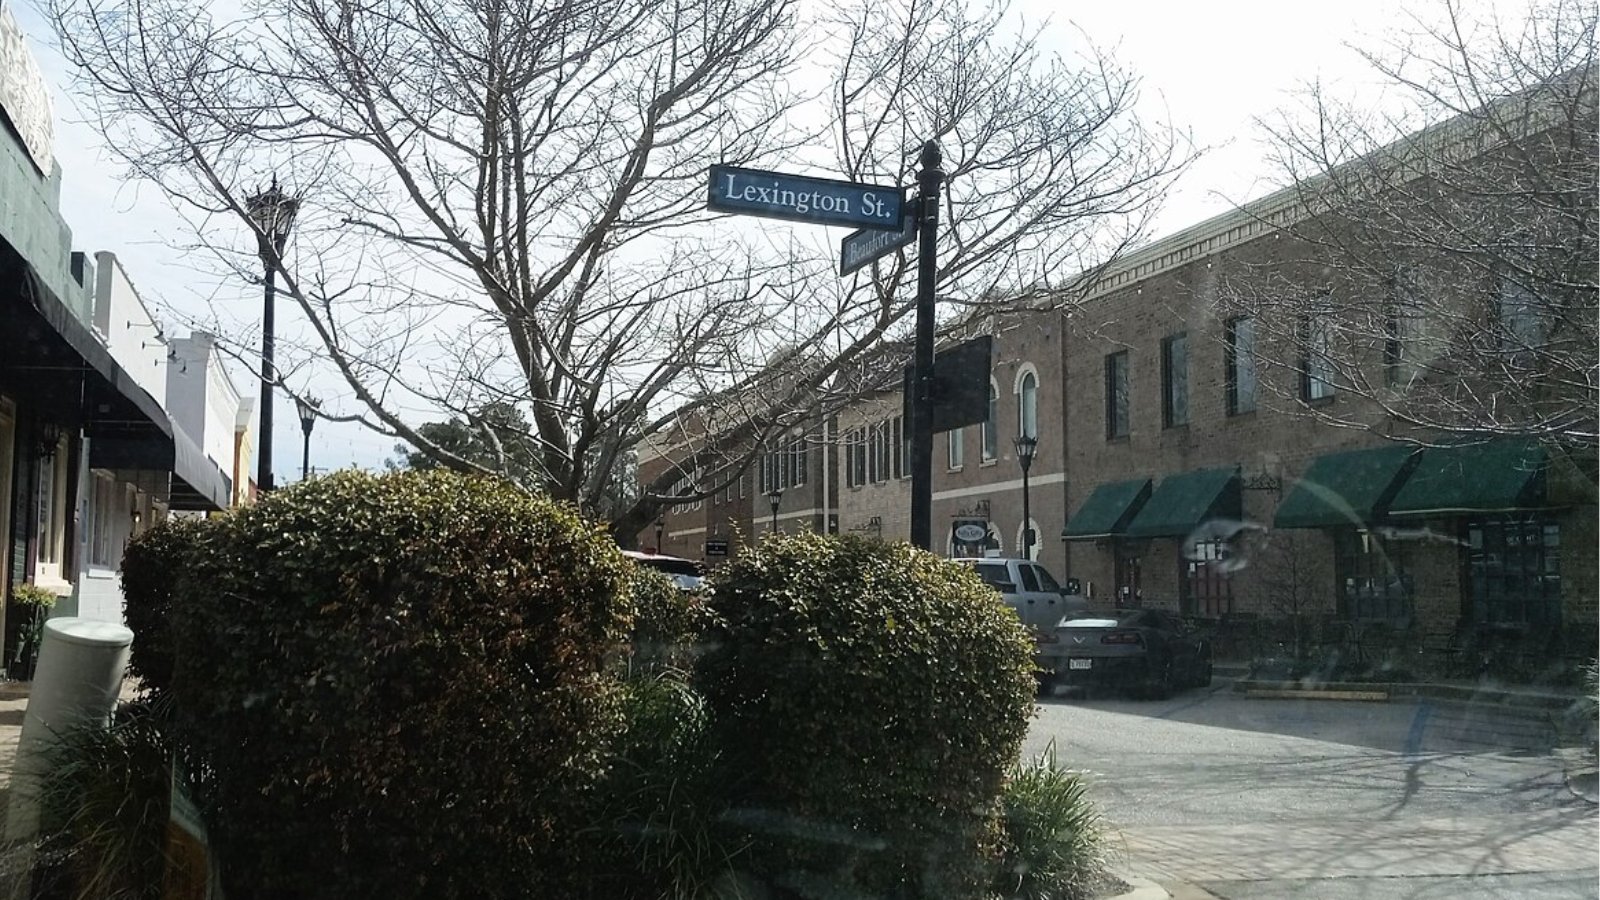
25. Hardeeville – 165% Home Price Increase Since 2010
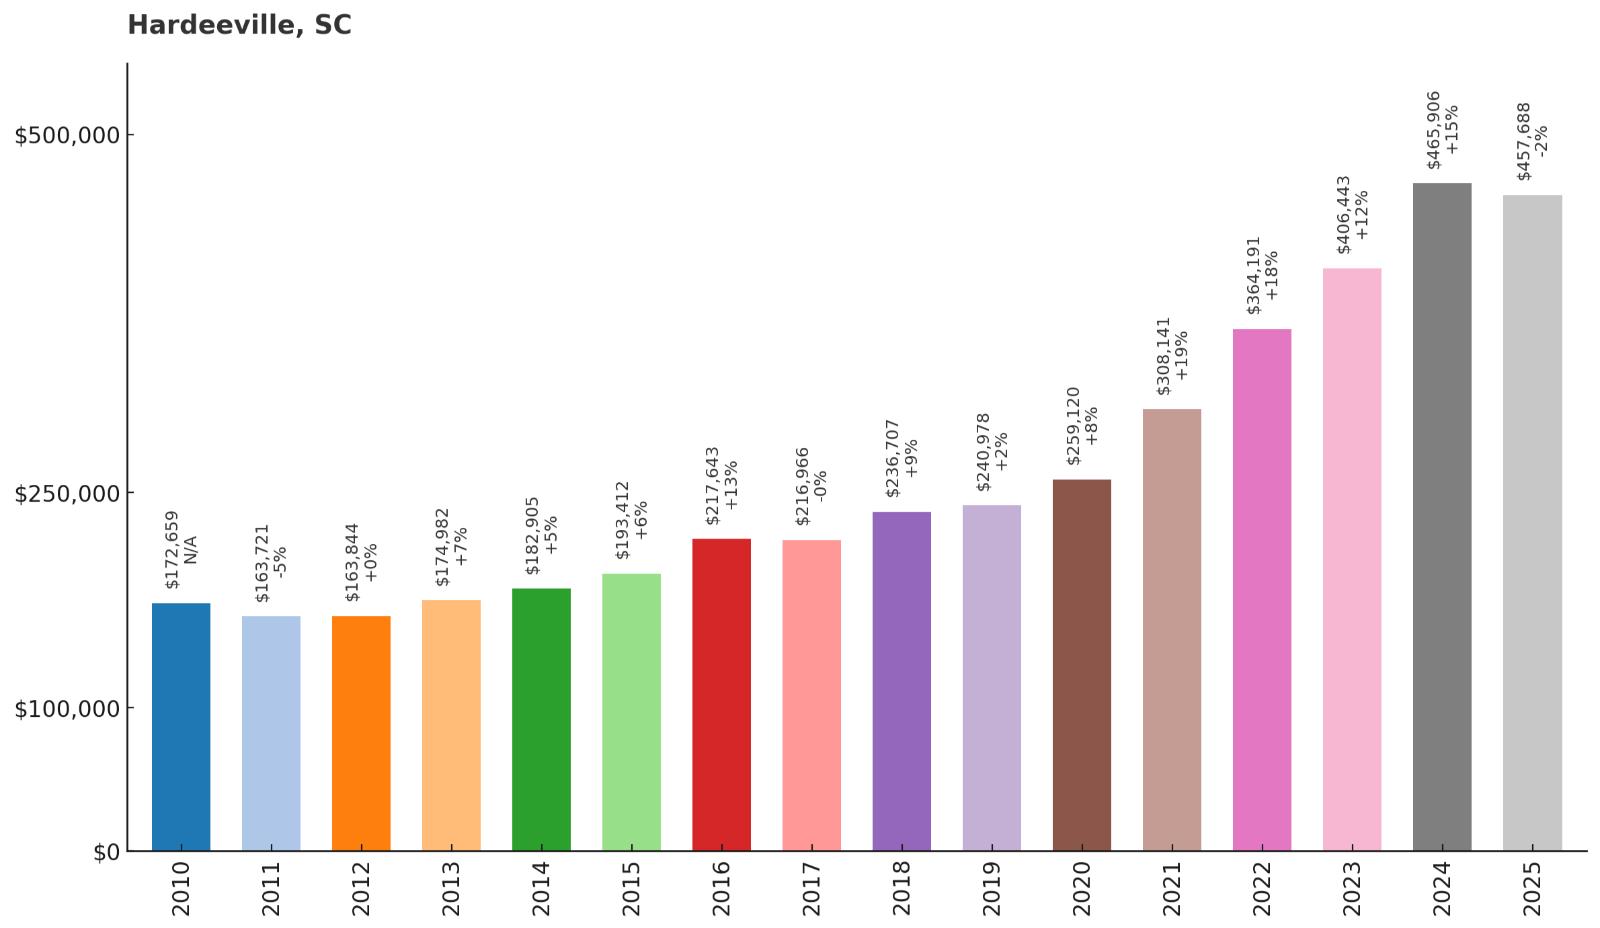
- 2010: $172,659
- 2011: $163,721
- 2012: $163,844
- 2013: $174,982
- 2014: $182,905
- 2015: $193,412
- 2016: $217,643
- 2017: $216,966
- 2018: $236,707
- 2019: $240,978
- 2020: $259,120
- 2021: $308,141
- 2022: $364,191
- 2023: $406,443
- 2024: $465,906
- 2025: $457,688
Hardeeville’s median has leapt 165% since 2010, reflecting its position between Savannah and Hilton Head. Prices hit a high in 2024 before a small step down this year, typical for fast-growing corridors. The broader arc still points sharply higher than a decade ago.
Why Hardeeville?
Why are people willing to pay so much to live here? What’s special about it?
I-95 and US-278 place beaches, airports, and major employers within easy reach. Master-planned neighborhoods offer new homes, amenities, and trail networks that suit busy schedules. Buyers like getting Lowcountry lifestyle without island price tags.
Daily errands take minutes thanks to clustered retail and services along the main corridors. Weekend plans bounce between Savannah’s arts scene and Hilton Head’s beaches. For many households, that flexibility is a key value driver.
How Hardeeville Rose to Prominence
Once a railroad town, Hardeeville expanded rapidly as the Hilton Head-Savannah region boomed. Annexations and large-scale residential projects added thousands of homes across former timberlands. As job growth spread west of the Intracoastal, demand followed the highways.
Through the 2010s, infrastructure kept pace with rooftops, reinforcing confidence among builders and buyers. The pandemic era added remote workers and retirees to the mix. Those overlapping demand streams pushed values to new highs.
3 Interesting Tidbits
1. Two-City Access – Day trips to Savannah’s squares or Hilton Head’s beaches are routine.
2. Amenity Rich – Many neighborhoods feature pools, pickleball, and fitness centers.
3. Wildlife Corridors – Preserved wetlands and pines keep nature in view between subdivisions.
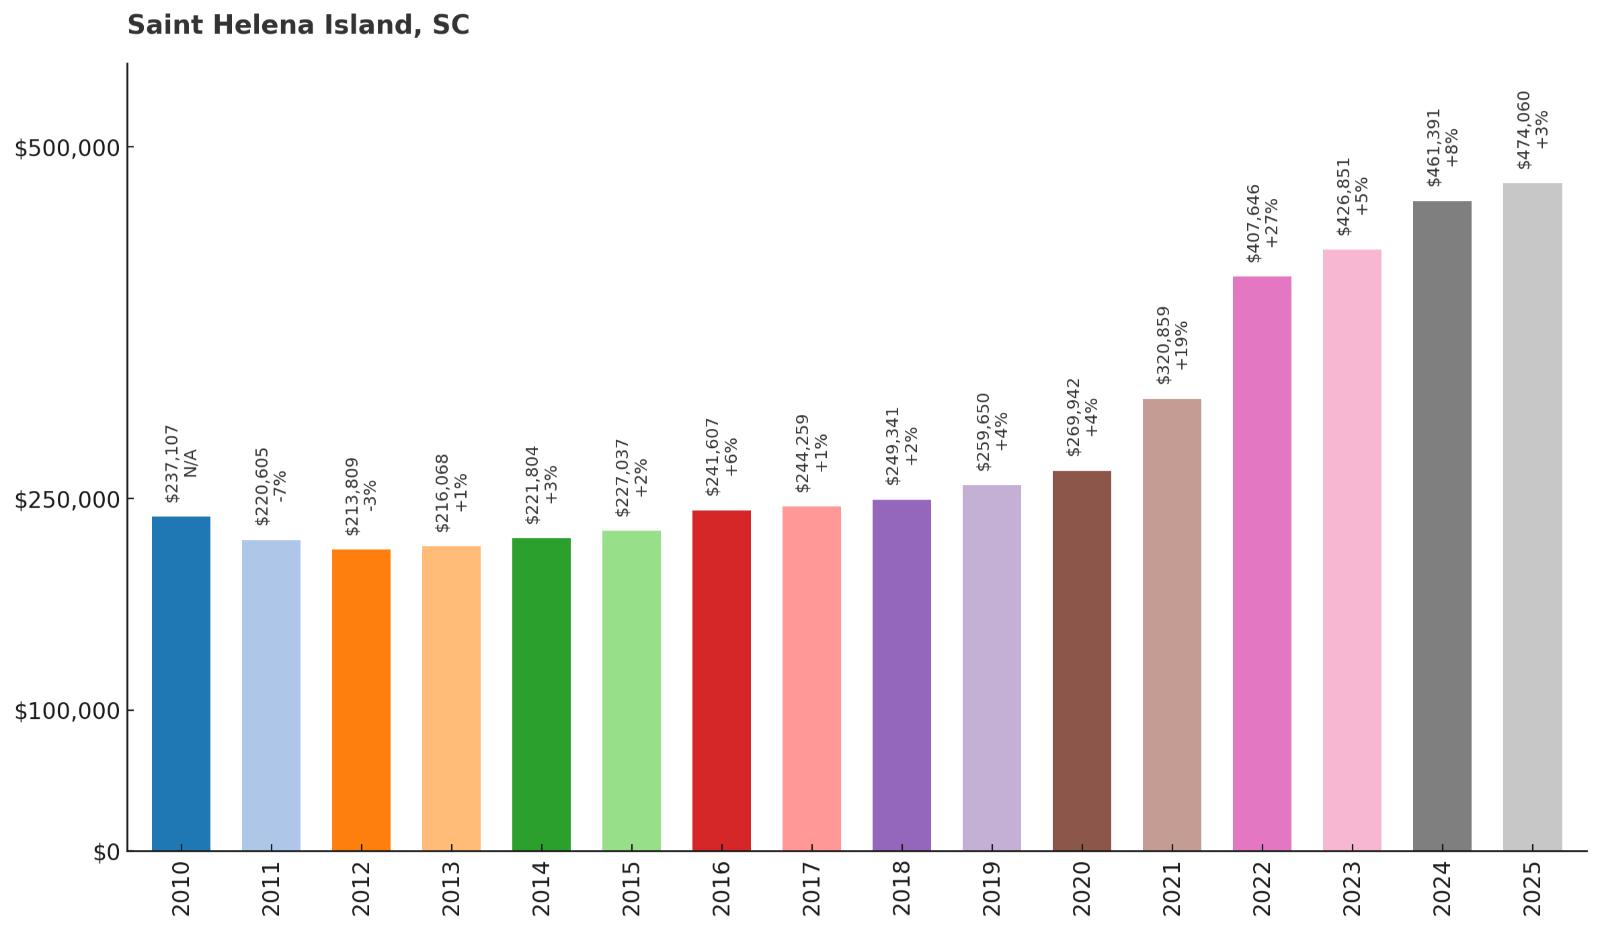
24. Saint Helena Island – 100% Home Price Increase Since 2010
🔥 Would you like to save this?
- 2010: $237,107
- 2011: $220,605
- 2012: $213,809
- 2013: $216,068
- 2014: $221,804
- 2015: $227,037
- 2016: $241,607
- 2017: $244,259
- 2018: $249,341
- 2019: $259,650
- 2020: $269,942
- 2021: $320,859
- 2022: $407,646
- 2023: $426,851
- 2024: $461,391
- 2025: $474,060
Saint Helena Island has seen values double since 2010 as more buyers seek unhurried Sea Islands living. The steadiest gains came after 2020, pushing the median above $474,000 in 2025. Culture, landscape, and limited supply all play a role in that rise.
Why Saint Helena Island?
Why are people willing to pay so much to live here? What’s special about it?
The island blends live oaks and tidal waterways with a strong Gullah Geechee heritage. Residents enjoy boat ramps, quiet creeks, and seafood markets that keep daily life close to the water. Compared with resort islands, the vibe stays authentic and residential.
Beaufort and Port Royal are close for dining, art, and services, keeping errands easy. Beaches on nearby Hunting and Fripp are within a short drive for weekend plans. For many households, that balance of culture and coast is the draw.
How Saint Helena Island Rose to Prominence
Historically agricultural and maritime, the island maintained a low-density pattern through the 20th century. Preservation efforts and community planning kept large resort projects off the main island. As coastal demand broadened, buyers who valued authenticity looked here.
Post-2020 flexibility added second-home and remote-work interest. With limited inventory, each wave of demand pushed values higher. The result is a market shaped by scarcity and heritage.
3 Interesting Tidbits
1. Penn Center – One of the nation’s first schools for formerly enslaved people operates as a cultural landmark.
2. Oyster Season – Local creeks and sounds underpin a beloved Lowcountry tradition.
3. Canopy Roads – Live-oak tunnels frame many of the island’s scenic drives.
23. Pinopolis – 111% Home Price Increase Since 2014
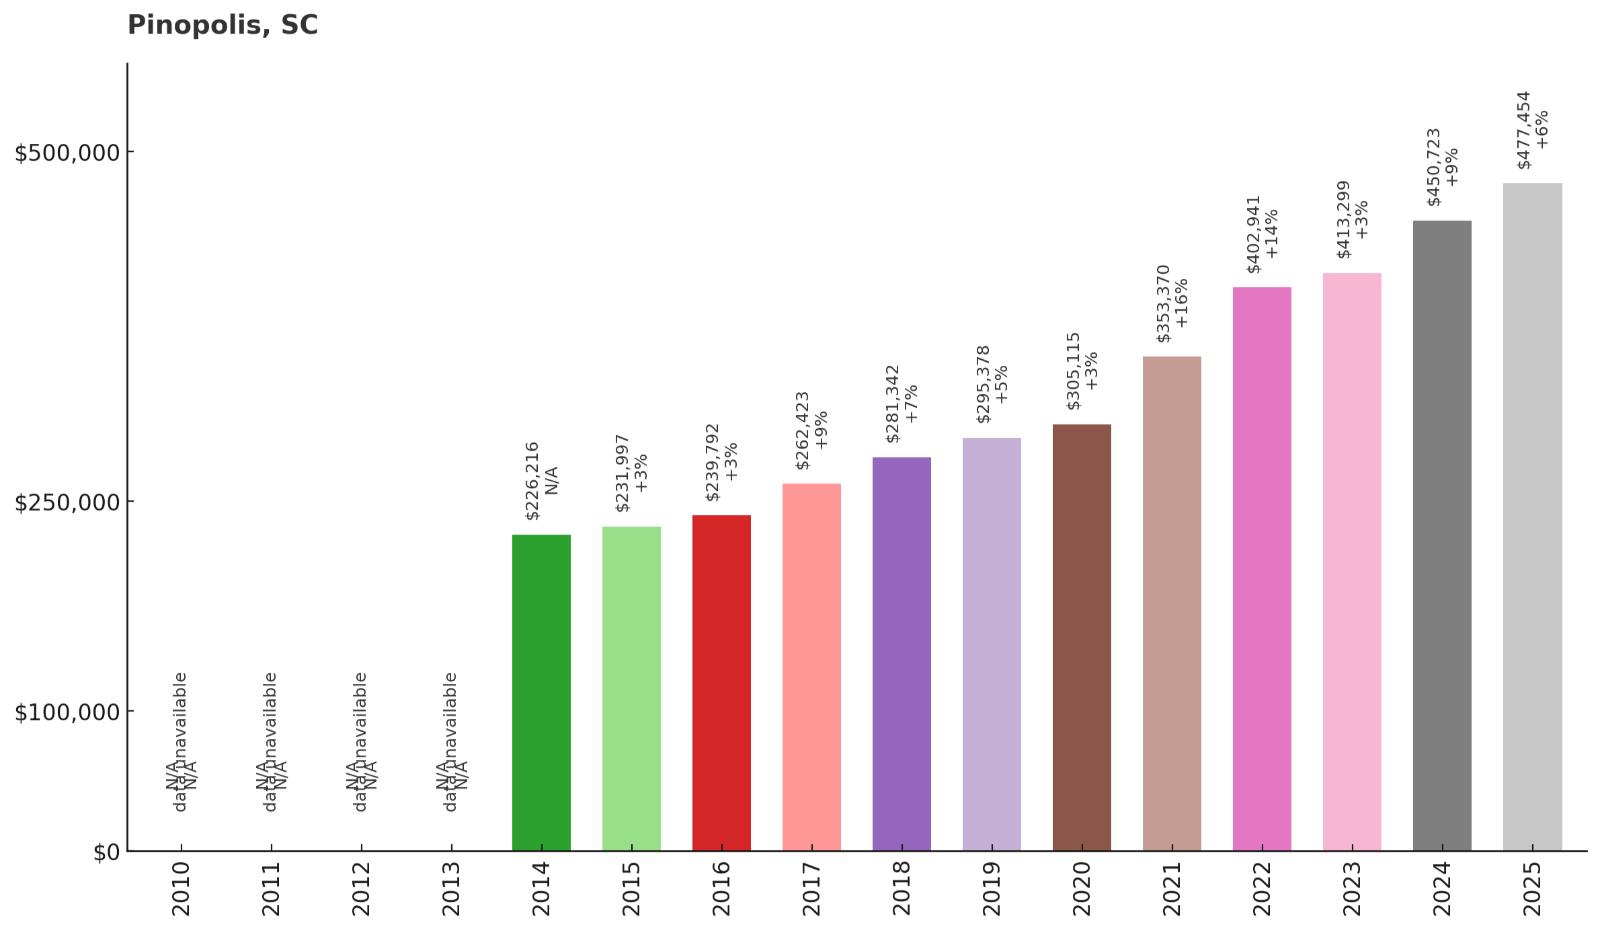
- 2010: N/A
- 2011: N/A
- 2012: N/A
- 2013: N/A
- 2014: $226,216
- 2015: $231,997
- 2016: $239,792
- 2017: $262,423
- 2018: $281,342
- 2019: $295,378
- 2020: $305,115
- 2021: $353,370
- 2022: $402,941
- 2023: $413,299
- 2024: $450,723
- 2025: $477,454
Since 2014, Pinopolis values have more than doubled, rising from about $226,000 to nearly $477,500. Momentum picked up during 2020–2022 as lake living drew a wider buyer pool. Continued gains into 2025 reflect that lasting appeal.
Why Pinopolis?
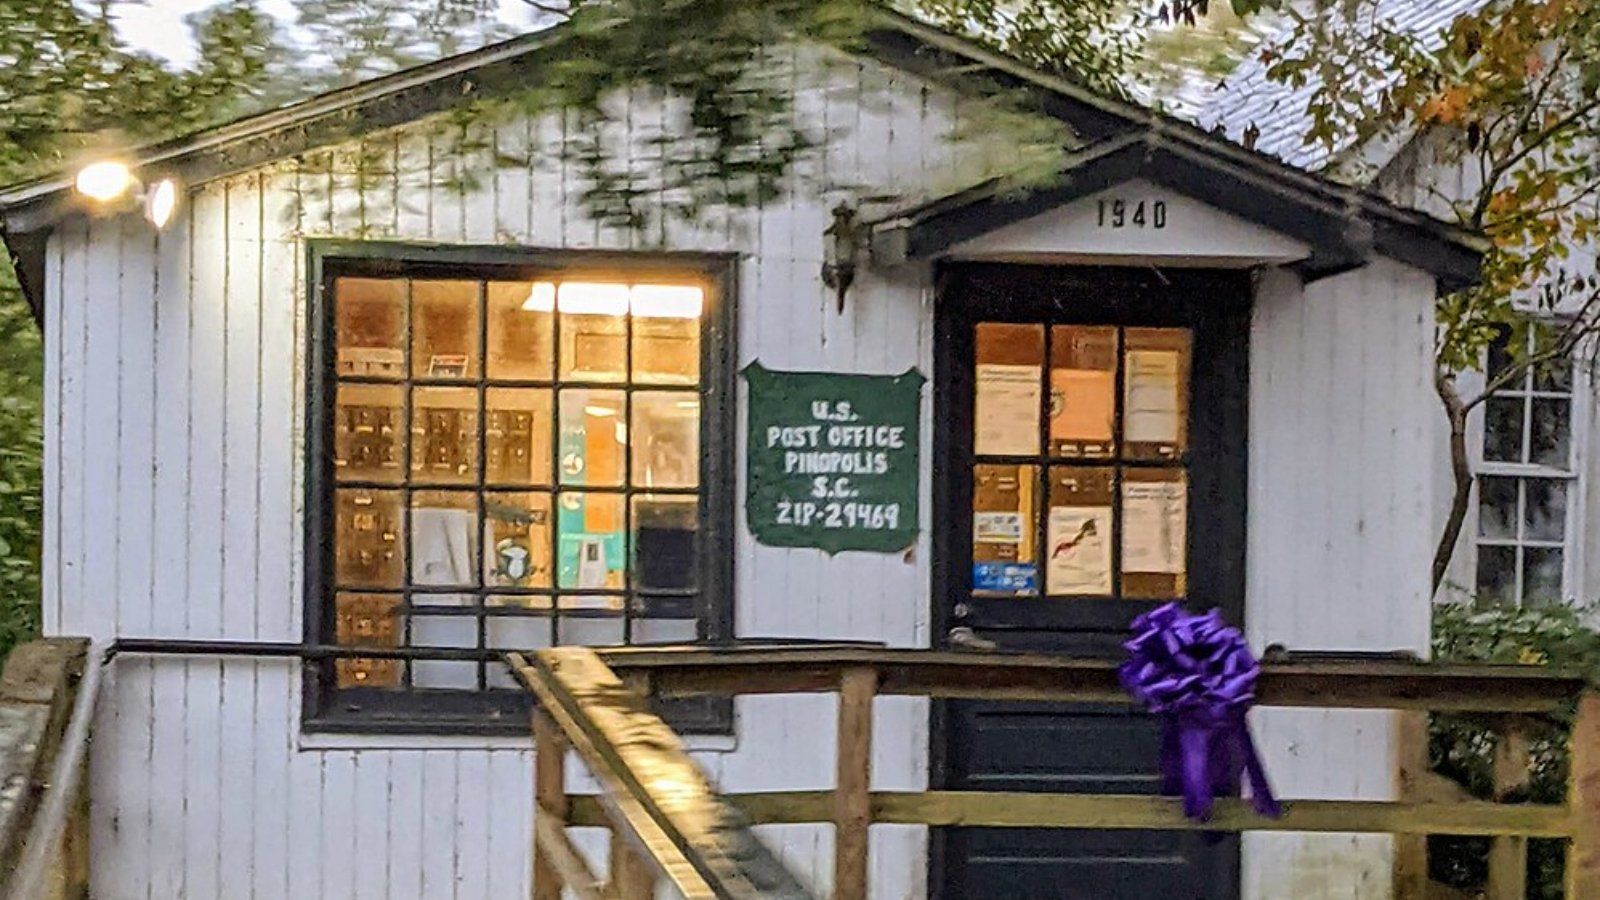
Why are people willing to pay so much to live here? What’s special about it?
Perched above Lake Moultrie, Pinopolis offers breezes, water views, and a quiet grid of shaded streets. Boating, fishing, and sunset cruises are part of everyday life. Homes feel tucked away yet remain close to Moncks Corner services.
The community’s small scale keeps traffic light and mornings peaceful. Buyers appreciate character homes alongside updated lakeside properties. For many, that blend of history and water access is the sweet spot.
How Pinopolis Rose to Prominence
Founded as a 19th-century summer retreat, the area stayed lightly developed for decades. The Santee Cooper project formed Lake Moultrie, turning Pinopolis into a hilltop peninsula. As Berkeley County grew, Pinopolis kept its lake-town charm while demand surged.
Remote work and outdoor lifestyles lifted interest after 2020. With limited shoreline and a preserved street grid, supply stayed tight. Prices responded accordingly as more buyers targeted the lake.
3 Interesting Tidbits
1. Name Says It All – “Pinopolis” nods to the longleaf pines that still tower over the neighborhood.
2. Hilltop High Ground – Elevated terrain gives rare lake vistas across the Santee Cooper system.
3. Historic Core – A recognized district preserves early cottages and quiet lanes.
22. Huger – 149% Home Price Increase Since 2010
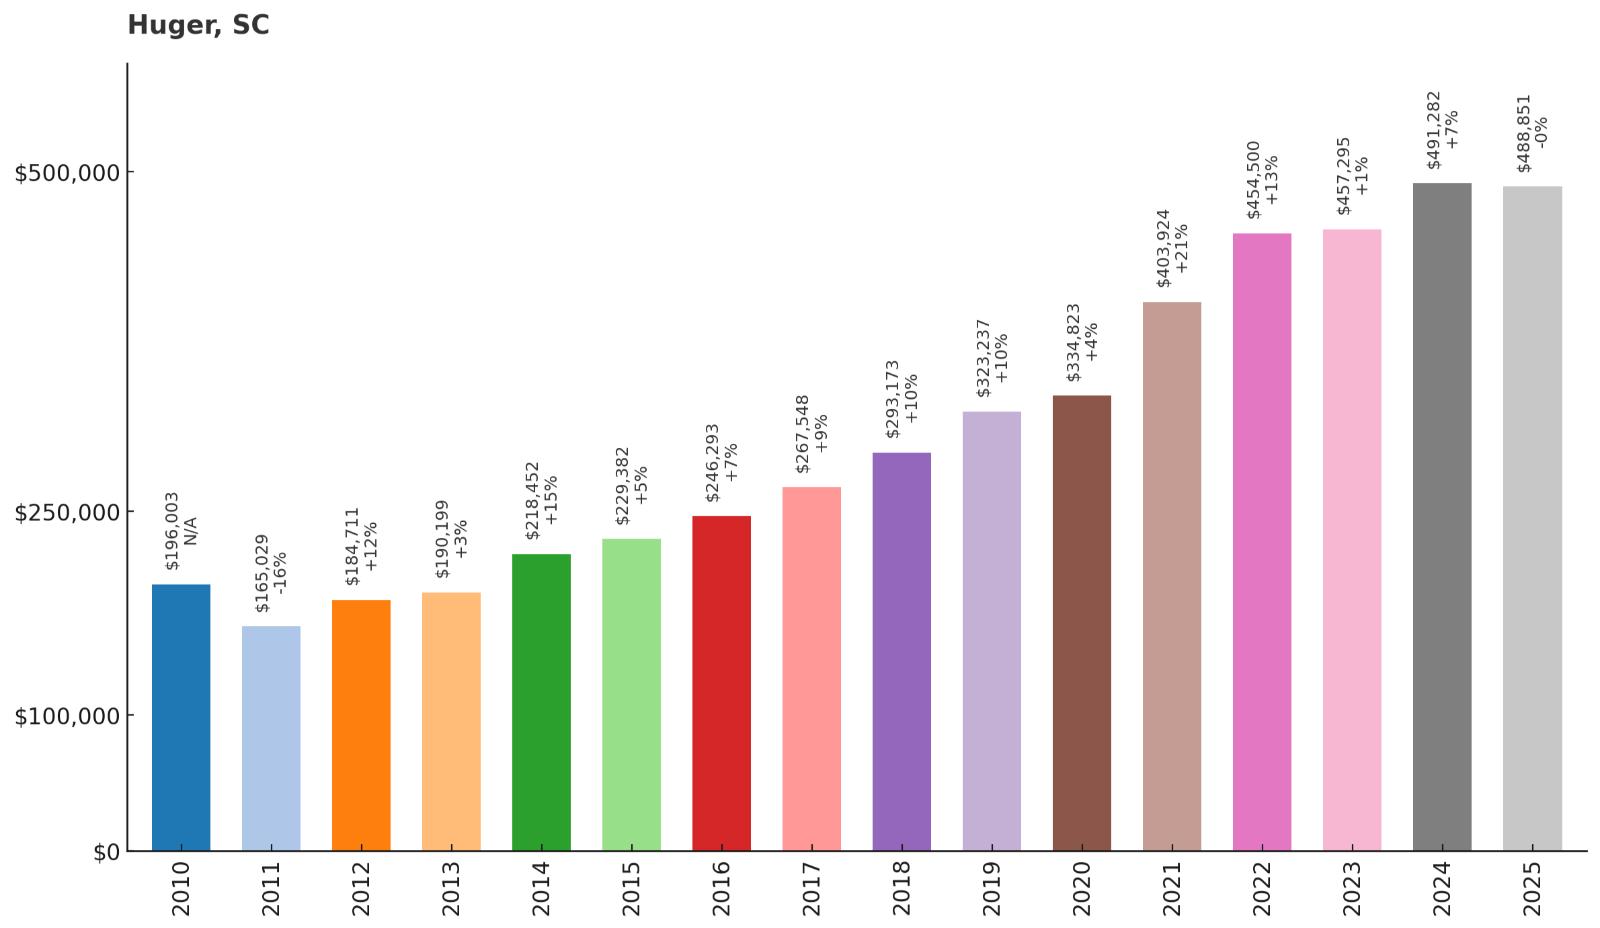
- 2010: $196,003
- 2011: $165,029
- 2012: $184,711
- 2013: $190,199
- 2014: $218,452
- 2015: $229,382
- 2016: $246,293
- 2017: $267,548
- 2018: $293,173
- 2019: $323,237
- 2020: $334,823
- 2021: $403,924
- 2022: $454,500
- 2023: $457,295
- 2024: $491,282
- 2025: $488,851
Huger’s values have risen nearly 150% since 2010 as Charleston’s growth radiated outward. The biggest gains arrived after 2020, lifting the median close to $489,000. More space, trees, and access to nature continue to attract buyers.
Why Huger?

Why are people willing to pay so much to live here? What’s special about it?
Huger places the Francis Marion National Forest practically in your backyard. Trails, rivers, and dirt roads turn weekends into mini adventures without leaving the county. Buyers seeking elbow room find it here, often at prices below coastal ZIP codes.
Daily needs remain simple with Mount Pleasant and North Charleston within a reasonable drive. New homes mix with rural parcels, giving shoppers flexibility in size and setting. For many, that rural-close-to-urban balance is exactly right.
How Huger Rose to Prominence
Long a forestry and farming area, Huger shifted as Charleston’s metro expanded north and east. Improved corridors made commutes and errands more predictable. As prices climbed closer to the coast, households looked inland for land and quiet.
The 2020s layered on remote work and outdoor-centric lifestyles. Inventory stayed thin relative to interest, pressing values higher. The result is a countryside market with staying power.
3 Interesting Tidbits
1. Forest Access – Boat launches and trailheads into the Francis Marion sit minutes away.
2. Wildlife Sightings – Deer, turkey, and wading birds are common neighbors.
3. Country Roads – Scenic drives connect small communities across Berkeley County.
21. Ravenel – 165% Home Price Increase Since 2010

- 2010: $187,778
- 2011: $170,718
- 2012: $176,482
- 2013: $180,288
- 2014: $204,629
- 2015: $222,237
- 2016: $249,272
- 2017: $264,953
- 2018: $272,601
- 2019: $286,780
- 2020: $306,599
- 2021: $383,051
- 2022: $451,465
- 2023: $469,010
- 2024: $497,941
- 2025: $498,245
Ravenel’s median value has risen 165% since 2010, now brushing $500,000. The strongest acceleration came in 2021–2024 as Charleston’s southwest corridor filled in. Buyers continue to seek acreage, privacy, and a straight shot up US-17.
Why Ravenel?
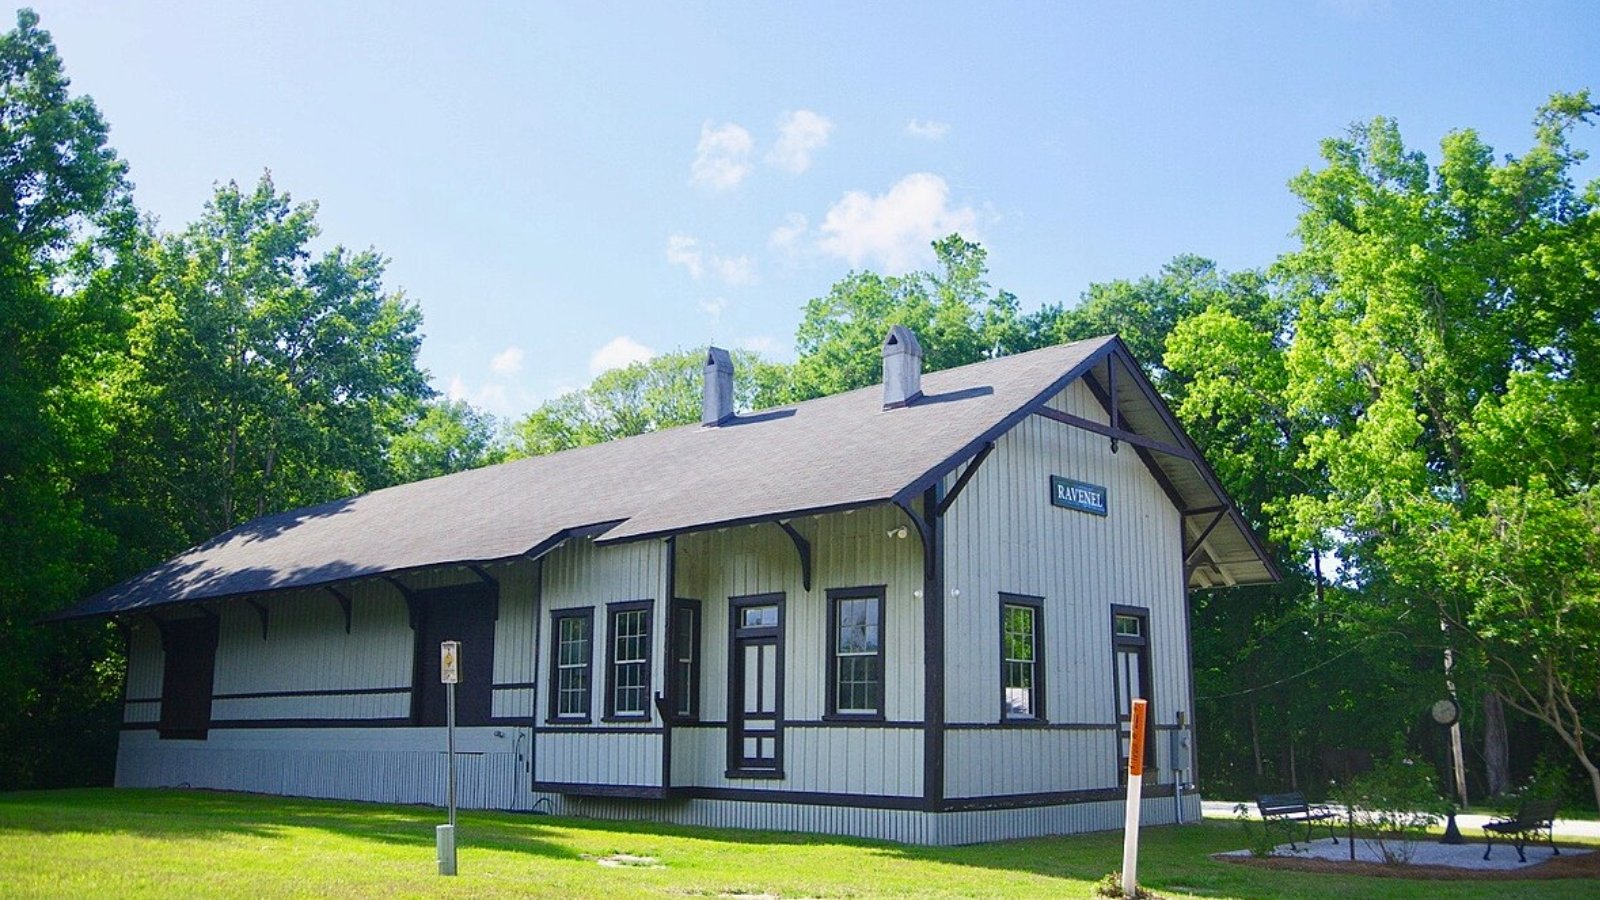
Why are people willing to pay so much to live here? What’s special about it?
Homes often come with more land, room for gardens, and quiet evenings under the pines. The drive to Charleston stays direct, keeping commutes reasonable a few days each week. Weekends point toward Edisto, the ACE Basin, and tidal rivers for easy escapes.
Neighborhoods range from classic ranch homes to newer builds on larger sites. Local markets and produce stands keep errands fresh and close by. For many, the value lies in space without losing regional access.
How Ravenel Rose to Prominence
Agriculture dominated for decades until suburban demand crept down the Savannah Highway. Each market cycle brought more residents seeking space beyond city limits. As Charleston’s core tightened, Ravenel became a release valve for growth.
Recent years added remote and hybrid workers who can trade drive time for acreage. With limited inventory and larger lots, appreciation compounded quickly. The result is a rural-suburban market with strong footing.
3 Interesting Tidbits
1. Edisto Gateway – Day-trip beaches and rivers lie just down US-17.
2. Farm Stands – Seasonal produce pops up along roadside stands and small markets.
3. Horses Welcome – Many properties and trails suit equestrian lifestyles.
20. Bluffton – 109% Home Price Increase Since 2010
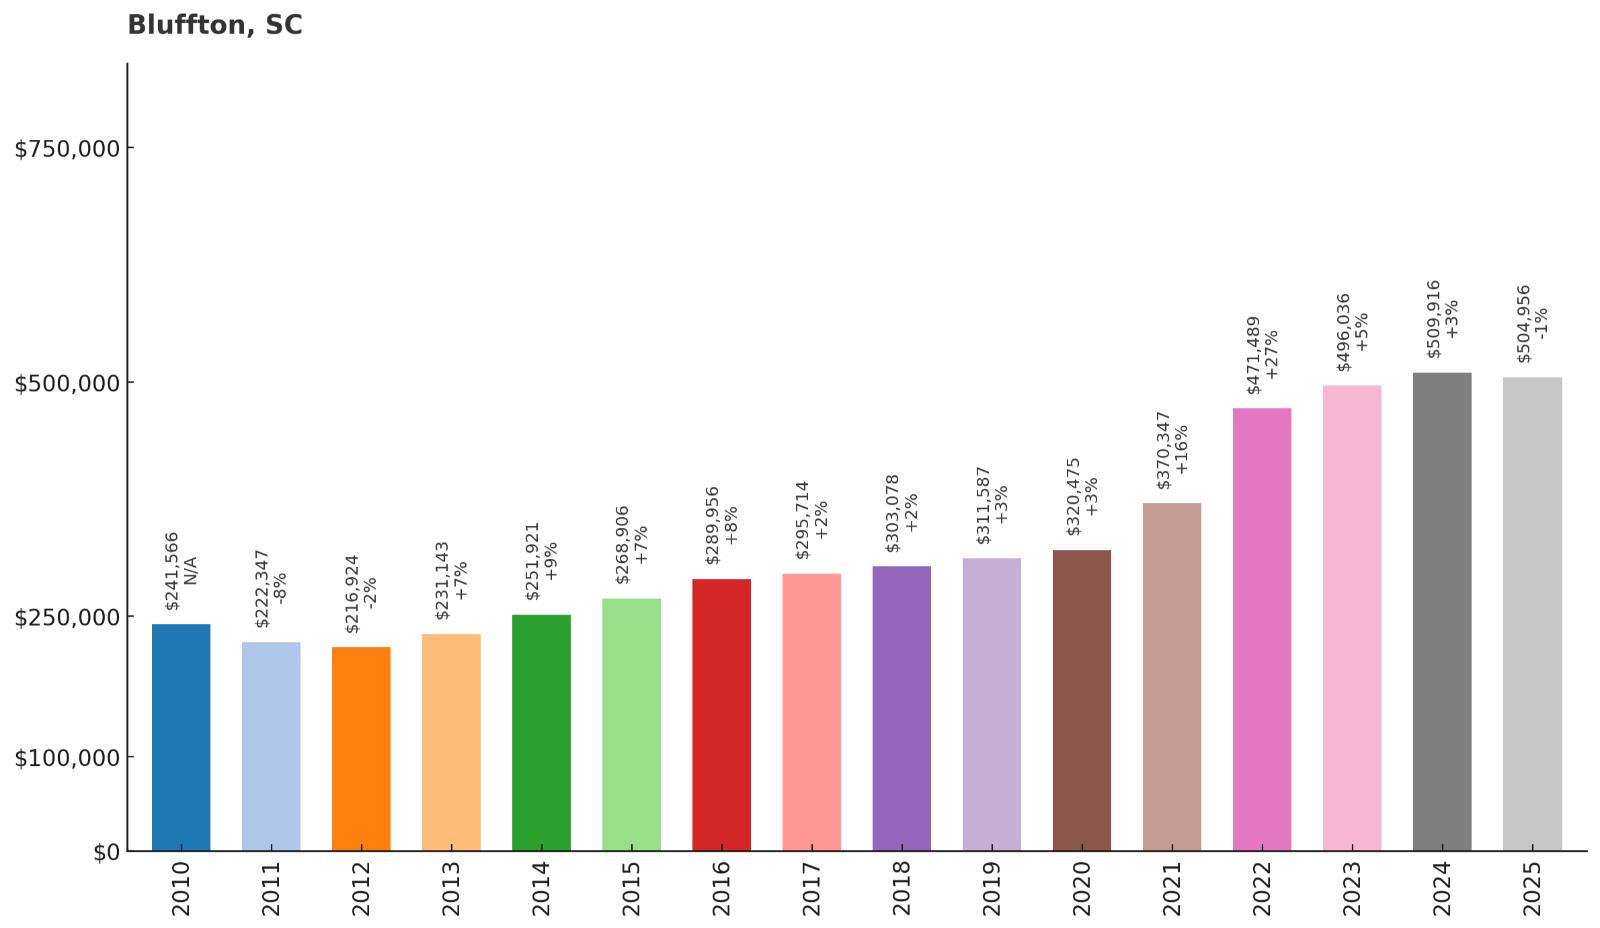
- 2010: $241,566
- 2011: $222,347
- 2012: $216,924
- 2013: $231,143
- 2014: $251,921
- 2015: $268,906
- 2016: $289,956
- 2017: $295,714
- 2018: $303,078
- 2019: $311,587
- 2020: $320,475
- 2021: $370,347
- 2022: $471,489
- 2023: $496,036
- 2024: $509,916
- 2025: $504,956
Bluffton’s median value has more than doubled since 2010 as the town became a full-fledged Lowcountry hub. The biggest lift came in 2021–2022 when demand spilled over from Hilton Head and Savannah. Prices have held near recent highs thanks to strong in-migration and new amenities.
Why Bluffton?
Why are people willing to pay so much to live here? What’s special about it?
Old Town’s oak-shaded streets, galleries, and May River sunsets deliver postcard scenes every evening. Master-planned communities add pools, paths, and clubhouses that fit active lifestyles. Shoppers can choose everything from cottages to larger new builds within minutes of each other.
Daily life runs smoothly with medical centers, groceries, and schools close to home. Weekend choices are easy—launch a boat on the May, head to Hilton Head’s beaches, or explore Savannah’s squares. That three-direction versatility is a powerful draw.
How Bluffton Rose to Prominence
What began as a quiet river town changed rapidly in the 1990s and 2000s during the “Bluffton Boom.” Annexations and new neighborhoods multiplied as jobs and retirees arrived. Old Town revitalization added restaurants, markets, and events that anchored a true downtown.
By the 2010s, Bluffton stood on its own rather than as a simple bedroom community. The pandemic poured fuel on demand as more buyers targeted space, trails, and water access. That wave set new price levels that have largely held.
3 Interesting Tidbits
1. May River Magic – Dolphin sightings are common on calm mornings along the river.
2. Arts & Markets – Regular festivals and farmers’ markets keep Old Town buzzing.
3. Three-City Triangle – Quick drives reach Hilton Head, Savannah, and Beaufort, expanding work and play options.
19. Hollywood – 122% Home Price Increase Since 2010
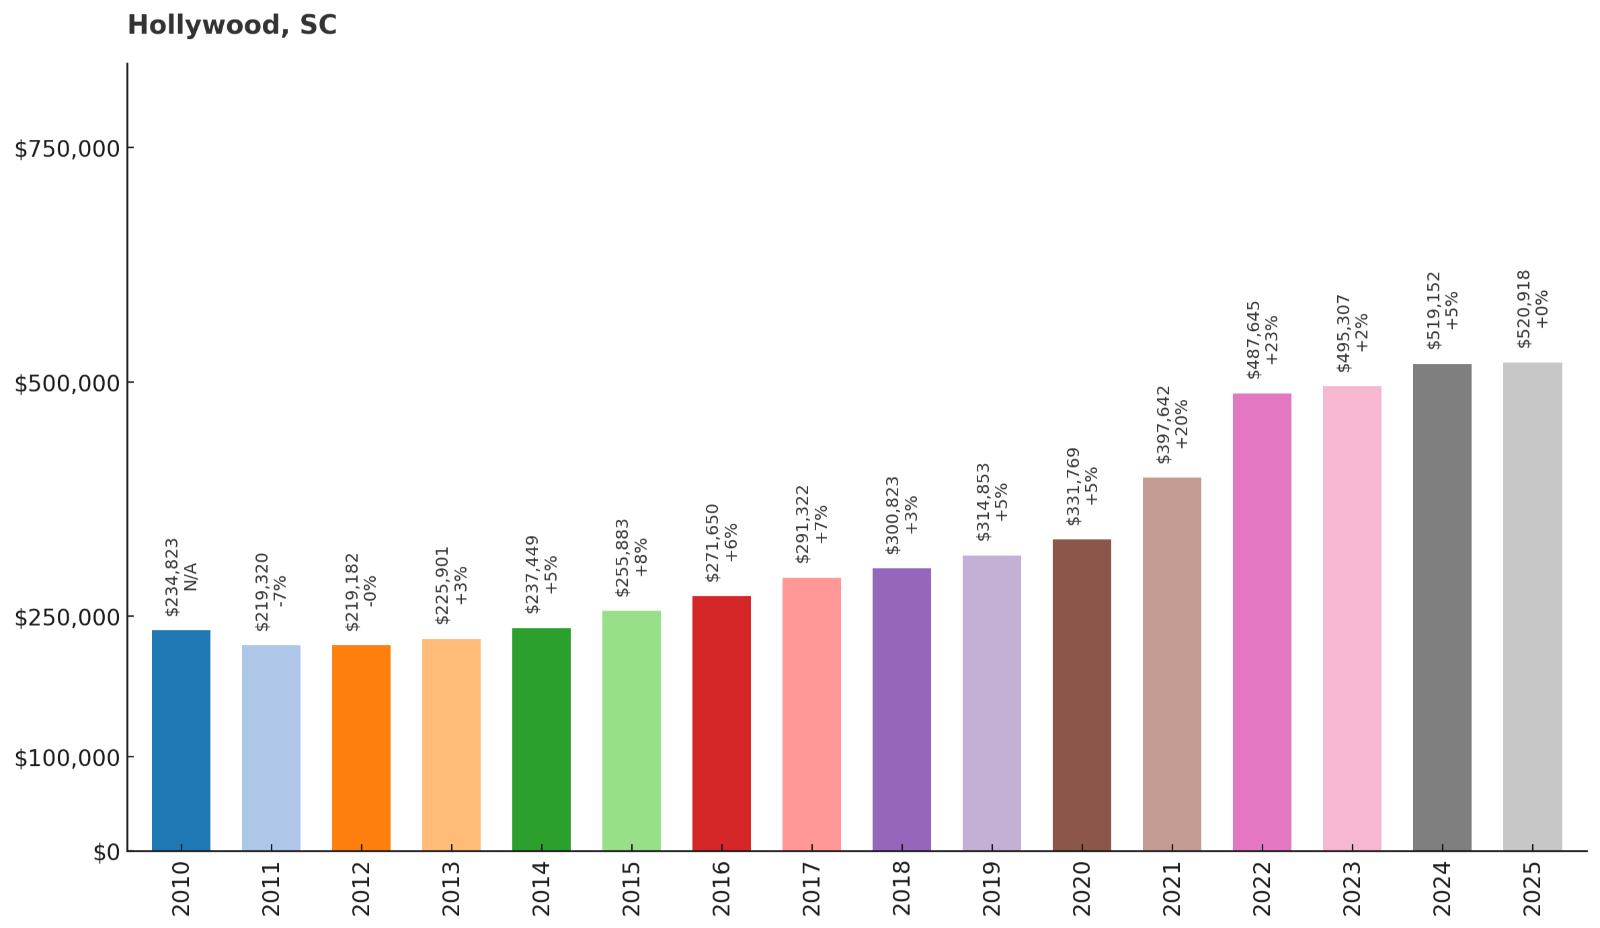
- 2010: $234,823
- 2011: $219,320
- 2012: $219,182
- 2013: $225,901
- 2014: $237,449
- 2015: $255,883
- 2016: $271,650
- 2017: $291,322
- 2018: $300,823
- 2019: $314,853
- 2020: $331,769
- 2021: $397,642
- 2022: $487,645
- 2023: $495,307
- 2024: $519,152
- 2025: $520,918
Hollywood’s median value has more than doubled since 2010, landing just over $520,000 in 2025. Appreciation accelerated after 2020 as Charleston’s growth spilled southwest along the Ashepoo–Combahee–Edisto basin. With larger lots and tidal scenery, demand has stayed firm at today’s higher price level.
Why Hollywood?
Why are people willing to pay so much to live here? What’s special about it?
Buyers seek space, river access, and quiet roads a manageable drive from Charleston jobs. Creeks, marsh views, and boat launches turn free time into fishing runs and sunset cruises. The housing mix includes ranch homes, small farms, and new builds on generous sites.
Daily needs are close in West Ashley, while beaches and Edisto day trips sit down the highway. People appreciate the country feel that still connects to city conveniences. That balance of elbow room and access is hard to beat.
How Hollywood Rose to Prominence
For decades, the area remained agricultural as the metro core densified. As growth moved outward along Savannah Highway, Hollywood drew households chasing land and privacy. Remote and hybrid work then widened the buyer pool and quickened the pace.
Limited supply and scenic waterways amplified each new wave of interest. Values built on themselves through the 2020s. The result is a rural-suburban market with staying power.
3 Interesting Tidbits
1. ACE Basin Gateway – Access to one of the East Coast’s largest protected estuaries is minutes away.
2. Equestrian Pockets – Properties with room for barns and pastures are common.
3. Tidal Lifestyle – Kayaks on porches and crab traps by docks are everyday sights.
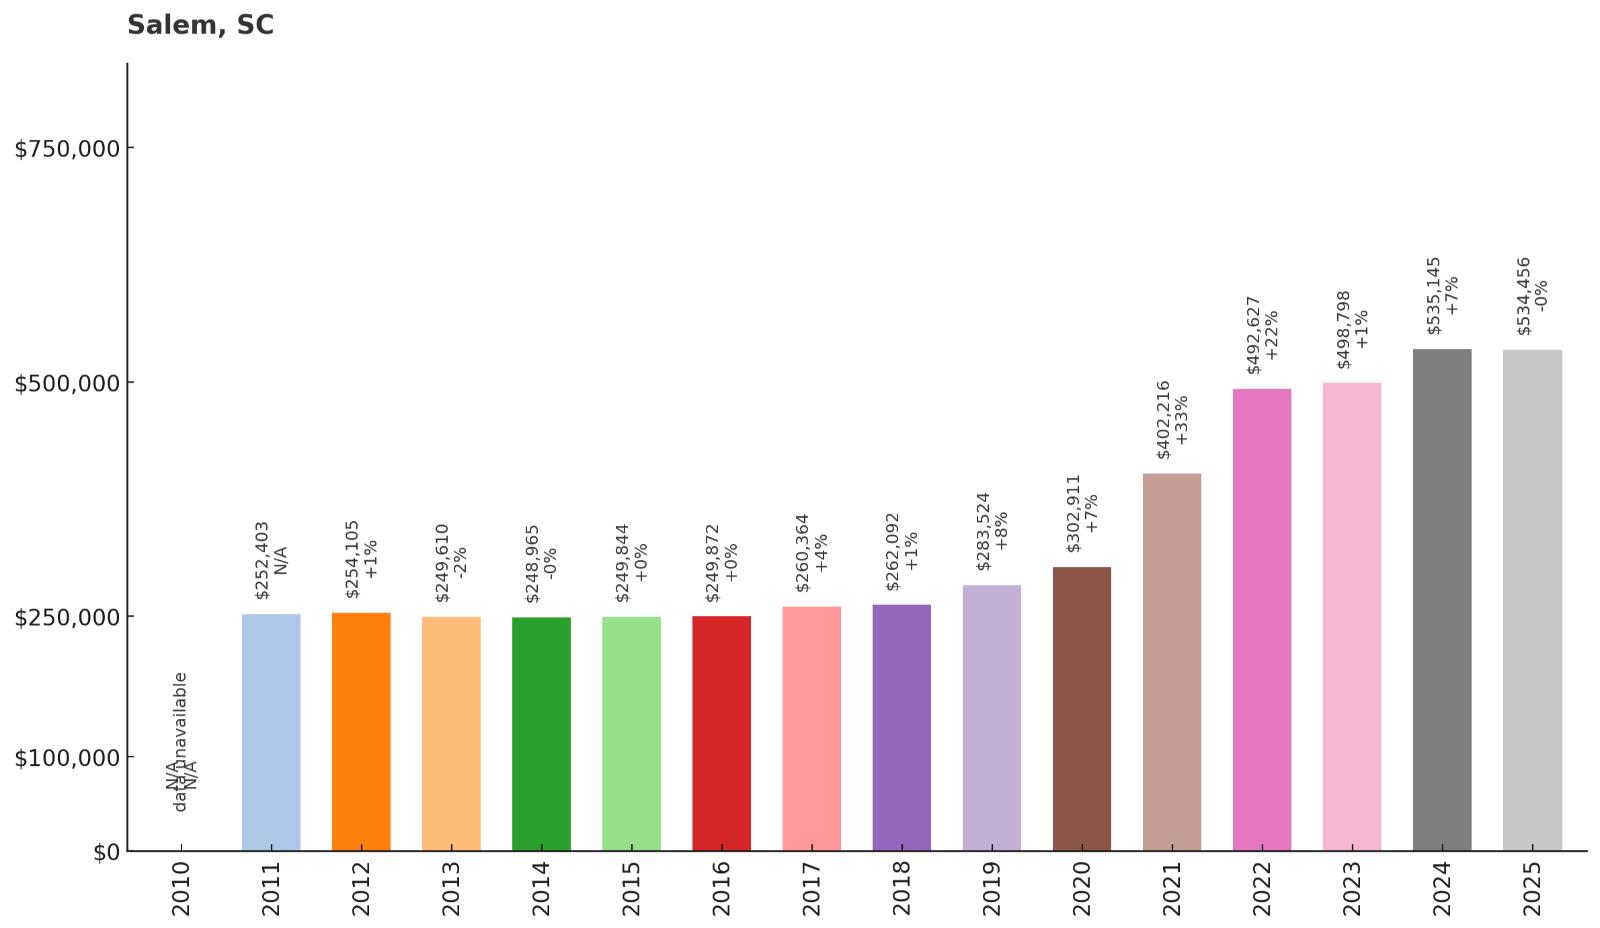
18. Salem – 112% Home Price Increase Since 2011
🔥 Would you like to save this?
- 2010: N/A
- 2011: $252,403
- 2012: $254,105
- 2013: $249,610
- 2014: $248,965
- 2015: $249,844
- 2016: $249,872
- 2017: $260,364
- 2018: $262,092
- 2019: $283,524
- 2020: $302,911
- 2021: $402,216
- 2022: $492,627
- 2023: $498,798
- 2024: $535,145
- 2025: $534,456
From the first available reading in 2011, Salem’s median has risen about 112%, now hovering near $534,000. The biggest leaps came during 2021–2022 as Lake Keowee living drew national attention. Prices have held near their high-water mark, signaling durable demand for waterfront and mountain-adjacent homes.
Why Salem?
Why are people willing to pay so much to live here? What’s special about it?
Lake Keowee delivers clear water, mountain vistas, and year-round boating minutes from the driveway. Golf communities, marinas, and trailheads make weekends feel like vacations. People pay for views, shoreline access, and a relaxed pace that still reaches Greenville and Clemson.
Newer custom homes join established cabins and lake cottages, giving buyers a wide menu. Quiet coves and low traffic keep mornings peaceful and evenings on the porch. The lifestyle premium is obvious the first time you launch at sunrise.
How Salem Rose to Prominence
Keowee’s development seeded neighborhoods that matured through the 2000s while job growth spread across the Upstate. Regional migration and remote work expanded the pool of lake-focused buyers after 2020. Scarce waterfront lots intensified competition and lifted values quickly.
Resort-style amenities built confidence among second-home and retirement shoppers. With inventory tight, prices found a higher plateau. Salem now reads as a premier Upstate lake address.
3 Interesting Tidbits
1. Blue Ridge Backdrop – Clear days deliver long views to the mountains.
2. Sunup to Sundown – Morning paddles and golden-hour cruises bookend many residents’ days.
3. Golf & Greenspace – Planned communities weave courses and parks throughout the shoreline.
17. Fort Mill – 125% Home Price Increase Since 2010
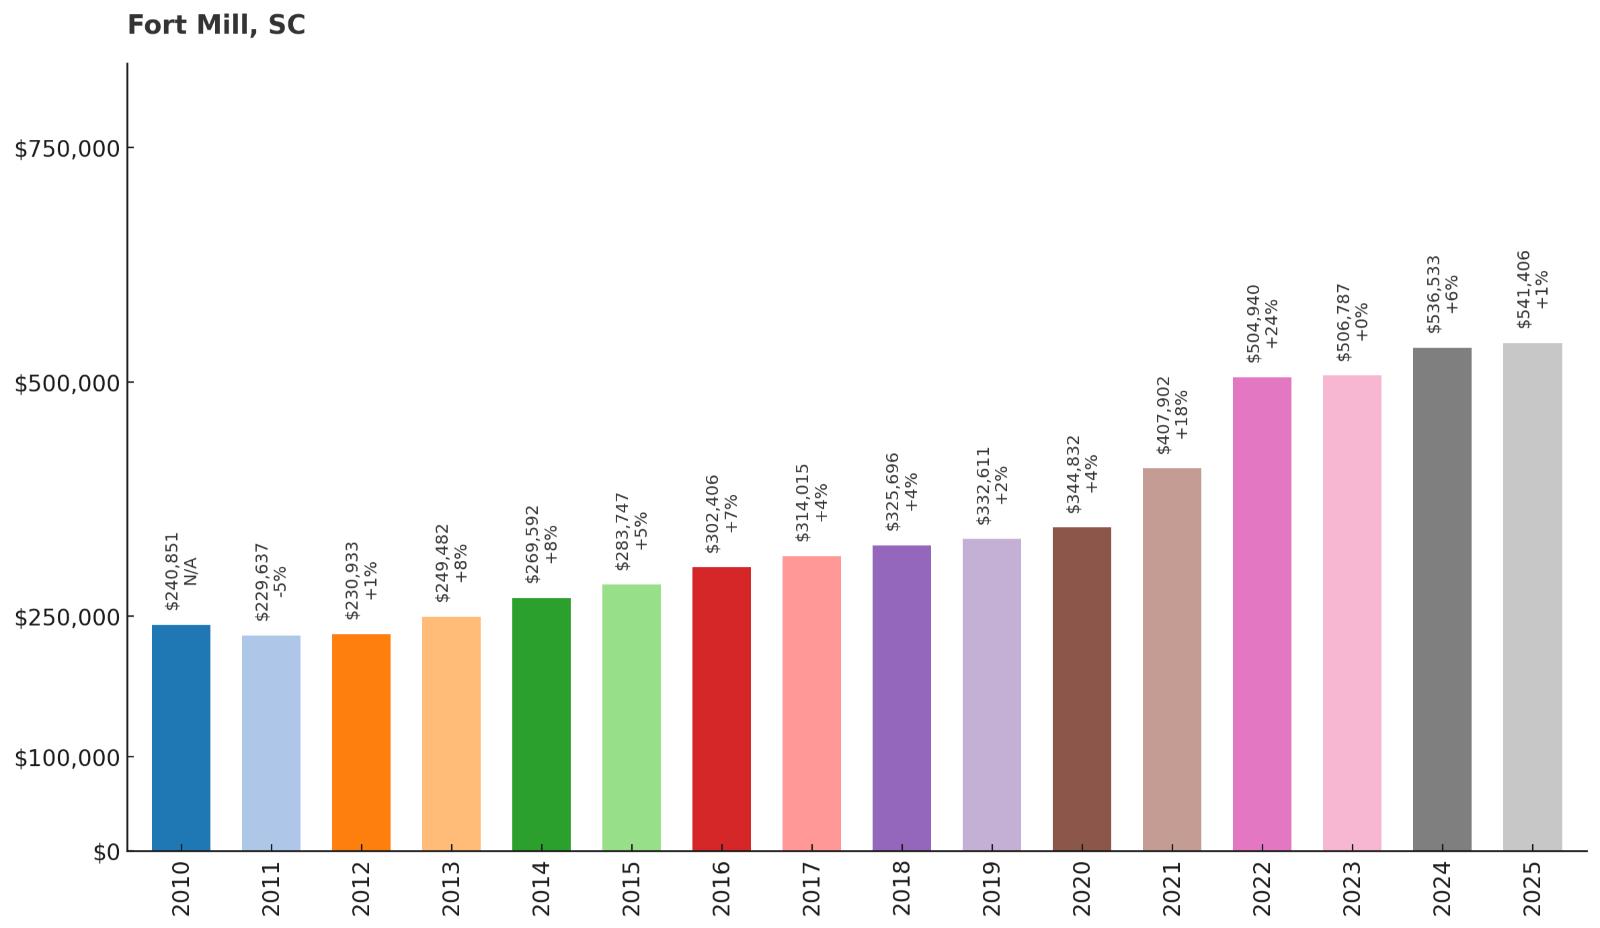
- 2010: $240,851
- 2011: $229,637
- 2012: $230,933
- 2013: $249,482
- 2014: $269,592
- 2015: $283,747
- 2016: $302,406
- 2017: $314,015
- 2018: $325,696
- 2019: $332,611
- 2020: $344,832
- 2021: $407,902
- 2022: $504,940
- 2023: $506,787
- 2024: $536,533
- 2025: $541,406
Fort Mill’s median has surged 125% since 2010, touching $541,000 in 2025. Growth stepped up in 2021–2022 as Charlotte’s south side boomed and new master-planned neighborhoods filled in. The market remains one of the region’s most competitive thanks to schools, amenities, and access.
Why Fort Mill?
Why are people willing to pay so much to live here? What’s special about it?
Top-rated schools, new construction, and amenity-rich communities headline the draw. Proximity to Ballantyne and Uptown Charlotte keeps commutes sane while taxes stay South Carolina-low. Neighboring Lake Wylie adds boating and beaches to the weekend plan.
Pocket parks, greenways, and clubhouses make neighborhood life active and social. Dining, retail, and healthcare have grown right alongside rooftops. It’s a clean fit for families who want turn-key convenience and strong resale.
How Fort Mill Rose to Prominence
Industrial and mill roots gave way to suburban growth as Charlotte expanded down I-77. By the 2010s, large-scale communities transformed pastureland into complete neighborhoods. Corporate moves to Ballantyne and the state line deepened the jobs-housing connection.
During the pandemic, hybrid work broadened buyer interest and sped up relocations. With strong schools and modern housing, prices ratcheted higher. The town is now a Carolinas showcase for master-planned living.
3 Interesting Tidbits
1. Greenway Access – Trails link parks and playgrounds across multiple subdivisions.
2. State-Line Savings – Taxes and services remain a talking point for relocators.
3. Sports Everywhere – Youth leagues, travel teams, and facilities thrive year-round.
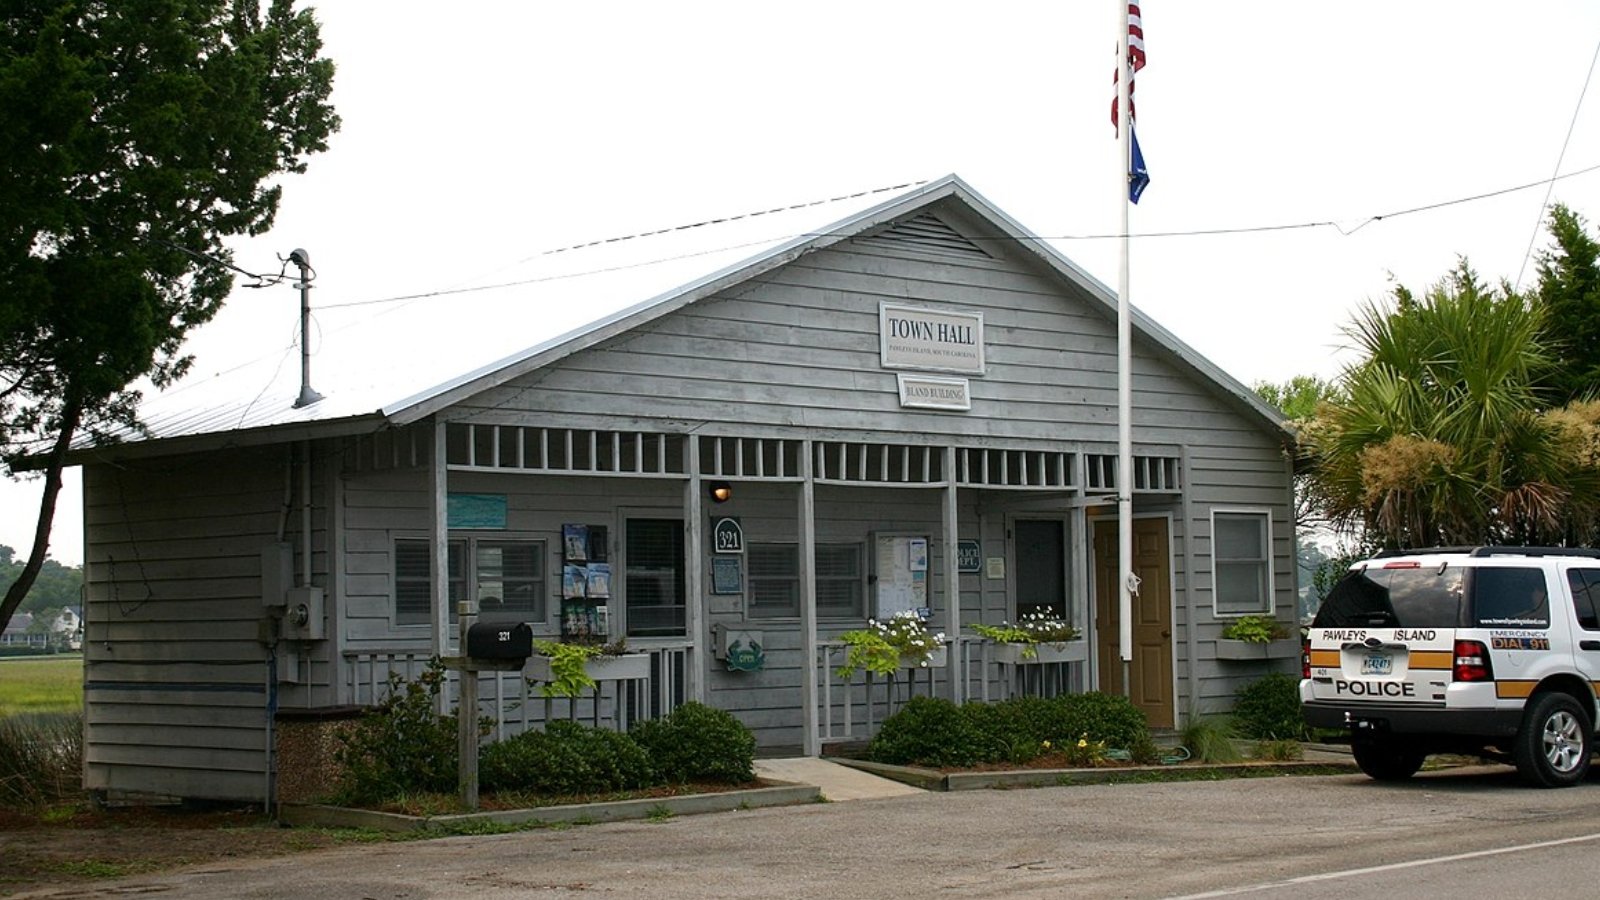
16. Pawleys Island – 110% Home Price Increase Since 2012
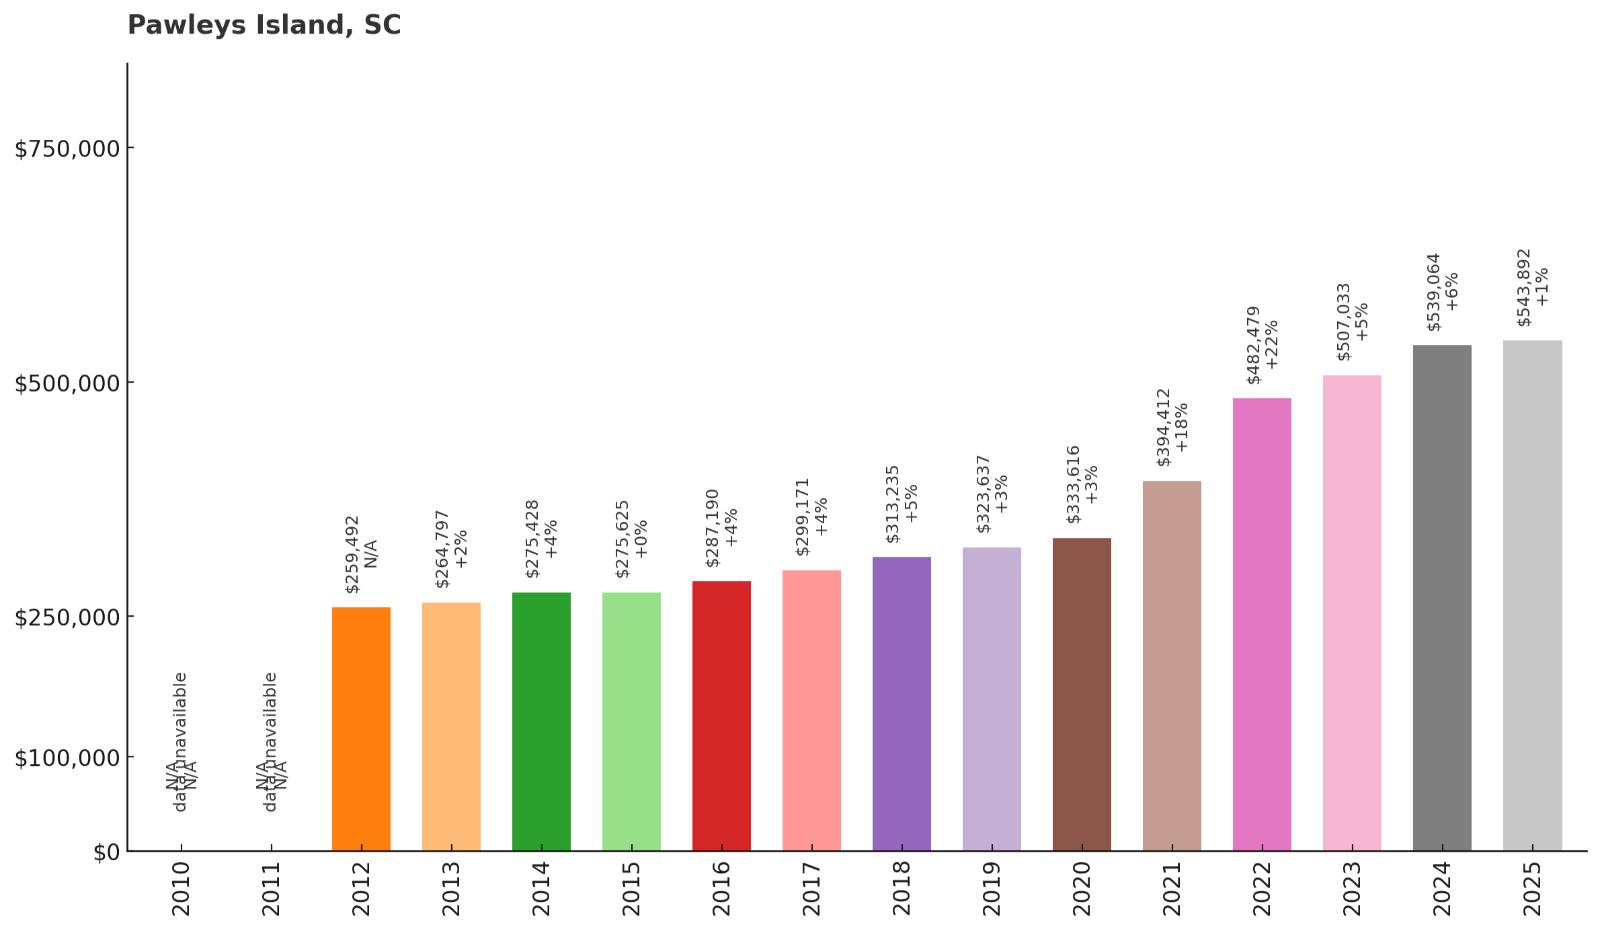
- 2010: N/A
- 2011: N/A
- 2012: $259,492
- 2013: $264,797
- 2014: $275,428
- 2015: $275,625
- 2016: $287,190
- 2017: $299,171
- 2018: $313,235
- 2019: $323,637
- 2020: $333,616
- 2021: $394,412
- 2022: $482,479
- 2023: $507,033
- 2024: $539,064
- 2025: $543,892
From the first reading in 2012, Pawleys Island’s median has risen about 110%, now near $544,000. Appreciation quickened after 2020 as second-home and work-from-anywhere buyers targeted the Lowcountry coast. Each year since 2021 has added to that momentum.
Why Pawleys Island?
Why are people willing to pay so much to live here? What’s special about it?
Uncrowded beaches, creek docks, and a timeless cottage aesthetic define Pawleys’ appeal. The pace is slow, the views are long, and the seafood is close to the net. Golf courses, boutiques, and galleries round out an easy daily rhythm.
People pay for simplicity—morning walks on soft sand, afternoons casting in tidal creeks, dinners on porches. The island and nearby mainland offer a wide range of price points and styles. That flexibility brings in both full-time residents and long-time vacationers ready to stay.
How Pawleys Island Rose to Prominence
One of America’s oldest seaside resorts, Pawleys cultivated a low-key tradition long before the boom. As the Grand Strand developed, Pawleys kept its charm and slower growth curve. That conservation-minded approach left a product the market now prizes.
The 2020s introduced new remote buyers who value nature and quiet. Limited buildable land restrained supply and supported higher prices. The result is steady appreciation anchored by authenticity.
3 Interesting Tidbits
1. Creek Life – Floating the salt marsh at high tide is a local rite of passage.
2. Hammock Shops – A historic retail village celebrates coastal craftsmanship.
3. Golf Row – Noted courses string along the Waccamaw Neck.
15. Charleston – 161% Home Price Increase Since 2010
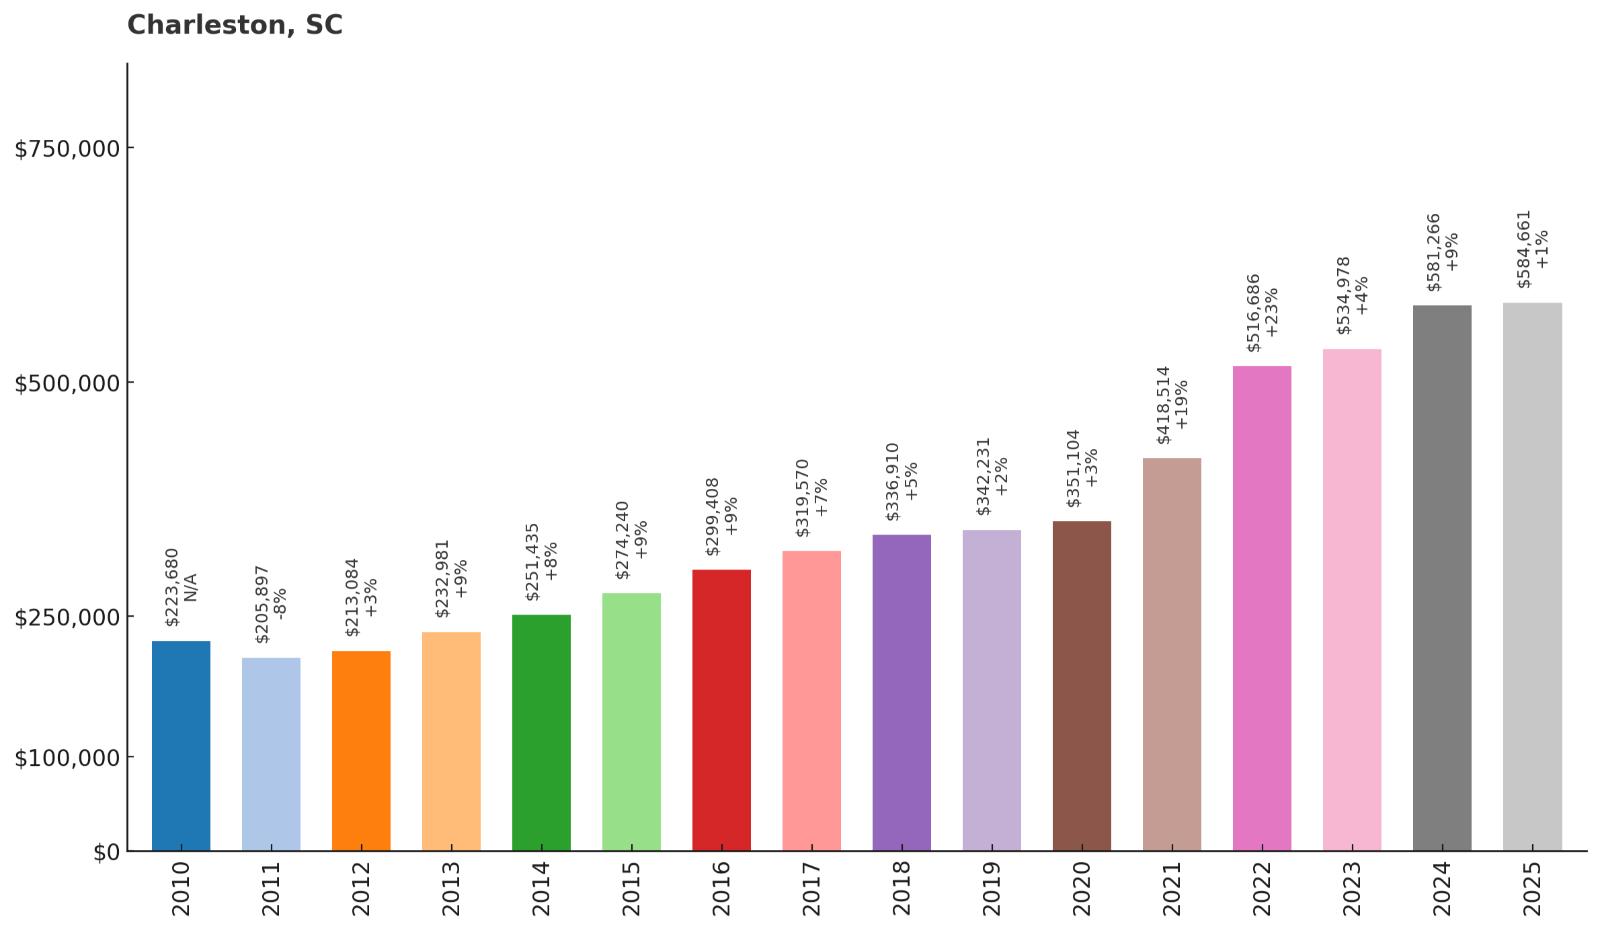
- 2010: $223,680
- 2011: $205,897
- 2012: $213,084
- 2013: $232,981
- 2014: $251,435
- 2015: $274,240
- 2016: $299,408
- 2017: $319,570
- 2018: $336,910
- 2019: $342,231
- 2020: $351,104
- 2021: $418,514
- 2022: $516,686
- 2023: $534,978
- 2024: $581,266
- 2025: $584,661
Charleston’s median has soared 161% since 2010, now around $585,000. Appreciation surged in 2021–2024 as national relocation, remote work, and lifestyle moves converged. Historic charm, food culture, and waterfront living continue to justify premium pricing.
Why Charleston?
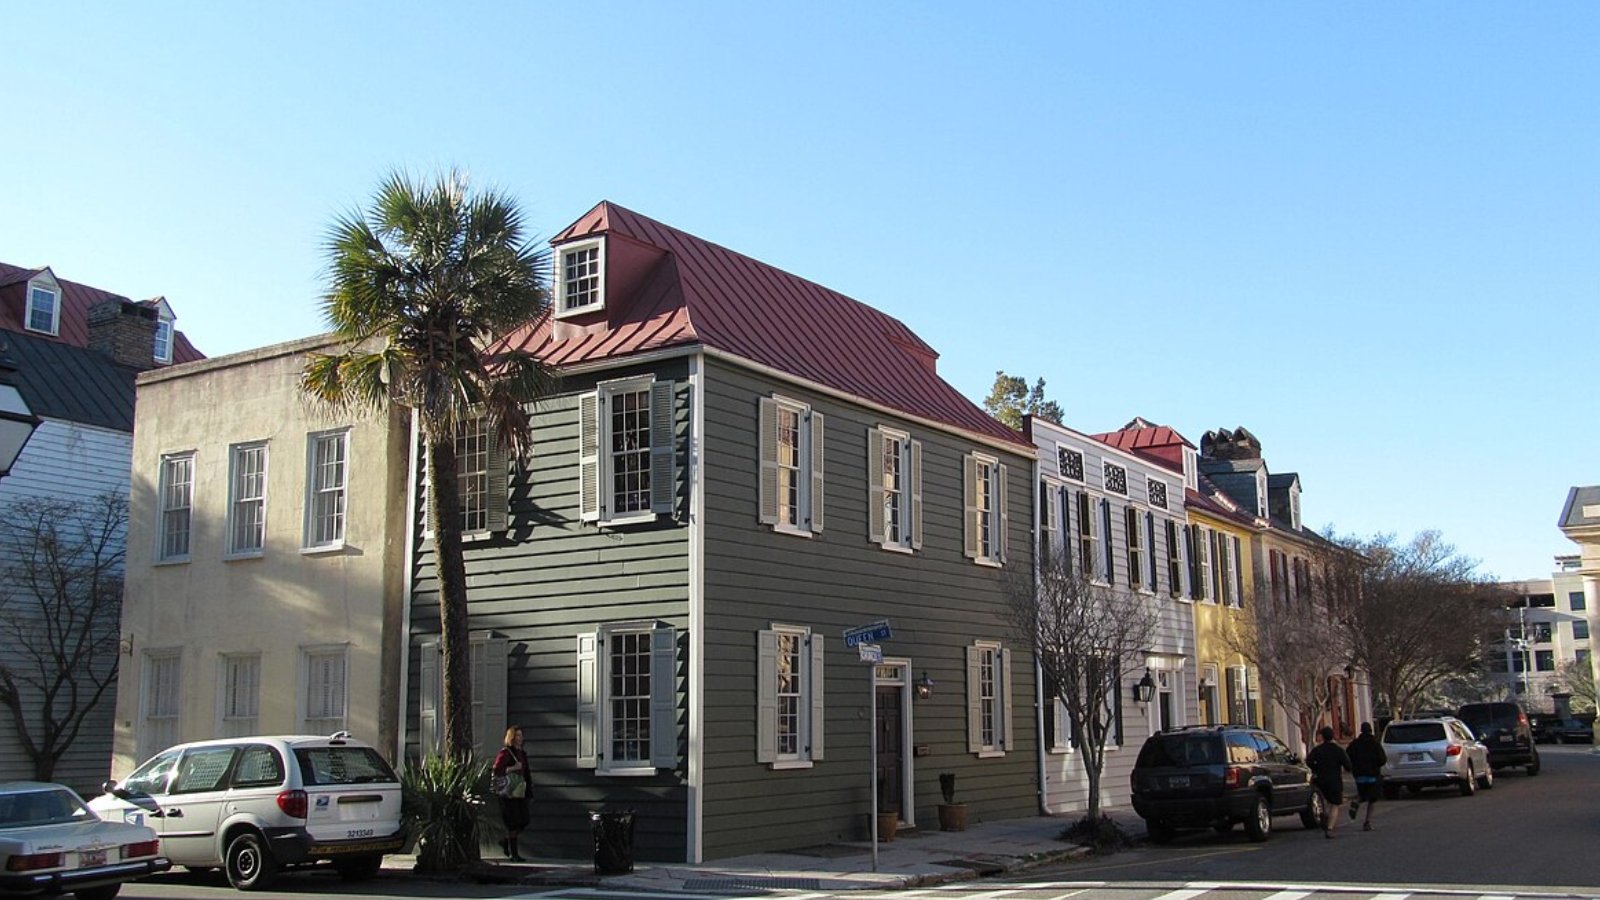
Why are people willing to pay so much to live here? What’s special about it?
Rainbow Row, cobblestones, and live oaks set a daily backdrop that feels cinematic. Award-winning restaurants, beaches, and festivals stack the calendar year-round. Neighborhoods range from antebellum gems to new infill, giving shoppers real choice.
Major employers, a busy port, and a growing tech scene bolster the local economy. Walkable streets and waterfront parks make everyday errands feel like small adventures. The combination of culture, jobs, and coast is rare and resilient.
How Charleston Rose to Prominence
Post-recession revitalization amplified long-running tourism and preservation efforts. National rankings for food, travel, and livability drew steady streams of new residents. The knowledge economy and Boeing-era industrial growth deepened employment anchors.
During the pandemic, hybrid work accelerated relocation from larger metros. With finite historic housing and strong demand, values stepped up quickly. Charleston now defines Lowcountry premium living.
3 Interesting Tidbits
1. Battery Promenade – Sunrise walks along the harbor wall never get old.
2. Food City – From shrimp and grits to tasting menus, dining is sport here.
3. Fort Sumter Views – History remains visible from many waterfront parks.
14. Tega Cay – 123% Home Price Increase Since 2010
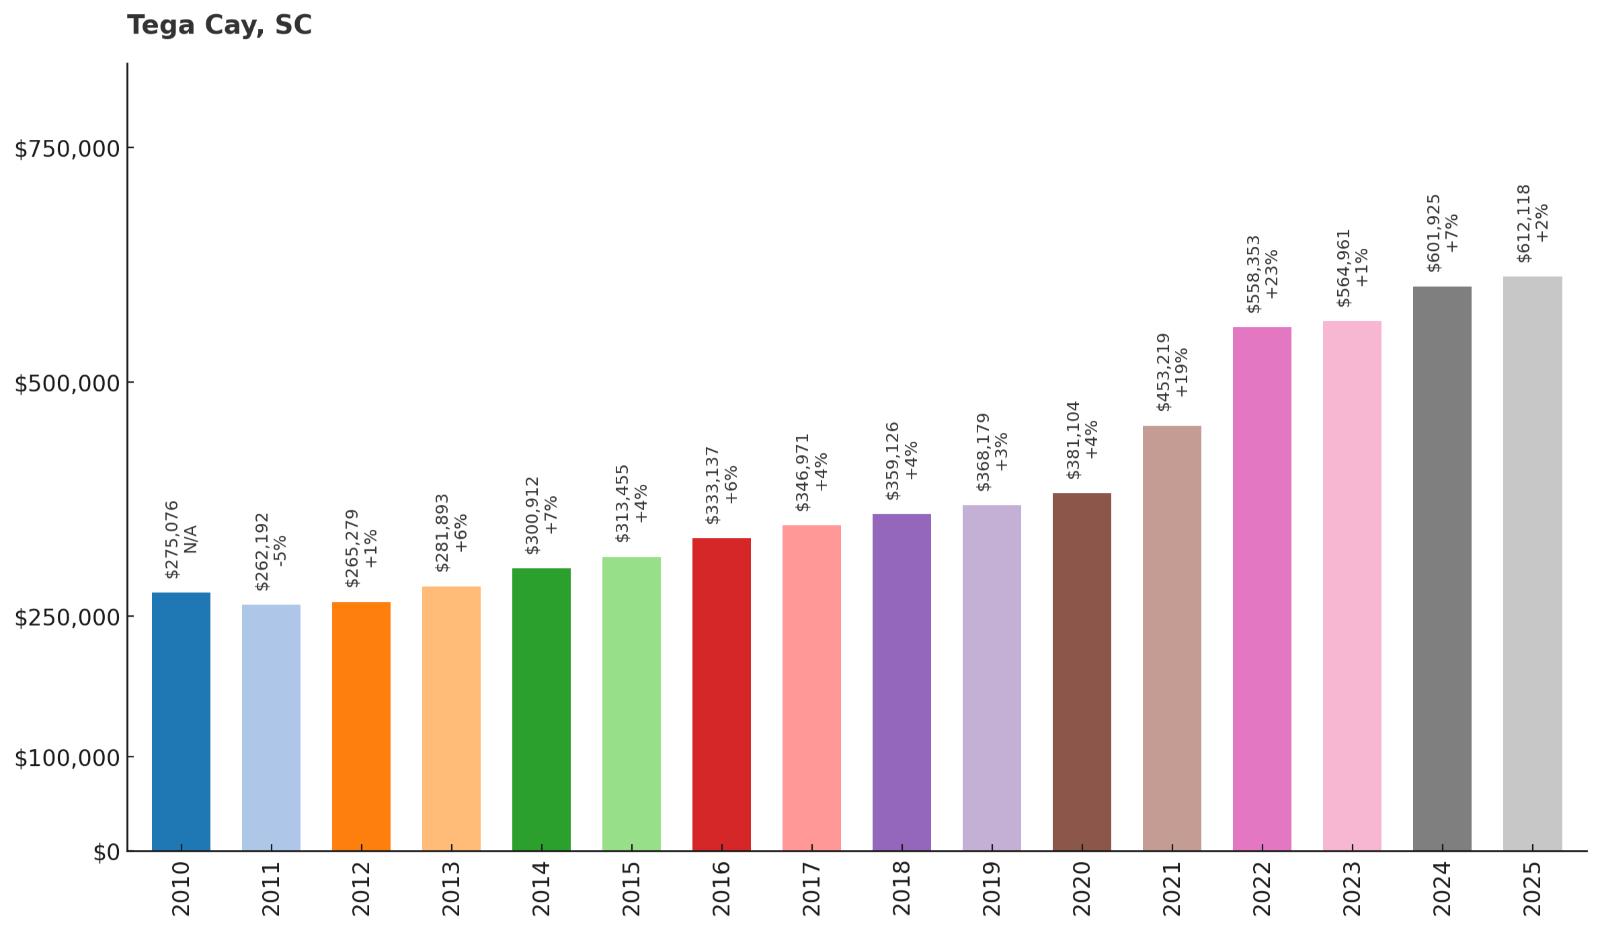
- 2010: $275,076
- 2011: $262,192
- 2012: $265,279
- 2013: $281,893
- 2014: $300,912
- 2015: $313,455
- 2016: $333,137
- 2017: $346,971
- 2018: $359,126
- 2019: $368,179
- 2020: $381,104
- 2021: $453,219
- 2022: $558,353
- 2023: $564,961
- 2024: $601,925
- 2025: $612,118
Tega Cay’s median has climbed 123% since 2010, now above $612,000. Lake Wylie frontage, parks, and proximity to Charlotte power persistent demand. Momentum stayed strong after 2022 as inventory remained tight and amenities kept expanding.
Why Tega Cay?
🔥 Would you like to save this?
Why are people willing to pay so much to live here? What’s special about it?
Residents get lake access, a city-run golf course, and miles of paths inside one compact community. Neighborhood events and waterfront parks build a strong sense of place. With Charlotte minutes away, the lifestyle and commute line up well.
Families love the schools and the easy-to-use recreation options. Housing spans from townhomes to custom waterfront, widening the buyer base. That variety keeps resale healthy through different market cycles.
How Tega Cay Rose to Prominence
Developed in the late 20th century as a lake resort community, it steadily added services and facilities. The Charlotte boom turned it into a year-round residential destination. Each new amenity reinforced home values and community identity.
Hybrid work and outdoor living trends added fresh demand after 2020. With little spare shoreline, scarcity helped prices hold gains. Tega Cay now ranks among the metro’s most sought-after addresses.
3 Interesting Tidbits
1. Peninsula City – Much of town sits on a scenic finger of land into Lake Wylie.
2. City Recreation – The municipality itself runs robust parks and programs.
3. Golf Cart Culture – Short hops to parks and docks often happen on four wheels.
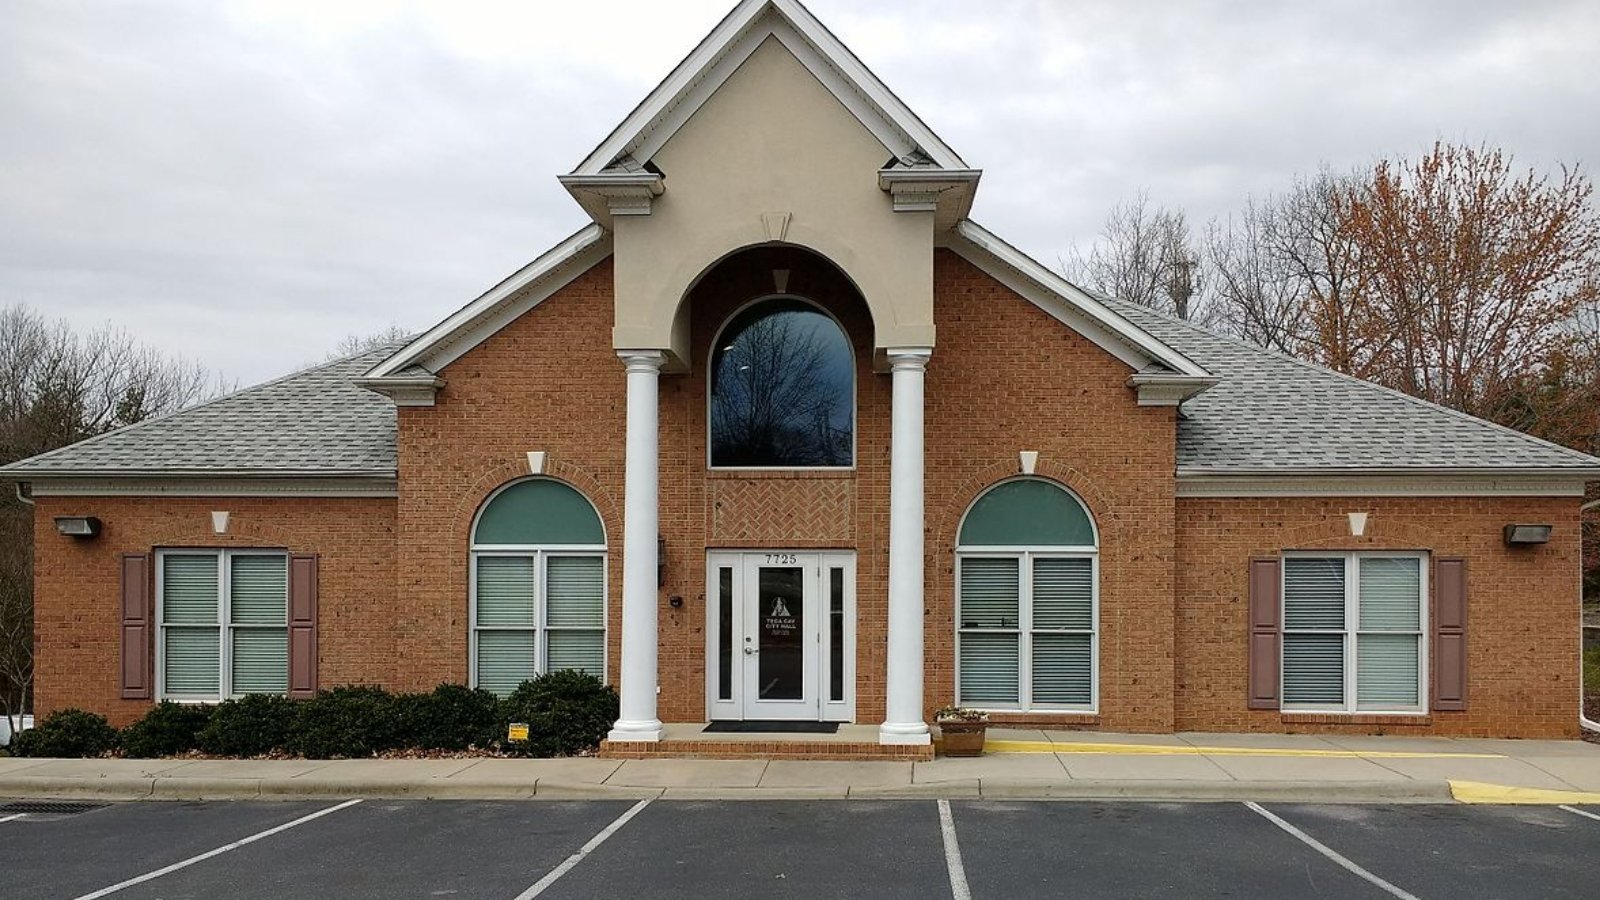
13. Wadmalaw Island – 154% Home Price Increase Since 2010
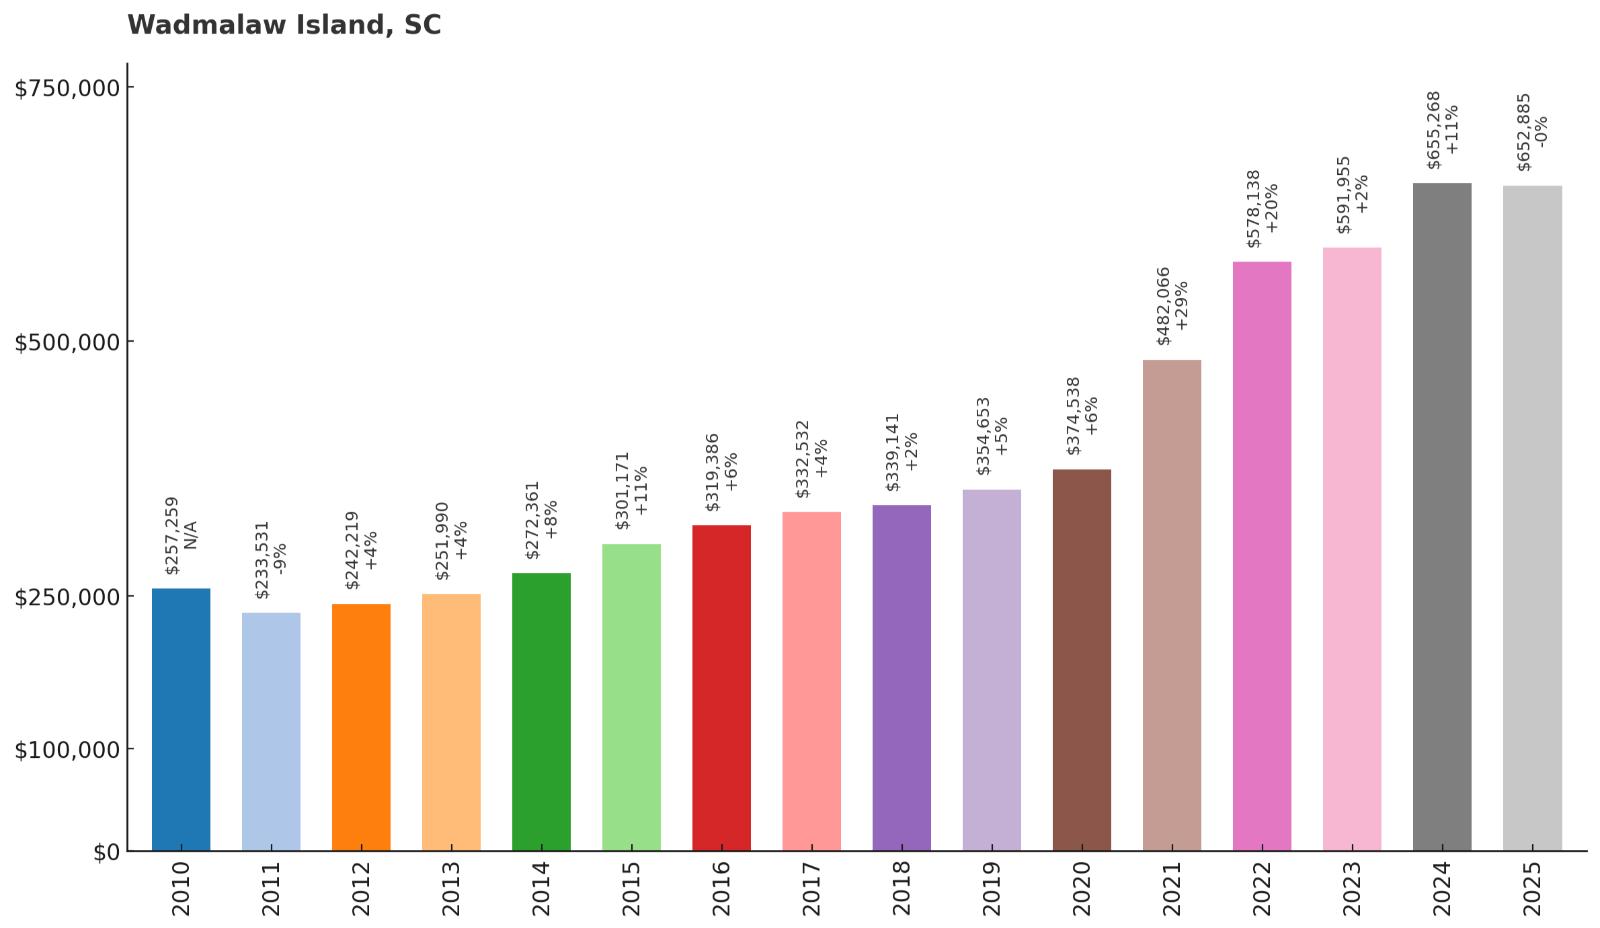
- 2010: $257,259
- 2011: $233,531
- 2012: $242,219
- 2013: $251,990
- 2014: $272,361
- 2015: $301,171
- 2016: $319,386
- 2017: $332,532
- 2018: $339,141
- 2019: $354,653
- 2020: $374,538
- 2021: $482,066
- 2022: $578,138
- 2023: $591,955
- 2024: $655,268
- 2025: $652,885
Wadmalaw Island’s median has climbed 154% since 2010, with values holding near record territory. The pattern reflects strong demand for large tracts and deep-river frontage within reach of Charleston. With scarce inventory and a preservation mindset, prices have real support.
Why Wadmalaw Island?
Why are people willing to pay so much to live here? What’s special about it?
Buyers pay for space—oaks, fields, and water—rather than subdivision amenities. The setting feels pastoral yet remains close to restaurants and services on neighboring Johns Island. Waterfront parcels offer docks to quiet creeks that feel a world away.
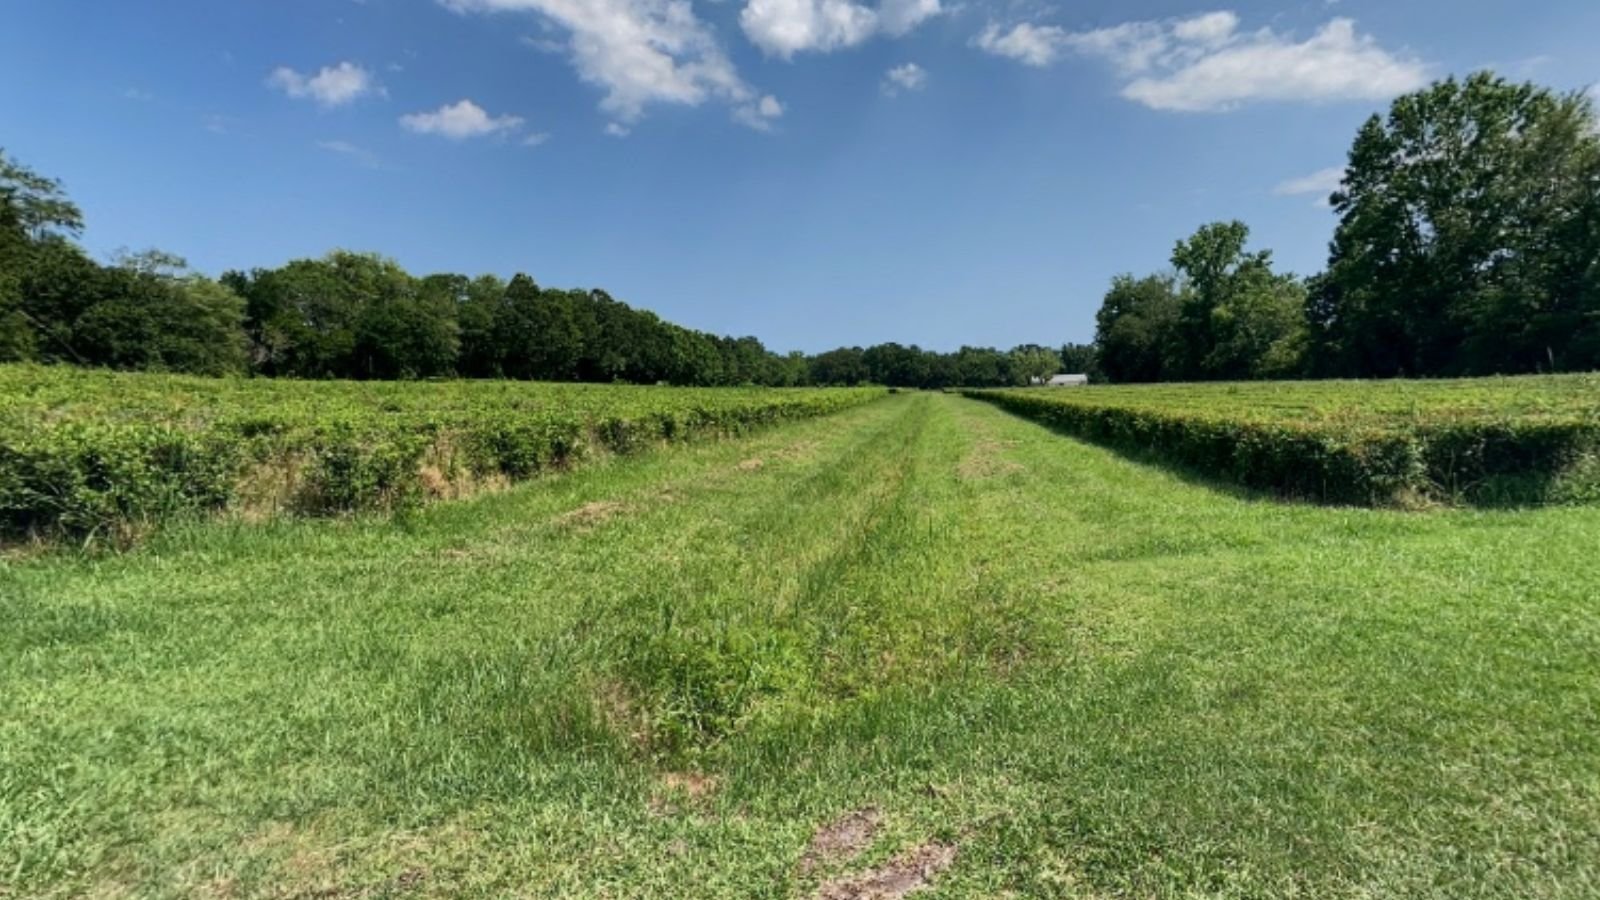
Vineyards, tea fields, and small farms add texture to the landscape. Even routine drives unfold under tree tunnels and marsh vistas. For many, that daily beauty is the value proposition.
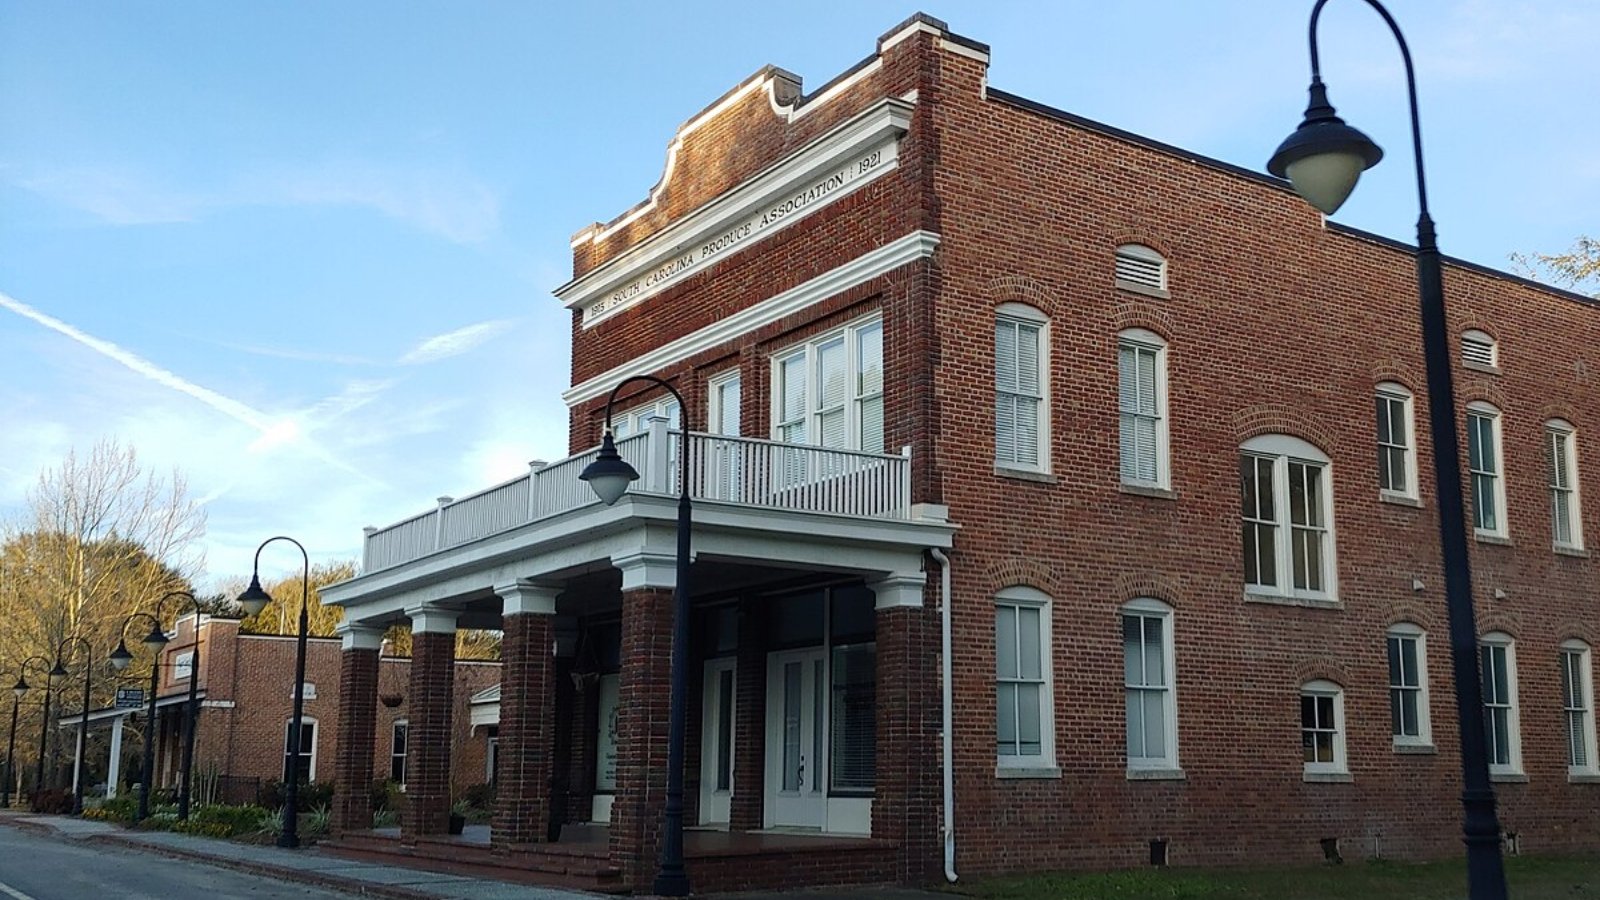
How Wadmalaw Island Rose to Prominence
Agriculture dominated for generations, slowing dense residential growth. As Charleston expanded, those seeking privacy and acreage looked to Wadmalaw. Post-2020 demand for land and water access magnified that trend.
Conservation easements and low density preserved the island’s feel. With limited lots coming to market, upward pressure on prices persisted. The island reads premium because it remains rare.
3 Interesting Tidbits
1. Charleston Tea Garden – America’s only large-scale tea plantation grows here.
2. Winery Stops – Local vineyards pair tasting rooms with sweeping views.
3. Tree Tunnels – Live oaks arch across winding island roads.
12. Meggett – 139% Home Price Increase Since 2010

- 2010: $307,569
- 2011: $289,106
- 2012: $285,948
- 2013: $305,231
- 2014: $316,791
- 2015: $345,010
- 2016: $355,101
- 2017: $378,629
- 2018: $394,650
- 2019: $409,771
- 2020: $428,708
- 2021: $539,553
- 2022: $671,986
- 2023: $683,740
- 2024: $722,628
- 2025: $736,387
Meggett’s median has grown 139% since 2010, crossing $736,000 in 2025. The town’s identity—big lots, tidal views, and quiet lanes—commands a premium. Gains since 2021 show how sustained the shift toward low-density coastal living has become.
Why Meggett?
Why are people willing to pay so much to live here? What’s special about it?
Sprawling parcels and marsh panoramas make homes feel like private retreats. Boaters and paddlers love the short hop to Wadmalaw Sound and Stono River. The vibe is unhurried but within an easy drive of West Ashley and Johns Island services.
Buyers appreciate a mix of custom builds and cottages tucked among pines. Night skies are dark, and morning coffee often comes with heron flyovers. Many shoppers are willing to pay for that daily calm.
How Meggett Rose to Prominence
Historically rural, Meggett saw limited subdivision activity compared with nearby suburbs. As land closer to Charleston grew scarce, attention shifted here. The pandemic era reinforced demand for privacy and water access.
Municipal focus on conservation and low intensity kept supply constrained. With each sale setting a new comp, values stair-stepped higher. Meggett now stands out as a quiet luxury pocket.
3 Interesting Tidbits
1. Edisto Gateway – It’s a scenic midway point toward the ACE Basin and Edisto.
2. Birds Everywhere – Egrets, spoonbills, and osprey are regular neighbors.
3. Rural By Design – Local policy favors low density and open vistas.
11. Edisto Beach – 142% Home Price Increase Since 2010
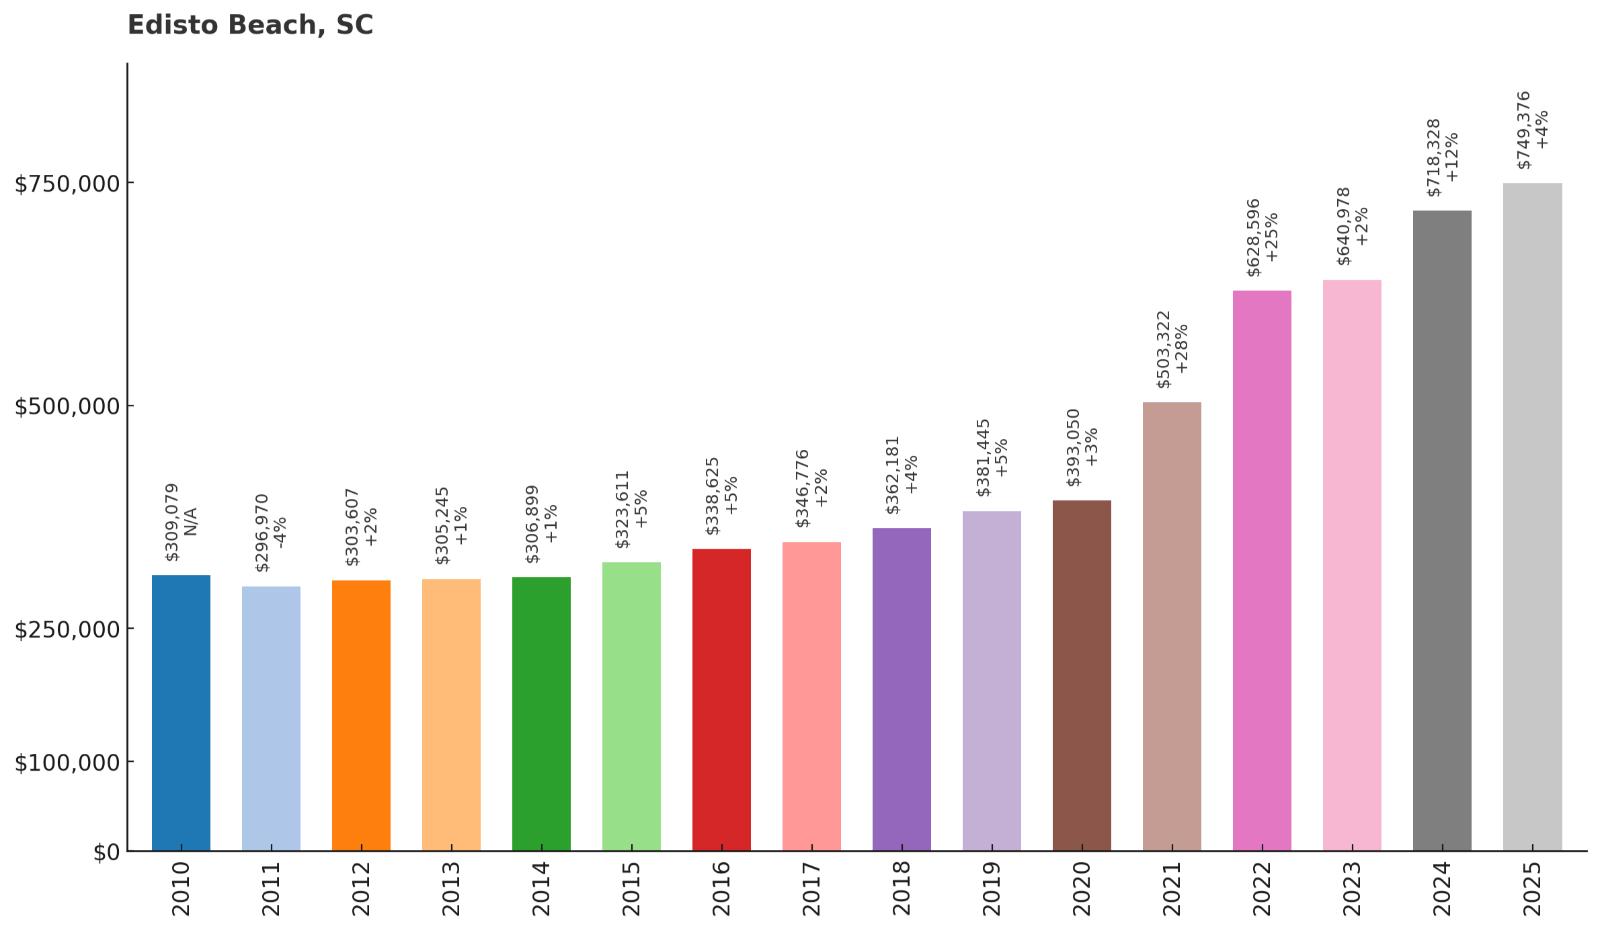
- 2010: $309,079
- 2011: $296,970
- 2012: $303,607
- 2013: $305,245
- 2014: $306,899
- 2015: $323,611
- 2016: $338,625
- 2017: $346,776
- 2018: $362,181
- 2019: $381,445
- 2020: $393,050
- 2021: $503,322
- 2022: $628,596
- 2023: $640,978
- 2024: $718,328
- 2025: $749,376
Edisto Beach’s median value has climbed 142% since 2010, reaching about $749,000. Prices surged after 2020 as buyers looked for small-town beach life without high-rise bustle. Continued gains in 2024–2025 show the appeal is enduring.
Why Edisto Beach?
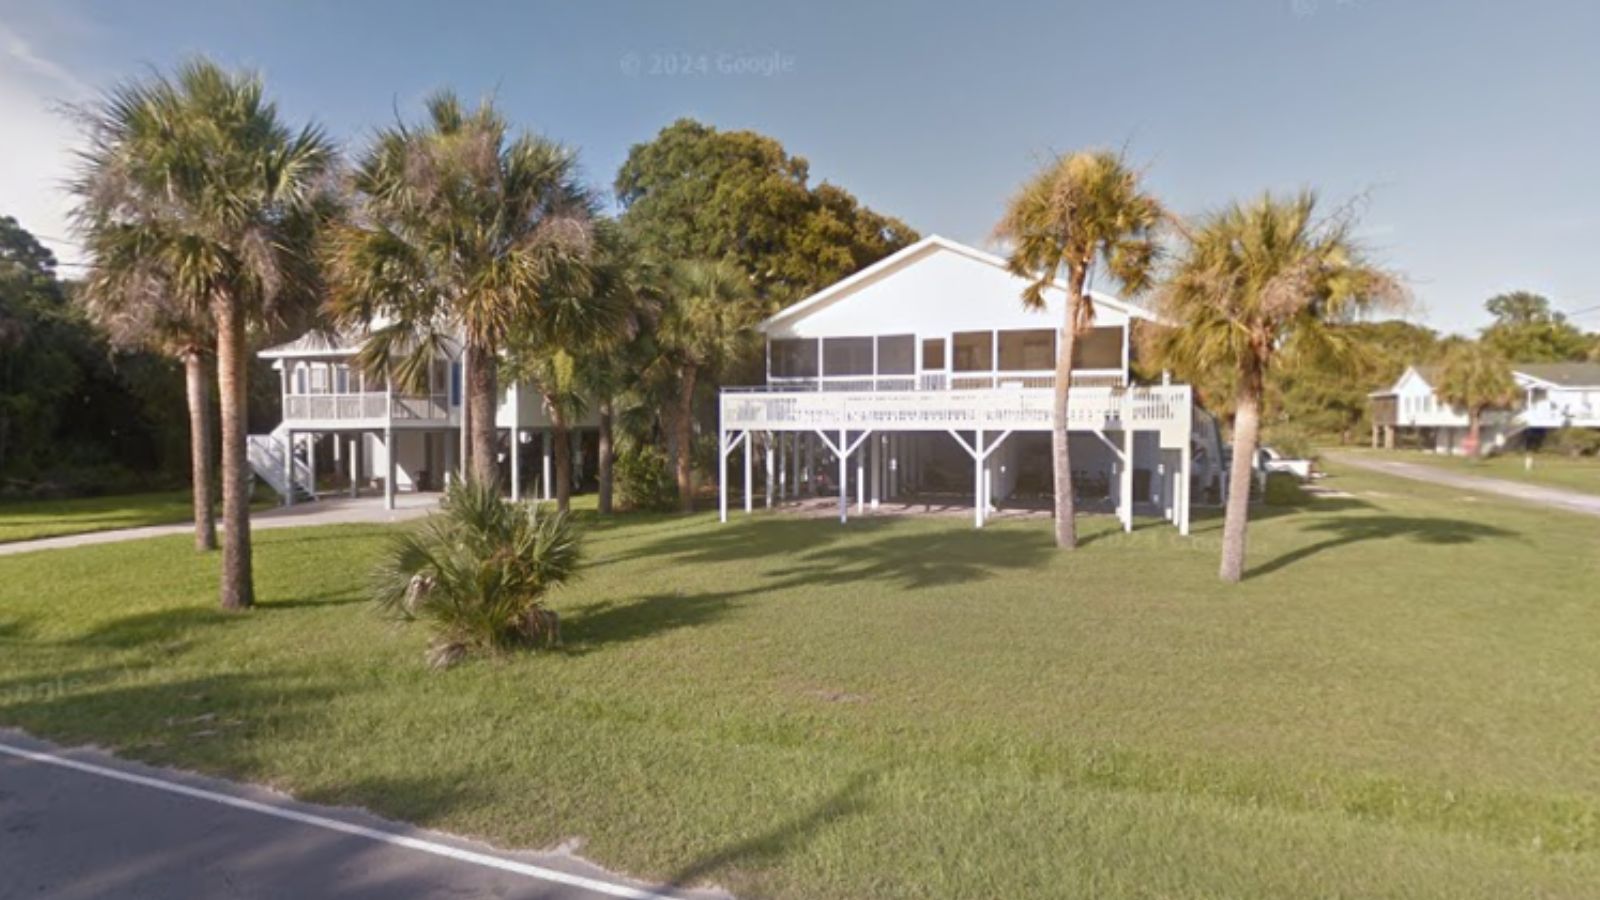
Why are people willing to pay so much to live here? What’s special about it?
No neon, no boardwalk rides—just dunes, shells, and family porches that face the Atlantic. The town’s scale stays manageable, which preserves the relaxed rhythm people come to find. Golf, bike paths, and state-park trails add simple, daily recreation.
Homes range from classic stilt cottages to updated oceanfront with sweeping decks. It’s a place where summer weeks stretch long and winters feel gentle. Paying more buys a quieter version of the beach dream.
How Edisto Beach Rose to Prominence
Limited commercial development kept supply tight while the broader coast developed. Word-of-mouth and repeat vacationers turned into long-term owners. The post-2020 remote wave made spending more time here feasible.
With few lots and strict height limits, scarcity did the rest. Recent sales set new benchmarks as demand outpaced listings. The beach that stayed small became highly prized.
3 Interesting Tidbits
1. Shelling Heaven – Morning walks often fill a bag.
2. Botany Bay – A preserved plantation landscape offers striking “boneyard” beaches.
3. Turtle Season – Volunteer groups mark and monitor nests all summer.
10. Hilton Head Island – 101% Home Price Increase Since 2010
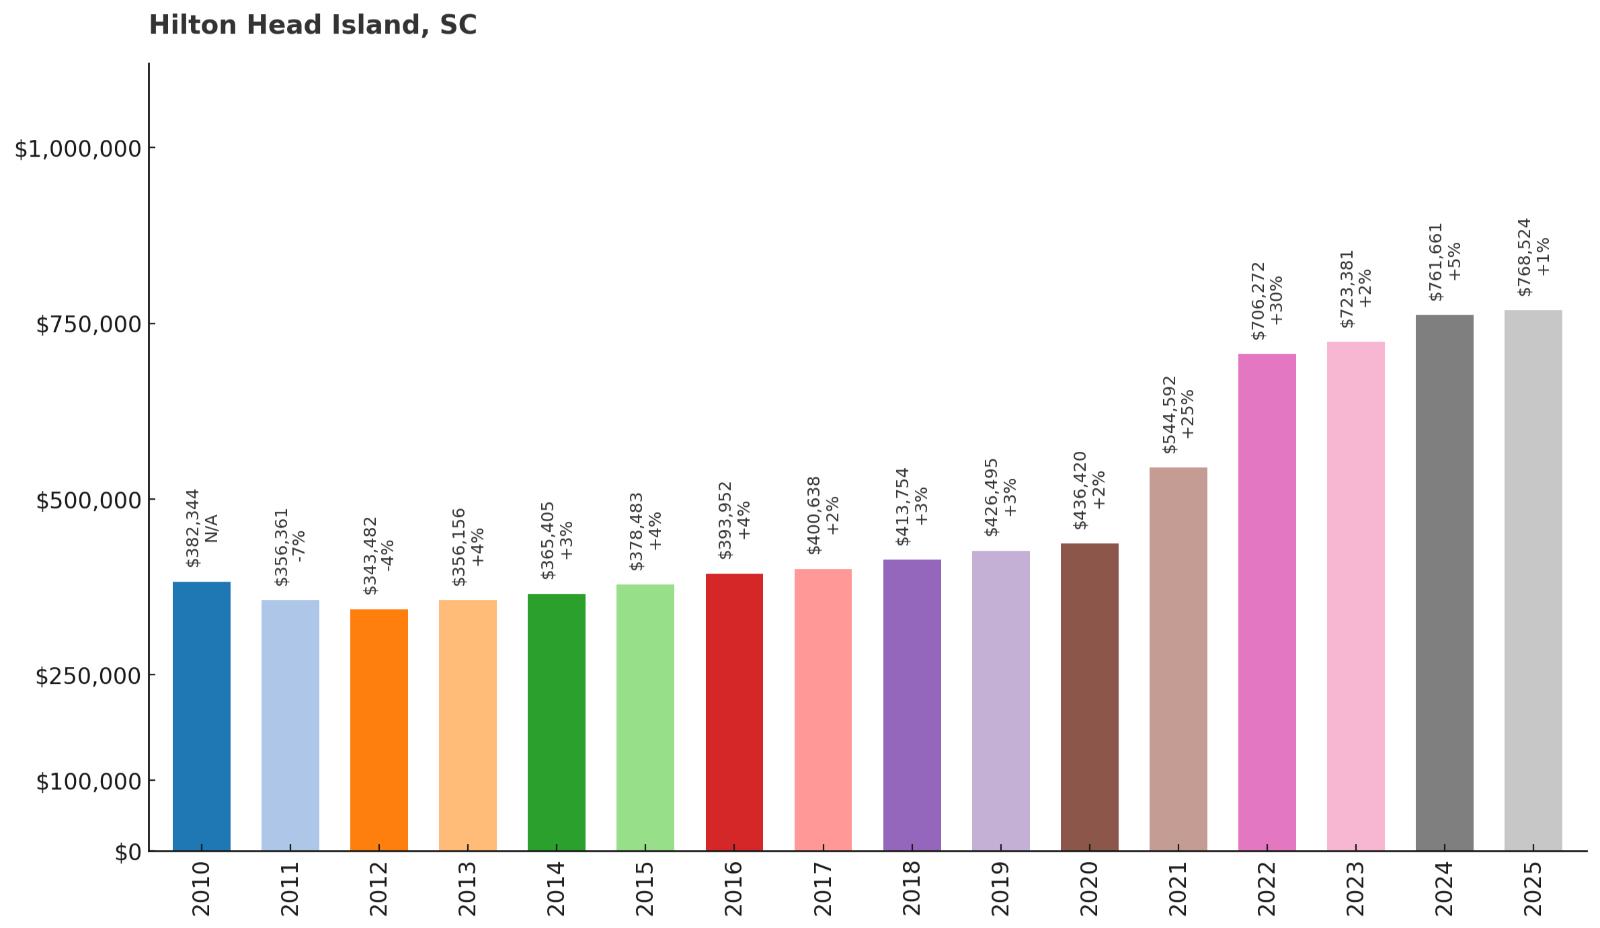
- 2010: $382,344
- 2011: $356,361
- 2012: $343,482
- 2013: $356,156
- 2014: $365,405
- 2015: $378,483
- 2016: $393,952
- 2017: $400,638
- 2018: $413,754
- 2019: $426,495
- 2020: $436,420
- 2021: $544,592
- 2022: $706,272
- 2023: $723,381
- 2024: $761,661
- 2025: $768,524
Hilton Head’s median has doubled since 2010, now near $769,000. The island’s brand—golf, beaches, and bike paths—remains one of the strongest in the Southeast. Post-2020 demand from relocators and second-home buyers pushed values into a higher range.
Why Hilton Head Island?
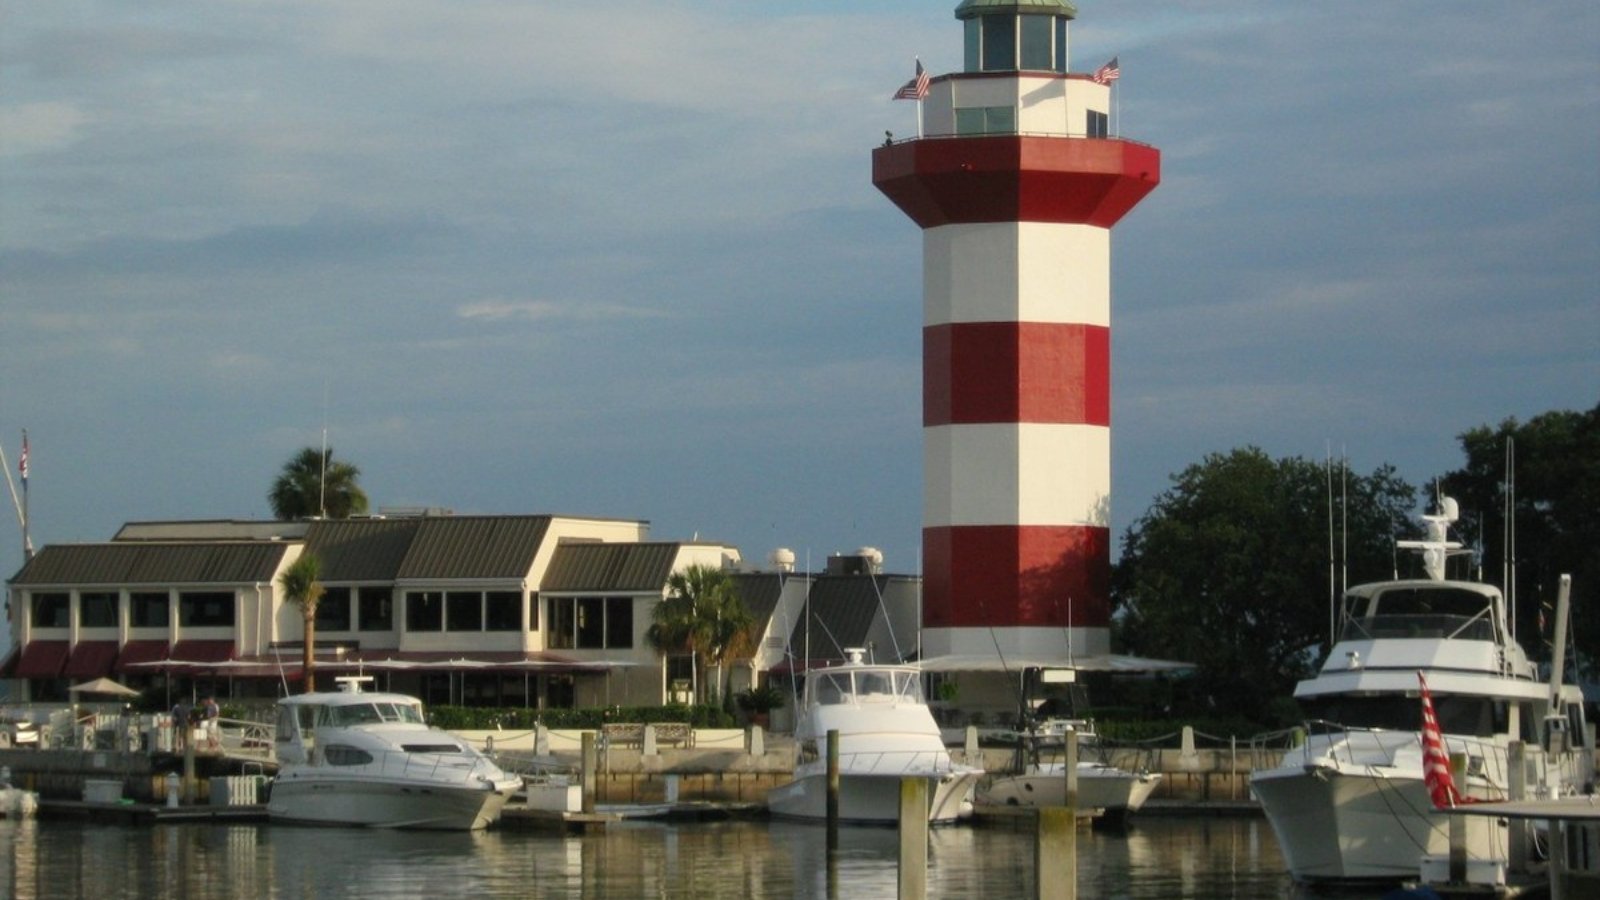
Why are people willing to pay so much to live here? What’s special about it?
Pristine beaches, miles of trails, and master-planned resorts create a turnkey coastal lifestyle. Top courses, marinas, and restaurants make every weekend feel special. Neighborhoods span gated enclaves to mid-island cottages, covering many tastes.
Healthcare, airports, and services are unusually robust for a barrier island. Seasonal energy arrives without sacrificing off-season calm. Buyers pay for consistency, amenities, and a polished experience.
How Hilton Head Island Rose to Prominence
Sea Pines and early resort planning set a high bar for design and conservation. As the model proved out, other plantations followed and strengthened the offering. Marketing and tournaments built national recognition through the 1980s and 1990s.
In the 2010s and 2020s, remote work and retiring boomers expanded the audience. Limited space and rising construction costs supported higher comps. The island’s reputation keeps the demand pipeline full.
3 Interesting Tidbits
1. Bike Culture – Over 60 miles of paths connect beaches, shops, and parks.
2. RBC Heritage – The PGA Tour stop puts Harbour Town on global TV each spring.
3. Sea Turtle Stewards – Nesting season brings community-wide protection efforts.
9. Awendaw – 184% Home Price Increase Since 2010
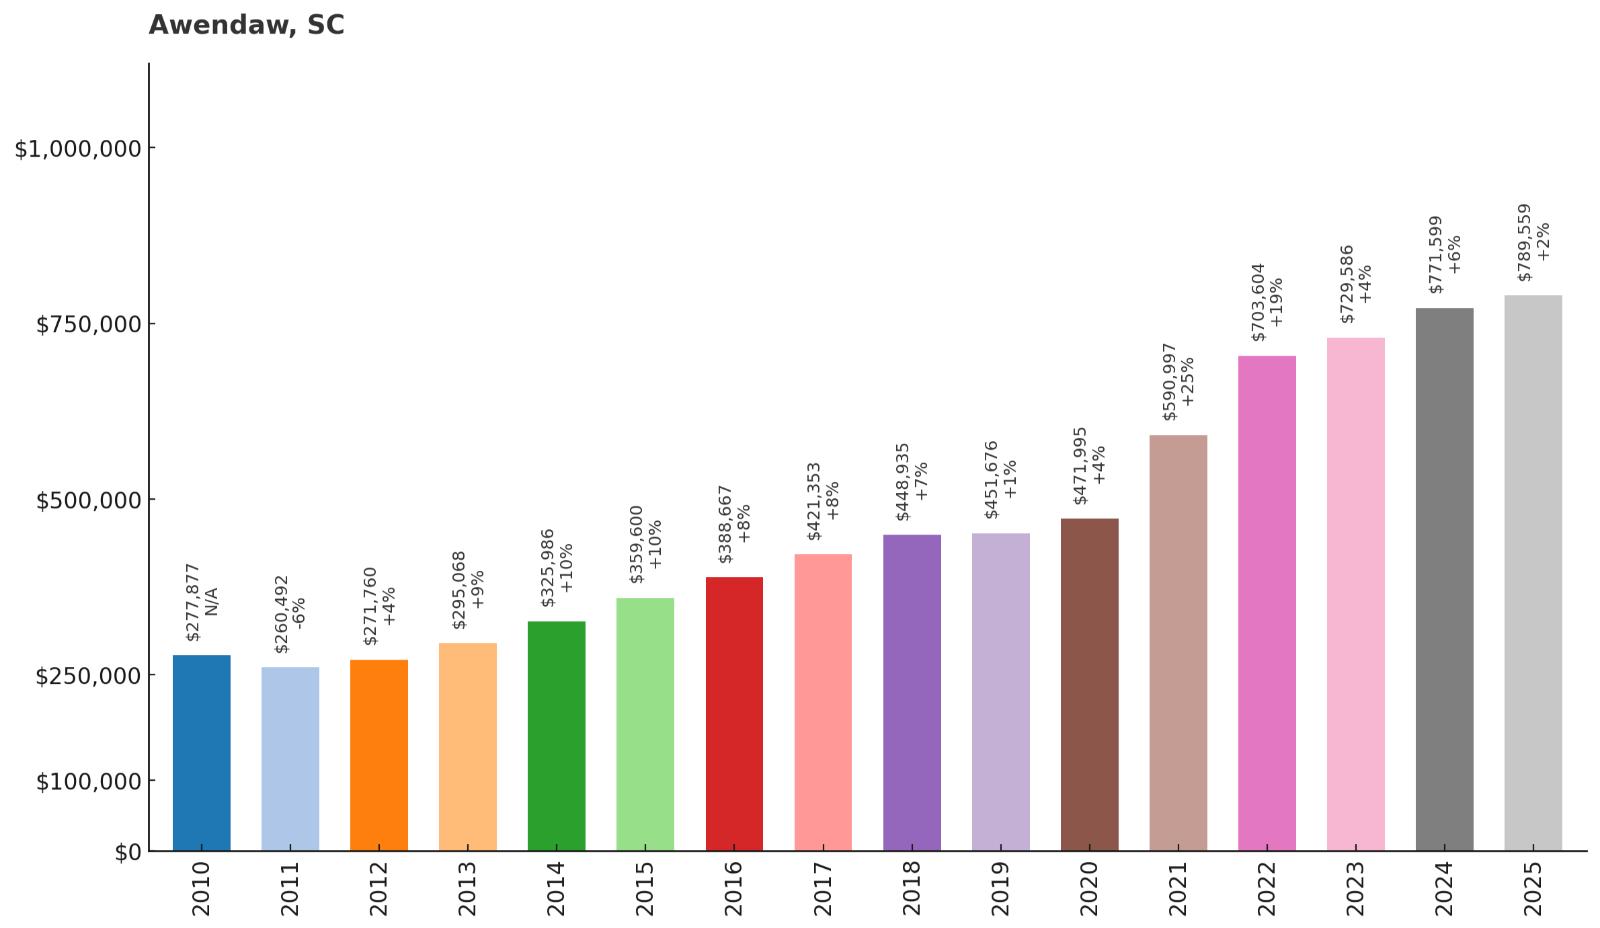
- 2010: $277,877
- 2011: $260,492
- 2012: $271,760
- 2013: $295,068
- 2014: $325,986
- 2015: $359,600
- 2016: $388,667
- 2017: $421,353
- 2018: $448,935
- 2019: $451,676
- 2020: $471,995
- 2021: $590,997
- 2022: $703,604
- 2023: $729,586
- 2024: $771,599
- 2025: $789,559
Awendaw’s median has soared 184% since 2010, nearing $790,000. The combination of forest, waterways, and proximity to Mount Pleasant is magnetic. Values have climbed steadily as more buyers discover this stretch of the coast.
Why Awendaw?
Why are people willing to pay so much to live here? What’s special about it?
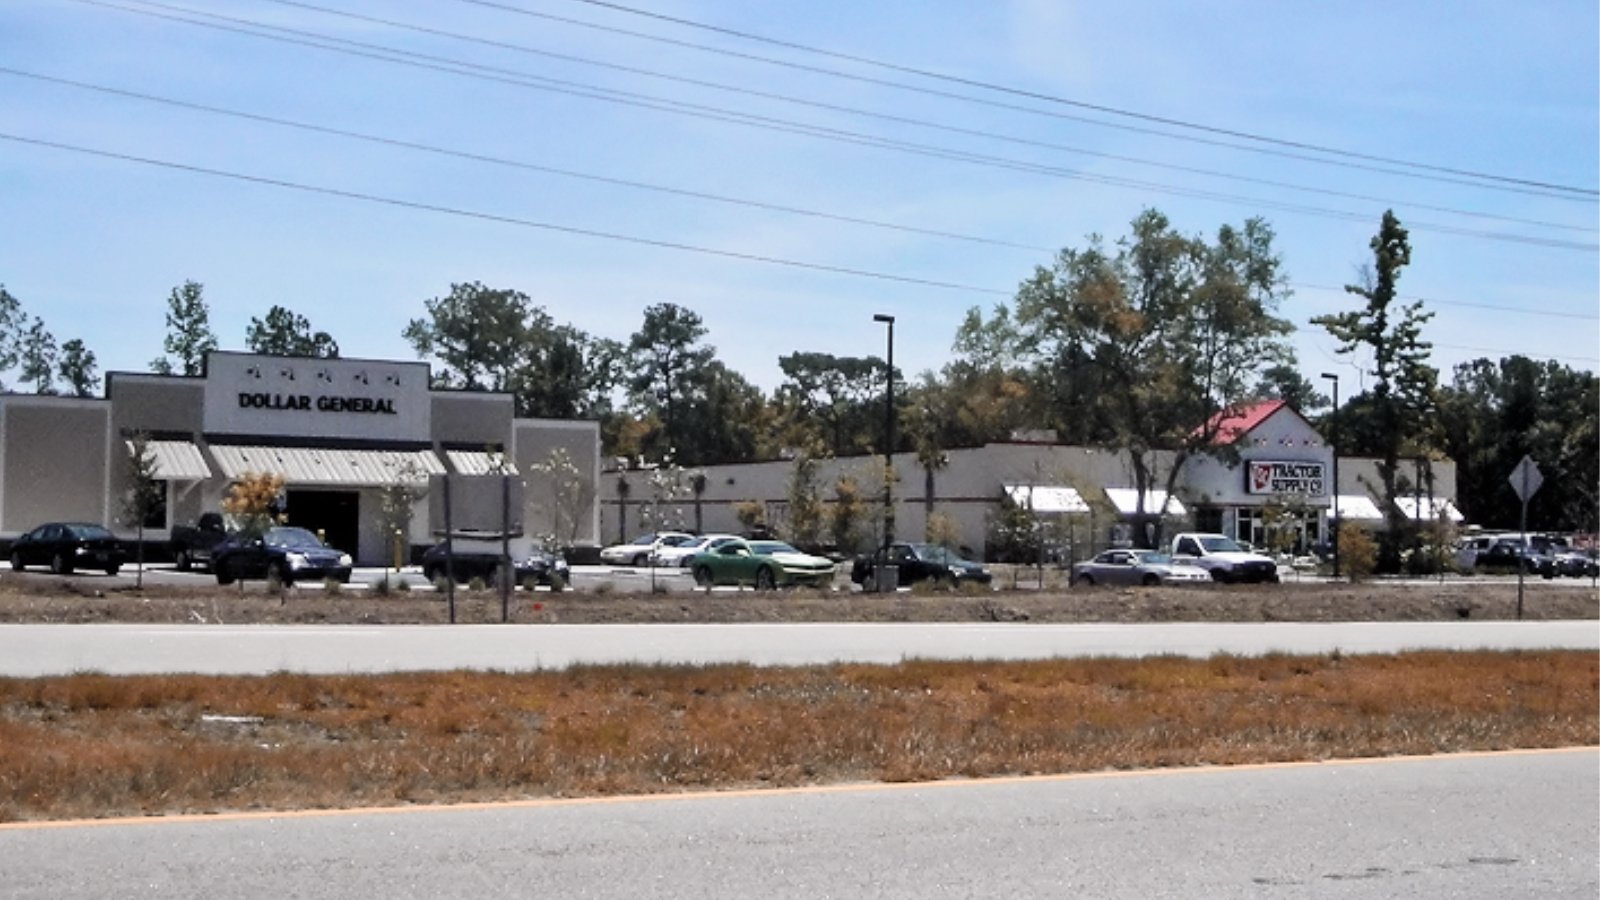
Francis Marion National Forest meets the Intracoastal Waterway in Awendaw’s backyard. Trails, creeks, and quiet marshes make outdoor time effortless. Buyers also like the straightforward drive to Mount Pleasant’s shopping and schools.
Homes on acreage and custom builds dominate, limiting cookie-cutter feel. Night skies, bird calls, and long horizons set the tone. People pay for that blend of wild and convenient.
How Awendaw Rose to Prominence
For years, Awendaw sat between growth nodes and kept a rural posture. As Mount Pleasant matured, the next wave looked just beyond the line. New demand arrived without large-scale subdivision pressure.
Post-2020 lifestyle shifts emphasized space, nature, and flexibility. With supply thin, each sale nudged prices higher. The town has become a definition of Lowcountry serenity.
3 Interesting Tidbits
1. Bulls Bay – Oyster roasts and old-school Lowcountry flavors thrive here.
2. Palmetto Trail – Segments of the statewide path pass nearby.
3. Rookery Views – Wading birds flock to local impoundments at dusk.
8. Mount Pleasant – 185% Home Price Increase Since 2010
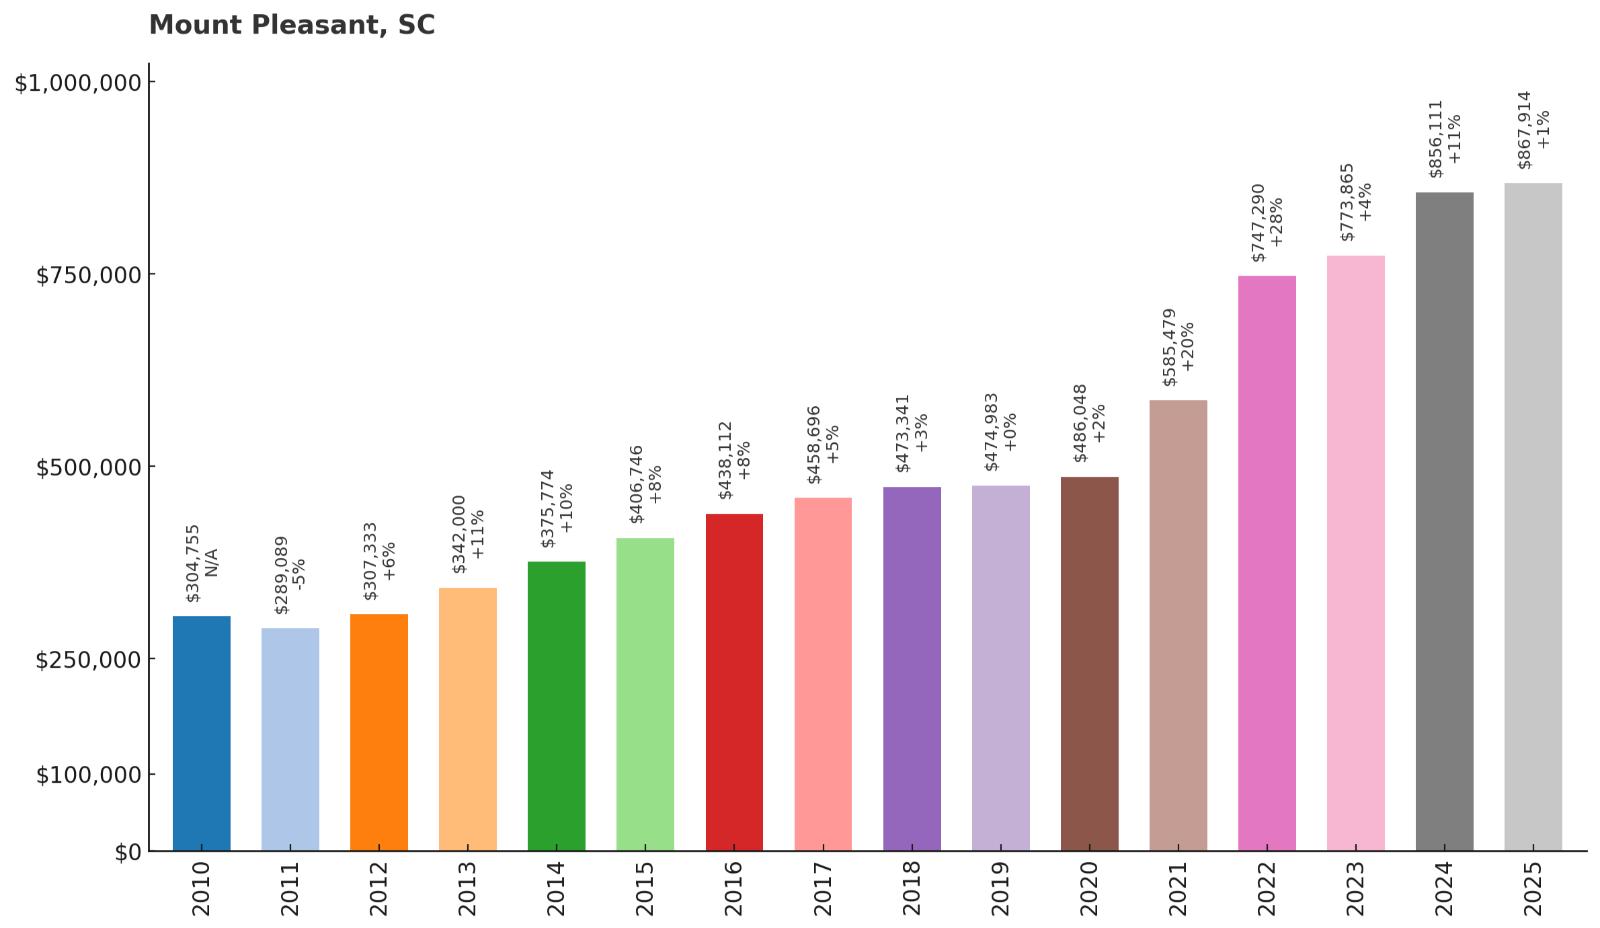
- 2010: $304,755
- 2011: $289,089
- 2012: $307,333
- 2013: $342,000
- 2014: $375,774
- 2015: $406,746
- 2016: $438,112
- 2017: $458,696
- 2018: $473,341
- 2019: $474,983
- 2020: $486,048
- 2021: $585,479
- 2022: $747,290
- 2023: $773,865
- 2024: $856,111
- 2025: $867,914
Mount Pleasant’s median has rocketed 185% since 2010, now around $868,000. School strength, shopping, and beach proximity keep demand elevated. Continued appreciation through 2025 shows how tight supply remains east of the Cooper.
Why Mount Pleasant?
Why are people willing to pay so much to live here? What’s special about it?
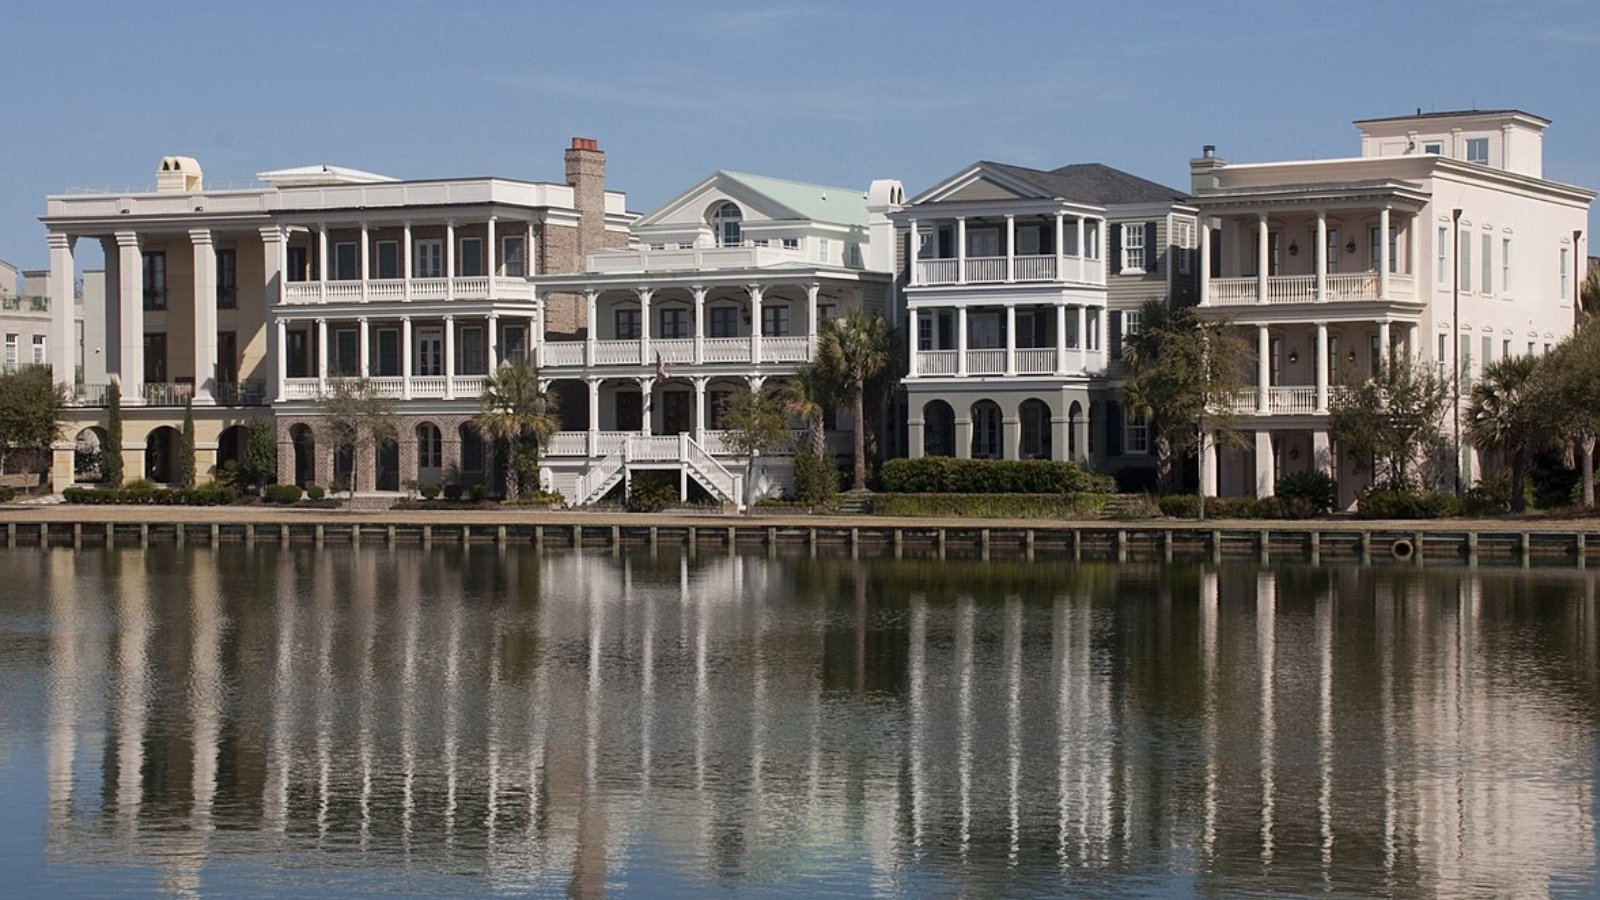
Beach days at Sullivan’s or Isle of Palms start with a short drive over the bridges. Shem Creek restaurants, waterfront parks, and extensive trails make everyday life feel coastal. Neighborhoods run from historic Old Village to modern master-planned options.
Families and professionals value quick access to Charleston and top-tier amenities at home. Healthcare, retail, and schools all sit within a tight radius. Buyers pay a premium to shorten drives and lengthen beach time.
How Mount Pleasant Rose to Prominence
Growth took off after the Ravenel Bridge reset regional access. Residential and retail investment followed rapidly through the 2010s. The town added parks and paths that anchored its brand.
Post-2020 relocations amplified the national spotlight on the area. With land limited, infill and renovation carried prices higher. Mount Pleasant now defines high-demand suburban coastal living.
3 Interesting Tidbits
1. Shem Creek Sunsets – Boardwalk views mix shrimp boats and dolphin sightings.
2. Old Village Charm – Live oaks and front porches sit steps from the harbor.
3. Bridge Icon – The Arthur Ravenel Jr. Bridge frames the skyline and hosts a massive run.
7. Seabrook Island – 108% Home Price Increase Since 2010
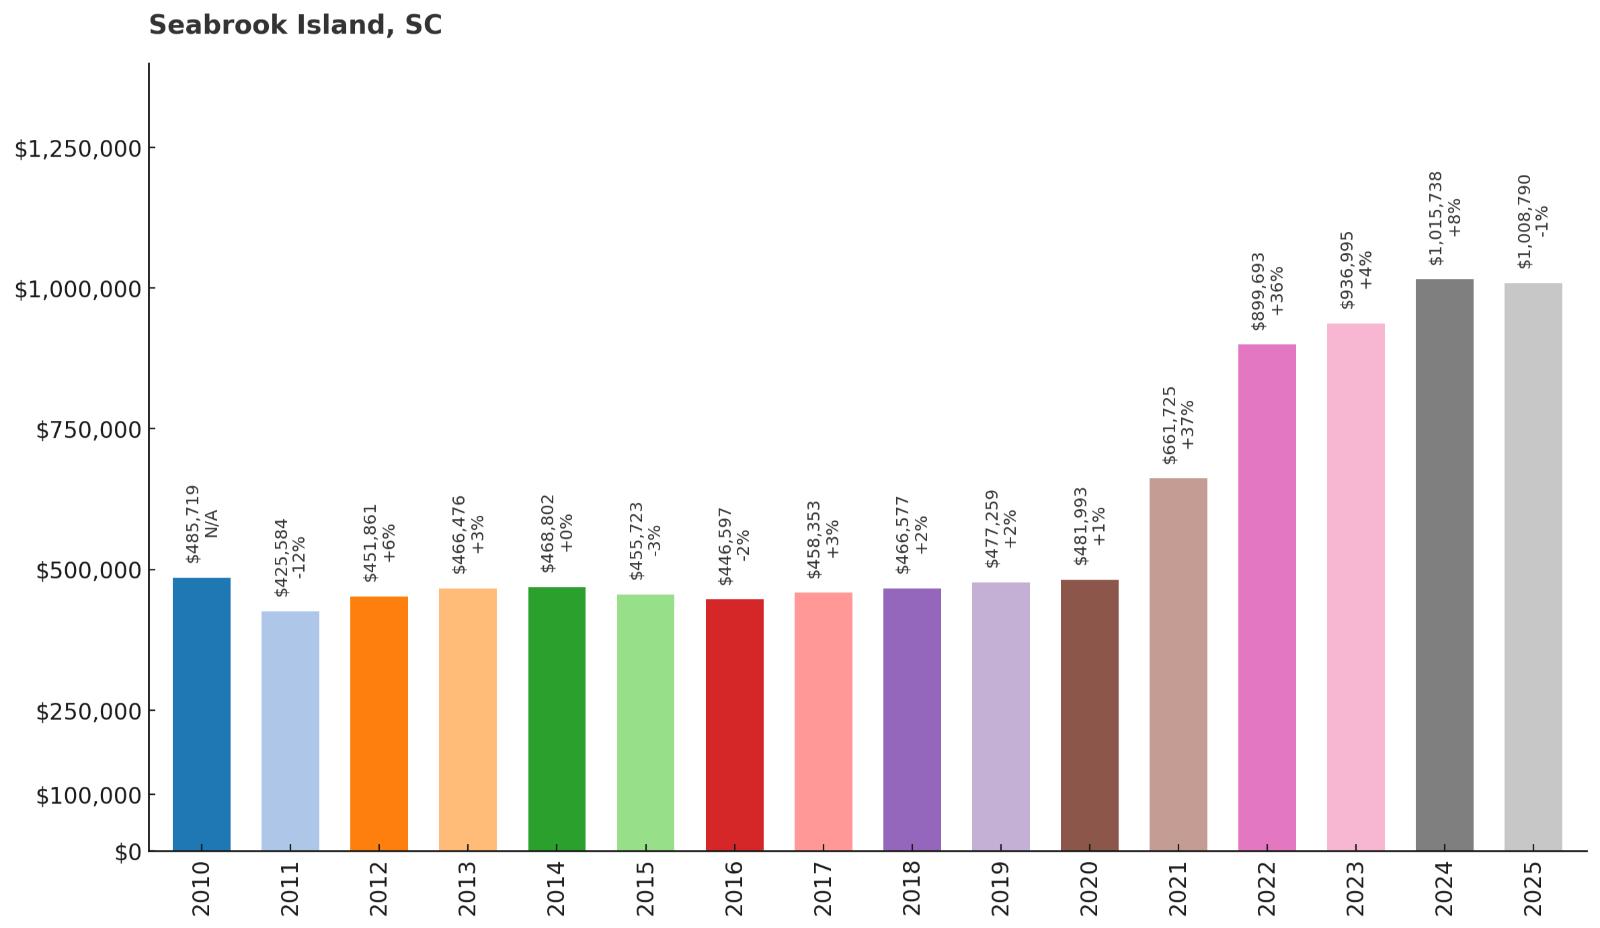
- 2010: $485,719
- 2011: $425,584
- 2012: $451,861
- 2013: $466,476
- 2014: $468,802
- 2015: $455,723
- 2016: $446,597
- 2017: $458,353
- 2018: $466,577
- 2019: $477,259
- 2020: $481,993
- 2021: $661,725
- 2022: $899,693
- 2023: $936,995
- 2024: $1,015,738
- 2025: $1,008,790
Seabrook Island’s median has climbed 108% since 2010, sitting near $1.01 million in 2025. The jump since 2021 reflects a strong appetite for private, amenity-rich coastal communities. Even with a slight 2025 dip, values remain well above pre-pandemic levels.
Why Seabrook Island?
Why are people willing to pay so much to live here? What’s special about it?
Gated serenity, oceanfront dunes, and miles of bikeable roads set the tone. Two championship golf courses, an equestrian center, and club amenities elevate daily life. Dolphins often strand-feed along nearby beaches, giving residents front-row nature moments.
Homes range from villas to oceanfront estates with sweeping marsh views. Services on island and at neighboring Kiawah keep errands easy. Buyers pay for privacy, polish, and pristine natural settings.
How Seabrook Island Rose to Prominence
Developed with a preservation-first mindset, Seabrook kept density low and green space high. As Charleston’s popularity exploded, private coastal enclaves gained attention. The post-2020 era brought more second-home and full-time residents alike.
With limited buildable land, comps rose with each premium sale. Amenity investment reinforced the value proposition. Today’s pricing reflects both scarcity and a refined coastal product.
3 Interesting Tidbits
1. Dolphin Watch – Strand-feeding sightings are a local signature.
2. Horseback on the Beach – Few coastal towns can match that experience.
3. Turtle Patrol – Volunteers protect nests along wide, quiet sands.
6. Folly Beach – 159% Home Price Increase Since 2010
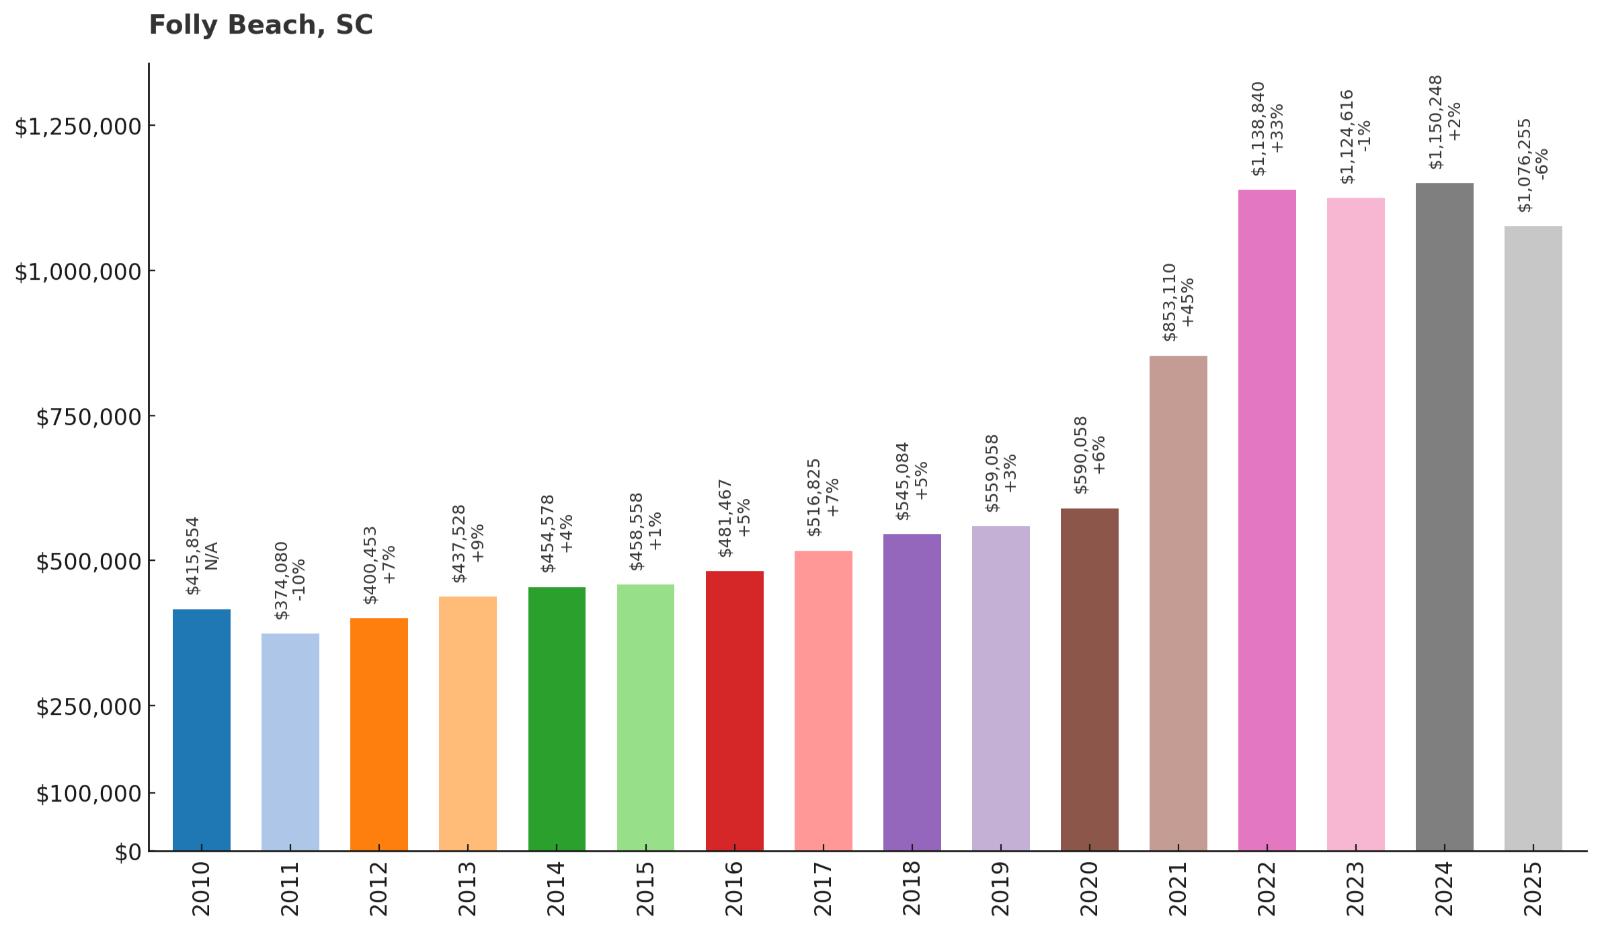
- 2010: $415,854
- 2011: $374,080
- 2012: $400,453
- 2013: $437,528
- 2014: $454,578
- 2015: $458,558
- 2016: $481,467
- 2017: $516,825
- 2018: $545,084
- 2019: $559,058
- 2020: $590,058
- 2021: $853,110
- 2022: $1,138,840
- 2023: $1,124,616
- 2024: $1,150,248
- 2025: $1,076,255
Folly’s median has climbed 159% since 2010, now around $1.08 million. Prices spiked through 2022 as demand for laid-back, surf-friendly beach towns surged. A modest 2025 step down still leaves values far above pre-pandemic marks.
Why Folly Beach?

Why are people willing to pay so much to live here? What’s special about it?
Surf breaks, funky cafes, and a come-as-you-are vibe make Folly unique. The pier anchors the scene, and sunsets at the county park never disappoint. Charleston is close, yet Folly keeps its own identity and rhythm.
Buyers choose between oceanfront, marsh-view, and walkable in-town cottages. Golf carts, bikes, and sandals do much of the transport work. Paying up secures a beach town that still feels wonderfully unpolished.
How Folly Beach Rose to Prominence
Once a classic day-trip beach, Folly matured into a highly coveted year-round community. Short-term rental demand intersected with second-home interest to push values higher. Limited land and a barrier-island setting magnified each new comp.
Post-2020 lifestyle shifts cemented its national appeal. Even with policy changes over time, demand has stayed deep. Folly remains Charleston’s free-spirited oceanfront outpost.
3 Interesting Tidbits
1. Washout Waves – The island’s best-known surf spot draws year-round riders.
2. Morris Island Light – Distant lighthouse silhouettes star in countless sunset photos.
3. Pier Life – Fishing, music, and strolling all converge at the new pier.
5. Sunset – 158% Home Price Increase Since 2010
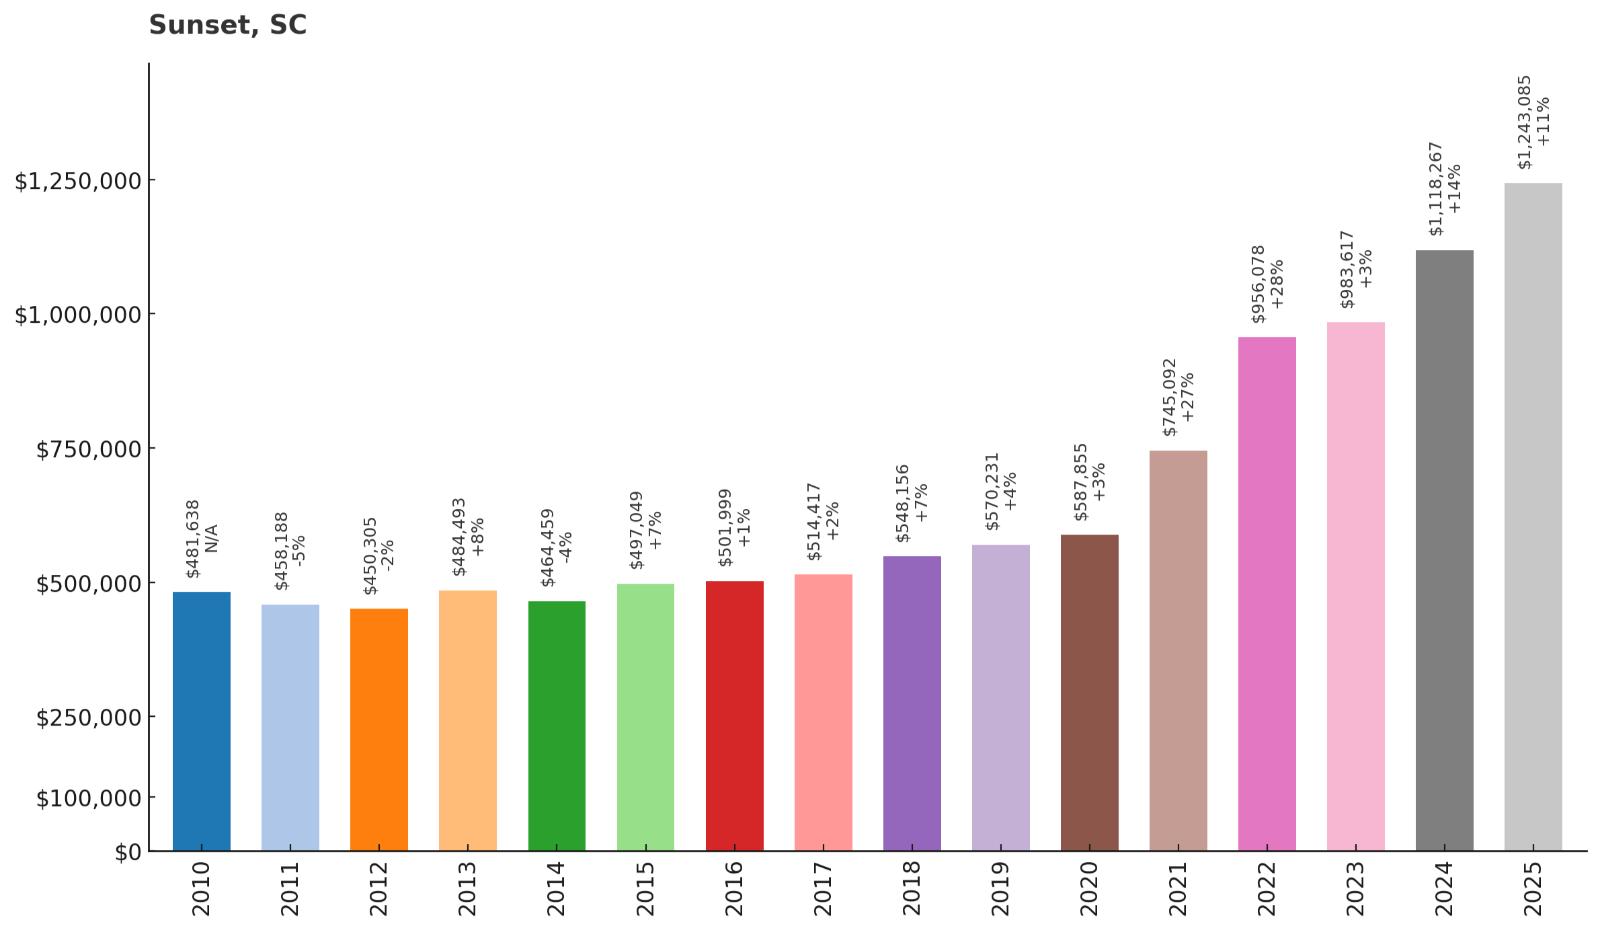
- 2010: $481,638
- 2011: $458,188
- 2012: $450,305
- 2013: $484,493
- 2014: $464,459
- 2015: $497,049
- 2016: $501,999
- 2017: $514,417
- 2018: $548,156
- 2019: $570,231
- 2020: $587,855
- 2021: $745,092
- 2022: $956,078
- 2023: $983,617
- 2024: $1,118,267
- 2025: $1,243,085
Sunset’s median has jumped 158% since 2010, topping $1.24 million in 2025. The town rides the same Lake Keowee wave as its neighbors, with luxury builds and long views. Successive highs since 2021 show persistent top-tier buyer interest.
Why Sunset?
Why are people willing to pay so much to live here? What’s special about it?
Sweeping water and mountain views headline nearly every marketing flyer—and they deliver. High-end communities bring marinas, clubhouses, and trail networks to the shoreline. Buyers pay for the combination of scenery, security, and amenities.
Architectural styles lean custom, with outdoor living spaces that capture sunrise and, yes, sunset. Proximity to Clemson and Greenville keeps travel easy for sports, dining, and flights. It’s resort living with everyday practicality.
How Sunset Rose to Prominence
As Keowee matured, premium enclaves clustered near the best views and coves. Word-of-mouth and club networks drew national buyers. The remote-work era turned weekend houses into primary homes.
Limited waterfront inventory kept bidding competitive at the top end. Each record sale set the stage for the next one. Sunset now ranks among the Upstate’s most exclusive ZIP codes.
3 Interesting Tidbits
1. Long Vistas – Winter air clears views to far ridgelines.
2. Club Culture – Social calendars fill fast with lake and golf events.
3. Dock Days – Afternoons slide by with music and friends on the water.
4. Isle of Palms – 164% Home Price Increase Since 2010
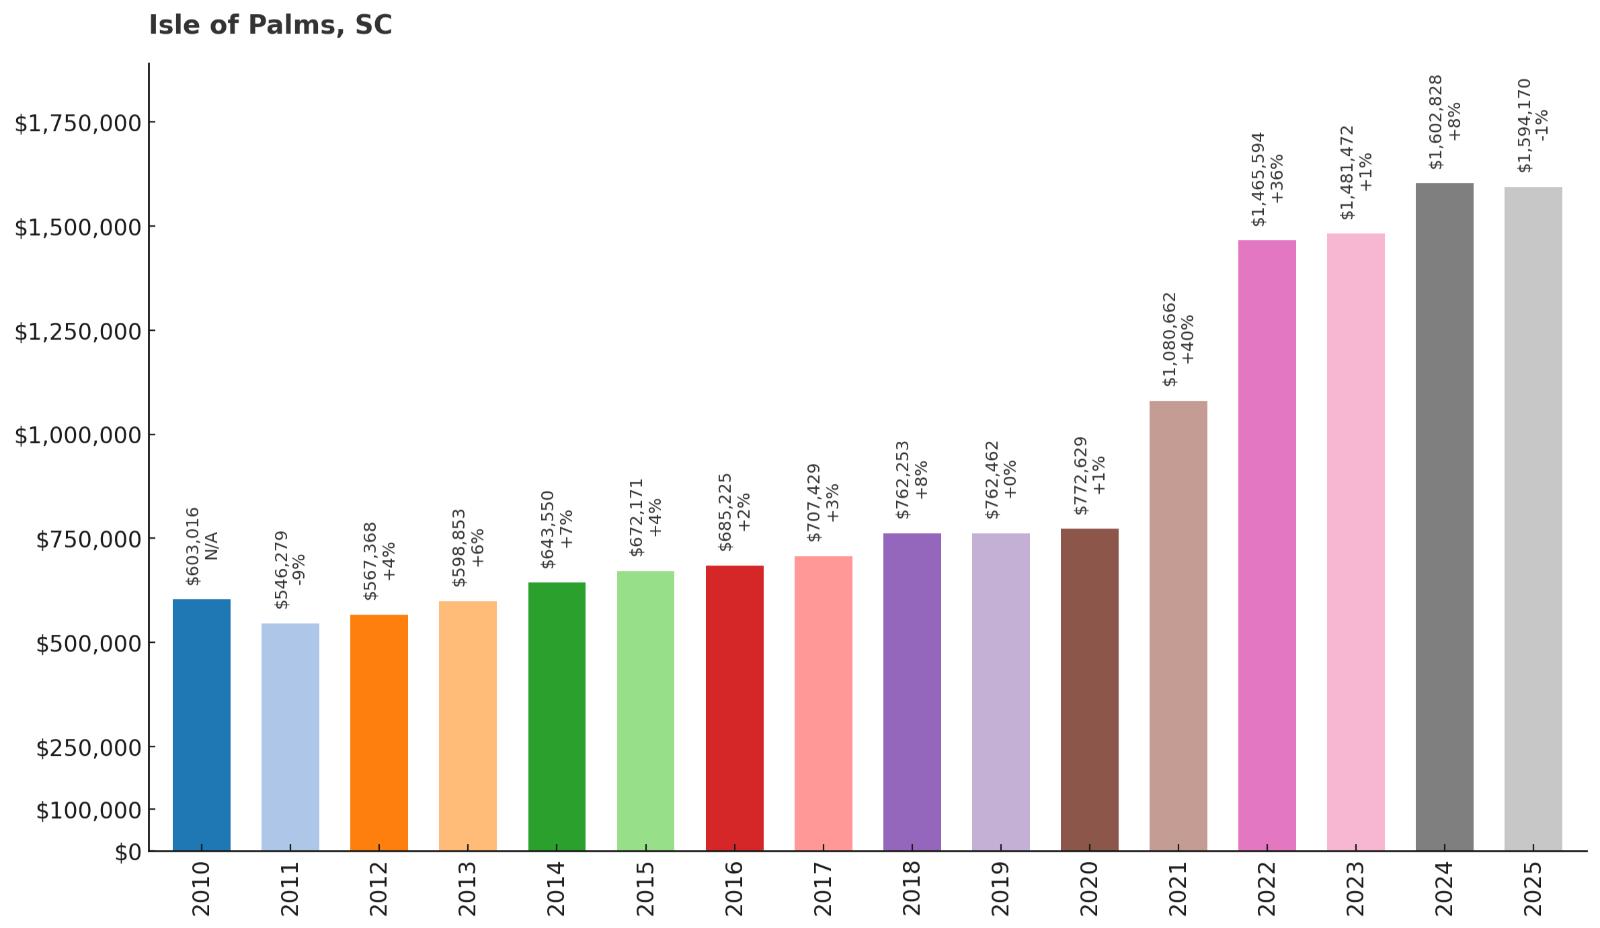
- 2010: $603,016
- 2011: $546,279
- 2012: $567,368
- 2013: $598,853
- 2014: $643,550
- 2015: $672,171
- 2016: $685,225
- 2017: $707,429
- 2018: $762,253
- 2019: $762,462
- 2020: $772,629
- 2021: $1,080,662
- 2022: $1,465,594
- 2023: $1,481,472
- 2024: $1,602,828
- 2025: $1,594,170
Isle of Palms’ median has climbed 164% since 2010, stabilizing near $1.59 million. Proximity to Mount Pleasant, wide beaches, and high-end homes support premium pricing. Recent years set a new level that has largely held.
Why Isle of Palms?
Why are people willing to pay so much to live here? What’s special about it?
Expansive beaches, deep porches, and golf-cart lanes define daily life. The island blends resort comforts with true neighborhood blocks and parks. Buyers love being 15–20 minutes from Mount Pleasant essentials and Charleston’s culture.
Oceanfront estates, canal homes, and walkable bungalows capture different budgets within a luxury range. Rental potential exists, yet many homes remain cherished family retreats. Paying up secures a polished version of barrier-island living.
How Isle of Palms Rose to Prominence
Postwar cottages evolved into larger homes as Charleston boomed. The Ravenel Bridge era tightened connections and boosted demand. Policy shifts over time shaped rental dynamics but didn’t dent the core appeal.
Limited lots, rebuilding costs, and ocean proximity all support higher values. With every sale, the upper tier pushed forward. The island now sits among the state’s top price points.
3 Interesting Tidbits
1. Wild Dunes – A resort-within-a-town adds courses and amenities.
2. Turtle Teams – Volunteers monitor nests along long, walkable beaches.
3. Pier Reimagined – The new county pier anchors community gatherings.
3. Kiawah Island – 127% Home Price Increase Since 2010
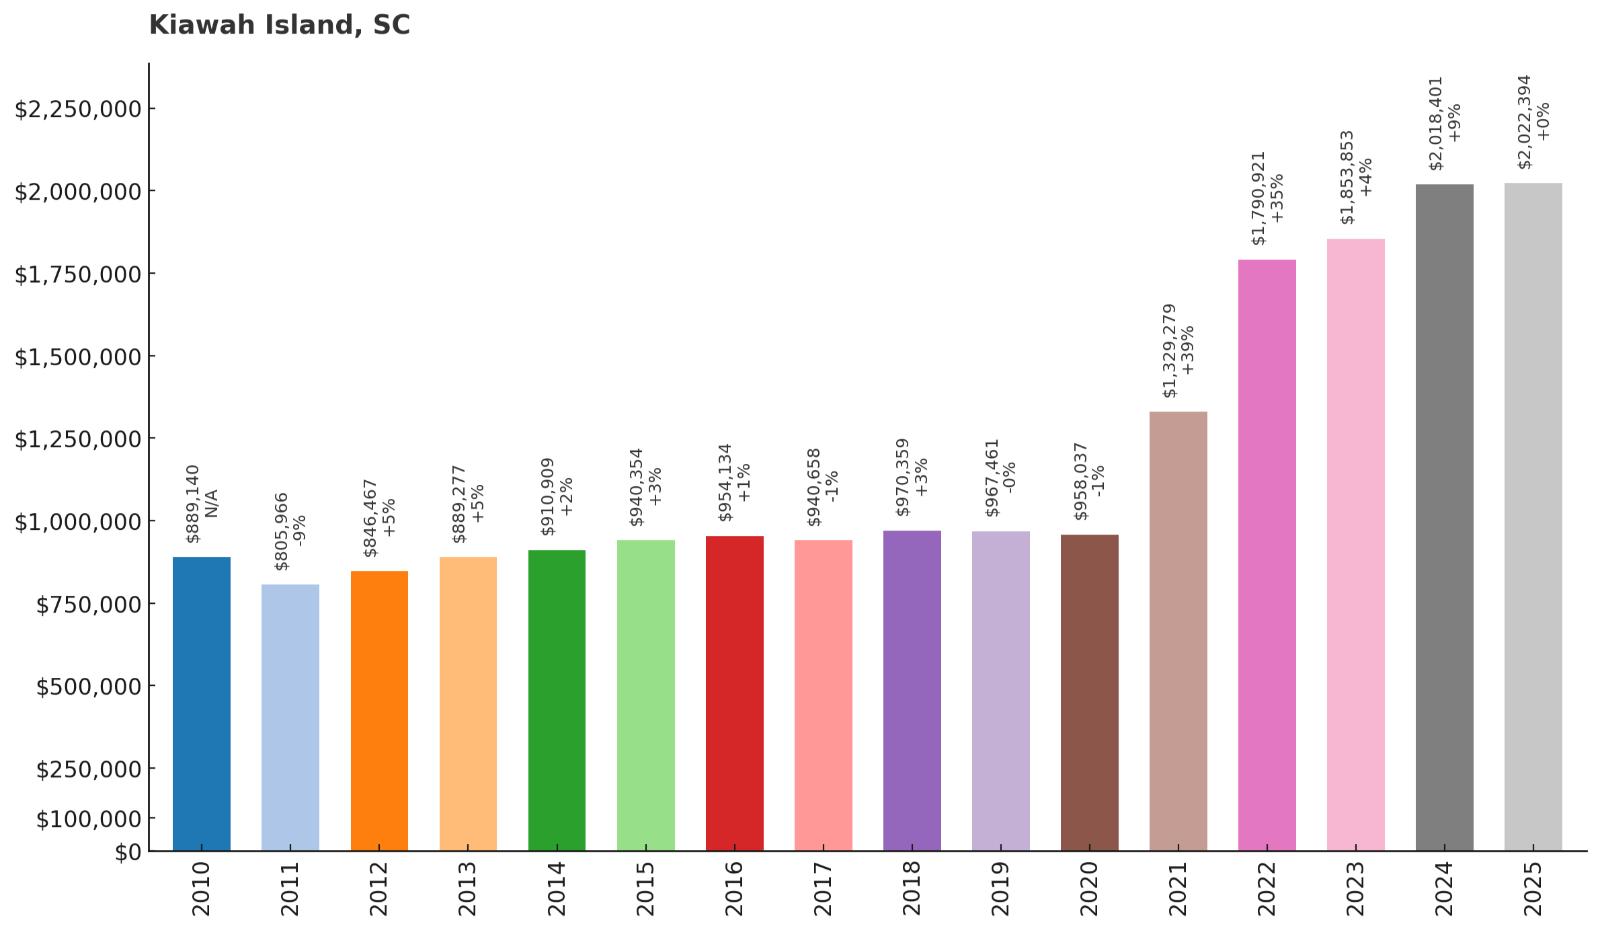
- 2010: $889,140
- 2011: $805,966
- 2012: $846,467
- 2013: $889,277
- 2014: $910,909
- 2015: $940,354
- 2016: $954,134
- 2017: $940,658
- 2018: $970,359
- 2019: $967,461
- 2020: $958,037
- 2021: $1,329,279
- 2022: $1,790,921
- 2023: $1,853,853
- 2024: $2,018,401
- 2025: $2,022,394
Kiawah’s median has advanced 127% since 2010, now just over $2.02 million. The island’s recipe—wildlife, dunes, and elite golf—draws a global audience. Successive highs since 2021 underscore its position at the top of the market.
Why Kiawah Island?
Why are people willing to pay so much to live here? What’s special about it?
Ocean Course sunsets, maritime forests, and miles of bikeable sand deliver rare daily experiences. Gated neighborhoods, resort service levels, and curated amenities justify premium costs. Homes showcase architecture that frames marsh and ocean panoramas.
Dining, tennis, spa facilities, and nature programs keep the calendar full. It’s a place where families gather for milestones and stay for seasons. Buyers pay for world-class quality wrapped in protected natural beauty.
How Kiawah Island Rose to Prominence
Thoughtful master planning preserved habitat and emphasized low-slung design. Major tournaments and national press cemented its reputation. Each phase added amenities without crowding the landscape.
In the 2020s, high-net-worth relocations and longer stays fueled price gains. Oceanfront scarcity did the rest. Kiawah stands as South Carolina’s luxury benchmark.
3 Interesting Tidbits
1. The Ocean Course – Host to the PGA Championship with winds that challenge pros.
2. Wildlife First – Deer, bobcats, and shorebirds are daily neighbors.
3. Biking on the Beach – Hard-packed sand makes miles feel easy.
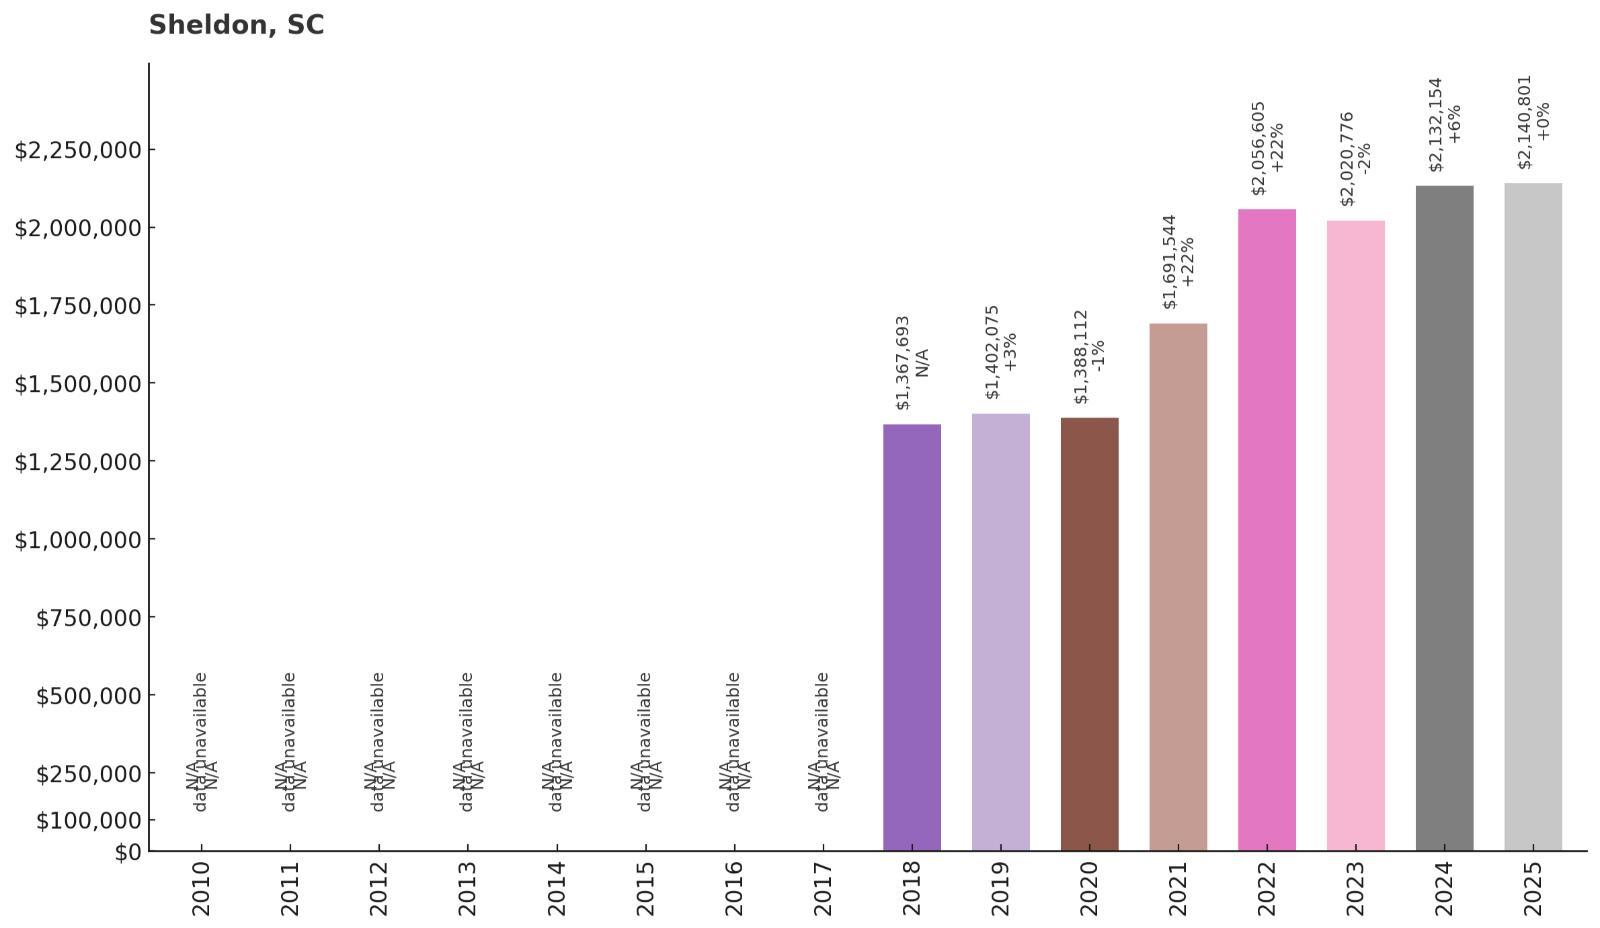
2. Sheldon – 57% Home Price Increase Since 2018
- 2010: N/A
- 2011: N/A
- 2012: N/A
- 2013: N/A
- 2014: N/A
- 2015: N/A
- 2016: N/A
- 2017: N/A
- 2018: $1,367,693
- 2019: $1,402,075
- 2020: $1,388,112
- 2021: $1,691,544
- 2022: $2,056,605
- 2023: $2,020,776
- 2024: $2,132,154
- 2025: $2,140,801
Since 2018, Sheldon’s median has climbed 57% to about $2.14 million. Large estates, deep-river parcels, and historic properties define this Beaufort County enclave. The numbers reflect a thin, high-end market where individual sales set the tone.
Why Sheldon?
Why are people willing to pay so much to live here? What’s special about it?
Acreage, live oaks, and tidal rivers shape properties that feel like private preserves. Buyers value seclusion that still reaches Beaufort, Bluffton, and Charleston corridors. Historic homes and new luxury builds share the same Lowcountry canvas.
Outdoor life is rich with boating, hunting, and quiet mornings on broad porches. Night skies are dark and neighbors are a respectful distance away. People pay for legacy holdings that can span generations.
How Sheldon Rose to Prominence
Plantation-era lands evolved into private estates over the 20th century. As the broader Lowcountry appreciated, Sheldon’s rare mix of history and acreage drew notice. The post-2020 period brought additional high-net-worth interest seeking privacy and water.
With little turnover, sale prices move in firm steps. Each premium transaction establishes a new benchmark. Sheldon remains exclusive by design and by geography.
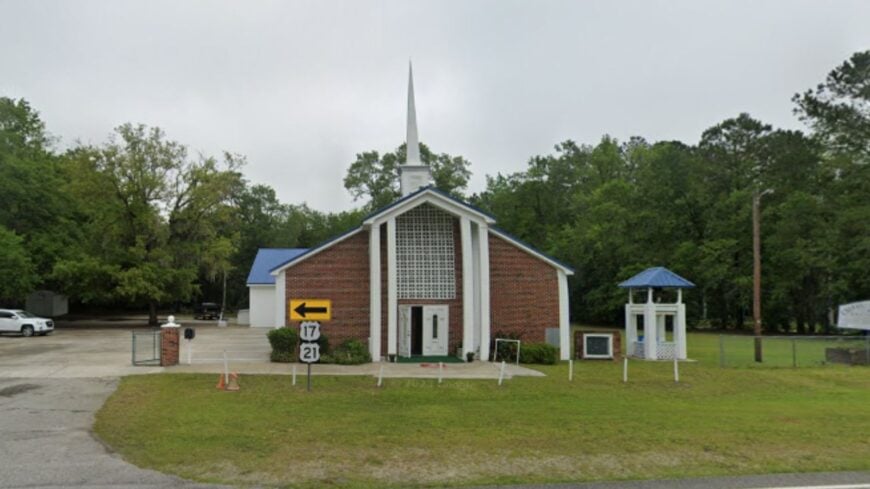
3 Interesting Tidbits
1. Combahee & Whale Branch – Deep-water access anchors many properties.
2. Legacy Live Oaks – Centuries-old trees frame driveways and lawns.
3. Historic Fabric – Churches and preserved sites dot the surrounding countryside.
1. Sullivans Island – 248% Home Price Increase Since 2010
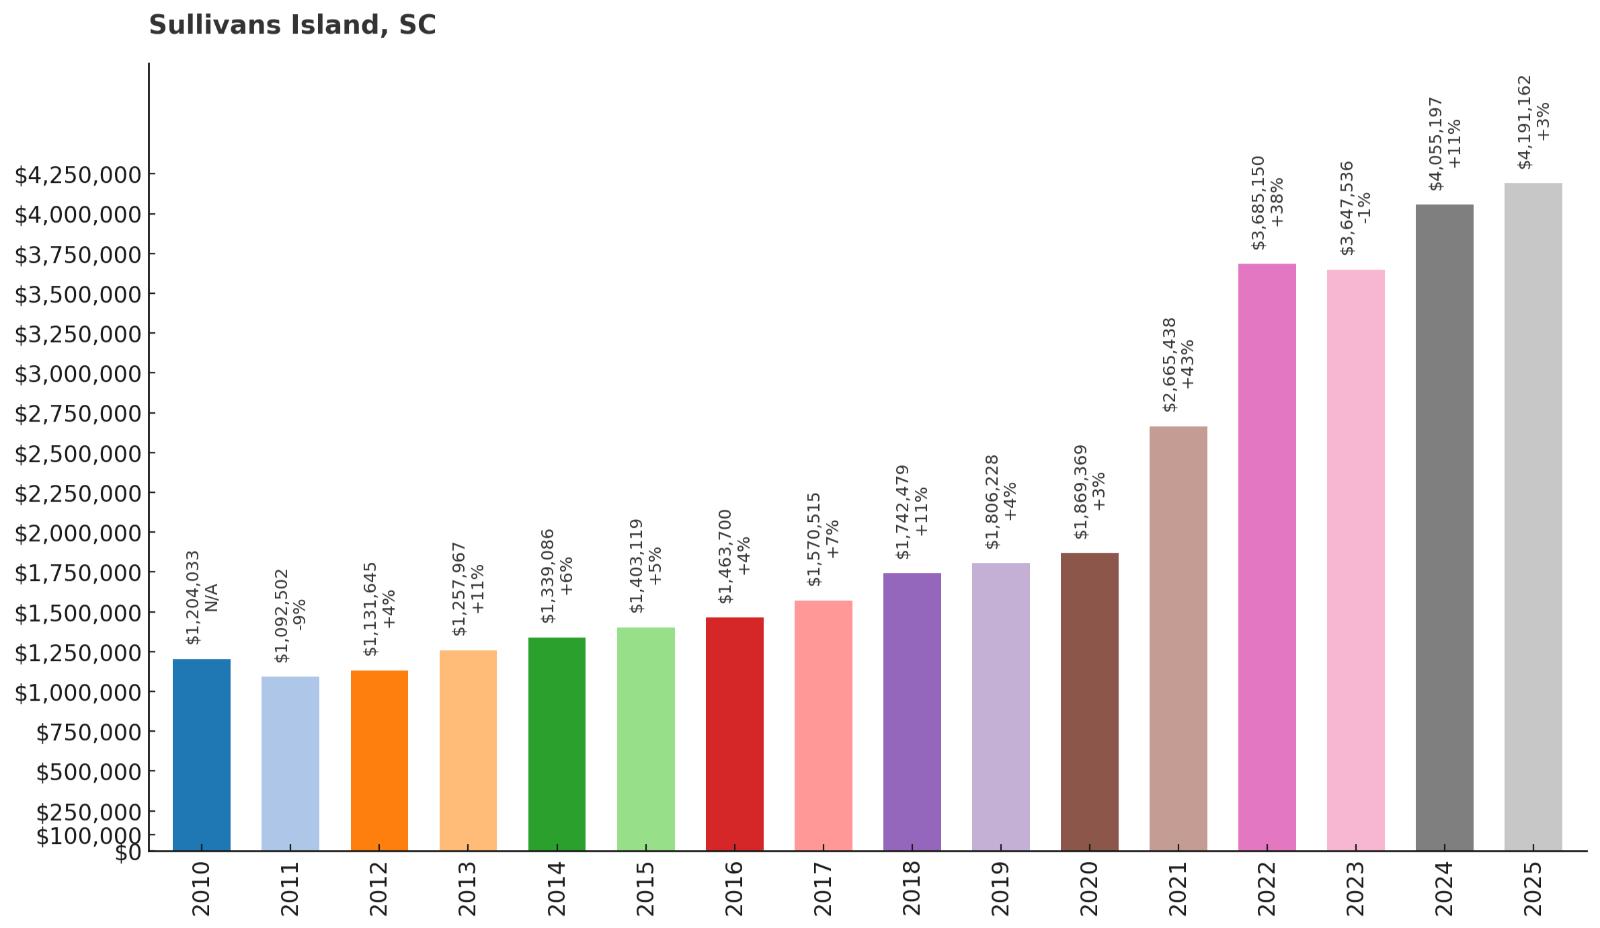
- 2010: $1,204,033
- 2011: $1,092,502
- 2012: $1,131,645
- 2013: $1,257,967
- 2014: $1,339,086
- 2015: $1,403,119
- 2016: $1,463,700
- 2017: $1,570,515
- 2018: $1,742,479
- 2019: $1,806,228
- 2020: $1,869,369
- 2021: $2,665,438
- 2022: $3,685,150
- 2023: $3,647,536
- 2024: $4,055,197
- 2025: $4,191,162
Sullivans Island tops South Carolina with a 248% rise since 2010, now above $4.19 million. Oceanfront blocks, strict zoning, and a walkable village create extreme scarcity. The island’s blend of understated architecture and world-class setting commands unmatched prices.
Why Sullivans Island?
Why are people willing to pay so much to live here? What’s special about it?
Wide beaches, broad dunes, and a quiet commercial district give the island its signature calm. Charleston’s skyline sits across the harbor, yet nights stay peaceful and dark. Architecture guidelines preserve a low-profile coastal aesthetic that ages beautifully.
Residents stroll to dinner, bike to the lighthouse, and surf at dawn. The village feel, coupled with premier schools across the bridge, resonates with long-term owners. Buyers pay for rarity, character, and a community that guards both.
How Sullivans Island Rose to Prominence
Historic military roots and careful planning limited density as demand grew. The Ravenel Bridge era shortened the trip from the peninsula, expanding the buyer base. Over the last decade, each record sale reset expectations for the next.
With minimal supply and global attention on Charleston, prices marched to new highs. Architectural standards and lot sizes kept the island’s identity intact. Today it stands as the state’s most expensive coastal address.
3 Interesting Tidbits
1. Fort Moultrie – A storied coastal fort anchors the island’s history.
2. Lighthouse Icon – The triangular Sullivans Island Light is instantly recognizable.
3. Turtle Guardians – Community volunteers monitor nesting along tranquil beaches.


