🔥 Would you like to save this?
Home prices in Vermont have soared in recent years, reshaping what it means to live in the Green Mountain State. According to the Zillow Home Value Index, some towns now rival luxury enclaves in pricier parts of the country. From ski towns turned investor magnets to rural escapes where remote work reshaped demand, Vermont’s most expensive markets highlight dramatic shifts in lifestyle, economy, and regional appeal. These 33 towns stand out not just for their price tags, but for how fast they’ve climbed — and why.
33. Plymouth – 70% Home Price Increase Since 2012
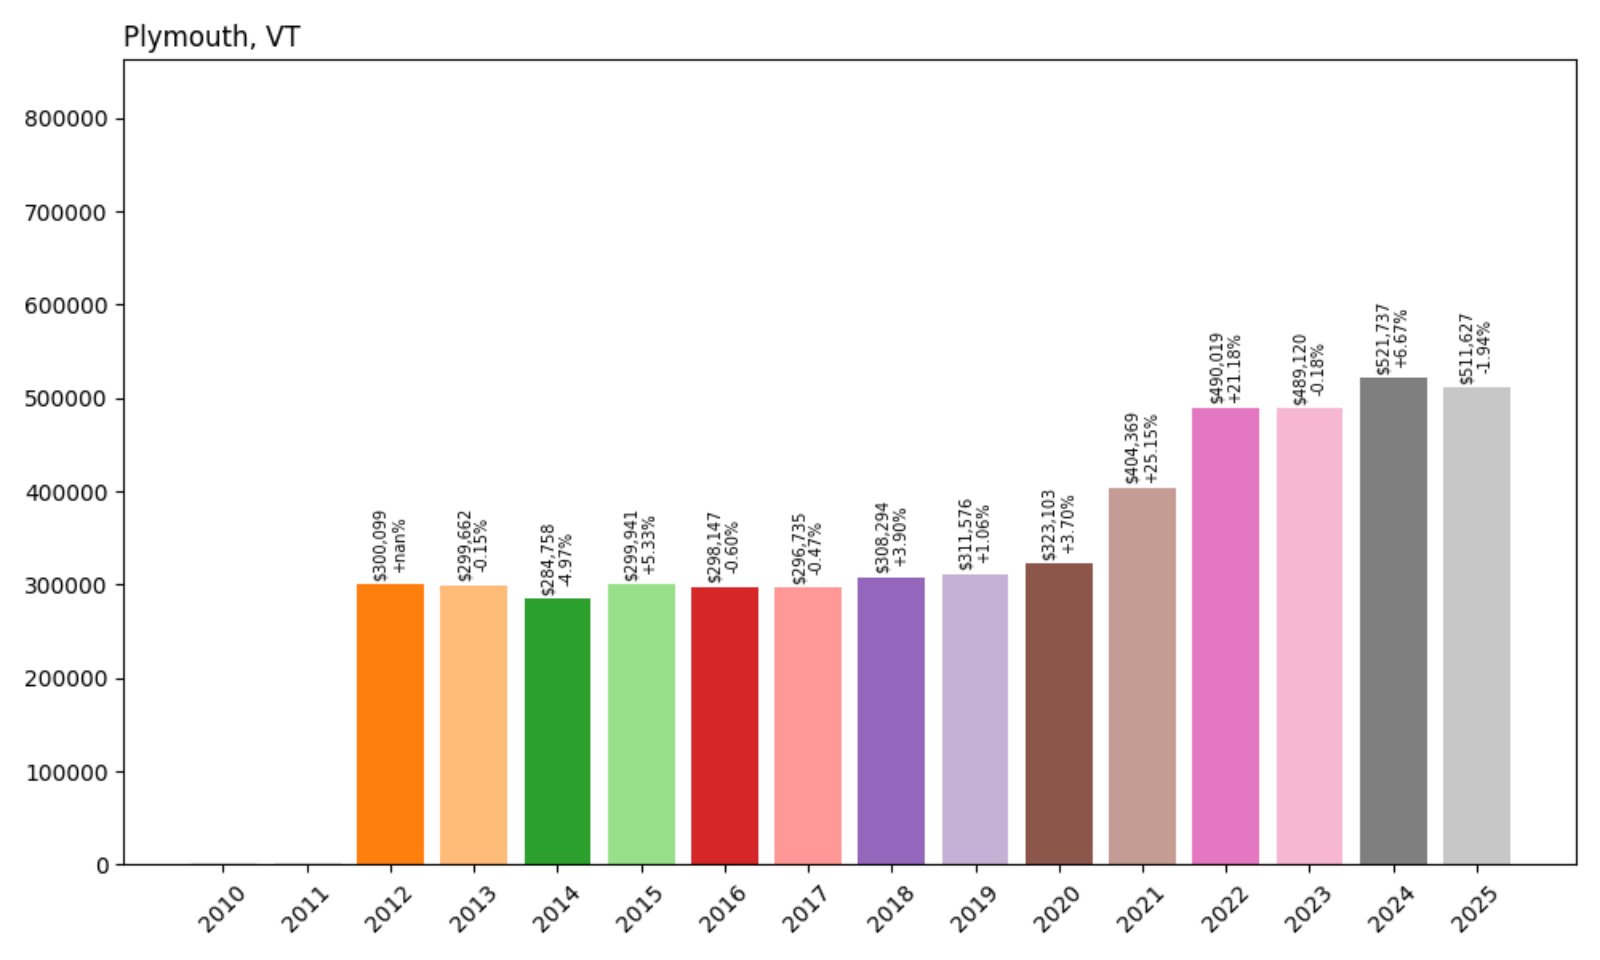
- 2012: $300,099
- 2013: $299,662 (−$438, −0.15%)
- 2014: $284,758 (−$14,904, −4.97%)
- 2015: $299,941 (+$15,183, +5.33%)
- 2016: $298,147 (−$1,794, −0.60%)
- 2017: $296,735 (−$1,412, −0.47%)
- 2018: $308,294 (+$11,559, +3.90%)
- 2019: $311,576 (+$3,281, +1.06%)
- 2020: $323,103 (+$11,527, +3.70%)
- 2021: $404,369 (+$81,267, +25.15%)
- 2022: $490,019 (+$85,649, +21.18%)
- 2023: $489,120 (−$899, −0.18%)
- 2024: $521,737 (+$32,617, +6.67%)
- 2025: $511,627 (−$10,110, −1.94%)
Plymouth’s home values have grown 70% since 2012, rising from around $300,000 to over $511,000 in July 2025. While there’s been some fluctuation — especially between 2014 and 2017 — recent years show a major jump, peaking in 2022. This growth reflects broader statewide interest in second homes and seasonal getaways, especially in rural towns with scenic appeal.
In order to come up with the very specific design ideas, we create most designs with the assistance of state-of-the-art AI interior design software. Also, assume links that take you off the site are affiliate links such as links to Amazon. this means we may earn a commission if you buy something.
Plymouth – Historic Village With Scenic Appeal
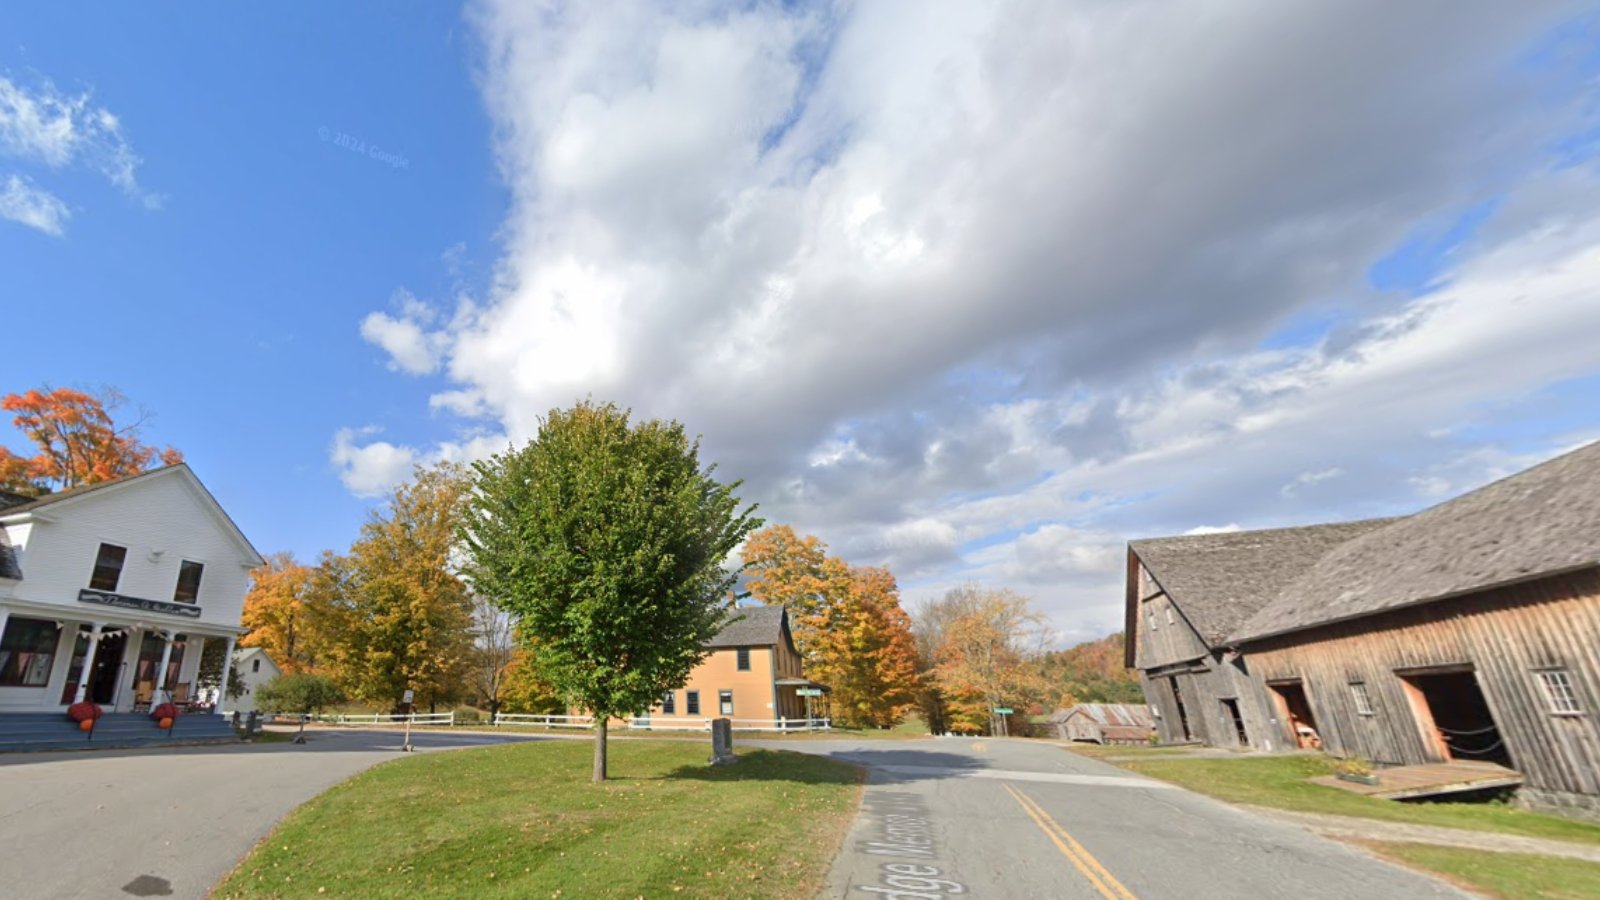
Located in Windsor County in south-central Vermont, Plymouth offers a blend of history, nature, and quiet charm. The town is best known as the birthplace and summer home of President Calvin Coolidge. With its lush mountain surroundings and access to lakes, hiking trails, and snowmobile routes, it’s a draw for vacationers and retirees alike. That seasonal appeal likely contributed to the substantial value increases seen from 2020 to 2022. Despite a small decline in 2025, values remain far higher than a decade ago.
Local amenities are modest but sufficient, and many homes serve as vacation properties. Its slower-paced growth prior to 2020 shifted into higher gear during the pandemic-era real estate boom. While prices have dipped slightly this year, demand for peaceful second-home retreats still keeps Plymouth firmly in Vermont’s top tier for home values.
32. Andover – 76% Home Price Increase Since 2012
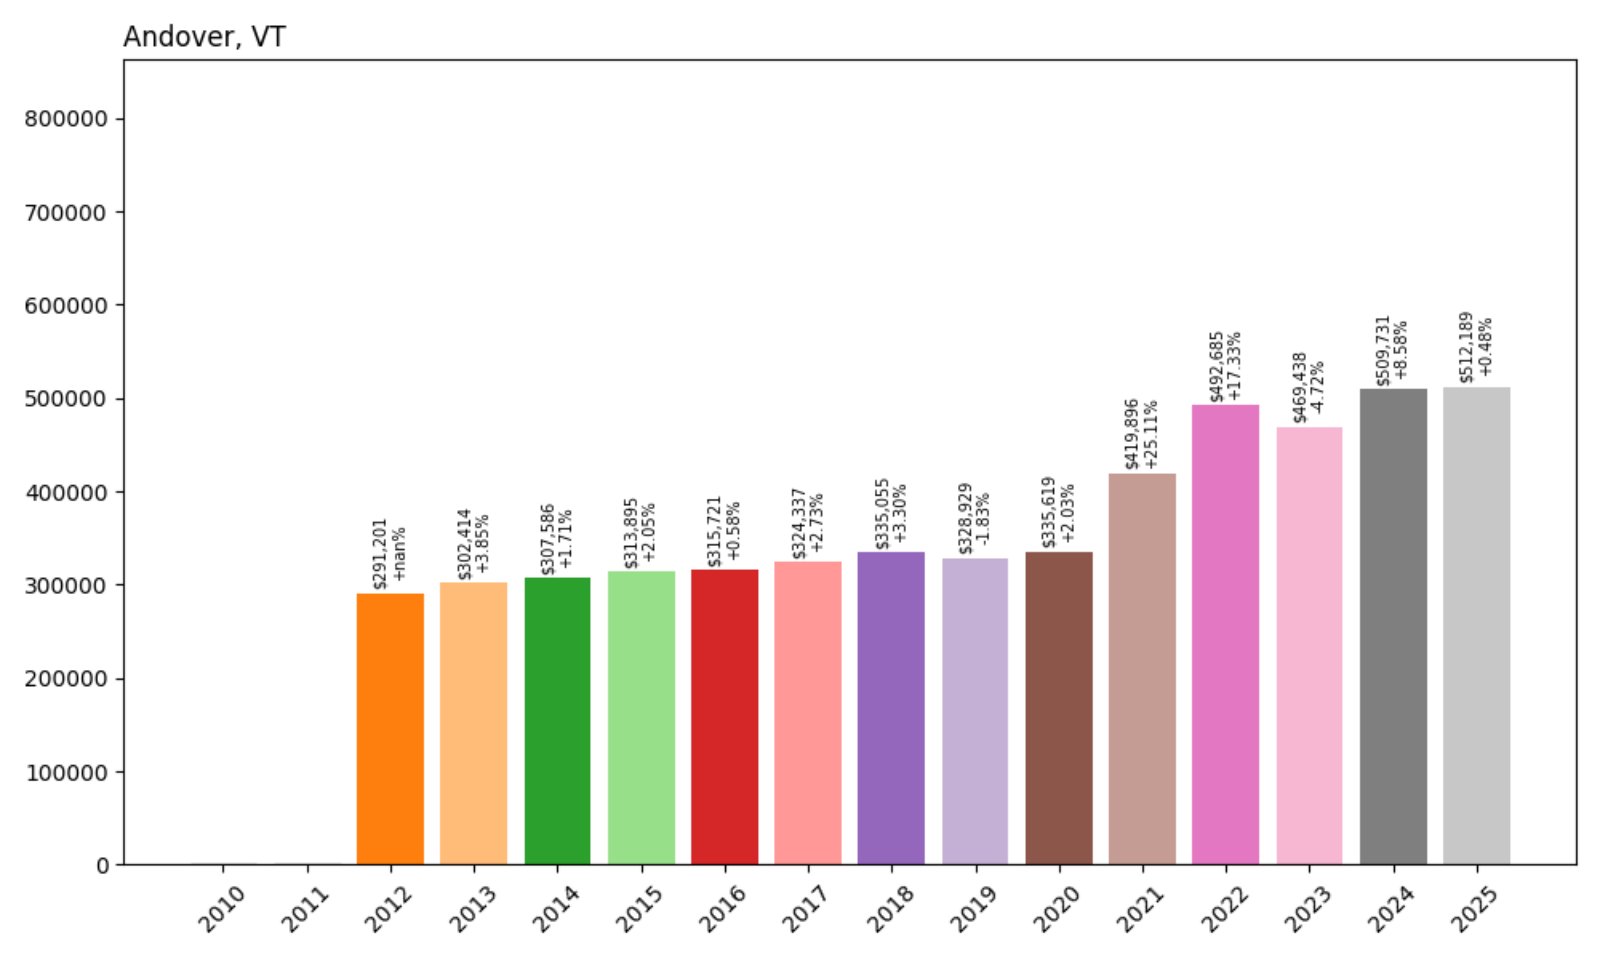
- 2012: $291,201
- 2013: $302,414 (+$11,213, +3.85%)
- 2014: $307,586 (+$5,173, +1.71%)
- 2015: $313,895 (+$6,308, +2.05%)
- 2016: $315,721 (+$1,826, +0.58%)
- 2017: $324,337 (+$8,616, +2.73%)
- 2018: $335,055 (+$10,718, +3.30%)
- 2019: $328,929 (−$6,126, −1.83%)
- 2020: $335,619 (+$6,690, +2.03%)
- 2021: $419,896 (+$84,277, +25.11%)
- 2022: $492,685 (+$72,789, +17.33%)
- 2023: $469,438 (−$23,247, −4.72%)
- 2024: $509,731 (+$40,293, +8.58%)
- 2025: $512,189 (+$2,457, +0.48%)
Home values in Andover have climbed more than 76% since 2012. While the town saw only gradual increases from 2012 to 2020, values surged dramatically through 2021 and 2022, mirroring statewide trends during the pandemic boom. After a brief dip in 2023, prices rebounded in 2024 and remain steady in 2025.
Andover – Quiet and Rural With Strong Second-Home Appeal
Set in Windsor County near ski destinations like Okemo and Magic Mountain, Andover is a small, rural town that’s increasingly popular among seasonal residents and remote workers. Many of its homes are cabins or vacation properties tucked into the woods, which helped boost its appeal during the work-from-home wave.
Though year-round services are limited, the area offers access to outdoor recreation and peaceful seclusion. The 2021–2022 value surge suggests that buyers were prioritizing privacy and natural beauty, even in smaller towns like this. Prices have leveled off somewhat, but Andover still boasts one of the state’s strongest long-term growth stories.
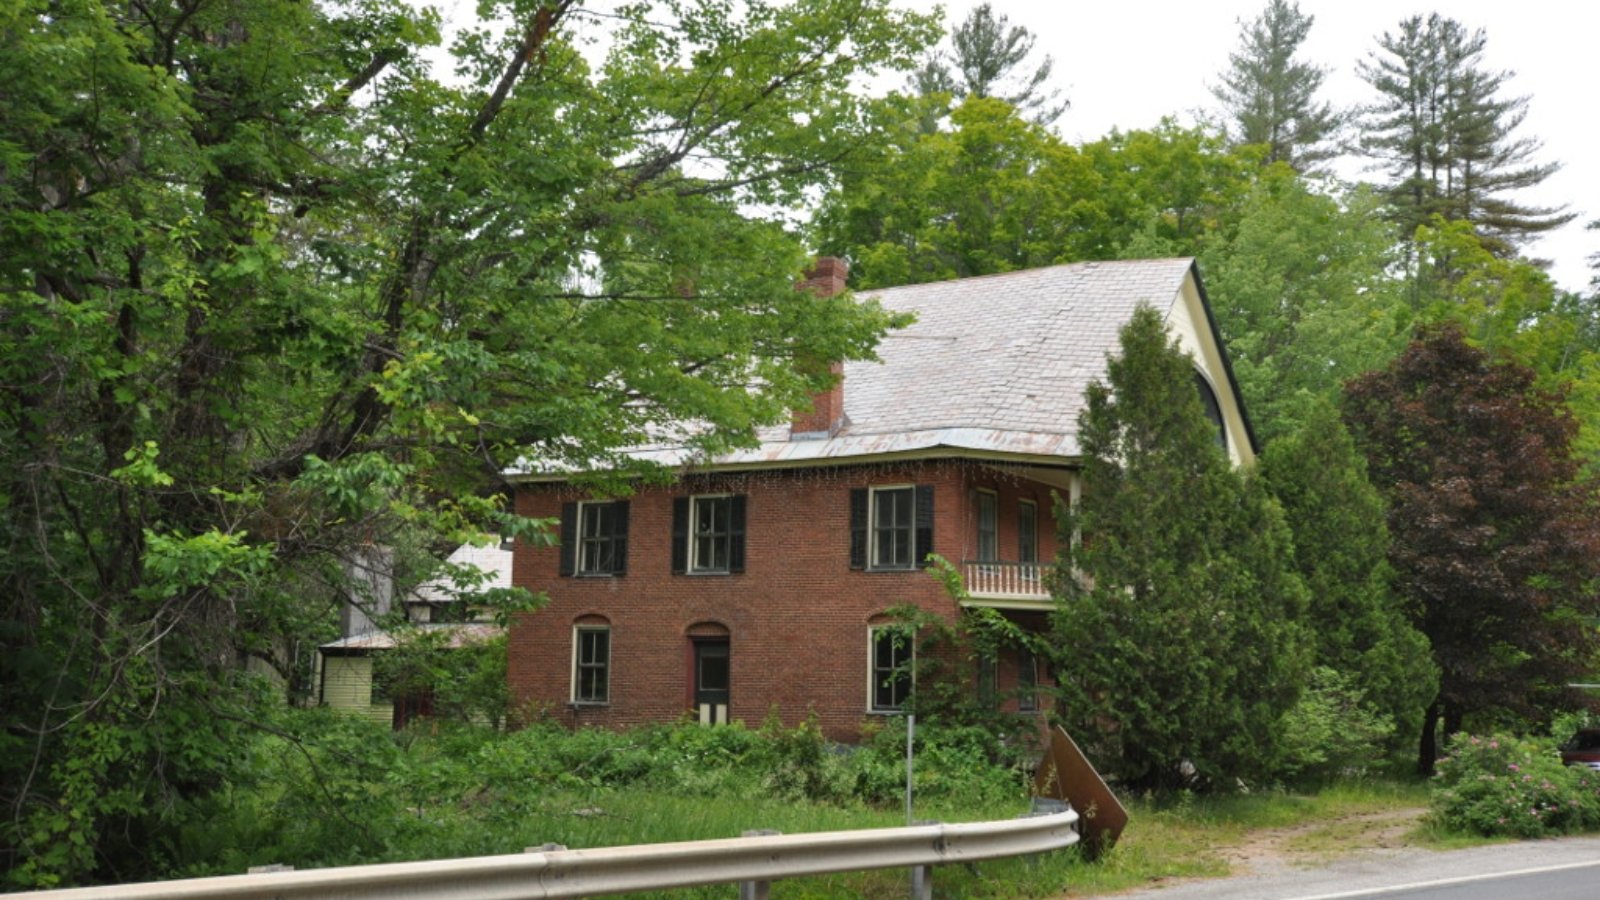
31. Ferrisburgh – 81% Home Price Increase Since 2010
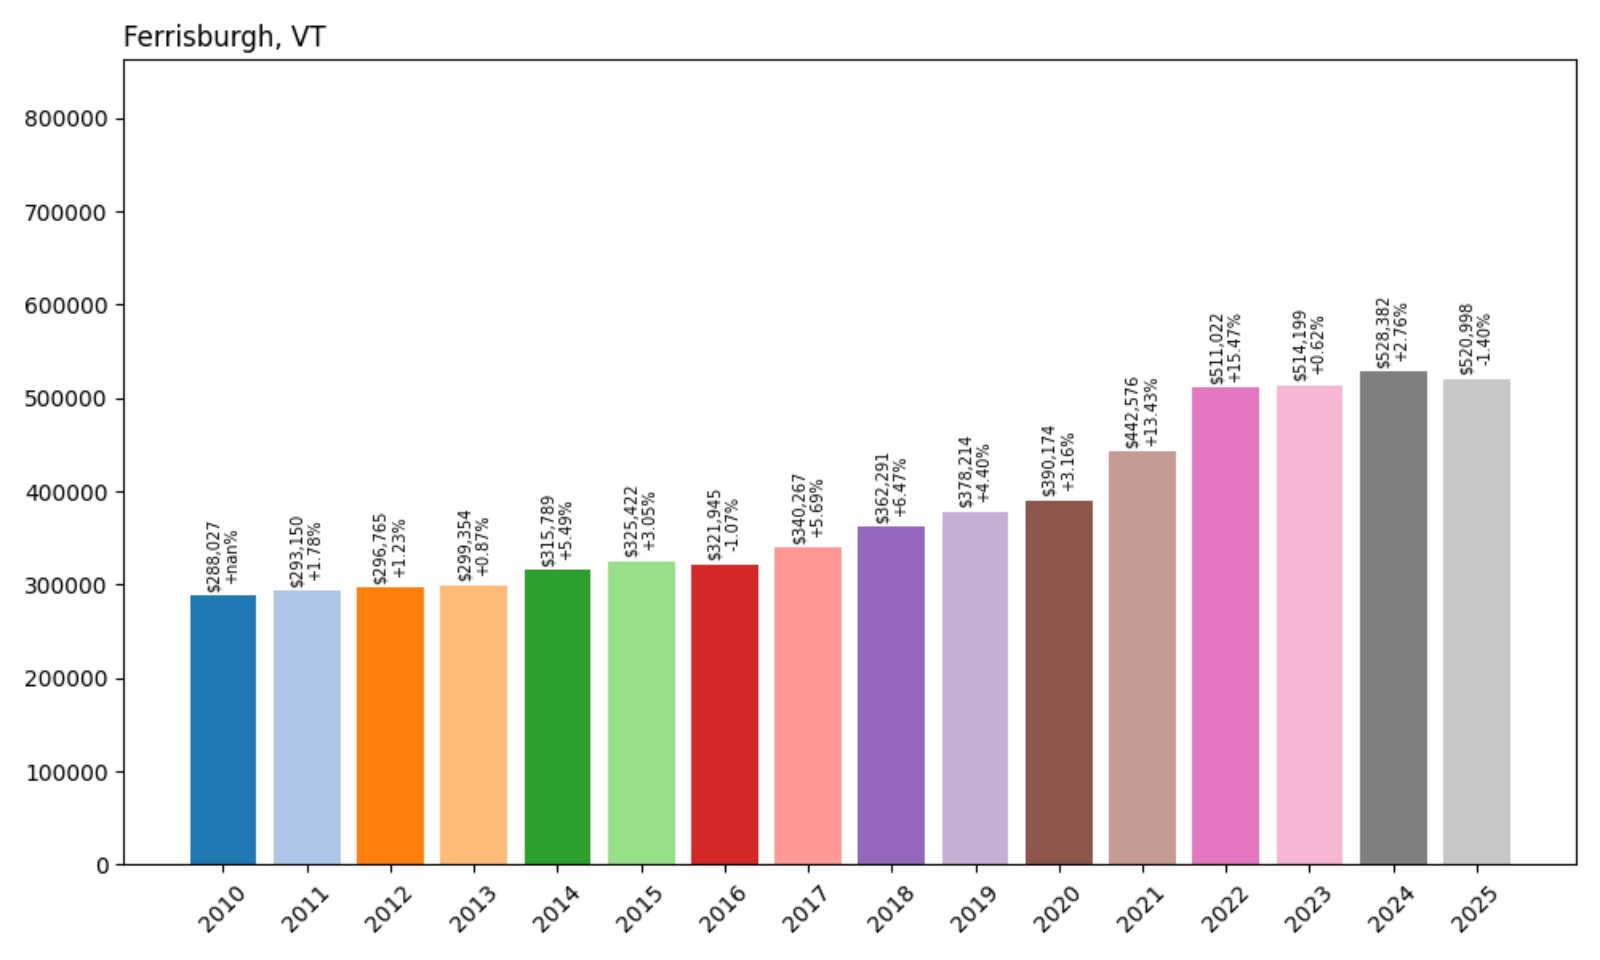
- 2010: $288,027
- 2011: $293,150 (+$5,123, +1.78%)
- 2012: $296,765 (+$3,616, +1.23%)
- 2013: $299,354 (+$2,589, +0.87%)
- 2014: $315,789 (+$16,435, +5.49%)
- 2015: $325,422 (+$9,633, +3.05%)
- 2016: $321,945 (−$3,478, −1.07%)
- 2017: $340,267 (+$18,323, +5.69%)
- 2018: $362,291 (+$22,023, +6.47%)
- 2019: $378,214 (+$15,923, +4.40%)
- 2020: $390,174 (+$11,960, +3.16%)
- 2021: $442,576 (+$52,402, +13.43%)
- 2022: $511,022 (+$68,446, +15.47%)
- 2023: $514,199 (+$3,177, +0.62%)
- 2024: $528,382 (+$14,183, +2.76%)
- 2025: $520,998 (−$7,384, −1.40%)
Ferrisburgh’s home prices rose from about $288K in 2010 to $520K in 2025 — an 81% increase. Price trends here reflect steady demand with a sharp rise post-2020, peaking in 2022. Although 2025 shows a modest decline, values remain high.
Ferrisburgh – Scenic, Spacious, and Lake Champlain Adjacent
Located along Lake Champlain in Addison County, Ferrisburgh is a mix of open farmland, lakeside neighborhoods, and classic Vermont village centers. The lake’s proximity, combined with relative affordability early in the decade, made this town increasingly attractive to homebuyers seeking scenic space.
The area includes access to Button Bay State Park and the Lake Champlain Bikeway. While not as densely developed as neighboring Middlebury or Vergennes, Ferrisburgh has seen stronger interest in the past five years, with values climbing rapidly through 2022. Slight softening in 2025 may reflect cooling demand, but the fundamentals remain solid.
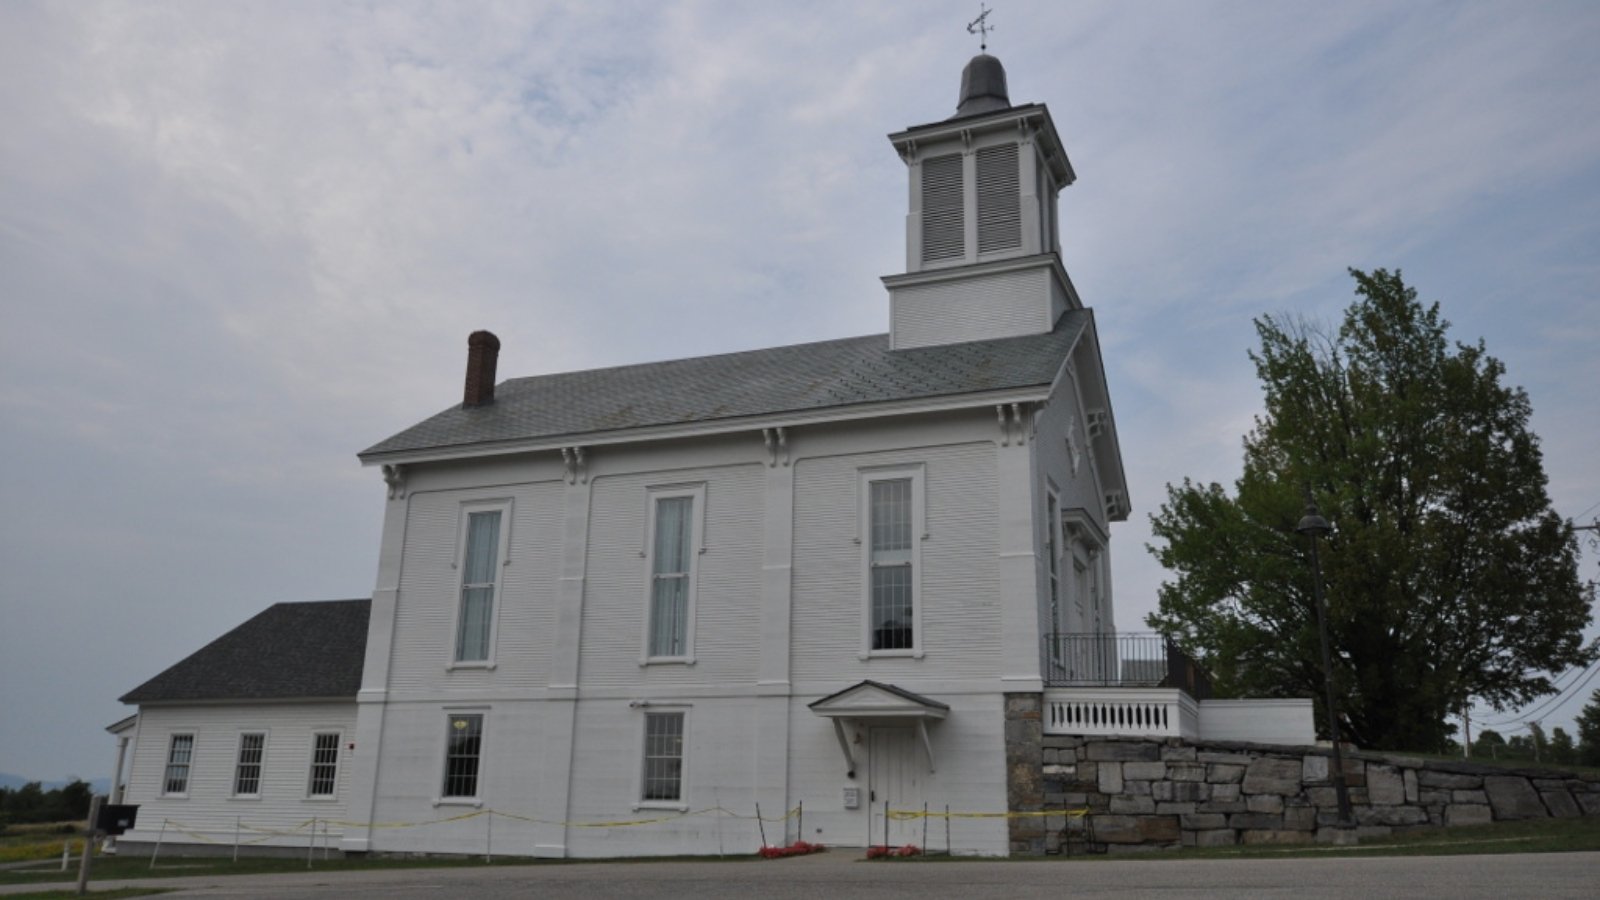
30. Peru – 111% Home Price Increase Since 2012
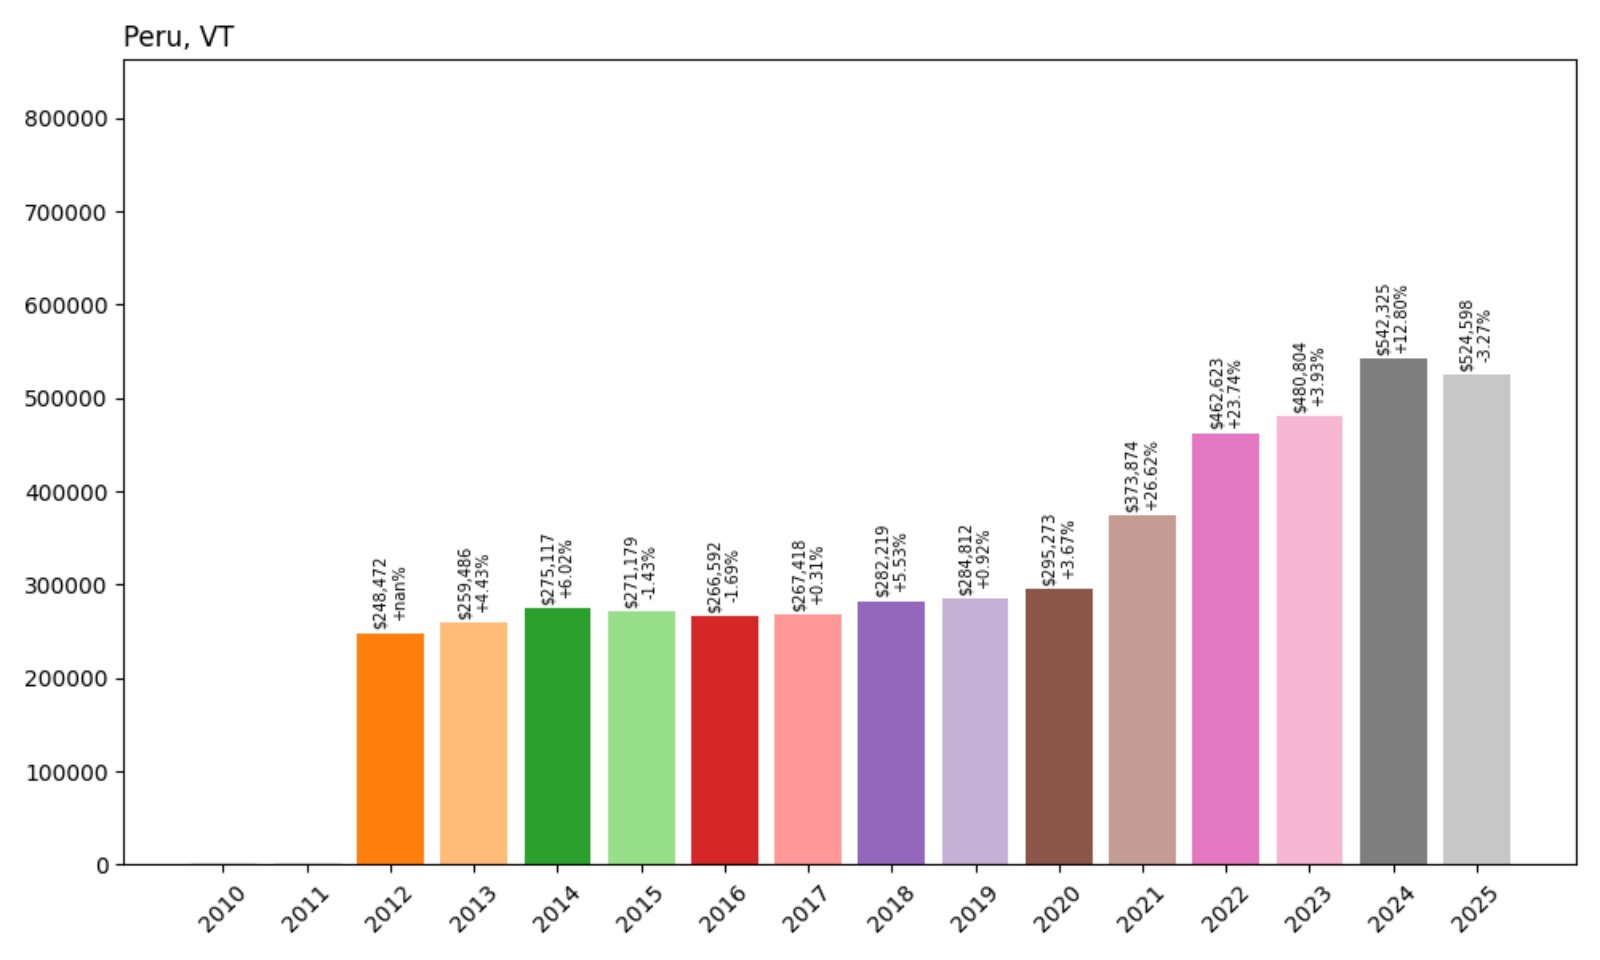
- 2012: $248,472
- 2013: $259,486 (+$11,014, +4.43%)
- 2014: $275,117 (+$15,632, +6.02%)
- 2015: $271,179 (−$3,938, −1.43%)
- 2016: $266,592 (−$4,587, −1.69%)
- 2017: $267,418 (+$826, +0.31%)
- 2018: $282,219 (+$14,801, +5.53%)
- 2019: $284,812 (+$2,592, +0.92%)
- 2020: $295,273 (+$10,461, +3.67%)
- 2021: $373,874 (+$78,601, +26.62%)
- 2022: $462,623 (+$88,750, +23.74%)
- 2023: $480,804 (+$18,181, +3.93%)
- 2024: $542,325 (+$61,521, +12.80%)
- 2025: $524,598 (−$17,727, −3.27%)
Peru’s home values have jumped 111% since 2012, with a massive leap between 2020 and 2022. Though prices dipped slightly in 2025, the long-term trend reflects strong demand, especially during Vermont’s real estate boom years.
Peru – Tiny Town With Big Outdoor Appeal
Located in Bennington County, Peru is home to Bromley Mountain ski area, which attracts visitors and vacationers year-round. The town’s rural charm and easy access to hiking and skiing have made it popular for second homes and investment properties.
Peru’s housing market remained fairly flat through the mid-2010s but exploded in the post-2020 real estate boom. Even with a 3% dip this year, current values remain more than double what they were in 2012. That level of growth reflects rising interest in small, amenity-rich mountain towns across Vermont.
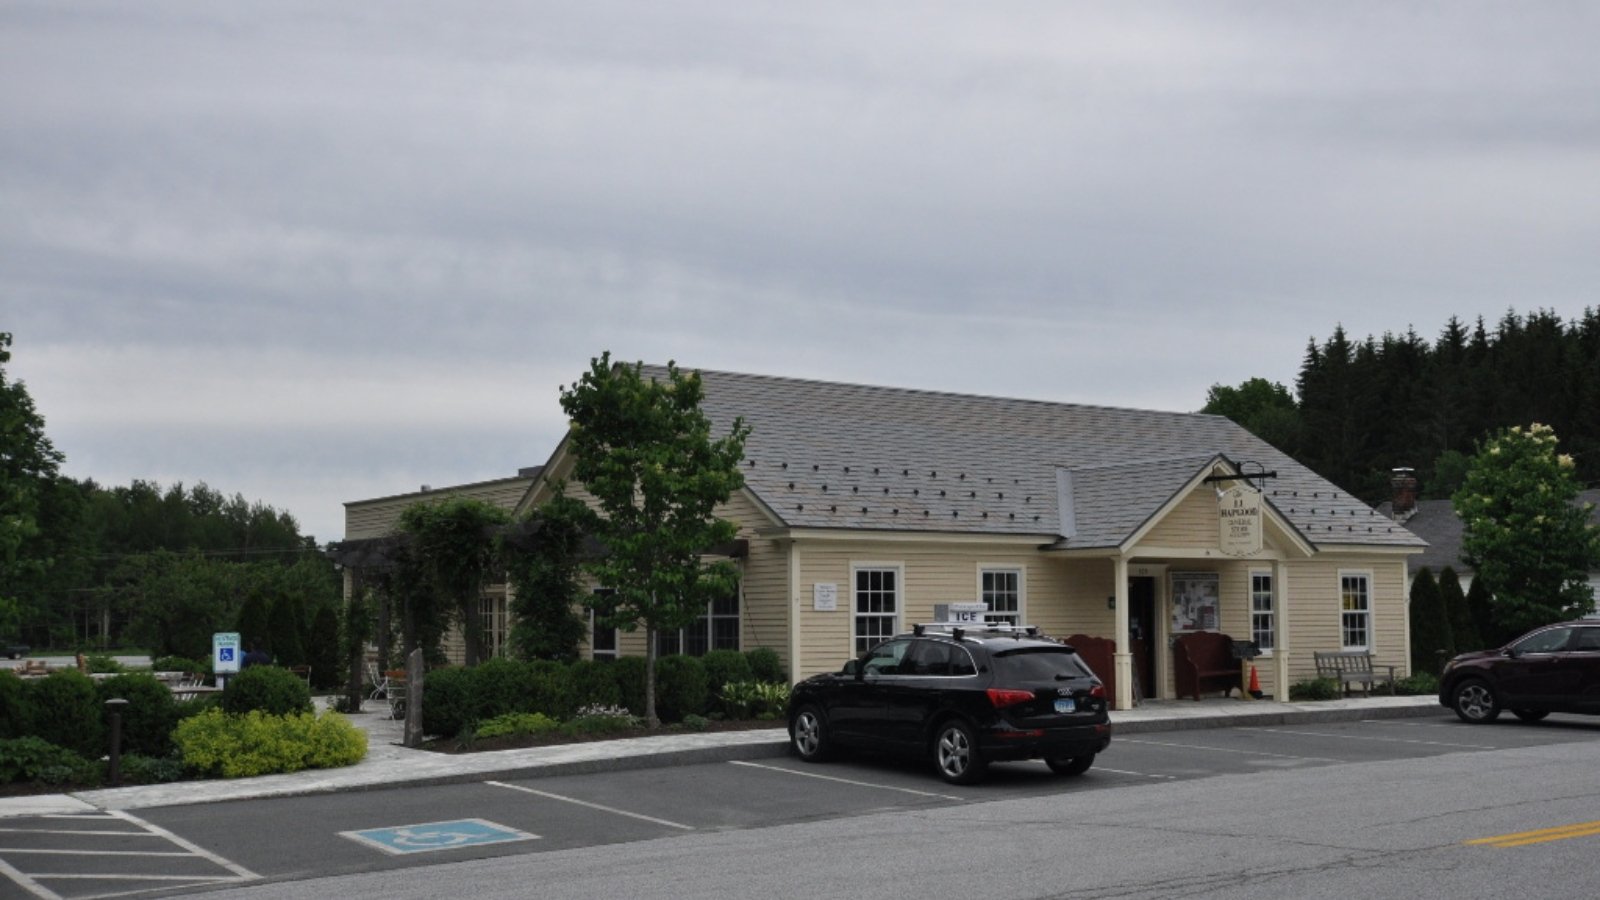
29. Weybridge – 60% Home Price Increase Since 2012
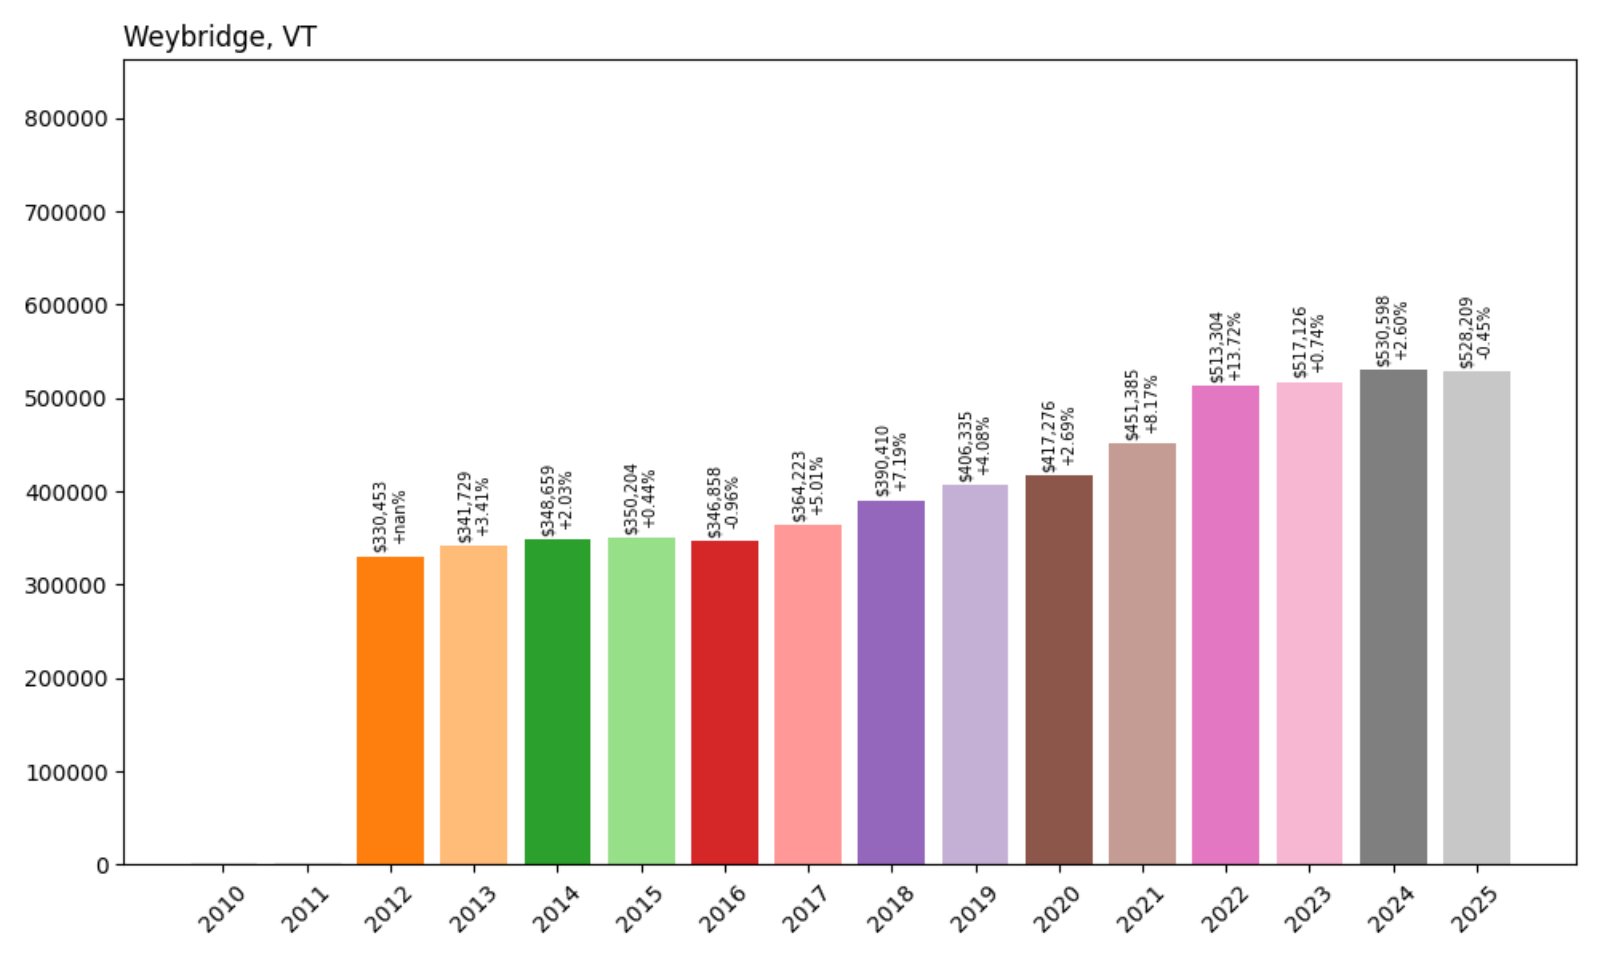
- 2012: $330,453
- 2013: $341,729 (+$11,277, +3.41%)
- 2014: $348,659 (+$6,929, +2.03%)
- 2015: $350,204 (+$1,545, +0.44%)
- 2016: $346,858 (−$3,346, −0.96%)
- 2017: $364,223 (+$17,365, +5.01%)
- 2018: $390,410 (+$26,187, +7.19%)
- 2019: $406,335 (+$15,925, +4.08%)
- 2020: $417,276 (+$10,941, +2.69%)
- 2021: $451,385 (+$34,109, +8.17%)
- 2022: $513,304 (+$61,919, +13.72%)
- 2023: $517,126 (+$3,822, +0.74%)
- 2024: $530,598 (+$13,471, +2.60%)
- 2025: $528,209 (−$2,389, −0.45%)
Weybridge home values have increased 60% since 2012, a steady climb that accelerated notably in 2020 and 2021. Although prices slightly softened in 2025, the town continues to show long-term resilience in property values.
Weybridge – Quiet, Academic, and Well-Located
Bordering Middlebury in Addison County, Weybridge benefits from its proximity to Middlebury College, rural charm, and access to Route 23. The area blends rolling hills and open land with accessibility to key services, drawing both families and retirees.
Values remained modest for much of the 2010s before picking up in the early 2020s. While 2025 saw a fractional drop, demand remains high for this academically adjacent, agriculturally rich town. Its combination of location, landscape, and low density keeps it on the map for upscale rural living in Vermont.
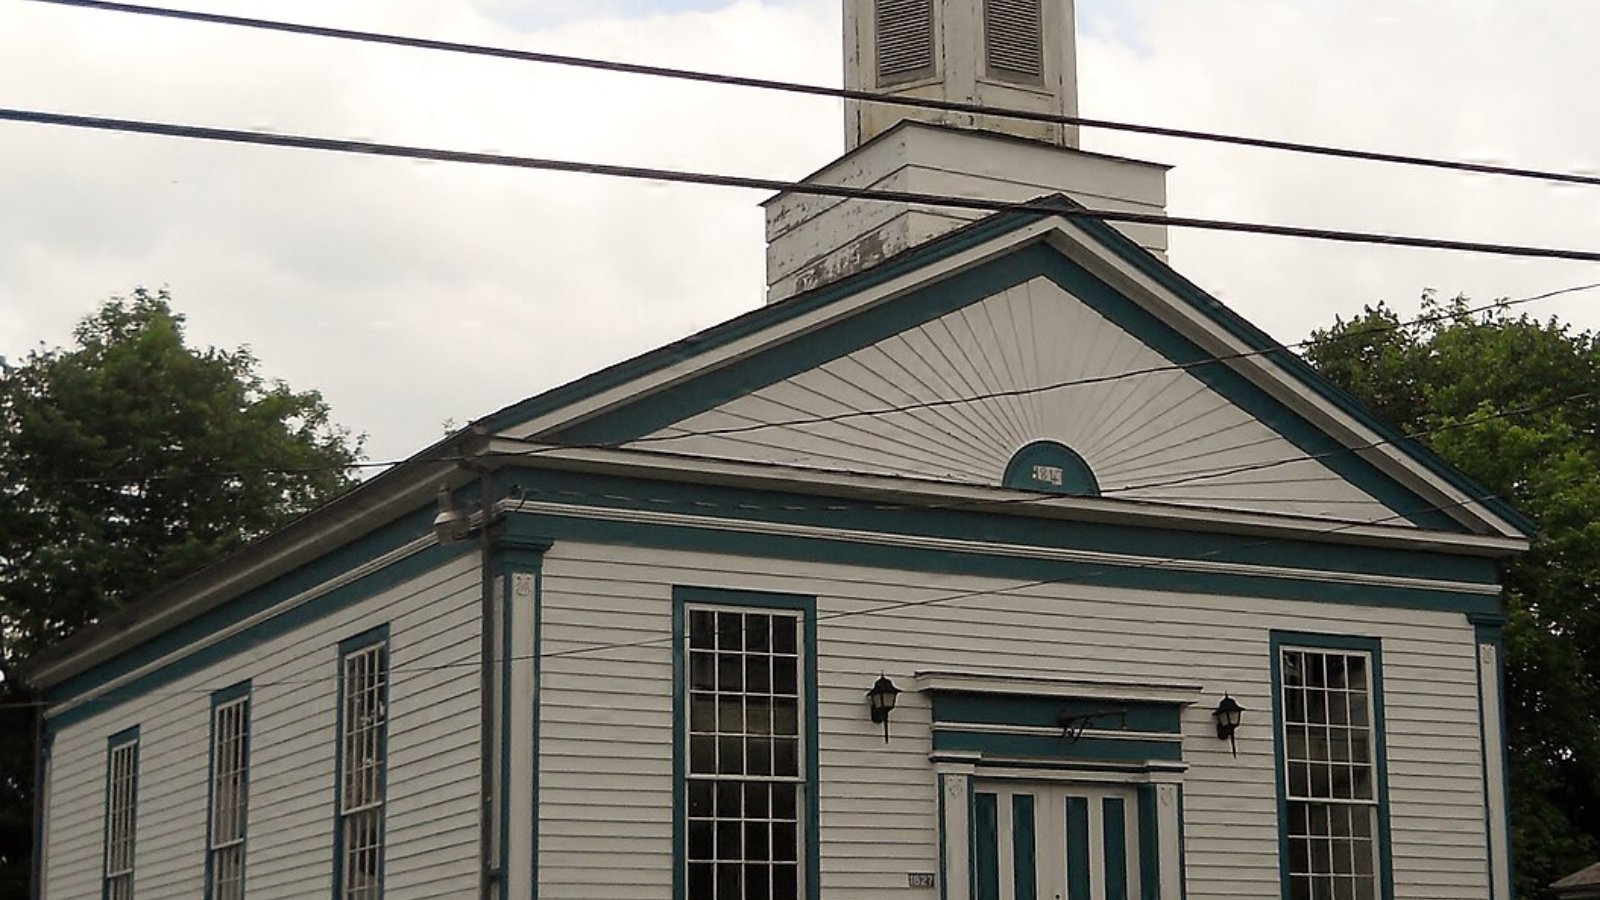
28. Westford – 78% Home Price Increase Since 2012
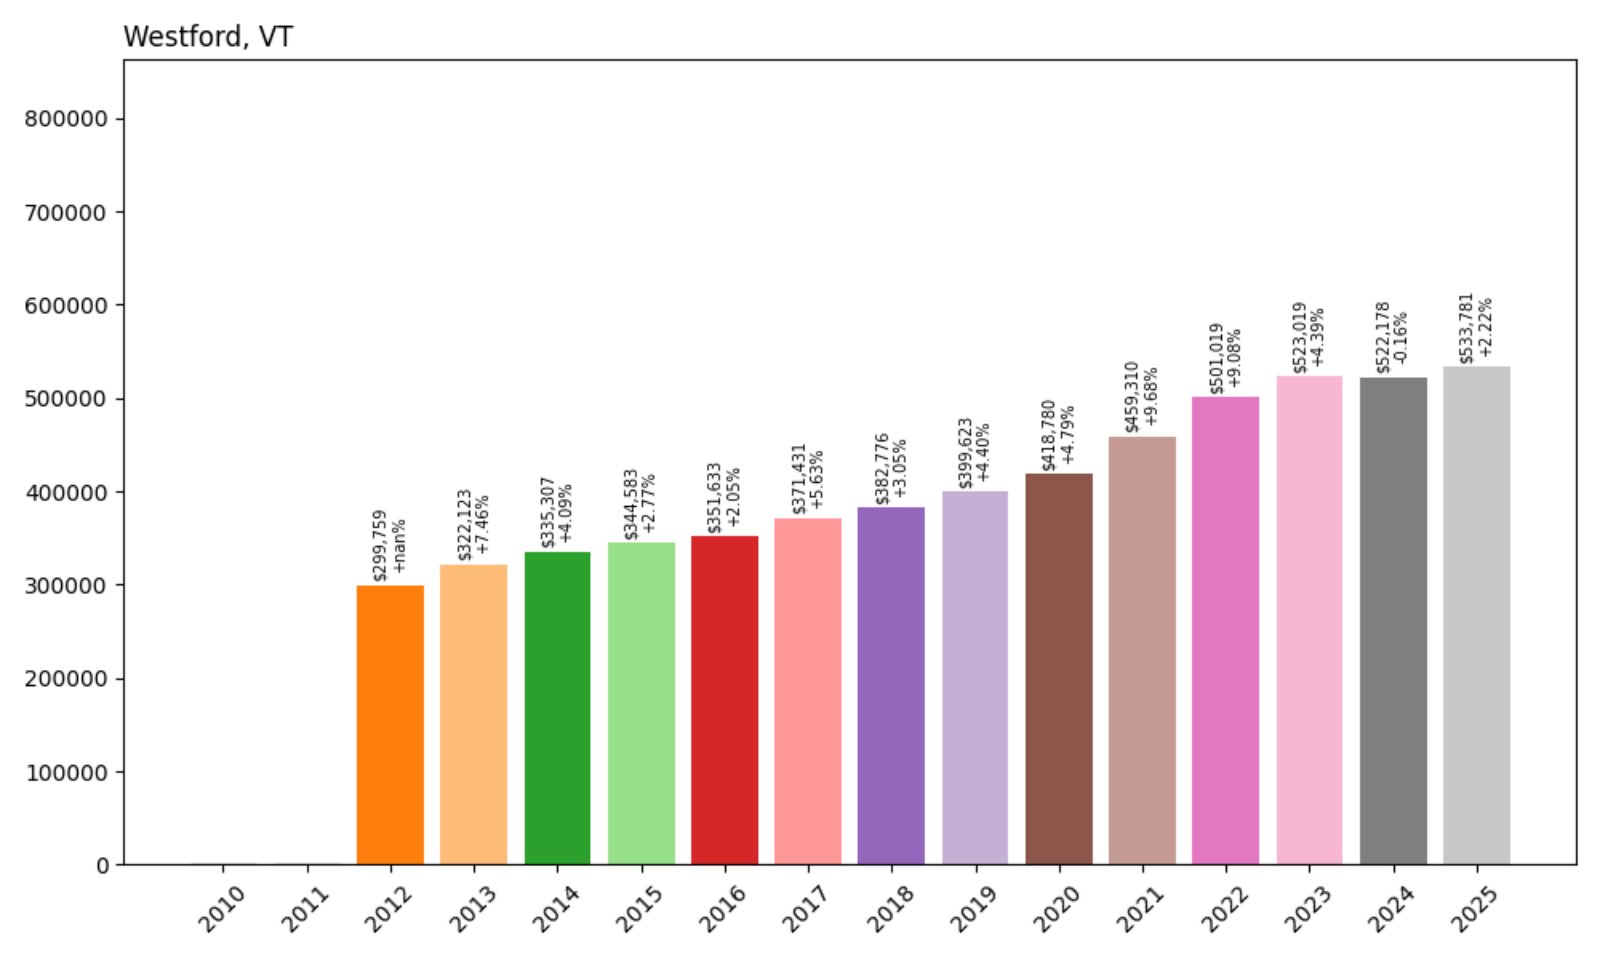
- 2012: $299,759
- 2013: $322,123 (+$22,364, +7.46%)
- 2014: $335,307 (+$13,184, +4.09%)
- 2015: $344,583 (+$9,276, +2.77%)
- 2016: $351,633 (+$7,050, +2.05%)
- 2017: $371,431 (+$19,798, +5.63%)
- 2018: $382,776 (+$11,345, +3.05%)
- 2019: $399,623 (+$16,847, +4.40%)
- 2020: $418,780 (+$19,157, +4.79%)
- 2021: $459,310 (+$40,530, +9.68%)
- 2022: $501,019 (+$41,709, +9.08%)
- 2023: $523,019 (+$22,000, +4.39%)
- 2024: $522,178 (−$841, −0.16%)
- 2025: $533,781 (+$11,603, +2.22%)
Westford’s housing market has expanded 78% since 2012, reaching $533,781 in 2025. Growth has been steady over the past decade, with notable momentum since 2020. The brief slowdown in 2024 was followed by a recovery in 2025, signaling sustained buyer interest.
Westford – Steady Growth in a Classic Vermont Setting
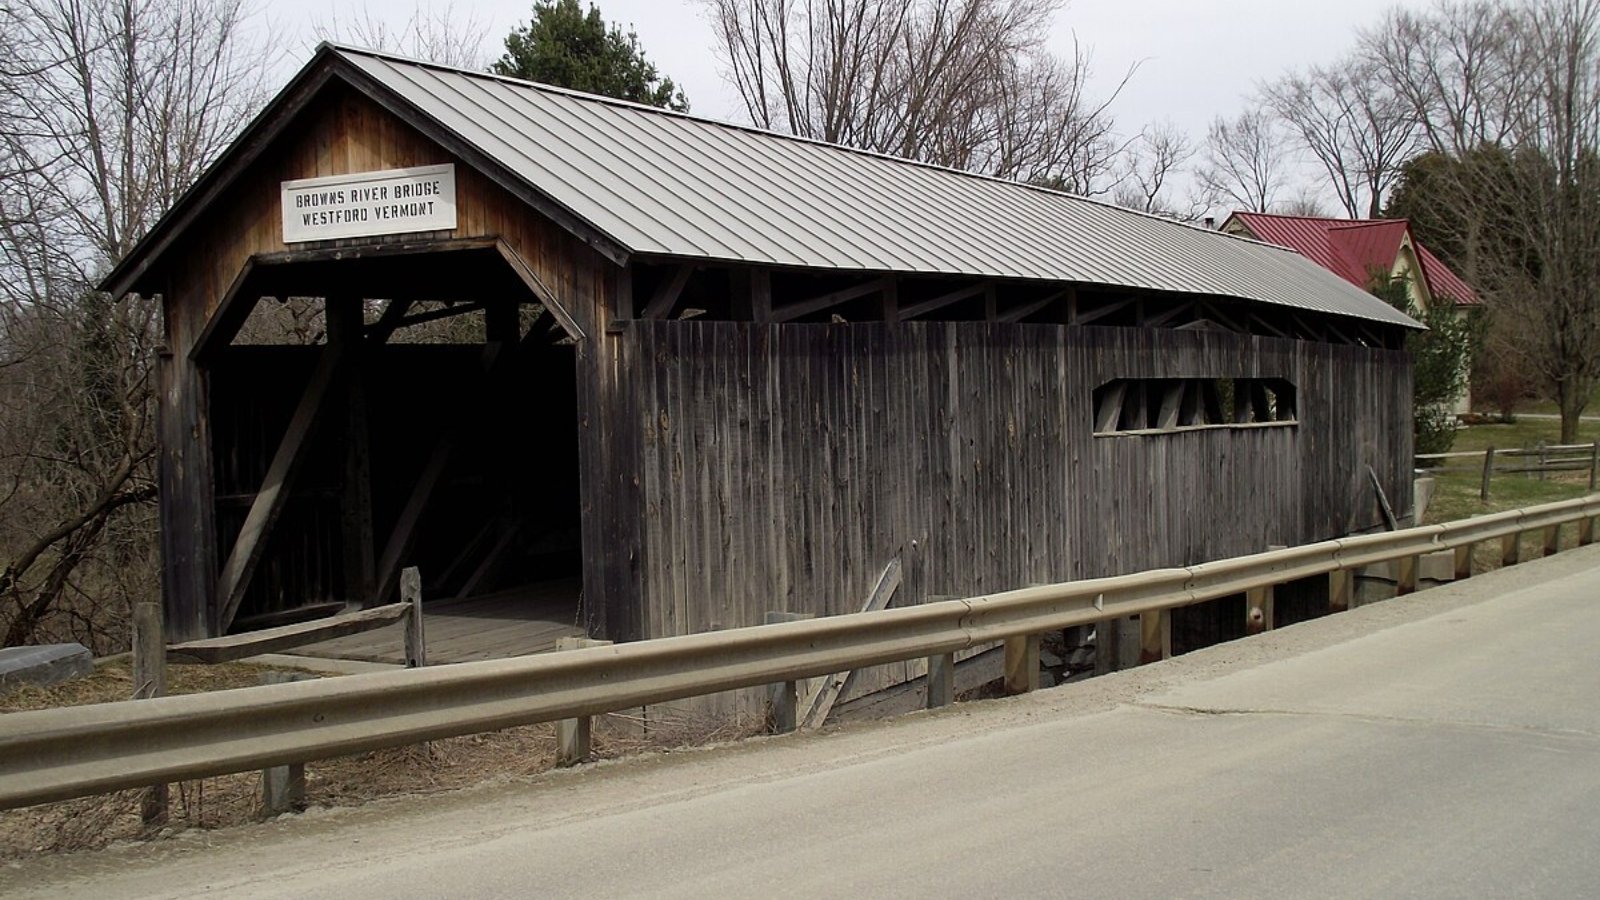
Nestled in Chittenden County, just northeast of Essex, Westford is a quiet residential town with a growing appeal for families and professionals seeking rural living close to Burlington. With scenic fields, farms, and forested areas, it offers a classic Vermont feel without being isolated.
As prices in nearby suburbs climbed, Westford became a logical next step for buyers looking for more space. School quality and natural beauty continue to support strong demand. Though not a high-profile market, Westford’s reliable price growth has made it a standout among Vermont’s more affordable upscale towns.
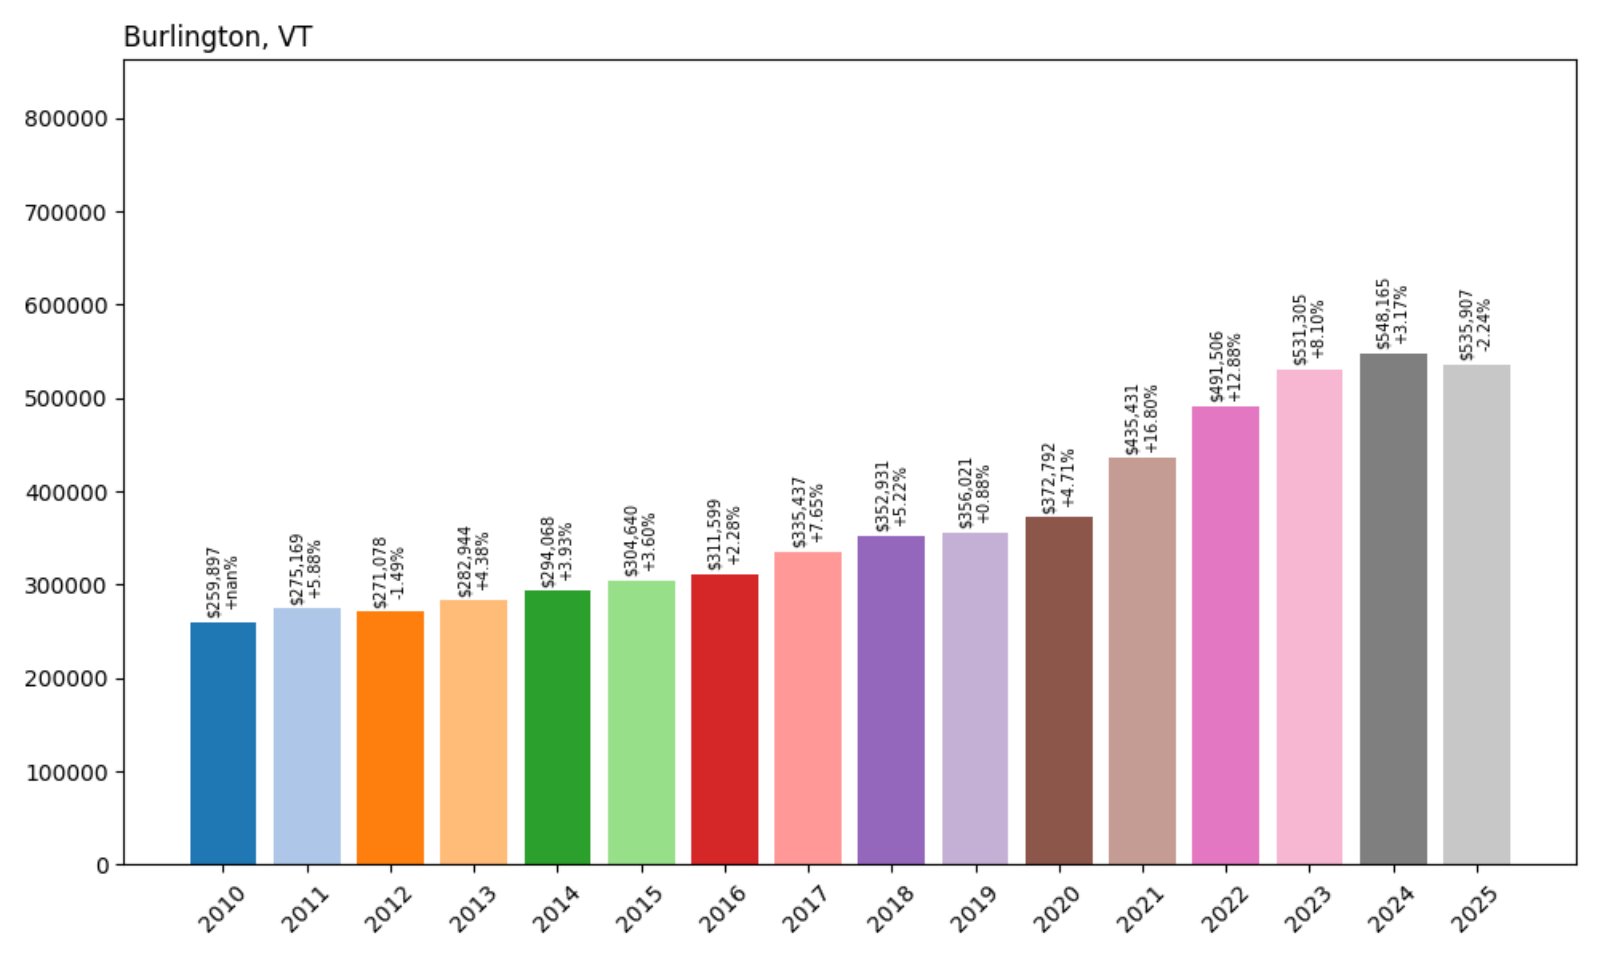
27. Burlington – 106% Home Price Increase Since 2010
🔥 Would you like to save this?
- 2010: $259,897
- 2011: $275,169 (+$15,271, +5.88%)
- 2012: $271,078 (−$4,091, −1.49%)
- 2013: $282,944 (+$11,865, +4.38%)
- 2014: $294,068 (+$11,124, +3.93%)
- 2015: $304,640 (+$10,572, +3.60%)
- 2016: $311,599 (+$6,959, +2.28%)
- 2017: $335,437 (+$23,838, +7.65%)
- 2018: $352,931 (+$17,494, +5.22%)
- 2019: $356,021 (+$3,090, +0.88%)
- 2020: $372,792 (+$16,771, +4.71%)
- 2021: $435,431 (+$62,639, +16.80%)
- 2022: $491,506 (+$56,075, +12.88%)
- 2023: $531,305 (+$39,798, +8.10%)
- 2024: $548,165 (+$16,861, +3.17%)
- 2025: $535,907 (−$12,258, −2.24%)
Over the past 15 years, Burlington’s housing market has more than doubled in value, growing 106% since 2010. With peaks in 2022 and 2023, recent fluctuations suggest some cooling, but prices remain among Vermont’s highest.
Burlington – Vermont’s Urban Anchor with Strong Appeal
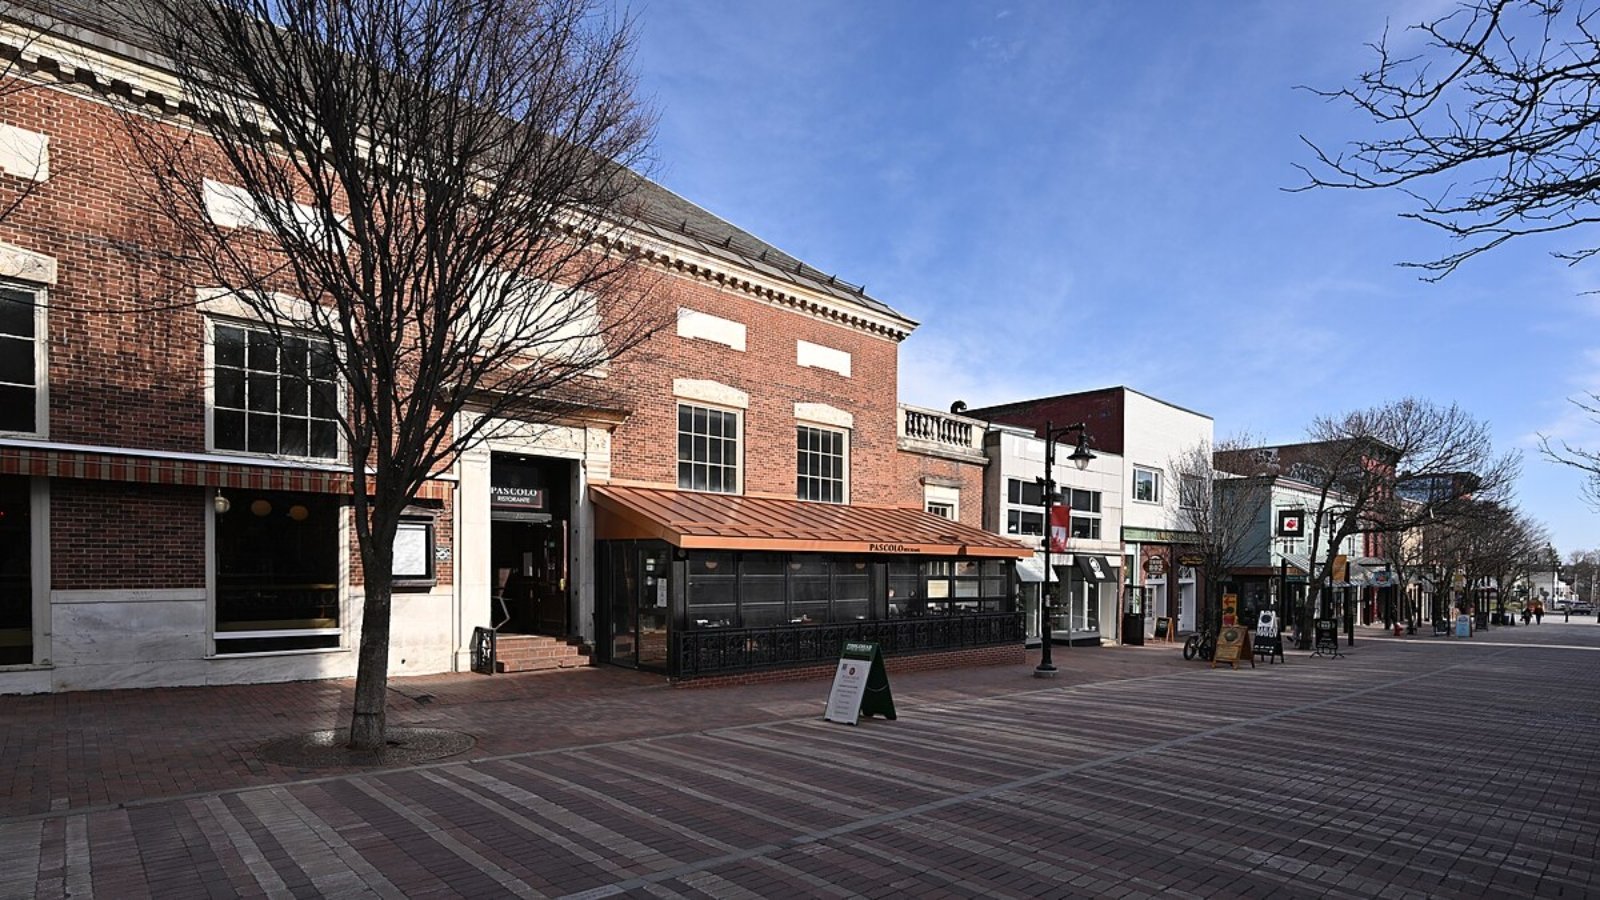
As Vermont’s largest city, Burlington blends walkable urban living with lakefront views and a vibrant cultural scene. Home to the University of Vermont and a bustling downtown, it attracts students, professionals, and families alike.
Demand surged post-2020 due to remote work trends and increased migration to scenic small cities. Though growth has softened slightly in 2025, high demand and limited inventory keep Burlington’s market competitive. As a hub for business and healthcare in northern Vermont, its real estate value remains strong long-term.
26. Morristown – 127% Home Price Increase Since 2010
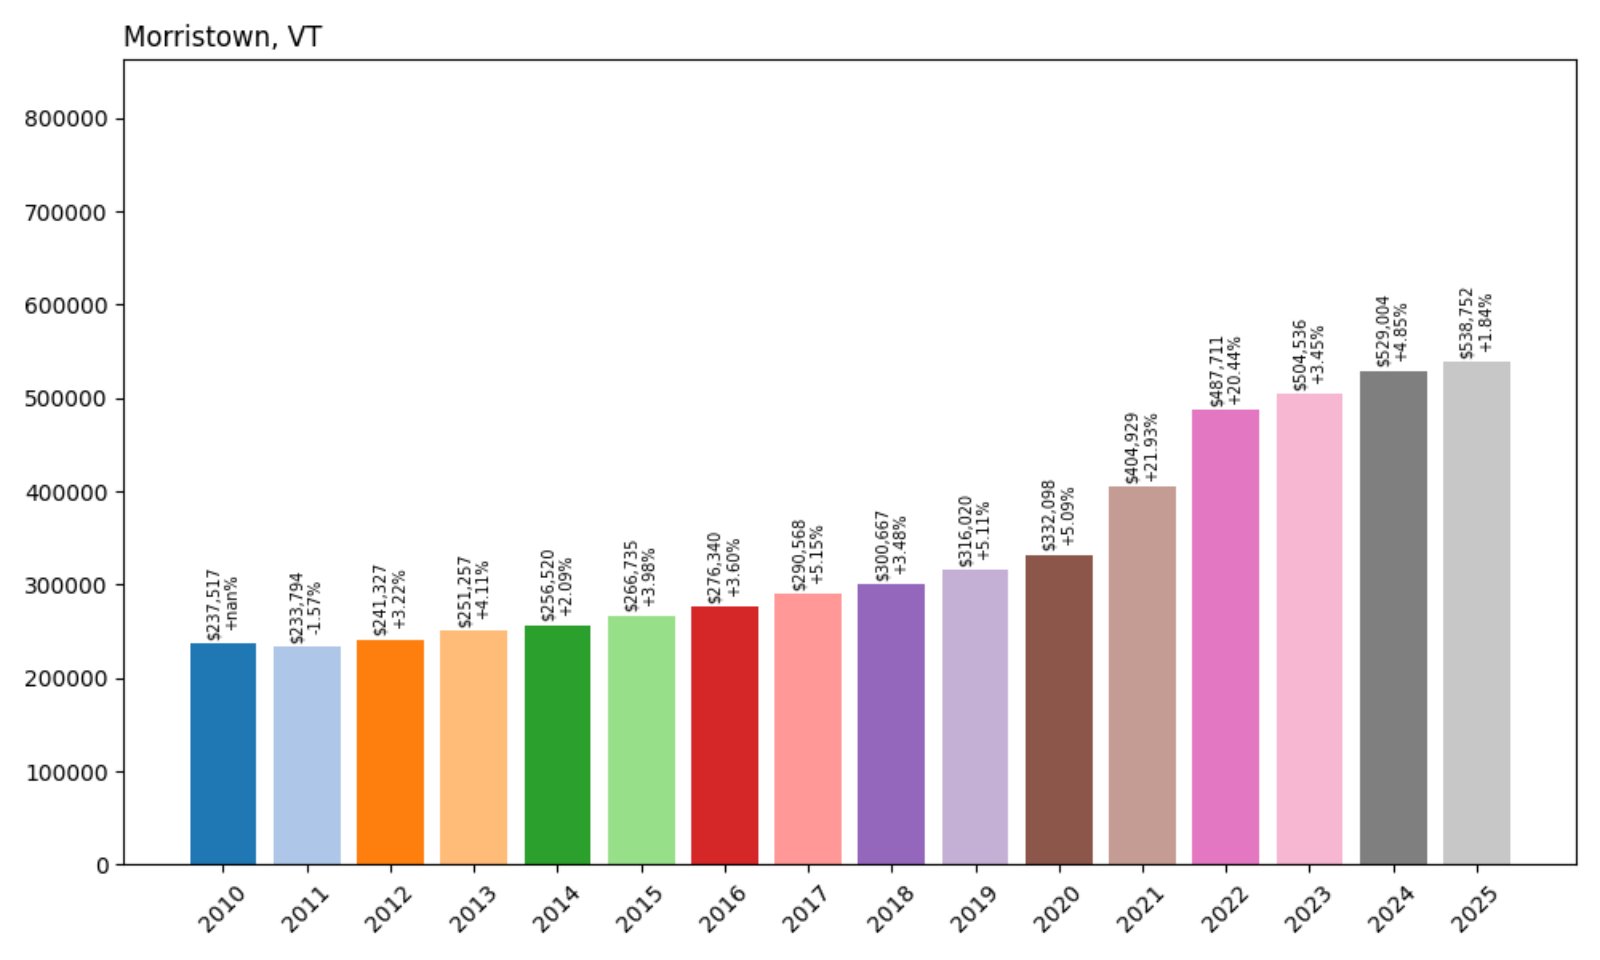
- 2010: $237,517
- 2011: $233,794 (−$3,723, −1.57%)
- 2012: $241,327 (+$7,533, +3.22%)
- 2013: $251,257 (+$9,929, +4.11%)
- 2014: $256,520 (+$5,264, +2.09%)
- 2015: $266,735 (+$10,215, +3.98%)
- 2016: $276,340 (+$9,604, +3.60%)
- 2017: $290,568 (+$14,228, +5.15%)
- 2018: $300,667 (+$10,099, +3.48%)
- 2019: $316,020 (+$15,353, +5.11%)
- 2020: $332,098 (+$16,078, +5.09%)
- 2021: $404,929 (+$72,831, +21.93%)
- 2022: $487,711 (+$82,782, +20.44%)
- 2023: $504,536 (+$16,825, +3.45%)
- 2024: $529,004 (+$24,468, +4.85%)
- 2025: $538,752 (+$9,748, +1.84%)
Morristown home values have surged 127% since 2010, nearly doubling over the past decade and a half. Growth accelerated after 2020 and continued consistently through 2025, showing the town’s growing real estate strength.
Morristown – A Gateway to Stowe’s Popularity
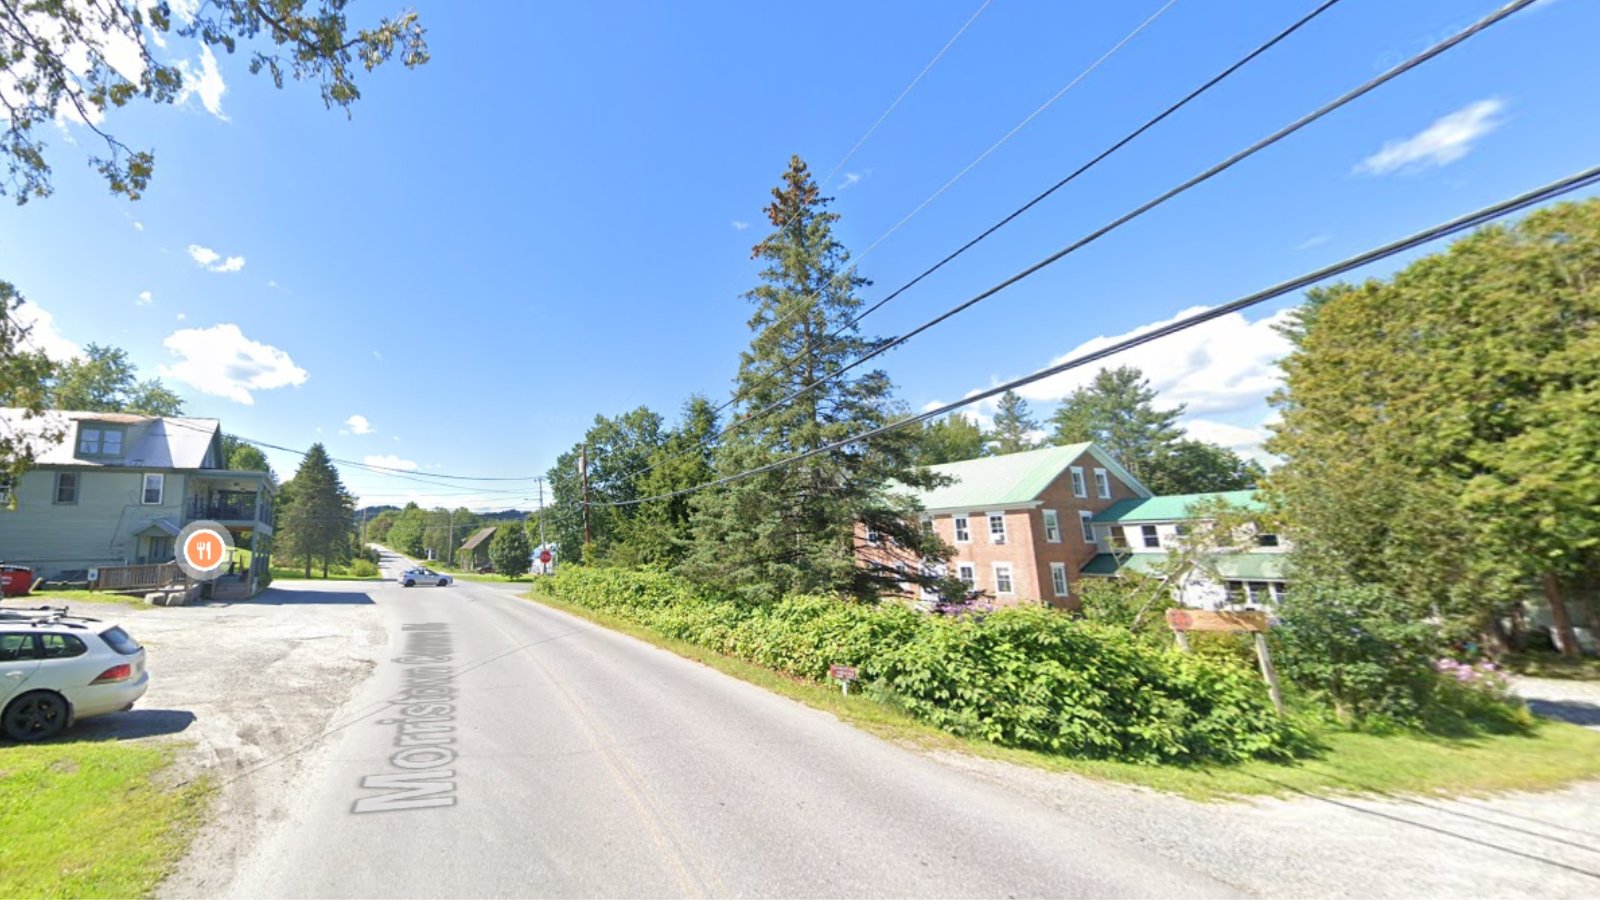
Located just southeast of the tourism hotspot Stowe, Morristown offers a more affordable, accessible alternative while still benefiting from the region’s economic engine. The town has become popular with year-round residents and second-home buyers priced out of Stowe.
Its housing stock has expanded, and investment in local amenities — from restaurants to recreation — has helped drive demand. With easy access to skiing, hiking, and scenic drives, Morristown has matured into a desirable market in its own right, and 2025 prices reflect that climb.
25. North Hero – 82% Home Price Increase Since 2010
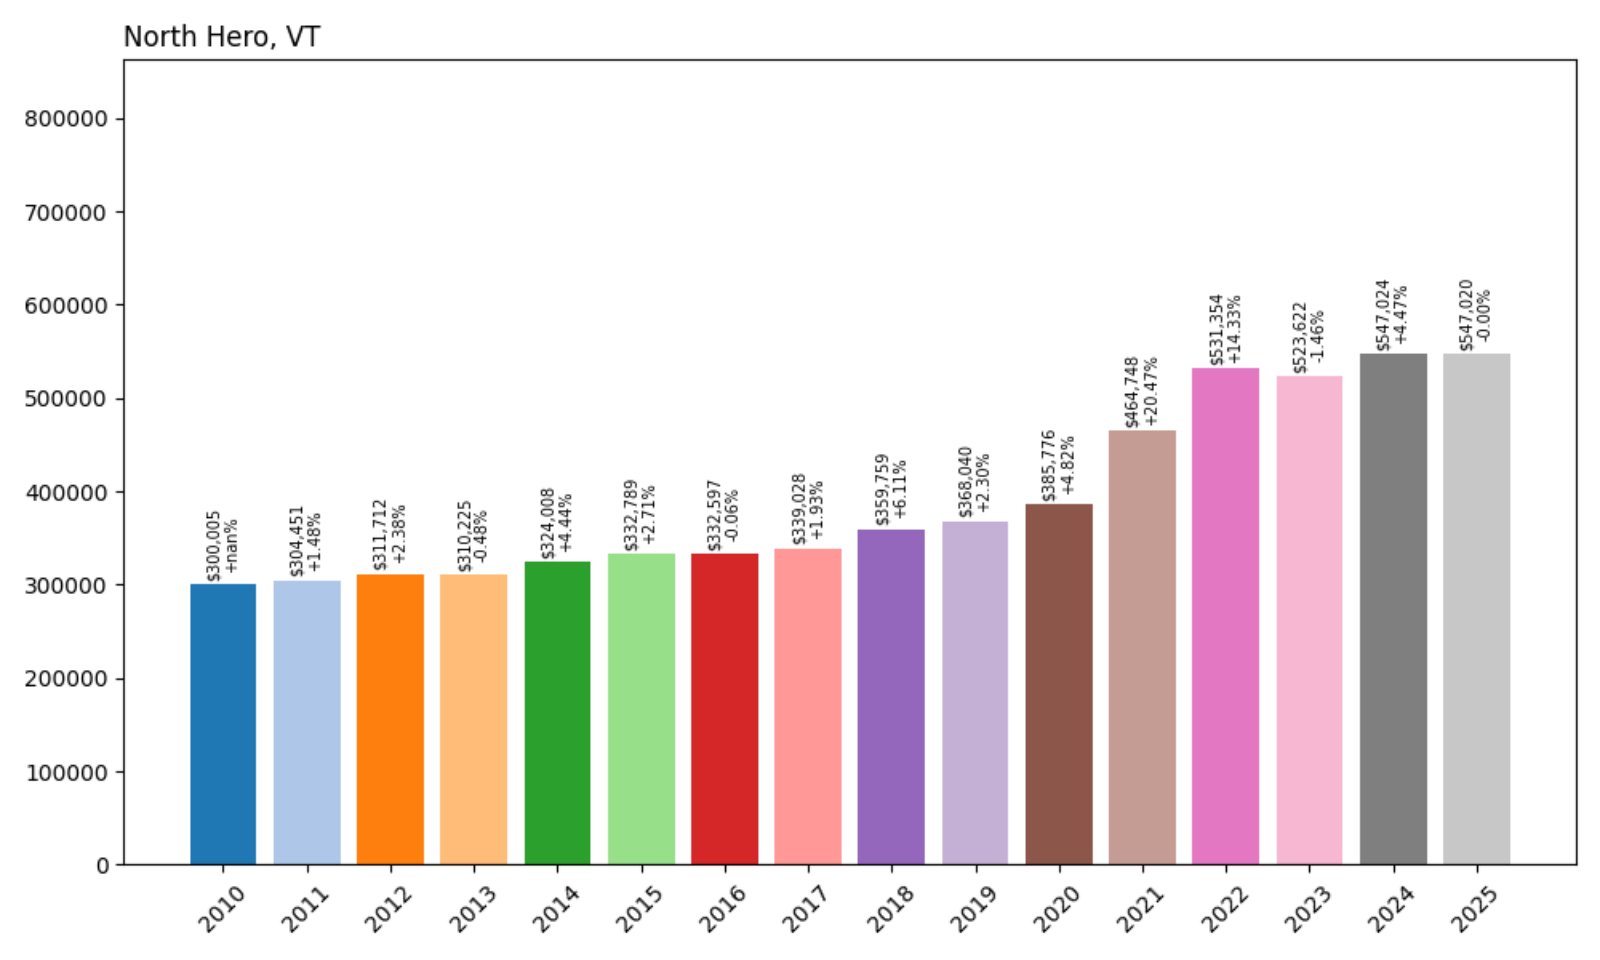
- 2010: $300,005
- 2011: $304,451 (+$4,447, +1.48%)
- 2012: $311,712 (+$7,261, +2.38%)
- 2013: $310,225 (−$1,487, −0.48%)
- 2014: $324,008 (+$13,783, +4.44%)
- 2015: $332,789 (+$8,781, +2.71%)
- 2016: $332,597 (−$192, −0.06%)
- 2017: $339,028 (+$6,431, +1.93%)
- 2018: $359,759 (+$20,731, +6.11%)
- 2019: $368,040 (+$8,281, +2.30%)
- 2020: $385,776 (+$17,736, +4.82%)
- 2021: $464,748 (+$78,972, +20.47%)
- 2022: $531,354 (+$66,606, +14.33%)
- 2023: $523,622 (−$7,732, −1.46%)
- 2024: $547,024 (+$23,402, +4.47%)
- 2025: $547,020 (−$4, −0.00%)
North Hero has experienced an 82% increase in home values since 2010, with sharp gains from 2020 through 2022. Prices have steadied since then, with no meaningful change in 2025, indicating stability at a high level.
North Hero – Island Living Along Lake Champlain
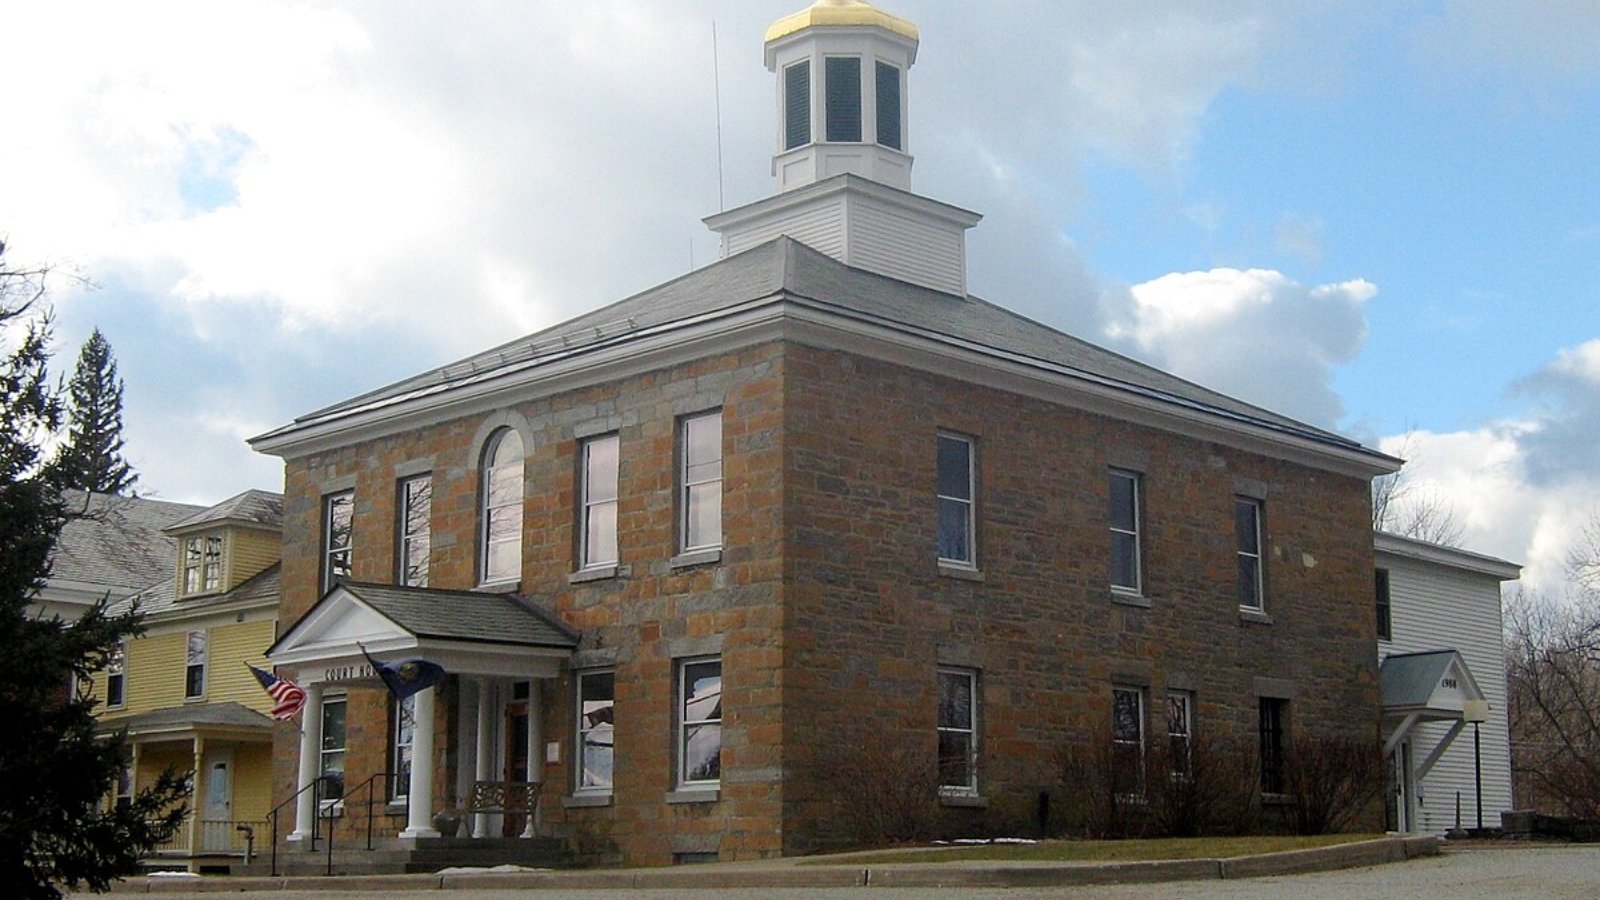
Part of the Lake Champlain Islands in Grand Isle County, North Hero offers water views, boating, and a uniquely tranquil lifestyle. Its homes often serve as vacation or retirement properties, and the town remains one of Vermont’s most distinctive settings.
With limited housing stock and strong demand for waterfront properties, prices jumped during the pandemic and have held firm since. Its mix of seasonal cottages and higher-end year-round residences help support its position on this list, even as the pace of growth slows in 2025.
24. Fayston – 113% Home Price Increase Since 2010
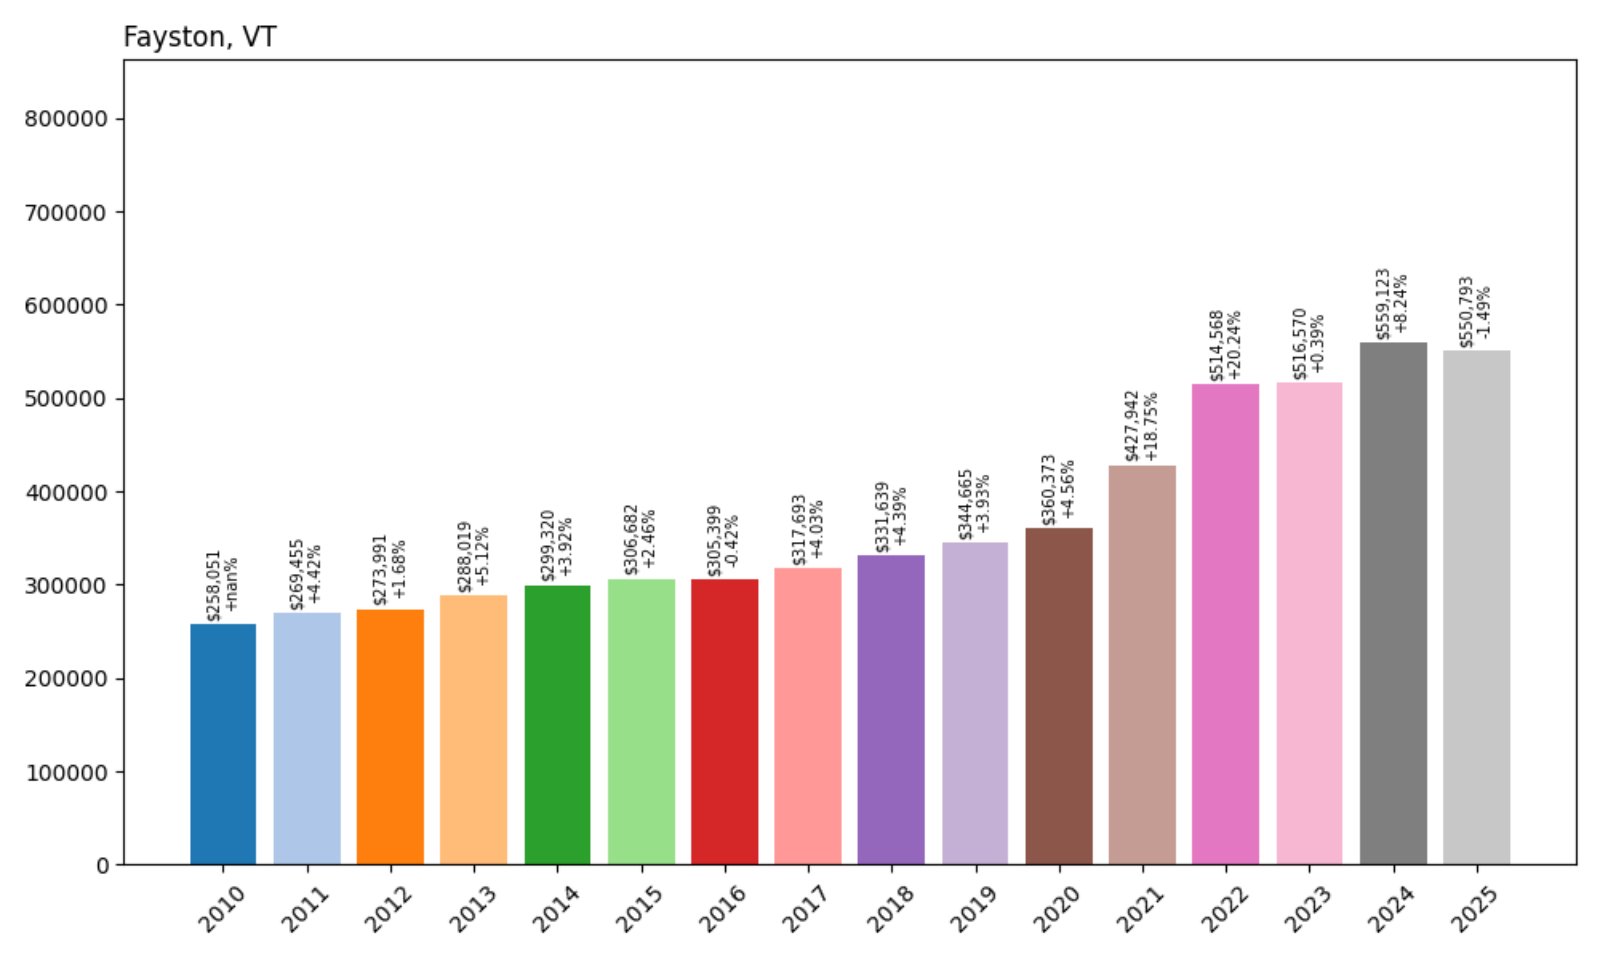
- 2010: $258,051
- 2011: $269,455 (+$11,404, +4.42%)
- 2012: $273,991 (+$4,537, +1.68%)
- 2013: $288,019 (+$14,028, +5.12%)
- 2014: $299,320 (+$11,301, +3.92%)
- 2015: $306,682 (+$7,362, +2.46%)
- 2016: $305,399 (−$1,283, −0.42%)
- 2017: $317,693 (+$12,294, +4.03%)
- 2018: $331,639 (+$13,945, +4.39%)
- 2019: $344,665 (+$13,027, +3.93%)
- 2020: $360,373 (+$15,707, +4.56%)
- 2021: $427,942 (+$67,569, +18.75%)
- 2022: $514,568 (+$86,626, +20.24%)
- 2023: $516,570 (+$2,002, +0.39%)
- 2024: $559,123 (+$42,552, +8.24%)
- 2025: $550,793 (−$8,330, −1.49%)
Fayston’s home values have more than doubled since 2010, with a total increase of 113%. The biggest gains came between 2020 and 2022, followed by moderate growth and a small drop in 2025. Still, prices remain far above pre-pandemic levels.
Fayston – Big Mountain Access, Small-Town Atmosphere
Fayston sits in Washington County and shares a border with Mad River Glen and Sugarbush ski resorts. Though less commercial than neighboring Warren, it’s highly desirable for skiers and second-home owners who want close access to the slopes without the bustle.
The sharp price growth between 2020 and 2022 speaks to heightened demand for mountain properties during the pandemic. Even with the slight 2025 dip, prices remain historically high, supported by its excellent location and year-round outdoor lifestyle.
23. Waitsfield – 101% Home Price Increase Since 2010
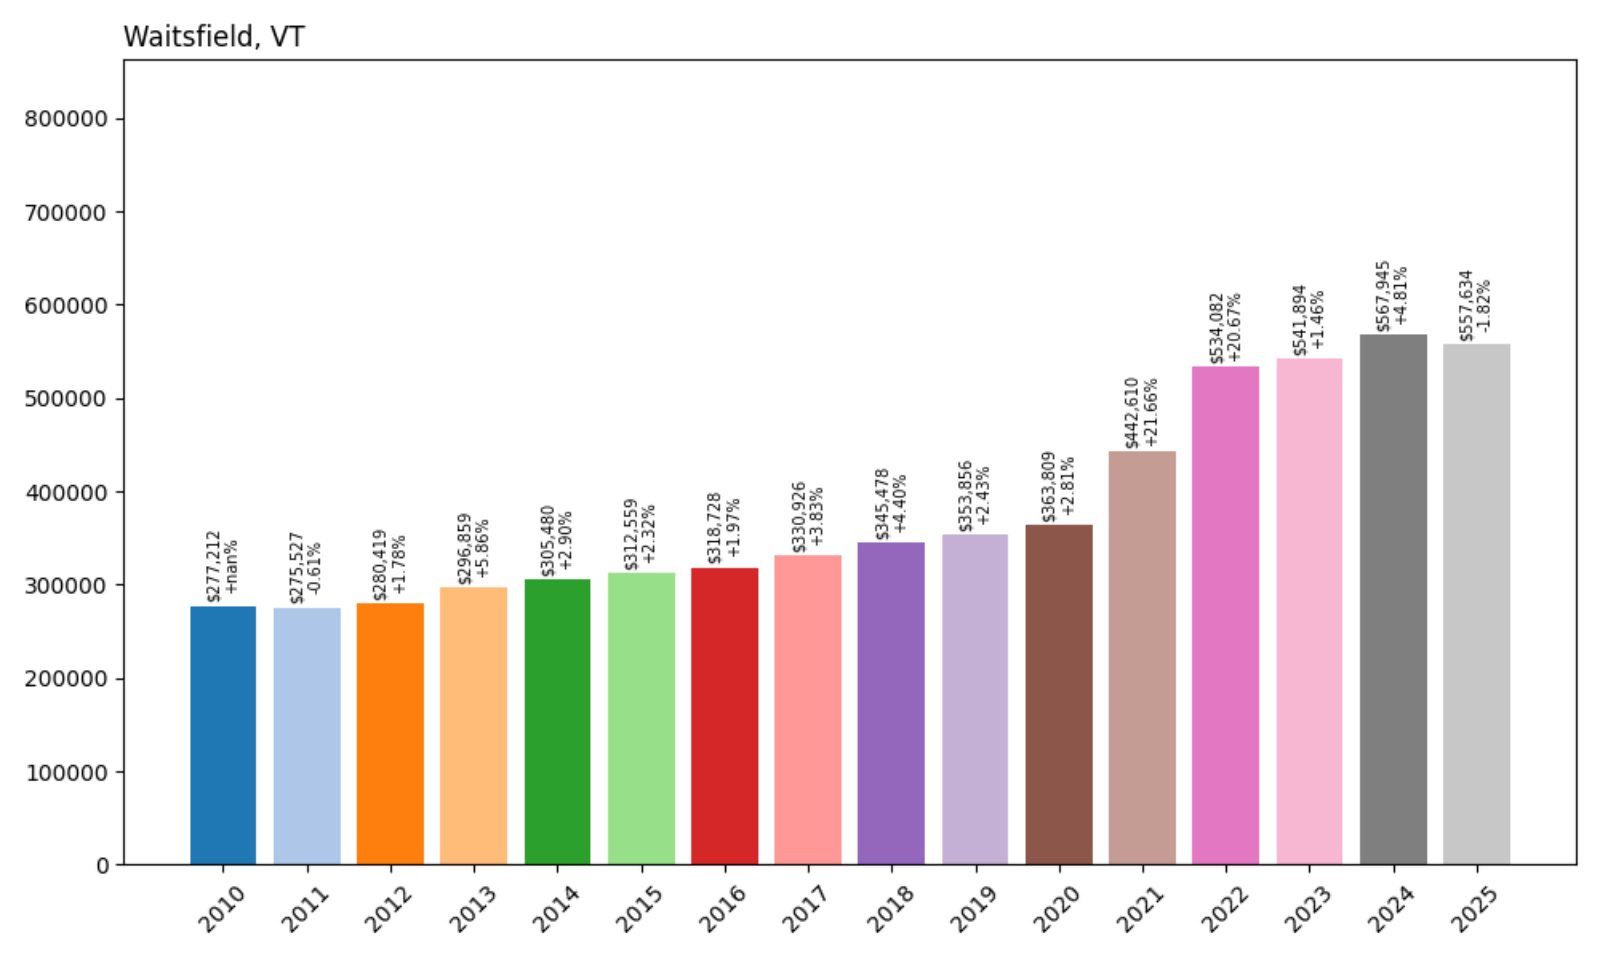
- 2010: $277,212
- 2011: $275,527 (−$1,685, −0.61%)
- 2012: $280,419 (+$4,892, +1.78%)
- 2013: $296,859 (+$16,440, +5.86%)
- 2014: $305,480 (+$8,621, +2.90%)
- 2015: $312,559 (+$7,079, +2.32%)
- 2016: $318,728 (+$6,169, +1.97%)
- 2017: $330,926 (+$12,198, +3.83%)
- 2018: $345,478 (+$14,552, +4.40%)
- 2019: $353,856 (+$8,378, +2.43%)
- 2020: $363,809 (+$9,953, +2.81%)
- 2021: $442,610 (+$78,802, +21.66%)
- 2022: $534,082 (+$91,472, +20.67%)
- 2023: $541,894 (+$7,812, +1.46%)
- 2024: $567,945 (+$26,051, +4.81%)
- 2025: $557,634 (−$10,311, −1.82%)
Home values in Waitsfield have grown 101% since 2010, with particularly large increases in 2021 and 2022. Recent fluctuations indicate a more stable market in 2025, even after a slight pullback in prices.
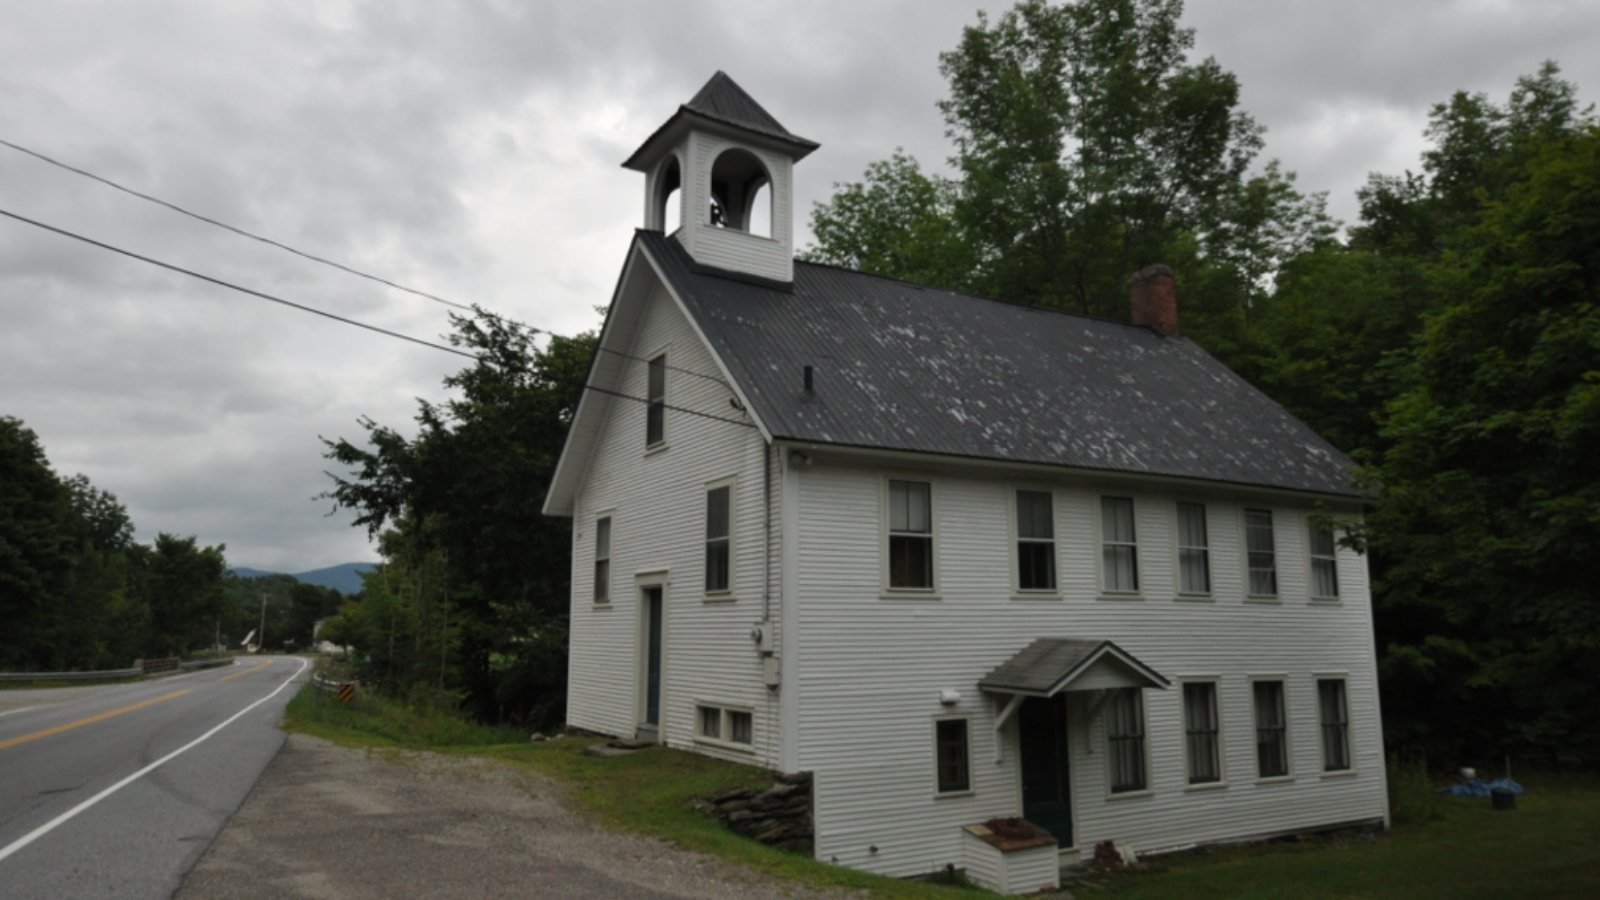
Waitsfield – Heart of the Mad River Valley
Waitsfield is the cultural and commercial center of the Mad River Valley, known for its art galleries, restaurants, and proximity to Sugarbush and Mad River Glen. Its blend of year-round residents and second-homeowners fuels a consistently strong housing market.
Post-pandemic interest in lifestyle-focused communities gave Waitsfield a major boost. Even with a modest 2025 correction, the town remains a high-demand location for buyers seeking charm, scenery, and quick access to Vermont’s premier ski terrain.
22. Waterbury – 91% Home Price Increase Since 2010
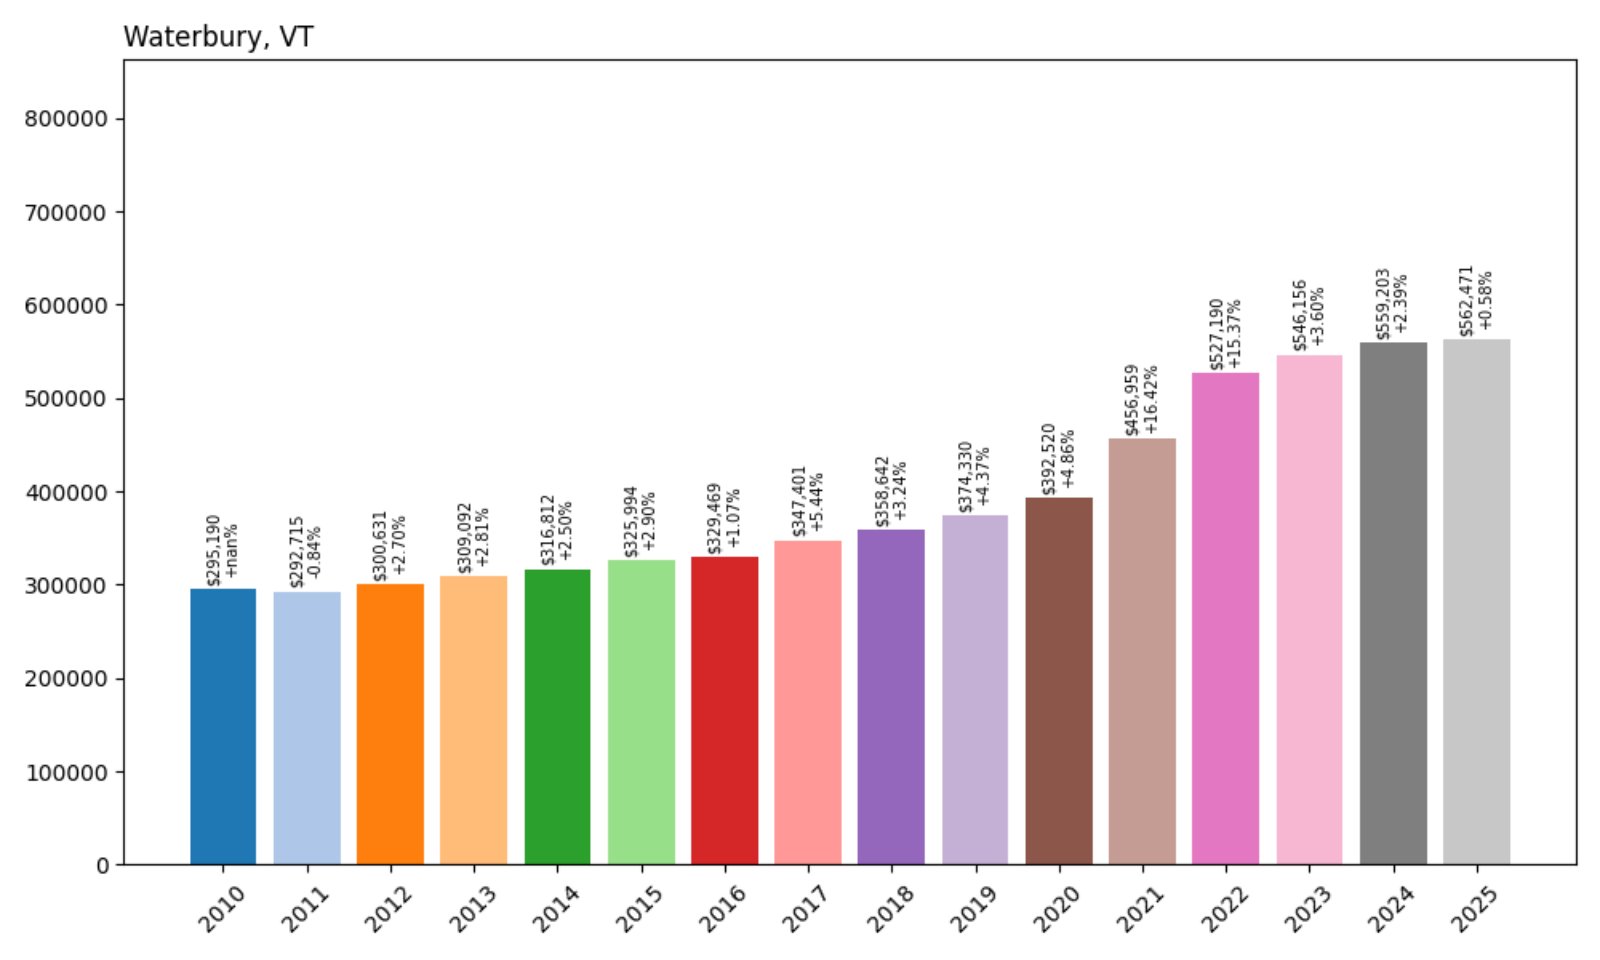
- 2010: $295,190
- 2011: $292,715 (−$2,476, −0.84%)
- 2012: $300,631 (+$7,916, +2.70%)
- 2013: $309,092 (+$8,461, +2.81%)
- 2014: $316,812 (+$7,720, +2.50%)
- 2015: $325,994 (+$9,182, +2.90%)
- 2016: $329,469 (+$3,475, +1.07%)
- 2017: $347,401 (+$17,932, +5.44%)
- 2018: $358,642 (+$11,241, +3.24%)
- 2019: $374,330 (+$15,688, +4.37%)
- 2020: $392,520 (+$18,190, +4.86%)
- 2021: $456,959 (+$64,438, +16.42%)
- 2022: $527,190 (+$70,231, +15.37%)
- 2023: $546,156 (+$18,966, +3.60%)
- 2024: $559,203 (+$13,047, +2.39%)
- 2025: $562,471 (+$3,268, +0.58%)
Waterbury’s housing market has climbed nearly 91% since 2010. Major increases occurred in the early 2020s, particularly in 2021 and 2022. Though growth has slowed, prices continue inching upward in 2025.
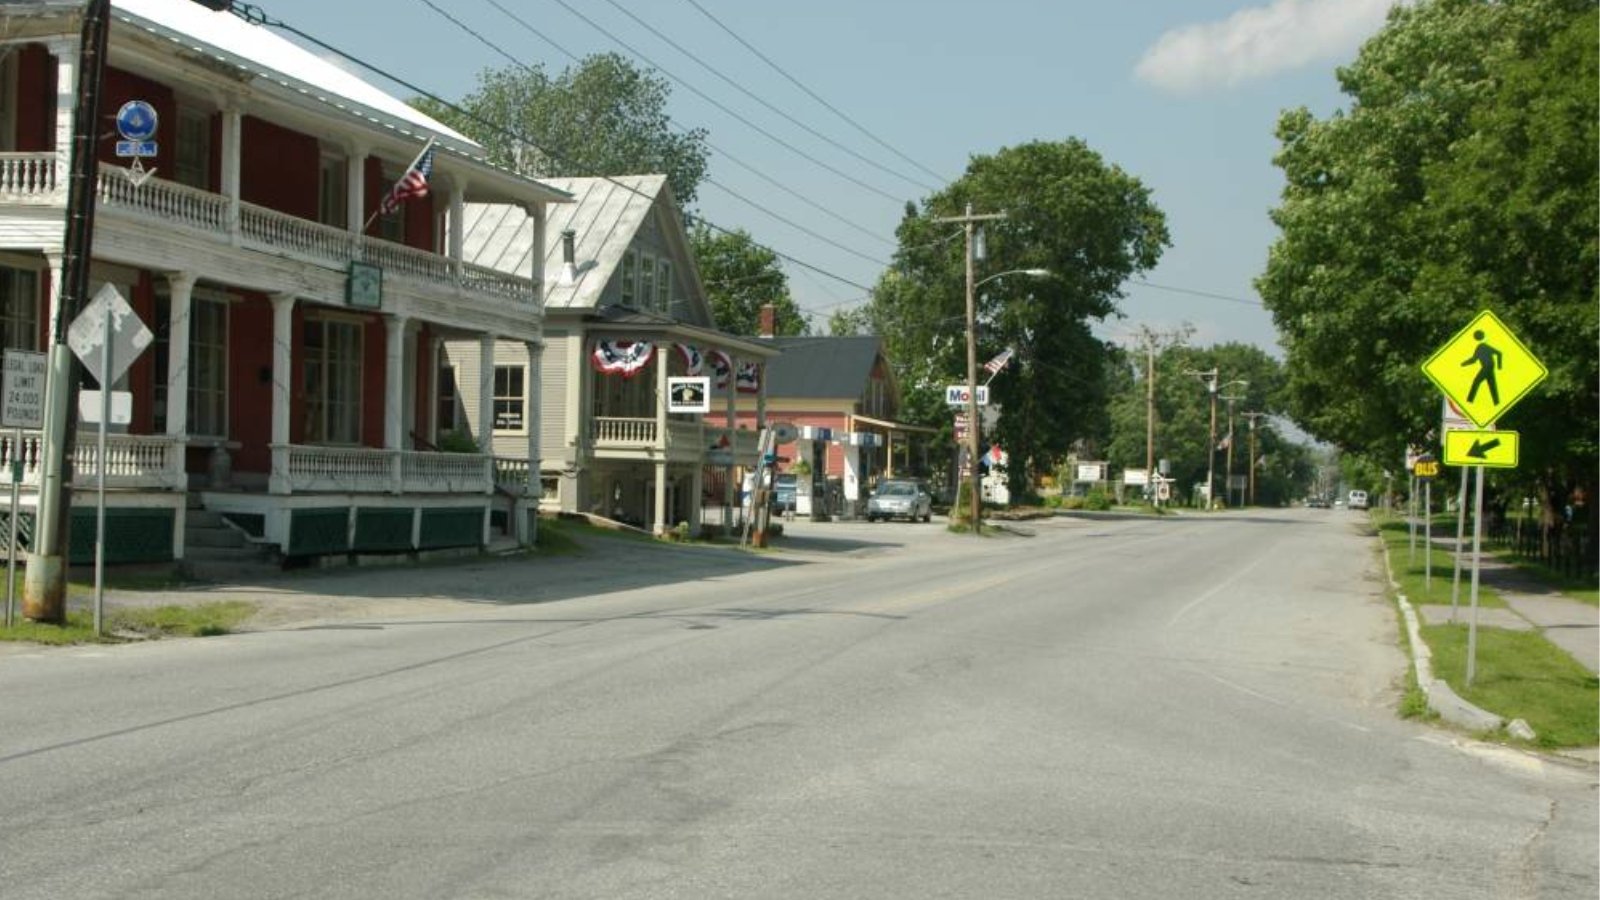
Waterbury – Central and Commutable, Yet Outdoorsy
Home to Ben & Jerry’s and nestled between Burlington and Montpelier, Waterbury offers both job access and recreational proximity to Stowe. This makes it popular with commuters and weekenders alike.
The town’s strategic location along I-89, combined with its growing amenities and charming downtown, has made it a consistently desirable market. As buyers sought balance between convenience and scenery, Waterbury delivered — and its stable 2025 pricing shows continued strength.
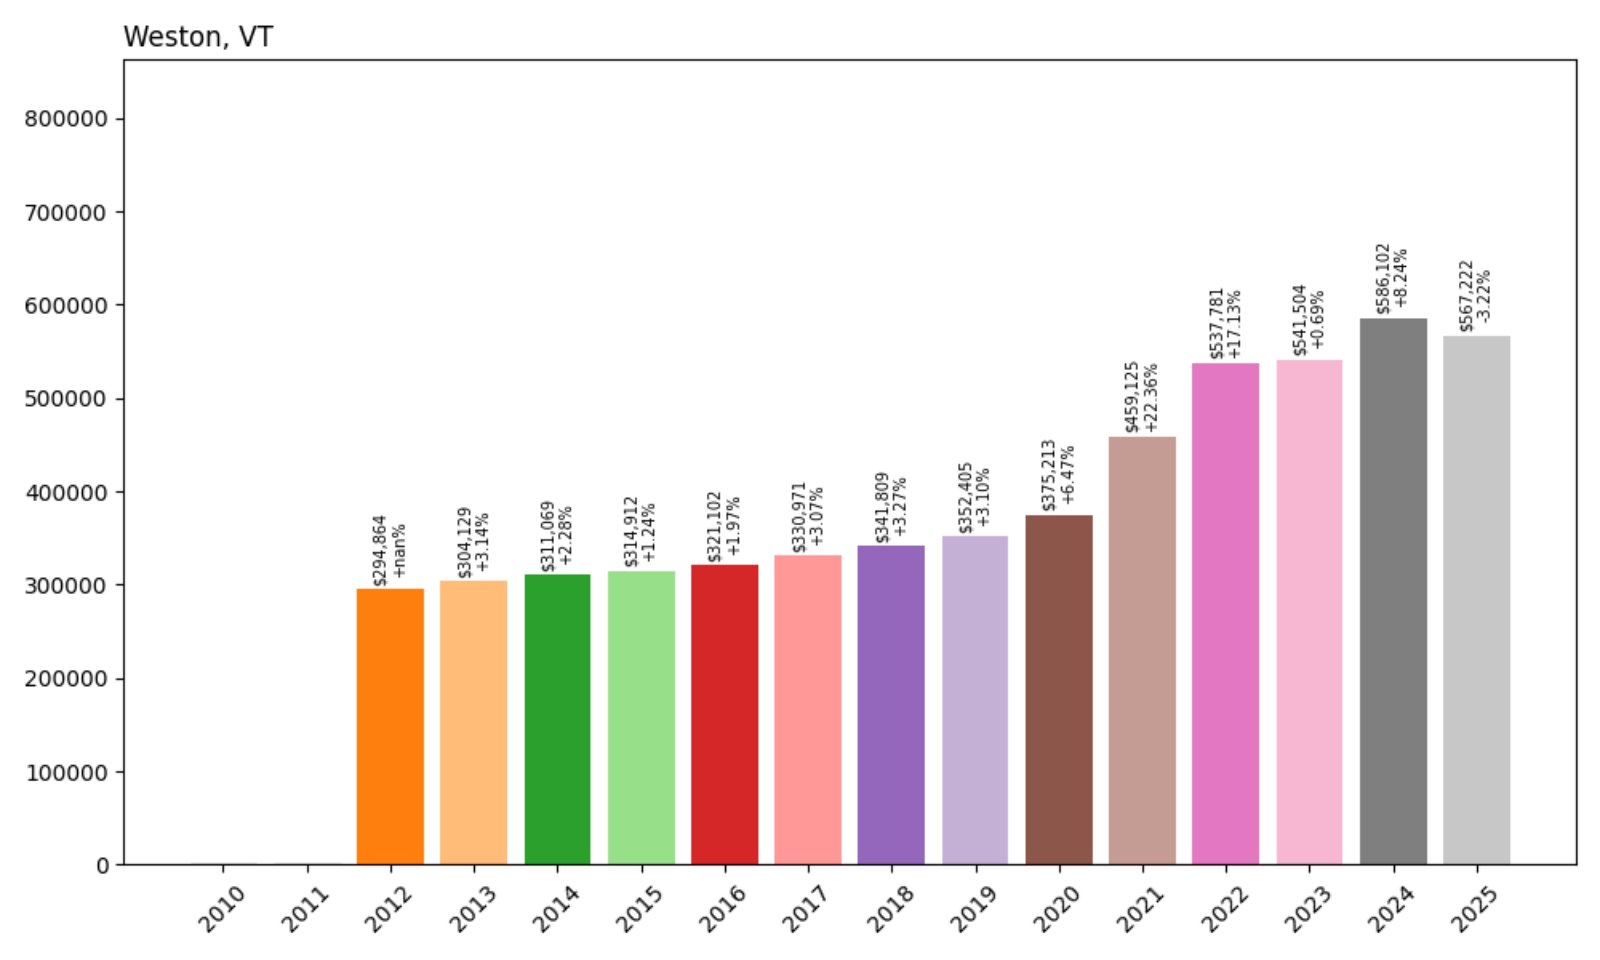
21. Weston – 92% Home Price Increase Since 2012
🔥 Would you like to save this?
- 2012: $294,864
- 2013: $304,129 (+$9,265, +3.14%)
- 2014: $311,069 (+$6,940, +2.28%)
- 2015: $314,912 (+$3,843, +1.24%)
- 2016: $321,102 (+$6,189, +1.97%)
- 2017: $330,971 (+$9,869, +3.07%)
- 2018: $341,809 (+$10,838, +3.27%)
- 2019: $352,405 (+$10,596, +3.10%)
- 2020: $375,213 (+$22,808, +6.47%)
- 2021: $459,125 (+$83,912, +22.36%)
- 2022: $537,781 (+$78,656, +17.13%)
- 2023: $541,504 (+$3,723, +0.69%)
- 2024: $586,102 (+$44,598, +8.24%)
- 2025: $567,222 (−$18,880, −3.22%)
Weston’s home prices rose 92% since 2012, with most of that growth occurring from 2020 onward. The sharp uptick in 2021 and 2022 was followed by continued strength — despite a slight decrease in 2025.
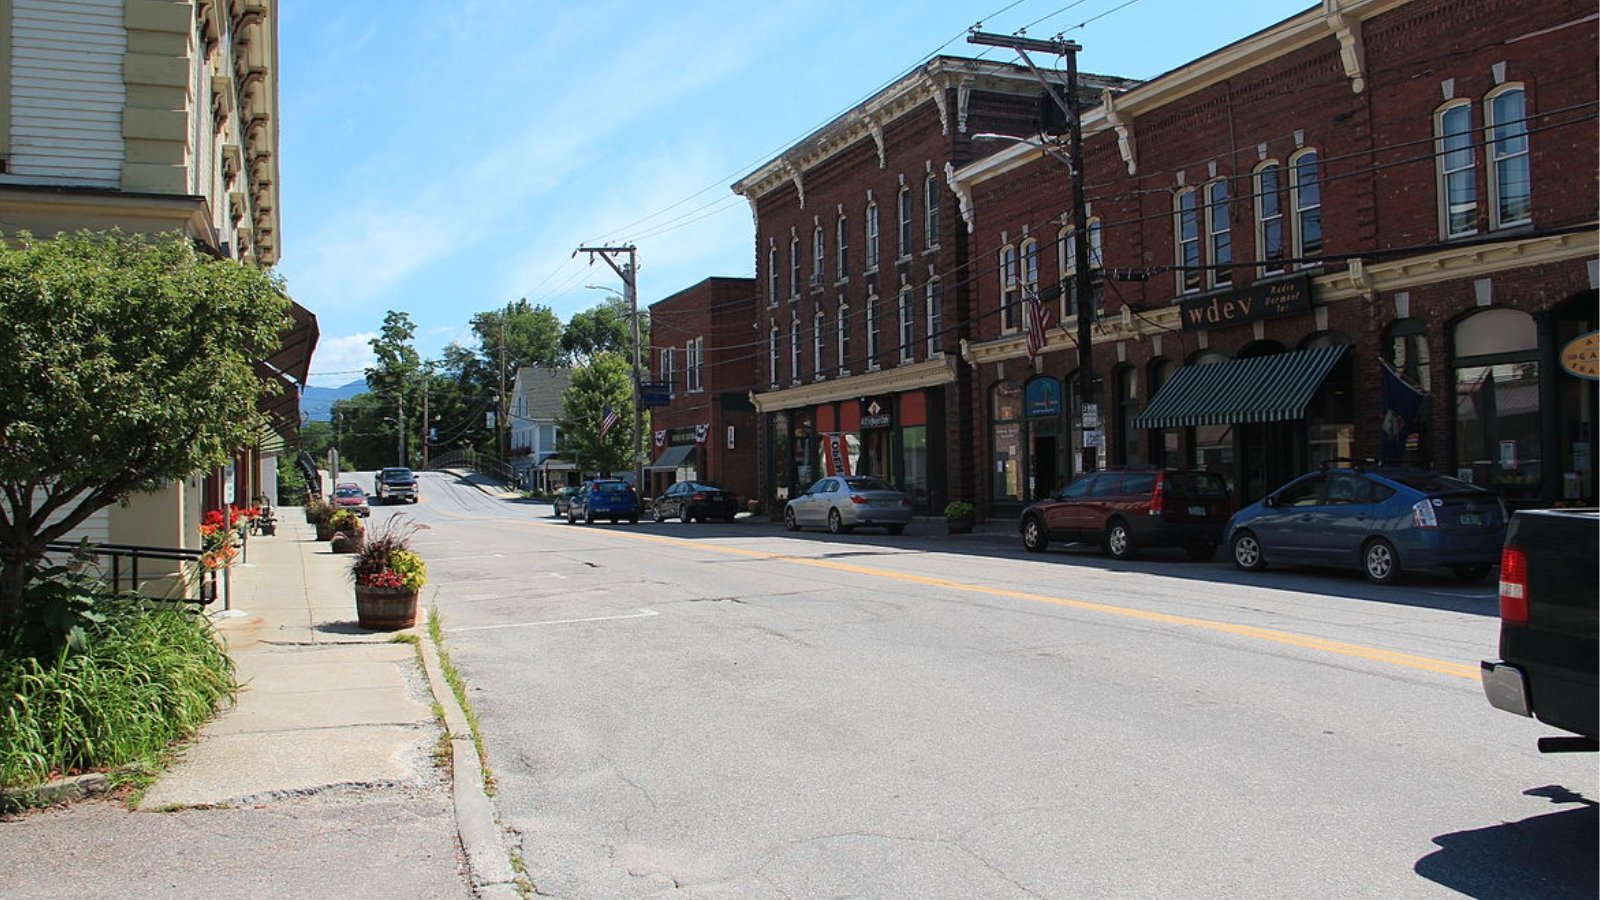
Weston – Theatrical Charm Meets Mountain Living
Known for the Weston Playhouse and Vermont Country Store, this Windsor County town blends cultural appeal with natural beauty. It’s small, quiet, and loaded with character, attracting buyers who want charm over convenience.
The market surged post-pandemic as buyers sought second homes in less-discovered locales. Though 2025 brought a minor pullback, Weston’s appeal as a serene, artsy village ensures continued long-term interest and value.
20. Jericho – 91% Home Price Increase Since 2010

- 2010: $298,515
- 2011: $312,329 (+$13,814, +4.63%)
- 2012: $306,922 (−$5,407, −1.73%)
- 2013: $313,737 (+$6,816, +2.22%)
- 2014: $327,799 (+$14,062, +4.48%)
- 2015: $329,110 (+$1,311, +0.40%)
- 2016: $333,966 (+$4,856, +1.48%)
- 2017: $355,271 (+$21,305, +6.38%)
- 2018: $372,677 (+$17,406, +4.90%)
- 2019: $384,662 (+$11,985, +3.22%)
- 2020: $401,903 (+$17,241, +4.48%)
- 2021: $463,149 (+$61,246, +15.24%)
- 2022: $530,189 (+$67,040, +14.47%)
- 2023: $540,852 (+$10,663, +2.01%)
- 2024: $564,906 (+$24,054, +4.45%)
- 2025: $570,121 (+$5,215, +0.92%)
Jericho’s home values have climbed 91% since 2010, rising steadily with few interruptions. Prices surged particularly in 2021 and 2022 and have continued to grow, albeit more modestly, in 2025.
Jericho – Rural Comfort with Burlington Proximity
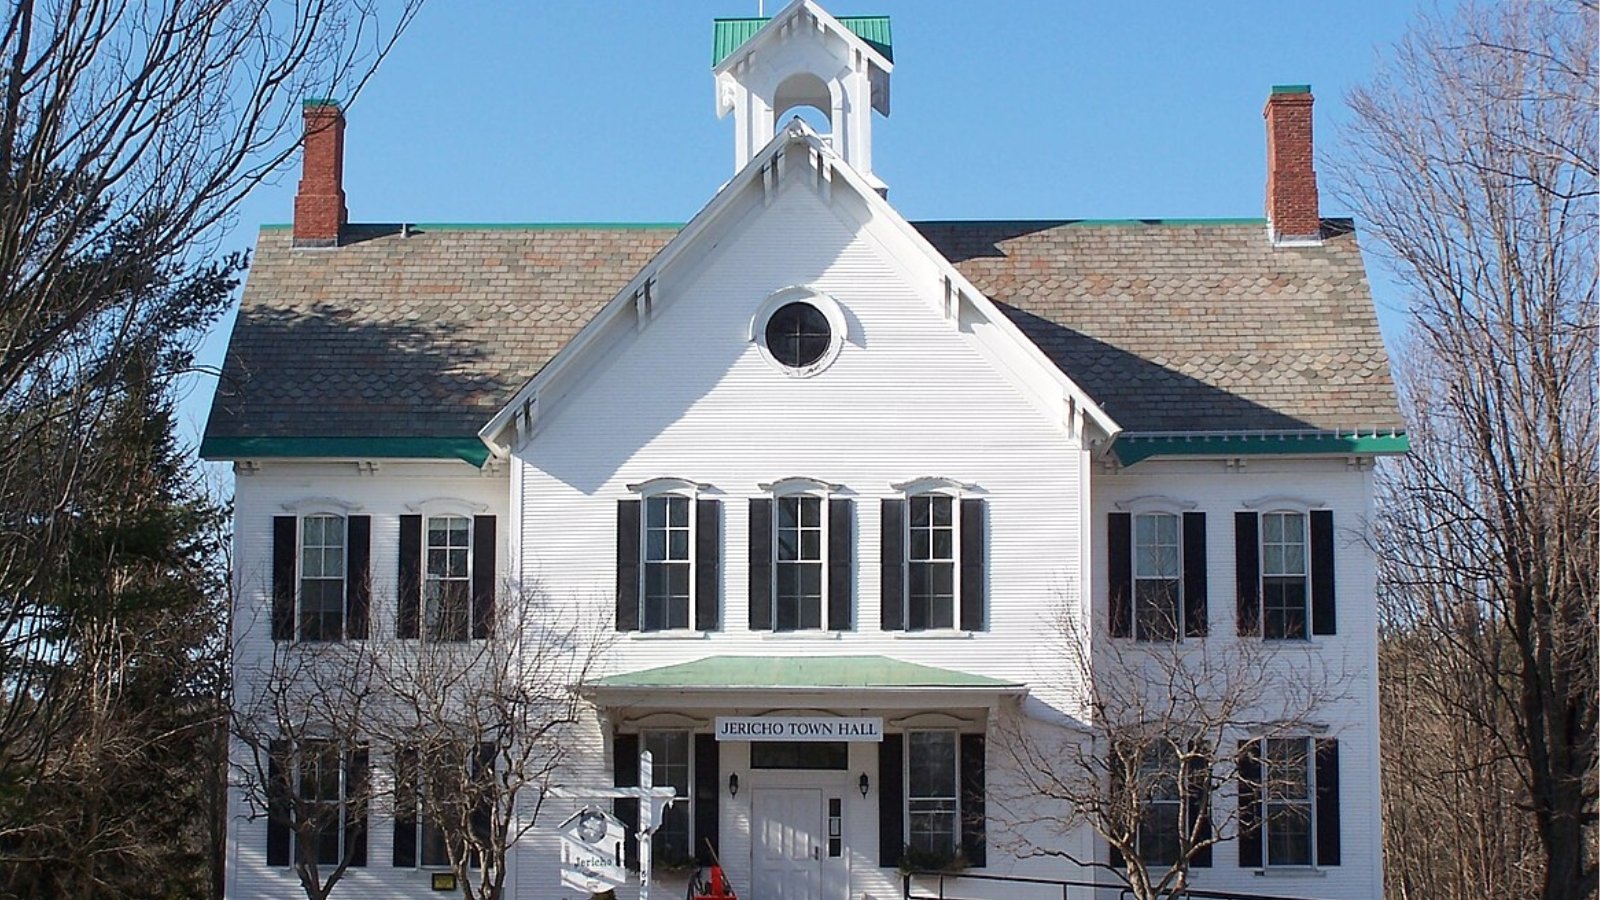
Jericho is a peaceful town in Chittenden County, located about 30 minutes from Burlington. It combines the appeal of small-town living with reasonable commuting access, making it a desirable option for those who work in the city but want more space and quiet.
The post-2020 shift toward remote and hybrid work models played a key role in Jericho’s housing surge. Buyers flocked to areas offering a rural feel without total isolation. With strong schools and scenic views of Mount Mansfield, Jericho remains a magnet for families and professionals alike.
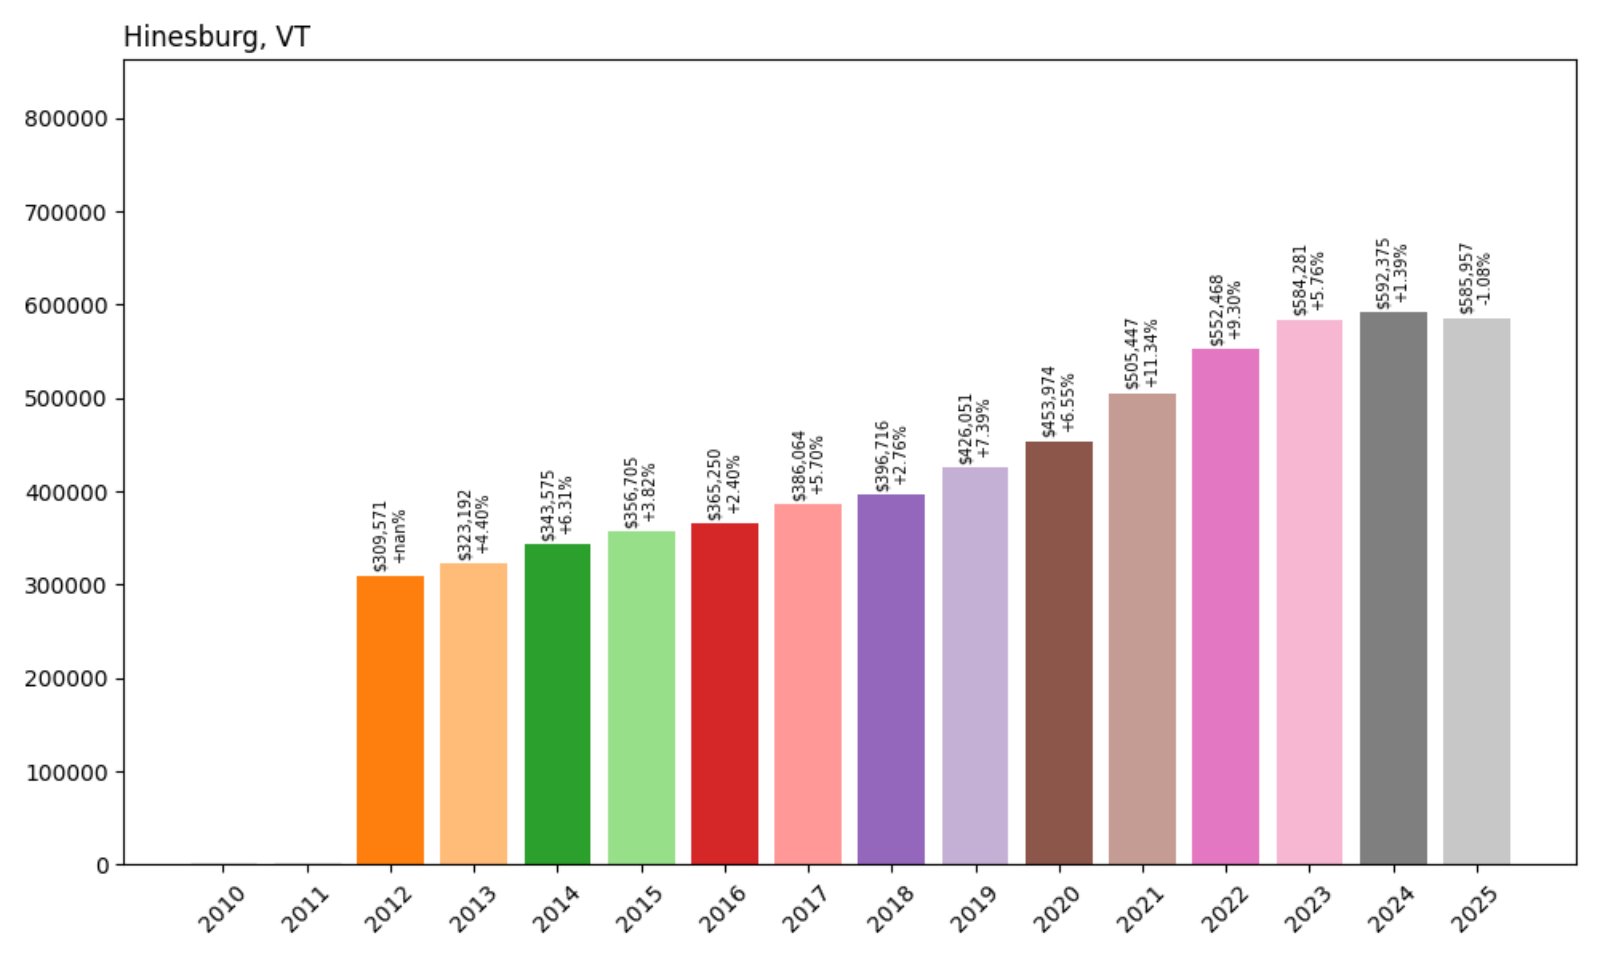
19. Hinesburg – 89% Home Price Increase Since 2012
- 2012: $309,571
- 2013: $323,192 (+$13,621, +4.40%)
- 2014: $343,575 (+$20,384, +6.31%)
- 2015: $356,705 (+$13,130, +3.82%)
- 2016: $365,250 (+$8,545, +2.40%)
- 2017: $386,064 (+$20,814, +5.70%)
- 2018: $396,716 (+$10,651, +2.76%)
- 2019: $426,051 (+$29,335, +7.39%)
- 2020: $453,974 (+$27,924, +6.55%)
- 2021: $505,447 (+$51,473, +11.34%)
- 2022: $552,468 (+$47,020, +9.30%)
- 2023: $584,281 (+$31,814, +5.76%)
- 2024: $592,375 (+$8,094, +1.39%)
- 2025: $585,957 (−$6,418, −1.08%)
Home values in Hinesburg have jumped 89% since 2012, with consistent gains across the last decade. After peaking in 2024, prices dipped slightly in 2025 but remain close to all-time highs.
Hinesburg – Vibrant Community with Rural Character
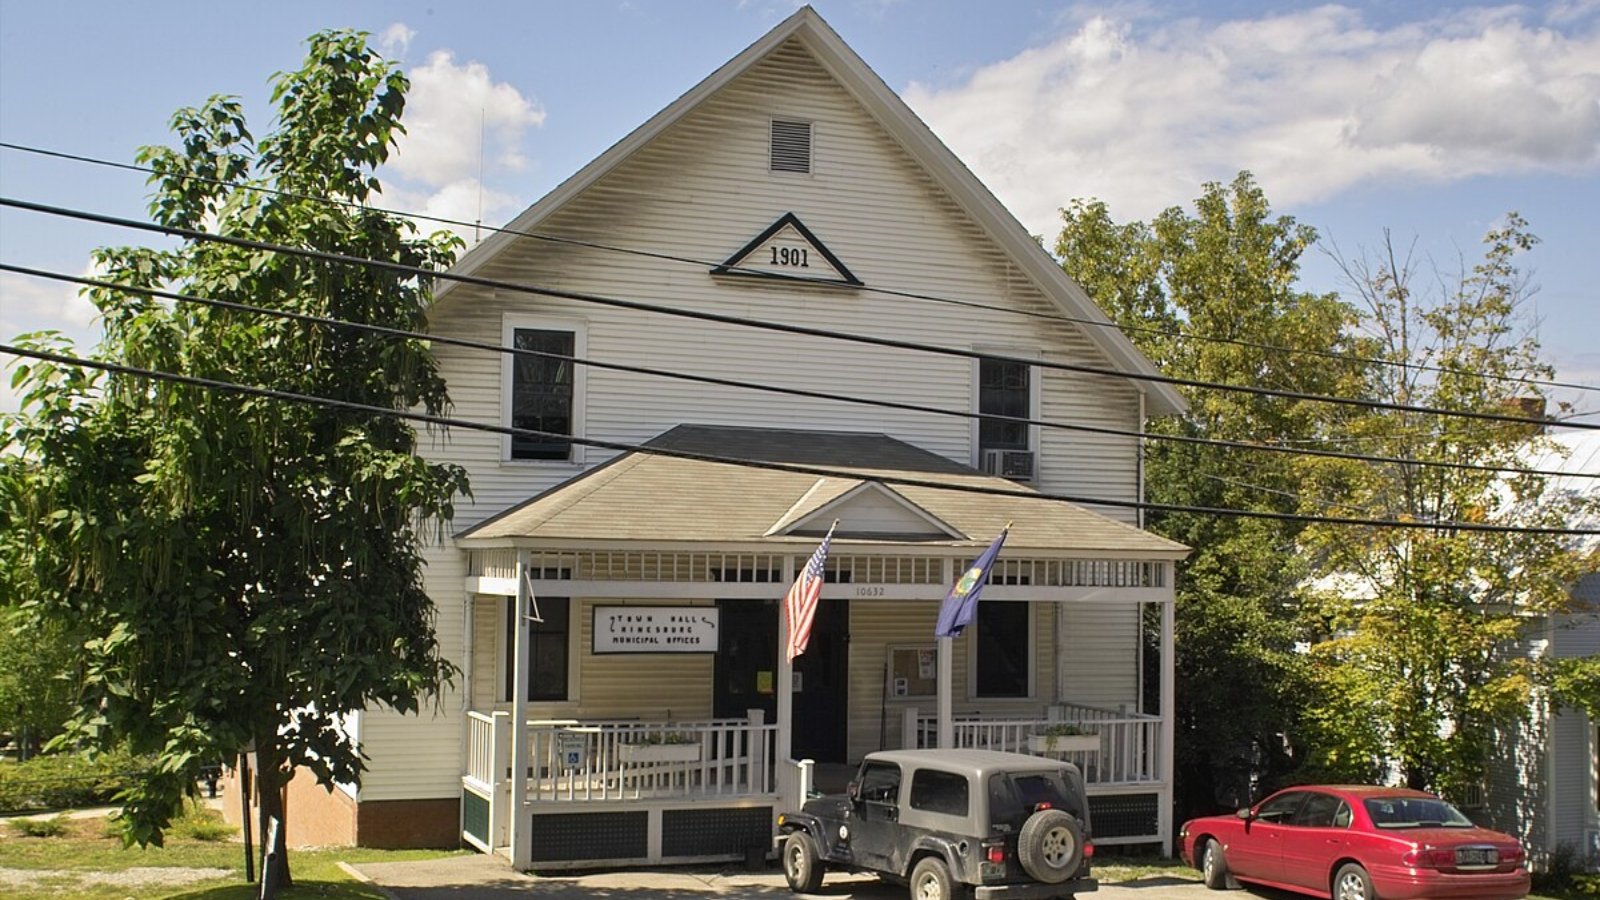
Located south of Burlington, Hinesburg has become one of Chittenden County’s most desirable rural towns. With a growing population, a lively village center, and close access to Lake Iroquois and hiking trails, it offers a lifestyle that blends convenience with nature.
Recent years brought new construction and rising demand, particularly among buyers priced out of Burlington. Its modest decline in 2025 likely reflects a pause rather than a reversal, as housing supply remains tight and interest stays high.
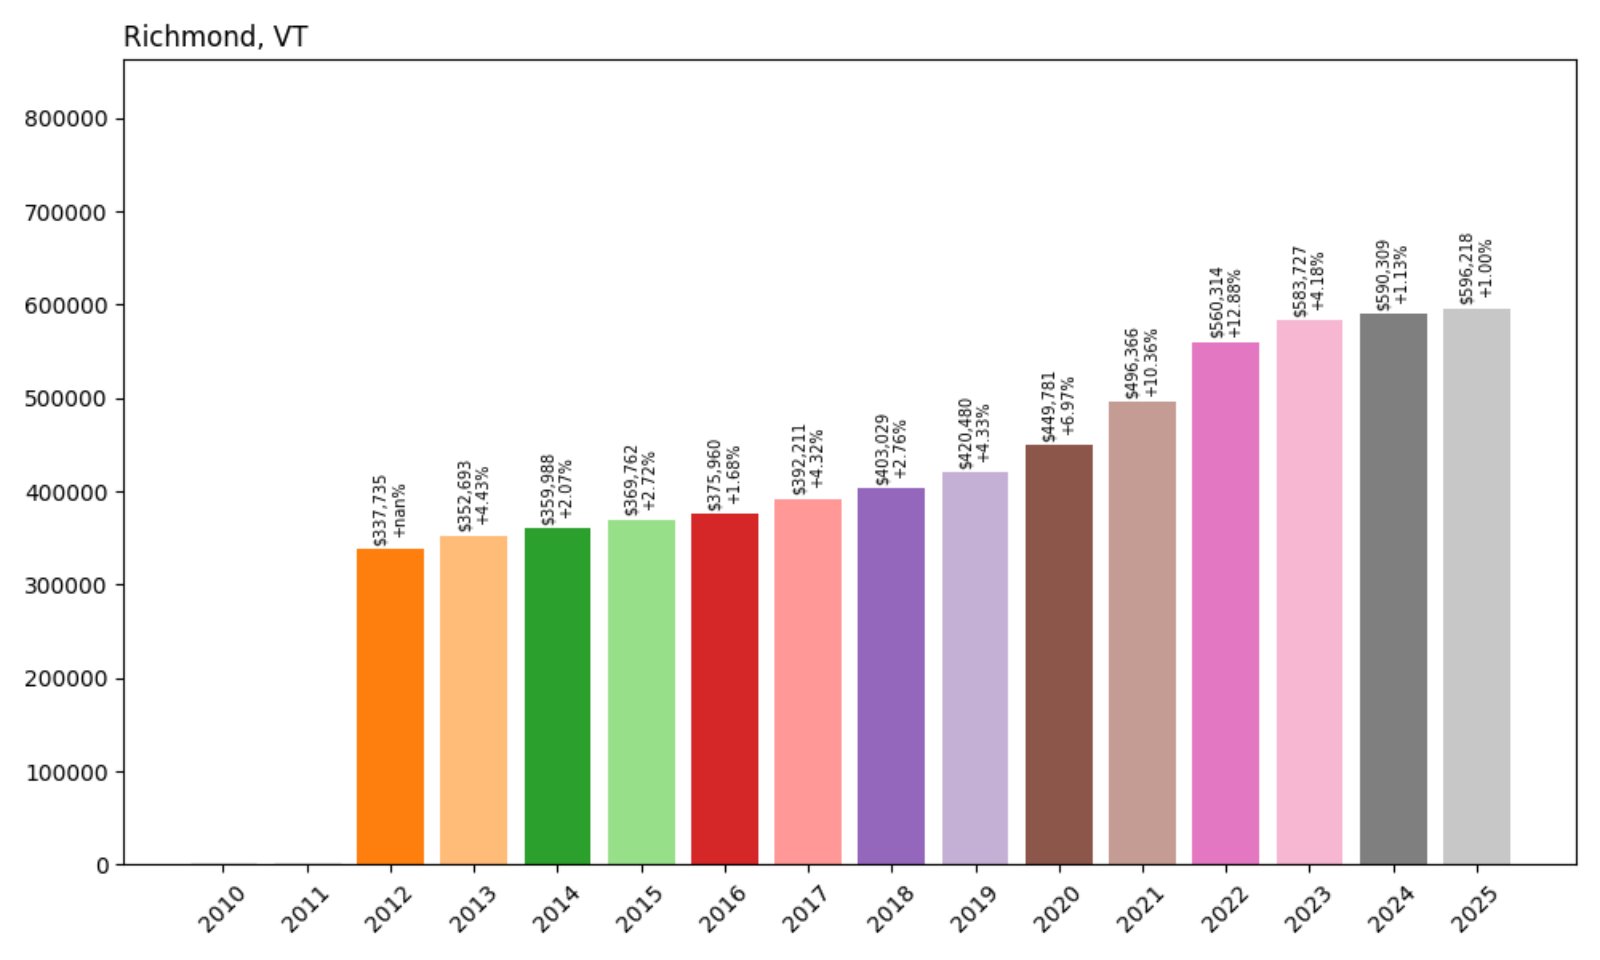
18. Richmond – 77% Home Price Increase Since 2012
- 2012: $337,735
- 2013: $352,693 (+$14,958, +4.43%)
- 2014: $359,988 (+$7,294, +2.07%)
- 2015: $369,762 (+$9,774, +2.72%)
- 2016: $375,960 (+$6,198, +1.68%)
- 2017: $392,211 (+$16,251, +4.32%)
- 2018: $403,029 (+$10,819, +2.76%)
- 2019: $420,480 (+$17,451, +4.33%)
- 2020: $449,781 (+$29,301, +6.97%)
- 2021: $496,366 (+$46,585, +10.36%)
- 2022: $560,314 (+$63,948, +12.88%)
- 2023: $583,727 (+$23,413, +4.18%)
- 2024: $590,309 (+$6,582, +1.13%)
- 2025: $596,218 (+$5,909, +1.00%)
Richmond’s home prices have increased 77% since 2012, with year-over-year growth nearly every cycle. 2021 and 2022 brought the biggest leaps, but even in 2025, values continue a slow upward trend.
Richmond – Natural Beauty and Commuter Access
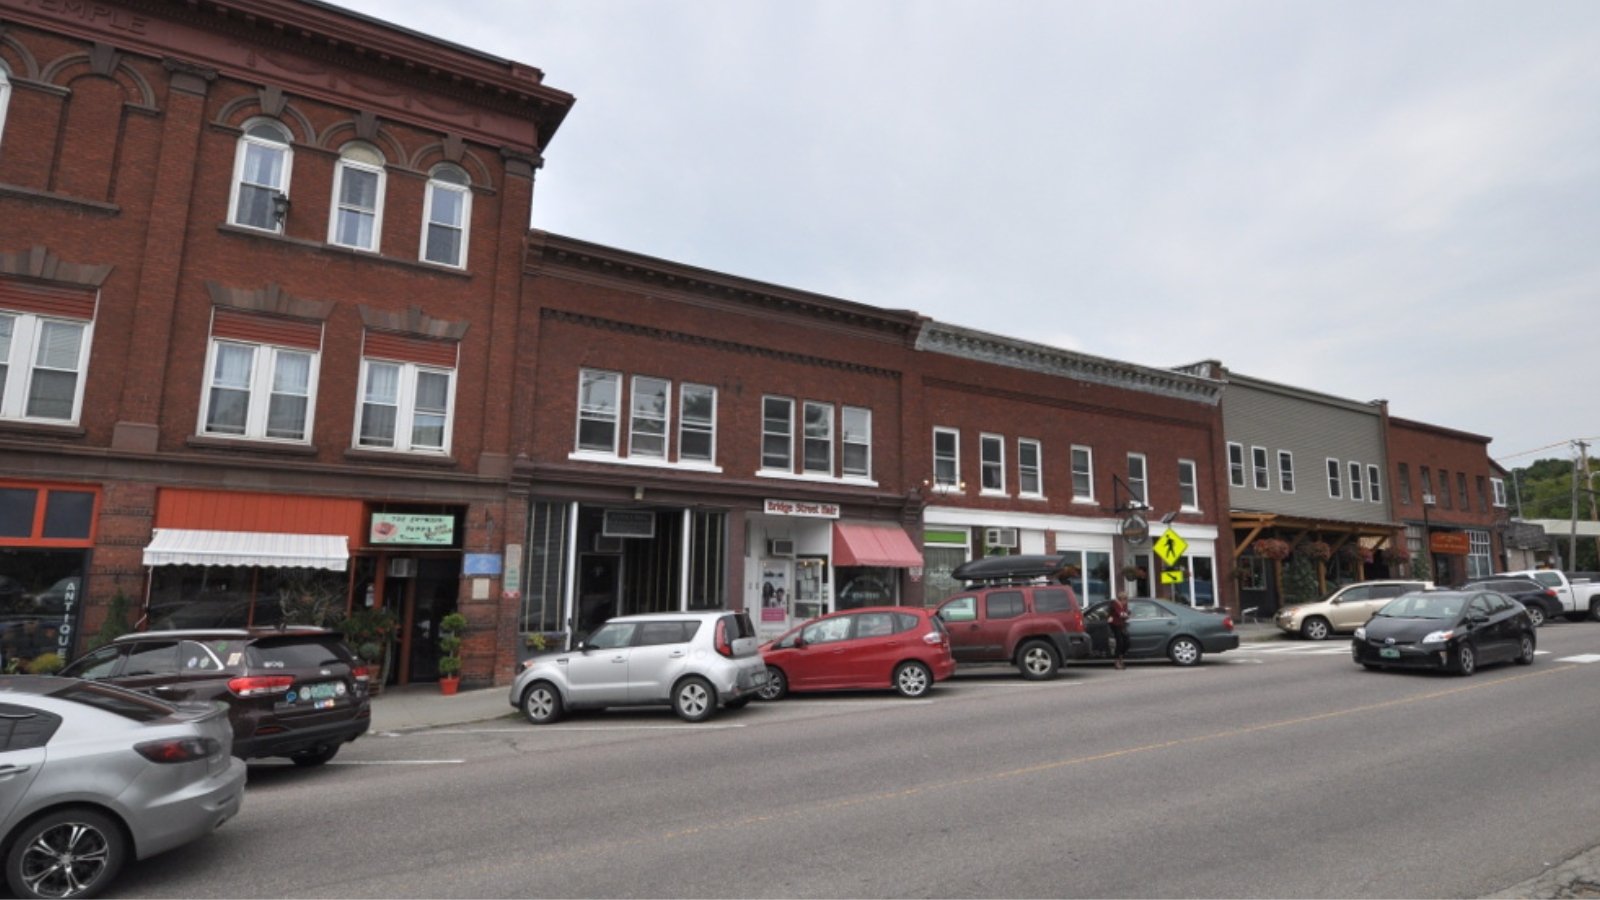
Richmond is ideally positioned between Burlington and Montpelier, making it a favorite among commuters seeking a scenic hometown. The Winooski River, Huntington Gorge, and Camel’s Hump all contribute to its visual appeal and outdoor lifestyle.
Its tight-knit community and vibrant local businesses have added to its long-term stability. Growth may be moderating, but Richmond’s desirability continues to drive healthy, sustained value in its real estate market.
17. Cornwall – 88% Home Price Increase Since 2010
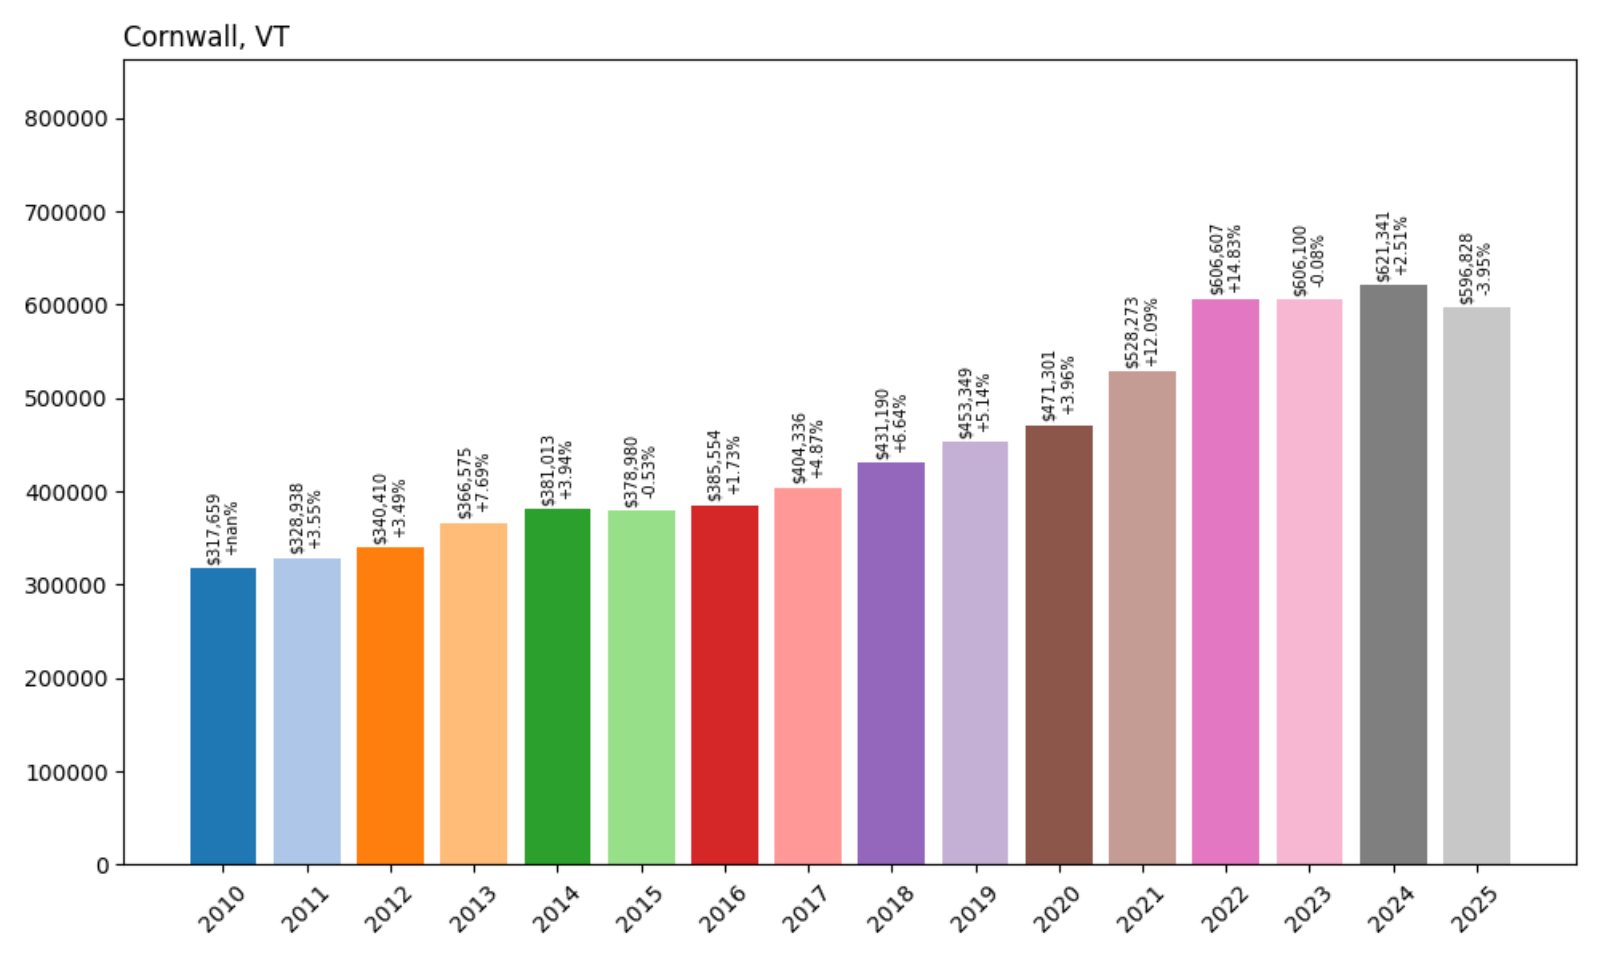
- 2010: $317,659
- 2011: $328,938 (+$11,279, +3.55%)
- 2012: $340,410 (+$11,472, +3.49%)
- 2013: $366,575 (+$26,165, +7.69%)
- 2014: $381,013 (+$14,439, +3.94%)
- 2015: $378,980 (−$2,033, −0.53%)
- 2016: $385,554 (+$6,574, +1.73%)
- 2017: $404,336 (+$18,781, +4.87%)
- 2018: $431,190 (+$26,855, +6.64%)
- 2019: $453,349 (+$22,159, +5.14%)
- 2020: $471,301 (+$17,952, +3.96%)
- 2021: $528,273 (+$56,972, +12.09%)
- 2022: $606,607 (+$78,334, +14.83%)
- 2023: $606,100 (−$508, −0.08%)
- 2024: $621,341 (+$15,241, +2.51%)
- 2025: $596,828 (−$24,513, −3.95%)
Home values in Cornwall have increased 88% since 2010. Strong gains came in the early 2020s, though prices declined slightly in 2025 after peaking in 2022–2024.
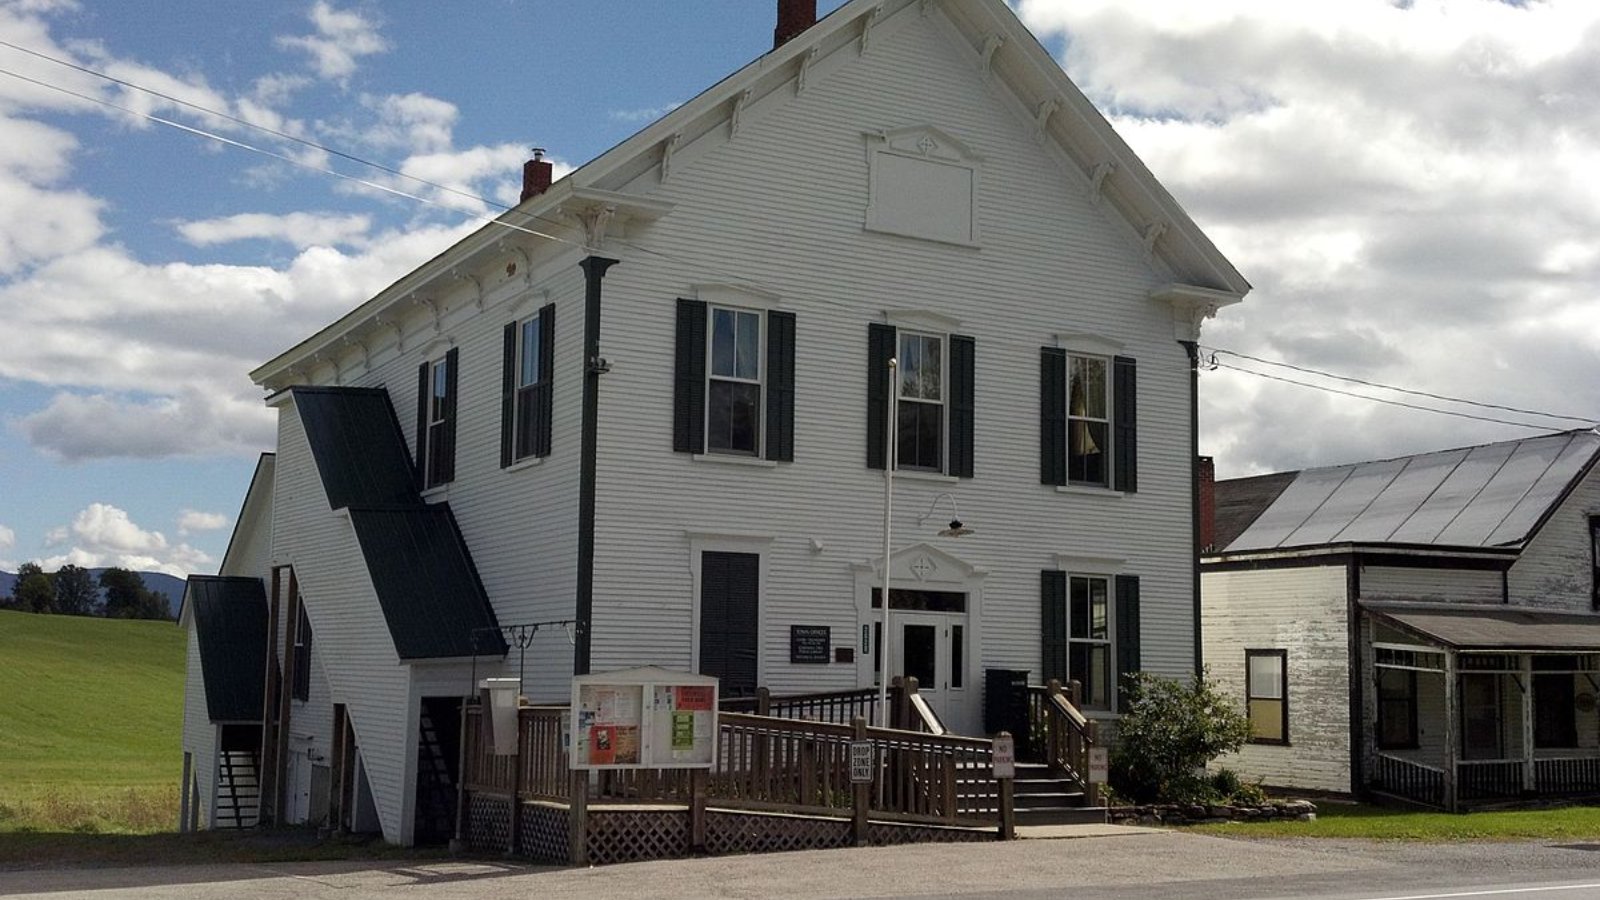
Cornwall – Open Fields and Proximity to Middlebury
🔥 Would you like to save this?
Just west of Middlebury, Cornwall is known for its pastoral views and rolling farmlands. Many homes enjoy views of the Adirondacks, and the town’s proximity to a college hub adds stability to the market.
Much of its price growth came as buyers sought peaceful alternatives to more crowded areas. While the 2025 decline may indicate market cooling, Cornwall’s scenic charm and location should keep values strong long-term.
16. Williston – 108% Home Price Increase Since 2010
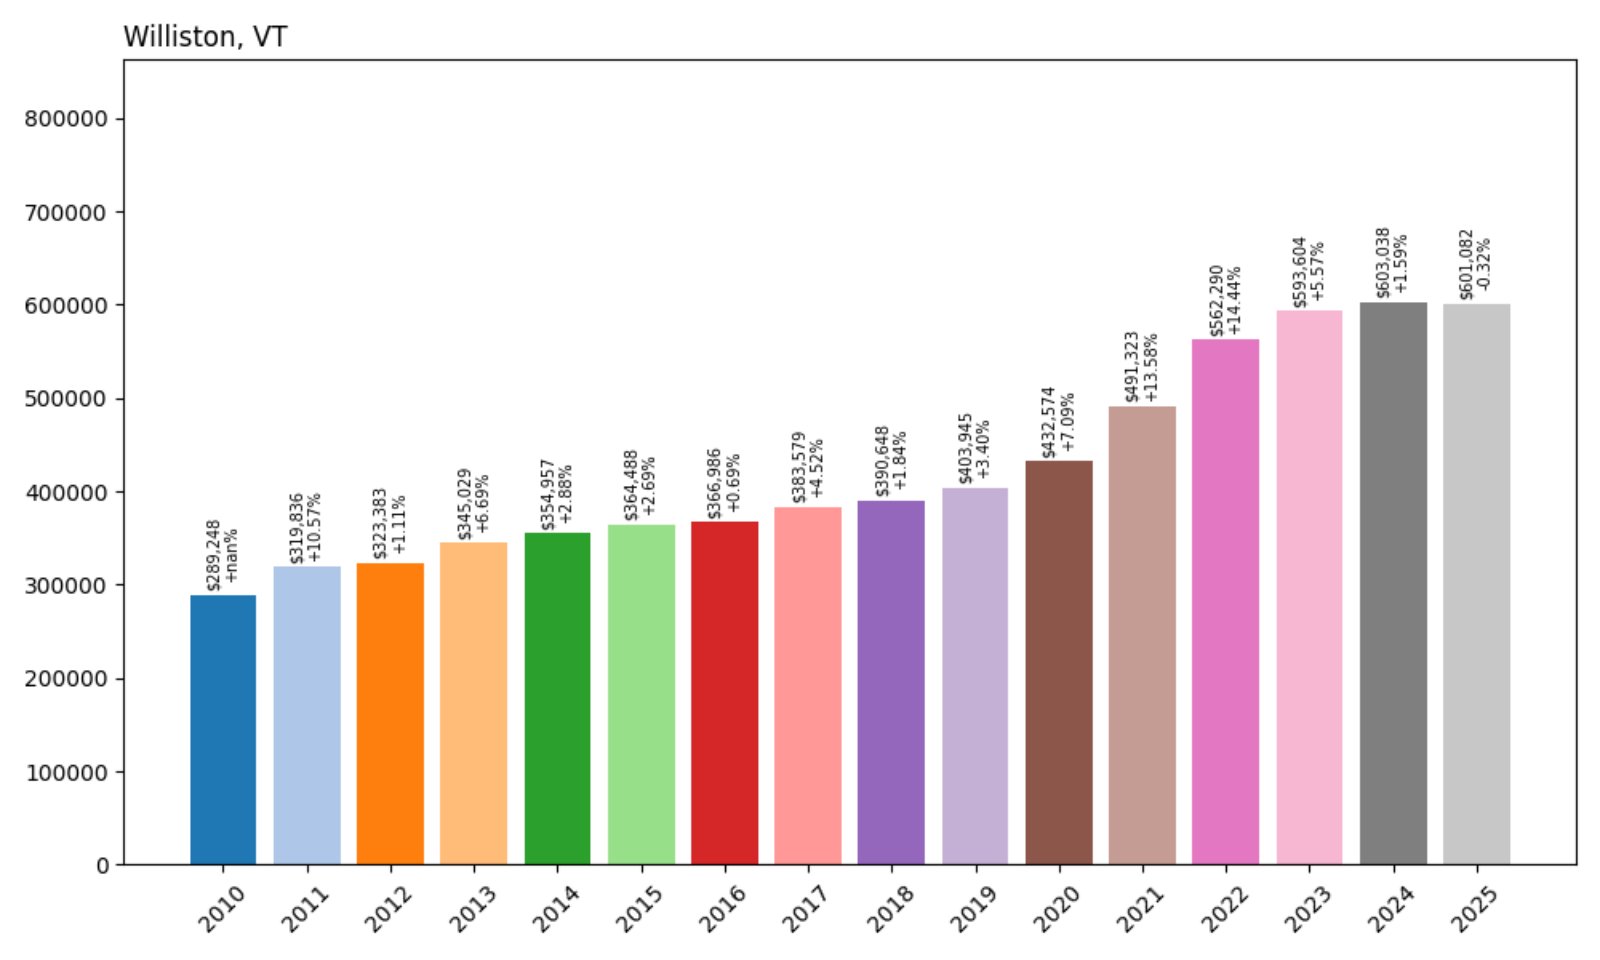
- 2010: $289,248
- 2011: $319,836 (+$30,587, +10.57%)
- 2012: $323,383 (+$3,547, +1.11%)
- 2013: $345,029 (+$21,646, +6.69%)
- 2014: $354,957 (+$9,928, +2.88%)
- 2015: $364,488 (+$9,531, +2.69%)
- 2016: $366,986 (+$2,498, +0.69%)
- 2017: $383,579 (+$16,593, +4.52%)
- 2018: $390,648 (+$7,069, +1.84%)
- 2019: $403,945 (+$13,297, +3.40%)
- 2020: $432,574 (+$28,629, +7.09%)
- 2021: $491,323 (+$58,749, +13.58%)
- 2022: $562,290 (+$70,967, +14.44%)
- 2023: $593,604 (+$31,315, +5.57%)
- 2024: $603,038 (+$9,434, +1.59%)
- 2025: $601,082 (−$1,956, −0.32%)
Williston’s home prices have jumped 108% since 2010, driven by a steady stream of growth and major acceleration after 2020. A small dip in 2025 follows multiple years of solid appreciation.
Williston – Shopping, Services, and Suburban Growth
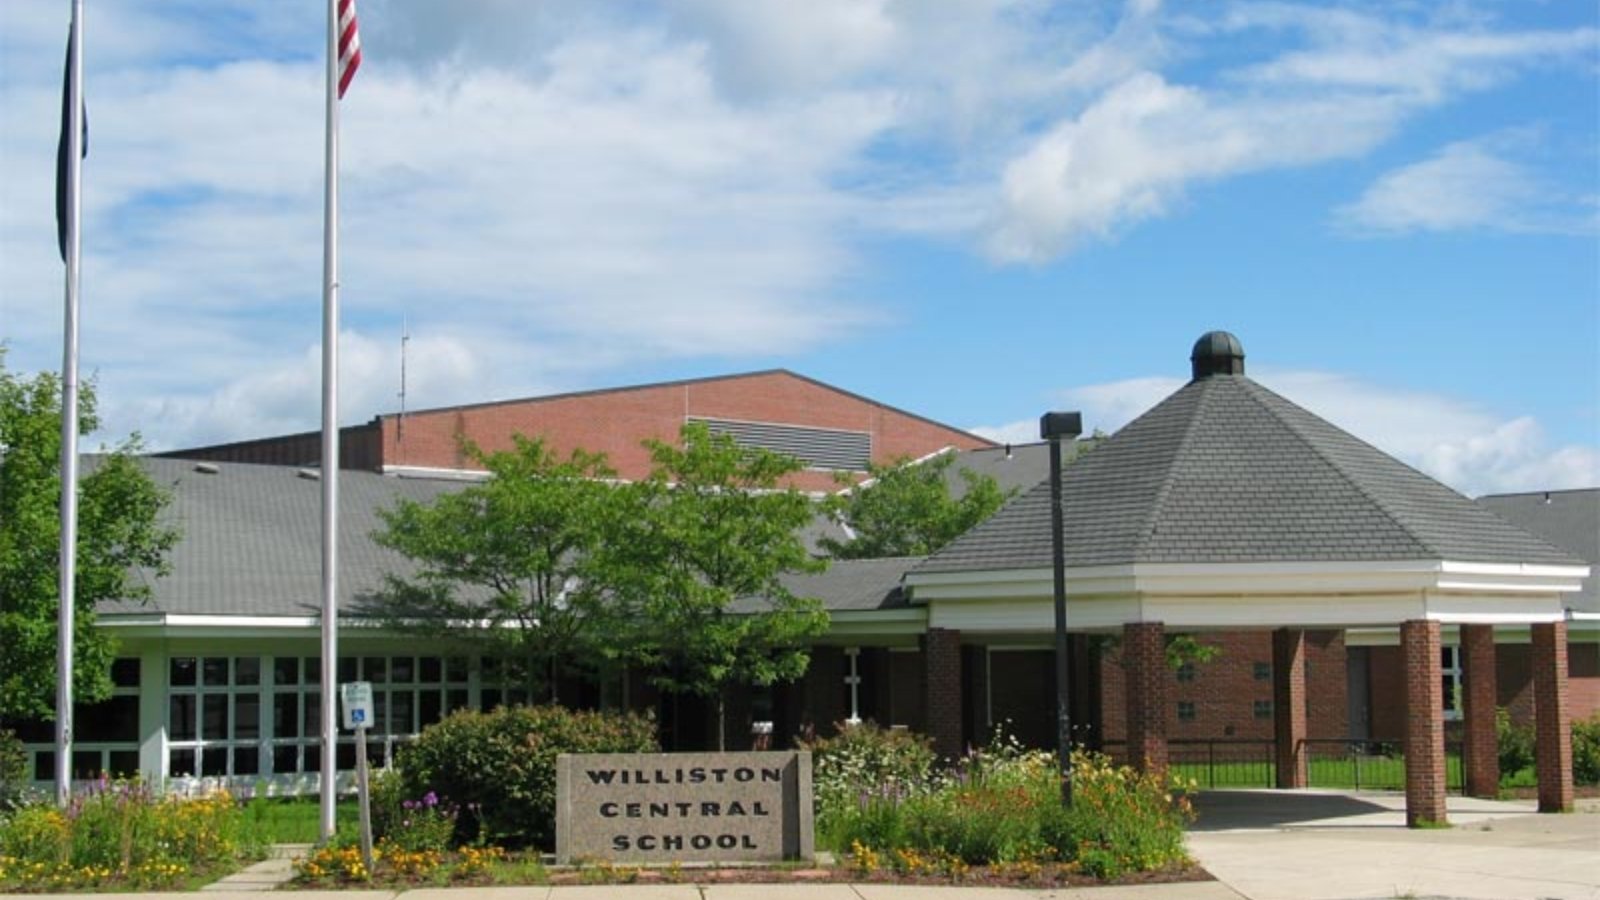
Williston is one of Chittenden County’s major retail and commercial hubs, offering big-box stores and housing developments just minutes from Burlington. This accessibility has fueled sustained housing demand.
The town’s rapid growth in the 2020s reflects migration patterns toward well-serviced suburban areas. While 2025 brings a rare slight decrease, Williston remains one of Vermont’s most robust and dependable housing markets.
15. Underhill – 70% Home Price Increase Since 2012
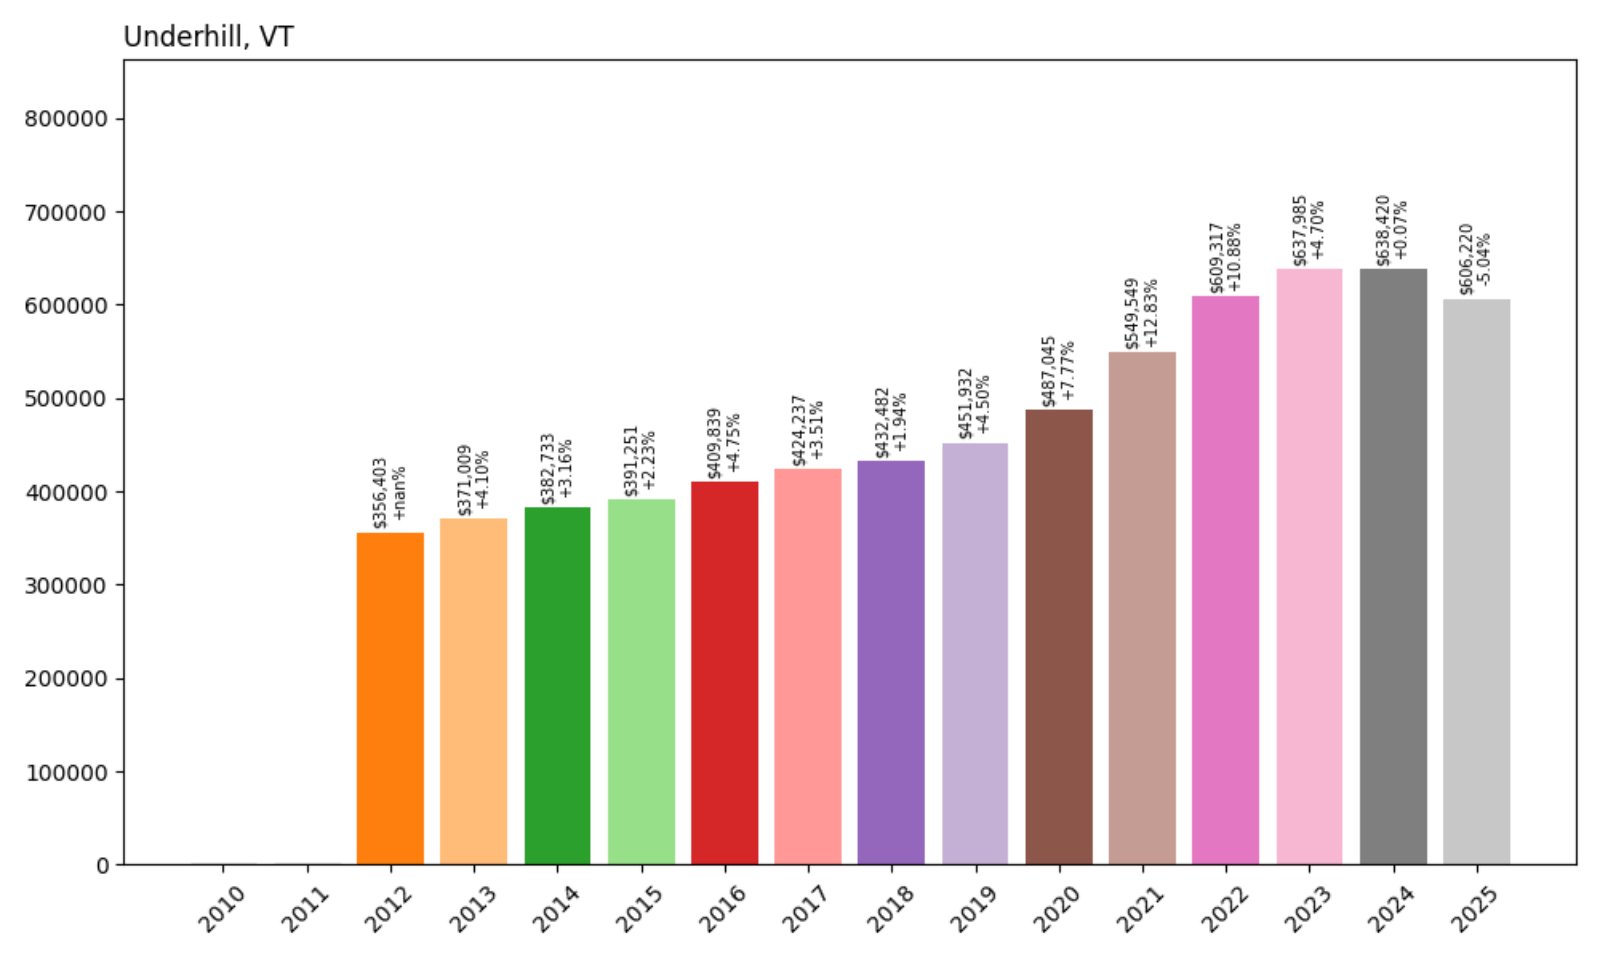
- 2012: $356,403
- 2013: $371,009 (+$14,605, +4.10%)
- 2014: $382,733 (+$11,724, +3.16%)
- 2015: $391,251 (+$8,518, +2.23%)
- 2016: $409,839 (+$18,588, +4.75%)
- 2017: $424,237 (+$14,398, +3.51%)
- 2018: $432,482 (+$8,245, +1.94%)
- 2019: $451,932 (+$19,451, +4.50%)
- 2020: $487,045 (+$35,112, +7.77%)
- 2021: $549,549 (+$62,504, +12.83%)
- 2022: $609,317 (+$59,768, +10.88%)
- 2023: $637,985 (+$28,667, +4.70%)
- 2024: $638,420 (+$435, +0.07%)
- 2025: $606,220 (−$32,200, −5.04%)
Underhill saw a 70% increase in home values since 2012, propelled by steady growth and sharp gains after 2020. The recent decline in 2025 reflects a broader regional cooldown but doesn’t erase the long-term trend of appreciation.
Underhill – Scenic Backdrop Beneath Mount Mansfield
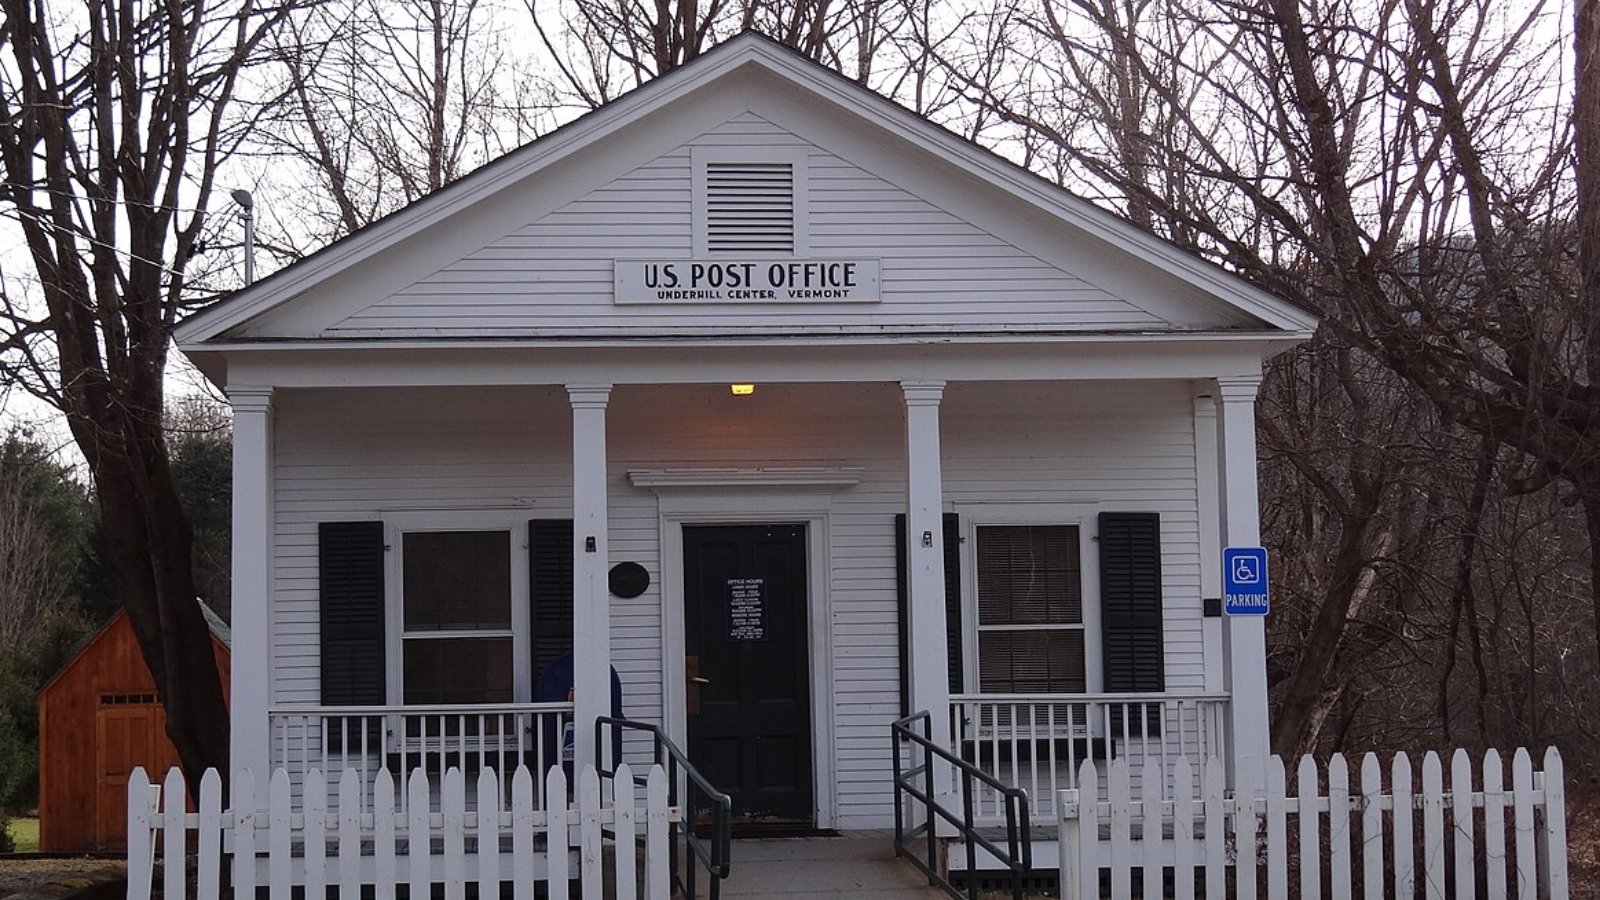
Tucked beneath Vermont’s tallest peak, Mount Mansfield, Underhill is a quiet, rural community with dramatic views and excellent access to hiking and backcountry skiing. Though largely residential, it offers a strong quality of life and a sense of seclusion without being remote.
Values grew quickly during the pandemic-era housing boom as buyers prioritized lifestyle and landscape. While 2025 brought a notable correction, interest in Underhill remains steady among those looking for space, views, and a low-key community atmosphere.
14. Ludlow – 88% Home Price Increase Since 2010
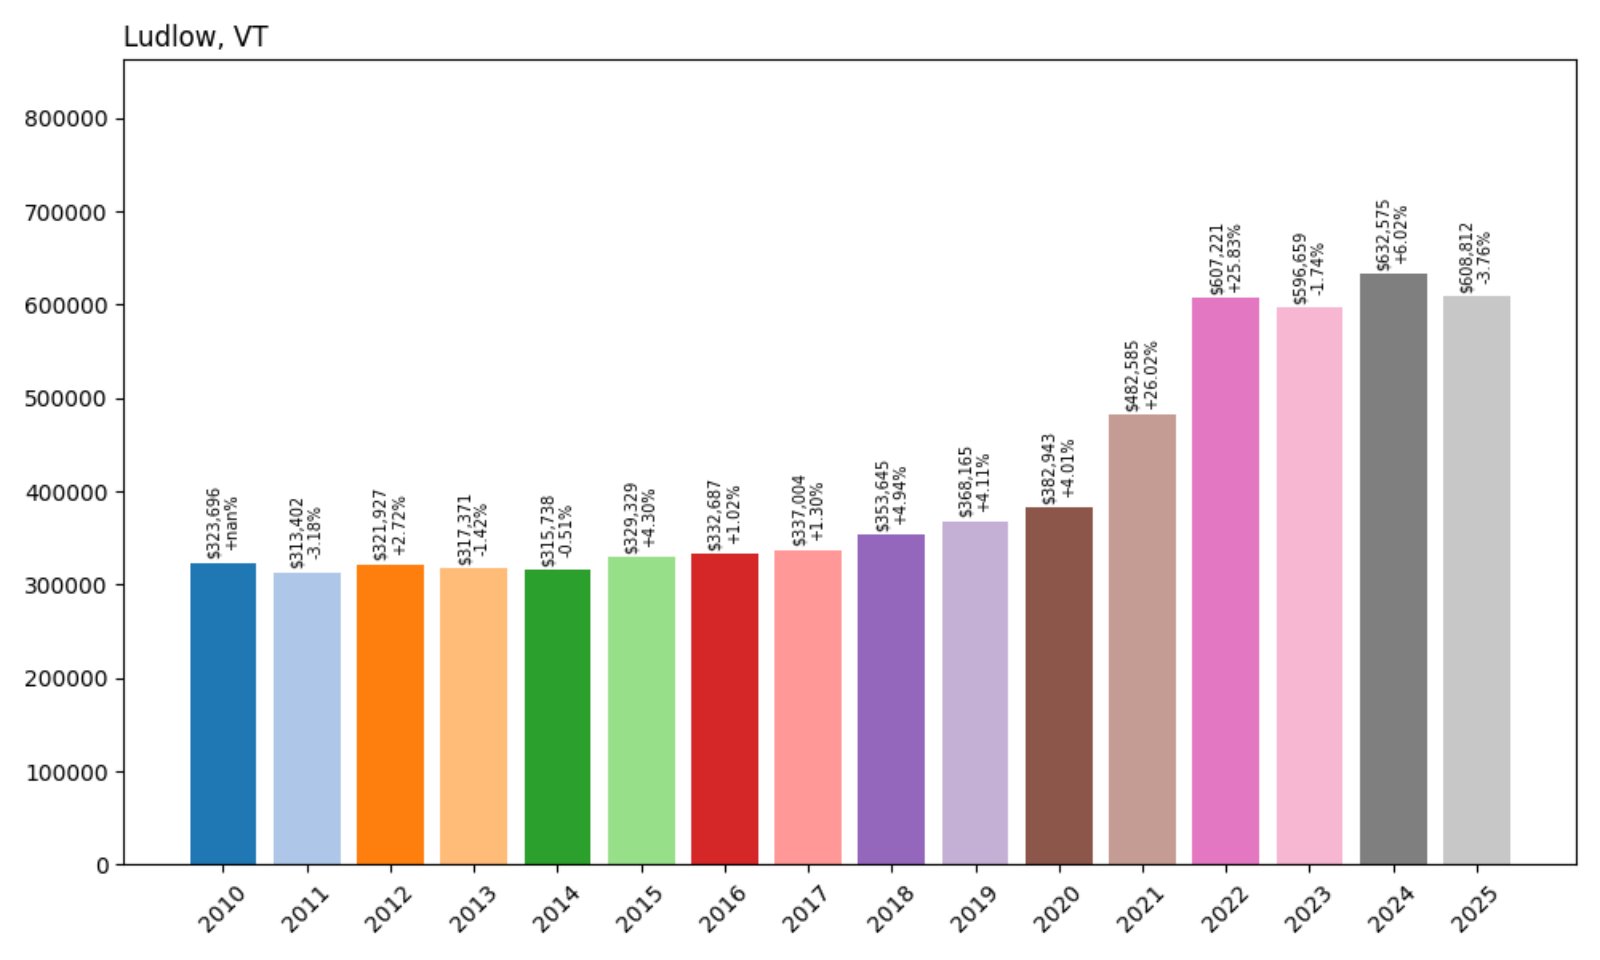
- 2010: $323,696
- 2011: $313,402 (−$10,294, −3.18%)
- 2012: $321,927 (+$8,525, +2.72%)
- 2013: $317,371 (−$4,556, −1.42%)
- 2014: $315,738 (−$1,633, −0.51%)
- 2015: $329,329 (+$13,590, +4.30%)
- 2016: $332,687 (+$3,359, +1.02%)
- 2017: $337,004 (+$4,317, +1.30%)
- 2018: $353,645 (+$16,641, +4.94%)
- 2019: $368,165 (+$14,520, +4.11%)
- 2020: $382,943 (+$14,778, +4.01%)
- 2021: $482,585 (+$99,642, +26.02%)
- 2022: $607,221 (+$124,636, +25.83%)
- 2023: $596,659 (−$10,562, −1.74%)
- 2024: $632,575 (+$35,916, +6.02%)
- 2025: $608,812 (−$23,763, −3.76%)
Since 2010, home values in Ludlow have climbed 88%, driven largely by explosive growth from 2020 to 2022. A price dip in 2025 reflects correction after intense pandemic-fueled demand, but values remain among the highest in the state.
Ludlow – Ski Town Living at Okemo’s Base
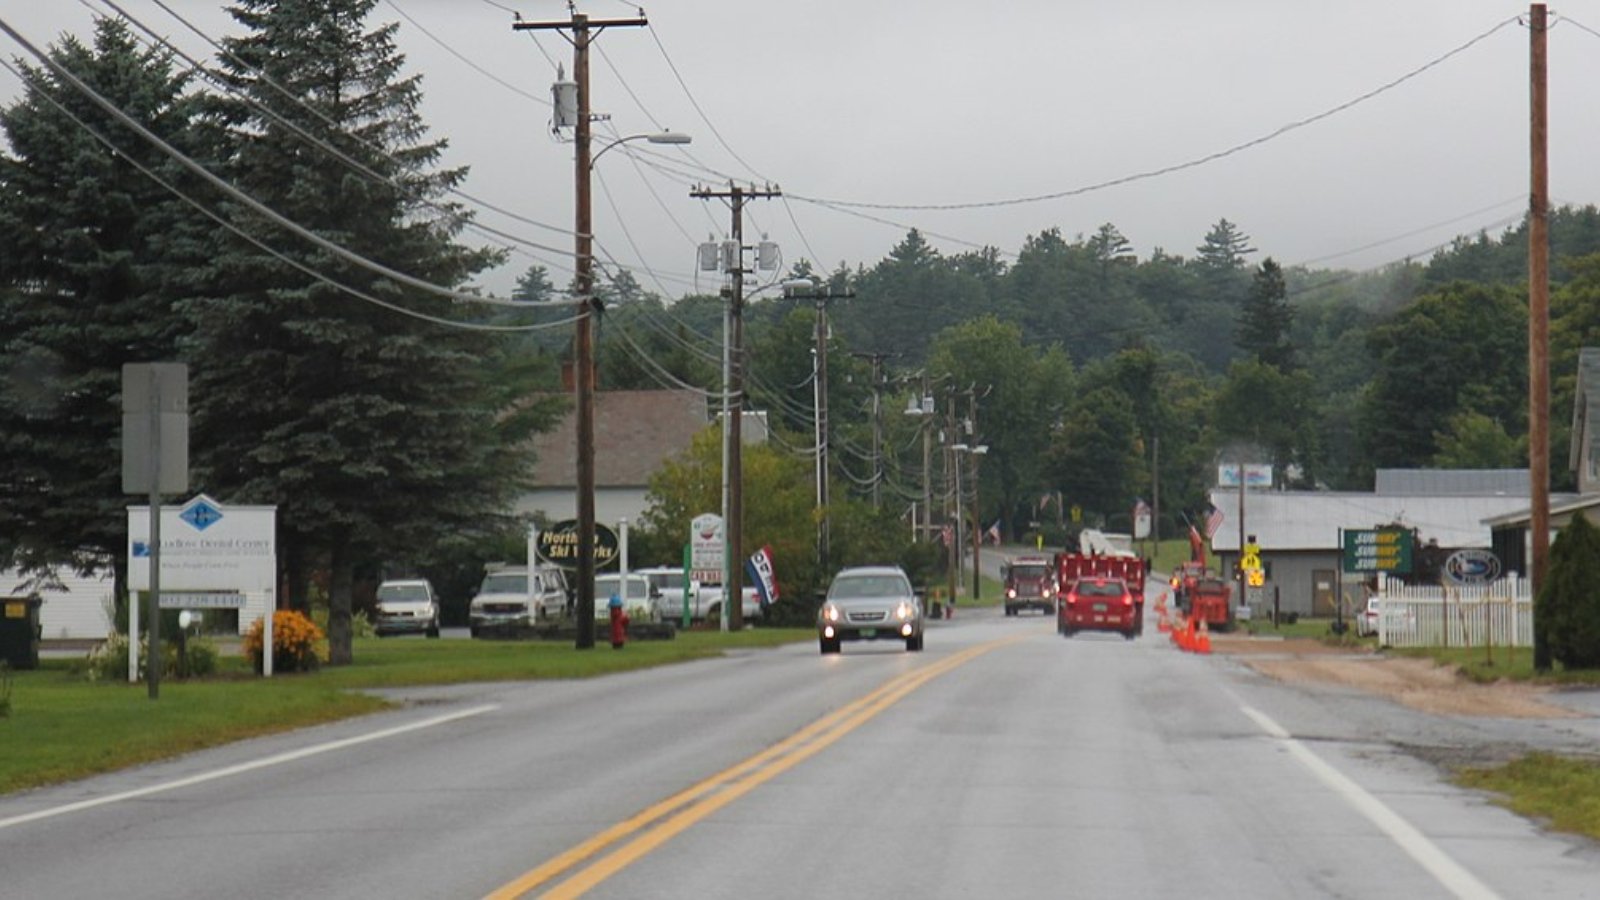
Ludlow is home to Okemo Mountain Resort, one of Vermont’s most popular ski destinations. This resort access makes the town a magnet for second-homeowners and investors, and demand has remained high for both seasonal and year-round properties.
The real estate boom of the early 2020s pushed prices sharply upward. While 2025 brings some adjustment, Ludlow’s deep connection to Vermont’s ski industry means it will likely remain a top-tier market for years to come.
13. South Hero – 65% Home Price Increase Since 2010
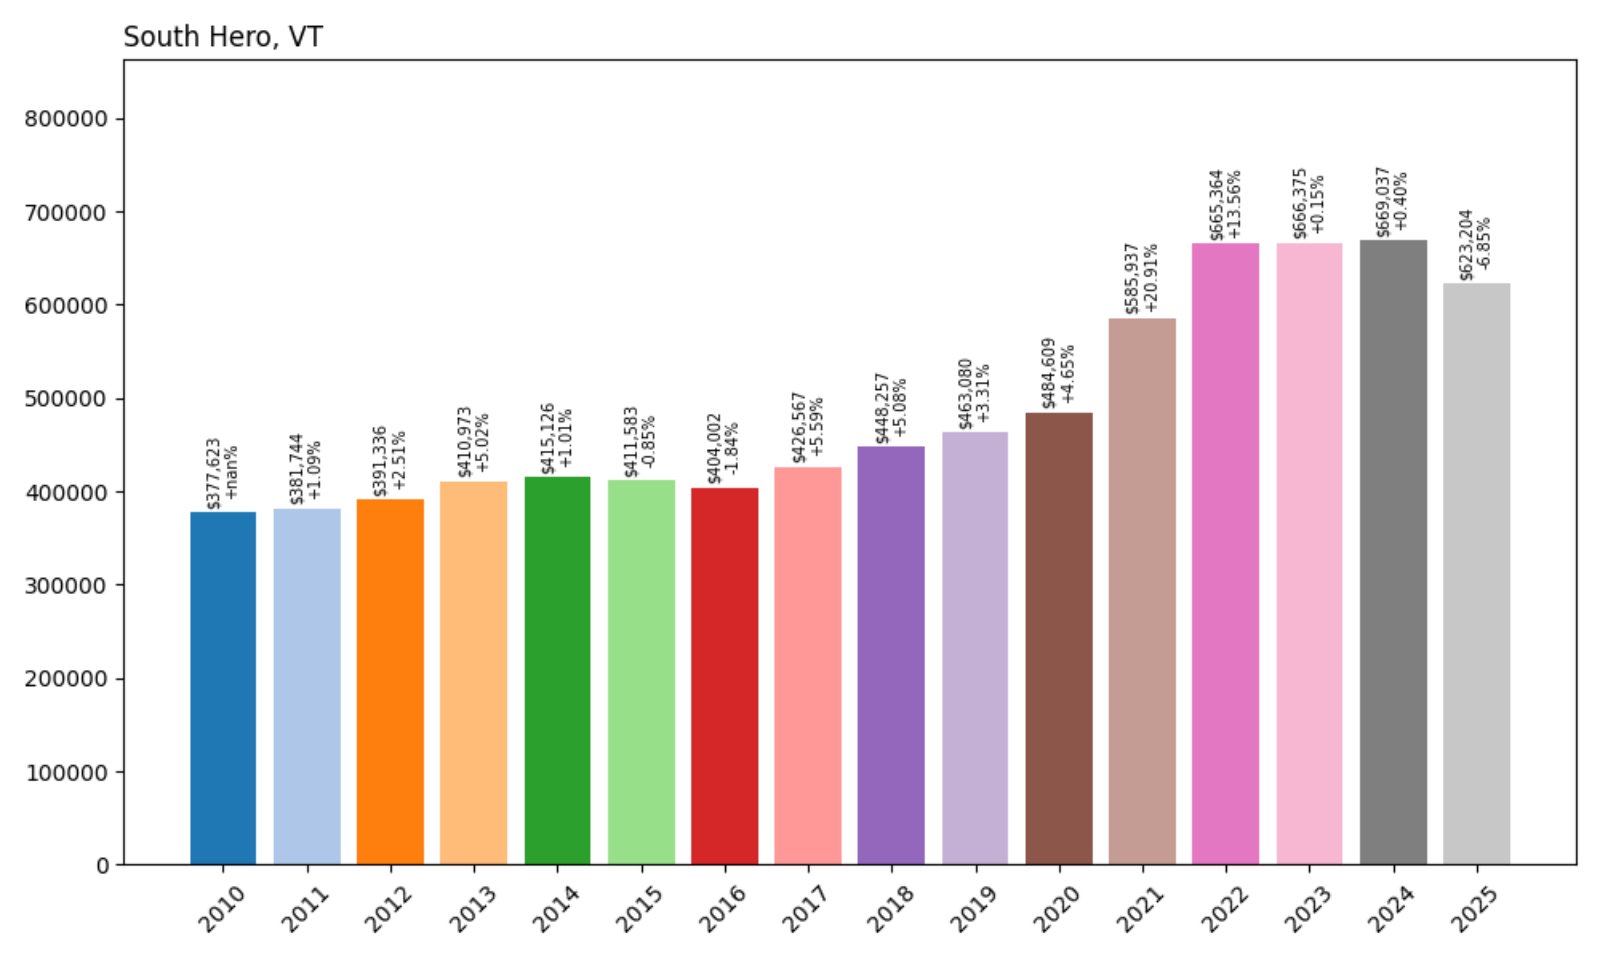
- 2010: $377,623
- 2011: $381,744 (+$4,121, +1.09%)
- 2012: $391,336 (+$9,592, +2.51%)
- 2013: $410,973 (+$19,637, +5.02%)
- 2014: $415,126 (+$4,154, +1.01%)
- 2015: $411,583 (−$3,543, −0.85%)
- 2016: $404,002 (−$7,582, −1.84%)
- 2017: $426,567 (+$22,566, +5.59%)
- 2018: $448,257 (+$21,689, +5.08%)
- 2019: $463,080 (+$14,824, +3.31%)
- 2020: $484,609 (+$21,529, +4.65%)
- 2021: $585,937 (+$101,328, +20.91%)
- 2022: $665,364 (+$79,427, +13.56%)
- 2023: $666,375 (+$1,011, +0.15%)
- 2024: $669,037 (+$2,662, +0.40%)
- 2025: $623,204 (−$45,833, −6.85%)
Home prices in South Hero have grown 65% since 2010, with the sharpest increases during 2020–2022. The drop in 2025 is one of the more significant corrections among high-value towns, but long-term gains remain strong.
South Hero – Island Serenity with Lake Champlain Views
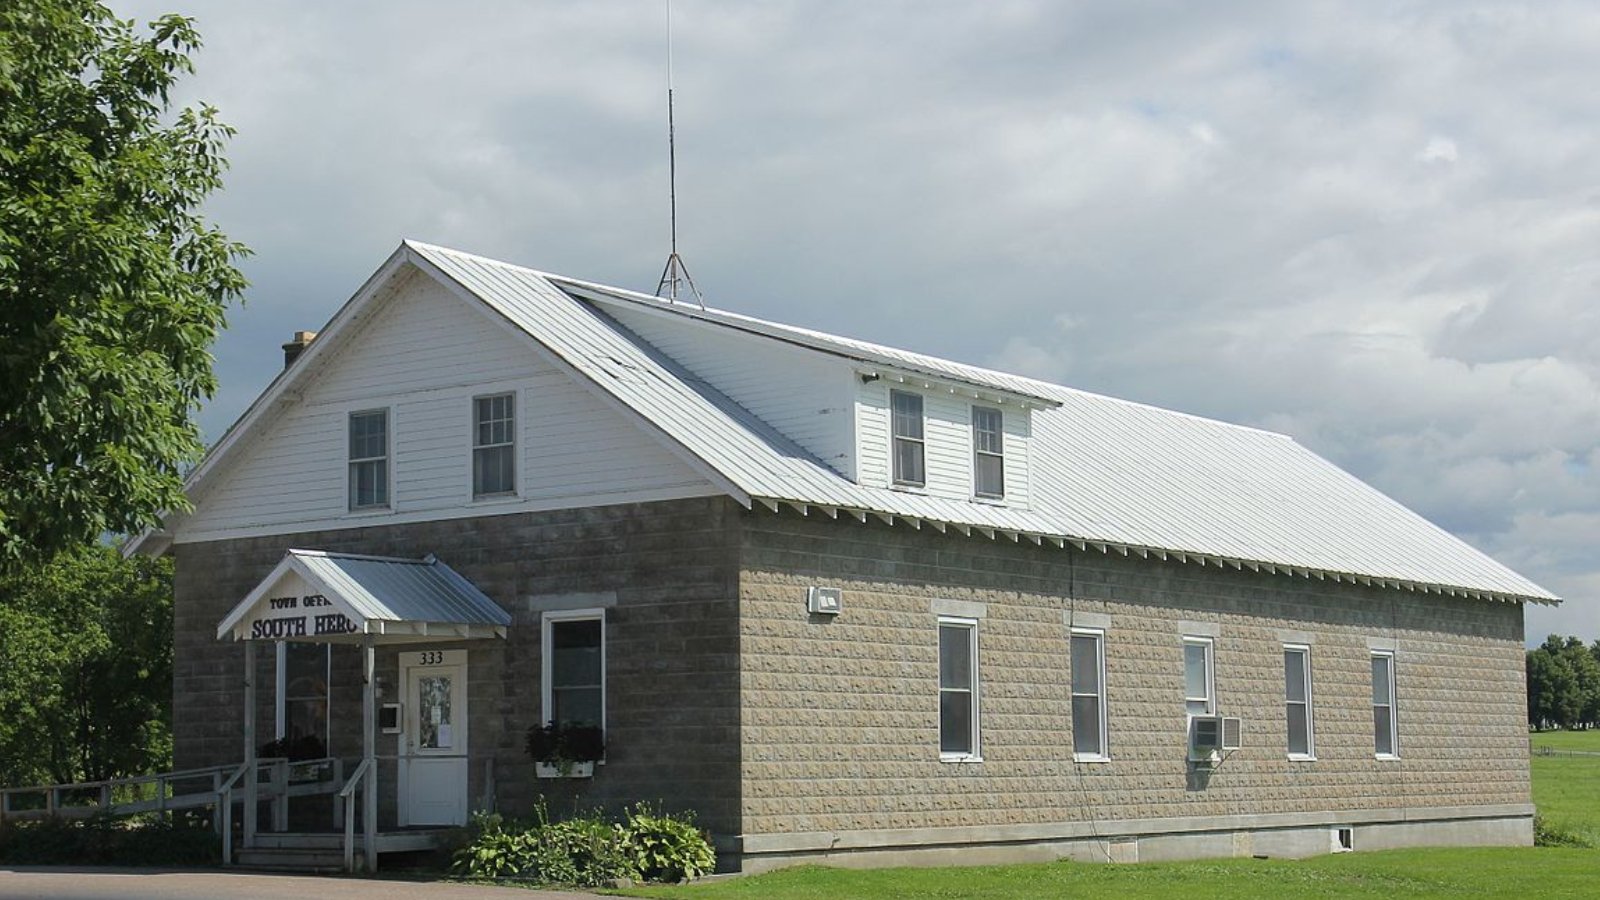
Located on South Hero Island in Grand Isle County, this community is renowned for its sweeping lake views, orchards, and tranquil pace. Despite its small population, the area attracts buyers looking for waterfront access and open space.
Prices soared in recent years as remote workers and retirees sought out places with natural beauty and elbow room. Though values fell notably in 2025, the appeal of island living continues to support South Hero’s place among Vermont’s most expensive towns.
12. Barnard – 83% Home Price Increase Since 2012
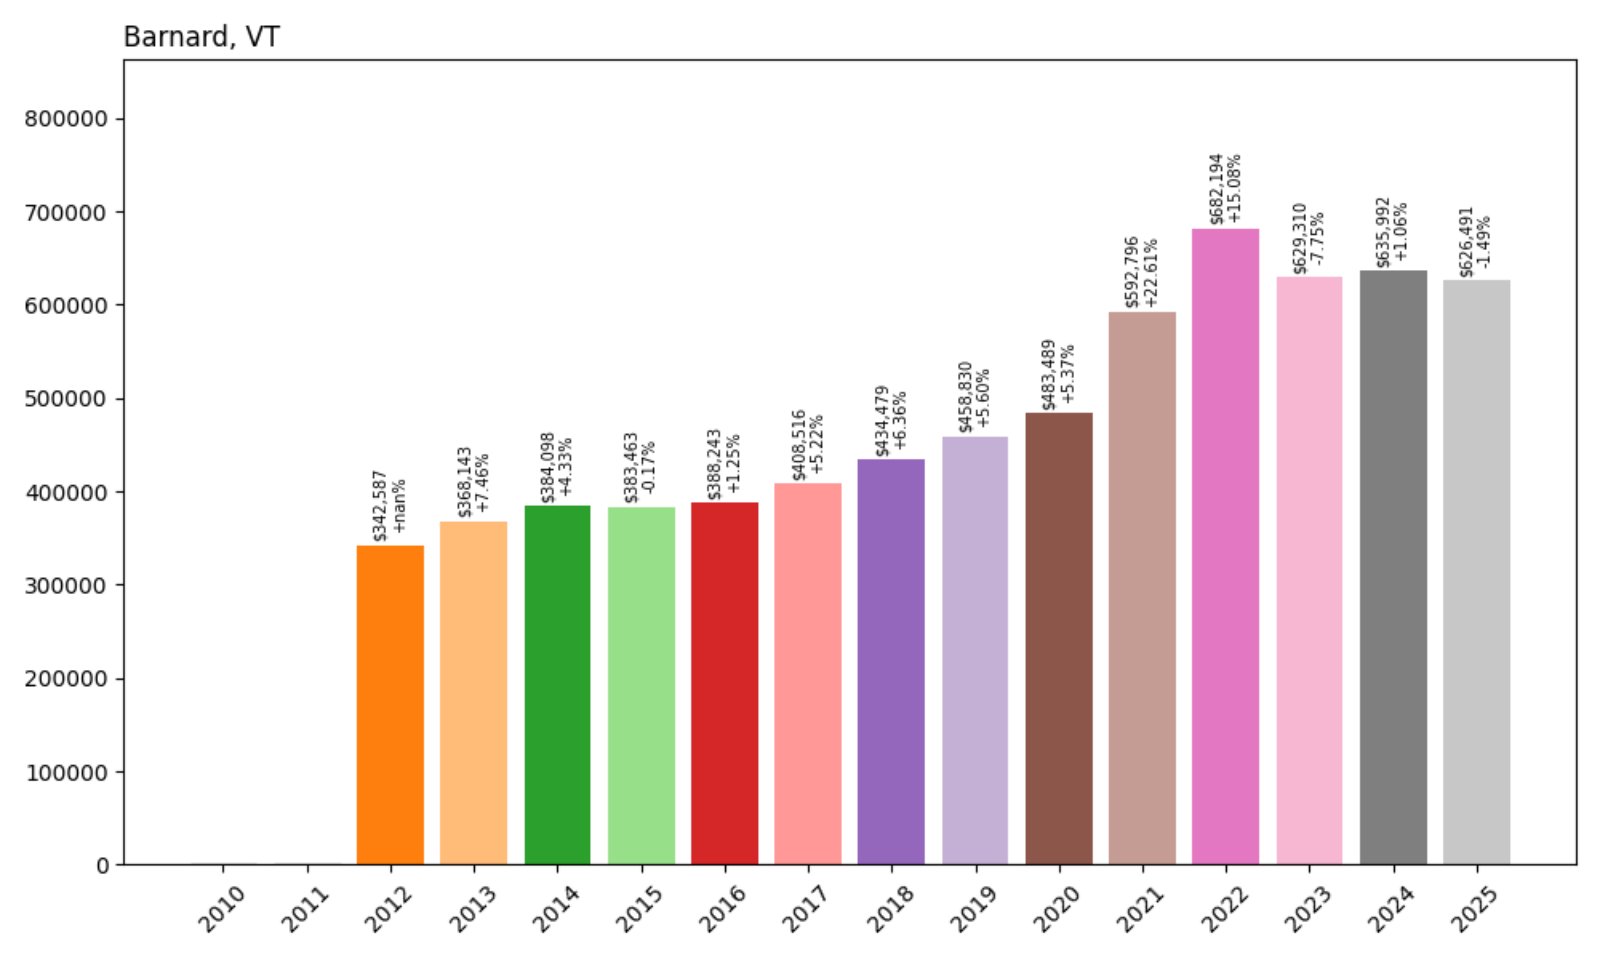
- 2012: $342,587
- 2013: $368,143 (+$25,556, +7.46%)
- 2014: $384,098 (+$15,956, +4.33%)
- 2015: $383,463 (−$635, −0.17%)
- 2016: $388,243 (+$4,780, +1.25%)
- 2017: $408,516 (+$20,273, +5.22%)
- 2018: $434,479 (+$25,963, +6.36%)
- 2019: $458,830 (+$24,352, +5.60%)
- 2020: $483,489 (+$24,659, +5.37%)
- 2021: $592,796 (+$109,307, +22.61%)
- 2022: $682,194 (+$89,398, +15.08%)
- 2023: $629,310 (−$52,884, −7.75%)
- 2024: $635,992 (+$6,682, +1.06%)
- 2025: $626,491 (−$9,501, −1.49%)
Barnard has seen an 83% increase in home values since 2012, with the strongest gains clustered in 2020–2022. Prices have dipped in recent years, but overall value remains high for this rural community.
Barnard – Lakeside Peace and Country Elegance
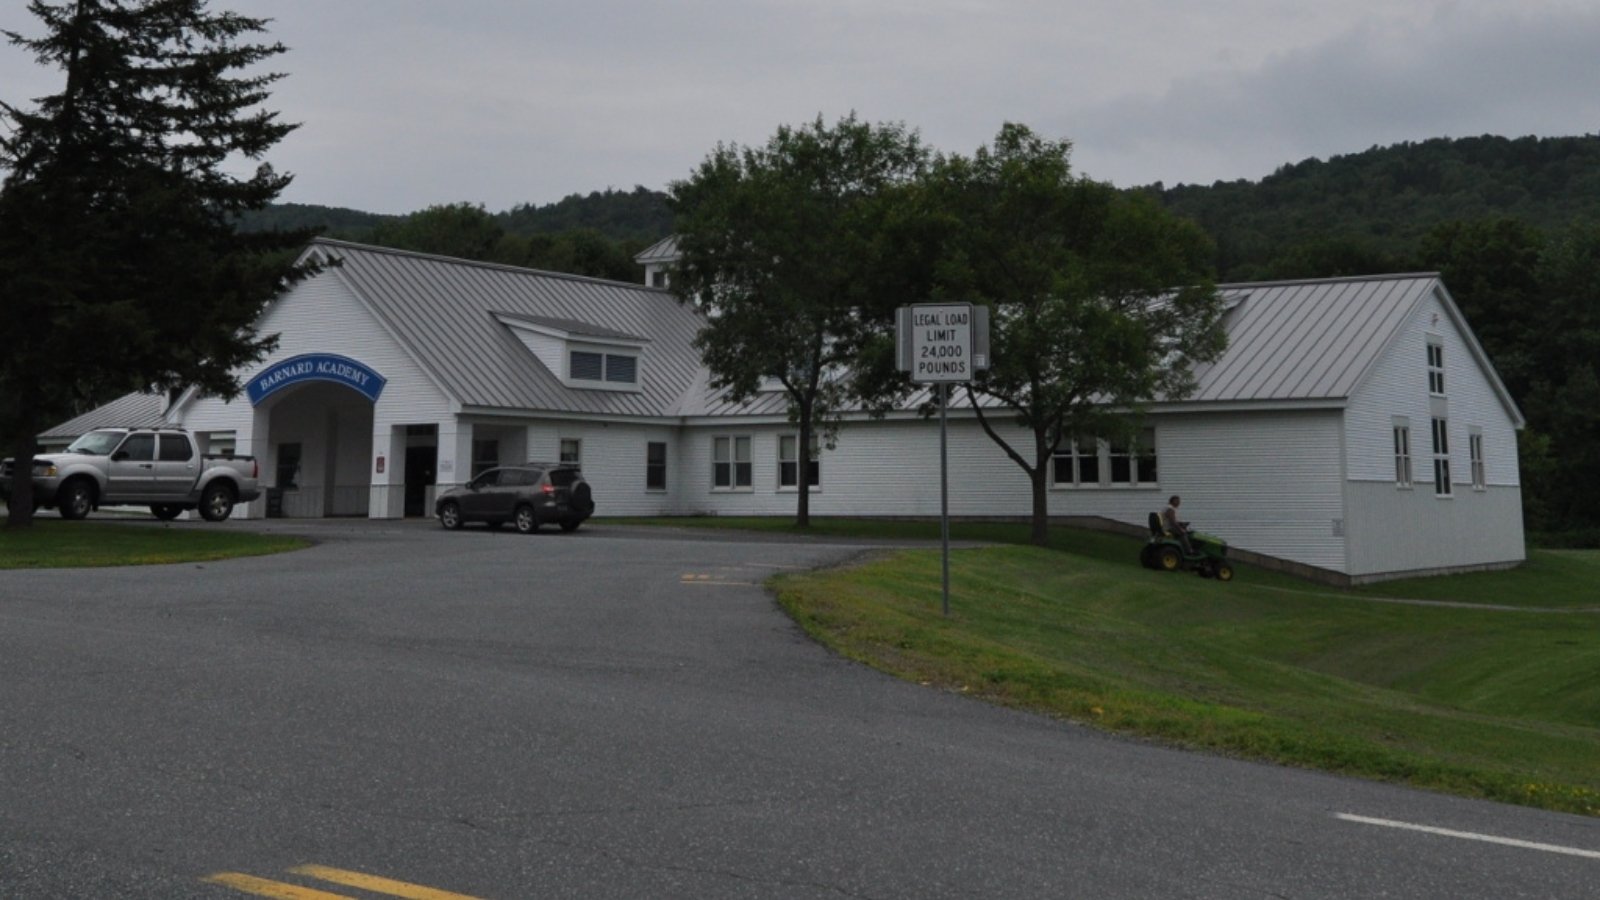
Barnard is best known for Silver Lake and its lush surroundings. Located in Windsor County, it draws interest from luxury buyers looking for lakefront properties and privacy. Several notable inns and retreats add prestige to the area.
Though 2023 and 2025 saw slight price retreats, the long-term growth reflects high-end demand and the town’s appeal as a peaceful, picturesque getaway. The tight inventory of desirable properties will likely continue to keep values elevated.
11. Manchester – 92% Home Price Increase Since 2010
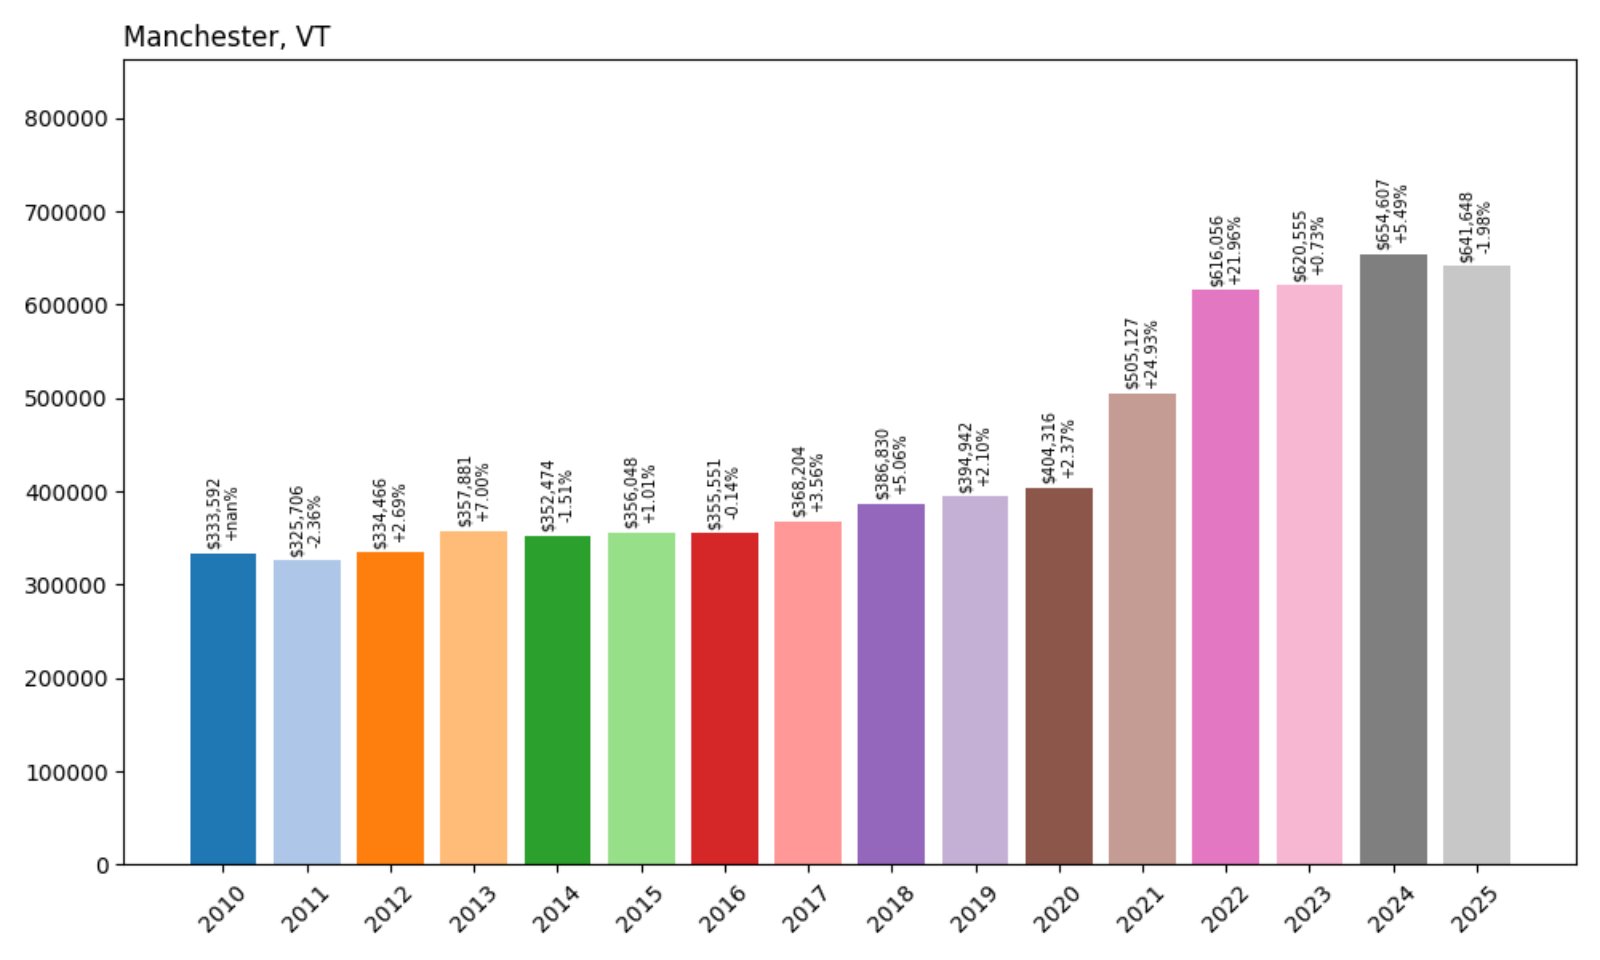
- 2010: $333,592
- 2011: $325,706 (−$7,886, −2.36%)
- 2012: $334,466 (+$8,760, +2.69%)
- 2013: $357,881 (+$23,416, +7.00%)
- 2014: $352,474 (−$5,407, −1.51%)
- 2015: $356,048 (+$3,573, +1.01%)
- 2016: $355,551 (−$496, −0.14%)
- 2017: $368,204 (+$12,652, +3.56%)
- 2018: $386,830 (+$18,626, +5.06%)
- 2019: $394,942 (+$8,113, +2.10%)
- 2020: $404,316 (+$9,374, +2.37%)
- 2021: $505,127 (+$100,810, +24.93%)
- 2022: $616,056 (+$110,929, +21.96%)
- 2023: $620,555 (+$4,499, +0.73%)
- 2024: $654,607 (+$34,052, +5.49%)
- 2025: $641,648 (−$12,959, −1.98%)
Manchester’s home values have risen 92% since 2010. Like many Vermont towns, the largest spikes occurred in 2021 and 2022. Prices have slightly corrected since then but remain among the highest in southern Vermont.
Manchester – Upscale Destination with Shopping and Skiing
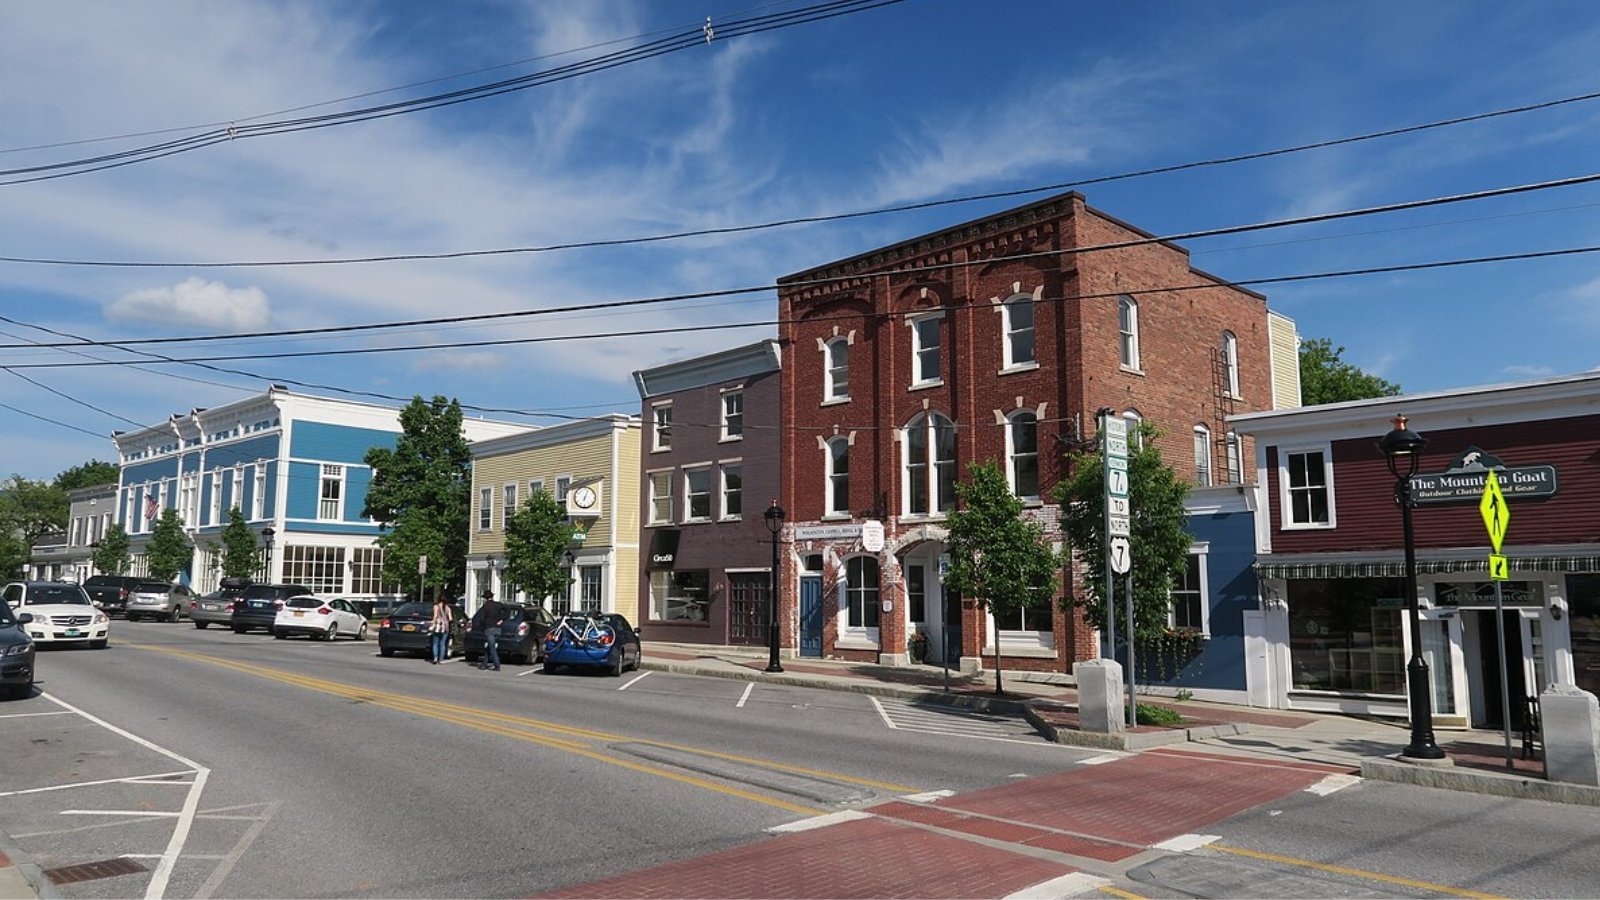
Manchester is a southern Vermont hub known for its outlet shopping, fine dining, and proximity to Bromley and Stratton ski resorts. With a blend of affluent full-time residents and second-home owners, it offers a more cosmopolitan feel than many small towns in the state.
The luxury market helped propel prices upward over the past few years. Even with modest pullbacks, the area’s unique mix of culture, commerce, and access to recreation ensures strong long-term value.
10. Winhall – 113% Home Price Increase Since 2012
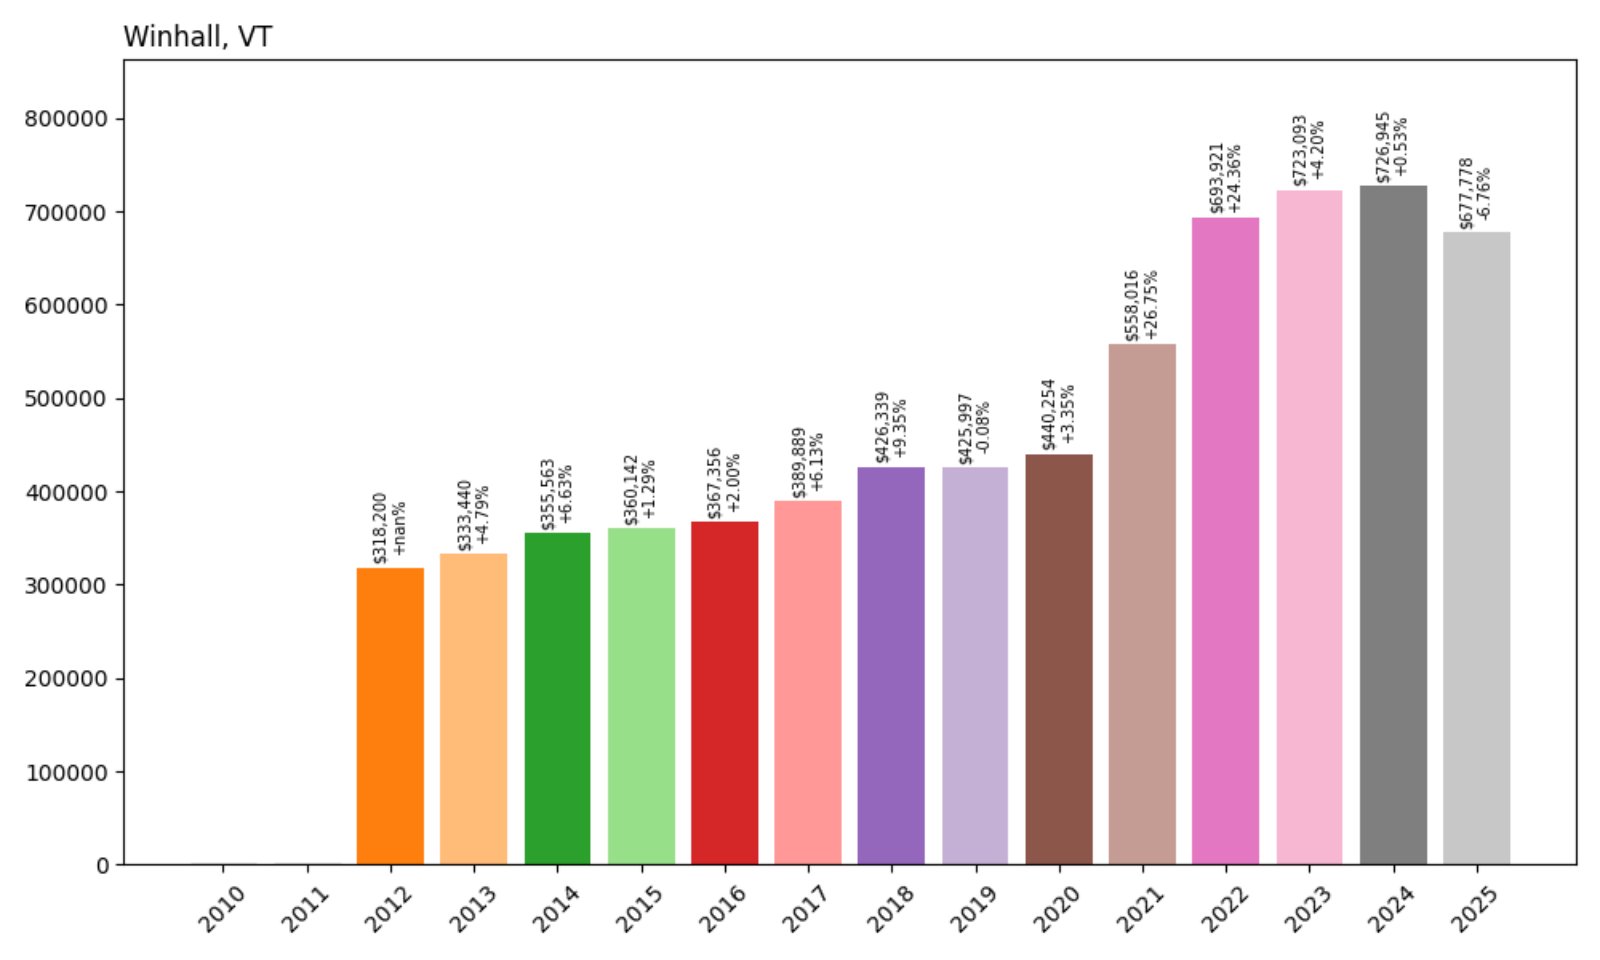
- 2012: $318,200
- 2013: $333,440 (+$15,240, +4.79%)
- 2014: $355,563 (+$22,123, +6.63%)
- 2015: $360,142 (+$4,579, +1.29%)
- 2016: $367,356 (+$7,214, +2.00%)
- 2017: $389,889 (+$22,533, +6.13%)
- 2018: $426,339 (+$36,450, +9.35%)
- 2019: $425,997 (−$342, −0.08%)
- 2020: $440,254 (+$14,257, +3.35%)
- 2021: $558,016 (+$117,763, +26.75%)
- 2022: $693,921 (+$135,905, +24.36%)
- 2023: $723,093 (+$29,172, +4.20%)
- 2024: $726,945 (+$3,852, +0.53%)
- 2025: $677,778 (−$49,167, −6.76%)
Winhall’s home values have soared 113% since 2012, with massive increases from 2020 through 2022. Although 2025 saw a notable decline, values remain more than double what they were a decade ago.
Winhall – A Premier Ski Retreat at Stratton’s Doorstep
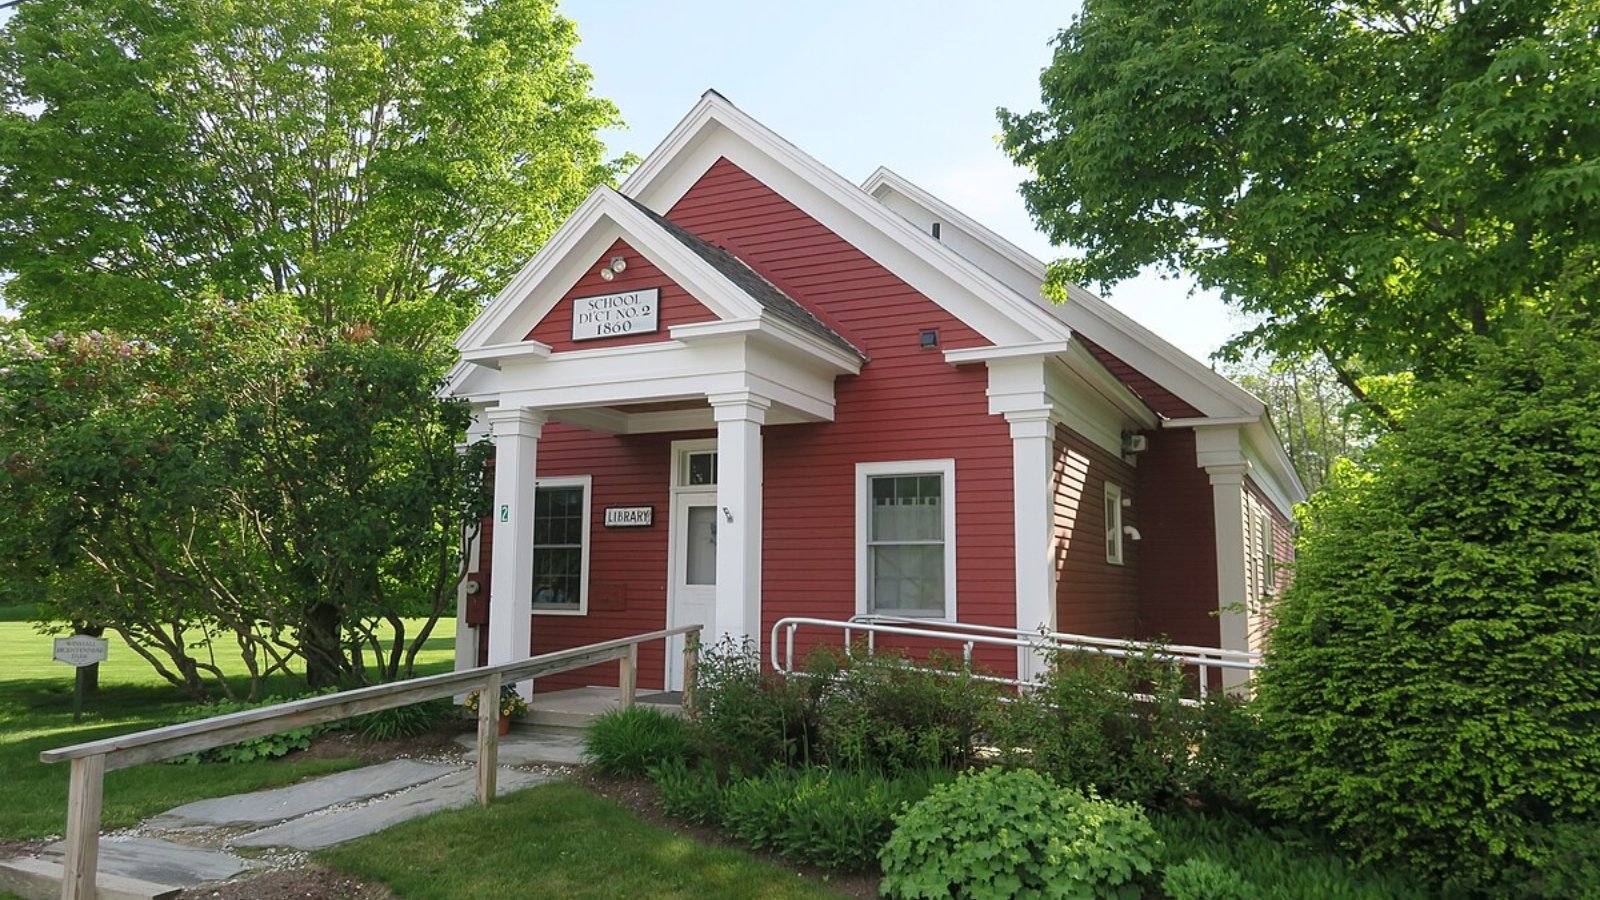
Home to much of the Stratton Mountain Resort area, Winhall in Bennington County is packed with ski chalets and vacation homes. Its proximity to major lifts and trails makes it one of Vermont’s most in-demand winter destinations.
The surge in home values during the pandemic reflected a rush for second homes and remote living with recreational access. While the recent drop signals market correction, Stratton’s draw ensures long-term desirability and continued attention from affluent buyers.
9. Pomfret – 93% Home Price Increase Since 2012
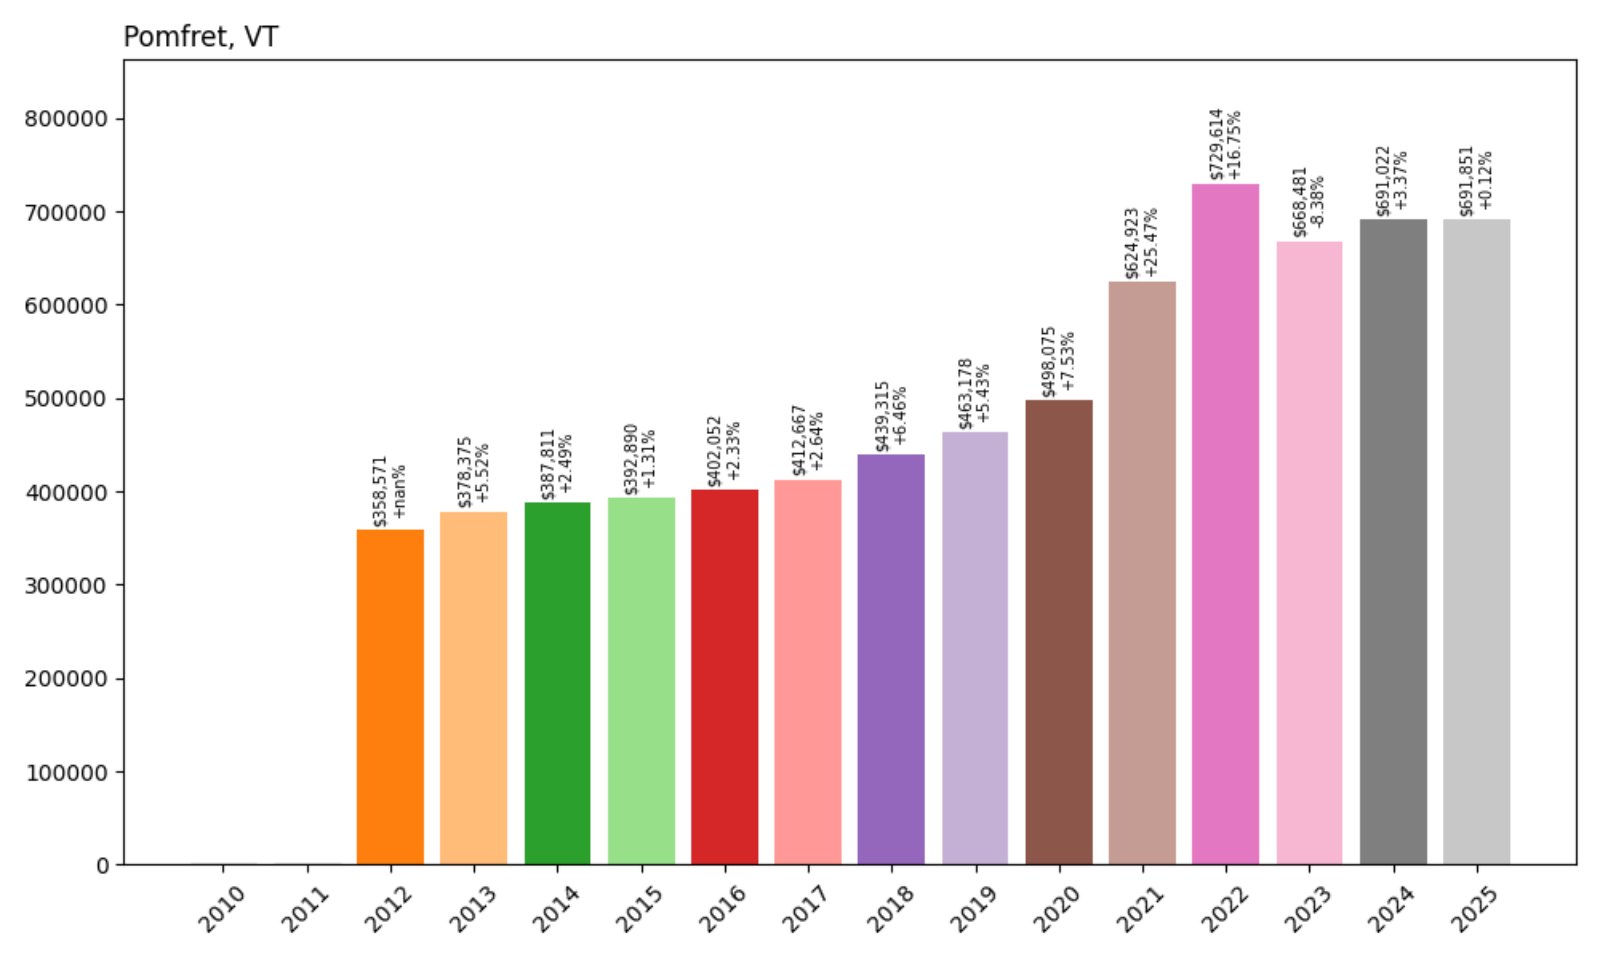
- 2012: $358,571
- 2013: $378,375 (+$19,804, +5.52%)
- 2014: $387,811 (+$9,436, +2.49%)
- 2015: $392,890 (+$5,079, +1.31%)
- 2016: $402,052 (+$9,162, +2.33%)
- 2017: $412,667 (+$10,615, +2.64%)
- 2018: $439,315 (+$26,647, +6.46%)
- 2019: $463,178 (+$23,863, +5.43%)
- 2020: $498,075 (+$34,897, +7.53%)
- 2021: $624,923 (+$126,849, +25.47%)
- 2022: $729,614 (+$104,691, +16.75%)
- 2023: $668,481 (−$61,133, −8.38%)
- 2024: $691,022 (+$22,541, +3.37%)
- 2025: $691,851 (+$829, +0.12%)
Pomfret’s home prices rose 93% since 2012, peaking in 2022. The town weathered a steep decline in 2023 but bounced back to remain stable in 2025, suggesting a market regaining balance.
Pomfret – Pastoral Views and Woodstock Proximity
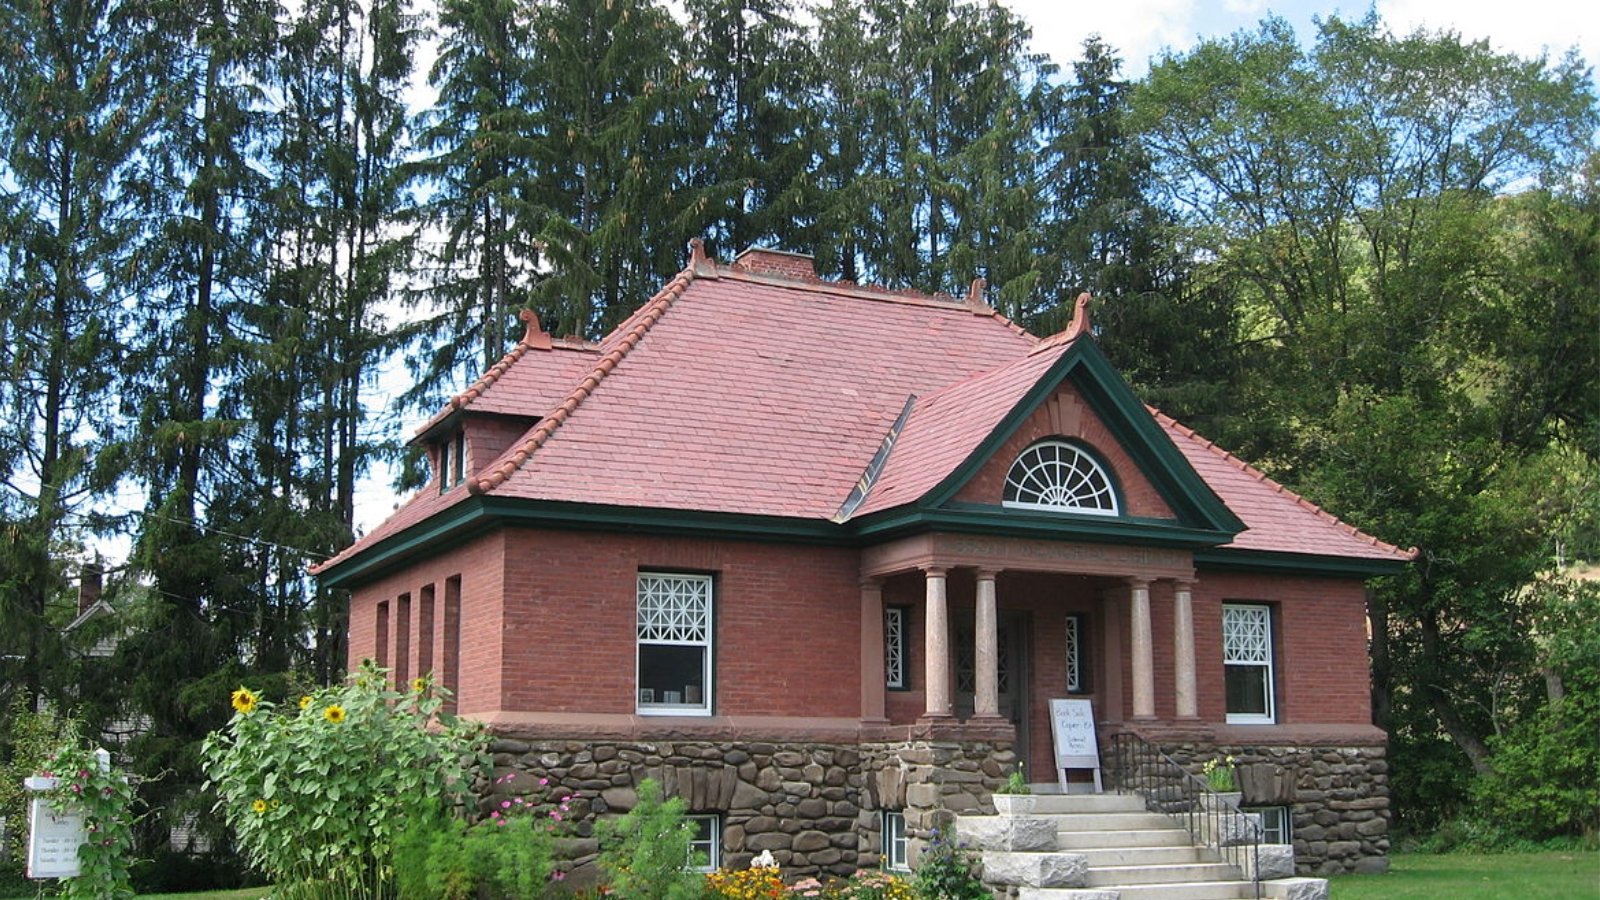
Pomfret is a small Windsor County town nestled next to Woodstock, combining rustic charm with upscale real estate. Many homes are historic or architect-designed properties with mountain views and large plots of land.
The post-2020 rise in rural luxury living sent Pomfret prices soaring. While a sharp decline in 2023 made waves, modest growth since suggests demand is stabilizing at a high level. Its scenic beauty and cultural ties to Woodstock continue to draw interest.
8. Stratton – 117% Home Price Increase Since 2012
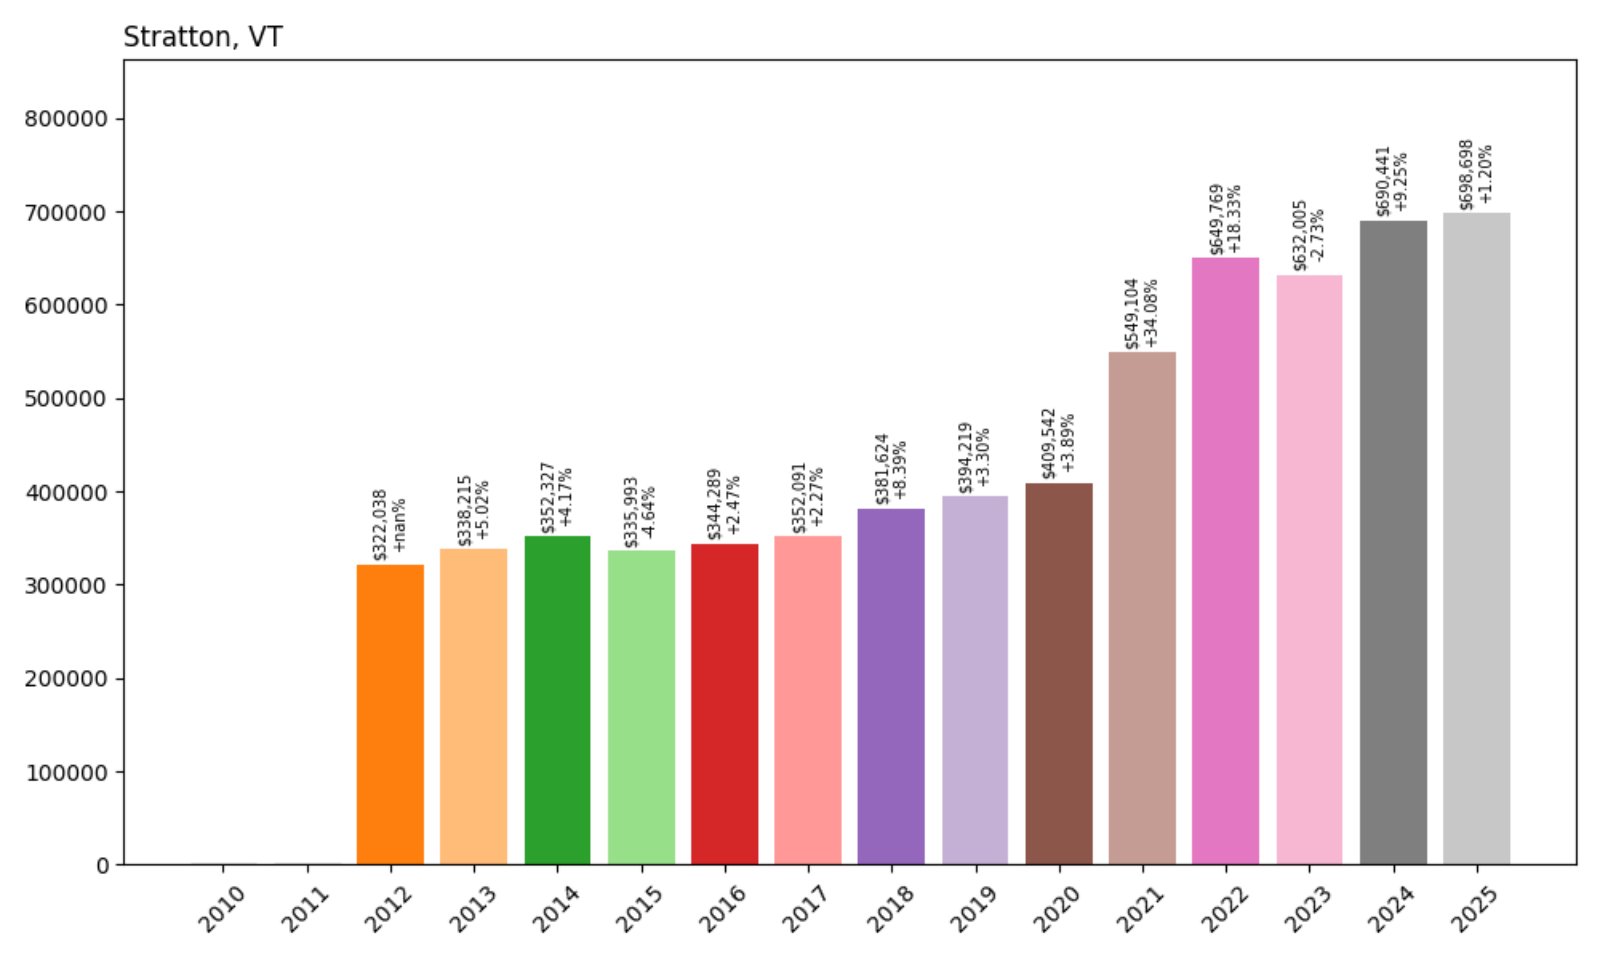
- 2012: $322,038
- 2013: $338,215 (+$16,177, +5.02%)
- 2014: $352,327 (+$14,112, +4.17%)
- 2015: $335,993 (−$16,334, −4.64%)
- 2016: $344,289 (+$8,296, +2.47%)
- 2017: $352,091 (+$7,802, +2.27%)
- 2018: $381,624 (+$29,533, +8.39%)
- 2019: $394,219 (+$12,595, +3.30%)
- 2020: $409,542 (+$15,323, +3.89%)
- 2021: $549,104 (+$139,562, +34.08%)
- 2022: $649,769 (+$100,664, +18.33%)
- 2023: $632,005 (−$17,764, −2.73%)
- 2024: $690,441 (+$58,436, +9.25%)
- 2025: $698,698 (+$8,257, +1.20%)
Stratton’s home values have climbed 117% since 2012, with a standout surge between 2020 and 2022. Price growth has continued, albeit more slowly, in 2025.
Stratton – Southern Vermont’s Ski Capital
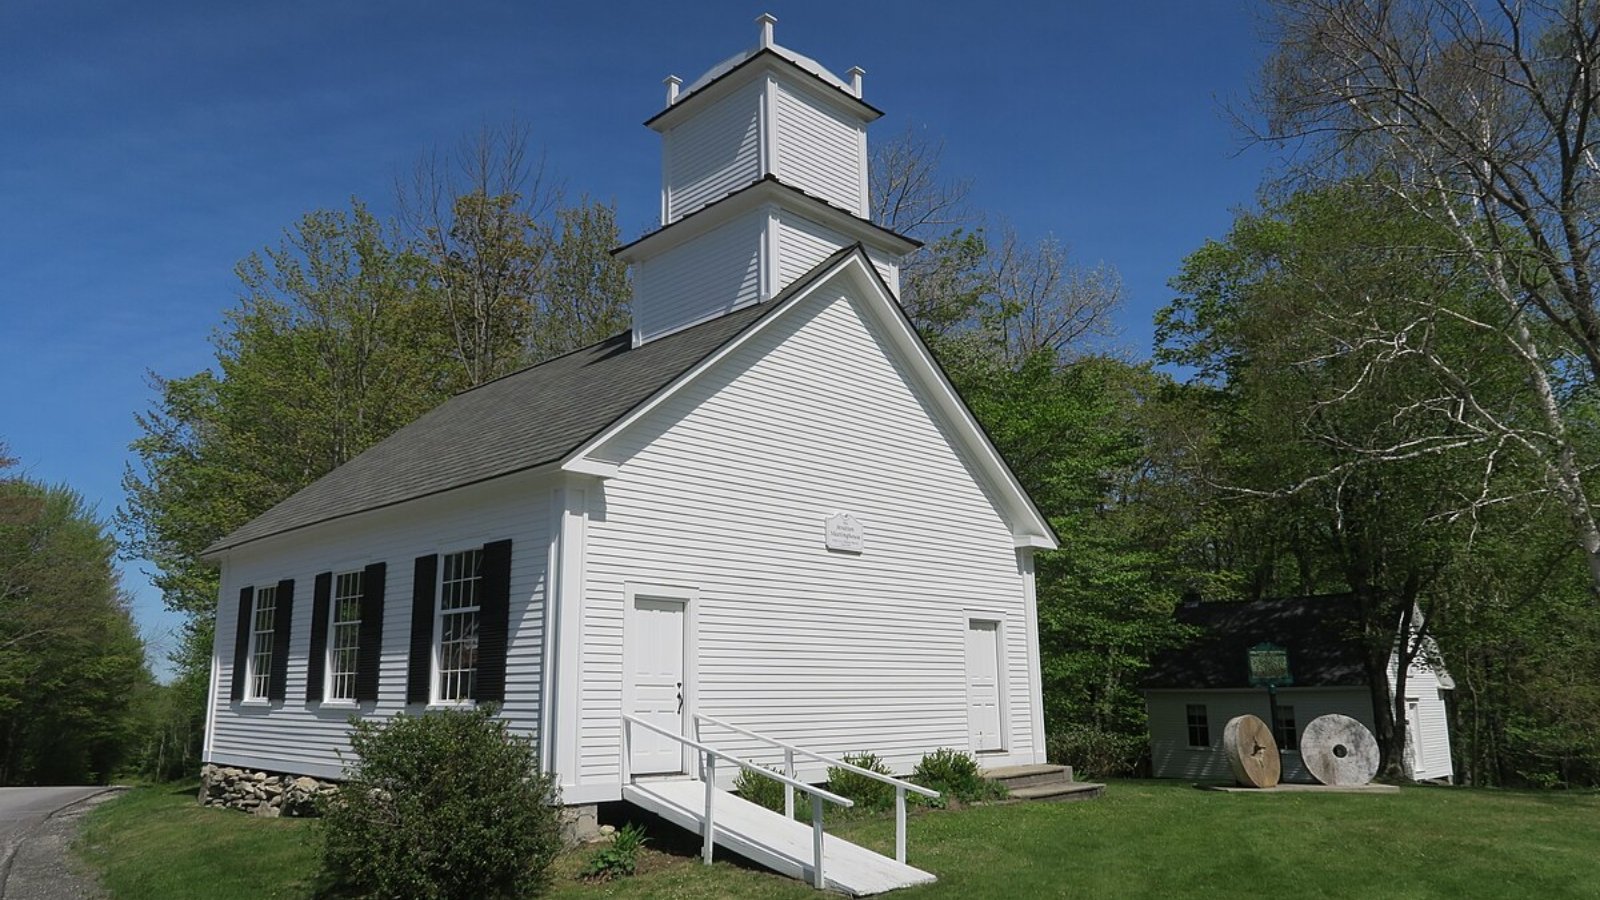
Stratton is synonymous with skiing in southern Vermont. The resort village and surrounding properties attract second-homeowners and investors year-round, thanks to snow sports in winter and mountain biking and golf in summer.
The real estate surge reflects Stratton’s stature as a four-season resort destination. With a thriving rental market and high-end new construction, prices remain strong. Even after a minor dip in 2023, continued growth in 2024 and 2025 points to lasting value.
7. Shelburne – 69% Home Price Increase Since 2011
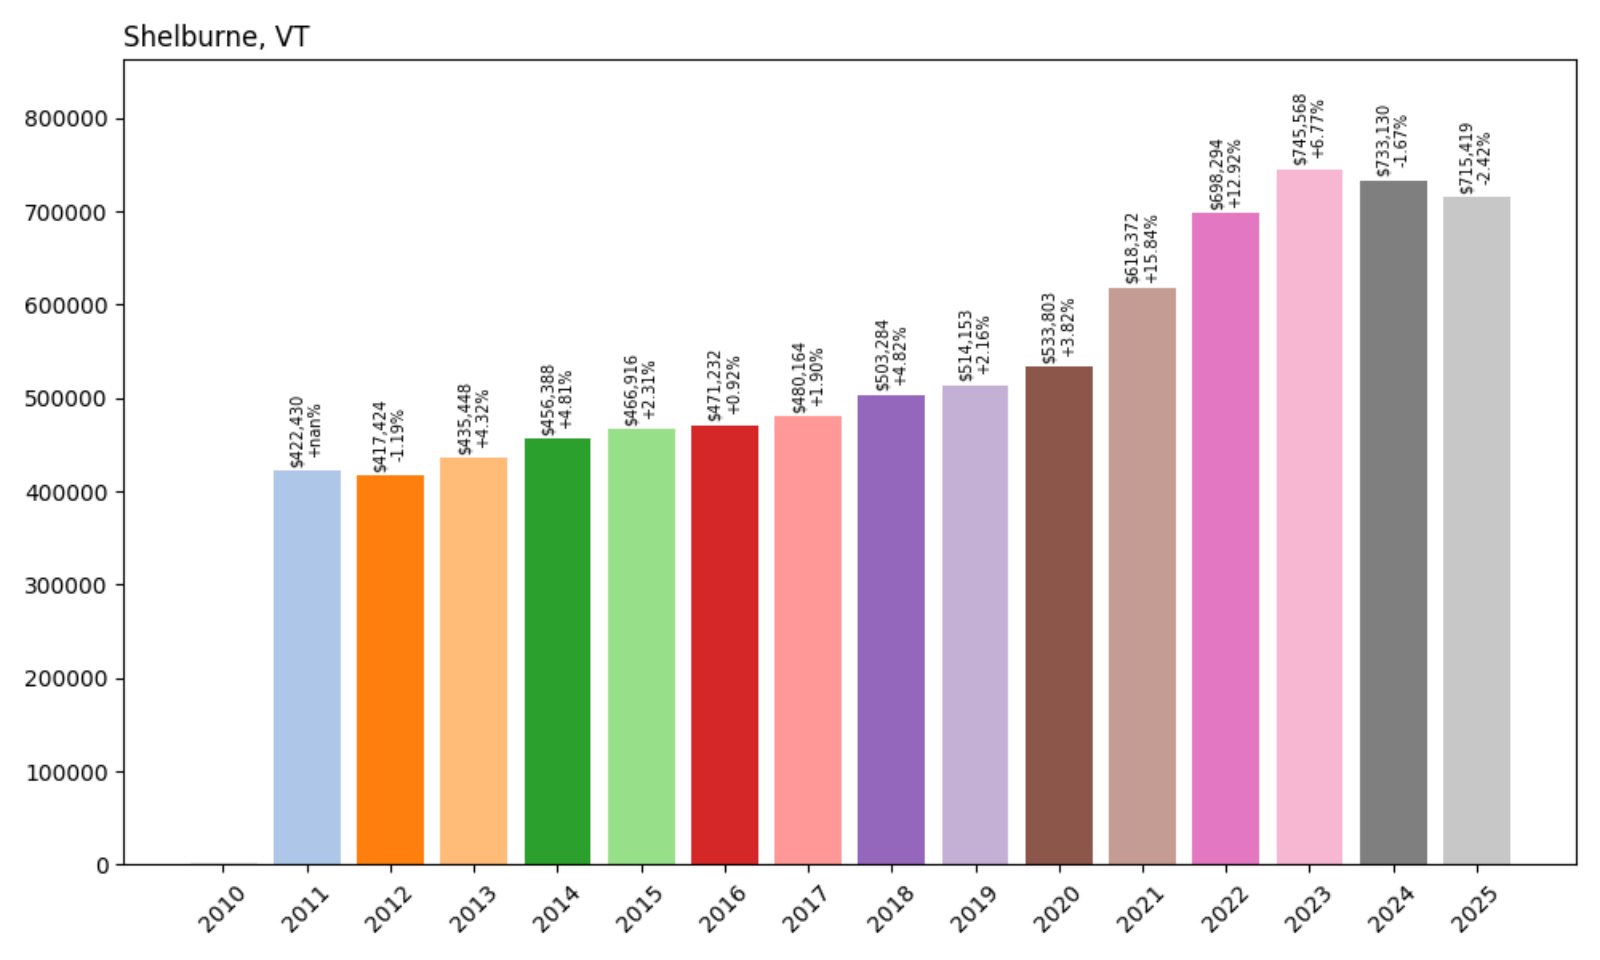
- 2011: $422,430
- 2012: $417,424 (−$5,006, −1.19%)
- 2013: $435,448 (+$18,024, +4.32%)
- 2014: $456,388 (+$20,940, +4.81%)
- 2015: $466,916 (+$10,528, +2.31%)
- 2016: $471,232 (+$4,316, +0.92%)
- 2017: $480,164 (+$8,932, +1.90%)
- 2018: $503,284 (+$23,121, +4.82%)
- 2019: $514,153 (+$10,869, +2.16%)
- 2020: $533,803 (+$19,650, +3.82%)
- 2021: $618,372 (+$84,569, +15.84%)
- 2022: $698,294 (+$79,922, +12.92%)
- 2023: $745,568 (+$47,274, +6.77%)
- 2024: $733,130 (−$12,439, −1.67%)
- 2025: $715,419 (−$17,711, −2.42%)
Shelburne home values have risen 69% since 2011, with strong gains through 2022. After peaking in 2023, the market has softened slightly, though values remain elevated.
Shelburne – Waterfront Living with Suburban Comfort
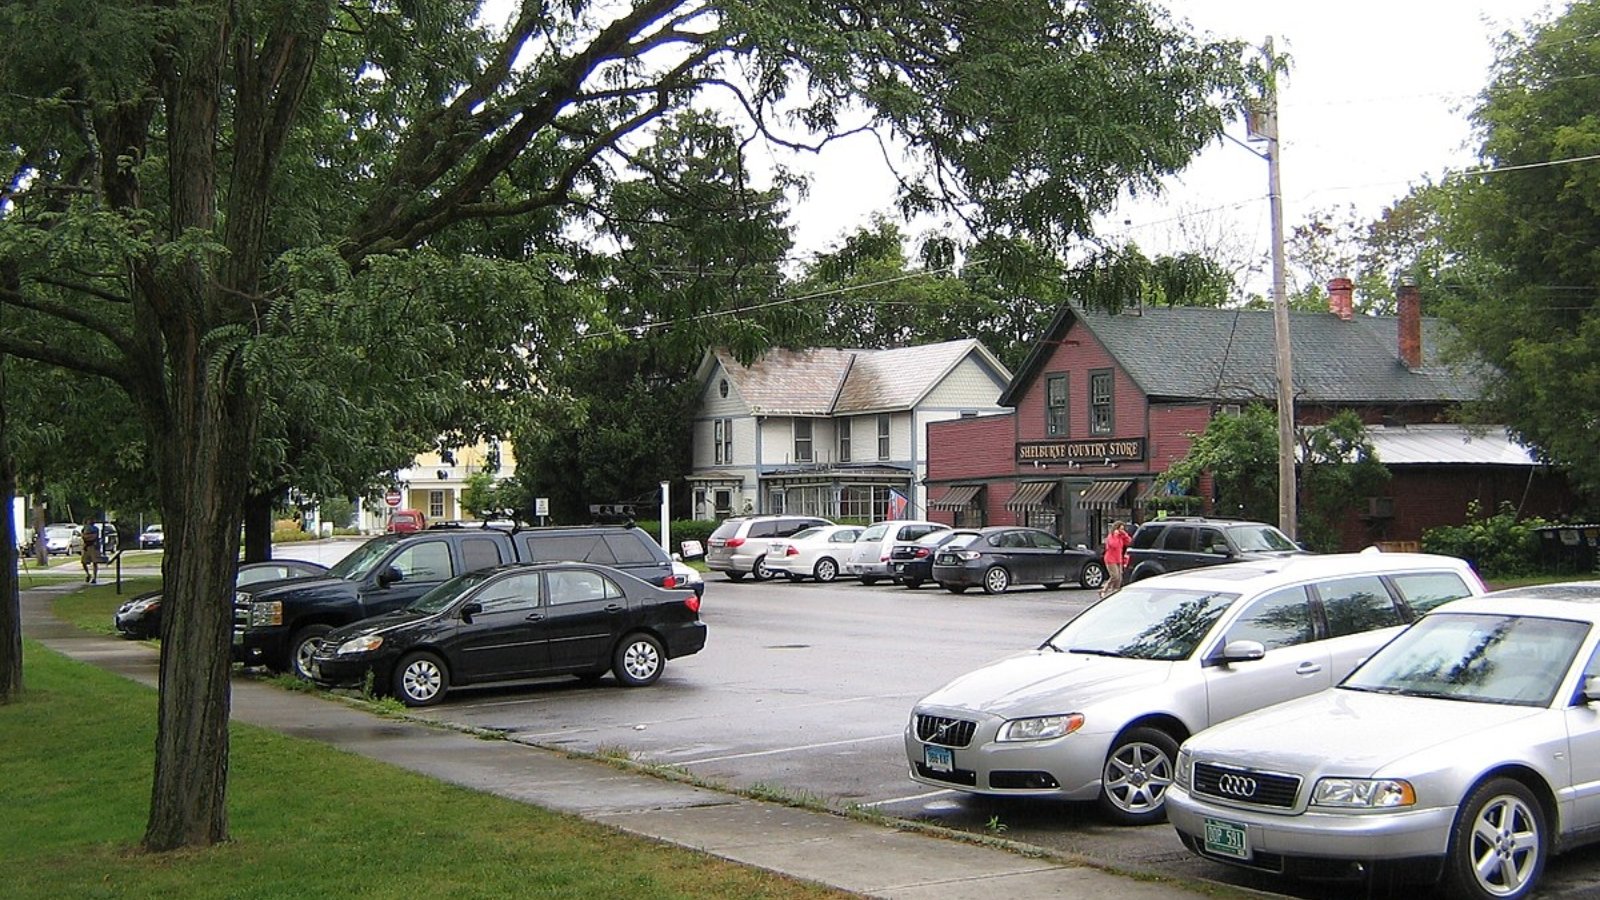
Located just south of Burlington, Shelburne is a desirable Chittenden County town offering lake access, museums, and high-end residential neighborhoods. Its combination of cultural offerings and natural beauty appeals to professionals and retirees alike.
The town’s upscale real estate market benefited from proximity to Burlington jobs and amenities, driving growth through the early 2020s. Recent declines may reflect broader affordability constraints, but demand for lakefront and luxury housing here remains solid.
6. Woodstock – 88% Home Price Increase Since 2010
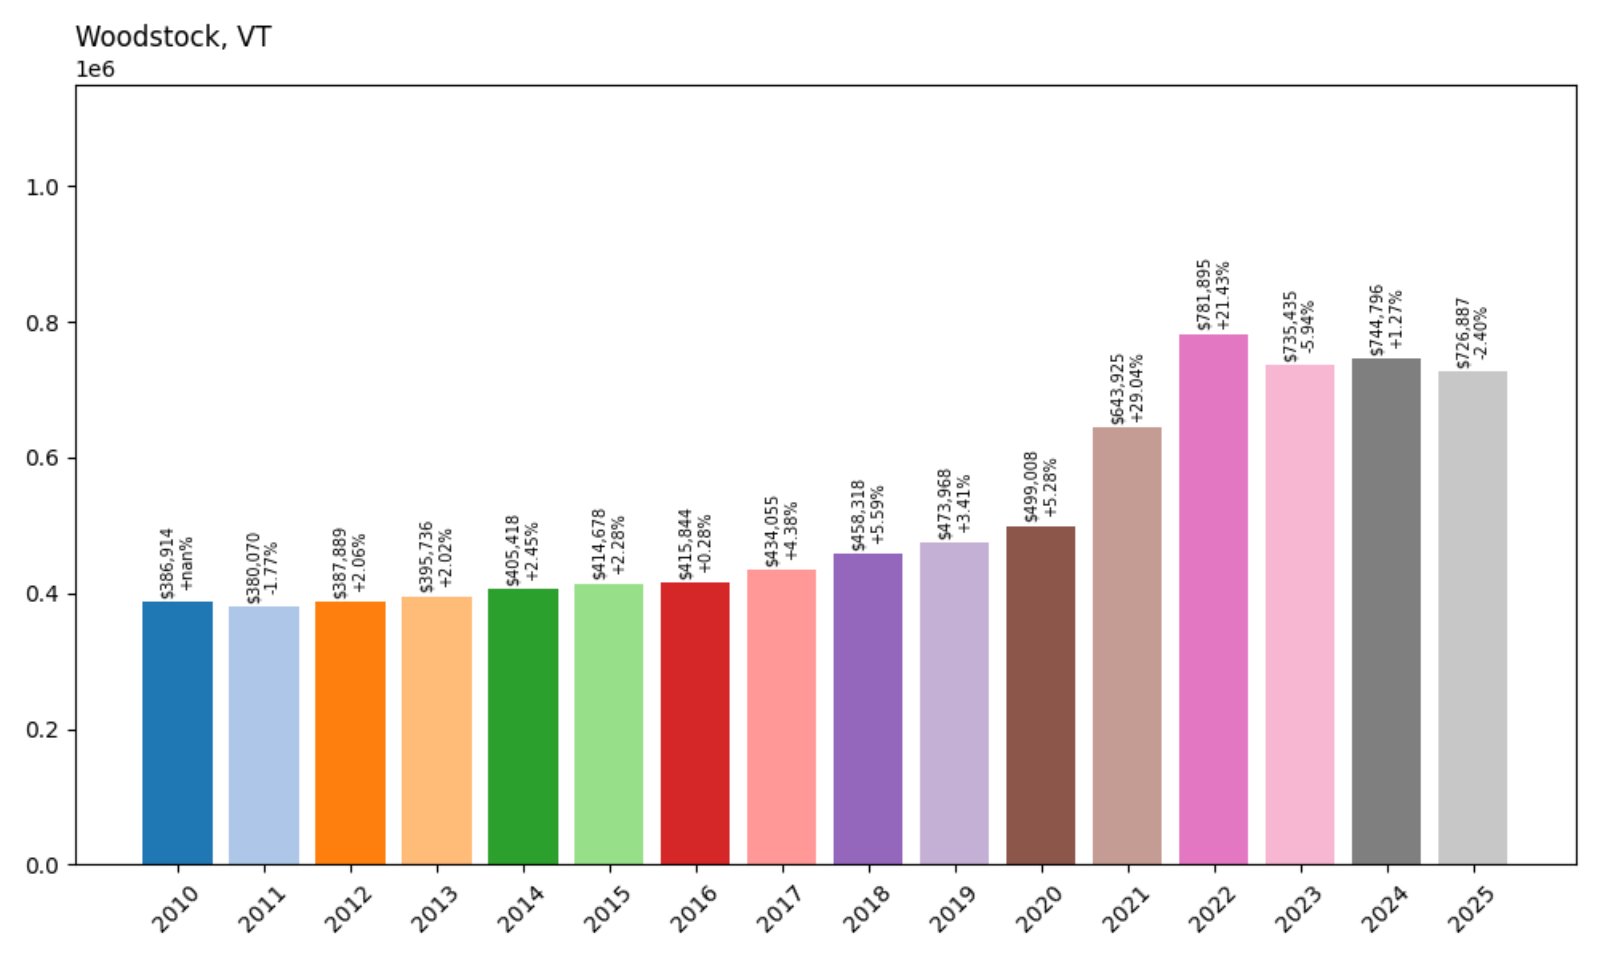
- 2010: $386,914
- 2011: $380,070 (−$6,844, −1.77%)
- 2012: $387,889 (+$7,819, +2.06%)
- 2013: $395,736 (+$7,846, +2.02%)
- 2014: $405,418 (+$9,682, +2.45%)
- 2015: $414,678 (+$9,261, +2.28%)
- 2016: $415,844 (+$1,166, +0.28%)
- 2017: $434,055 (+$18,211, +4.38%)
- 2018: $458,318 (+$24,263, +5.59%)
- 2019: $473,968 (+$15,650, +3.41%)
- 2020: $499,008 (+$25,041, +5.28%)
- 2021: $643,925 (+$144,916, +29.04%)
- 2022: $781,895 (+$137,970, +21.43%)
- 2023: $735,435 (−$46,460, −5.94%)
- 2024: $744,796 (+$9,361, +1.27%)
- 2025: $726,887 (−$17,909, −2.40%)
Woodstock has seen an 88% home price increase since 2010, much of it concentrated in 2021 and 2022. A modest retreat since then puts prices just below their 2022 peak.
Woodstock – Vermont’s Quintessential Historic Village
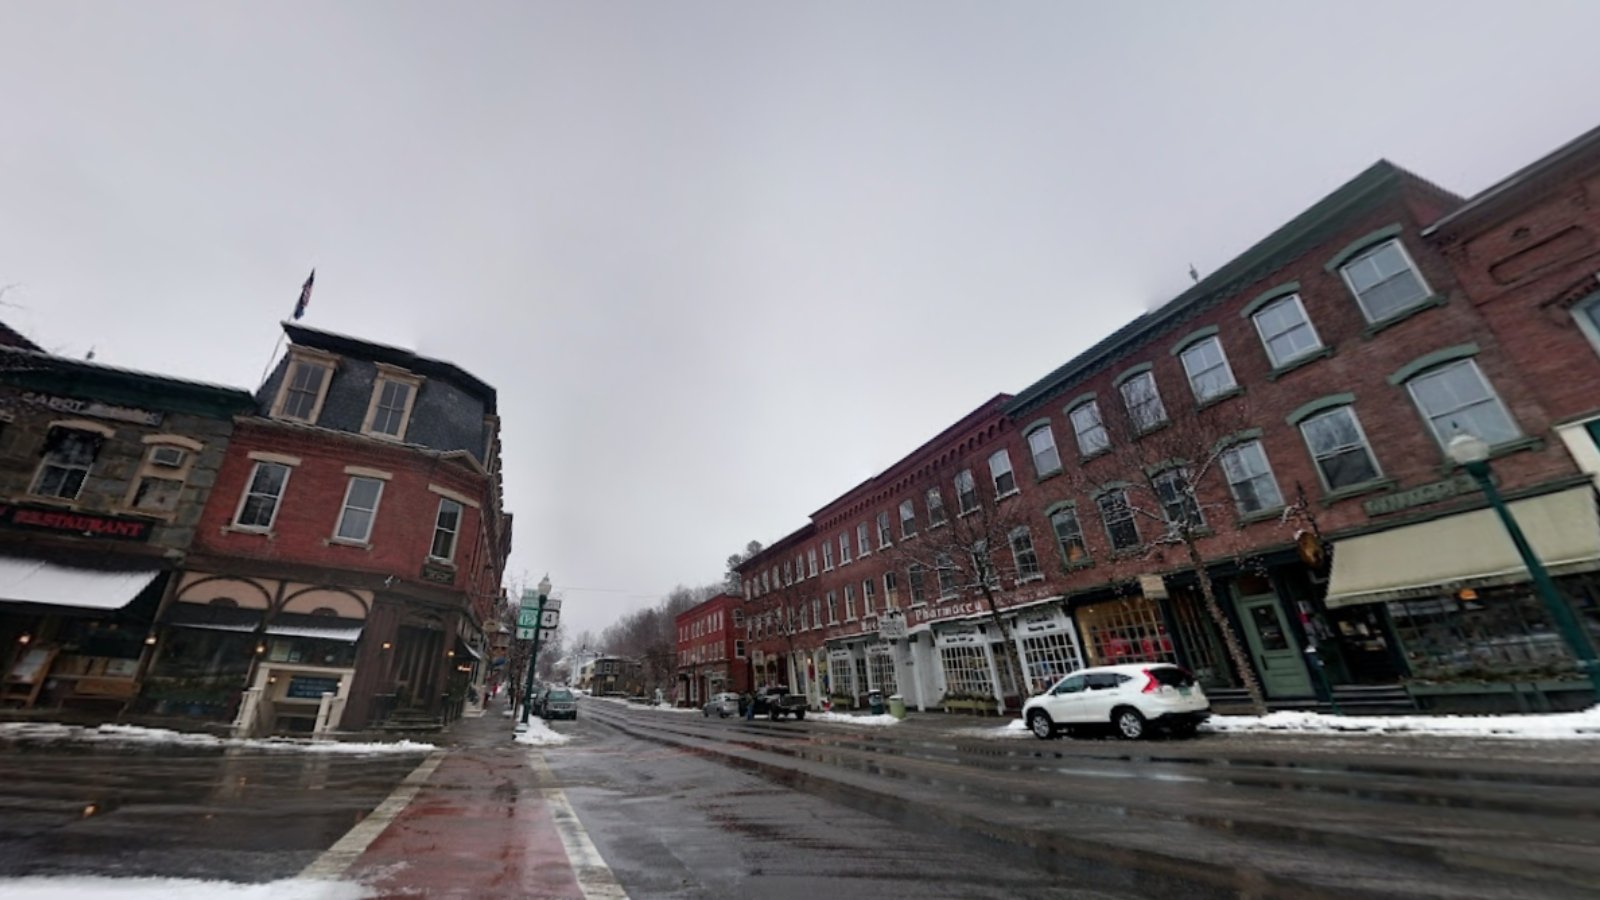
Often considered one of the most beautiful small towns in America, Woodstock combines classic New England charm with high-end homes and inns. Its walkable downtown, covered bridges, and cultural institutions keep it perennially popular.
The town saw a burst of luxury demand during the pandemic, but 2025 values reflect a return to a more balanced market. Woodstock continues to attract wealthy buyers and second-homeowners, ensuring it remains one of Vermont’s premier housing markets.
5. Dorset – 88% Home Price Increase Since 2010
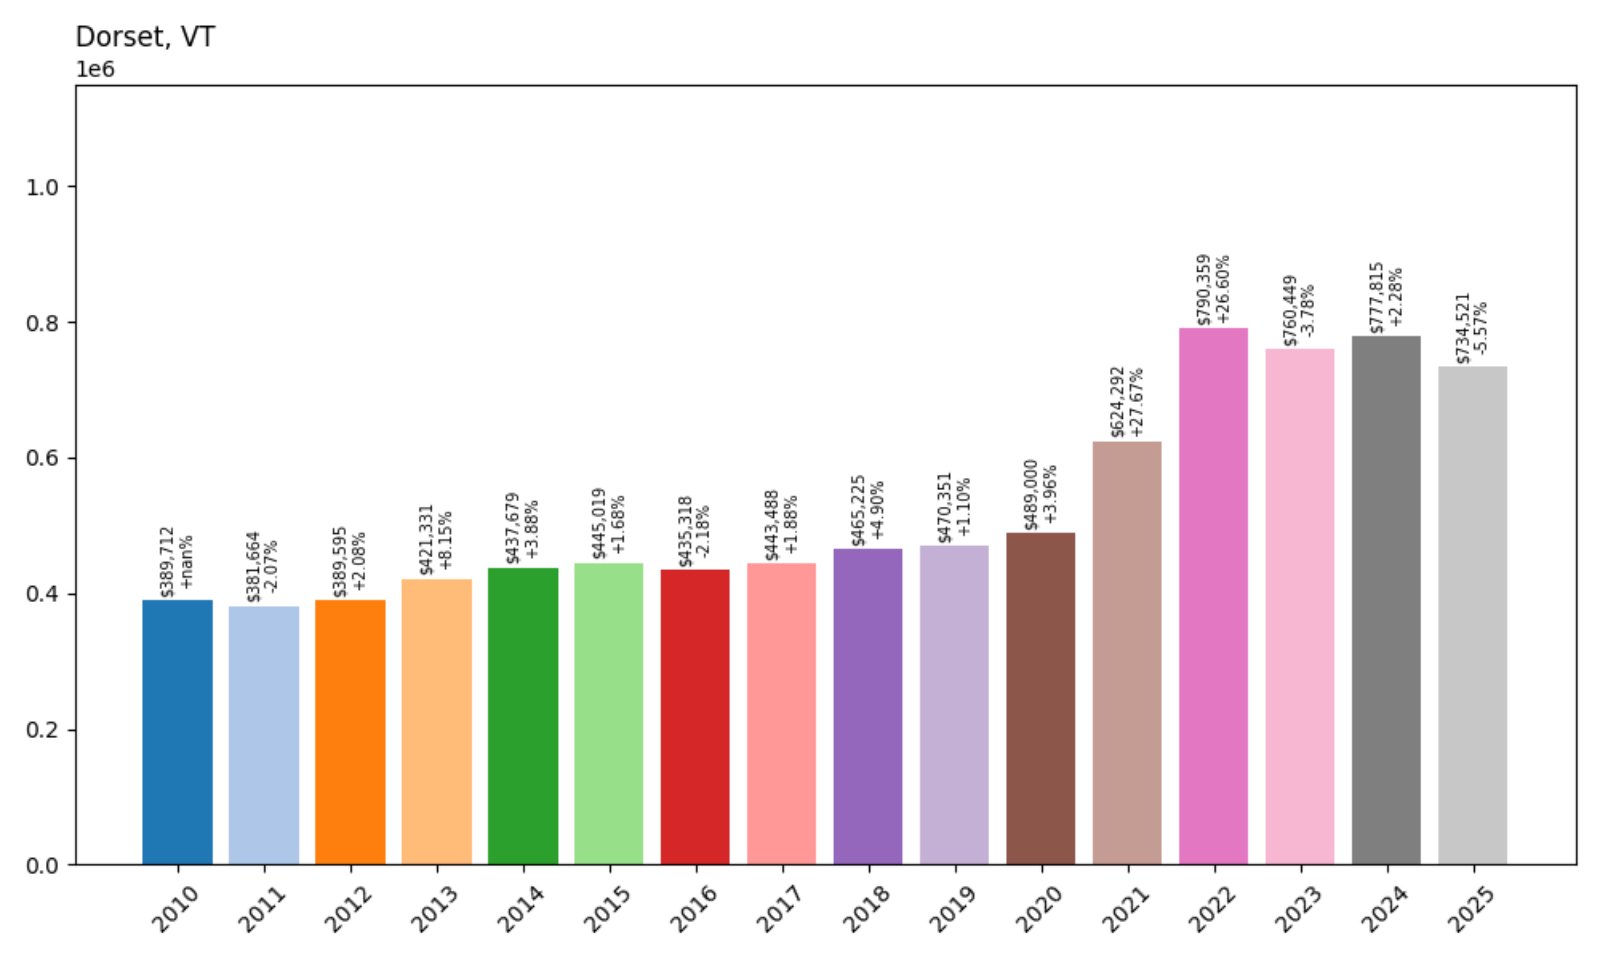
- 2010: $389,712
- 2011: $381,664 (−$8,048, −2.06%)
- 2012: $389,595 (+$7,931, +2.08%)
- 2013: $421,331 (+$31,735, +8.14%)
- 2014: $437,679 (+$16,348, +3.88%)
- 2015: $445,019 (+$7,340, +1.68%)
- 2016: $435,318 (−$9,701, −2.18%)
- 2017: $443,488 (+$8,170, +1.88%)
- 2018: $465,225 (+$21,737, +4.90%)
- 2019: $470,351 (+$5,126, +1.10%)
- 2020: $489,000 (+$18,650, +3.97%)
- 2021: $624,292 (+$135,292, +27.66%)
- 2022: $790,359 (+$166,067, +26.61%)
- 2023: $760,449 (−$29,910, −3.78%)
- 2024: $777,815 (+$17,366, +2.28%)
- 2025: $734,521 (−$43,294, −5.57%)
Dorset’s home values have grown 88% since 2010, driven by dramatic increases during the pandemic housing boom. While 2025 reflects a price pullback, the town remains among Vermont’s most premium markets.
Dorset – Mountain Charm with High-End Appeal
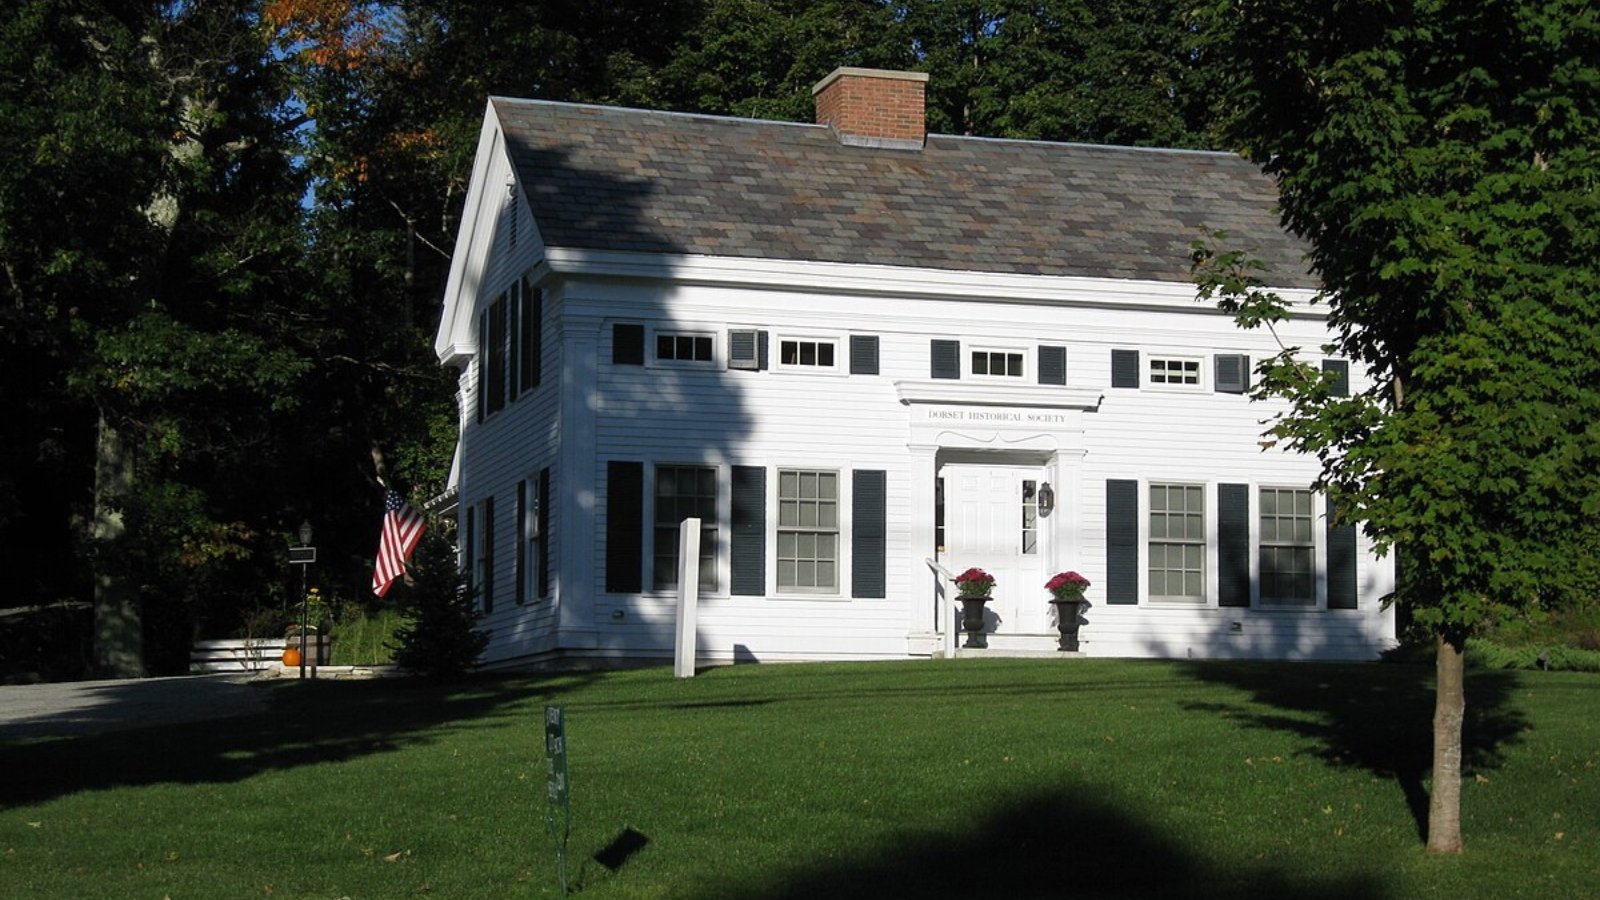
Located in Bennington County near Manchester, Dorset is a picturesque town known for marble quarries, historic inns, and a strong second-home market. The town’s real estate saw a huge uptick in value between 2020 and 2022 as buyers sought scenic refuge with upscale amenities.
The mild price softening in 2025 doesn’t change Dorset’s prestige. It offers privacy, proximity to Bromley and Stratton ski areas, and a sense of exclusivity that continues to attract affluent buyers.
4. Norwich – 97% Home Price Increase Since 2010
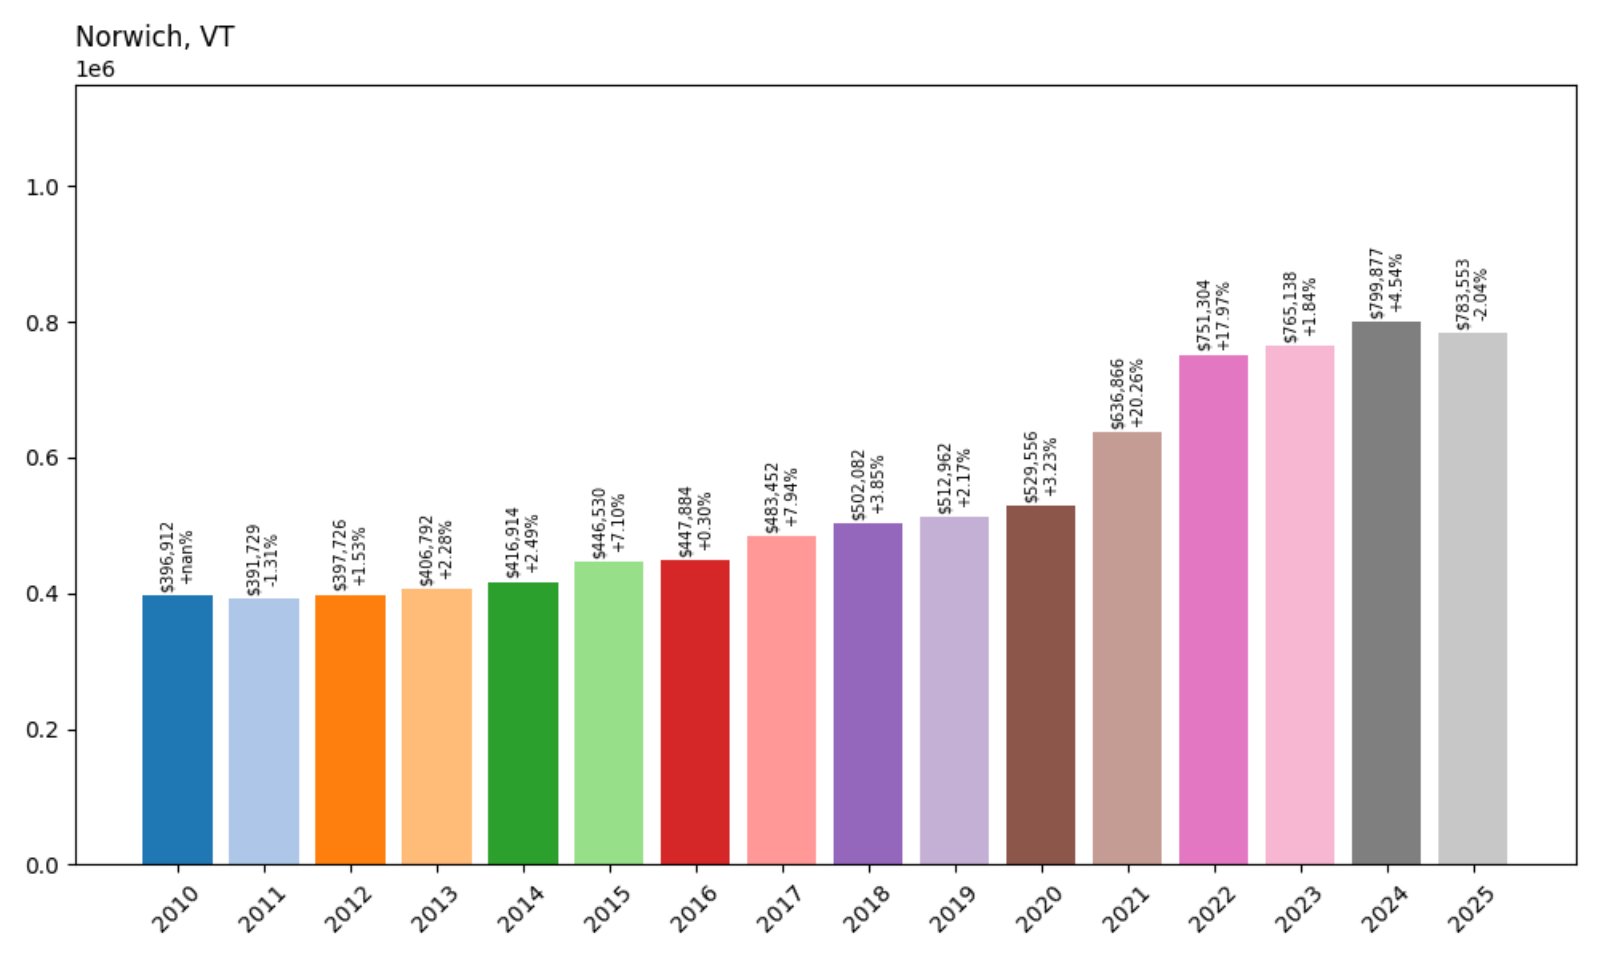
- 2010: $396,912
- 2011: $391,729 (−$5,183, −1.31%)
- 2012: $397,726 (+$5,997, +1.53%)
- 2013: $406,792 (+$9,066, +2.28%)
- 2014: $416,914 (+$10,122, +2.49%)
- 2015: $446,530 (+$29,616, +7.10%)
- 2016: $447,884 (+$1,354, +0.30%)
- 2017: $483,452 (+$35,568, +7.94%)
- 2018: $502,082 (+$18,630, +3.85%)
- 2019: $512,962 (+$10,880, +2.17%)
- 2020: $529,556 (+$16,594, +3.23%)
- 2021: $636,866 (+$107,310, +20.26%)
- 2022: $751,304 (+$114,438, +17.97%)
- 2023: $765,138 (+$13,834, +1.84%)
- 2024: $799,877 (+$34,739, +4.54%)
- 2025: $783,553 (−$16,324, −2.04%)
Home values in Norwich have nearly doubled since 2010, with surging growth between 2020 and 2022. The slight drop in 2025 reflects stabilization after record highs.
Norwich – Ivy League Neighbor, Elite Real Estate
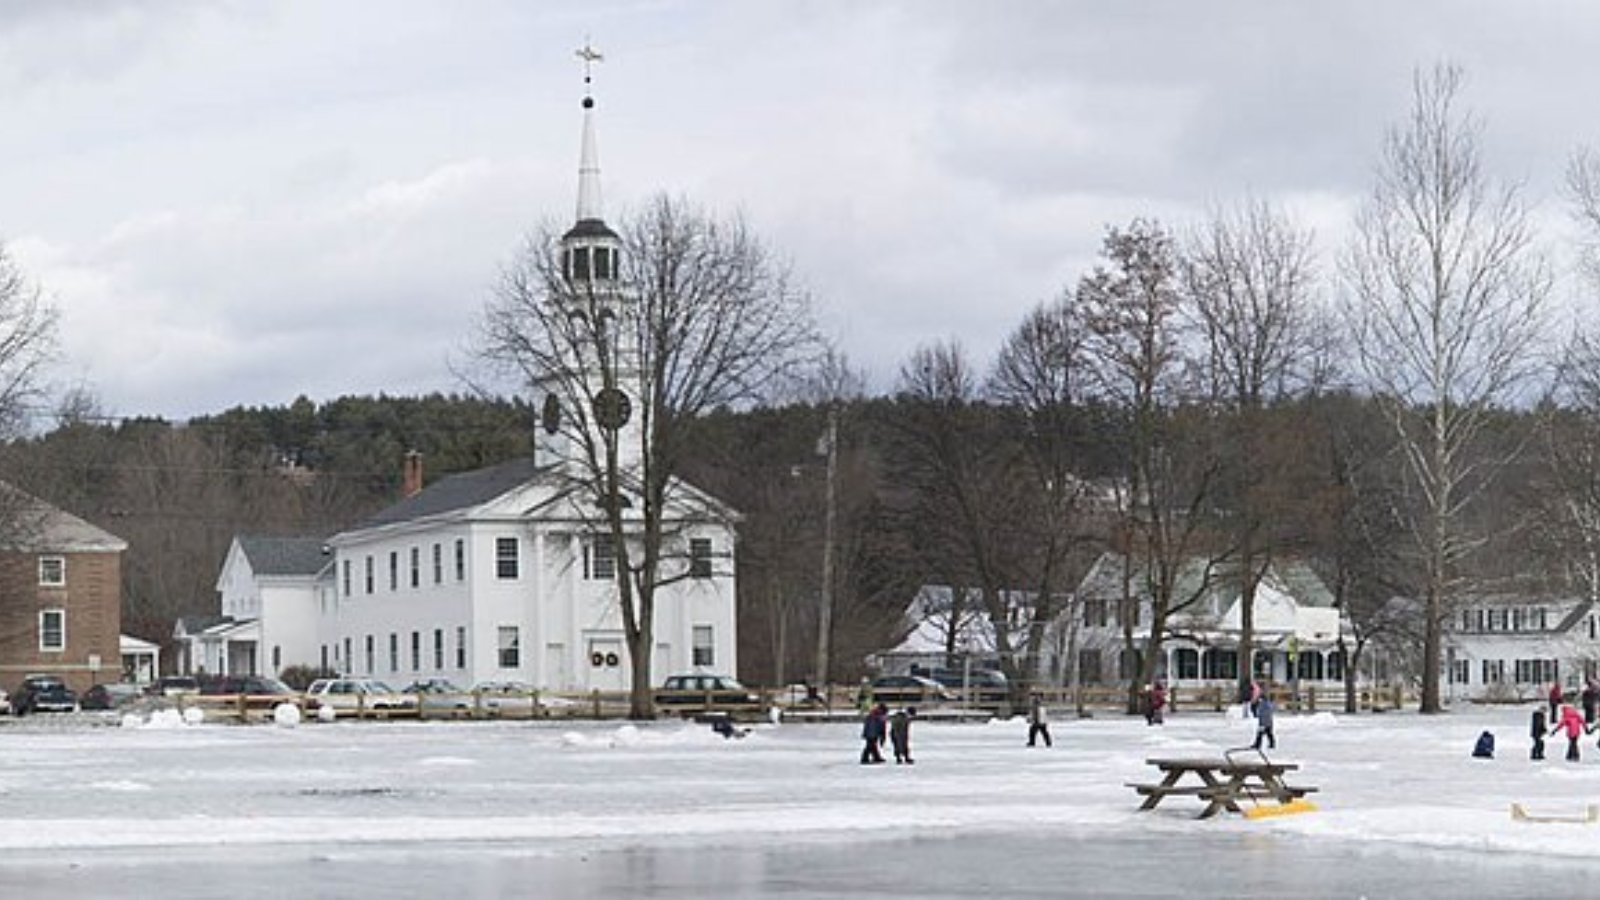
Sitting just across the river from Dartmouth College in New Hampshire, Norwich attracts academics, professionals, and affluent retirees. With easy access to Hanover’s amenities, Norwich’s quiet residential streets offer a peaceful yet connected lifestyle.
Its prestige and proximity to education and healthcare hubs pushed home prices higher during the pandemic era. Even with a slight dip, Norwich remains one of Vermont’s most expensive towns thanks to its location, schools, and well-maintained homes.
3. Landgrove – Price Increase Undetermined
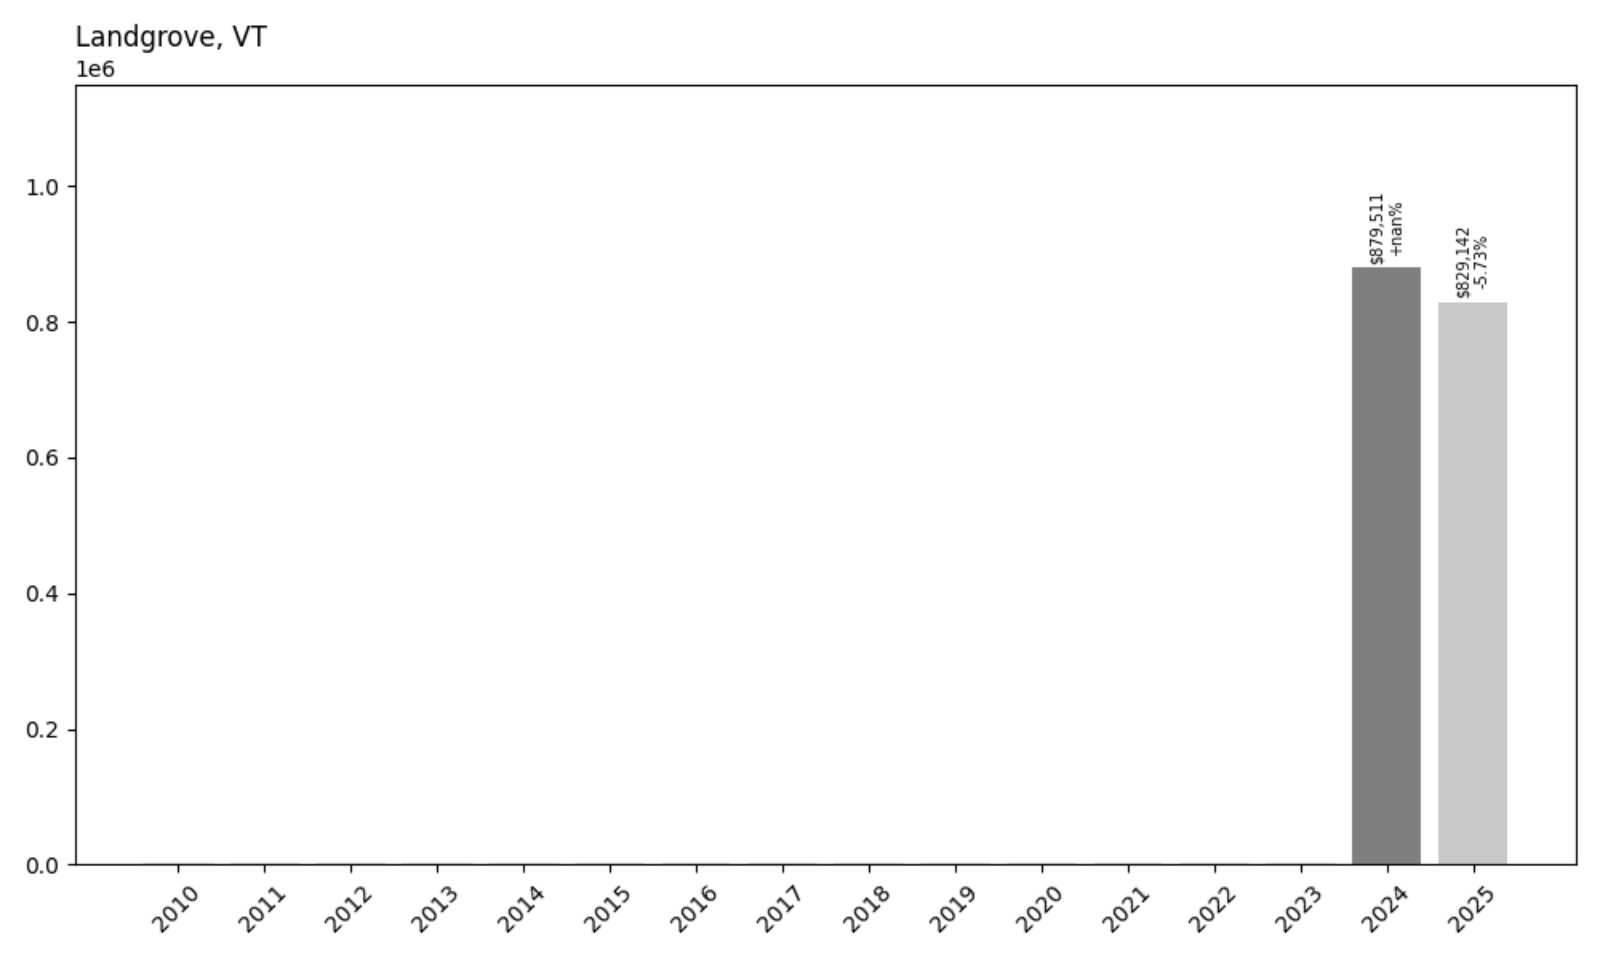
- 2024: $879,511
- 2025: $829,142 (−$50,369, −5.73%)
Landgrove’s full historical price growth is unclear due to missing early-year data. However, recent years place it firmly among Vermont’s top three most expensive towns by mid-2025.
Landgrove – Tiny Town, Towering Prices
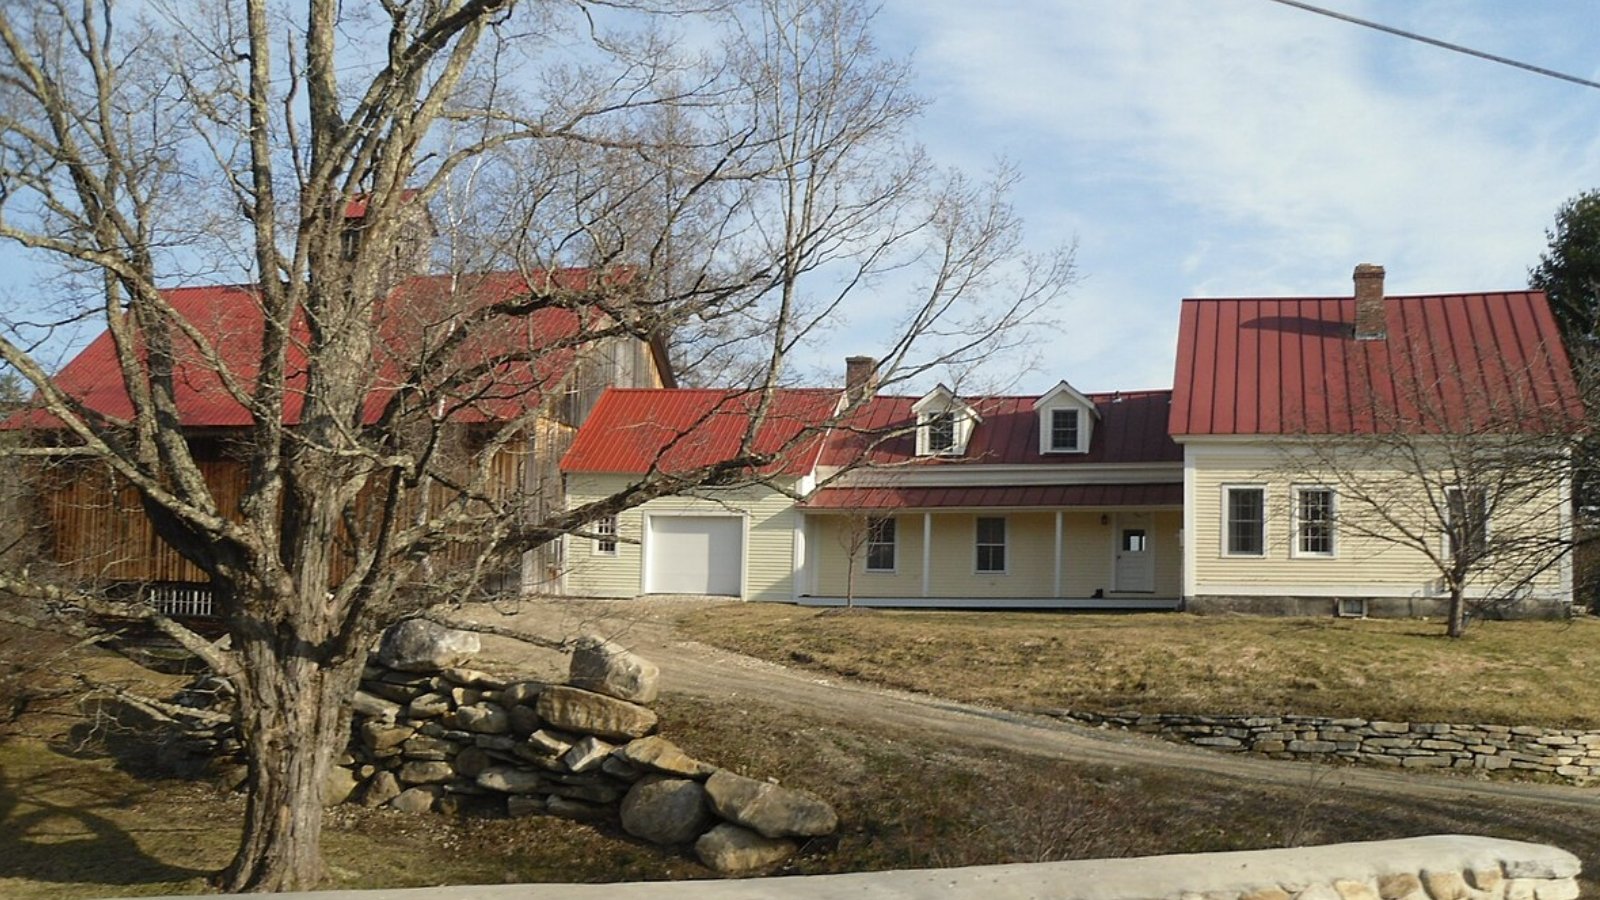
With a population of under 200, Landgrove is one of Vermont’s smallest and most exclusive towns. Located near Bromley Mountain in Bennington County, it offers pristine views, privacy, and luxury homes tucked into forested hills.
Its secluded appeal drives high home values, particularly among second-home buyers seeking refuge from busier areas. The recent 2025 price dip may reflect market correction, but Landgrove’s unique charm and limited inventory help keep values sky-high.
2. Charlotte – 103% Home Price Increase Since 2010
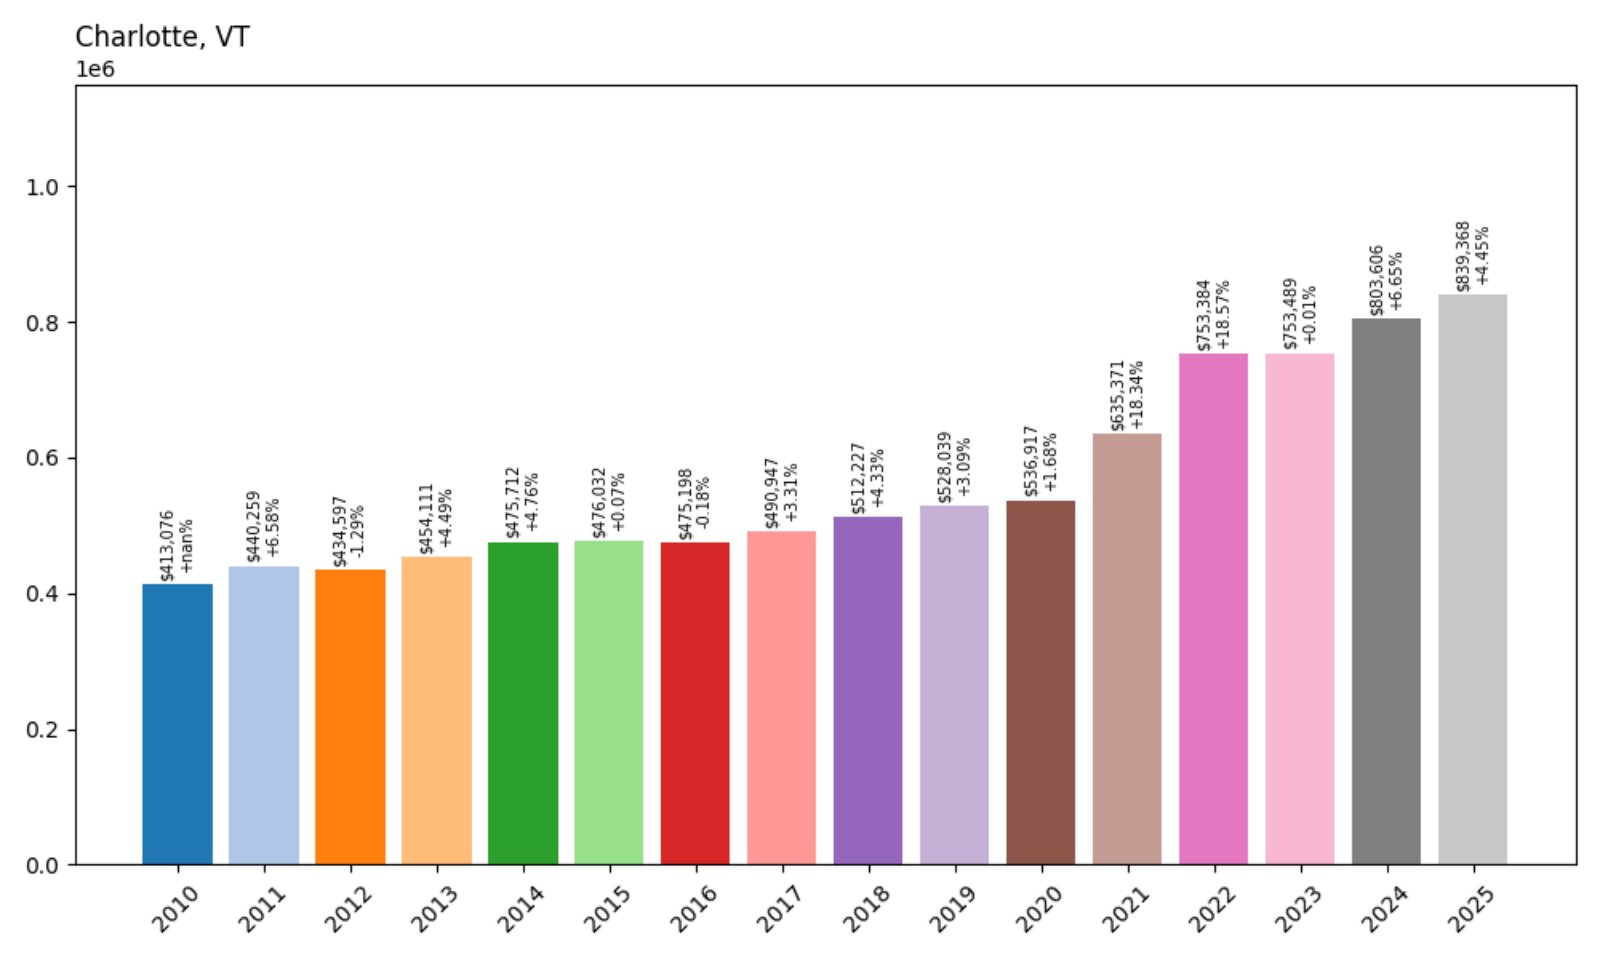
- 2010: $413,076
- 2011: $440,259 (+$27,183, +6.58%)
- 2012: $434,597 (−$5,662, −1.29%)
- 2013: $454,111 (+$19,514, +4.49%)
- 2014: $475,712 (+$21,601, +4.76%)
- 2015: $476,032 (+$320, +0.07%)
- 2016: $475,198 (−$834, −0.18%)
- 2017: $490,947 (+$15,749, +3.31%)
- 2018: $512,227 (+$21,280, +4.33%)
- 2019: $528,039 (+$15,812, +3.09%)
- 2020: $536,917 (+$8,878, +1.68%)
- 2021: $635,371 (+$98,454, +18.34%)
- 2022: $753,384 (+$118,013, +18.58%)
- 2023: $753,489 (+$105, +0.01%)
- 2024: $803,606 (+$50,117, +6.65%)
- 2025: $839,368 (+$35,762, +4.45%)
Charlotte’s home values have more than doubled since 2010, led by explosive growth during the early 2020s. The steady climb into 2025 keeps it at the top of Vermont’s housing market.
Charlotte – Waterfront Living Near Burlington
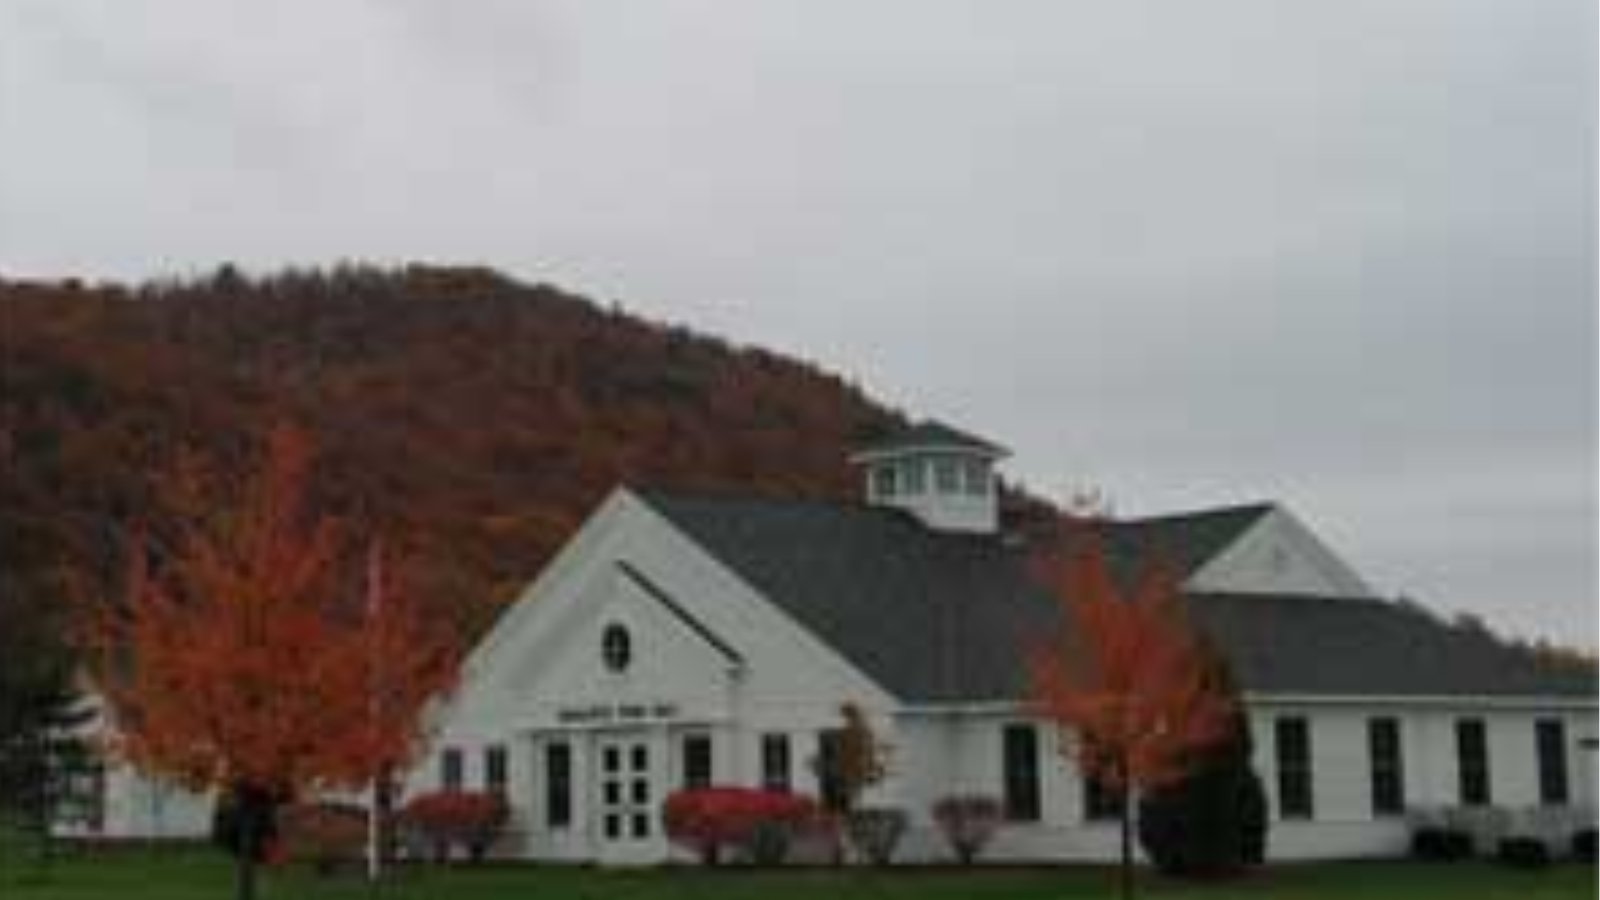
Perched on Lake Champlain, Charlotte offers scenic lake views, farmland, and upscale homes. Its location just south of Burlington makes it a top choice for professionals and families seeking space without sacrificing convenience.
Charlotte’s premium real estate benefited from pandemic-fueled demand and remains attractive due to its school quality, lake access, and proximity to Vermont’s largest metro area. Prices continued to rise in 2025, solidifying its #2 rank statewide.
1. Stowe – 121% Home Price Increase Since 2010
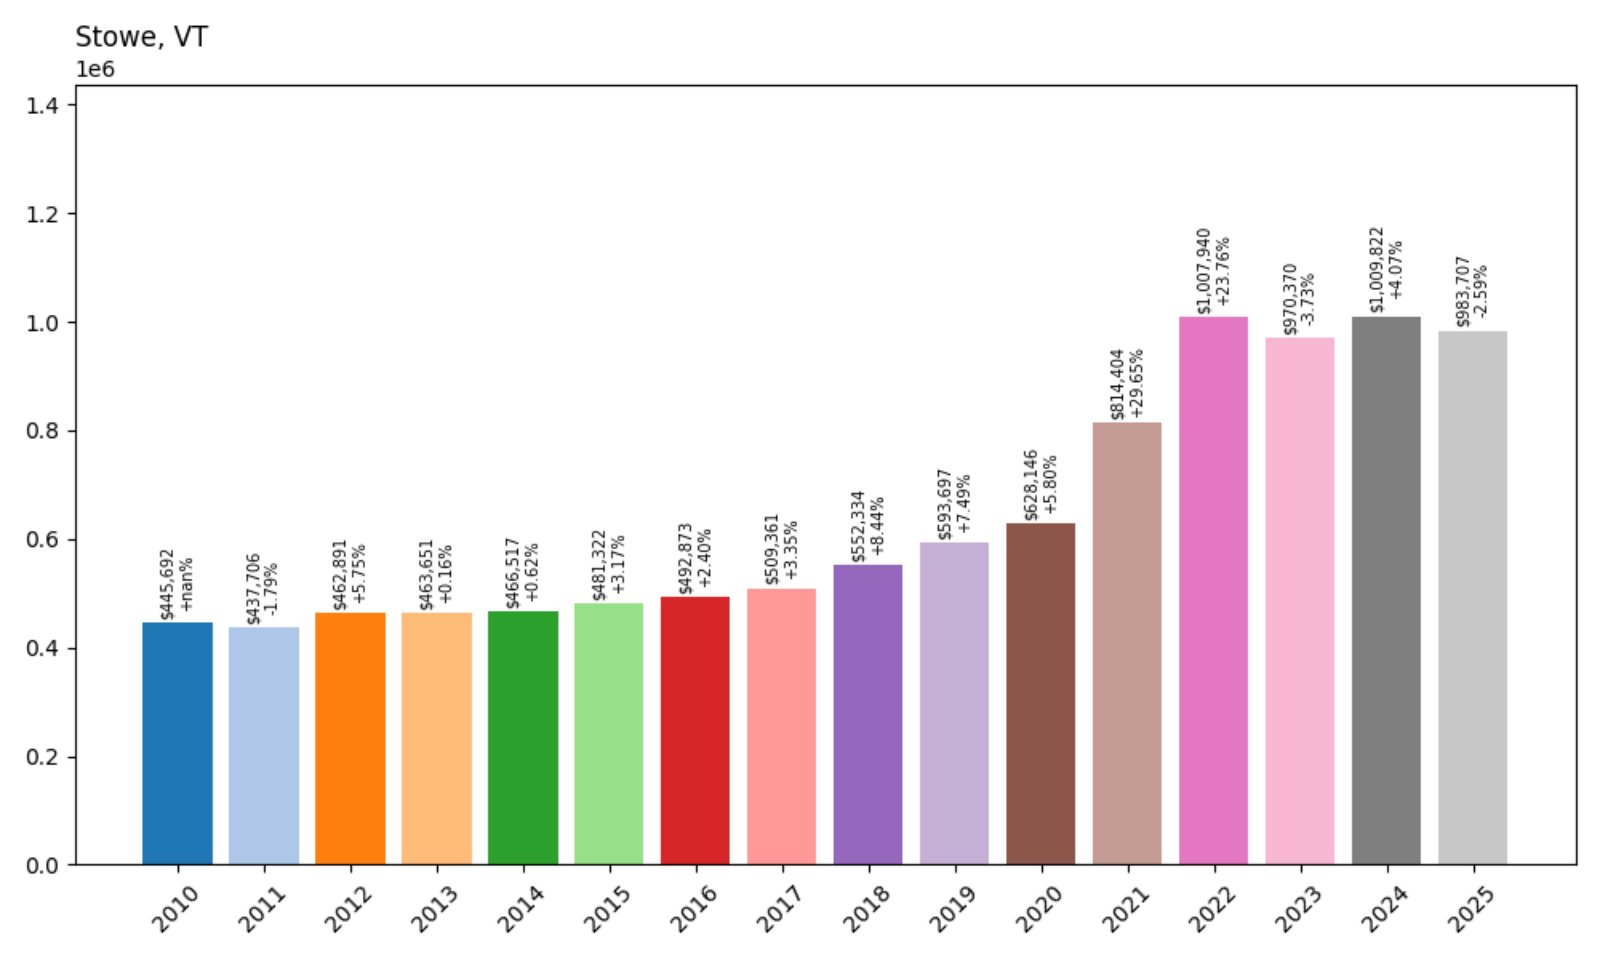
- 2010: $445,692
- 2011: $437,706 (−$7,986, −1.79%)
- 2012: $462,891 (+$25,185, +5.75%)
- 2013: $463,651 (+$760, +0.16%)
- 2014: $466,517 (+$2,866, +0.62%)
- 2015: $481,322 (+$14,805, +3.17%)
- 2016: $492,873 (+$11,551, +2.40%)
- 2017: $509,361 (+$16,488, +3.34%)
- 2018: $552,334 (+$42,973, +8.43%)
- 2019: $593,697 (+$41,363, +7.49%)
- 2020: $628,146 (+$34,449, +5.80%)
- 2021: $814,404 (+$186,258, +29.64%)
- 2022: $1,007,940 (+$193,536, +23.77%)
- 2023: $970,370 (−$37,570, −3.73%)
- 2024: $1,009,822 (+$39,452, +4.07%)
- 2025: $983,707 (−$26,115, −2.59%)
Stowe’s home values have skyrocketed 121% since 2010, the highest growth on this list. Even with minor declines, the town leads Vermont in overall price and prestige.
Stowe – Vermont’s Luxury Destination
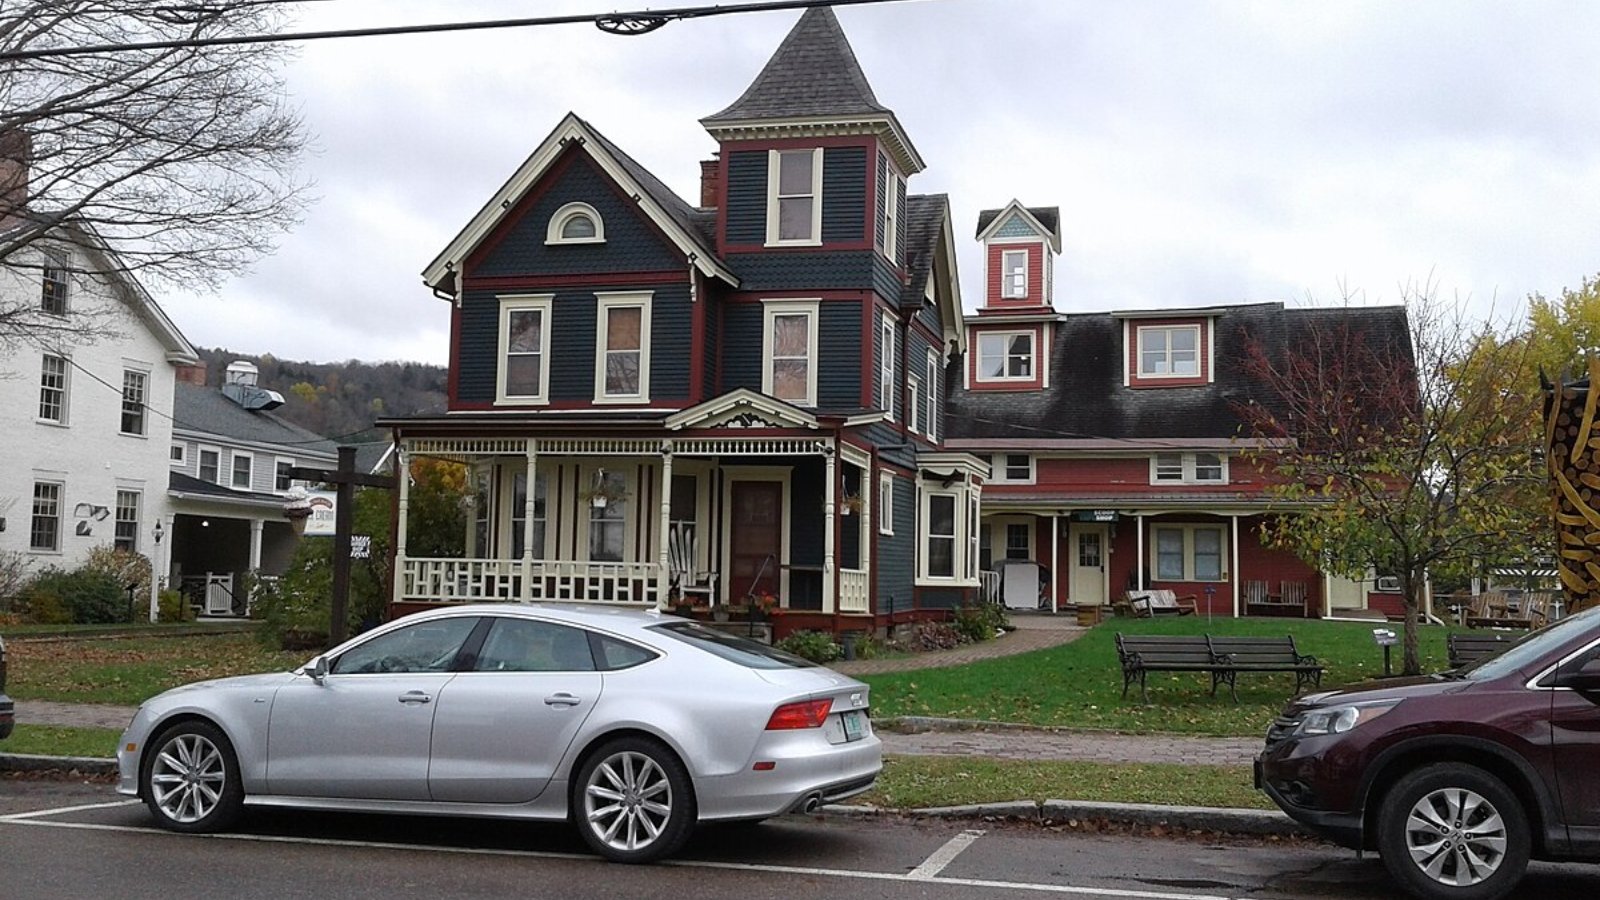
As home to the state’s premier ski resort, Stowe has long been a magnet for tourists, investors, and affluent second-homeowners. Its charming village, top-tier restaurants, and outdoor offerings make it a year-round hotspot.
The pandemic boosted interest in luxury mountain homes, and Stowe was a clear winner. Even after market recalibration in 2023 and 2025, home values remain sky-high — securing its spot as Vermont’s most expensive town in 2025.