Would you like to save this?
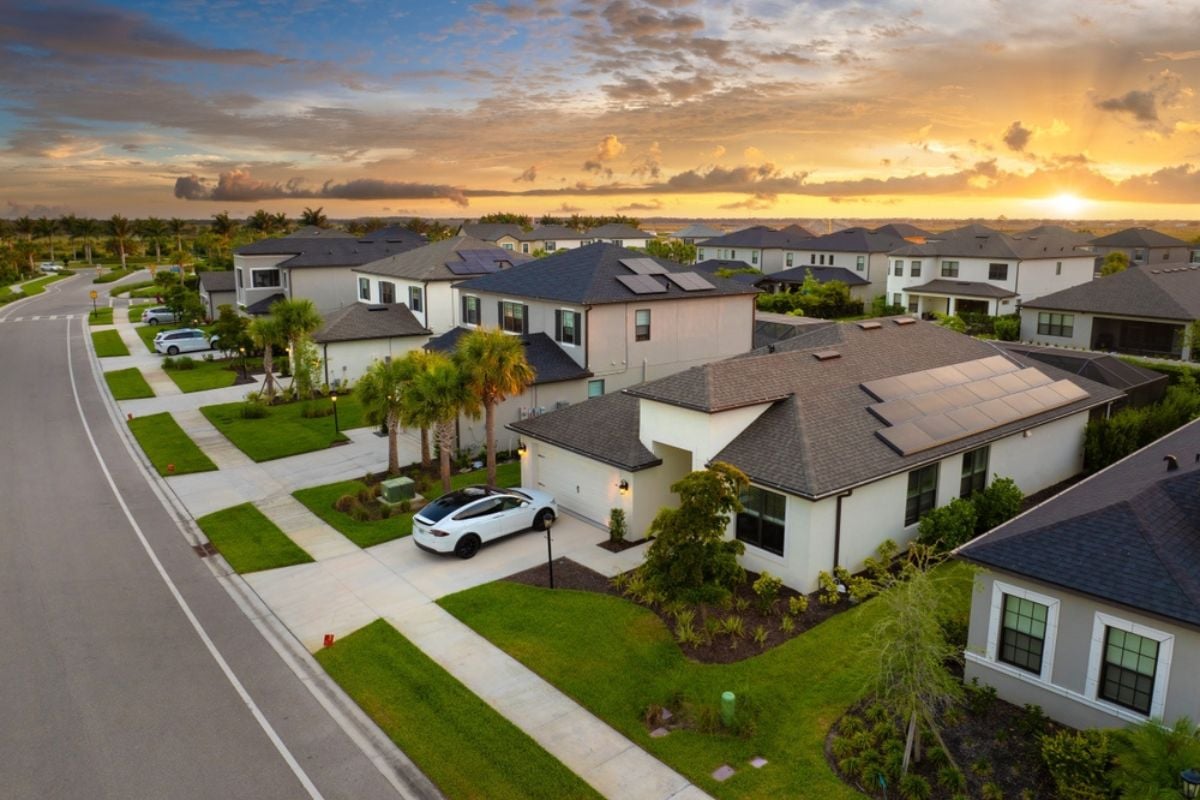
South Dakota’s real estate market has experienced remarkable transformation over the past decade, with home values in select communities reaching unprecedented heights. According to data from the Zillow Home Value Index, certain towns across the Mount Rushmore State have seen extraordinary price appreciation, creating distinct pockets of luxury real estate that stand apart from the state’s traditionally affordable housing landscape.
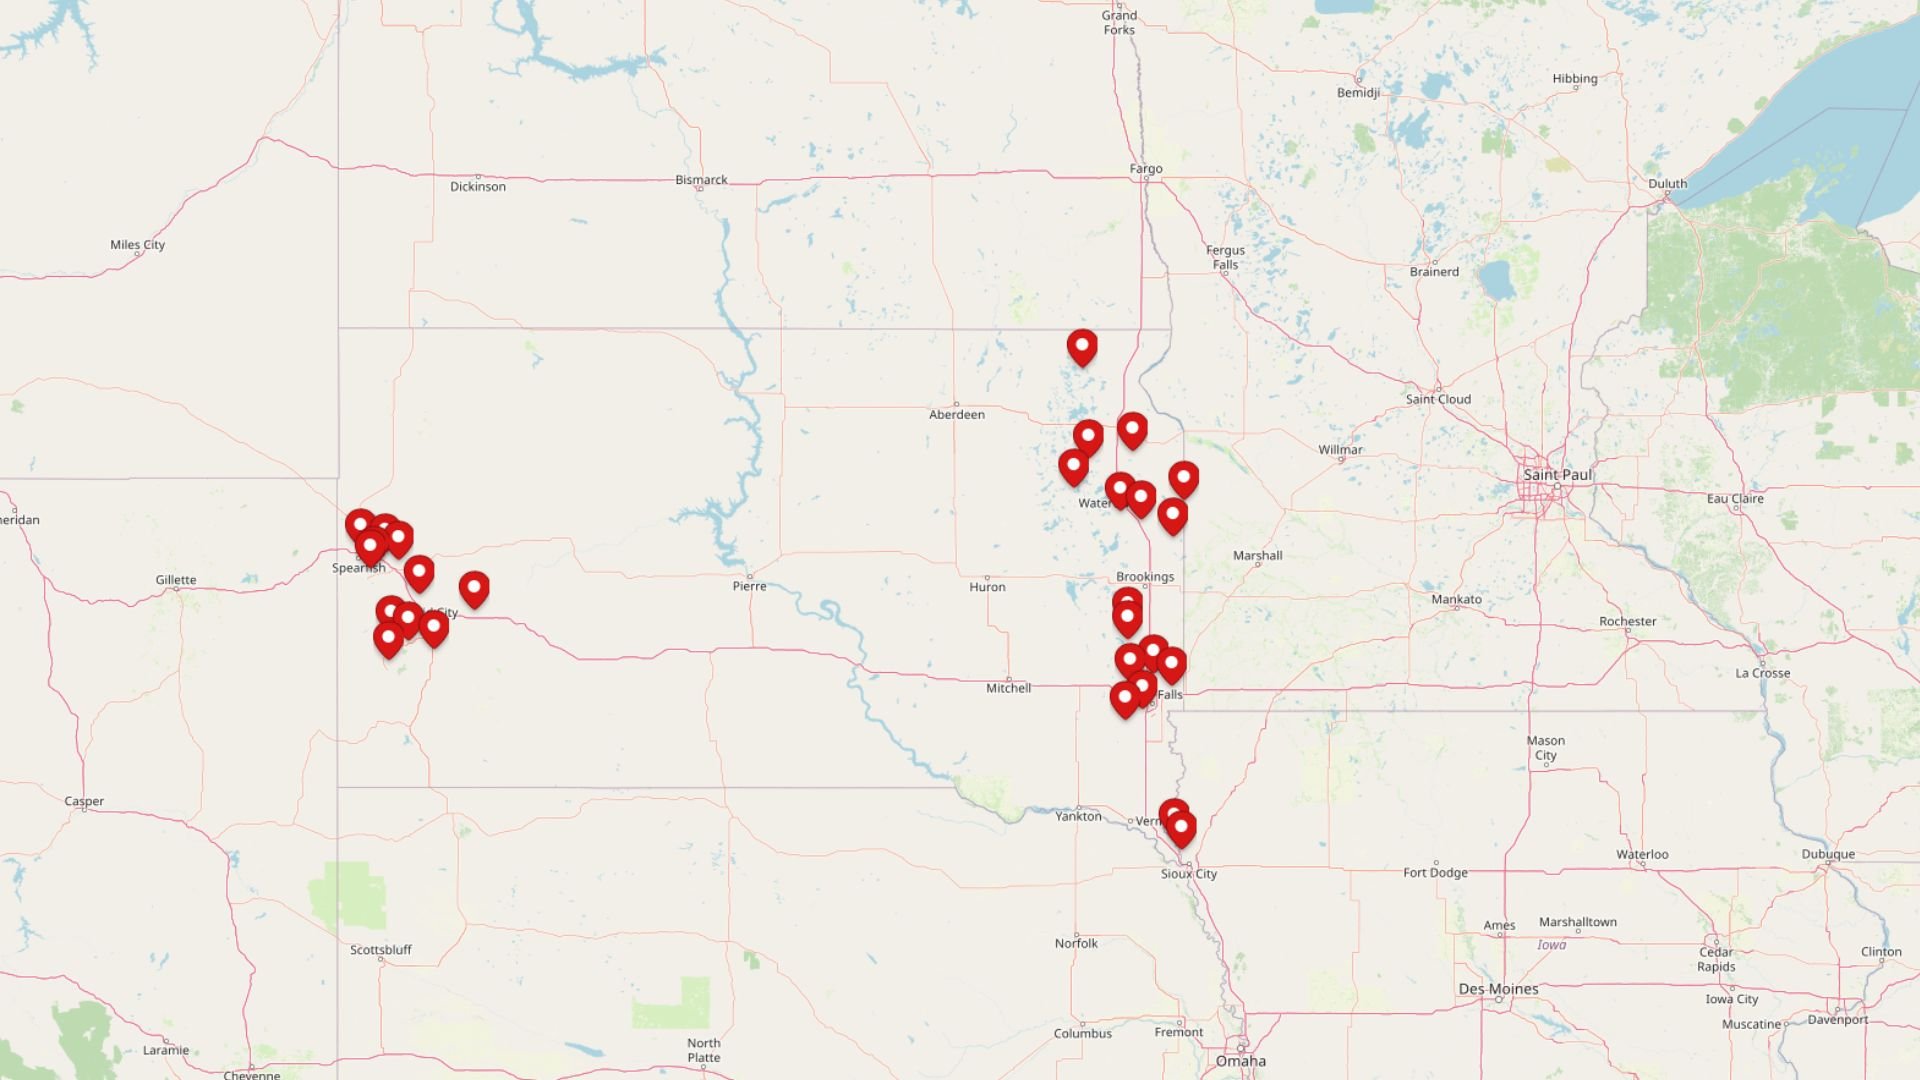
From Black Hills resort communities to growing suburban enclaves, this comprehensive analysis examines the 28 most expensive towns in South Dakota, revealing not just current home values but the remarkable price trajectories that have shaped these markets. Whether you’re a potential buyer, seller, or simply curious about real estate trends, these communities represent the premium tier of South Dakota’s housing market.
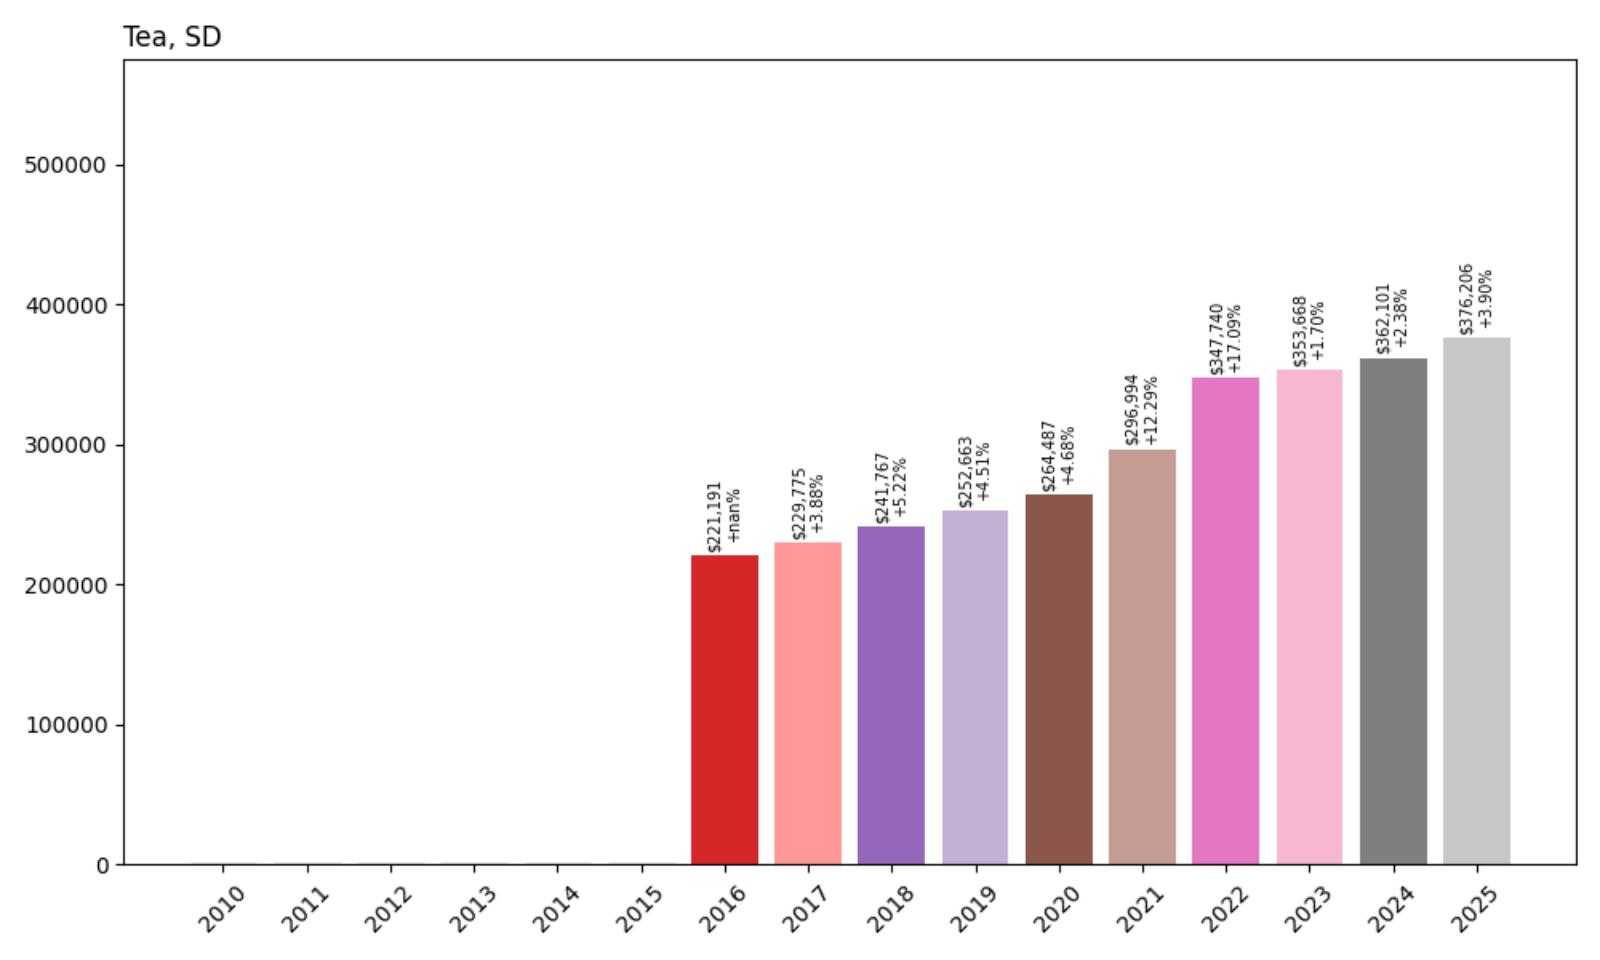
28. Tea – 70.1% Home Price Increase Since 2016
- 2010: N/A
- 2011: N/A
- 2012: N/A
- 2013: N/A
- 2014: N/A
- 2015: N/A
- 2016: $221,191
- 2017: $229,775 (+$8,585, +3.88% from previous year)
- 2018: $241,767 (+$11,991, +5.22% from previous year)
- 2019: $252,663 (+$10,896, +4.51% from previous year)
- 2020: $264,487 (+$11,824, +4.68% from previous year)
- 2021: $296,994 (+$32,507, +12.29% from previous year)
- 2022: $347,740 (+$50,747, +17.09% from previous year)
- 2023: $353,668 (+$5,927, +1.70% from previous year)
- 2024: $362,101 (+$8,434, +2.38% from previous year)
- 2025: $376,206 (+$14,105, +3.90% from previous year)
Tea has experienced steady appreciation since tracking began in 2016, with particularly strong growth during the pandemic years of 2021-2022 when prices jumped over 30% in just two years. The community’s current median home price of $376,206 represents solid value compared to higher-tier markets while maintaining consistent upward momentum. The town’s growth trajectory mirrors many suburban communities that benefited from increased demand for family-friendly locations during recent market shifts.
Tea – Growing Suburban Appeal
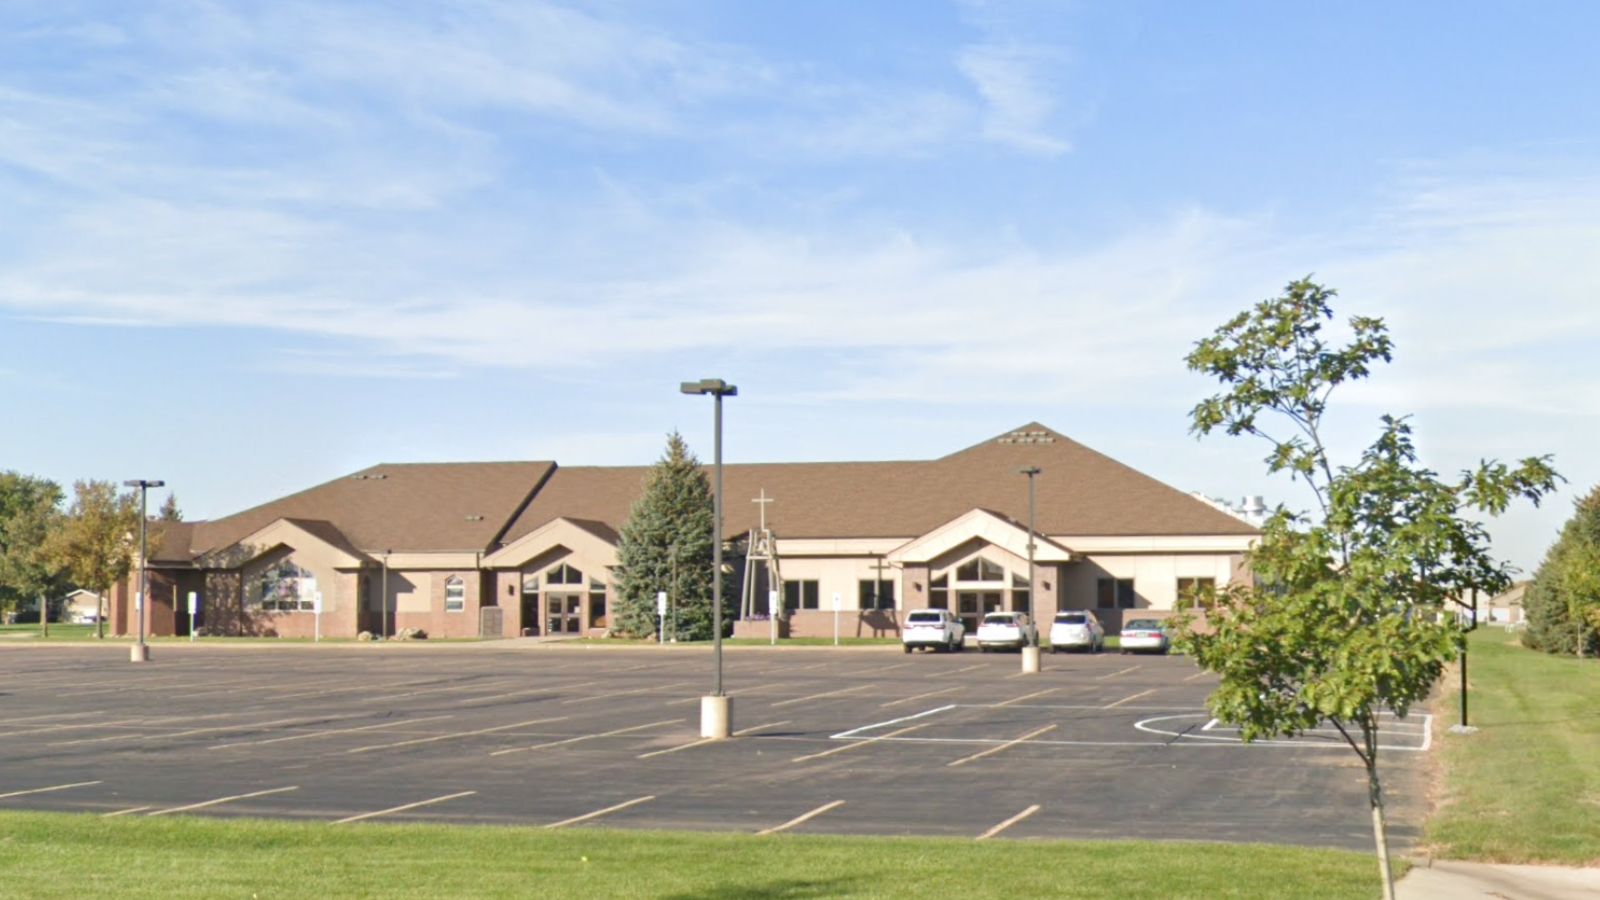
Located just 15 minutes south of Sioux Falls in Lincoln County, Tea has emerged as one of the region’s most desirable suburban communities. The town’s strategic position provides easy access to Sioux Falls employment centers while offering a small-town atmosphere that appeals to growing families. Tea’s excellent school district and well-maintained infrastructure have contributed significantly to its real estate appreciation over the past decade.
The community’s housing market reflects broader trends in suburban development around major South Dakota cities. Tea’s residential developments feature a mix of starter homes and move-up properties, with new construction helping to meet demand from buyers seeking alternatives to urban living. The town’s parks, recreational facilities, and community events create a strong sense of place that supports property values.
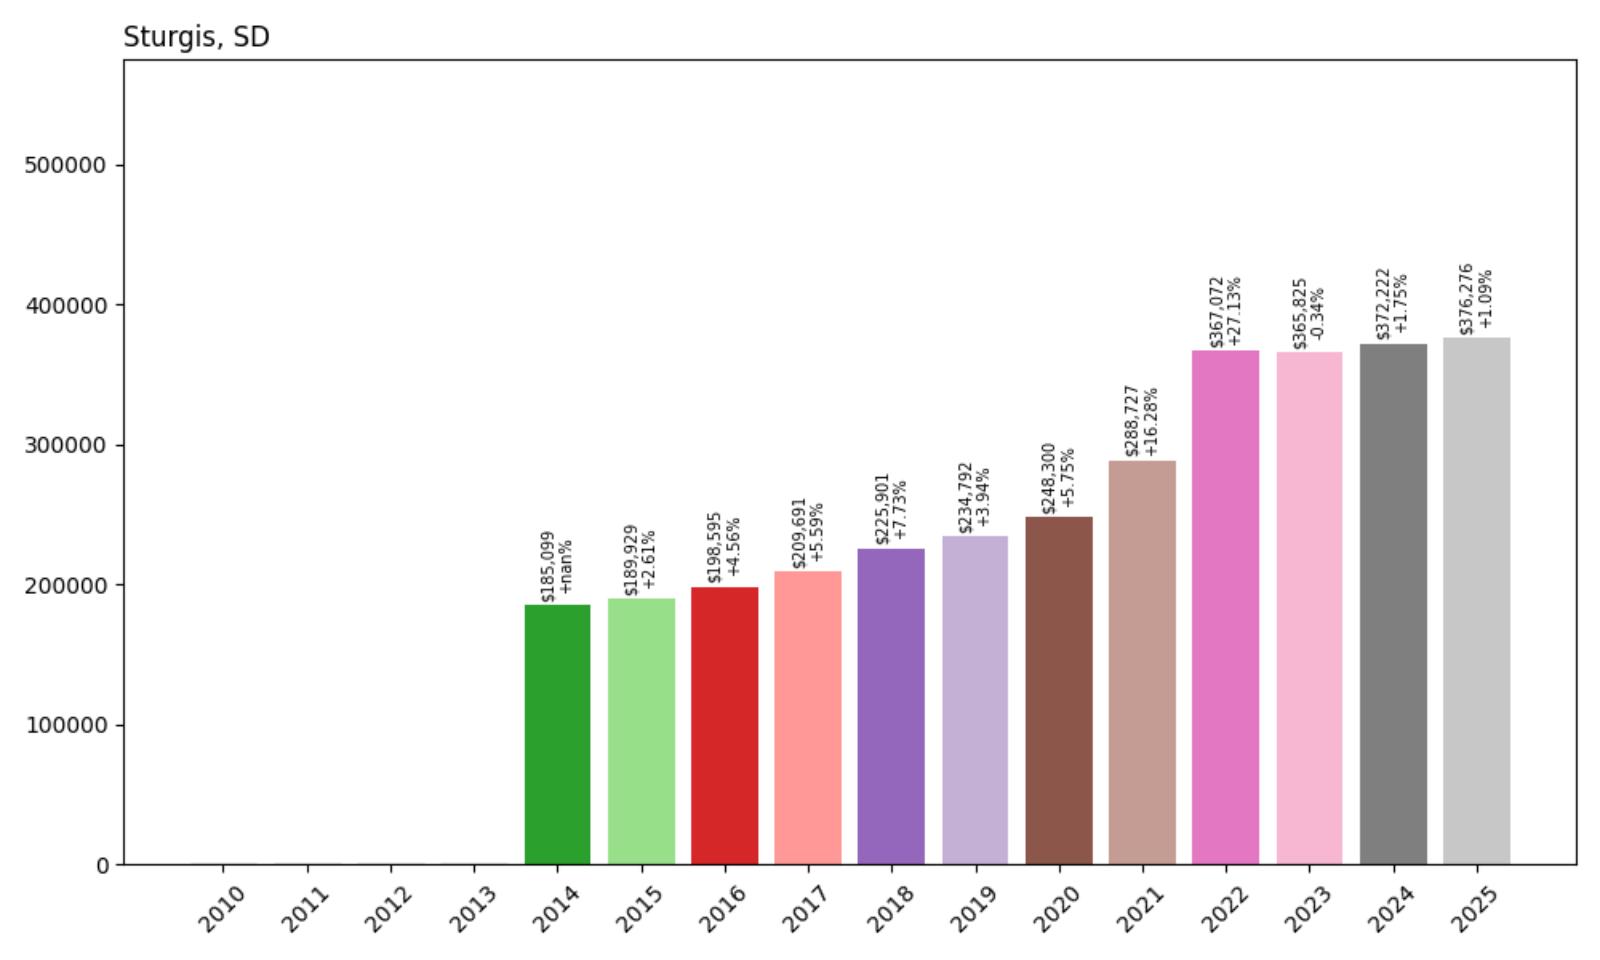
27. Sturgis – 103.2% Home Price Increase Since 2014
- 2010: N/A
- 2011: N/A
- 2012: N/A
- 2013: N/A
- 2014: $185,099
- 2015: $189,929 (+$4,830, +2.61% from previous year)
- 2016: $198,595 (+$8,666, +4.56% from previous year)
- 2017: $209,691 (+$11,096, +5.59% from previous year)
- 2018: $225,901 (+$16,210, +7.73% from previous year)
- 2019: $234,792 (+$8,891, +3.94% from previous year)
- 2020: $248,300 (+$13,507, +5.75% from previous year)
- 2021: $288,727 (+$40,427, +16.28% from previous year)
- 2022: $367,072 (+$78,345, +27.13% from previous year)
- 2023: $365,825 (−$1,247, −0.34% from previous year)
- 2024: $372,222 (+$6,397, +1.75% from previous year)
- 2025: $376,276 (+$4,053, +1.09% from previous year)
Sturgis has achieved remarkable appreciation since 2014, more than doubling in value over just eleven years. The town experienced explosive growth during 2021-2022, when prices jumped 44% in two years, though the market has since stabilized with modest gains. The massive 2022 increase of 27.13% represents one of the most dramatic single-year appreciations in the dataset, highlighting the community’s strong market dynamics during peak demand periods.
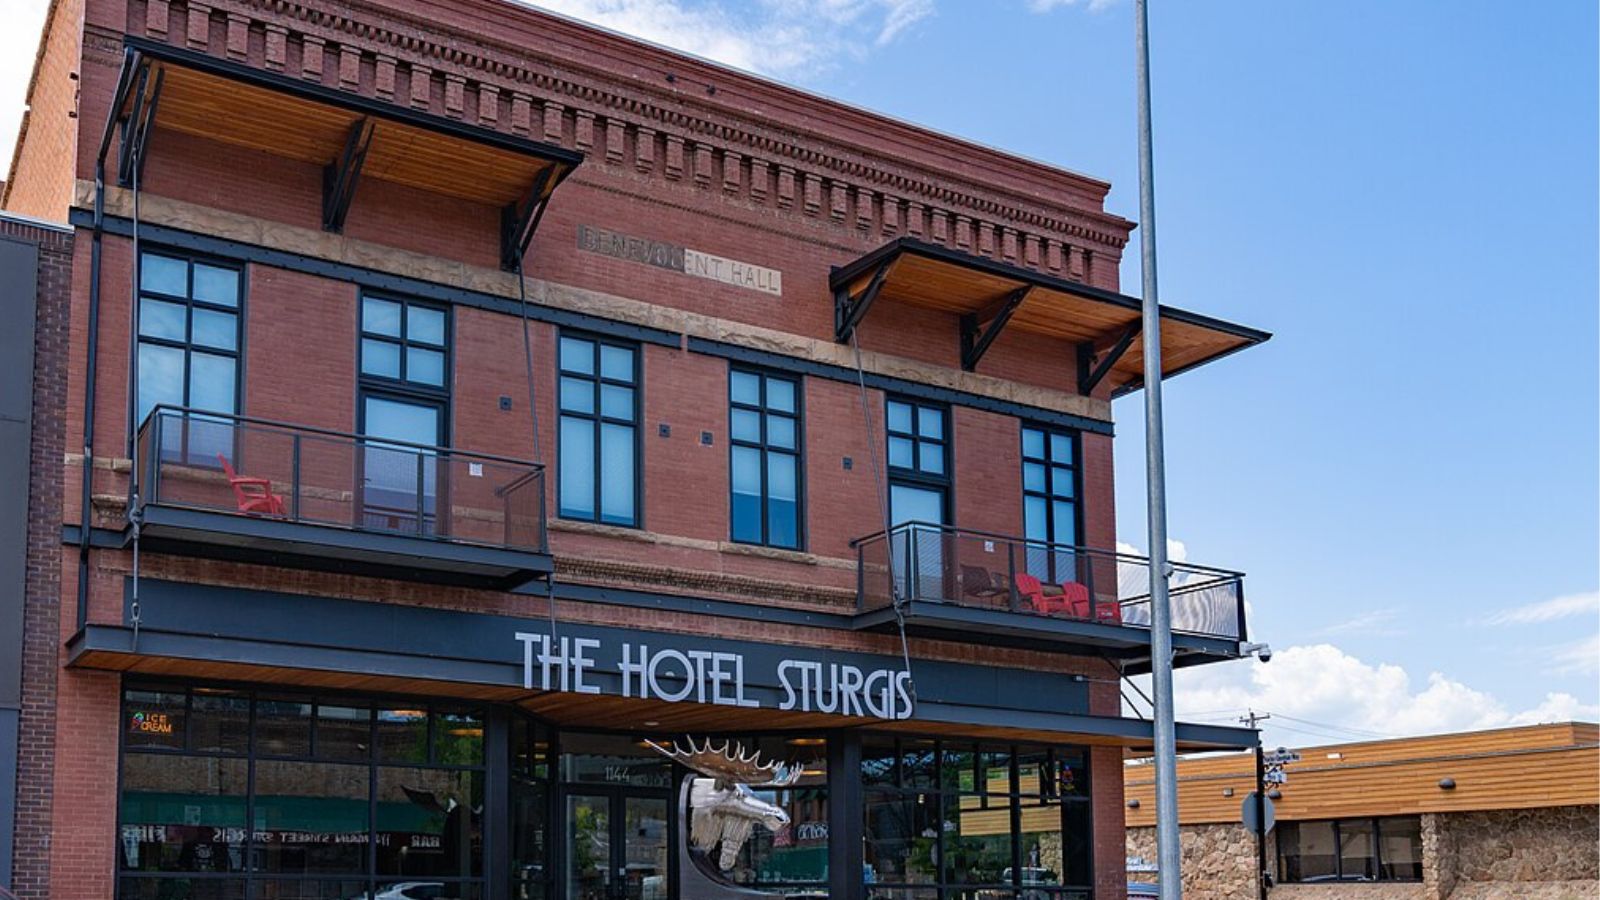
Sturgis – Motorcycle Capital’s Real Estate Boom
Were You Meant
to Live In?
Sturgis holds a unique position in American culture as the host of the world’s largest motorcycle rally, drawing over 500,000 visitors annually to this Black Hills community of just 7,000 residents. This international recognition has created a distinctive real estate market where tourism, recreation, and year-round living converge. The famous Sturgis Motorcycle Rally generates significant economic impact that supports property values throughout the year.
The dramatic price appreciation seen in recent years reflects both the town’s unique tourism economy and growing recognition as a desirable place to live in the Black Hills region. Property buyers are drawn to Sturgis for its combination of recreational opportunities, community character, and investment potential tied to its internationally known brand.
26. Jefferson – 105.8% Home Price Increase Since 2010
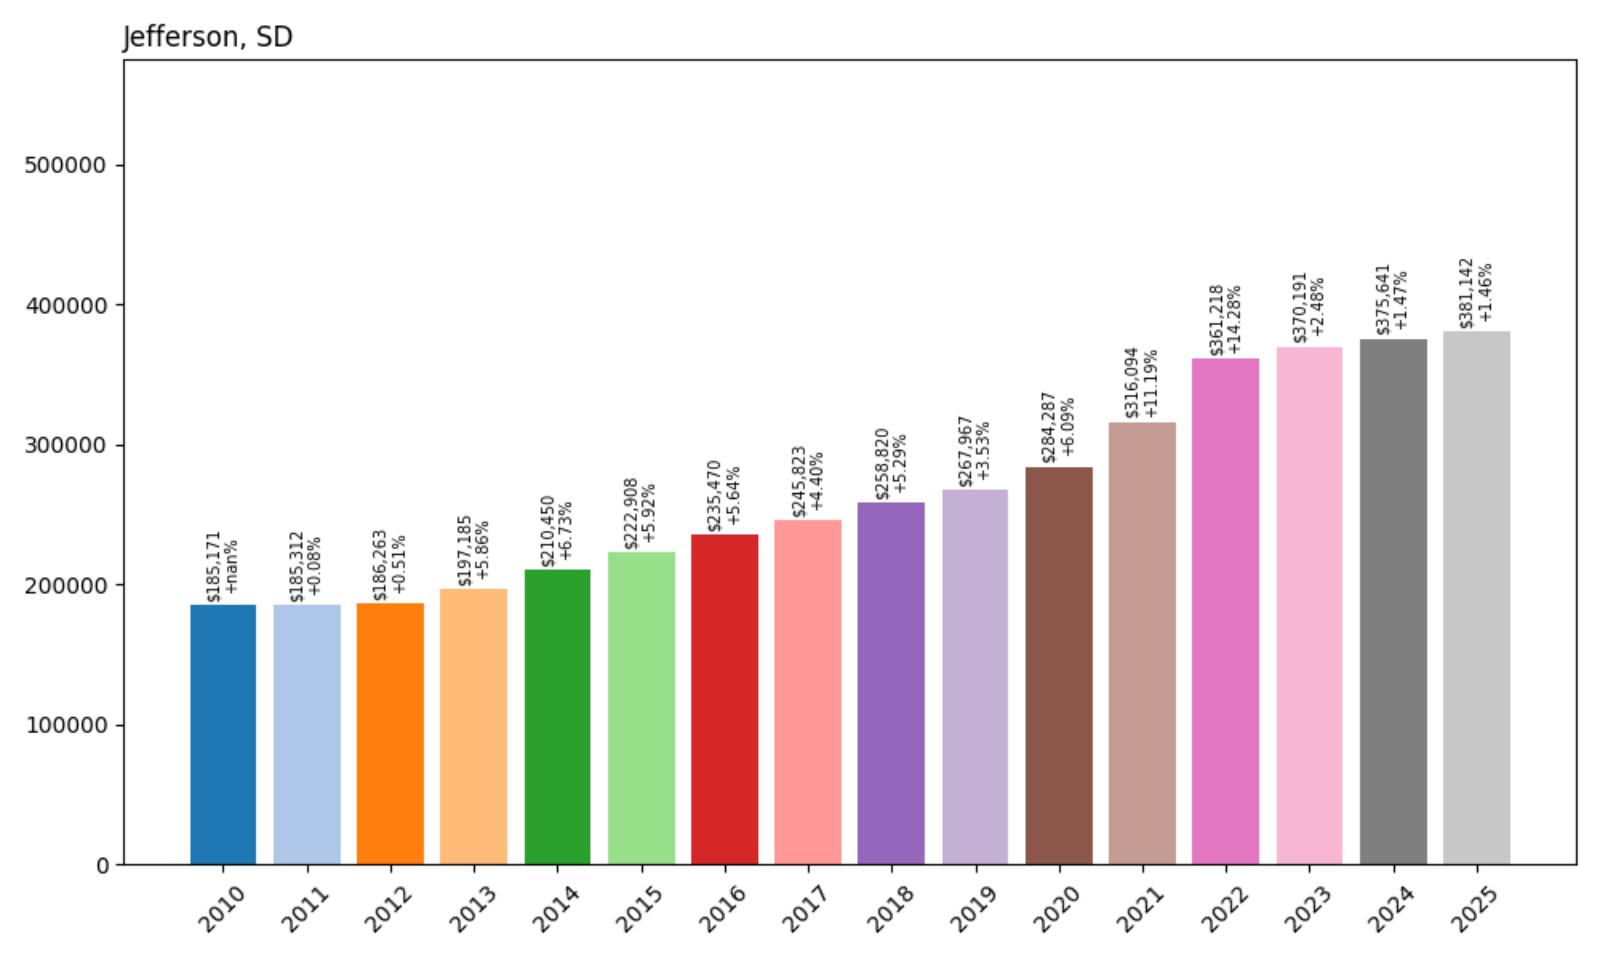
- 2010: $185,171
- 2011: $185,312 (+$141, +0.08% from previous year)
- 2012: $186,263 (+$951, +0.51% from previous year)
- 2013: $197,185 (+$10,922, +5.86% from previous year)
- 2014: $210,450 (+$13,265, +6.73% from previous year)
- 2015: $222,908 (+$12,458, +5.92% from previous year)
- 2016: $235,470 (+$12,563, +5.64% from previous year)
- 2017: $245,823 (+$10,352, +4.40% from previous year)
- 2018: $258,820 (+$12,997, +5.29% from previous year)
- 2019: $267,967 (+$9,147, +3.53% from previous year)
- 2020: $284,287 (+$16,321, +6.09% from previous year)
- 2021: $316,094 (+$31,807, +11.19% from previous year)
- 2022: $361,218 (+$45,125, +14.28% from previous year)
- 2023: $370,191 (+$8,973, +2.48% from previous year)
- 2024: $375,641 (+$5,450, +1.47% from previous year)
- 2025: $381,142 (+$5,500, +1.46% from previous year)
Jefferson demonstrates remarkably consistent appreciation over 15 years, with only minimal fluctuation in the early 2010s before establishing steady growth. The community has maintained annual gains throughout the entire tracking period, with particularly strong performance during 2021-2022 when prices increased nearly 27% over two years. Current values at $381,142 represent solid growth that has more than doubled since 2010.
Jefferson – Steady Growth in Union County
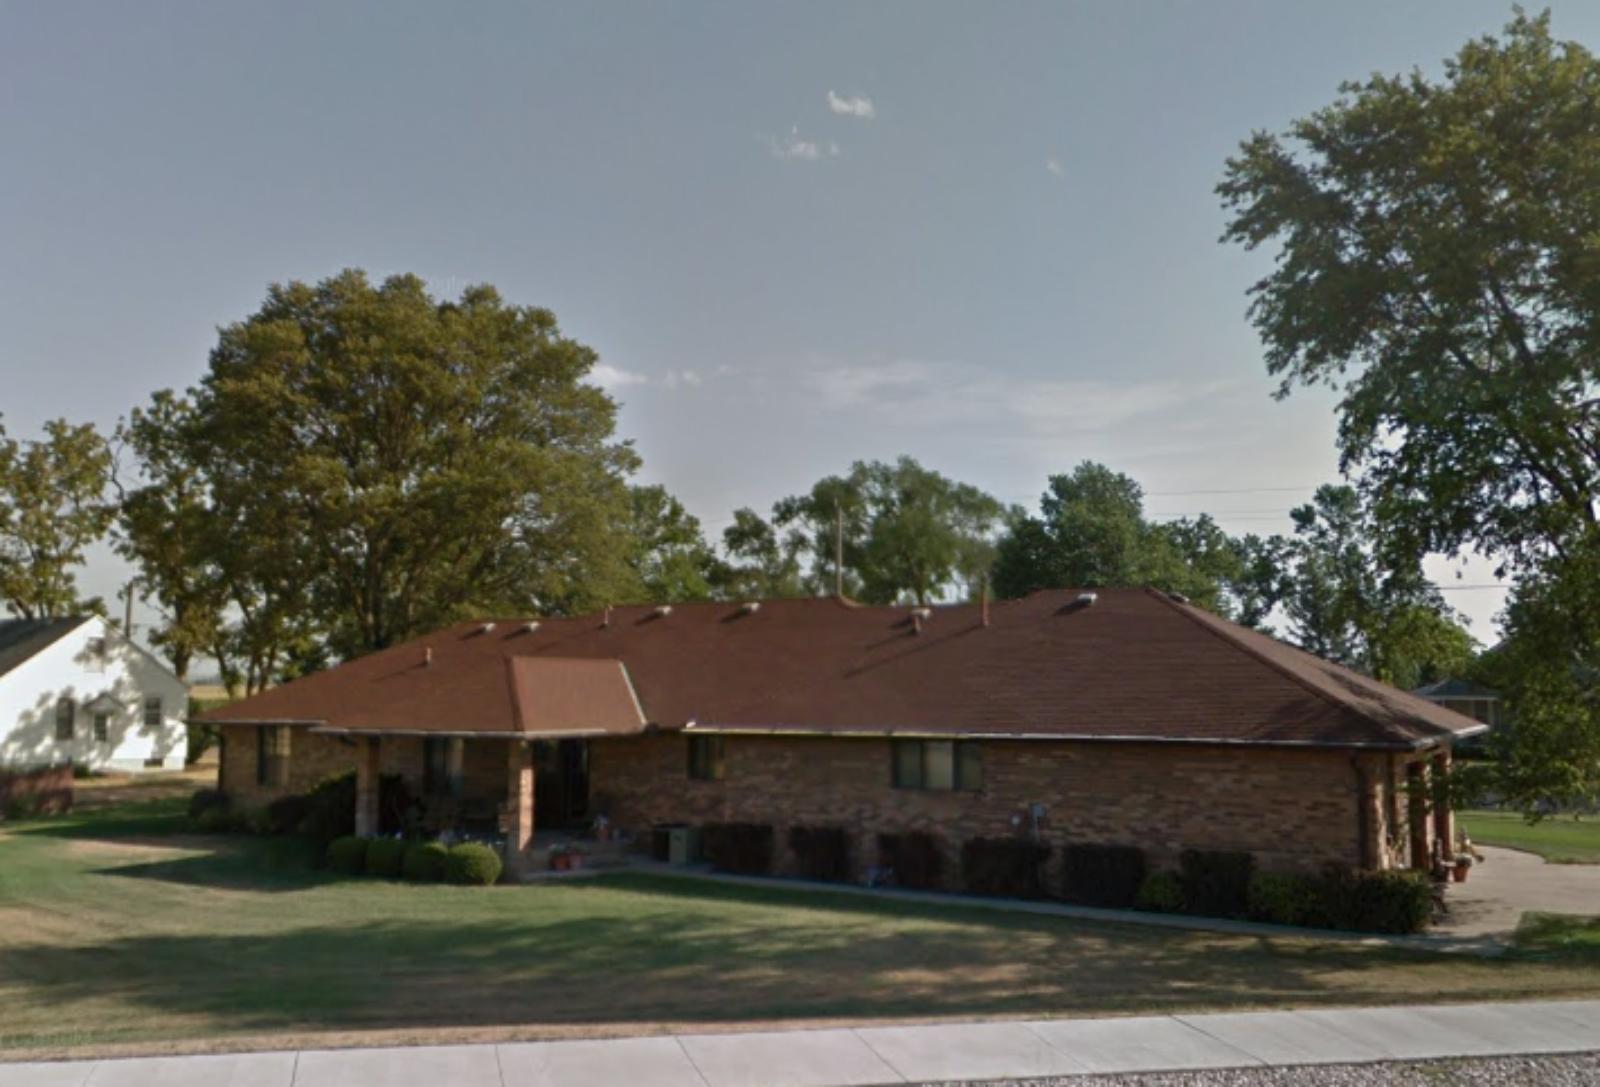
Located in Union County near the Nebraska border, Jefferson represents the appeal of small-town South Dakota living within commuting distance of the Sioux City metropolitan area. The community’s location along Highway 18 provides convenient access to regional employment centers while maintaining rural character that attracts families seeking space and affordability. Jefferson’s agricultural heritage blends with modern residential development to create a stable housing market.
Recent development in Jefferson has focused on maintaining community character while accommodating new residents drawn to the area’s quality of life. The town’s schools, community facilities, and recreational opportunities support family living, while its agricultural surroundings preserve the rural atmosphere that defines much of South Dakota’s appeal.
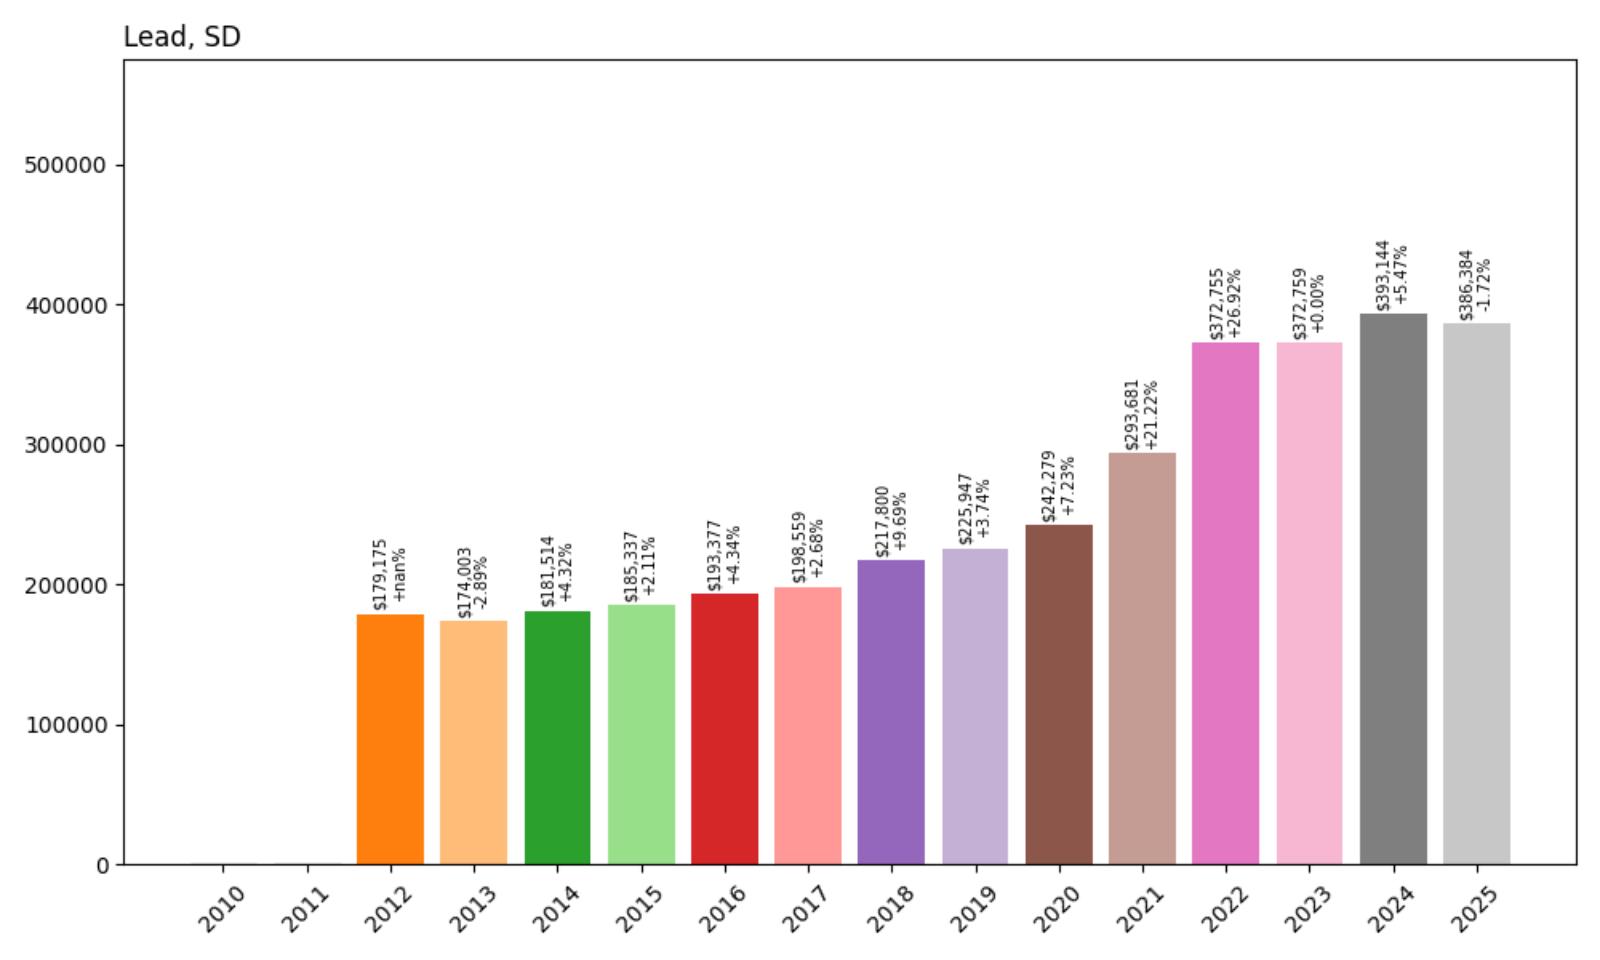
25. Lead – 115.7% Home Price Increase Since 2012
Home Stratosphere Guide
Your Personality Already Knows
How Your Home Should Feel
113 pages of room-by-room design guidance built around your actual brain, your actual habits, and the way you actually live.
You might be an ISFJ or INFP designer…
You design through feeling — your spaces are personal, comforting, and full of meaning. The guide covers your exact color palettes, room layouts, and the one mistake your type always makes.
The full guide maps all 16 types to specific rooms, palettes & furniture picks ↓
You might be an ISTJ or INTJ designer…
You crave order, function, and visual calm. The guide shows you how to create spaces that feel both serene and intentional — without ending up sterile.
The full guide maps all 16 types to specific rooms, palettes & furniture picks ↓
You might be an ENFP or ESTP designer…
You design by instinct and energy. Your home should feel alive. The guide shows you how to channel that into rooms that feel curated, not chaotic.
The full guide maps all 16 types to specific rooms, palettes & furniture picks ↓
You might be an ENTJ or ESTJ designer…
You value quality, structure, and things done right. The guide gives you the framework to build rooms that feel polished without overthinking every detail.
The full guide maps all 16 types to specific rooms, palettes & furniture picks ↓
- 2010: N/A
- 2011: N/A
- 2012: $179,175
- 2013: $174,003 (−$5,171, −2.89% from previous year)
- 2014: $181,514 (+$7,510, +4.32% from previous year)
- 2015: $185,337 (+$3,824, +2.11% from previous year)
- 2016: $193,377 (+$8,039, +4.34% from previous year)
- 2017: $198,559 (+$5,182, +2.68% from previous year)
- 2018: $217,800 (+$19,241, +9.69% from previous year)
- 2019: $225,947 (+$8,146, +3.74% from previous year)
- 2020: $242,279 (+$16,332, +7.23% from previous year)
- 2021: $293,681 (+$51,402, +21.22% from previous year)
- 2022: $372,755 (+$79,073, +26.92% from previous year)
- 2023: $372,759 (+$4, +0.00% from previous year)
- 2024: $393,144 (+$20,385, +5.47% from previous year)
- 2025: $386,384 (−$6,760, −1.72% from previous year)
Lead experienced explosive growth during the pandemic years, with prices nearly doubling between 2020 and 2022. The remarkable 26.92% increase in 2022 pushed values to over $372,000 before stabilizing around current levels near $386,000. After a brief decline in 2013, the community has shown strong appreciation, particularly accelerating after 2018 when annual gains consistently exceeded broader market trends.
Lead – Historic Mining Town Transformation
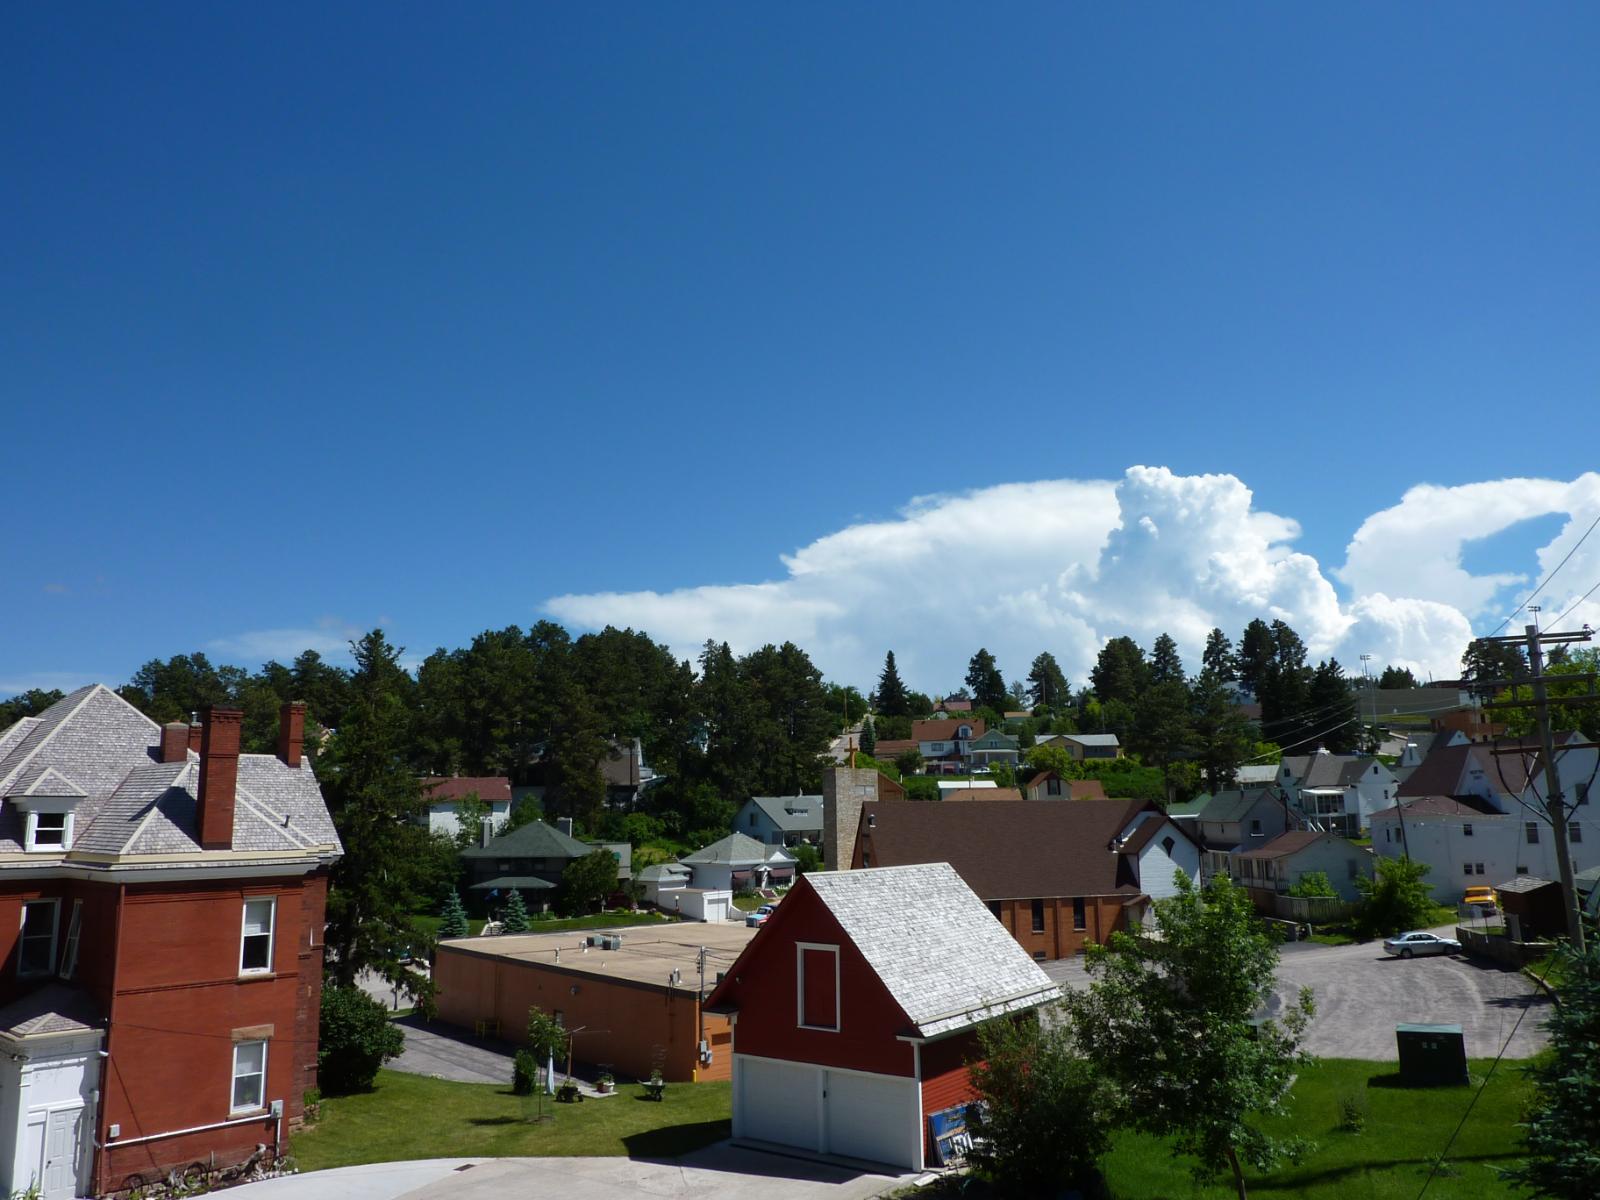
Lead occupies a special place in American mining history as the site of the Homestake Mine, once the largest and deepest gold mine in North America. This historic Black Hills community has successfully transitioned from its mining heritage to become a destination for outdoor recreation and scientific research. The former Homestake Mine now houses the Sanford Underground Research Facility, bringing new economic activity and residents to the area.
The town’s dramatic elevation changes and mountainous setting create unique real estate opportunities not found elsewhere in South Dakota. Properties often feature spectacular views of the Black Hills, while the community’s elevation provides a cooler climate that appeals to buyers seeking mountain living. Lead’s transformation from mining town to recreation destination has attracted new residents and investment.
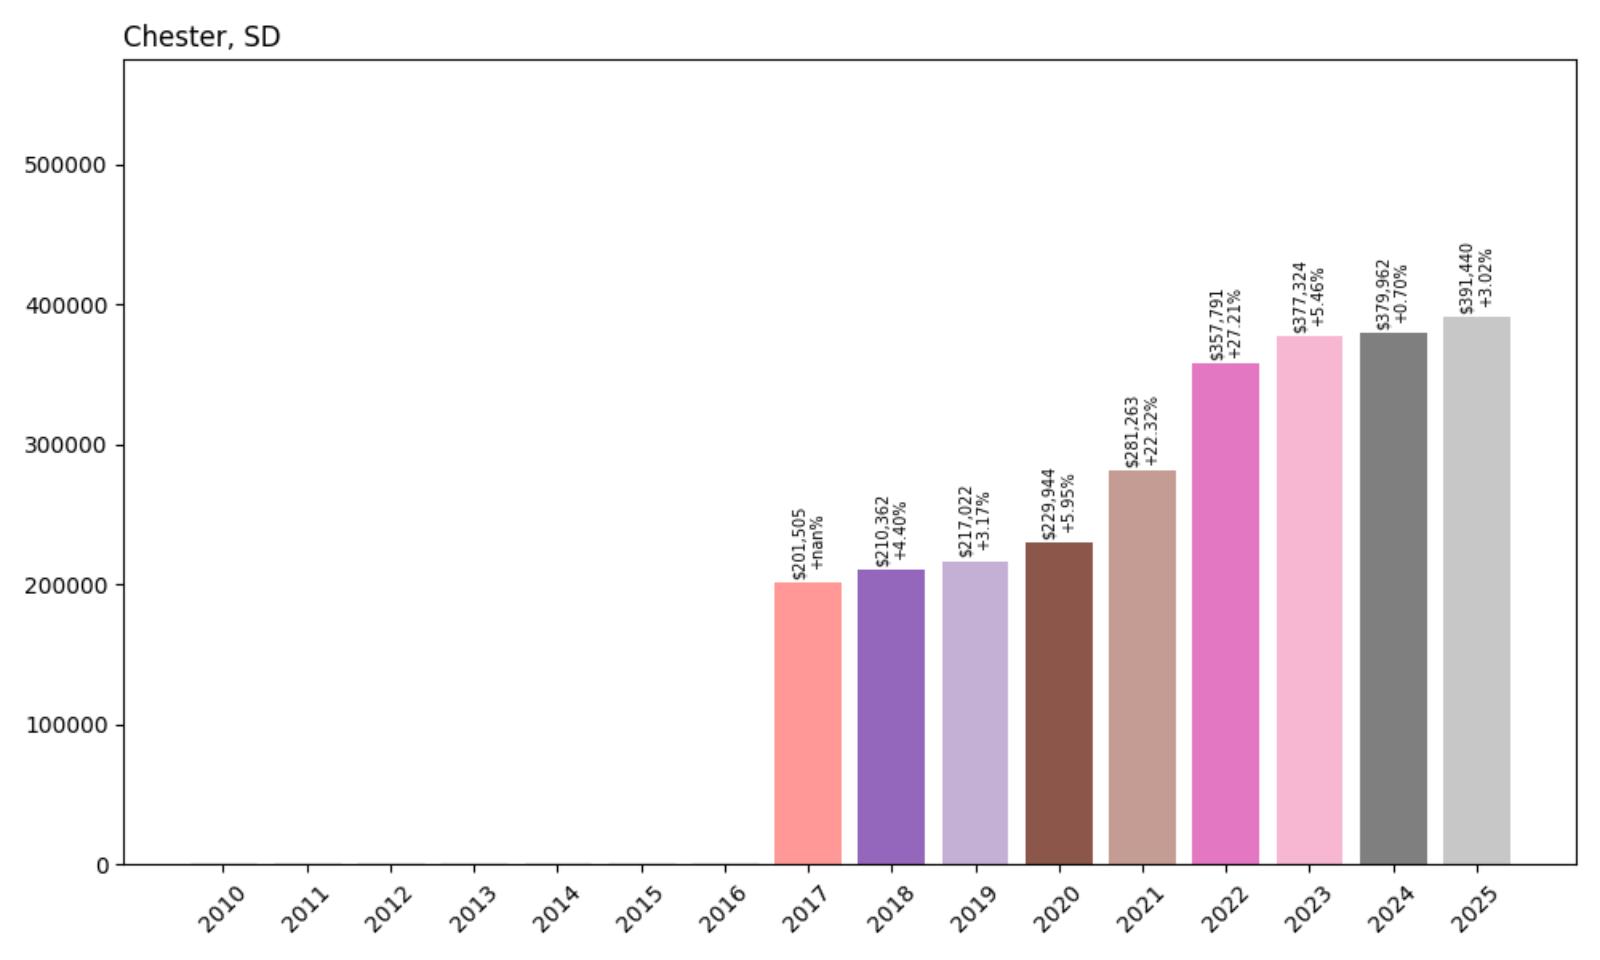
24. Chester – 94.4% Home Price Increase Since 2017
- 2010: N/A
- 2011: N/A
- 2012: N/A
- 2013: N/A
- 2014: N/A
- 2015: N/A
- 2016: N/A
- 2017: $201,505
- 2018: $210,362 (+$8,857, +4.40% from previous year)
- 2019: $217,022 (+$6,661, +3.17% from previous year)
- 2020: $229,944 (+$12,921, +5.95% from previous year)
- 2021: $281,263 (+$51,319, +22.32% from previous year)
- 2022: $357,791 (+$76,528, +27.21% from previous year)
- 2023: $377,324 (+$19,533, +5.46% from previous year)
- 2024: $379,962 (+$2,638, +0.70% from previous year)
- 2025: $391,440 (+$11,478, +3.02% from previous year)
Chester experienced explosive growth during the pandemic era, with a remarkable 54% price increase over just two years (2021-2022). The community’s current median home price of $391,440 nearly doubled from its 2017 baseline, driven by the same market forces that elevated many small South Dakota communities. After the dramatic appreciation period, prices have stabilized with modest continued growth in recent years.
Chester – Small Community, Big Growth
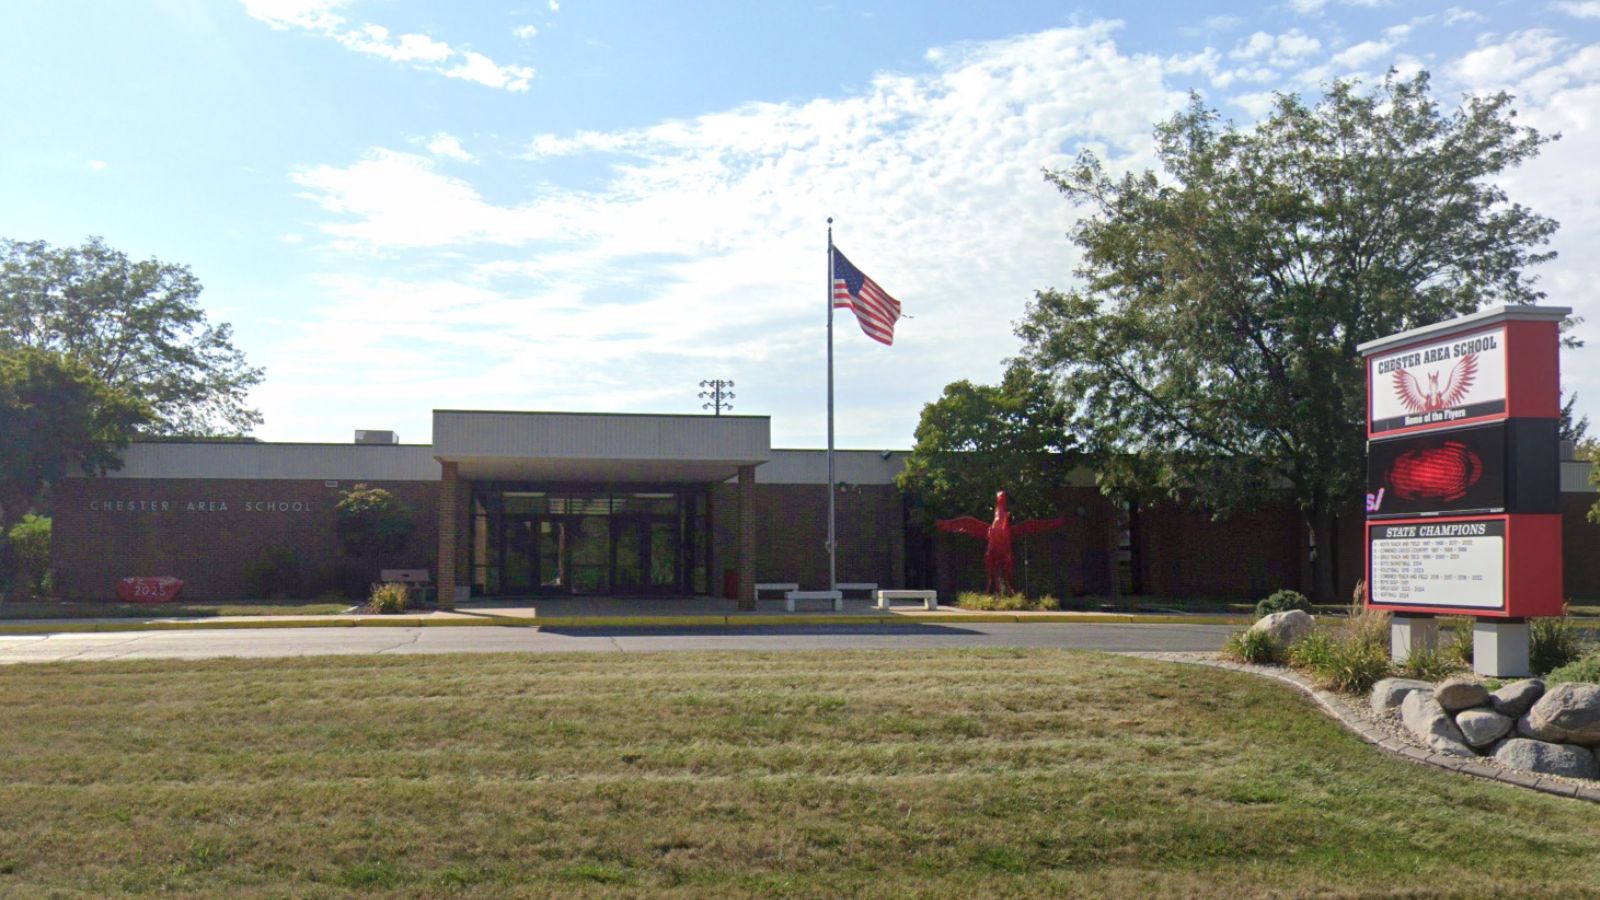
Chester is an unincorporated community and census-designated place in Lake County, located in the southeast corner of the county just 15 miles southeast of Madison. With a population of just 237 residents, this small agricultural community has experienced some of the most dramatic real estate appreciation in the region. The community boasts a remarkably low poverty rate of just 1.4% and a median household income of $67,417, well above many rural areas.
Chester’s location near Brant Lake and along Skunk Creek provides natural amenities that enhance property values in this rural setting. The community serves families seeking small-town living within reasonable commuting distance of regional employment centers. Chester’s school district and rural character appeal to buyers looking for affordable family life with strong community connections.
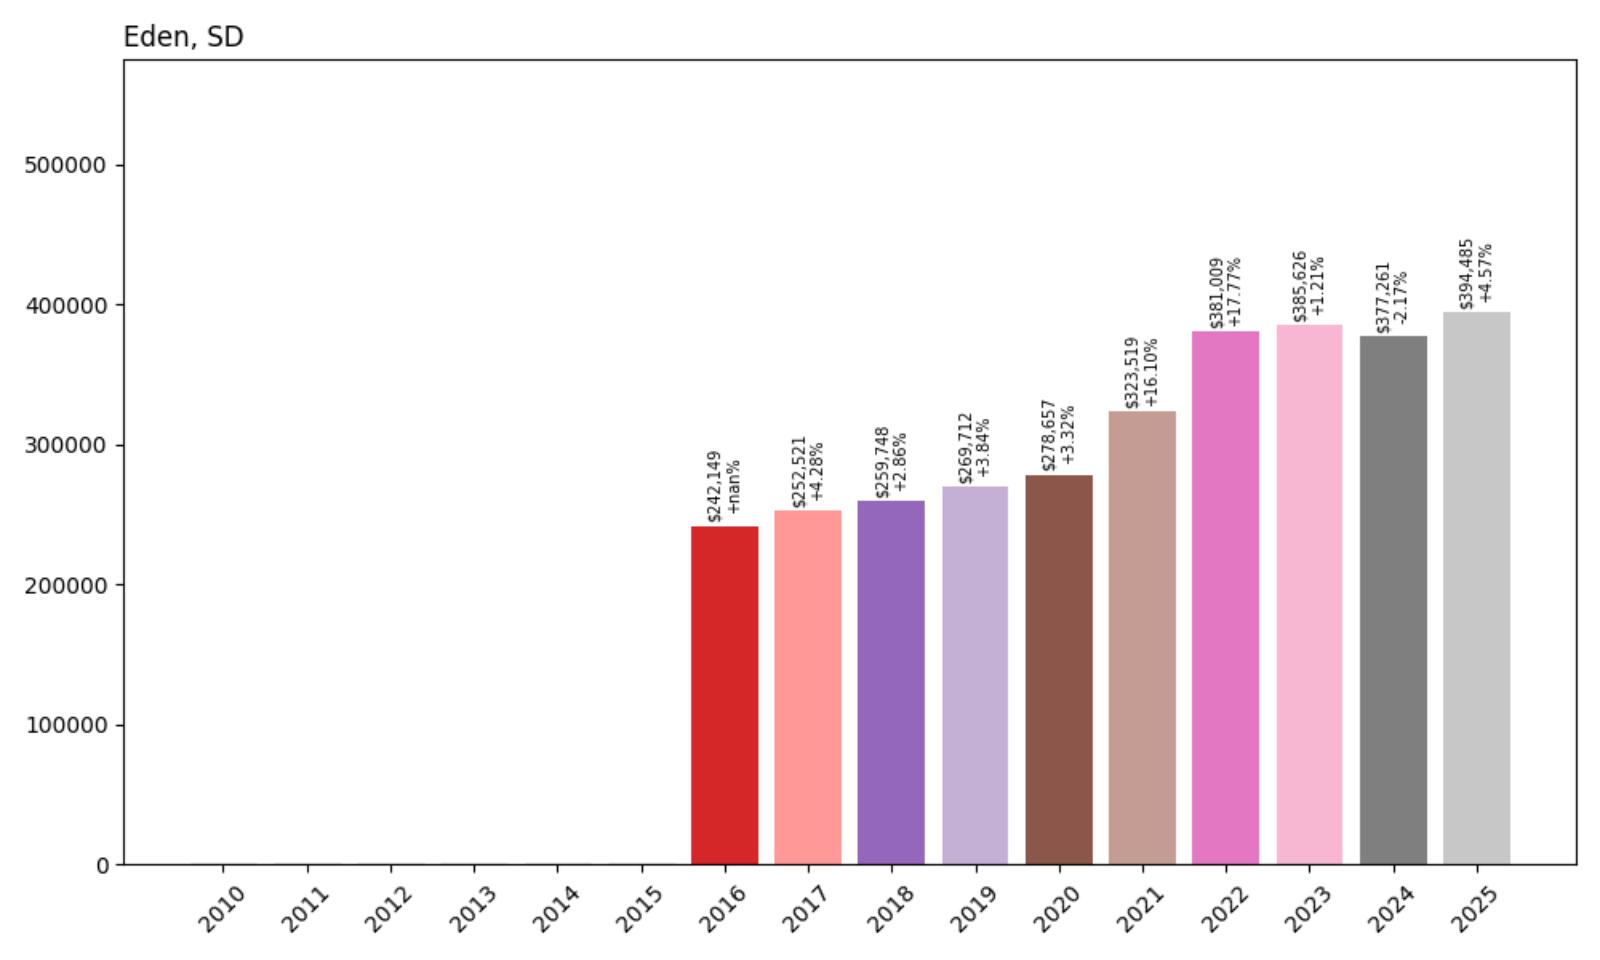
23. Eden – 62.9% Home Price Increase Since 2016
- 2010: N/A
- 2011: N/A
- 2012: N/A
- 2013: N/A
- 2014: N/A
- 2015: N/A
- 2016: $242,149
- 2017: $252,521 (+$10,372, +4.28% from previous year)
- 2018: $259,748 (+$7,227, +2.86% from previous year)
- 2019: $269,712 (+$9,964, +3.84% from previous year)
- 2020: $278,657 (+$8,945, +3.32% from previous year)
- 2021: $323,519 (+$44,863, +16.10% from previous year)
- 2022: $381,009 (+$57,490, +17.77% from previous year)
- 2023: $385,626 (+$4,617, +1.21% from previous year)
- 2024: $377,261 (−$8,365, −2.17% from previous year)
- 2025: $394,485 (+$17,224, +4.57% from previous year)
Eden demonstrated steady appreciation through 2020 before experiencing significant acceleration during 2021-2022, when prices increased 36% over two years. The market has shown some volatility since then, with a decline in 2024 followed by strong recovery in 2025. Current values at $394,485 represent solid long-term growth from the 2016 baseline, though with more fluctuation than other markets.
Eden – Marshall County Growth Story
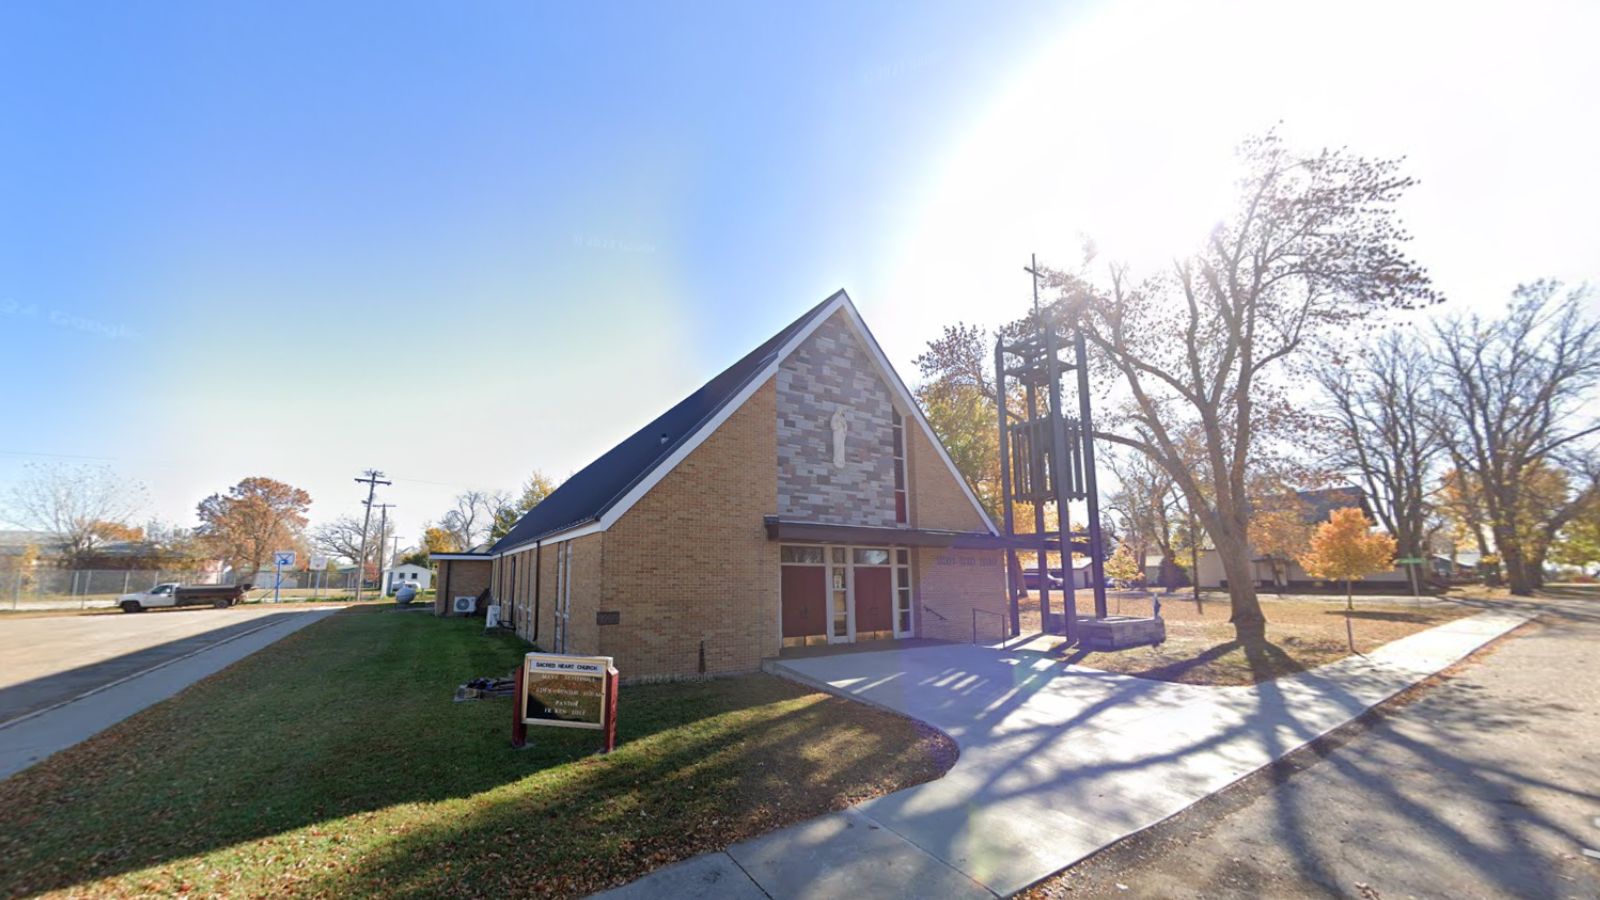
Eden represents the transformation occurring in small Marshall County communities as buyers seek affordable alternatives to larger metropolitan areas. This rural community has benefited from its location in northeastern South Dakota, where agricultural stability meets growing interest in small-town living. Eden’s real estate market reflects broader regional trends toward rural property appreciation.
Recent market volatility reflects the adjustment period many smaller communities experience as they balance rapid appreciation with local economic fundamentals. Eden’s recovery in 2025 suggests continued underlying demand for rural properties, supported by buyers seeking alternatives to urban markets and the lifestyle benefits of small-town South Dakota living.
22. Brandon – 120.1% Home Price Increase Since 2010
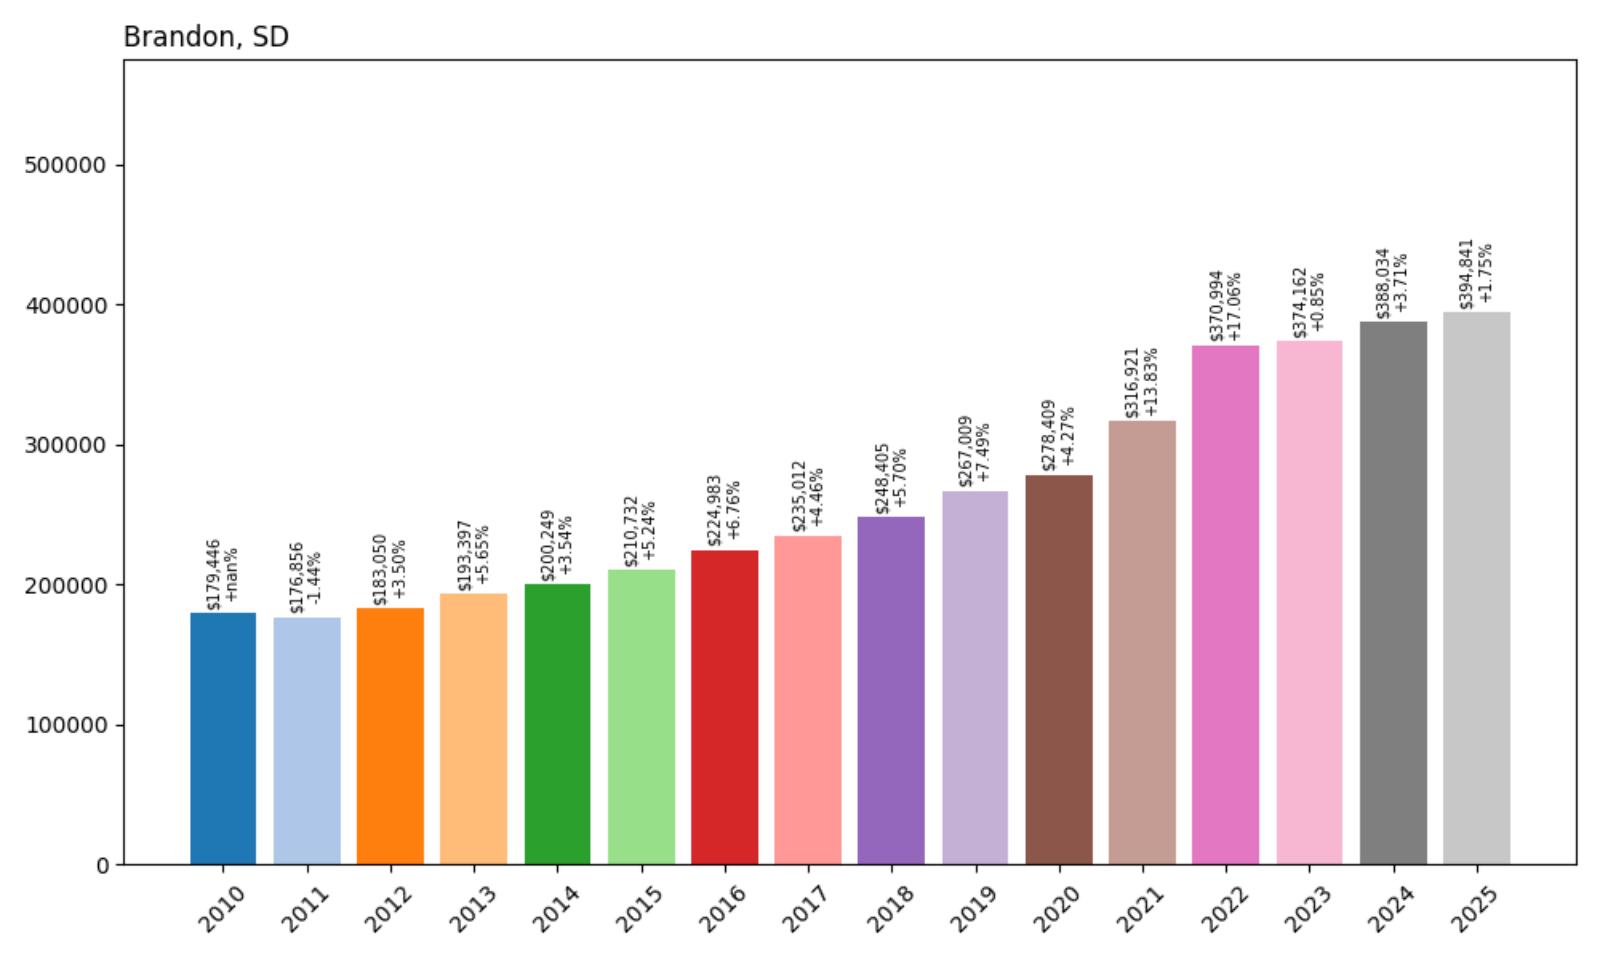
- 2010: $179,446
- 2011: $176,856 (−$2,590, −1.44% from previous year)
- 2012: $183,050 (+$6,193, +3.50% from previous year)
- 2013: $193,397 (+$10,347, +5.65% from previous year)
- 2014: $200,249 (+$6,852, +3.54% from previous year)
- 2015: $210,732 (+$10,484, +5.24% from previous year)
- 2016: $224,983 (+$14,251, +6.76% from previous year)
- 2017: $235,012 (+$10,028, +4.46% from previous year)
- 2018: $248,405 (+$13,393, +5.70% from previous year)
- 2019: $267,009 (+$18,605, +7.49% from previous year)
- 2020: $278,409 (+$11,400, +4.27% from previous year)
- 2021: $316,921 (+$38,511, +13.83% from previous year)
- 2022: $370,994 (+$54,073, +17.06% from previous year)
- 2023: $374,162 (+$3,169, +0.85% from previous year)
- 2024: $388,034 (+$13,872, +3.71% from previous year)
- 2025: $394,841 (+$6,807, +1.75% from previous year)
Brandon shows remarkable consistency over 15 years, with only a brief decline in 2011 before establishing steady upward momentum. The community has more than doubled in value since 2010, demonstrating sustained demand and successful suburban development. The pandemic years brought accelerated growth, with prices increasing 33% between 2021-2022, though the market has since stabilized with continued modest gains.
Brandon – Sioux Falls Suburban Success
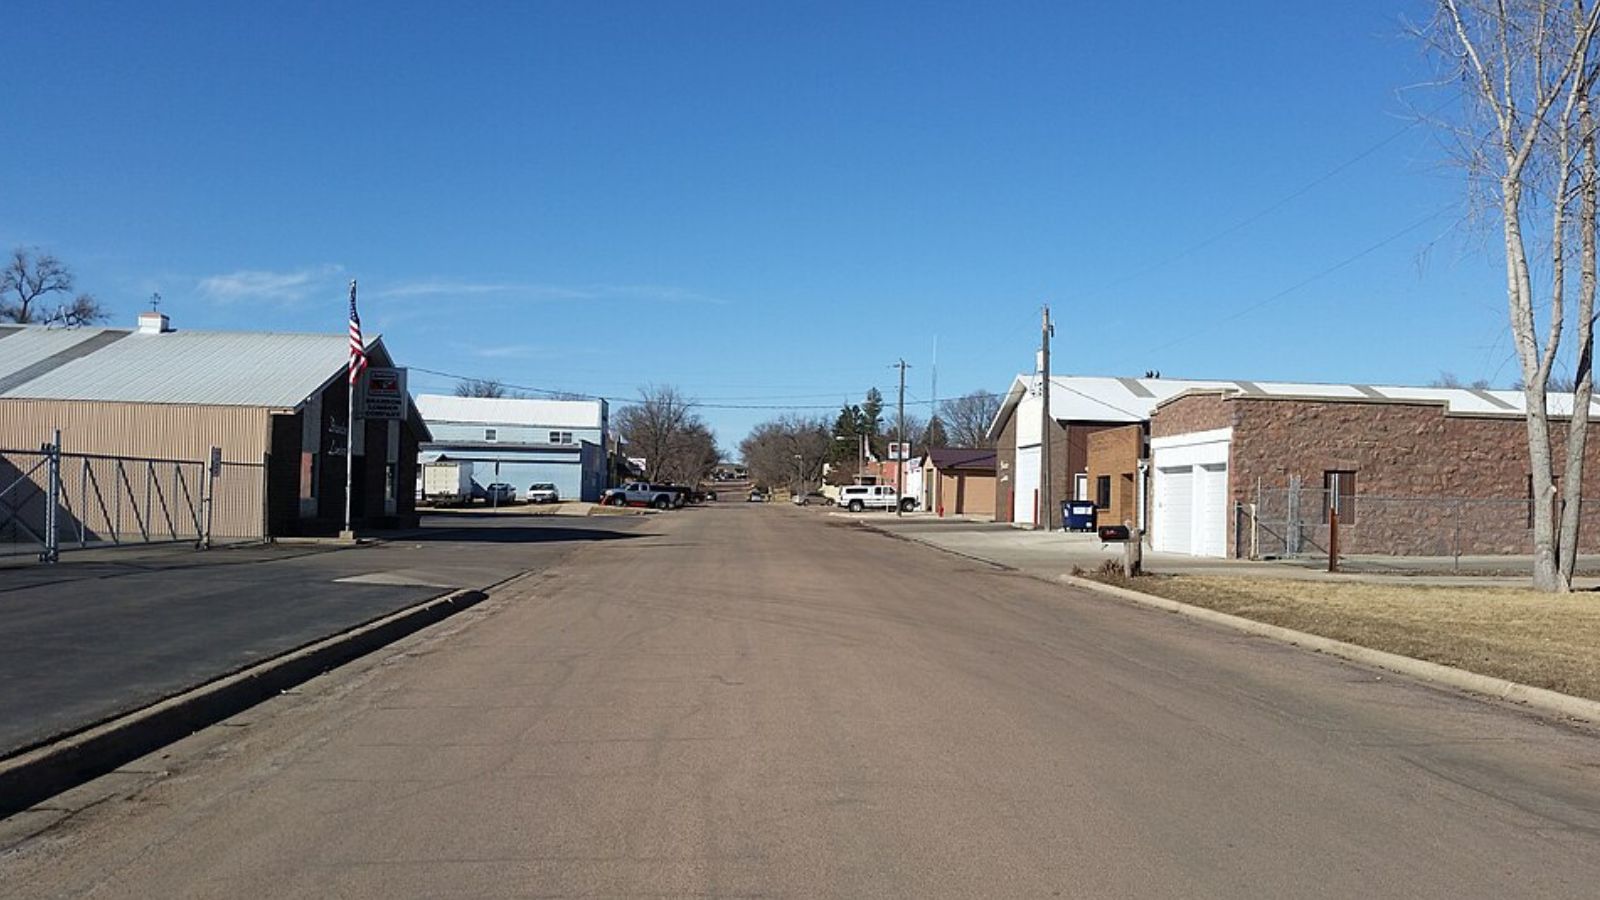
Brandon has emerged as one of South Dakota’s most successful suburban communities, benefiting enormously from its proximity to Sioux Falls while maintaining distinct small-town character. Located just east of the state’s largest city, Brandon offers residents easy access to urban employment and amenities while providing the space, schools, and community atmosphere that attract growing families.
The Brandon Valley School District serves as a major draw for families, consistently ranking among the state’s top-performing systems. This educational excellence, combined with well-planned residential developments and strong municipal services, has created sustained demand that supports consistent property appreciation. Brandon’s careful growth management has preserved community character while accommodating new residents.
21. Hartford – 136.3% Home Price Increase Since 2010
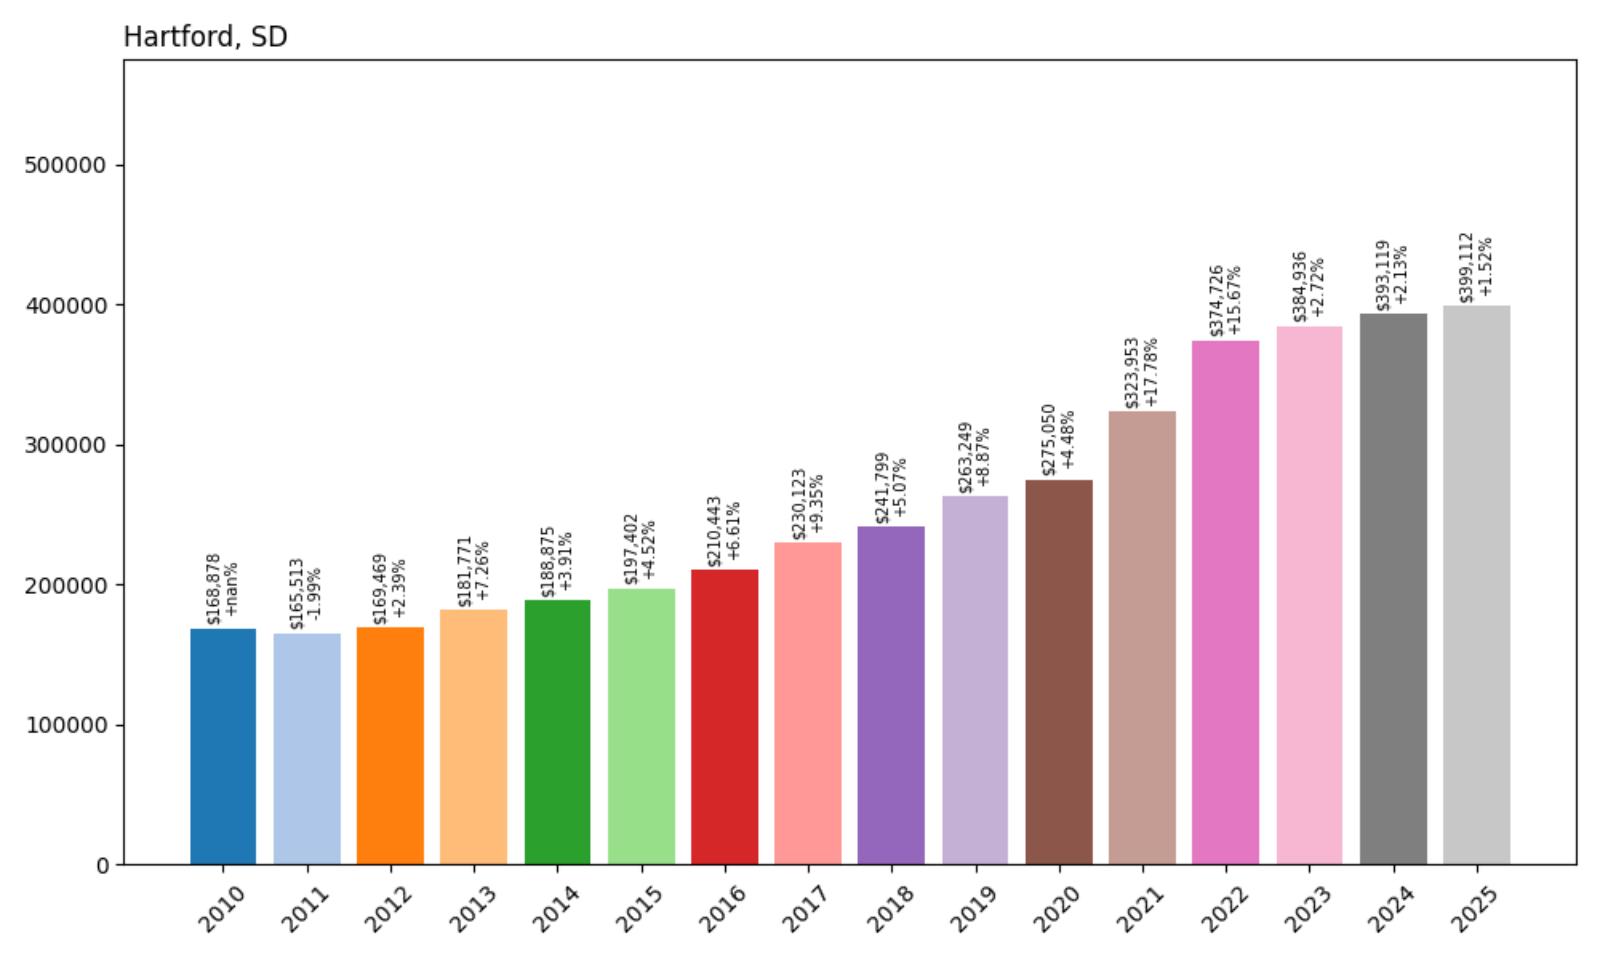
- 2010: $168,878
- 2011: $165,513 (−$3,365, −1.99% from previous year)
- 2012: $169,469 (+$3,956, +2.39% from previous year)
- 2013: $181,771 (+$12,302, +7.26% from previous year)
- 2014: $188,875 (+$7,104, +3.91% from previous year)
- 2015: $197,402 (+$8,528, +4.52% from previous year)
- 2016: $210,443 (+$13,041, +6.61% from previous year)
- 2017: $230,123 (+$19,680, +9.35% from previous year)
- 2018: $241,799 (+$11,676, +5.07% from previous year)
- 2019: $263,249 (+$21,449, +8.87% from previous year)
- 2020: $275,050 (+$11,801, +4.48% from previous year)
- 2021: $323,953 (+$48,903, +17.78% from previous year)
- 2022: $374,726 (+$50,773, +15.67% from previous year)
- 2023: $384,936 (+$10,210, +2.72% from previous year)
- 2024: $393,119 (+$8,182, +2.13% from previous year)
- 2025: $399,112 (+$5,994, +1.52% from previous year)
Hartford demonstrates exceptional long-term appreciation, more than doubling in value since 2010 with particularly strong performance in recent years. The community showed accelerated growth starting in 2017, with consistently high annual gains culminating in pandemic-era appreciation exceeding 34% over two years. The current price of $399,112 reflects sustained demand and successful suburban positioning.
Hartford – Growing Minnehaha County Destination
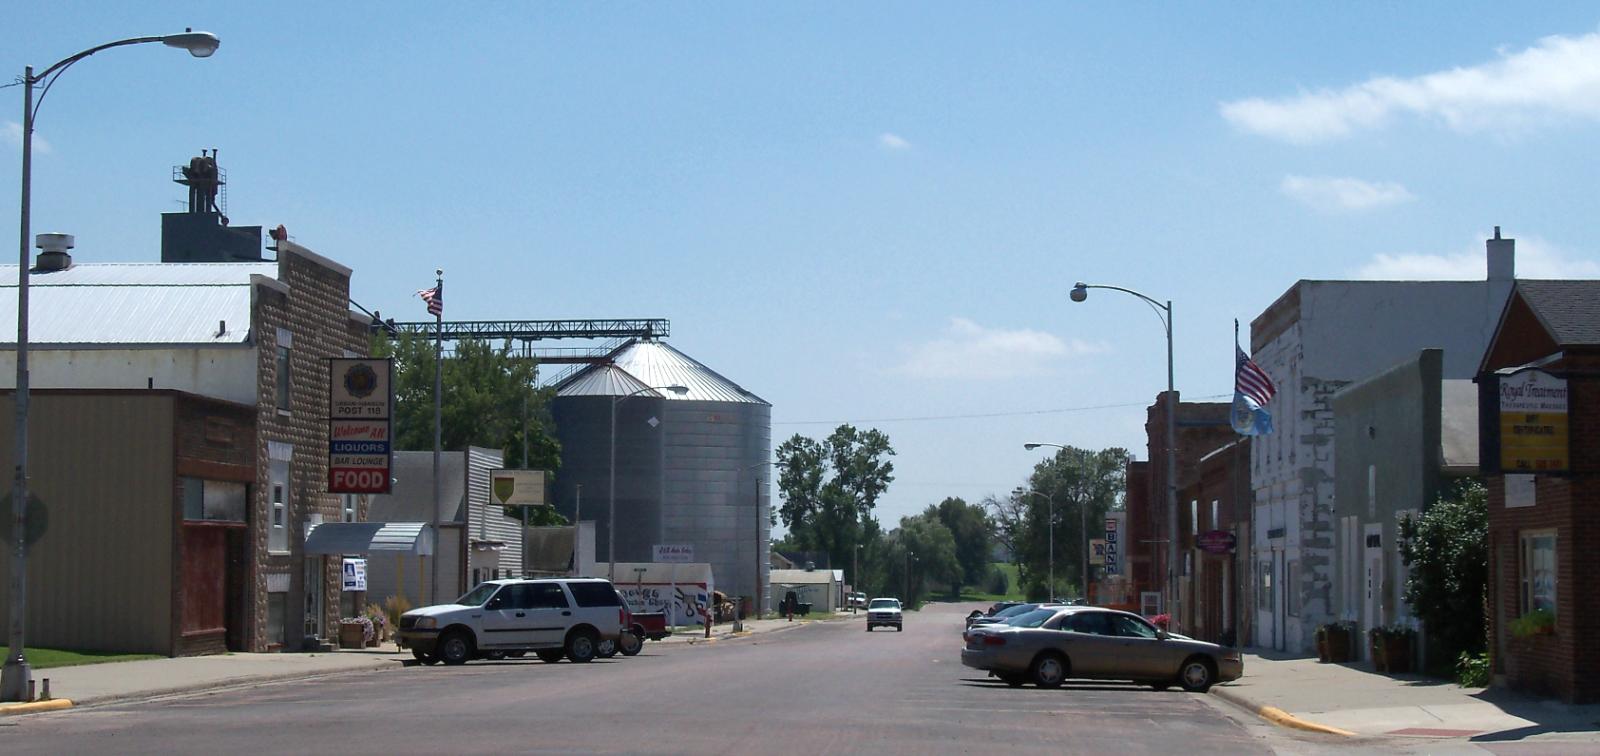
Hartford has established itself as a premier suburban community in Minnehaha County, strategically positioned between Sioux Falls and the Minnesota border. This location provides residents with easy access to regional employment centers while offering the benefits of small-town living in a rapidly developing area. Hartford’s growth reflects the broader trend of families seeking alternatives to urban living without sacrificing convenience.
Hartford’s real estate market benefits from controlled growth that balances new development with community character preservation. Recent residential projects offer diverse housing options, from starter homes to executive properties, meeting demand across different buyer segments. This comprehensive approach to development has created a stable market foundation that supports continued appreciation.
20. Whitewood – 109.6% Home Price Increase Since 2012
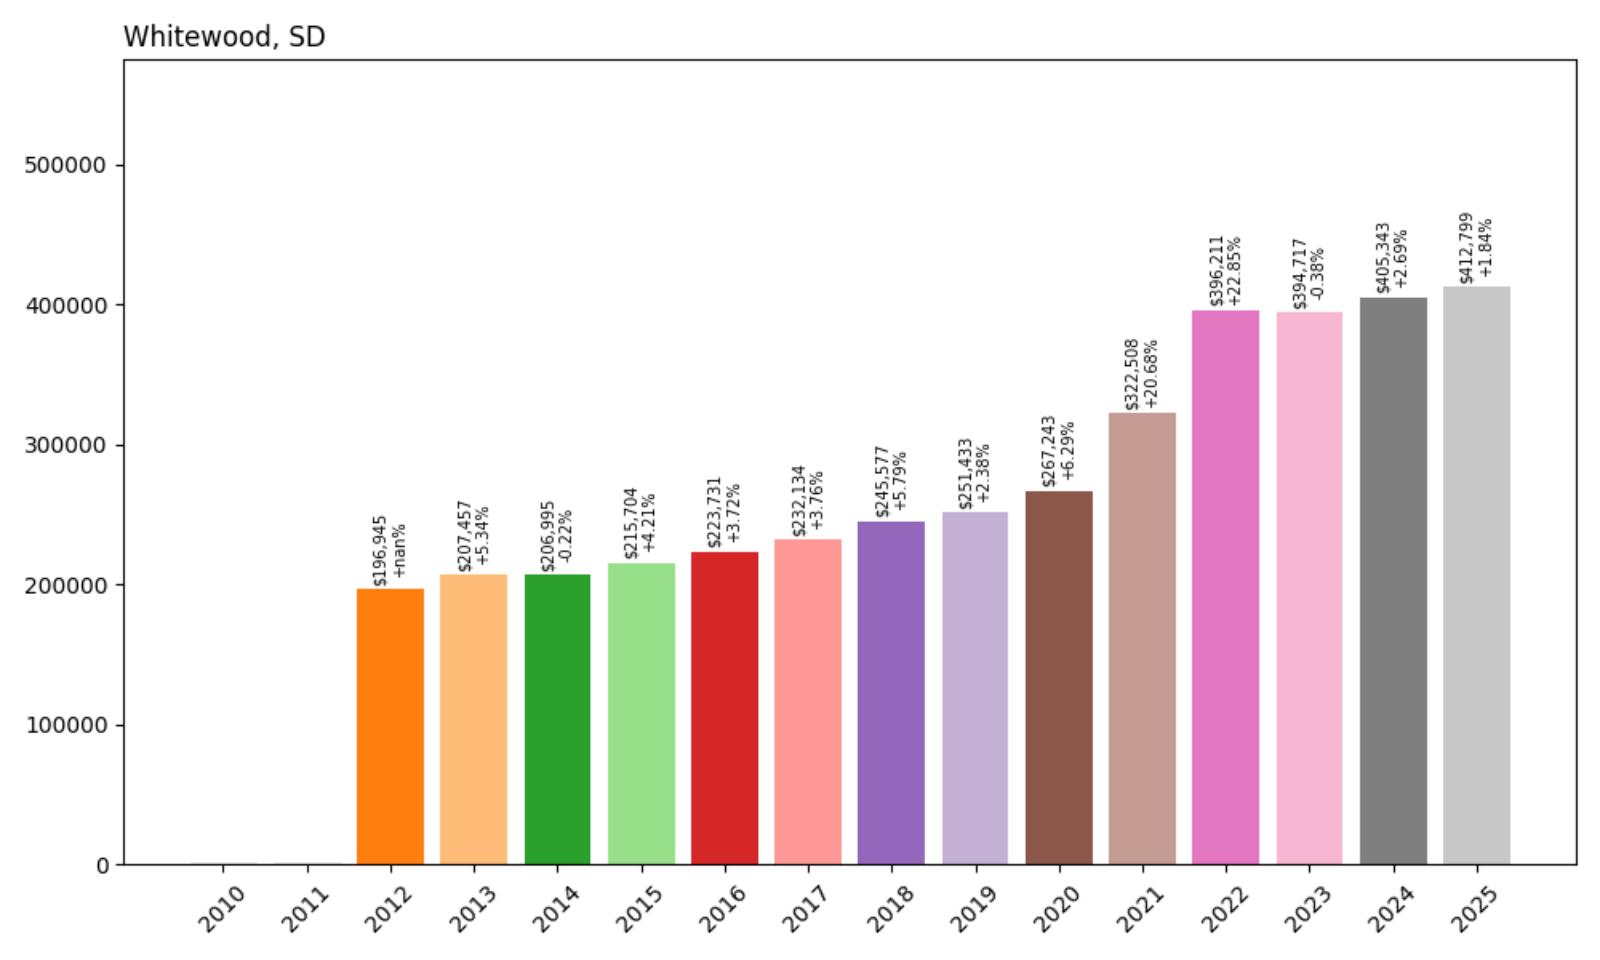
- 2010: N/A
- 2011: N/A
- 2012: $196,945
- 2013: $207,457 (+$10,511, +5.34% from previous year)
- 2014: $206,995 (−$461, −0.22% from previous year)
- 2015: $215,704 (+$8,708, +4.21% from previous year)
- 2016: $223,731 (+$8,028, +3.72% from previous year)
- 2017: $232,134 (+$8,403, +3.76% from previous year)
- 2018: $245,577 (+$13,442, +5.79% from previous year)
- 2019: $251,433 (+$5,856, +2.38% from previous year)
- 2020: $267,243 (+$15,810, +6.29% from previous year)
- 2021: $322,508 (+$55,265, +20.68% from previous year)
- 2022: $396,211 (+$73,703, +22.85% from previous year)
- 2023: $394,717 (−$1,493, −0.38% from previous year)
- 2024: $405,343 (+$10,626, +2.69% from previous year)
- 2025: $412,799 (+$7,456, +1.84% from previous year)
Whitewood exhibited steady growth through 2020 before experiencing explosive appreciation during the pandemic years, when prices increased 48% over just two years. The community’s current median price of $412,799 more than doubled from its 2012 baseline, reflecting strong demand for Black Hills properties. After brief stabilization in 2023, the market has resumed modest upward momentum.
Whitewood – Black Hills Gateway Community
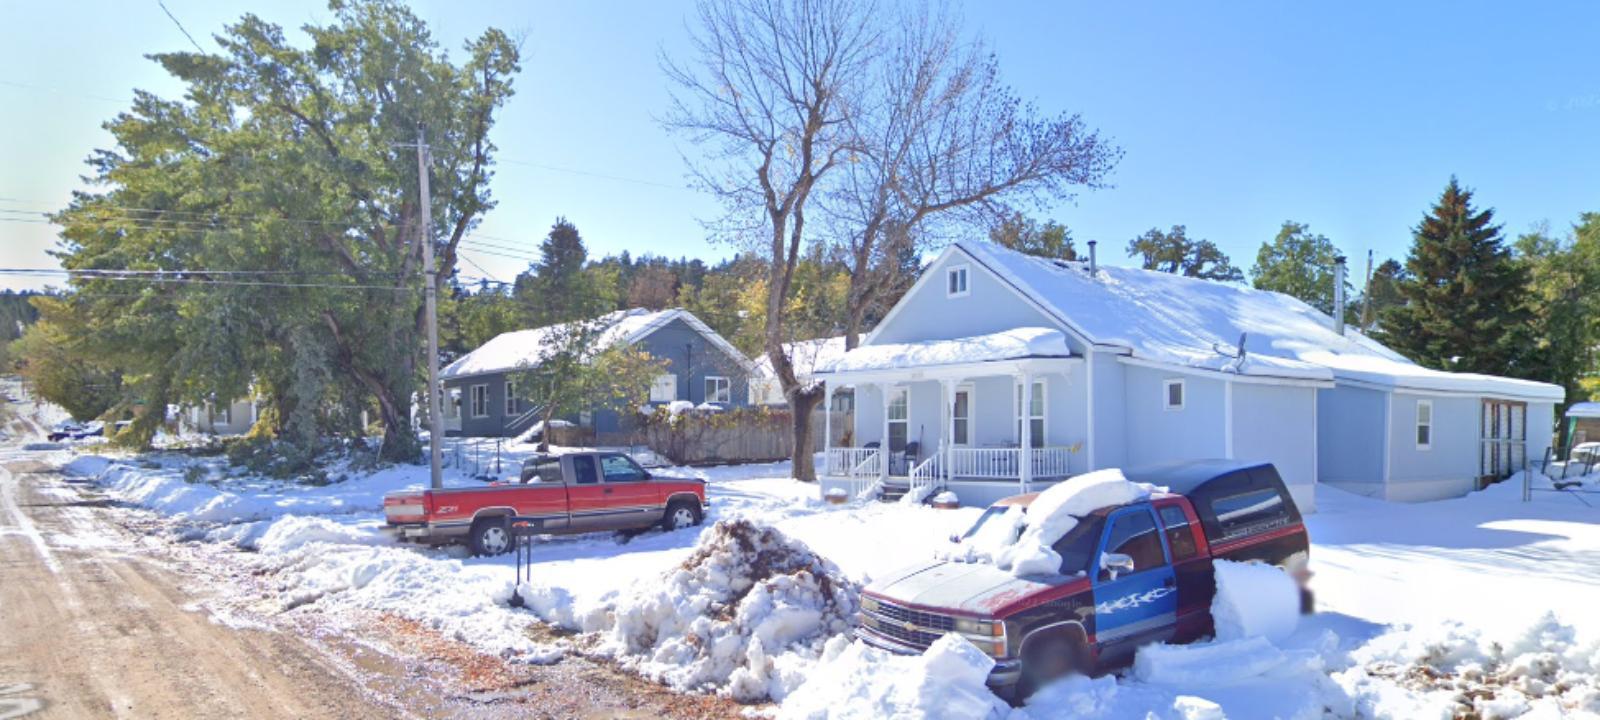
Whitewood is a city in Lawrence County with a population of 879, strategically located as a gateway to the Black Hills region. The community was platted in 1888 when the Chicago and North Western Railway extended to the area, taking its name from nearby Whitewood Creek. This historic railroad town has evolved into a desirable residential community that benefits from both its Black Hills location and proximity to regional attractions.
The town benefits from the broader Black Hills tourism economy, which saw $4.96 billion in tourism spending in 2023 with 14.7 million visitors to the region. Whitewood’s real estate market reflects growing recognition of smaller Black Hills communities as desirable places to live, combining recreational access with community amenities and reasonable proximity to employment centers in Rapid City and surrounding areas.
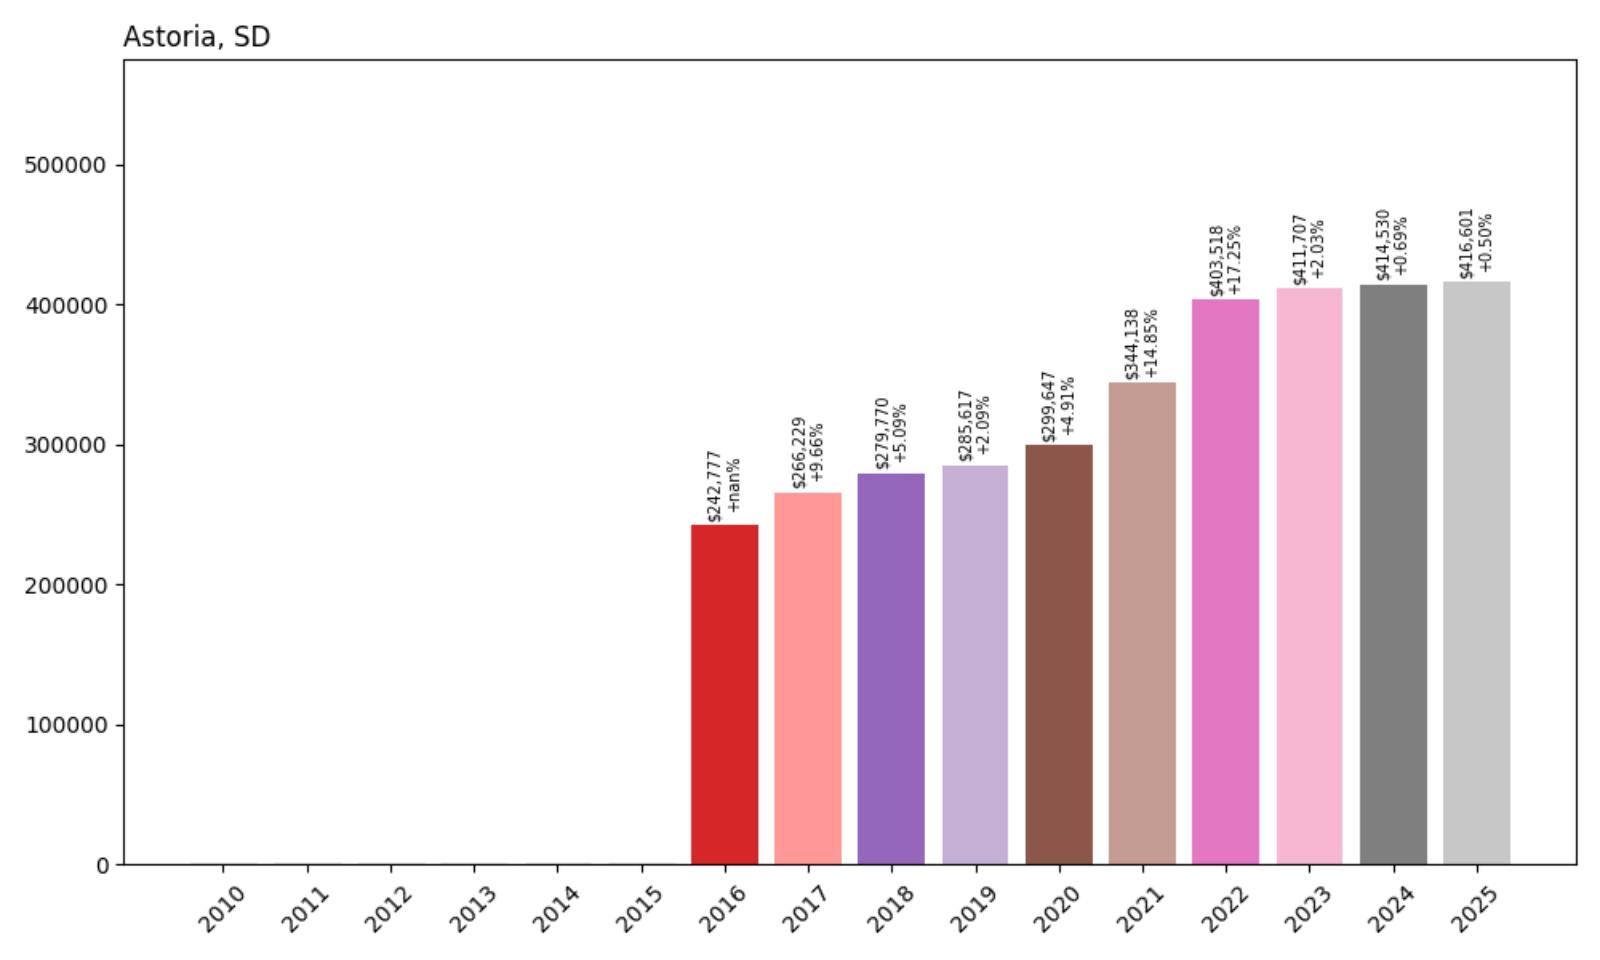
19. Astoria – 71.6% Home Price Increase Since 2016
Would you like to save this?
- 2010: N/A
- 2011: N/A
- 2012: N/A
- 2013: N/A
- 2014: N/A
- 2015: N/A
- 2016: $242,777
- 2017: $266,229 (+$23,452, +9.66% from previous year)
- 2018: $279,770 (+$13,541, +5.09% from previous year)
- 2019: $285,617 (+$5,847, +2.09% from previous year)
- 2020: $299,647 (+$14,030, +4.91% from previous year)
- 2021: $344,138 (+$44,491, +14.85% from previous year)
- 2022: $403,518 (+$59,380, +17.25% from previous year)
- 2023: $411,707 (+$8,189, +2.03% from previous year)
- 2024: $414,530 (+$2,823, +0.69% from previous year)
- 2025: $416,601 (+$2,070, +0.50% from previous year)
Astoria showed strong initial growth in 2017 before moderating through 2019, then experienced significant acceleration during 2021-2022 with 34% appreciation over two years. The market has since stabilized with minimal but continued growth, reaching $416,601 in 2025. The community’s appreciation pattern reflects broader trends in smaller South Dakota markets during the pandemic era housing boom.
Astoria – Deuel County Stability
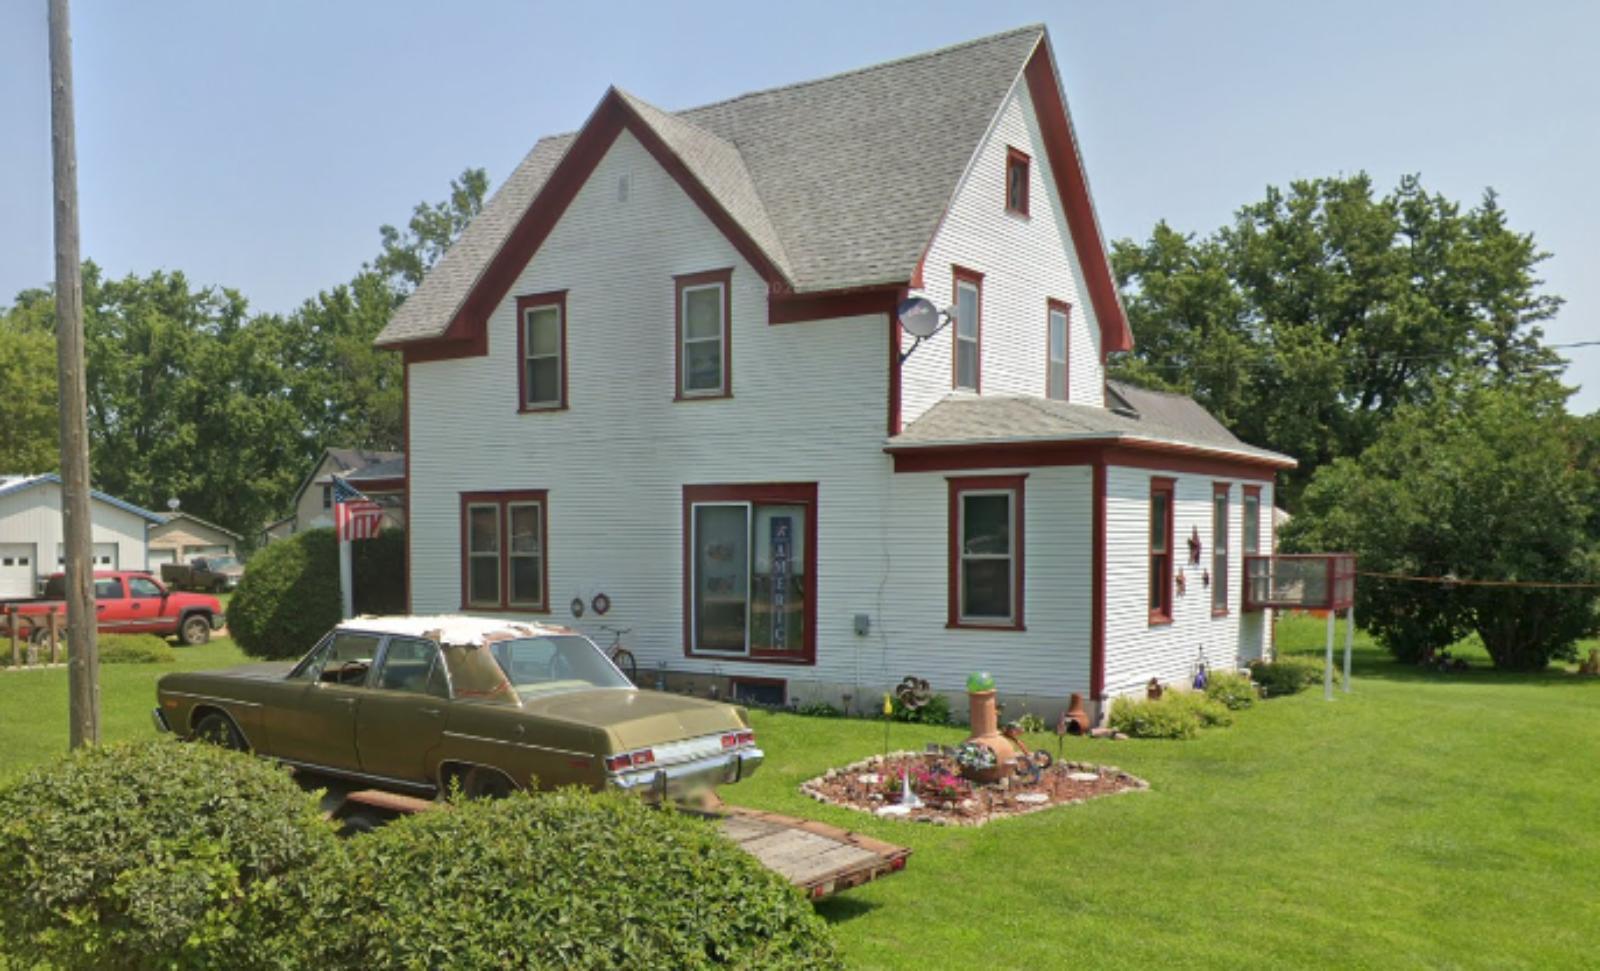
Astoria represents the quiet appeal of small-town South Dakota living in Deuel County, where agricultural heritage meets modern residential appeal. This rural community has benefited from the broader trend of buyers seeking affordable alternatives to metropolitan areas while maintaining access to regional amenities and employment opportunities.
Recent price appreciation reflects the growing recognition of smaller South Dakota communities as viable residential options for those seeking alternatives to urban living. Astoria’s combination of affordability, community character, and rural setting creates appeal for buyers prioritizing quality of life and value in their housing decisions.
18. New Underwood – 128.7% Home Price Increase Since 2010
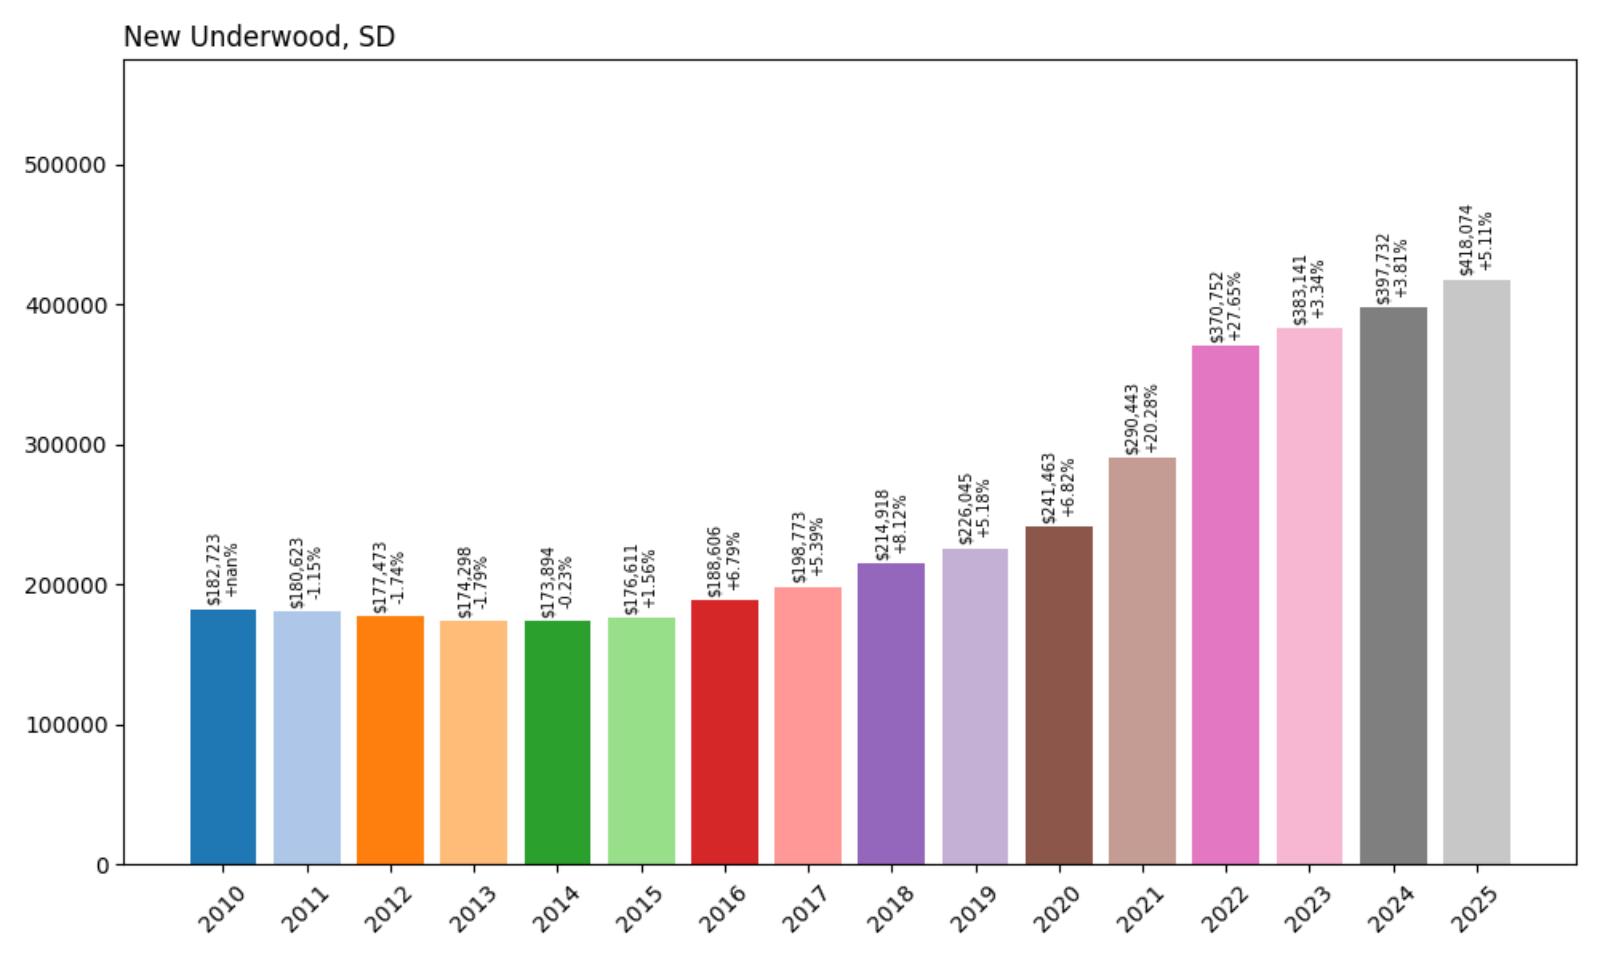
- 2010: $182,723
- 2011: $180,623 (−$2,101, −1.15% from previous year)
- 2012: $177,473 (−$3,150, −1.74% from previous year)
- 2013: $174,298 (−$3,175, −1.79% from previous year)
- 2014: $173,894 (−$404, −0.23% from previous year)
- 2015: $176,611 (+$2,717, +1.56% from previous year)
- 2016: $188,606 (+$11,995, +6.79% from previous year)
- 2017: $198,773 (+$10,167, +5.39% from previous year)
- 2018: $214,918 (+$16,145, +8.12% from previous year)
- 2019: $226,045 (+$11,127, +5.18% from previous year)
- 2020: $241,463 (+$15,418, +6.82% from previous year)
- 2021: $290,443 (+$48,980, +20.28% from previous year)
- 2022: $370,752 (+$80,309, +27.65% from previous year)
- 2023: $383,141 (+$12,389, +3.34% from previous year)
- 2024: $397,732 (+$14,592, +3.81% from previous year)
- 2025: $418,074 (+$20,342, +5.11% from previous year)
New Underwood experienced initial decline through 2014 before establishing strong upward momentum that culminated in explosive pandemic-era growth. The community saw remarkable appreciation of 53% over just two years (2021-2022), with the massive 27.65% increase in 2022 representing one of the highest single-year gains in the dataset. Current values more than double the 2010 baseline, reflecting sustained demand recovery and growth.
New Underwood – Western South Dakota Opportunity
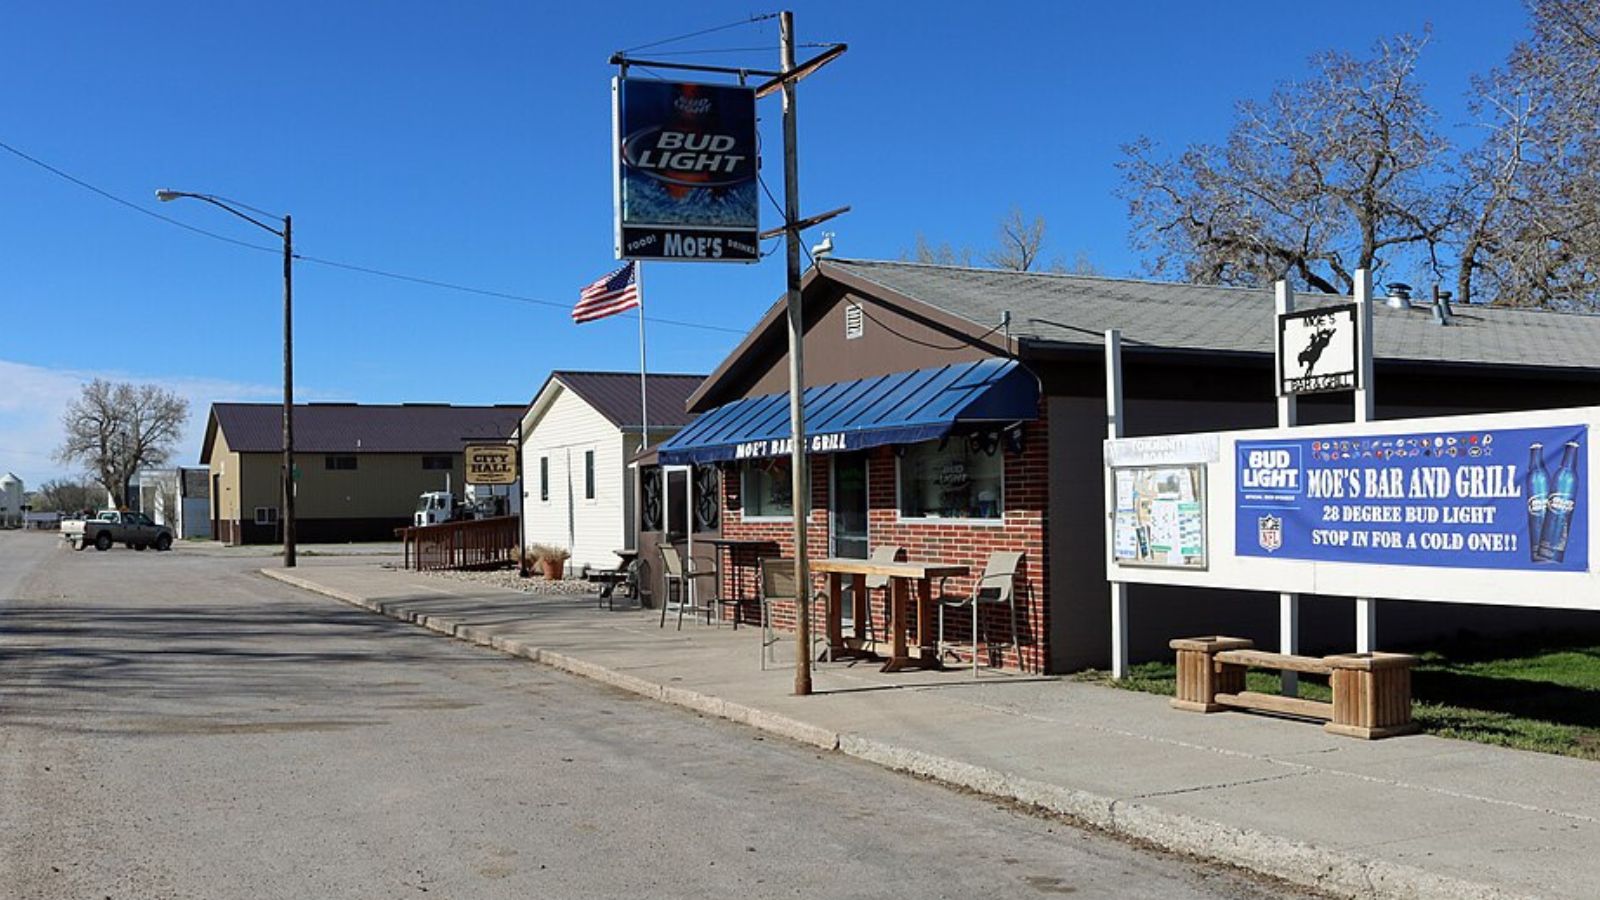
New Underwood occupies a strategic position in western South Dakota, serving communities between the Black Hills region and central parts of the state. This location provides residents with access to recreational opportunities in the Black Hills while maintaining the agricultural and ranching character that defines much of western South Dakota’s economy and culture.
Recent continued appreciation suggests sustained demand for properties in western South Dakota communities that offer rural living with reasonable access to regional amenities. New Underwood’s combination of space, affordability relative to resort areas, and proximity to recreational opportunities creates appeal for buyers seeking western lifestyle without premium resort pricing.
17. North Sioux City – 72.4% Home Price Increase Since 2010
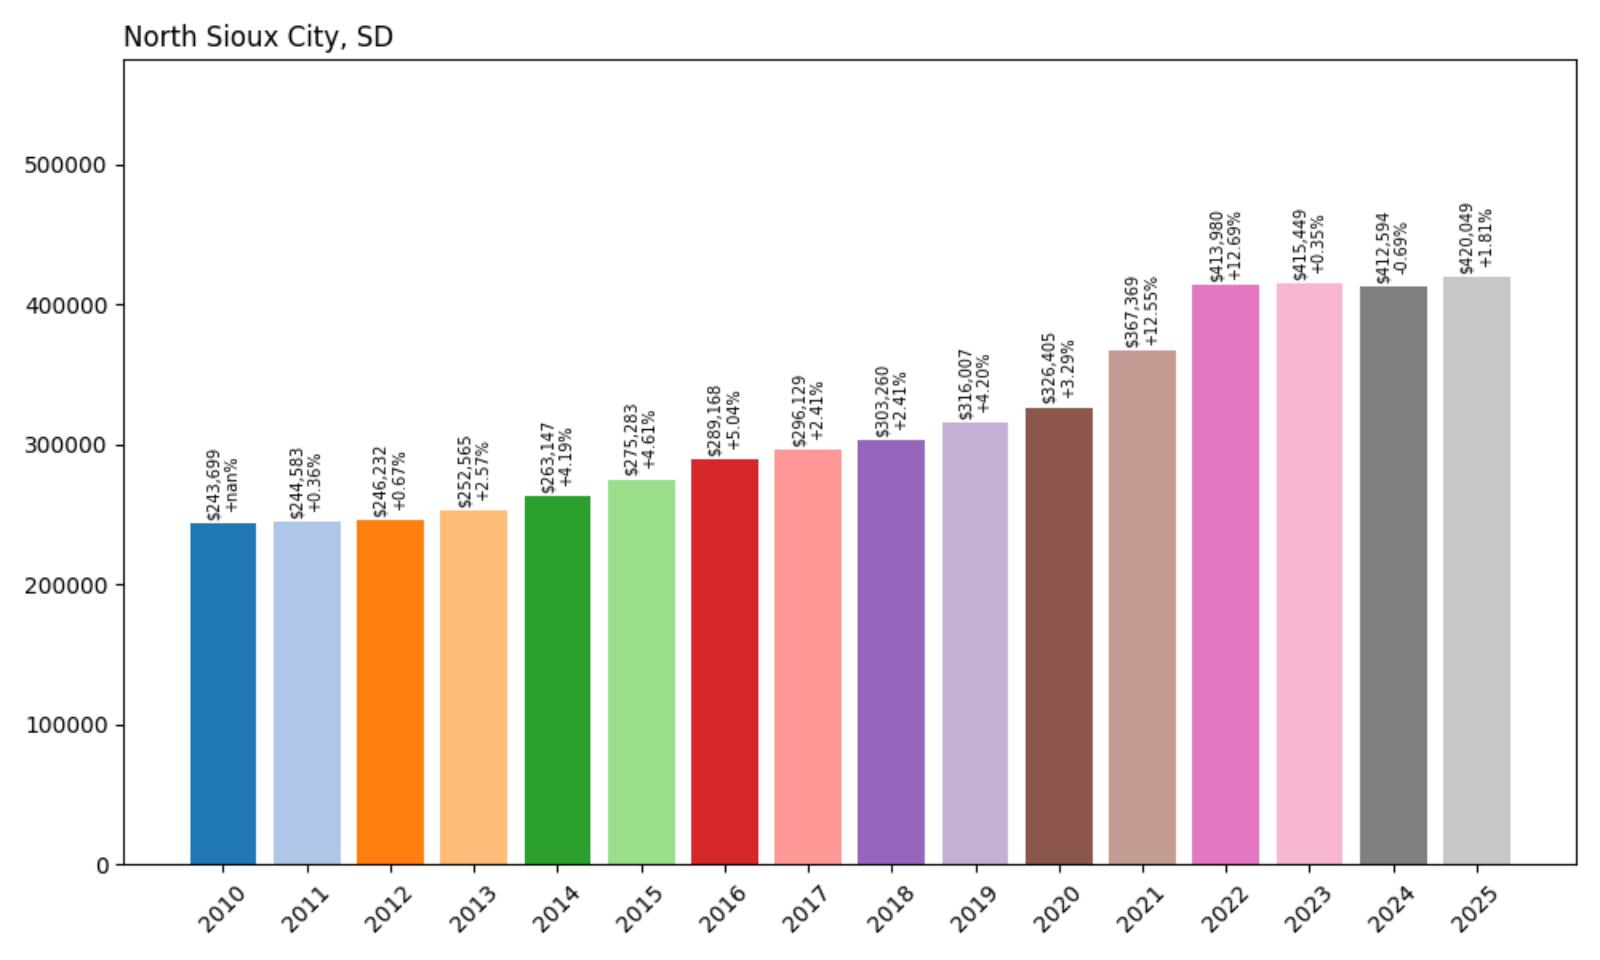
- 2010: $243,699
- 2011: $244,583 (+$884, +0.36% from previous year)
- 2012: $246,232 (+$1,649, +0.67% from previous year)
- 2013: $252,565 (+$6,333, +2.57% from previous year)
- 2014: $263,147 (+$10,582, +4.19% from previous year)
- 2015: $275,283 (+$12,137, +4.61% from previous year)
- 2016: $289,168 (+$13,885, +5.04% from previous year)
- 2017: $296,129 (+$6,961, +2.41% from previous year)
- 2018: $303,260 (+$7,131, +2.41% from previous year)
- 2019: $316,007 (+$12,748, +4.20% from previous year)
- 2020: $326,405 (+$10,398, +3.29% from previous year)
- 2021: $367,369 (+$40,964, +12.55% from previous year)
- 2022: $413,980 (+$46,610, +12.69% from previous year)
- 2023: $415,449 (+$1,469, +0.35% from previous year)
- 2024: $412,594 (−$2,854, −0.69% from previous year)
- 2025: $420,049 (+$7,454, +1.81% from previous year)
North Sioux City demonstrates remarkable consistency over 15 years, with steady appreciation and minimal volatility until pandemic-era acceleration. The community achieved sustained growth averaging over 4% annually from 2013-2020, followed by strong gains during 2021-2022. Recent stabilization around $420,000 reflects a mature market with solid fundamentals and continued modest growth potential.
North Sioux City – Tri-State Metropolitan Advantage
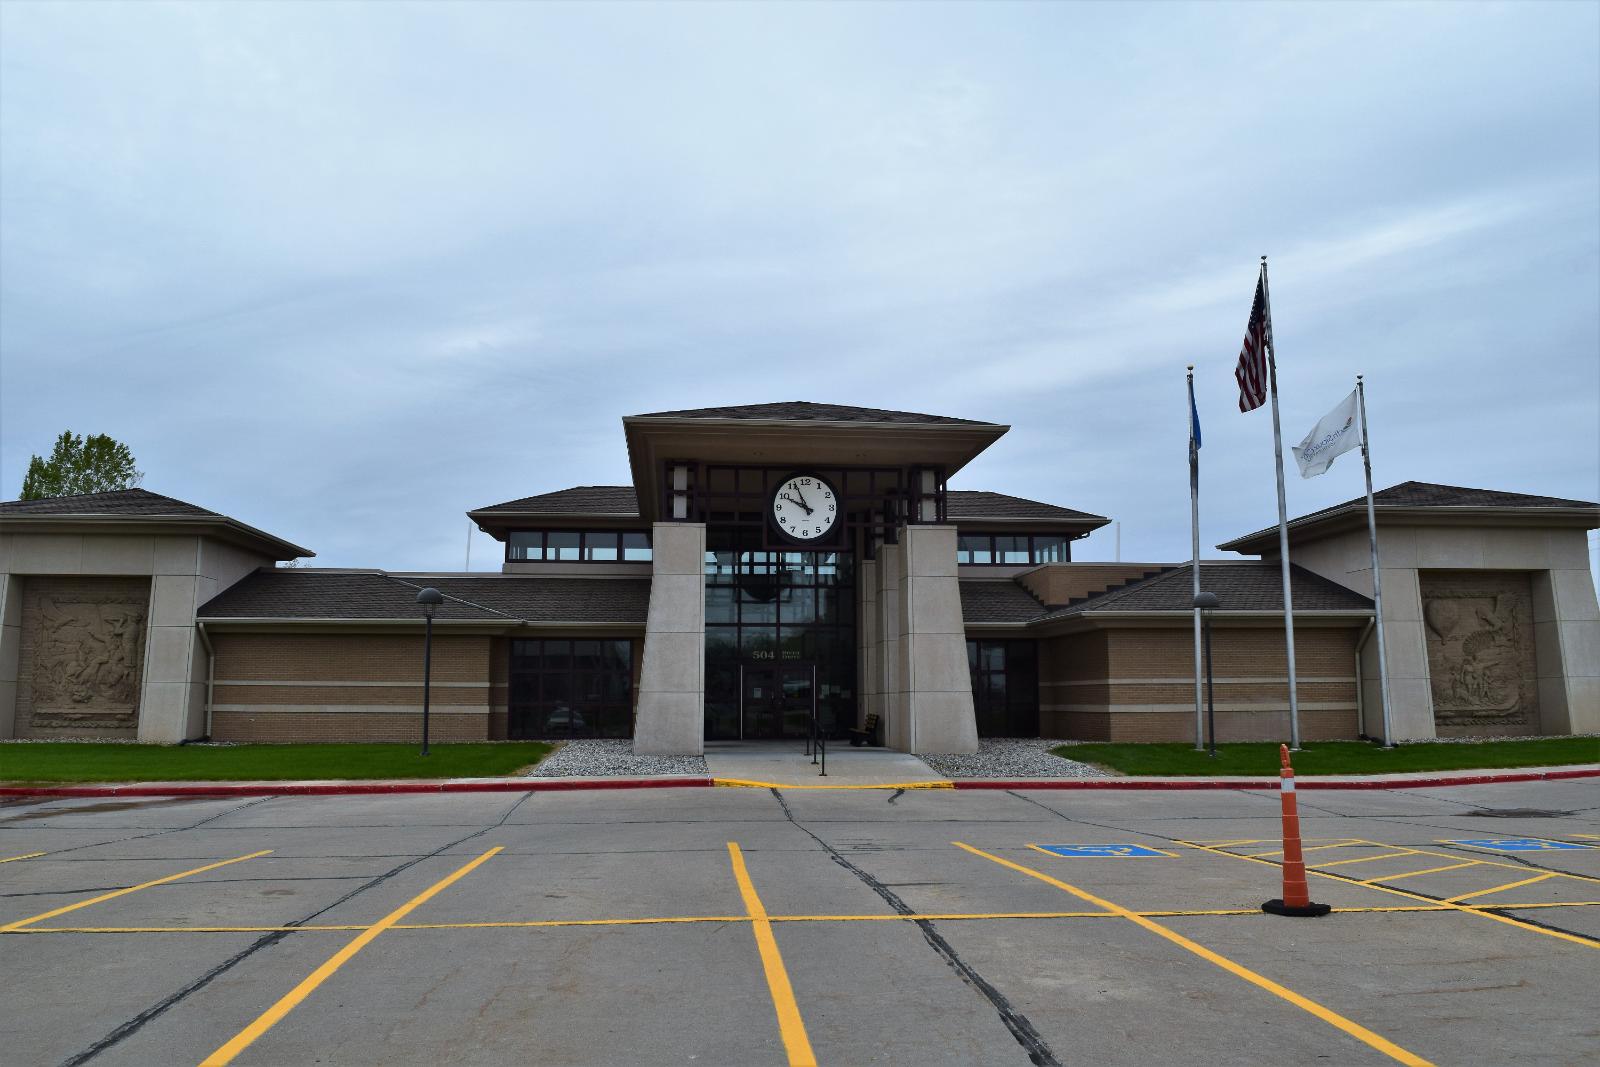
North Sioux City occupies a unique position in the tri-state area where South Dakota meets Iowa and Nebraska, providing residents with metropolitan amenities while maintaining South Dakota’s favorable tax structure and regulatory environment. This strategic location has created sustained demand from buyers seeking access to the broader Sioux City metropolitan economy while capturing the benefits of South Dakota residency.
The community benefits from its proximity to employment centers in Iowa and Nebraska while offering residents the advantages of South Dakota living, including no state income tax and lower overall tax burden. North Sioux City’s position in Union County provides easy access to regional shopping, healthcare, and cultural amenities while maintaining a suburban residential character that appeals to families and professionals.
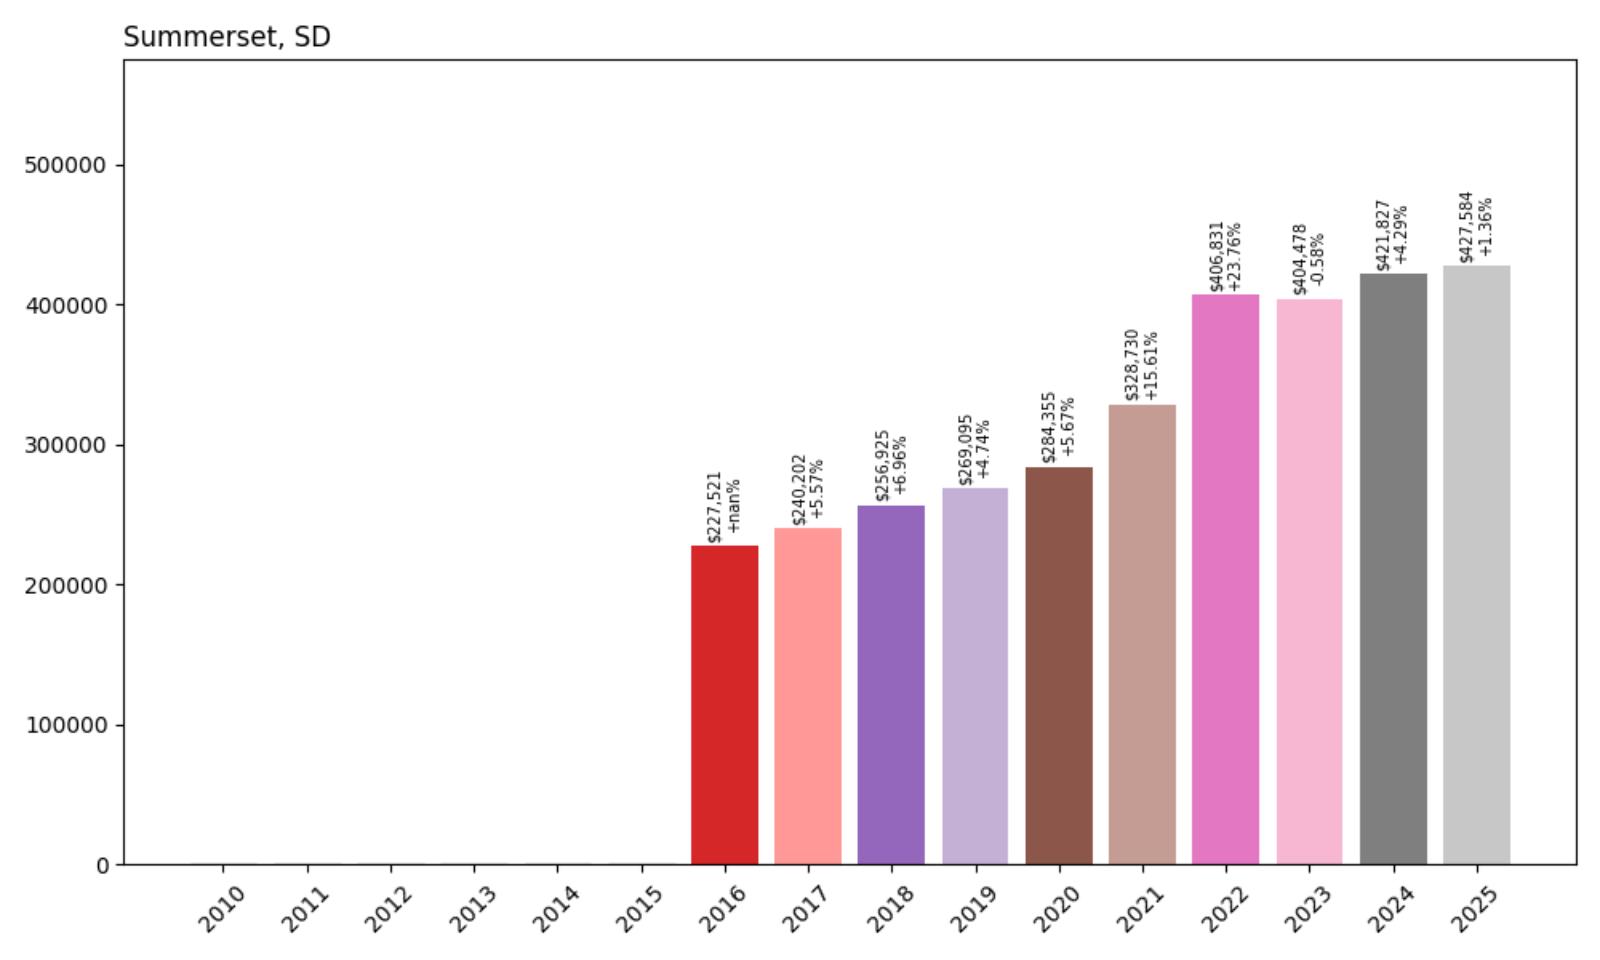
16. Summerset – 87.9% Home Price Increase Since 2016
- 2010: N/A
- 2011: N/A
- 2012: N/A
- 2013: N/A
- 2014: N/A
- 2015: N/A
- 2016: $227,521
- 2017: $240,202 (+$12,680, +5.57% from previous year)
- 2018: $256,925 (+$16,723, +6.96% from previous year)
- 2019: $269,095 (+$12,170, +4.74% from previous year)
- 2020: $284,355 (+$15,260, +5.67% from previous year)
- 2021: $328,730 (+$44,375, +15.61% from previous year)
- 2022: $406,831 (+$78,101, +23.76% from previous year)
- 2023: $404,478 (−$2,353, −0.58% from previous year)
- 2024: $421,827 (+$17,348, +4.29% from previous year)
- 2025: $427,584 (+$5,758, +1.36% from previous year)
Summerset maintained consistent appreciation through 2020 before experiencing dramatic pandemic-era growth, with prices increasing 43% over two years (2021-2022). The remarkable 23.76% increase in 2022 represents exceptional market performance, followed by brief adjustment in 2023 and resumed growth. Current values at $427,584 demonstrate the community’s strong market position and continued appeal.
Summerset – Rapid City’s Premier Suburb
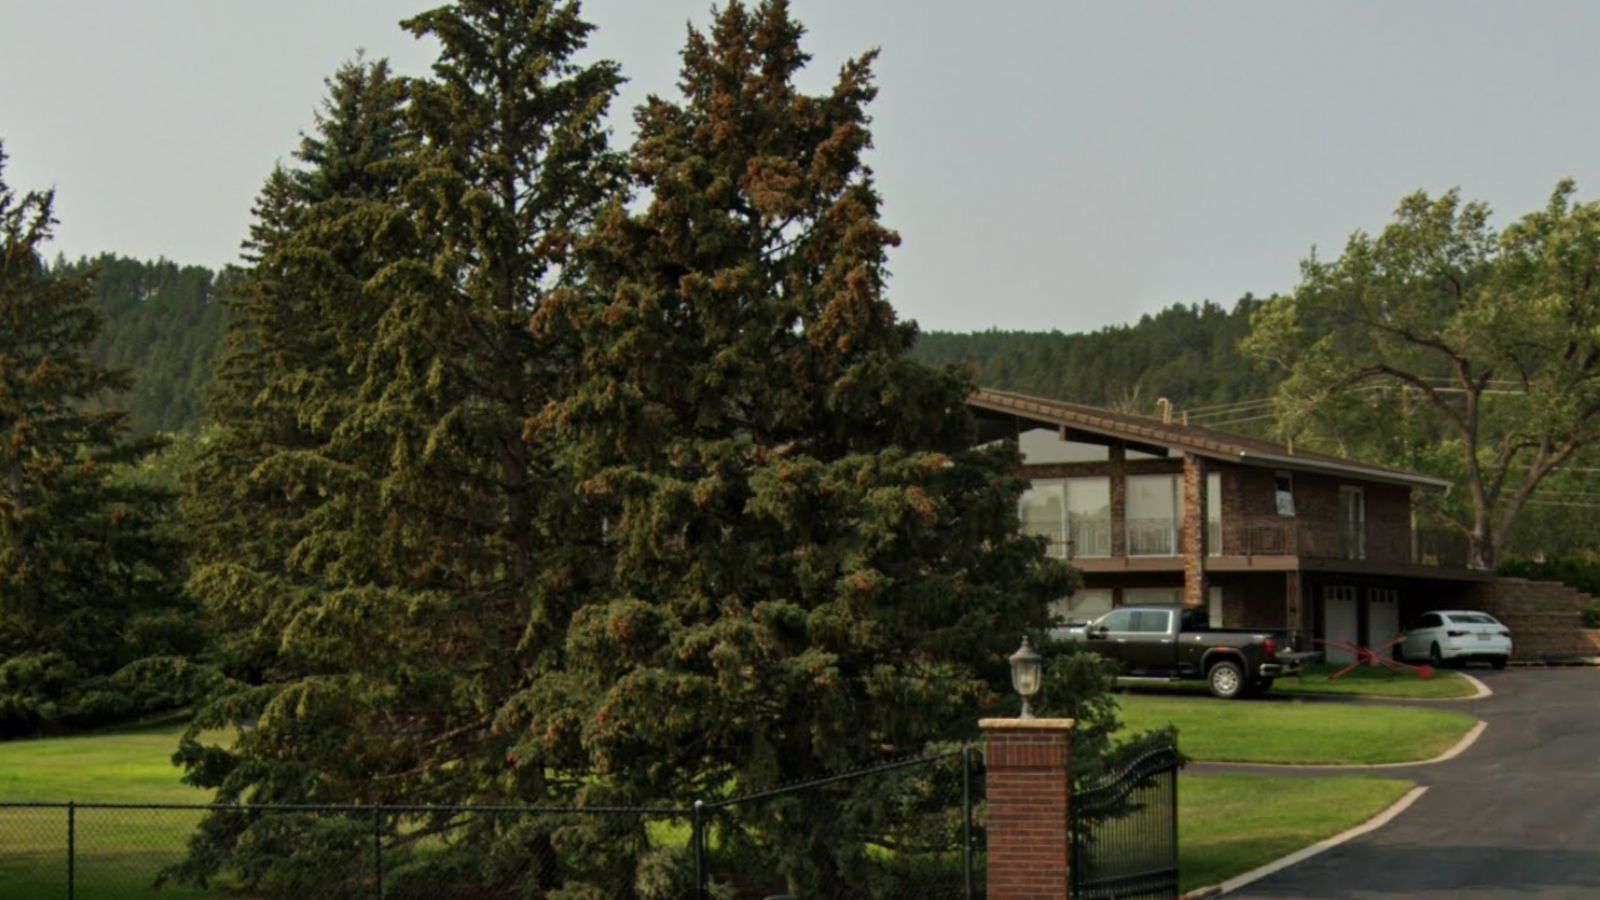
Summerset has established itself as one of the Black Hills region’s most desirable suburban communities, strategically located between Rapid City and the natural attractions that define western South Dakota. This planned community combines modern amenities with easy access to outdoor recreation, creating a unique residential environment that appeals to families and professionals seeking Black Hills living with suburban convenience.
Recent market performance reflects growing recognition of Summerset as a premier residential destination in the Black Hills region. The community’s combination of planned development, natural setting, and regional access has created sustained demand that supports premium pricing relative to other regional markets, positioning Summerset as a flagship suburban community in western South Dakota.
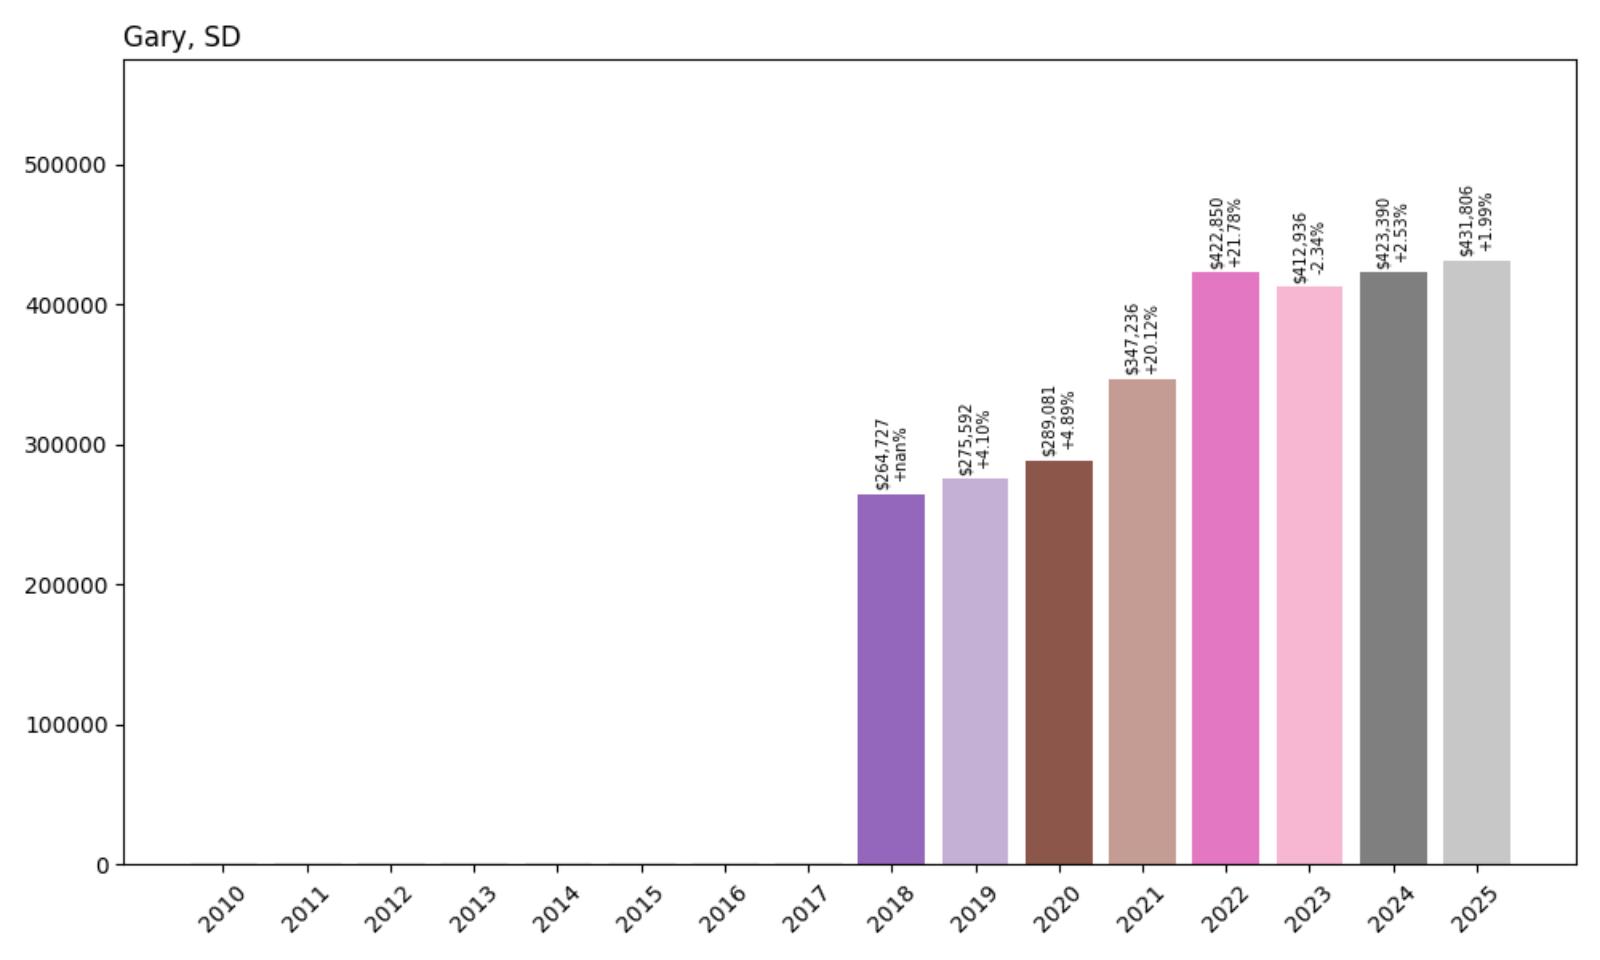
15. Gary – 63.1% Home Price Increase Since 2018
- 2010: N/A
- 2011: N/A
- 2012: N/A
- 2013: N/A
- 2014: N/A
- 2015: N/A
- 2016: N/A
- 2017: N/A
- 2018: $264,727
- 2019: $275,592 (+$10,865, +4.10% from previous year)
- 2020: $289,081 (+$13,489, +4.89% from previous year)
- 2021: $347,236 (+$58,155, +20.12% from previous year)
- 2022: $422,850 (+$75,613, +21.78% from previous year)
- 2023: $412,936 (−$9,913, −2.34% from previous year)
- 2024: $423,390 (+$10,454, +2.53% from previous year)
- 2025: $431,806 (+$8,416, +1.99% from previous year)
Gary demonstrated steady growth through 2020 before experiencing explosive pandemic-era appreciation, with prices increasing 46% over just two years (2021-2022). The remarkable combined gain of 45% during this period pushed values well above $400,000. After a brief correction in 2023, the market has resumed upward momentum, with current values at $431,806 representing strong long-term performance since tracking began.
Gary – Eastern Border Community
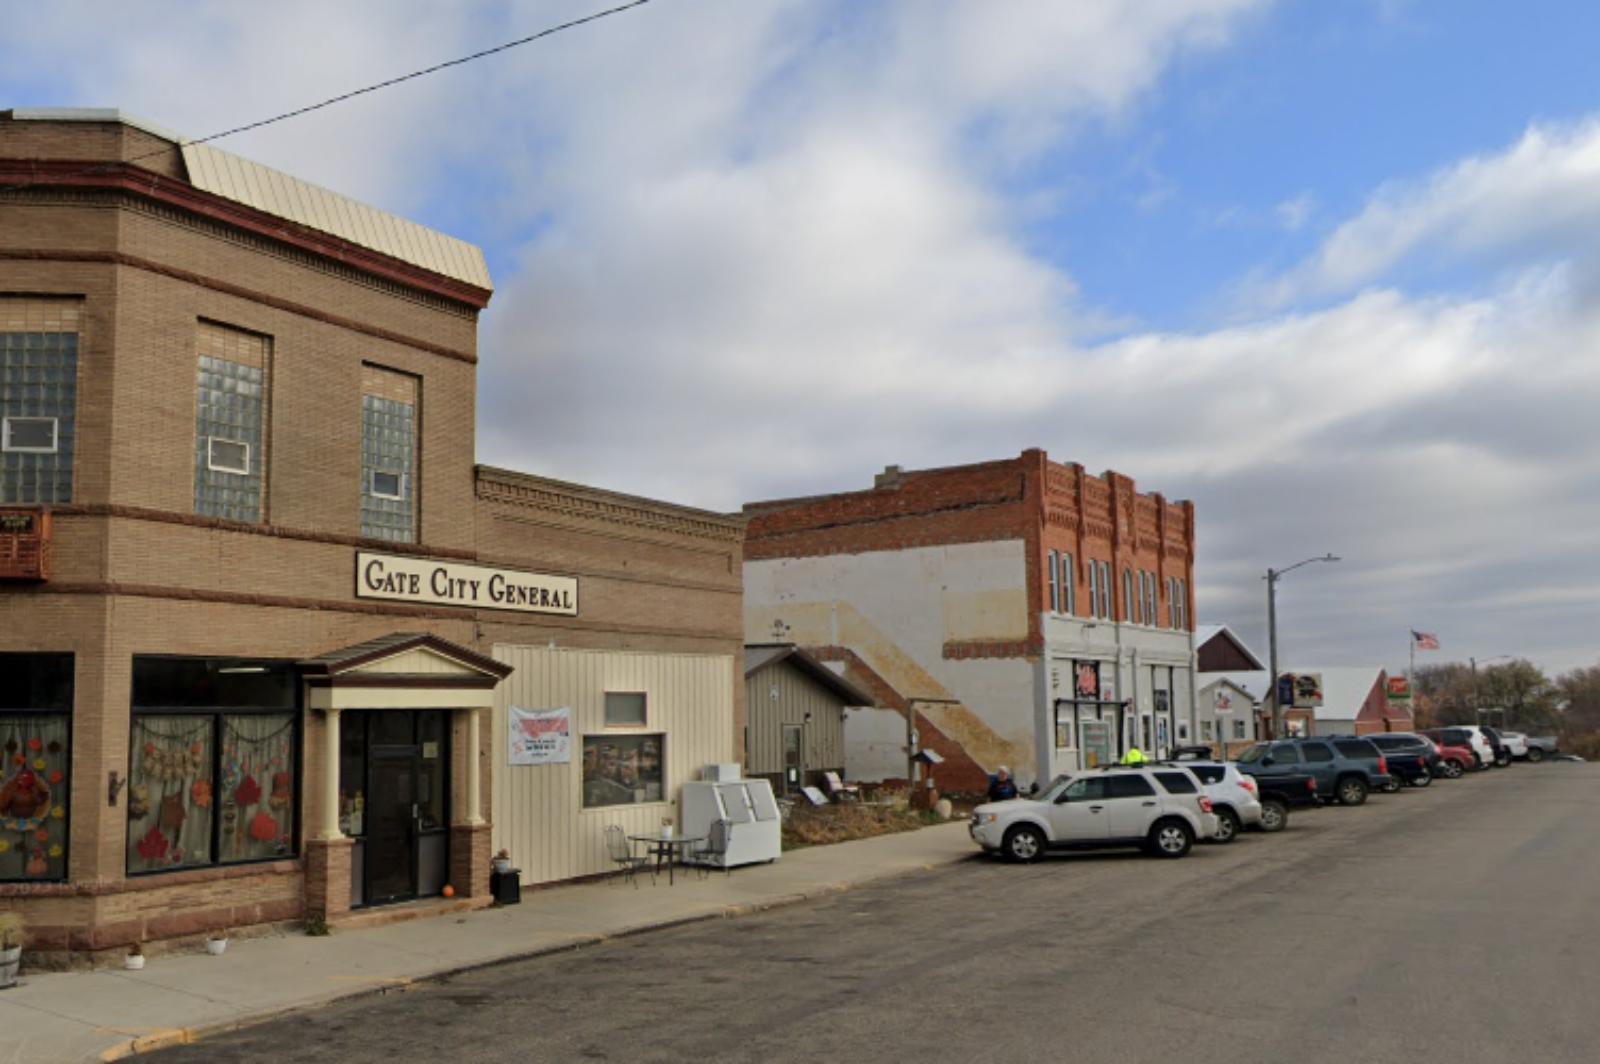
Gary, South Dakota lies on the very eastern edge of the state, butted up against Minnesota in Deuel County, positioned in the glacial lakes region high on the Coteau Prairie. With a population of just 238 people, Gary is a small community that projects a big personality, known throughout the area as a place to relax and have a good time. The town holds historical significance as one of the first settlements in Dakota Territory, where the railroad first entered the territory in 1872.
The economy of Gary employs 98 people, with the largest industries being Construction , Health Care & Social Assistance, and Manufacturing. The community’s median household income of $49,375 and low poverty rate of 8.8% reflect economic stability despite its small size. Gary’s diverse local economy ranges from farming and ranching to trucking and wind generation, creating a varied economic base for such a small community.
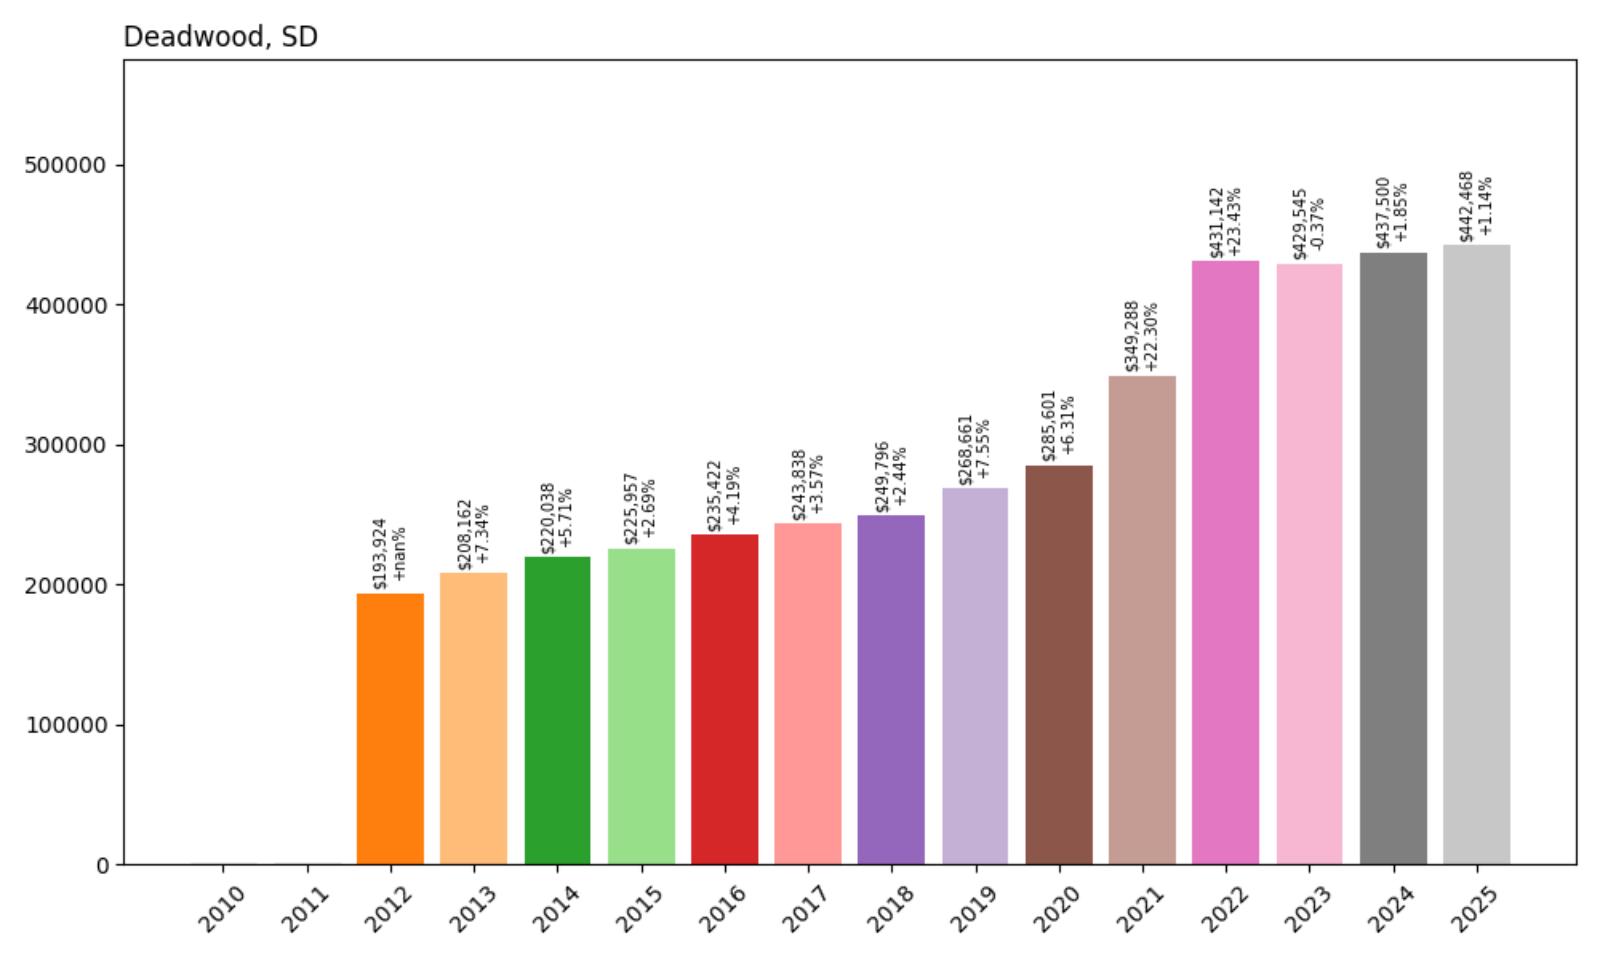
14. Deadwood – 128.3% Home Price Increase Since 2012
- 2010: N/A
- 2011: N/A
- 2012: $193,924
- 2013: $208,162 (+$14,238, +7.34% from previous year)
- 2014: $220,038 (+$11,876, +5.71% from previous year)
- 2015: $225,957 (+$5,919, +2.69% from previous year)
- 2016: $235,422 (+$9,465, +4.19% from previous year)
- 2017: $243,838 (+$8,415, +3.57% from previous year)
- 2018: $249,796 (+$5,958, +2.44% from previous year)
- 2019: $268,661 (+$18,866, +7.55% from previous year)
- 2020: $285,601 (+$16,940, +6.31% from previous year)
- 2021: $349,288 (+$63,687, +22.30% from previous year)
- 2022: $431,142 (+$81,854, +23.43% from previous year)
- 2023: $429,545 (−$1,597, −0.37% from previous year)
- 2024: $437,500 (+$7,955, +1.85% from previous year)
- 2025: $442,468 (+$4,967, +1.14% from previous year)
Deadwood maintained consistent appreciation through 2020 before experiencing dramatic pandemic-era growth, with values increasing 51% over two years (2021-2022). The massive 23.43% increase in 2022 represents exceptional market performance for this historic community. Current values at $442,468 more than double the 2012 baseline, reflecting the town’s transformation into a premium Black Hills destination.
Deadwood – Historic Gaming Capital
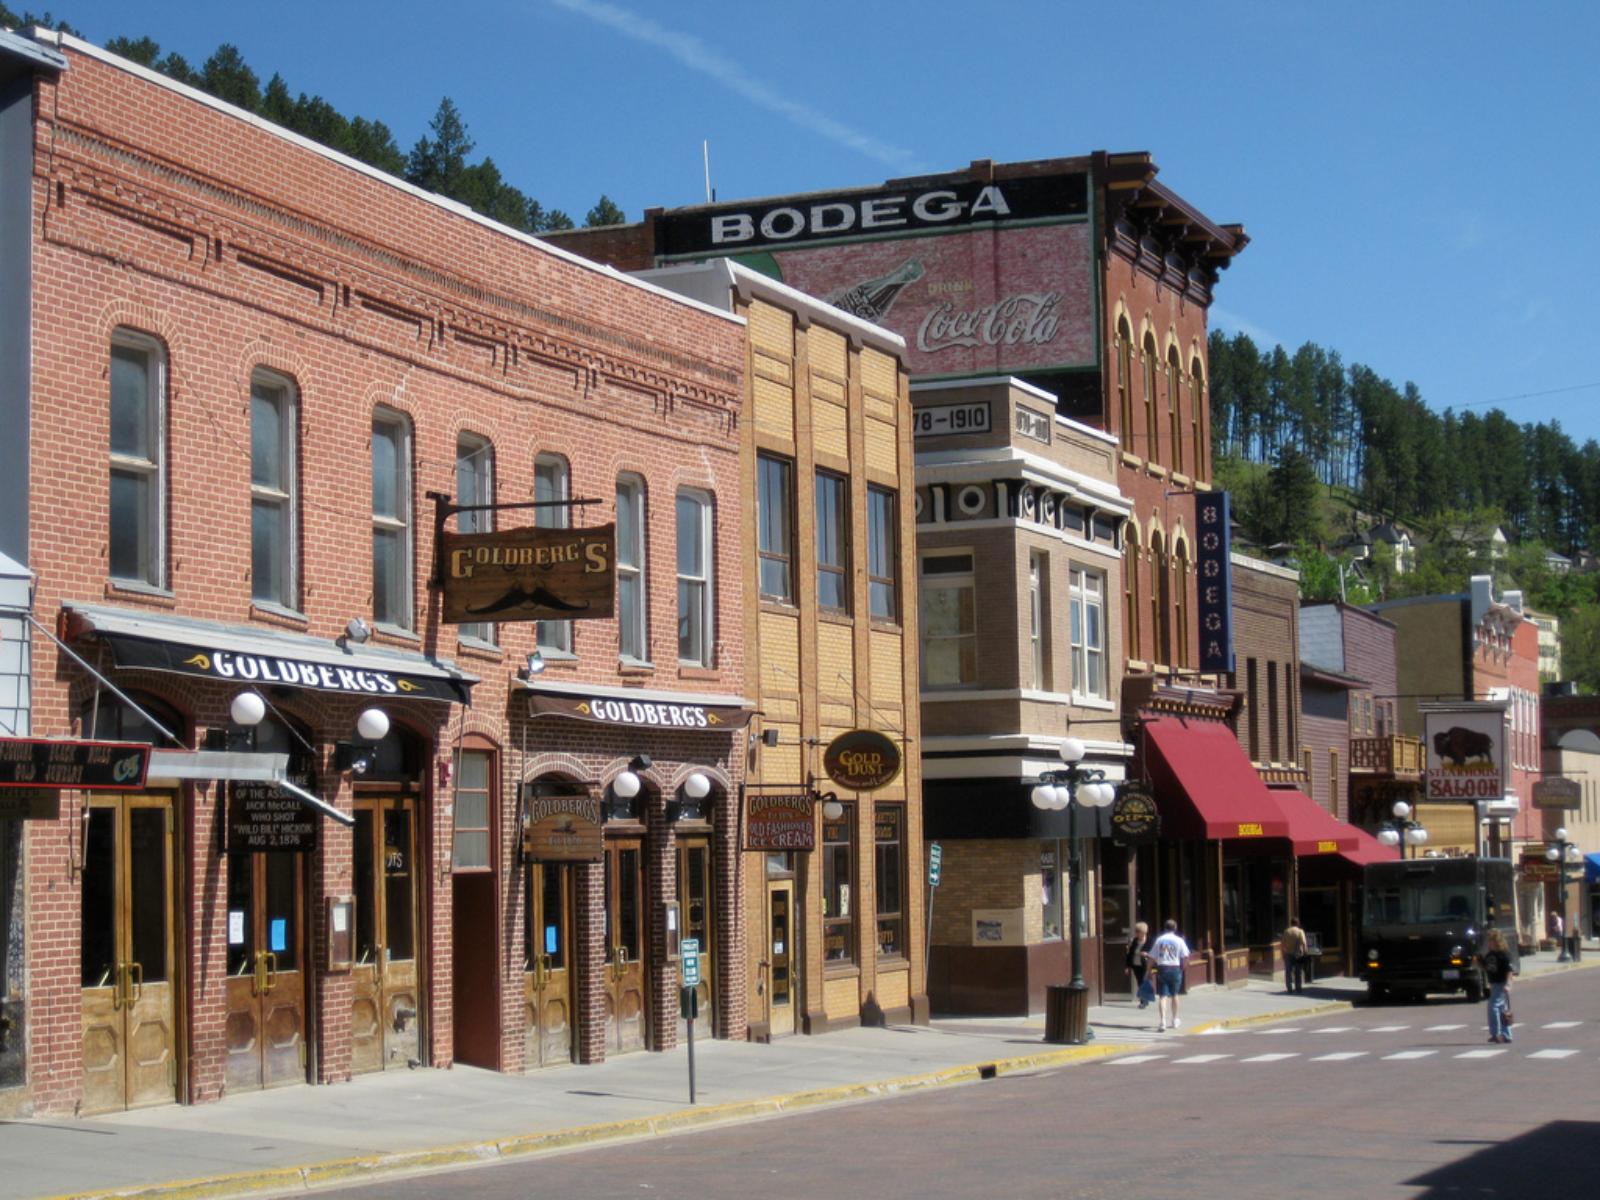
Deadwood holds a legendary place in American history as one of the most famous frontier towns of the Old West, where Wild Bill Hickok met his end and fortunes were made and lost in gold mines and gambling halls. Today, this National Historic Landmark city has successfully transformed its Wild West heritage into a thriving tourism and gaming economy, creating unique real estate opportunities in the heart of the Black Hills.
Recent price appreciation reflects growing recognition of Deadwood as both a tourist destination and desirable place to live in the Black Hills region. The community’s unique character, combined with access to outdoor recreation and proximity to other Black Hills attractions, has created sustained demand for residential properties. Deadwood’s successful balance of historic preservation and economic development positions it as a premium market within the Black Hills real estate landscape.
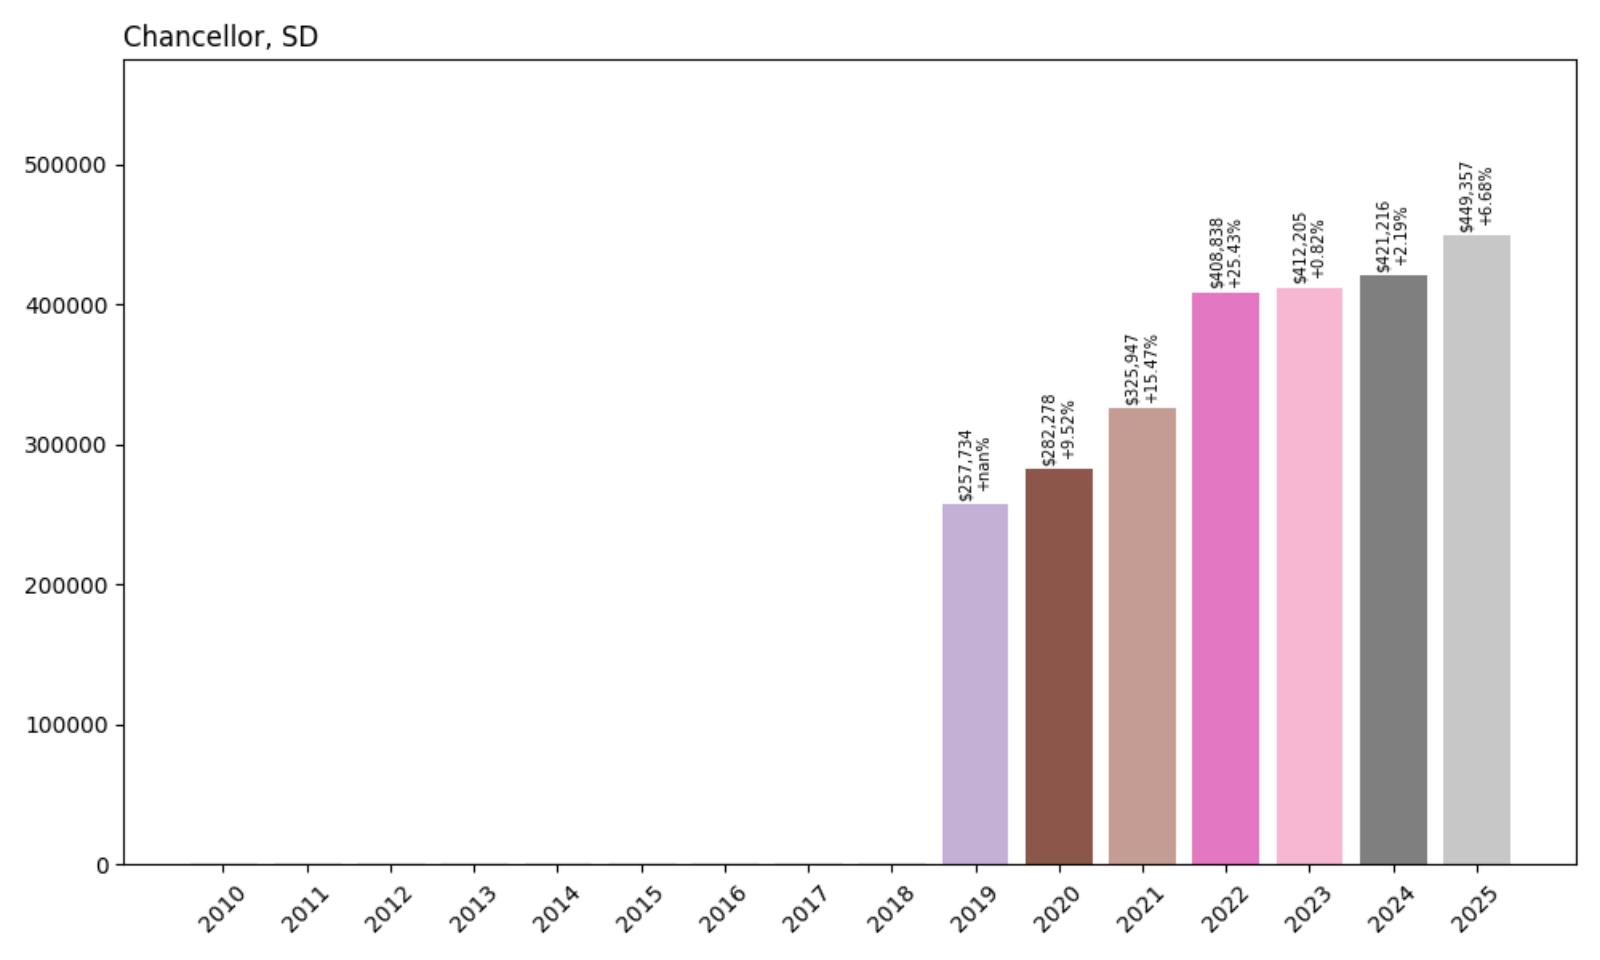
13. Chancellor – 74.5% Home Price Increase Since 2019
- 2010: N/A
- 2011: N/A
- 2012: N/A
- 2013: N/A
- 2014: N/A
- 2015: N/A
- 2016: N/A
- 2017: N/A
- 2018: N/A
- 2019: $257,734
- 2020: $282,278 (+$24,545, +9.52% from previous year)
- 2021: $325,947 (+$43,669, +15.47% from previous year)
- 2022: $408,838 (+$82,891, +25.43% from previous year)
- 2023: $412,205 (+$3,367, +0.82% from previous year)
- 2024: $421,216 (+$9,011, +2.19% from previous year)
- 2025: $449,357 (+$28,141, +6.68% from previous year)
Chancellor has experienced remarkable appreciation since tracking began in 2019, with the most dramatic growth occurring during 2021-2022 when prices increased 46% over two years. The exceptional 25.43% increase in 2022 represents one of the highest single-year gains in the dataset. Strong continued growth in 2025 with a 6.68% increase suggests sustained demand and market momentum in this Turner County community.
Chancellor – Southeastern Growth Story
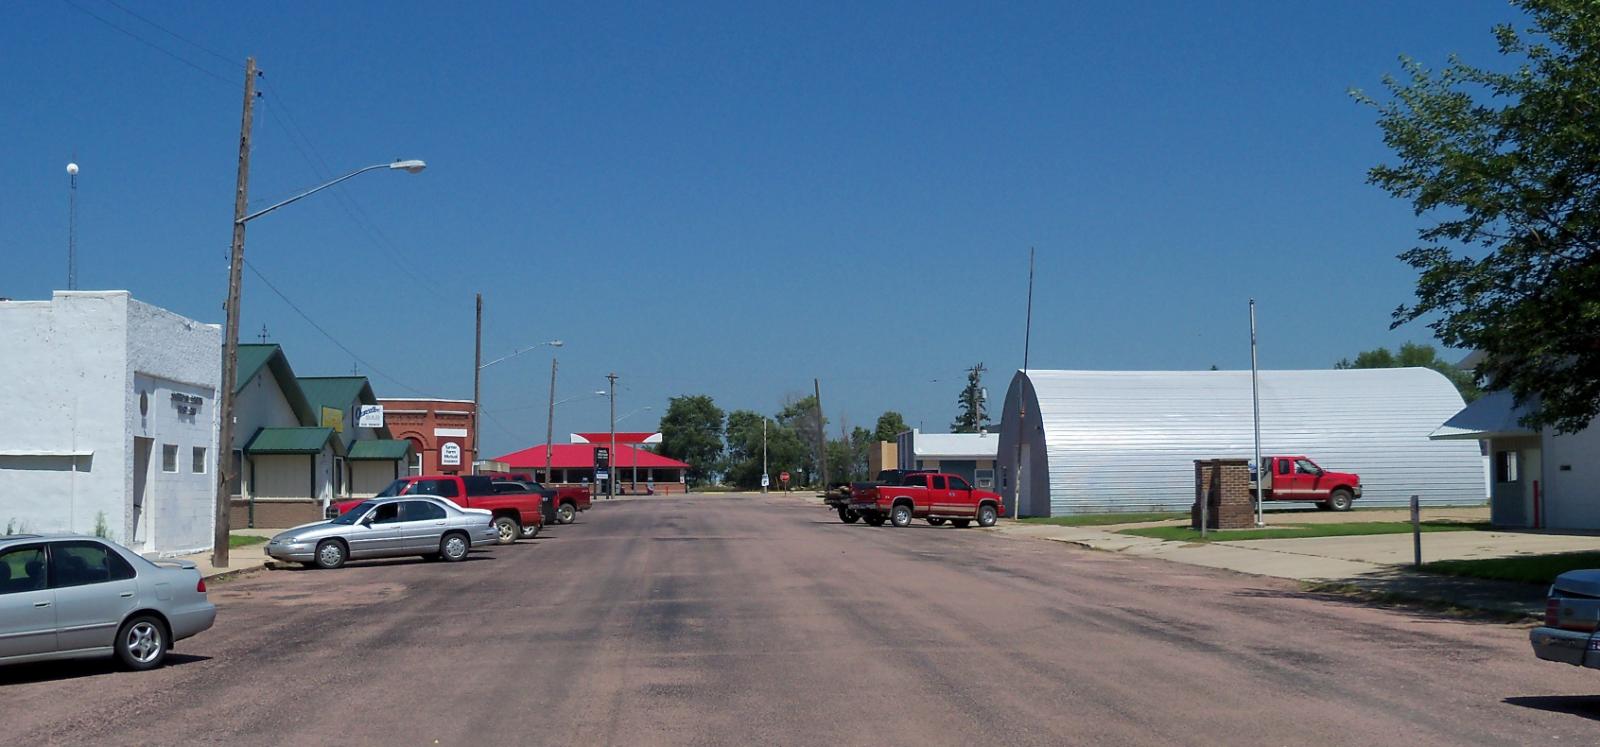
Chancellor represents the growing appeal of smaller communities in southeastern South Dakota, where agricultural heritage meets modern residential development. Located in Turner County, this community has benefited from its position within commuting distance of larger regional centers while maintaining the character and affordability that attract families seeking small-town living with access to regional amenities.
The community’s dramatic price appreciation reflects broader trends affecting southeastern South Dakota, where population growth and economic development have created increased demand for residential properties. Chancellor’s location provides access to regional employment opportunities while offering the space, community connections, and quality of life that define rural South Dakota living.
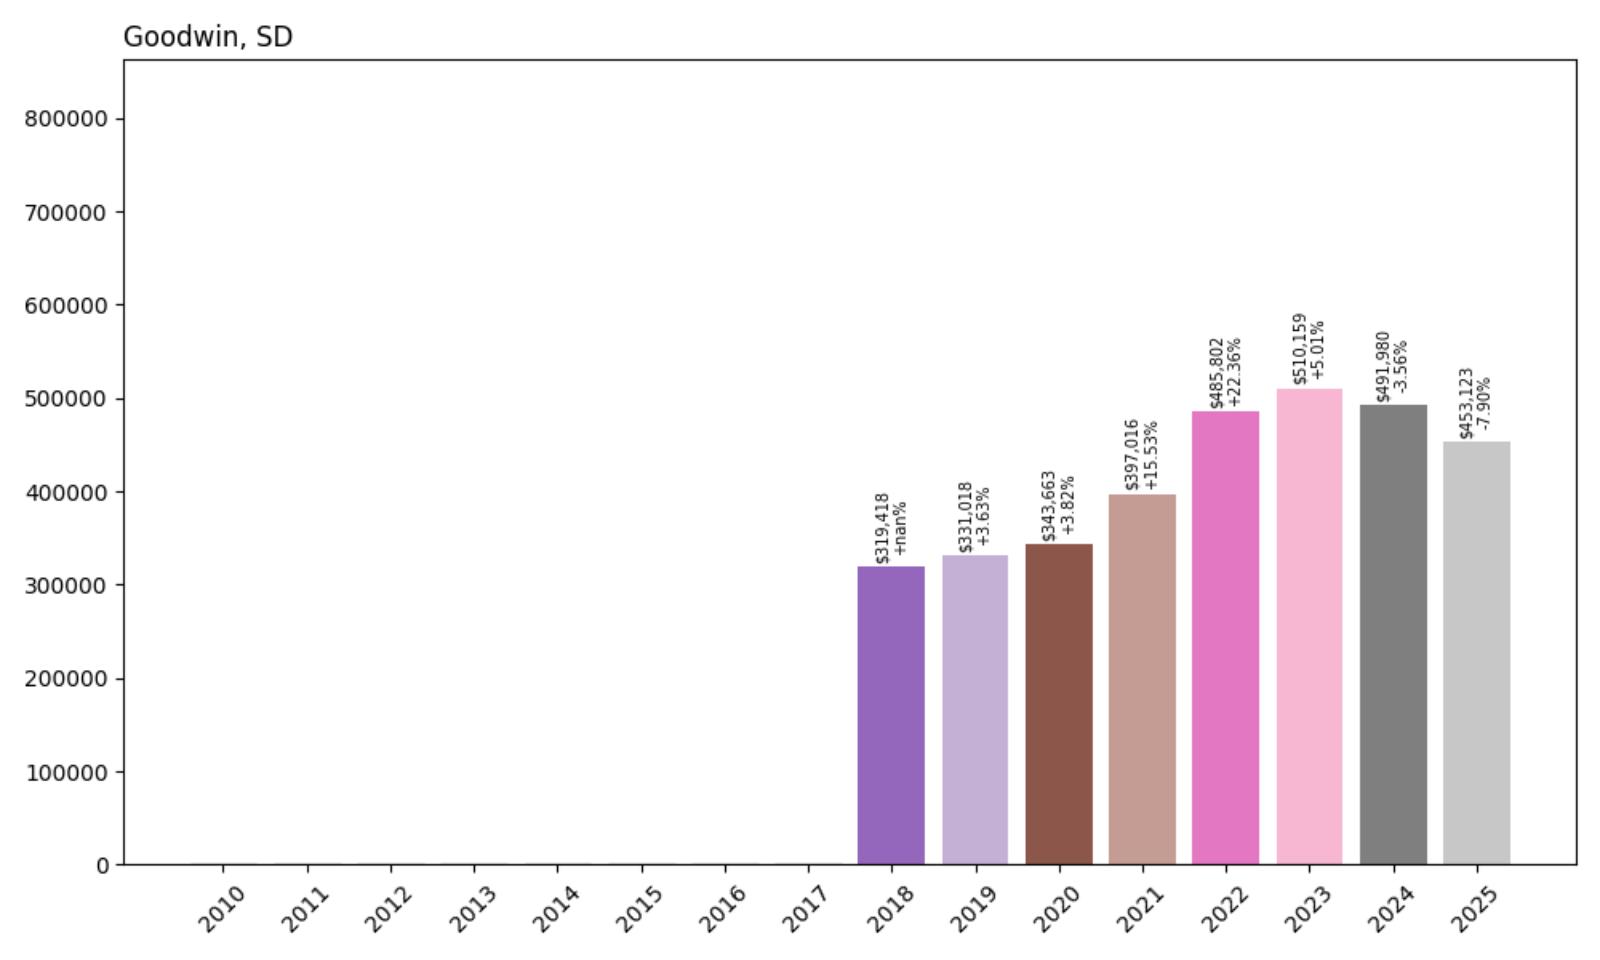
12. Goodwin – 41.3% Home Price Increase Since 2018
- 2010: N/A
- 2011: N/A
- 2012: N/A
- 2013: N/A
- 2014: N/A
- 2015: N/A
- 2016: N/A
- 2017: N/A
- 2018: $319,418
- 2019: $331,018 (+$11,600, +3.63% from previous year)
- 2020: $343,663 (+$12,644, +3.82% from previous year)
- 2021: $397,016 (+$53,354, +15.53% from previous year)
- 2022: $485,802 (+$88,785, +22.36% from previous year)
- 2023: $510,159 (+$24,357, +5.01% from previous year)
- 2024: $491,980 (−$18,179, −3.56% from previous year)
- 2025: $453,123 (−$38,857, −7.90% from previous year)
Goodwin demonstrated steady growth through 2020 before experiencing significant pandemic-era appreciation, with prices increasing 41% over two years (2021-2022). The market peaked in 2023 at over $510,000 before experiencing recent corrections, though current values still represent substantial appreciation from the 2018 baseline. The recent declines suggest market adjustment after rapid appreciation exceeded local fundamentals.
Goodwin – Market Adjustment Period
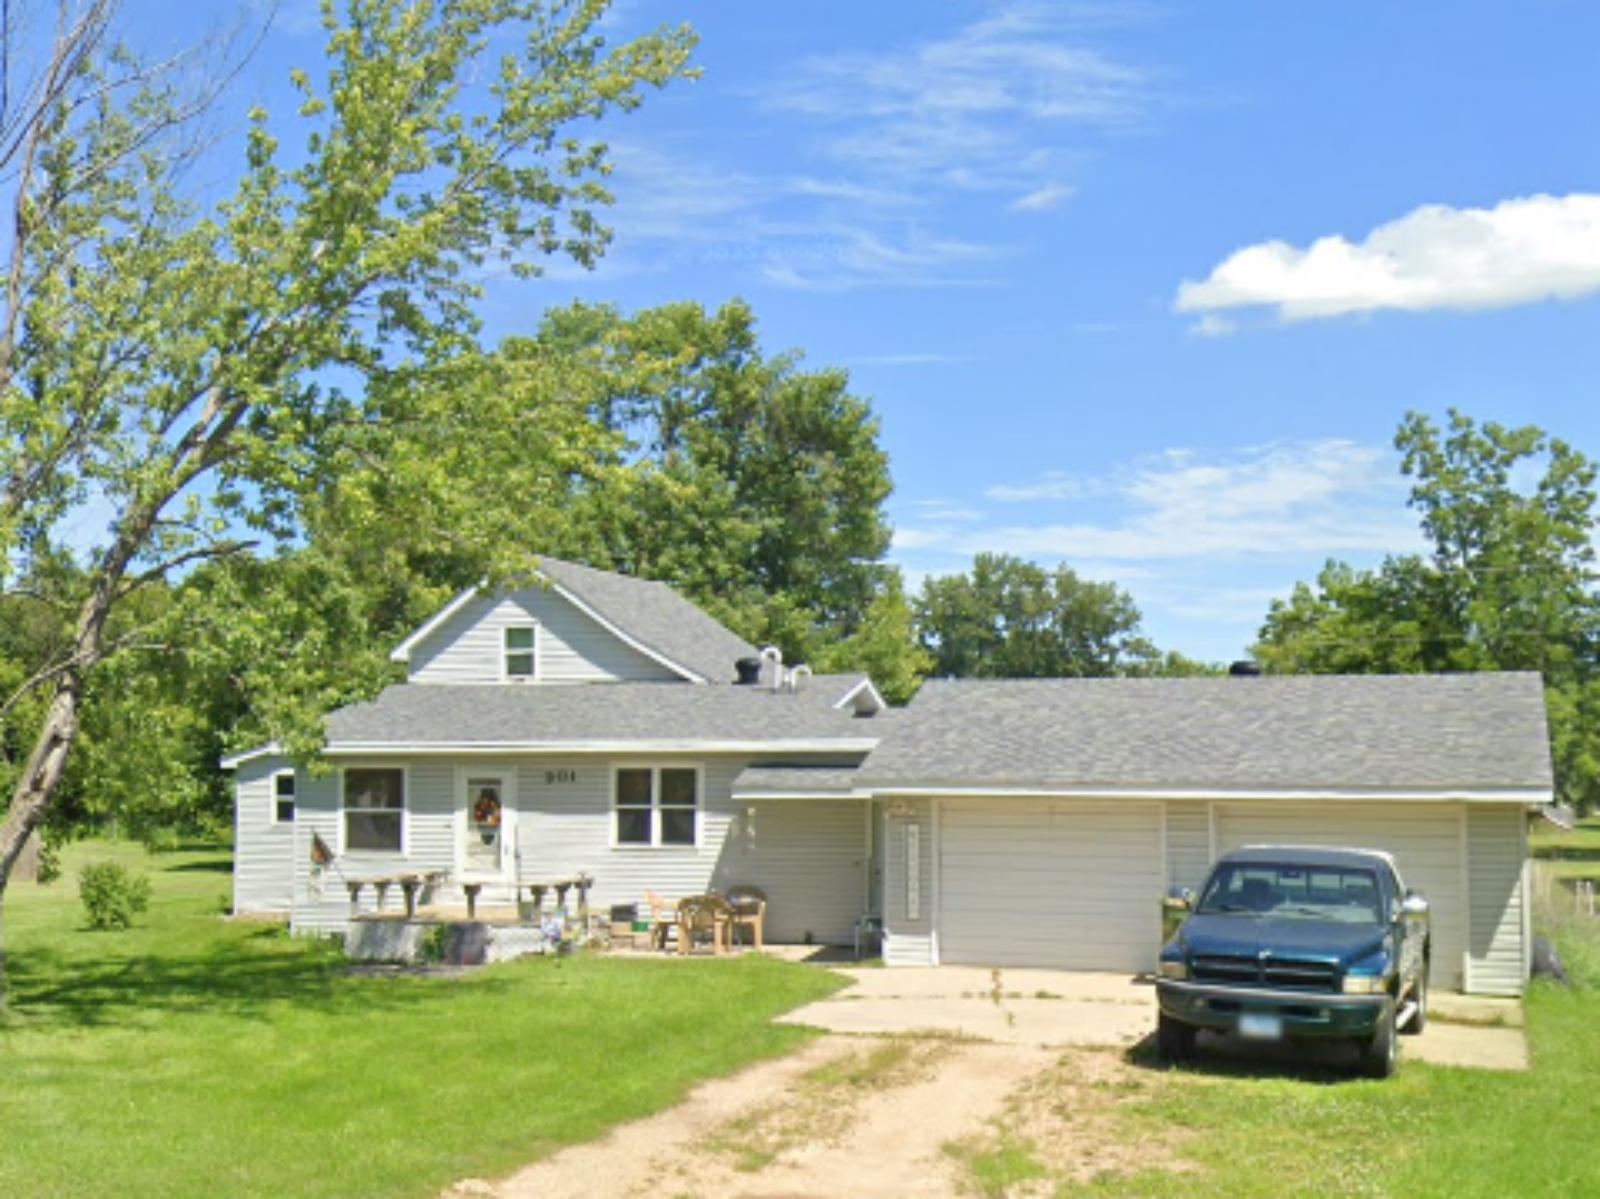
Goodwin represents the volatility that can affect smaller South Dakota real estate markets when rapid appreciation encounters local economic limitations. Located in Deuel County, this small community experienced dramatic price growth during the pandemic era that pushed values to levels requiring subsequent market adjustment to align with local economic fundamentals.
Despite recent declines, Goodwin’s current values remain well above pre-pandemic levels, suggesting some fundamental appreciation has occurred alongside speculative excess. The community’s longer-term prospects depend on its ability to attract residents and economic activity that can support sustainable property values aligned with the broader regional real estate market.
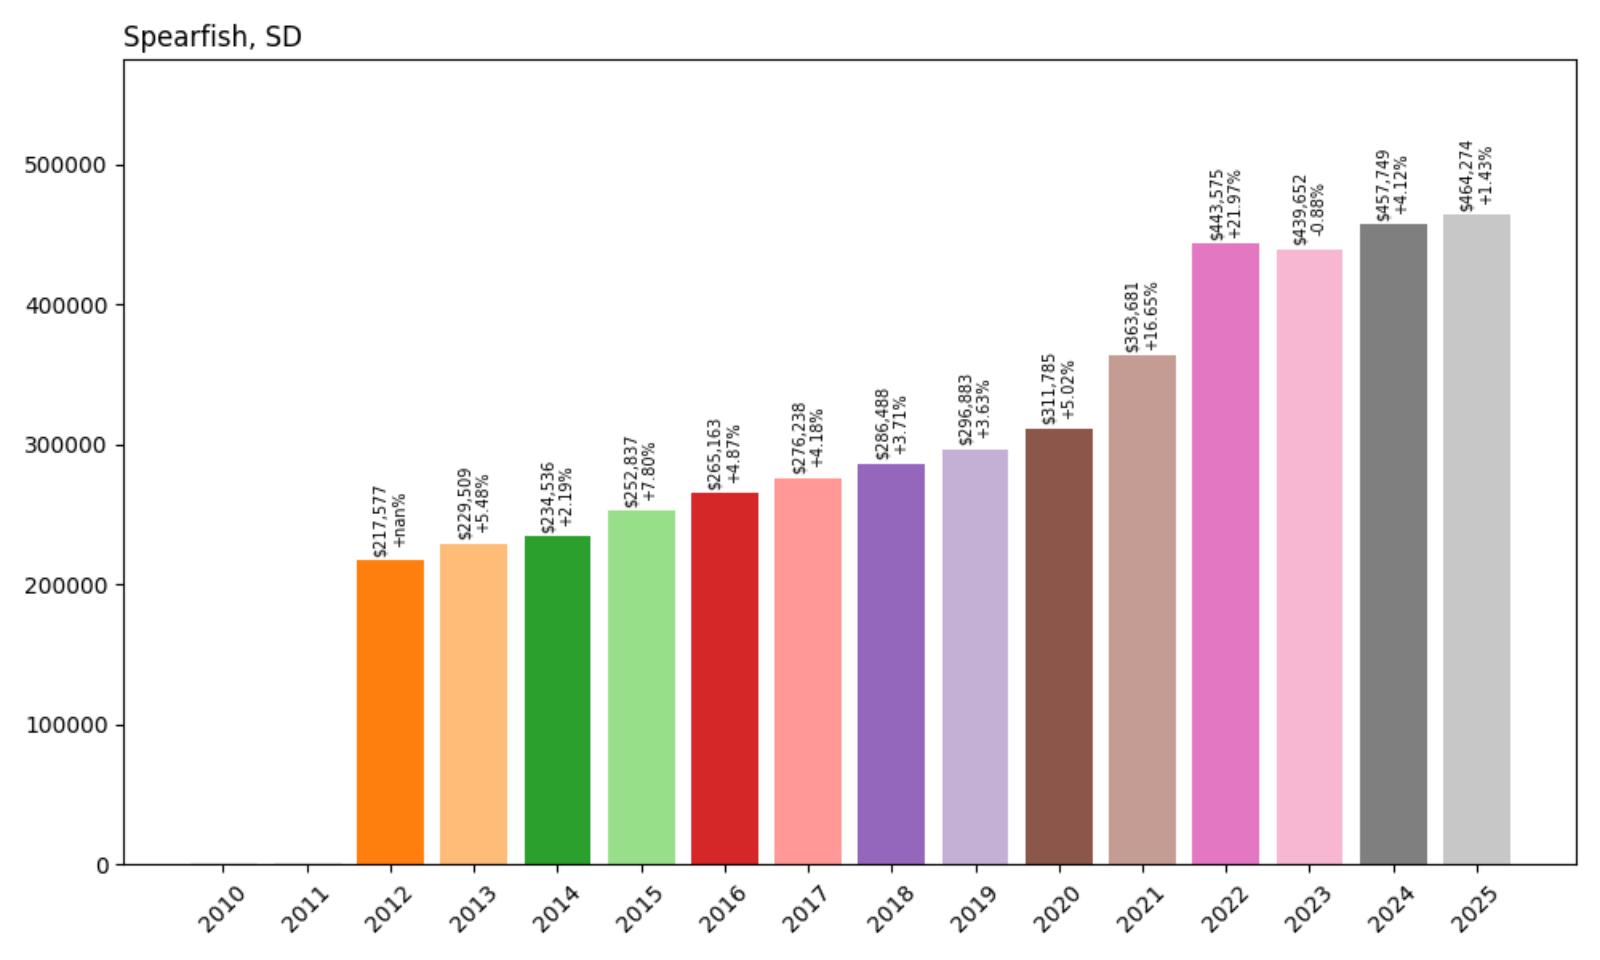
11. Spearfish – 113.4% Home Price Increase Since 2012
- 2010: N/A
- 2011: N/A
- 2012: $217,577
- 2013: $229,509 (+$11,932, +5.48% from previous year)
- 2014: $234,536 (+$5,028, +2.19% from previous year)
- 2015: $252,837 (+$18,301, +7.80% from previous year)
- 2016: $265,163 (+$12,325, +4.87% from previous year)
- 2017: $276,238 (+$11,075, +4.18% from previous year)
- 2018: $286,488 (+$10,251, +3.71% from previous year)
- 2019: $296,883 (+$10,395, +3.63% from previous year)
- 2020: $311,785 (+$14,902, +5.02% from previous year)
- 2021: $363,681 (+$51,897, +16.65% from previous year)
- 2022: $443,575 (+$79,894, +21.97% from previous year)
- 2023: $439,652 (−$3,923, −0.88% from previous year)
- 2024: $457,749 (+$18,097, +4.12% from previous year)
- 2025: $464,274 (+$6,525, +1.43% from previous year)
Spearfish maintained remarkably consistent appreciation through 2020, averaging over 4% annually for nearly a decade before experiencing significant pandemic-era acceleration. The community saw dramatic growth during 2021-2022, with prices increasing 42% over two years. After brief stabilization in 2023, the market has resumed upward momentum with current values more than doubling since 2012.
Spearfish – Northern Black Hills University Town
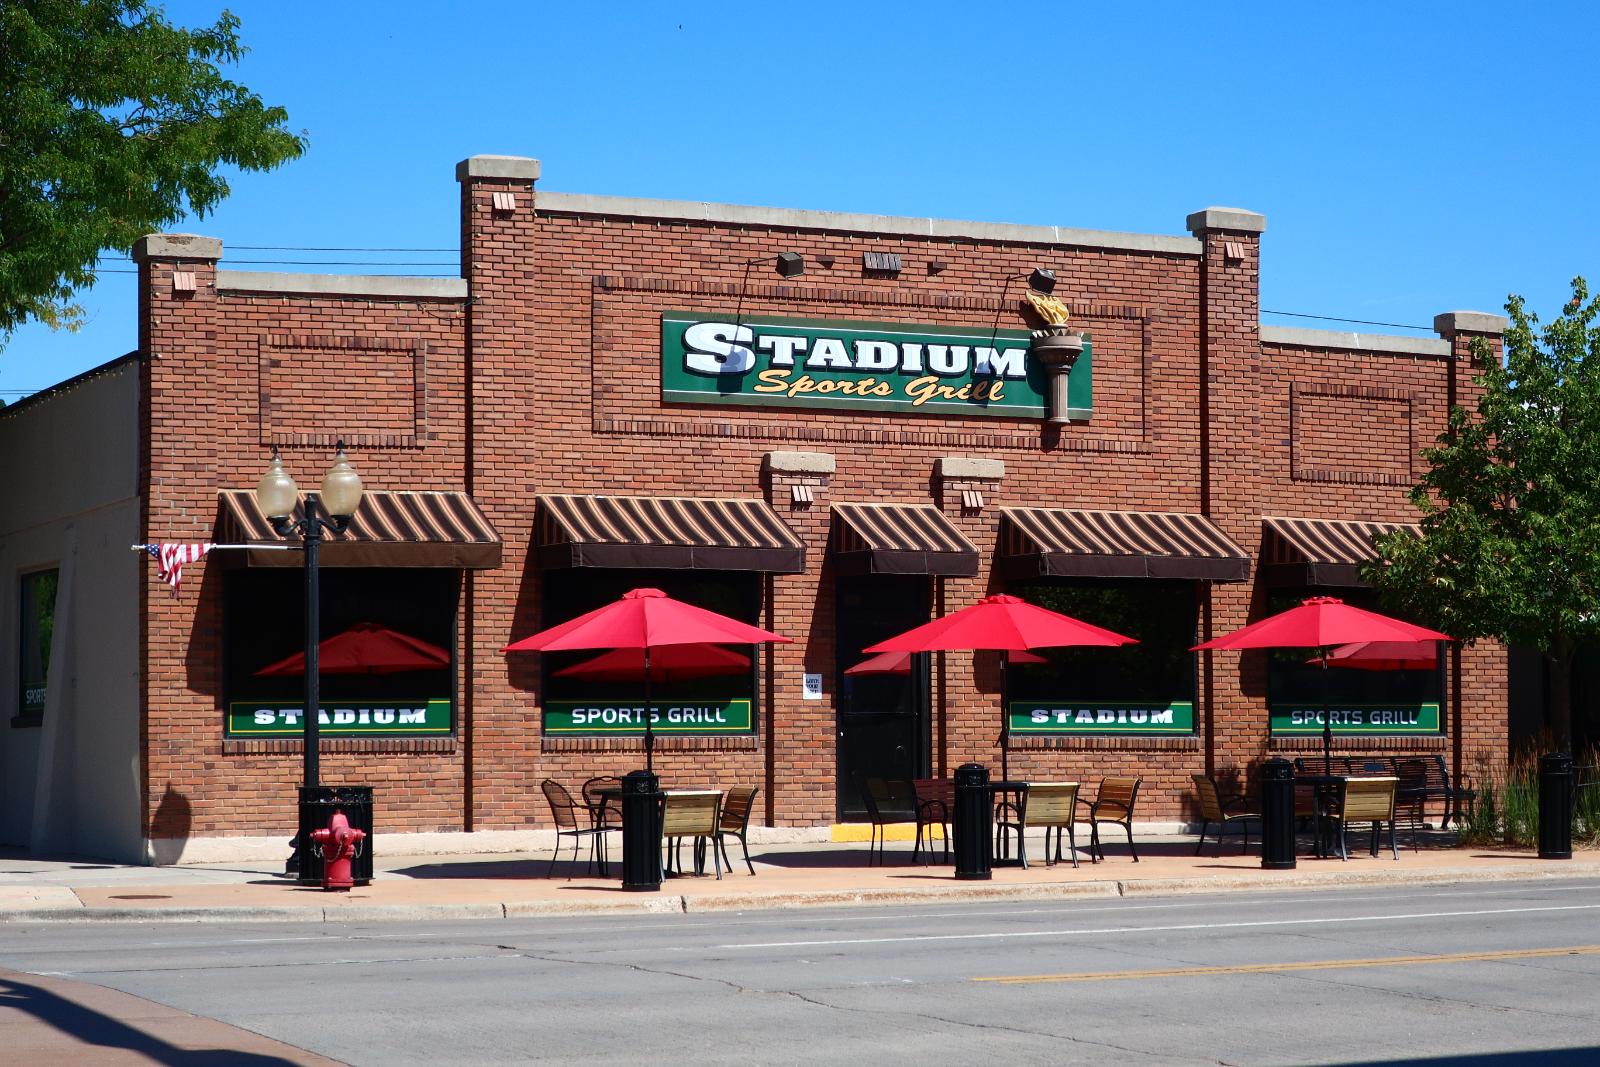
Spearfish combines the appeal of a university town with the natural beauty of the northern Black Hills, creating a unique residential market that attracts both families and students. Home to Black Hills State University, the community benefits from the economic stability and cultural amenities that come with higher education while offering residents access to world-class outdoor recreation in nearby Spearfish Canyon and the surrounding Black Hills.
The town’s economy benefits from both the university presence and growing tourism industry, with Spearfish Canyon attracting visitors for its scenic beauty, waterfalls, and recreational opportunities. This economic diversity, combined with the community’s natural setting and cultural amenities, has created sustained demand for residential properties that supports consistent appreciation over time.
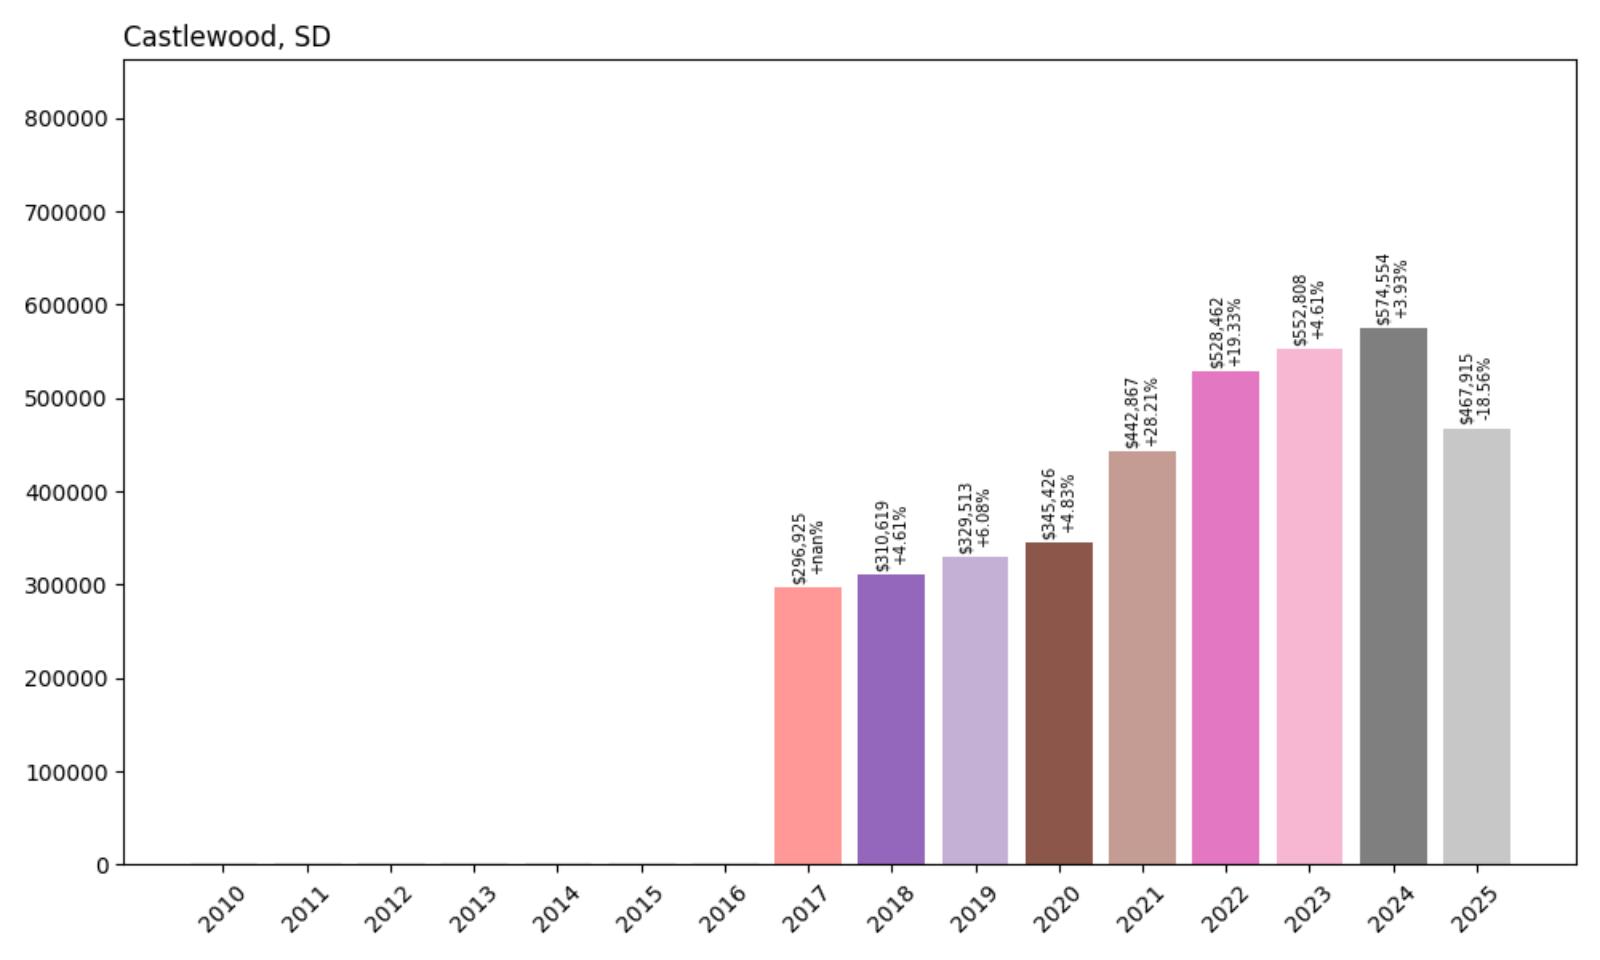
10. Castlewood – 57.6% Home Price Increase Since 2017
Would you like to save this?
- 2010: N/A
- 2011: N/A
- 2012: N/A
- 2013: N/A
- 2014: N/A
- 2015: N/A
- 2016: N/A
- 2017: $296,925
- 2018: $310,619 (+$13,694, +4.61% from previous year)
- 2019: $329,513 (+$18,894, +6.08% from previous year)
- 2020: $345,426 (+$15,913, +4.83% from previous year)
- 2021: $442,867 (+$97,441, +28.21% from previous year)
- 2022: $528,462 (+$85,595, +19.33% from previous year)
- 2023: $552,808 (+$24,345, +4.61% from previous year)
- 2024: $574,554 (+$21,746, +3.93% from previous year)
- 2025: $467,915 (−$106,639, −18.56% from previous year)
Castlewood maintained steady growth through 2020 before experiencing explosive pandemic-era appreciation, with prices increasing 53% over two years (2021-2022). The market peaked in 2024 at over $574,000 before experiencing a significant correction in 2025, though current values still represent substantial appreciation from the 2017 baseline. The recent decline suggests market adjustment after rapid appreciation exceeded sustainable levels.
Castlewood – Hamlin County Hub
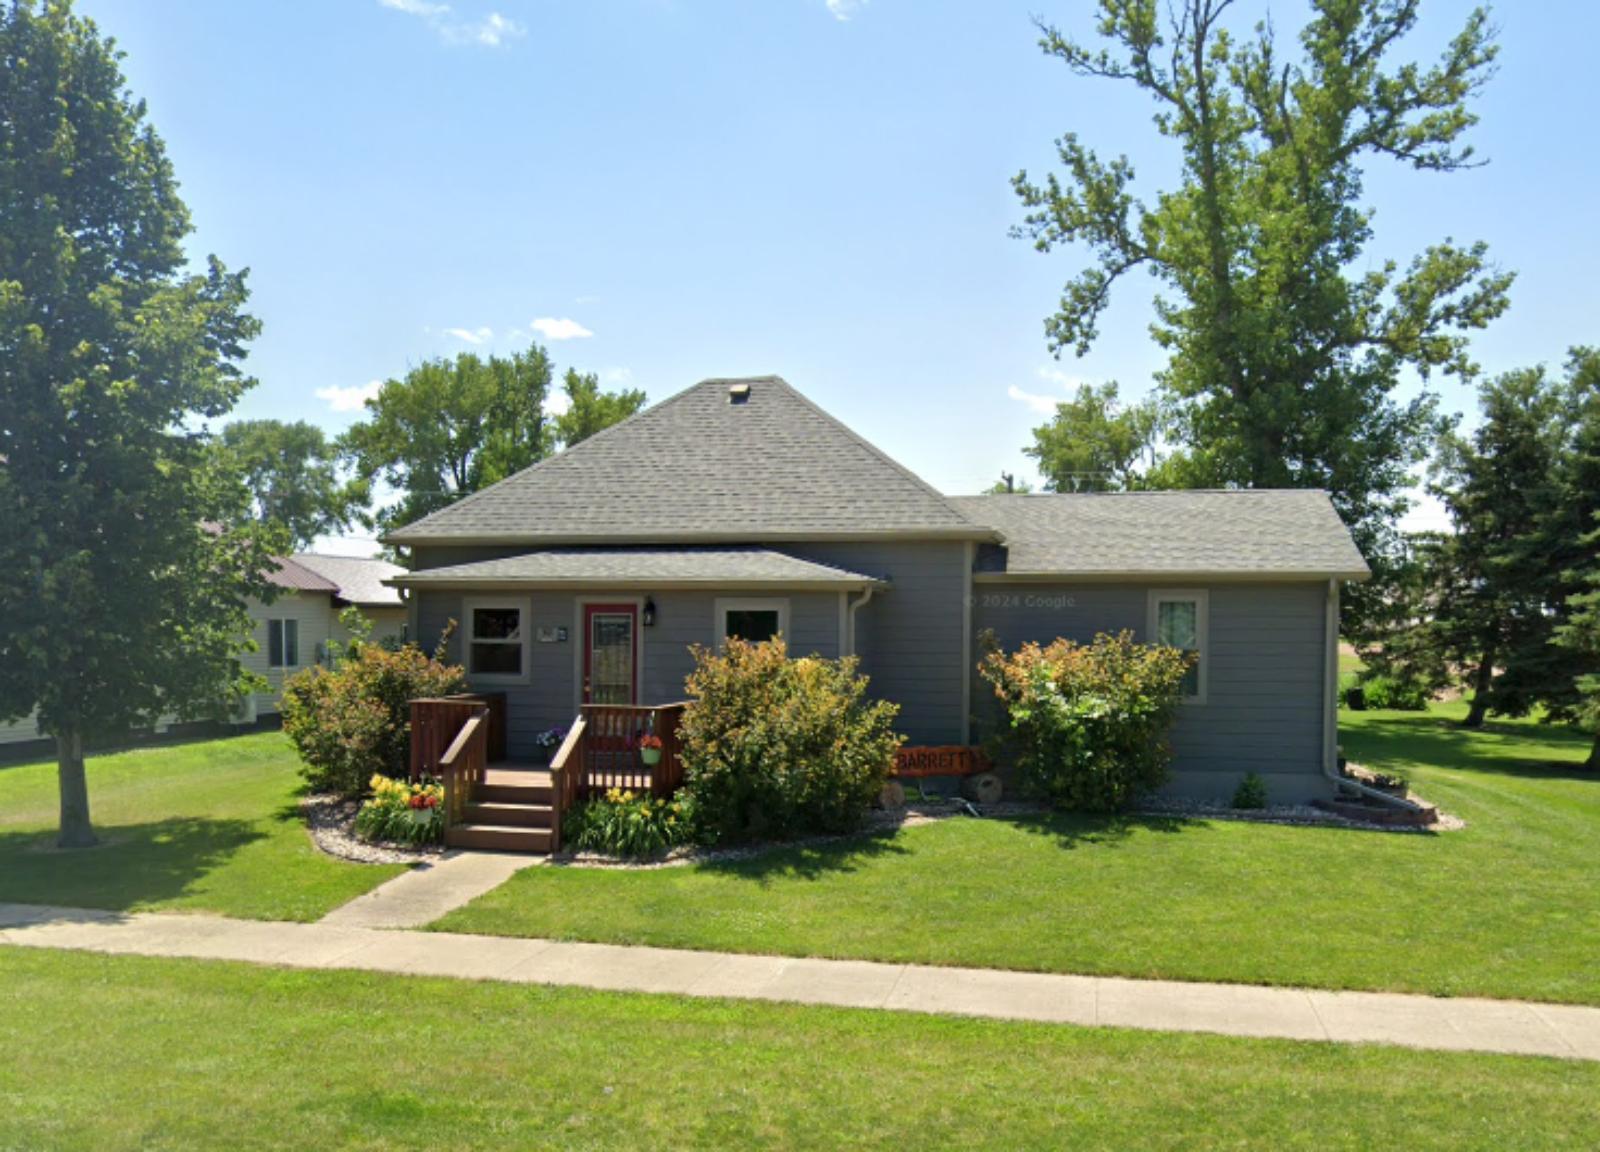
Castlewood is a city in Hamlin County with a population of 712, located along the Big Sioux River as part of the Watertown Micropolitan Statistical Area. The city was platted in 1881 when the railroad was extended to that point and named after a place mentioned in the 1857 novel The Virginians by William Makepeace Thackeray. The community boasts a median household income of $87,768 and a remarkably low poverty rate of just 3.04%.
The recent market correction reflects the volatility that can affect smaller communities when rapid appreciation outpaces local economic fundamentals. Despite the 2025 decline, Castlewood’s current values remain well above pre-pandemic levels, and the community’s strong economic indicators and quality of life amenities suggest potential for future stability as the market adjusts to sustainable levels.
9. Hill City – 115.3% Home Price Increase Since 2010
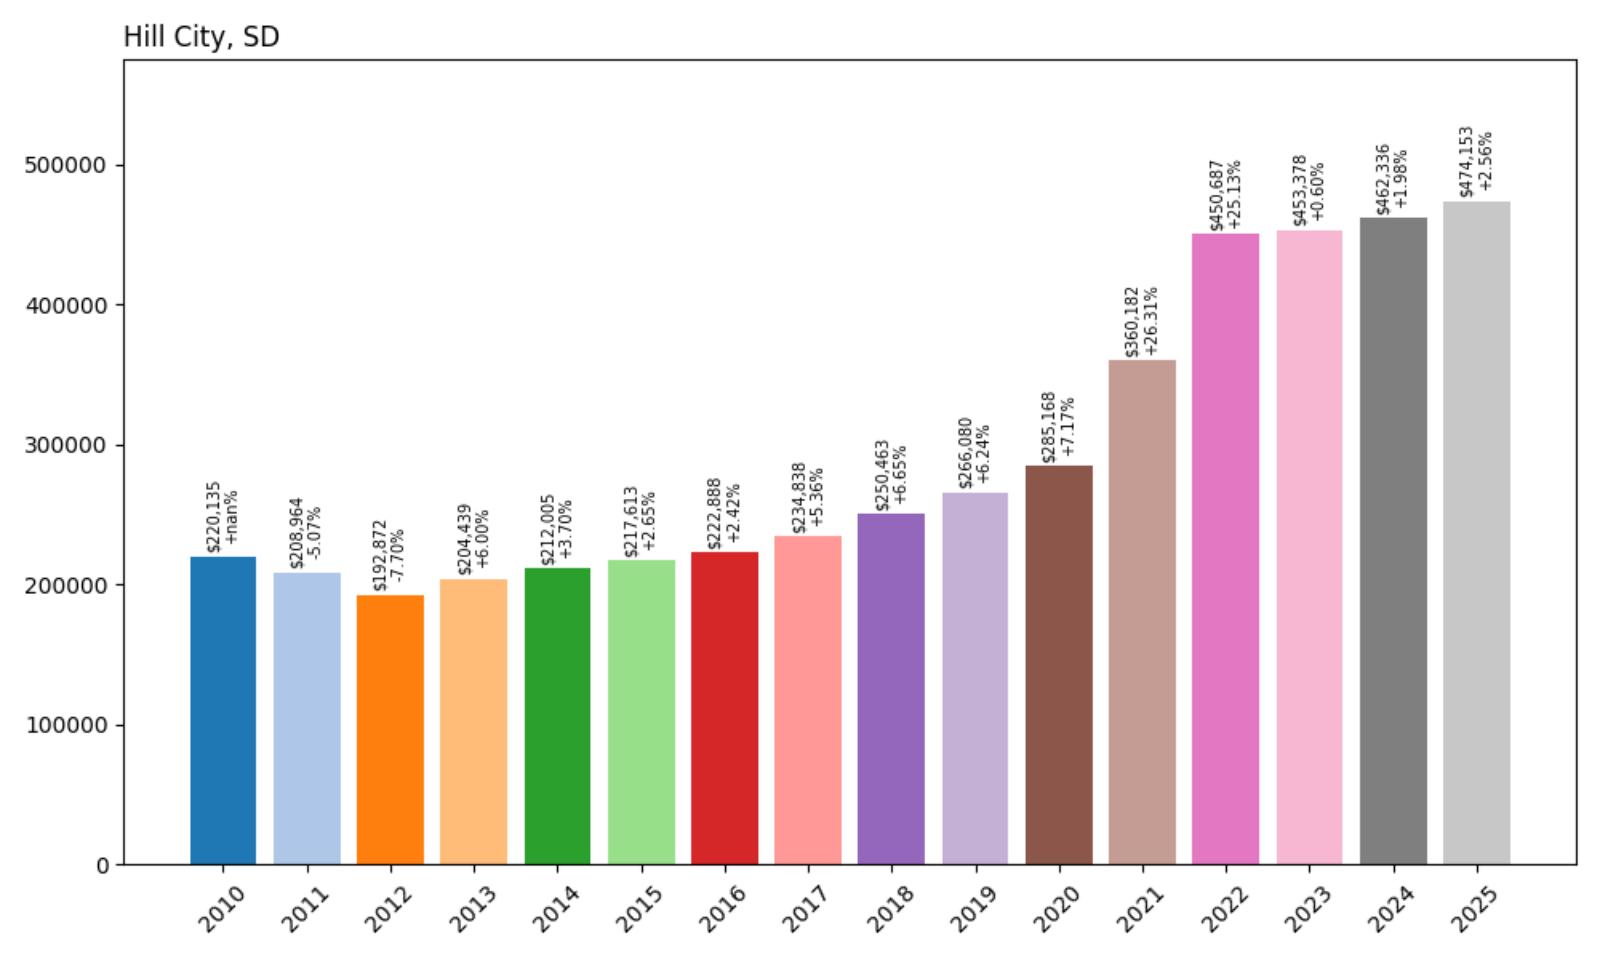
- 2010: $220,135
- 2011: $208,964 (−$11,171, −5.07% from previous year)
- 2012: $192,872 (−$16,091, −7.70% from previous year)
- 2013: $204,439 (+$11,567, +6.00% from previous year)
- 2014: $212,005 (+$7,566, +3.70% from previous year)
- 2015: $217,613 (+$5,608, +2.65% from previous year)
- 2016: $222,888 (+$5,275, +2.42% from previous year)
- 2017: $234,838 (+$11,950, +5.36% from previous year)
- 2018: $250,463 (+$15,625, +6.65% from previous year)
- 2019: $266,080 (+$15,617, +6.24% from previous year)
- 2020: $285,168 (+$19,087, +7.17% from previous year)
- 2021: $360,182 (+$75,014, +26.31% from previous year)
- 2022: $450,687 (+$90,505, +25.13% from previous year)
- 2023: $453,378 (+$2,691, +0.60% from previous year)
- 2024: $462,336 (+$8,959, +1.98% from previous year)
- 2025: $474,153 (+$11,816, +2.56% from previous year)
Hill City experienced initial decline through 2012 before establishing consistent upward momentum that culminated in dramatic pandemic-era growth. The community saw remarkable appreciation of 58% over two years (2021-2022), with values more than doubling since the 2010 baseline. The market has stabilized with continued modest growth, demonstrating strong fundamental demand in this Black Hills community.
Hill City – Heart of the Black Hills

Hill City occupies a central position in the Black Hills region, serving as both a gateway to outdoor recreation and a hub for the area’s tourism economy. The community is famous as the home of the Black Hills Central Railroad, which operates historic steam trains to Keystone, providing a major tourist attraction that supports the local economy year-round.
Recent market performance reflects growing recognition of Hill City as a premier Black Hills residential destination. The community’s central location, recreational opportunities, and tourism-supported economy have created a real estate market that commands premium prices while offering the authentic Black Hills lifestyle that attracts buyers seeking mountain living with small-town amenities.
8. Custer – 167.6% Home Price Increase Since 2011
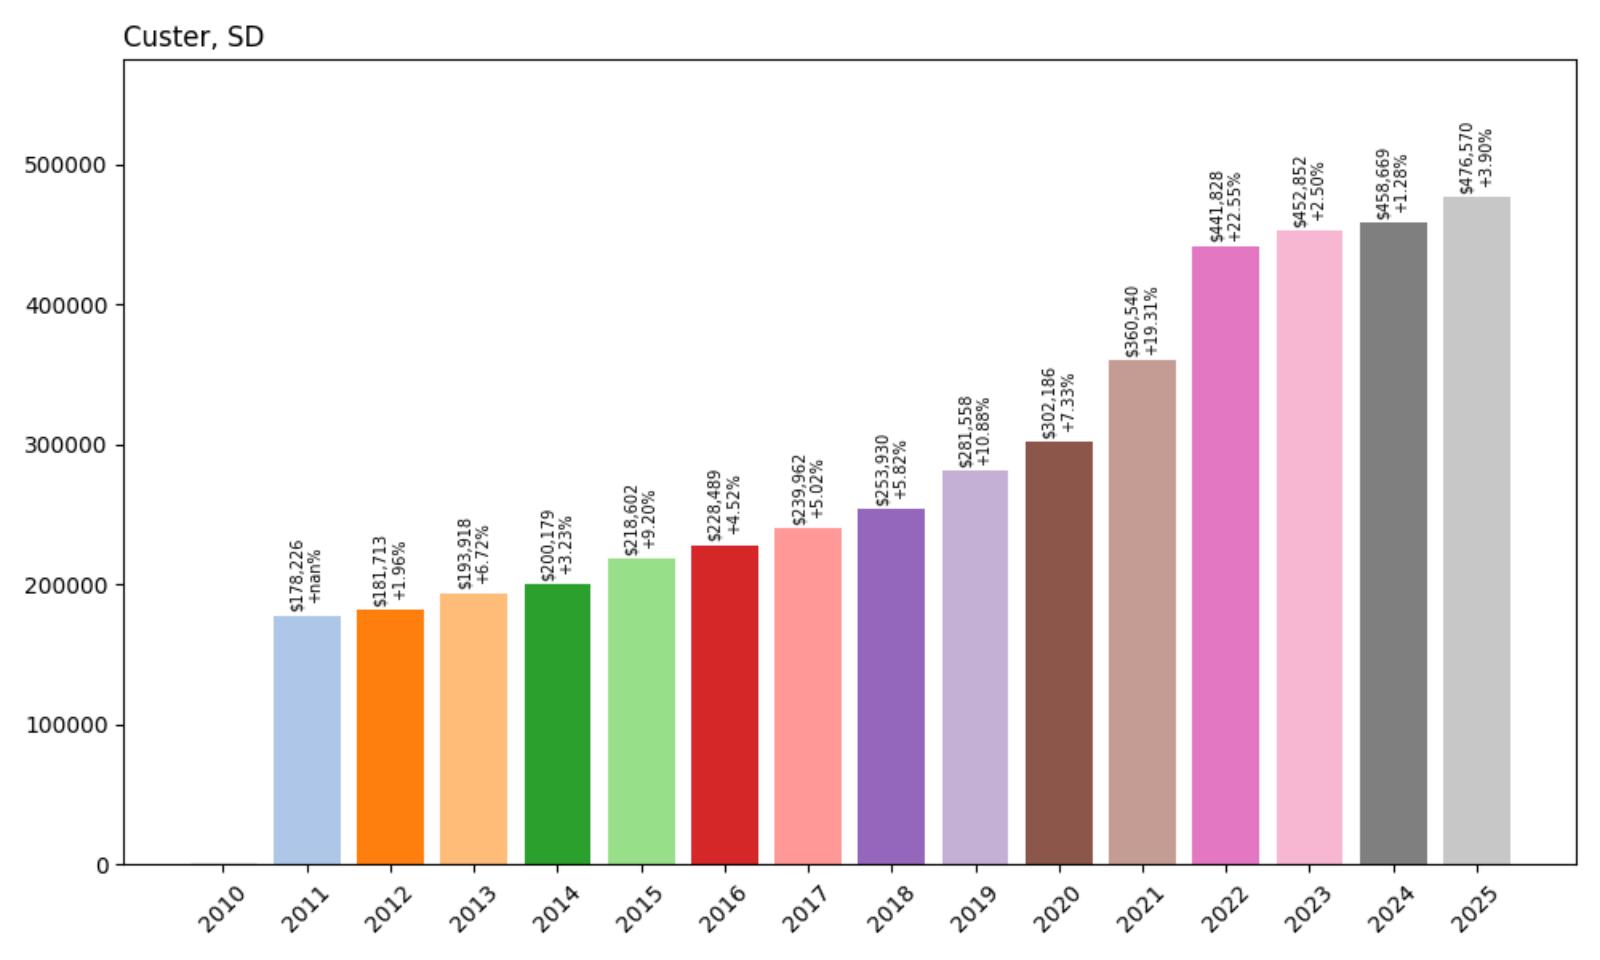
- 2010: N/A
- 2011: $178,226
- 2012: $181,713 (+$3,487, +1.96% from previous year)
- 2013: $193,918 (+$12,205, +6.72% from previous year)
- 2014: $200,179 (+$6,261, +3.23% from previous year)
- 2015: $218,602 (+$18,422, +9.20% from previous year)
- 2016: $228,489 (+$9,888, +4.52% from previous year)
- 2017: $239,962 (+$11,472, +5.02% from previous year)
- 2018: $253,930 (+$13,968, +5.82% from previous year)
- 2019: $281,558 (+$27,628, +10.88% from previous year)
- 2020: $302,186 (+$20,628, +7.33% from previous year)
- 2021: $360,540 (+$58,354, +19.31% from previous year)
- 2022: $441,828 (+$81,289, +22.55% from previous year)
- 2023: $452,852 (+$11,024, +2.50% from previous year)
- 2024: $458,669 (+$5,817, +1.28% from previous year)
- 2025: $476,570 (+$17,902, +3.90% from previous year)
Custer demonstrated exceptional consistency over 14 years, with steady appreciation interrupted only by dramatic pandemic-era acceleration. The community maintained consistent annual gains through 2020 before experiencing explosive growth during 2021-2022, when prices increased 46% over two years. Current values represent a remarkable 168% increase from 2011, reflecting sustained demand for this historic Black Hills community.
Custer – Gateway to Natural Wonders
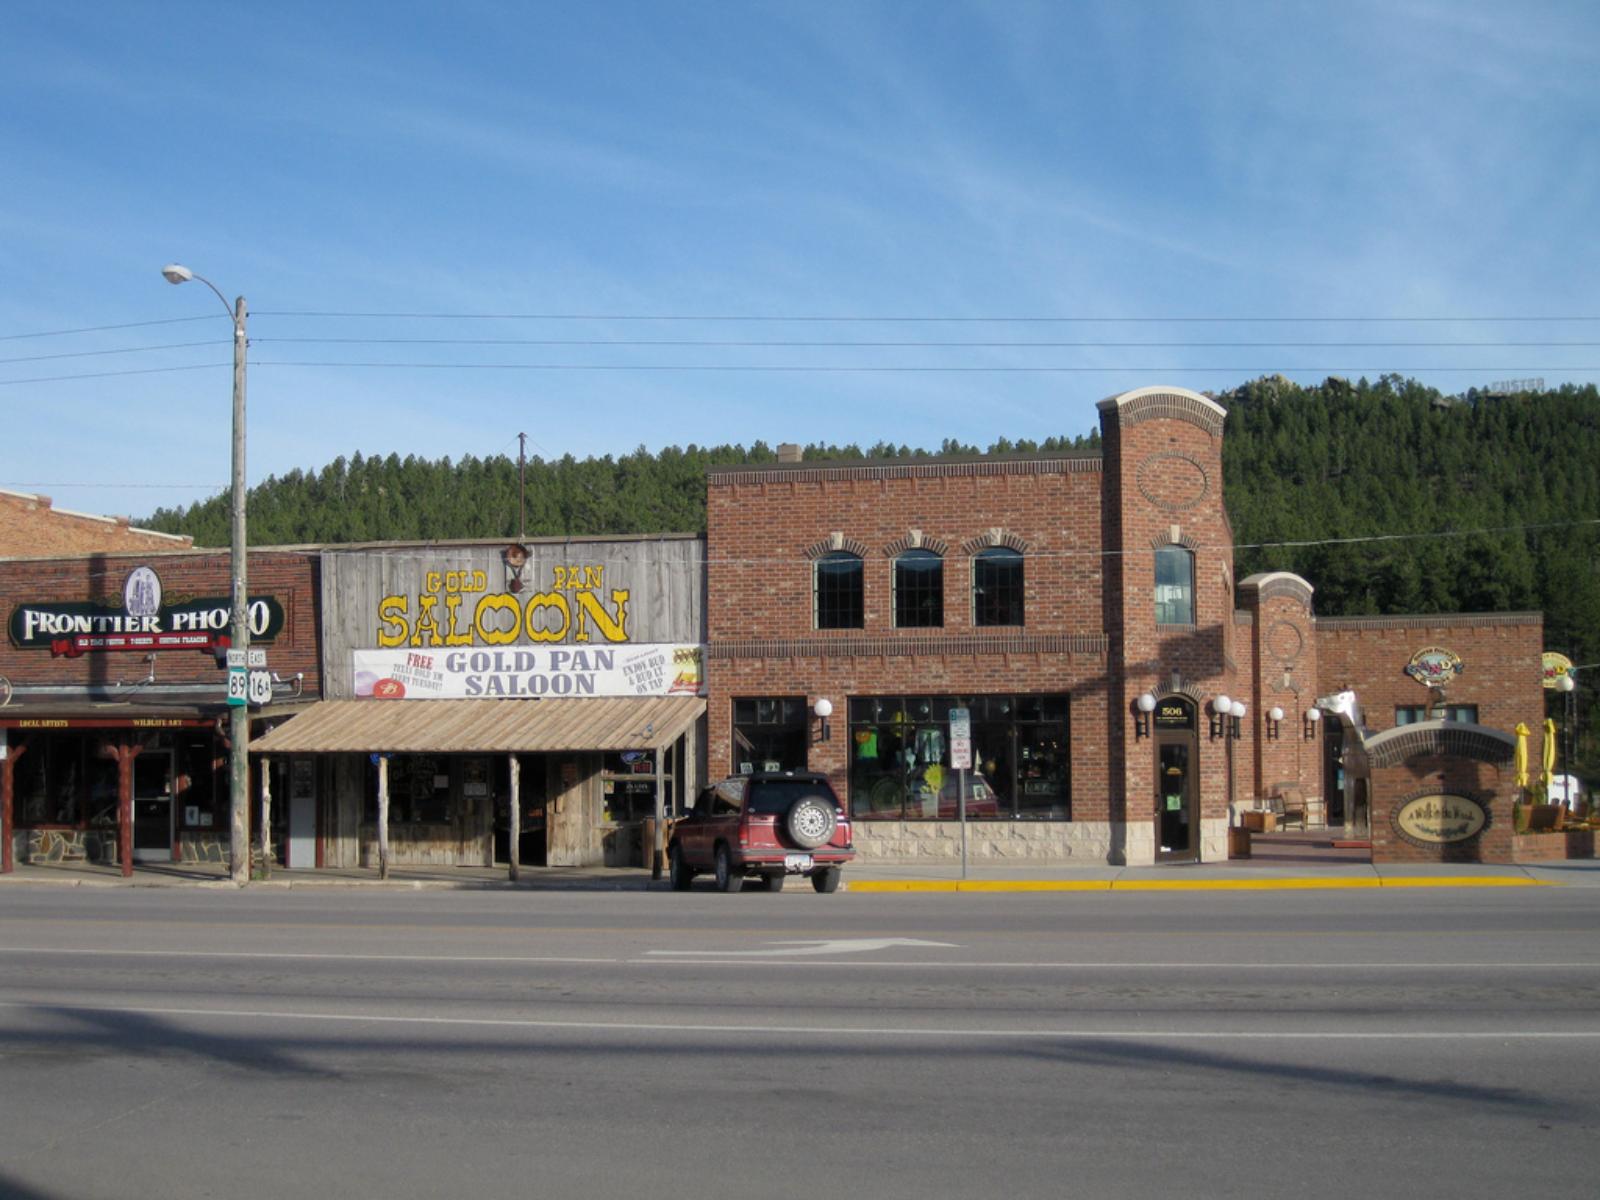
Custer holds a special place in Black Hills history as one of the region’s earliest settlements and the gateway to some of South Dakota’s most spectacular natural attractions. The community serves as the entrance to Custer State Park, one of the largest and most visited state parks in the United States, famous for its wildlife, scenic drives, and the annual buffalo roundup that draws visitors from around the world.
Recent price appreciation reflects growing recognition of Custer as both a tourist destination and desirable place to live in the Black Hills. The community’s access to world-class outdoor recreation, combined with its historic character and tourism-supported economy, has created a real estate market that attracts buyers seeking authentic Black Hills lifestyle with proximity to major natural attractions.
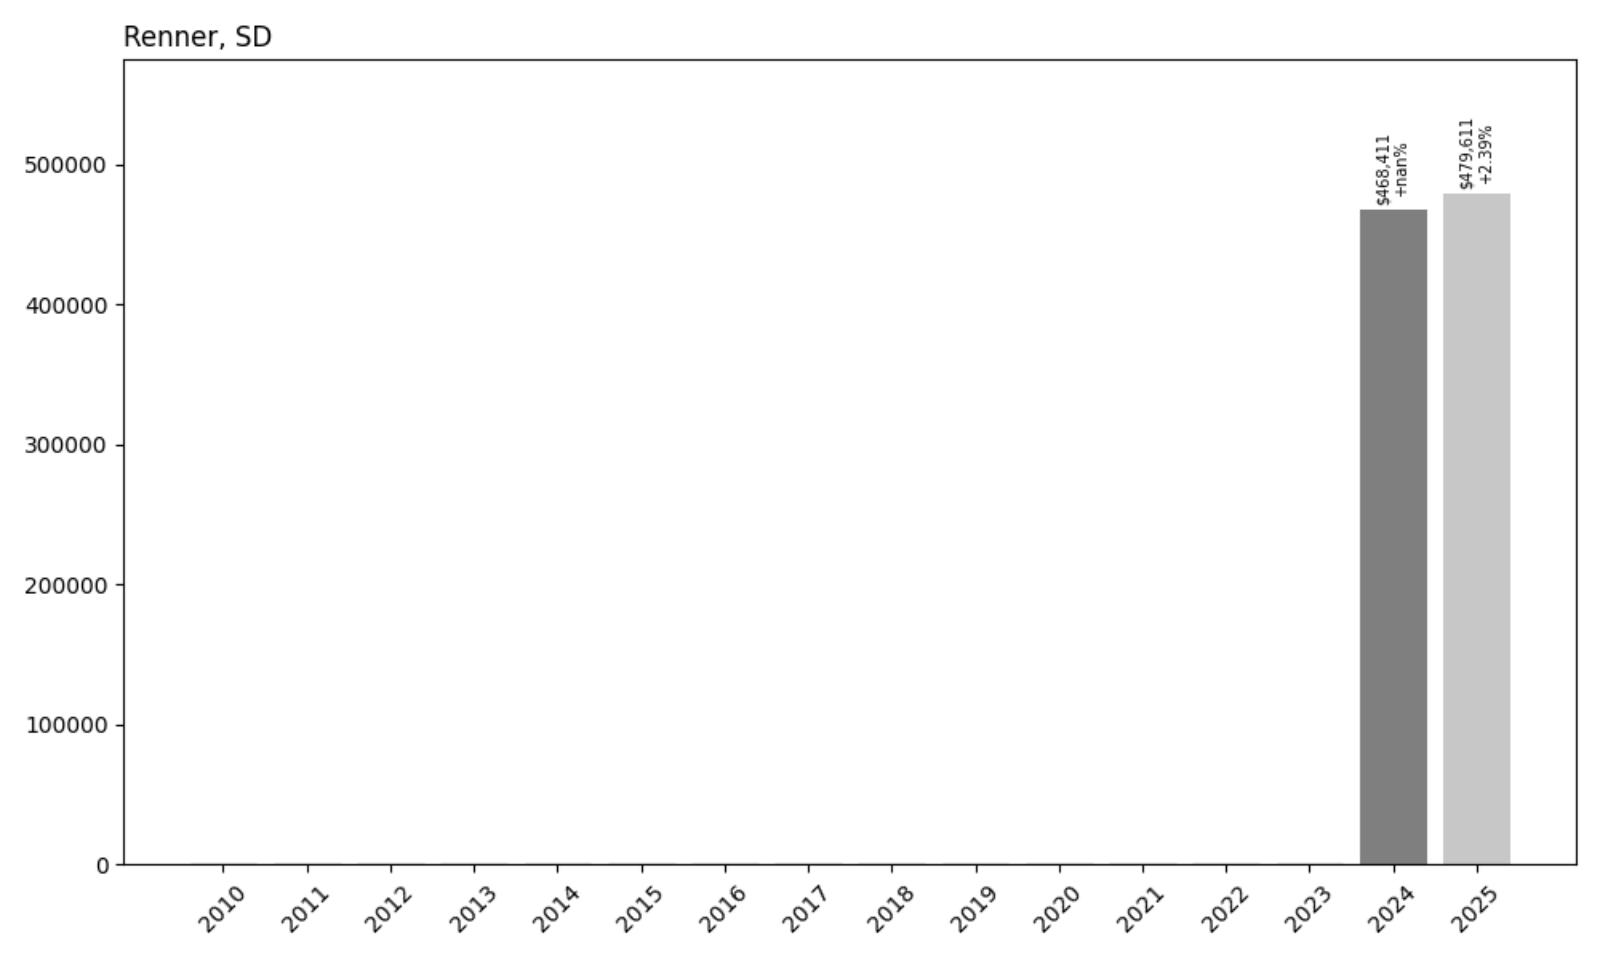
7. Renner – 2.4% Home Price Increase Since 2024
- 2010: N/A
- 2011: N/A
- 2012: N/A
- 2013: N/A
- 2014: N/A
- 2015: N/A
- 2016: N/A
- 2017: N/A
- 2018: N/A
- 2019: N/A
- 2020: N/A
- 2021: N/A
- 2022: N/A
- 2023: N/A
- 2024: $468,411
- 2025: $479,611 (+$11,199, +2.39% from previous year)
Renner enters the tracking data in 2024 with an already elevated baseline of $468,411, suggesting significant prior appreciation that preceded data collection. The modest 2.4% increase to $479,611 in 2025 indicates a mature market with continued but measured growth. The high entry point reflects the community’s established position as one of South Dakota’s premium residential markets.
Renner – Minnehaha County Exclusivity

Renner represents one of the most exclusive residential communities in the Sioux Falls metropolitan area, offering luxury living within easy commuting distance of South Dakota’s largest city. This Minnehaha County community has established itself as a premier destination for buyers seeking upscale suburban living with the convenience of metropolitan access and the benefits of South Dakota’s favorable tax environment.
The community’s appeal stems from its combination of executive-level housing, well-planned development, and proximity to Sioux Falls employment and cultural amenities. Renner’s location provides residents with urban convenience while maintaining the space and privacy that define luxury suburban living. The area’s development patterns focus on larger lots and custom homes that appeal to affluent buyers.
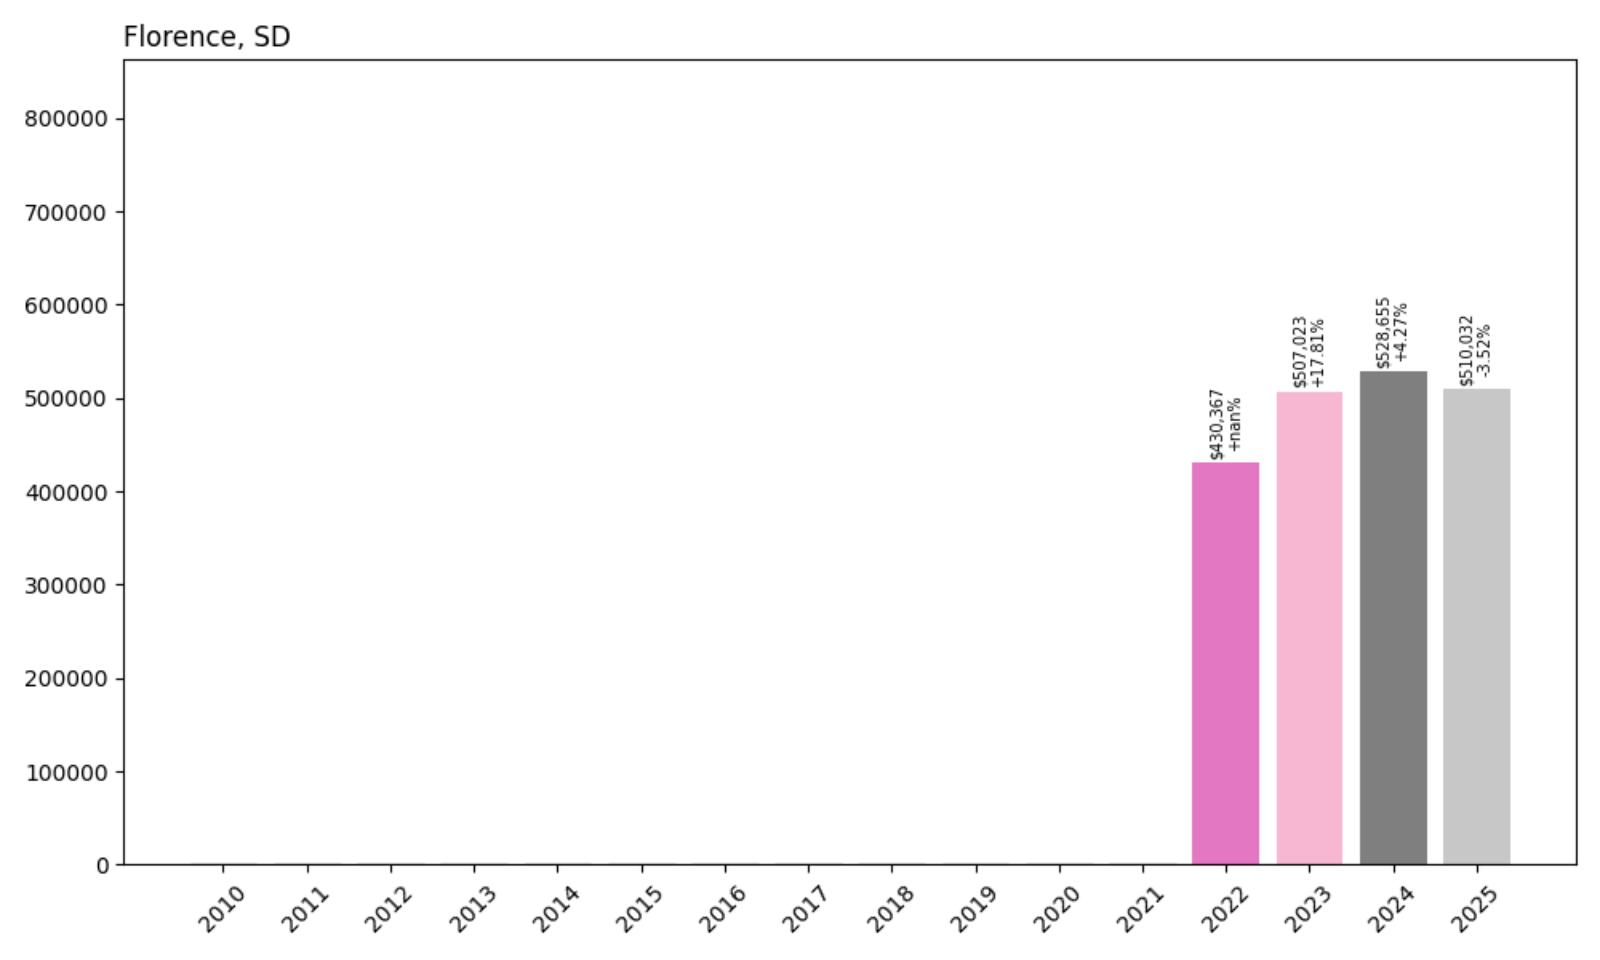
6. Florence – -3.5% Home Price Decline Since 2022
- 2010: N/A
- 2011: N/A
- 2012: N/A
- 2013: N/A
- 2014: N/A
- 2015: N/A
- 2016: N/A
- 2017: N/A
- 2018: N/A
- 2019: N/A
- 2020: N/A
- 2021: N/A
- 2022: $430,367
- 2023: $507,023 (+$76,657, +17.81% from previous year)
- 2024: $528,655 (+$21,632, +4.27% from previous year)
- 2025: $510,032 (−$18,623, −3.52% from previous year)
Florence entered tracking in 2022 at $430,367 before experiencing dramatic growth in 2023 with an exceptional 17.81% increase, followed by continued appreciation in 2024. However, 2025 brought a market correction with a 3.5% decline to $510,032. Despite the recent adjustment, current values remain substantially above the 2022 baseline, reflecting the community’s strong market position with some volatility adjustment.
Florence – Codington County Premium Market
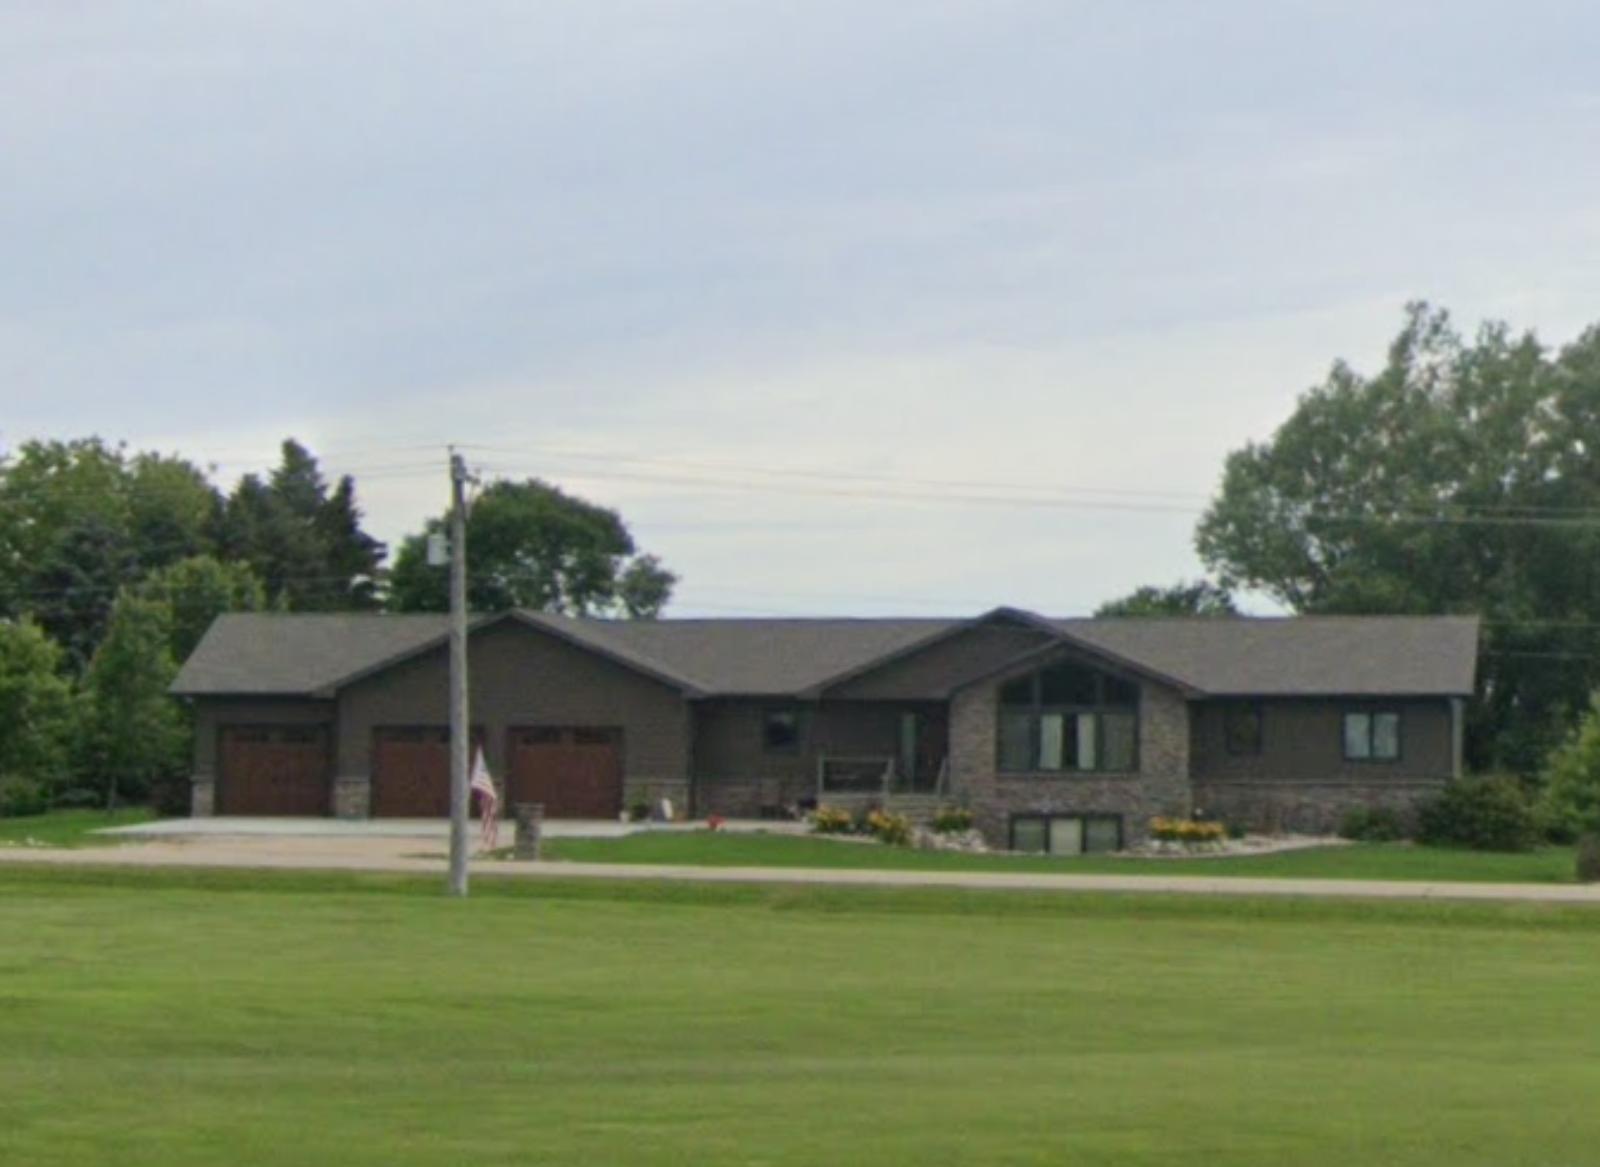
Florence represents the premium tier of residential real estate in Codington County, offering upscale living within the Watertown region of northeastern South Dakota. This community has attracted buyers seeking luxury housing with access to regional amenities while maintaining the character and advantages of smaller-town South Dakota living.
Recent market volatility reflects the adjustment period that can affect higher-end markets when rapid appreciation encounters economic fundamentals. Despite the 2025 correction, Florence’s current valuations remain well above entry levels, suggesting the community has established itself as a premium residential destination with continued appeal to buyers seeking luxury living in northeastern South Dakota.
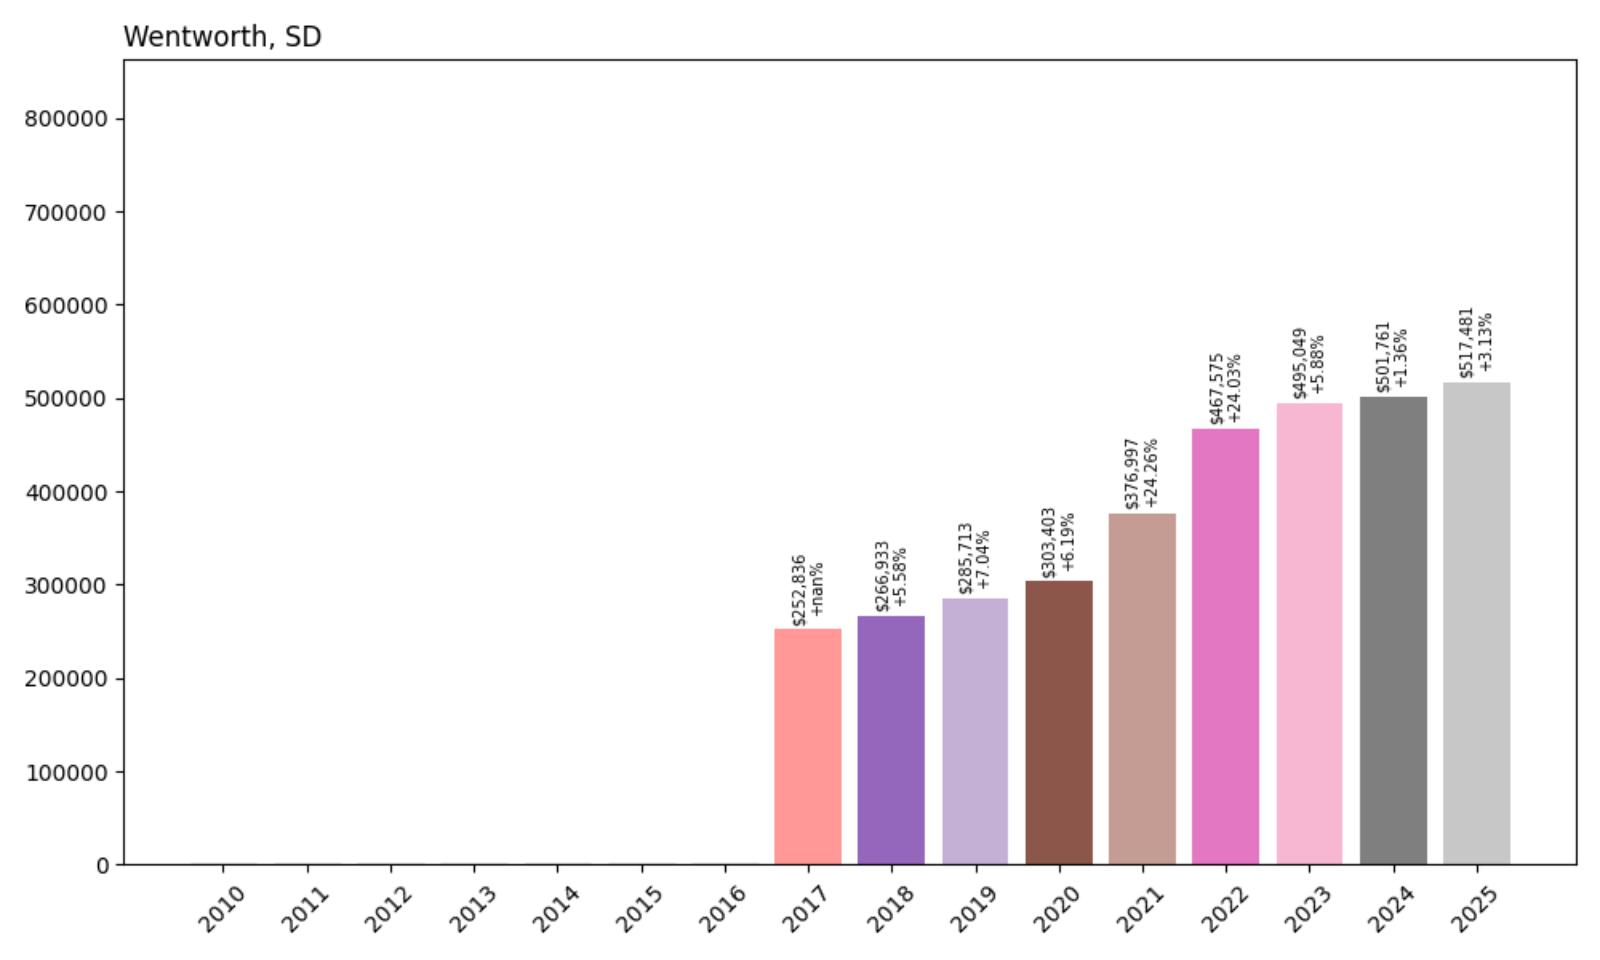
5. Wentworth – 104.7% Home Price Increase Since 2017
- 2010: N/A
- 2011: N/A
- 2012: N/A
- 2013: N/A
- 2014: N/A
- 2015: N/A
- 2016: N/A
- 2017: $252,836
- 2018: $266,933 (+$14,097, +5.58% from previous year)
- 2019: $285,713 (+$18,781, +7.04% from previous year)
- 2020: $303,403 (+$17,690, +6.19% from previous year)
- 2021: $376,997 (+$73,595, +24.26% from previous year)
- 2022: $467,575 (+$90,578, +24.03% from previous year)
- 2023: $495,049 (+$27,474, +5.88% from previous year)
- 2024: $501,761 (+$6,712, +1.36% from previous year)
- 2025: $517,481 (+$15,719, +3.13% from previous year)
Wentworth maintained consistent appreciation through 2020 before experiencing remarkable pandemic-era growth, with prices increasing 55% over two years (2021-2022). The community more than doubled in value since 2017, demonstrating exceptional market performance. Recent stabilization with continued modest growth suggests a mature market with strong fundamental demand in this Lake County community.
Wentworth – Lake County Excellence
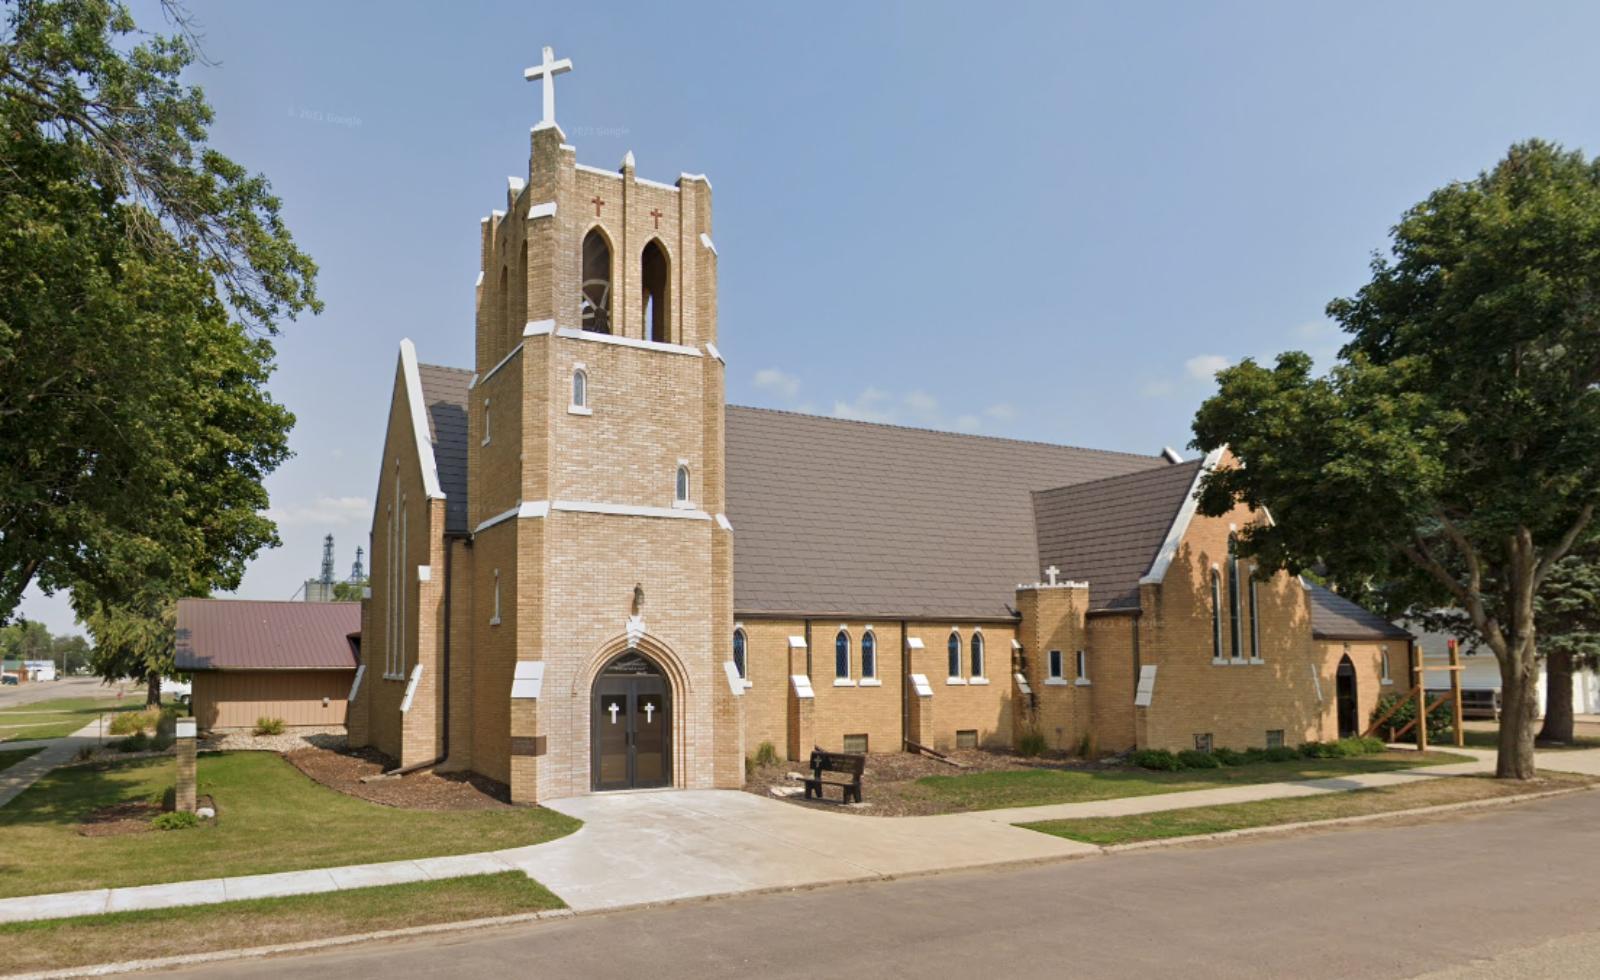
Wentworth has established itself as one of Lake County’s most desirable residential communities, combining small-town character with proximity to regional amenities and recreational opportunities. The community’s location in eastern South Dakota provides access to glacial lakes region attractions while maintaining convenient connections to larger regional centers.
Recent market performance reflects growing recognition of Wentworth as a premier residential destination in eastern South Dakota. The community’s combination of small-town amenities, regional access, and natural setting has created sustained demand that supports premium pricing relative to other rural markets, positioning Wentworth as a flagship community in the glacial lakes region.
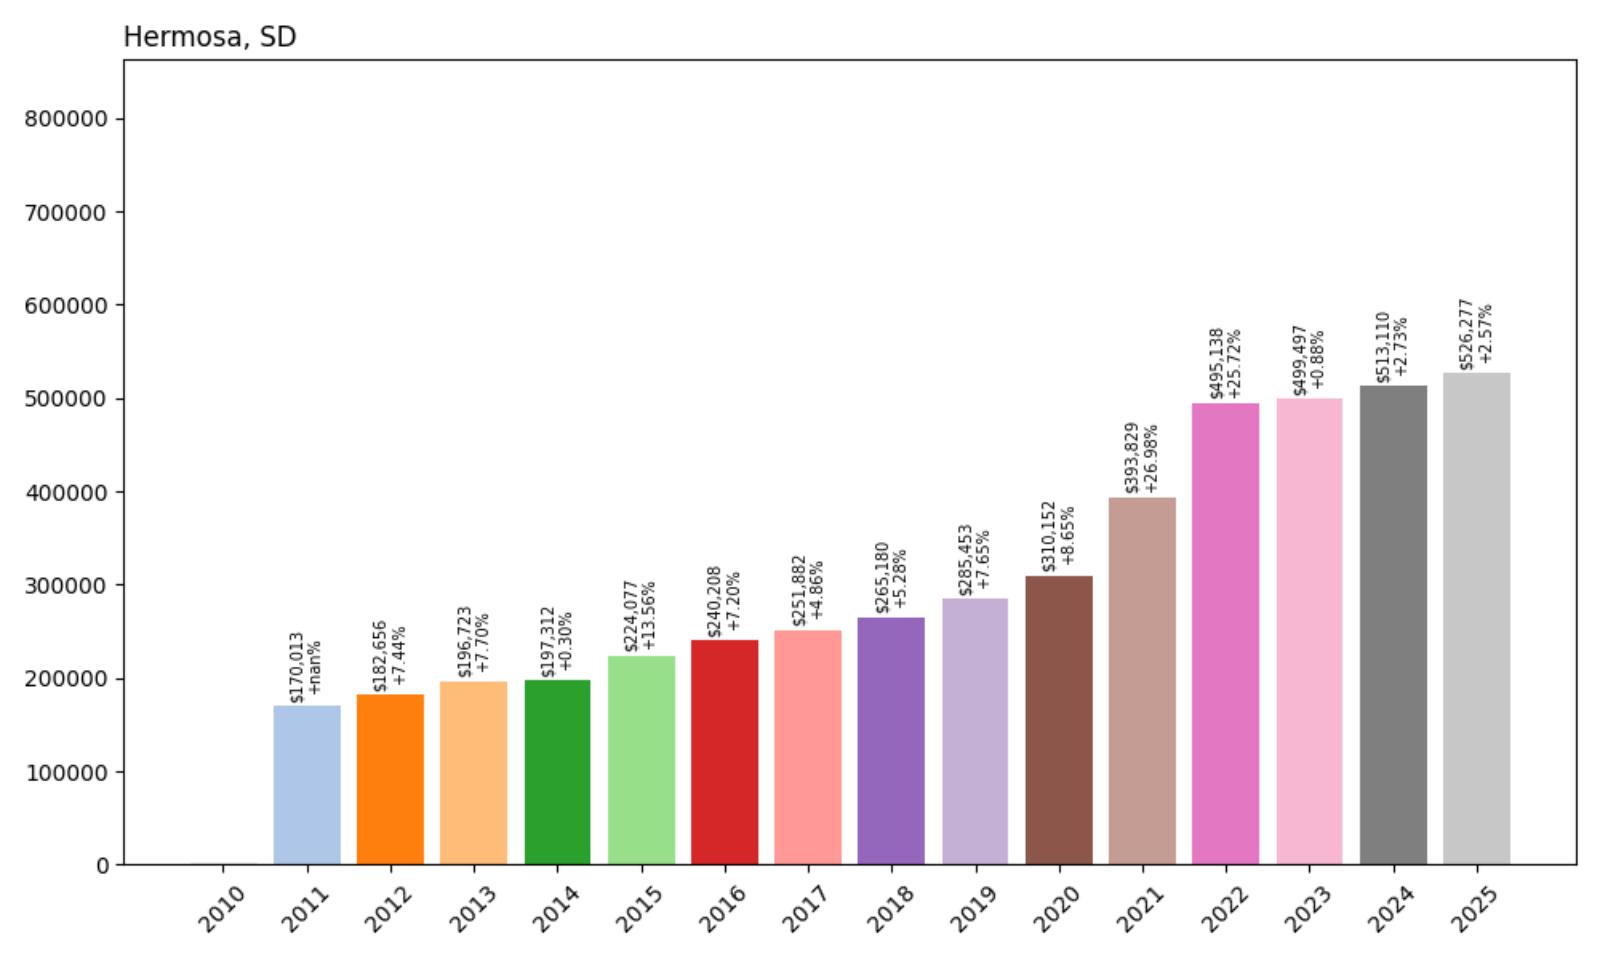
4. Hermosa – 209.5% Home Price Increase Since 2011
- 2010: N/A
- 2011: $170,013
- 2012: $182,656 (+$12,644, +7.44% from previous year)
- 2013: $196,723 (+$14,067, +7.70% from previous year)
- 2014: $197,312 (+$589, +0.30% from previous year)
- 2015: $224,077 (+$26,765, +13.56% from previous year)
- 2016: $240,208 (+$16,131, +7.20% from previous year)
- 2017: $251,882 (+$11,674, +4.86% from previous year)
- 2018: $265,180 (+$13,298, +5.28% from previous year)
- 2019: $285,453 (+$20,273, +7.65% from previous year)
- 2020: $310,152 (+$24,699, +8.65% from previous year)
- 2021: $393,829 (+$83,677, +26.98% from previous year)
- 2022: $495,138 (+$101,309, +25.72% from previous year)
- 2023: $499,497 (+$4,359, +0.88% from previous year)
- 2024: $513,110 (+$13,614, +2.73% from previous year)
- 2025: $526,277 (+$13,166, +2.57% from previous year)
Hermosa achieved remarkable appreciation over 14 years, demonstrating consistent growth that culminated in explosive pandemic-era gains. The community tripled in value since 2011, with particularly dramatic growth during 2021-2022 when prices increased 58% over two years. Recent stabilization with continued growth suggests strong fundamental demand in this Black Hills gateway community.
Hermosa – Black Hills Gateway
Hermosa occupies a strategic position as a gateway to the Black Hills region, providing residents with access to mountain recreation while maintaining proximity to Rapid City employment and amenities. This Custer County community has benefited enormously from its location between South Dakota’s second-largest city and the world-renowned attractions of the Black Hills.
Recent market performance reflects growing recognition of Hermosa as an ideal residential location for those seeking Black Hills living with metropolitan access. The community’s combination of natural setting, regional connectivity, and relative affordability has created a real estate market that commands premium prices while offering exceptional value compared to more exclusive Black Hills destinations.
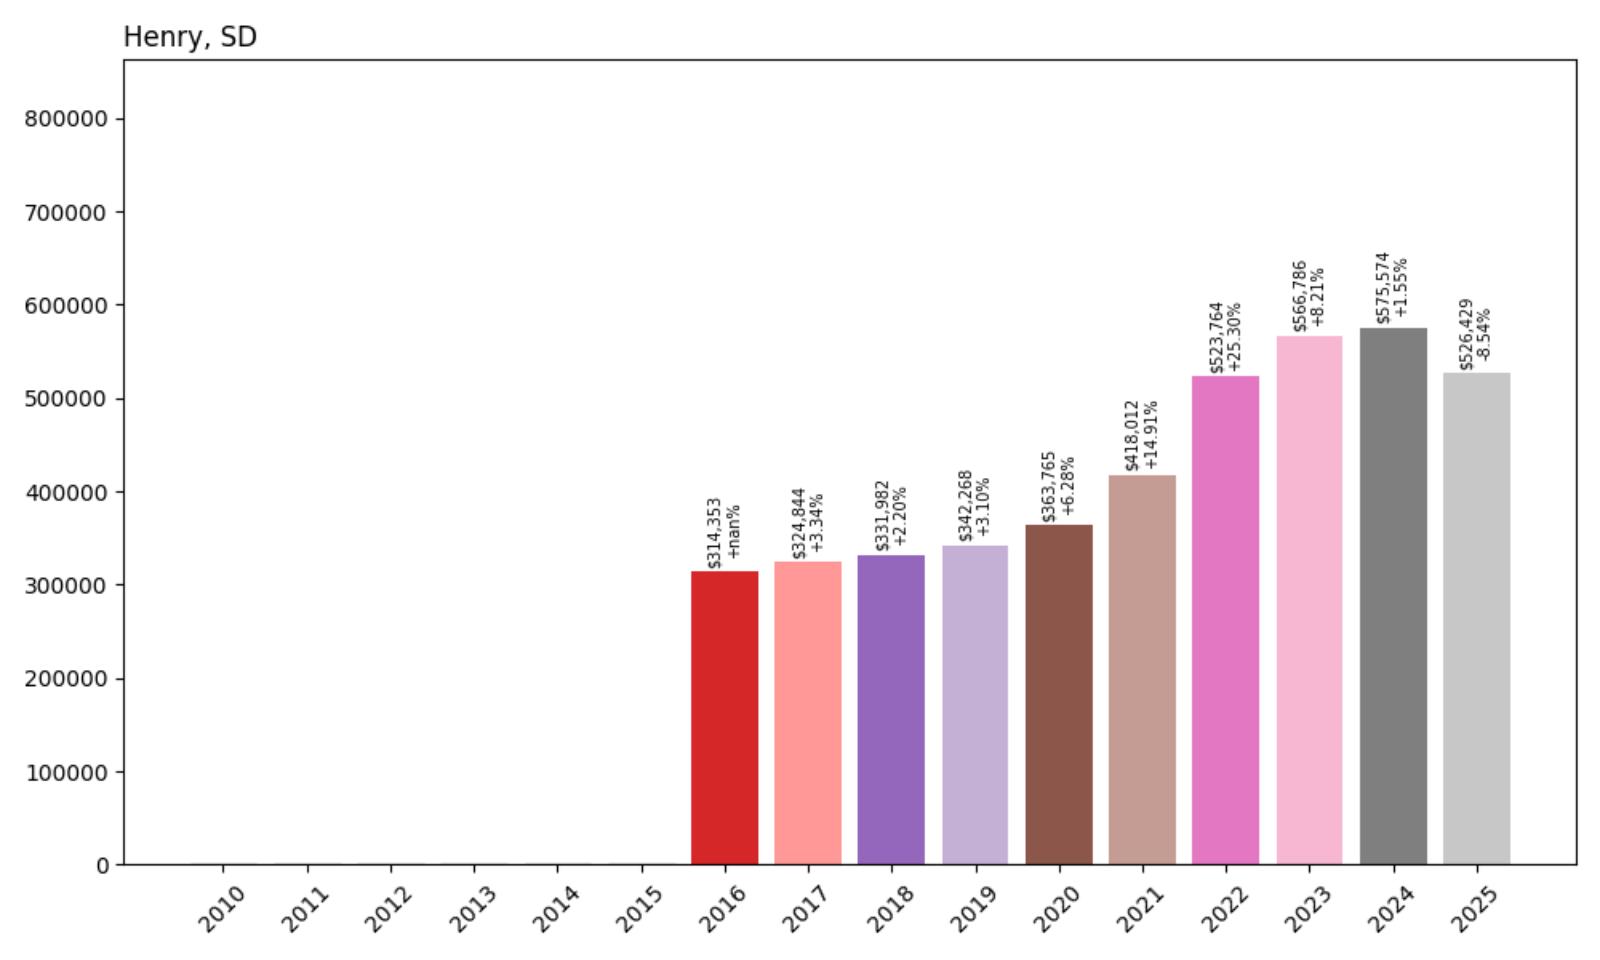
3. Henry – 67.5% Home Price Increase Since 2016
- 2010: N/A
- 2011: N/A
- 2012: N/A
- 2013: N/A
- 2014: N/A
- 2015: N/A
- 2016: $314,353
- 2017: $324,844 (+$10,490, +3.34% from previous year)
- 2018: $331,982 (+$7,138, +2.20% from previous year)
- 2019: $342,268 (+$10,286, +3.10% from previous year)
- 2020: $363,765 (+$21,497, +6.28% from previous year)
- 2021: $418,012 (+$54,247, +14.91% from previous year)
- 2022: $523,764 (+$105,751, +25.30% from previous year)
- 2023: $566,786 (+$43,022, +8.21% from previous year)
- 2024: $575,574 (+$8,789, +1.55% from previous year)
- 2025: $526,429 (−$49,146, −8.54% from previous year)
Henry maintained steady growth through 2020 before experiencing dramatic pandemic-era appreciation, with prices increasing 43% over two years (2021-2022). The market peaked in 2024 at over $575,000 before experiencing a significant correction in 2025. Despite the recent decline, current values remain substantially above the 2016 baseline, reflecting the community’s established position in the premium market tier.
Henry – Codington County Premium Location
Henry represents one of the most exclusive residential communities in the Watertown region, offering luxury living in Codington County with access to northeastern South Dakota’s recreational and economic opportunities. The community has attracted buyers seeking premium properties with space, privacy, and proximity to regional amenities while maintaining the advantages of South Dakota residency.
The community’s appeal stems from its combination of executive-level housing and strategic location that provides access to both recreational opportunities and regional business centers. Henry’s development has focused on larger properties and custom homes that appeal to affluent buyers seeking luxury rural living with convenient access to urban amenities and services.
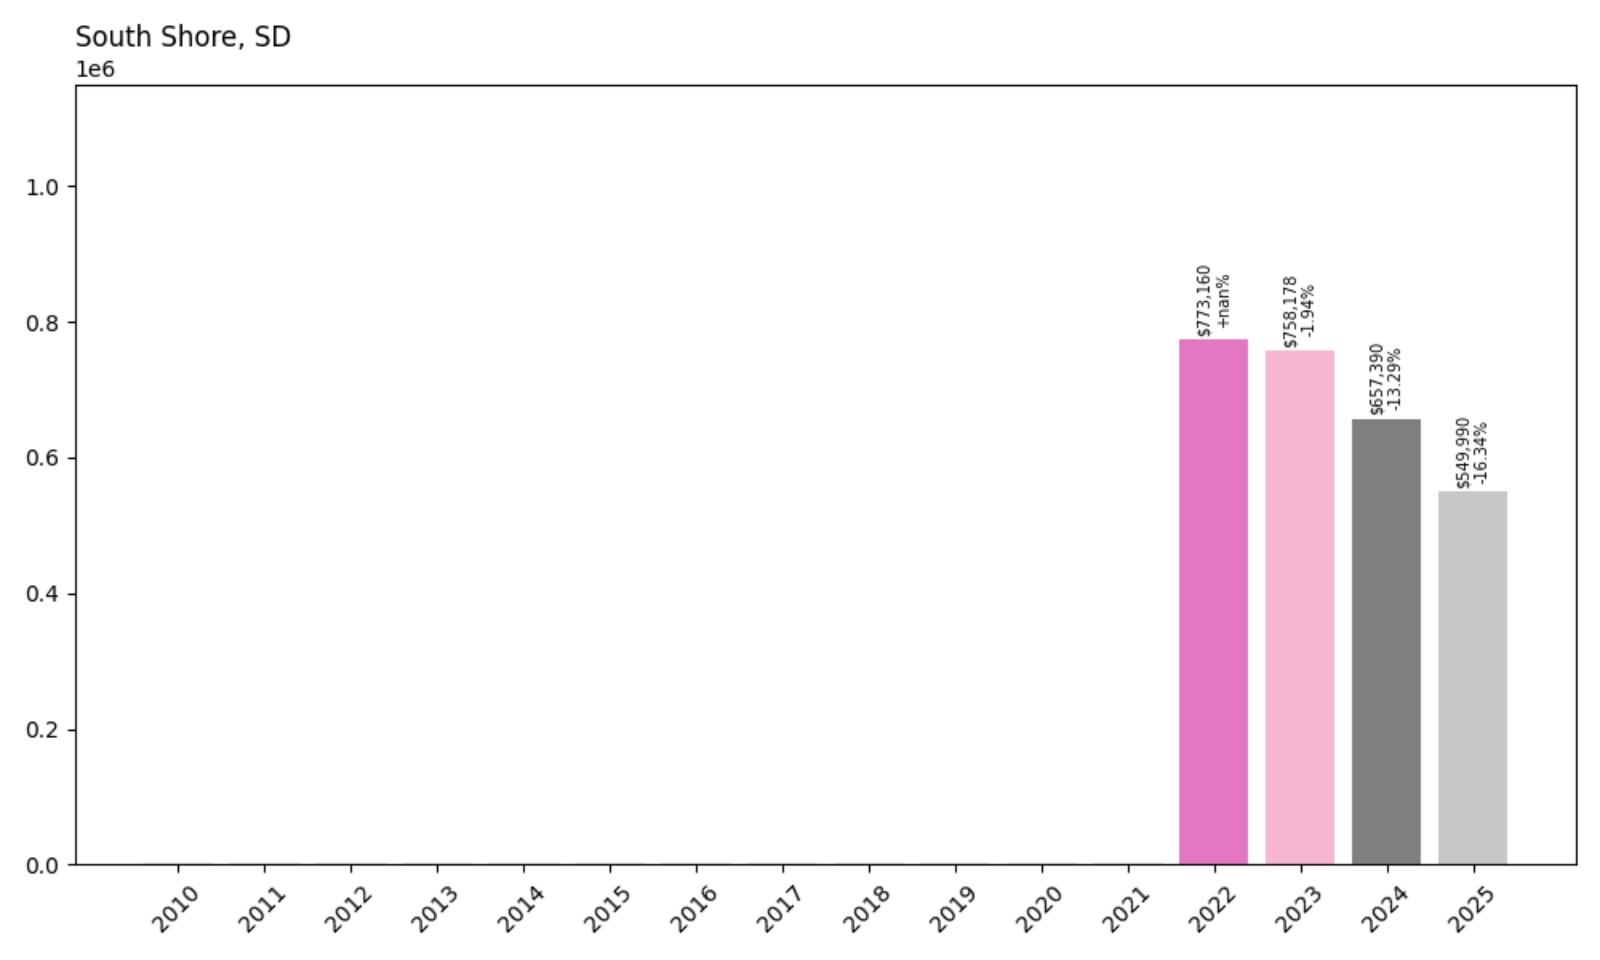
2. South Shore – -28.9% Home Price Decline Since 2022
- 2010: N/A
- 2011: N/A
- 2012: N/A
- 2013: N/A
- 2014: N/A
- 2015: N/A
- 2016: N/A
- 2017: N/A
- 2018: N/A
- 2019: N/A
- 2020: N/A
- 2021: N/A
- 2022: $773,160
- 2023: $758,178 (−$14,982, −1.94% from previous year)
- 2024: $657,390 (−$100,787, −13.29% from previous year)
- 2025: $549,990 (−$107,400, −16.34% from previous year)
South Shore entered tracking in 2022 at the exceptionally high level of $773,160 before experiencing consistent declines over three consecutive years. The cumulative 29% decline to $549,990 represents significant market correction, though current values remain at premium levels. The pattern suggests initial overvaluation followed by market adjustment toward sustainable pricing levels.
South Shore – Market Correction Story
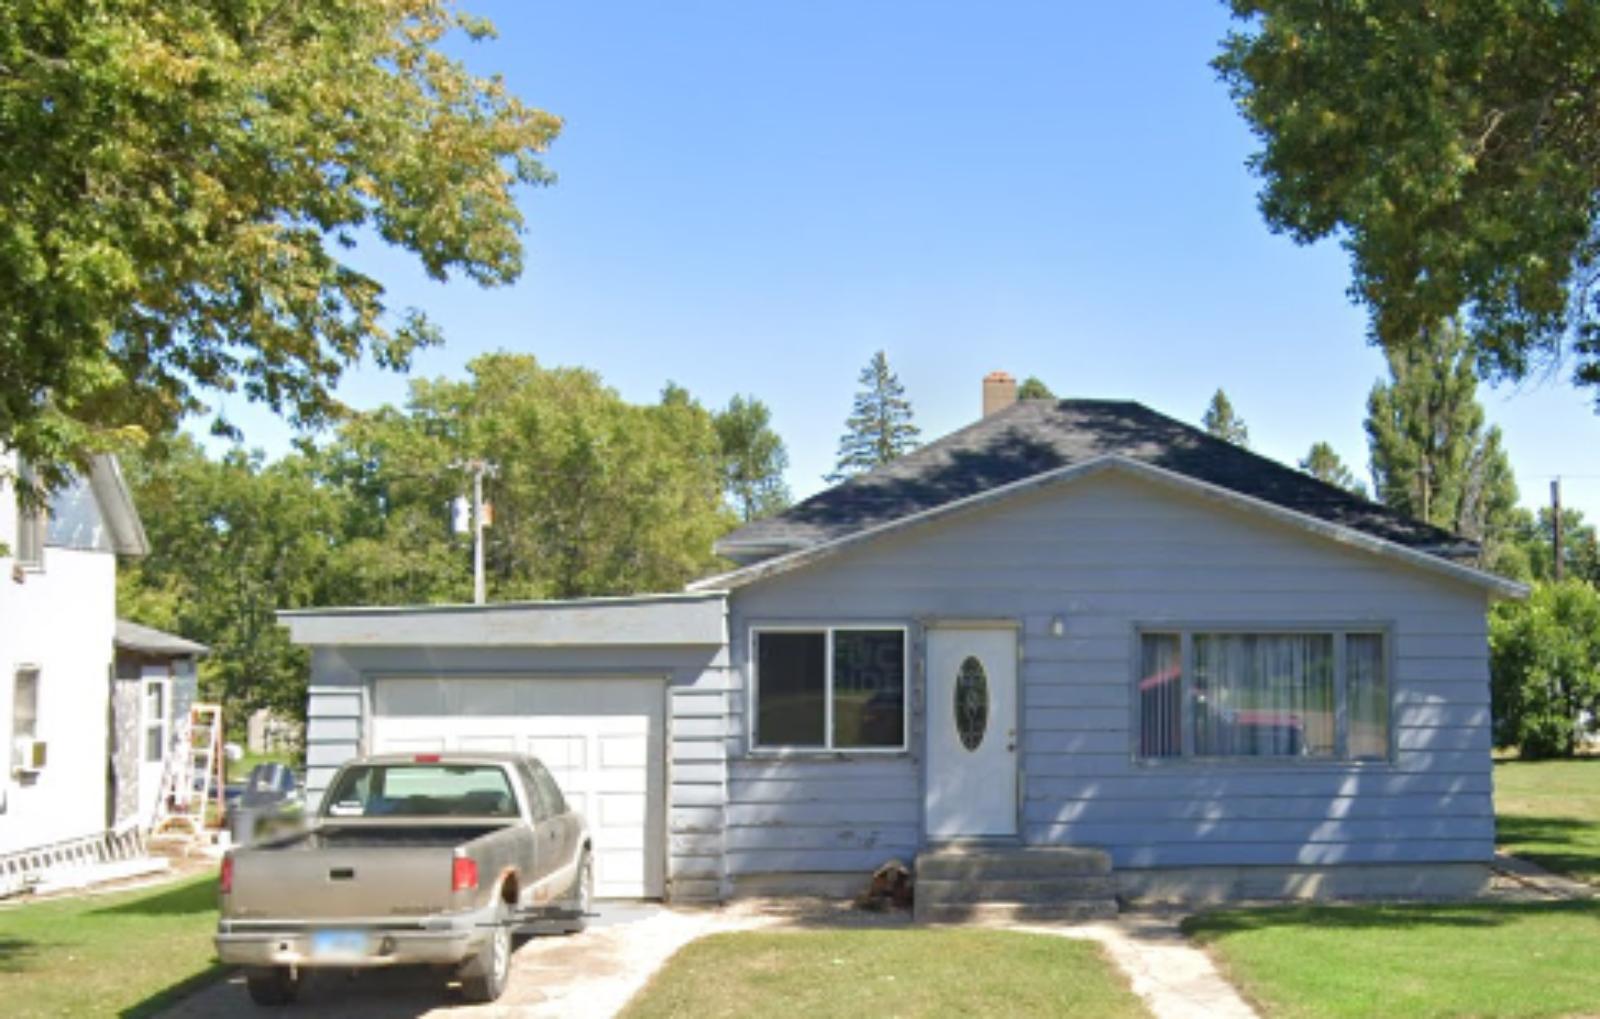
South Shore represents the most dramatic example of market correction among South Dakota’s expensive communities, illustrating how rapid appreciation can create unsustainable valuations that require significant adjustment. Located in Codington County, this community achieved exceptional peak valuations that proved difficult to maintain as market conditions normalized.
Despite substantial corrections, South Shore’s current values remain at premium levels compared to most South Dakota communities, suggesting some fundamental appeal persists. The community’s longer-term prospects depend on its ability to establish sustainable pricing that reflects local economic conditions while maintaining the amenities and character that attracted initial premium valuations.
1. Keystone – 185.1% Home Price Increase Since 2010
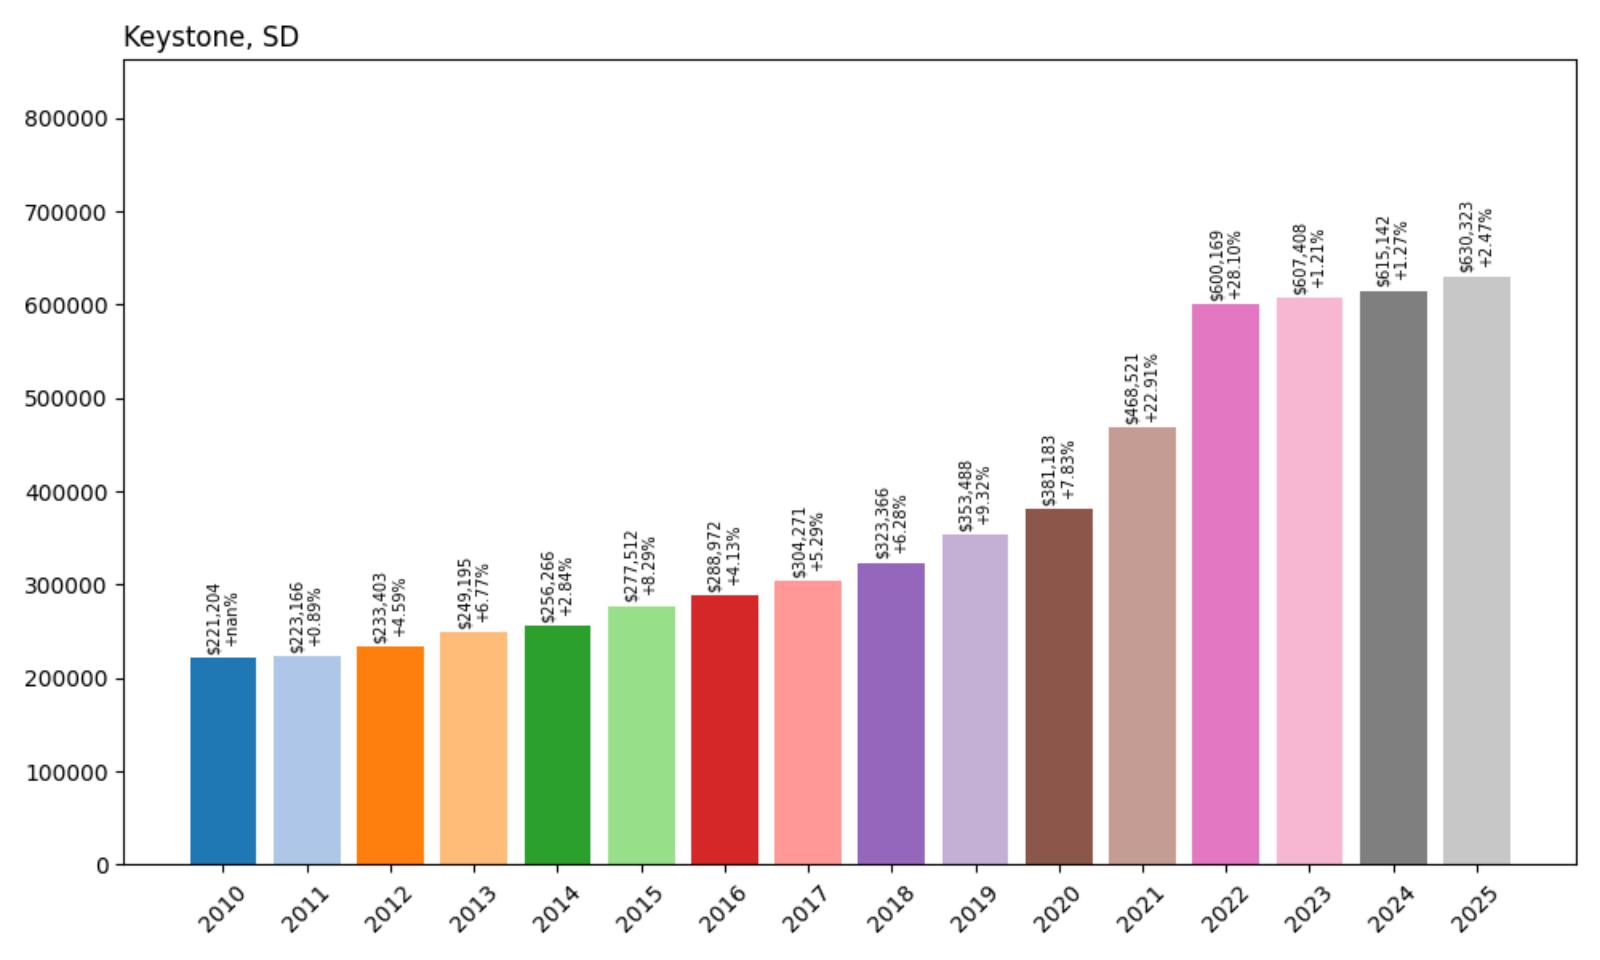
- 2010: $221,204
- 2011: $223,166 (+$1,962, +0.89% from previous year)
- 2012: $233,403 (+$10,237, +4.59% from previous year)
- 2013: $249,195 (+$15,792, +6.77% from previous year)
- 2014: $256,266 (+$7,070, +2.84% from previous year)
- 2015: $277,512 (+$21,246, +8.29% from previous year)
- 2016: $288,972 (+$11,460, +4.13% from previous year)
- 2017: $304,271 (+$15,299, +5.29% from previous year)
- 2018: $323,366 (+$19,095, +6.28% from previous year)
- 2019: $353,488 (+$30,122, +9.32% from previous year)
- 2020: $381,183 (+$27,695, +7.83% from previous year)
- 2021: $468,521 (+$87,338, +22.91% from previous year)
- 2022: $600,169 (+$131,647, +28.10% from previous year)
- 2023: $607,408 (+$7,240, +1.21% from previous year)
- 2024: $615,142 (+$7,734, +1.27% from previous year)
- 2025: $630,323 (+$15,180, +2.47% from previous year)
Keystone demonstrates the most consistent and dramatic appreciation in the dataset, with steady growth over 15 years that culminated in explosive pandemic-era gains. The community achieved remarkable 185% appreciation since 2010, with particularly dramatic growth during 2021-2022 when prices increased 58% over two years. The massive 28.10% increase in 2022 represents the highest single-year gain among all communities tracked.
Keystone – Mount Rushmore’s Premier Address
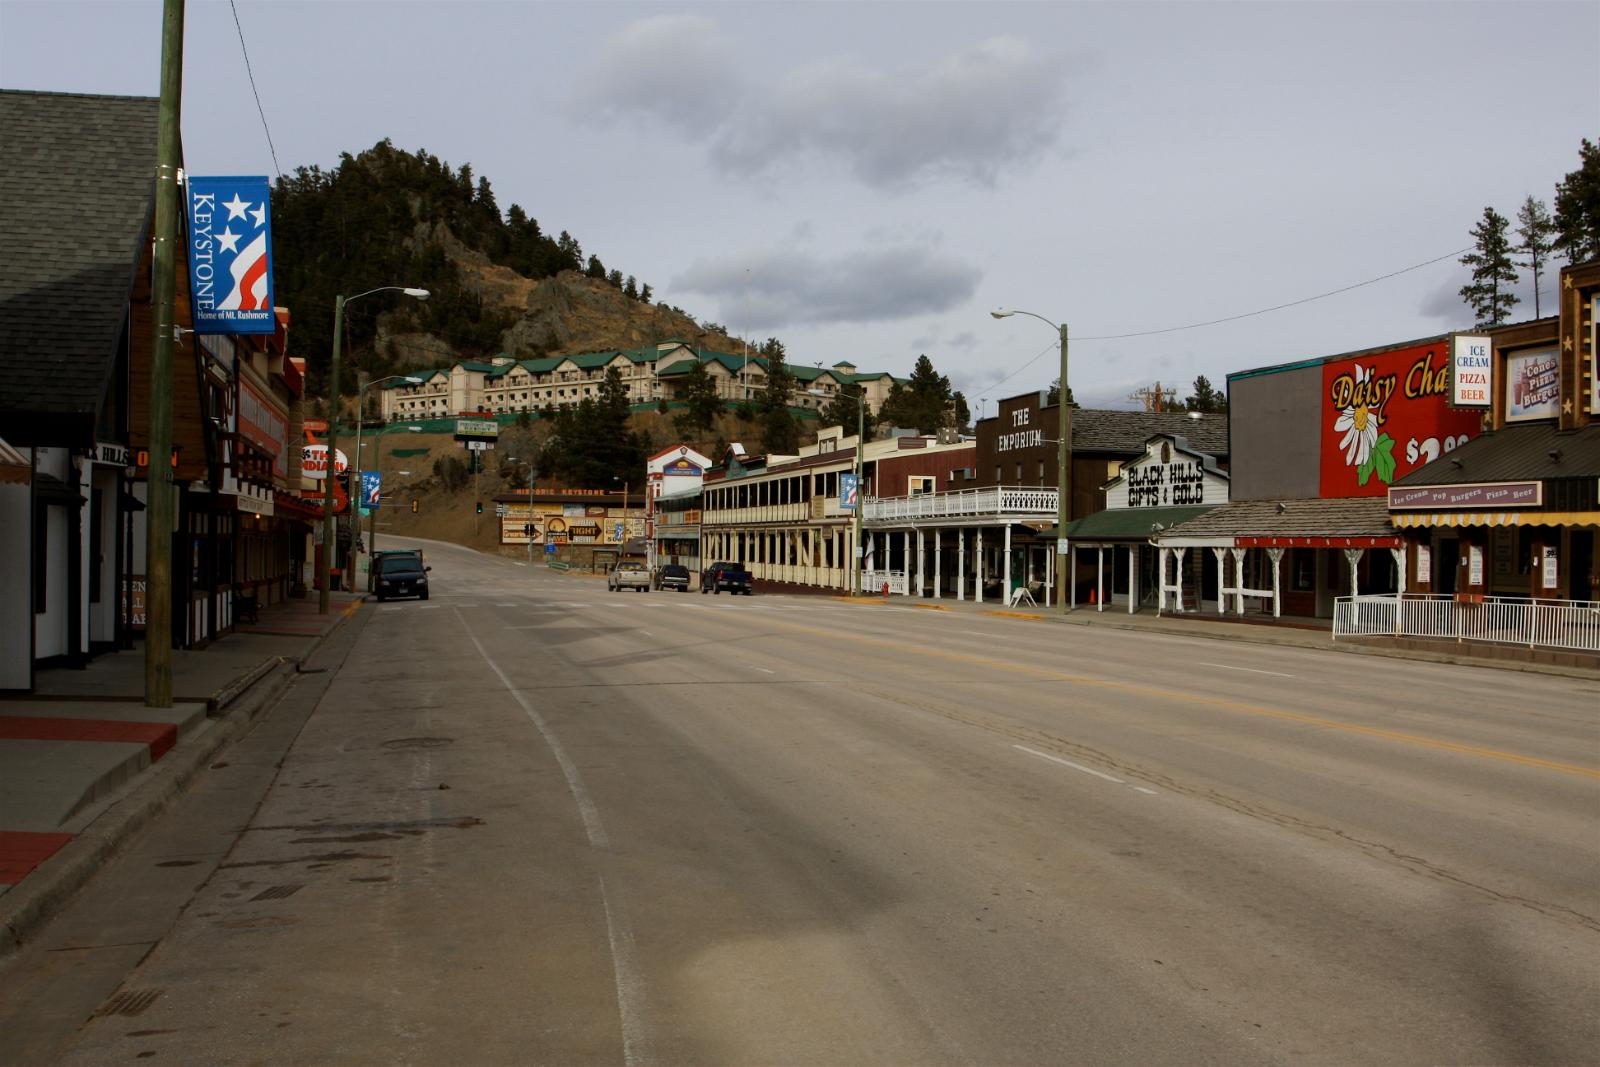
Keystone stands as South Dakota’s most expensive community, occupying the unique position as the gateway to Mount Rushmore National Memorial and the heart of the Black Hills tourism economy. This iconic location has created a real estate market unlike anywhere else in the state, where proximity to one of America’s most famous landmarks drives exceptional property values and sustained demand.
The dramatic price appreciation reflects both the community’s irreplaceable location and growing recognition of Keystone as a premium Black Hills residential destination. Property owners benefit from the constant tourism economy while enjoying daily access to some of the most spectacular scenery in the American West. Keystone’s combination of iconic location, tourism economy, and natural beauty has created the state’s most exclusive real estate market, commanding prices that reflect its status as South Dakota’s premier address.