🔥 Would you like to save this?
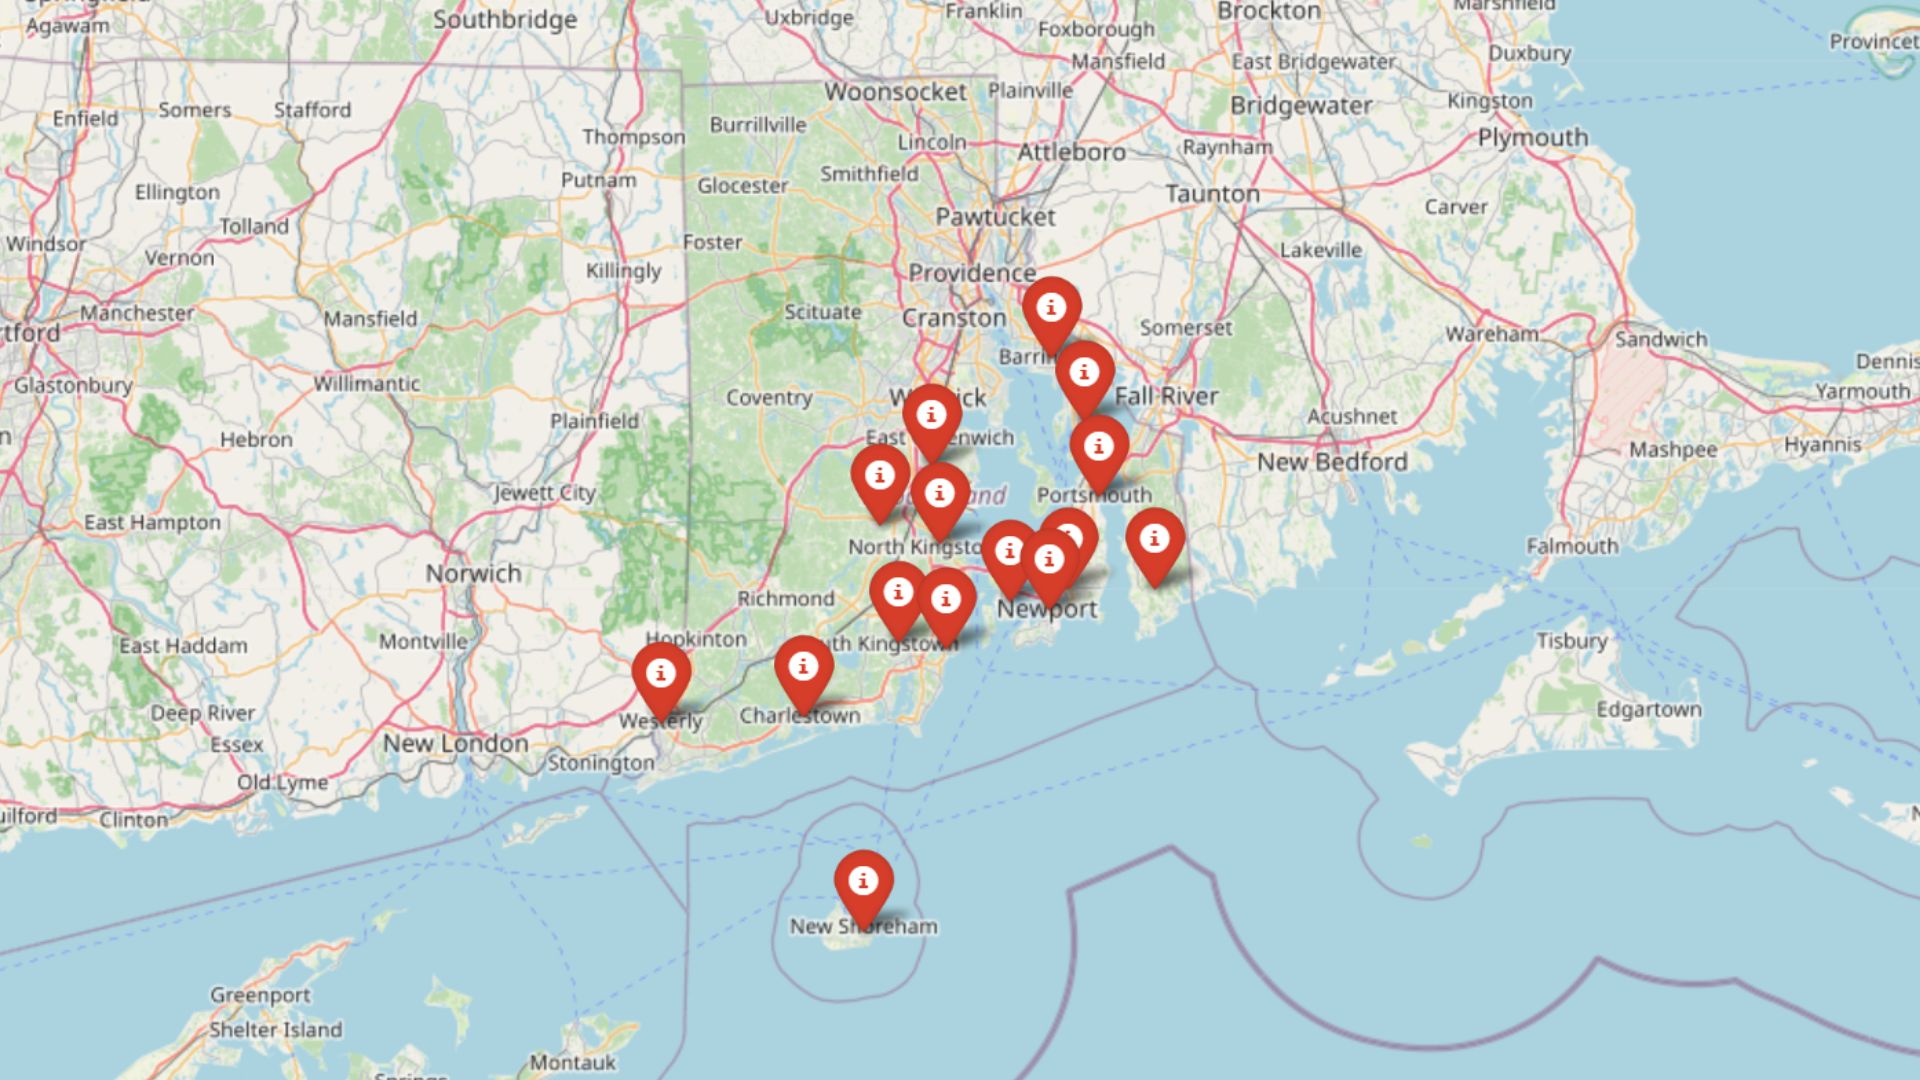
Zillow’s Home Value Index shows that Rhode Island’s housing market has come a long way—especially in its most desirable towns. In 2025, these 15 places top the state in home values, driven by ocean views, strong schools, historic charm, and proximity to cities like Boston and Providence. From shoreline retreats to family-friendly suburbs, each town reflects a different version of upscale New England living—and a price tag to match.
15. Bristol – 129% Home Price Increase Since 2010
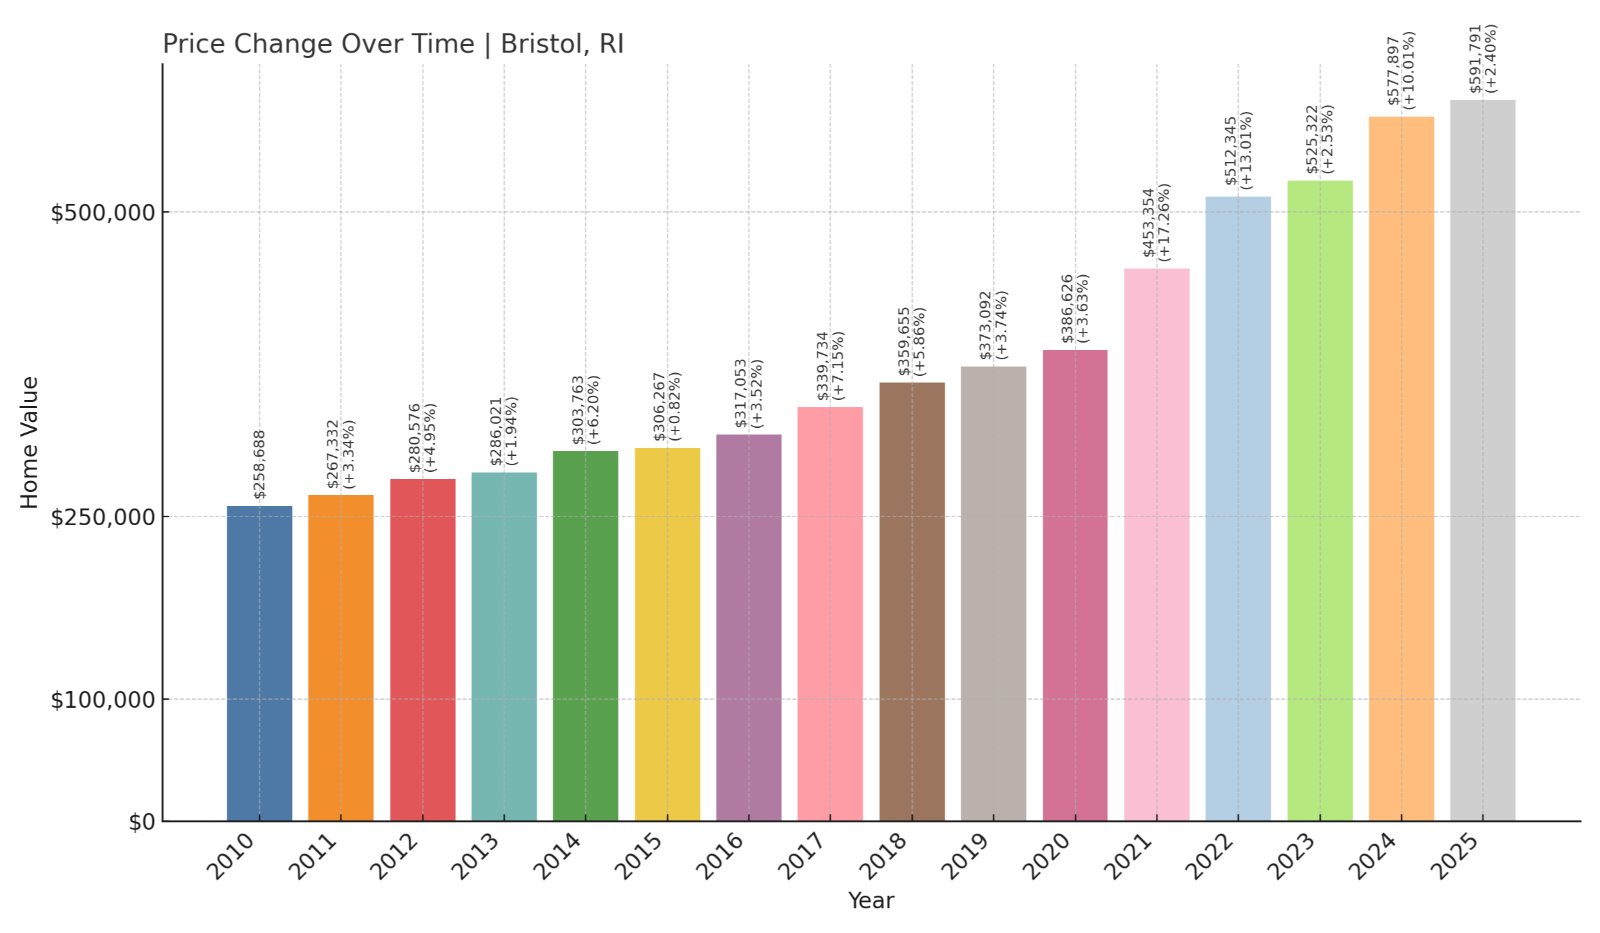
- 2010: $258,688
- 2011: $267,332 (+$8,643, +3.34% from previous year)
- 2012: $280,576 (+$13,244, +4.95% from previous year)
- 2013: $286,021 (+$5,445, +1.94% from previous year)
- 2014: $303,763 (+$17,742, +6.20% from previous year)
- 2015: $306,267 (+$2,504, +0.82% from previous year)
- 2016: $317,053 (+$10,786, +3.52% from previous year)
- 2017: $339,734 (+$22,681, +7.15% from previous year)
- 2018: $359,655 (+$19,921, +5.86% from previous year)
- 2019: $373,092 (+$13,437, +3.74% from previous year)
- 2020: $386,626 (+$13,534, +3.63% from previous year)
- 2021: $453,354 (+$66,728, +17.26% from previous year)
- 2022: $512,345 (+$58,991, +13.01% from previous year)
- 2023: $525,322 (+$12,977, +2.53% from previous year)
- 2024: $577,897 (+$52,575, +10.01% from previous year)
- 2025: $591,791 (+$13,894, +2.40% from previous year)
Home values in Bristol have more than doubled since 2010, rising by approximately 129% to reach $591,791 in 2025. This long-term upward trend was steady until 2021, when price jumps became particularly dramatic. Even with recent cooling, prices remain far above pre-pandemic levels. Bristol’s consistent growth reflects its lasting appeal to buyers seeking charm, convenience, and coastlines.
In order to come up with the very specific design ideas, we create most designs with the assistance of state-of-the-art AI interior design software.
Bristol – Seaside Appeal and Steady Growth
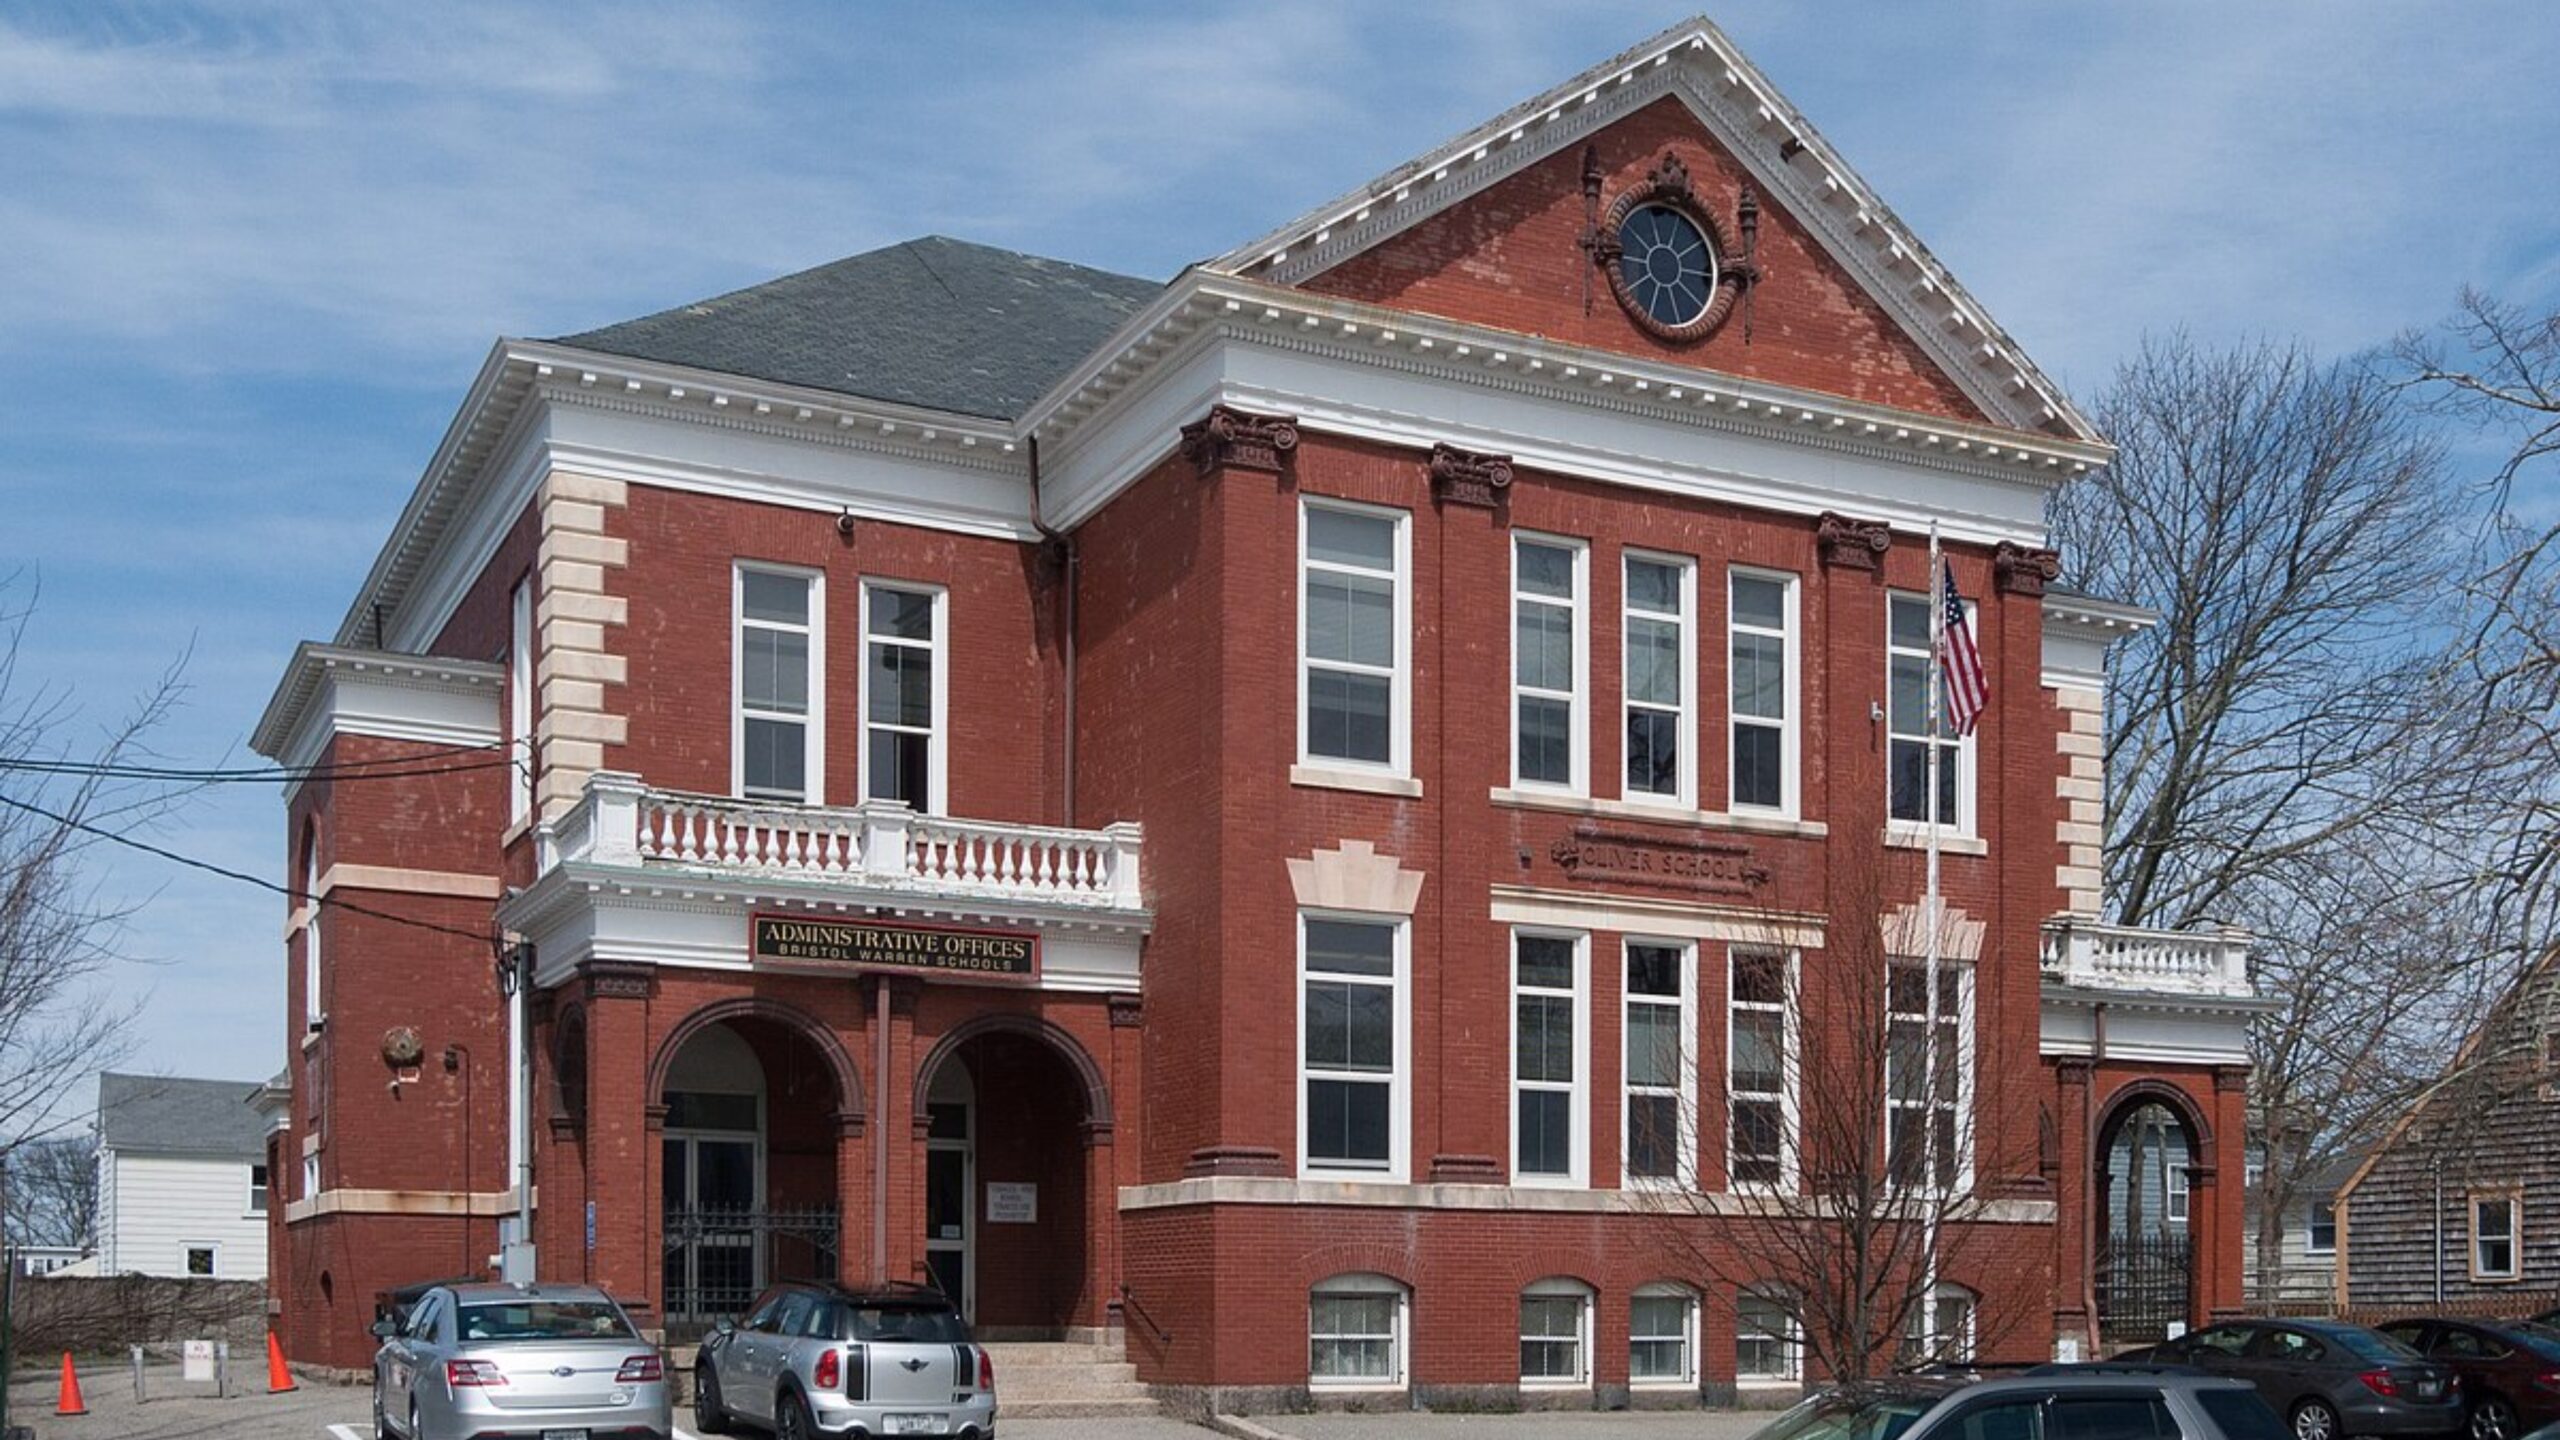
Located on a peninsula between Narragansett Bay and Mount Hope Bay, Bristol combines maritime heritage with a walkable downtown and deep community roots. The town is famed for hosting the oldest continuous Fourth of July celebration in the country, which draws thousands each summer. Proximity to Roger Williams University adds a youthful energy, while sailing and water recreation keep demand for waterfront property high.
The rapid acceleration in home prices from 2020 onward is partly attributed to buyers looking for suburban and small-town homes with character. Bristol offers just that—historic houses, waterfront access, and access to both Providence and Newport. Limited inventory, especially near the coast, has helped keep values high even as interest rates fluctuate.
14. Westerly – 93% Home Price Increase Since 2010
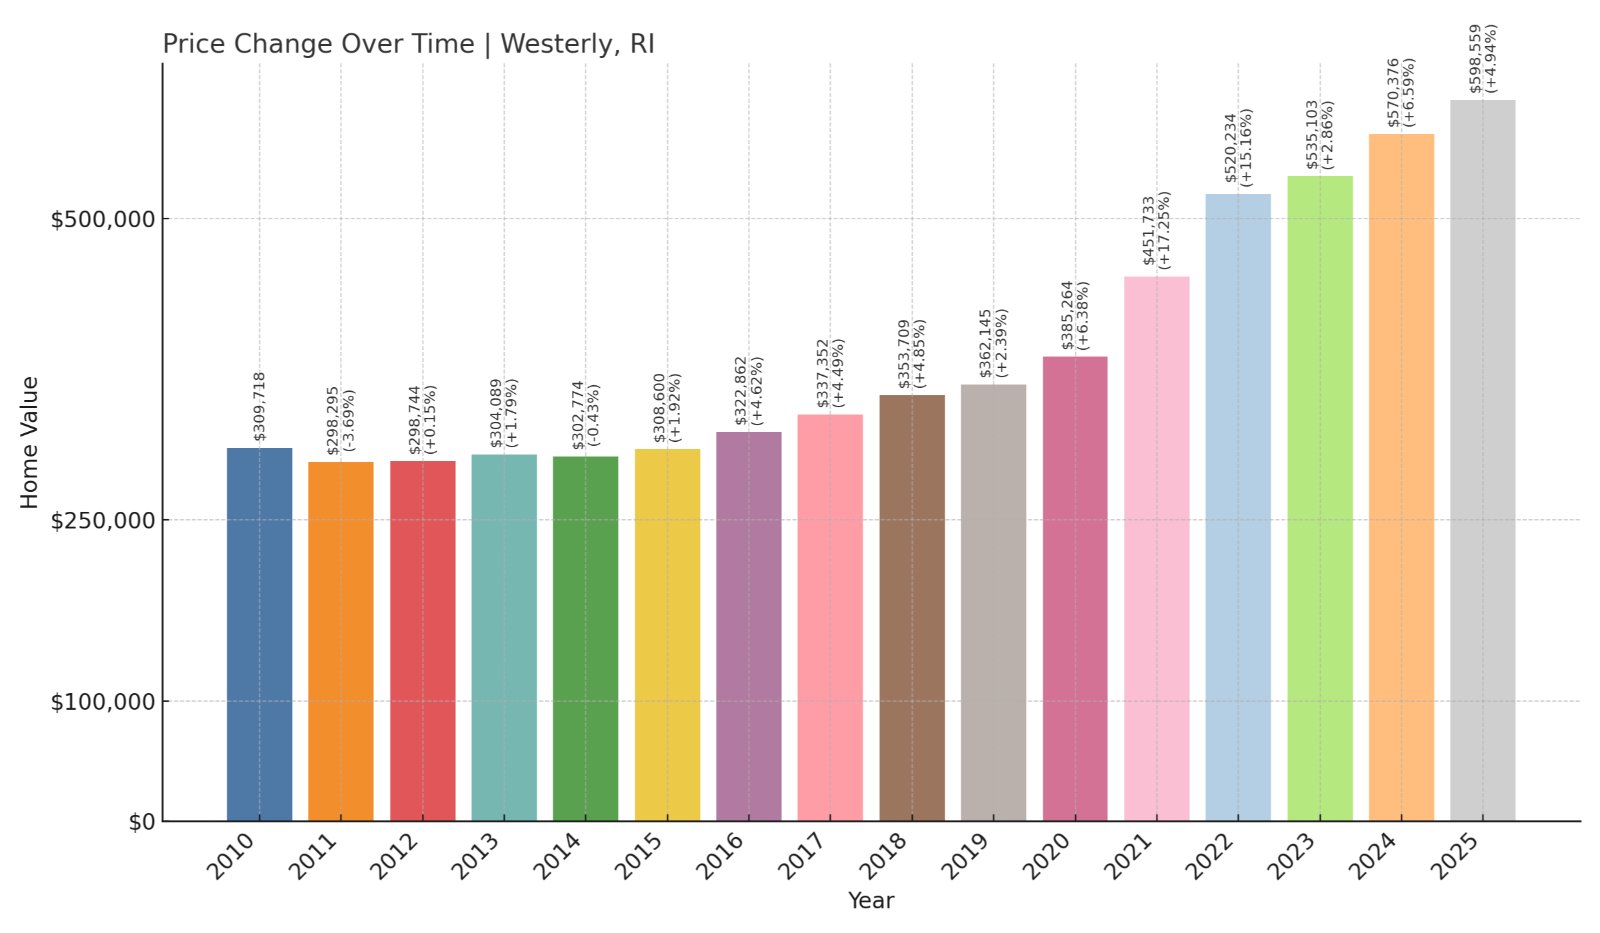
- 2010: $309,718
- 2011: $298,295 (-$11,423, -3.69% from previous year)
- 2012: $298,744 (+$450, +0.15% from previous year)
- 2013: $304,089 (+$5,345, +1.79% from previous year)
- 2014: $302,774 (-$1,315, -0.43% from previous year)
- 2015: $308,600 (+$5,826, +1.92% from previous year)
- 2016: $322,862 (+$14,263, +4.62% from previous year)
- 2017: $337,352 (+$14,490, +4.49% from previous year)
- 2018: $353,709 (+$16,357, +4.85% from previous year)
- 2019: $362,145 (+$8,435, +2.38% from previous year)
- 2020: $385,264 (+$23,120, +6.38% from previous year)
- 2021: $451,733 (+$66,469, +17.25% from previous year)
- 2022: $520,234 (+$68,501, +15.16% from previous year)
- 2023: $535,103 (+$14,869, +2.86% from previous year)
- 2024: $570,376 (+$35,273, +6.59% from previous year)
- 2025: $598,559 (+$28,183, +4.94% from previous year)
Westerly’s home prices have climbed from just over $309,000 in 2010 to nearly $599,000 in 2025—an increase of about 93%. Growth remained modest through the mid-2010s but picked up dramatically from 2020 onward. The town’s increasing appeal among second-home buyers and retirees likely contributed to the surge.
Westerly – Beaches, Boomers, and High Demand

Westerly sits at the southwestern tip of Rhode Island, near the Connecticut border, with easy access to Long Island Sound. Its biggest draw is Misquamicut Beach, a summer hotspot with sandy shores and classic vacation charm. The town’s blend of quiet neighborhoods and vibrant summer tourism has made it a dual-attraction market for both full-time residents and vacation home seekers.
The post-2020 real estate boom was amplified in Westerly by buyers looking for coastal properties within a few hours’ drive of Boston and New York. Low housing inventory and growing demand, particularly for properties near the water, have helped drive up home values even during periods of broader market cooling.
13. Exeter – 121% Home Price Increase Since 2010
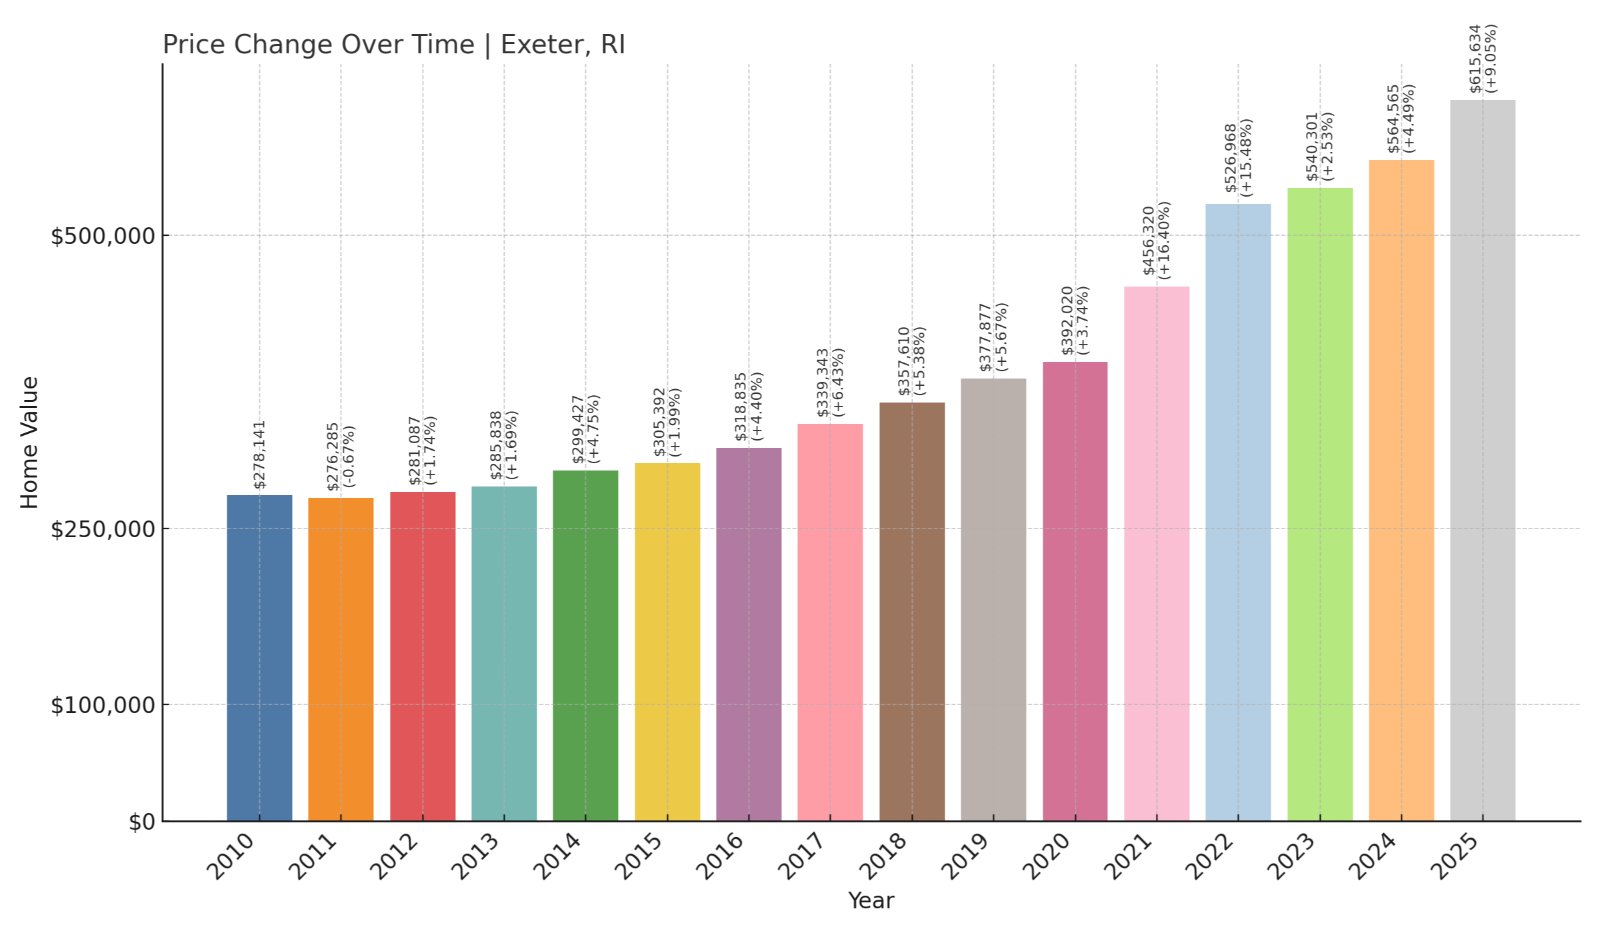
- 2010: $278,141
- 2011: $276,285 (-$1,856, -0.67% from previous year)
- 2012: $281,087 (+$4,803, +1.74% from previous year)
- 2013: $285,838 (+$4,750, +1.69% from previous year)
- 2014: $299,427 (+$13,589, +4.75% from previous year)
- 2015: $305,392 (+$5,965, +1.99% from previous year)
- 2016: $318,835 (+$13,442, +4.40% from previous year)
- 2017: $339,343 (+$20,509, +6.43% from previous year)
- 2018: $357,610 (+$18,267, +5.38% from previous year)
- 2019: $377,877 (+$20,267, +5.67% from previous year)
- 2020: $392,020 (+$14,143, +3.74% from previous year)
- 2021: $456,320 (+$64,300, +16.40% from previous year)
- 2022: $526,968 (+$70,647, +15.48% from previous year)
- 2023: $540,301 (+$13,333, +2.53% from previous year)
- 2024: $564,565 (+$24,264, +4.49% from previous year)
- 2025: $615,634 (+$51,070, +9.05% from previous year)
Home prices in Exeter have climbed by 121% since 2010, reaching $615,634 in 2025. While growth was slow but steady for much of the past decade, values began surging in 2021. Even with modest increases in 2023 and 2024, Exeter continues to trend upward.
Exeter – Quiet Living, Strong Price Climb
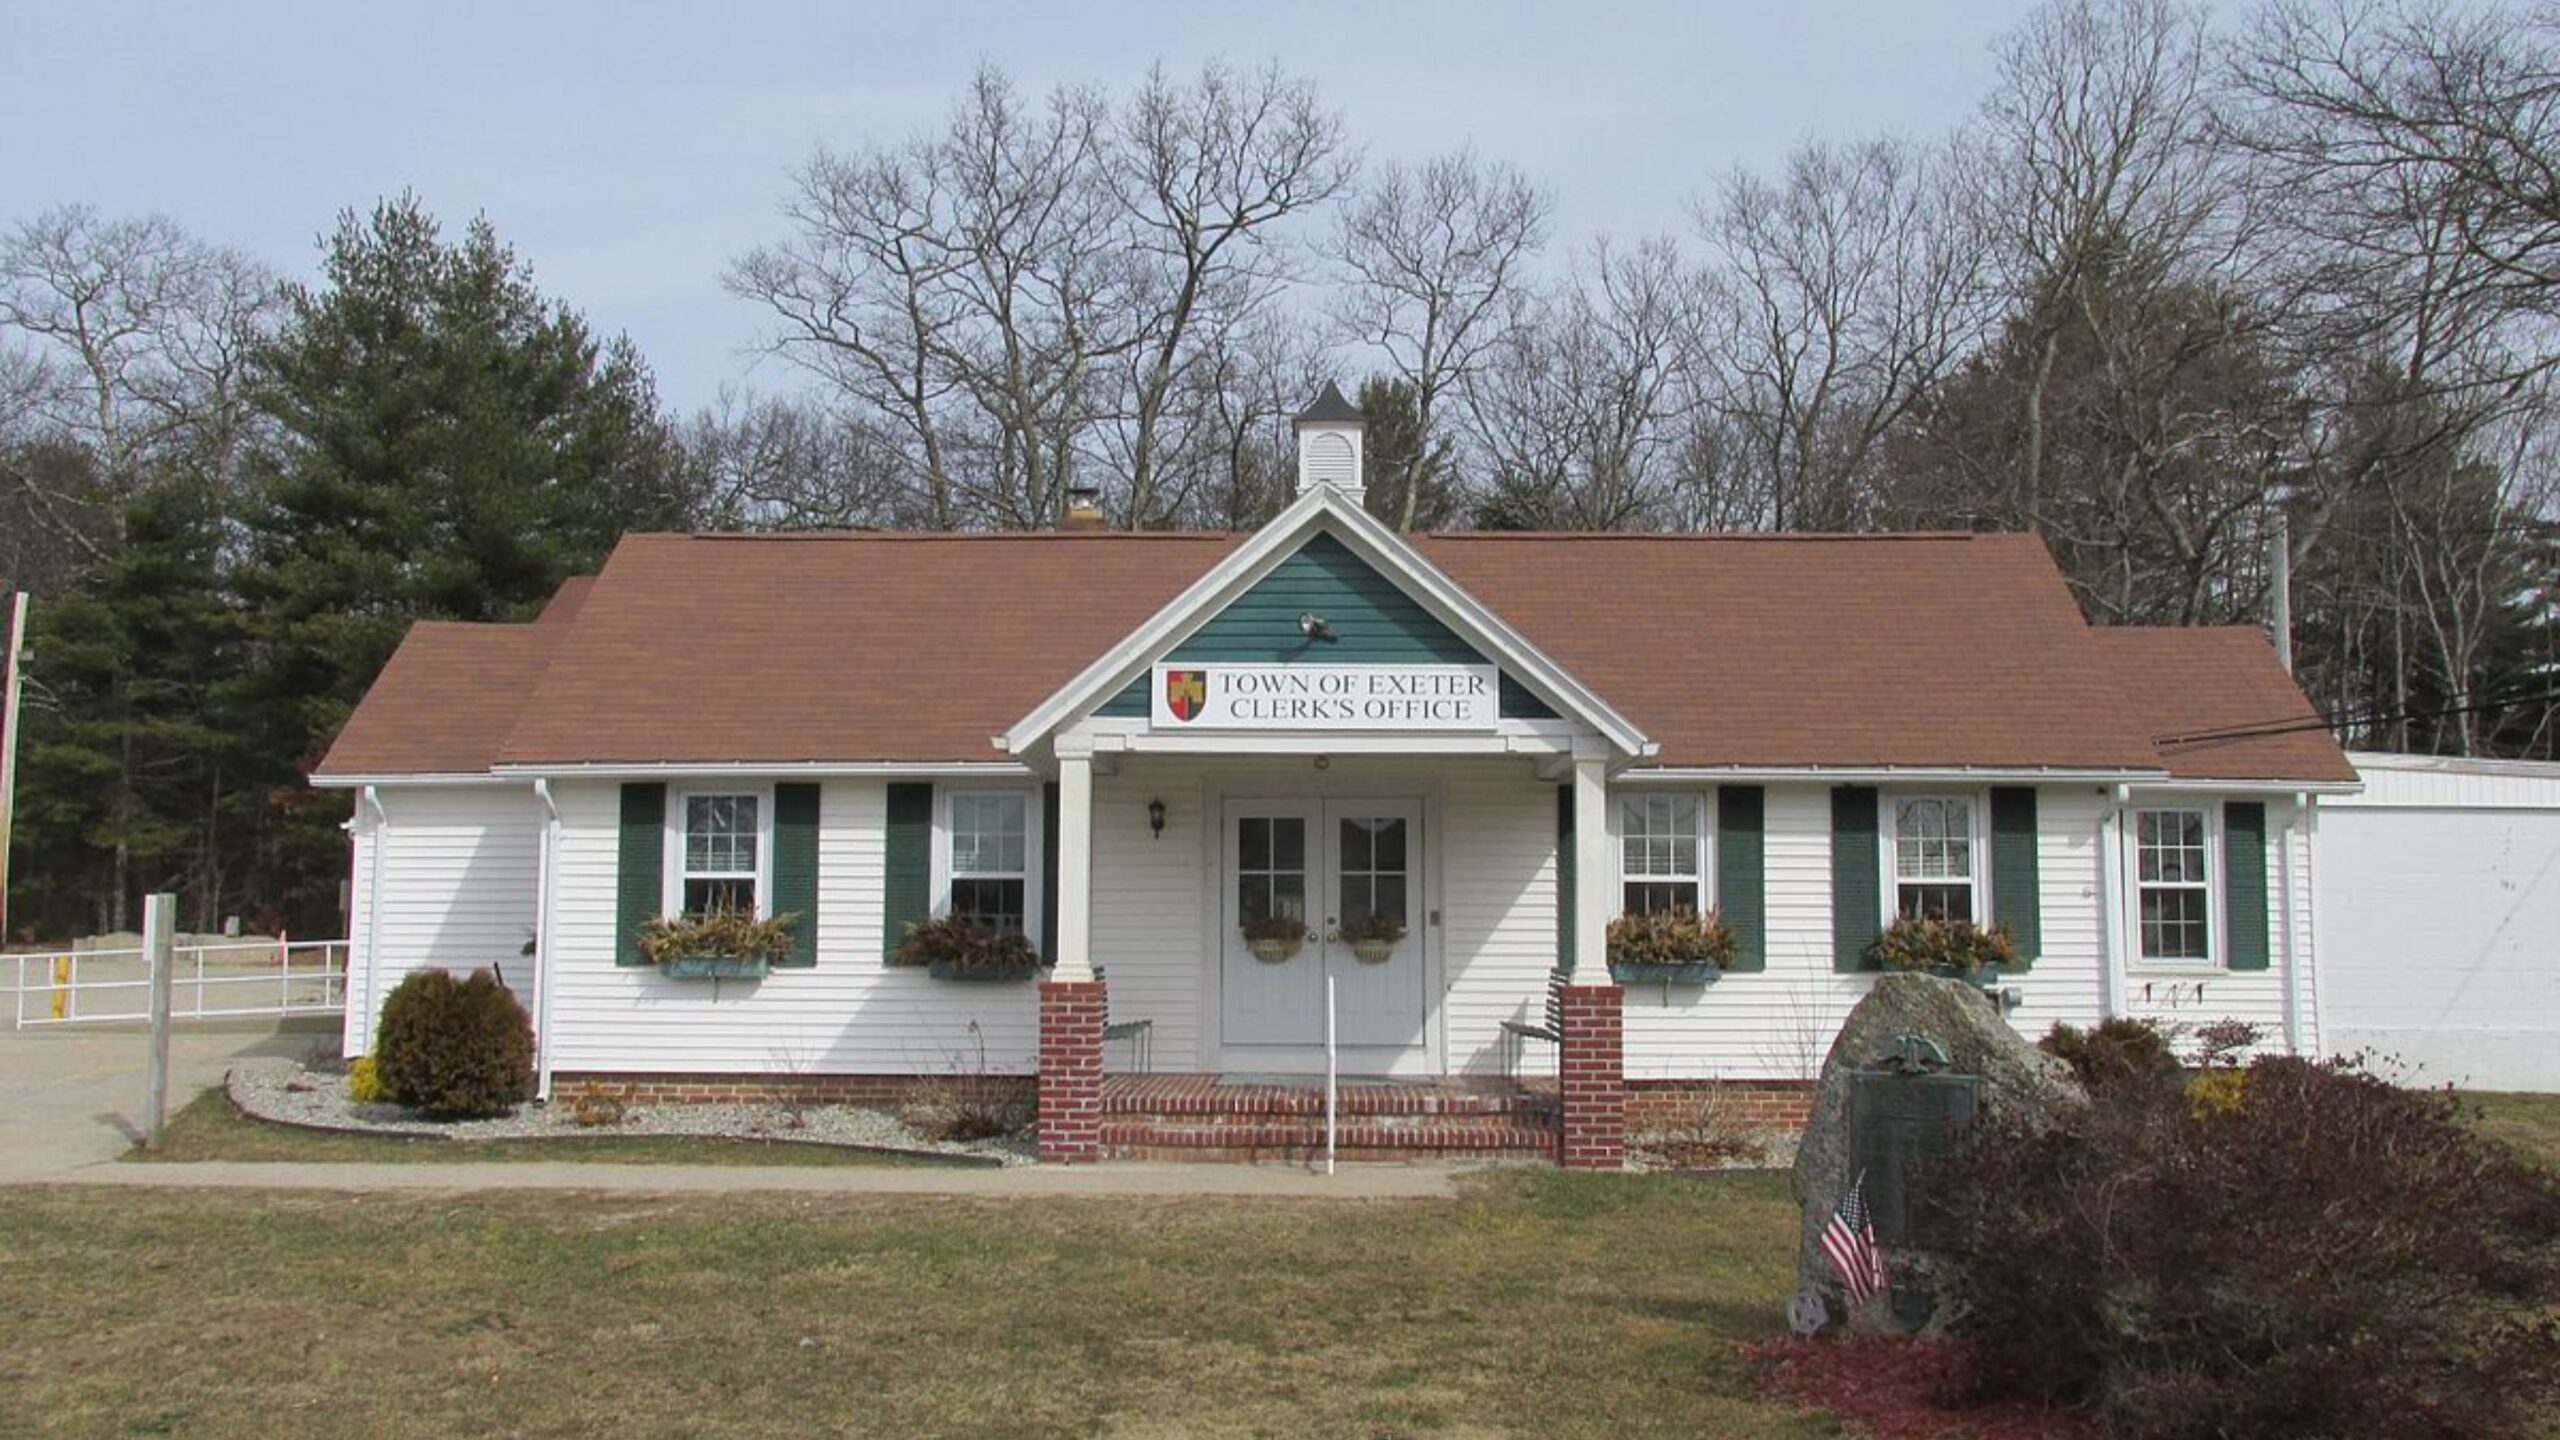
Exeter stands out as one of Rhode Island’s few landlocked towns, but it offers large lots, wooded settings, and a peaceful environment. It’s particularly attractive to buyers who prioritize privacy, space, and natural surroundings over coastline. Despite its inland setting, Exeter has seen an impressive jump in home prices—partly due to its proximity to both Providence and South County.
As remote work grew, Exeter benefited from an influx of homebuyers seeking rural charm without leaving the state. While it lacks a town center, its access to Route 102 and neighboring town amenities makes it a strategic choice for those seeking more home for their money while still seeing strong price appreciation.
12. North Kingstown – 105% Home Price Increase Since 2012
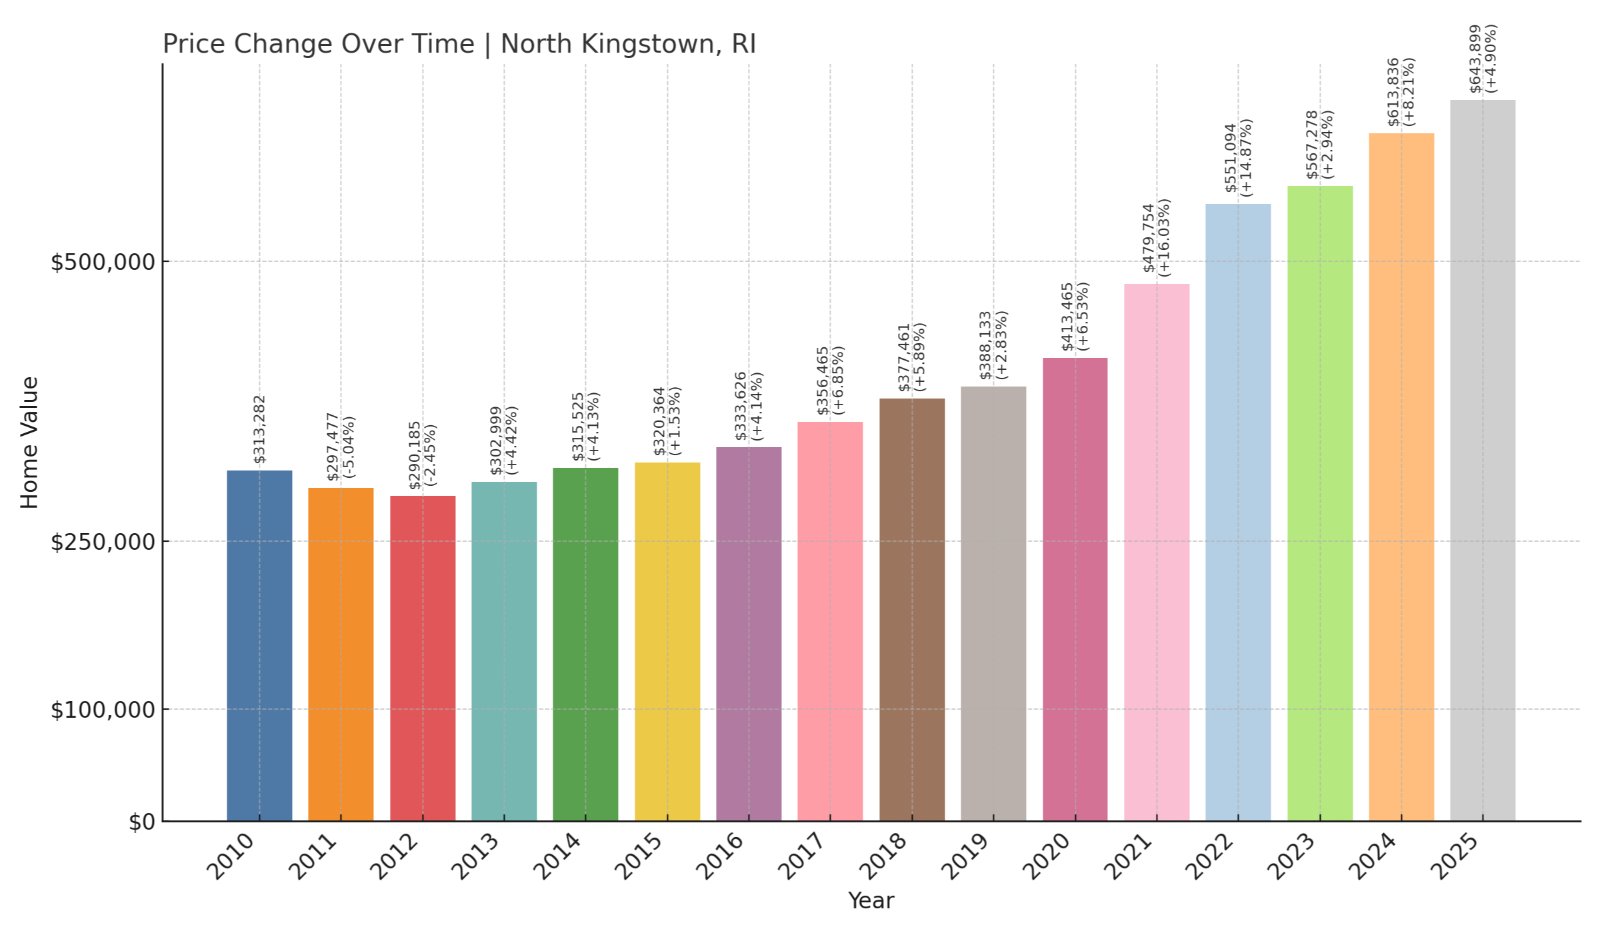
- 2010: $313,282
- 2011: $297,477 (-$15,805, -5.05% from previous year)
- 2012: $290,185 (-$7,292, -2.45% from previous year)
- 2013: $302,999 (+$12,814, +4.42% from previous year)
- 2014: $315,525 (+$12,527, +4.13% from previous year)
- 2015: $320,364 (+$4,839, +1.53% from previous year)
- 2016: $333,626 (+$13,262, +4.14% from previous year)
- 2017: $356,465 (+$22,839, +6.85% from previous year)
- 2018: $377,461 (+$20,997, +5.89% from previous year)
- 2019: $388,133 (+$10,672, +2.83% from previous year)
- 2020: $413,465 (+$25,332, +6.53% from previous year)
- 2021: $479,754 (+$66,289, +16.03% from previous year)
- 2022: $551,094 (+$71,341, +14.87% from previous year)
- 2023: $567,278 (+$16,184, +2.94% from previous year)
- 2024: $613,836 (+$46,557, +8.21% from previous year)
- 2025: $643,899 (+$30,063, +4.90% from previous year)
Since dipping in the early 2010s, North Kingstown’s home values have risen by 105% over the last 13 years, from $290,185 in 2012 to $643,899 in 2025. Steady gains were followed by a sharp pandemic-era surge, with growth continuing at a solid pace through 2025.
North Kingstown – Coastal Convenience With Room to Grow
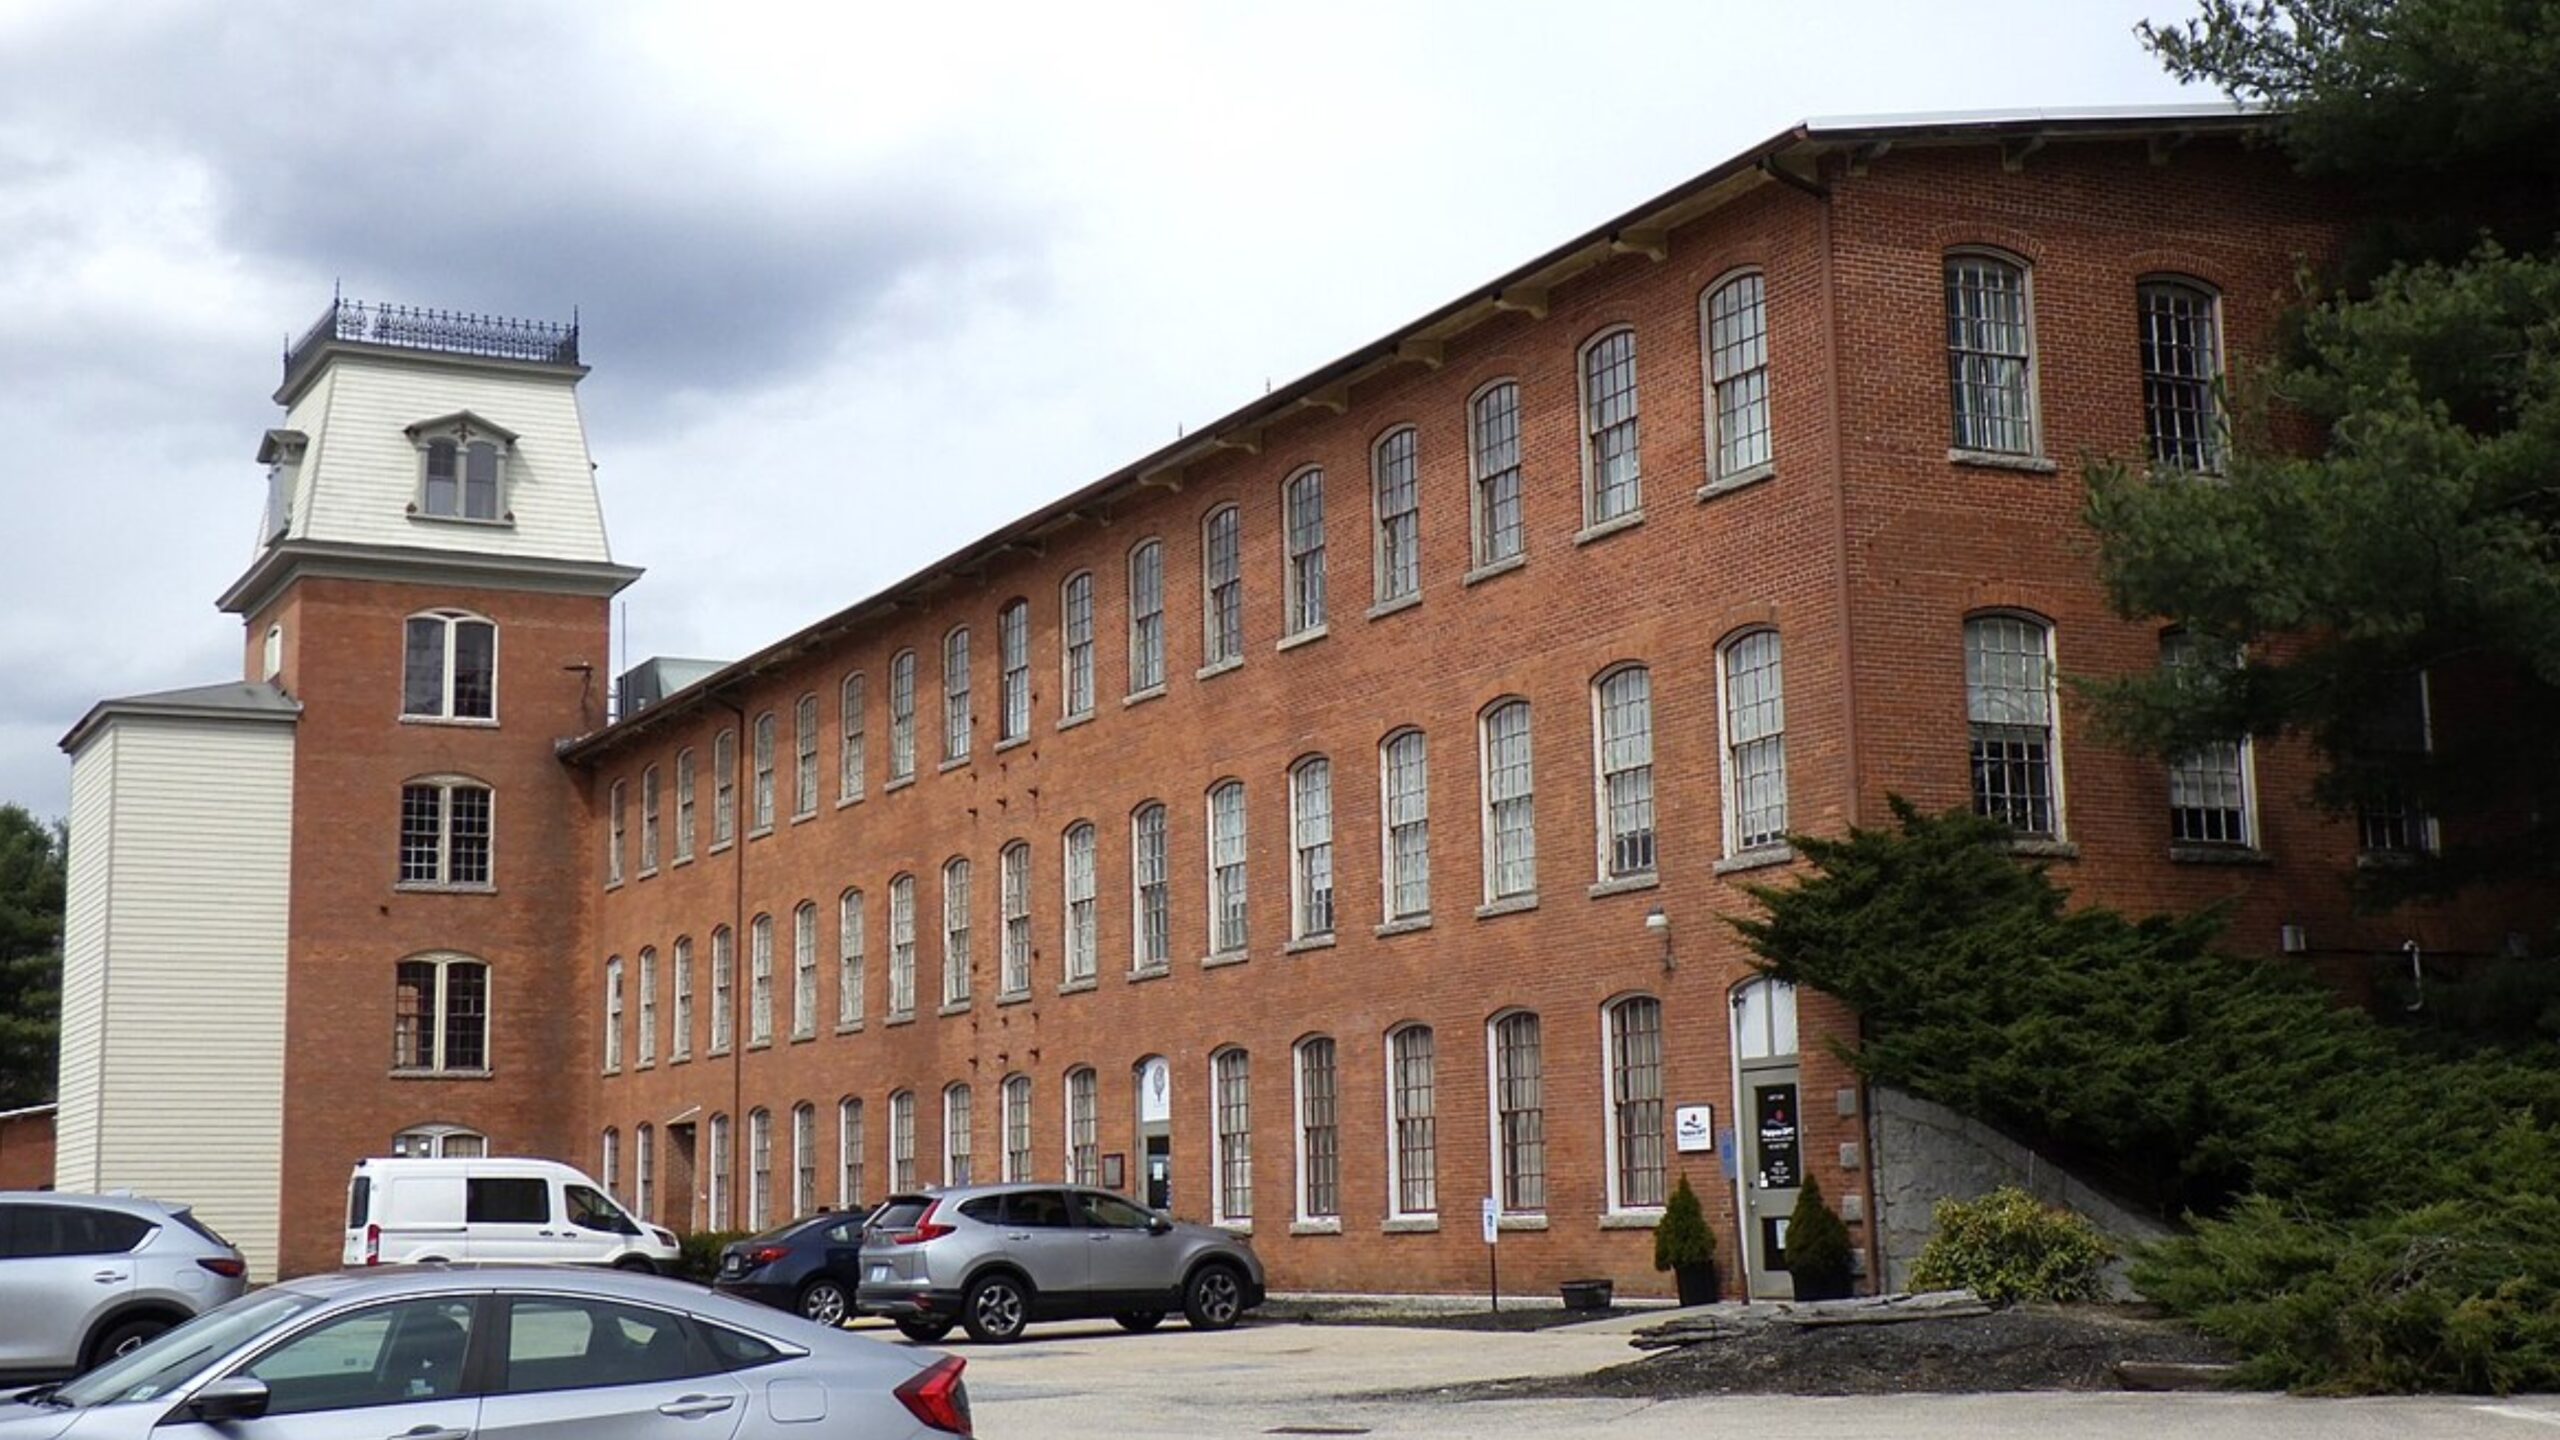
North Kingstown offers a blend of small-town feel and suburban convenience, with Wickford Village serving as a hub of local shops, marina life, and historic architecture. The town sits along Narragansett Bay and includes access to beaches, harbors, and the Quonset Business Park—a major employer in the region.
Its strategic location between Providence and Newport has made it popular with commuters and weekenders alike. As development spread southward from Providence and housing options dwindled closer to the coast, North Kingstown’s balance of accessibility and amenities led to consistent price appreciation. Despite market fluctuations, interest has remained high due to its blend of history, green space, and shoreline access.
11. Portsmouth – 107% Home Price Increase Since 2012

- 2010: $323,904
- 2011: $357,562 (+$33,658, +10.39% from previous year)
- 2012: $309,490 (-$48,072, -13.44% from previous year)
- 2013: $317,984 (+$8,494, +2.74% from previous year)
- 2014: $332,364 (+$14,380, +4.52% from previous year)
- 2015: $331,911 (-$454, -0.14% from previous year)
- 2016: $345,742 (+$13,831, +4.17% from previous year)
- 2017: $370,947 (+$25,205, +7.29% from previous year)
- 2018: $395,809 (+$24,862, +6.70% from previous year)
- 2019: $408,792 (+$12,983, +3.28% from previous year)
- 2020: $422,063 (+$13,271, +3.25% from previous year)
- 2021: $510,498 (+$88,436, +20.95% from previous year)
- 2022: $591,390 (+$80,892, +15.85% from previous year)
- 2023: $600,713 (+$9,322, +1.58% from previous year)
- 2024: $644,690 (+$43,977, +7.32% from previous year)
- 2025: $671,101 (+$26,411, +4.10% from previous year)
Portsmouth saw a drop in home values in 2012, but the market rebounded strongly afterward. Since 2012, prices have more than doubled—rising from $309,490 to $671,101 in 2025, a gain of about 117%. The town has benefited from both pandemic-era demand and its position on Aquidneck Island.
Portsmouth – Island Views, Growing Appeal

Portsmouth is the northernmost of the three towns on Aquidneck Island, offering scenic views of the Sakonnet River and easy access to beaches and marinas. It’s less tourist-heavy than neighboring Newport, making it popular with year-round residents who want coastal beauty without the summer crowds.
Portsmouth’s relatively spacious lots, combined with strong public schools and a quieter pace of life, have boosted its real estate appeal. In recent years, demand for second homes and retirement properties surged, especially in waterfront areas like Island Park and Common Fence Point. The town’s growth shows no signs of slowing as limited island inventory keeps pressure on prices.
10. South Kingstown – 109% Home Price Increase Since 2012
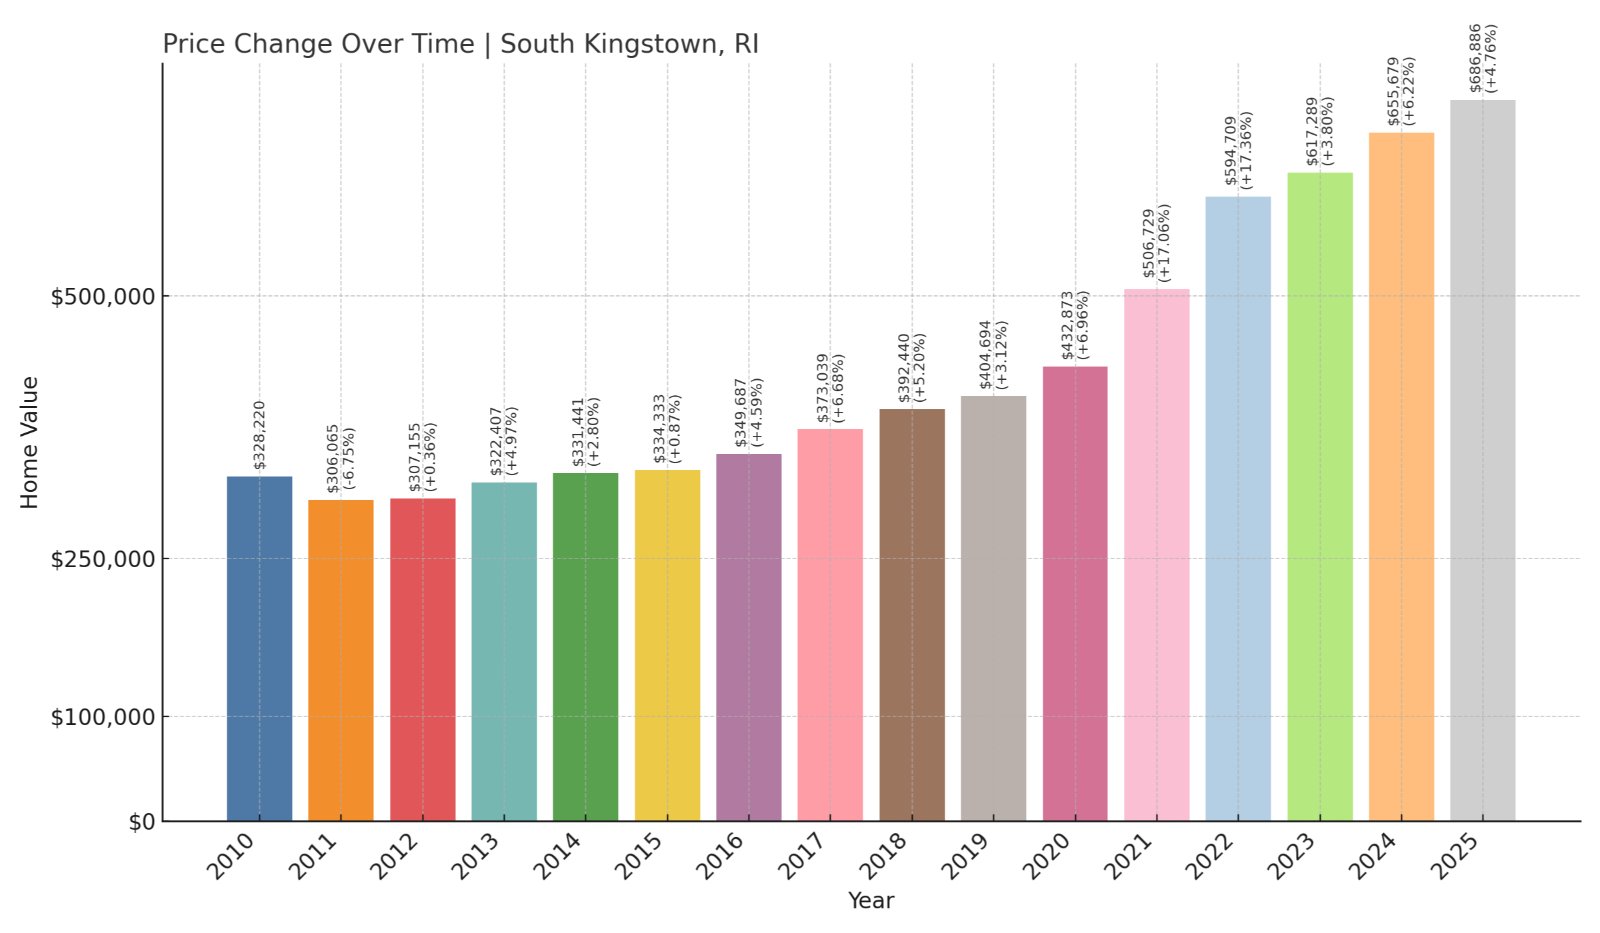
- 2010: $328,220
- 2011: $306,065 (-$22,155, -6.75% from previous year)
- 2012: $307,155 (+$1,090, +0.36% from previous year)
- 2013: $322,407 (+$15,251, +4.97% from previous year)
- 2014: $331,441 (+$9,035, +2.80% from previous year)
- 2015: $334,333 (+$2,892, +0.87% from previous year)
- 2016: $349,687 (+$15,354, +4.59% from previous year)
- 2017: $373,039 (+$23,352, +6.68% from previous year)
- 2018: $392,440 (+$19,402, +5.20% from previous year)
- 2019: $404,694 (+$12,254, +3.12% from previous year)
- 2020: $432,873 (+$28,178, +6.96% from previous year)
- 2021: $506,729 (+$73,857, +17.06% from previous year)
- 2022: $594,709 (+$87,980, +17.36% from previous year)
- 2023: $617,289 (+$22,580, +3.80% from previous year)
- 2024: $655,679 (+$38,390, +6.22% from previous year)
- 2025: $686,886 (+$31,207, +4.76% from previous year)
South Kingstown’s home values have jumped 109% since 2012, when the median price was just over $307,000. Growth picked up after 2015 and exploded after 2020, leading to a 2025 median value of $686,886.
South Kingstown – College Town Meets Coastal Rhode Island

Located in Washington County, South Kingstown is home to the University of Rhode Island, which gives the town a unique mix of youthful energy and long-term residents. It includes several villages such as Wakefield and Peace Dale, as well as access to beaches like Matunuck and Green Hill.
The town’s varied appeal—to students, faculty, retirees, and seasonal visitors—has kept real estate demand high. South Kingstown’s proximity to Narragansett and its array of cultural, educational, and recreational offerings have made it one of the fastest-growing housing markets in southern Rhode Island. The pandemic-era boom drove prices higher, but ongoing demand has kept the trajectory steady since.
9. Charlestown – 123% Home Price Increase Since 2012

🔥 Would you like to save this?
- 2010: $308,911
- 2011: $313,059 (+$4,147, +1.34% from previous year)
- 2012: $296,521 (-$16,538, -5.28% from previous year)
- 2013: $307,254 (+$10,733, +3.62% from previous year)
- 2014: $319,358 (+$12,104, +3.94% from previous year)
- 2015: $323,975 (+$4,617, +1.45% from previous year)
- 2016: $337,083 (+$13,108, +4.05% from previous year)
- 2017: $359,051 (+$21,968, +6.52% from previous year)
- 2018: $382,599 (+$23,547, +6.56% from previous year)
- 2019: $394,519 (+$11,920, +3.12% from previous year)
- 2020: $405,774 (+$11,255, +2.85% from previous year)
- 2021: $504,143 (+$98,369, +24.24% from previous year)
- 2022: $588,971 (+$84,827, +16.83% from previous year)
- 2023: $606,642 (+$17,671, +3.00% from previous year)
- 2024: $669,037 (+$62,395, +10.29% from previous year)
- 2025: $688,402 (+$19,365, +2.89% from previous year)
Charlestown has seen a 123% increase in home prices since 2012, rebounding quickly after a dip that year. From a low of $296,521 in 2012, prices surged past $688,000 by 2025. Big gains in 2021 and 2022 helped push Charlestown into the top 10 most expensive towns in Rhode Island.
Charlestown – Beach Town With Space and Privacy
Charlestown is a coastal town known for its long stretches of protected shoreline and a quiet, rural feel. Ninigret National Wildlife Refuge and Charlestown Beach are major attractions, and much of the area is kept intentionally low-density. This has created scarcity in the housing market—especially for waterfront properties.
The town attracts seasonal homeowners and year-round residents looking for space and tranquility. With limited new construction and a growing number of buyers from out of state, demand continues to outpace supply. The large jumps in 2021 and 2022 reflect a rush for coastal real estate, a trend that hasn’t fully abated in the years since.
8. Middletown – 136% Home Price Increase Since 2012
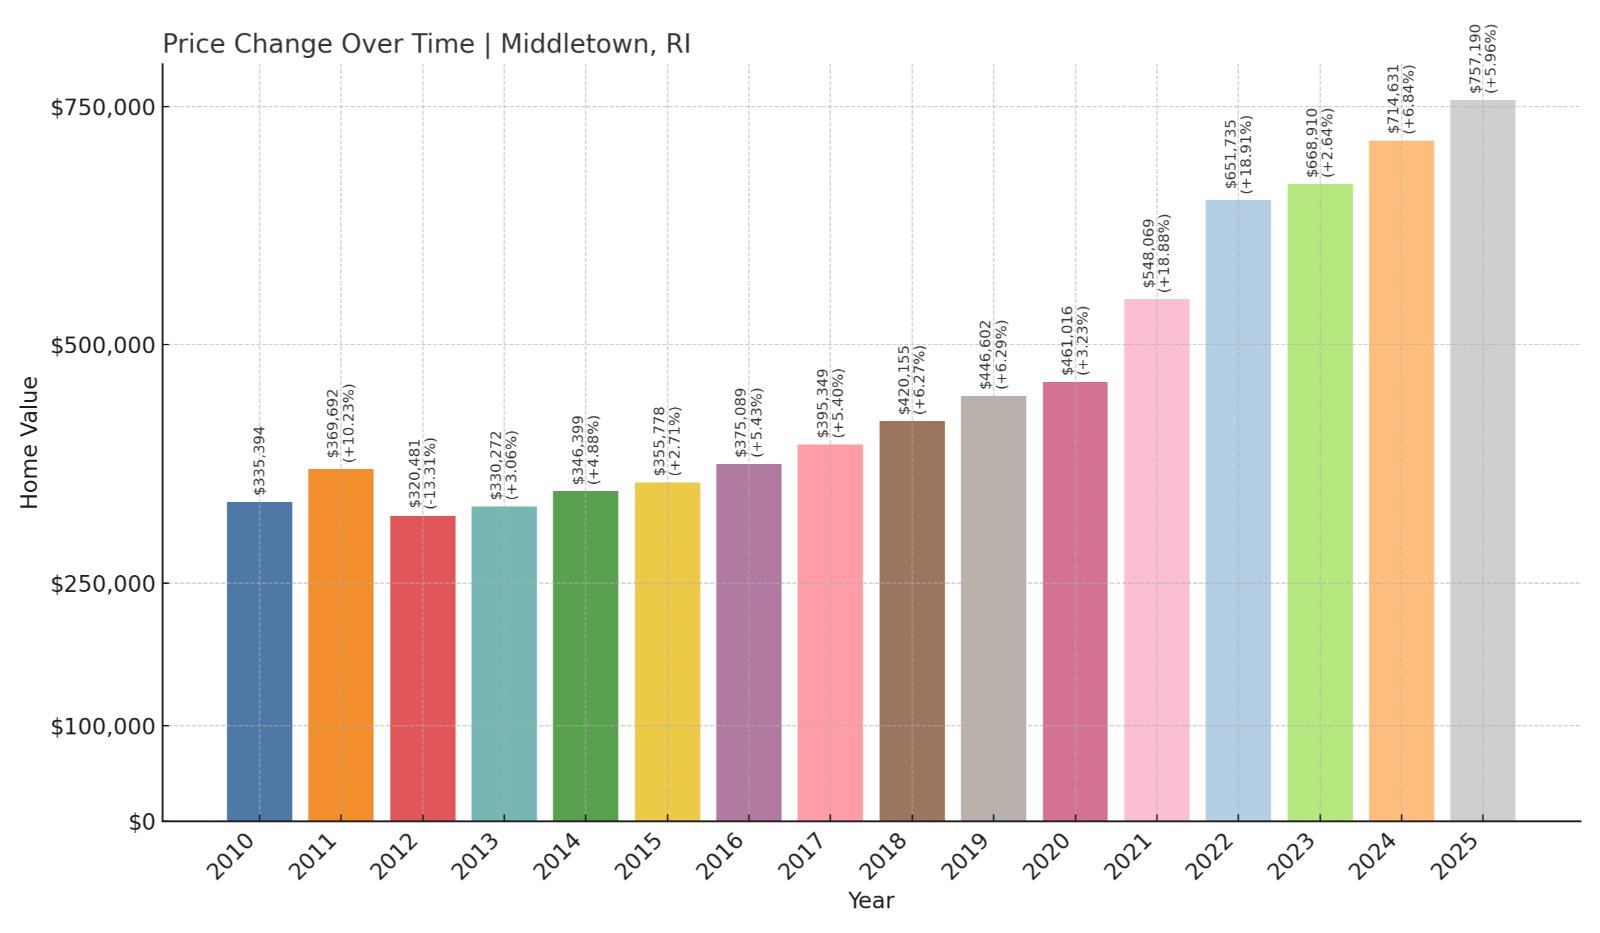
- 2010: $335,394
- 2011: $369,692 (+$34,298, +10.23% from previous year)
- 2012: $320,481 (-$49,211, -13.31% from previous year)
- 2013: $330,272 (+$9,791, +3.06% from previous year)
- 2014: $346,399 (+$16,127, +4.88% from previous year)
- 2015: $355,778 (+$9,379, +2.71% from previous year)
- 2016: $375,089 (+$19,311, +5.43% from previous year)
- 2017: $395,349 (+$20,260, +5.40% from previous year)
- 2018: $420,155 (+$24,806, +6.27% from previous year)
- 2019: $446,602 (+$26,447, +6.29% from previous year)
- 2020: $461,016 (+$14,413, +3.23% from previous year)
- 2021: $548,069 (+$87,054, +18.88% from previous year)
- 2022: $651,735 (+$103,666, +18.91% from previous year)
- 2023: $668,910 (+$17,174, +2.64% from previous year)
- 2024: $714,631 (+$45,722, +6.84% from previous year)
- 2025: $757,190 (+$42,559, +5.96% from previous year)
Middletown’s home values have jumped by 136% since 2012, when prices dipped to $320,481. Since then, values have risen steadily with particularly large increases in 2021 and 2022. By 2025, the median price surpassed $757,000.
Middletown – Between Newport Luxury and Ocean Views

Situated on Aquidneck Island, Middletown is flanked by Newport to the south and Portsmouth to the north. It offers a quieter residential experience compared to its famous neighbor but still enjoys access to beaches like Second Beach and Sachuest Point. The town’s mix of suburban neighborhoods and luxury coastal properties has made it a favorite for buyers who want Newport’s charm without Newport’s crowds.
The real estate market here surged as buyers sought second homes and retirement properties in scenic yet accessible areas. Middletown’s combination of coastal access, moderate density, and proximity to Newport’s cultural scene continues to drive strong demand and high property values.
7. Barrington – 138% Home Price Increase Since 2010

- 2010: $328,671
- 2011: $336,516 (+$7,846, +2.39% from previous year)
- 2012: $351,028 (+$14,511, +4.31% from previous year)
- 2013: $367,782 (+$16,754, +4.77% from previous year)
- 2014: $390,361 (+$22,579, +6.14% from previous year)
- 2015: $392,357 (+$1,995, +0.51% from previous year)
- 2016: $405,863 (+$13,506, +3.44% from previous year)
- 2017: $427,584 (+$21,720, +5.35% from previous year)
- 2018: $445,535 (+$17,951, +4.20% from previous year)
- 2019: $460,599 (+$15,064, +3.38% from previous year)
- 2020: $472,006 (+$11,407, +2.48% from previous year)
- 2021: $560,234 (+$88,227, +18.69% from previous year)
- 2022: $654,775 (+$94,541, +16.88% from previous year)
- 2023: $671,077 (+$16,301, +2.49% from previous year)
- 2024: $731,547 (+$60,470, +9.01% from previous year)
- 2025: $783,430 (+$51,883, +7.09% from previous year)
Barrington’s home prices have increased 138% since 2010. While the gains were consistent for much of the past decade, price jumps in the early 2020s helped accelerate its rise to one of the most expensive towns in Rhode Island.
Barrington – Elite Schools and Bayfront Living
Barrington has long been known for its highly rated public schools and scenic bayfront homes, making it a top choice for families. Located just southeast of Providence, it offers an easy commute while providing a peaceful, suburban setting. The town’s strict zoning laws and focus on community preservation have kept development low and demand high.
Buyers are often drawn to Barrington for its combination of academic excellence, waterfront views, and tight-knit community feel. Homes along the Barrington River and Narragansett Bay command premium prices, contributing to the town’s rapid appreciation. It’s a well-established enclave that continues to see steady real estate growth, especially among relocating professionals.
6. East Greenwich – 95% Home Price Increase Since 2012
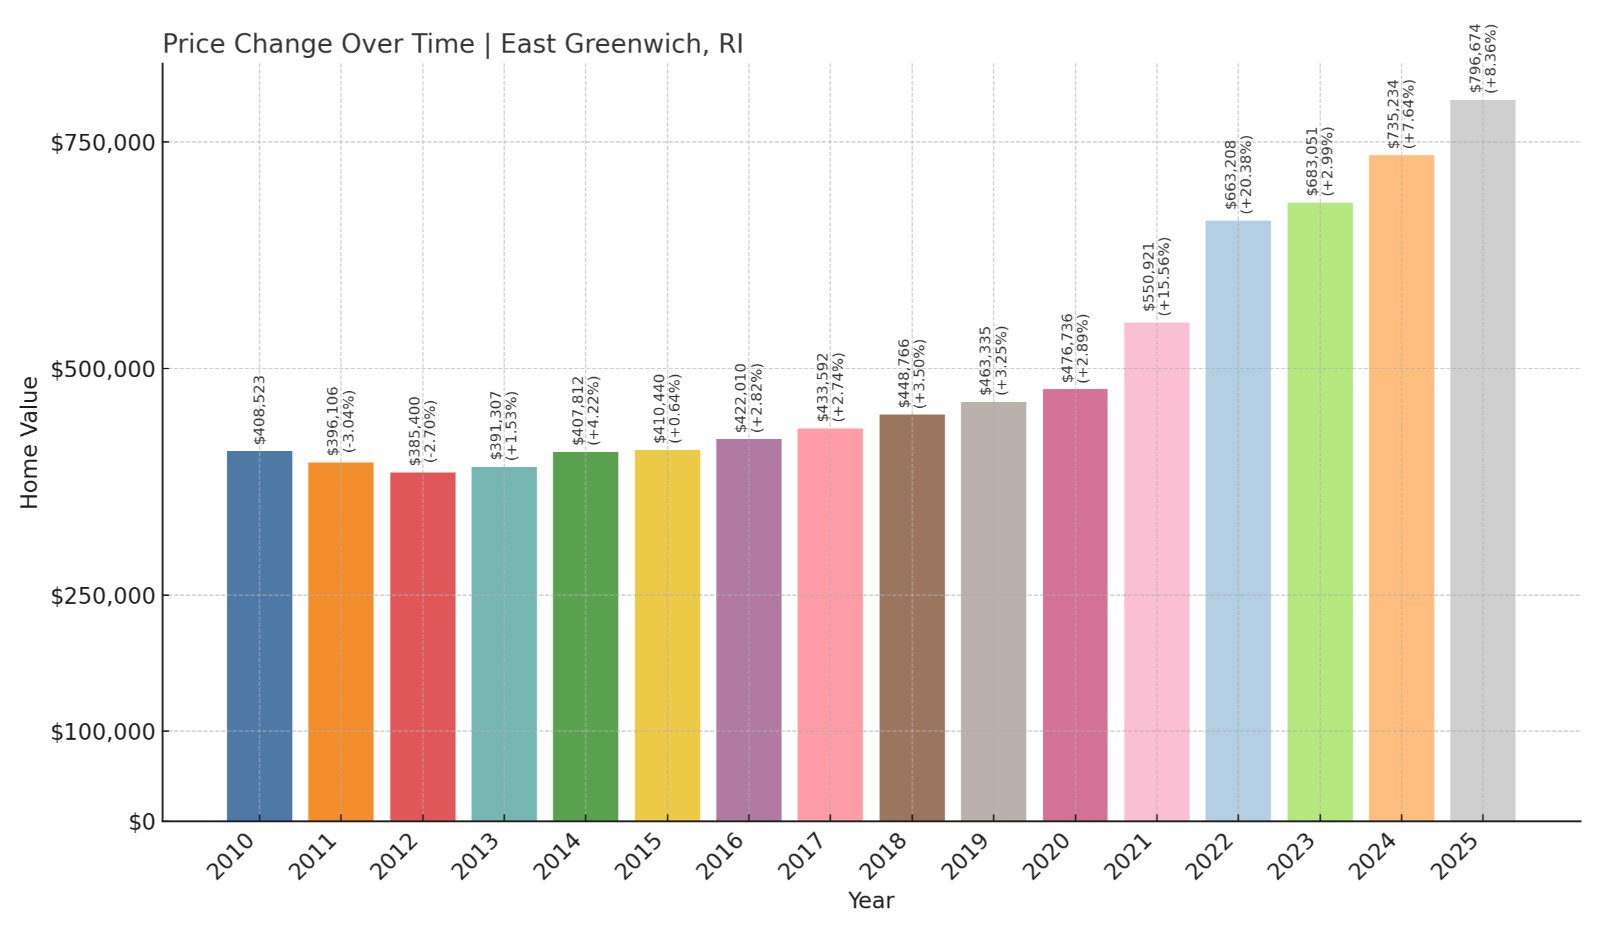
- 2010: $408,523
- 2011: $396,106 (-$12,417, -3.04% from previous year)
- 2012: $385,400 (-$10,706, -2.70% from previous year)
- 2013: $391,307 (+$5,907, +1.53% from previous year)
- 2014: $407,812 (+$16,504, +4.22% from previous year)
- 2015: $410,440 (+$2,628, +0.64% from previous year)
- 2016: $422,010 (+$11,571, +2.82% from previous year)
- 2017: $433,592 (+$11,582, +2.74% from previous year)
- 2018: $448,766 (+$15,174, +3.50% from previous year)
- 2019: $463,335 (+$14,569, +3.25% from previous year)
- 2020: $476,736 (+$13,400, +2.89% from previous year)
- 2021: $550,921 (+$74,185, +15.56% from previous year)
- 2022: $663,208 (+$112,287, +20.38% from previous year)
- 2023: $683,051 (+$19,844, +2.99% from previous year)
- 2024: $735,234 (+$52,183, +7.64% from previous year)
- 2025: $796,674 (+$61,440, +8.36% from previous year)
East Greenwich’s home values have risen by 95% since 2012, when they dropped to $385,400. The town saw especially sharp growth during 2021 and 2022, pushing prices to nearly $800,000 in 2025.
East Greenwich – Upscale Suburb With Historic Charm
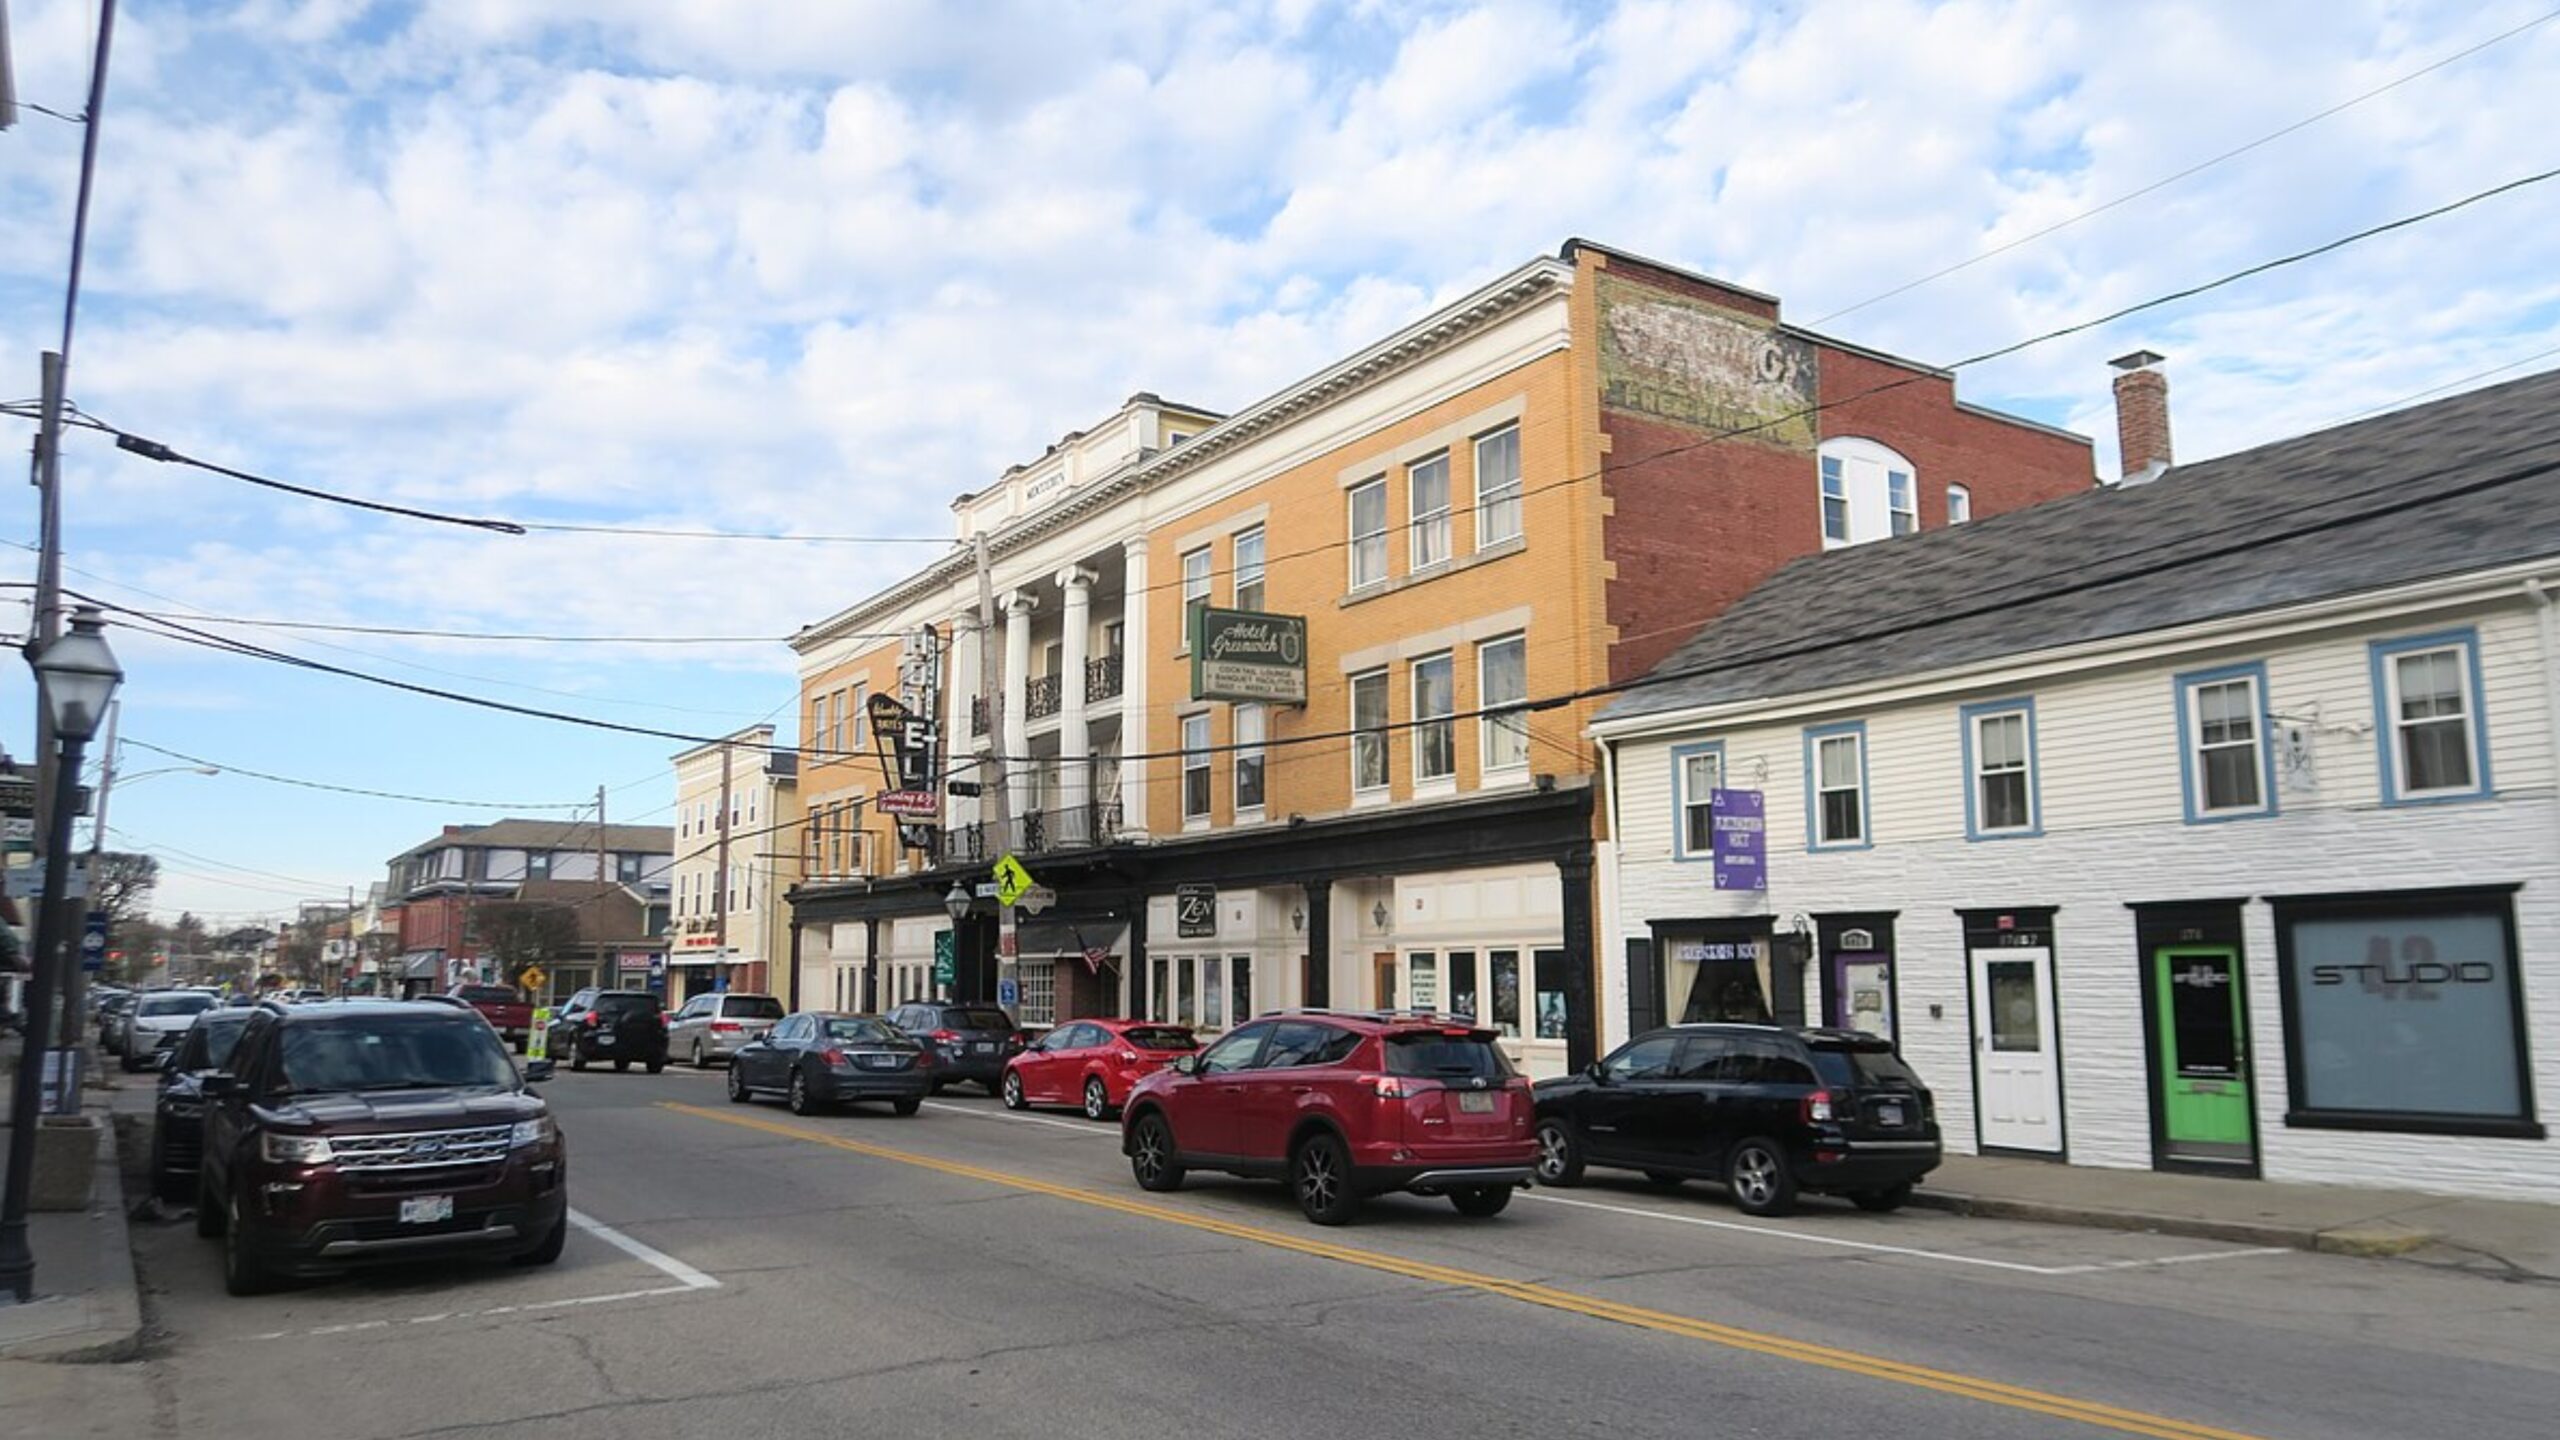
Often considered one of Rhode Island’s most affluent suburbs, East Greenwich offers a classic downtown lined with colonial buildings, restaurants, and boutique shops. The school district consistently ranks among the state’s best, and the town’s marina attracts boaters and visitors from around the region.
Its appeal lies in the balance of prestige and livability. With ample parks, high-end homes, and excellent schools, East Greenwich is a magnet for professionals and families looking for quality of life and long-term stability. These traits have helped drive—and sustain—its sharp rise in home values over the past decade.
5. Narragansett – 146% Home Price Increase Since 2010

- 2010: $339,408
- 2011: $336,663 (-$2,745, -0.81% from previous year)
- 2012: $337,004 (+$341, +0.10% from previous year)
- 2013: $348,563 (+$11,559, +3.43% from previous year)
- 2014: $358,965 (+$10,401, +2.98% from previous year)
- 2015: $369,181 (+$10,216, +2.85% from previous year)
- 2016: $386,989 (+$17,808, +4.82% from previous year)
- 2017: $405,991 (+$19,002, +4.91% from previous year)
- 2018: $430,247 (+$24,256, +5.97% from previous year)
- 2019: $460,527 (+$30,280, +7.04% from previous year)
- 2020: $474,105 (+$13,578, +2.95% from previous year)
- 2021: $588,547 (+$114,442, +24.14% from previous year)
- 2022: $694,707 (+$106,161, +18.04% from previous year)
- 2023: $718,174 (+$23,466, +3.38% from previous year)
- 2024: $757,355 (+$39,181, +5.46% from previous year)
- 2025: $836,118 (+$78,763, +10.40% from previous year)
Since 2010, Narragansett home prices have surged by 146%, making it one of the top gainers in the state. What began as a gradual climb accelerated rapidly starting in 2020, culminating in a median value of over $836,000 in 2025.
Narragansett – Surging Demand in a Seaside Favorite
Famous for its beaches, surf spots, and charming neighborhoods like Point Judith and Bonnet Shores, Narragansett is a long-time summer destination that has become a year-round real estate hotspot. Its appeal is obvious: ocean views, proximity to URI, and a laid-back lifestyle that still offers easy access to major highways.
With strong demand from vacation home buyers and retiring baby boomers, coupled with tight inventory, the town has seen continuous price increases. The explosive growth in 2021 and 2022 reflects a pandemic-era push for coastal living. Even as the pace has slowed, the town’s fundamentals keep it among the most expensive in the state.
4. Newport – 138% Home Price Increase Since 2012
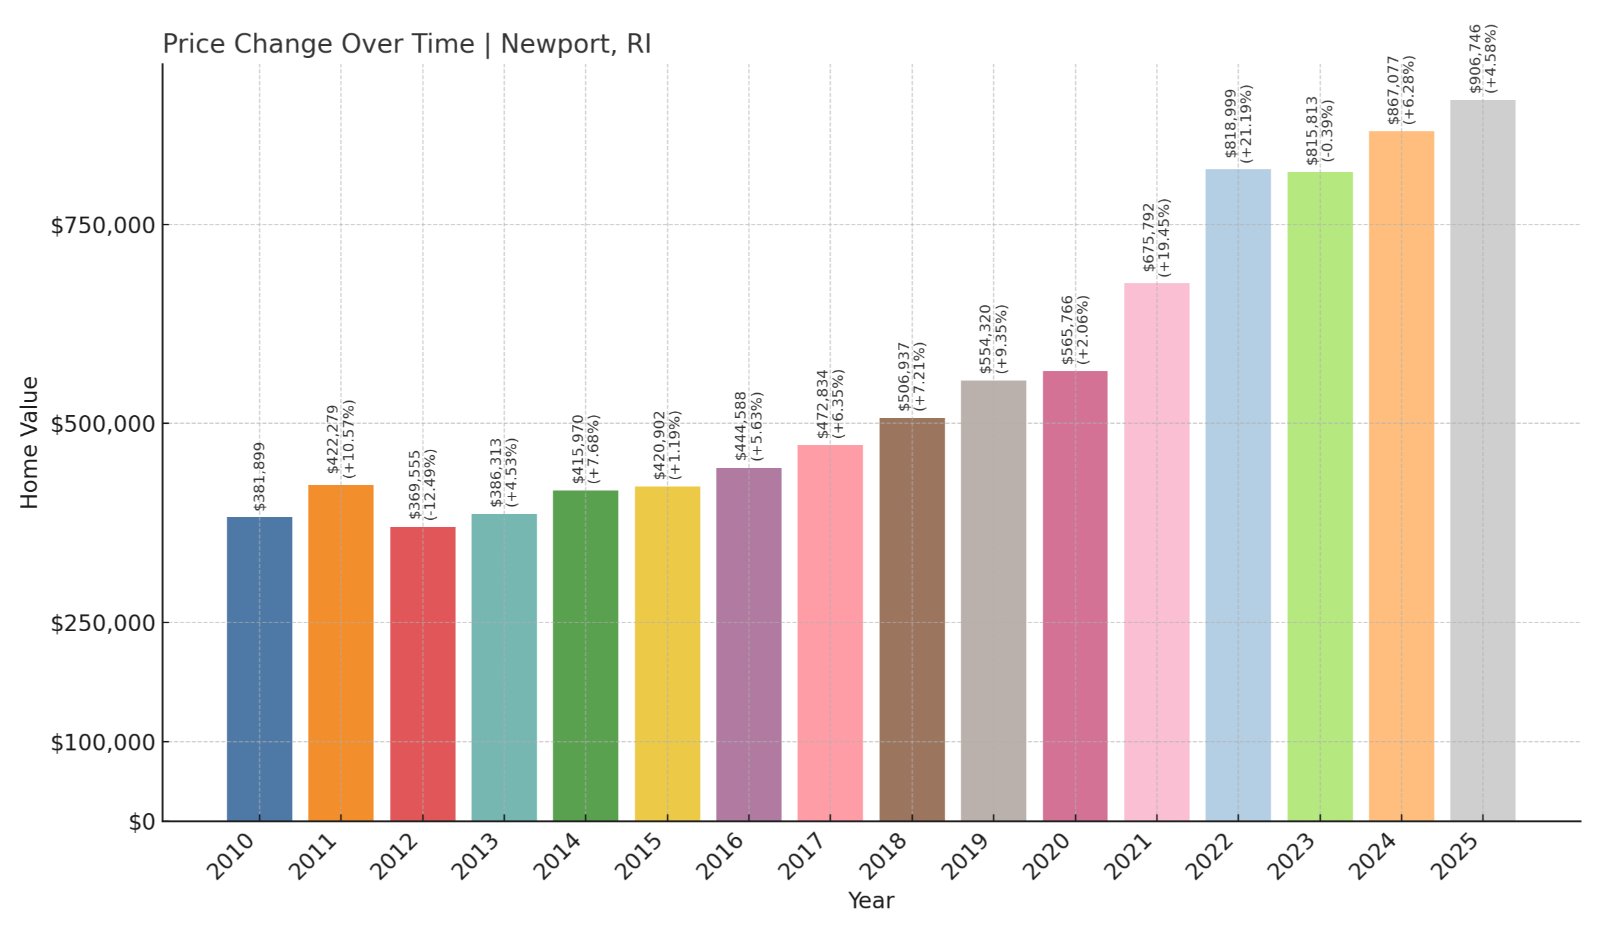
- 2010: $381,899
- 2011: $422,279 (+$40,380, +10.57% from previous year)
- 2012: $369,555 (-$52,724, -12.49% from previous year)
- 2013: $386,313 (+$16,758, +4.53% from previous year)
- 2014: $415,970 (+$29,657, +7.68% from previous year)
- 2015: $420,902 (+$4,932, +1.19% from previous year)
- 2016: $444,588 (+$23,686, +5.63% from previous year)
- 2017: $472,834 (+$28,247, +6.35% from previous year)
- 2018: $506,937 (+$34,103, +7.21% from previous year)
- 2019: $554,320 (+$47,383, +9.35% from previous year)
- 2020: $565,766 (+$11,445, +2.06% from previous year)
- 2021: $675,792 (+$110,026, +19.45% from previous year)
- 2022: $818,999 (+$143,207, +21.19% from previous year)
- 2023: $815,813 (-$3,186, -0.39% from previous year)
- 2024: $867,077 (+$51,263, +6.28% from previous year)
- 2025: $906,746 (+$39,670, +4.58% from previous year)
Despite a brief dip in 2012, Newport’s home prices have grown by 138% in just over a decade. After skyrocketing in 2021 and 2022, values stabilized but remained high, reaching over $906,000 in 2025.
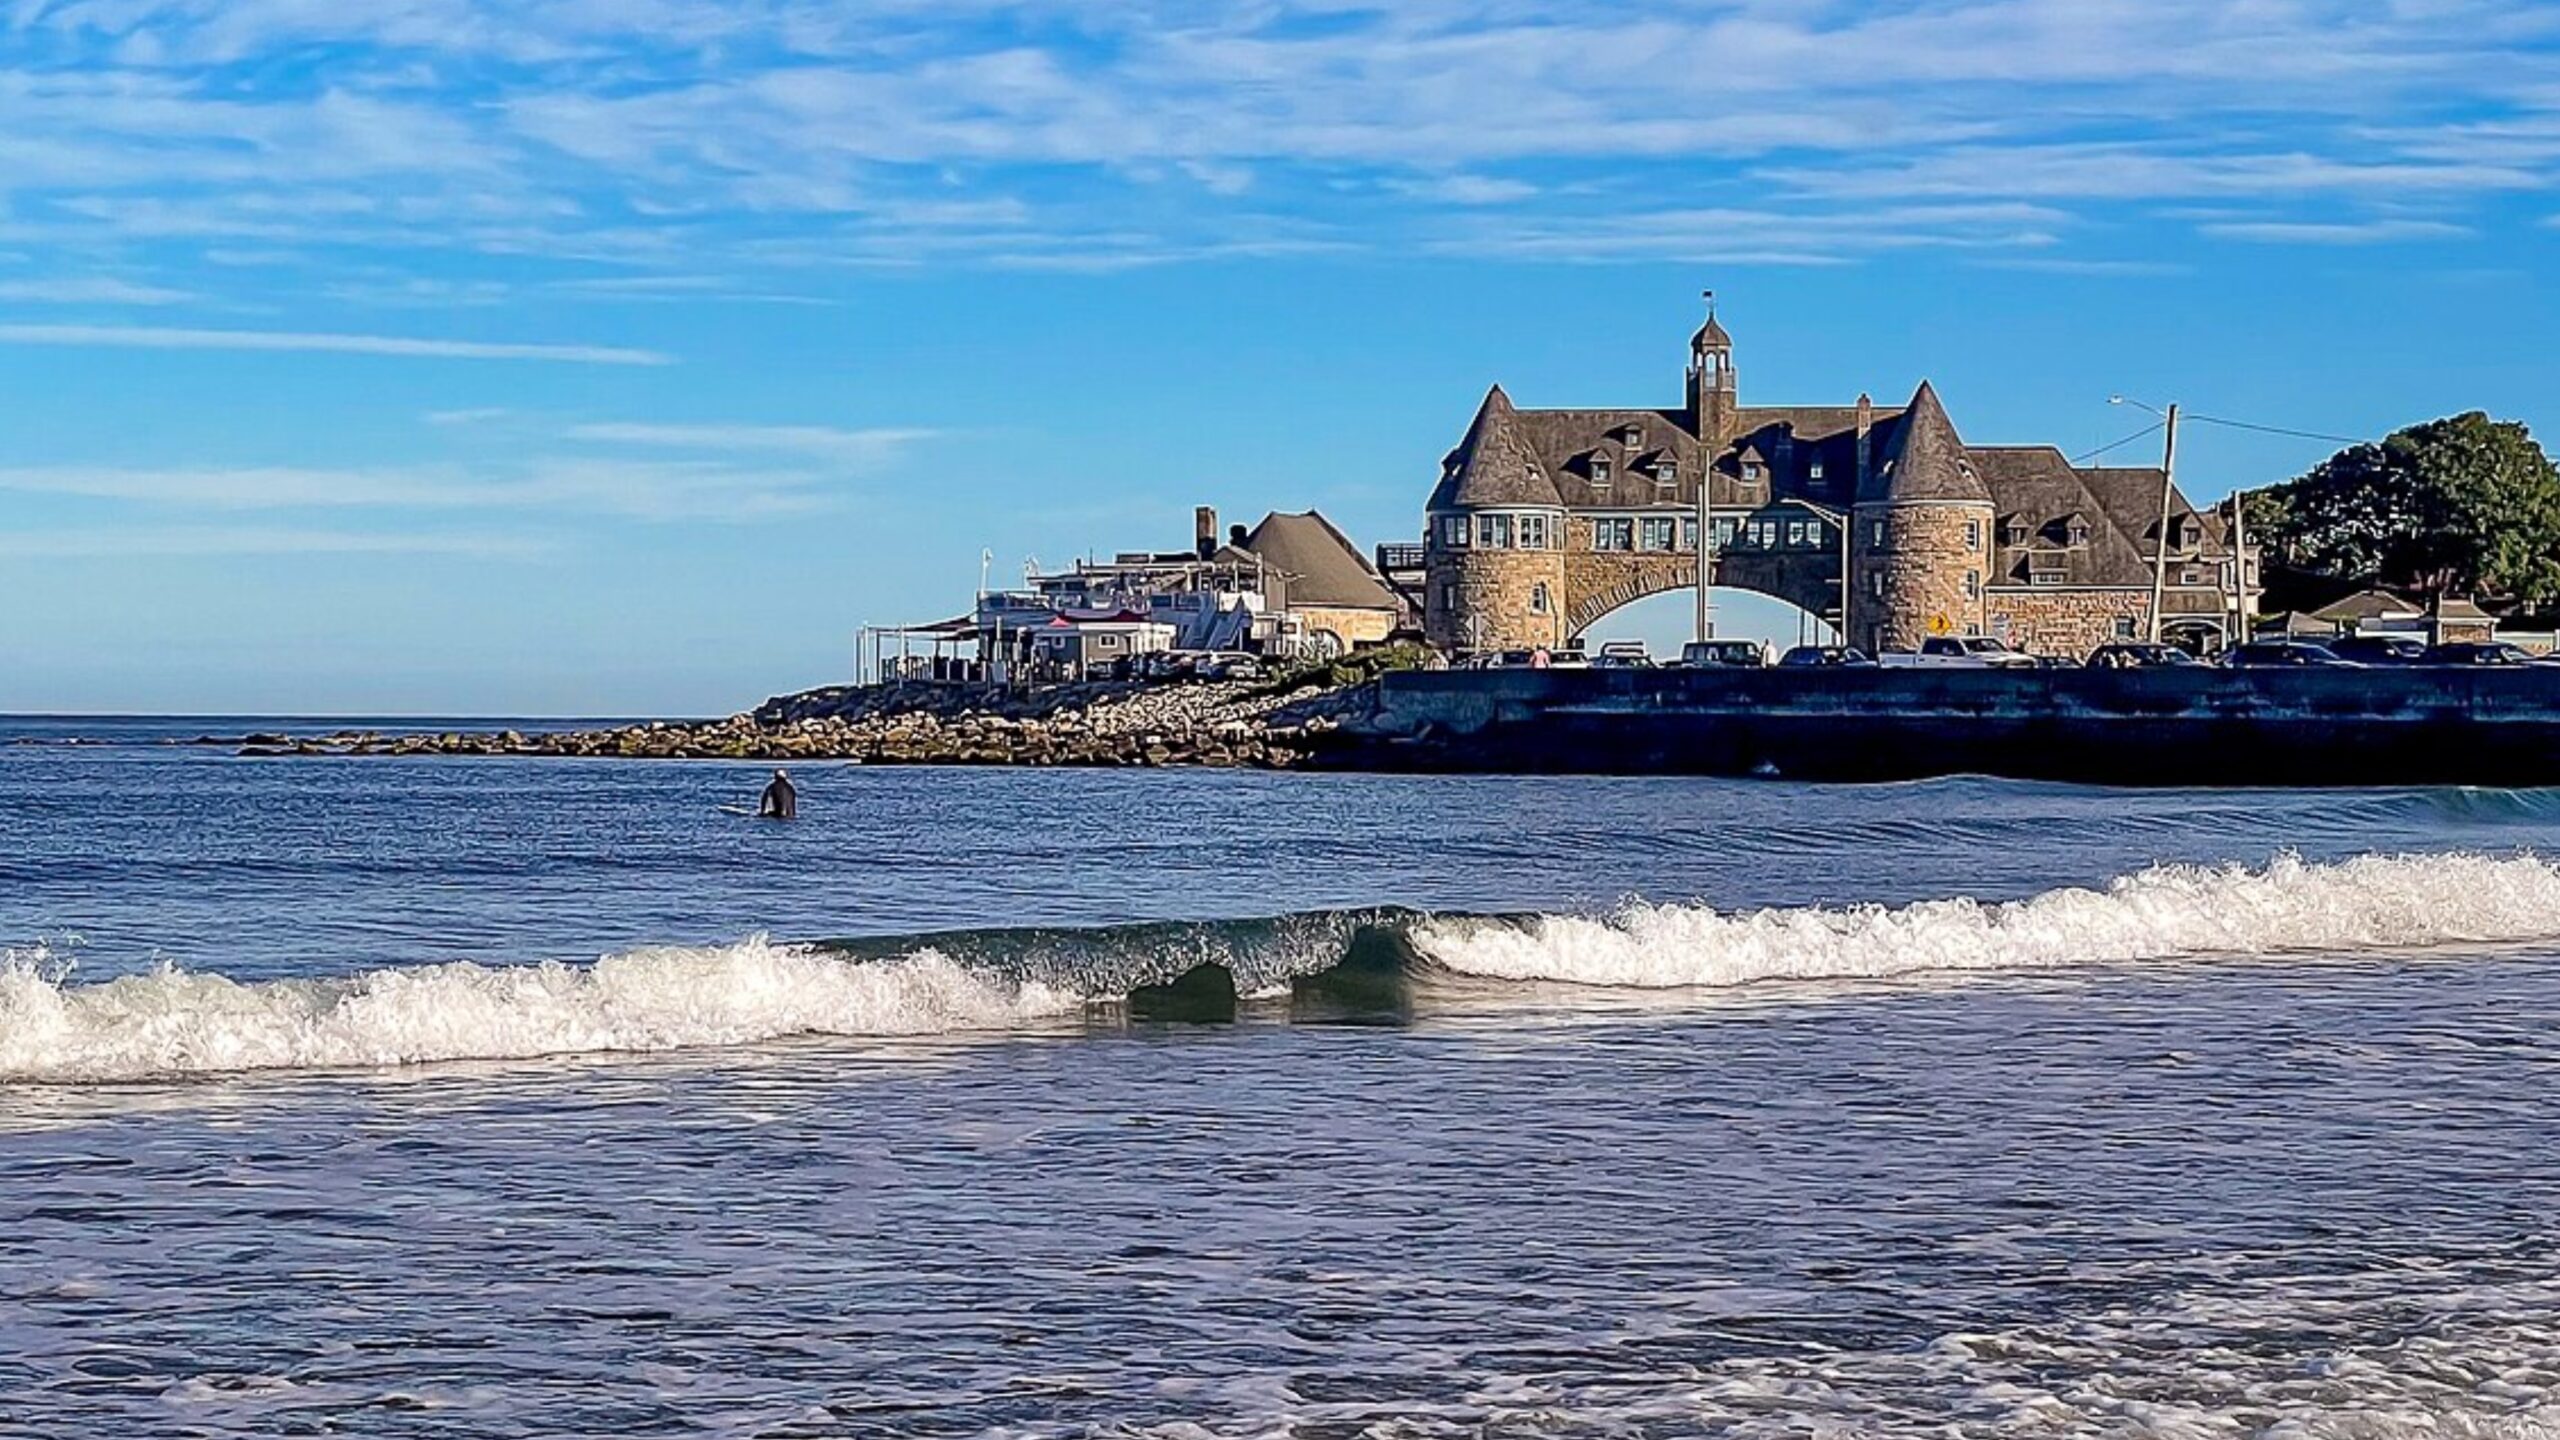
Newport – Luxury, Legacy, and Sky-High Prices

A storied city known for its Gilded Age mansions and sailing legacy, Newport has long attracted affluent buyers from the Northeast and beyond. The city blends high-end real estate with cultural institutions, beaches, and seasonal tourism. Thames Street and the Cliff Walk add to its charm and draw.
Prices rose sharply during the pandemic as luxury buyers sought exclusive retreats. Newport’s limited supply of historic homes and premium waterfront real estate continues to drive competition. While affordability is a concern, demand has yet to cool significantly, and the city remains one of Rhode Island’s most expensive markets.
3. Little Compton – 127% Home Price Increase Since 2012

🔥 Would you like to save this?
- 2012: $416,540
- 2013: $442,759 (+$26,219, +6.29% from previous year)
- 2014: $452,300 (+$9,541, +2.15% from previous year)
- 2015: $470,059 (+$17,759, +3.93% from previous year)
- 2016: $493,054 (+$22,995, +4.89% from previous year)
- 2017: $516,603 (+$23,549, +4.78% from previous year)
- 2018: $537,990 (+$21,388, +4.14% from previous year)
- 2019: $558,447 (+$20,457, +3.80% from previous year)
- 2020: $557,129 (-$1,318, -0.24% from previous year)
- 2021: $688,581 (+$131,452, +23.59% from previous year)
- 2022: $832,730 (+$144,149, +20.93% from previous year)
- 2023: $848,282 (+$15,552, +1.87% from previous year)
- 2024: $937,924 (+$89,643, +10.57% from previous year)
- 2025: $946,530 (+$8,606, +0.92% from previous year)
Little Compton’s home values have grown by 127% since 2012, peaking sharply after 2020. Though price increases slowed in 2023 and 2025, the town remains among Rhode Island’s priciest markets.
Little Compton – Quiet Coastlines and Exclusive Living
Tucked into Rhode Island’s southeastern corner, Little Compton offers a rural, agrarian lifestyle with stunning ocean views. It’s known for farmland, stone walls, and expansive private estates. The town has resisted large-scale development, and much of the coastline is preserved or restricted.
This exclusivity fuels high home prices, especially during the recent boom in luxury rural real estate. With limited inventory and increasing demand from out-of-state buyers, Little Compton’s prices soared between 2020 and 2022. Though the pace has slowed, the town remains a premium market defined by scarcity and privacy.
2. Jamestown – 126% Home Price Increase Since 2012
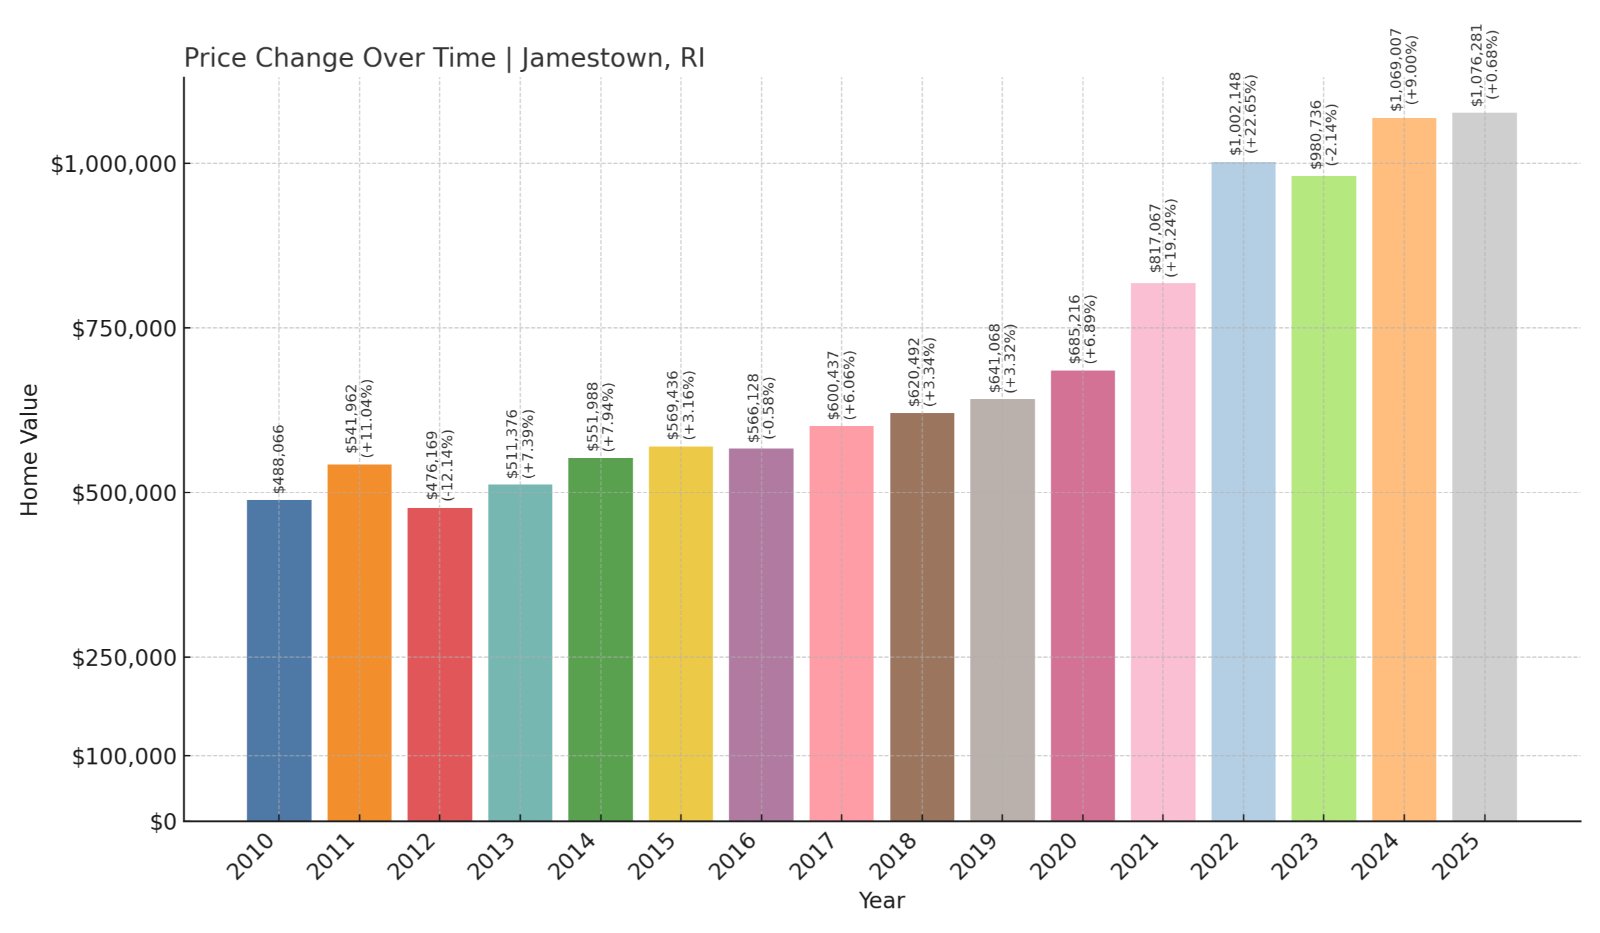
- 2010: $488,066
- 2011: $541,962 (+$53,896, +11.04% from previous year)
- 2012: $476,169 (-$65,793, -12.14% from previous year)
- 2013: $511,376 (+$35,207, +7.39% from previous year)
- 2014: $551,988 (+$40,612, +7.94% from previous year)
- 2015: $569,436 (+$17,448, +3.16% from previous year)
- 2016: $566,128 (-$3,308, -0.58% from previous year)
- 2017: $600,437 (+$34,309, +6.06% from previous year)
- 2018: $620,492 (+$20,054, +3.34% from previous year)
- 2019: $641,068 (+$20,577, +3.32% from previous year)
- 2020: $685,216 (+$44,148, +6.89% from previous year)
- 2021: $817,067 (+$131,851, +19.24% from previous year)
- 2022: $1,002,148 (+$185,080, +22.65% from previous year)
- 2023: $980,736 (-$21,412, -2.14% from previous year)
- 2024: $1,069,007 (+$88,271, +9.00% from previous year)
- 2025: $1,076,281 (+$7,274, +0.68% from previous year)
From a low of $476,169 in 2012, Jamestown’s home prices have climbed 126% to reach over $1.07 million in 2025. The town crossed the million-dollar threshold in 2022 and has maintained strong values since.
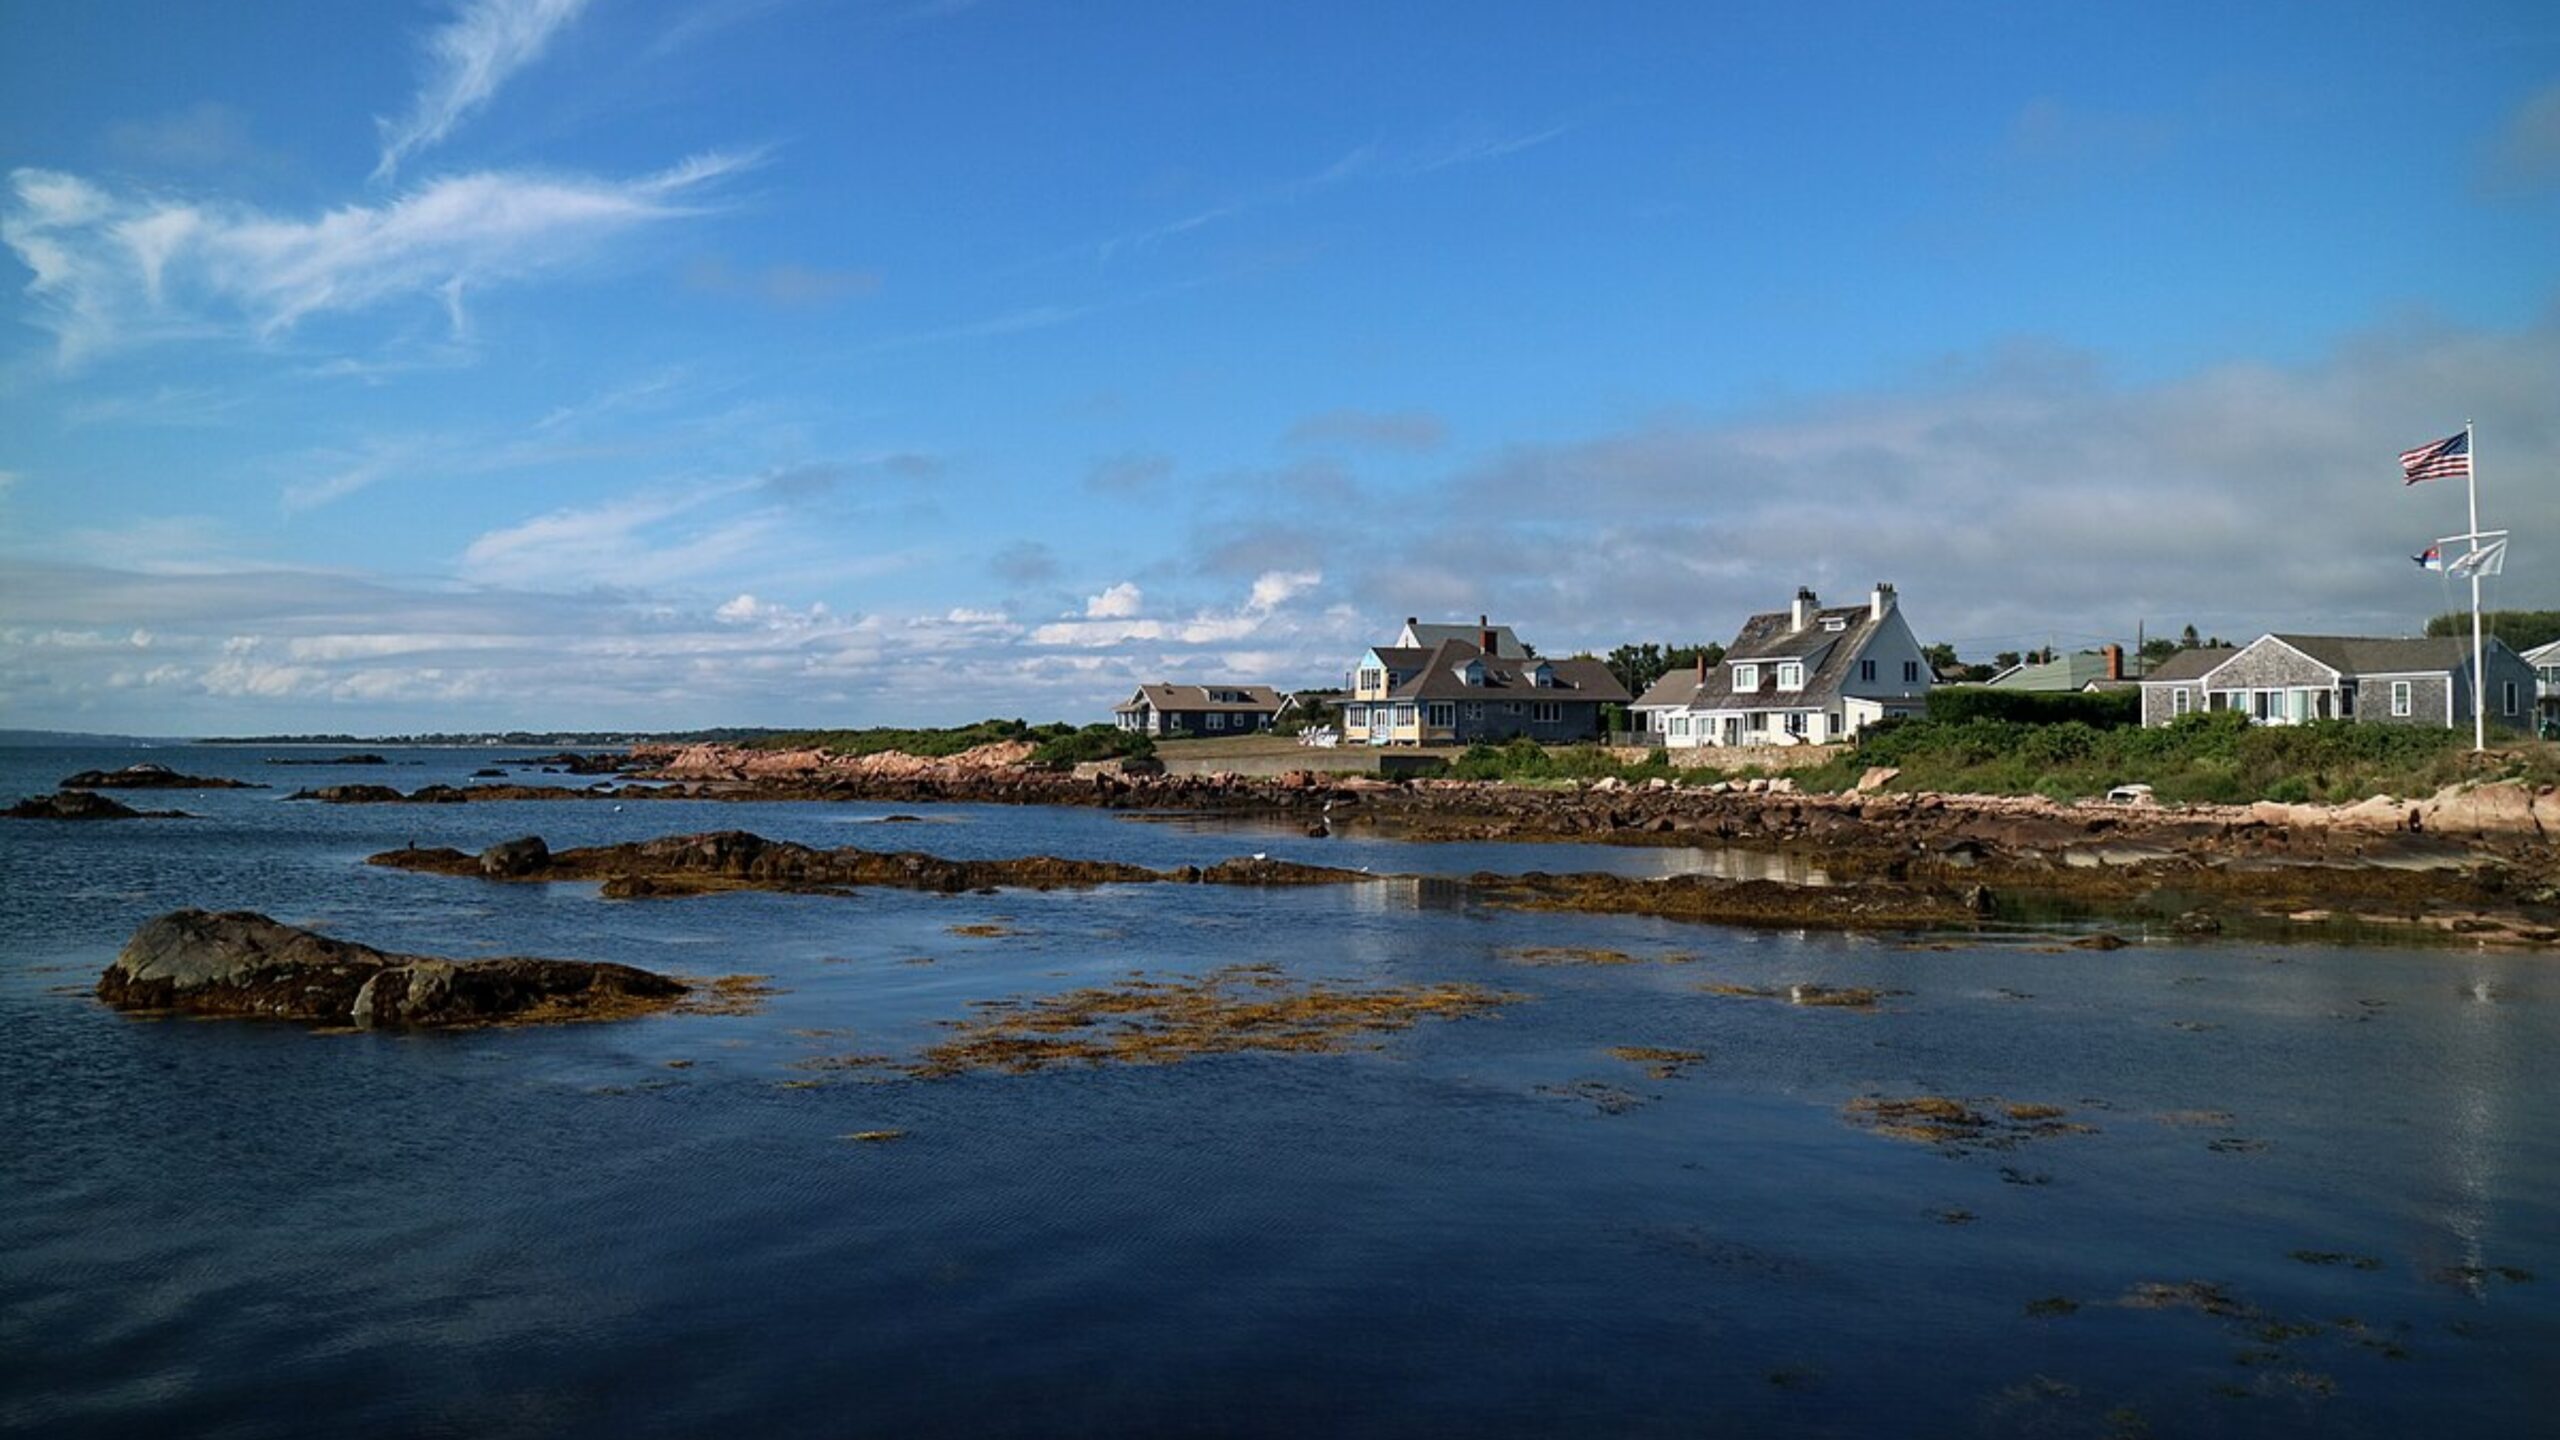
Jamestown – Island Living with Luxury Pricing
Jamestown sits on Conanicut Island in Narragansett Bay, connected to the mainland by the Jamestown-Verrazzano Bridge and just a short drive from Newport. Its coastal roads and protected open space have helped keep development limited and property values high.
The island’s tranquility and upscale housing stock appeal to affluent buyers seeking privacy and views. Major spikes in 2021 and 2022 reflected national demand for luxury coastal homes. Today, Jamestown’s consistent seven-figure prices speak to its standing as one of the most prestigious enclaves in Rhode Island.
1. New Shoreham – 119% Home Price Increase Since 2012
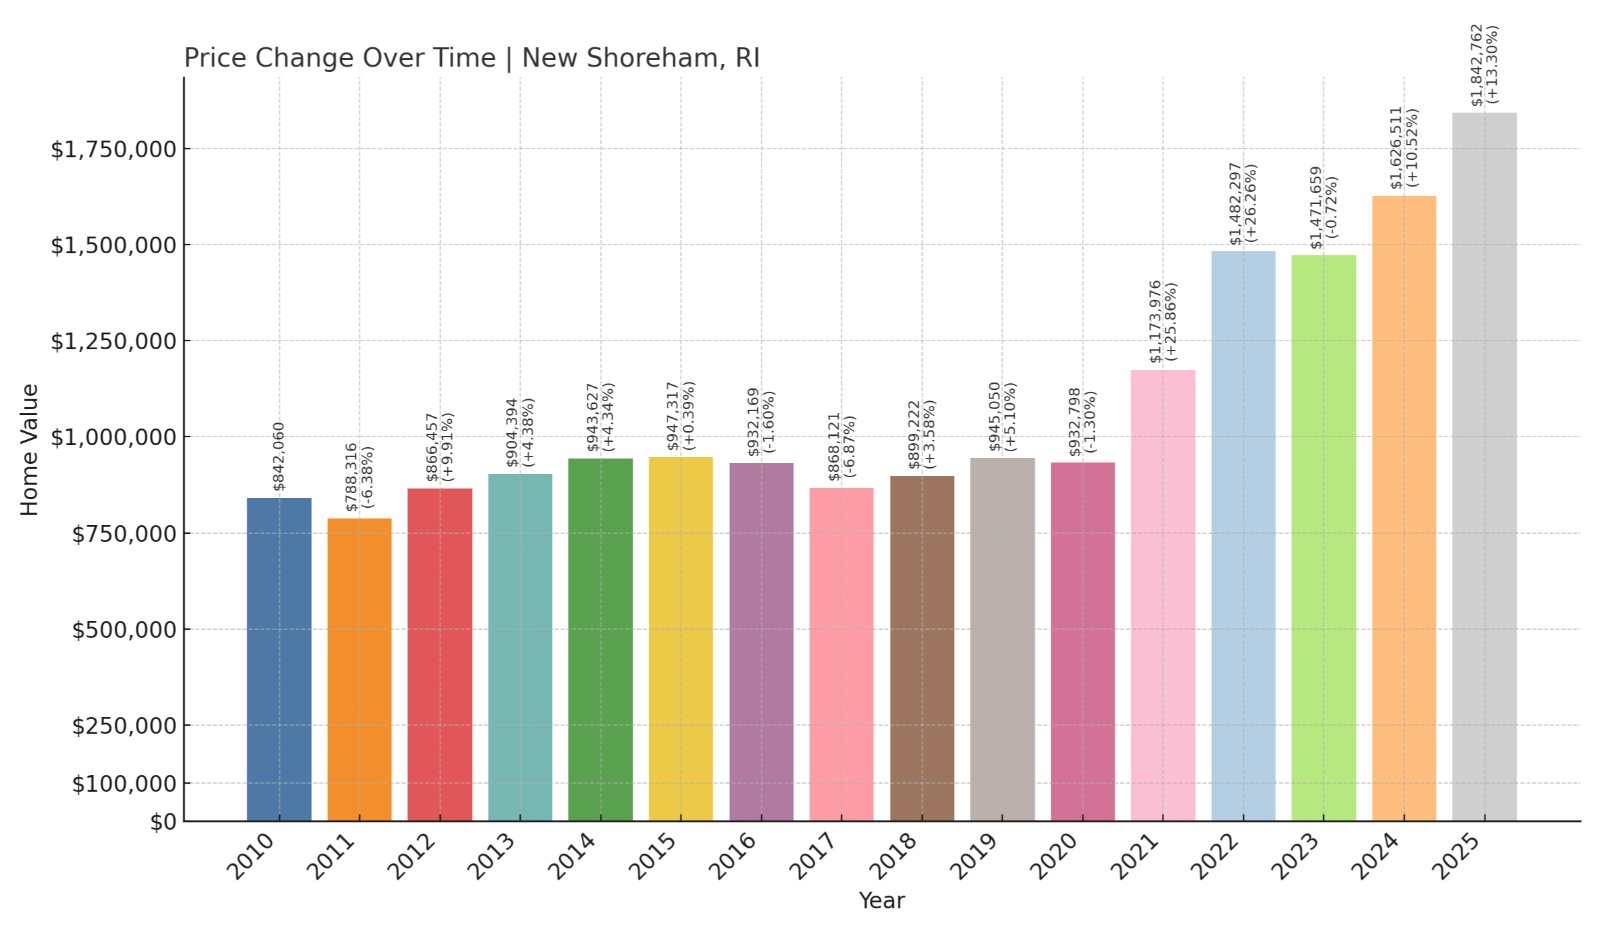
- 2010: $842,060
- 2011: $788,316 (-$53,744, -6.38% from previous year)
- 2012: $866,457 (+$78,141, +9.91% from previous year)
- 2013: $904,394 (+$37,937, +4.38% from previous year)
- 2014: $943,627 (+$39,233, +4.34% from previous year)
- 2015: $947,317 (+$3,690, +0.39% from previous year)
- 2016: $932,169 (-$15,148, -1.60% from previous year)
- 2017: $868,121 (-$64,047, -6.87% from previous year)
- 2018: $899,222 (+$31,100, +3.58% from previous year)
- 2019: $945,050 (+$45,828, +5.10% from previous year)
- 2020: $932,798 (-$12,251, -1.30% from previous year)
- 2021: $1,173,976 (+$241,177, +25.86% from previous year)
- 2022: $1,482,297 (+$308,321, +26.26% from previous year)
- 2023: $1,471,659 (-$10,638, -0.72% from previous year)
- 2024: $1,626,511 (+$154,853, +10.52% from previous year)
- 2025: $1,842,762 (+$216,251, +13.30% from previous year)
New Shoreham tops the list with a 119% price increase since 2012, and a 2025 median home value nearing $1.85 million. Price volatility has been a factor, but major jumps in 2021, 2022, and 2024 pushed this island town to the top of Rhode Island’s real estate market.
New Shoreham – Exclusive Island, Elite Prices
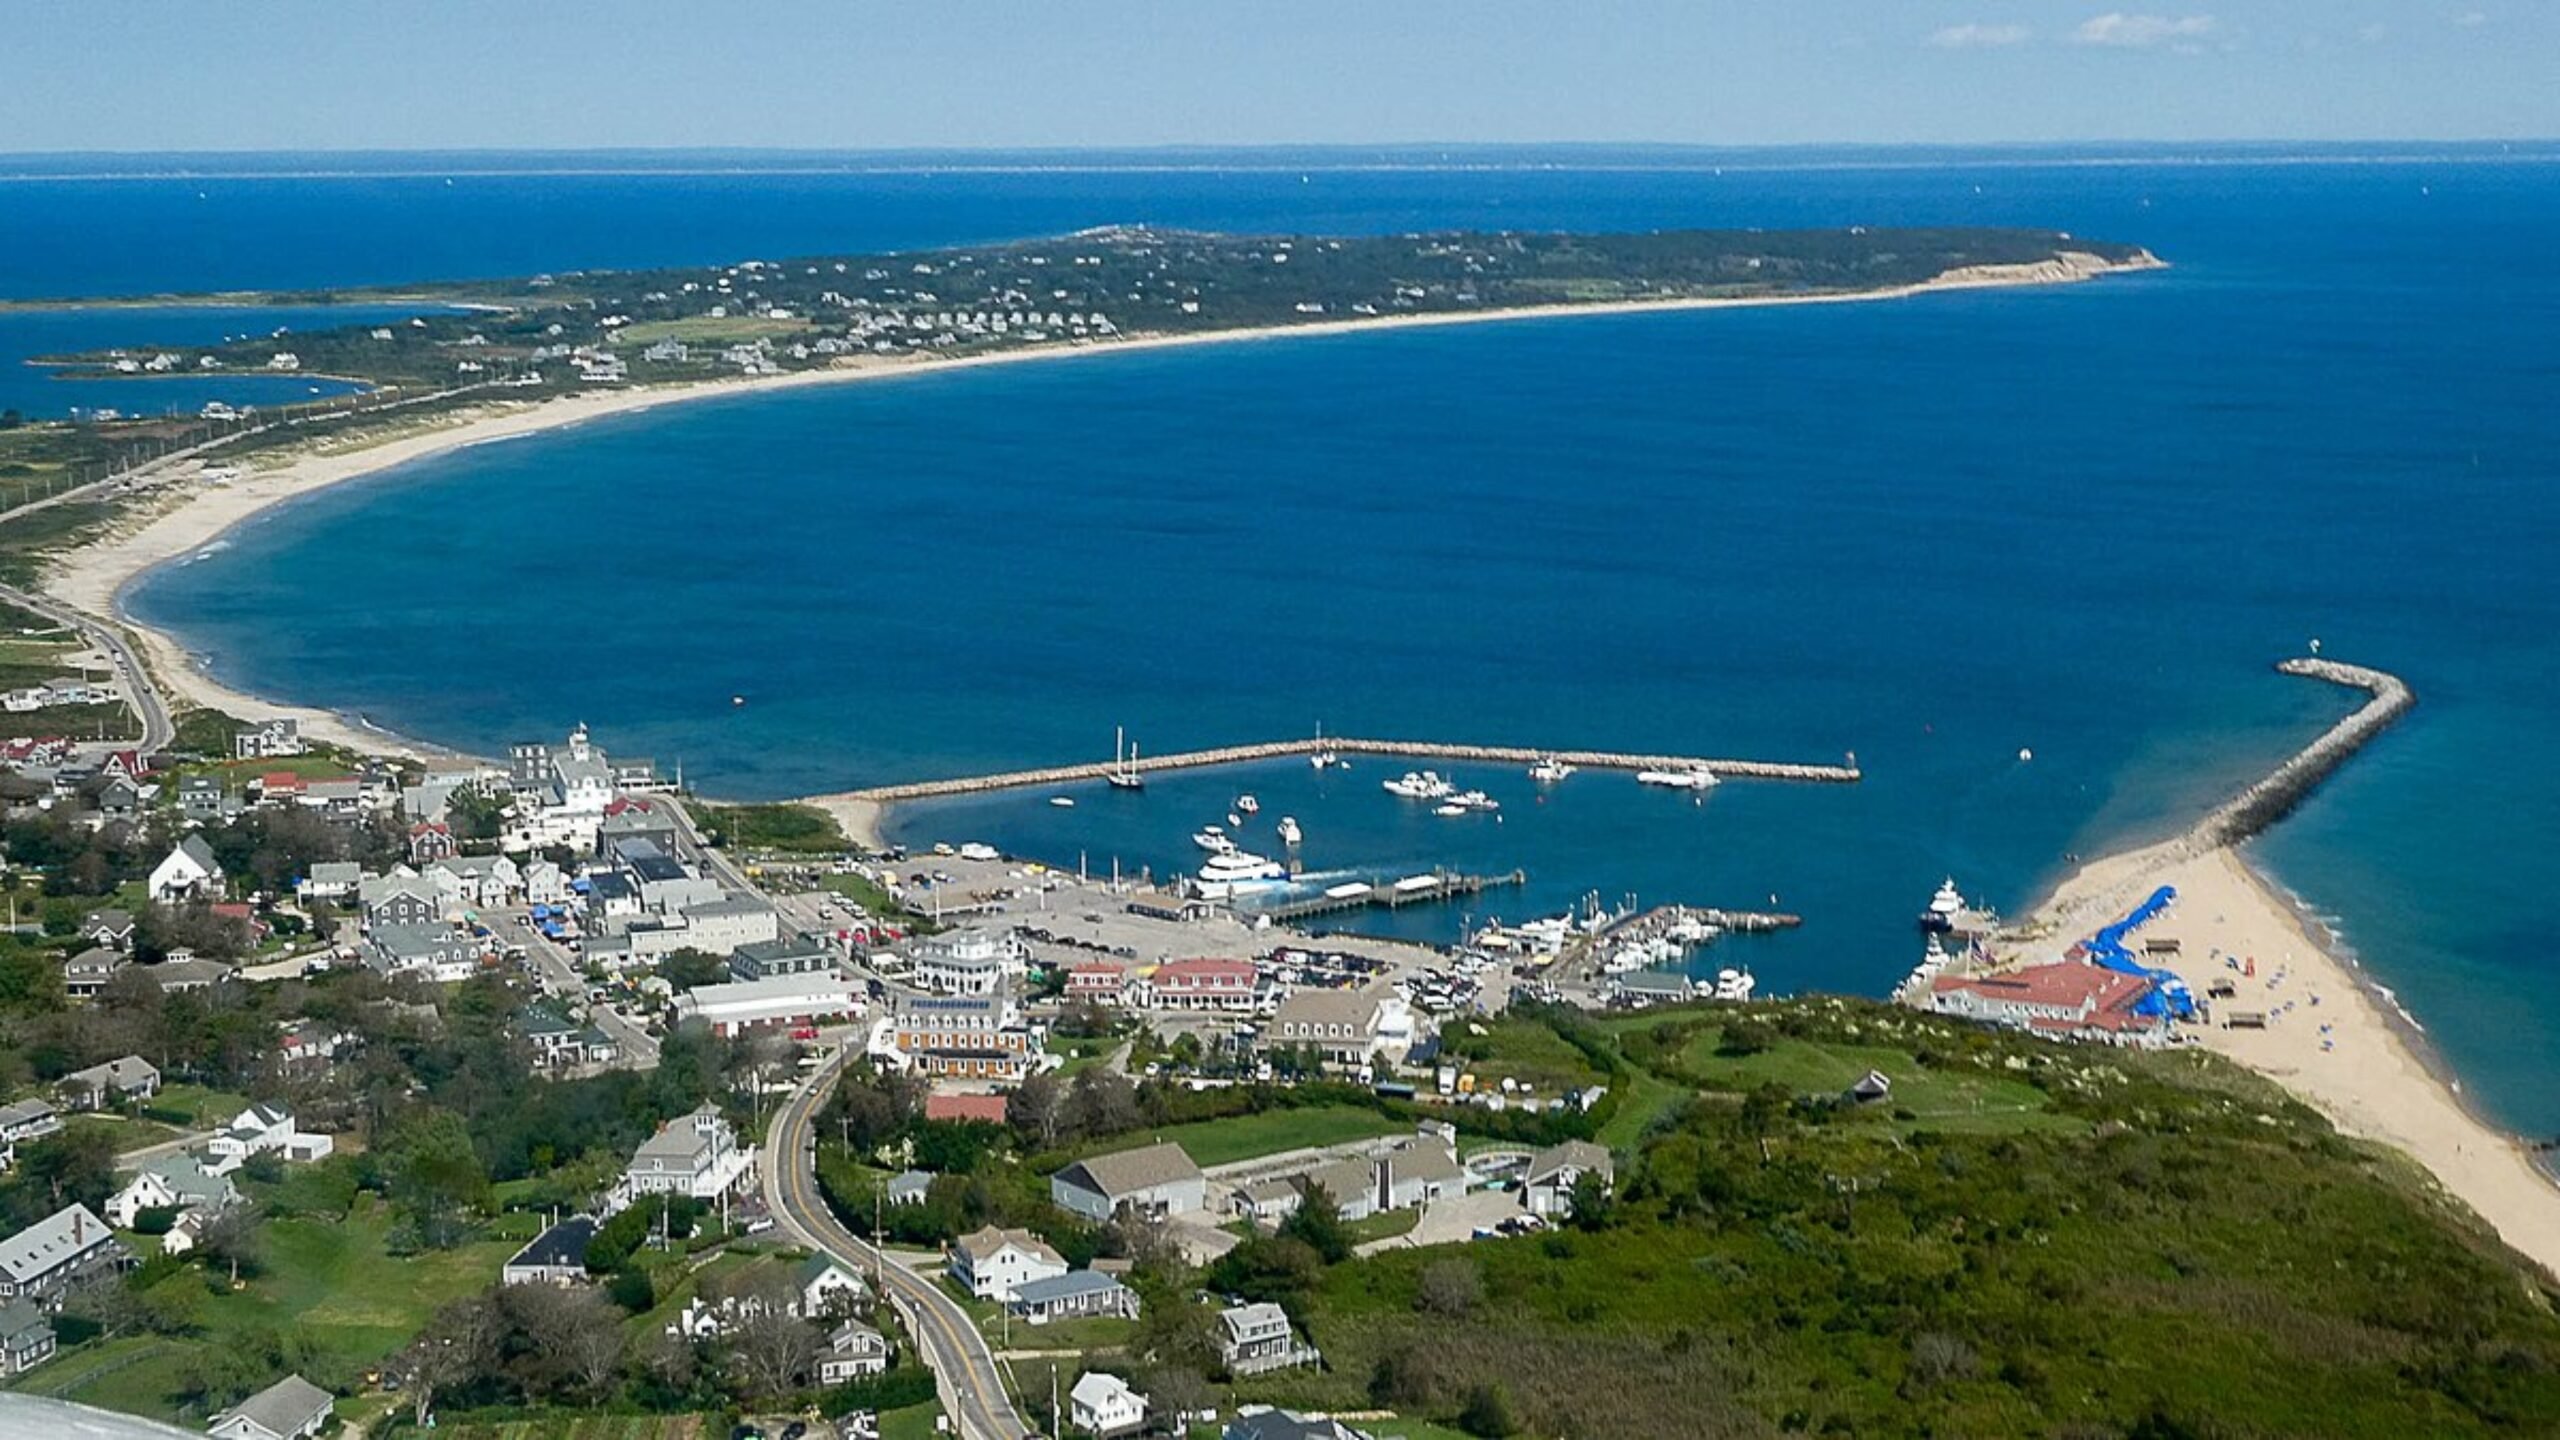
Better known as Block Island, New Shoreham is one of the most distinctive places in Rhode Island. With no bridges connecting it to the mainland, it remains accessible only by ferry or plane. That isolation, combined with strict land-use regulations and preserved open space, keeps real estate inventory extremely limited.
While year-round population is small, the summer influx is large and includes affluent seasonal residents. Limited supply and unrelenting demand mean home prices here continue to climb. The massive jumps in recent years reflect not just local desirability, but national interest in secluded luxury getaways.


