Would you like to save this?
From charming boroughs to luxury suburbs, house prices across Pennsylvania are climbing fast. According to the Zillow Home Value Index, 2025 home values show just how sharply real estate prices have risen in the state’s most sought-after towns. Buyers now face six-figure price tags in areas that once felt affordable, as demand outpaces supply in many upscale communities. Whether you’re a hopeful buyer or simply curious, these are the 30 towns where Pennsylvania property prices are hitting new highs.
30. Lafayette Hill – 2.60% Home Price Increase Since 2024
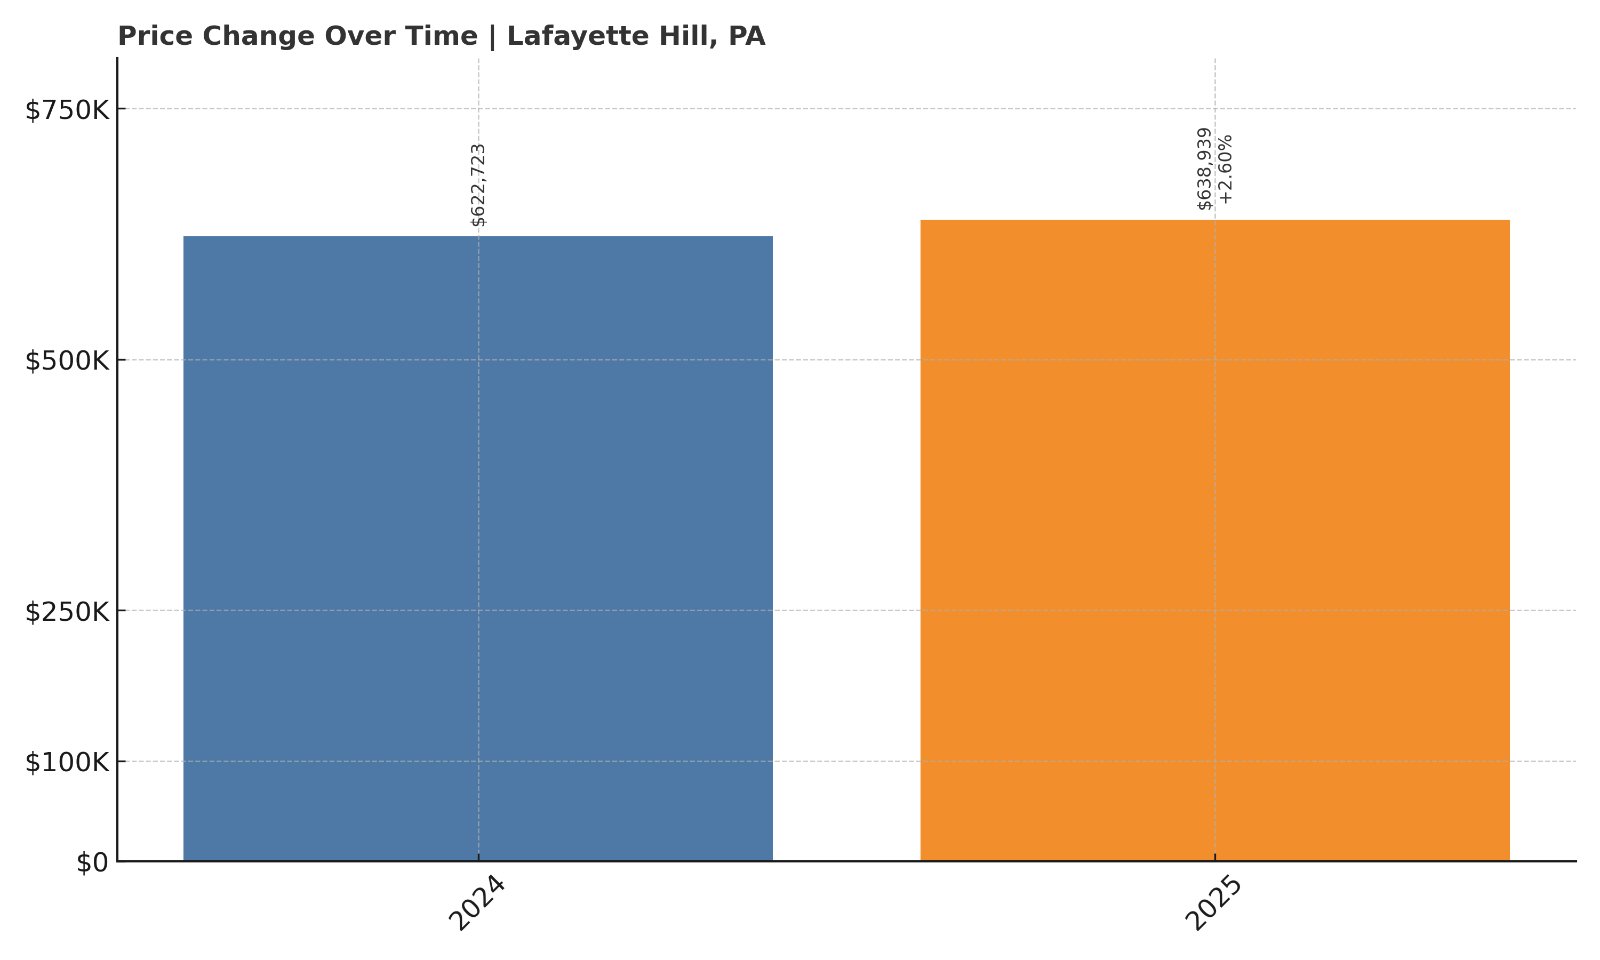
- 2024: $622,723
- 2025: $638,939 (+$16,216, +2.60% from previous year)
Lafayette Hill home prices saw a mild bump in the last year, gaining 2.6% and reaching $638,939 in 2025. With no prior data available, this recent growth gives us our first benchmark for one of Montgomery County’s most in-demand suburbs.
Lafayette Hill – Steady Growth with Prime Suburban Access
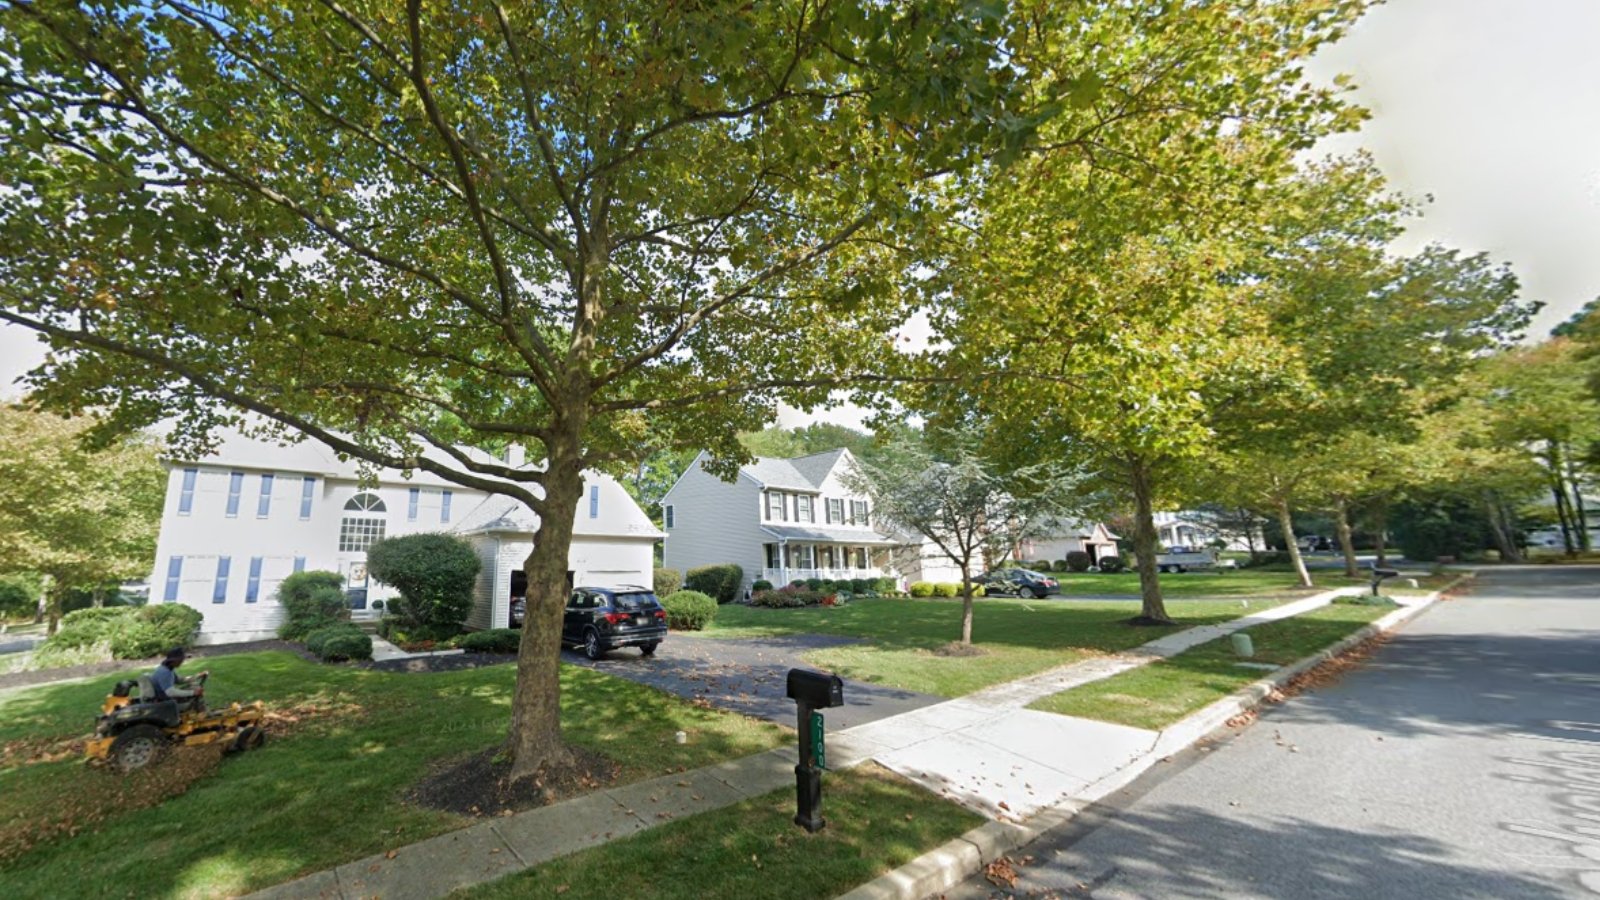
Located just outside the Philadelphia city limits, Lafayette Hill attracts buyers who want a quiet residential feel with quick access to the city. The town is surrounded by green space—including Wissahickon Valley Park—and has long been popular for its top-rated Colonial School District. Its proximity to the Main Line and Center City boosts its long-term appeal.
While the year-over-year gain is modest, Lafayette Hill’s stability is part of the draw. In a market where volatility can be common, a predictable increase signals ongoing demand in an already mature market. Homes here tend to sell quickly when they hit the market, especially those with updated interiors or walkability to local cafes and schools.
29. Landenberg – 4.35% Home Price Increase Since 2024
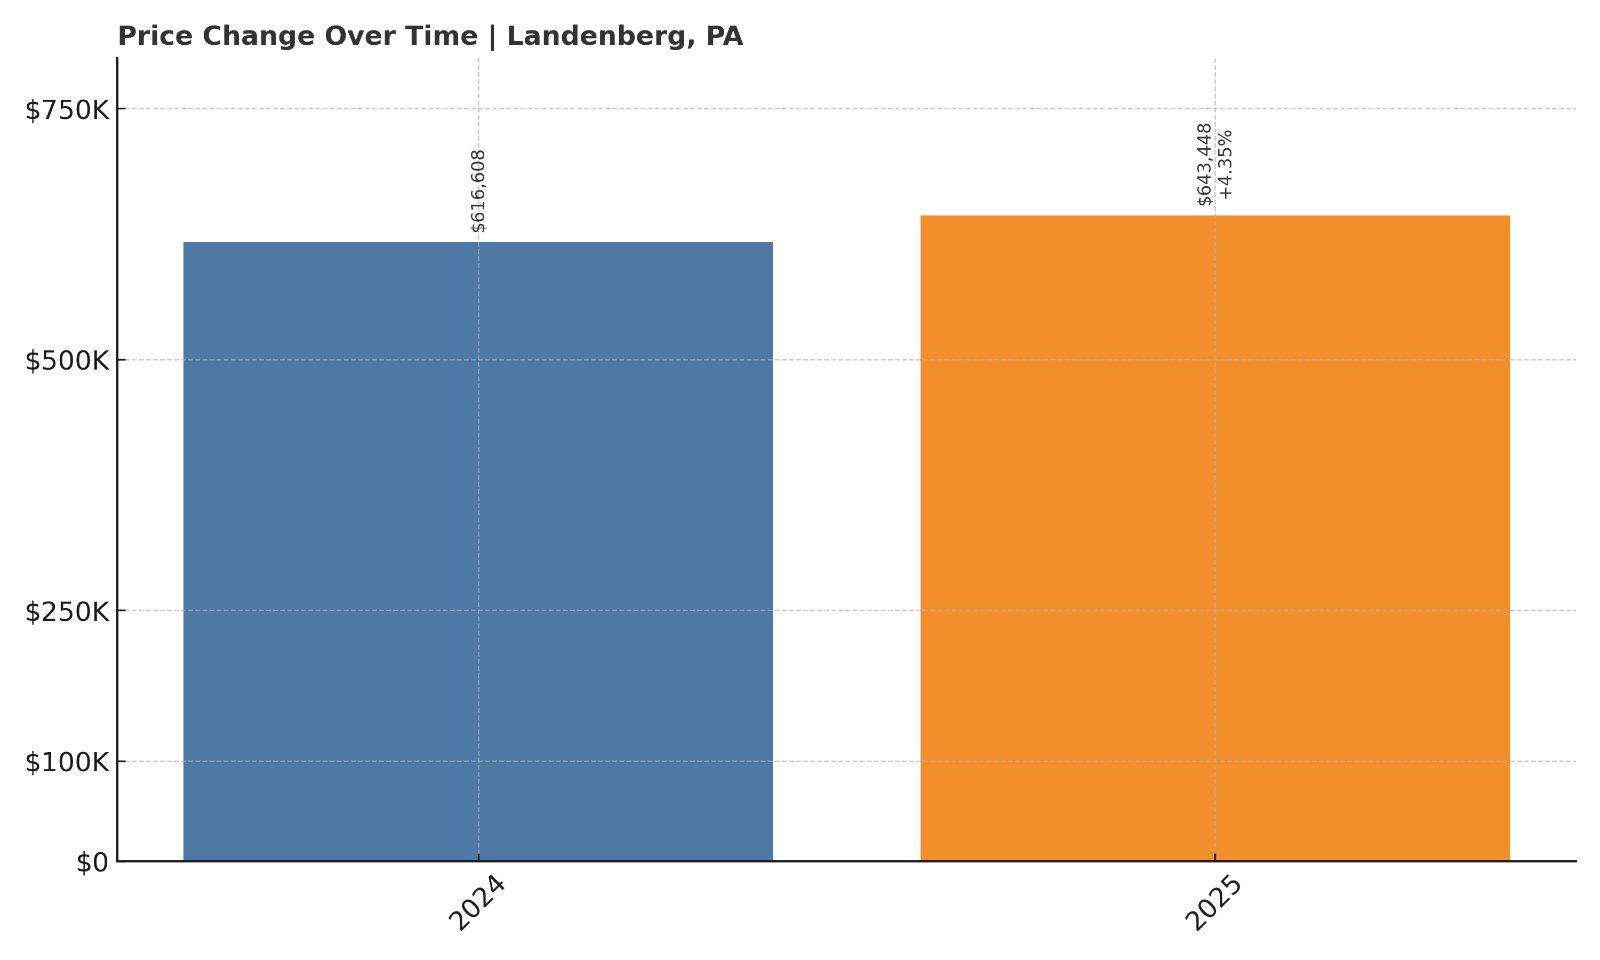
- 2024: $616,608
- 2025: $643,448 (+$26,840, +4.35% from previous year)
Landenberg homes climbed 4.35% from 2024 to 2025, reaching an average price of $643,448. It’s a notable jump for a town with only two years of tracked data, hinting at growing interest and market momentum.
Landenberg – Upscale Living Near the Delaware Border
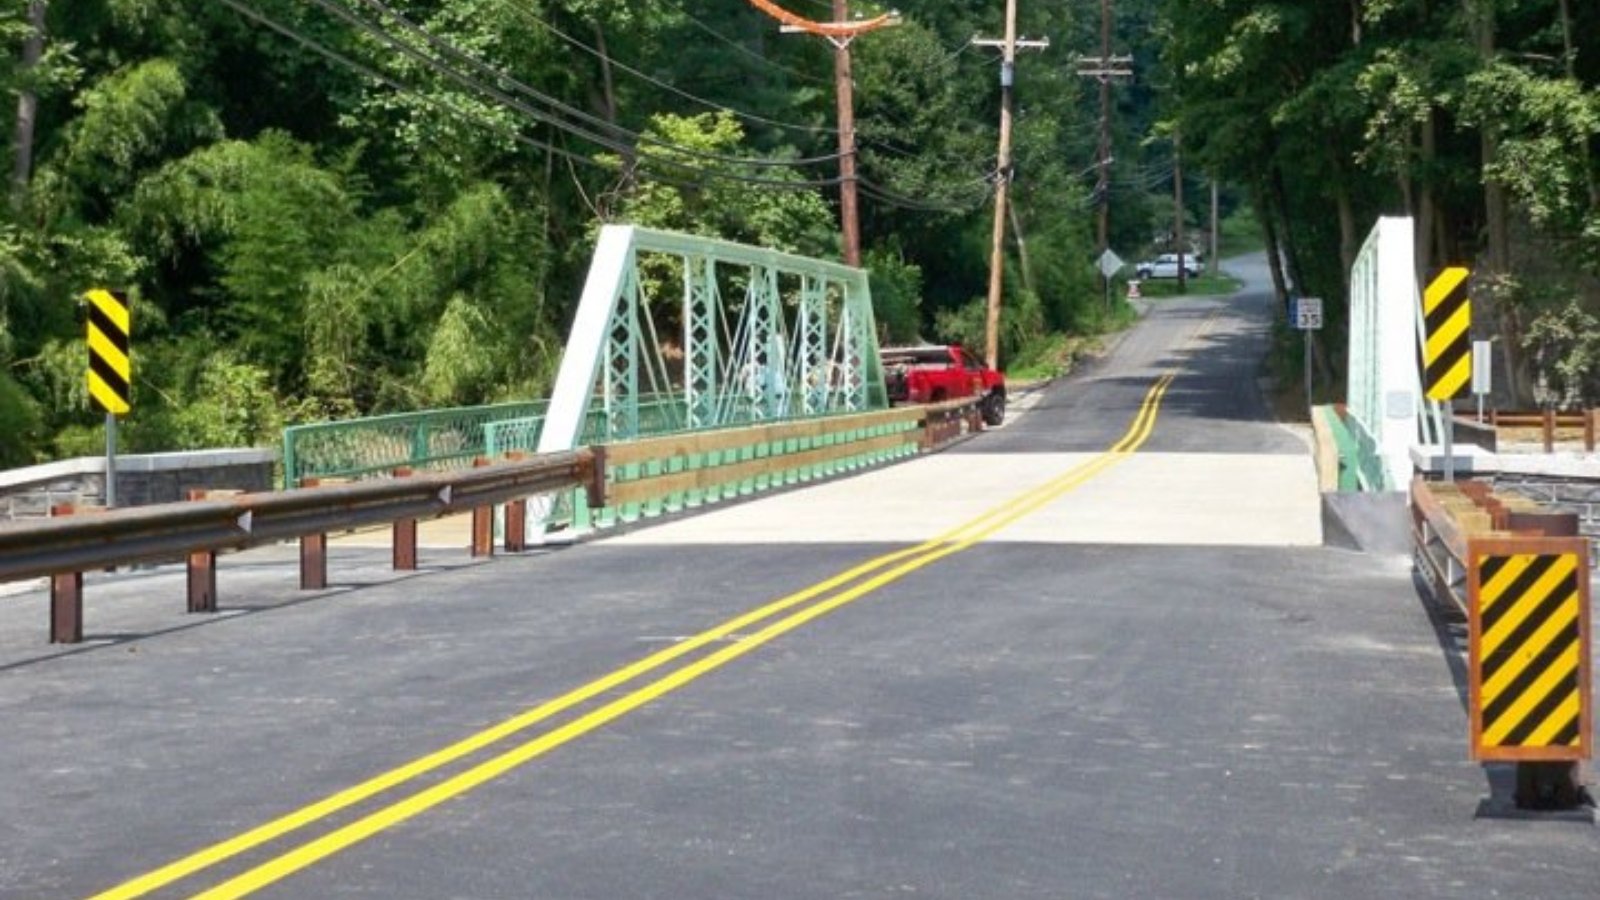
Part of Chester County’s southern fringe, Landenberg sits close to the Delaware line, drawing buyers from both states who want space and privacy without sacrificing access to regional jobs. With large lots, scenic drives, and preserved farmland, the area feels distinctly rural—yet it’s within an hour of Philadelphia and Wilmington.
The recent price growth is fueled in part by limited new construction and a consistent influx of buyers looking for homes that feel like a retreat. Landenberg also benefits from Unionville-Chadds Ford School District, which remains one of the top-performing public systems in the region, further pushing up demand—and prices.
28. West Chester – 74.5% Home Price Increase Since 2010

- 2010: $374,938
- 2011: $352,266 (-$22,672, -6.05%)
- 2012: $345,291 (-$6,975, -1.98%)
- 2013: $353,945 (+$8,655, +2.51%)
- 2014: $373,588 (+$19,643, +5.55%)
- 2015: $385,845 (+$12,256, +3.28%)
- 2016: $396,614 (+$10,770, +2.79%)
- 2017: $408,517 (+$11,902, +3.00%)
- 2018: $427,232 (+$18,715, +4.58%)
- 2019: $437,136 (+$9,904, +2.32%)
- 2020: $448,126 (+$10,990, +2.51%)
- 2021: $507,050 (+$58,925, +13.15%)
- 2022: $561,778 (+$54,728, +10.79%)
- 2023: $588,150 (+$26,372, +4.69%)
- 2024: $636,220 (+$48,070, +8.17%)
- 2025: $654,474 (+$18,254, +2.87%)
West Chester’s home prices have climbed by nearly $280,000 since 2010—a 74.5% increase over 15 years. The most recent year saw a gain of 2.87%, showing the town remains a solid bet even after years of strong growth.
West Chester – Historic, Walkable, and In Demand
Would you like to save this?
As the Chester County seat, West Chester combines walkability, vibrant downtown life, and access to top-tier schools. Its brick sidewalks and preserved historic architecture make it a magnet for professionals and families who want charm without isolation. That charm, along with consistent upgrades to infrastructure and retail, has kept home values climbing even in cooling markets.
Buyers are drawn to the variety of housing—everything from rowhomes to single-family estates—along with nearby West Chester University. The borough’s tight inventory has led to bidding wars in recent years, particularly for homes near the heart of town. With easy access to Route 202 and employment hubs, West Chester isn’t just expensive—it’s also practical.
27. Glenmoore – 76.6% Home Price Increase Since 2010

- 2010: $375,262
- 2011: $351,805 (-$23,457, -6.25%)
- 2012: $345,184 (-$6,621, -1.88%)
- 2013: $356,293 (+$11,110, +3.22%)
- 2014: $374,842 (+$18,549, +5.21%)
- 2015: $381,891 (+$7,048, +1.88%)
- 2016: $386,615 (+$4,725, +1.24%)
- 2017: $406,298 (+$19,683, +5.09%)
- 2018: $416,712 (+$10,415, +2.56%)
- 2019: $426,728 (+$10,015, +2.40%)
- 2020: $443,004 (+$16,276, +3.81%)
- 2021: $515,672 (+$72,668, +16.40%)
- 2022: $589,227 (+$73,556, +14.26%)
- 2023: $606,485 (+$17,258, +2.93%)
- 2024: $637,988 (+$31,503, +5.19%)
- 2025: $663,019 (+$25,031, +3.92%)
Glenmoore home prices have risen 76.6% since 2010, with a consistent upward trend. The past three years alone have added more than $75,000 in value, showing that demand in this Chester County area remains strong.
Glenmoore – A Quiet Market with Serious Momentum
Glenmoore doesn’t make headlines, but the numbers speak for themselves. This rural-feeling Chester County town offers larger lots, top schools, and a relatively quiet housing market that’s appreciated sharply in value. Its appeal lies in privacy, space, and high-end properties that tend to attract long-term residents.
With no major commercial centers inside the town itself, Glenmoore benefits from low congestion while still being a short drive from Exton and Downingtown. The mix of new construction and well-kept historic homes gives buyers flexibility at the higher end of the market. That’s part of what’s kept prices growing steadily even as other markets flattened out.
26. Ambler – 86.3% Home Price Increase Since 2010
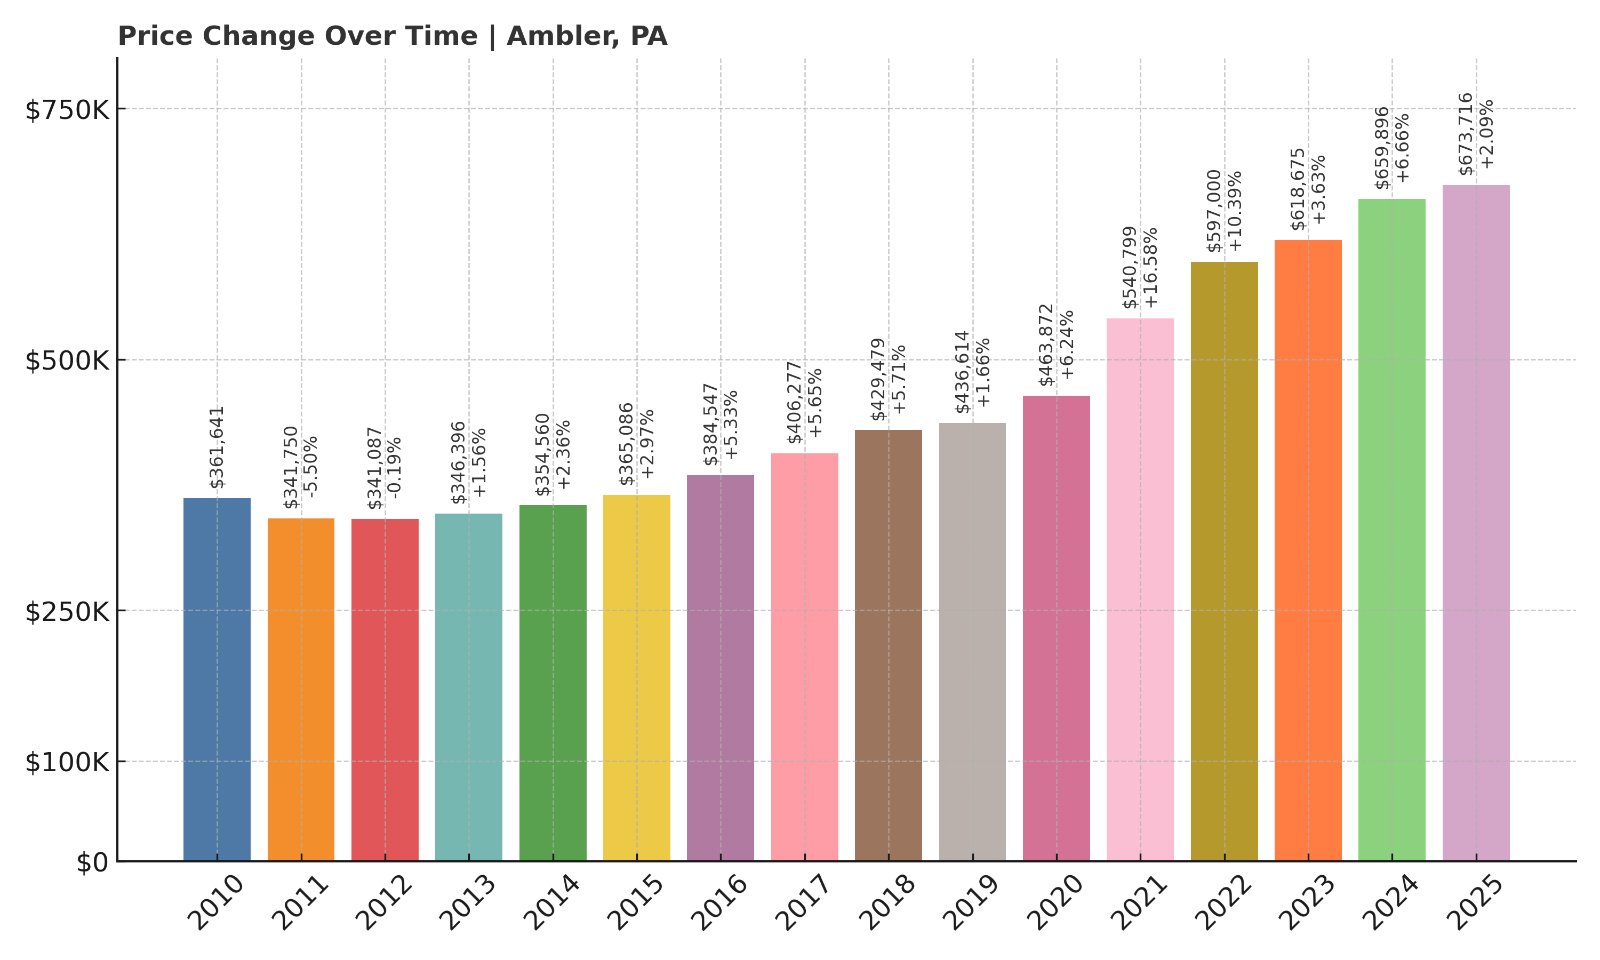
- 2010: $361,641
- 2011: $341,750 (-$19,891, -5.50%)
- 2012: $341,087 (-$664, -0.19%)
- 2013: $346,396 (+$5,309, +1.56%)
- 2014: $354,560 (+$8,164, +2.36%)
- 2015: $365,086 (+$10,526, +2.97%)
- 2016: $384,547 (+$19,461, +5.33%)
- 2017: $406,277 (+$21,730, +5.65%)
- 2018: $429,479 (+$23,202, +5.71%)
- 2019: $436,614 (+$7,135, +1.66%)
- 2020: $463,872 (+$27,259, +6.24%)
- 2021: $540,799 (+$76,926, +16.58%)
- 2022: $597,000 (+$56,202, +10.39%)
- 2023: $618,675 (+$21,674, +3.63%)
- 2024: $659,896 (+$41,221, +6.66%)
- 2025: $673,716 (+$13,820, +2.09%)
Ambler home values are up 86.3% since 2010, and in 2025 the median price stands at $673,716. Gains in the last five years have been particularly strong, with several double-digit jumps in 2020–2022.
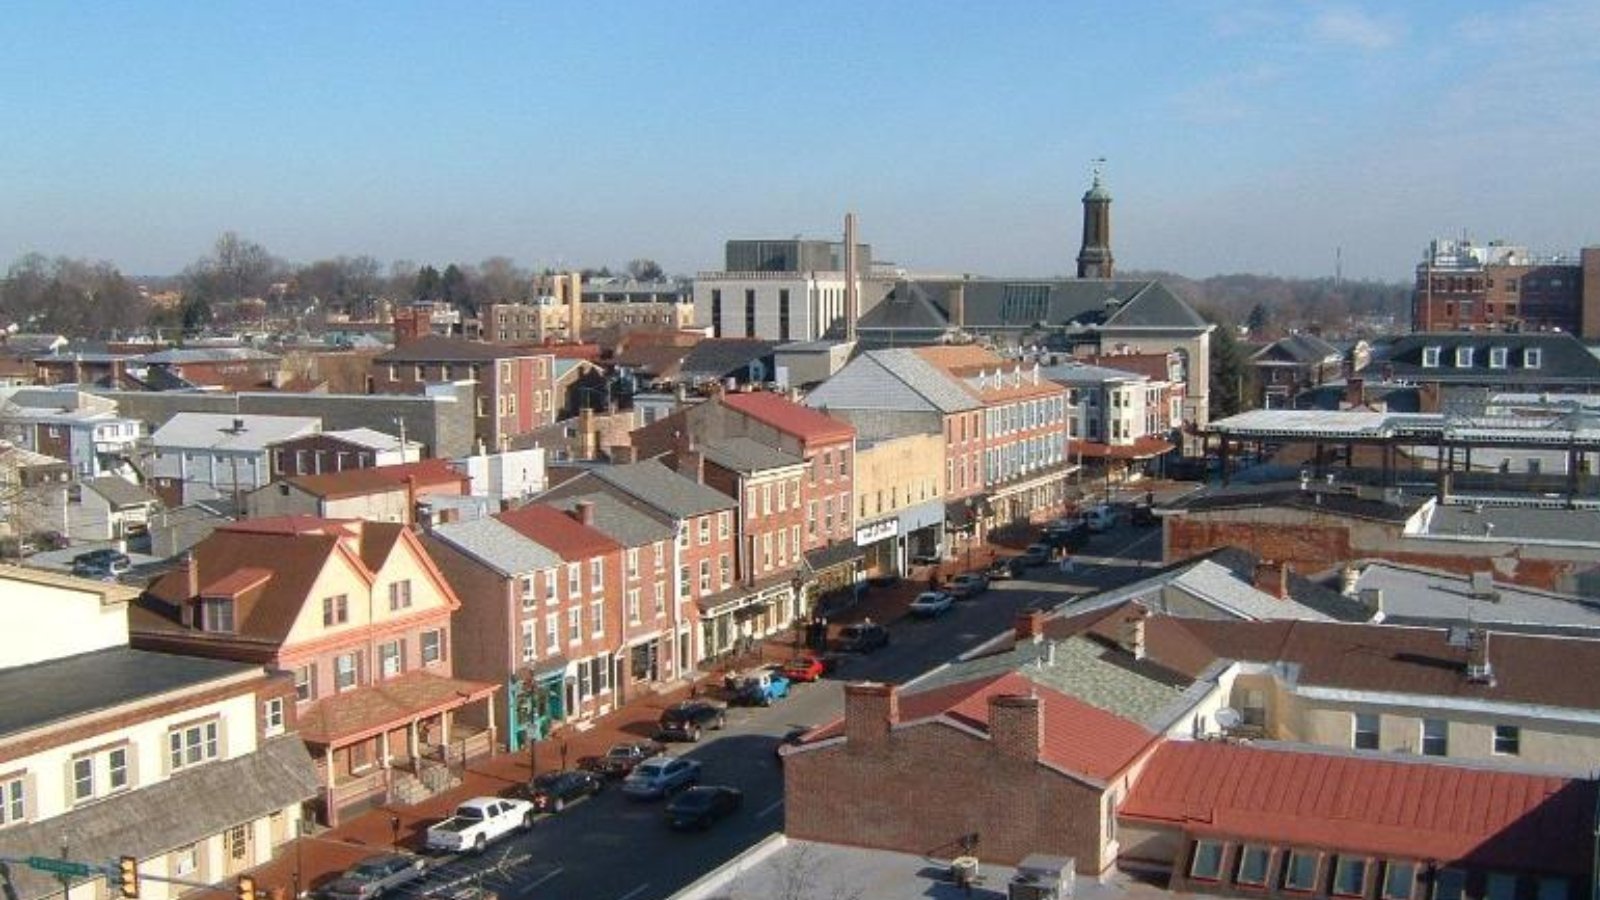
Ambler – Transit-Friendly and Rising Fast
Located in Montgomery County, Ambler blends an active downtown with strong commuter access via SEPTA’s Lansdale/Doylestown line. The town is well-known for its community feel, cultural scene, and accessibility—making it attractive to buyers priced out of nearby Chestnut Hill and Lower Gwynedd.
Homes near the train station or in walkable sections of town are especially sought-after. Recent renovations of older properties have added inventory, but demand remains intense. As Ambler’s reputation grows, so do its prices—solidifying its place among Pennsylvania’s most expensive markets in 2025.
25. Bryn Athyn – 3.28% Home Price Increase Since 2024
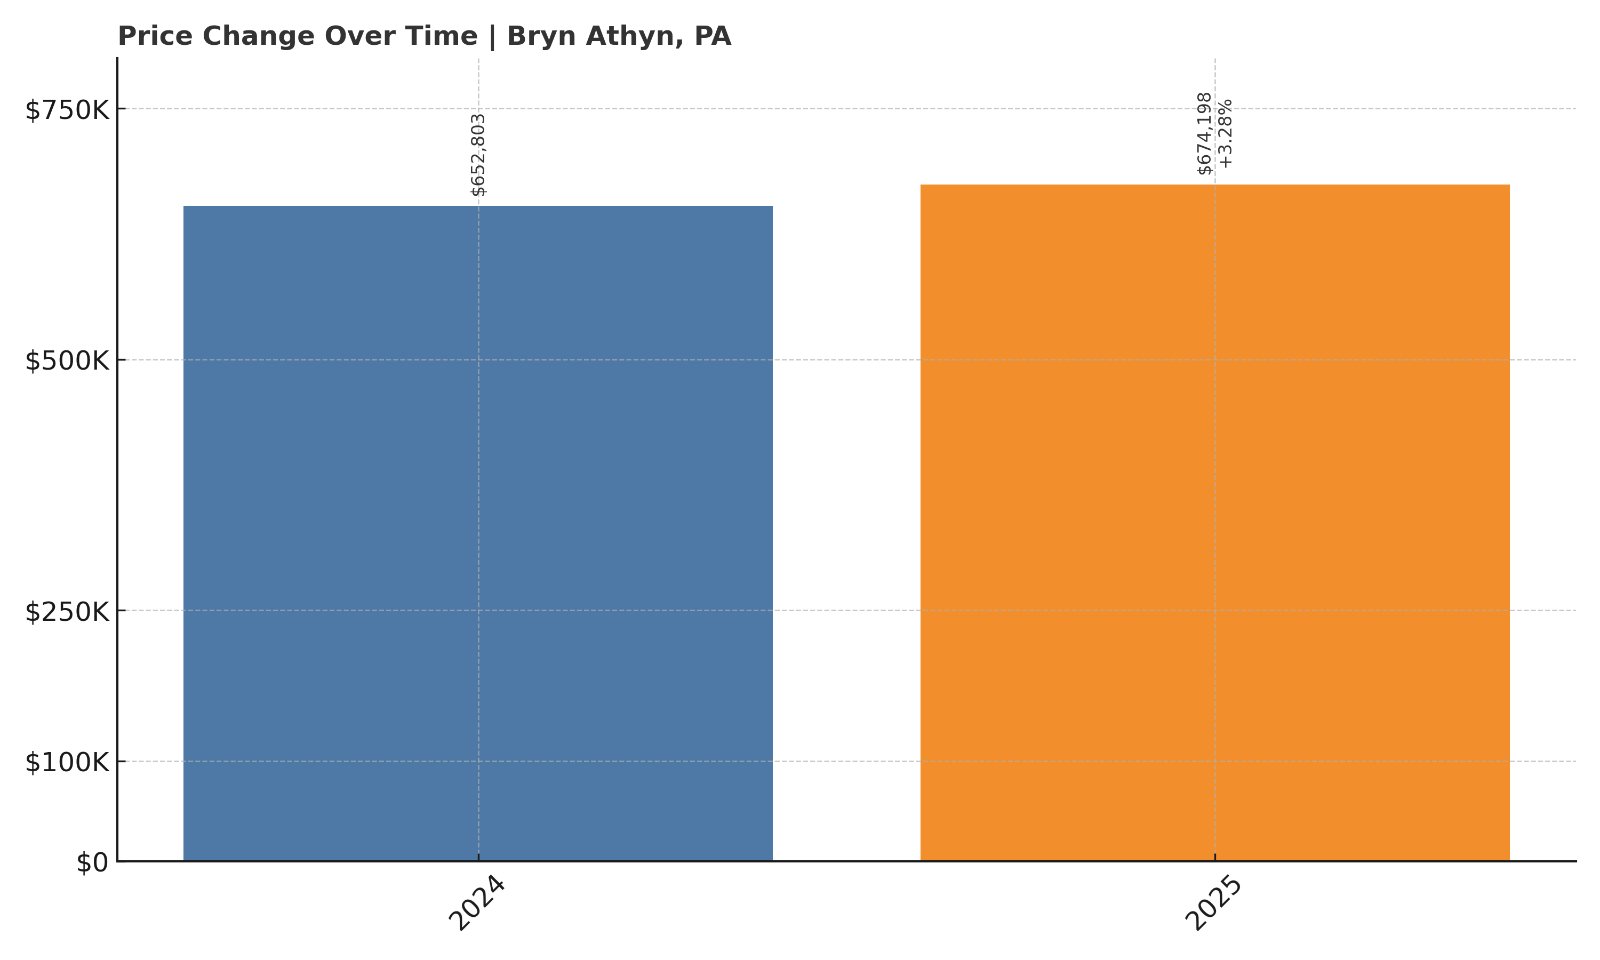
- 2024: $652,803
- 2025: $674,198 (+$21,396, +3.28% from previous year)
Bryn Athyn’s average home price rose to $674,198 in 2025, marking a 3.28% increase from 2024. This limited data shows consistent strength in a market known for exclusivity and low turnover.
Bryn Athyn – Historic Prestige with Lasting Value
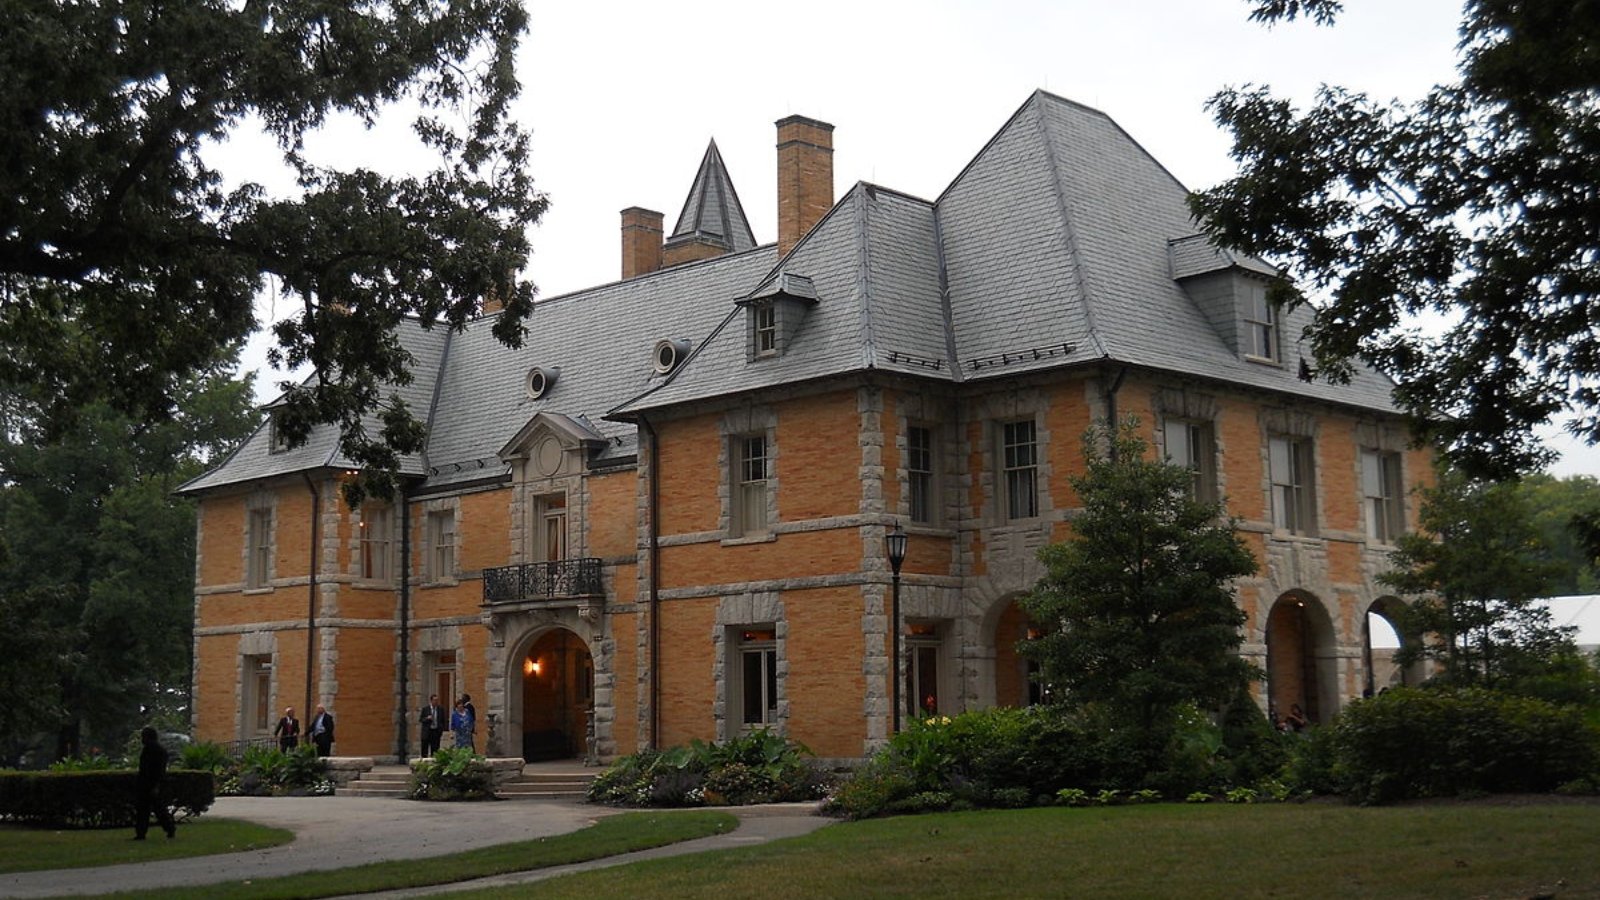
Bryn Athyn, nestled in Montgomery County, is one of the smallest and most unique boroughs in Pennsylvania. It’s best known for its historic district, including the Bryn Athyn Cathedral and Cairnwood Estate, and has long maintained a quiet, tightly held real estate market.
Because of zoning restrictions and its insular, close-knit community, the supply of homes is extremely limited. Properties that do come on the market tend to be larger estate-style homes with significant acreage. That scarcity helps support values—and makes even small annual increases like 2025’s $21K jump significant.
24. Bala-Cynwyd – 4.89% Home Price Increase Since 2024

- 2024: $643,916
- 2025: $675,373 (+$31,457, +4.89% from previous year)
Bala-Cynwyd saw a 4.89% year-over-year gain in 2025, pushing home prices to $675,373. The growth continues a long-standing trend of rising values in this upscale Main Line suburb.
Bala-Cynwyd – Classic Main Line Prestige with City Access
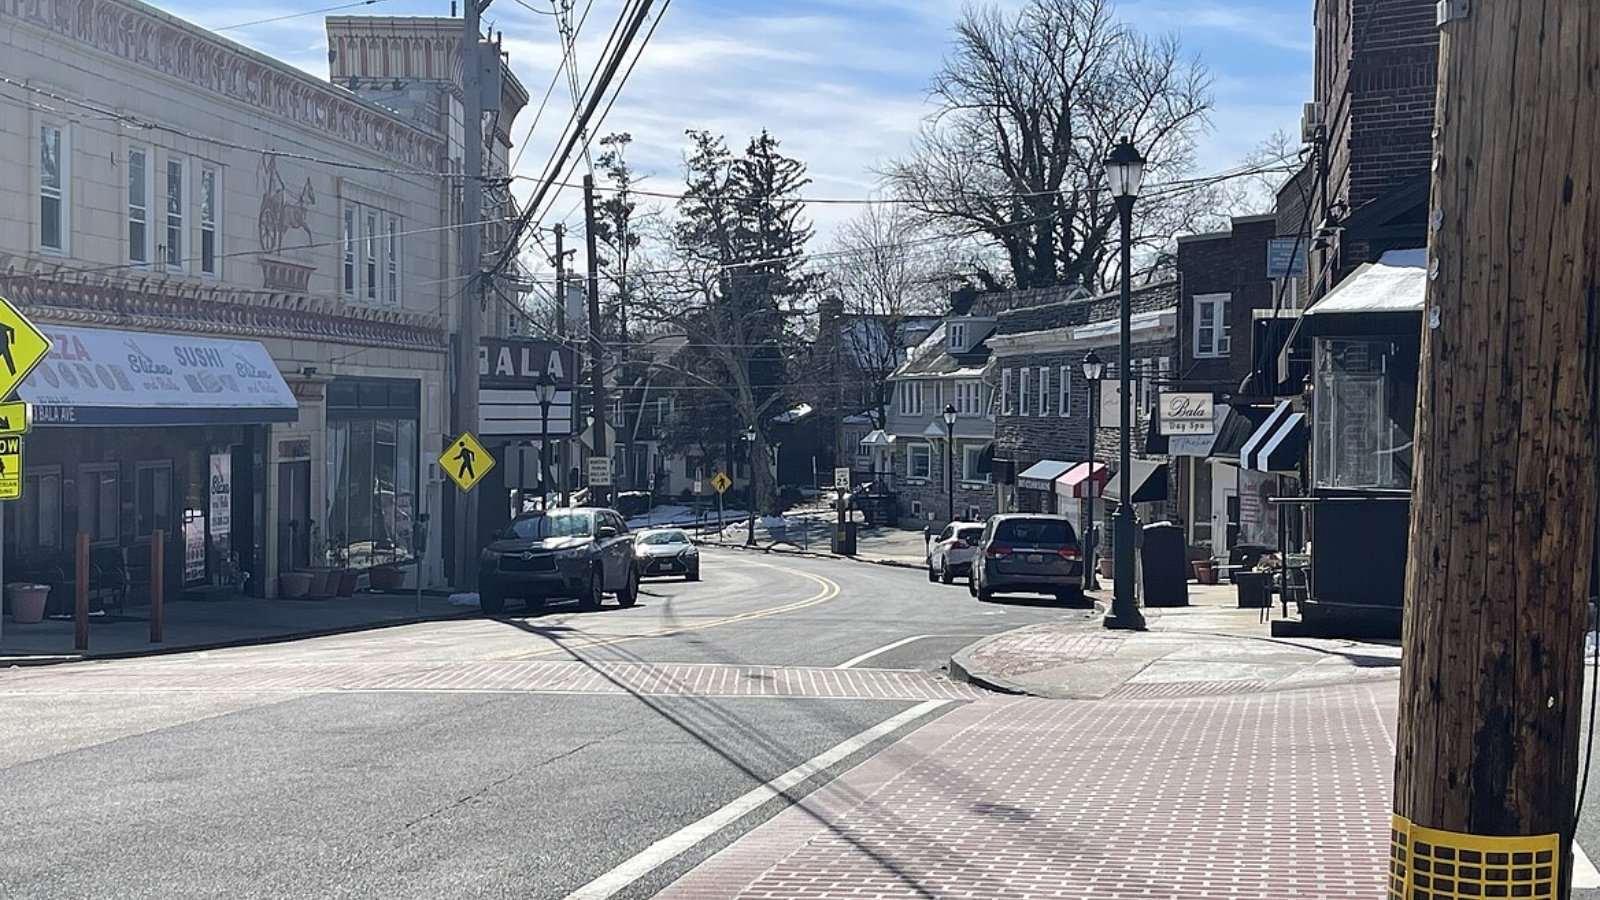
Part of Lower Merion Township in Montgomery County, Bala-Cynwyd sits just across the city line from Philadelphia, offering an ideal location for professionals who want suburban amenities without giving up urban access. The town features a blend of historic homes and newer high-end developments, especially near City Avenue.
With strong schools and proximity to major corporate employers, Bala-Cynwyd has long been a stable, high-demand market. Recent improvements in walkability and access to transit have only fueled that growth, helping maintain upward pressure on prices.
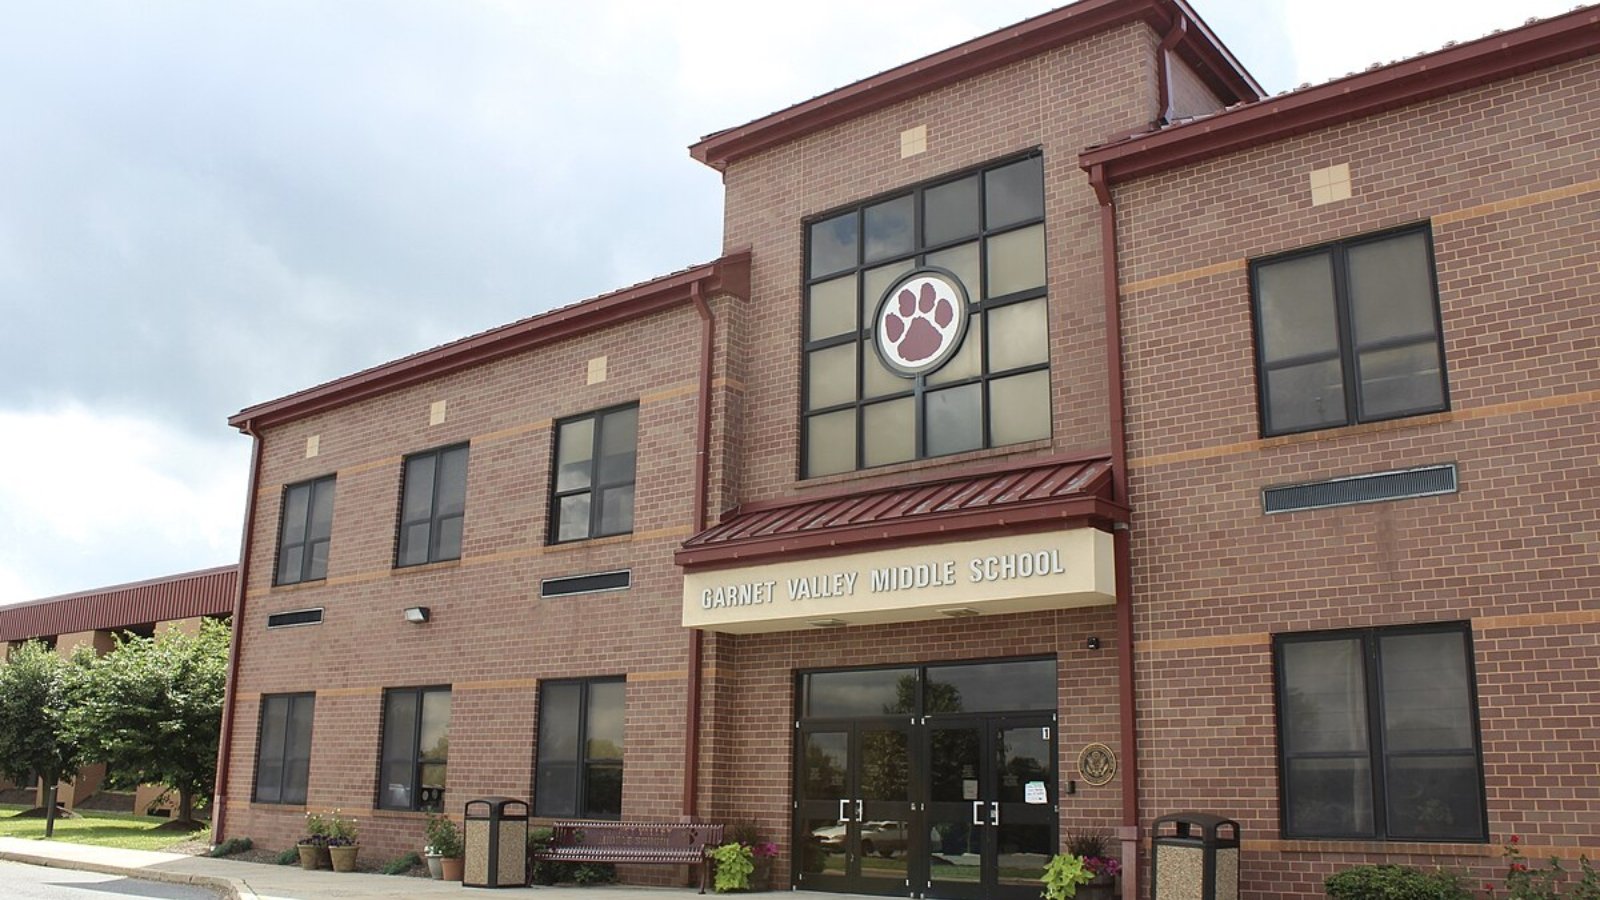
23. Garnet Valley – 84.5% Home Price Increase Since 2010
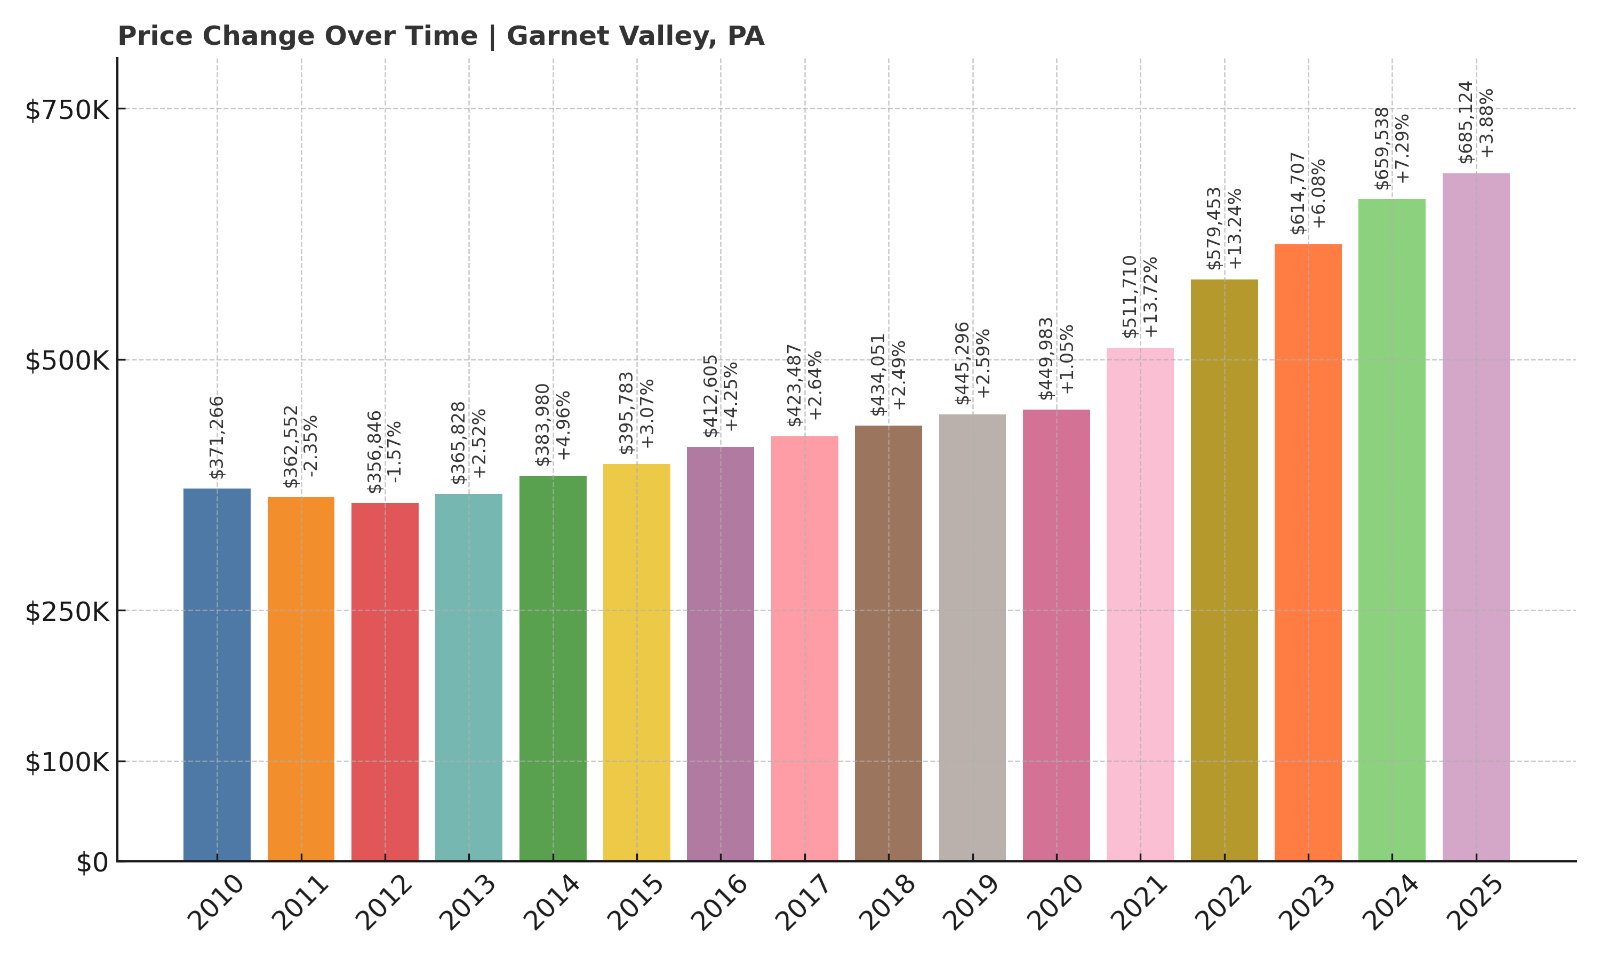
- 2010: $371,266
- 2011: $362,552 (-$8,714, -2.35%)
- 2012: $356,846 (-$5,706, -1.57%)
- 2013: $365,828 (+$8,982, +2.52%)
- 2014: $383,980 (+$18,153, +4.96%)
- 2015: $395,783 (+$11,803, +3.07%)
- 2016: $412,605 (+$16,822, +4.25%)
- 2017: $423,487 (+$10,882, +2.64%)
- 2018: $434,051 (+$10,564, +2.49%)
- 2019: $445,296 (+$11,246, +2.59%)
- 2020: $449,983 (+$4,687, +1.05%)
- 2021: $511,710 (+$61,727, +13.72%)
- 2022: $579,453 (+$67,743, +13.24%)
- 2023: $614,707 (+$35,254, +6.08%)
- 2024: $659,538 (+$44,831, +7.29%)
- 2025: $685,124 (+$25,586, +3.88%)
Since 2010, Garnet Valley home prices have surged by over 84%, reaching $685,124 in 2025. Double-digit gains in 2021 and 2022 account for much of the recent momentum, though growth has remained steady since.
Garnet Valley – Big Homes and Bigger Demand
Located in Delaware County, Garnet Valley is popular for its large, newer homes and high-performing schools. With its wide roads, ample green space, and family-oriented amenities, the area appeals to buyers who want space and convenience without moving far from Philadelphia or Wilmington.
The surge in values reflects not only demand, but a lack of inventory. Many homes are custom-built and well-maintained, and turnover remains relatively low. Garnet Valley’s continued appeal makes it a reliable high-end market even when others cool down.
22. Churchville – 75.3% Home Price Increase Since 2010
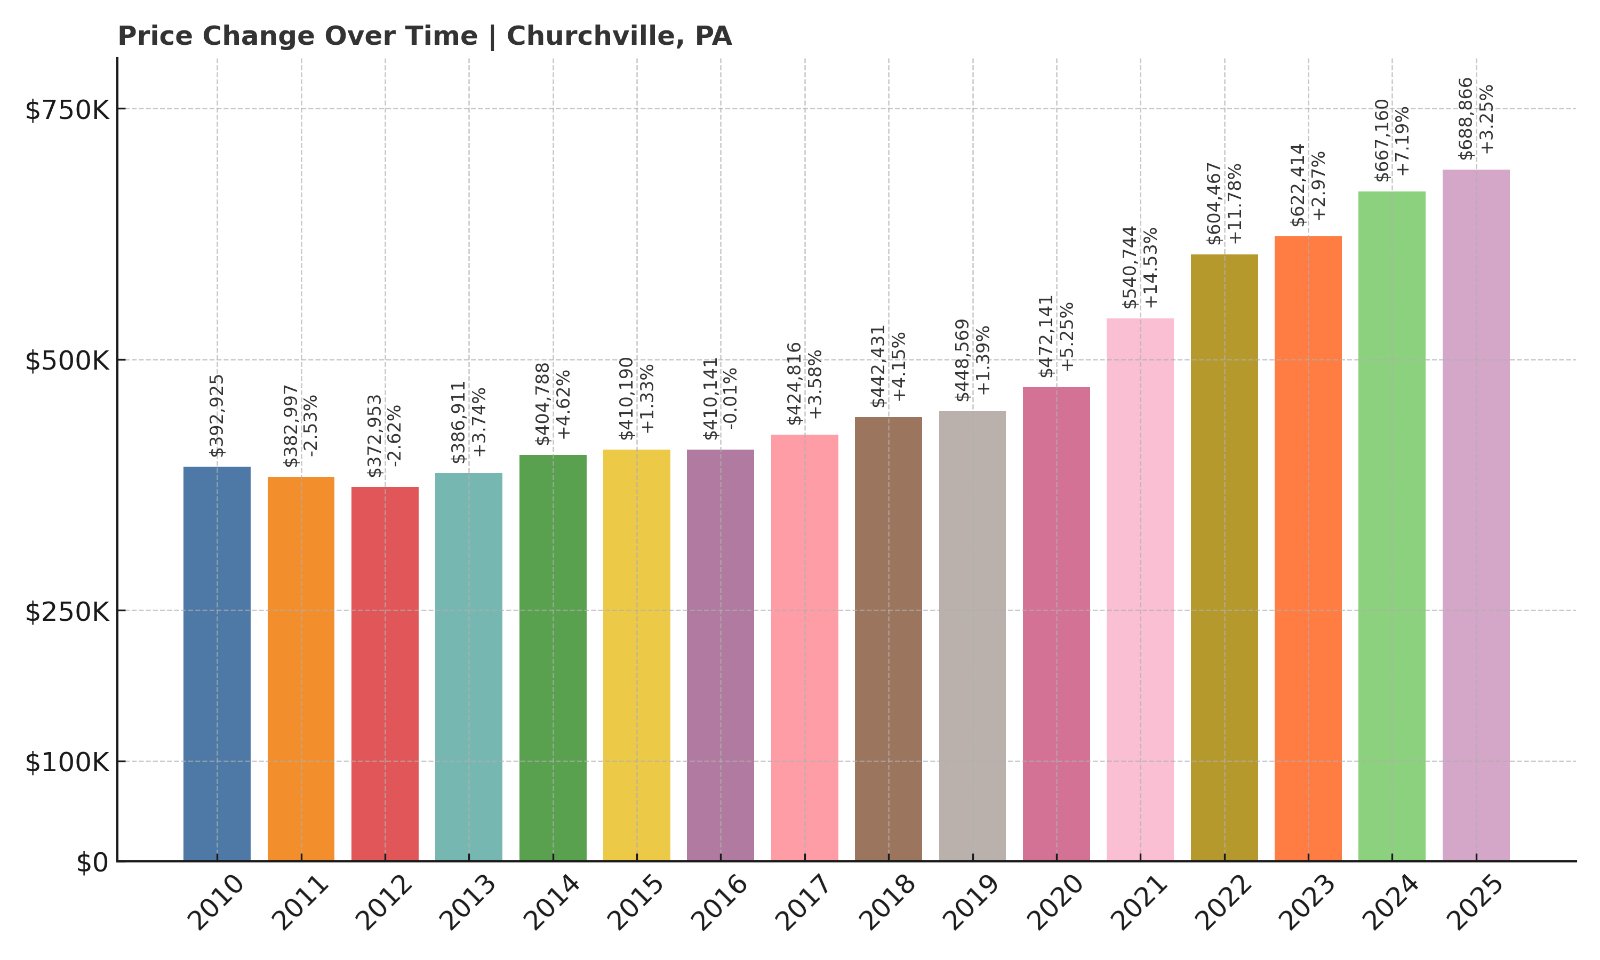
- 2010: $392,925
- 2011: $382,997 (-$9,929, -2.53%)
- 2012: $372,953 (-$10,044, -2.62%)
- 2013: $386,911 (+$13,958, +3.74%)
- 2014: $404,788 (+$17,878, +4.62%)
- 2015: $410,190 (+$5,401, +1.33%)
- 2016: $410,141 (-$49, -0.01%)
- 2017: $424,816 (+$14,675, +3.58%)
- 2018: $442,431 (+$17,615, +4.15%)
- 2019: $448,569 (+$6,138, +1.39%)
- 2020: $472,141 (+$23,573, +5.26%)
- 2021: $540,744 (+$68,603, +14.53%)
- 2022: $604,467 (+$63,723, +11.78%)
- 2023: $622,414 (+$17,947, +2.97%)
- 2024: $667,160 (+$44,746, +7.19%)
- 2025: $688,866 (+$21,705, +3.25%)
Churchville home prices have gone up by 75.3% since 2010, climbing to $688,866 in 2025. Much of that growth happened after 2020, with strong annual gains continuing over the past three years.
Churchville – Quiet Living, Strong Appreciation
Churchville, located in Bucks County, offers a low-profile lifestyle with high-performing schools and a solid commuter location. While it lacks the flash of some larger suburbs, its appeal lies in well-kept neighborhoods, peaceful streets, and strong resale value.
Buyers here are often long-term residents looking for solid investments rather than quick flips. With stable price growth, Churchville has proven to be one of the region’s most reliable higher-end housing markets.
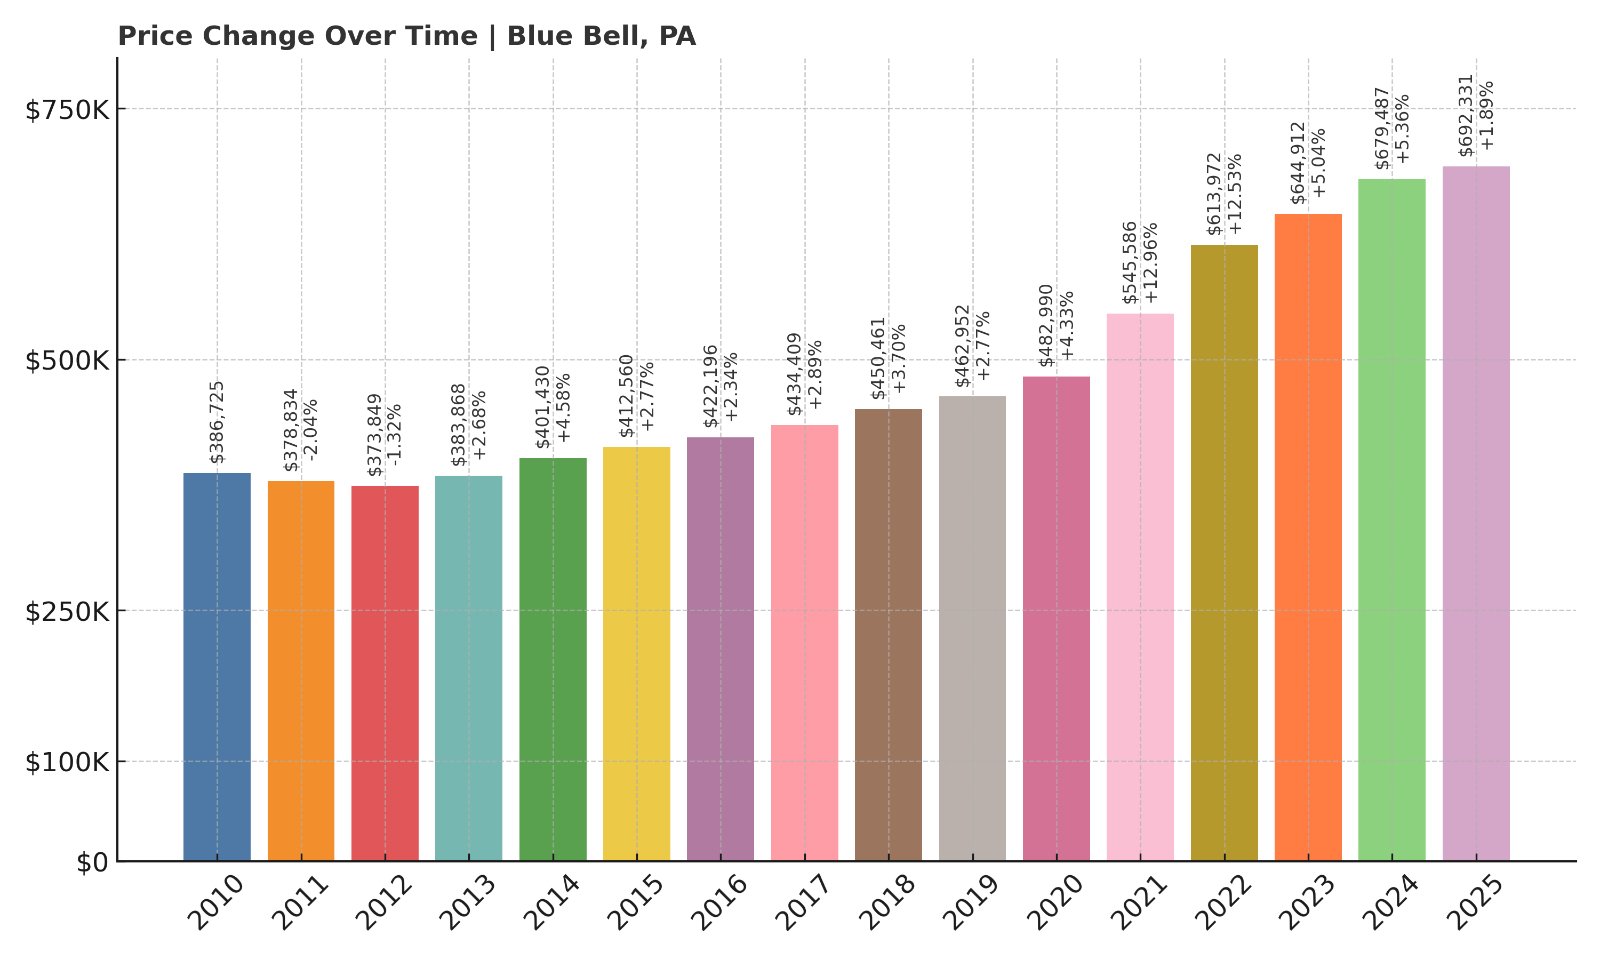
21. Blue Bell – 79% Home Price Increase Since 2010
Would you like to save this?
- 2010: $386,725
- 2011: $378,834 (-$7,891, -2.04%)
- 2012: $373,849 (-$4,986, -1.32%)
- 2013: $383,868 (+$10,019, +2.68%)
- 2014: $401,430 (+$17,562, +4.57%)
- 2015: $412,560 (+$11,130, +2.77%)
- 2016: $422,196 (+$9,636, +2.34%)
- 2017: $434,409 (+$12,213, +2.89%)
- 2018: $450,461 (+$16,053, +3.70%)
- 2019: $462,952 (+$12,491, +2.77%)
- 2020: $482,990 (+$20,038, +4.33%)
- 2021: $545,586 (+$62,596, +12.96%)
- 2022: $613,972 (+$68,386, +12.53%)
- 2023: $644,912 (+$30,940, +5.04%)
- 2024: $679,487 (+$34,574, +5.36%)
- 2025: $692,331 (+$12,844, +1.89%)
Blue Bell home values have increased nearly 80% since 2010, reaching $692,331 in 2025. While growth has slowed slightly this year, the long-term trend remains upward and consistent.
Blue Bell – Upscale and Business-Friendly
Blue Bell, in Montgomery County, is known for its blend of residential affluence and corporate hubs. With strong school districts and easy access to I-476 and Route 202, it appeals to executives and professionals seeking proximity to work and golf-course living.
The past decade has brought new housing developments and a steady demand for luxury homes. While 2025’s 1.89% growth is modest, it’s reflective of a mature market with limited room for wild swings—good news for buyers looking for long-term security in their investment.
20. Glen Mills – 82.9% Home Price Increase Since 2010
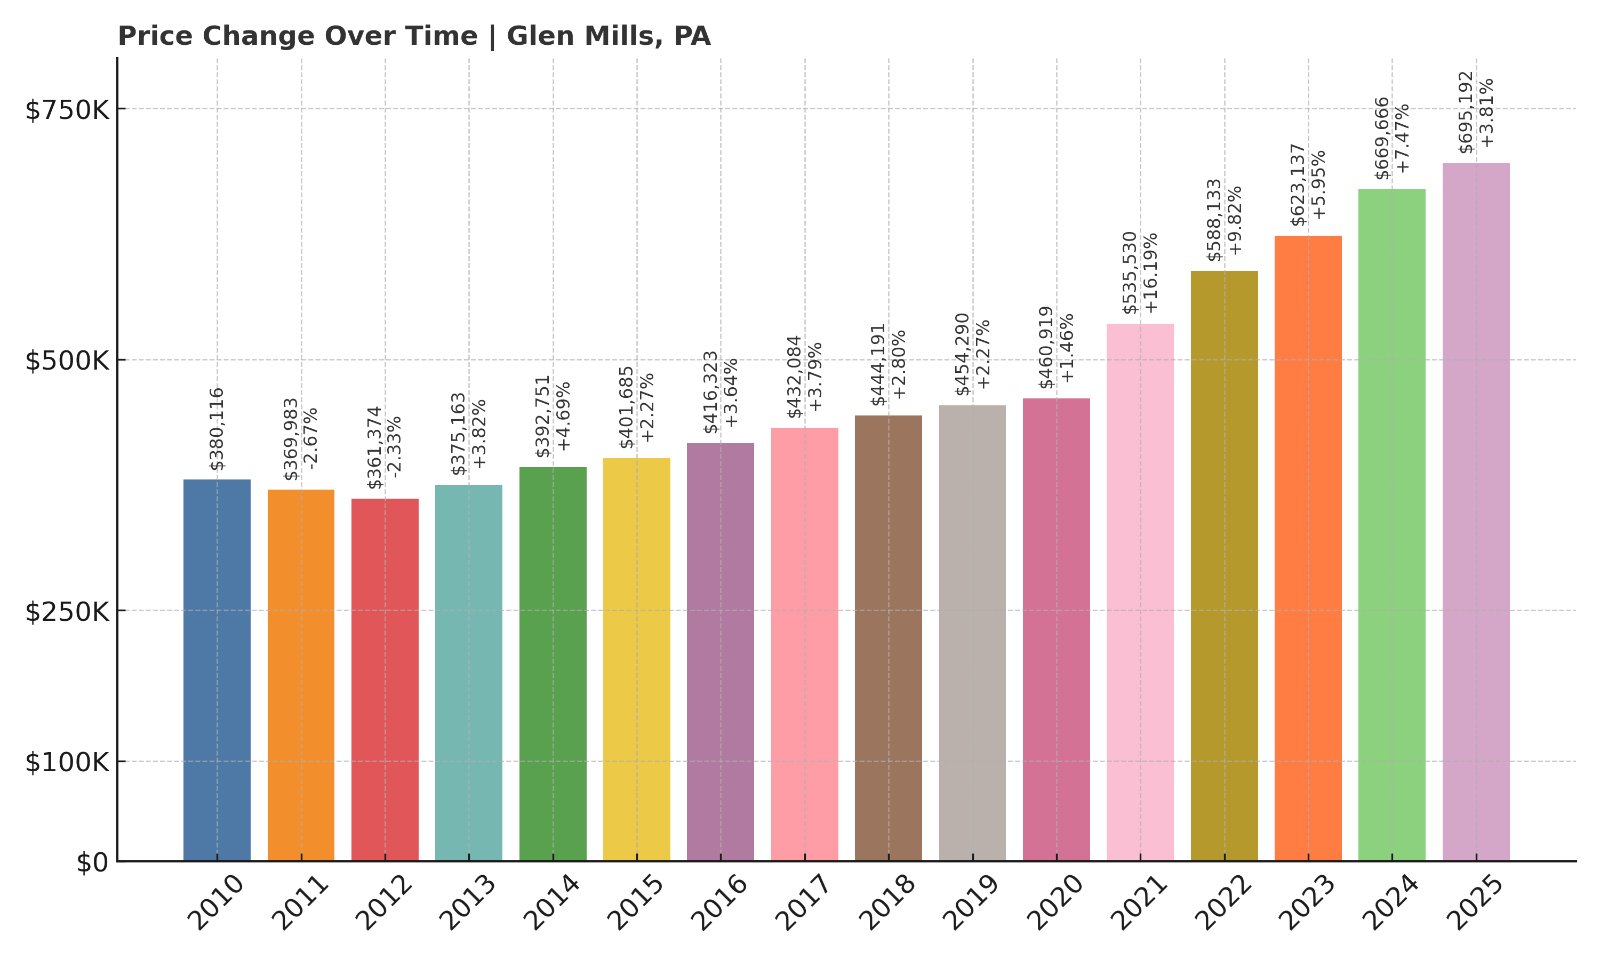
- 2010: $380,116
- 2011: $369,983 (-$10,133, -2.67%)
- 2012: $361,374 (-$8,609, -2.33%)
- 2013: $375,163 (+$13,789, +3.82%)
- 2014: $392,751 (+$17,589, +4.69%)
- 2015: $401,685 (+$8,933, +2.27%)
- 2016: $416,323 (+$14,639, +3.64%)
- 2017: $432,084 (+$15,761, +3.79%)
- 2018: $444,191 (+$12,107, +2.80%)
- 2019: $454,290 (+$10,098, +2.27%)
- 2020: $460,919 (+$6,629, +1.46%)
- 2021: $535,530 (+$74,611, +16.19%)
- 2022: $588,133 (+$52,603, +9.82%)
- 2023: $623,137 (+$35,004, +5.95%)
- 2024: $669,666 (+$46,528, +7.47%)
- 2025: $695,192 (+$25,526, +3.81%)
Since 2010, Glen Mills has seen home values grow by nearly 83%, with the average property now priced at $695,192. Even after large jumps in 2021 and 2022, the market continues to rise, adding more than $25,000 in the past year alone.
Glen Mills – High-End Growth with a Country Feel
Glen Mills, in Delaware County, mixes upscale developments with a semi-rural setting that appeals to buyers looking for space and comfort. The area has become increasingly popular among professionals seeking luxury without the congestion of inner suburbs.
With convenient access to Route 1 and 202, plus highly rated Garnet Valley schools, Glen Mills has maintained a strong market across economic cycles. Dining, golf courses, and a variety of retail options support its desirability—and the data shows buyers are willing to pay a premium for it.
19. Richboro – 71.8% Home Price Increase Since 2010
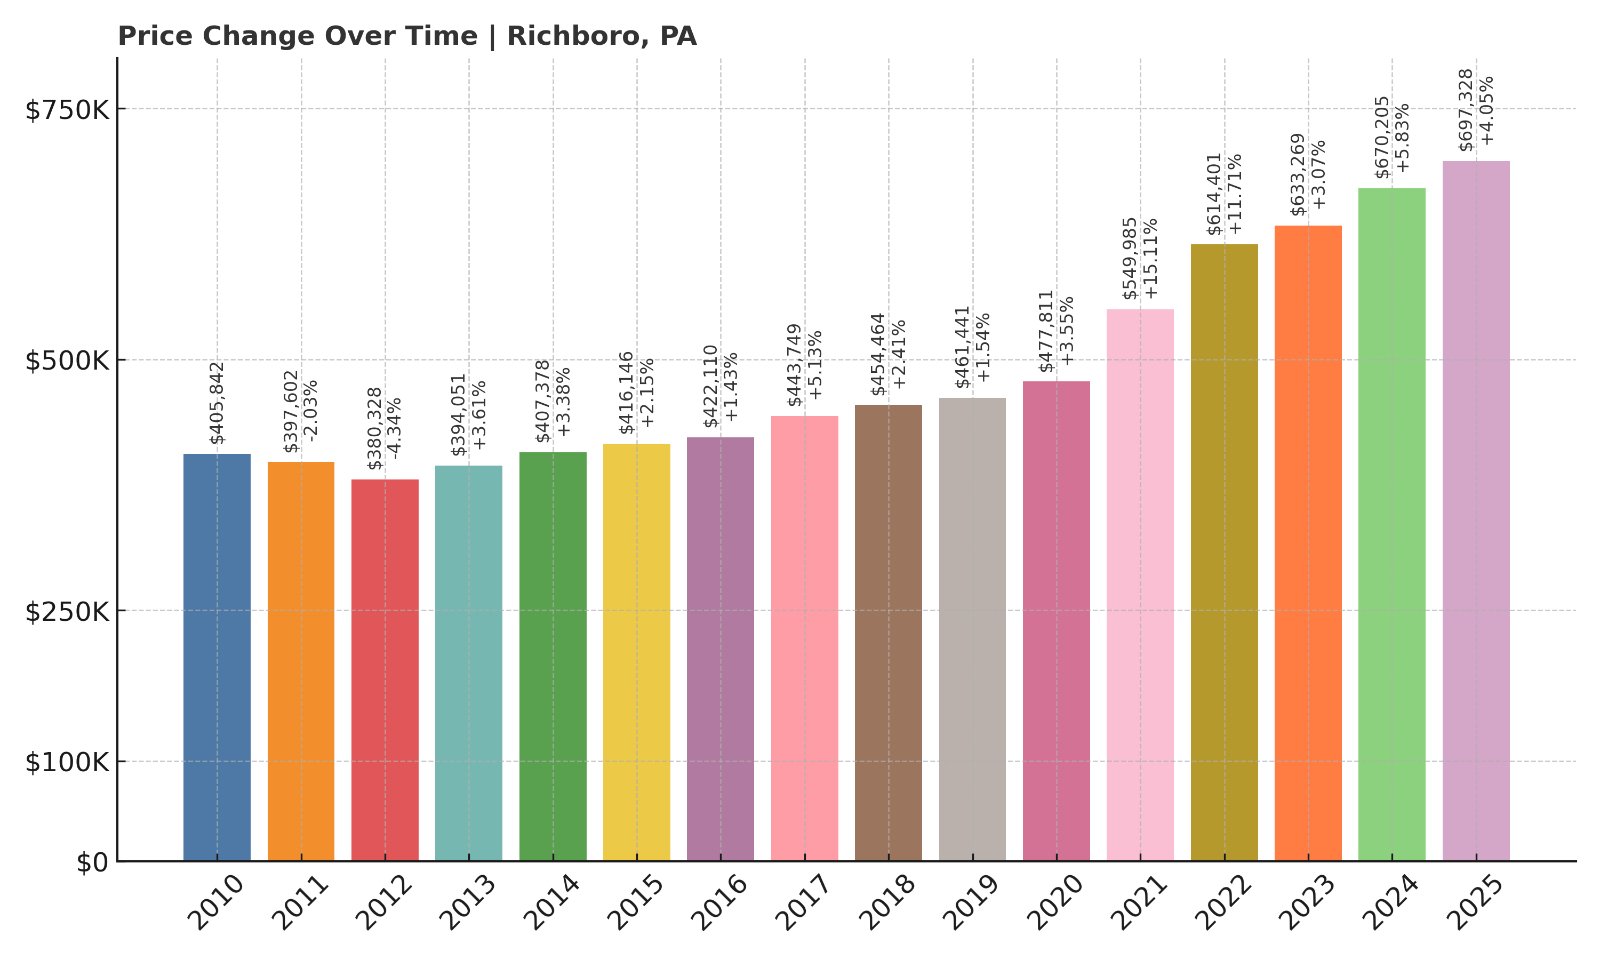
- 2010: $405,842
- 2011: $397,602 (-$8,239, -2.03%)
- 2012: $380,328 (-$17,275, -4.34%)
- 2013: $394,051 (+$13,723, +3.61%)
- 2014: $407,378 (+$13,326, +3.38%)
- 2015: $416,146 (+$8,769, +2.15%)
- 2016: $422,110 (+$5,964, +1.43%)
- 2017: $443,749 (+$21,639, +5.13%)
- 2018: $454,464 (+$10,715, +2.41%)
- 2019: $461,441 (+$6,976, +1.54%)
- 2020: $477,811 (+$16,371, +3.55%)
- 2021: $549,985 (+$72,173, +15.11%)
- 2022: $614,401 (+$64,416, +11.71%)
- 2023: $633,269 (+$18,868, +3.07%)
- 2024: $670,205 (+$36,936, +5.83%)
- 2025: $697,328 (+$27,123, +4.05%)
Richboro has seen its home prices rise by nearly 72% since 2010, finishing at $697,328 in 2025. Recent annual increases remain strong, with 4.05% growth just this past year.
Richboro – Bucks County Stability and Space
Located in Northampton Township, Richboro offers a quiet, residential lifestyle with large homes and strong school systems. It’s a classic Bucks County suburb, popular with families looking for larger properties and a slower pace without being too far from the city.
Inventory is typically tight here, and that continues to drive prices higher. While the 2021–2022 boom contributed to a significant jump, steady growth has remained a theme even after those spikes. Richboro’s consistent appreciation reflects both its desirability and low housing churn.
18. Dresher – 59.4% Home Price Increase Since 2016

- 2016: $442,569
- 2017: $455,830 (+$13,261, +3.00%)
- 2018: $465,256 (+$9,427, +2.07%)
- 2019: $478,321 (+$13,065, +2.81%)
- 2020: $487,746 (+$9,424, +1.97%)
- 2021: $564,335 (+$76,589, +15.70%)
- 2022: $624,634 (+$60,299, +10.68%)
- 2023: $648,772 (+$24,138, +3.86%)
- 2024: $691,670 (+$42,898, +6.61%)
- 2025: $705,467 (+$13,797, +1.99%)
Home prices in Dresher have increased nearly 60% since 2016. In 2025, the average price reached $705,467, following a multi-year streak of gains driven by limited supply and steady demand.
Dresher – Low Inventory, High Return
Dresher, a quiet suburb in Upper Dublin Township, Montgomery County, offers top-ranked schools, convenient commuting options via Route 309 and the PA Turnpike, and a strong sense of community. It’s not flashy—but it’s extremely desirable.
Buyers have long valued the combination of well-built mid-century homes and newer high-end properties. Even though the 2025 increase was just under 2%, it caps nearly a decade of gains that make Dresher one of the most consistently appreciating suburbs in the Philadelphia metro area.
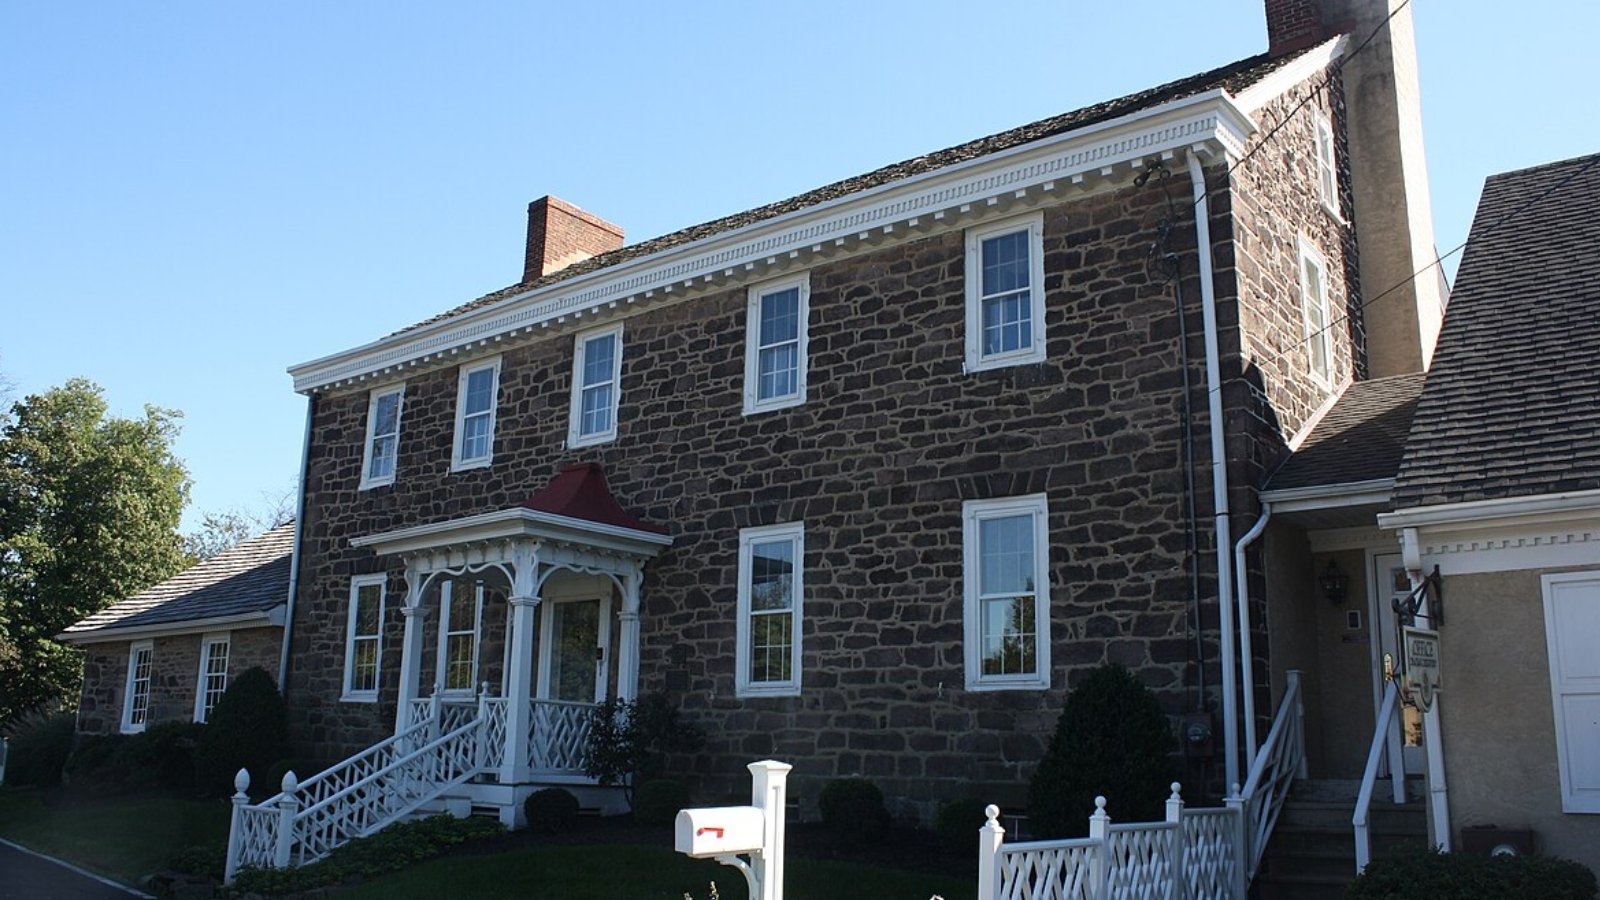
17. Chadds Ford – 3.47% Home Price Increase Since 2024
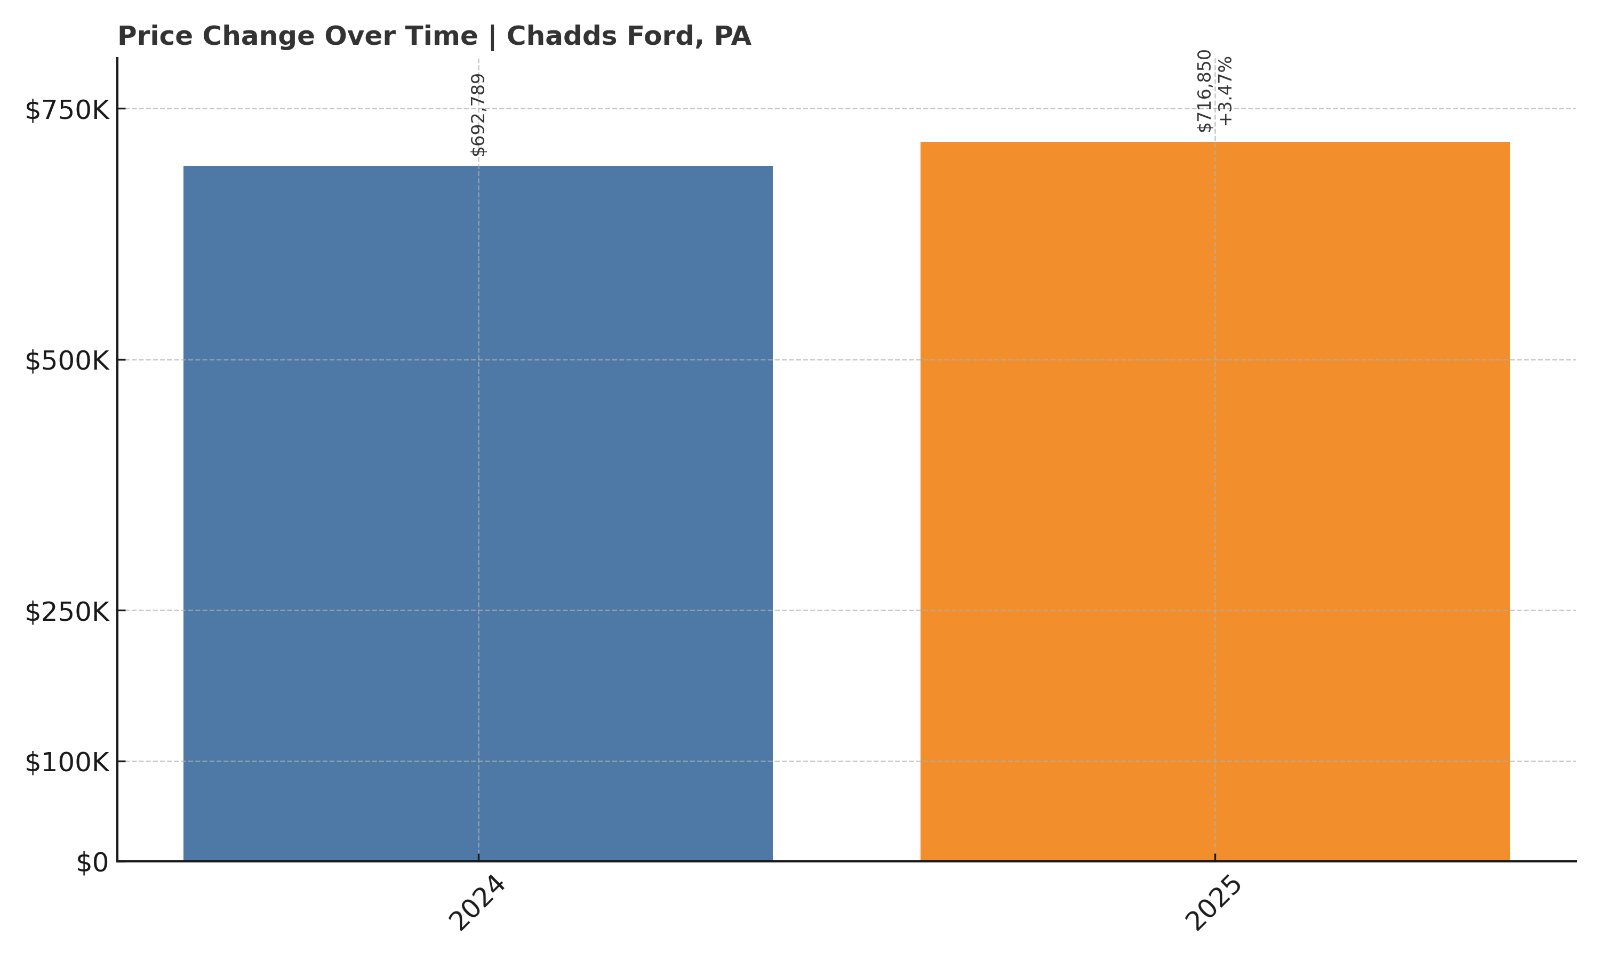
- 2024: $692,789
- 2025: $716,850 (+$24,061, +3.47% from previous year)
Chadds Ford posted a 3.47% gain over the past year, with home prices now averaging $716,850. While long-term data isn’t available, the recent growth is in line with its high-end market profile.
Chadds Ford – A Historic Market with Ongoing Demand
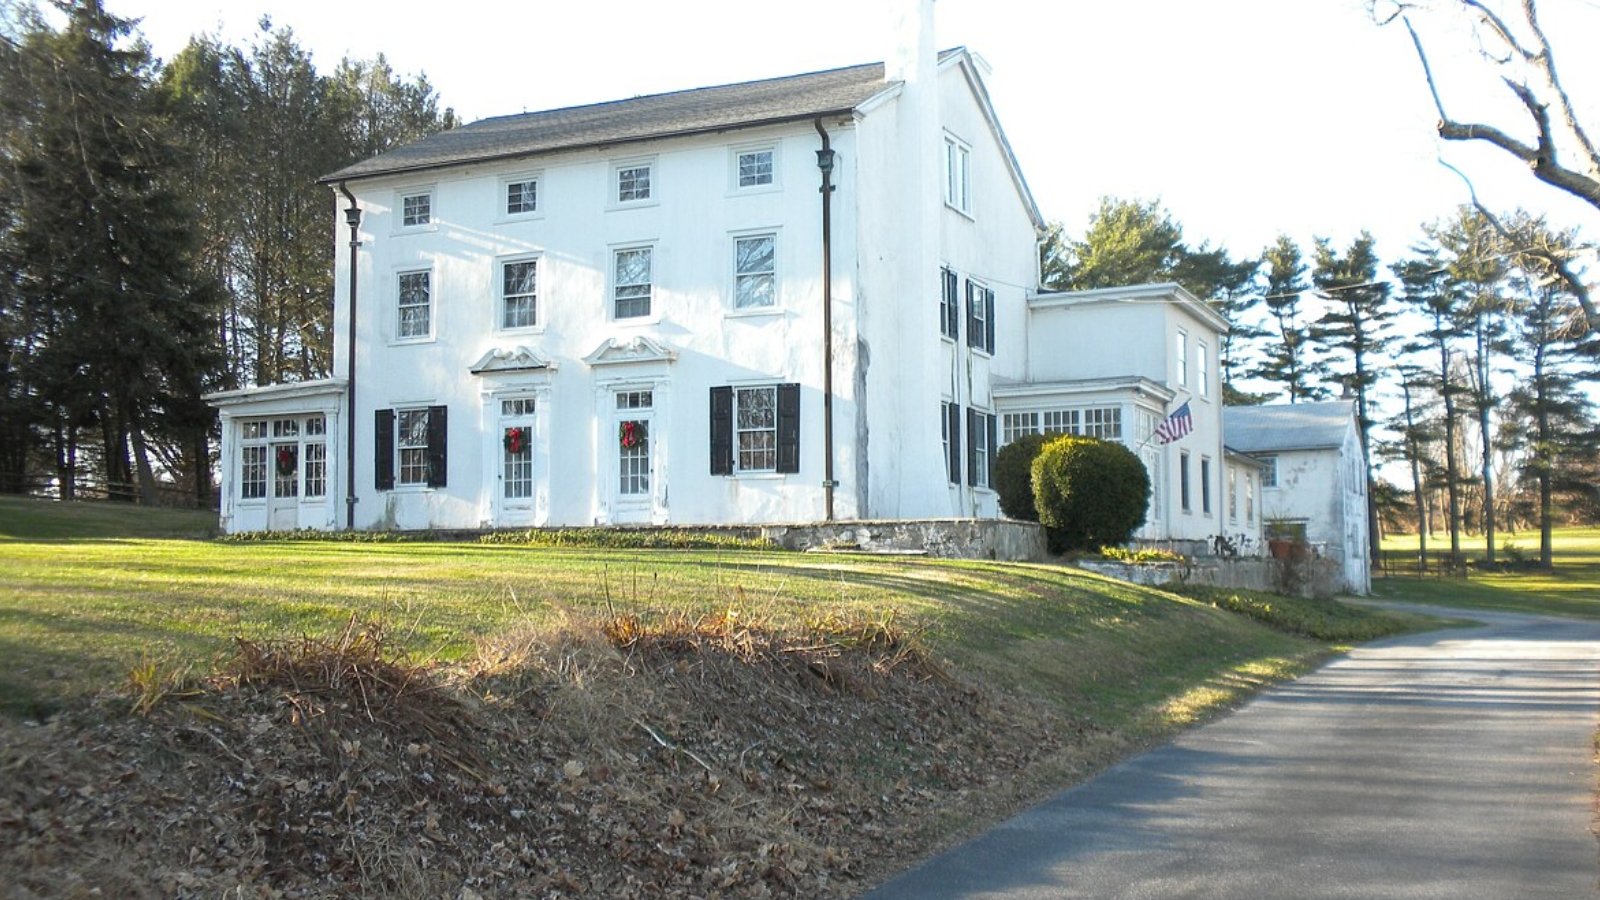
Known for its ties to the Brandywine River Valley and a deep cultural legacy, Chadds Ford in Delaware County is both scenic and sought-after. Its schools—particularly the Unionville-Chadds Ford district—are some of the strongest in the region, which supports price stability.
Many homes here are situated on large, wooded lots with classic colonial or farmhouse architecture. Buyers come for charm, privacy, and proximity to both Route 1 and major job hubs. That formula continues to drive prices upward, year after year.
16. Furlong – 56.3% Home Price Increase Since 2016
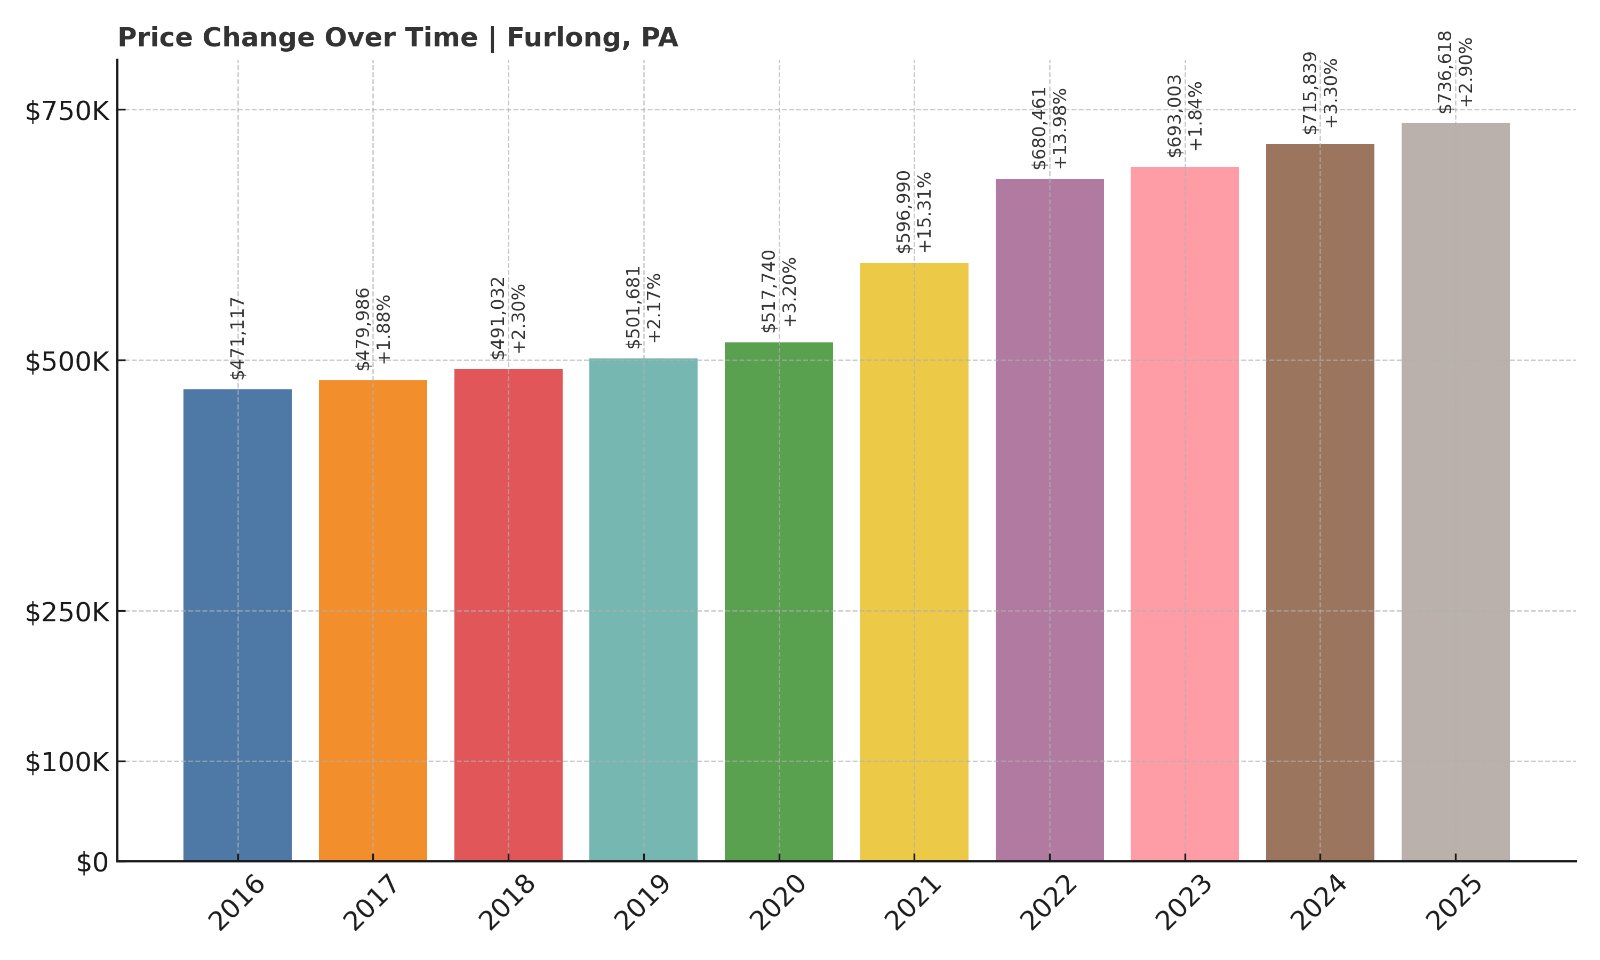
- 2016: $471,117
- 2017: $479,986 (+$8,870, +1.88%)
- 2018: $491,032 (+$11,045, +2.30%)
- 2019: $501,681 (+$10,649, +2.17%)
- 2020: $517,740 (+$16,059, +3.20%)
- 2021: $596,990 (+$79,250, +15.31%)
- 2022: $680,461 (+$83,471, +13.98%)
- 2023: $693,003 (+$12,542, +1.84%)
- 2024: $715,839 (+$22,836, +3.30%)
- 2025: $736,618 (+$20,779, +2.90%)
Furlong home prices have grown more than 56% since 2016, with the 2025 average landing at $736,618. Most of the growth happened during the 2021–2022 boom, but steady increases have followed each year since.
Furlong – Bucks County Growth with Upscale Appeal
Furlong, in central Bucks County, is prized for its upscale subdivisions, proximity to Doylestown, and the Central Bucks School District. It offers a good blend of newer developments and well-kept traditional homes with plenty of green space and privacy.
Though smaller than neighboring towns, Furlong’s housing market has remained competitive. With inventory often scarce and move-in-ready homes going fast, demand continues to push values upward—even in a cooling statewide market.
15. Chester Springs – 76.8% Home Price Increase Since 2010
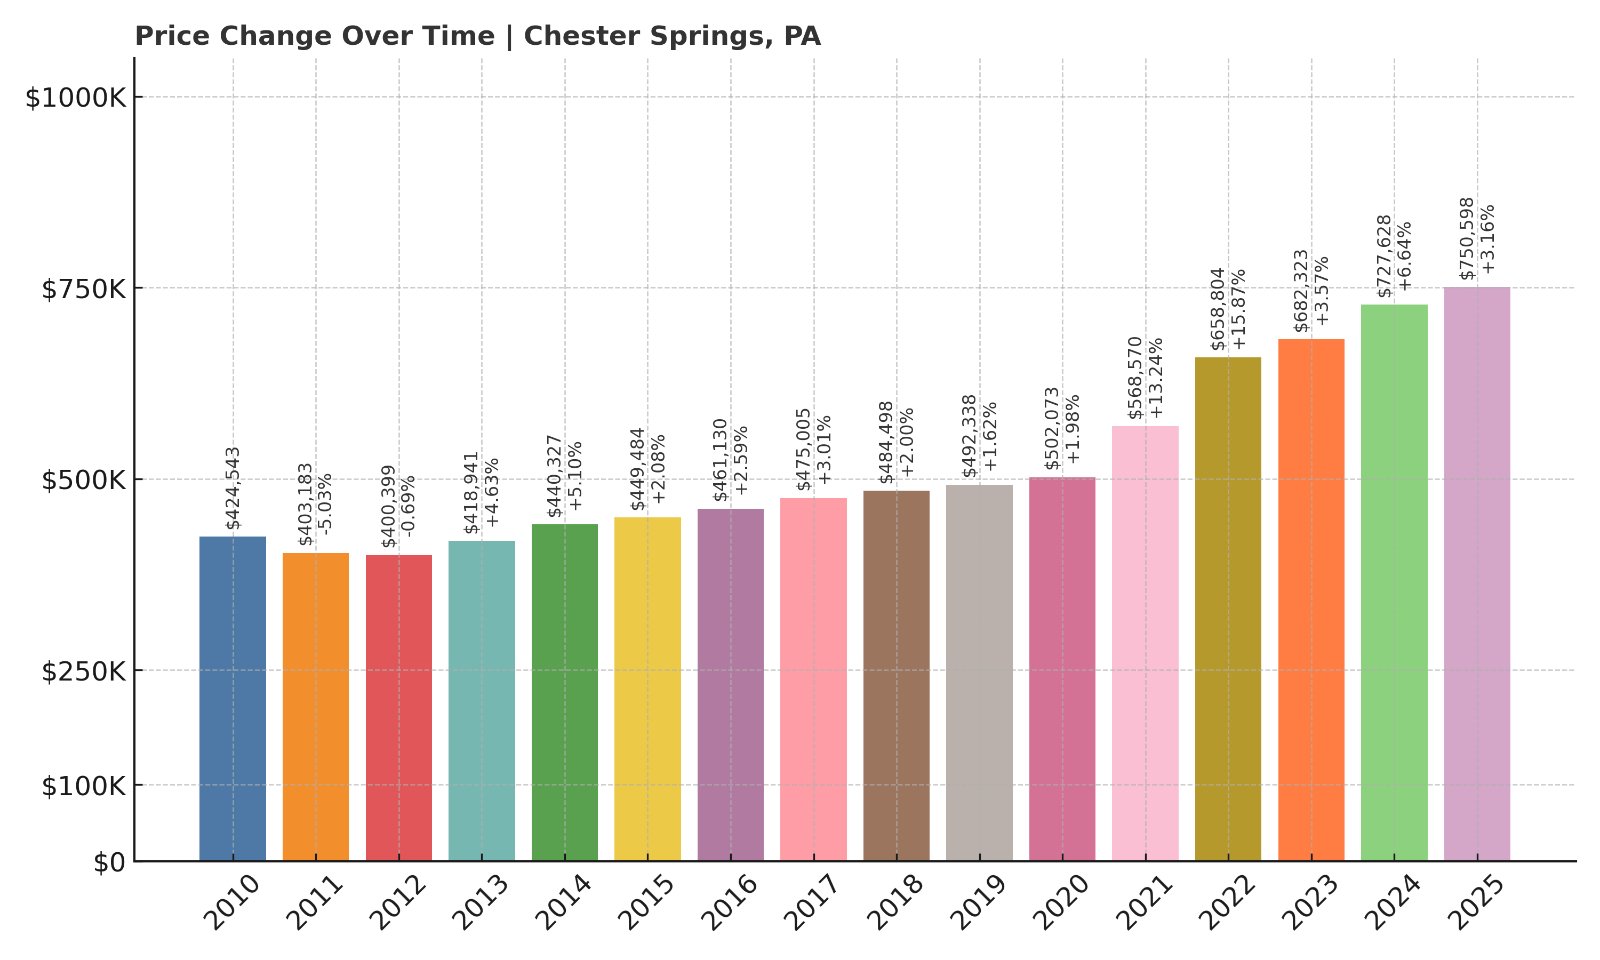
- 2010: $424,543
- 2011: $403,183 (-$21,360, -5.03%)
- 2012: $400,399 (-$2,784, -0.69%)
- 2013: $418,941 (+$18,542, +4.63%)
- 2014: $440,327 (+$21,386, +5.10%)
- 2015: $449,484 (+$9,157, +2.08%)
- 2016: $461,130 (+$11,646, +2.59%)
- 2017: $475,005 (+$13,875, +3.01%)
- 2018: $484,498 (+$9,493, +2.00%)
- 2019: $492,338 (+$7,840, +1.62%)
- 2020: $502,073 (+$9,735, +1.98%)
- 2021: $568,570 (+$66,497, +13.24%)
- 2022: $658,804 (+$90,234, +15.87%)
- 2023: $682,323 (+$23,519, +3.57%)
- 2024: $727,628 (+$45,305, +6.64%)
- 2025: $750,598 (+$22,970, +3.16%)
Since 2010, Chester Springs home values have climbed by more than 76%, with the average now at $750,598. Price gains have remained consistent even after the post-pandemic surge, with another $22K added this past year alone.
Chester Springs – Scenic, Serene, and Still Surging
Located in northern Chester County, Chester Springs is known for its rolling hills, horse farms, and upscale homes. Its peaceful setting and proximity to Route 100 and the Pennsylvania Turnpike make it a favorite among those who want rural beauty with suburban convenience.
The area’s price appreciation reflects strong demand for newer construction and stately custom homes on large lots. Many buyers are drawn by the Downingtown Area School District and the semi-rural environment that’s still within commuting distance to King of Prussia and West Chester. This blend of setting and accessibility continues to drive demand—and values.
14. Fort Washington – 60.9% Home Price Increase Since 2016
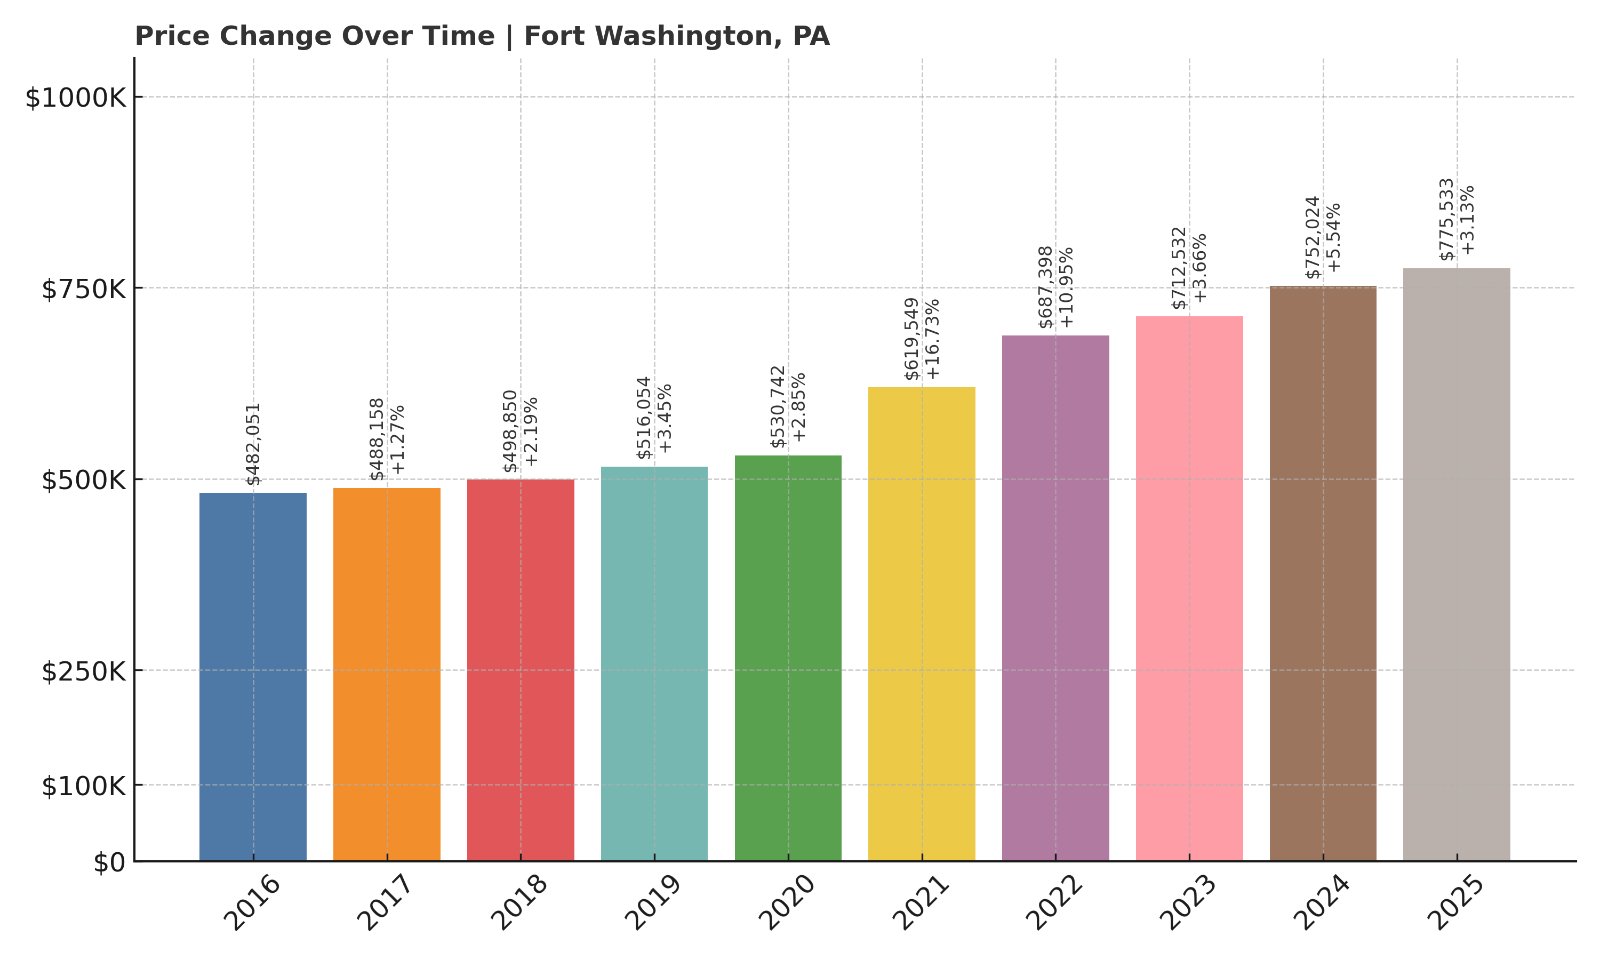
- 2016: $482,051
- 2017: $488,158 (+$6,108, +1.27%)
- 2018: $498,850 (+$10,692, +2.19%)
- 2019: $516,054 (+$17,204, +3.45%)
- 2020: $530,742 (+$14,687, +2.85%)
- 2021: $619,549 (+$88,807, +16.73%)
- 2022: $687,398 (+$67,849, +10.95%)
- 2023: $712,532 (+$25,134, +3.66%)
- 2024: $752,024 (+$39,492, +5.54%)
- 2025: $775,533 (+$23,508, +3.13%)
Home prices in Fort Washington have increased 60.9% since 2016. The 2025 average of $775,533 continues a pattern of steady appreciation that began in earnest after 2020.
Fort Washington – Transit and Tranquility in One Package
Fort Washington, a Montgomery County community along the SEPTA rail line and Route 309, has long been favored for its location. It offers a quick trip into Philadelphia, good schools, and established neighborhoods—making it a safe and rising investment.
The area’s housing market is competitive but not frenzied, and new buyers continue to push prices higher. In addition to excellent highway and rail access, Fort Washington hosts several corporate campuses and country clubs, helping keep the area desirable for professionals and executives alike.
13. Newtown Square – 2.10% Home Price Increase Since 2024
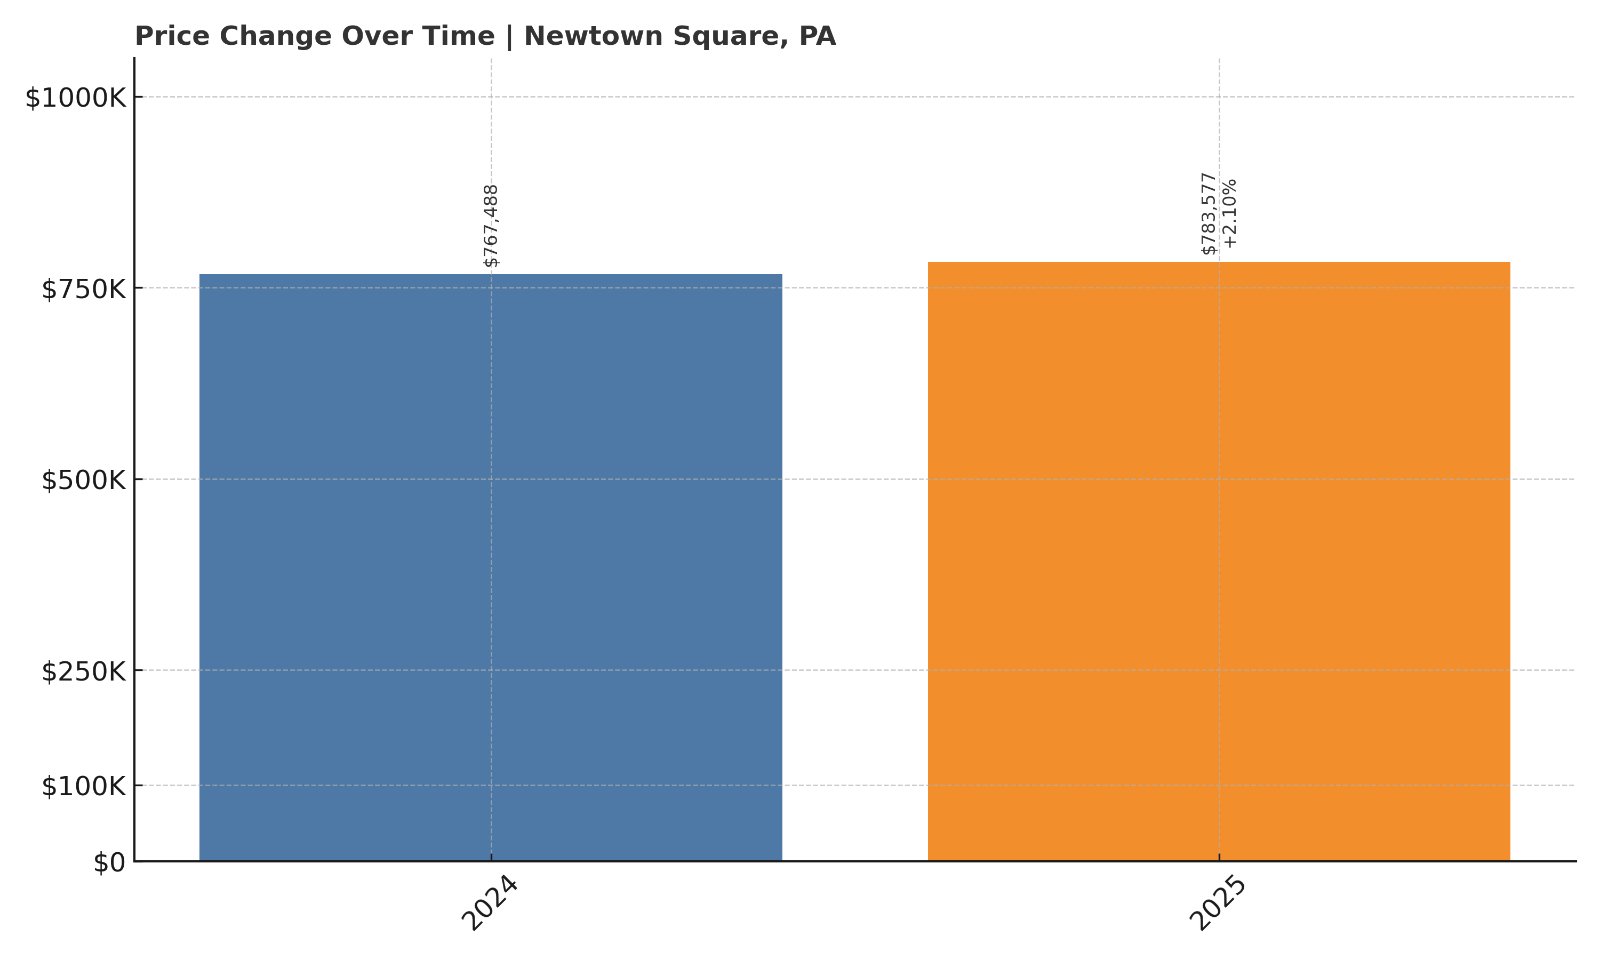
- 2024: $767,488
- 2025: $783,577 (+$16,088, +2.10% from previous year)
Newtown Square’s home prices ticked up 2.1% in the last year, with the 2025 median reaching $783,577. While there’s no long-term data available, this slight gain suggests prices are holding steady in this high-demand town.
Newtown Square – Tech, Trails, and Consistent Demand
Located in Delaware County, Newtown Square is home to several major employers—including SAP America—and a number of luxury residential developments. It blends executive housing with natural preserves like Ridley Creek State Park, creating a balance that appeals to buyers seeking upscale but not overbuilt environments.
The town also benefits from strong public and private school options, as well as proximity to the Main Line. Though 2025’s gain was modest, it follows several years of expansion and positions Newtown Square as one of the most stable luxury markets in southeastern Pennsylvania.
12. Wynnewood – 92.3% Home Price Increase Since 2010
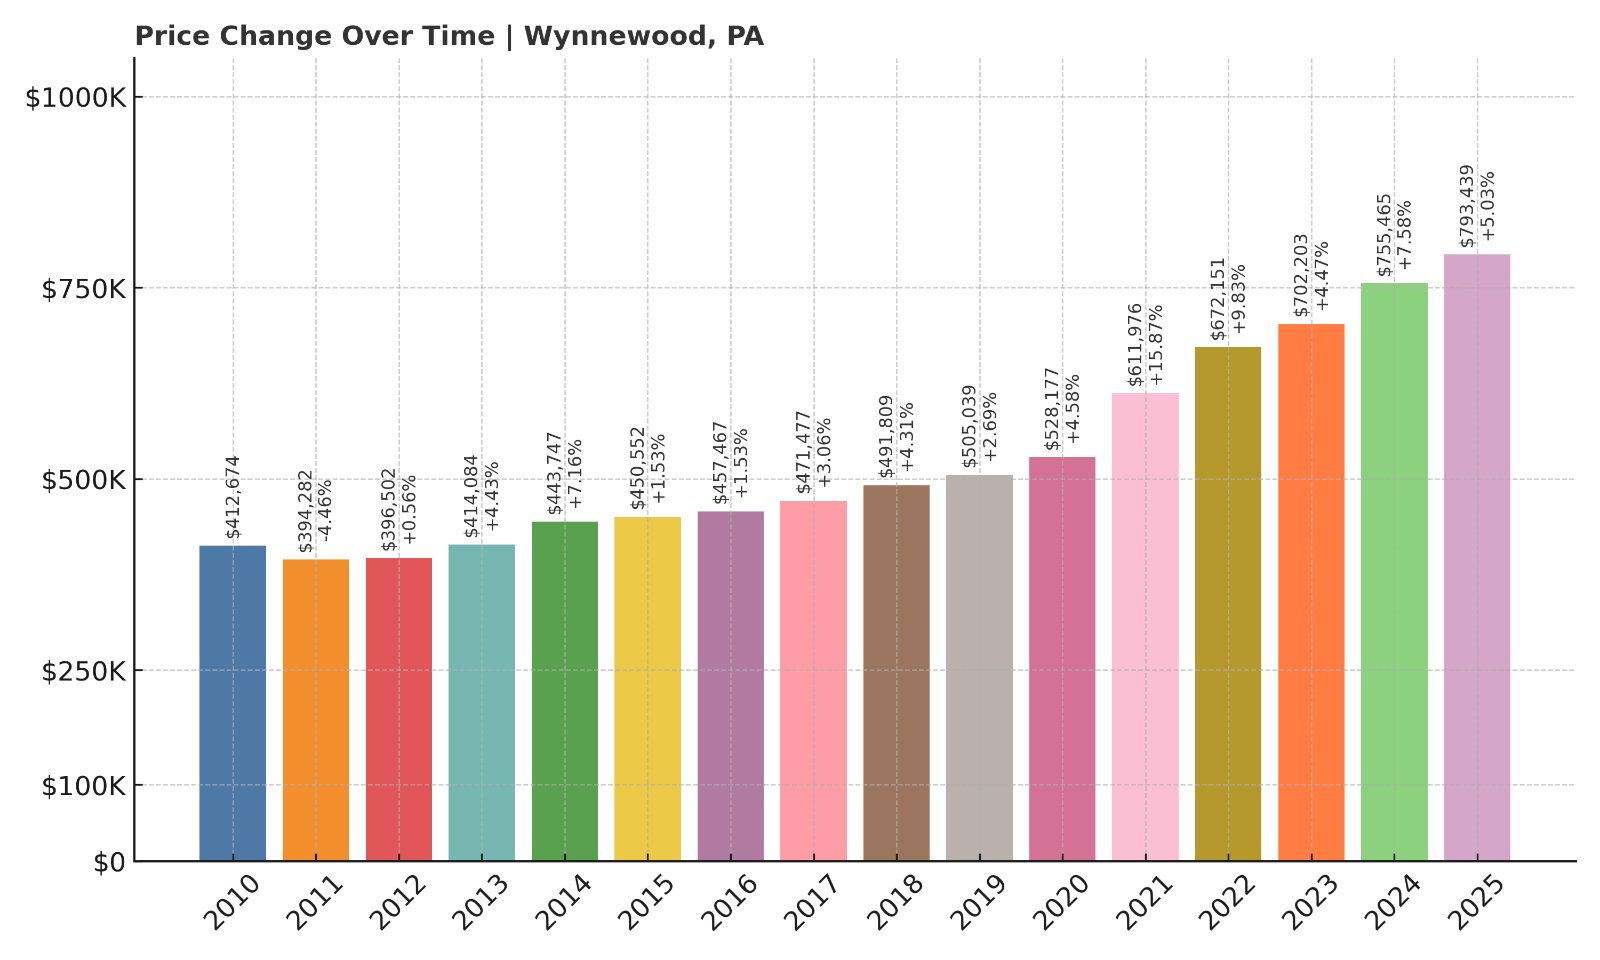
- 2010: $412,674
- 2011: $394,282 (-$18,392, -4.46%)
- 2012: $396,502 (+$2,220, +0.56%)
- 2013: $414,084 (+$17,582, +4.43%)
- 2014: $443,747 (+$29,663, +7.16%)
- 2015: $450,552 (+$6,805, +1.53%)
- 2016: $457,467 (+$6,915, +1.53%)
- 2017: $471,477 (+$14,010, +3.06%)
- 2018: $491,809 (+$20,332, +4.31%)
- 2019: $505,039 (+$13,230, +2.69%)
- 2020: $528,177 (+$23,139, +4.58%)
- 2021: $611,976 (+$83,799, +15.87%)
- 2022: $672,151 (+$60,174, +9.83%)
- 2023: $702,203 (+$30,053, +4.47%)
- 2024: $755,465 (+$53,262, +7.58%)
- 2025: $793,439 (+$37,974, +5.03%)
Wynnewood’s home values have soared 92.3% since 2010, reaching $793,439 in 2025. The past five years have delivered some of the town’s sharpest increases, with consistent annual gains well above 4%.
Wynnewood – Affluent, Accessible, and Always in Demand
Part of the famed Main Line, Wynnewood straddles Lower Merion and Haverford townships in Montgomery County. It offers direct rail access to Center City and a charming mix of stone colonials, Tudors, and modern homes that make it attractive to a wide range of buyers.
Wynnewood’s value isn’t just location—it’s walkability, top-tier public schools, and proximity to institutions like Lankenau Medical Center. It’s no surprise that its housing market continues to appreciate, with no signs of slowing down in 2025.
11. Malvern – 74.4% Home Price Increase Since 2010
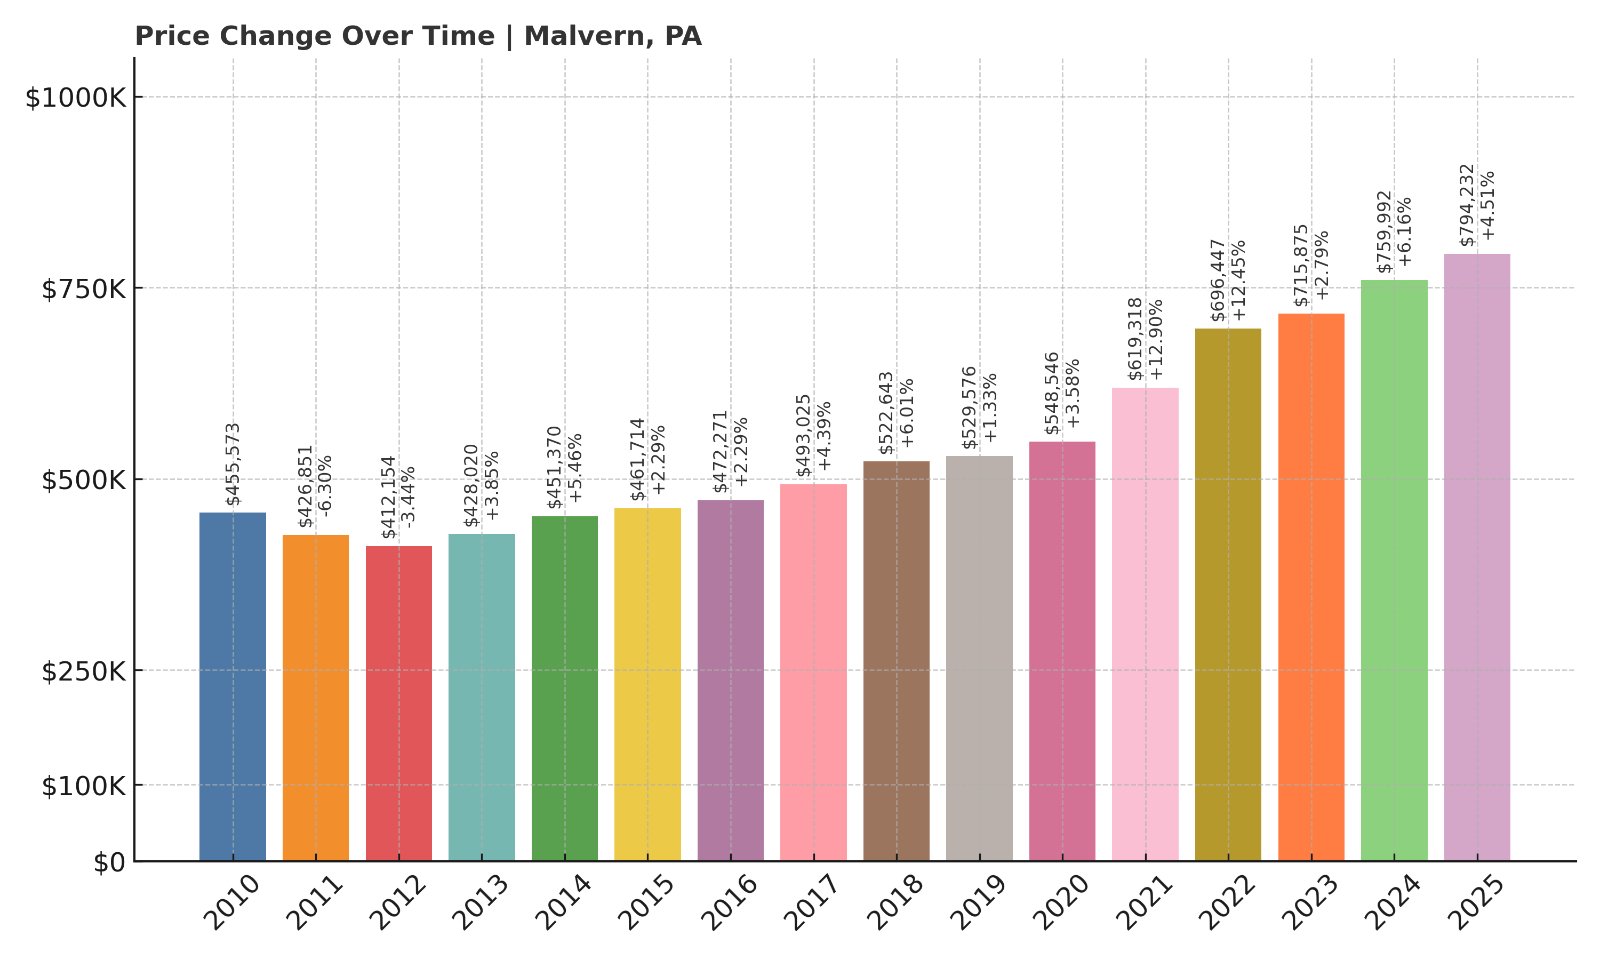
- 2010: $455,573
- 2011: $426,851 (-$28,722, -6.30%)
- 2012: $412,154 (-$14,697, -3.44%)
- 2013: $428,020 (+$15,866, +3.85%)
- 2014: $451,370 (+$23,350, +5.46%)
- 2015: $461,714 (+$10,344, +2.29%)
- 2016: $472,271 (+$10,556, +2.29%)
- 2017: $493,025 (+$20,755, +4.39%)
- 2018: $522,643 (+$29,618, +6.01%)
- 2019: $529,576 (+$6,933, +1.33%)
- 2020: $548,546 (+$18,970, +3.58%)
- 2021: $619,318 (+$70,772, +12.90%)
- 2022: $696,447 (+$77,129, +12.45%)
- 2023: $715,875 (+$19,428, +2.79%)
- 2024: $759,992 (+$44,117, +6.16%)
- 2025: $794,232 (+$34,241, +4.51%)
Malvern’s home values have increased 74.4% since 2010, with consistent growth year after year. The current median stands at $794,232, reflecting sustained demand and high buyer confidence.
Malvern – Chester County’s Elegant Growth Engine
Malvern offers a rare mix: a charming, walkable downtown and a growing tech corridor anchored by corporate campuses like Vanguard. It’s part of the Great Valley School District, a major driver of homebuyer interest.
The housing stock ranges from historic homes to luxury developments, with steady turnover keeping the market competitive. Malvern’s accessibility, quality of life, and strong community infrastructure make it one of the most reliable—and expensive—markets in southeastern PA.
10. Narberth – 97.6% Home Price Increase Since 2010
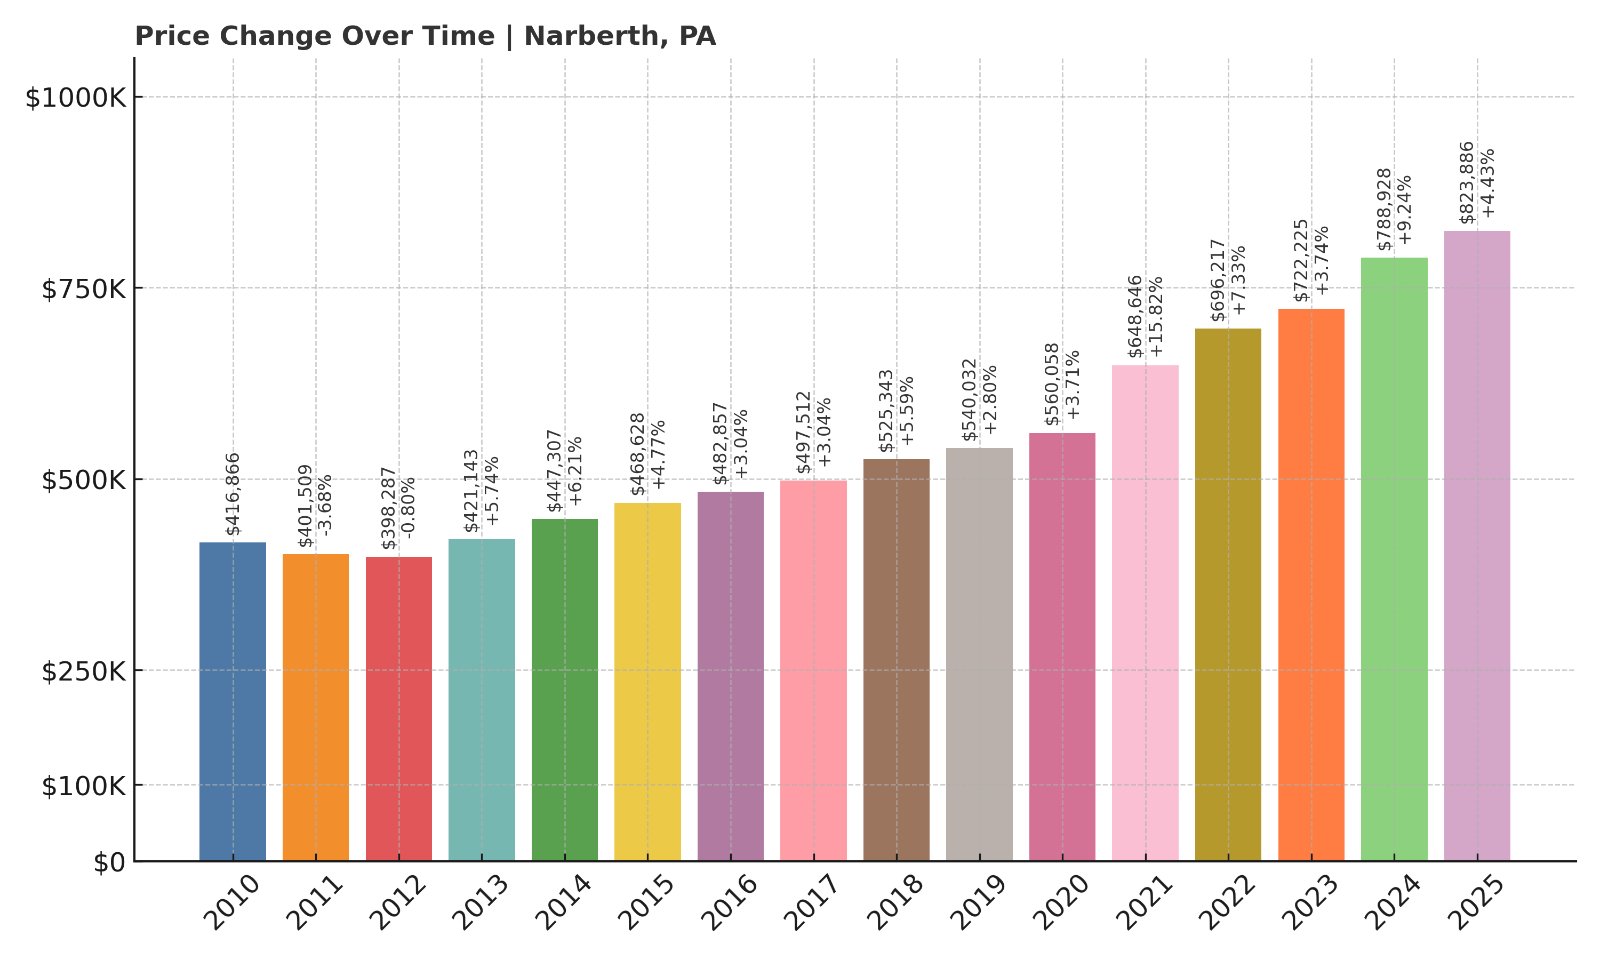
- 2010: $416,866
- 2011: $401,509 (-$15,357, -3.68%)
- 2012: $398,287 (-$3,222, -0.80%)
- 2013: $421,143 (+$22,855, +5.74%)
- 2014: $447,307 (+$26,164, +6.21%)
- 2015: $468,628 (+$21,322, +4.77%)
- 2016: $482,857 (+$14,229, +3.04%)
- 2017: $497,512 (+$14,654, +3.03%)
- 2018: $525,343 (+$27,832, +5.59%)
- 2019: $540,032 (+$14,688, +2.80%)
- 2020: $560,058 (+$20,027, +3.71%)
- 2021: $648,646 (+$88,588, +15.82%)
- 2022: $696,217 (+$47,571, +7.33%)
- 2023: $722,225 (+$26,008, +3.74%)
- 2024: $788,928 (+$66,703, +9.24%)
- 2025: $823,886 (+$34,958, +4.43%)
Narberth home prices have nearly doubled since 2010, growing by 97.6%. In 2025, the average reached $823,886—another strong year that followed a nearly 10% increase in 2024.
Narberth – Village Living with Main Line Access
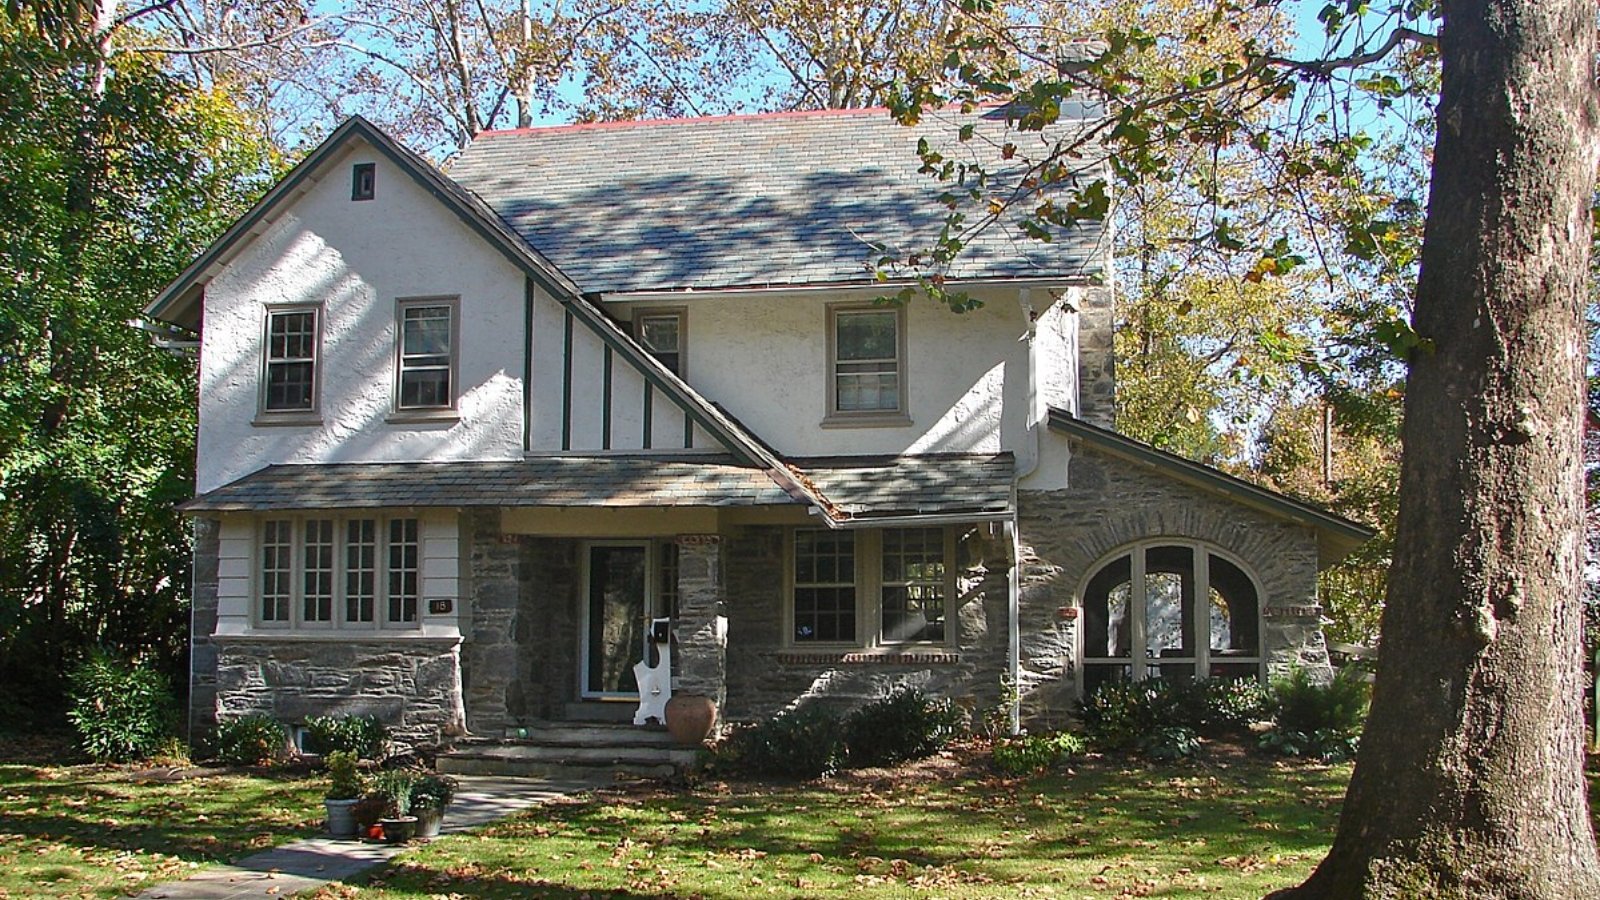
Narberth is a borough with a big personality. Located on the Main Line in Montgomery County, it’s known for its walkable downtown, SEPTA Regional Rail station, and tight-knit community vibe. Many homes are early 20th-century twins and single-family houses with character that rarely come on the market.
This small town’s charm and stellar Lower Merion schools have made it one of the most sought-after places to live in the region. High demand and limited supply keep values climbing, and 2025’s $35K jump shows that buyers are still lining up for the Narberth lifestyle.
9. Bryn Mawr – 79.7% Home Price Increase Since 2010
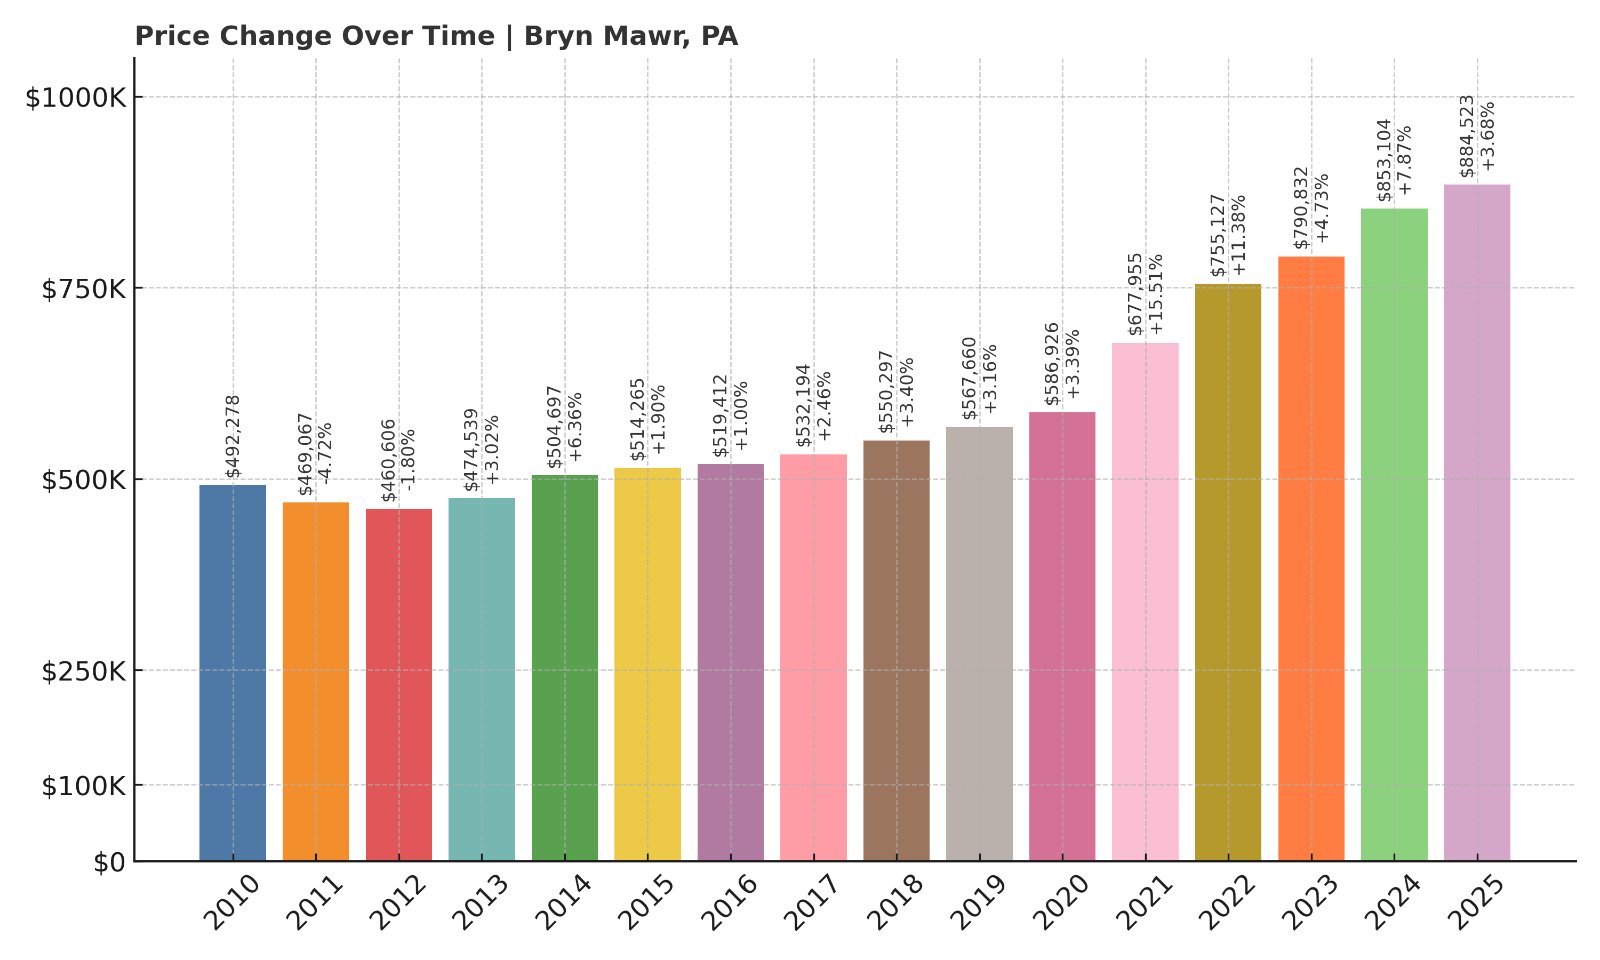
- 2010: $492,278
- 2011: $469,067 (-$23,210, -4.71%)
- 2012: $460,606 (-$8,462, -1.80%)
- 2013: $474,539 (+$13,933, +3.02%)
- 2014: $504,697 (+$30,158, +6.36%)
- 2015: $514,265 (+$9,568, +1.90%)
- 2016: $519,412 (+$5,147, +1.00%)
- 2017: $532,194 (+$12,782, +2.46%)
- 2018: $550,297 (+$18,102, +3.40%)
- 2019: $567,660 (+$17,363, +3.16%)
- 2020: $586,926 (+$19,267, +3.39%)
- 2021: $677,955 (+$91,029, +15.51%)
- 2022: $755,127 (+$77,172, +11.38%)
- 2023: $790,832 (+$35,705, +4.73%)
- 2024: $853,104 (+$62,272, +7.87%)
- 2025: $884,523 (+$31,419, +3.68%)
Bryn Mawr home values rose 79.7% from 2010 to 2025, reaching $884,523. After a massive 15.5% jump in 2021, gains have remained steady, with prices up another $31K this year.
Bryn Mawr – Elite Real Estate in the Heart of the Main Line
Bryn Mawr is synonymous with the Main Line—both in reputation and in price. With its historic estates, private schools, and proximity to prestigious colleges like Bryn Mawr College and Haverford, it attracts a refined market of buyers who value culture, education, and exclusivity.
Home styles range from stone mansions to modern townhomes, and nearly all command top dollar. With limited land for development and strong demand from families and professionals, prices continue to trend upward across most segments of the market.
8. New Hope – 80.4% Home Price Increase Since 2010
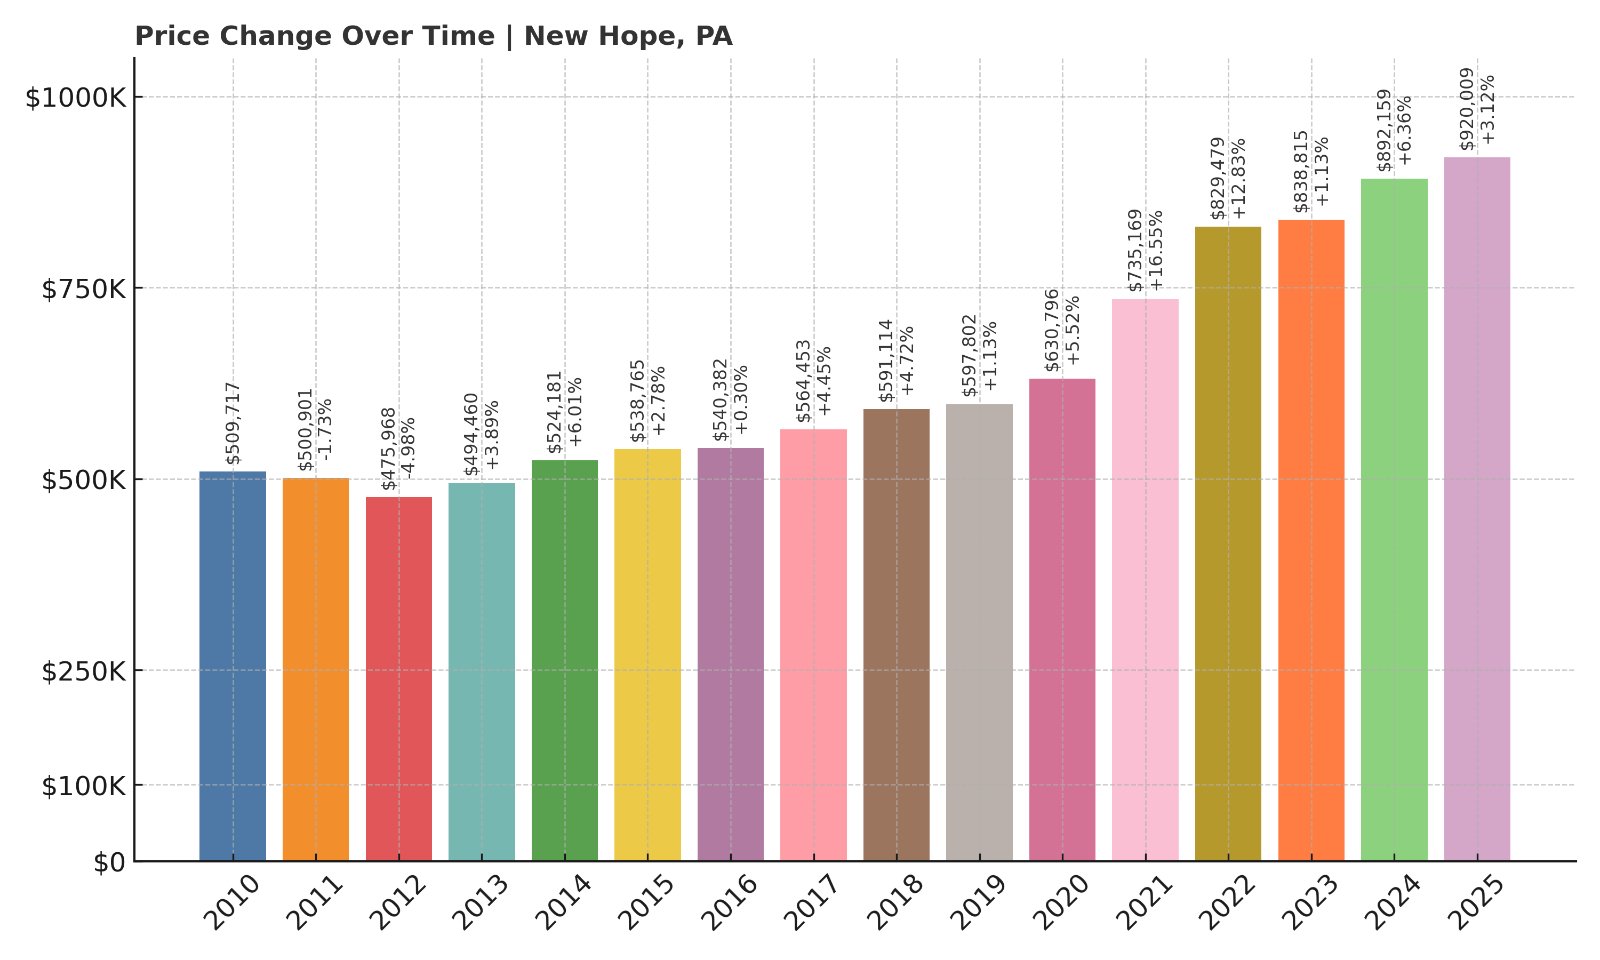
- 2010: $509,717
- 2011: $500,901 (-$8,816, -1.73%)
- 2012: $475,968 (-$24,933, -4.98%)
- 2013: $494,460 (+$18,492, +3.89%)
- 2014: $524,181 (+$29,721, +6.01%)
- 2015: $538,765 (+$14,584, +2.78%)
- 2016: $540,382 (+$1,617, +0.30%)
- 2017: $564,453 (+$24,071, +4.45%)
- 2018: $591,114 (+$26,661, +4.72%)
- 2019: $597,802 (+$6,688, +1.13%)
- 2020: $630,796 (+$32,994, +5.52%)
- 2021: $735,169 (+$104,373, +16.55%)
- 2022: $829,479 (+$94,309, +12.83%)
- 2023: $838,815 (+$9,336, +1.13%)
- 2024: $892,159 (+$53,344, +6.36%)
- 2025: $920,009 (+$27,850, +3.12%)
New Hope home prices have risen over 80% since 2010. In 2025, the average hit $920,009, continuing a multiyear streak of appreciation in this Bucks County destination.
New Hope – Historic Character Meets Luxury Pricing
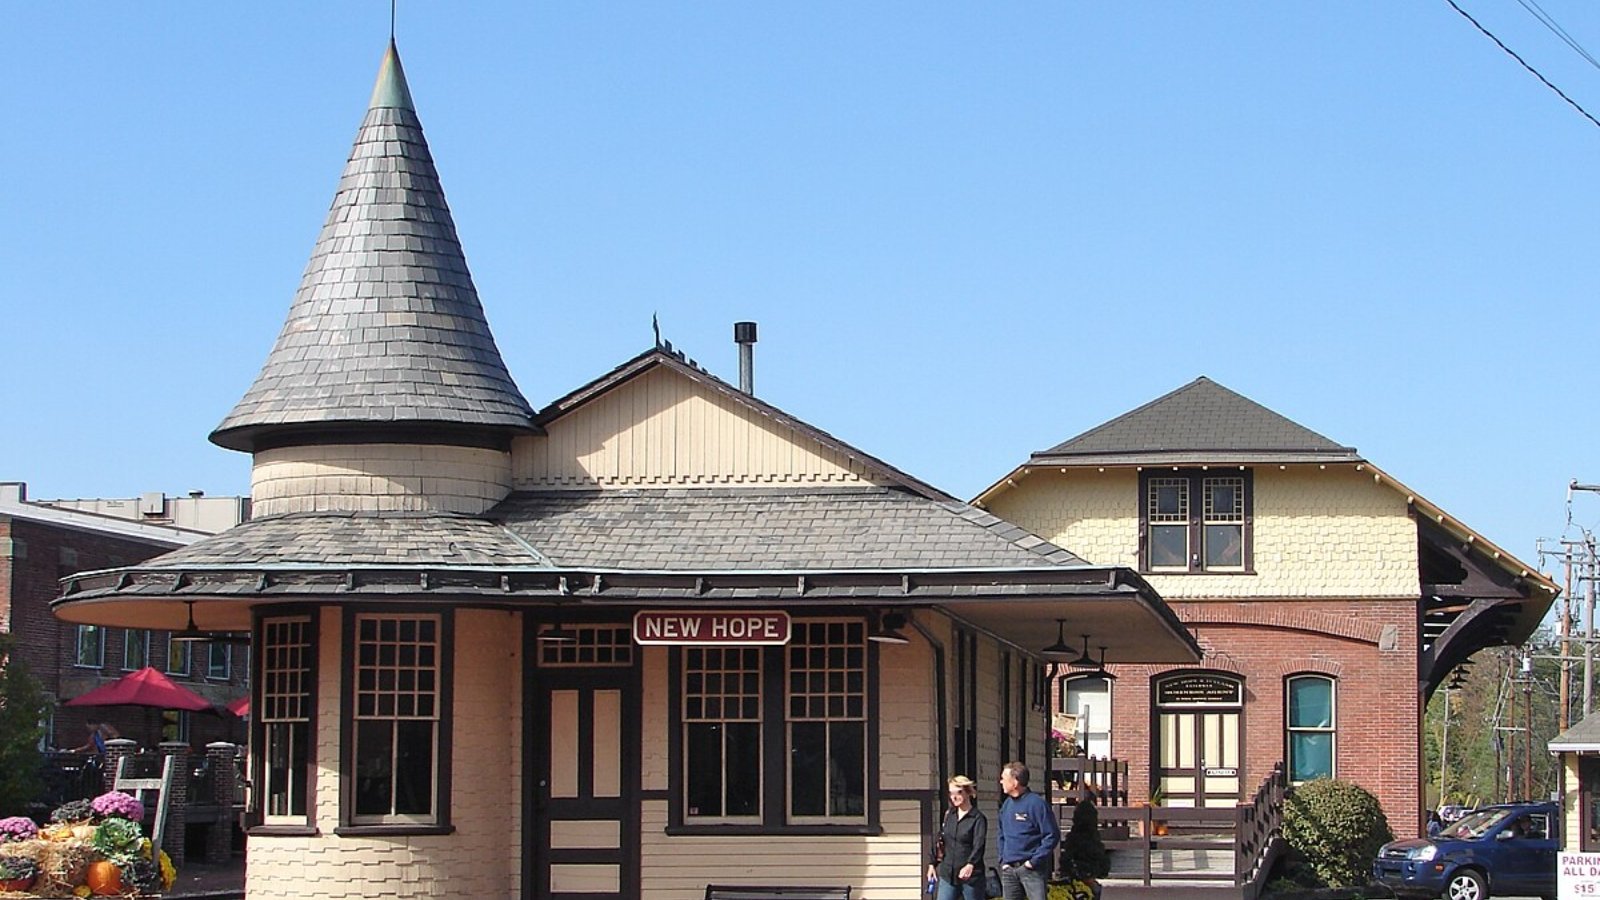
New Hope sits along the Delaware River and has become one of the most desirable small towns in the Northeast. It’s a haven for artists, creatives, and high-income buyers who appreciate both historic charm and modern luxury.
Properties range from stone cottages to sprawling riverfront estates. Despite nationwide market cooling, New Hope continues to thrive thanks to strong tourism, limited housing supply, and a reputation for quality dining, shopping, and scenic beauty.
7. Wayne – 5.18% Home Price Increase Since 2024
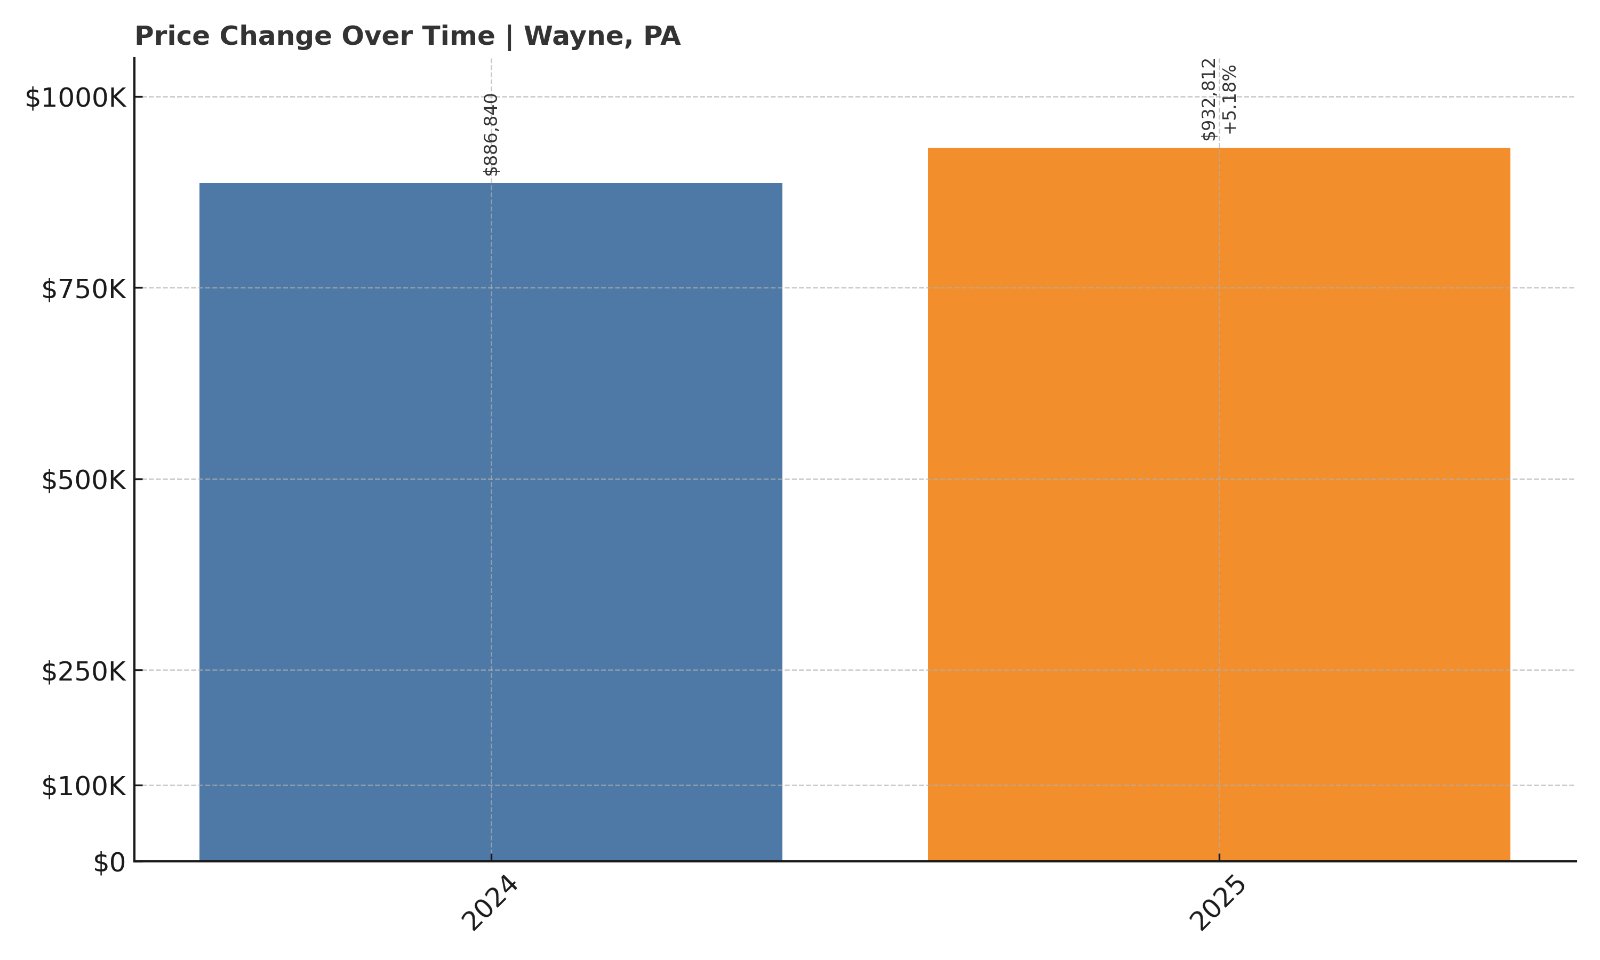
- 2024: $886,840
- 2025: $932,812 (+$45,972, +5.18% from previous year)
Wayne saw a 5.18% increase over the past year, with prices topping $932K in 2025. While longer-term trends aren’t available, recent gains show robust demand.
Wayne – Top-Tier Amenities with Classic Suburban Appeal
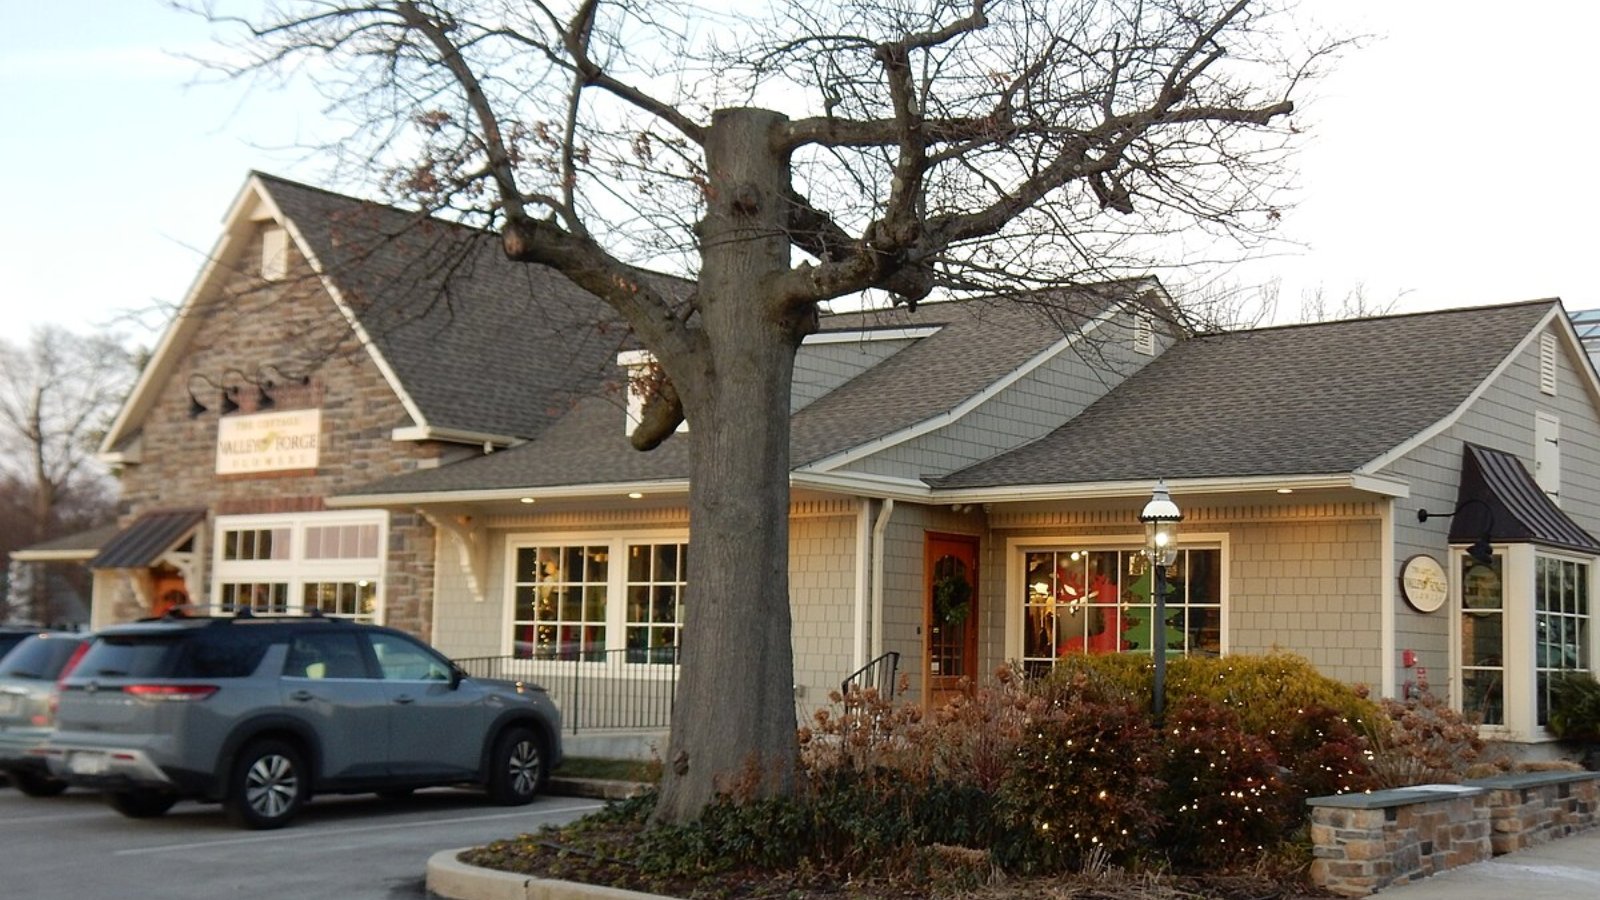
Wayne, located in both Delaware and Chester counties, is a staple of the Main Line and consistently ranks among the most desirable suburbs in Pennsylvania. Its downtown is vibrant, its schools top-notch, and its housing inventory tight—all factors that push prices higher.
Buyers seek out Wayne for its turn-of-the-century homes, upscale shopping, and central access to major highways and rail. Its combination of prestige and livability makes even small annual price jumps significant in terms of market strength.
6. Berwyn – 64.6% Home Price Increase Since 2016
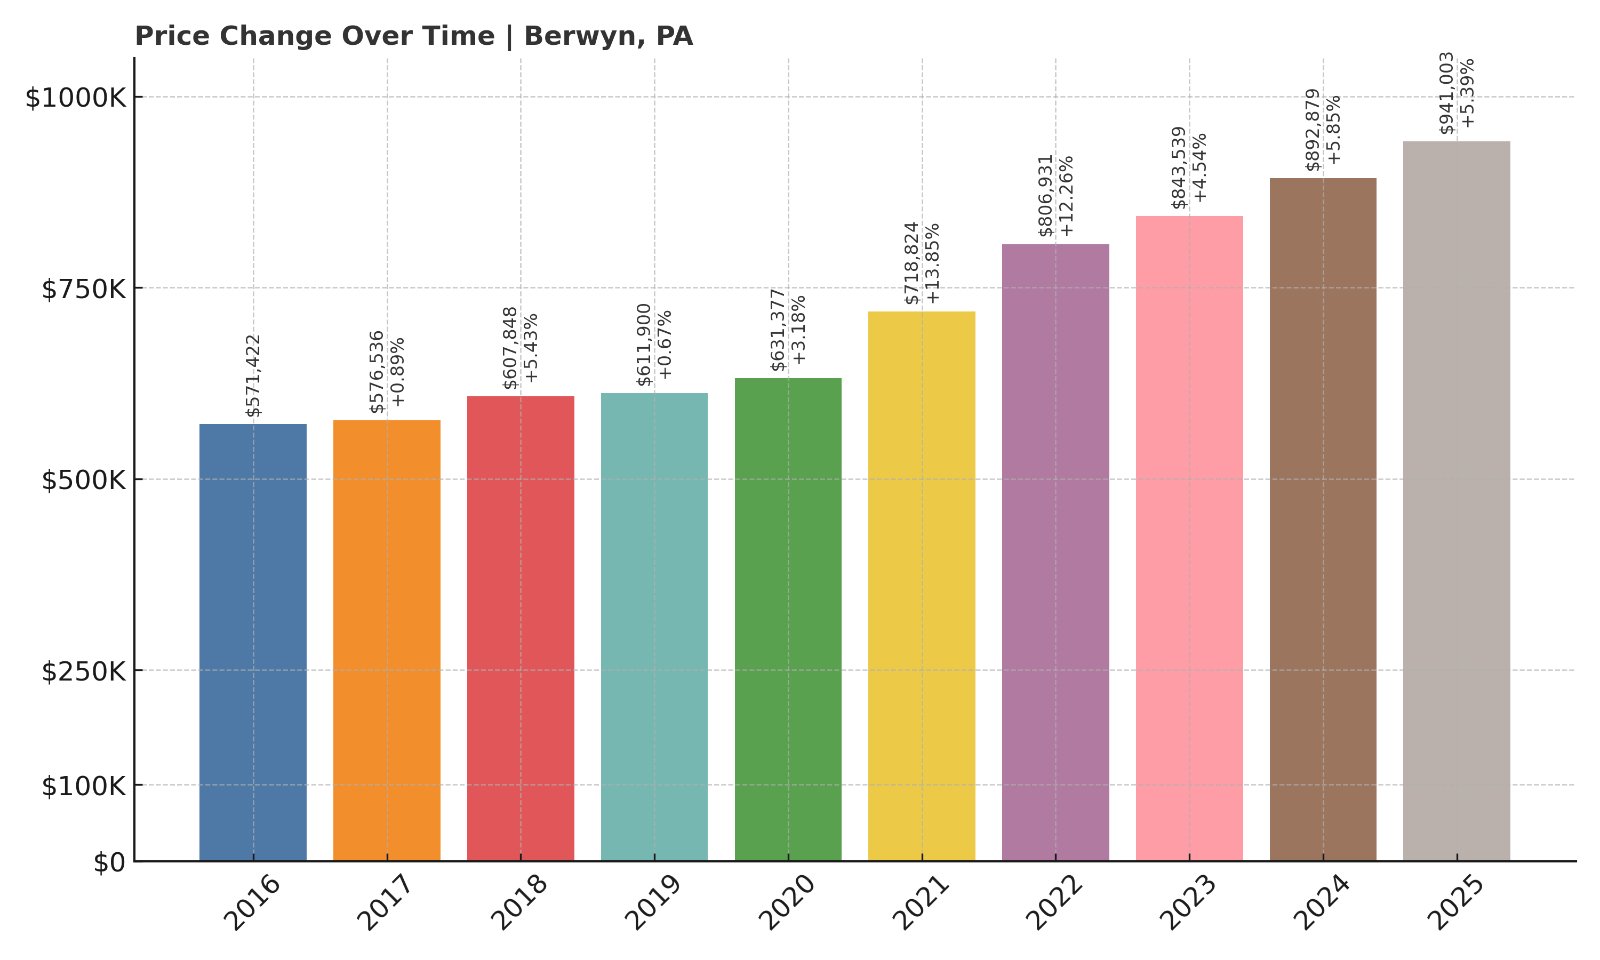
- 2016: $571,422
- 2017: $576,536 (+$5,114, +0.90%)
- 2018: $607,848 (+$31,312, +5.43%)
- 2019: $611,900 (+$4,052, +0.67%)
- 2020: $631,377 (+$19,476, +3.18%)
- 2021: $718,824 (+$87,448, +13.85%)
- 2022: $806,931 (+$88,106, +12.26%)
- 2023: $843,539 (+$36,609, +4.54%)
- 2024: $892,879 (+$49,340, +5.85%)
- 2025: $941,003 (+$48,123, +5.39%)
Berwyn home prices are up nearly 65% since 2016. The average rose to $941,003 in 2025, with another strong year of appreciation driven by consistent buyer interest.
Berwyn – Elite Schools and Enduring Demand
Berwyn, part of Tredyffrin-Easttown School District, offers some of the best public education in the state—and that alone drives premium pricing. Located along the Main Line, it balances prestige with livability, drawing families, retirees, and remote workers alike.
Its real estate market is shaped by stable turnover, well-kept neighborhoods, and commuter convenience. Whether buyers are looking for mid-century colonials or large custom homes, Berwyn’s consistent gains reflect its long-standing value.
5. Devon – 64.9% Home Price Increase Since 2016
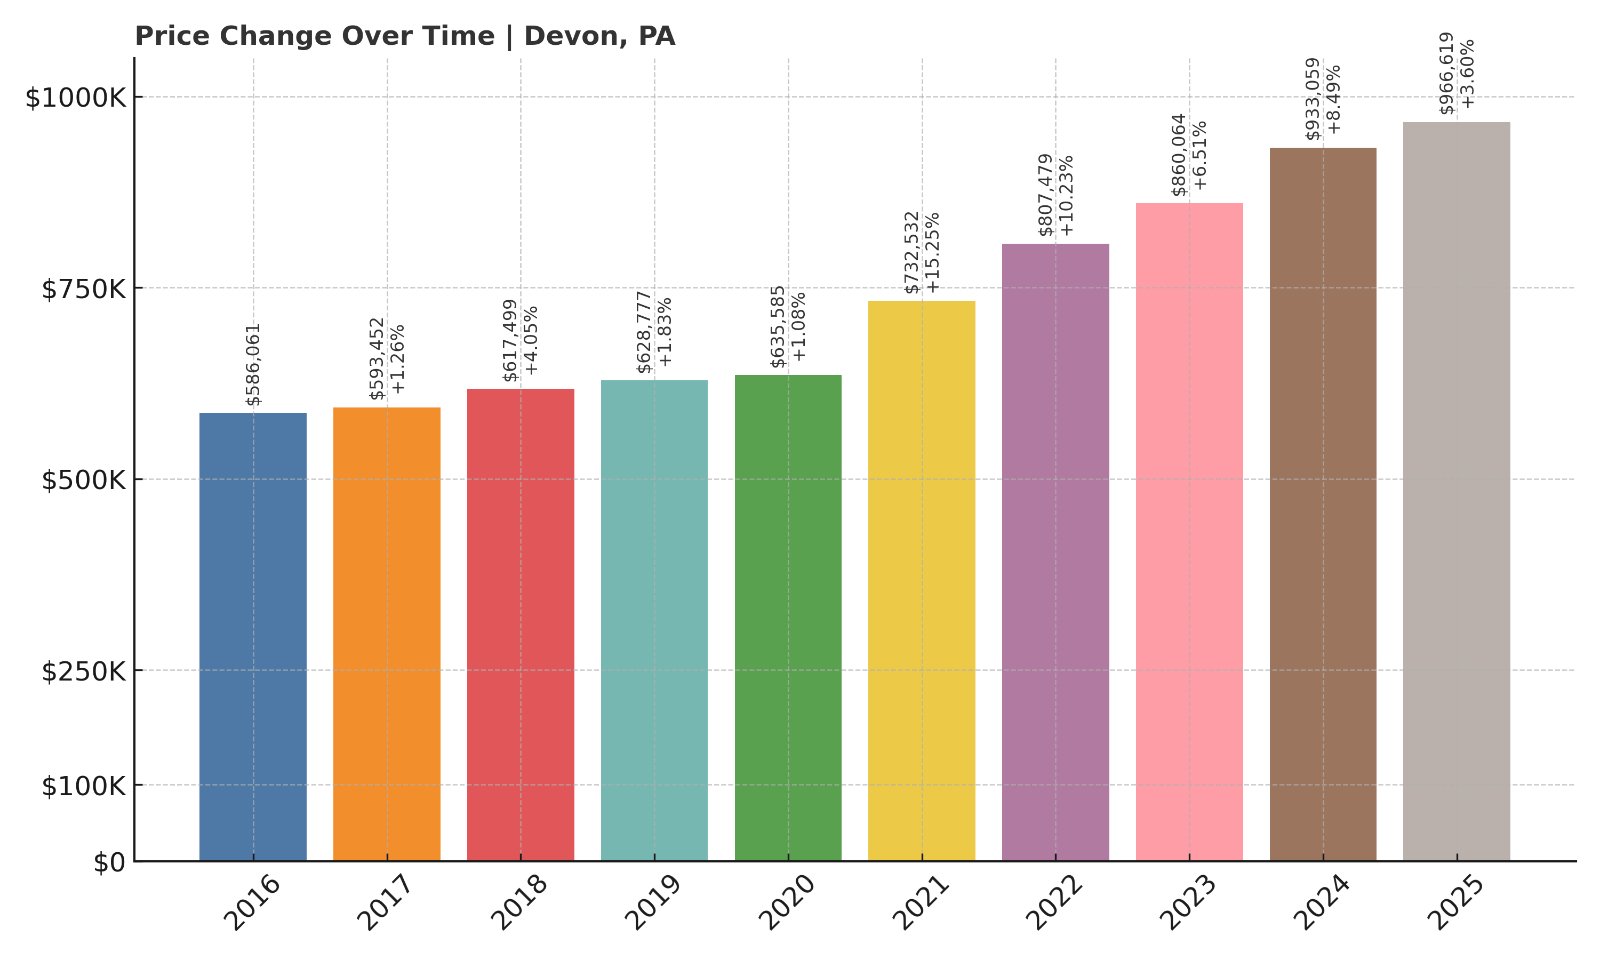
- 2016: $586,061
- 2017: $593,452 (+$7,391, +1.26%)
- 2018: $617,499 (+$24,046, +4.05%)
- 2019: $628,777 (+$11,279, +1.83%)
- 2020: $635,585 (+$6,807, +1.08%)
- 2021: $732,532 (+$96,947, +15.25%)
- 2022: $807,479 (+$74,948, +10.23%)
- 2023: $860,064 (+$52,585, +6.51%)
- 2024: $933,059 (+$72,994, +8.49%)
- 2025: $966,619 (+$33,560, +3.60%)
Devon home prices have increased nearly 65% since 2016, with the 2025 average reaching $966,619. Gains in the last three years have been particularly strong, adding more than $200K in value.
Devon – Prestige in the Heart of the Main Line
Devon is one of the smallest but most sought-after communities along the Main Line. Known for its stately homes, quiet tree-lined streets, and the iconic Devon Horse Show, it has long been associated with wealth and tradition.
Located in the top-ranked Tredyffrin-Easttown School District, Devon offers both privacy and prestige. Its strong appreciation reflects its reputation as a long-term investment town, where supply is always low and demand never seems to fade.
4. Edgeworth – 102.1% Home Price Increase Since 2010
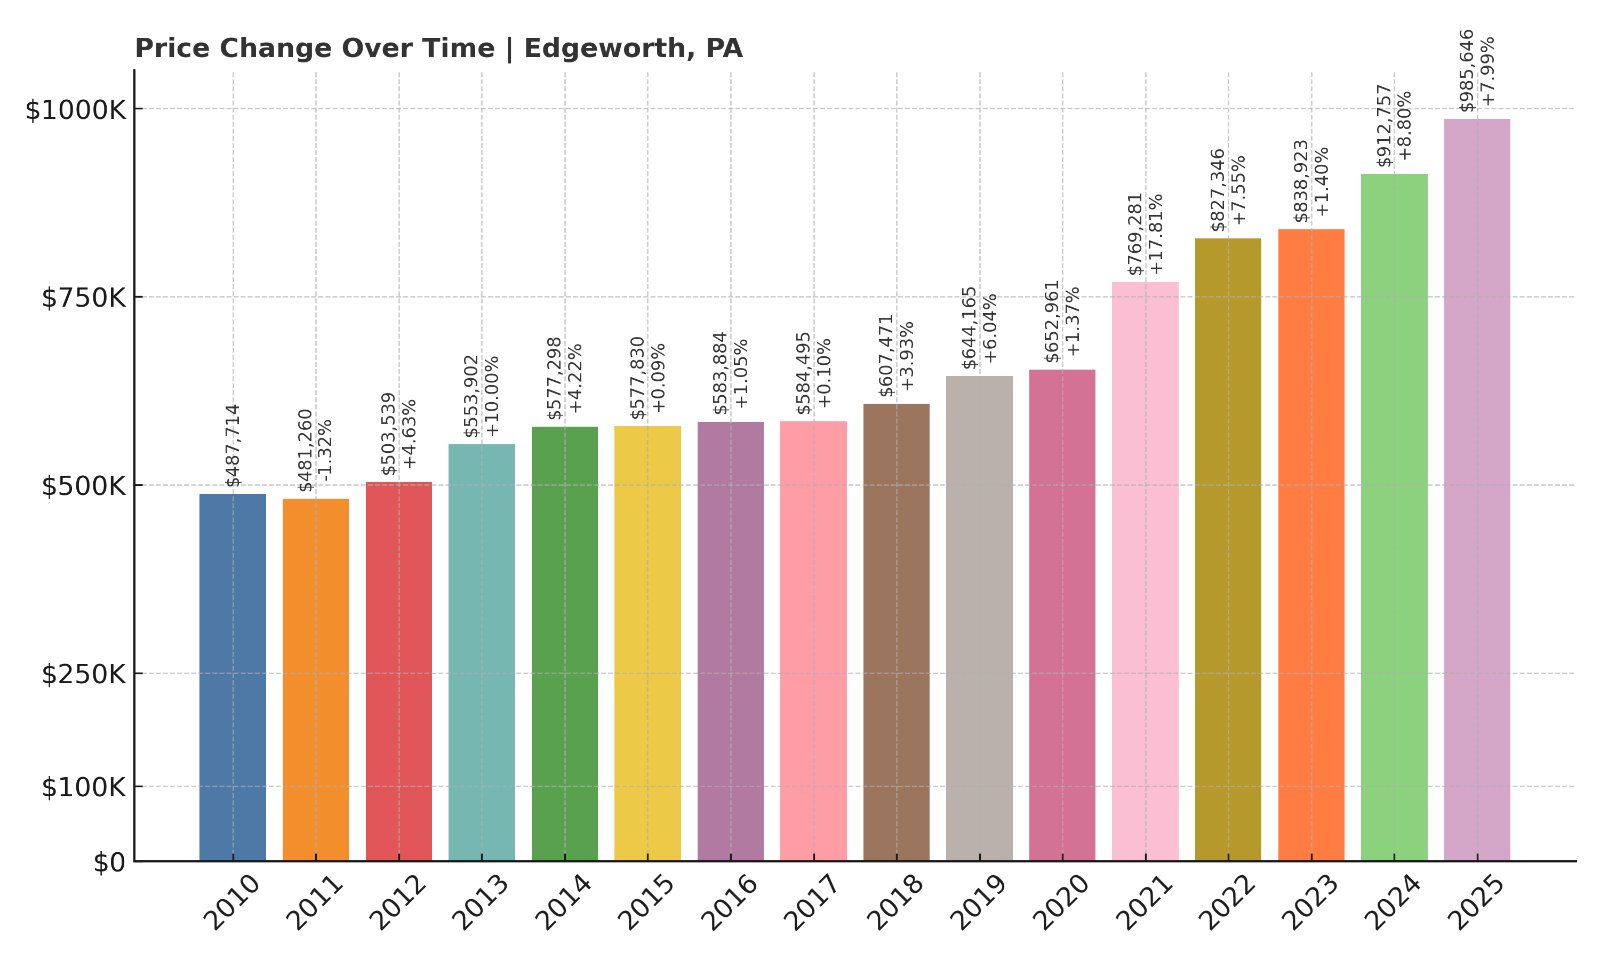
- 2010: $487,714
- 2011: $481,260 (-$6,455, -1.32%)
- 2012: $503,539 (+$22,279, +4.63%)
- 2013: $553,902 (+$50,363, +10.00%)
- 2014: $577,298 (+$23,396, +4.22%)
- 2015: $577,830 (+$532, +0.09%)
- 2016: $583,884 (+$6,054, +1.05%)
- 2017: $584,495 (+$611, +0.10%)
- 2018: $607,471 (+$22,976, +3.93%)
- 2019: $644,165 (+$36,694, +6.04%)
- 2020: $652,961 (+$8,796, +1.37%)
- 2021: $769,281 (+$116,320, +17.81%)
- 2022: $827,346 (+$58,065, +7.55%)
- 2023: $838,923 (+$11,577, +1.40%)
- 2024: $912,757 (+$73,834, +8.80%)
- 2025: $985,646 (+$72,890, +7.99%)
Edgeworth home prices have more than doubled since 2010, rising 102.1%. The 2025 average is $985,646, boosted by strong year-over-year gains for four consecutive years.
Edgeworth – Pittsburgh’s Most Exclusive Suburb
Edgeworth, in Allegheny County, sits along the Ohio River just northwest of Pittsburgh. This small, wealthy borough is part of the Quaker Valley School District and known for its expansive estates and stately architecture.
With few homes available and some of the highest incomes in the state, Edgeworth’s market is consistently strong. Prices have surged particularly since 2020 as affluent buyers looked for historic charm, riverside views, and access to downtown without sacrificing privacy.
3. Merion Station – 4.84% Home Price Increase Since 2024
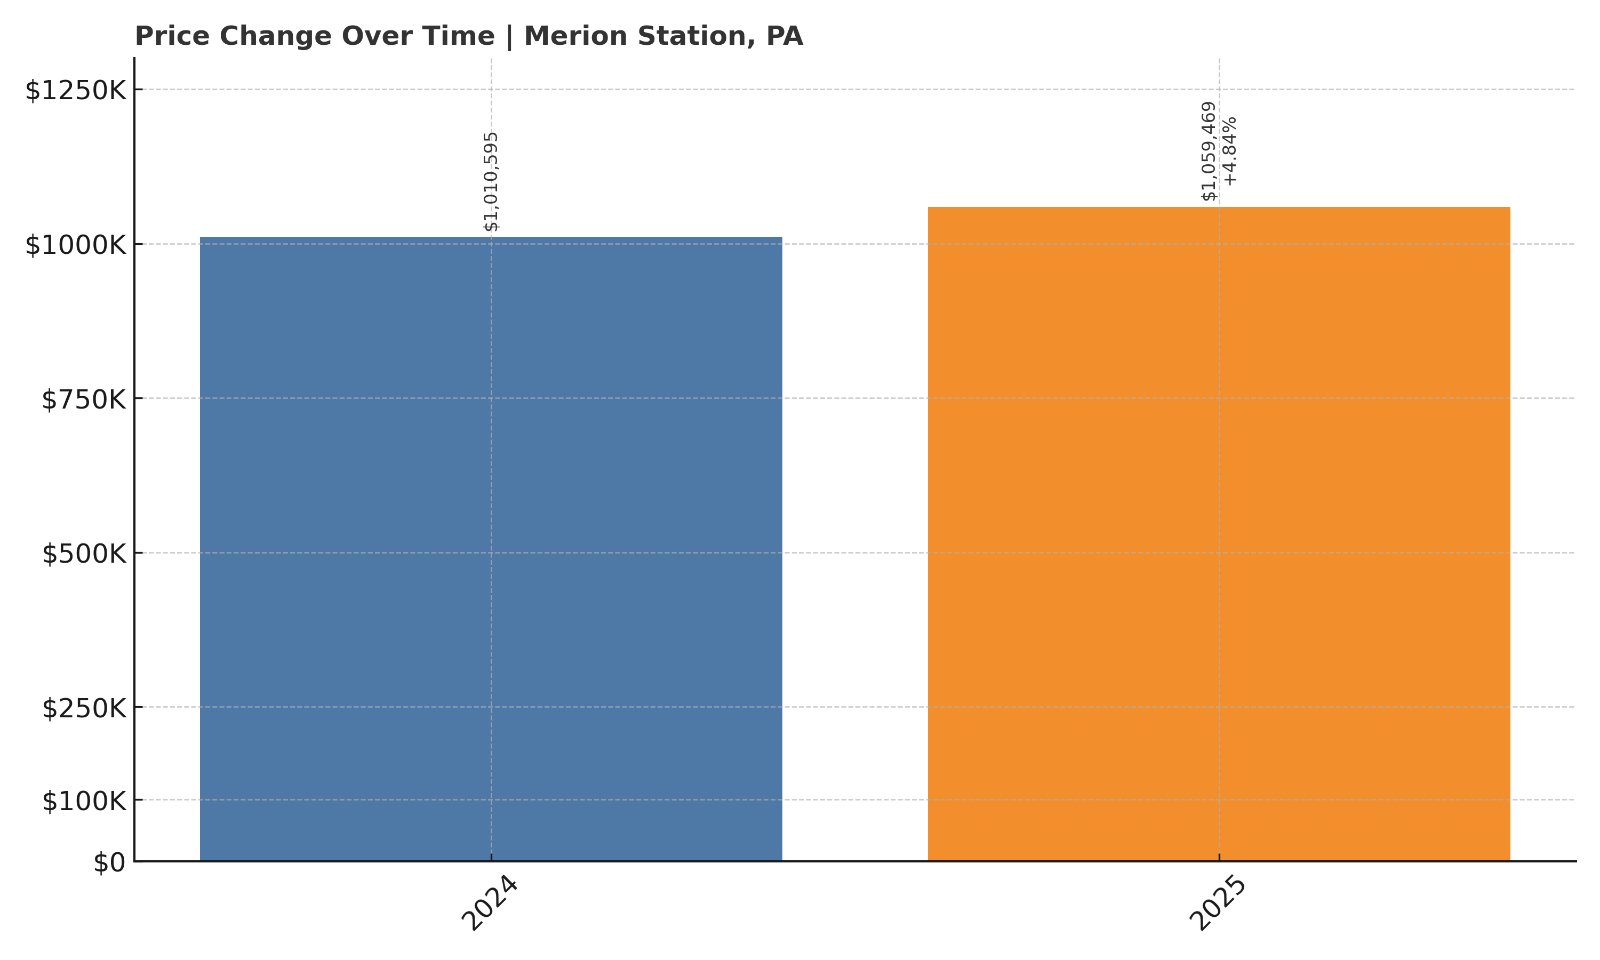
- 2024: $1,010,595
- 2025: $1,059,469 (+$48,873, +4.84% from previous year)
Merion Station saw a 4.84% rise in home values from 2024 to 2025, putting the current average just over $1.05 million. While we don’t have long-term data, this year’s increase confirms its position in Pennsylvania’s luxury market.
Merion Station – Old Money, Modern Value
Merion Station, part of Lower Merion Township, is one of the most historically affluent neighborhoods in the state. Large stone homes, manicured lawns, and cultural institutions define the area—and buyers pay a premium for the prestige.
Proximity to the city, the highly ranked Lower Merion School District, and access to both SEPTA and private schools continue to support high property values. Even a single-digit gain like this year’s adds tens of thousands in value.
2. Villanova – 4.20% Home Price Increase Since 2024
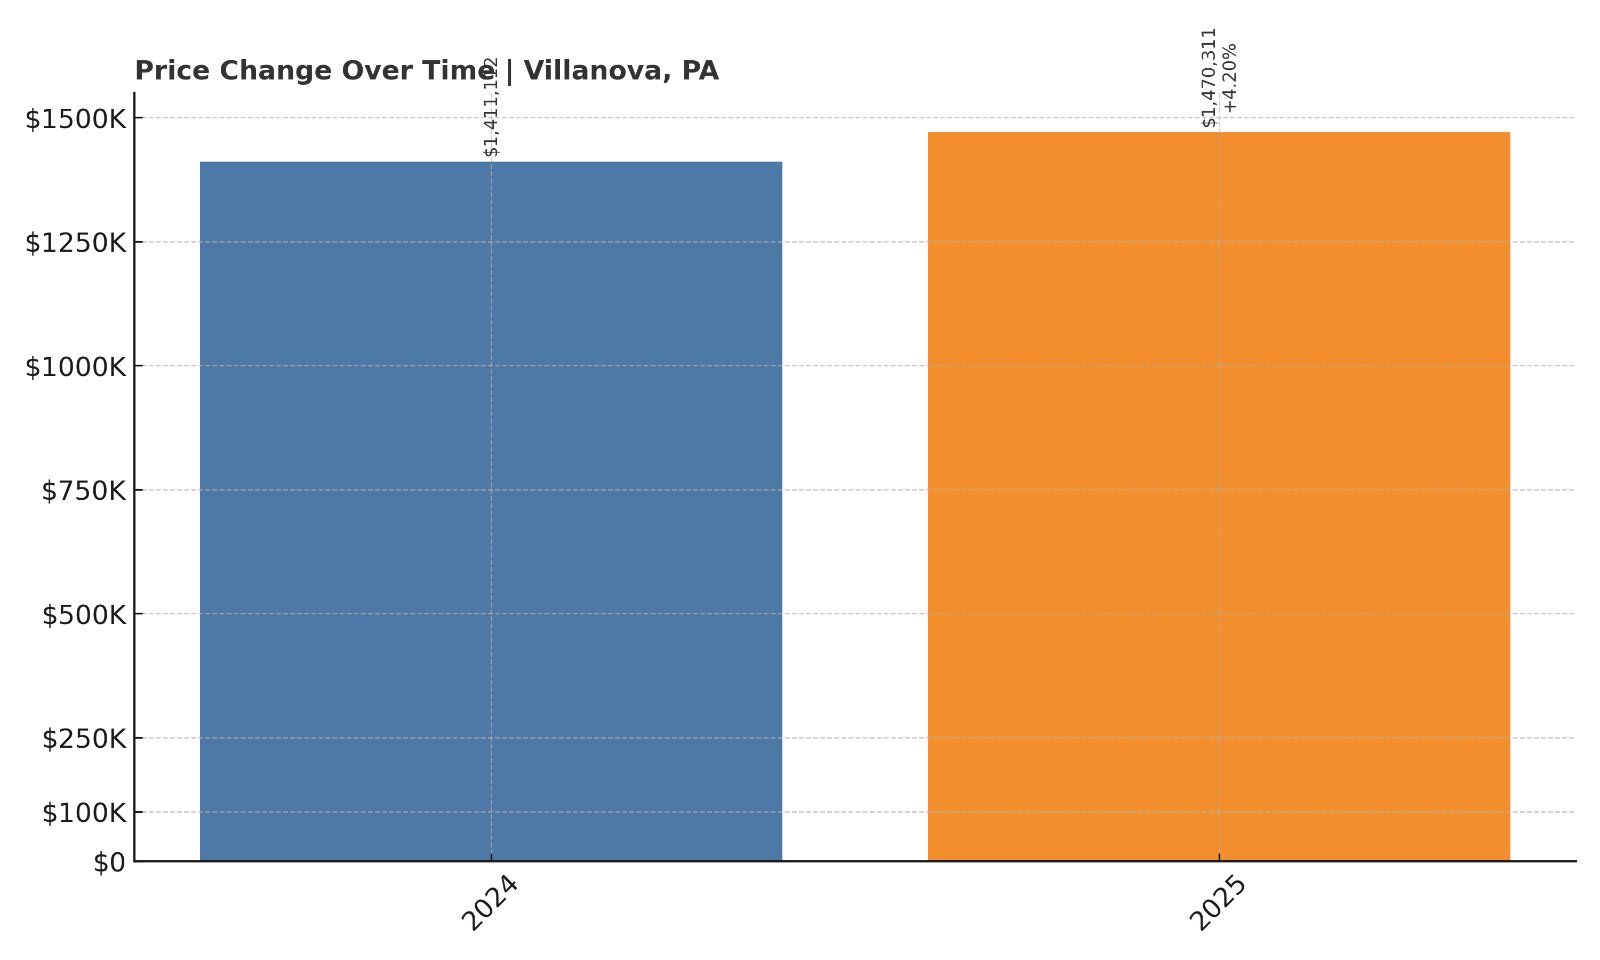
- 2024: $1,411,112
- 2025: $1,470,311 (+$59,199, +4.20% from previous year)
Villanova home values rose 4.2% this year, topping $1.47 million. While data is limited to just the past two years, the numbers reflect one of the most consistently expensive real estate markets in the state.
Villanova – Power, Prestige, and Price Tags to Match
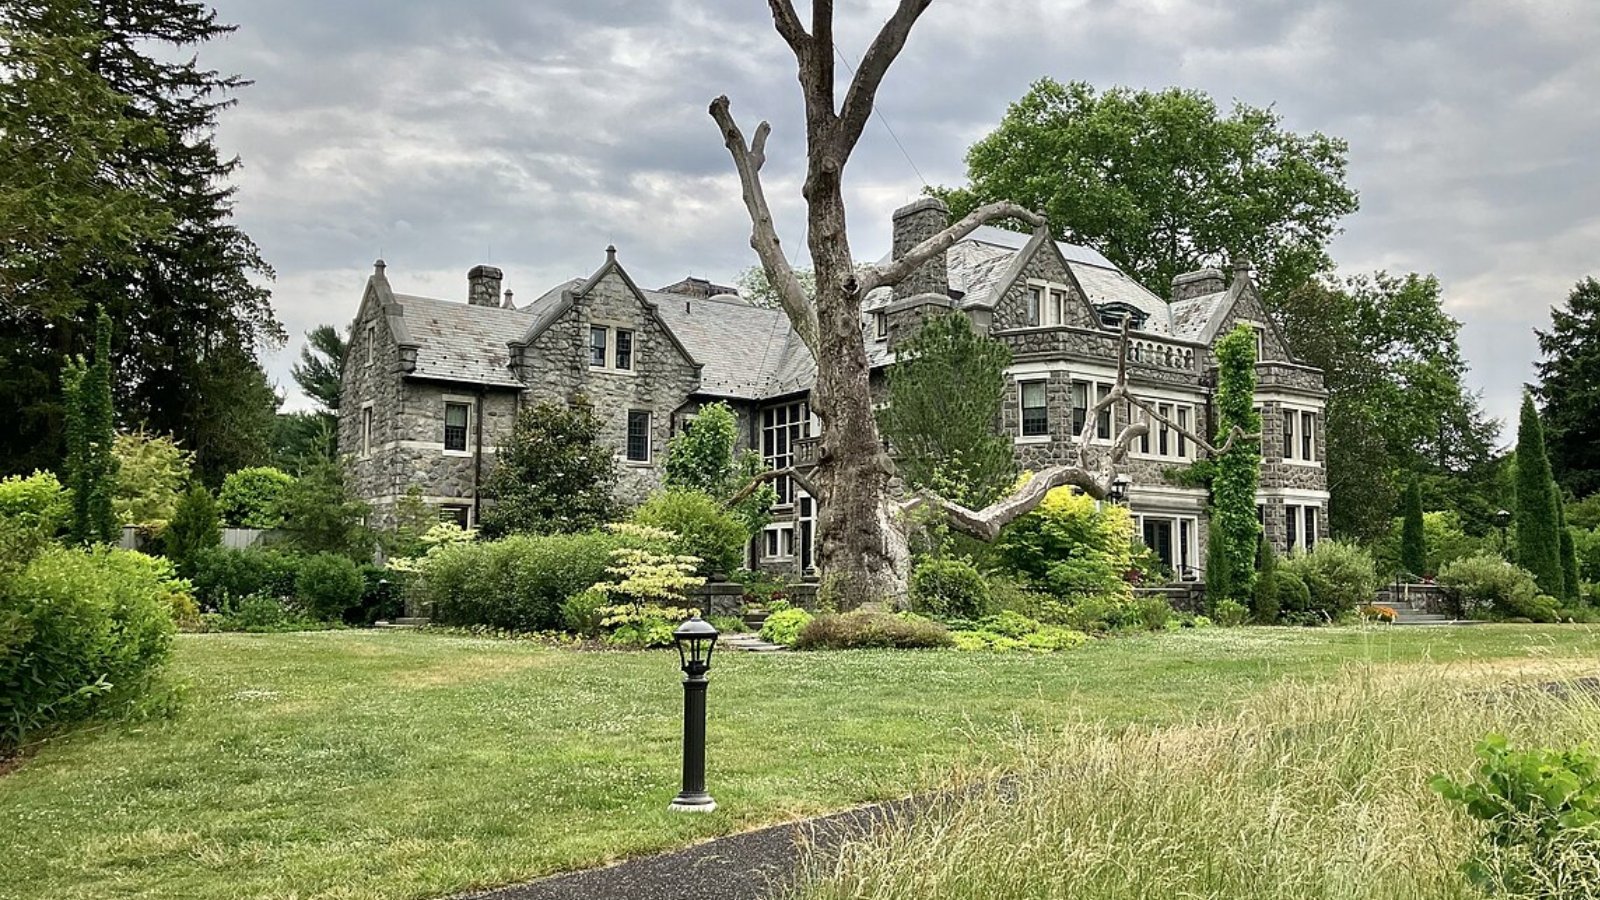
Home to the namesake university and some of the Philadelphia region’s most affluent families, Villanova is a cornerstone of the Main Line. Large homes, private roads, and gated estates dominate the landscape.
Buyers here tend to stay long-term, which keeps inventory low and prices high. The 2025 gain represents nearly $60,000 in added value—just another year in one of Pennsylvania’s most elite enclaves.
1. Gladwyne – 4.17% Home Price Increase Since 2024
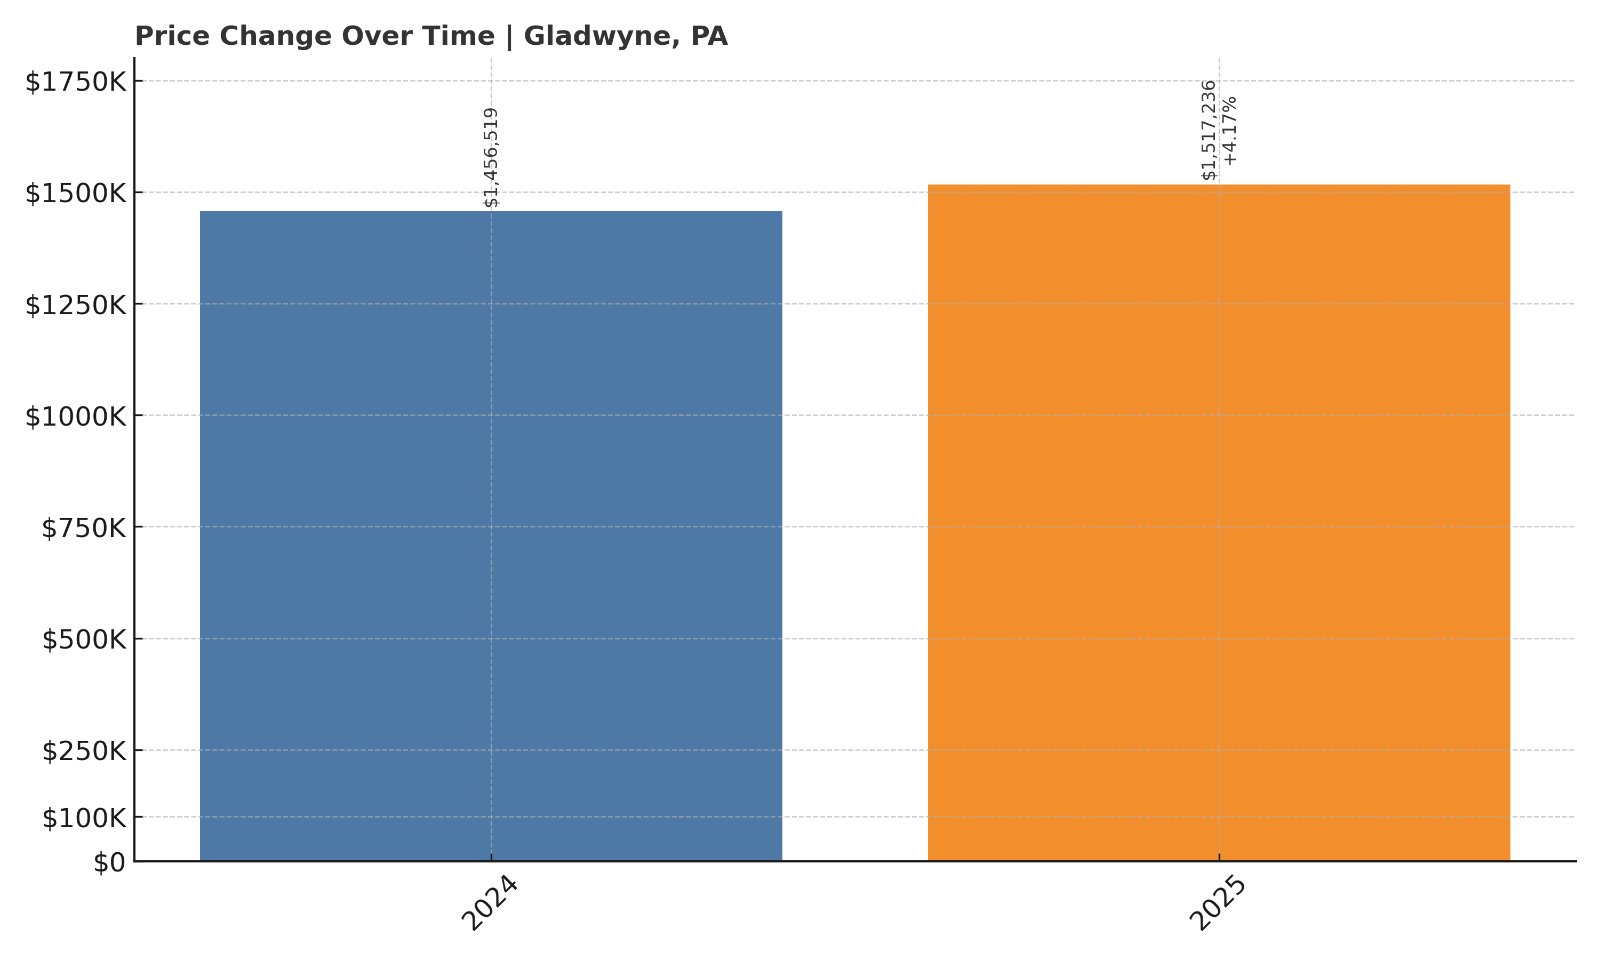
- 2024: $1,456,519
- 2025: $1,517,236 (+$60,717, +4.17% from previous year)
Gladwyne remains the most expensive town in Pennsylvania with an average home price of $1.52 million in 2025. Prices increased by 4.17% over the past year, adding more than $60,000 in value.
Gladwyne – Pennsylvania’s Pinnacle of Luxury
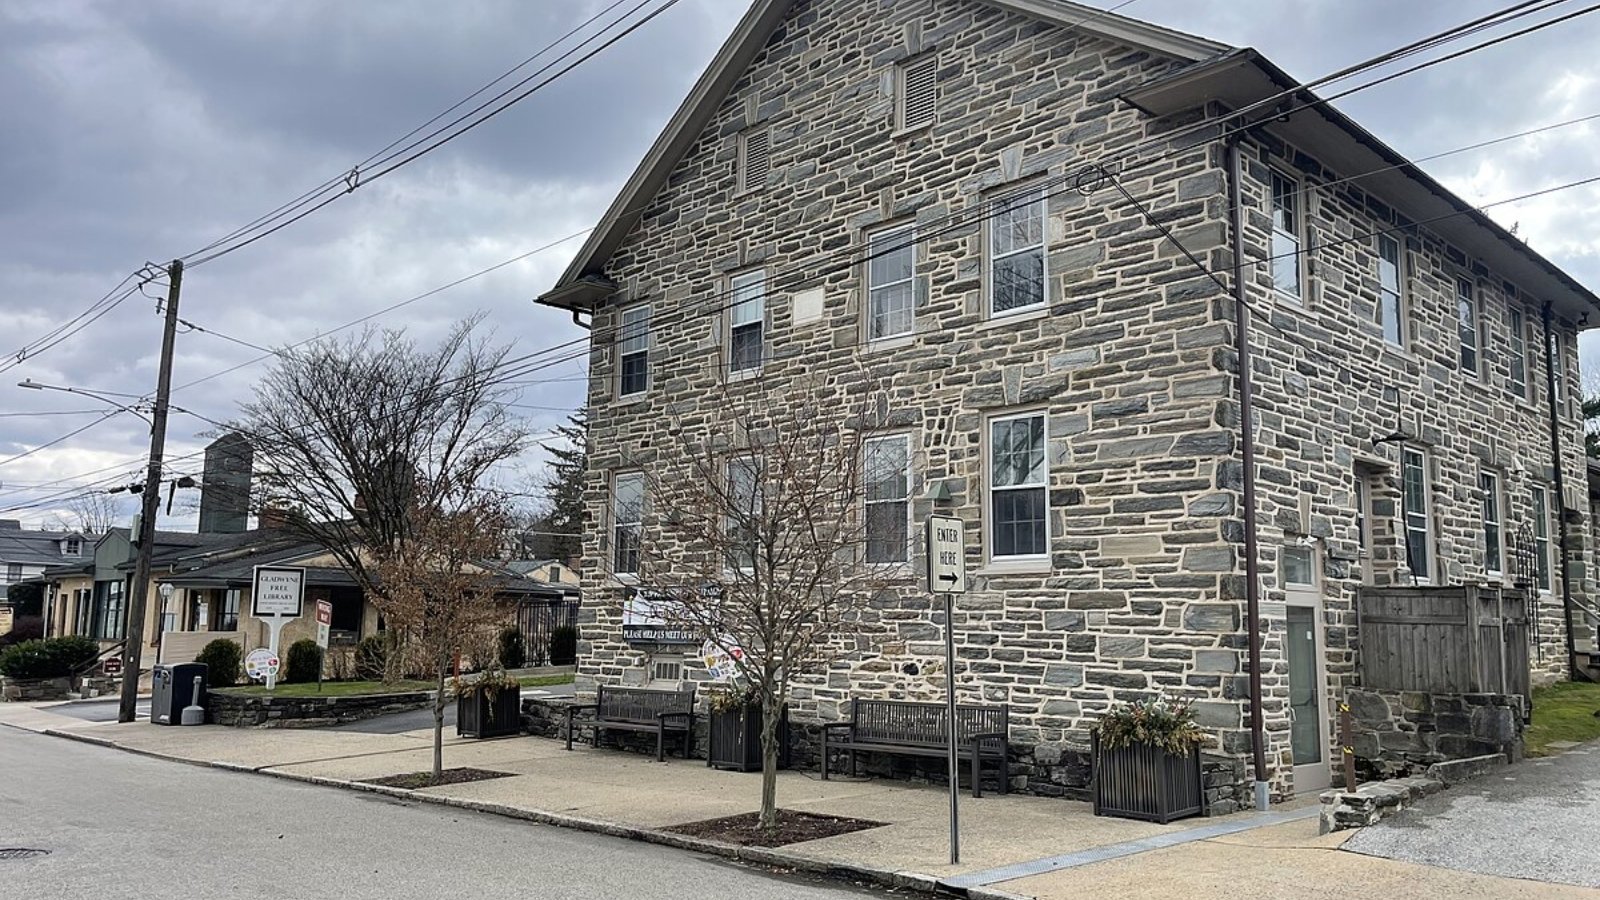
Gladwyne sits at the top of the Main Line and the top of the price ladder. Known for sprawling estates, secluded roads, and elite clientele, this Lower Merion neighborhood has long been the most expensive ZIP code in the state.
With proximity to Philadelphia, private clubs, and prestigious schools, Gladwyne attracts high-net-worth buyers who want exclusivity and elegance. Year after year, it tops the charts—and 2025 is no exception.