Would you like to save this?
New data from the Zillow Home Value Index shows just how far home prices have climbed across Pennsylvania in 2025. In some towns, values have surged so sharply that buying a house now means making a serious financial leap. From the historic Main Line to rising-star suburbs, this list tracks the steepest price points and biggest jumps over time. Some of these places have always been pricey; others have seen rapid change. Together, they offer a clear look at where Pennsylvania’s housing market is hottest—and how it got there.
21. Blue Bell – 79% Home Price Increase Since 2010

- 2010: $381,941
- 2011: $377,331 (-$4,610, -1.21% from previous year)
- 2012: $368,824 (-$8,507, -2.25% from previous year)
- 2013: $379,325 (+$10,501, +2.85% from previous year)
- 2014: $396,778 (+$17,453, +4.60% from previous year)
- 2015: $407,985 (+$11,207, +2.82% from previous year)
- 2016: $417,207 (+$9,222, +2.26% from previous year)
- 2017: $429,389 (+$12,182, +2.92% from previous year)
- 2018: $444,909 (+$15,520, +3.61% from previous year)
- 2019: $457,152 (+$12,243, +2.75% from previous year)
- 2020: $477,570 (+$20,418, +4.47% from previous year)
- 2021: $533,685 (+$56,115, +11.75% from previous year)
- 2022: $599,660 (+$65,975, +12.36% from previous year)
- 2023: $635,449 (+$35,789, +5.97% from previous year)
- 2024: $672,384 (+$36,935, +5.81% from previous year)
- 2025: $685,841 (+$13,457, +2.00% from previous year)
Home prices in Blue Bell have climbed steadily over the past 15 years, rising from just under $382,000 in 2010 to nearly $686,000 in 2025. Growth was especially sharp between 2020 and 2022, when double-digit annual increases pushed values above the $600,000 mark. Though growth has moderated more recently, the long-term trend remains strong.
Blue Bell – Quiet Affluence in Montgomery County
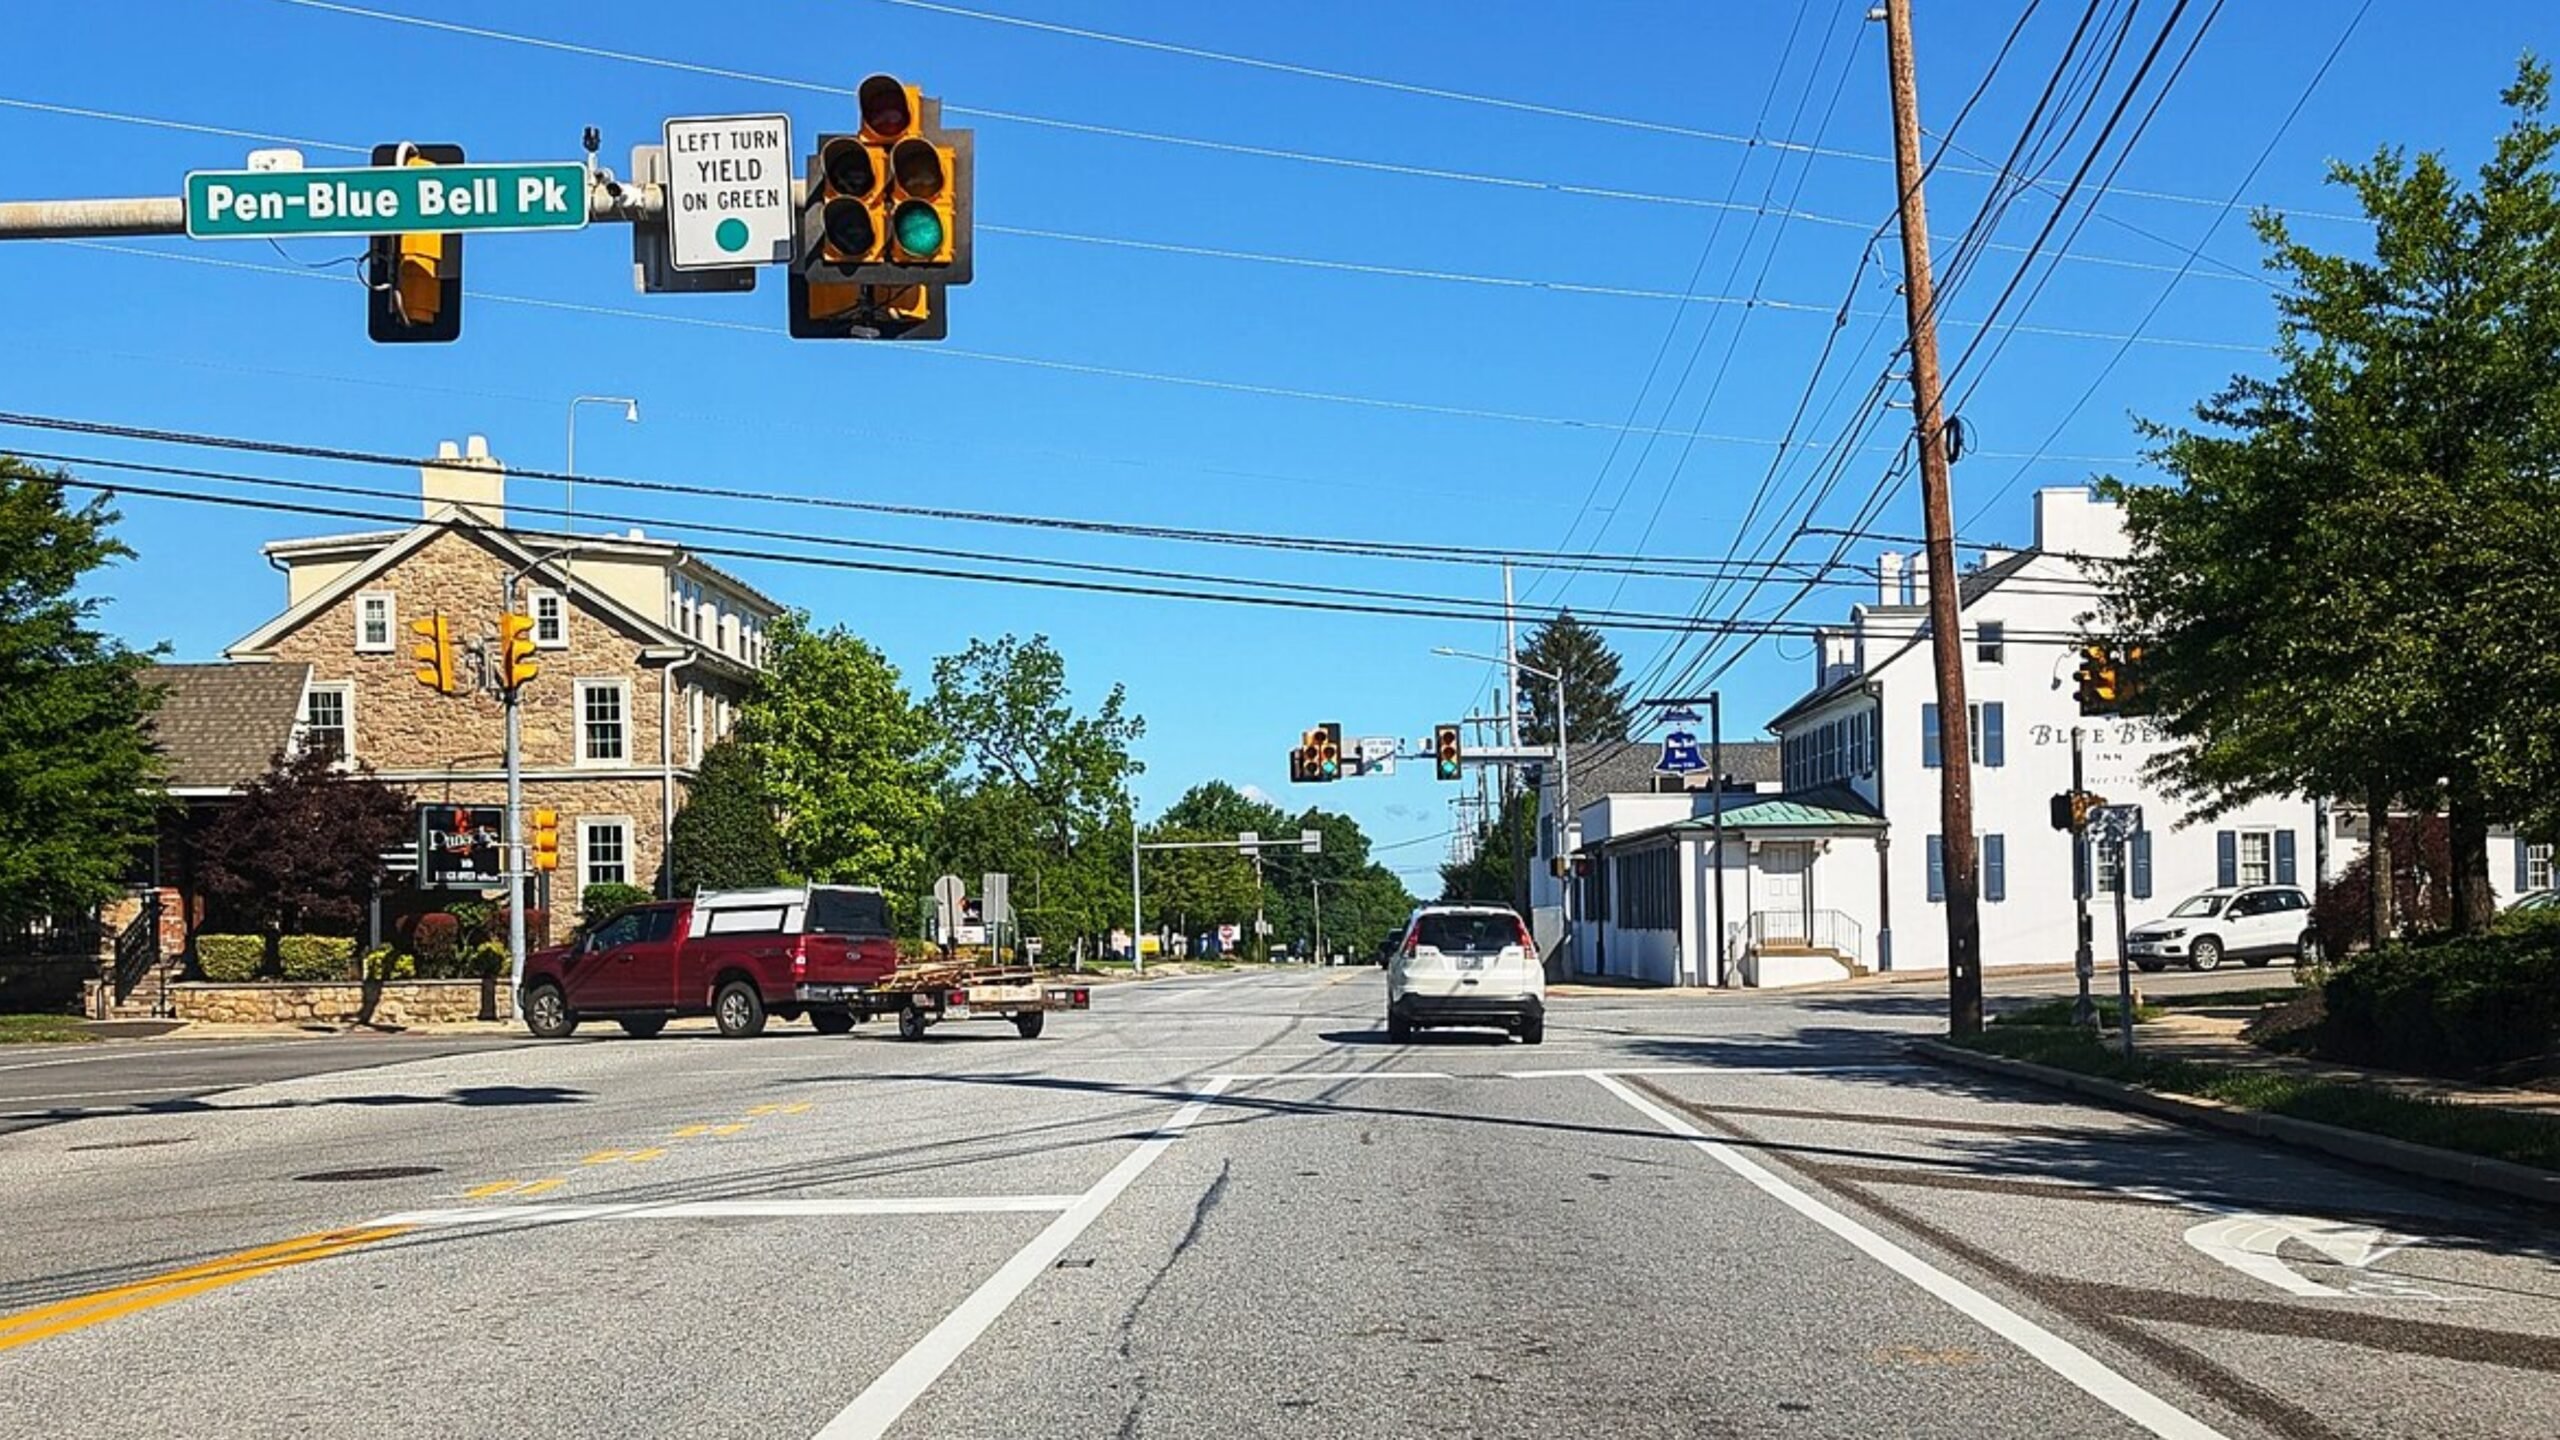
Located in Montgomery County, Blue Bell has long been one of the Philadelphia area’s most desirable suburbs. Known for its large homes, spacious lots, and highly-rated Wissahickon School District, it appeals to professionals seeking peace without sacrificing proximity to jobs and amenities.
The sharp appreciation in value from 2020 to 2022 reflects strong demand, likely driven by remote work shifts and a preference for suburban living. With corporate offices, golf courses, and access to major highways nearby, Blue Bell remains a top-tier community with staying power in the regional housing market.
20. Richboro – 71% Home Price Increase Since 2010
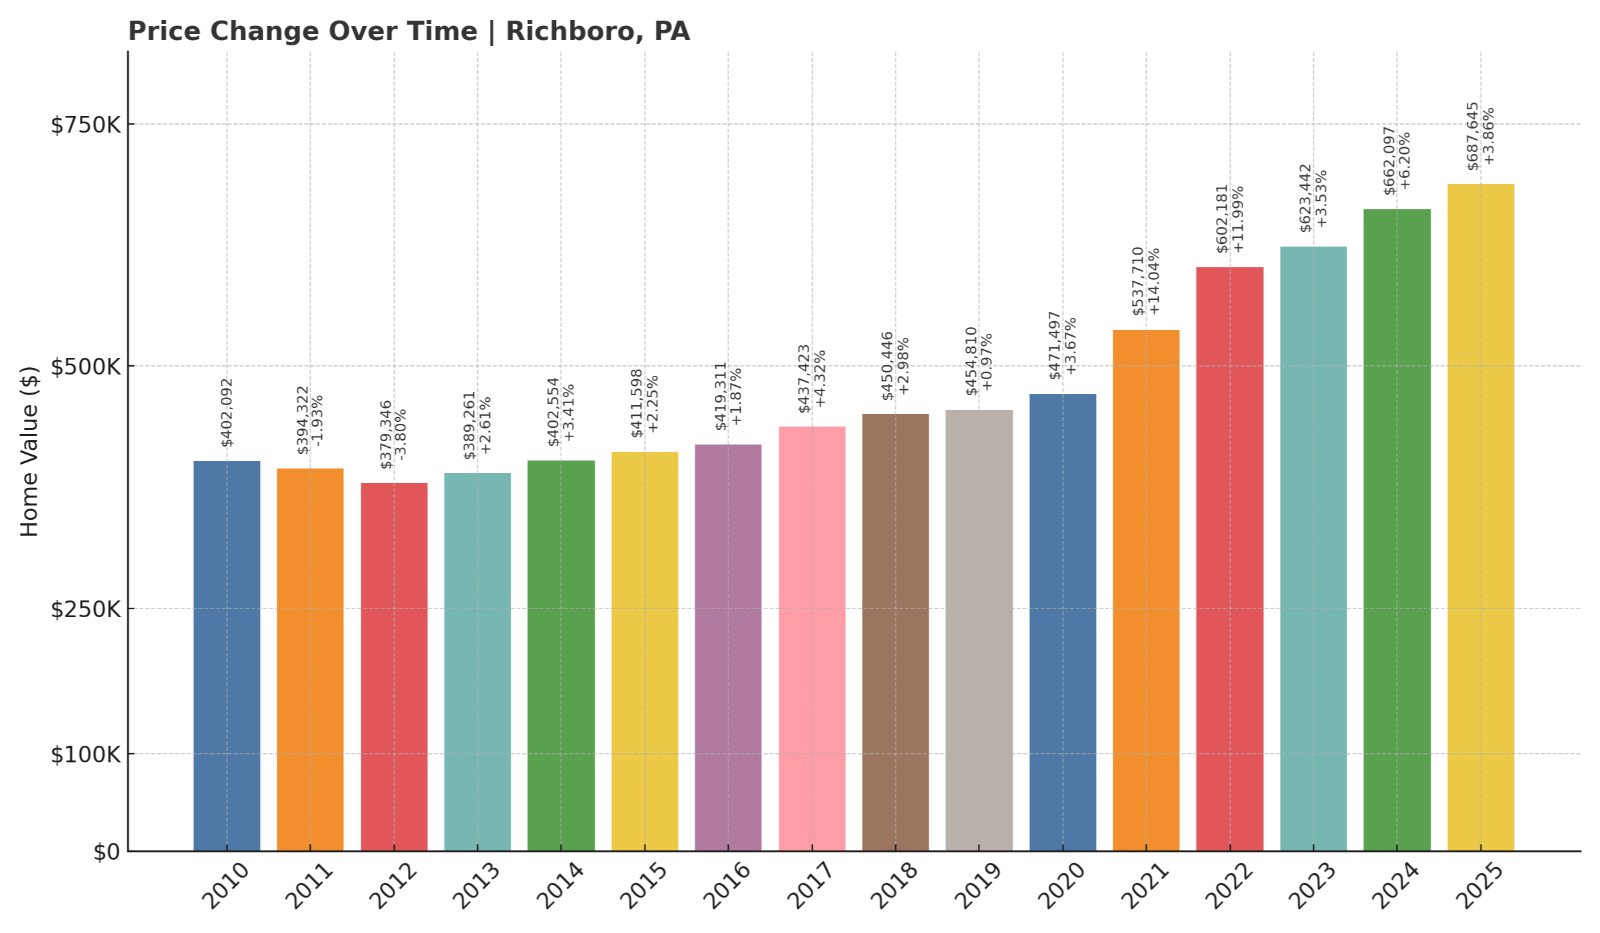
- 2010: $402,092
- 2011: $394,322 (-$7,770, -1.93% from previous year)
- 2012: $379,346 (-$14,976, -3.80% from previous year)
- 2013: $389,261 (+$9,915, +2.61% from previous year)
- 2014: $402,554 (+$13,293, +3.41% from previous year)
- 2015: $411,598 (+$9,044, +2.25% from previous year)
- 2016: $419,311 (+$7,713, +1.87% from previous year)
- 2017: $437,423 (+$18,112, +4.32% from previous year)
- 2018: $450,446 (+$13,023, +2.98% from previous year)
- 2019: $454,810 (+$4,364, +0.97% from previous year)
- 2020: $471,497 (+$16,687, +3.67% from previous year)
- 2021: $537,710 (+$66,213, +14.04% from previous year)
- 2022: $602,181 (+$64,471, +11.99% from previous year)
- 2023: $623,442 (+$21,261, +3.53% from previous year)
- 2024: $662,097 (+$38,655, +6.20% from previous year)
- 2025: $687,645 (+$25,548, +3.86% from previous year)
Richboro’s home prices climbed from about $402K in 2010 to nearly $688K in 2025. Though growth was modest early on, values accelerated sharply starting in 2020, with notable double-digit increases in 2021 and 2022. Even with smaller gains in recent years, Richboro continues to show strong price appreciation.
Richboro – Steady Growth in Bucks County

Kitchen Style?
Richboro sits in Northampton Township, Bucks County, an area known for its top-rated Council Rock schools and well-kept residential communities. It’s a town where quiet streets, mature trees, and classic suburban planning have attracted buyers for decades.
The substantial rise in prices during the early 2020s likely reflects pandemic-era demand combined with low inventory. Easy access to Newtown, Langhorne, and the Route 1 corridor adds convenience for commuters. Richboro’s consistent rise makes it a steady contender on any list of pricey places in Pennsylvania.
19. Glen Mills – 83% Home Price Increase Since 2010
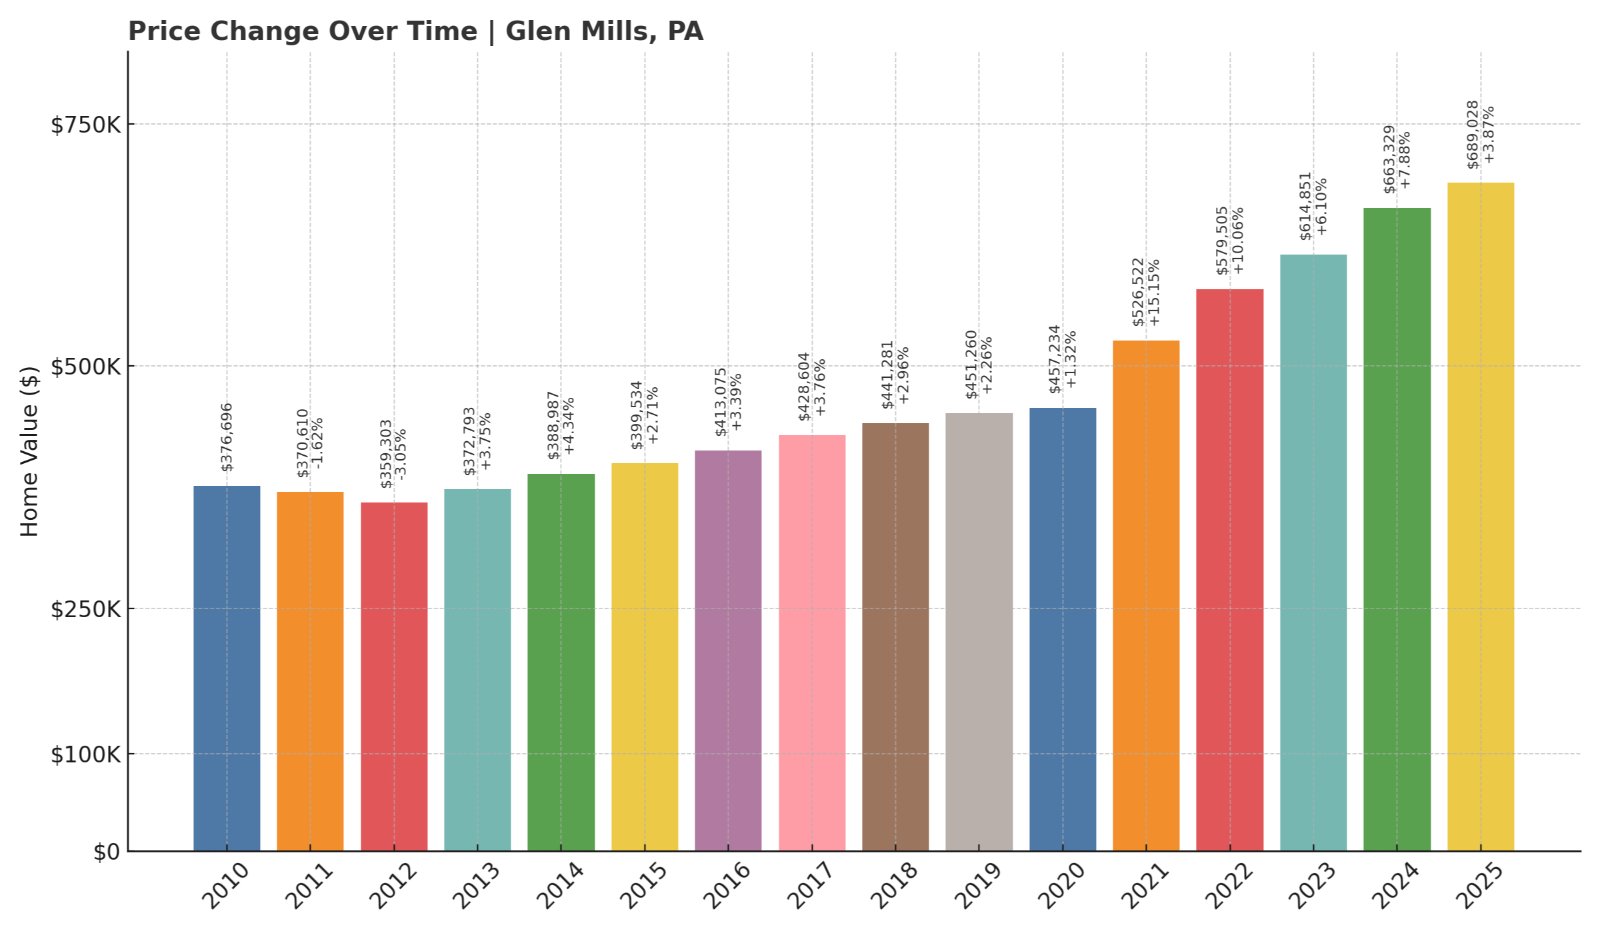
- 2010: $376,696
- 2011: $370,610 (-$6,086, -1.62% from previous year)
- 2012: $359,303 (-$11,307, -3.05% from previous year)
- 2013: $372,793 (+$13,490, +3.75% from previous year)
- 2014: $388,987 (+$16,194, +4.34% from previous year)
- 2015: $399,534 (+$10,547, +2.71% from previous year)
- 2016: $413,075 (+$13,541, +3.39% from previous year)
- 2017: $428,604 (+$15,529, +3.76% from previous year)
- 2018: $441,281 (+$12,677, +2.96% from previous year)
- 2019: $451,260 (+$9,979, +2.26% from previous year)
- 2020: $457,234 (+$5,974, +1.32% from previous year)
- 2021: $526,522 (+$69,288, +15.15% from previous year)
- 2022: $579,505 (+$52,983, +10.06% from previous year)
- 2023: $614,851 (+$35,346, +6.10% from previous year)
- 2024: $663,329 (+$48,478, +7.88% from previous year)
- 2025: $689,028 (+$25,699, +3.87% from previous year)
Glen Mills saw home values nearly double from $377K in 2010 to $689K by 2025. Prices remained relatively stable in the early years, but momentum picked up significantly after 2020. The biggest jump came in 2021, and values have continued to rise steadily since.
Glen Mills – Fast-Changing Suburb Near the State Line
Part of Delaware County and just a short drive from the Delaware state border, Glen Mills blends historic charm with suburban convenience. Shopping centers, golf courses, and access to Routes 1 and 202 give it broad appeal to homebuyers looking to settle in Pennsylvania while staying close to Delaware’s tax perks.
The strong uptick in home values during the 2020s matches the trend of rising demand for suburban homes with more space. With respected schools and an expanding housing stock, Glen Mills has transitioned from a quiet semi-rural area to a competitive real estate market in its own right.
18. Dresher – 60% Home Price Increase Since 2016

Home Stratosphere Guide
Your Personality Already Knows
How Your Home Should Feel
113 pages of room-by-room design guidance built around your actual brain, your actual habits, and the way you actually live.
You might be an ISFJ or INFP designer…
You design through feeling — your spaces are personal, comforting, and full of meaning. The guide covers your exact color palettes, room layouts, and the one mistake your type always makes.
The full guide maps all 16 types to specific rooms, palettes & furniture picks ↓
You might be an ISTJ or INTJ designer…
You crave order, function, and visual calm. The guide shows you how to create spaces that feel both serene and intentional — without ending up sterile.
The full guide maps all 16 types to specific rooms, palettes & furniture picks ↓
You might be an ENFP or ESTP designer…
You design by instinct and energy. Your home should feel alive. The guide shows you how to channel that into rooms that feel curated, not chaotic.
The full guide maps all 16 types to specific rooms, palettes & furniture picks ↓
You might be an ENTJ or ESTJ designer…
You value quality, structure, and things done right. The guide gives you the framework to build rooms that feel polished without overthinking every detail.
The full guide maps all 16 types to specific rooms, palettes & furniture picks ↓
- 2016: $432,054
- 2017: $444,800 (+$12,746, +2.95% from previous year)
- 2018: $455,032 (+$10,232, +2.30% from previous year)
- 2019: $466,027 (+$10,995, +2.42% from previous year)
- 2020: $475,736 (+$9,709, +2.08% from previous year)
- 2021: $544,472 (+$68,736, +14.45% from previous year)
- 2022: $604,846 (+$60,374, +11.09% from previous year)
- 2023: $631,572 (+$26,726, +4.42% from previous year)
- 2024: $675,226 (+$43,654, +6.91% from previous year)
- 2025: $690,316 (+$15,090, +2.23% from previous year)
Dresher’s home prices have grown from $432K in 2016 to just over $690K in 2025. The sharpest gains occurred in 2021 and 2022, echoing regional trends in suburban growth. While increases have cooled somewhat, prices continue to rise steadily.
Dresher – Rising Appeal in Eastern Montgomery County

Tucked into Upper Dublin Township, Dresher offers excellent access to the Pennsylvania Turnpike and proximity to major business parks. With a blend of older homes and newer construction, the housing stock is diverse, and school ratings are high.
Growth from 2020 onward appears driven by demand for single-family homes in quieter areas with good amenities. Dresher’s affordability compared to nearby hot spots like Ambler and Fort Washington has likely helped fuel its climb up the pricing ranks.
17. Chadds Ford – 3% Home Price Increase Since 2024
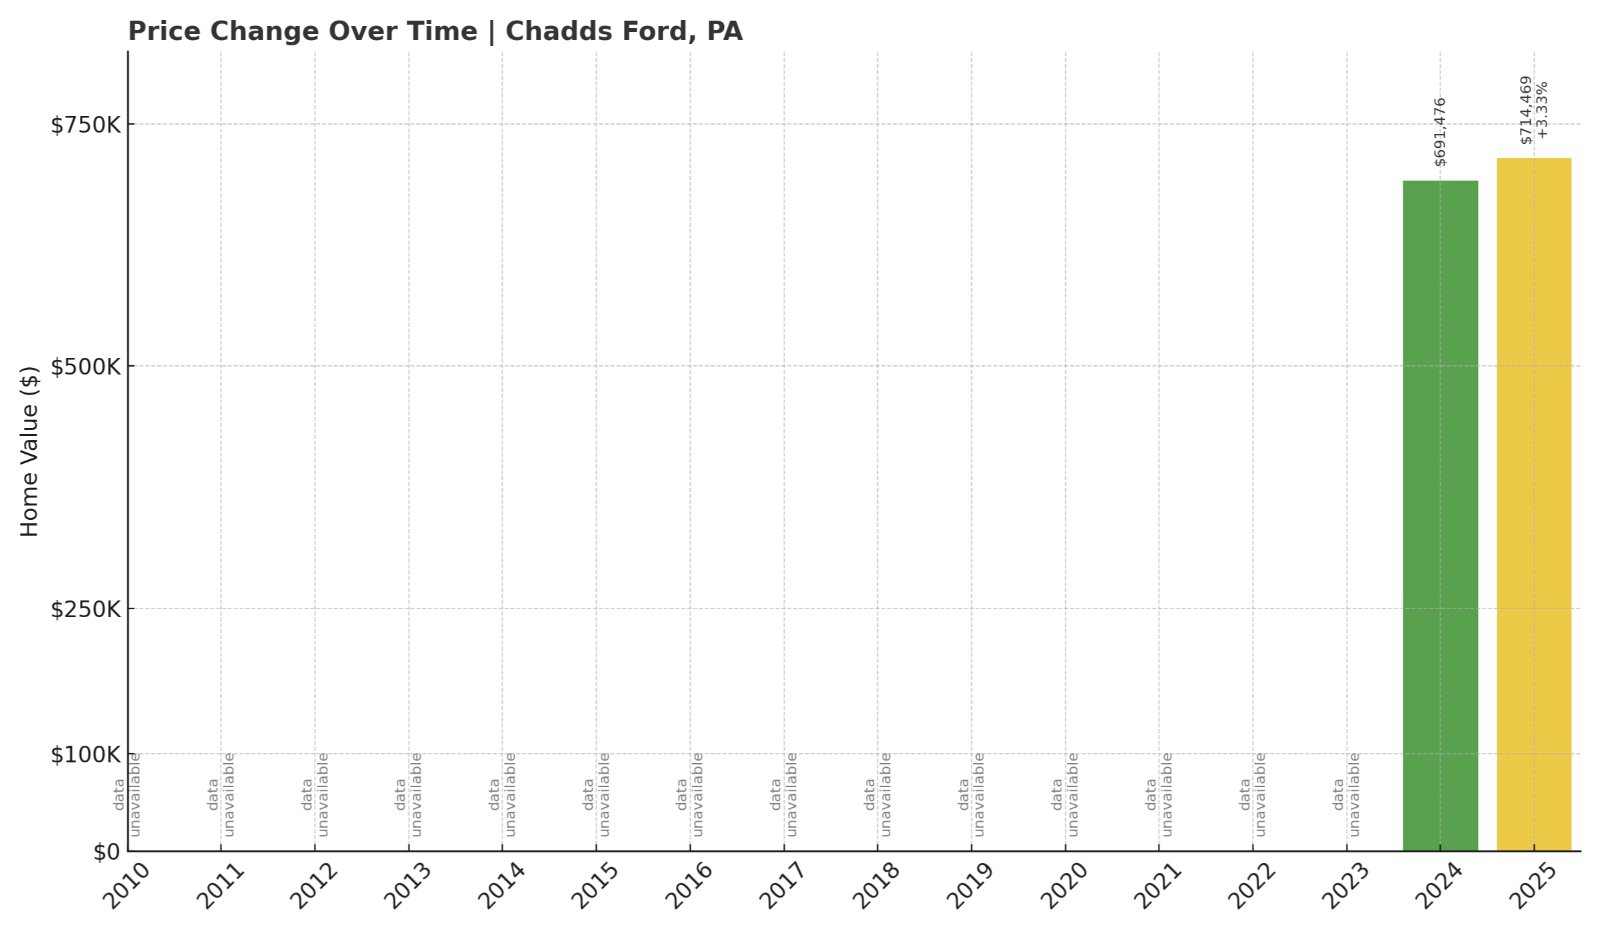
- 2024: $691,476
- 2025: $714,469 (+$22,993, +3.33% from previous year)
Although data is only available for the last two years, Chadds Ford’s home values have already jumped by over $22,000 between 2024 and 2025. That’s a sign of a market on the move, though more historical context will help show whether this is part of a larger trend.
Chadds Ford – High Prices and Historic Prestige
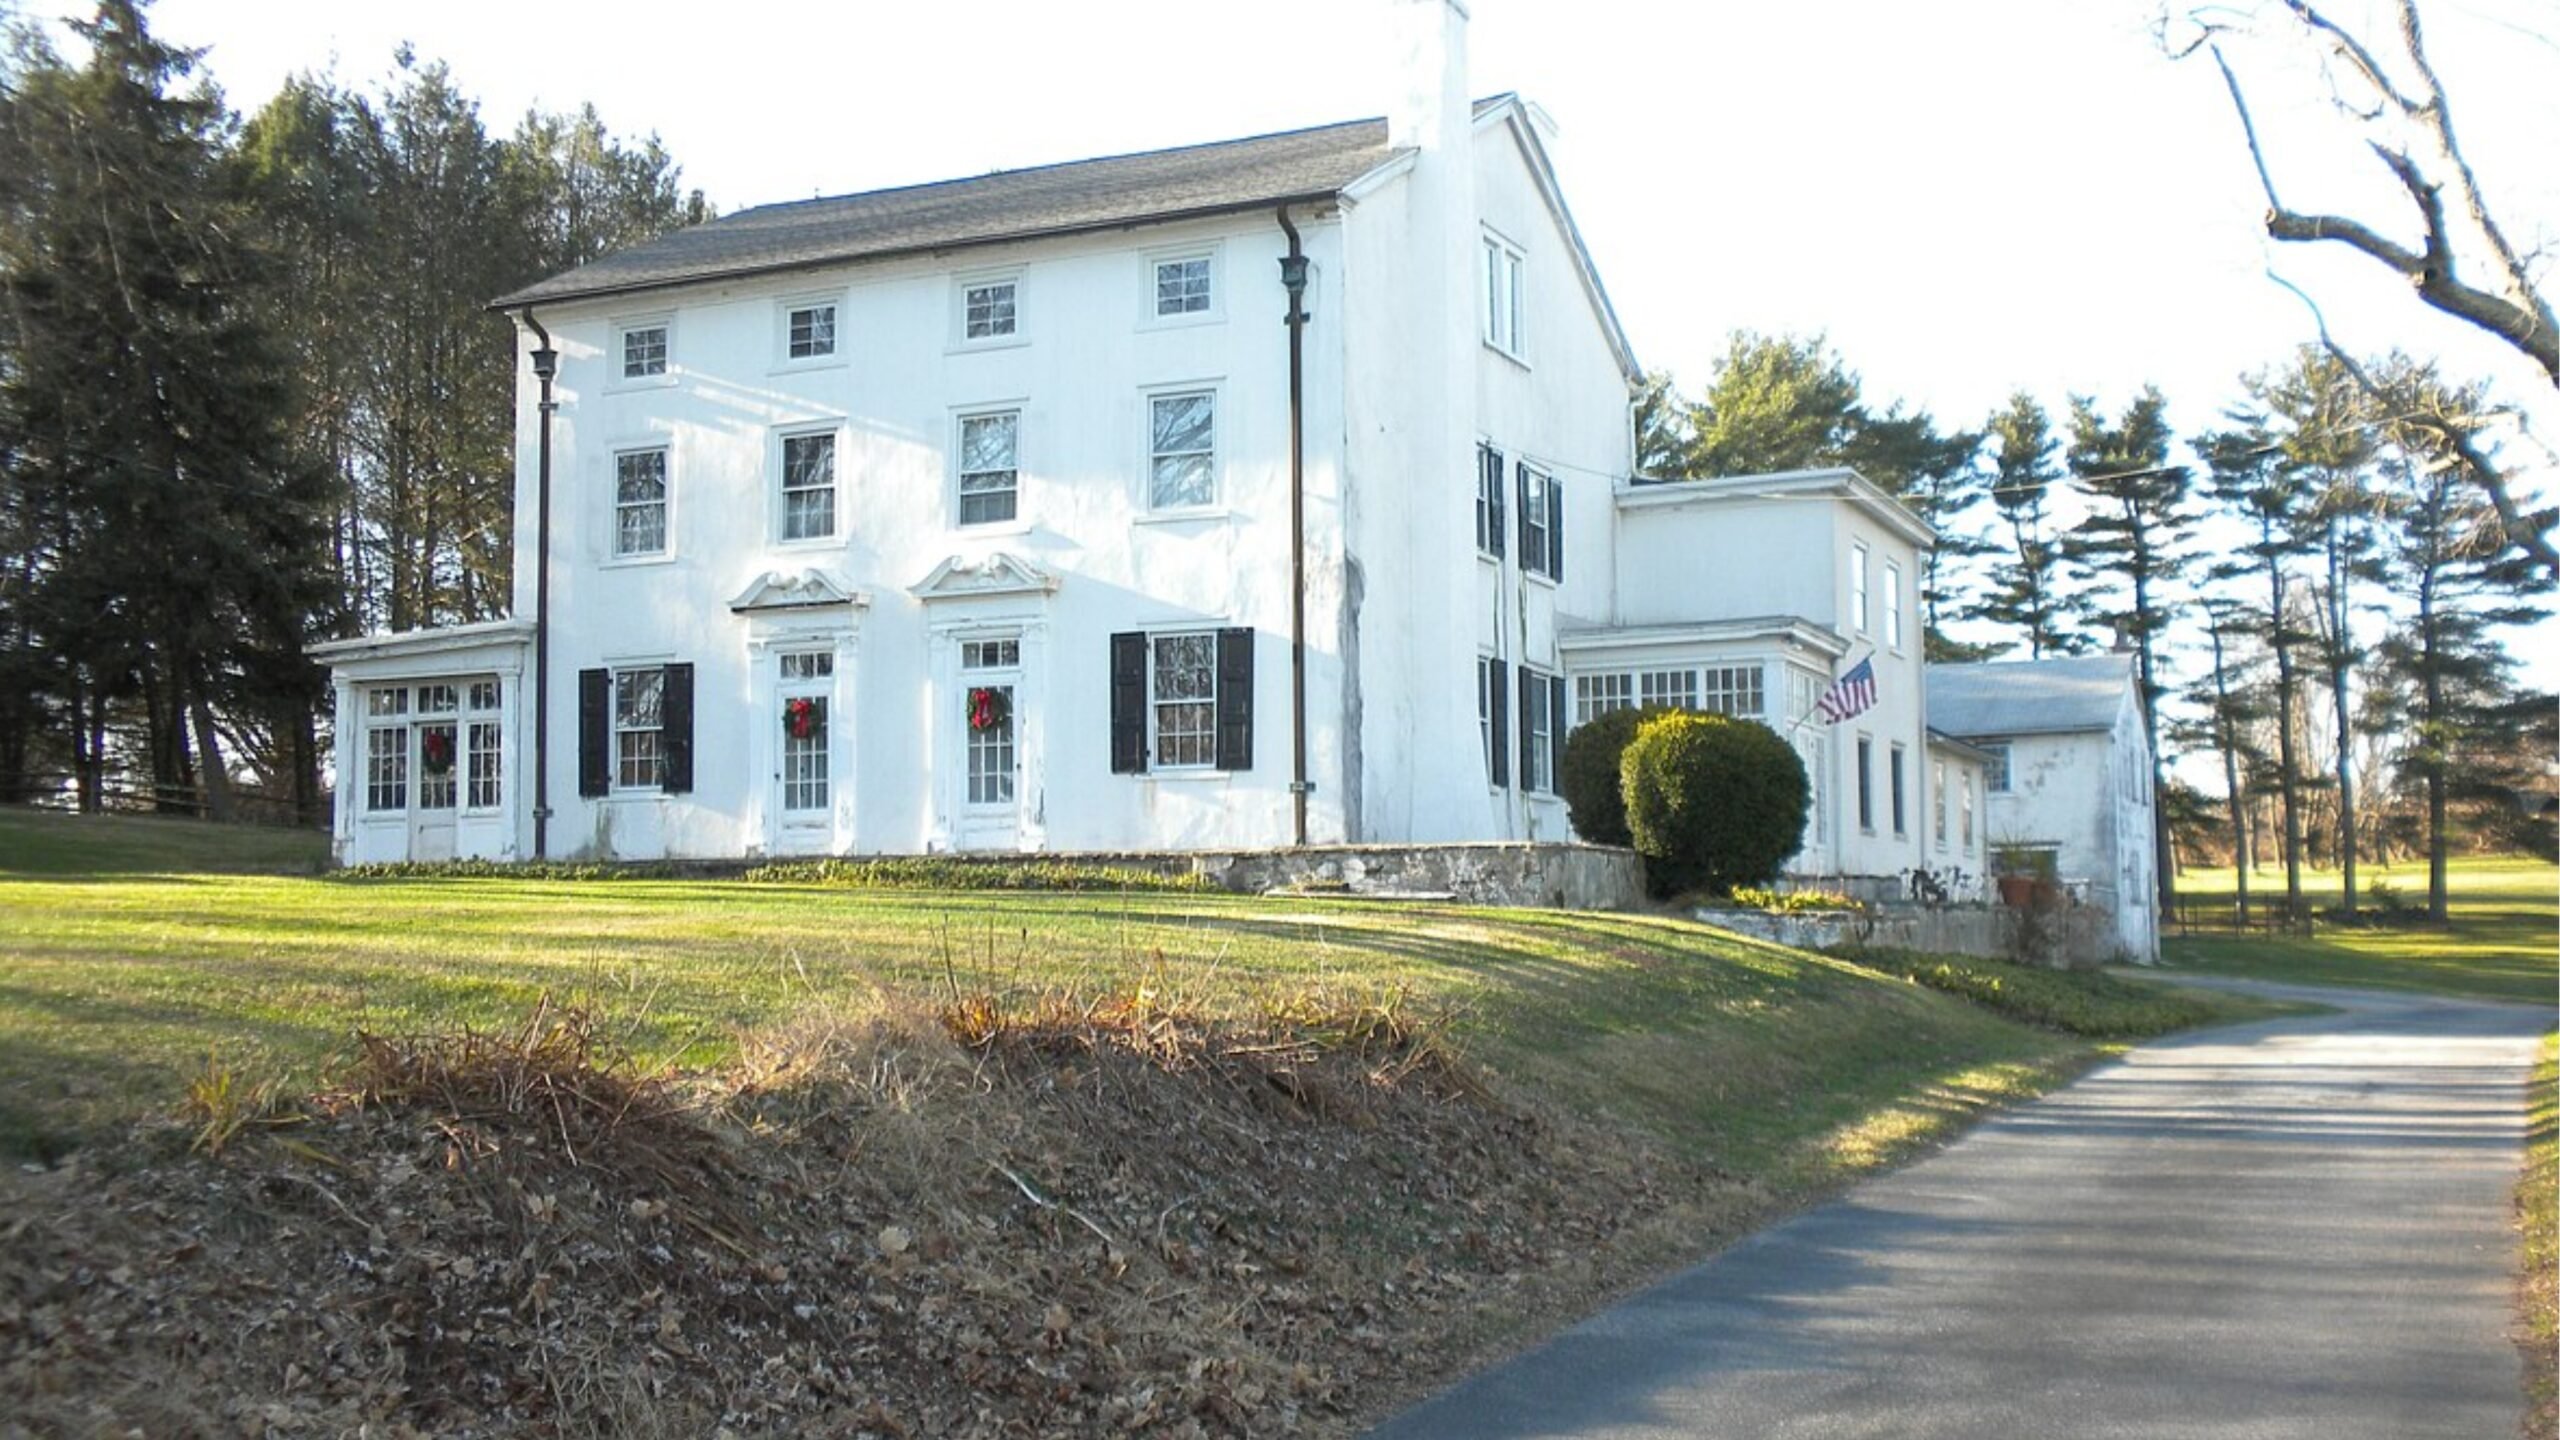
Chadds Ford is one of Pennsylvania’s most iconic communities, known for its historic landscapes, ties to the Brandywine Valley, and proximity to Longwood Gardens and the Wyeth art legacy. Located in southern Delaware County, the town draws professionals and retirees alike with its semi-rural feel and well-preserved heritage.
The significant increase in value between 2024 and 2025 may reflect the ripple effect from nearby Glen Mills and Kennett Square, where growth has already taken off. While limited data makes it harder to chart long-term patterns, early signs suggest Chadds Ford is firmly among the state’s higher-priced markets.
16. Furlong – 56% Home Price Increase Since 2016

- 2016: $468,612
- 2017: $475,926 (+$7,314, +1.56% from previous year)
- 2018: $487,790 (+$11,864, +2.49% from previous year)
- 2019: $497,360 (+$9,570, +1.96% from previous year)
- 2020: $514,654 (+$17,294, +3.48% from previous year)
- 2021: $584,381 (+$69,727, +13.55% from previous year)
- 2022: $668,388 (+$84,007, +14.38% from previous year)
- 2023: $686,453 (+$18,065, +2.70% from previous year)
- 2024: $711,234 (+$24,781, +3.61% from previous year)
- 2025: $731,043 (+$19,809, +2.79% from previous year)
Furlong’s home prices have increased by over $262,000 since 2016, driven by especially strong gains during the early 2020s. Between 2020 and 2022, year-over-year increases of over 13% pushed values well beyond the $650,000 mark. Growth has since moderated, but prices continue trending upward.
Furlong – Bucks County’s Quietly Booming Corner

Furlong is a small but highly sought-after residential area nestled between Doylestown and Newtown. While its footprint is compact, the homes here are spacious, modern, and often surrounded by open space and farmland — a combination that became particularly attractive during the pandemic’s housing rush.
Served by the Central Bucks School District and offering easy access to shopping and parks, Furlong attracts buyers seeking a blend of rural tranquility and suburban convenience. That combination has helped fuel the consistent rise in home prices, placing it among the more exclusive corners of Bucks County.
15. Chester Springs – 76% Home Price Increase Since 2010

- 2010: $422,379
- 2011: $402,709 (-$19,670, -4.66% from previous year)
- 2012: $398,189 (-$4,520, -1.12% from previous year)
- 2013: $414,882 (+$16,693, +4.19% from previous year)
- 2014: $437,329 (+$22,447, +5.41% from previous year)
- 2015: $446,688 (+$9,359, +2.14% from previous year)
- 2016: $459,848 (+$13,160, +2.95% from previous year)
- 2017: $472,698 (+$12,850, +2.79% from previous year)
- 2018: $481,576 (+$8,878, +1.88% from previous year)
- 2019: $488,995 (+$7,419, +1.54% from previous year)
- 2020: $498,728 (+$9,733, +1.99% from previous year)
- 2021: $556,459 (+$57,731, +11.58% from previous year)
- 2022: $648,190 (+$91,731, +16.48% from previous year)
- 2023: $675,602 (+$27,412, +4.23% from previous year)
- 2024: $721,925 (+$46,323, +6.86% from previous year)
- 2025: $744,211 (+$22,286, +3.09% from previous year)
Chester Springs saw home values rise from around $422K in 2010 to more than $744K in 2025. Price growth was relatively steady through the 2010s, with a major surge starting in 2021. In 2022 alone, home prices jumped by more than $91,000.
Chester Springs – Historic Roots and Modern Appeal

Located in Chester County’s West Pikeland Township, Chester Springs is known for its rolling hills, colonial-era buildings, and covered bridges. It offers a quiet, upscale atmosphere that has become increasingly popular with families and remote professionals seeking scenic surroundings within commuting distance of Philadelphia.
The explosive price growth in 2021 and 2022 aligns with broader regional trends, but Chester Springs stands out for how quickly it crossed into the $700K range. High demand for single-family homes on large lots continues to drive interest, while zoning policies help keep inventory limited — further supporting rising values.
14. Fort Washington – 60% Home Price Increase Since 2016
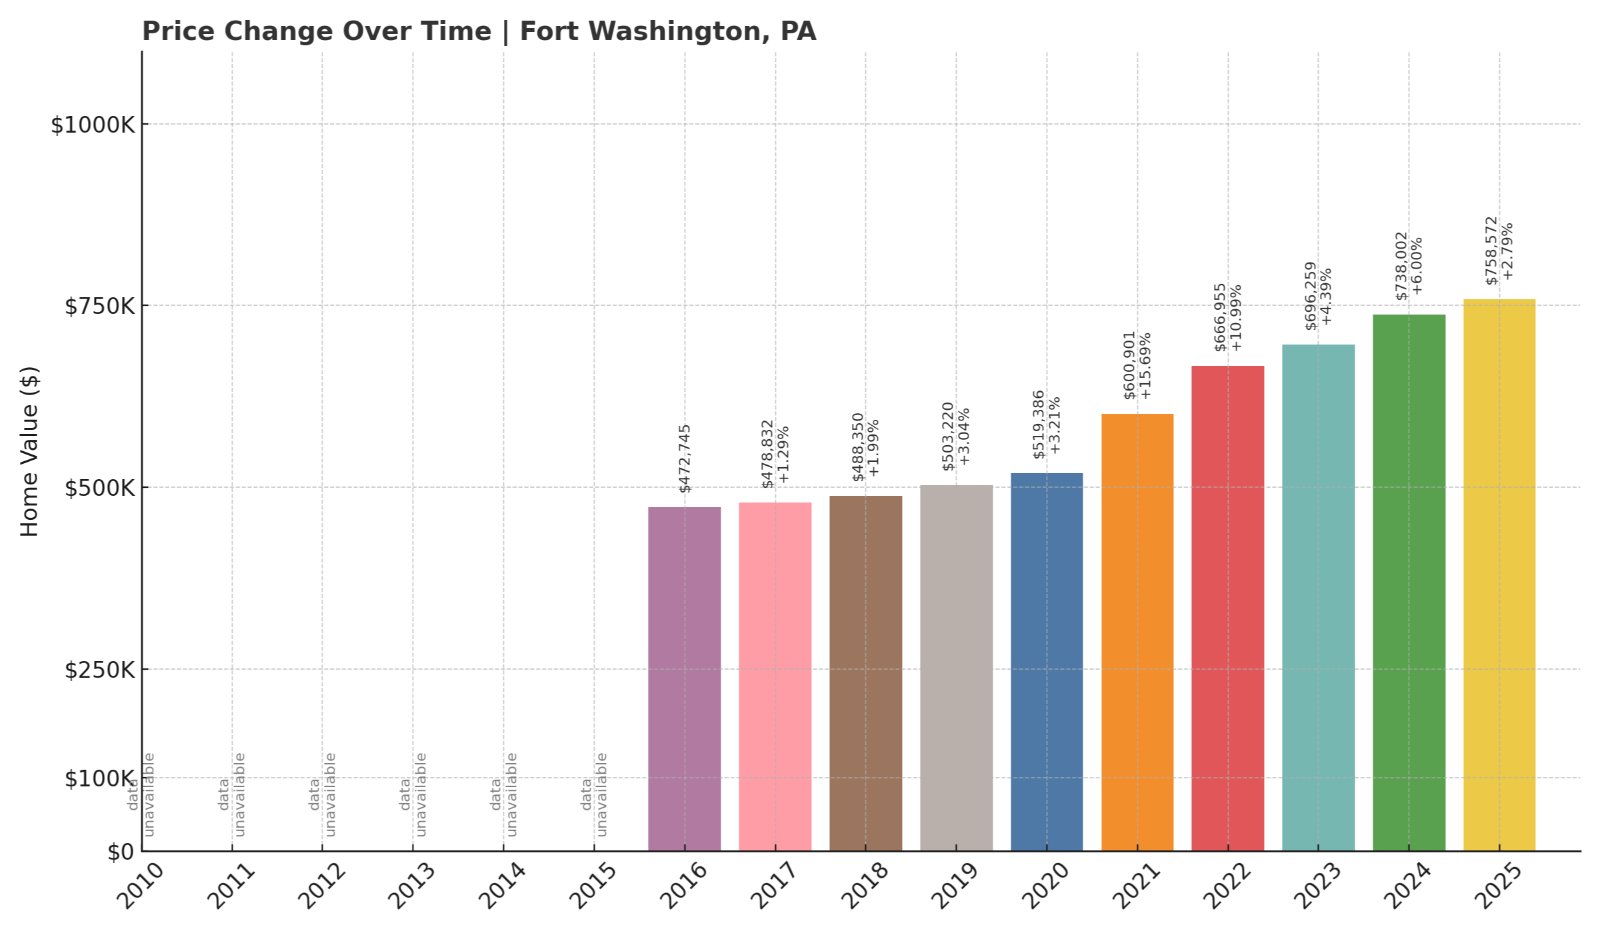
- 2016: $472,745
- 2017: $478,832 (+$6,087, +1.29% from previous year)
- 2018: $488,350 (+$9,518, +1.99% from previous year)
- 2019: $503,220 (+$14,870, +3.04% from previous year)
- 2020: $519,386 (+$16,166, +3.21% from previous year)
- 2021: $600,901 (+$81,515, +15.69% from previous year)
- 2022: $666,955 (+$66,054, +10.99% from previous year)
- 2023: $696,259 (+$29,304, +4.39% from previous year)
- 2024: $738,002 (+$41,743, +6.00% from previous year)
- 2025: $758,572 (+$20,570, +2.79% from previous year)
Since 2016, Fort Washington’s home prices have risen by over $285,000, with dramatic increases beginning in 2021. That year saw a nearly 16% gain, reflecting the strong post-pandemic demand in premium suburban markets. Even in more stable years, growth has remained solid.
Fort Washington – Commuter Convenience Meets High Demand

Located in Upper Dublin Township, Fort Washington offers excellent transit access via SEPTA rail and the Pennsylvania Turnpike. It’s also home to large corporate centers and the popular Fort Washington State Park, adding both employment opportunities and recreation to its appeal.
The home price spike in 2021 mirrors broader shifts toward suburban living, and the area’s mix of large properties, top-rated schools, and business amenities continues to attract higher-income buyers. Inventory remains tight, which has helped keep prices climbing well into 2025.
13. Newtown Square – 2% Home Price Increase Since 2024
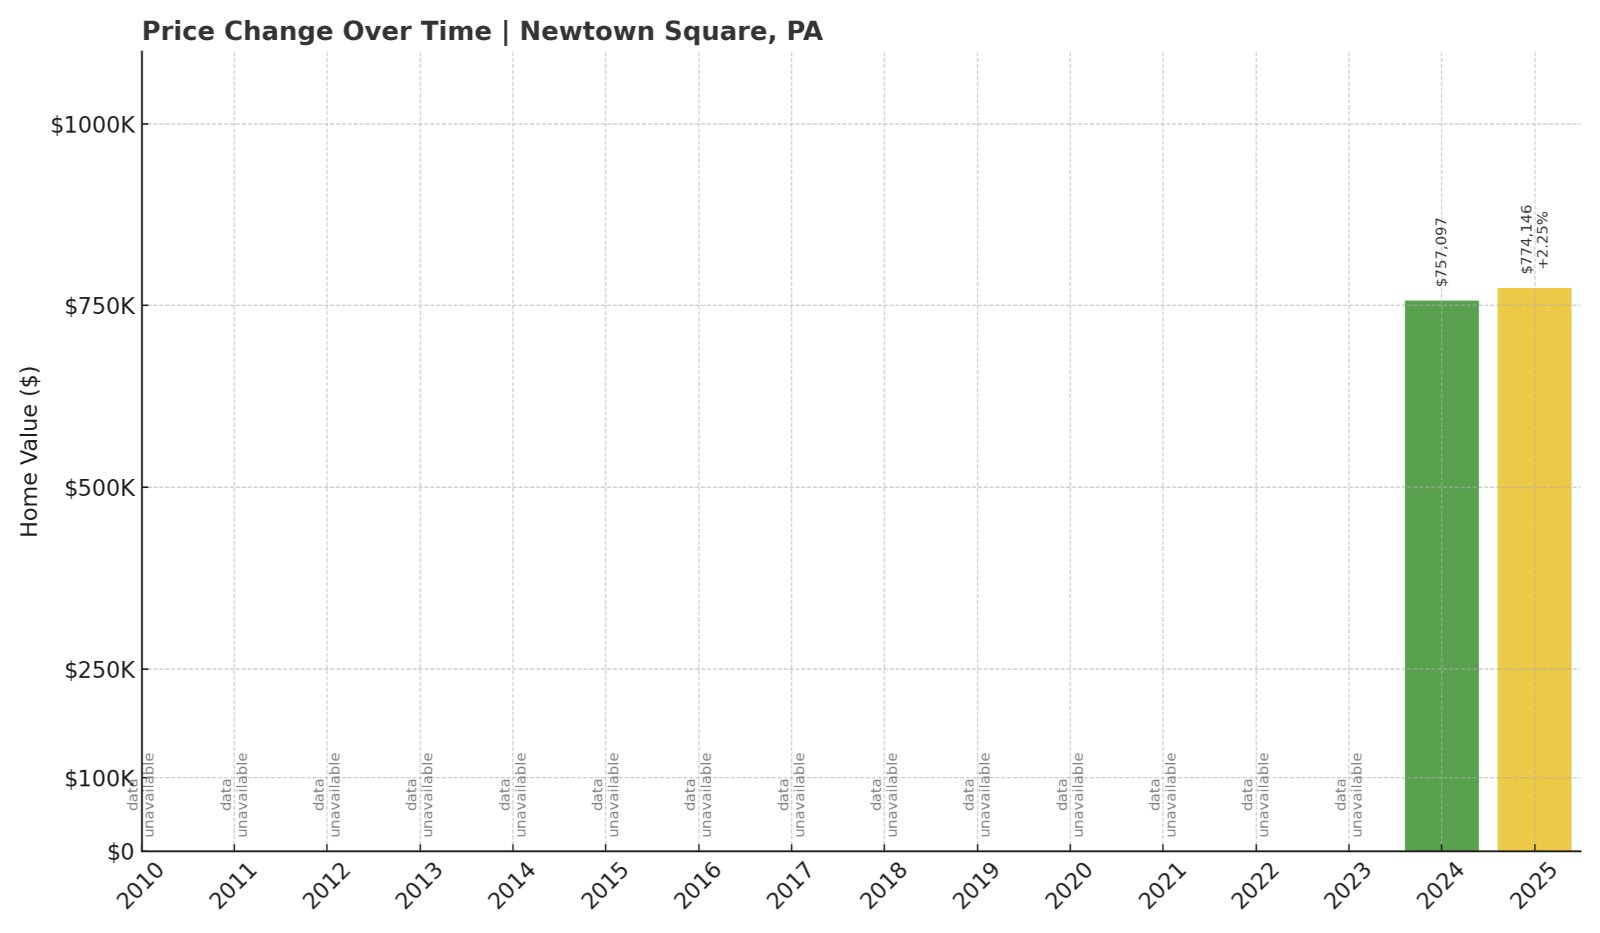
- 2024: $757,097
- 2025: $774,146 (+$17,049, +2.25% from previous year)
Though data is limited to two years, Newtown Square’s homes gained over $17,000 in value between 2024 and 2025. That moderate increase suggests an already high market that continues to rise gradually.
Newtown Square – Upscale Living in Delaware County

Newtown Square is an established and increasingly upscale community in Delaware County, just west of Philadelphia. With the headquarters of major firms like SAP and a growing collection of luxury developments, the town has become one of the region’s most desirable addresses.
The modest increase in 2025 could reflect a maturing market where values are already high. Strong schools, proximity to the Main Line, and amenities like the new Ellis Preserve shopping and office complex continue to drive local demand.
12. Wynnewood – 93% Home Price Increase Since 2010

Would you like to save this?
- 2010: $406,637
- 2011: $392,153 (-$14,484, -3.56% from previous year)
- 2012: $389,625 (-$2,528, -0.64% from previous year)
- 2013: $407,377 (+$17,752, +4.56% from previous year)
- 2014: $439,227 (+$31,850, +7.82% from previous year)
- 2015: $445,243 (+$6,016, +1.37% from previous year)
- 2016: $453,155 (+$7,912, +1.78% from previous year)
- 2017: $464,867 (+$11,712, +2.58% from previous year)
- 2018: $487,237 (+$22,370, +4.81% from previous year)
- 2019: $497,493 (+$10,256, +2.10% from previous year)
- 2020: $523,476 (+$25,983, +5.22% from previous year)
- 2021: $598,164 (+$74,688, +14.27% from previous year)
- 2022: $656,876 (+$58,712, +9.82% from previous year)
- 2023: $689,405 (+$32,529, +4.95% from previous year)
- 2024: $745,742 (+$56,337, +8.17% from previous year)
- 2025: $783,747 (+$38,005, +5.10% from previous year)
Wynnewood has nearly doubled in price since 2010, going from just over $406K to nearly $784K by 2025. After years of moderate growth, the biggest leaps came after 2020, especially in 2021 and 2022. Prices have continued to rise at a solid pace in the years since.
Wynnewood – Classic Main Line Prestige

Wynnewood, part of Lower Merion Township, is one of the most recognizable names on the Philadelphia Main Line. Known for its leafy streets, stately homes, and access to excellent schools and train service, it remains a magnet for families and professionals alike.
With substantial price increases since 2020, Wynnewood reflects the enduring appeal of Main Line living. The growth isn’t just about housing demand — it’s also about prestige, convenience, and a steady influx of buyers looking for access to both suburban amenities and city proximity.
11. Malvern – 73% Home Price Increase Since 2010
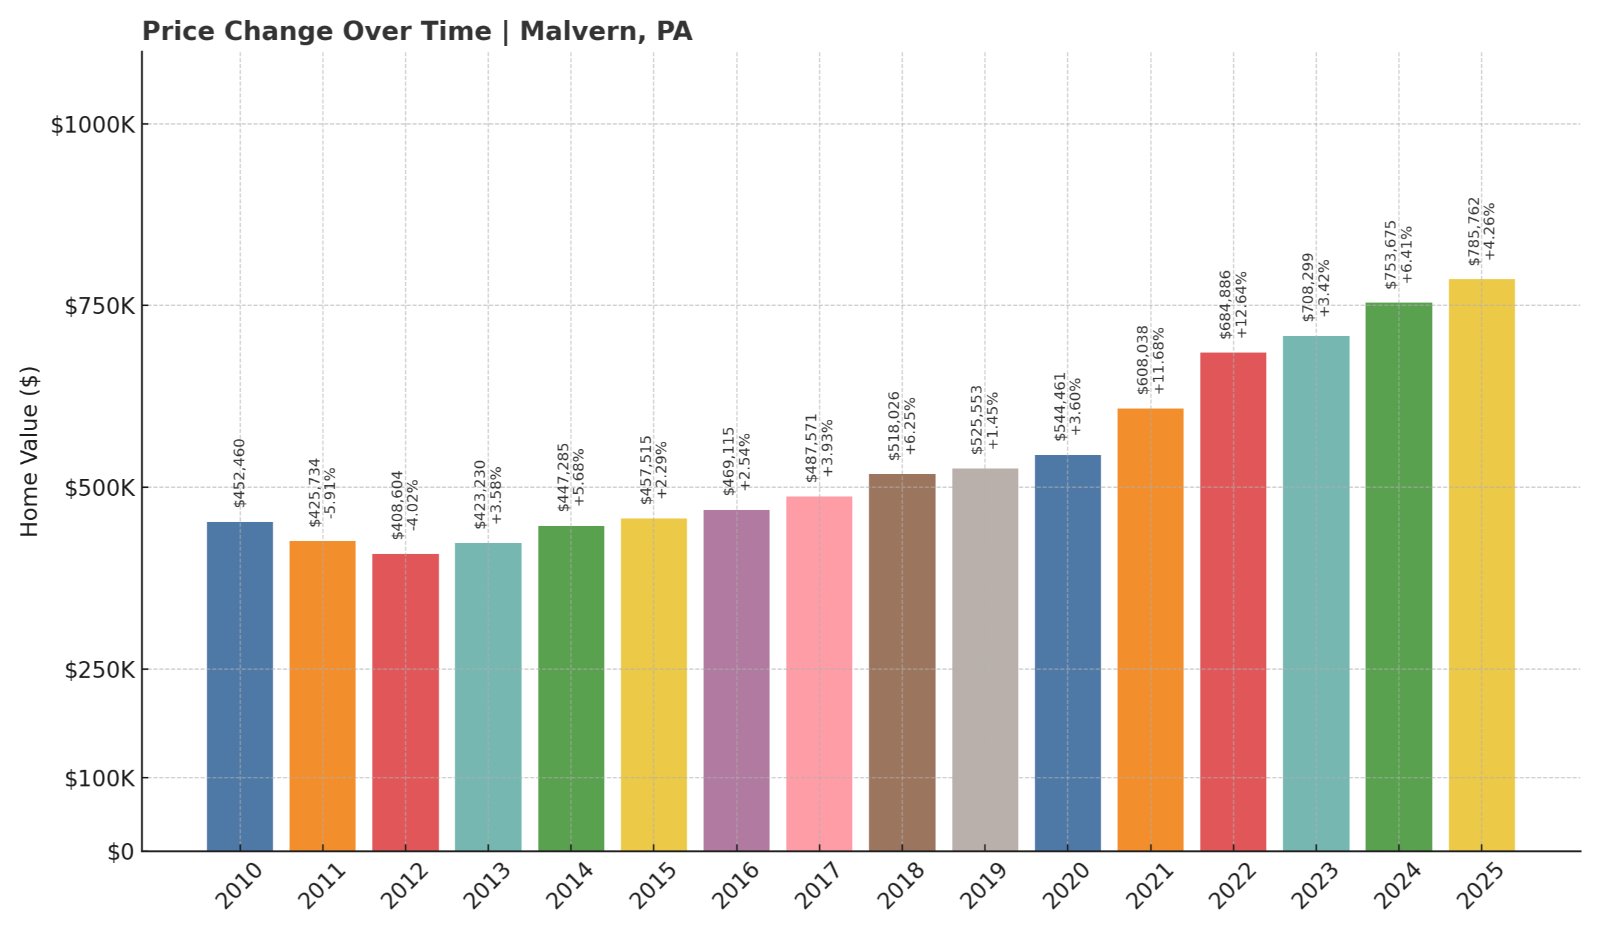
- 2010: $452,460
- 2011: $425,734 (-$26,726, -5.91% from previous year)
- 2012: $408,604 (-$17,130, -4.02% from previous year)
- 2013: $423,230 (+$14,626, +3.58% from previous year)
- 2014: $447,285 (+$24,055, +5.68% from previous year)
- 2015: $457,515 (+$10,230, +2.29% from previous year)
- 2016: $469,115 (+$11,600, +2.54% from previous year)
- 2017: $487,571 (+$18,456, +3.93% from previous year)
- 2018: $518,026 (+$30,455, +6.25% from previous year)
- 2019: $525,553 (+$7,527, +1.45% from previous year)
- 2020: $544,461 (+$18,908, +3.60% from previous year)
- 2021: $608,038 (+$63,577, +11.68% from previous year)
- 2022: $684,886 (+$76,848, +12.64% from previous year)
- 2023: $708,299 (+$23,413, +3.42% from previous year)
- 2024: $753,675 (+$45,376, +6.41% from previous year)
- 2025: $785,762 (+$32,087, +4.26% from previous year)
Malvern’s home prices have grown from $452K in 2010 to over $785K in 2025. Though the early 2010s were rocky, appreciation picked up in the second half of the decade, with strong double-digit gains especially from 2021 to 2022.
Malvern – Chester County’s Professional Hub

Malvern has transformed in recent years into one of Chester County’s most dynamic towns. With major employers like Vanguard nearby and excellent transportation via Route 202 and the Paoli/Thorndale train line, it’s both a residential and economic center.
The recent home price surge underscores Malvern’s rising stature. In addition to strong job access, the town offers a lively downtown, quality schools, and a blend of historic and new developments — all factors contributing to long-term demand and value.
10. Narberth – 98% Home Price Increase Since 2010

- 2010: $404,975
- 2011: $396,600 (-$8,375, -2.07% from previous year)
- 2012: $390,795 (-$5,805, -1.46% from previous year)
- 2013: $409,934 (+$19,139, +4.90% from previous year)
- 2014: $437,482 (+$27,548, +6.72% from previous year)
- 2015: $458,572 (+$21,090, +4.82% from previous year)
- 2016: $473,147 (+$14,575, +3.18% from previous year)
- 2017: $484,537 (+$11,390, +2.41% from previous year)
- 2018: $514,442 (+$29,905, +6.17% from previous year)
- 2019: $527,100 (+$12,658, +2.46% from previous year)
- 2020: $549,912 (+$22,812, +4.33% from previous year)
- 2021: $628,980 (+$79,068, +14.38% from previous year)
- 2022: $673,691 (+$44,711, +7.11% from previous year)
- 2023: $702,869 (+$29,178, +4.33% from previous year)
- 2024: $771,591 (+$68,722, +9.78% from previous year)
- 2025: $803,594 (+$32,003, +4.15% from previous year)
Narberth’s home prices have nearly doubled since 2010, reflecting one of the strongest growth trajectories in the region. The biggest jump came in 2021, when prices shot up over $79,000 in a single year.
Narberth – Small Town, Big Demand

With its walkable downtown, community vibe, and regional rail access, Narberth is one of the most distinctive and desirable boroughs on the Main Line. Despite its compact size, the town offers a full slate of local services, parks, and independent shops — all just minutes from Philadelphia.
The town’s tight housing supply and high demand help explain its rapid price increases. Buyers are drawn to Narberth for its small-town charm and city convenience, and the numbers show it — with home values steadily climbing year after year.
9. Bryn Mawr – 79% Home Price Increase Since 2010

- 2010: $486,589
- 2011: $467,881 (-$18,708, -3.84% from previous year)
- 2012: $453,069 (-$14,812, -3.17% from previous year)
- 2013: $467,662 (+$14,593, +3.22% from previous year)
- 2014: $496,301 (+$28,639, +6.12% from previous year)
- 2015: $507,839 (+$11,538, +2.32% from previous year)
- 2016: $513,333 (+$5,494, +1.08% from previous year)
- 2017: $524,086 (+$10,753, +2.09% from previous year)
- 2018: $541,641 (+$17,555, +3.35% from previous year)
- 2019: $560,781 (+$19,140, +3.53% from previous year)
- 2020: $578,687 (+$17,906, +3.19% from previous year)
- 2021: $661,787 (+$83,100, +14.36% from previous year)
- 2022: $737,155 (+$75,368, +11.39% from previous year)
- 2023: $771,956 (+$34,801, +4.72% from previous year)
- 2024: $841,840 (+$69,884, +9.05% from previous year)
- 2025: $874,176 (+$32,336, +3.84% from previous year)
Home prices in Bryn Mawr have risen by nearly $388,000 since 2010, climbing at a steady pace with sharp upticks from 2020 to 2022. Price growth remains healthy even in recent years, indicating ongoing interest in the area.
Bryn Mawr – Education and Elegance in Equal Measure

Home to Bryn Mawr College and one of the most prestigious stops along the Main Line, this town combines academic atmosphere with classic suburban appeal. Tree-lined streets, historic architecture, and top-tier public and private schools make it a perennial favorite for affluent buyers.
The strong demand for homes in Bryn Mawr is backed by its consistent performance in the housing market. The combination of culture, accessibility, and amenities ensures that this town remains one of Pennsylvania’s most desirable — and expensive — places to live.
8. Wayne – 5% Home Price Increase Since 2024
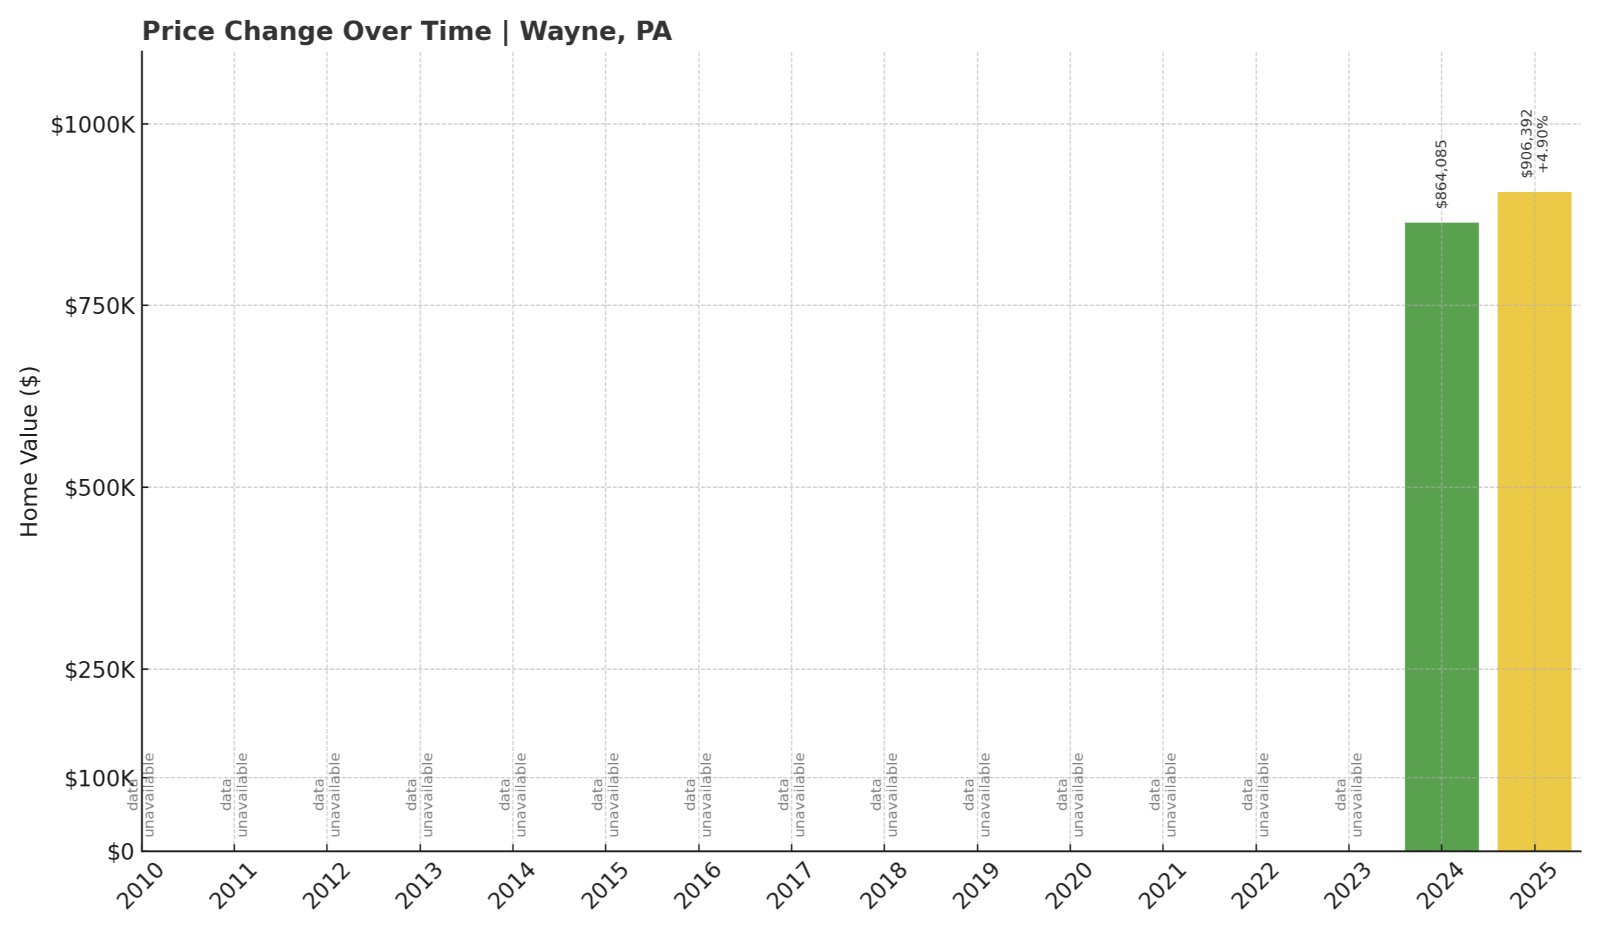
- 2024: $864,085
- 2025: $906,392 (+$42,307, +4.90% from previous year)
Though limited to two years of data, Wayne’s home prices climbed by more than $42,000 between 2024 and 2025. This nearly 5% increase signals a strong, active housing market even at already high valuations.
Wayne – Main Line Luxury with a Bustling Center

Wayne is a major hub along Philadelphia’s Main Line and one of its most sought-after destinations. Split across multiple townships in Delaware and Chester counties, Wayne boasts top-rated Radnor schools, high-end shopping, and a walkable downtown with boutiques, restaurants, and cultural venues.
Its blend of historic estates, modern townhomes, and family-friendly amenities continues to push property values upward. Even with homes already priced over $850K, the town’s demand remains strong — a reflection of both location and livability.
7. New Hope – 80% Home Price Increase Since 2010

- 2010: $506,990
- 2011: $498,489 (-$8,501, -1.68% from previous year)
- 2012: $479,887 (-$18,602, -3.73% from previous year)
- 2013: $492,096 (+$12,209, +2.54% from previous year)
- 2014: $521,657 (+$29,561, +6.01% from previous year)
- 2015: $536,973 (+$15,316, +2.94% from previous year)
- 2016: $535,743 (-$1,230, -0.23% from previous year)
- 2017: $559,613 (+$23,870, +4.46% from previous year)
- 2018: $587,101 (+$27,488, +4.91% from previous year)
- 2019: $592,582 (+$5,481, +0.93% from previous year)
- 2020: $627,141 (+$34,559, +5.83% from previous year)
- 2021: $717,947 (+$90,806, +14.48% from previous year)
- 2022: $818,515 (+$100,568, +14.01% from previous year)
- 2023: $832,996 (+$14,481, +1.77% from previous year)
- 2024: $887,811 (+$54,815, +6.58% from previous year)
- 2025: $912,543 (+$24,732, +2.79% from previous year)
New Hope’s home values have jumped from about $507K in 2010 to more than $912K in 2025. The most dramatic increases came in 2021 and 2022, with triple-digit gains over those two years alone. The trend has continued, albeit at a slower pace, in the years since.
New Hope – Artistic Enclave with a High Price Tag

Sitting along the Delaware River in Bucks County, New Hope has long been known for its artsy spirit, walkable downtown, and scenic riverfront setting. Tourists flock here for shopping, fine dining, and shows at the Bucks County Playhouse, while residents enjoy a unique small-town vibe with big-city flair.
Historic homes, limited inventory, and continued interest from retirees and second-home buyers have all helped push prices skyward. With home values nearing $1 million, New Hope blends charm with exclusivity in one of the state’s most distinctive housing markets.
6. Berwyn – 64% Home Price Increase Since 2016
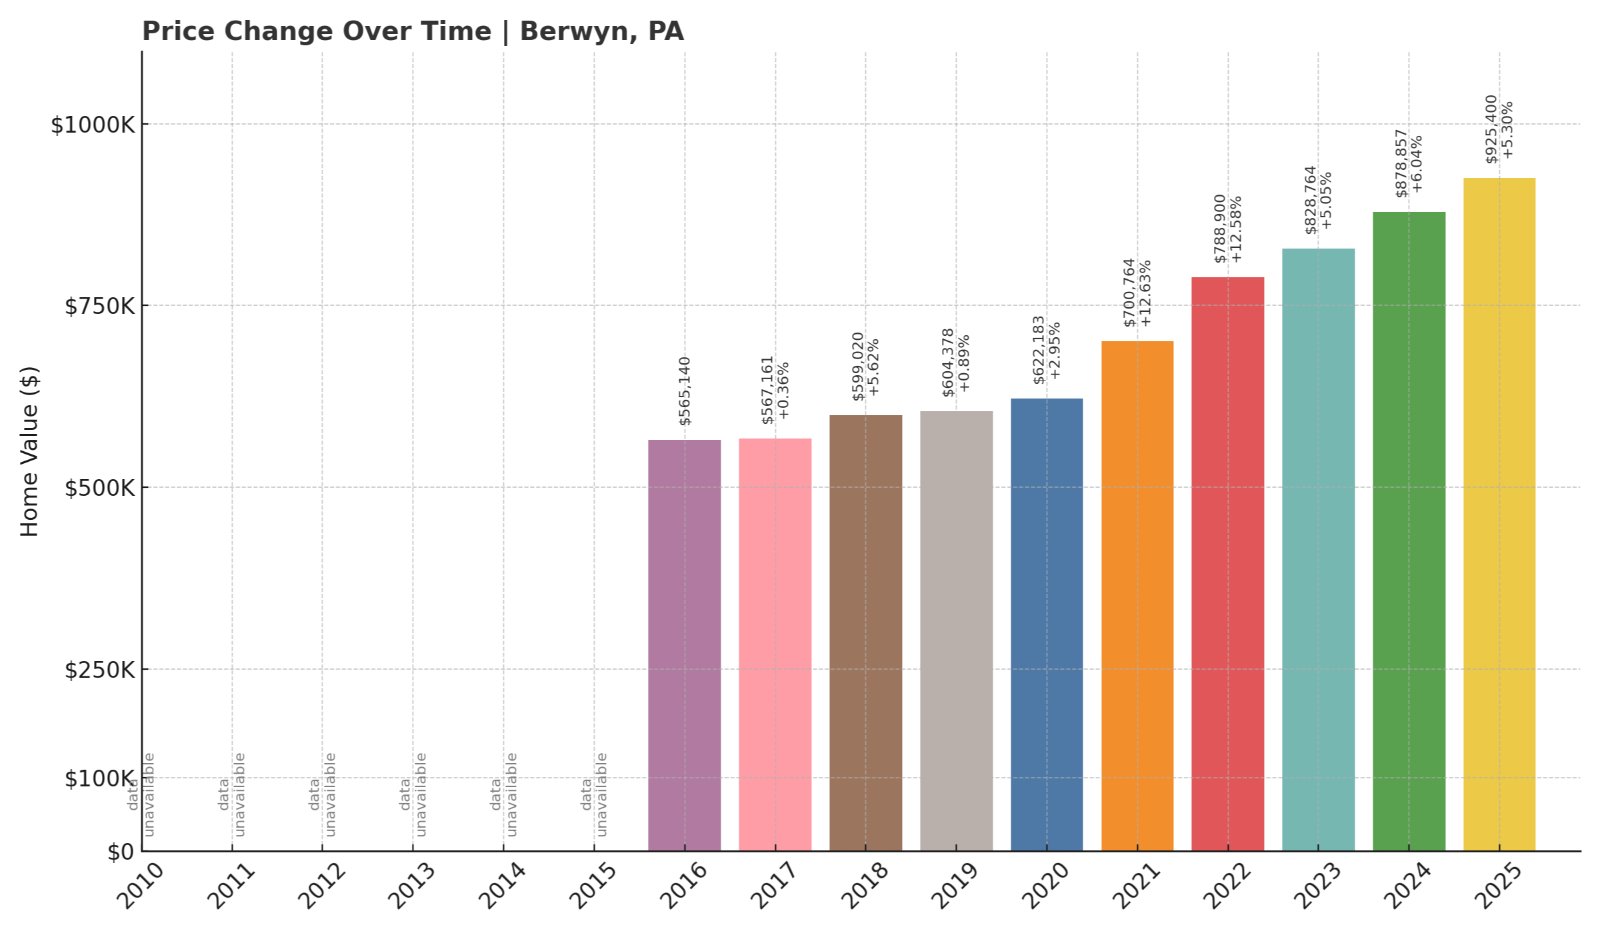
- 2016: $565,140
- 2017: $567,161 (+$2,021, +0.36% from previous year)
- 2018: $599,020 (+$31,859, +5.62% from previous year)
- 2019: $604,378 (+$5,358, +0.89% from previous year)
- 2020: $622,183 (+$17,805, +2.95% from previous year)
- 2021: $700,764 (+$78,581, +12.63% from previous year)
- 2022: $788,900 (+$88,136, +12.58% from previous year)
- 2023: $828,764 (+$39,864, +5.05% from previous year)
- 2024: $878,857 (+$50,093, +6.04% from previous year)
- 2025: $925,400 (+$46,543, +5.30% from previous year)
Berwyn’s home prices have risen over $360,000 since 2016. Values remained fairly flat until 2020, after which rapid appreciation took hold — with two straight years of double-digit increases followed by continued solid growth.
Berwyn – A Rising Star on the Main Line
Berwyn, located in Chester County and served by the Tredyffrin-Easttown School District, combines Main Line appeal with a more relaxed vibe than neighboring towns. It offers excellent schools, regional rail access, and a growing collection of restaurants and shops along Lancaster Avenue.
Recent growth has brought greater visibility to Berwyn’s real estate market, with more buyers considering it as a slightly more affordable alternative to Wayne or Devon. But with prices now exceeding $925K, Berwyn is quickly catching up to its higher-profile neighbors.
5. Devon – 64% Home Price Increase Since 2016
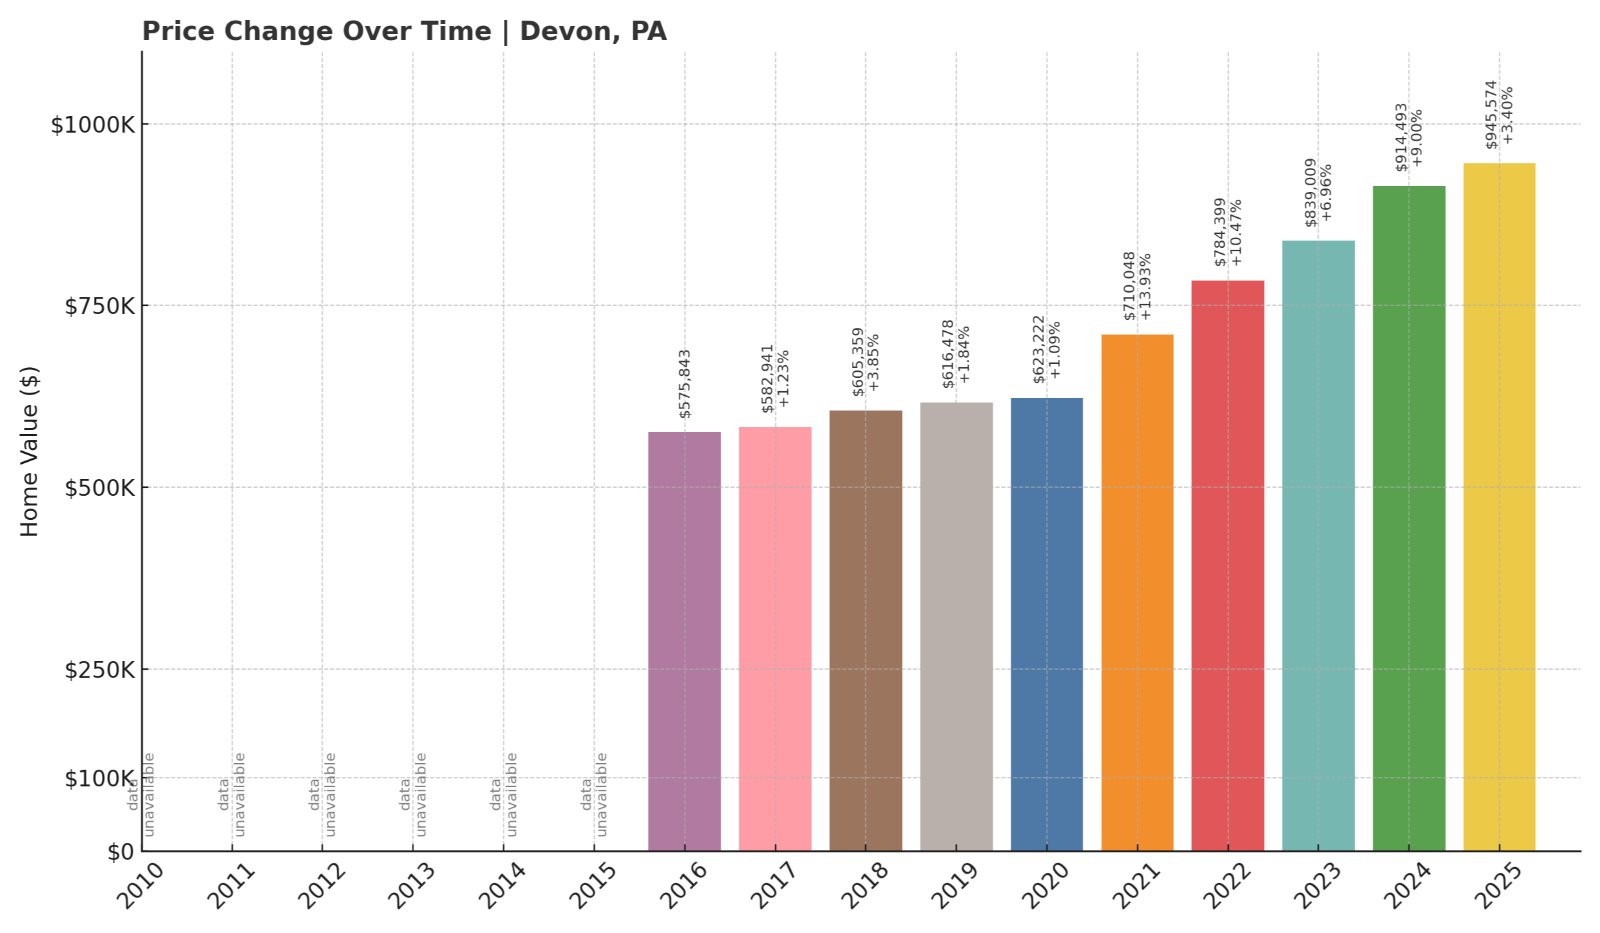
- 2016: $575,843
- 2017: $582,941 (+$7,098, +1.23% from previous year)
- 2018: $605,359 (+$22,418, +3.85% from previous year)
- 2019: $616,478 (+$11,119, +1.84% from previous year)
- 2020: $623,222 (+$6,744, +1.09% from previous year)
- 2021: $710,048 (+$86,826, +13.93% from previous year)
- 2022: $784,399 (+$74,351, +10.47% from previous year)
- 2023: $839,009 (+$54,610, +6.96% from previous year)
- 2024: $914,493 (+$75,484, +9.00% from previous year)
- 2025: $945,574 (+$31,081, +3.40% from previous year)
Devon’s home prices have climbed by almost $370,000 since 2016. After modest growth in the late 2010s, values surged in 2021 and have maintained upward momentum since, landing above $945K in 2025.
Devon – Estate Living and Elite Schools

Devon, part of Easttown Township in Chester County, is known for its large lots, luxury homes, and the Devon Horse Show — a signature Main Line event since 1896. The area is served by the highly-rated Tredyffrin-Easttown School District, further boosting demand.
The housing stock includes a mix of historic properties and new custom builds, attracting buyers looking for elegance and privacy. As Main Line housing demand remains high, Devon’s upscale market continues to thrive, with prices closing in on the million-dollar mark.
4. Edgeworth – 99% Home Price Increase Since 2010

- 2010: $481,183
- 2011: $470,322 (-$10,861, -2.26% from previous year)
- 2012: $488,294 (+$17,972, +3.82% from previous year)
- 2013: $536,500 (+$48,206, +9.87% from previous year)
- 2014: $565,870 (+$29,370, +5.47% from previous year)
- 2015: $564,463 (-$1,407, -0.25% from previous year)
- 2016: $570,406 (+$5,943, +1.05% from previous year)
- 2017: $568,084 (-$2,322, -0.41% from previous year)
- 2018: $586,968 (+$18,884, +3.32% from previous year)
- 2019: $628,184 (+$41,216, +7.02% from previous year)
- 2020: $639,026 (+$10,842, +1.73% from previous year)
- 2021: $738,575 (+$99,549, +15.58% from previous year)
- 2022: $799,520 (+$60,945, +8.25% from previous year)
- 2023: $812,576 (+$13,056, +1.63% from previous year)
- 2024: $887,512 (+$74,936, +9.22% from previous year)
- 2025: $957,875 (+$70,363, +7.93% from previous year)
Edgeworth has nearly doubled in home value since 2010, with prices increasing by about $477,000 over that span. Major jumps in 2013, 2021, and 2024 have contributed to the surge, with prices now approaching $1 million.
Edgeworth – Historic Affluence on Pittsburgh’s Edge
Located in Allegheny County along the Ohio River, Edgeworth is one of the wealthiest boroughs in the Pittsburgh metro area. Known for its tree-lined streets, gracious homes, and proximity to the prestigious Sewickley Academy, it has long been a quiet enclave for affluent residents.
Its historic charm and small size mean that inventory is always tight — a key driver behind its escalating prices. The growth pattern here mirrors national trends in high-income suburbs, with sharp increases after 2020 and continued appreciation into 2025.
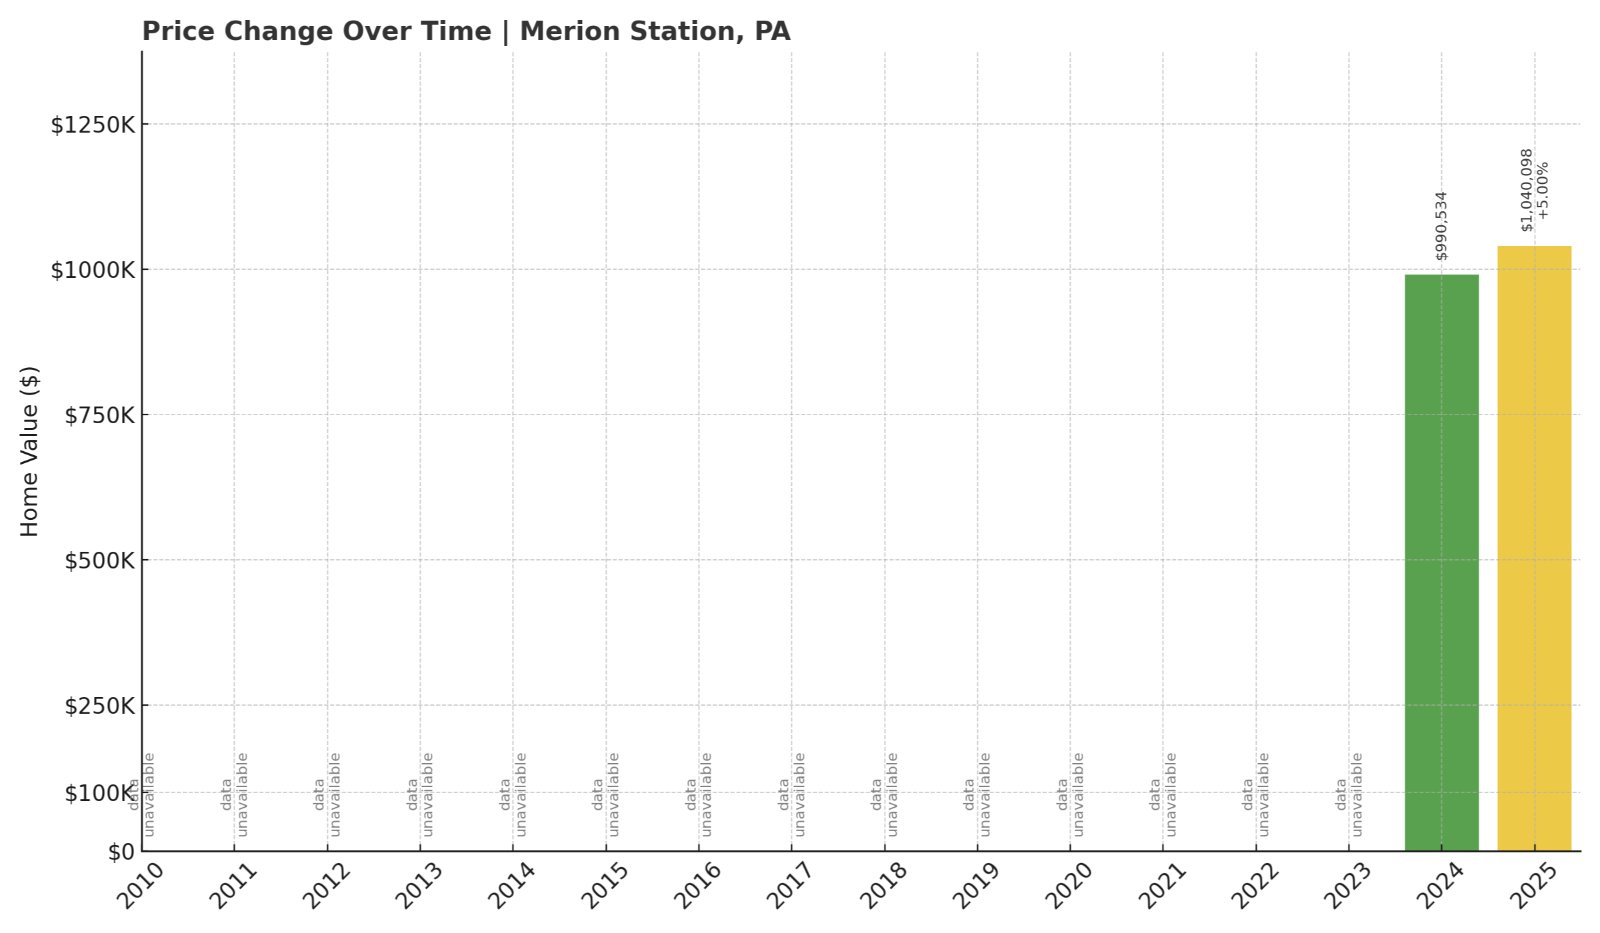
3. Merion Station – 5% Home Price Increase Since 2024
Would you like to save this?
- 2024: $990,534
- 2025: $1,040,098 (+$49,564, +5.00% from previous year)
While long-term data is unavailable, Merion Station has crossed the million-dollar threshold in 2025 after a healthy 5% increase in just one year. The town’s high baseline suggests it’s been among the top-tier markets for some time.
Merion Station – Main Line Grandeur with Lasting Value

Merion Station is a cornerstone of Philadelphia’s Main Line and part of the highly sought-after Lower Merion Township. Known for its grand homes, excellent schools, and walkable access to public transit, it offers a near-perfect mix of city access and suburban calm.
The recent rise in prices likely continues a long-standing trend of sustained demand in this elite market. With historic mansions, manicured lawns, and a reputation for exclusivity, Merion Station is both prestigious and enduringly expensive.
2. Villanova – 4% Home Price Increase Since 2024

- 2024: $1,399,337
- 2025: $1,457,287 (+$57,950, +4.14% from previous year)
Villanova remains one of Pennsylvania’s highest-priced markets, with home values jumping nearly $58,000 in one year alone. Though limited data prevents a longer-term comparison, its 2025 valuation speaks volumes about demand.
Villanova – Elite Education and Million-Dollar Homes

Home to Villanova University and sprawling estates, this Main Line town has long attracted affluent homeowners. With easy access to major highways, SEPTA rail lines, and top-ranked schools, it offers both beauty and convenience.
Villanova’s property values have stayed well above state averages, thanks to a combination of exclusivity, prestige, and proximity to cultural and educational institutions. With home prices nearing $1.5 million, this is luxury real estate at its most established.
1. Gladwyne – 4% Home Price Increase Since 2024
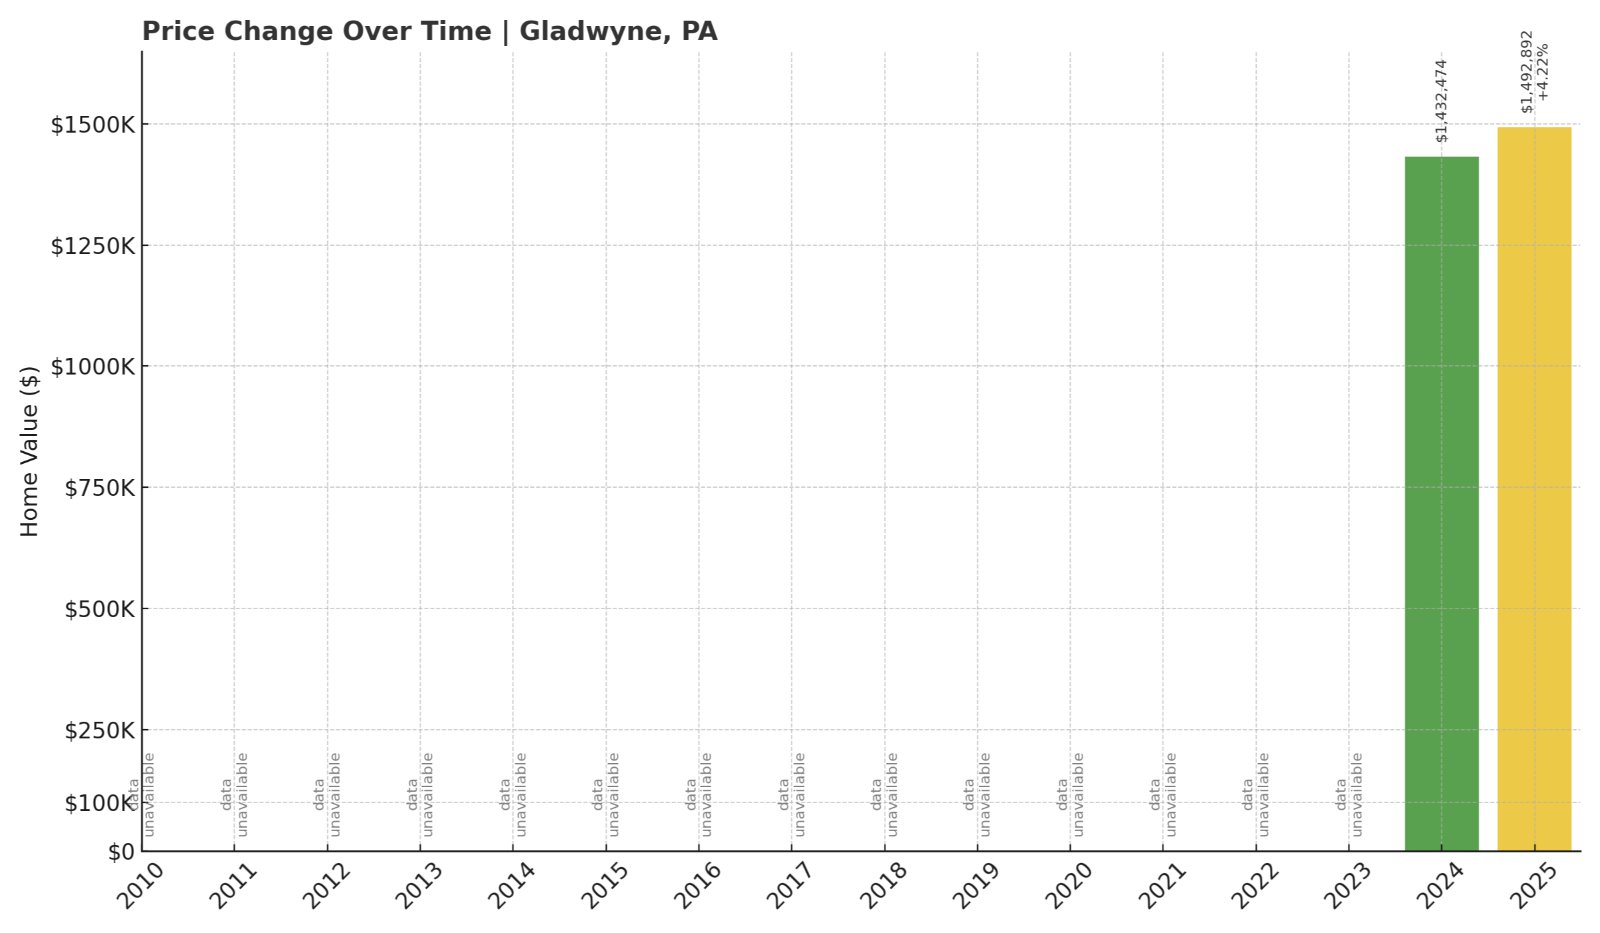
- 2024: $1,432,474
- 2025: $1,492,892 (+$60,418, +4.22% from previous year)
Gladwyne tops the list as Pennsylvania’s most expensive town in 2025, with home prices climbing over $1.49 million. The one-year increase of more than $60,000 underscores this exclusive enclave’s ongoing appeal.
Gladwyne – Timeless Wealth on the Main Line

One of the richest ZIP codes in the state, Gladwyne is known for its secluded estates, rolling hills, and proximity to Philadelphia. It’s part of Lower Merion Township and sits along the Schuylkill River, offering privacy without isolation.
Despite already sky-high values, prices continue to rise. Limited housing supply, historic significance, and high demand from buyers seeking prestige ensure that Gladwyne remains the gold standard in Pennsylvania real estate.