Home prices across North Carolina have reached unprecedented levels, with some communities seeing values that would make even coastal California residents take notice. According to data from the Zillow Home Value Index, the state’s most expensive towns showcase a remarkable range of luxury markets, from Outer Banks beach retreats to mountain hideaways in the Blue Ridge Mountains. These premium communities reflect North Carolina’s growing appeal to affluent buyers seeking everything from oceanfront estates to high-altitude sanctuaries.
The data reveals fascinating patterns in how North Carolina’s luxury real estate markets have evolved over the past decade and a half. Coastal communities dominate the upper tiers, but mountain towns and select suburban enclaves have carved out their own niches in the high-end market. What makes these places so expensive goes beyond simple supply and demand—factors like geographic constraints, recreational amenities, proximity to major metropolitan areas, and unique local character all contribute to their premium pricing.
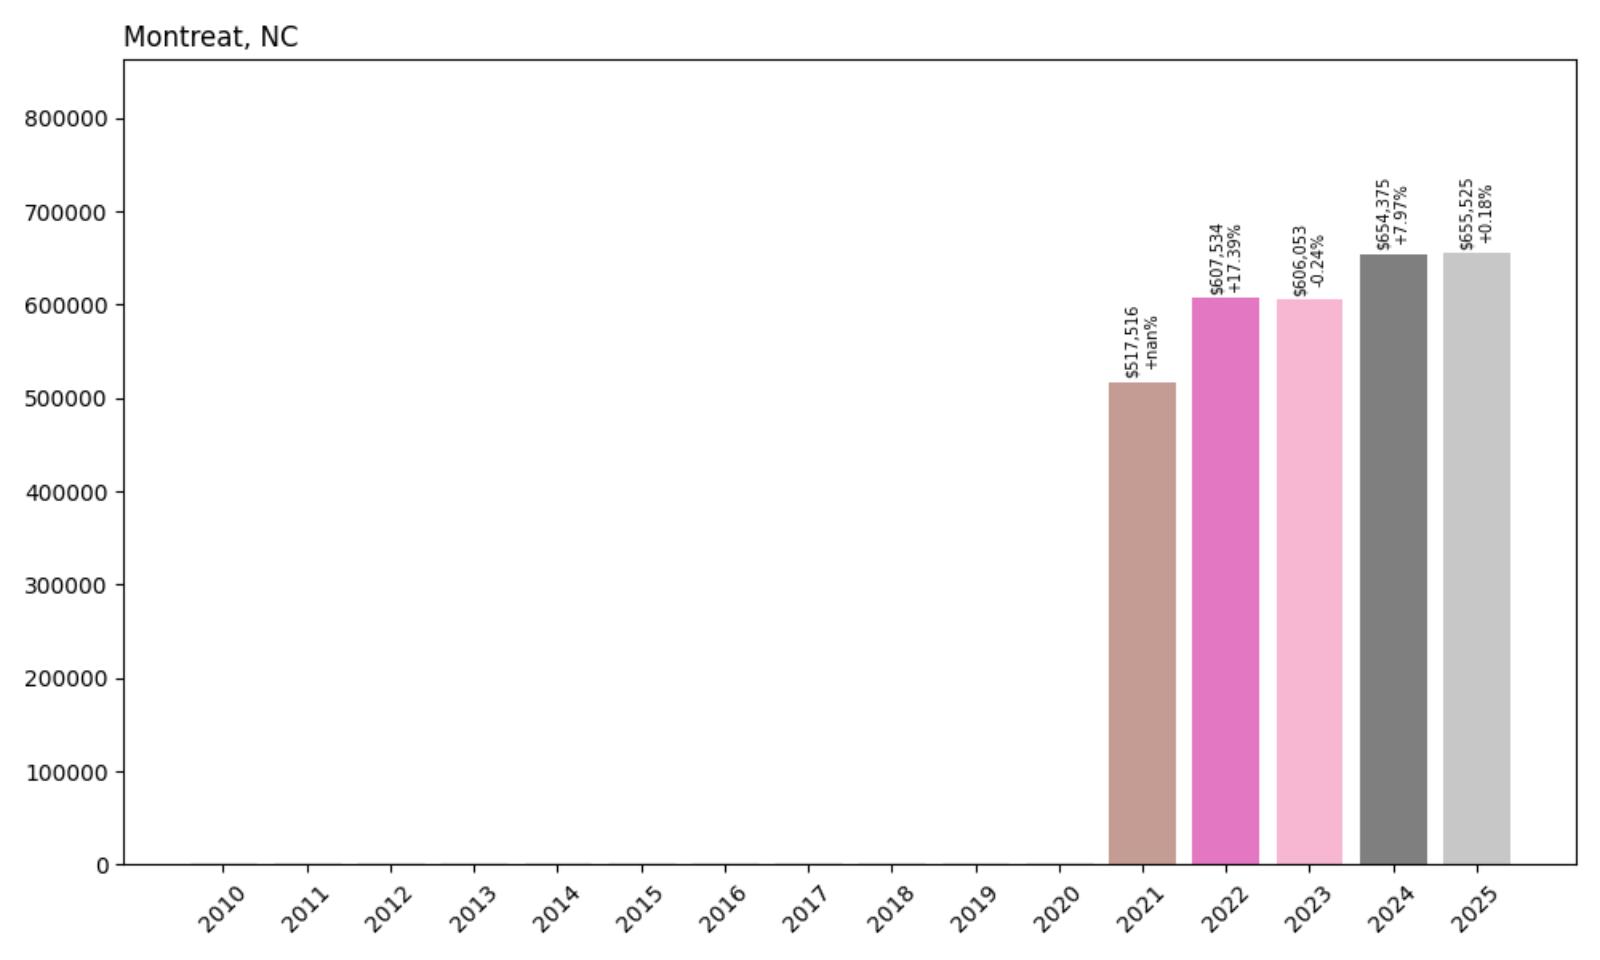
25. Montreat – 27% Home Price Increase Since 2021
- 2010: N/A
- 2011: N/A
- 2012: N/A
- 2013: N/A
- 2014: N/A
- 2015: N/A
- 2016: N/A
- 2017: N/A
- 2018: N/A
- 2019: N/A
- 2020: N/A
- 2021: $517,516
- 2022: $607,534 (+$90,018, +17.39% from previous year)
- 2023: $606,053 (−$1,481, −0.24% from previous year)
- 2024: $654,375 (+$48,322, +7.97% from previous year)
- 2025: $655,525 (+$1,150, +0.18% from previous year)
Montreat’s housing market shows steady growth since data became available in 2021, with current home values averaging $655,525. The town experienced its strongest price surge in 2022 with a 17% increase, followed by more modest but consistent growth through 2025. Despite some minor fluctuation in 2023, the overall trajectory demonstrates the community’s growing desirability among homebuyers seeking mountain living.
Montreat – Historic Mountain Retreat
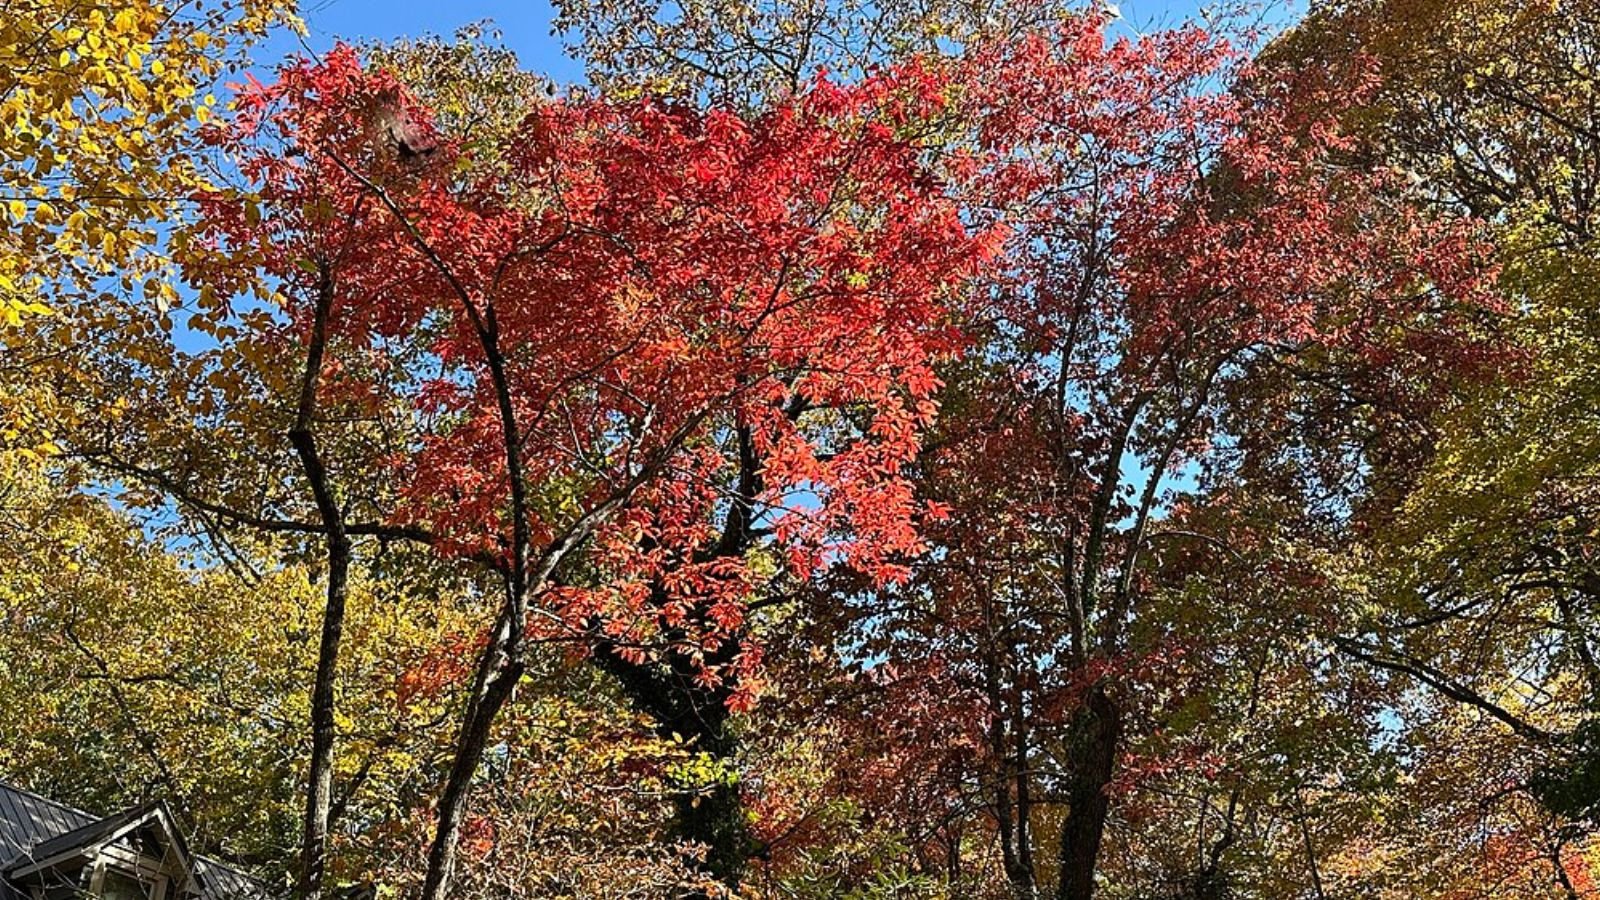
Nestled in the Blue Ridge Mountains just east of Asheville, Montreat stands as one of North Carolina’s most unique residential communities. This small town of fewer than 1,000 residents was founded in 1897 as a Christian conference center and has maintained its distinctive character as a planned community centered around Montreat College and the Montreat Conference Center. The town’s name, meaning “mountain retreat,” perfectly captures its essence as a peaceful sanctuary surrounded by the Pisgah National Forest.
Recent price appreciation reflects growing interest in Montreat’s combination of historical significance, natural beauty, and proximity to Asheville’s cultural amenities. The town’s limited housing inventory, combined with restrictions on new development that preserve its character, creates natural upward pressure on home values. Many properties here serve as second homes for affluent buyers drawn to the area’s spiritual heritage, educational institutions, and mountain recreational opportunities.
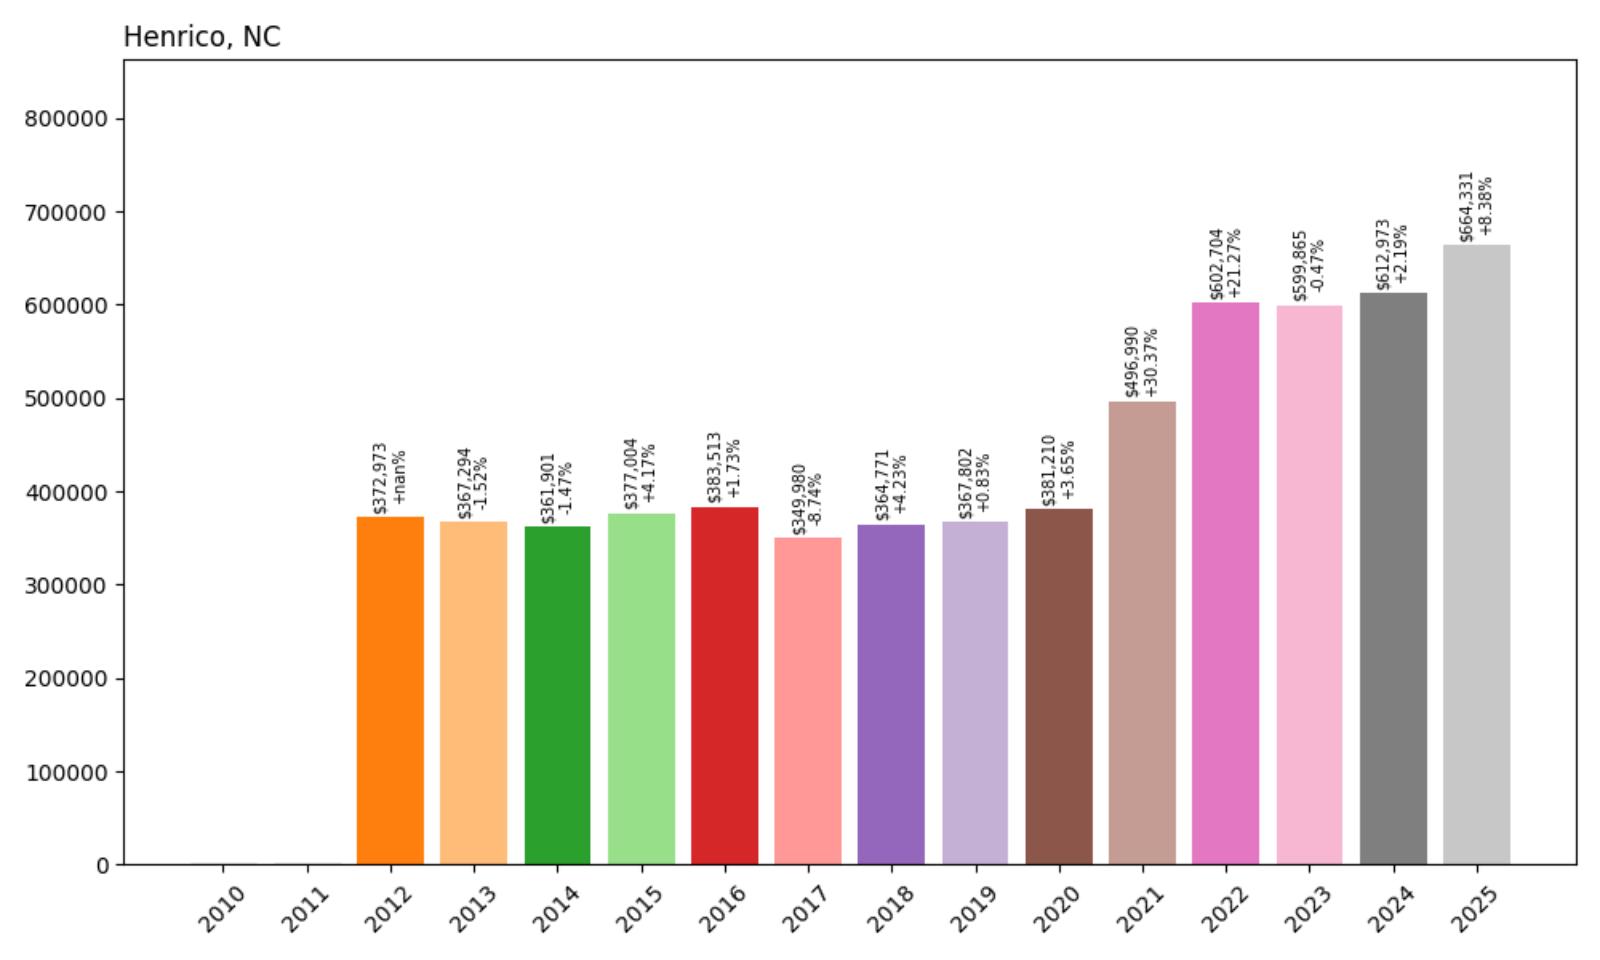
24. Henrico – 78% Home Price Increase Since 2012
- 2010: N/A
- 2011: N/A
- 2012: $372,973
- 2013: $367,294 (−$5,679, −1.52% from previous year)
- 2014: $361,901 (−$5,393, −1.47% from previous year)
- 2015: $377,004 (+$15,103, +4.17% from previous year)
- 2016: $383,513 (+$6,510, +1.73% from previous year)
- 2017: $349,980 (−$33,533, −8.74% from previous year)
- 2018: $364,771 (+$14,791, +4.23% from previous year)
- 2019: $367,802 (+$3,031, +0.83% from previous year)
- 2020: $381,210 (+$13,407, +3.65% from previous year)
- 2021: $496,990 (+$115,781, +30.37% from previous year)
- 2022: $602,704 (+$105,713, +21.27% from previous year)
- 2023: $599,865 (−$2,839, −0.47% from previous year)
- 2024: $612,973 (+$13,108, +2.19% from previous year)
- 2025: $664,331 (+$51,357, +8.38% from previous year)
Henrico’s housing market demonstrates remarkable resilience and growth, with current values at $664,331 representing a 78% increase since 2012. The town experienced some volatility in the mid-2010s, including a notable dip in 2017, but recovered strongly with explosive growth during the pandemic years. The 30% jump in 2021 followed by another 21% increase in 2022 reflects the broader national housing boom, while recent years show continued appreciation at a more sustainable pace.
Henrico – Coastal Community with Rural Charm
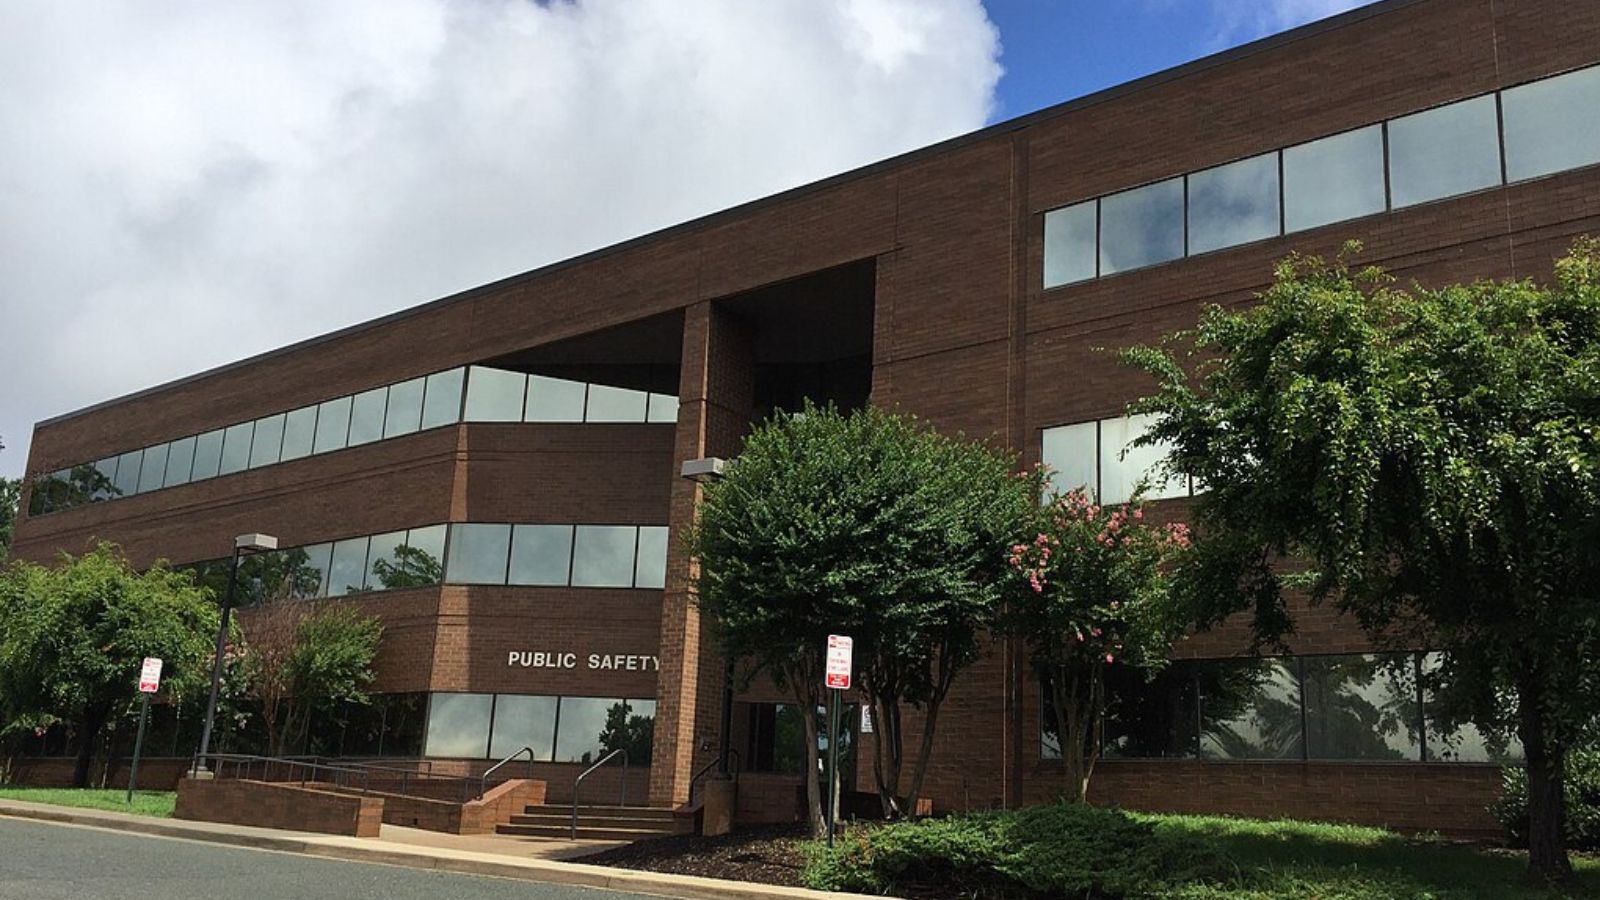
Located in Northampton County near the Virginia border, Henrico represents a unique blend of rural North Carolina charm and proximity to larger metropolitan areas. This small community benefits from its location along major transportation corridors while maintaining its agricultural roots and small-town character. The area’s economy has traditionally centered around farming, but residential development has increased as buyers seek affordable alternatives to more expensive coastal and urban markets.
The town’s housing market reflects broader demographic shifts in northeastern North Carolina, where remote work opportunities and lifestyle changes have drawn new residents seeking space and affordability. Henrico’s properties typically feature larger lots and traditional Southern architecture, appealing to buyers looking for room to spread out. The community’s location provides easy access to both the Outer Banks and the Hampton Roads area of Virginia, making it attractive to those who want coastal proximity without coastal prices.
23. Davidson – 115% Home Price Increase Since 2010
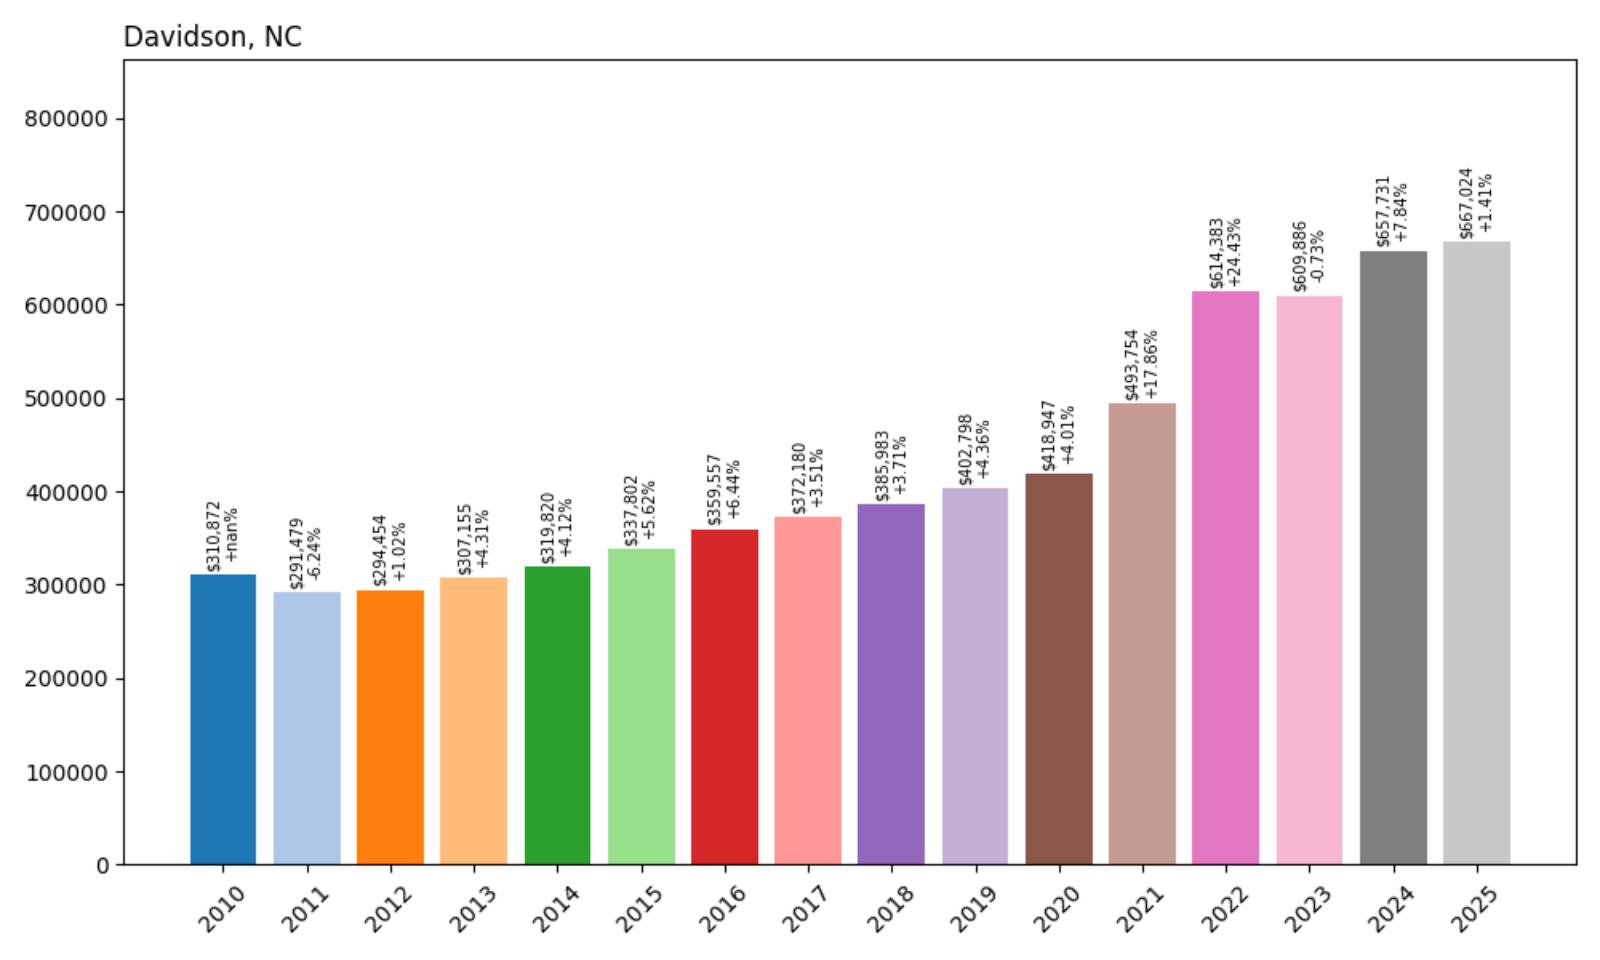
- 2010: $310,872
- 2011: $291,479 (−$19,393, −6.24% from previous year)
- 2012: $294,454 (+$2,975, +1.02% from previous year)
- 2013: $307,155 (+$12,701, +4.31% from previous year)
- 2014: $319,820 (+$12,664, +4.12% from previous year)
- 2015: $337,802 (+$17,982, +5.62% from previous year)
- 2016: $359,557 (+$21,755, +6.44% from previous year)
- 2017: $372,180 (+$12,624, +3.51% from previous year)
- 2018: $385,983 (+$13,802, +3.71% from previous year)
- 2019: $402,798 (+$16,816, +4.36% from previous year)
- 2020: $418,947 (+$16,149, +4.01% from previous year)
- 2021: $493,754 (+$74,807, +17.86% from previous year)
- 2022: $614,383 (+$120,629, +24.43% from previous year)
- 2023: $609,886 (−$4,497, −0.73% from previous year)
- 2024: $657,731 (+$47,845, +7.84% from previous year)
- 2025: $667,024 (+$9,293, +1.41% from previous year)
Davidson’s housing market showcases steady, consistent growth over 15 years, with current home values at $667,024 representing a remarkable 115% increase since 2010. After recovering from the early 2010s housing downturn, the town experienced steady appreciation through the decade, followed by accelerated growth during 2021-2022. The market has since stabilized at current levels, demonstrating the community’s sustained desirability and strong fundamentals.
Davidson – College Town Excellence
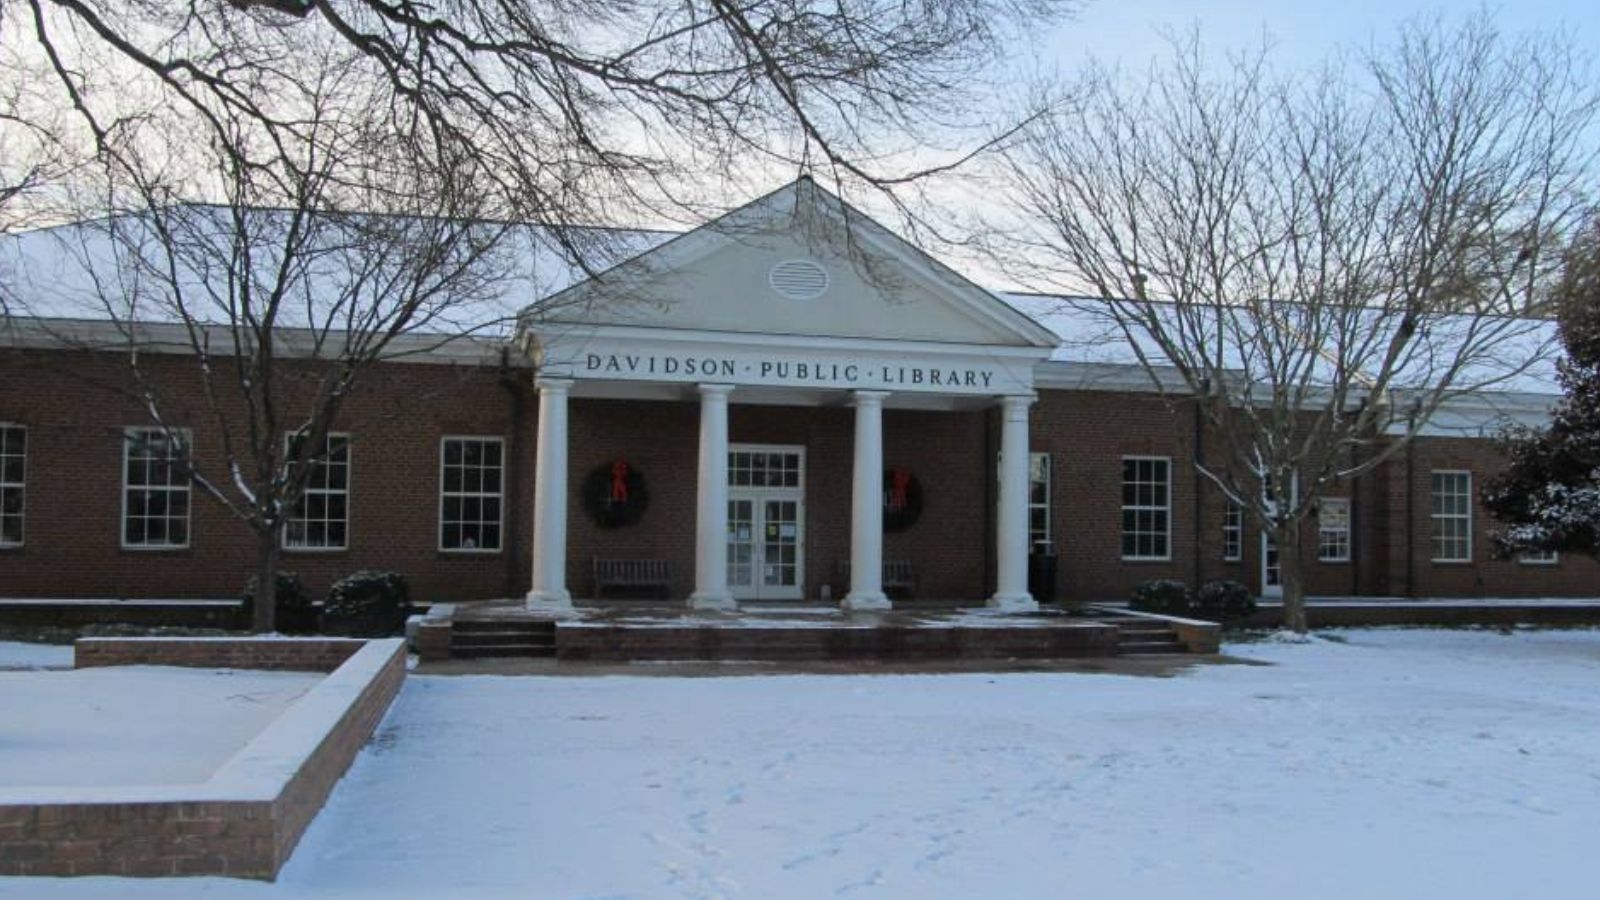
Davidson stands as one of North Carolina’s premier college towns, home to prestigious Davidson College and located just 30 minutes north of Charlotte. This charming community of approximately 13,000 residents successfully balances small-town atmosphere with sophisticated amenities, creating a highly desirable residential market. The town’s historic downtown features tree-lined streets, local boutiques, and restaurants that cater to both college families and permanent residents seeking a refined lifestyle with urban accessibility.
Davidson’s remarkable price growth reflects its evolution from a sleepy college town to a sought-after suburban community within Charlotte’s expanding metropolitan area. The town successfully attracted young professionals and families seeking alternatives to urban living while maintaining easy commuter access to Charlotte’s business district. This demographic shift, combined with limited housing inventory due to geographic constraints and development restrictions, has sustained upward pressure on home prices throughout the market cycle.
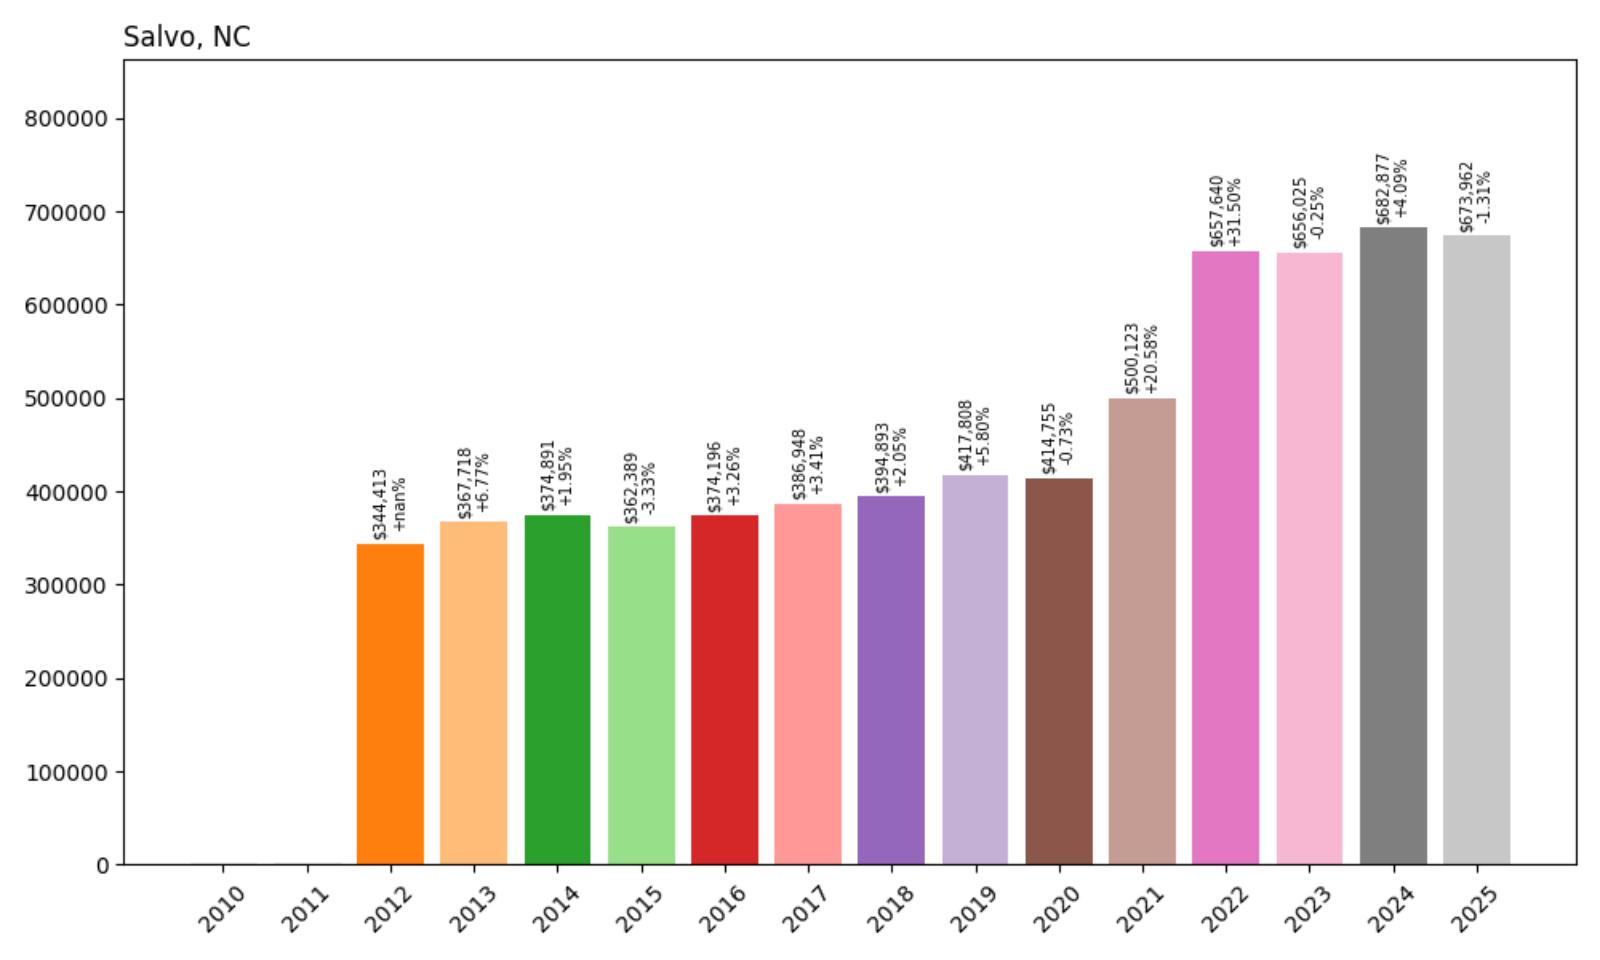
22. Salvo – 96% Home Price Increase Since 2012
- 2010: N/A
- 2011: N/A
- 2012: $344,413
- 2013: $367,718 (+$23,304, +6.77% from previous year)
- 2014: $374,891 (+$7,173, +1.95% from previous year)
- 2015: $362,389 (−$12,501, −3.33% from previous year)
- 2016: $374,196 (+$11,807, +3.26% from previous year)
- 2017: $386,948 (+$12,751, +3.41% from previous year)
- 2018: $394,893 (+$7,945, +2.05% from previous year)
- 2019: $417,808 (+$22,916, +5.80% from previous year)
- 2020: $414,755 (−$3,054, −0.73% from previous year)
- 2021: $500,123 (+$85,369, +20.58% from previous year)
- 2022: $657,640 (+$157,517, +31.50% from previous year)
- 2023: $656,025 (−$1,615, −0.25% from previous year)
- 2024: $682,877 (+$26,851, +4.09% from previous year)
- 2025: $673,962 (−$8,915, −1.31% from previous year)
Salvo’s housing market demonstrates the volatility typical of Outer Banks communities, with current home values at $673,962 representing a 96% increase since 2012. The town showed steady but modest growth through the 2010s before experiencing dramatic appreciation during the pandemic years, with back-to-back increases of 20.6% and 31.5% in 2021-2022. Recent years show some market cooling, with slight decreases in 2025, reflecting broader trends in coastal vacation home markets.
Salvo – Outer Banks Serenity
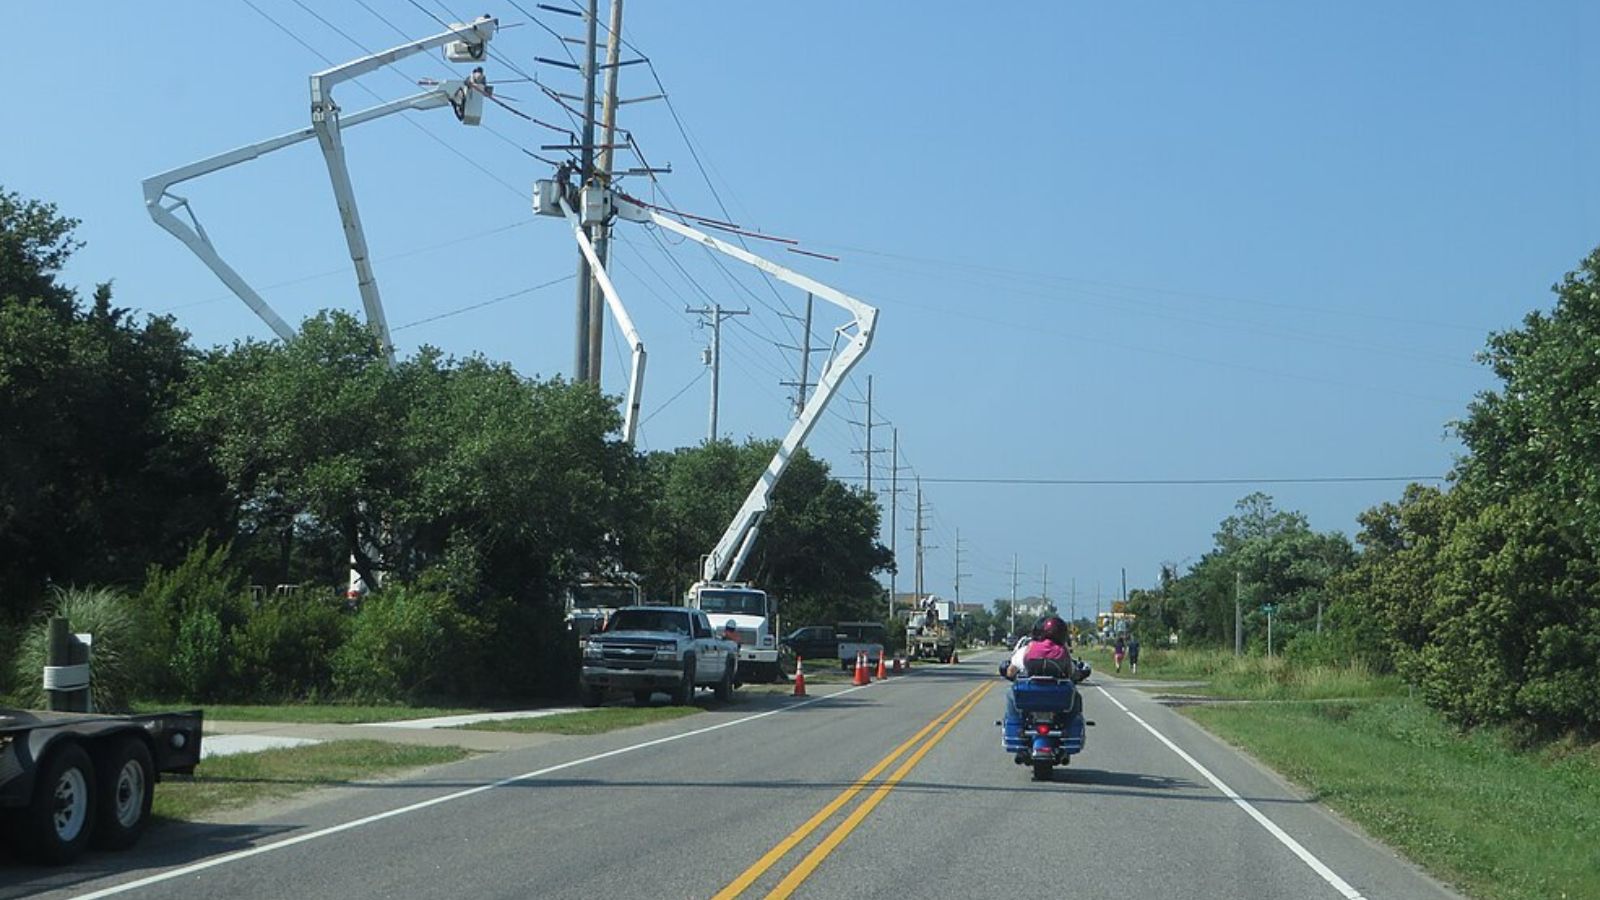
Salvo occupies a unique position on Hatteras Island as one of the smaller and more secluded villages along the Outer Banks. This unincorporated community sits between the more developed areas of Waves to the north and Avon to the south, offering residents and visitors a quieter alternative to busier beach destinations. The village maintains much of its original character as a fishing community while adapting to modern tourism and second-home markets that drive much of the local economy.
Salvo’s dramatic price appreciation reflects the broader Outer Banks phenomenon where pandemic-era demand for vacation homes and remote work opportunities created unprecedented buyer competition. The village’s relatively small inventory of properties, combined with its reputation for excellent fishing and surfing conditions, has made it particularly attractive to affluent buyers seeking exclusive coastal retreats. Current market conditions suggest some normalization after the extreme growth of recent years, but the area’s fundamental appeal remains strong.
21. New Hill – 160% Home Price Increase Since 2010
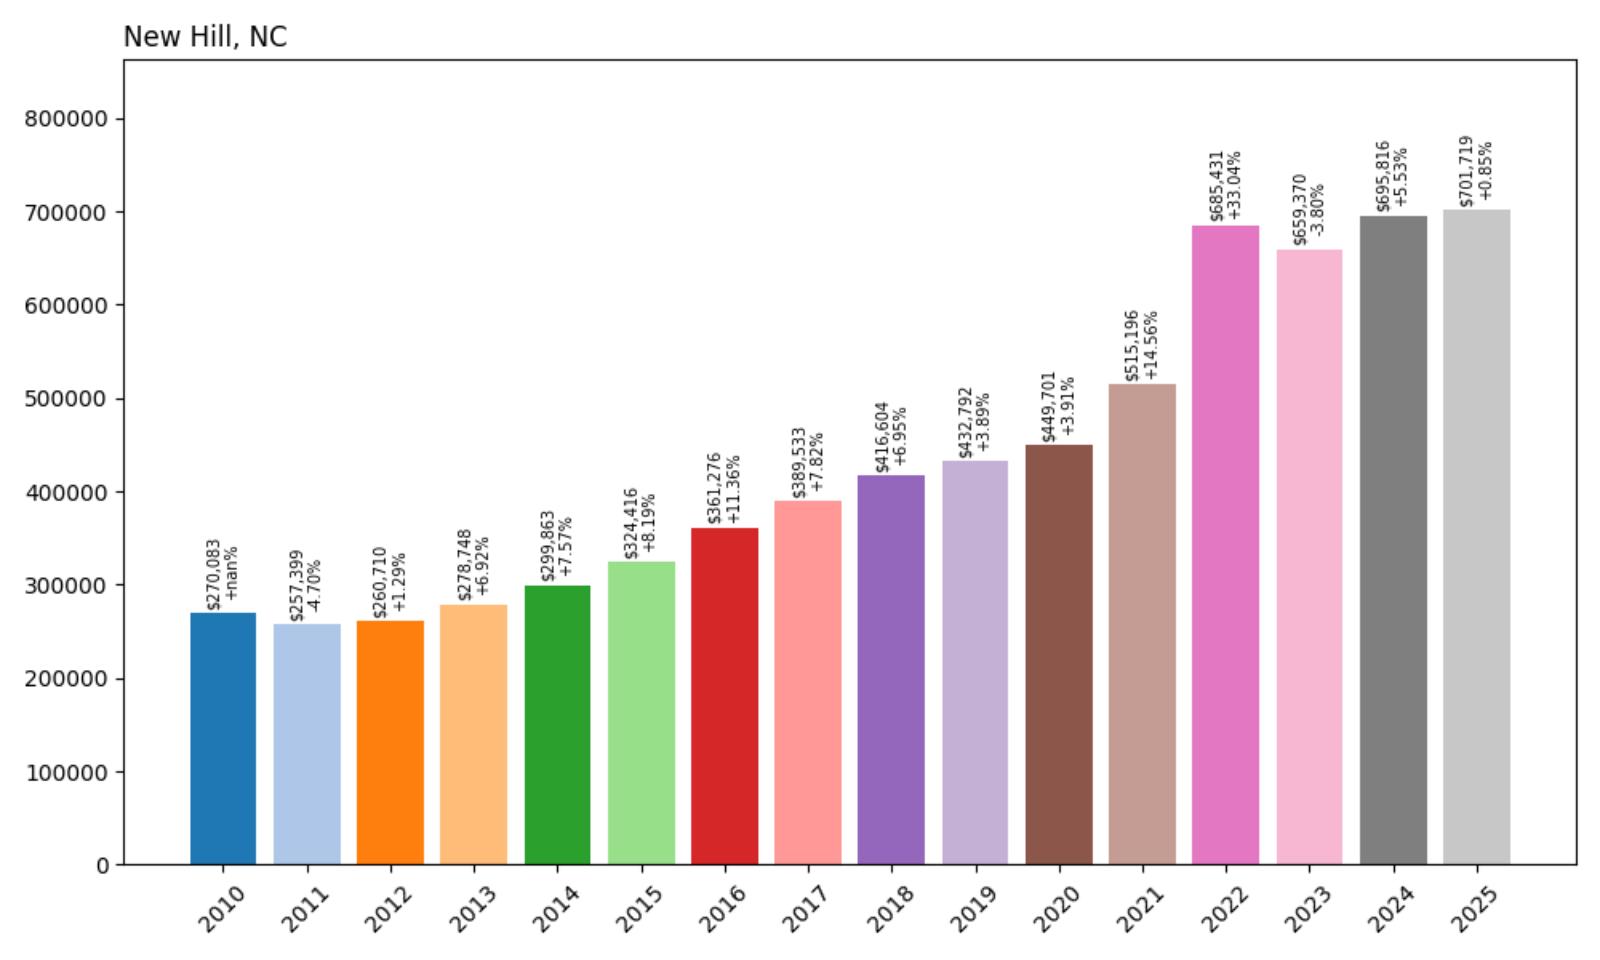
- 2010: $270,083
- 2011: $257,399 (−$12,684, −4.70% from previous year)
- 2012: $260,710 (+$3,311, +1.29% from previous year)
- 2013: $278,748 (+$18,037, +6.92% from previous year)
- 2014: $299,863 (+$21,115, +7.57% from previous year)
- 2015: $324,416 (+$24,553, +8.19% from previous year)
- 2016: $361,276 (+$36,860, +11.36% from previous year)
- 2017: $389,533 (+$28,258, +7.82% from previous year)
- 2018: $416,604 (+$27,071, +6.95% from previous year)
- 2019: $432,792 (+$16,188, +3.89% from previous year)
- 2020: $449,701 (+$16,909, +3.91% from previous year)
- 2021: $515,196 (+$65,495, +14.56% from previous year)
- 2022: $685,431 (+$170,234, +33.04% from previous year)
- 2023: $659,370 (−$26,061, −3.80% from previous year)
- 2024: $695,816 (+$36,446, +5.53% from previous year)
- 2025: $701,719 (+$5,903, +0.85% from previous year)
New Hill’s housing market represents one of the most dramatic success stories in North Carolina real estate, with current home values at $701,719 marking a spectacular 160% increase since 2010. The community experienced consistent strong growth throughout the 2010s, with particularly robust appreciation from 2014-2018. The pandemic housing boom brought explosive growth in 2022 with a 33% increase, and despite some volatility, values have continued climbing to current record levels.
New Hill – Suburban Growth Engine
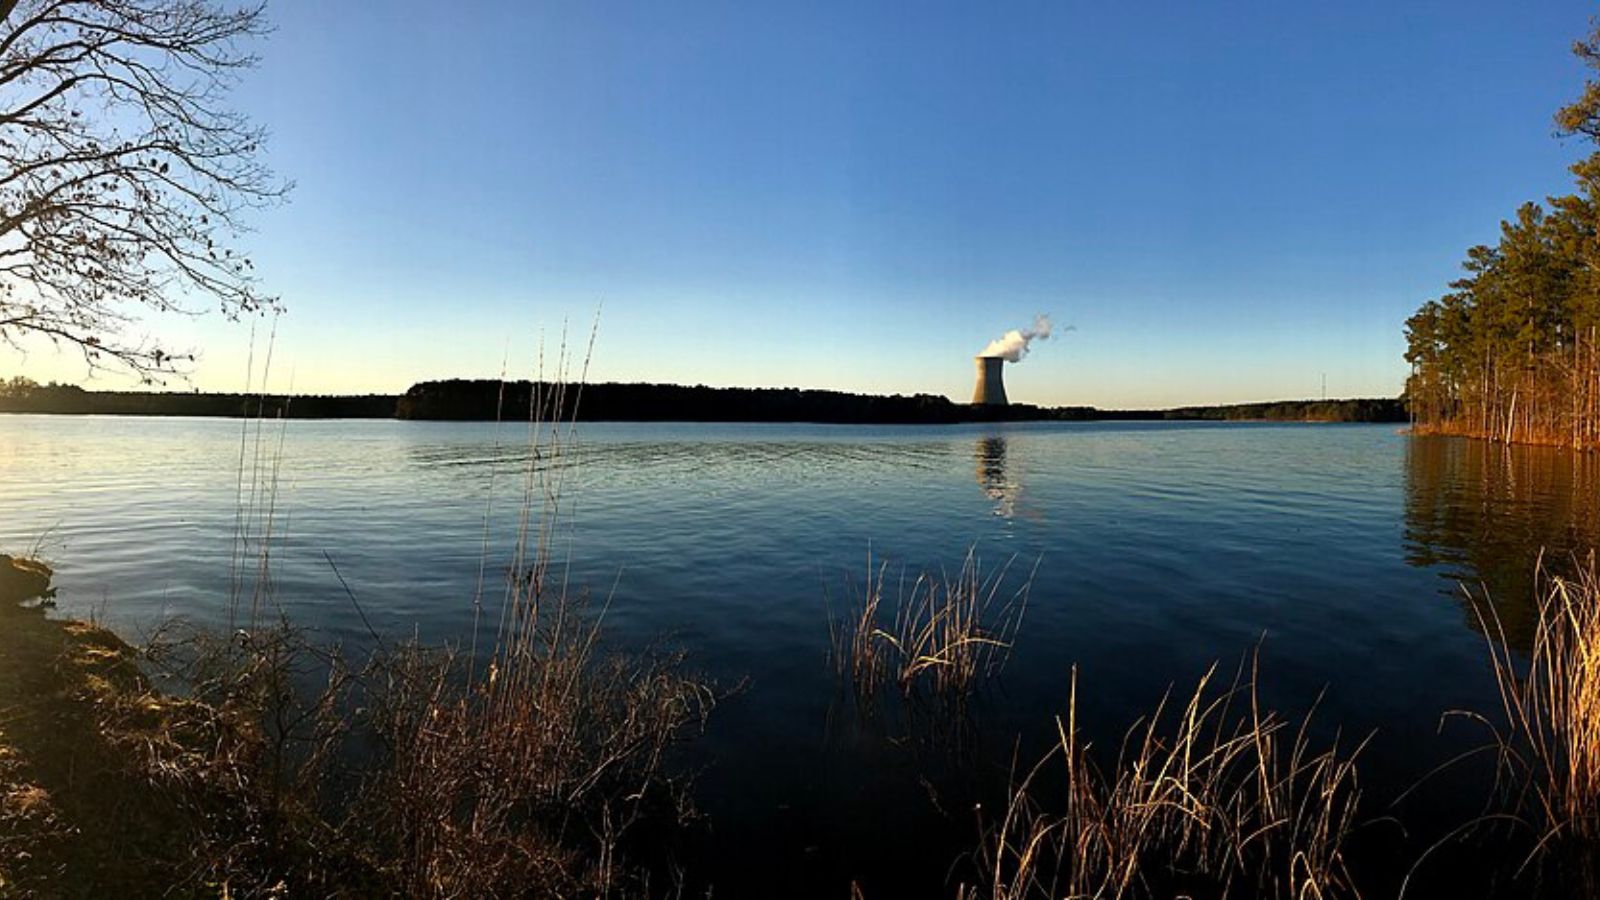
New Hill sits strategically in Wake County, positioned between the expanding Research Triangle metropolitan area and the rural communities of central North Carolina. This unincorporated community has become increasingly attractive to families and professionals seeking suburban living with reasonable commutes to Raleigh, Durham, and Chapel Hill. The area’s rolling hills and mature forests provide a scenic backdrop for residential development, while maintaining the spacious feel that draws buyers away from more densely populated urban areas.
The community’s housing stock consists primarily of newer suburban developments featuring large single-family homes on generous lots. Many properties in New Hill offer modern amenities and architectural styles that appeal to affluent buyers, while the area’s zoning allows for the kind of spacious lots that are increasingly rare closer to urban centers. The presence of good schools and proximity to major employment centers in the Research Triangle have made New Hill particularly popular with families seeking high-quality suburban living.
20. Pine Knoll Shores – 96% Home Price Increase Since 2010
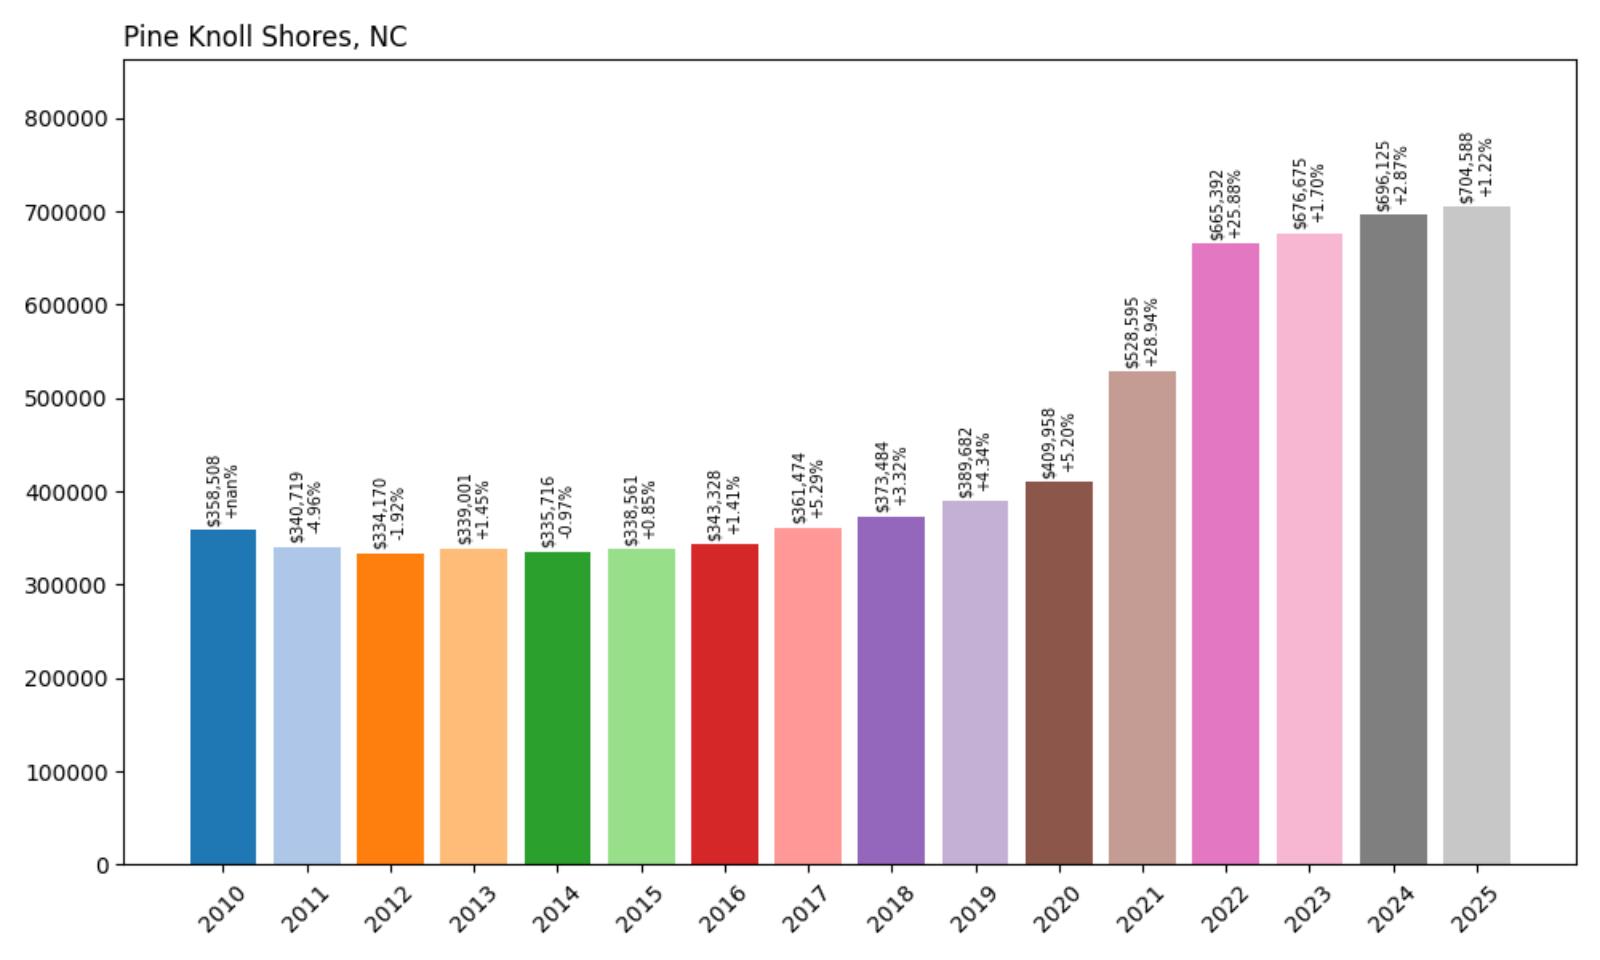
- 2010: $358,508
- 2011: $340,719 (−$17,789, −4.96% from previous year)
- 2012: $334,170 (−$6,549, −1.92% from previous year)
- 2013: $339,001 (+$4,832, +1.45% from previous year)
- 2014: $335,716 (−$3,285, −0.97% from previous year)
- 2015: $338,561 (+$2,845, +0.85% from previous year)
- 2016: $343,328 (+$4,766, +1.41% from previous year)
- 2017: $361,474 (+$18,147, +5.29% from previous year)
- 2018: $373,484 (+$12,010, +3.32% from previous year)
- 2019: $389,682 (+$16,198, +4.34% from previous year)
- 2020: $409,958 (+$20,276, +5.20% from previous year)
- 2021: $528,595 (+$118,638, +28.94% from previous year)
- 2022: $665,392 (+$136,796, +25.88% from previous year)
- 2023: $676,675 (+$11,284, +1.70% from previous year)
- 2024: $696,125 (+$19,450, +2.87% from previous year)
- 2025: $704,588 (+$8,464, +1.22% from previous year)
Pine Knoll Shores demonstrates the classic coastal recovery pattern, with current home values at $704,588 representing a 96% increase since 2010. After struggling through the early 2010s with minimal growth, the town found its footing around 2017 and began steady appreciation. The pandemic years brought dramatic increases of nearly 29% and 26% in consecutive years, followed by more moderate but consistent growth that continues through 2025.
Pine Knoll Shores – Crystal Coast Elegance
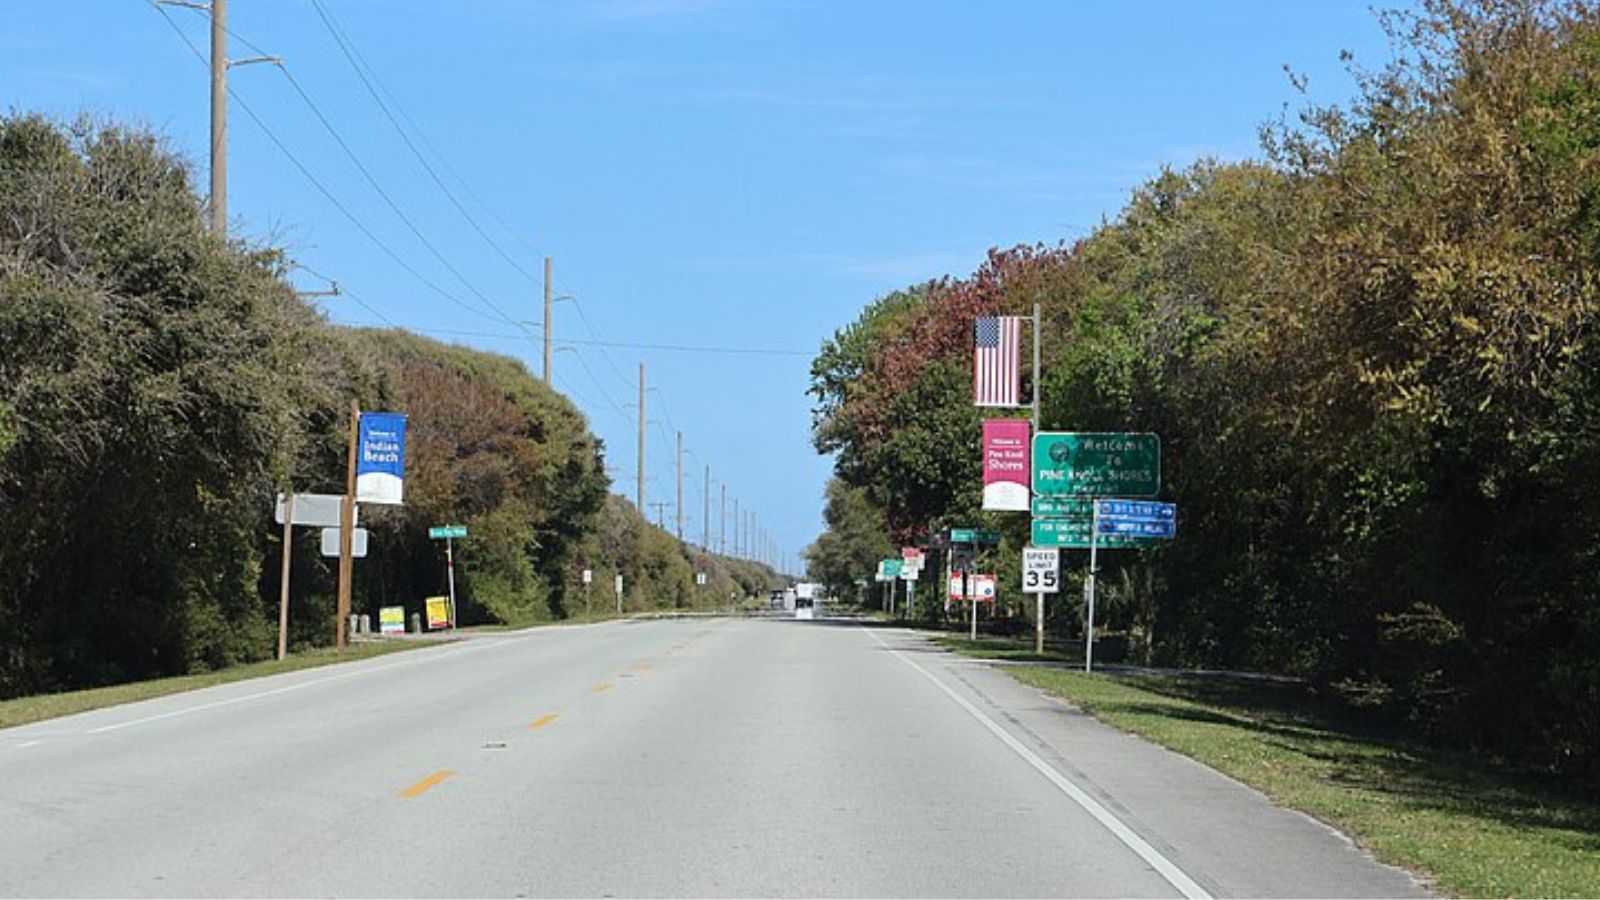
Pine Knoll Shores stands as one of the most refined residential communities along North Carolina’s Crystal Coast, occupying a barrier island location that offers both ocean and sound frontage. This incorporated town of fewer than 1,500 residents maintains strict development standards that preserve its natural beauty while supporting high property values. The community features a mix of year-round residents and second-home owners who appreciate its combination of pristine beaches, maritime forests, and upscale amenities.
Recent price appreciation in Pine Knoll Shores reflects growing recognition of its premium position within the Crystal Coast market. The town’s combination of environmental protection, architectural standards, and limited development opportunities creates natural scarcity that supports property values. Current market conditions show the community has successfully transitioned from a regional vacation destination to a nationally recognized luxury market, attracting buyers from major metropolitan areas seeking high-end coastal living.
19. Saint James – 79% Home Price Increase Since 2010
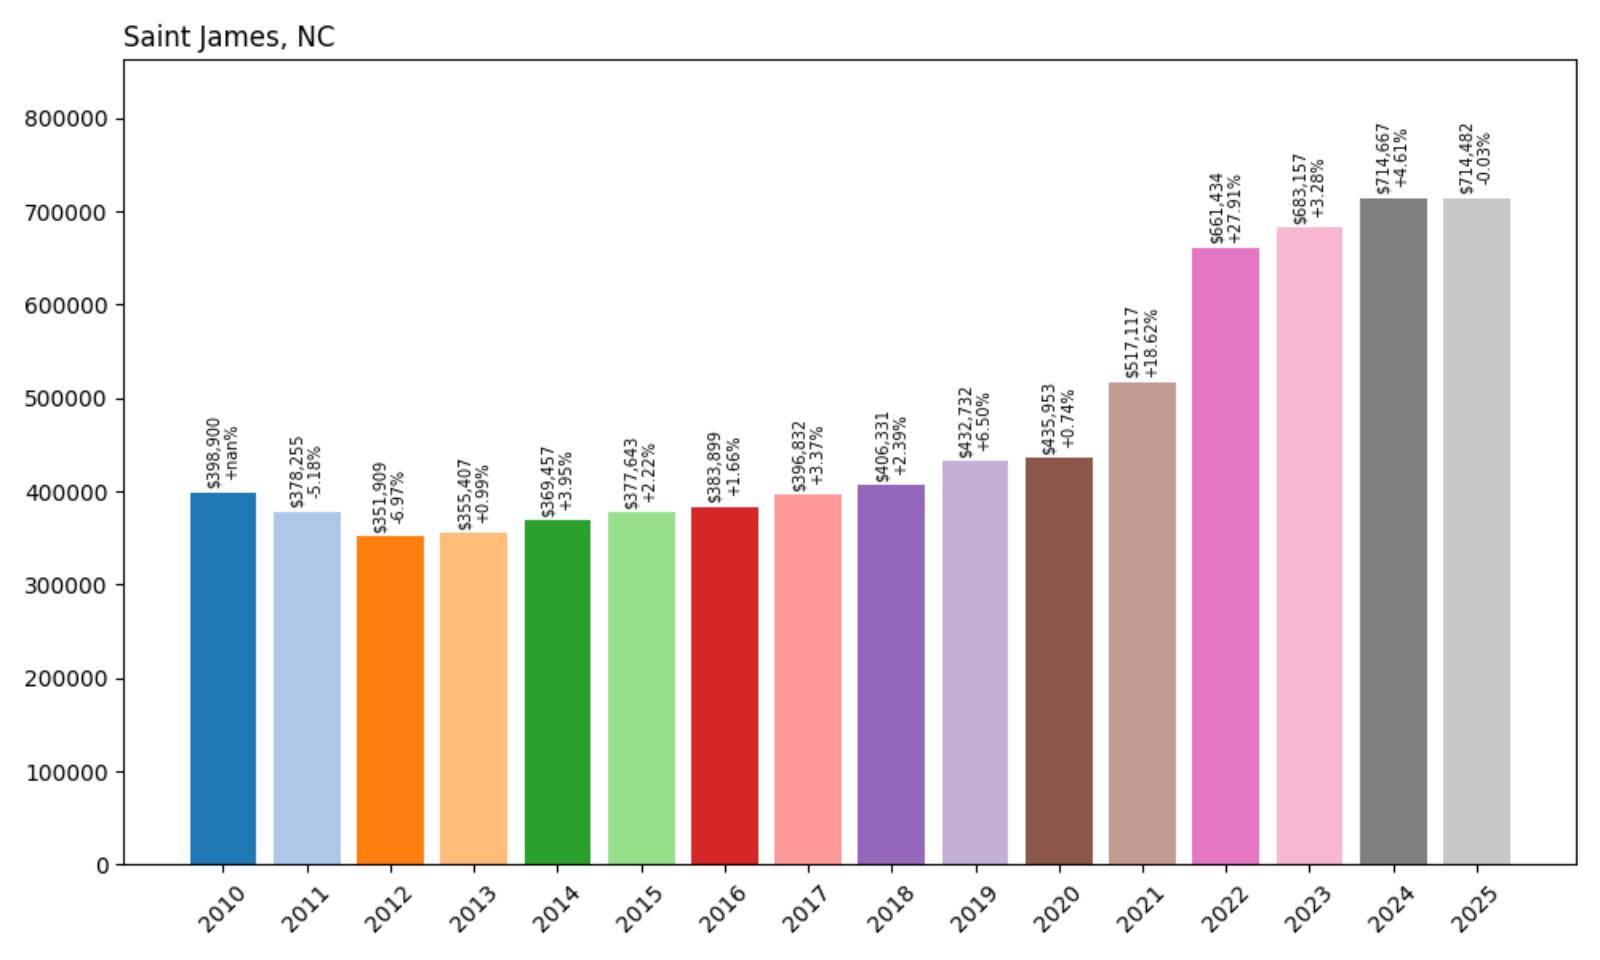
- 2010: $398,900
- 2011: $378,255 (−$20,645, −5.18% from previous year)
- 2012: $351,909 (−$26,346, −6.97% from previous year)
- 2013: $355,407 (+$3,498, +0.99% from previous year)
- 2014: $369,457 (+$14,050, +3.95% from previous year)
- 2015: $377,643 (+$8,186, +2.22% from previous year)
- 2016: $383,899 (+$6,256, +1.66% from previous year)
- 2017: $396,832 (+$12,932, +3.37% from previous year)
- 2018: $406,331 (+$9,499, +2.39% from previous year)
- 2019: $432,732 (+$26,401, +6.50% from previous year)
- 2020: $435,953 (+$3,221, +0.74% from previous year)
- 2021: $517,117 (+$81,164, +18.62% from previous year)
- 2022: $661,434 (+$144,317, +27.91% from previous year)
- 2023: $683,157 (+$21,723, +3.28% from previous year)
- 2024: $714,667 (+$31,510, +4.61% from previous year)
- 2025: $714,482 (−$185, −0.03% from previous year)
Saint James shows a steady recovery and growth pattern, with current home values at $714,482 representing a 79% increase since 2010. After weathering the post-recession downturn through 2012, the community experienced consistent moderate growth through the decade. The pandemic housing boom brought substantial increases, with back-to-back years of 18.6% and 27.9% growth, before stabilizing at current levels with essentially flat pricing in 2025.
Saint James – Plantation Community Luxury
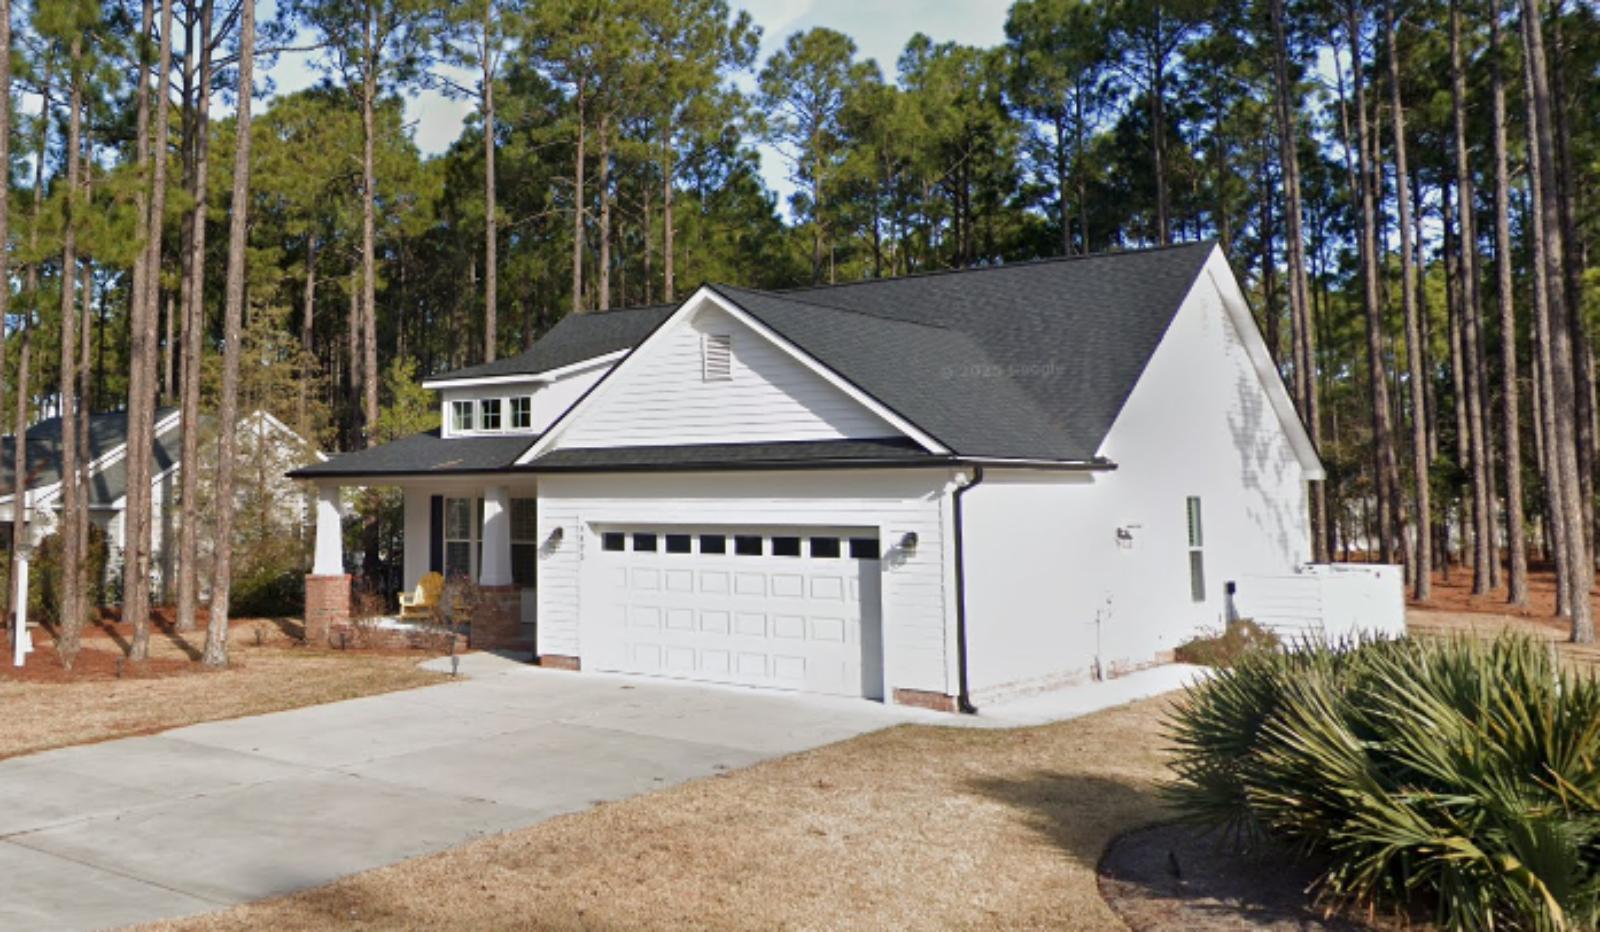
Saint James represents one of southeastern North Carolina’s premier planned communities, located in Brunswick County near the South Carolina border. This master-planned development spans over 10,000 acres and features multiple golf courses, extensive recreational facilities, and neighborhoods designed around different lifestyle preferences. The community attracts both retirees and active families seeking resort-style amenities with the convenience of proximity to Wilmington and coastal attractions.
The housing market in Saint James benefits from its comprehensive approach to community development, offering everything from condominiums and townhomes to custom estate properties. The presence of championship golf courses designed by renowned architects, along with tennis facilities, swimming pools, and fitness centers, creates a country club atmosphere that justifies premium pricing. The community’s location provides easy access to beaches, while its inland position offers protection from coastal weather concerns that affect oceanfront properties.
18. Lake Toxaway – 133% Home Price Increase Since 2010
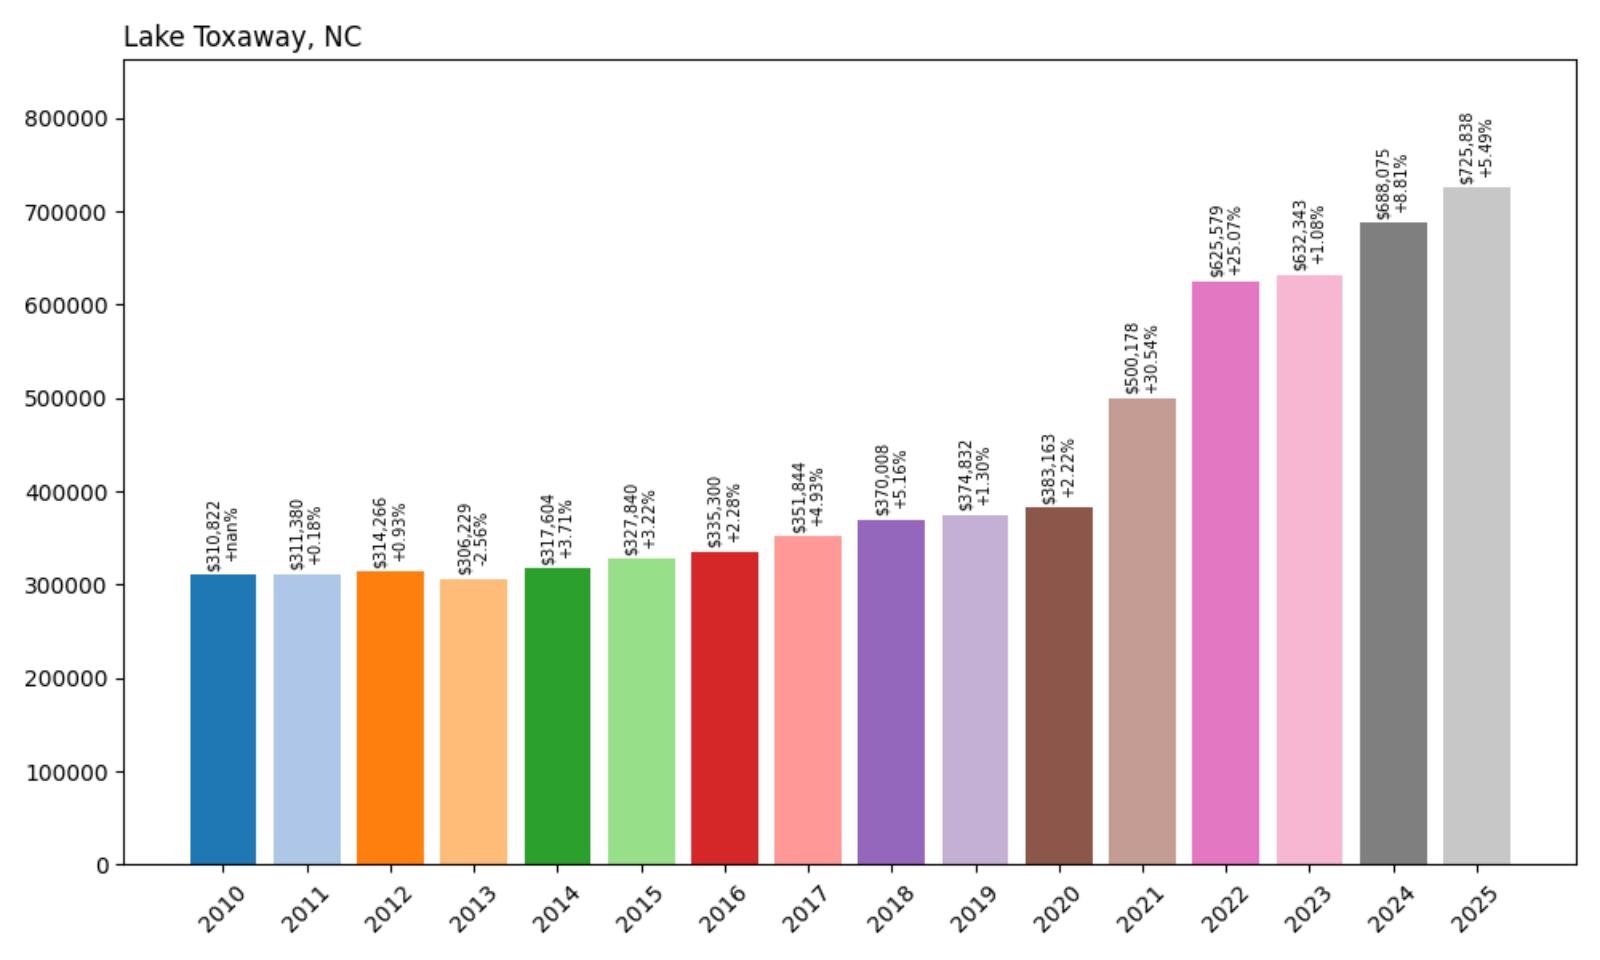
- 2010: $310,822
- 2011: $311,380 (+$558, +0.18% from previous year)
- 2012: $314,266 (+$2,886, +0.93% from previous year)
- 2013: $306,229 (−$8,037, −2.56% from previous year)
- 2014: $317,604 (+$11,375, +3.71% from previous year)
- 2015: $327,840 (+$10,237, +3.22% from previous year)
- 2016: $335,300 (+$7,460, +2.28% from previous year)
- 2017: $351,844 (+$16,543, +4.93% from previous year)
- 2018: $370,008 (+$18,165, +5.16% from previous year)
- 2019: $374,832 (+$4,824, +1.30% from previous year)
- 2020: $383,163 (+$8,331, +2.22% from previous year)
- 2021: $500,178 (+$117,016, +30.54% from previous year)
- 2022: $625,579 (+$125,401, +25.07% from previous year)
- 2023: $632,343 (+$6,764, +1.08% from previous year)
- 2024: $688,075 (+$55,732, +8.81% from previous year)
- 2025: $725,838 (+$37,763, +5.49% from previous year)
Lake Toxaway’s housing market displays remarkable consistency and growth, with current home values at $725,838 representing a substantial 133% increase since 2010. The community showed steady, modest appreciation through the 2010s before experiencing dramatic pandemic-era growth with increases of 30.5% and 25% in consecutive years. Recent years demonstrate continued strong appreciation, with significant gains of 8.8% and 5.5% in 2024-2025, suggesting sustained market strength.
Lake Toxaway – Mountain Lake Paradise

Lake Toxaway claims the distinction of being North Carolina’s largest private lake, spanning 640 acres in the heart of the Blue Ridge Mountains near the South Carolina border. This exclusive community has served as a mountain retreat for wealthy families since the early 1900s, when it was originally developed as a luxury resort destination. Today, Lake Toxaway maintains its reputation as one of the most prestigious addresses in the Southern Appalachians, offering residents a unique combination of mountain scenery and lakefront living.
Lake Toxaway’s impressive price appreciation reflects growing demand for luxury mountain properties, particularly those offering water access and recreational amenities. The community’s limited inventory of lakefront properties, combined with strict environmental and architectural standards, creates natural scarcity that supports premium pricing. Recent market strength demonstrates Lake Toxaway’s evolution from a regional mountain retreat to a nationally recognized luxury destination attracting affluent buyers seeking exclusive mountain lake living.
17. Nags Head – 90% Home Price Increase Since 2010
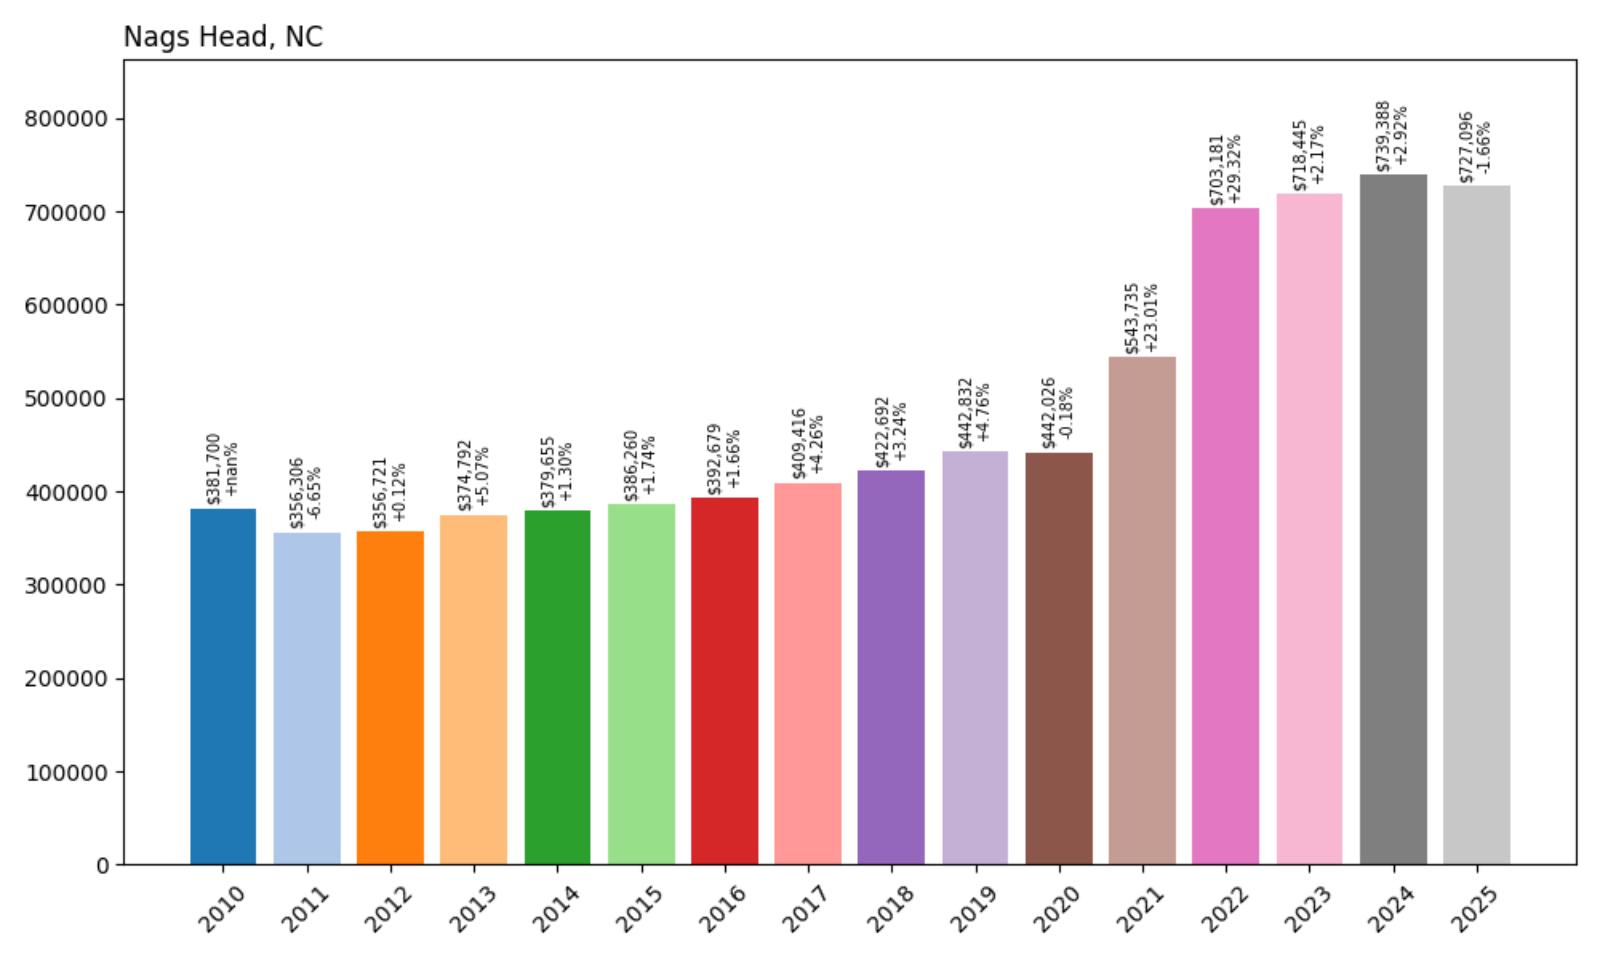
- 2010: $381,700
- 2011: $356,306 (−$25,393, −6.65% from previous year)
- 2012: $356,721 (+$415, +0.12% from previous year)
- 2013: $374,792 (+$18,071, +5.07% from previous year)
- 2014: $379,655 (+$4,863, +1.30% from previous year)
- 2015: $386,260 (+$6,605, +1.74% from previous year)
- 2016: $392,679 (+$6,419, +1.66% from previous year)
- 2017: $409,416 (+$16,738, +4.26% from previous year)
- 2018: $422,692 (+$13,275, +3.24% from previous year)
- 2019: $442,832 (+$20,140, +4.76% from previous year)
- 2020: $442,026 (−$806, −0.18% from previous year)
- 2021: $543,735 (+$101,710, +23.01% from previous year)
- 2022: $703,181 (+$159,445, +29.32% from previous year)
- 2023: $718,445 (+$15,264, +2.17% from previous year)
- 2024: $739,388 (+$20,943, +2.92% from previous year)
- 2025: $727,096 (−$12,291, −1.66% from previous year)
Nags Head’s housing market reflects the typical Outer Banks pattern of steady recovery followed by explosive pandemic-era growth, with current home values at $727,096 representing a 90% increase since 2010. After modest growth through the 2010s, the community experienced dramatic appreciation with consecutive increases of 23% and 29% in 2021-2022. Recent years show some market cooling with a slight decline in 2025, suggesting a return to more normalized pricing patterns after the exceptional growth period.
Nags Head – Outer Banks Icon
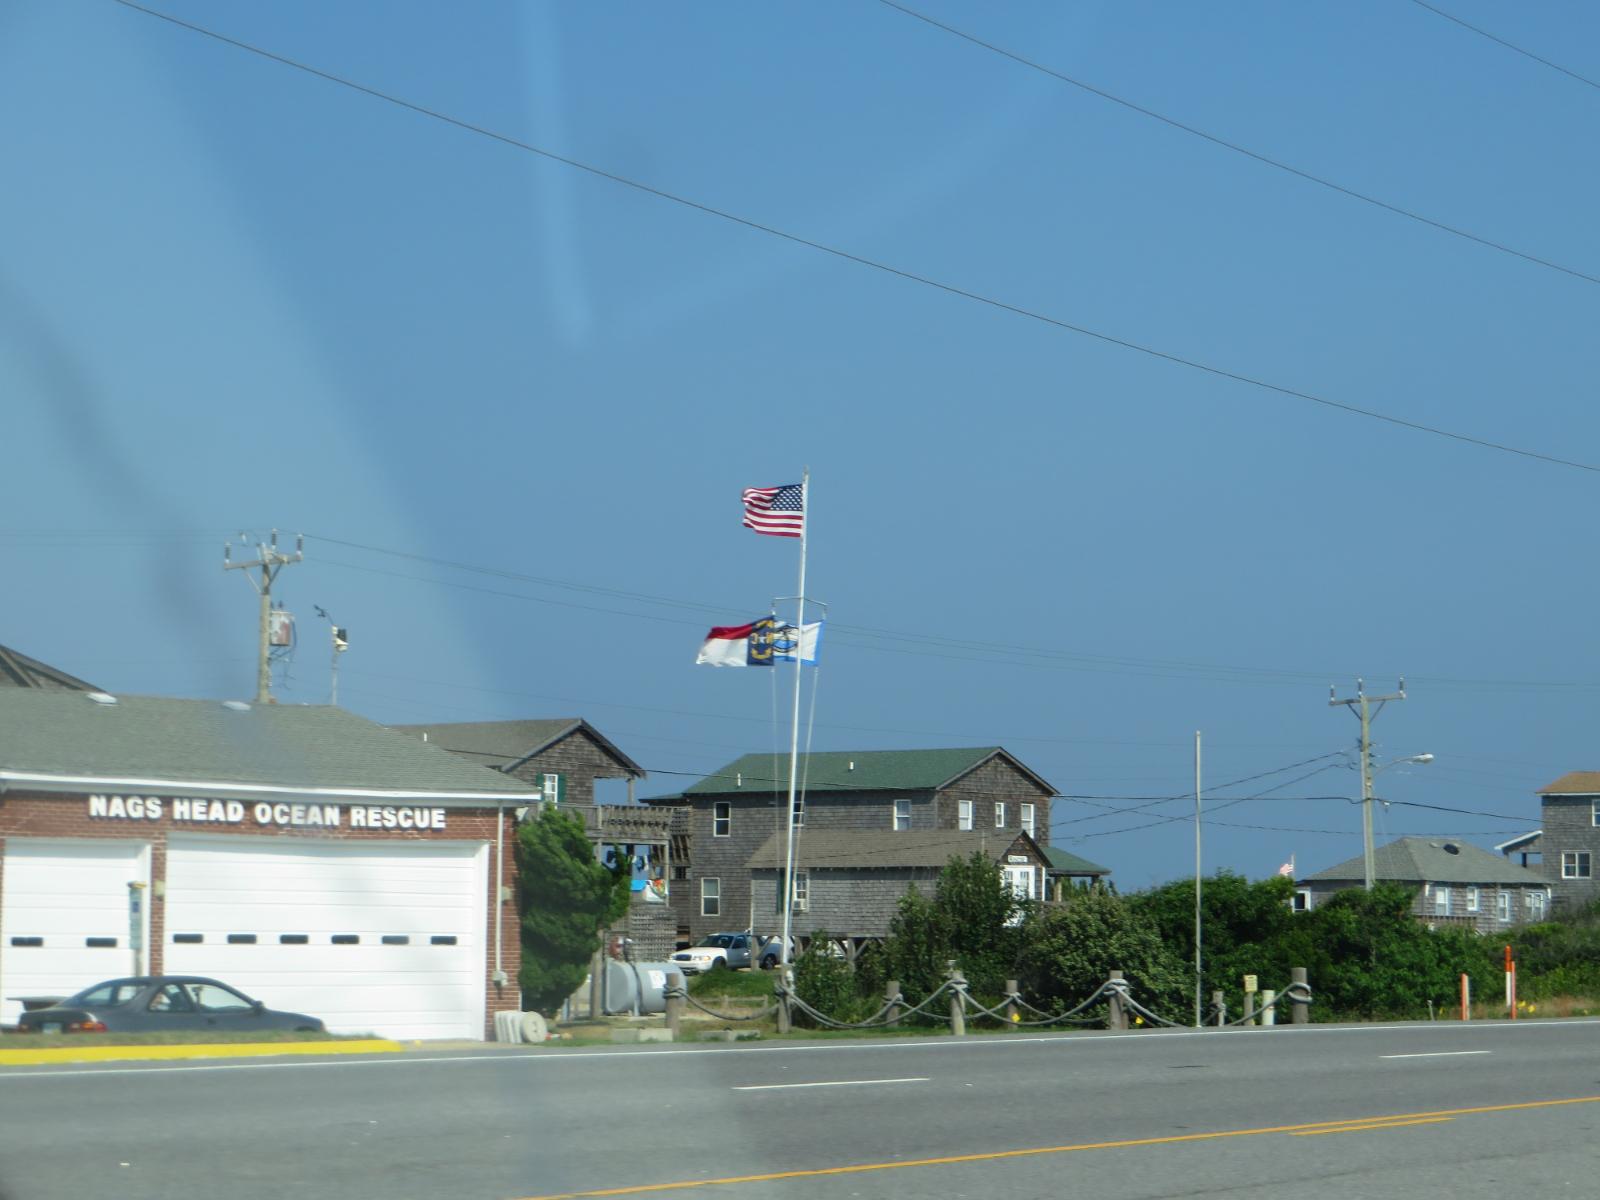
Nags Head stands as one of the most recognizable names along the Outer Banks, serving as both a historic landmark and a thriving beach community. This barrier island town has been welcoming visitors since the 1830s and has evolved into one of North Carolina’s premier beach destinations. The community successfully balances its role as a tourist destination with residential neighborhoods that attract both year-round residents and second-home owners seeking classic Outer Banks living.
The town’s housing market benefits from its central location on the Outer Banks, providing easy access to both the Wright Brothers National Memorial and Cape Hatteras National Seashore. Properties range from modest beach cottages to expansive oceanfront estates, with many homes designed to accommodate both family living and vacation rental income. Nags Head’s well-established infrastructure, including restaurants, shopping, and recreational facilities, adds value for residents while supporting the tourism economy that drives much of the local market.
16. Emerald Isle – 85% Home Price Increase Since 2010
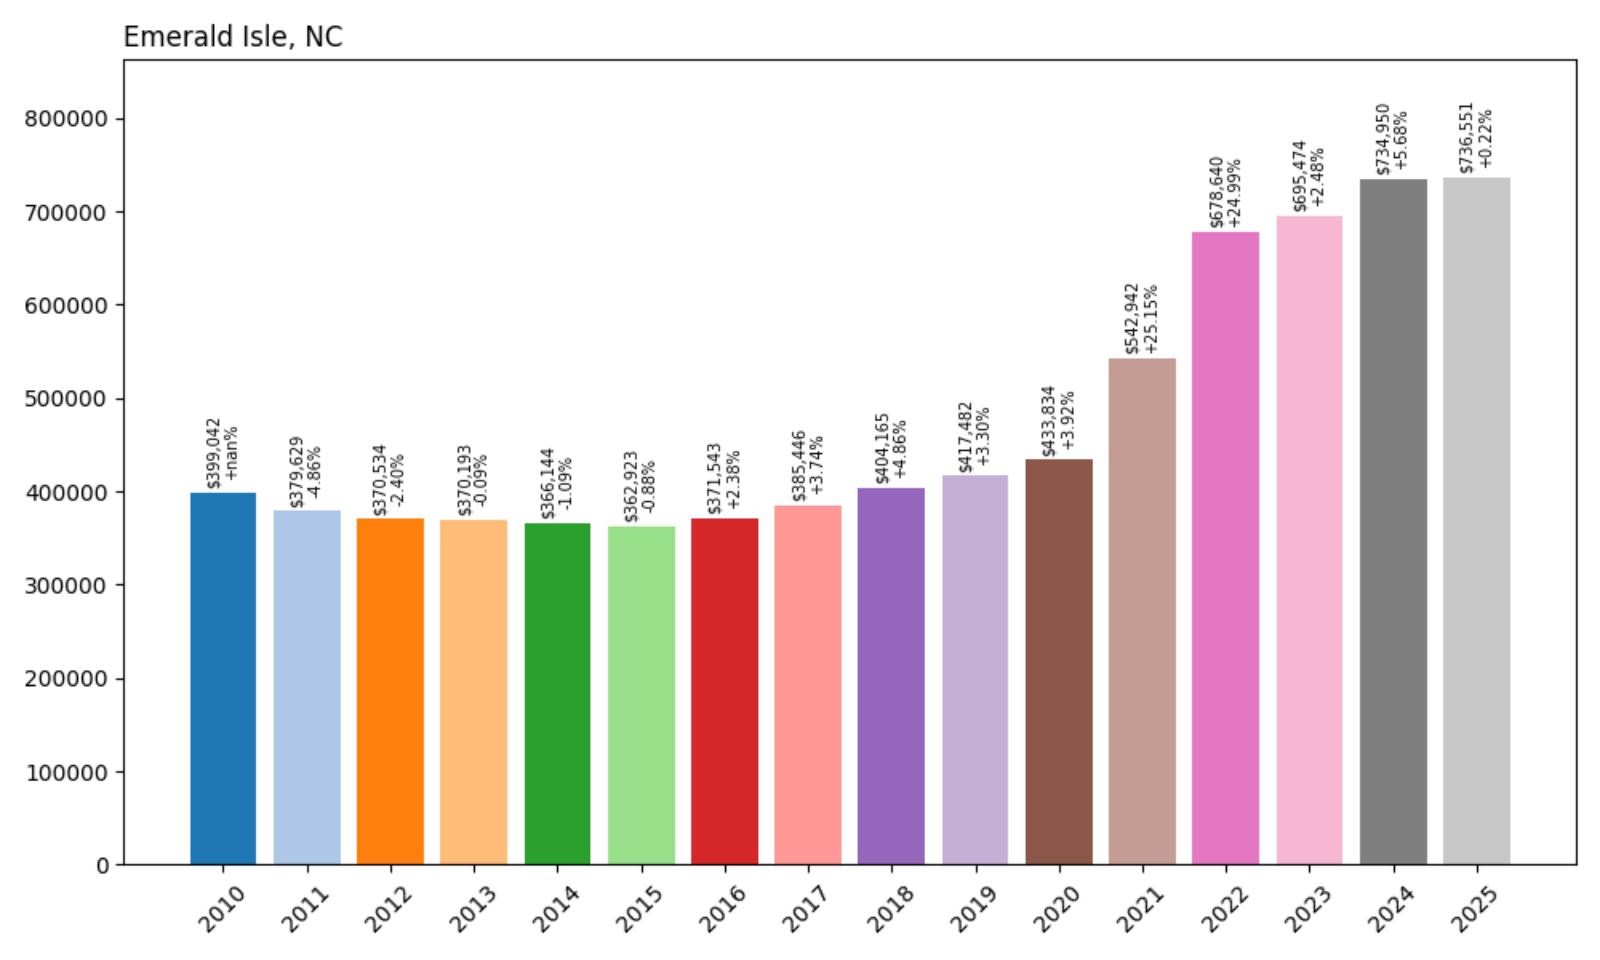
- 2010: $399,042
- 2011: $379,629 (−$19,413, −4.86% from previous year)
- 2012: $370,534 (−$9,095, −2.40% from previous year)
- 2013: $370,193 (−$341, −0.09% from previous year)
- 2014: $366,144 (−$4,049, −1.09% from previous year)
- 2015: $362,923 (−$3,221, −0.88% from previous year)
- 2016: $371,543 (+$8,620, +2.38% from previous year)
- 2017: $385,446 (+$13,903, +3.74% from previous year)
- 2018: $404,165 (+$18,719, +4.86% from previous year)
- 2019: $417,482 (+$13,317, +3.30% from previous year)
- 2020: $433,834 (+$16,351, +3.92% from previous year)
- 2021: $542,942 (+$109,108, +25.15% from previous year)
- 2022: $678,640 (+$135,698, +24.99% from previous year)
- 2023: $695,474 (+$16,834, +2.48% from previous year)
- 2024: $734,950 (+$39,476, +5.68% from previous year)
- 2025: $736,551 (+$1,601, +0.22% from previous year)
Emerald Isle’s housing market demonstrates remarkable resilience, with current home values at $736,551 representing an 85% increase since 2010. The community endured a challenging period through 2015 with declining values, but began steady recovery in 2016 that accelerated through the decade. The pandemic years brought substantial appreciation with consecutive increases of 25%, followed by continued growth that has stabilized at current record levels.
Emerald Isle – Crystal Coast Gem
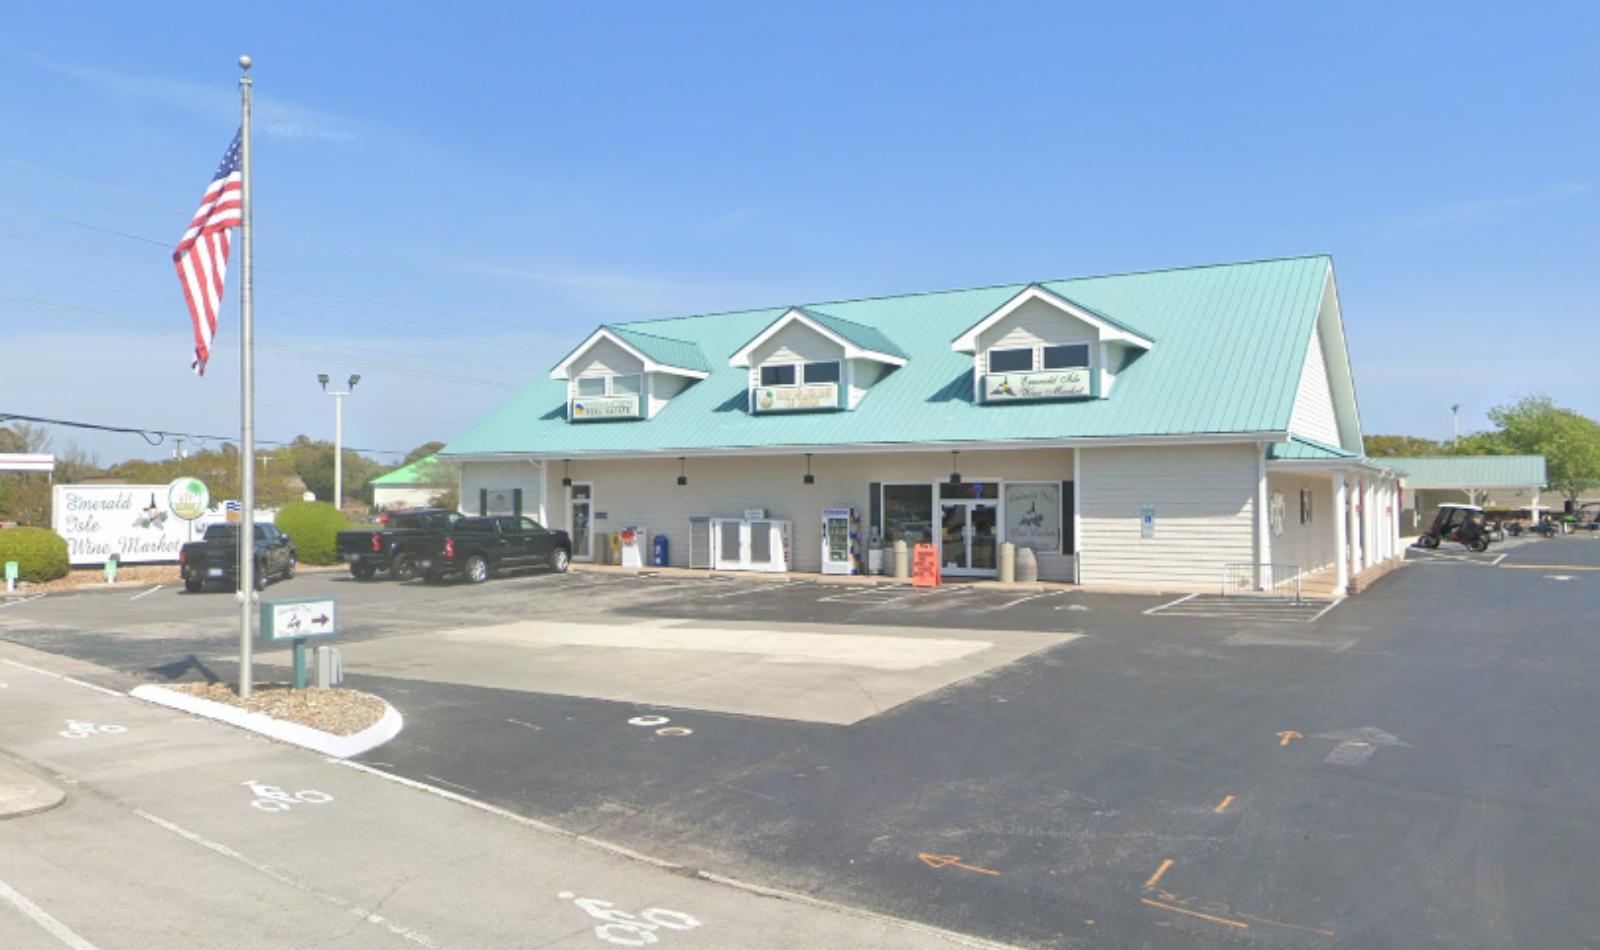
Emerald Isle anchors the western end of Bogue Banks as one of the Crystal Coast’s most family-friendly beach destinations. This incorporated town of approximately 3,500 residents offers 12 miles of pristine beaches along with extensive maritime forests that provide a natural backdrop for residential development. The community has successfully maintained its reputation as a quieter alternative to more commercial beach destinations while developing the amenities and infrastructure that support a thriving housing market.
Emerald Isle’s steady price appreciation reflects its successful positioning within the competitive Crystal Coast market. The town’s combination of family-friendly amenities, natural beauty, and reasonable accessibility from major metropolitan areas has created sustained demand among both primary and second-home buyers. Recent market performance demonstrates the community’s maturation into a premium coastal destination while maintaining the relaxed atmosphere that originally attracted visitors and residents to this corner of the Crystal Coast.
15. Blowing Rock – 93% Home Price Increase Since 2010
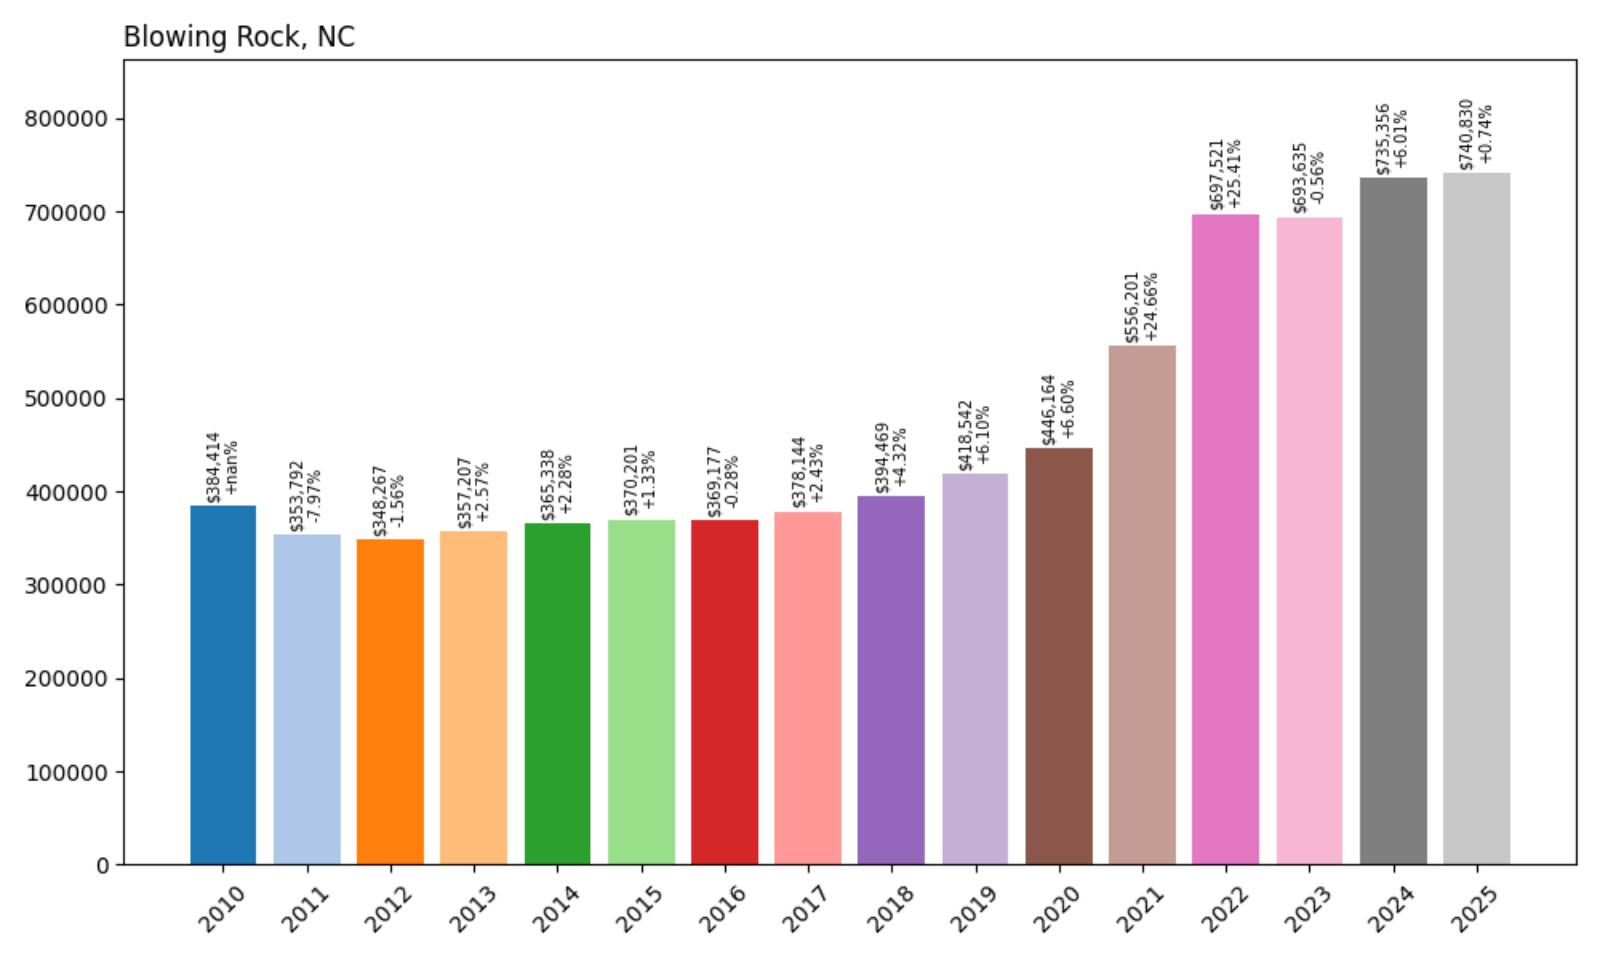
- 2010: $384,414
- 2011: $353,792 (−$30,622, −7.97% from previous year)
- 2012: $348,267 (−$5,525, −1.56% from previous year)
- 2013: $357,207 (+$8,940, +2.57% from previous year)
- 2014: $365,338 (+$8,131, +2.28% from previous year)
- 2015: $370,201 (+$4,863, +1.33% from previous year)
- 2016: $369,177 (−$1,024, −0.28% from previous year)
- 2017: $378,144 (+$8,967, +2.43% from previous year)
- 2018: $394,469 (+$16,326, +4.32% from previous year)
- 22019: $418,542 (+$24,073, +6.10% from previous year)
- 2020: $446,164 (+$27,622, +6.60% from previous year)
- 2021: $556,201 (+$110,037, +24.66% from previous year)
- 2022: $697,521 (+$141,320, +25.41% from previous year)
- 2023: $693,635 (−$3,887, −0.56% from previous year)
- 2024: $735,356 (+$41,722, +6.01% from previous year)
- 2025: $740,830 (+$5,474, +0.74% from previous year)
Blowing Rock’s housing market showcases steady mountain community growth, with current home values at $740,830 representing a 93% increase since 2010. After recovering from early 2010s softness, the town experienced accelerating appreciation through the decade, culminating in dramatic pandemic-era increases of nearly 25% in consecutive years. Recent performance shows continued but more moderate growth, suggesting market stabilization at elevated price levels.
Blowing Rock – Mountain Resort Heritage

Blowing Rock holds a special place in North Carolina’s mountain tourism history, having served as a cool-weather retreat for lowland residents since the late 1800s. This charming town of approximately 1,200 residents sits at 3,500 feet elevation in the Blue Ridge Mountains, offering spectacular views and a temperate climate that attracts both seasonal and year-round residents. The community’s Main Street features boutique shopping, fine dining, and cultural attractions that create a sophisticated mountain town atmosphere unique in western North Carolina.
The town’s housing market benefits from its status as both a tourist destination and a desirable residential community. Properties range from historic mountain cottages in the village core to modern luxury homes with panoramic views of the surrounding peaks and valleys. Blowing Rock’s location along the Blue Ridge Parkway provides easy access to outdoor recreation while maintaining the refined amenities that attract affluent buyers. The presence of attractions like the Blowing Rock formation and Tweetsie Railroad adds tourism value that supports both residential and investment property markets.
14. Glenville – 94% Home Price Increase Since 2010
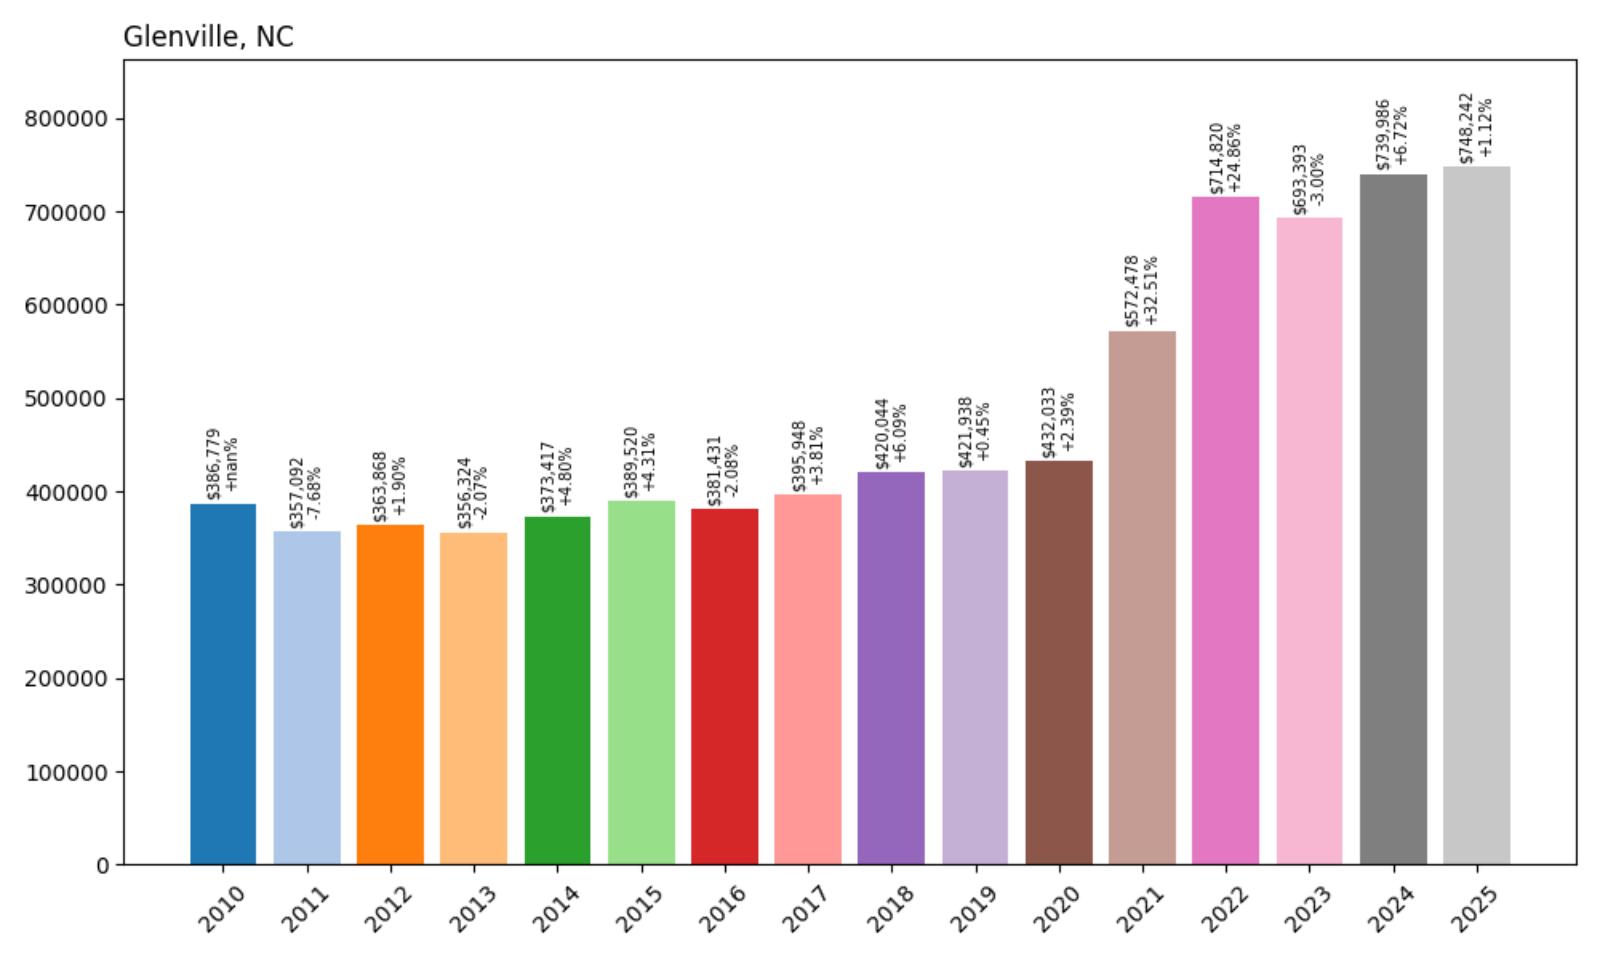
- 2010: $386,779
- 2011: $357,092 (−$29,687, −7.68% from previous year)
- 2012: $363,868 (+$6,776, +1.90% from previous year)
- 2013: $356,324 (−$7,544, −2.07% from previous year)
- 2014: $373,417 (+$17,093, +4.80% from previous year)
- 2015: $389,520 (+$16,104, +4.31% from previous year)
- 2016: $381,431 (−$8,090, −2.08% from previous year)
- 2017: $395,948 (+$14,517, +3.81% from previous year)
- 2018: $420,044 (+$24,096, +6.09% from previous year)
- 2019: $421,938 (+$1,894, +0.45% from previous year)
- 2020: $432,033 (+$10,095, +2.39% from previous year)
- 2021: $572,478 (+$140,445, +32.51% from previous year)
- 2022: $714,820 (+$142,342, +24.86% from previous year)
- 2023: $693,393 (−$21,426, −3.00% from previous year)
- 2024: $739,986 (+$46,593, +6.72% from previous year)
- 2025: $748,242 (+$8,256, +1.12% from previous year)
Glenville’s housing market demonstrates typical mountain community volatility with ultimate strong performance, showing current home values at $748,242 representing a 94% increase since 2010. The community experienced uneven growth through the 2010s with several down years, but found momentum leading into the pandemic. Explosive growth of 32.5% and 24.9% in consecutive years was followed by some correction, though values have since recovered to new highs.
Glenville – Lake Community Retreat
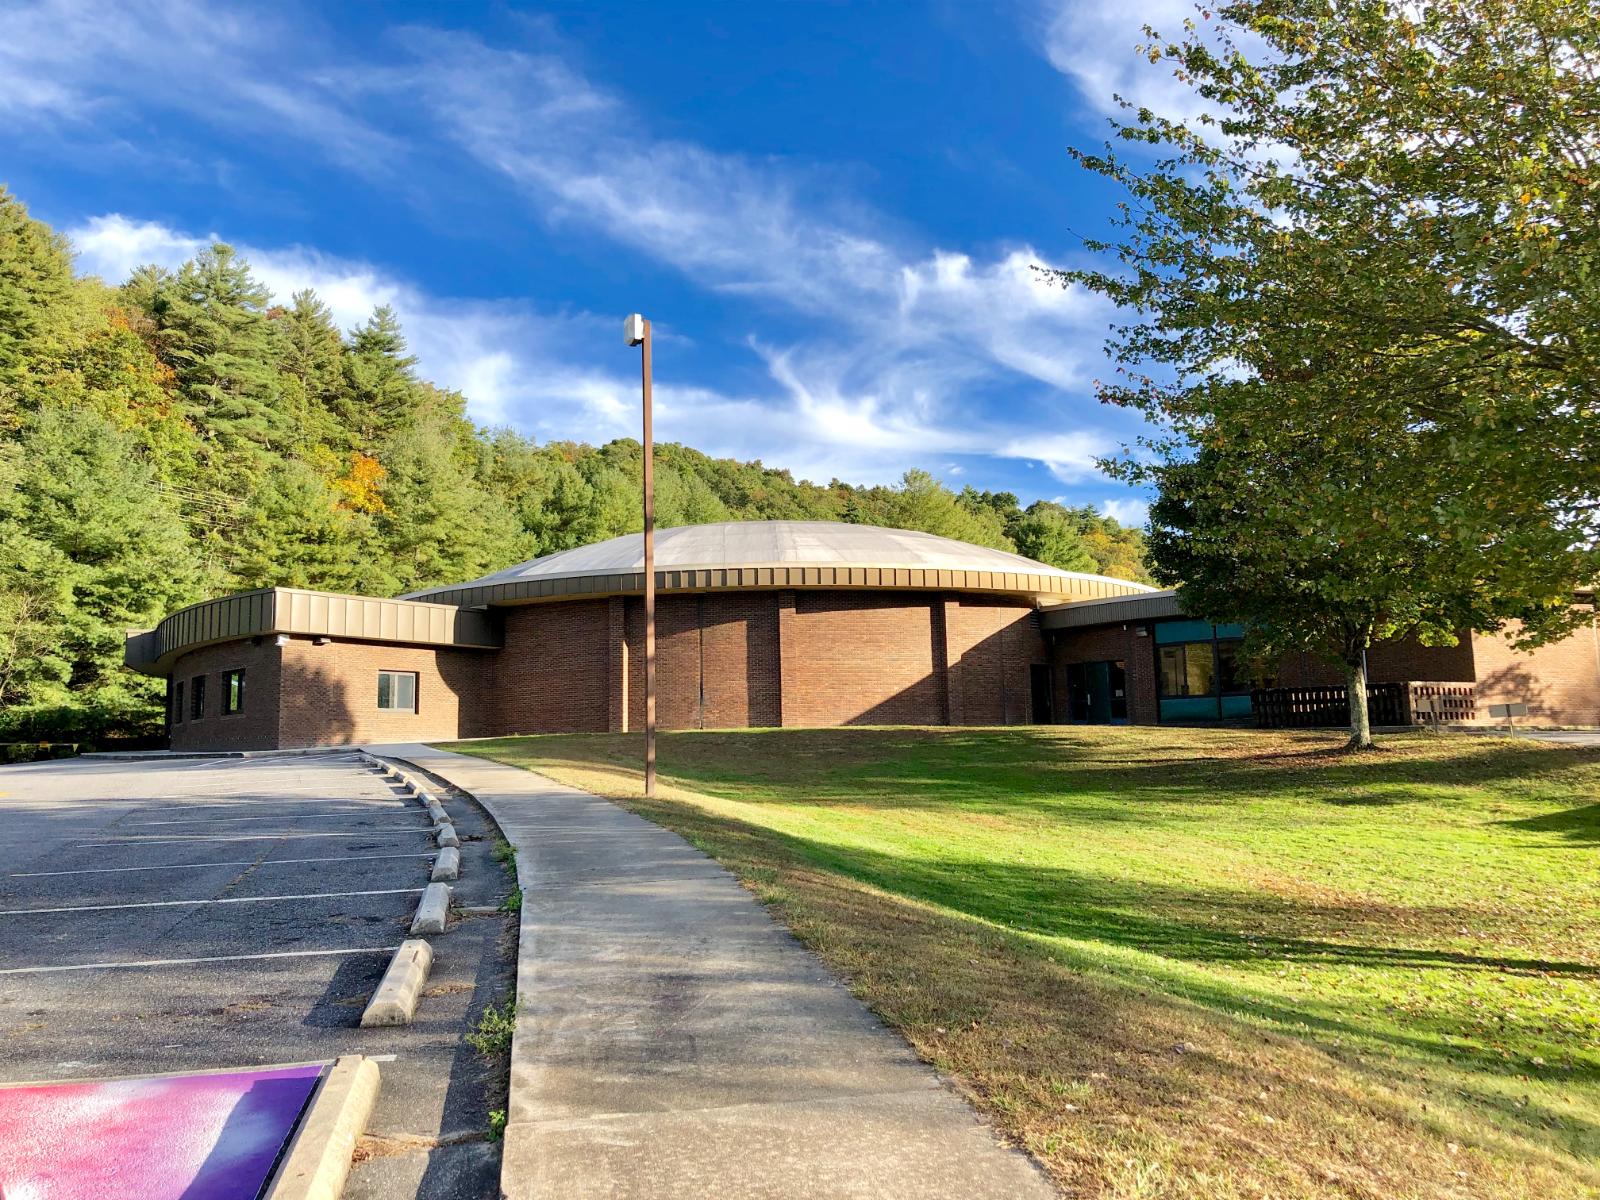
Glenville sits in the heart of Jackson County’s lake country, anchored by Lake Glenville and surrounded by the Nantahala National Forest. This small mountain community offers a unique combination of lake living and mountain scenery, with Lake Glenville being one of the highest elevation lakes in North Carolina at 3,500 feet. The area attracts residents seeking cooler summer temperatures, excellent fishing and water recreation, and the peace that comes with a secluded mountain setting.
Glenville’s strong price appreciation reflects growing demand for mountain lake properties, particularly those offering privacy and natural settings. The community’s combination of lake access, mountain scenery, and cooler climate has attracted buyers seeking alternatives to more crowded mountain destinations. Recent market performance shows Glenville establishing itself as a premium mountain lake destination, with property values reflecting its unique position in North Carolina’s high-country real estate market.
13. Kure Beach – 108% Home Price Increase Since 2010
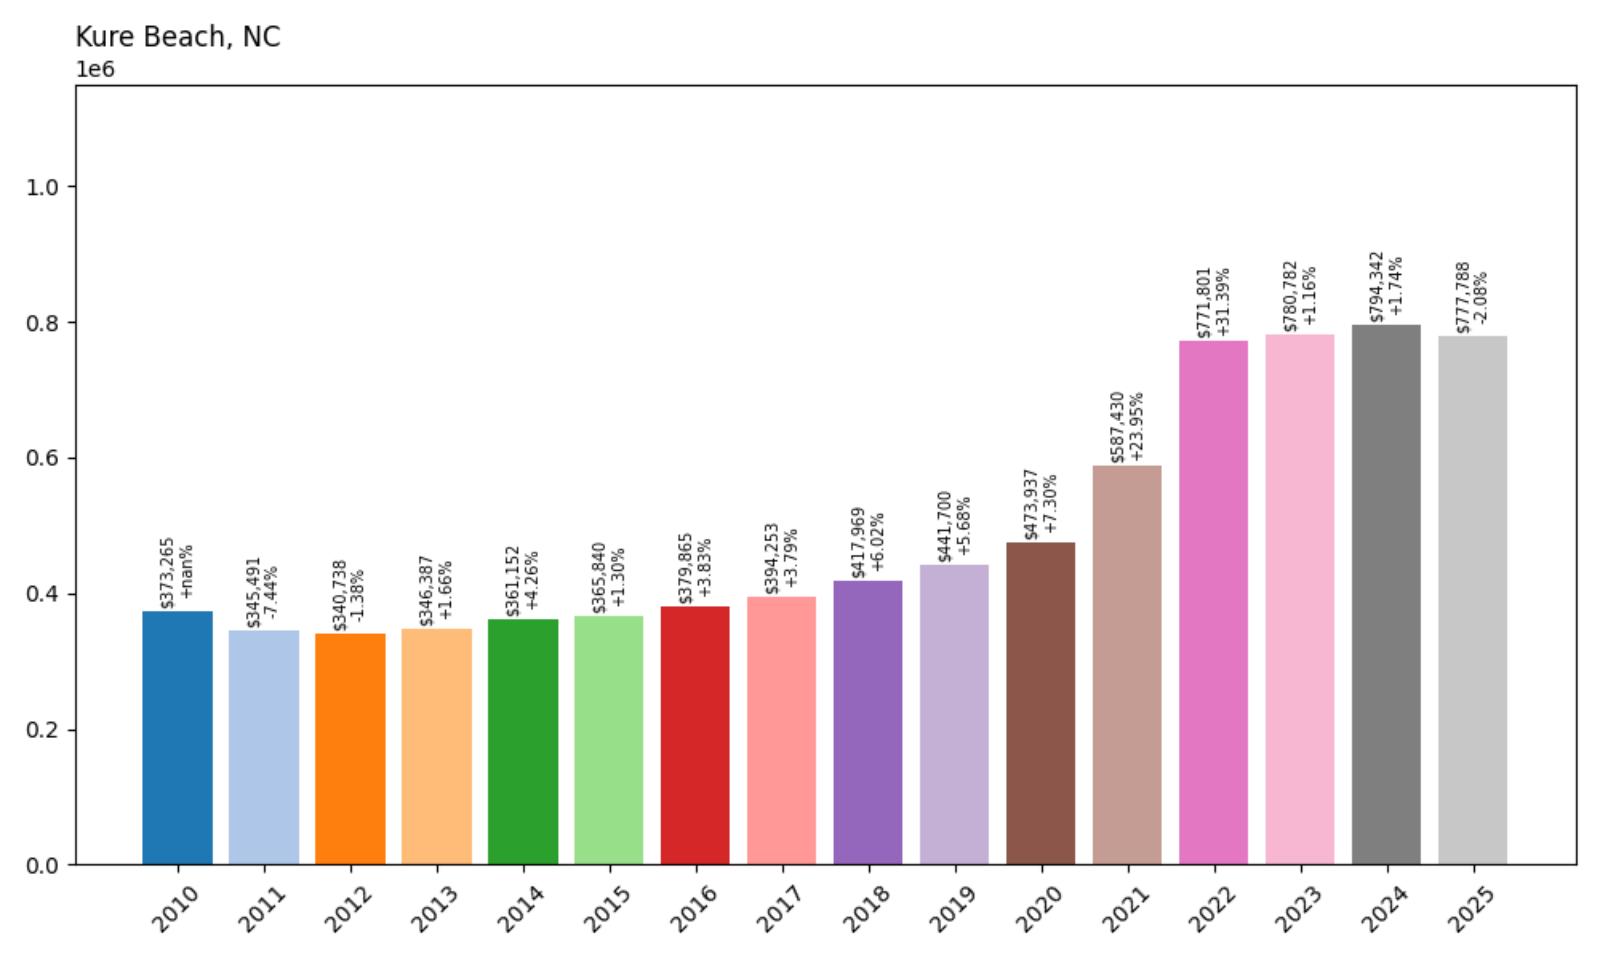
- 2010: $373,265
- 2011: $345,491 (−$27,774, −7.44% from previous year)
- 2012: $340,738 (−$4,753, −1.38% from previous year)
- 2013: $346,387 (+$5,649, +1.66% from previous year)
- 2014: $361,152 (+$14,766, +4.26% from previous year)
- 2015: $365,840 (+$4,688, +1.30% from previous year)
- 2016: $379,865 (+$14,025, +3.83% from previous year)
- 2017: $394,253 (+$14,388, +3.79% from previous year)
- 2018: $417,969 (+$23,716, +6.02% from previous year)
- 2019: $441,700 (+$23,732, +5.68% from previous year)
- 2020: $473,937 (+$32,237, +7.30% from previous year)
- 2021: $587,430 (+$113,492, +23.95% from previous year)
- 2022: $771,801 (+$184,371, +31.39% from previous year)
- 2023: $780,782 (+$8,981, +1.16% from previous year)
- 2024: $794,342 (+$13,560, +1.74% from previous year)
- 2025: $777,788 (−$16,554, −2.08% from previous year)
Kure Beach’s housing market displays strong coastal appreciation patterns, with current home values at $777,788 representing a robust 108% increase since 2010. After initial post-recession challenges, the community achieved steady growth through the 2010s that accelerated significantly in recent years. Pandemic-era increases of 24% and 31% in consecutive years brought values to current levels, with some recent softening reflecting broader coastal market corrections.
Kure Beach – Coastal Family Destination
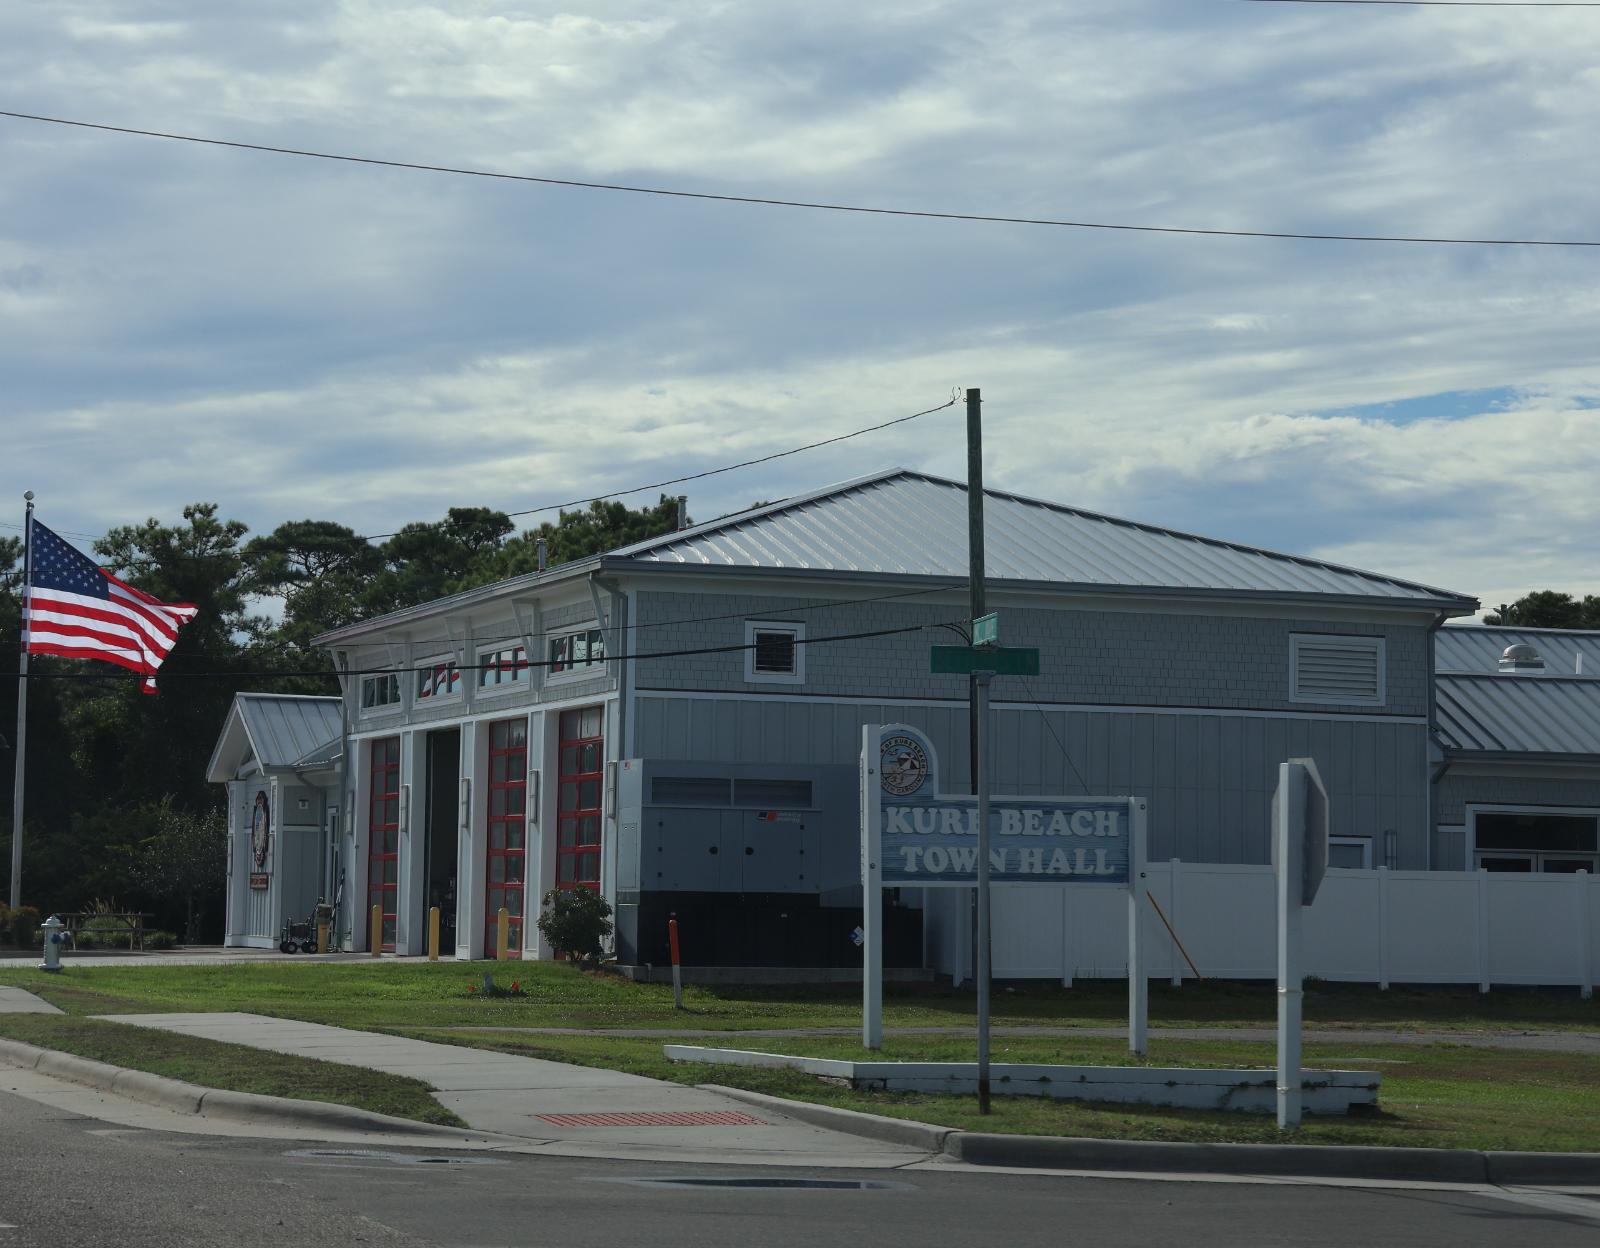
Kure Beach occupies the southern tip of Pleasure Island, offering a more relaxed alternative to busier beach destinations while maintaining easy access to Wilmington and regional attractions. This small coastal town of approximately 2,000 residents has successfully preserved its family-friendly character while developing into a desirable residential community. The town’s location provides both ocean and river access, with the Cape Fear River offering protected waterfront opportunities that complement traditional beachfront properties.
The community’s housing market benefits from its proximity to the North Carolina Aquarium at Fort Fisher and Fort Fisher State Recreation Area, which add recreational and educational amenities that enhance property values. Kure Beach properties range from modest beach cottages to luxury oceanfront homes, with many designed to accommodate both family use and vacation rental income. The town’s fishing pier and beach access points support an active lifestyle that appeals to both permanent residents and second-home owners.
12. Southern Shores – 87% Home Price Increase Since 2010
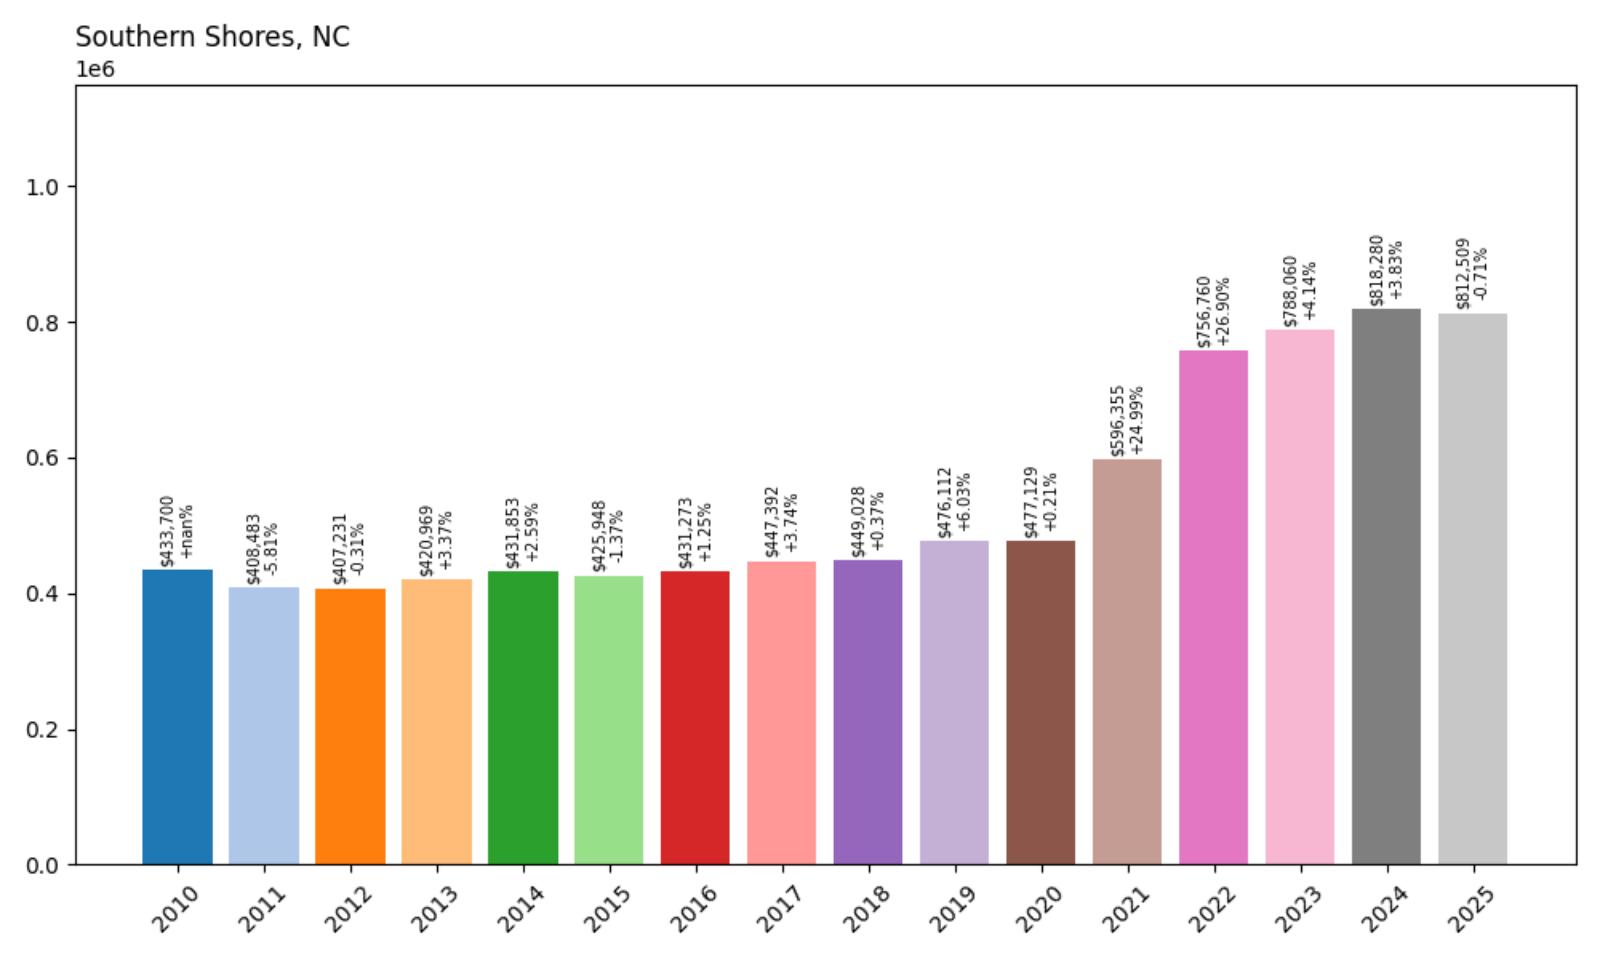
- 2010: $433,700
- 2011: $408,483 (−$25,217, −5.81% from previous year)
- 2012: $407,231 (−$1,252, −0.31% from previous year)
- 2013: $420,969 (+$13,738, +3.37% from previous year)
- 2014: $431,853 (+$10,884, +2.59% from previous year)
- 2015: $425,948 (−$5,905, −1.37% from previous year)
- 2016: $431,273 (+$5,325, +1.25% from previous year)
- 2017: $447,392 (+$16,119, +3.74% from previous year)
- 2018: $449,028 (+$1,636, +0.37% from previous year)
- 2019: $476,112 (+$27,084, +6.03% from previous year)
- 2020: $477,129 (+$1,017, +0.21% from previous year)
- 2021: $596,355 (+$119,225, +24.99% from previous year)
- 2022: $756,760 (+$160,405, +26.90% from previous year)
- 2023: $788,060 (+$31,300, +4.14% from previous year)
- 2024: $818,280 (+$30,220, +3.83% from previous year)
- 2025: $812,509 (−$5,771, −0.71% from previous year)
Southern Shores demonstrates steady Outer Banks appreciation, with current home values at $812,509 representing an 87% increase since 2010. The community showed modest, inconsistent growth through most of the 2010s before finding stronger momentum around 2019. Pandemic-era increases of 25% and 27% in consecutive years brought values to current levels, with recent performance showing some market cooling typical of coastal vacation home markets.
Southern Shores – Outer Banks Sophistication
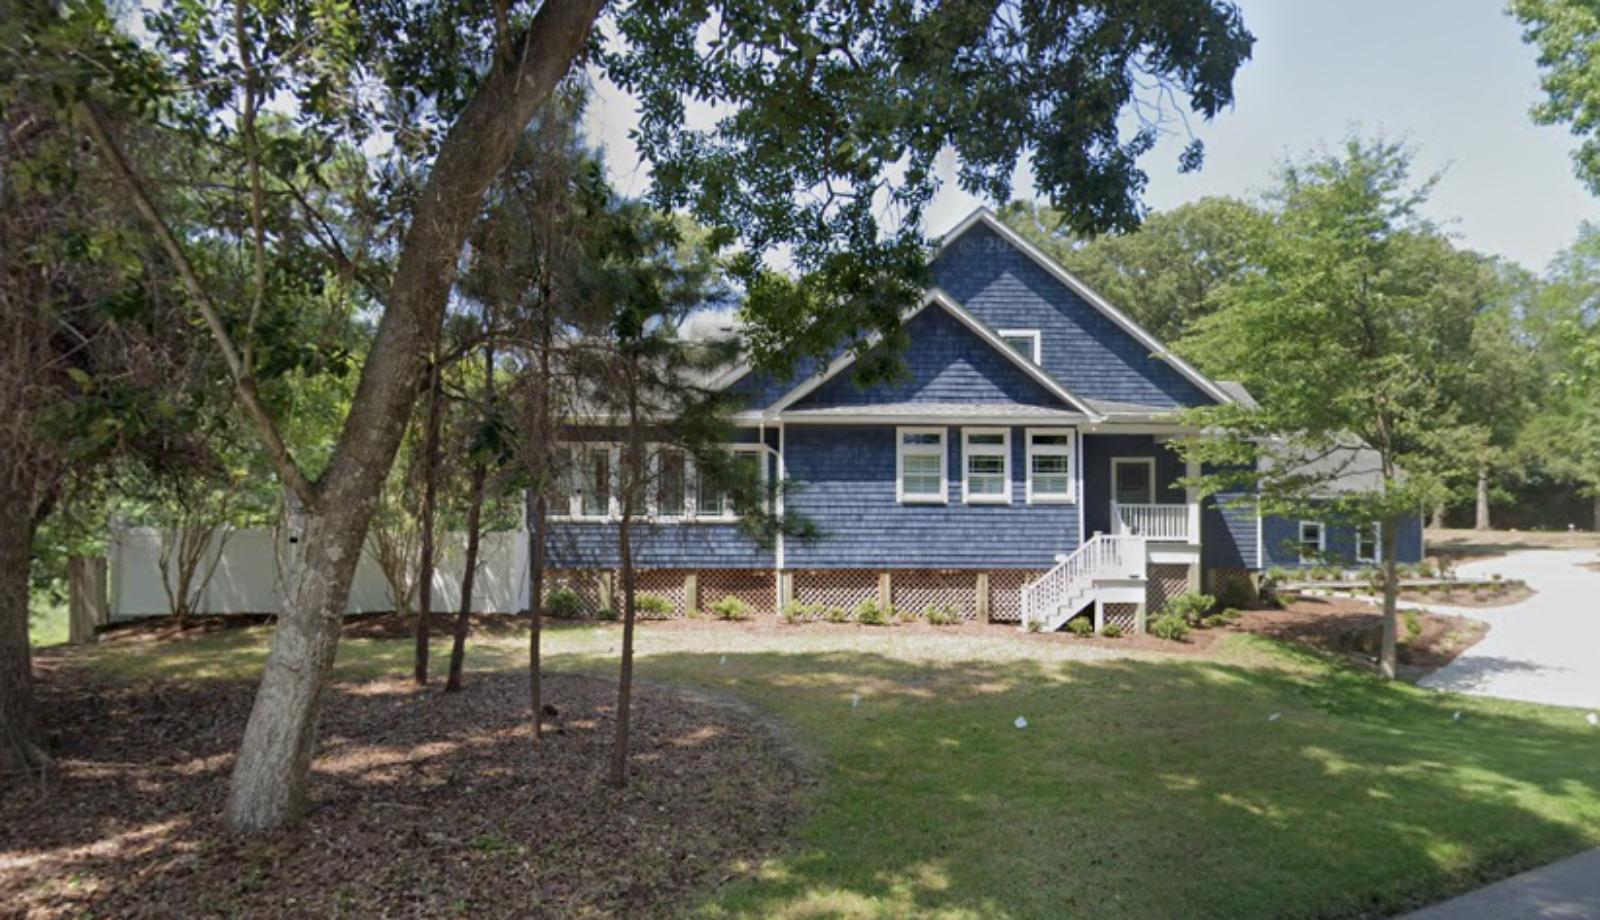
Southern Shores represents one of the more upscale residential communities along the Outer Banks, occupying prime oceanfront and soundside locations on Bodie Island. This incorporated town of approximately 2,700 residents has maintained its reputation as a quieter, more residential alternative to the busier commercial areas of the Outer Banks. The community features a mix of year-round residents and second-home owners who appreciate its combination of natural beauty, recreational amenities, and proximity to both beach and sound activities.
Southern Shores’ price appreciation reflects its position as one of the Outer Banks’ premier residential communities, attracting buyers who value both luxury amenities and natural settings. The town’s combination of established neighborhoods, recreational facilities, and diverse housing options has created sustained demand among affluent buyers seeking high-end coastal living. Recent market conditions demonstrate Southern Shores’ maturation into a nationally recognized luxury destination while maintaining the relaxed Outer Banks lifestyle that originally attracted residents to this unique coastal community.
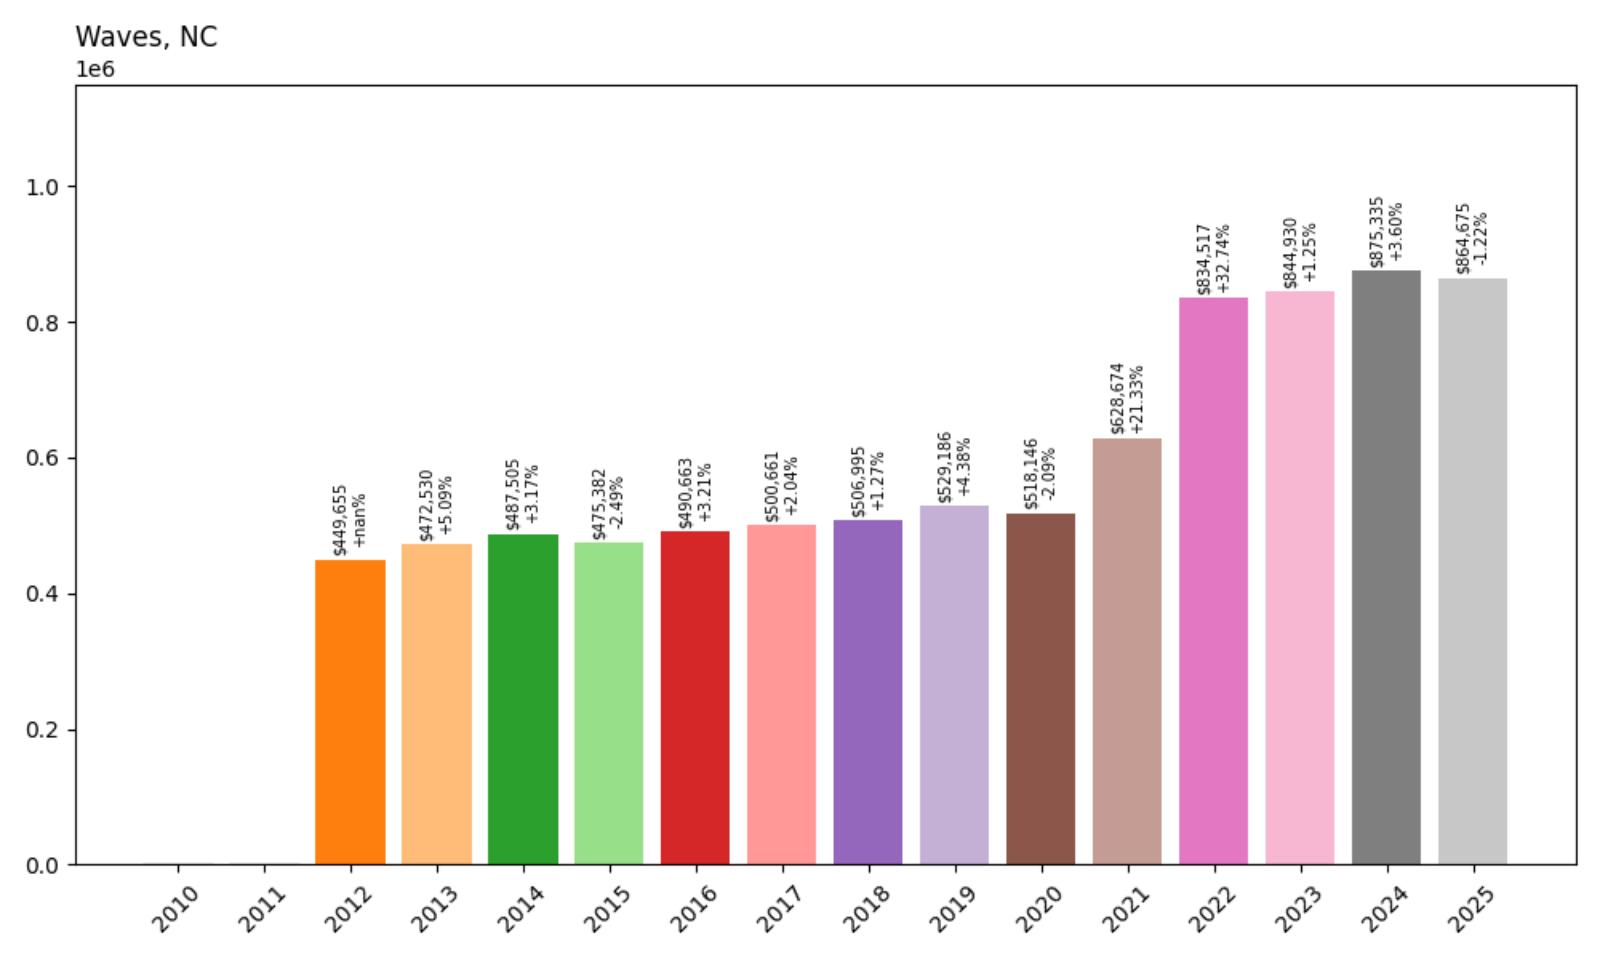
11. Waves – 92% Home Price Increase Since 2012
- 2010: N/A
- 2011: N/A
- 2012: $449,655
- 2013: $472,530 (+$22,875, +5.09% from previous year)
- 2014: $487,505 (+$14,975, +3.17% from previous year)
- 2015: $475,382 (−$12,123, −2.49% from previous year)
- 2016: $490,663 (+$15,281, +3.21% from previous year)
- 2017: $500,661 (+$9,998, +2.04% from previous year)
- 2018: $506,995 (+$6,334, +1.27% from previous year)
- 2019: $529,186 (+$22,191, +4.38% from previous year)
- 2020: $518,146 (−$11,040, −2.09% from previous year)
- 2021: $628,674 (+$110,528, +21.33% from previous year)
- 2022: $834,517 (+$205,843, +32.74% from previous year)
- 2023: $844,930 (+$10,413, +1.25% from previous year)
- 2024: $875,335 (+$30,405, +3.60% from previous year)
- 2025: $864,675 (−$10,660, −1.22% from previous year)
Waves shows typical Outer Banks market patterns, with current home values at $864,675 representing a 92% increase since data became available in 2012. The community experienced modest, uneven growth through the 2010s with several down years, but found strong momentum during the pandemic with increases of 21% and 33% in consecutive years. Recent performance shows some market softening, reflecting broader trends in vacation home markets following extraordinary pandemic-era growth.
Waves – Hatteras Island Haven
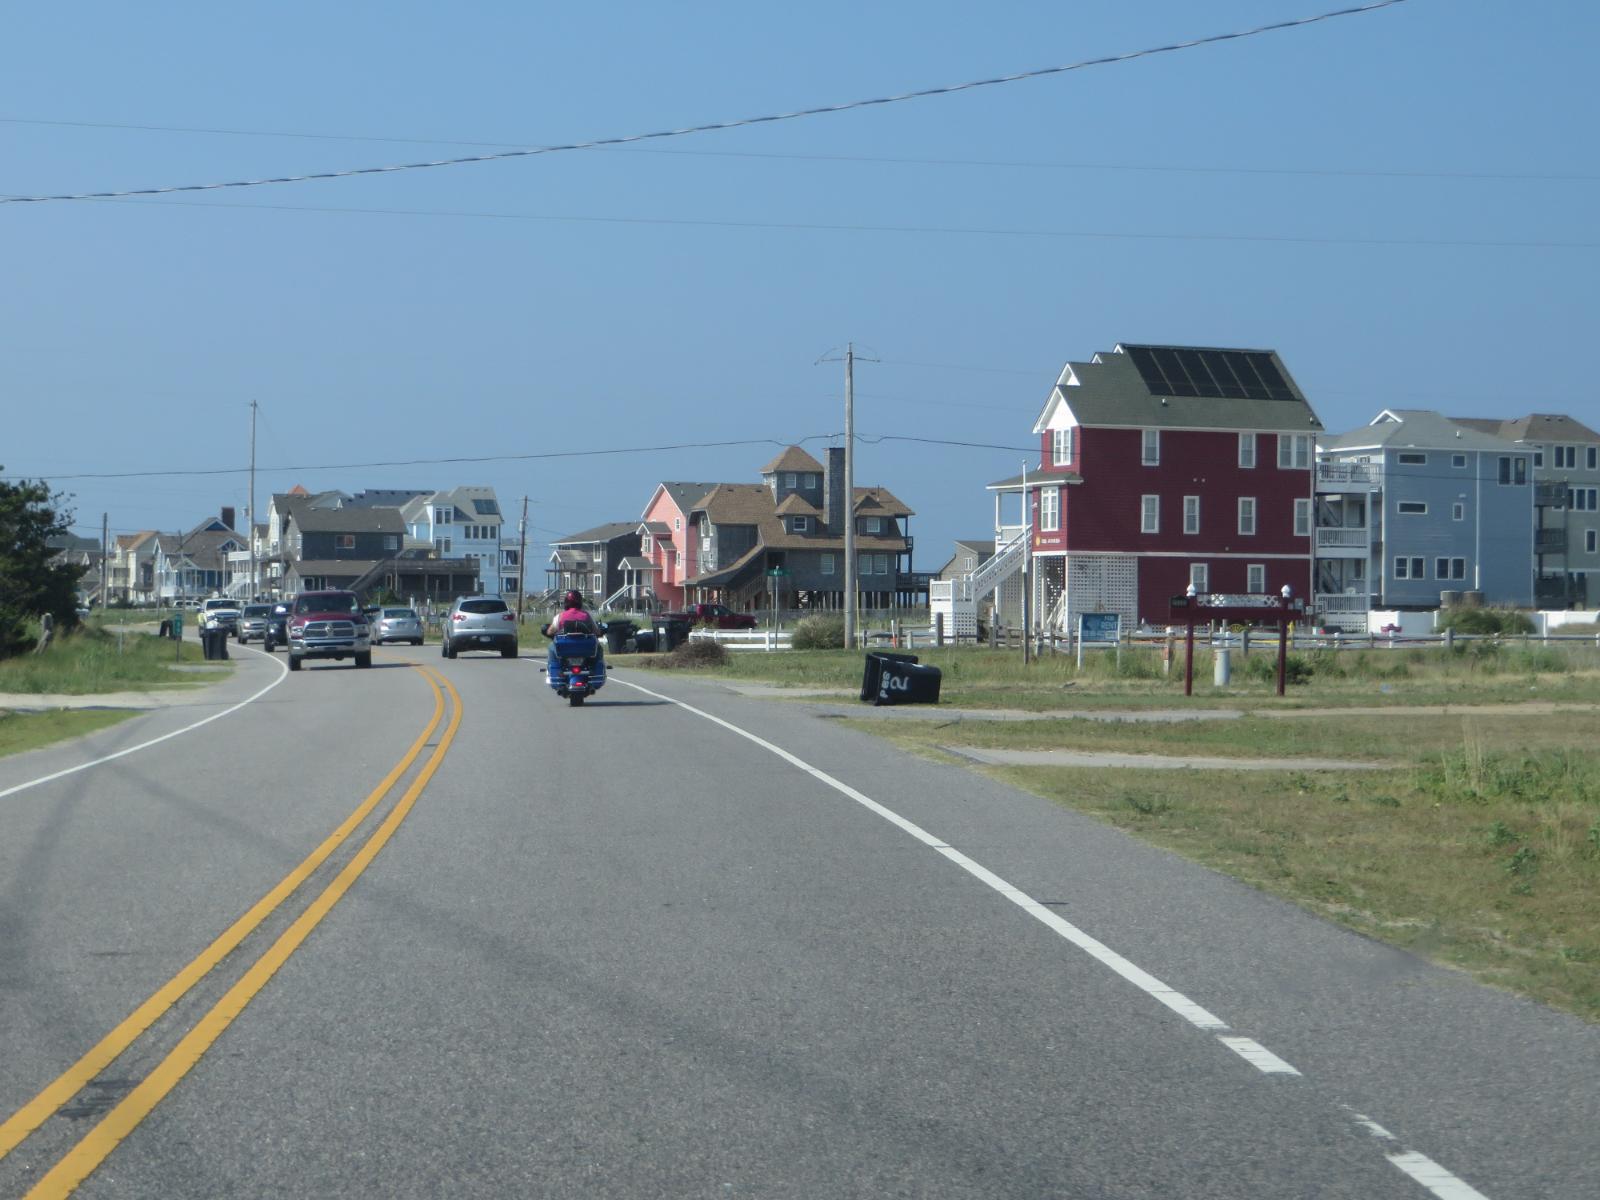
Waves occupies a unique position along Hatteras Island as one of the smaller villages that has maintained much of its original character while adapting to modern tourism demands. This unincorporated community sits between the larger villages of Rodanthe and Salvo, offering residents and visitors a quieter slice of Outer Banks life. The village’s name reflects its reputation among surfers and water sports enthusiasts, who are drawn to the consistent wave action and excellent wind conditions found along this stretch of coast.
The housing market in Waves consists primarily of beach houses designed to withstand coastal conditions, with many properties elevated on pilings and featuring classic Outer Banks architecture. The community’s location provides access to both ocean and sound waters, making it particularly attractive to buyers interested in fishing, surfing, and water sports. Many homes in Waves serve dual purposes as family retreats and vacation rental properties, taking advantage of the area’s popularity with tourists seeking authentic Outer Banks experiences.
10. Holden Beach – 93% Home Price Increase Since 2010
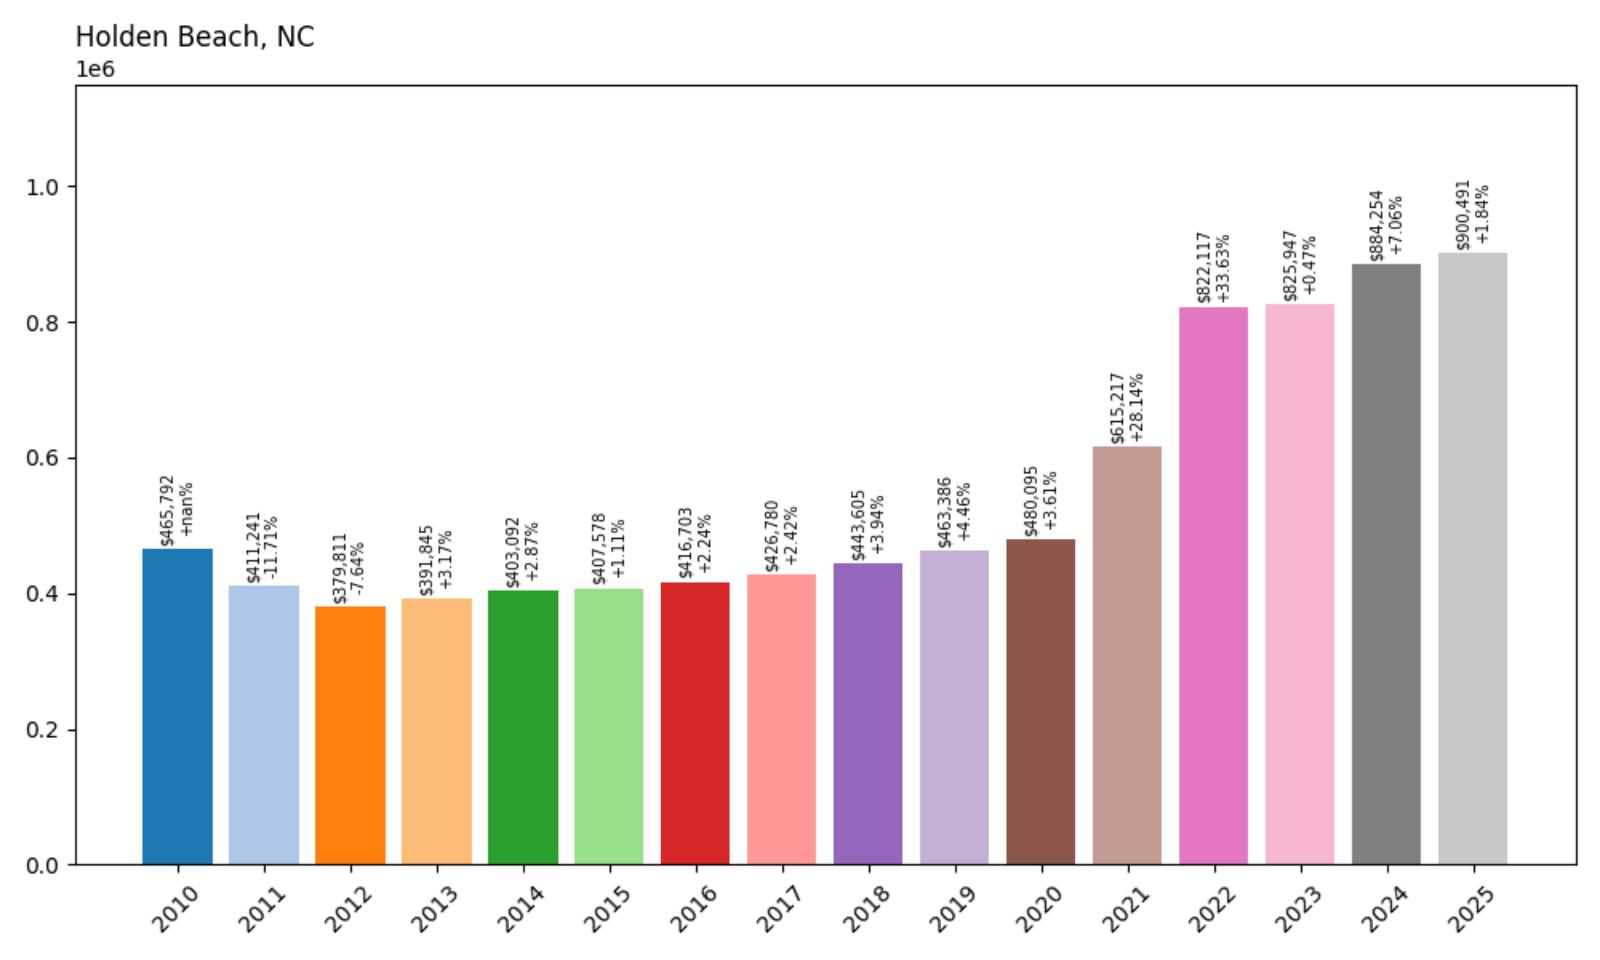
- 2010: $465,792
- 2011: $411,241 (−$54,551, −11.71% from previous year)
- 2012: $379,811 (−$31,430, −7.64% from previous year)
- 2013: $391,845 (+$12,035, +3.17% from previous year)
- 2014: $403,092 (+$11,246, +2.87% from previous year)
- 2015: $407,578 (+$4,486, +1.11% from previous year)
- 2016: $416,703 (+$9,125, +2.24% from previous year)
- 2017: $426,780 (+$10,077, +2.42% from previous year)
- 2018: $443,605 (+$16,825, +3.94% from previous year)
- 2019: $463,386 (+$19,781, +4.46% from previous year)
- 2020: $480,095 (+$16,709, +3.61% from previous year)
- 2021: $615,217 (+$135,122, +28.14% from previous year)
- 2022: $822,117 (+$206,900, +33.63% from previous year)
- 2023: $825,947 (+$3,830, +0.47% from previous year)
- 2024: $884,254 (+$58,307, +7.06% from previous year)
- 2025: $900,491 (+$16,237, +1.84% from previous year)
Holden Beach demonstrates classic coastal recovery patterns, with current home values at $900,491 representing a 93% increase since 2010. After significant early 2010s declines, the community achieved steady recovery through the decade with consistent moderate growth. Pandemic-era increases of 28% and 34% in consecutive years brought dramatic appreciation, followed by continued growth that has pushed values to current record levels.
Holden Beach – Family-Friendly Coastal Retreat
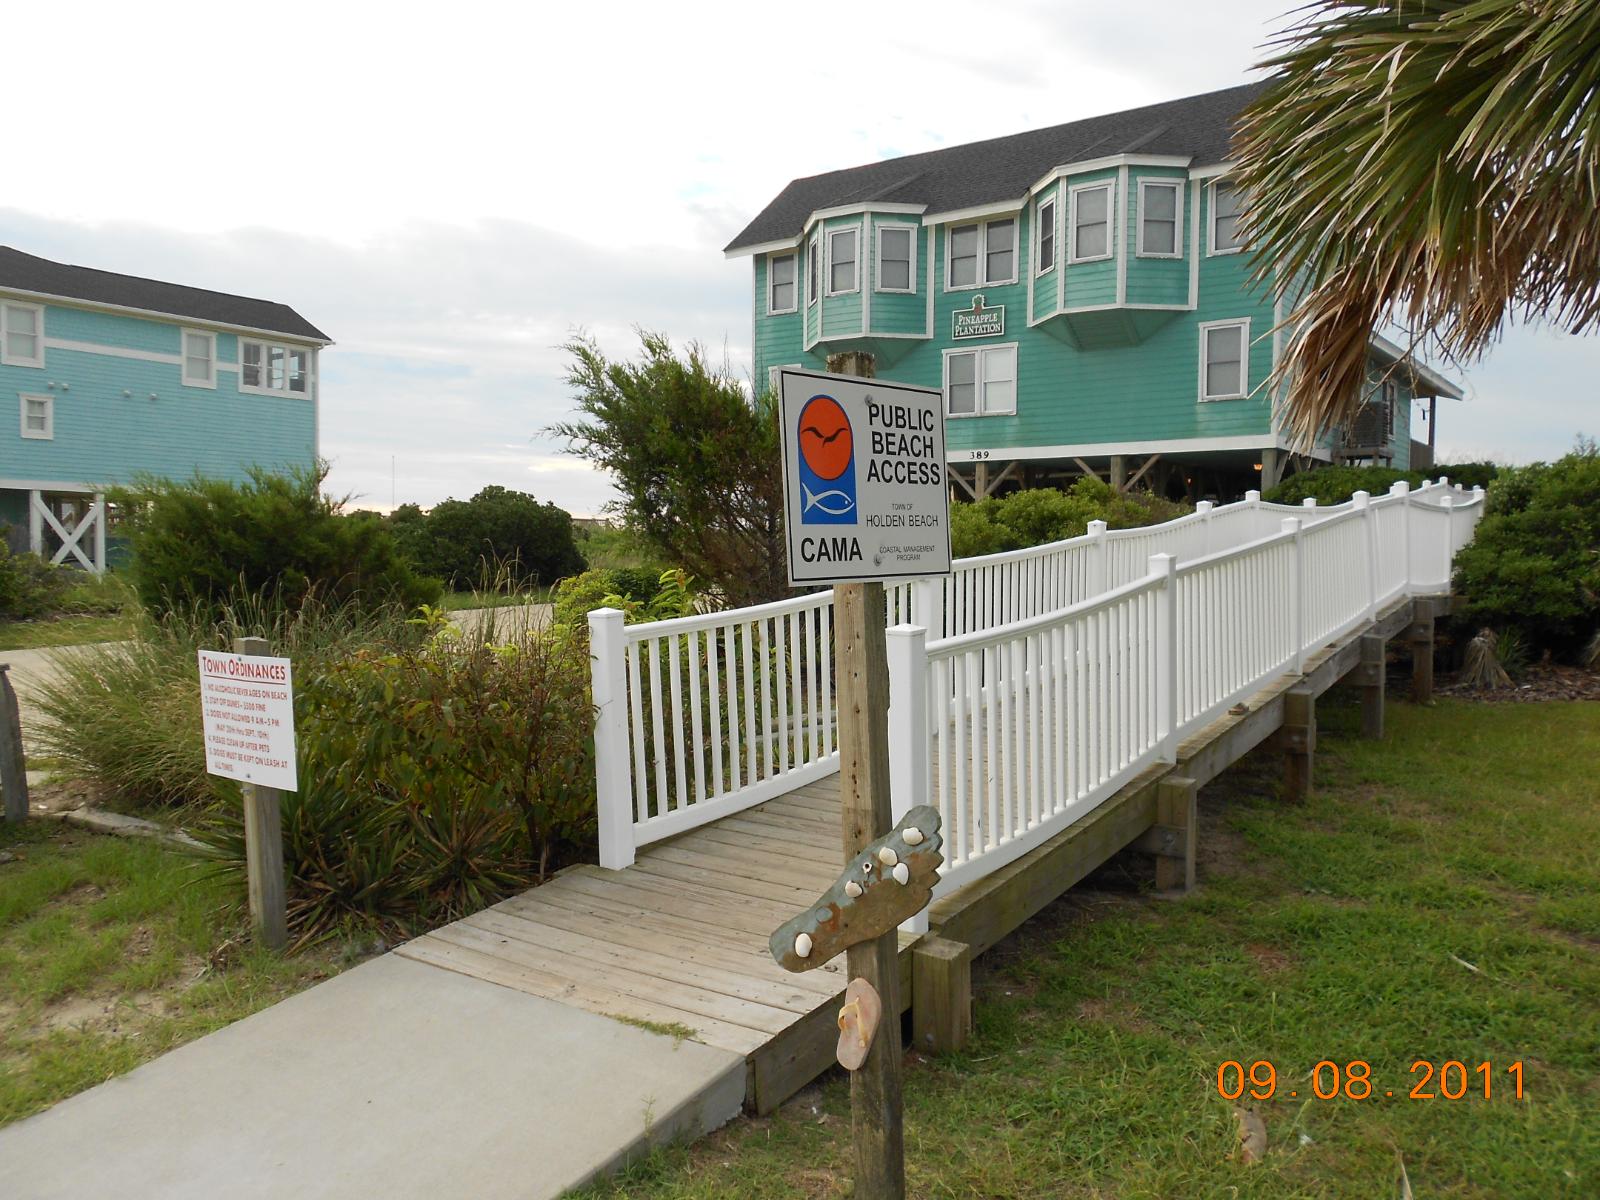
Holden Beach stands as one of Brunswick County’s most beloved family beach destinations, known for its wide sandy beaches and relaxed atmosphere. This barrier island community of approximately 600 year-round residents swells significantly during summer months as visitors flock to its pristine 10-mile stretch of coastline. The town has successfully maintained its small-town character while developing the infrastructure and amenities needed to support both residential and vacation rental markets.
The community’s housing market consists primarily of beach houses designed for family gatherings and vacation rentals, with architecture ranging from traditional coastal cottages to modern luxury homes. Holden Beach’s location provides easy access from major metropolitan areas in both North and South Carolina, making it particularly attractive to buyers seeking accessible coastal properties. The town’s fishing pier, golf courses, and family-friendly attractions add value for property owners while supporting the tourism economy that drives much of the local market.
9. Corolla – 81% Home Price Increase Since 2010
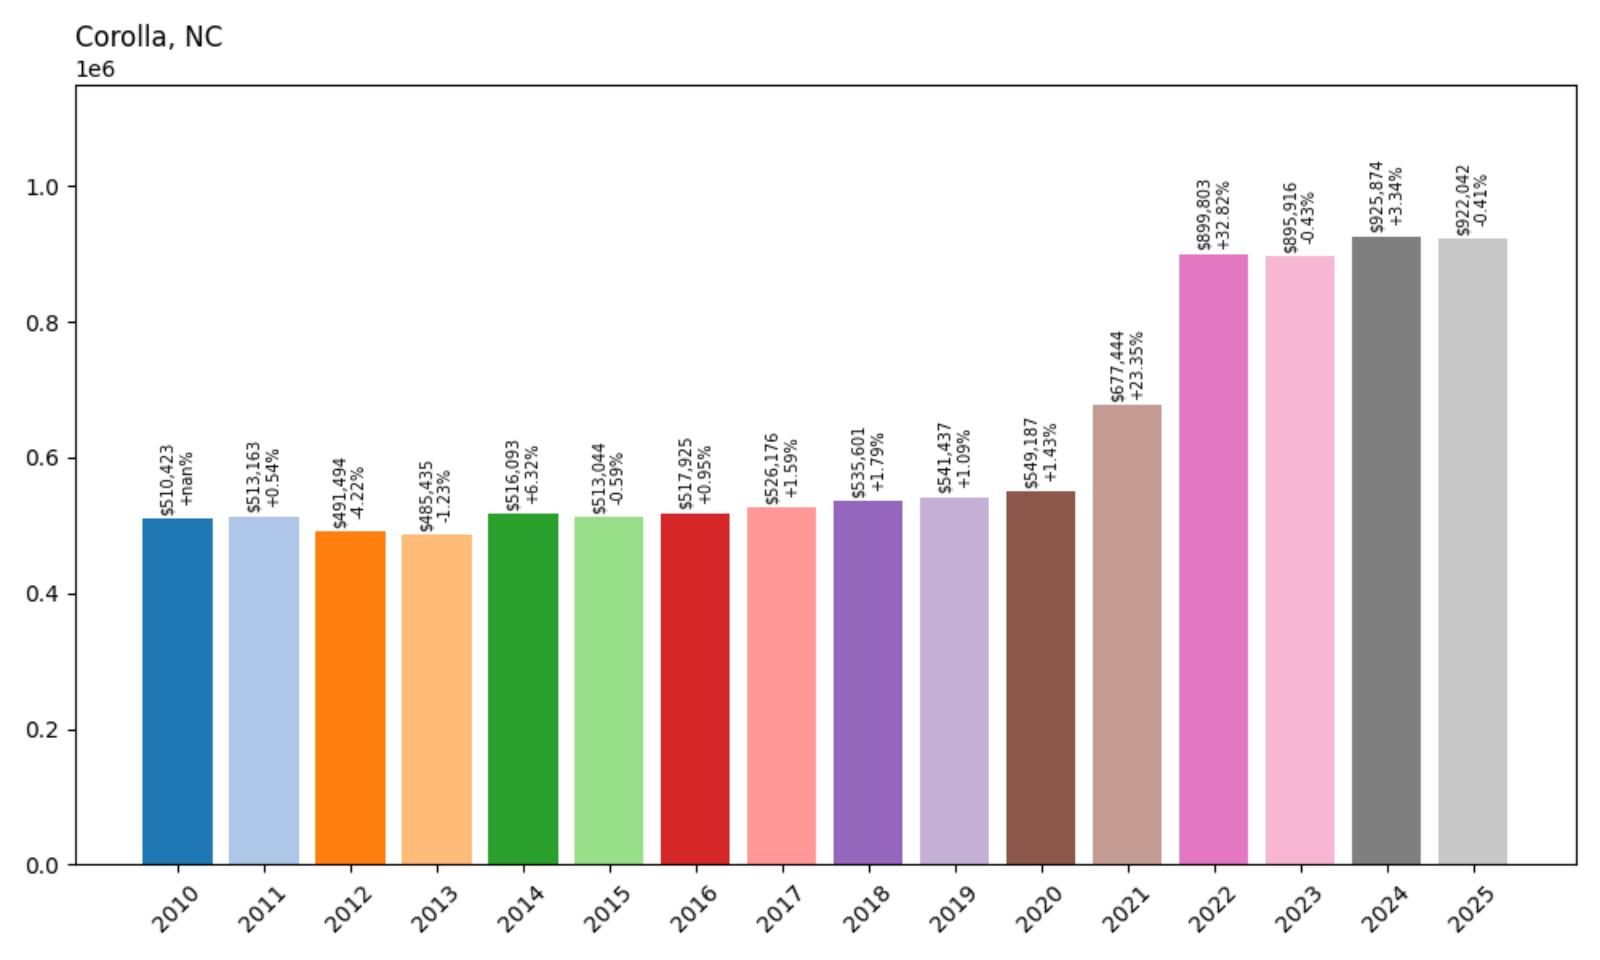
- 2010: $510,423
- 2011: $513,163 (+$2,740, +0.54% from previous year)
- 2012: $491,494 (−$21,669, −4.22% from previous year)
- 2013: $485,435 (−$6,059, −1.23% from previous year)
- 2014: $516,093 (+$30,659, +6.32% from previous year)
- 2015: $513,044 (−$3,049, −0.59% from previous year)
- 2016: $517,925 (+$4,881, +0.95% from previous year)
- 2017: $526,176 (+$8,251, +1.59% from previous year)
- 2018: $535,601 (+$9,424, +1.79% from previous year)
- 2019: $541,437 (+$5,836, +1.09% from previous year)
- 2020: $549,187 (+$7,750, +1.43% from previous year)
- 2021: $677,444 (+$128,257, +23.35% from previous year)
- 2022: $899,803 (+$222,360, +32.82% from previous year)
- 2023: $895,916 (−$3,887, −0.43% from previous year)
- 2024: $925,874 (+$29,958, +3.34% from previous year)
- 2025: $922,042 (−$3,832, −0.41% from previous year)
Corolla’s housing market shows steady Outer Banks patterns, with current home values at $922,042 representing an 81% increase since 2010. The community experienced very modest growth through most of the 2010s, with values remaining relatively flat for nearly a decade. Pandemic-era appreciation brought dramatic increases of 23% and 33% in consecutive years, followed by market stabilization with slight recent softening reflecting broader coastal vacation home market trends.
Corolla – Wild Horse Territory
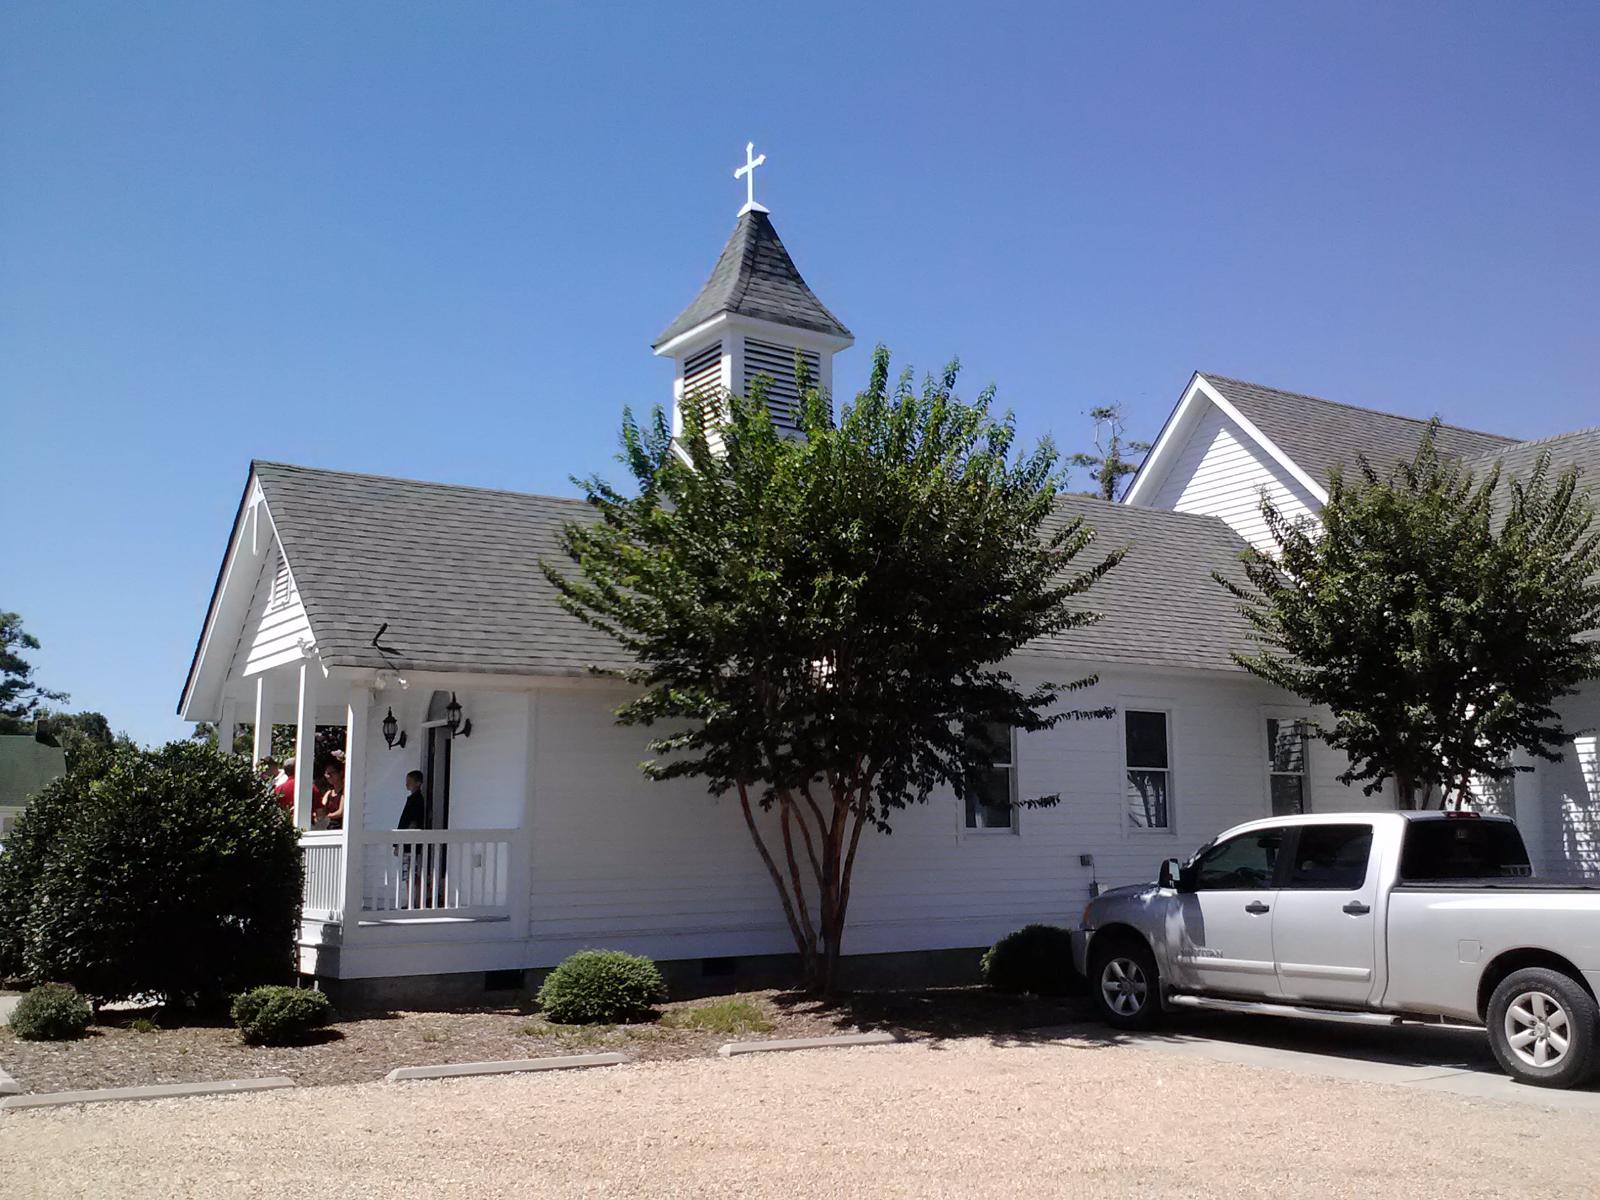
Corolla holds a unique position at the northern tip of the Outer Banks, famous for its wild horse population and pristine beaches that stretch for miles. This unincorporated community represents the more secluded end of the Outer Banks experience, where four-wheel drive vehicles are required to access the northernmost beaches and luxury homes. The area successfully balances its role as a tourist destination with exclusive residential neighborhoods that attract affluent buyers seeking privacy and natural beauty.
The community’s housing market consists primarily of luxury beach houses and vacation rentals, many designed to take advantage of spectacular ocean views and proximity to undeveloped beaches. Corolla’s location provides access to both the historic Currituck Beach Lighthouse and the Outer Banks Center for Wildlife Education, adding cultural and educational amenities that enhance property values. The presence of championship golf courses and upscale shopping at TimBuck II creates a resort-like atmosphere that appeals to high-end buyers.
8. Topsail Beach – 130% Home Price Increase Since 2010
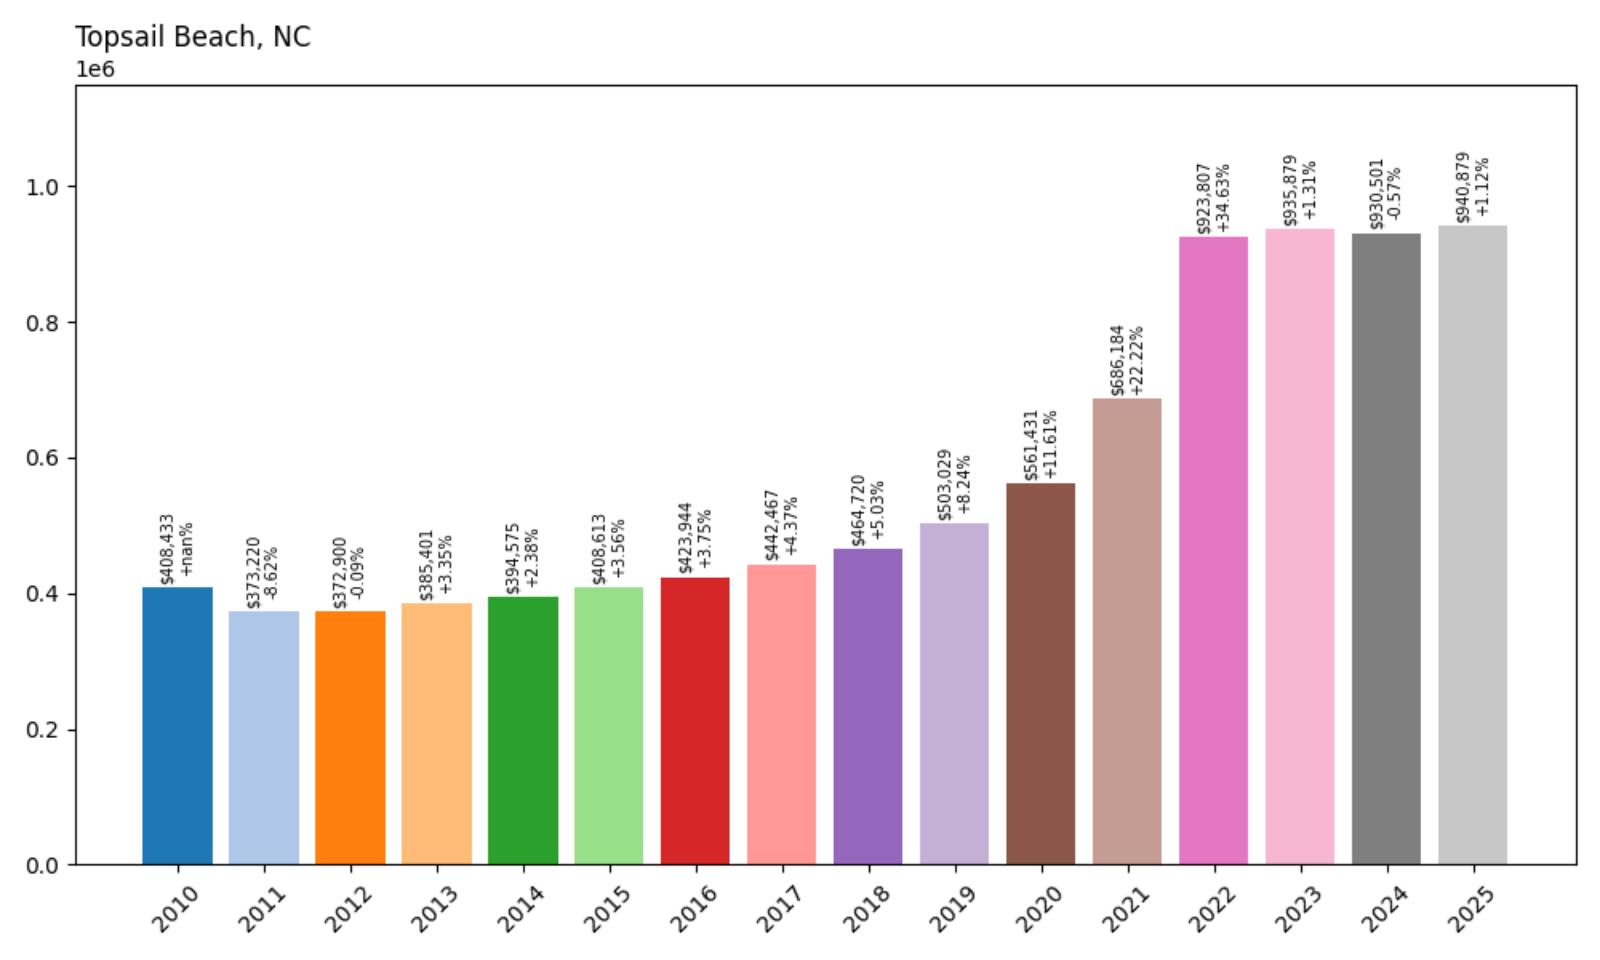
- 2010: $408,433
- 2011: $373,220 (−$35,213, −8.62% from previous year)
- 2012: $372,900 (−$320, −0.09% from previous year)
- 2013: $385,401 (+$12,502, +3.35% from previous year)
- 2014: $394,575 (+$9,174, +2.38% from previous year)
- 2015: $408,613 (+$14,038, +3.56% from previous year)
- 2016: $423,944 (+$15,332, +3.75% from previous year)
- 2017: $442,467 (+$18,522, +4.37% from previous year)
- 2018: $464,720 (+$22,253, +5.03% from previous year)
- 2019: $503,029 (+$38,309, +8.24% from previous year)
- 2020: $561,431 (+$58,402, +11.61% from previous year)
- 2021: $686,184 (+$124,752, +22.22% from previous year)
- 2022: $923,807 (+$237,623, +34.63% from previous year)
- 2023: $935,879 (+$12,072, +1.31% from previous year)
- 2024: $930,501 (−$5,378, −0.57% from previous year)
- 2025: $940,879 (+$10,377, +1.12% from previous year)
Topsail Beach demonstrates exceptional coastal appreciation, with current home values at $940,879 representing a remarkable 130% increase since 2010. After initial post-recession challenges, the community achieved accelerating growth through the 2010s, with particularly strong momentum building from 2019. Pandemic-era increases of 22% and 35% brought dramatic appreciation, with recent years showing continued growth despite some market volatility.
Topsail Beach – Pristine Island Paradise
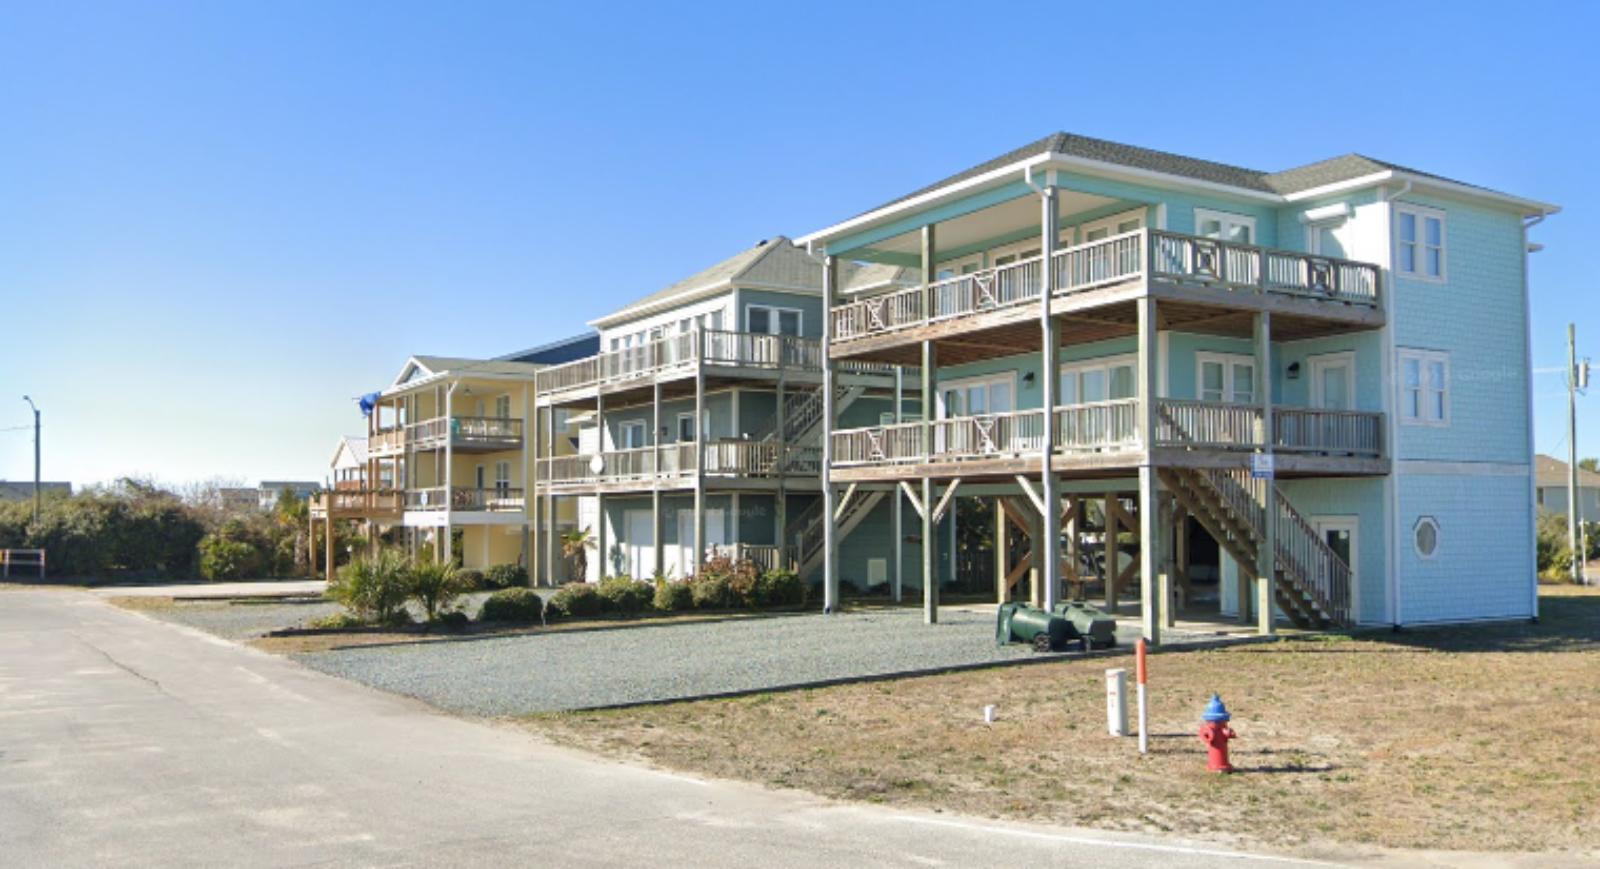
Topsail Beach occupies the southern portion of Topsail Island, offering 26 miles of pristine beaches and a reputation as one of North Carolina’s most unspoiled coastal destinations. This small town of approximately 400 year-round residents has successfully maintained its quiet, family-friendly character while developing into a highly desirable residential and vacation rental market. The community’s location provides easy access from both Wilmington and Jacksonville, making it attractive to military families, retirees, and second-home buyers seeking tranquil coastal living.
Topsail Beach’s dramatic price appreciation reflects its emergence as a premier coastal destination within North Carolina’s competitive beach market. The town’s combination of pristine natural settings, excellent recreational opportunities, and small-town atmosphere has attracted buyers from across the region seeking exclusive beachfront living. Recent market strength demonstrates Topsail Beach’s successful transition from a regional vacation spot to a nationally recognized luxury coastal community commanding premium prices for quality oceanfront properties.
7. Duck – 80% Home Price Increase Since 2010
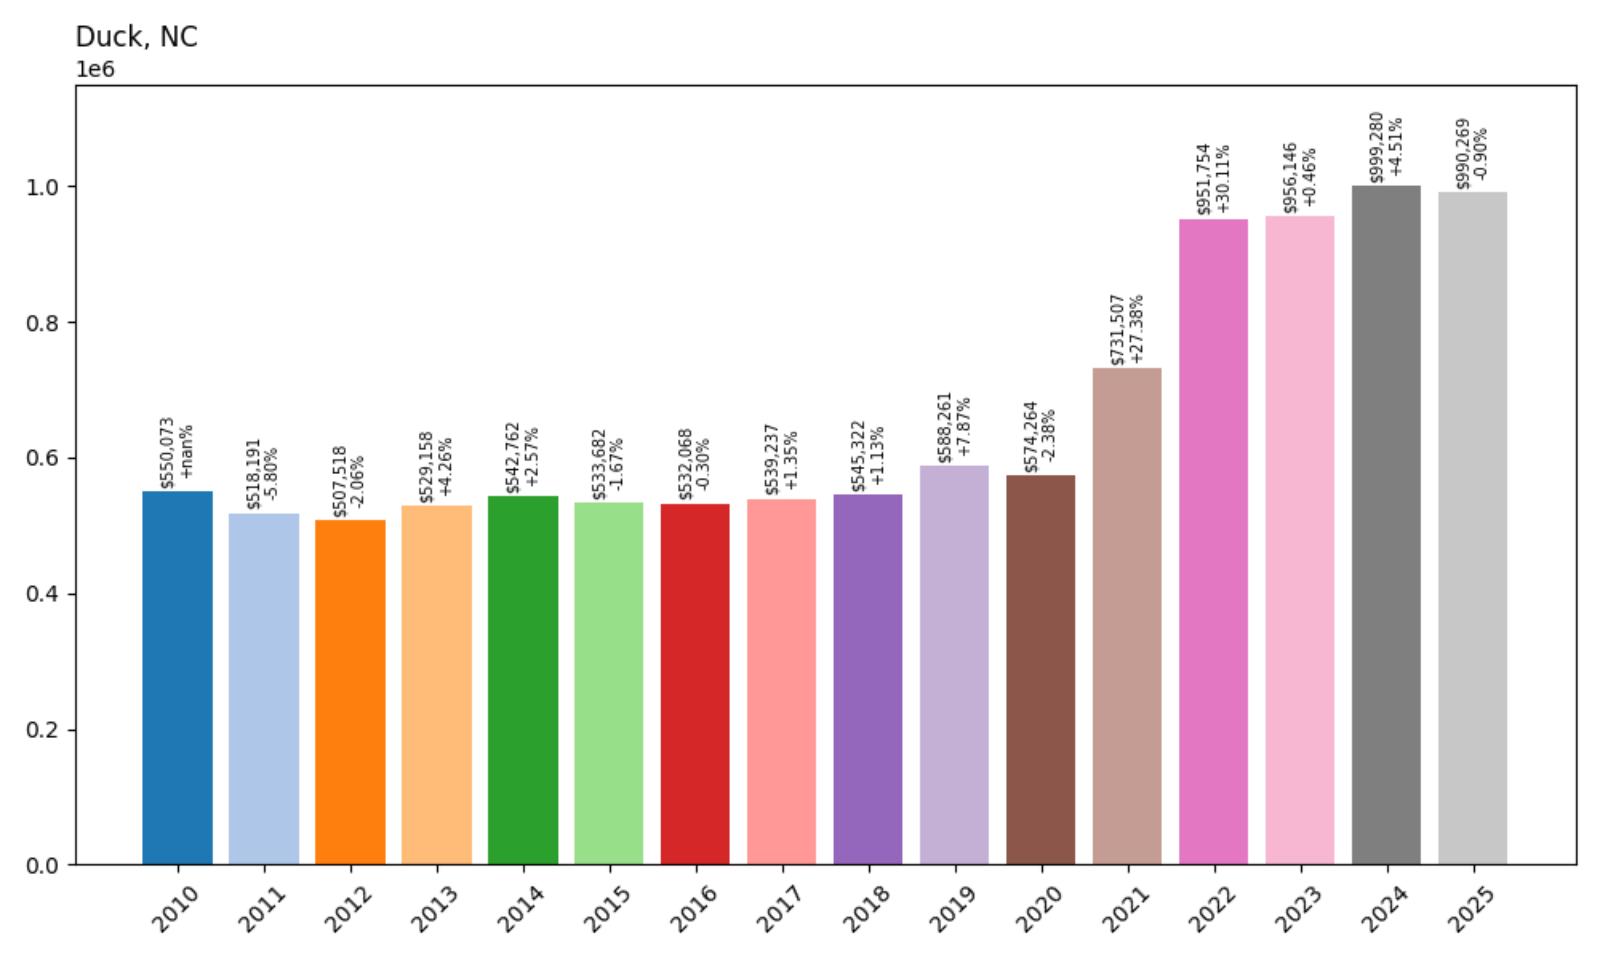
- 2010: $550,073
- 2011: $518,191 (−$31,882, −5.80% from previous year)
- 2012: $507,518 (−$10,673, −2.06% from previous year)
- 2013: $529,158 (+$21,640, +4.26% from previous year)
- 2014: $542,762 (+$13,604, +2.57% from previous year)
- 2015: $533,682 (−$9,081, −1.67% from previous year)
- 2016: $532,068 (−$1,613, −0.30% from previous year)
- 2017: $539,237 (+$7,169, +1.35% from previous year)
- 2018: $545,322 (+$6,086, +1.13% from previous year)
- 2019: $588,261 (+$42,939, +7.87% from previous year)
- 2020: $574,264 (−$13,997, −2.38% from previous year)
- 2021: $731,507 (+$157,244, +27.38% from previous year)
- 2022: $951,754 (+$220,247, +30.11% from previous year)
- 2023: $956,146 (+$4,392, +0.46% from previous year)
- 2024: $999,280 (+$43,134, +4.51% from previous year)
- 2025: $990,269 (−$9,011, −0.90% from previous year)
Duck’s housing market exemplifies Outer Banks sophistication, with current home values at $990,269 representing an 80% increase since 2010. The community showed modest, uneven growth through most of the 2010s before finding stronger momentum around 2019. Pandemic-era increases of 27% and 30% brought substantial appreciation, with recent performance showing some softening but values remaining near record levels, reflecting the area’s established premium market position.
Duck – Outer Banks Sophistication
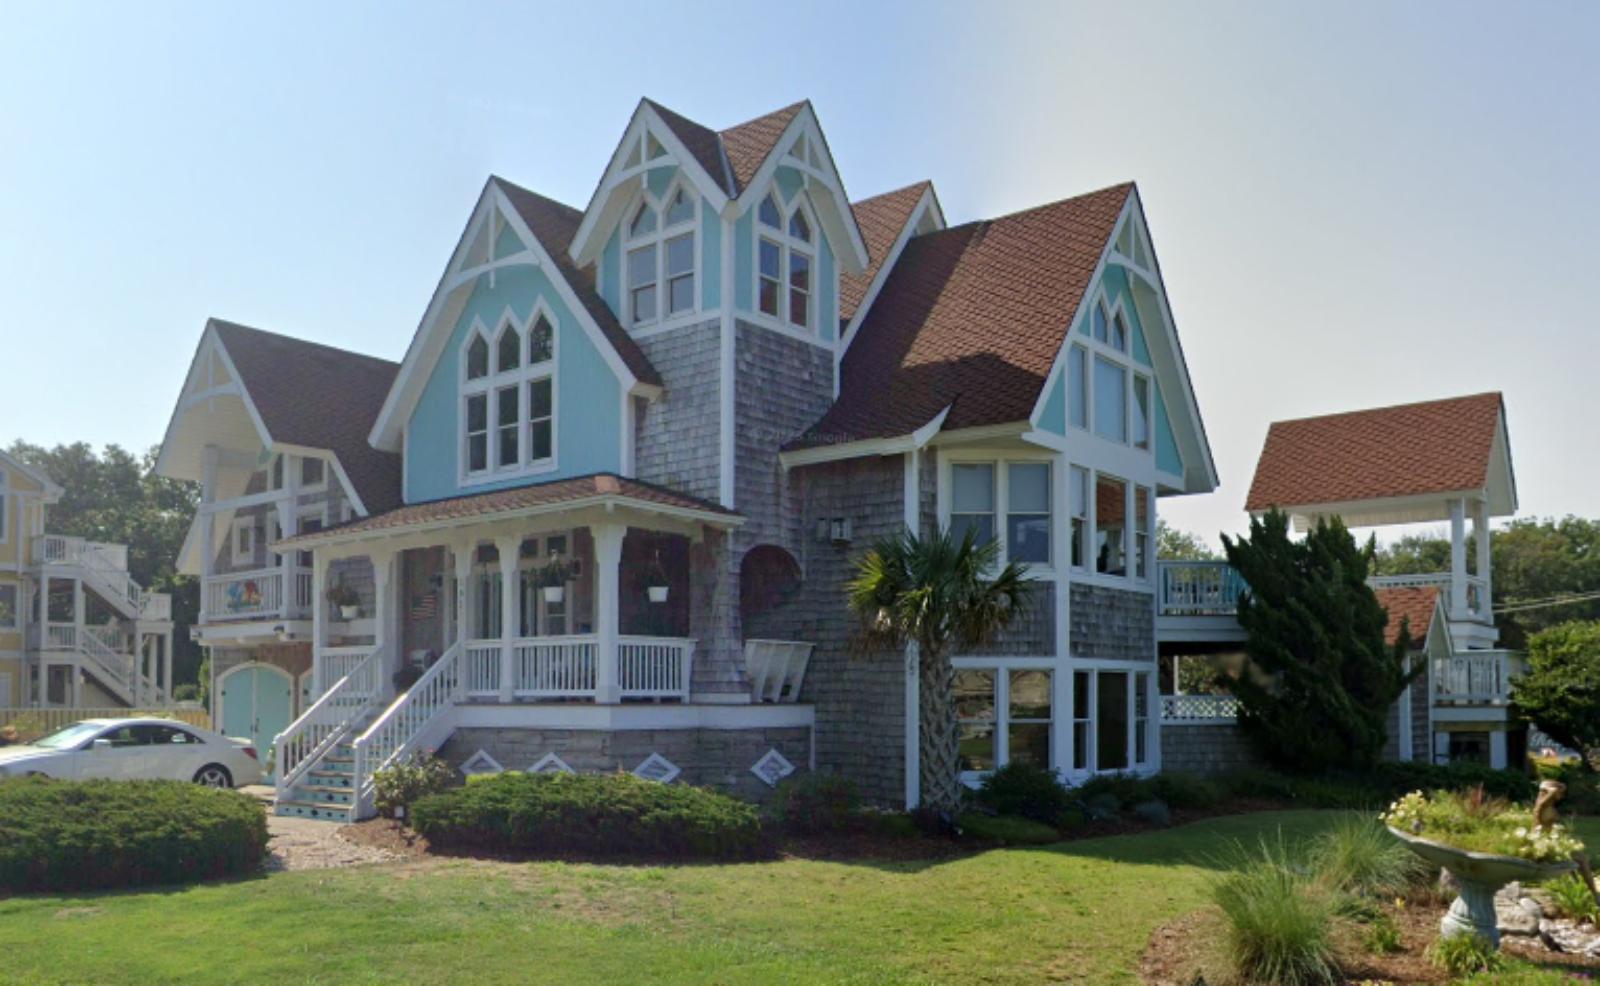
Duck represents the pinnacle of Outer Banks sophistication, combining natural beauty with upscale amenities that have made it one of North Carolina’s most desirable beach destinations. This incorporated town of approximately 400 year-round residents has successfully created a unique identity that balances tourist amenities with residential exclusivity. The famous Duck boardwalk, lined with boutique shops and restaurants, serves as the community’s social and commercial heart while maintaining the relaxed atmosphere that attracts affluent visitors and residents.
The town’s housing market consists predominantly of luxury beach houses and upscale condominiums, many featuring distinctive architecture that reflects Duck’s commitment to aesthetic standards. Properties range from soundside retreats to oceanfront estates, with many designed to accommodate both family use and high-end vacation rentals. Duck’s location provides access to pristine beaches while offering protected sound waters perfect for boating and water sports, creating diverse recreational opportunities that appeal to sophisticated buyers.
6. Highlands – 119% Home Price Increase Since 2010
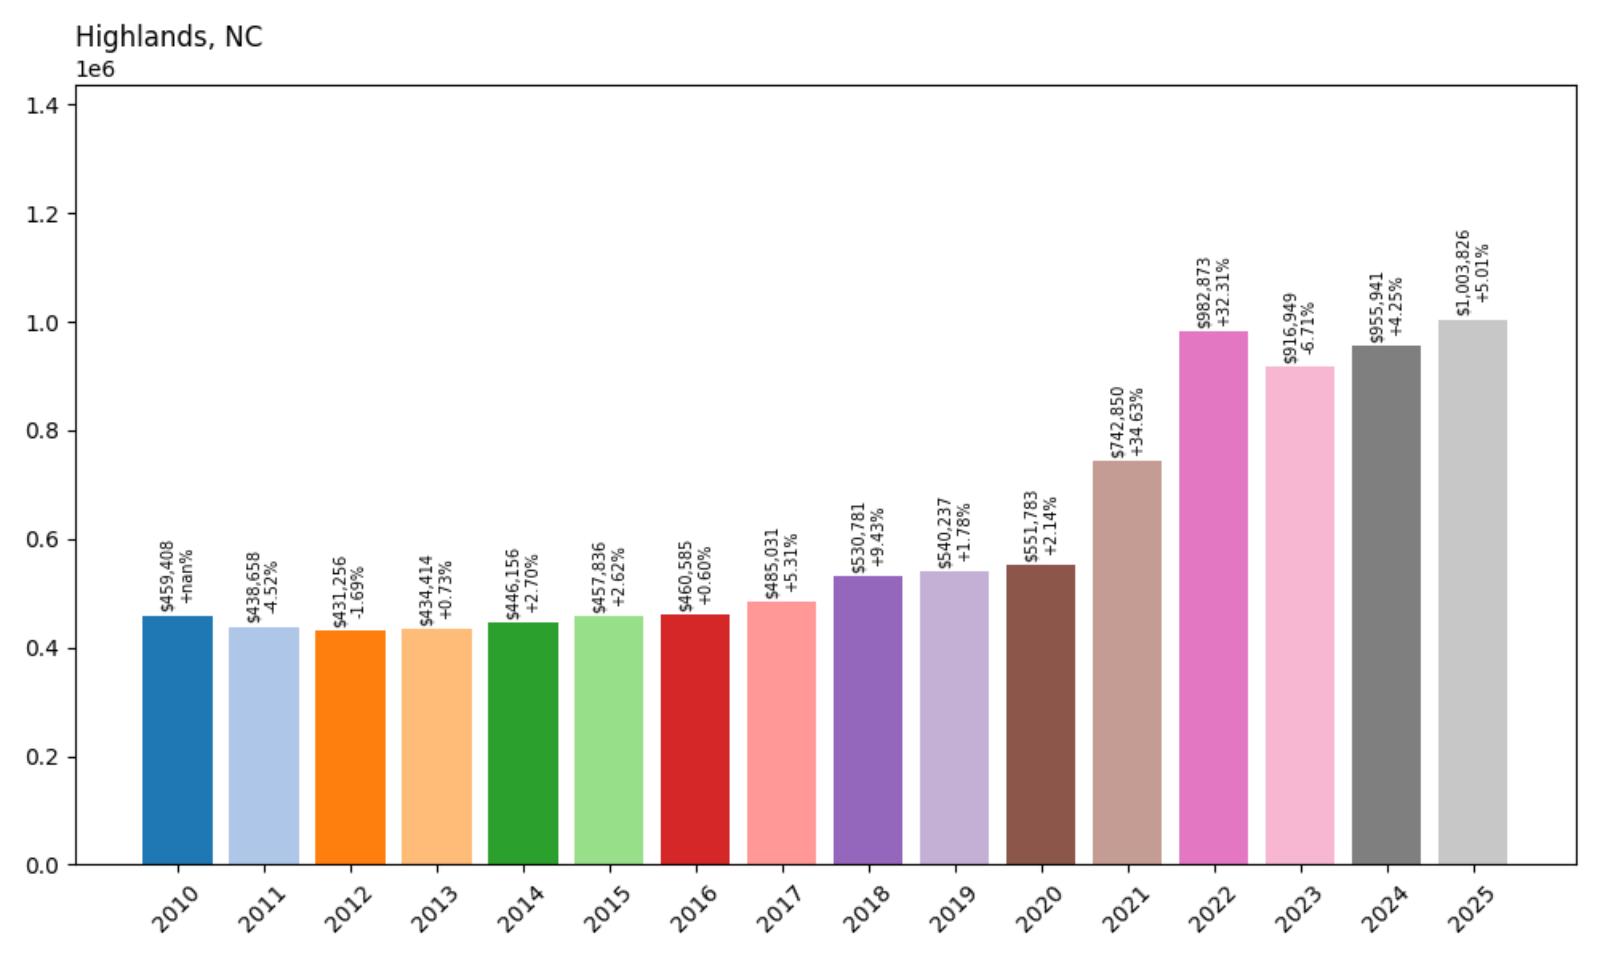
- 2010: $459,408
- 2011: $438,658 (−$20,750, −4.52% from previous year)
- 2012: $431,256 (−$7,402, −1.69% from previous year)
- 2013: $434,414 (+$3,158, +0.73% from previous year)
- 2014: $446,156 (+$11,742, +2.70% from previous year)
- 2015: $457,836 (+$11,680, +2.62% from previous year)
- 2016: $460,585 (+$2,749, +0.60% from previous year)
- 2017: $485,031 (+$24,446, +5.31% from previous year)
- 2018: $530,781 (+$45,750, +9.43% from previous year)
- 2019: $540,237 (+$9,456, +1.78% from previous year)
- 2020: $551,783 (+$11,546, +2.14% from previous year)
- 2021: $742,850 (+$191,067, +34.63% from previous year)
- 2022: $982,873 (+$240,022, +32.31% from previous year)
- 2023: $916,949 (−$65,924, −6.71% from previous year)
- 2024: $955,941 (+$38,993, +4.25% from previous year)
- 2025: $1,003,826 (+$47,884, +5.01% from previous year)
Highlands showcases remarkable mountain market strength, with current home values at $1,003,826 representing a substantial 119% increase since 2010. The community experienced modest growth through most of the 2010s with acceleration beginning in 2017-2018. Pandemic-era increases of 35% and 32% brought dramatic appreciation, followed by some market correction in 2023 before resuming strong growth that has pushed values above the $1 million threshold.
Highlands – Southern Highlands Elegance
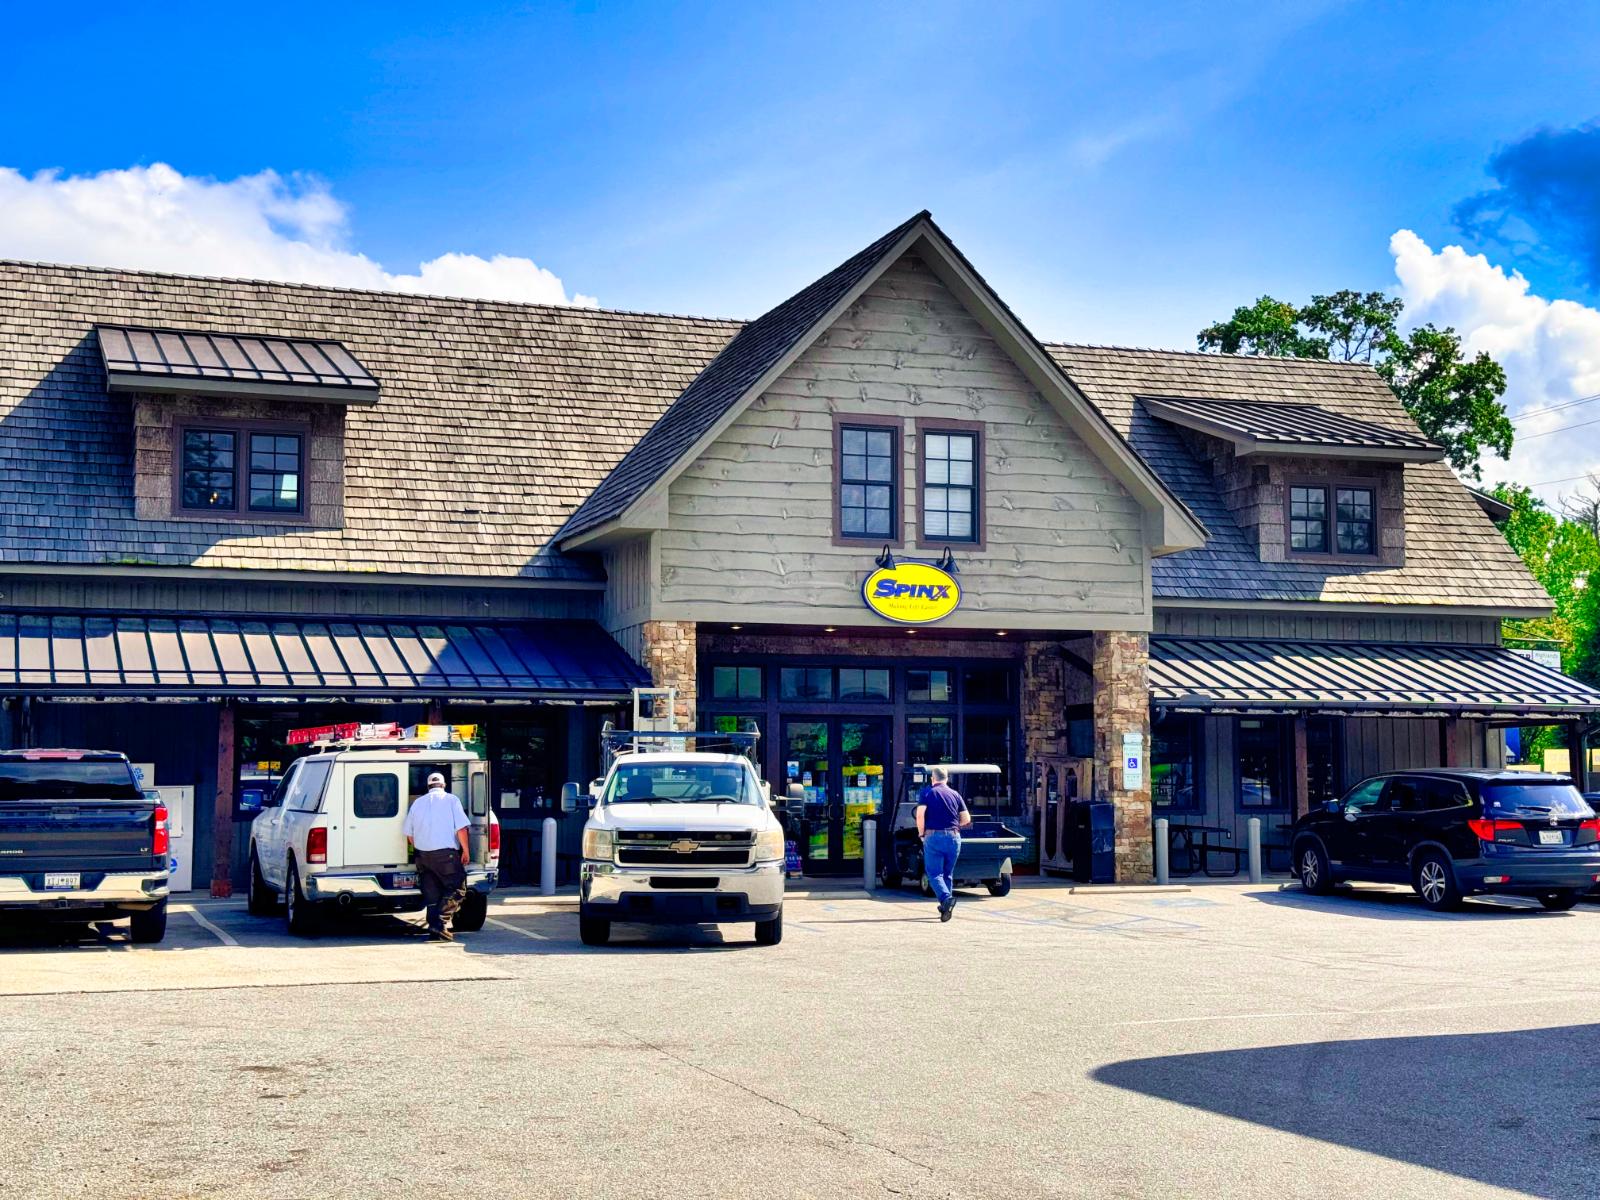
Highlands stands as one of the Southeast’s most prestigious mountain communities, perched at 4,118 feet elevation in the Blue Ridge Mountains near the Georgia and South Carolina borders. This charming town of approximately 1,000 residents has maintained its reputation as a sophisticated summer retreat since the late 1800s, attracting affluent families seeking cooler temperatures and mountain elegance. The community’s Main Street features upscale boutiques, art galleries, and fine dining establishments that create a cosmopolitan atmosphere rare in mountain settings.
Highlands’ exceptional price appreciation reflects its position as the premier luxury mountain destination in the southeastern United States. The community’s combination of natural beauty, sophisticated amenities, and exclusivity has created sustained demand among affluent buyers from across the region and beyond. Recent market performance demonstrates Highlands’ successful evolution from a regional summer retreat to a year-round luxury destination attracting buyers seeking the ultimate in mountain living, with property values now exceeding $1 million reflecting its status among America’s most expensive mountain communities.
5. Weddington – 146% Home Price Increase Since 2010
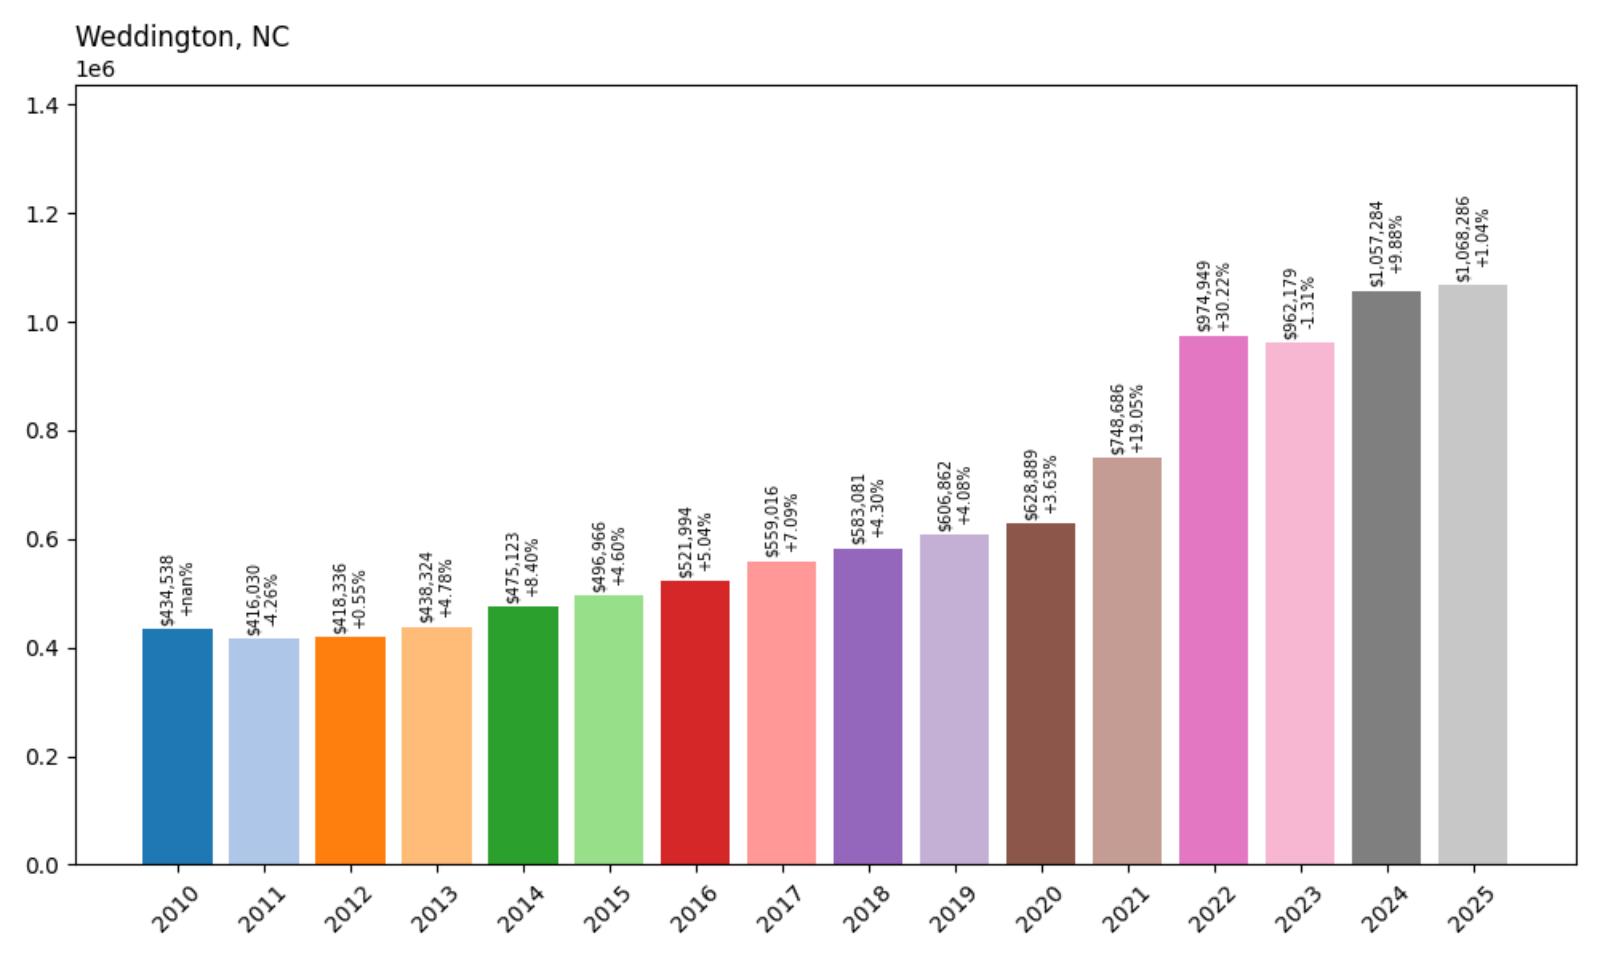
- 2010: $434,538
- 2011: $416,030 (−$18,509, −4.26% from previous year)
- 2012: $418,336 (+$2,306, +0.55% from previous year)
- 2013: $438,324 (+$19,988, +4.78% from previous year)
- 2014: $475,123 (+$36,800, +8.40% from previous year)
- 2015: $496,966 (+$21,843, +4.60% from previous year)
- 2016: $521,994 (+$25,028, +5.04% from previous year)
- 2017: $559,016 (+$37,022, +7.09% from previous year)
- 2018: $583,081 (+$24,065, +4.30% from previous year)
- 2019: $606,862 (+$23,781, +4.08% from previous year)
- 2020: $628,889 (+$22,027, +3.63% from previous year)
- 2021: $748,686 (+$119,798, +19.05% from previous year)
- 2022: $974,949 (+$226,263, +30.22% from previous year)
- 2023: $962,179 (−$12,770, −1.31% from previous year)
- 2024: $1,057,284 (+$95,104, +9.88% from previous year)
- 2025: $1,068,286 (+$11,002, +1.04% from previous year)
Weddington demonstrates exceptional suburban growth, with current home values at $1,068,286 representing a remarkable 146% increase since 2010. The community experienced consistent strong appreciation throughout the 2010s, with particularly robust growth from 2014-2017. Pandemic-era increases of 19% and 30% brought substantial appreciation, followed by continued growth that has pushed values above $1 million, establishing Weddington among North Carolina’s most expensive communities.
Weddington – Charlotte Suburb Excellence
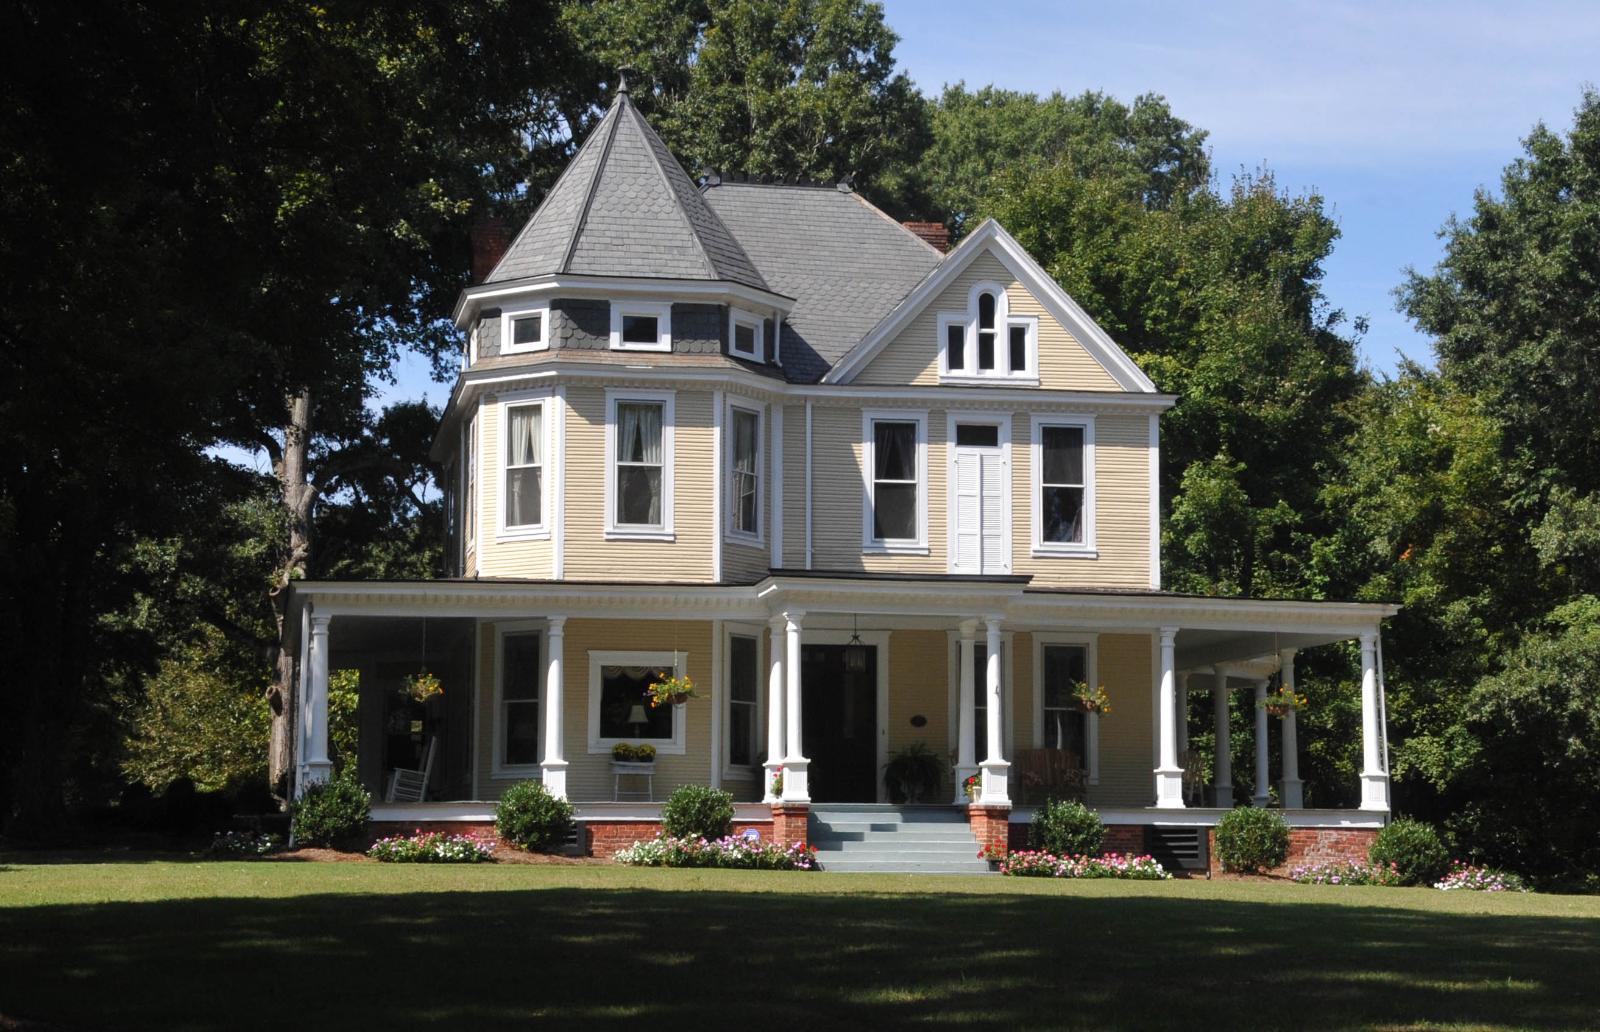
Weddington represents one of the Charlotte metropolitan area’s most prestigious suburban communities, strategically located in Union County just south of the city. This incorporated town of approximately 11,000 residents has successfully maintained its small-town character while developing into one of the region’s most desirable addresses for affluent families. The community features excellent schools, well-planned neighborhoods, and easy access to Charlotte’s business district, creating an ideal combination for high-earning professionals seeking suburban luxury.
The town’s housing market consists primarily of large single-family homes on generous lots, many featuring custom architecture and upscale amenities. Weddington’s zoning standards ensure spacious properties and architectural quality that supports premium pricing throughout the community. The presence of championship golf courses, including the prestigious Weddington Golf and Tennis Club, adds recreational amenities that enhance property values while creating a country club atmosphere that appeals to successful professionals and executives.
4. Marvin – 138% Home Price Increase Since 2010
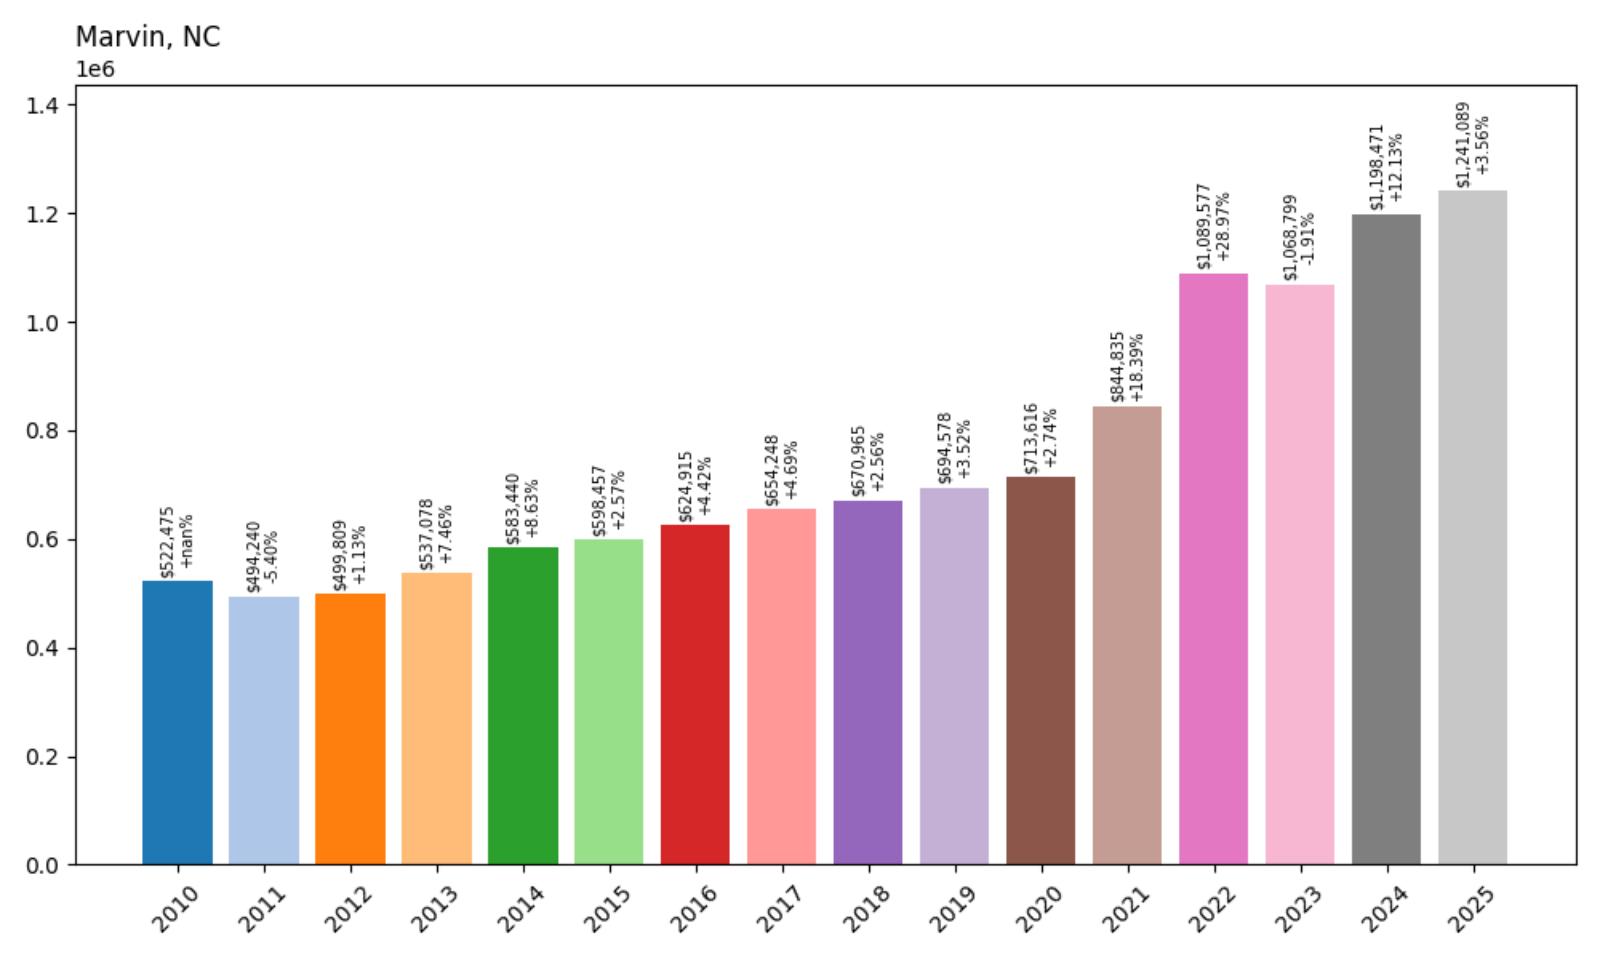
- 2010: $522,475
- 2011: $494,240 (−$28,235, −5.40% from previous year)
- 2012: $499,809 (+$5,569, +1.13% from previous year)
- 2013: $537,078 (+$37,269, +7.46% from previous year)
- 2014: $583,440 (+$46,362, +8.63% from previous year)
- 2015: $598,457 (+$15,018, +2.57% from previous year)
- 2016: $624,915 (+$26,458, +4.42% from previous year)
- 2017: $654,248 (+$29,333, +4.69% from previous year)
- 2018: $670,965 (+$16,718, +2.56% from previous year)
- 2019: $694,578 (+$23,613, +3.52% from previous year)
- 2020: $713,616 (+$19,038, +2.74% from previous year)
- 2021: $844,835 (+$131,220, +18.39% from previous year)
- 2022: $1,089,577 (+$244,742, +28.97% from previous year)
- 2023: $1,068,799 (−$20,778, −1.91% from previous year)
- 2024: $1,198,471 (+$129,672, +12.13% from previous year)
- 2025: $1,241,089 (+$42,617, +3.56% from previous year)
Marvin showcases consistent luxury market strength, with current home values at $1,241,089 representing a substantial 138% increase since 2010. The community demonstrated steady, strong appreciation throughout the entire period, with particularly robust growth from 2013-2014. Pandemic-era increases of 18% and 29% brought dramatic appreciation, followed by continued growth that has established Marvin as one of North Carolina’s most expensive residential communities.
Marvin – Lake Norman Luxury
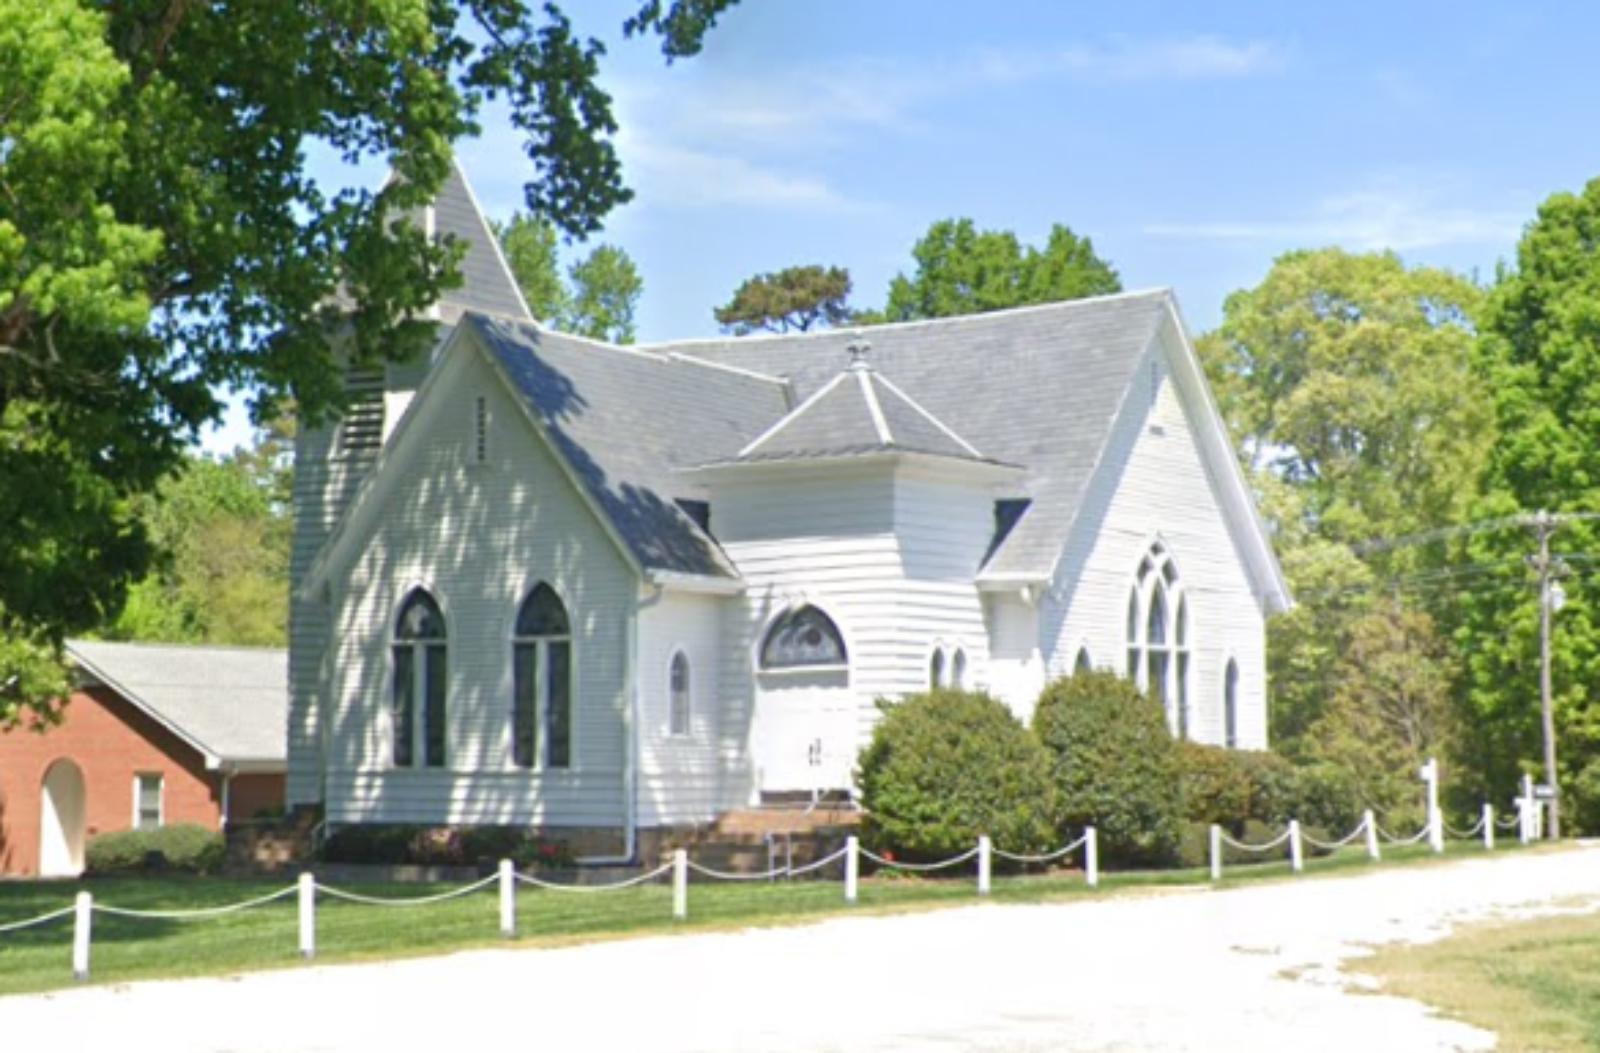
Marvin occupies a prime position in Union County, offering residents a unique combination of suburban luxury and Lake Norman access within easy commuting distance of Charlotte. This incorporated town of approximately 6,000 residents has developed a reputation as one of the most exclusive addresses in the Charlotte metropolitan area. The community features large estate-style properties, many with lake access or views, creating a country estate atmosphere that appeals to the region’s most successful professionals and business leaders.
Marvin’s exceptional price appreciation reflects its position as the Charlotte area’s premier luxury residential destination. The community’s combination of Lake Norman access, estate-style properties, and proximity to Charlotte’s business district has created sustained demand among the region’s most affluent buyers. Recent market performance demonstrates Marvin’s continued evolution as a luxury enclave, with property values now exceeding $1.2 million, establishing it among North Carolina’s most expensive communities and reflecting its status as a premier destination for those seeking the ultimate in suburban luxury living.
3. Cashiers – 143% Home Price Increase Since 2010
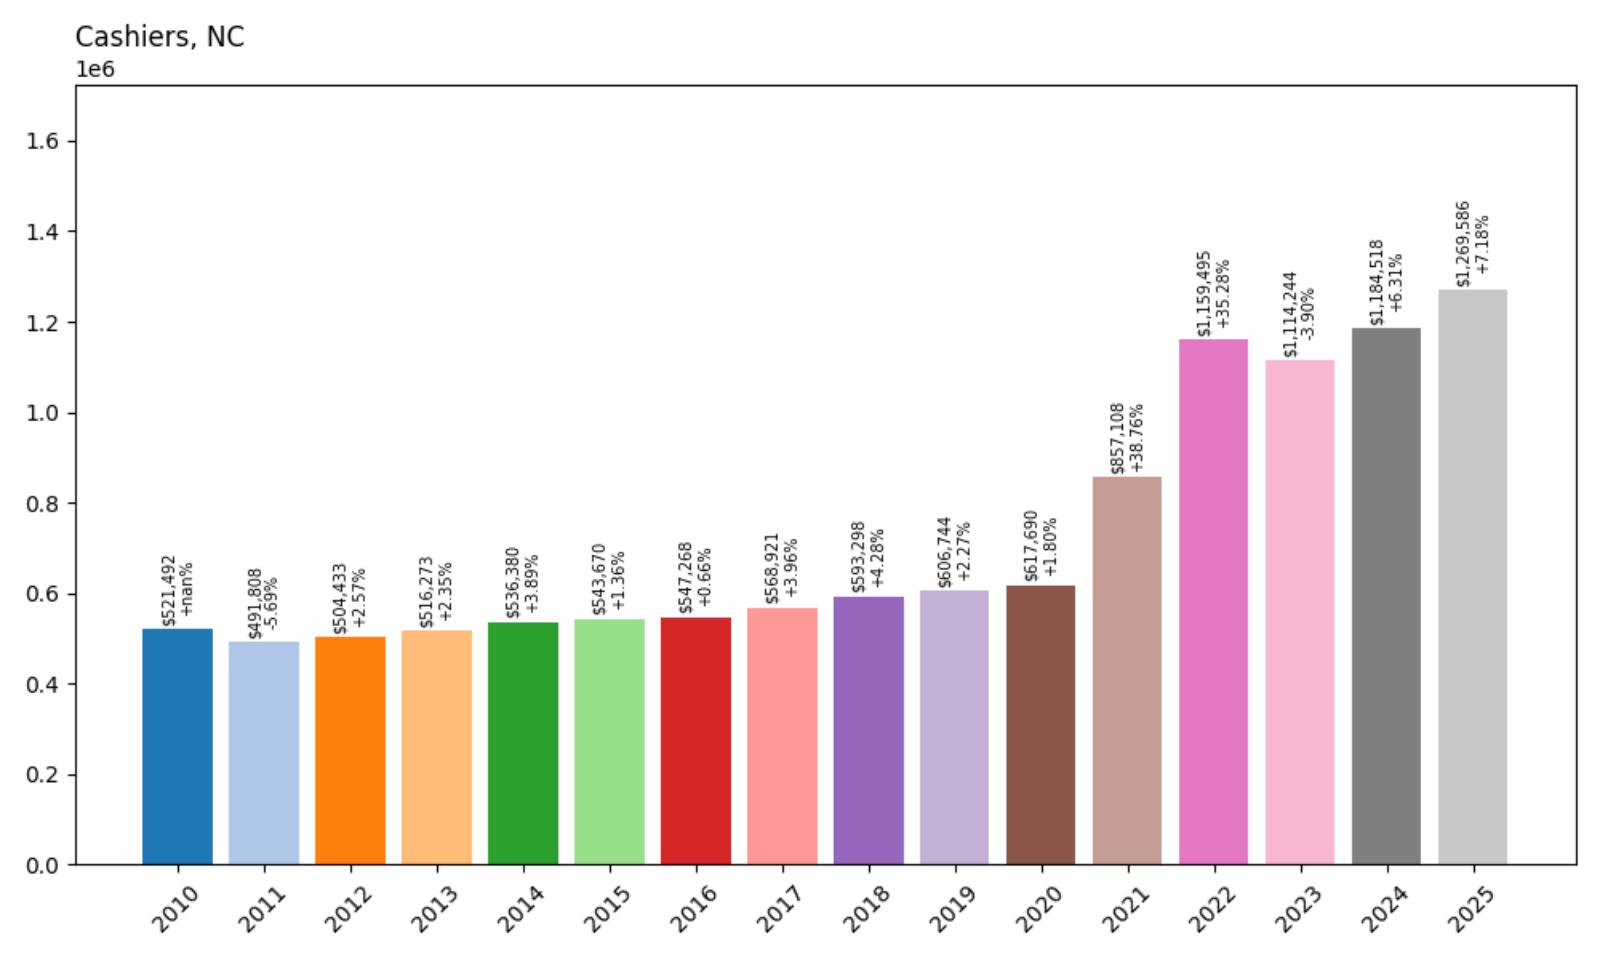
- 2010: $521,492
- 2011: $491,808 (−$29,684, −5.69% from previous year)
- 2012: $504,433 (+$12,625, +2.57% from previous year)
- 2013: $516,273 (+$11,839, +2.35% from previous year)
- 2014: $536,380 (+$20,108, +3.89% from previous year)
- 2015: $543,670 (+$7,290, +1.36% from previous year)
- 2016: $547,268 (+$3,598, +0.66% from previous year)
- 2017: $568,921 (+$21,652, +3.96% from previous year)
- 2018: $593,298 (+$24,377, +4.28% from previous year)
- 2019: $606,744 (+$13,446, +2.27% from previous year)
- 2020: $617,690 (+$10,945, +1.80% from previous year)
- 2021: $857,108 (+$239,418, +38.76% from previous year)
- 2022: $1,159,495 (+$302,387, +35.28% from previous year)
- 2023: $1,114,244 (−$45,251, −3.90% from previous year)
- 2024: $1,184,518 (+$70,274, +6.31% from previous year)
- 2025: $1,269,586 (+$85,068, +7.18% from previous year)
Cashiers displays extraordinary mountain market performance, with current home values at $1,269,586 representing a remarkable 143% increase since 2010. The community showed steady, modest growth through most of the 2010s before experiencing explosive pandemic-era appreciation with consecutive increases of 39% and 35%. Recent years demonstrate continued strong growth, with values climbing above $1.25 million and establishing Cashiers among North Carolina’s most expensive communities.
Cashiers – Mountain Resort Paradise

Cashiers stands as one of the Southeast’s most exclusive mountain resort communities, situated at 3,500 feet elevation in the heart of the Blue Ridge Mountains. This unincorporated community in Jackson County has evolved from a simple mountain crossroads into a sophisticated destination attracting affluent buyers from across the nation. The area’s stunning natural beauty, combined with world-class golf courses, luxury resorts, and fine dining, creates a unique mountain lifestyle that commands premium pricing.
The community’s housing market features an impressive collection of luxury mountain estates, golf course properties, and custom homes designed to take advantage of spectacular mountain views. Cashiers’ location provides access to numerous recreational opportunities, including championship golf courses at Highlands Falls Country Club and Wade Hampton Golf Club, both consistently ranked among America’s finest. The area’s waterfalls, hiking trails, and proximity to both Highlands and Lake Toxaway add recreational and cultural amenities that enhance property values throughout the region.
2. Bald Head Island – 47% Home Price Increase Since 2010
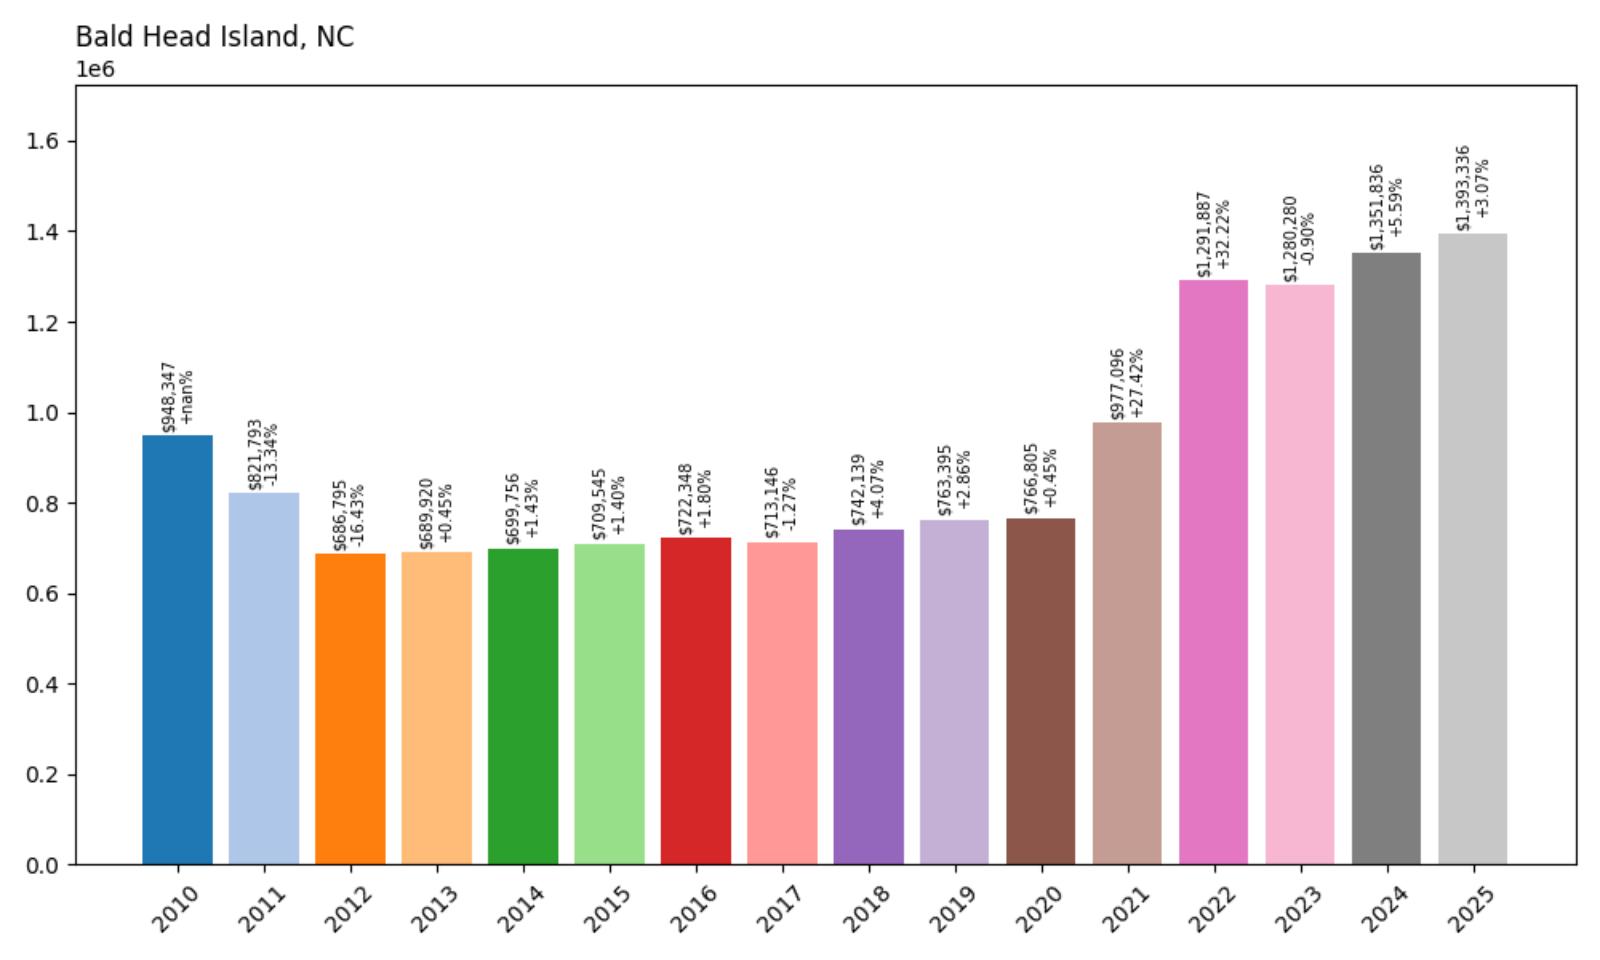
- 2010: $948,347
- 2011: $821,793 (−$126,553, −13.34% from previous year)
- 2012: $686,795 (−$134,999, −16.43% from previous year)
- 2013: $689,920 (+$3,125, +0.45% from previous year)
- 2014: $699,756 (+$9,836, +1.43% from previous year)
- 2015: $709,545 (+$9,789, +1.40% from previous year)
- 2016: $722,348 (+$12,803, +1.80% from previous year)
- 2017: $713,146 (−$9,202, −1.27% from previous year)
- 2018: $742,139 (+$28,993, +4.07% from previous year)
- 2019: $763,395 (+$21,256, +2.86% from previous year)
- 2020: $766,805 (+$3,410, +0.45% from previous year)
- 2021: $977,096 (+$210,291, +27.42% from previous year)
- 2022: $1,291,887 (+$314,791, +32.22% from previous year)
- 2023: $1,280,280 (−$11,607, −0.90% from previous year)
- 2024: $1,351,836 (+$71,555, +5.59% from previous year)
- 2025: $1,393,336 (+$41,500, +3.07% from previous year)
Bald Head Island demonstrates unique luxury market dynamics, with current home values at $1,393,336 representing a 47% increase since 2010. The community experienced significant early 2010s challenges with substantial declines, followed by slow recovery through the decade. Pandemic-era increases of 27% and 32% brought dramatic appreciation, with continued growth establishing the island among North Carolina’s most expensive residential destinations despite the lower overall percentage gain.
Bald Head Island – Private Island Sanctuary

Bald Head Island represents the ultimate in exclusive coastal living as North Carolina’s premier private island community. Accessible only by passenger ferry or private boat, this 12,000-acre barrier island off the coast of Southport offers residents and visitors a car-free environment where golf carts provide transportation and pristine beaches stretch for 14 miles. The island successfully balances environmental conservation with luxury development, creating one of the most unique residential destinations on the East Coast.
Bald Head Island’s position as North Carolina’s second most expensive community reflects its unique status as an exclusive private island destination. The combination of car-free living, pristine natural settings, luxury amenities, and complete privacy creates a lifestyle that appeals to the nation’s most affluent buyers seeking the ultimate coastal retreat. Recent market performance demonstrates the island’s recovery from earlier challenges and its establishment as a premier luxury destination commanding prices that reflect its extraordinary exclusivity and natural beauty.
1. Wrightsville Beach – 102% Home Price Increase Since 2010
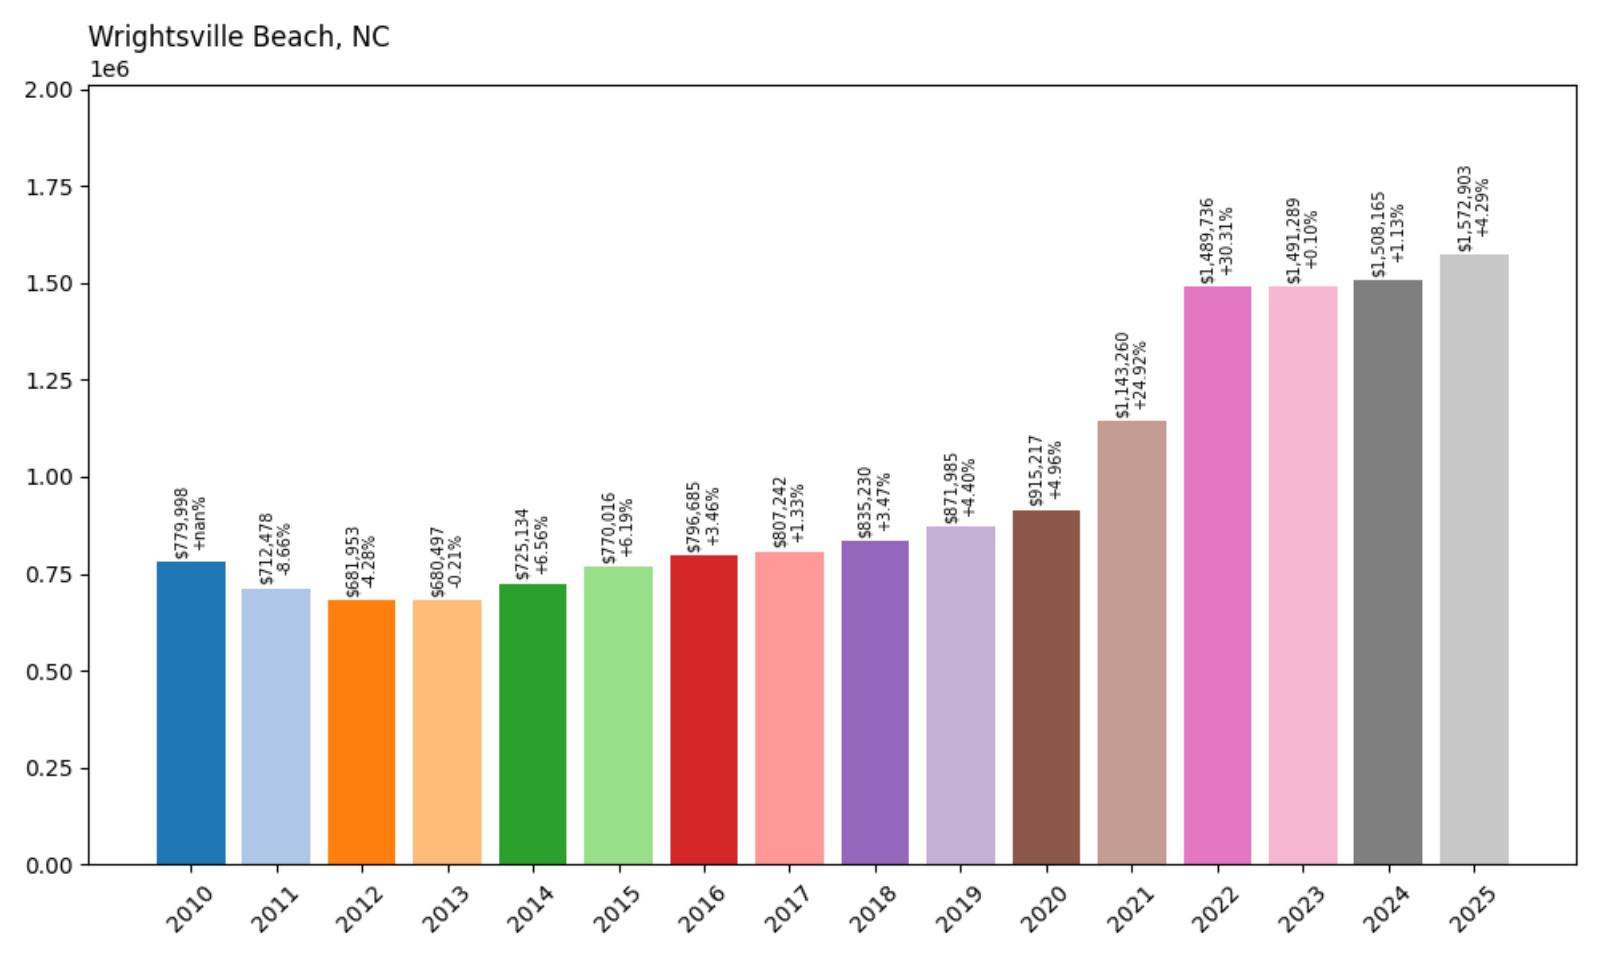
- 2010: $779,998
- 2011: $712,478 (−$67,519, −8.66% from previous year)
- 2012: $681,953 (−$30,525, −4.28% from previous year)
- 2013: $680,497 (−$1,456, −0.21% from previous year)
- 2014: $725,134 (+$44,637, +6.56% from previous year)
- 2015: $770,016 (+$44,881, +6.19% from previous year)
- 2016: $796,685 (+$26,670, +3.46% from previous year)
- 2017: $807,242 (+$10,557, +1.33% from previous year)
- 2018: $835,230 (+$27,987, +3.47% from previous year)
- 2019: $871,985 (+$36,756, +4.40% from previous year)
- 2020: $915,217 (+$43,232, +4.96% from previous year)
- 2021: $1,143,260 (+$228,042, +24.92% from previous year)
- 2022: $1,489,736 (+$346,476, +30.31% from previous year)
- 2023: $1,491,289 (+$1,553, +0.10% from previous year)
- 2024: $1,508,165 (+$16,877, +1.13% from previous year)
- 2025: $1,572,903 (+$64,738, +4.29% from previous year)
Wrightsville Beach claims the title of North Carolina’s most expensive community, with current home values at $1,572,903 representing a substantial 102% increase since 2010. After weathering post-recession challenges through 2013, the community achieved steady recovery and growth through the decade. Pandemic-era increases of 25% and 30% brought dramatic appreciation, with continued growth pushing values above $1.5 million and establishing Wrightsville Beach as the state’s premier luxury residential destination.
Wrightsville Beach – North Carolina’s Premier Coastal Destination
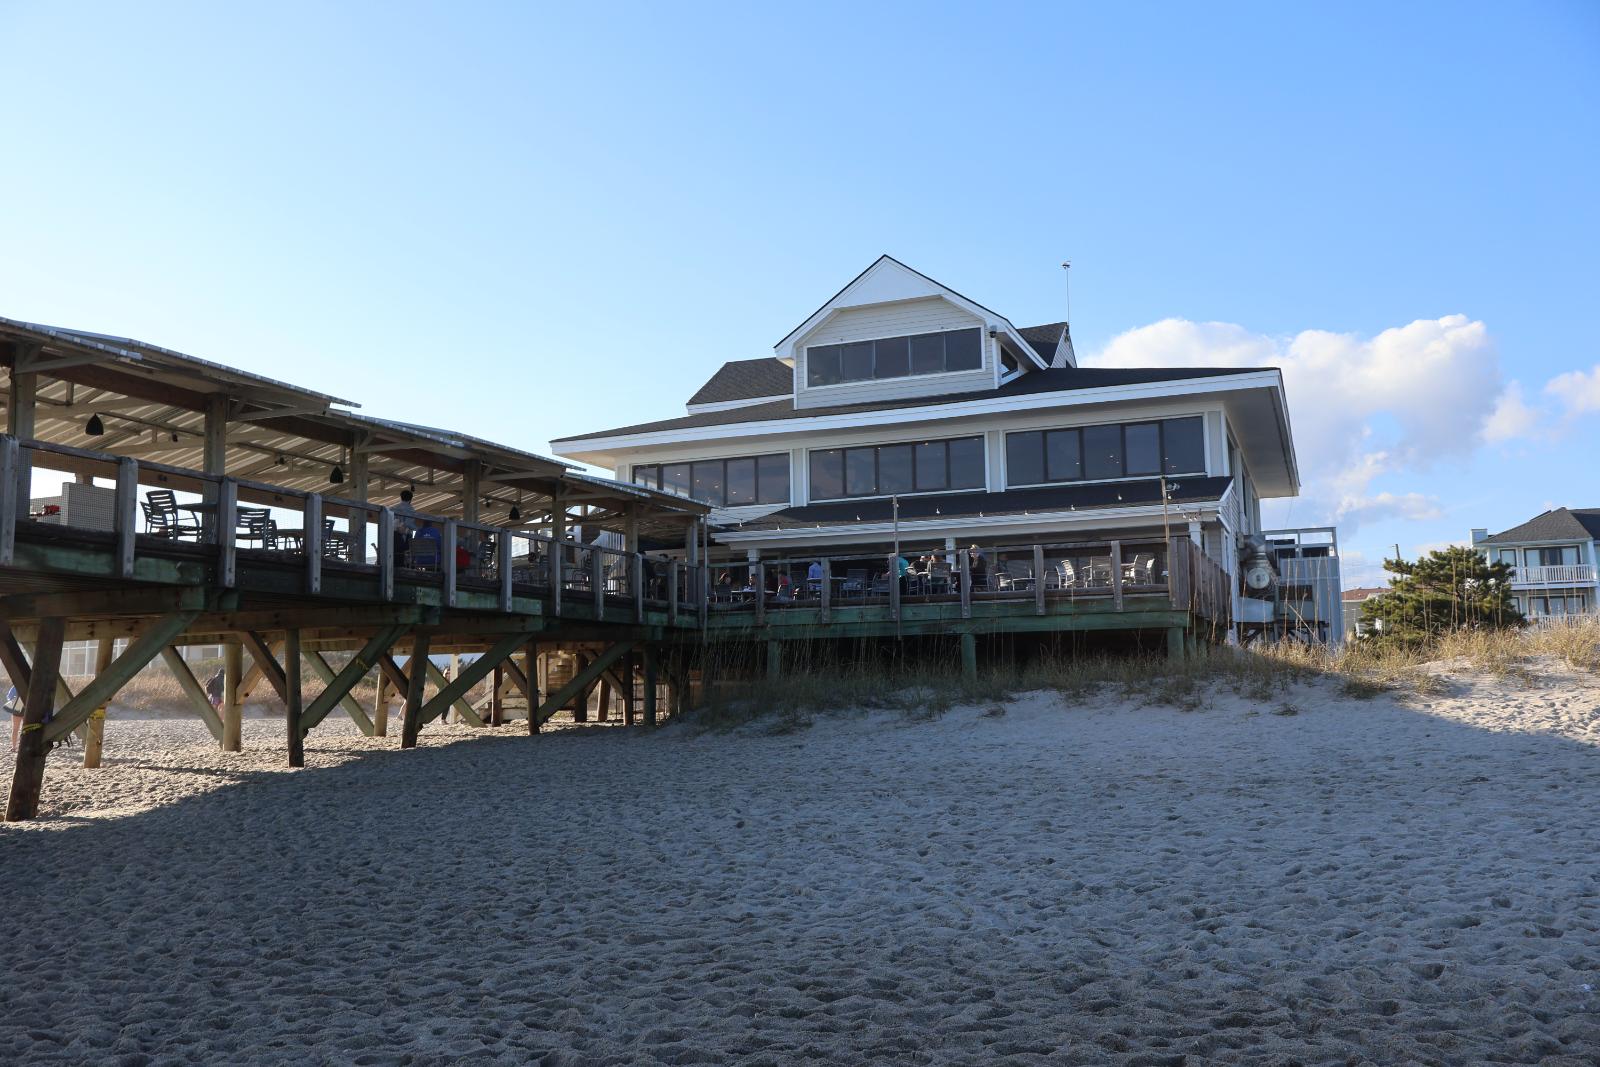
Wrightsville Beach stands as North Carolina’s most prestigious coastal community, representing the pinnacle of beachfront luxury in the state. This barrier island town of approximately 2,500 residents has successfully maintained its reputation as an exclusive destination while remaining accessible to Wilmington, just minutes across the Intracoastal Waterway. The community’s four miles of pristine beaches, combined with sophisticated dining, shopping, and recreational amenities, create an unparalleled coastal lifestyle that attracts the state’s most affluent residents and visitors.
Wrightsville Beach’s position as North Carolina’s most expensive community reflects its unique combination of natural beauty, luxury amenities, and proximity to urban conveniences. The town’s limited geographic area and strict development standards create natural scarcity that supports premium pricing, while its reputation for excellence attracts buyers from across the nation seeking the ultimate in coastal living. Recent market performance demonstrates Wrightsville Beach’s continued evolution as a luxury destination of national significance, with property values now exceeding $1.5 million reflecting its status as the crown jewel of North Carolina’s coastal real estate market.