🔥 Would you like to save this?
Housing prices in Nevada have climbed sharply over the past decade, and the Zillow Home Value Index provides a detailed look at which towns have become the most expensive. From rural outposts in the desert to booming suburban areas and scenic mountain retreats, Nevada’s real estate market has undergone major changes driven by both local growth and out-of-state demand. This ranking tracks the top 30 towns where home values have risen to the highest levels as of June 2025, comparing historical data dating back to 2010. Each entry includes year-by-year price changes, percentage growth, and commentary to help make sense of the long-term trends shaping these markets.
Many of these towns have seen a surge in prices during the pandemic-era housing boom, while others have climbed steadily over the years thanks to new development, proximity to major cities, or unique natural appeal. At the top of the list are some of Nevada’s most well-known luxury areas, but there are also a few surprises — towns that were once affordable but have seen their values skyrocket. Whether you’re a curious homeowner, an investor eyeing the next opportunity, or just interested in how Nevada’s housing markets stack up, this data-driven roundup offers a clear snapshot of where the most expensive real estate sits in the state right now.
In order to come up with the very specific design ideas, we create most designs with the assistance of state-of-the-art AI interior design software. Also, assume links that take you off the site are affiliate links such as links to Amazon. this means we may earn a commission if you buy something.
30. Overton – 124% Home Price Increase Since 2012
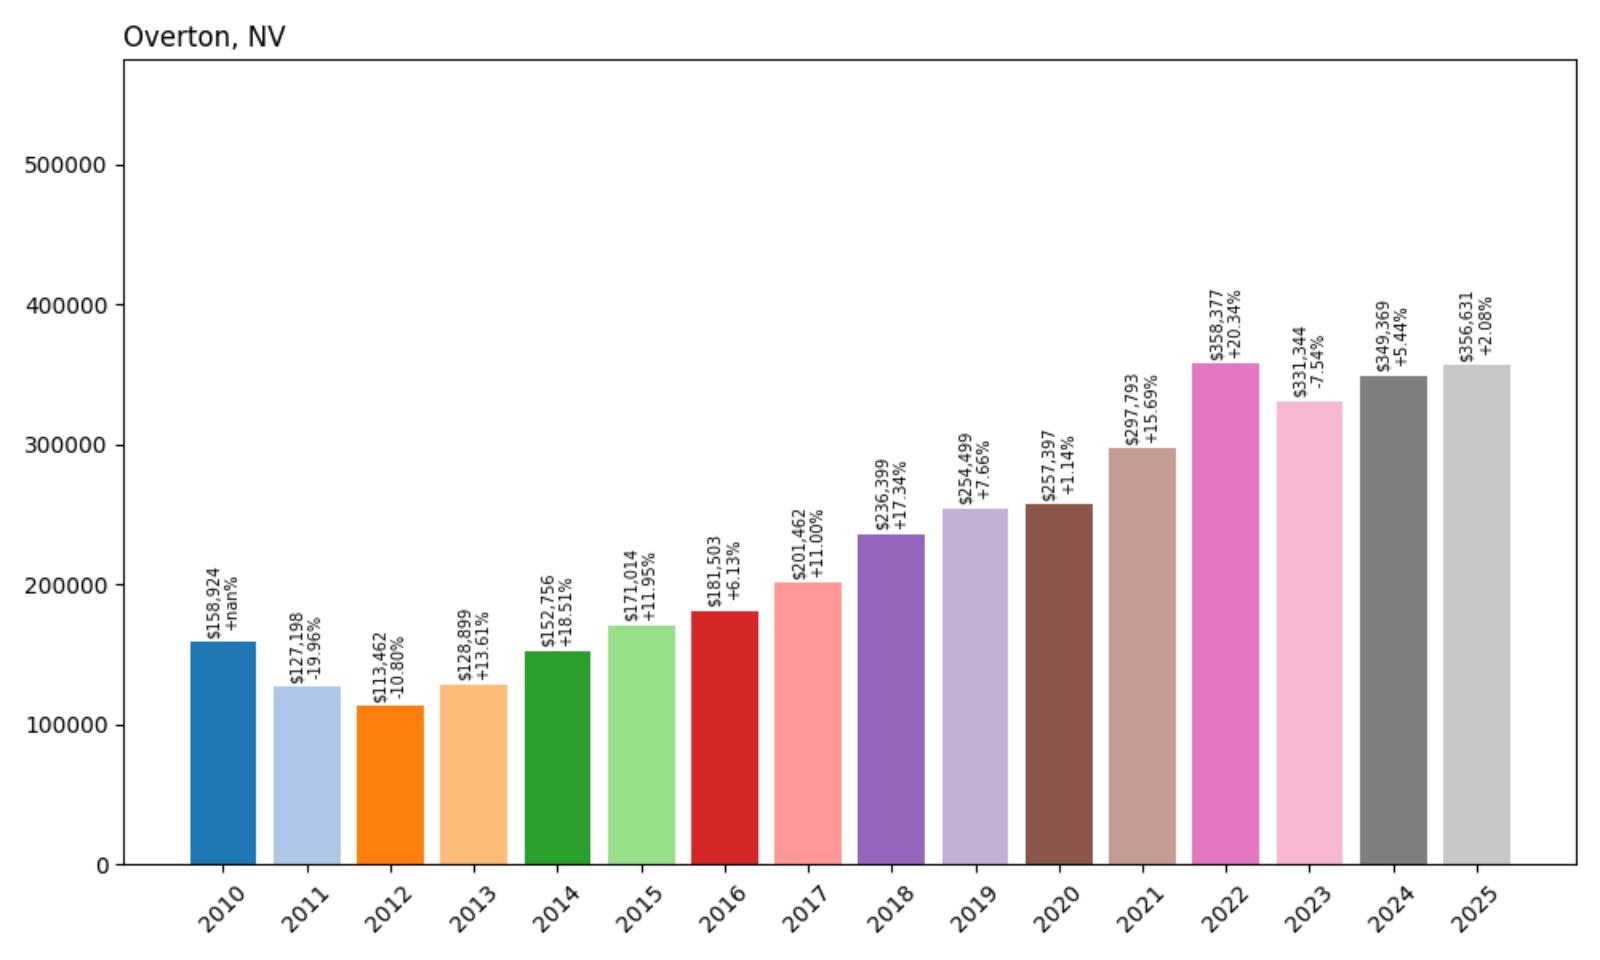
- 2010: $158,924
- 2011: $127,198 (−$31,727, −19.96% from previous year)
- 2012: $113,462 (−$13,735, −10.80% from previous year)
- 2013: $128,899 (+$15,437, +13.61% from previous year)
- 2014: $152,756 (+$23,857, +18.51% from previous year)
- 2015: $171,014 (+$18,259, +11.95% from previous year)
- 2016: $181,503 (+$10,488, +6.13% from previous year)
- 2017: $201,462 (+$19,960, +11.00% from previous year)
- 2018: $236,399 (+$34,937, +17.34% from previous year)
- 2019: $254,499 (+$18,100, +7.66% from previous year)
- 2020: $257,397 (+$2,898, +1.14% from previous year)
- 2021: $297,793 (+$40,396, +15.69% from previous year)
- 2022: $358,377 (+$60,584, +20.34% from previous year)
- 2023: $331,344 (−$27,033, −7.54% from previous year)
- 2024: $349,369 (+$18,025, +5.44% from previous year)
- 2025: $356,631 (+$7,262, +2.08% from previous year)
Overton’s housing market has transformed dramatically since bottoming out in 2012, with home values jumping from $113,462 to $356,631 — a 124% increase. After steep losses during the early 2010s, the town began a strong recovery in 2013 that continued for most of the decade. Particularly notable was the surge from 2020 to 2022, when prices climbed by more than $100,000. Although values dipped in 2023, they’ve since stabilized and are now slowly edging upward again. This overall growth reflects both renewed local demand and broader regional price pressures.
Overton – A Desert Town with Big Swings

Located in the Moapa Valley near Lake Mead, Overton has always had an appeal rooted in outdoor access and small-town charm. It sits about an hour northeast of Las Vegas, making it a feasible escape for those who want a quieter pace while remaining within reach of a major metro area. The big jump in prices after 2015 likely reflects interest from buyers priced out of larger markets, and Overton’s affordability — relative to other parts of southern Nevada — made it a logical next step. Despite its size, Overton benefits from the recreational traffic tied to Valley of Fire State Park and the nearby lake, which gives it broader appeal than its population alone might suggest.
The decline in 2023 was in line with market adjustments seen across Nevada, especially in towns where prices had surged sharply during the pandemic years. But Overton’s price recovery in 2024 and 2025 suggests local demand remains intact, possibly buoyed by its reputation as a retirement-friendly or second-home destination. Its growth has been uneven but significant, and its 2025 price of over $350,000 places it squarely among the state’s most expensive smaller towns. Going forward, much will depend on water concerns and broader infrastructure investment — both of which shape long-term livability in the desert.
29. Pahrump – 202% Home Price Increase Since 2012
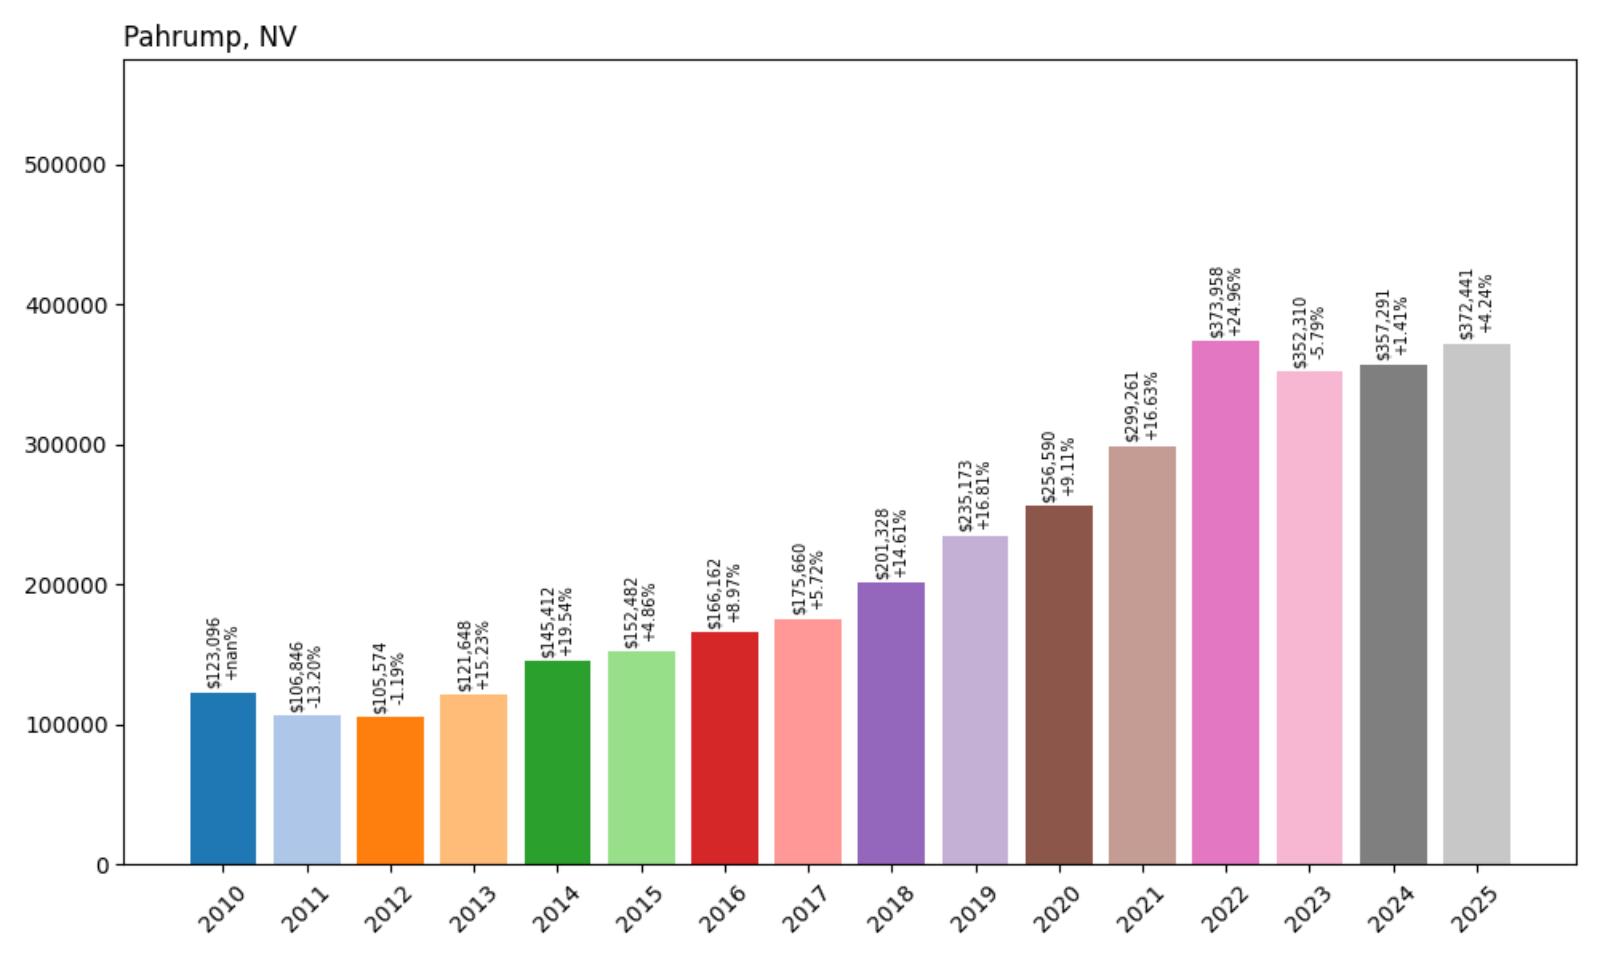
- 2010: $123,096
- 2011: $106,846 (−$16,249, −13.20% from previous year)
- 2012: $105,574 (−$1,272, −1.19% from previous year)
- 2013: $121,648 (+$16,074, +15.23% from previous year)
- 2014: $145,412 (+$23,764, +19.54% from previous year)
- 2015: $152,482 (+$7,070, +4.86% from previous year)
- 2016: $166,162 (+$13,680, +8.97% from previous year)
- 2017: $175,660 (+$9,498, +5.72% from previous year)
- 2018: $201,328 (+$25,668, +14.61% from previous year)
- 2019: $235,173 (+$33,845, +16.81% from previous year)
- 2020: $256,590 (+$21,417, +9.11% from previous year)
- 2021: $299,261 (+$42,671, +16.63% from previous year)
- 2022: $373,958 (+$74,697, +24.96% from previous year)
- 2023: $352,310 (−$21,649, −5.79% from previous year)
- 2024: $357,291 (+$4,981, +1.41% from previous year)
- 2025: $372,441 (+$15,150, +4.24% from previous year)
Pahrump’s home values have surged more than 200% since 2012, climbing from $105,574 to $372,441 as of 2025. The town saw particularly sharp growth from 2017 to 2022, when values nearly doubled in just five years. Even with a moderate correction in 2023, the overall trend has remained upward, with recovery signs already evident in the last two years. Pahrump’s affordability and location continue to attract new residents, especially retirees and remote workers seeking space and lower costs compared to nearby Las Vegas.
Pahrump – Growth on Vegas’s Edge
Pahrump is one of the more well-known commuter towns outside of Las Vegas, sitting roughly 60 miles west of the city near the California border. Long considered an affordable option with big backyards and open space, Pahrump has been on the radar for people seeking more privacy or those priced out of the Vegas metro. The sharp rise in home values reflects that growing demand, especially during the pandemic when remote work allowed many to leave urban centers. Local development and retail growth have also helped support rising property values, creating a more self-sufficient community than it once was.
While it briefly dipped in 2023, the town’s recent price rebound hints at continued resilience. At over $370,000, Pahrump is no longer the bargain it once was — but it remains competitively priced relative to nearby cities. Continued growth will likely depend on infrastructure investments, water access, and how well the town can balance expansion with preserving its rural charm. For now, it remains one of southern Nevada’s most active real estate markets outside Clark County’s core.
28. Bunkerville – 273% Home Price Increase Since 2012
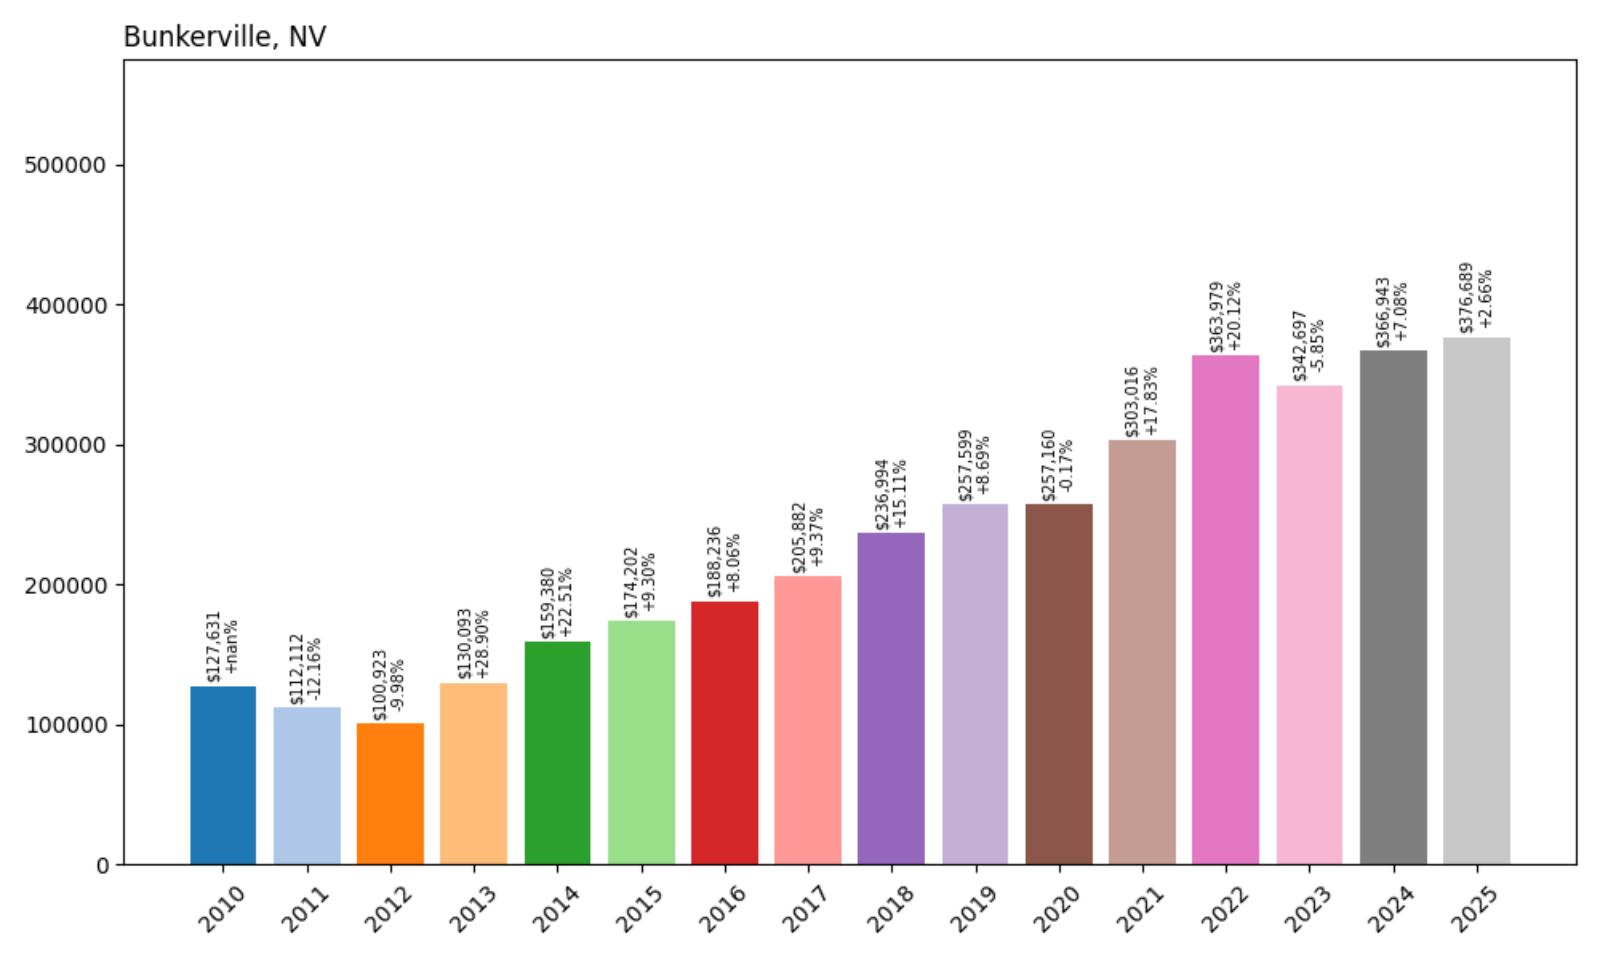
- 2010: $127,631
- 2011: $112,112 (−$15,519, −12.16% from previous year)
- 2012: $100,923 (−$11,189, −9.98% from previous year)
- 2013: $130,093 (+$29,170, +28.90% from previous year)
- 2014: $159,380 (+$29,286, +22.51% from previous year)
- 2015: $174,202 (+$14,822, +9.30% from previous year)
- 2016: $188,236 (+$14,035, +8.06% from previous year)
- 2017: $205,882 (+$17,646, +9.37% from previous year)
- 2018: $236,994 (+$31,112, +15.11% from previous year)
- 2019: $257,599 (+$20,606, +8.69% from previous year)
- 2020: $257,160 (−$440, −0.17% from previous year)
- 2021: $303,016 (+$45,857, +17.83% from previous year)
- 2022: $363,979 (+$60,963, +20.12% from previous year)
- 2023: $342,697 (−$21,282, −5.85% from previous year)
- 2024: $366,943 (+$24,246, +7.08% from previous year)
- 2025: $376,689 (+$9,746, +2.66% from previous year)
Bunkerville has seen a stunning 273% rise in home prices since hitting its lowest point in 2012, with values growing from just $100,923 to $376,689 in 2025. After bottoming out in the early 2010s, the town quickly rebounded and maintained a strong upward trajectory for most of the following decade. Growth was particularly sharp from 2013 to 2022, with consistent double-digit annual gains. Although prices pulled back slightly in 2023, the market recovered quickly in the next two years, and prices now sit near record highs.
Bunkerville – Quiet, Scenic, and On the Rise

Tucked near the Arizona border just a few miles from Mesquite, Bunkerville is a small community with agricultural roots and wide-open desert views. It’s not a place that sees heavy tourist traffic, but its quiet charm and proximity to the Virgin River have made it increasingly popular with buyers looking for a peaceful place to settle down. The town benefits from spillover demand from nearby Mesquite and broader interest in rural property across Nevada. With relatively few homes on the market at any given time, prices can rise quickly when demand increases — and that’s exactly what’s happened over the past decade.
Despite its small size, Bunkerville has emerged as one of Nevada’s most surprising high-value towns. The 2025 median home value of nearly $377,000 is far above what many would expect for a community of this scale. That growth has been supported by a mix of retiree demand, remote work shifts, and investment in surrounding areas. Whether Bunkerville can sustain this momentum will depend on factors like development pressure, water access, and whether local zoning policies change. For now, it remains a desirable — and increasingly expensive — pocket of rural southern Nevada.
27. Fallon – 213% Home Price Increase Since 2012
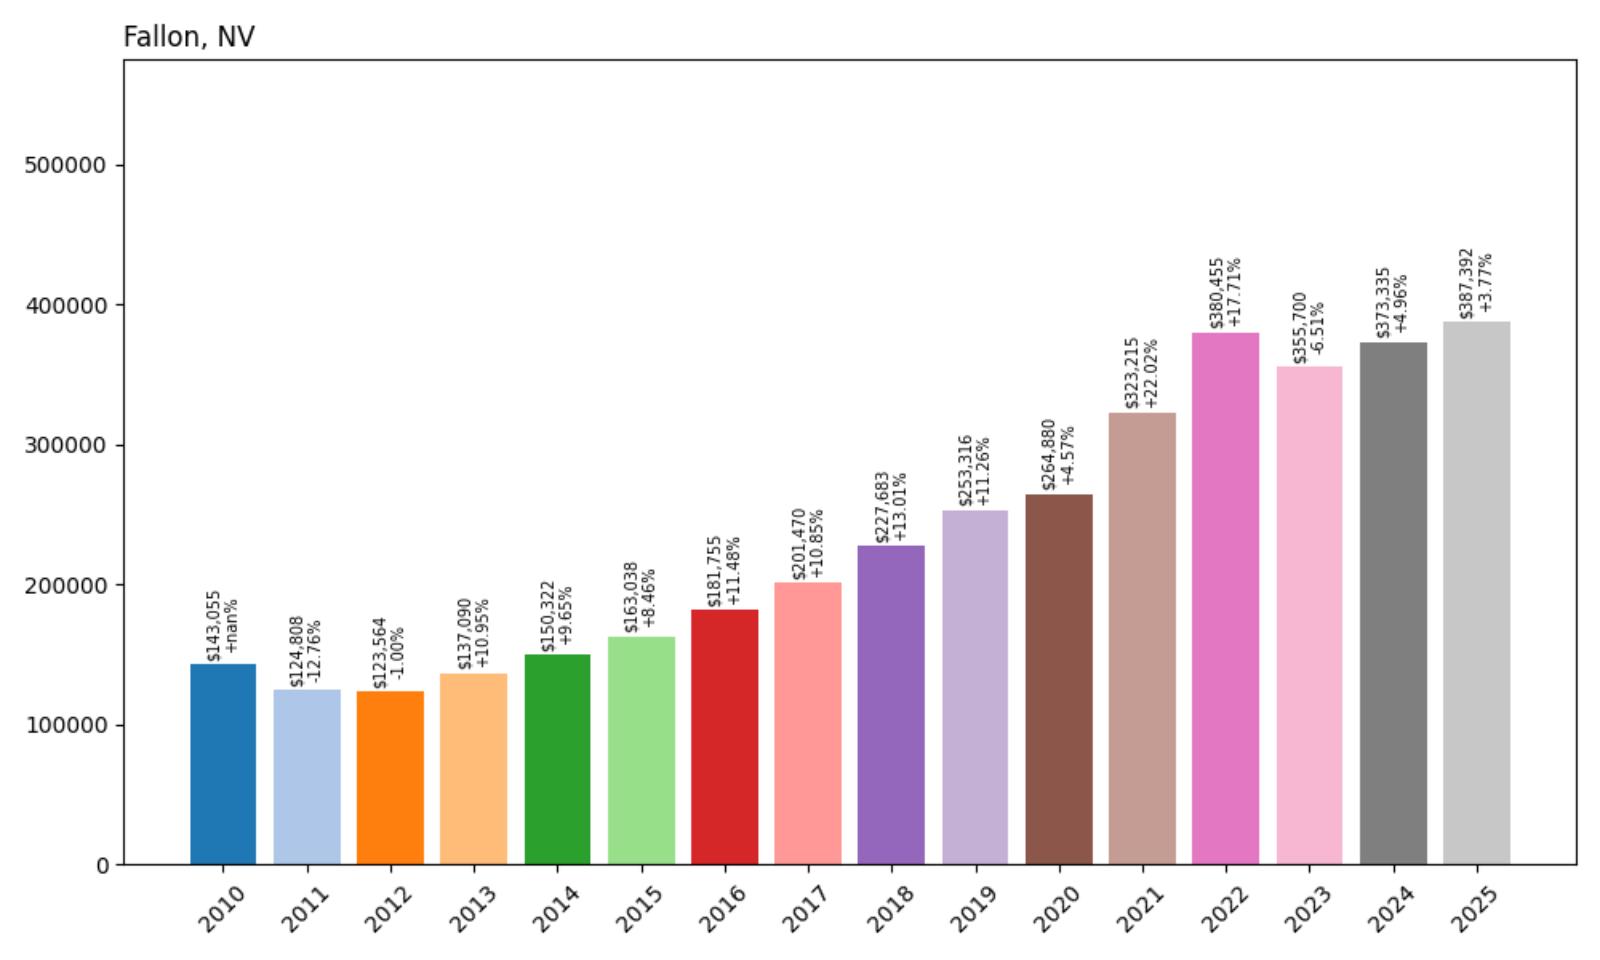
- 2010: $143,055
- 2011: $124,808 (−$18,247, −12.76% from previous year)
- 2012: $123,564 (−$1,244, −1.00% from previous year)
- 2013: $137,090 (+$13,526, +10.95% from previous year)
- 2014: $150,322 (+$13,233, +9.65% from previous year)
- 2015: $163,038 (+$12,716, +8.46% from previous year)
- 2016: $181,755 (+$18,718, +11.48% from previous year)
- 2017: $201,470 (+$19,715, +10.85% from previous year)
- 2018: $227,683 (+$26,213, +13.01% from previous year)
- 2019: $253,316 (+$25,633, +11.26% from previous year)
- 2020: $264,880 (+$11,564, +4.57% from previous year)
- 2021: $323,215 (+$58,335, +22.02% from previous year)
- 2022: $380,455 (+$57,240, +17.71% from previous year)
- 2023: $355,700 (−$24,755, −6.51% from previous year)
- 2024: $373,335 (+$17,635, +4.96% from previous year)
- 2025: $387,392 (+$14,057, +3.77% from previous year)
Fallon’s housing market has grown dramatically since 2012, with prices more than doubling — a 213% increase over 13 years. From a post-recession low of $123,564, values surged to $387,392 in 2025. The biggest jumps came between 2017 and 2022, with five consecutive years of strong growth. Even after a modest dip in 2023, prices rebounded in the following years and now sit comfortably above pre-pandemic levels. The town’s affordability and access to major roads have played a big role in attracting new residents.
Fallon – Affordable Living with Access to Reno
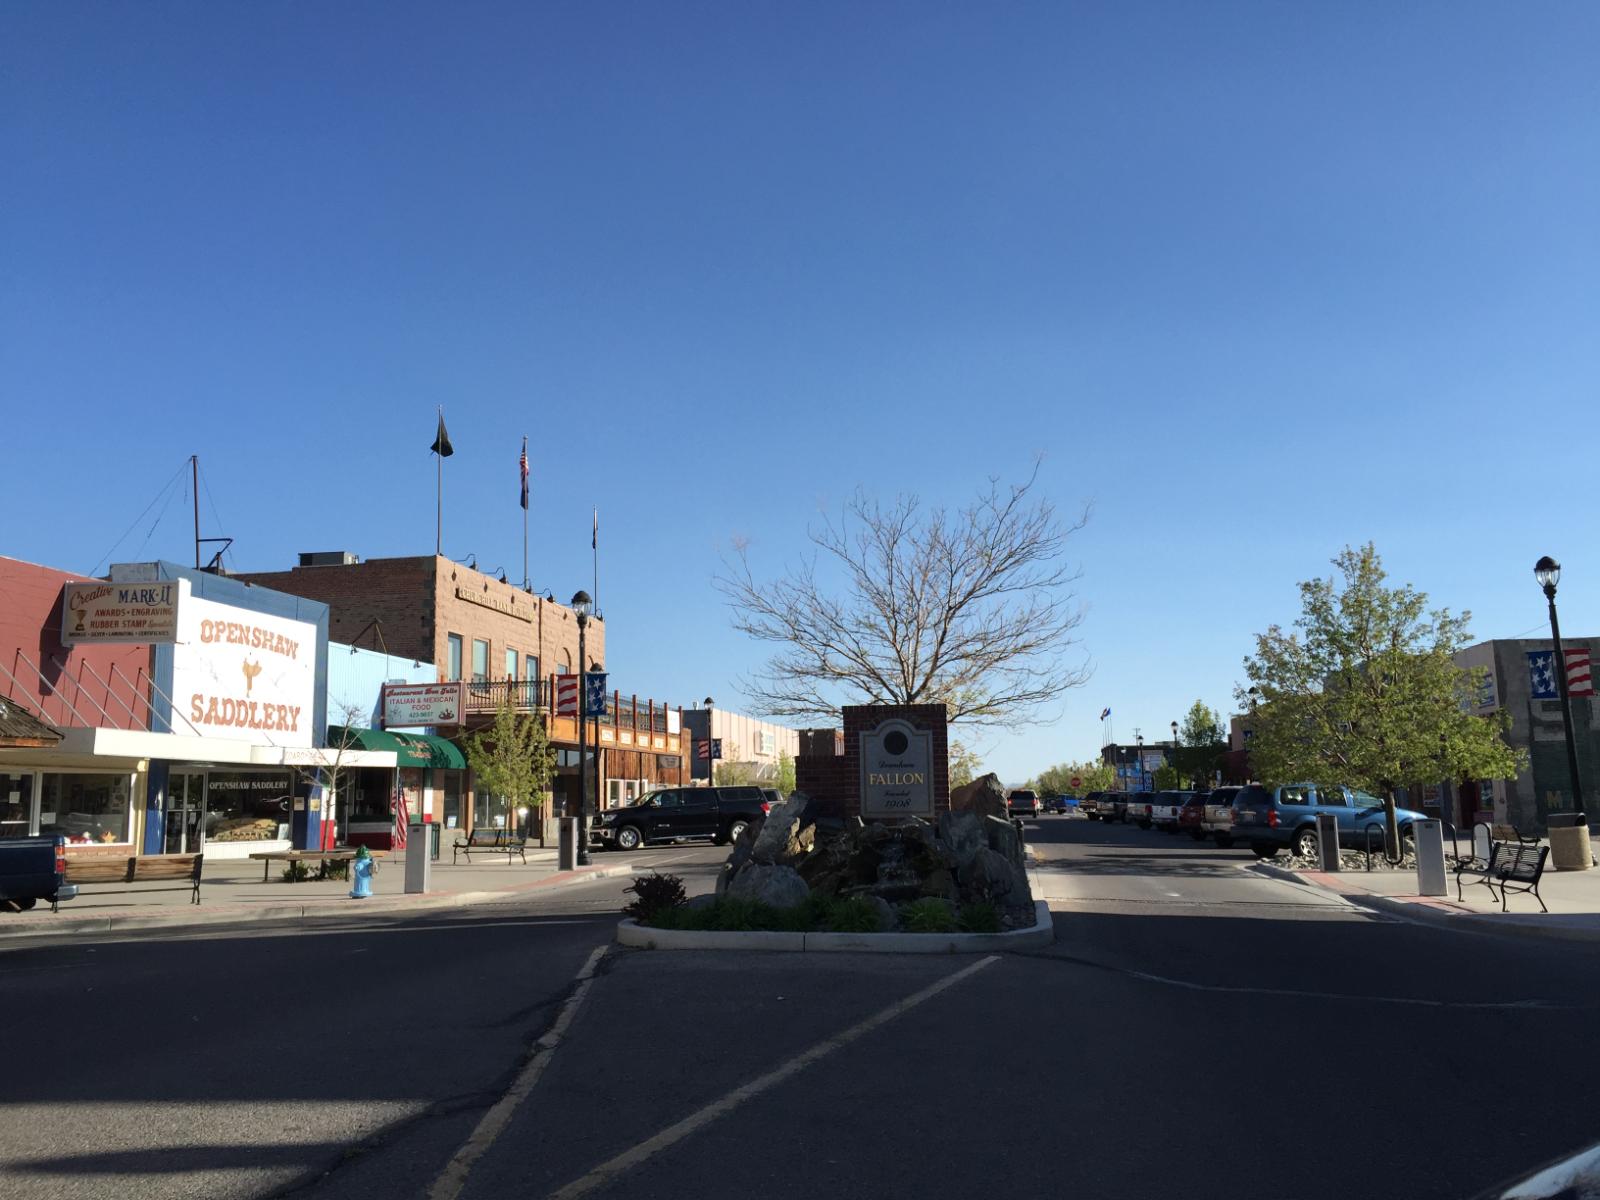
Located about an hour east of Reno, Fallon is a working-class town known for its agricultural history and as the home of Naval Air Station Fallon. This military presence brings both stability and jobs, while the town’s lower cost of living continues to attract first-time buyers and families looking for space. Fallon also benefits from its proximity to U.S. Route 50, which makes commuting and regional travel relatively easy. Housing stock here is more diverse than in many small Nevada towns, which has helped it keep pace with changing demand.
Fallon’s housing market is notable for how steadily it’s grown. Even during the peak of pandemic volatility, prices rose at a healthy pace, and while there was a slight correction in 2023, the overall trend remains solidly upward. At just under $390,000, homes here are still priced well below many other towns on this list, which could support continued interest. As Reno’s market remains competitive and expensive, Fallon is positioned to absorb spillover demand from the metro area without losing its distinct local character.
26. Mesquite – 145% Home Price Increase Since 2012
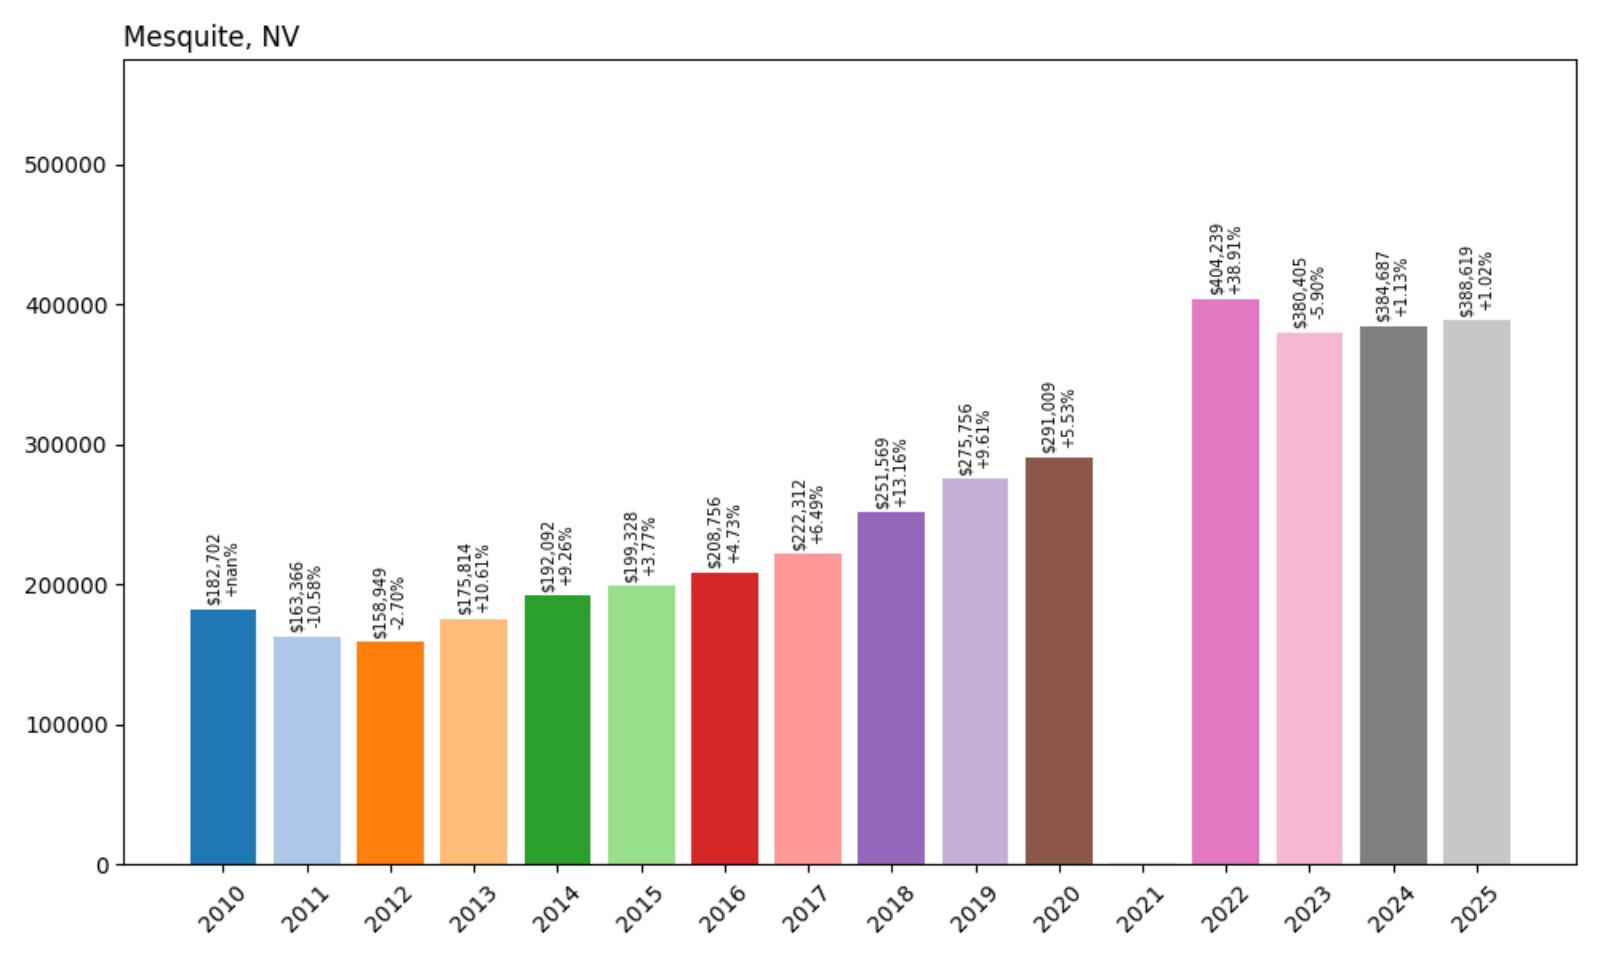
- 2010: $182,702
- 2011: $163,366 (−$19,336, −10.58% from previous year)
- 2012: $158,949 (−$4,417, −2.70% from previous year)
- 2013: $175,814 (+$16,865, +10.61% from previous year)
- 2014: $192,092 (+$16,278, +9.26% from previous year)
- 2015: $199,328 (+$7,236, +3.77% from previous year)
- 2016: $208,756 (+$9,428, +4.73% from previous year)
- 2017: $222,312 (+$13,556, +6.49% from previous year)
- 2018: $251,569 (+$29,258, +13.16% from previous year)
- 2019: $275,756 (+$24,187, +9.61% from previous year)
- 2020: $291,009 (+$15,253, +5.53% from previous year)
- 2021: $NA
- 2022: $404,239 (+$113,230, +38.91% from previous year)
- 2023: $380,405 (−$23,834, −5.90% from previous year)
- 2024: $384,687 (+$4,282, +1.13% from previous year)
- 2025: $388,619 (+$3,932, +1.02% from previous year)
Mesquite has experienced a strong 145% price increase since 2012, with values rising from $158,949 to $388,619 in 2025. The biggest leap occurred between 2020 and 2022, when prices surged by over $110,000. Even with some volatility in 2023, the market has since stabilized and is inching upward once again. Mesquite’s strong amenities and retirement appeal have helped it become one of the more consistently desirable smaller towns in Nevada.
Mesquite – A Growing Desert Community with Resort Appeal
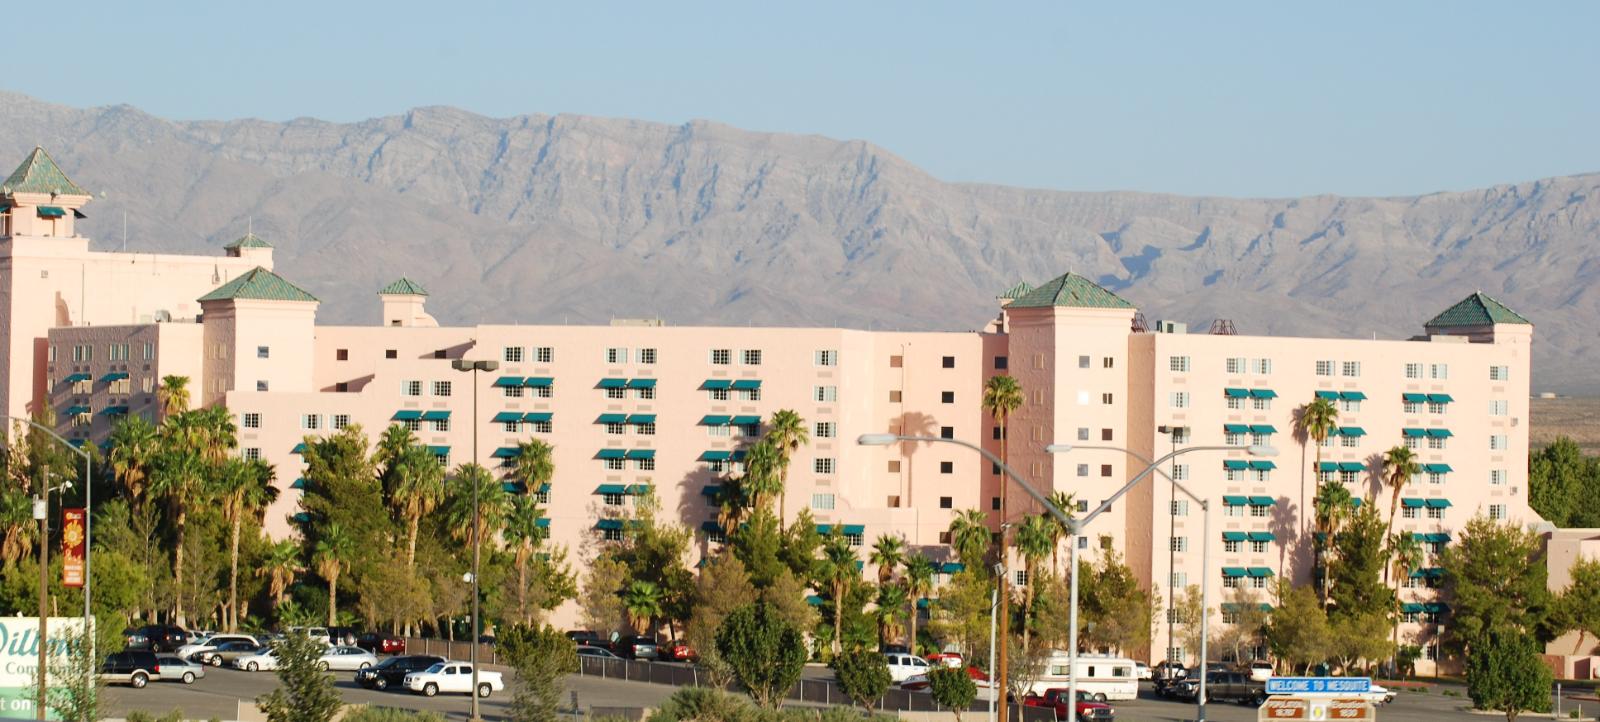
Mesquite sits near the Arizona border along Interstate 15, making it a popular choice for retirees, snowbirds, and those seeking warmer weather and affordable living. It’s known for its golf courses, casinos, and a well-maintained downtown — all of which make it a unique blend of small-town life and resort-town vibes. The growth in home prices reflects that popularity, especially as retirees and second-home buyers continue to fuel demand in the area. Its infrastructure is more developed than in many rural towns, which has likely helped sustain its long-term value.
The sharp jump from 2020 to 2022 came as pandemic-era migration patterns favored towns like Mesquite, which offered space, sunshine, and fewer urban hassles. Despite the drop in 2023, prices remain high — and the continued slight increases in 2024 and 2025 show ongoing resilience. At nearly $390,000, Mesquite is firmly in the upper tier of Nevada home markets. With tourism returning and development pressures increasing, the town’s real estate future appears steady, if no longer as explosive as in prior years.
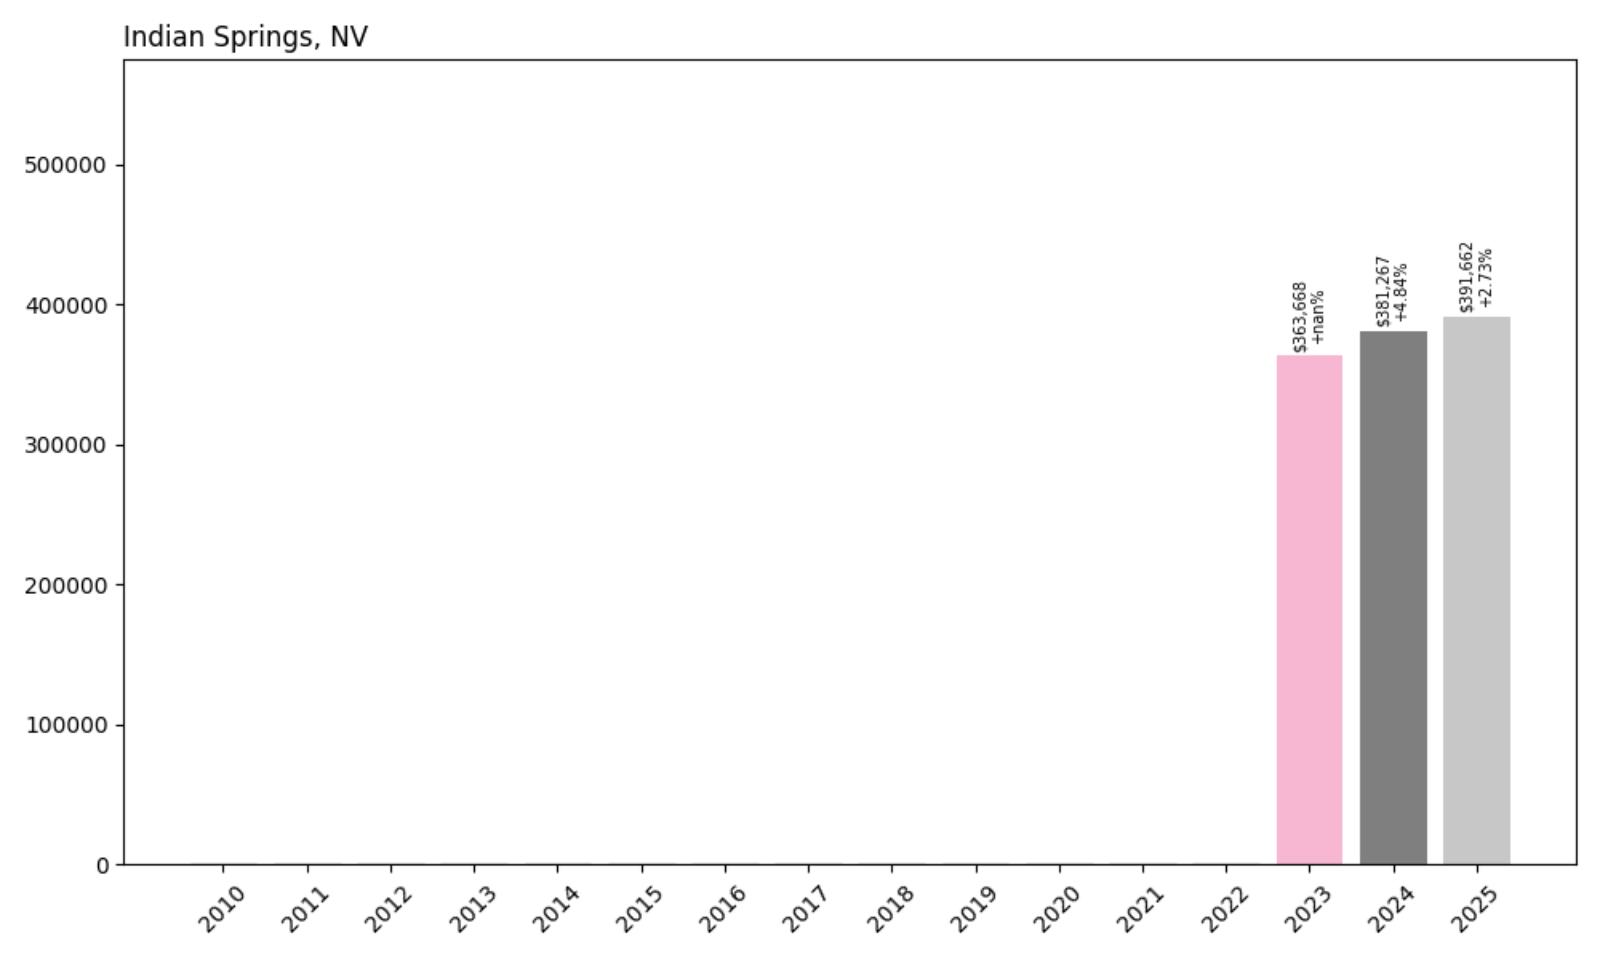
25. Indian Springs – No Historical Data Before 2023
- 2010: $NA
- 2011: $NA
- 2012: $NA
- 2013: $NA
- 2014: $NA
- 2015: $NA
- 2016: $NA
- 2017: $NA
- 2018: $NA
- 2019: $NA
- 2020: $NA
- 2021: $NA
- 2022: $NA
- 2023: $363,668
- 2024: $381,267 (+$17,599, +4.84% from previous year)
- 2025: $391,662 (+$10,396, +2.73% from previous year)
Indian Springs lacks publicly available housing data before 2023, making long-term comparisons difficult. However, the available information shows a steady upward trend over the past two years, with values increasing from $363,668 in 2023 to $391,662 in 2025 — a 7.7% gain. The market here appears stable, though limited historical insight makes it hard to assess whether current prices reflect rapid appreciation, gradual growth, or market correction from an earlier surge.
Indian Springs – An Emerging Outpost Northwest of Las Vegas

Indian Springs is a small community located about 45 miles northwest of Las Vegas, best known as the site of Creech Air Force Base. This military presence gives the town a unique character, and it also provides a level of economic stability that’s rare in such remote desert areas. Over the past few years, Indian Springs has seen modest development and slow but steady population growth, supported in part by military families, contractors, and those looking for more affordable alternatives to the Las Vegas metro area.
With no data available before 2023, it’s difficult to say how housing prices in Indian Springs have evolved in the long run, but the 2024 and 2025 increases suggest a community that’s gradually gaining value. This rise may be fueled by spillover from Las Vegas and improved transportation links. While the town remains fairly quiet and lightly populated, continued military investment and infrastructure improvements could support further growth in the years ahead. For now, it’s one of Nevada’s lesser-known, mid-range price markets.
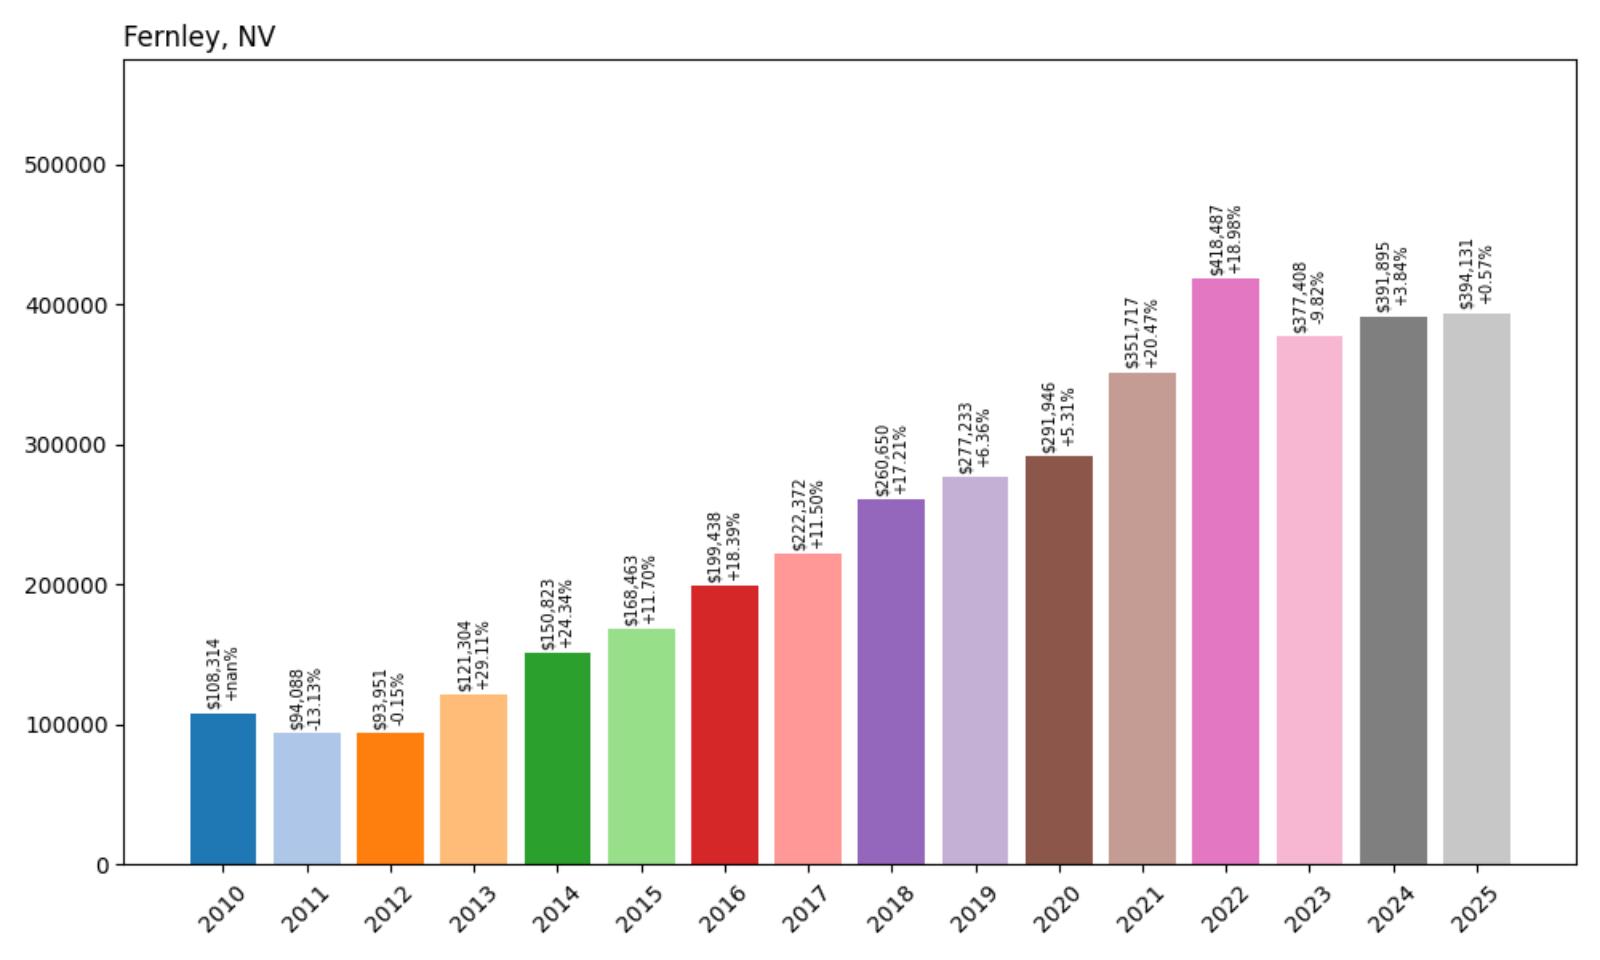
24. Fernley – 319% Home Price Increase Since 2012
🔥 Would you like to save this?
- 2010: $108,314
- 2011: $94,088 (−$14,225, −13.13% from previous year)
- 2012: $93,951 (−$138, −0.15% from previous year)
- 2013: $121,304 (+$27,353, +29.11% from previous year)
- 2014: $150,823 (+$29,519, +24.34% from previous year)
- 2015: $168,463 (+$17,640, +11.70% from previous year)
- 2016: $199,438 (+$30,976, +18.39% from previous year)
- 2017: $222,372 (+$22,934, +11.50% from previous year)
- 2018: $260,650 (+$38,278, +17.21% from previous year)
- 2019: $277,233 (+$16,583, +6.36% from previous year)
- 2020: $291,946 (+$14,714, +5.31% from previous year)
- 2021: $351,717 (+$59,771, +20.47% from previous year)
- 2022: $418,487 (+$66,769, +18.98% from previous year)
- 2023: $377,408 (−$41,078, −9.82% from previous year)
- 2024: $391,895 (+$14,487, +3.84% from previous year)
- 2025: $394,131 (+$2,235, +0.57% from previous year)
Fernley’s home values have skyrocketed since 2012, climbing from $93,951 to $394,131 — a stunning 319% increase. This growth is among the highest in the state and reflects the town’s transformation into a major commuter hub for Reno. Values spiked particularly quickly from 2016 through 2022, with several double-digit annual gains. While prices dipped slightly in 2023, they’ve since rebounded modestly, suggesting that demand remains strong in this key eastern Washoe County community.
Fernley – Rapid Growth Fueled by Proximity to Reno

Once a quiet railroad town, Fernley has become one of Nevada’s most important satellite cities. Located about 30 miles east of Reno along Interstate 80, the town has benefited from regional economic growth, logistics investment, and the migration of families and workers seeking more space. Fernley is home to industrial facilities and distribution centers, which provide a base of local employment that’s rare for an exurban area. These jobs, combined with its affordability compared to Reno, have pushed Fernley’s home prices sharply higher.
Even with a brief cooling in 2023, Fernley’s housing market remains among the strongest in northern Nevada. At just under $395,000, homes are still significantly less expensive than in Reno, Sparks, or Carson City — but that affordability gap is shrinking. Continued population growth, infrastructure expansion, and housing demand are likely to keep upward pressure on prices in the coming years. For buyers priced out of Reno, Fernley remains a key alternative — one with a strong upward trend to back it up.
23. Spring Creek – 77% Home Price Increase Since 2012

- 2010: $243,575
- 2011: $221,802 (−$21,773, −8.94% from previous year)
- 2012: $225,692 (+$3,890, +1.75% from previous year)
- 2013: $239,108 (+$13,416, +5.94% from previous year)
- 2014: $241,928 (+$2,820, +1.18% from previous year)
- 2015: $250,168 (+$8,239, +3.41% from previous year)
- 2016: $257,767 (+$7,599, +3.04% from previous year)
- 2017: $261,693 (+$3,926, +1.52% from previous year)
- 2018: $267,125 (+$5,432, +2.08% from previous year)
- 2019: $283,490 (+$16,365, +6.13% from previous year)
- 2020: $297,818 (+$14,328, +5.05% from previous year)
- 2021: $335,940 (+$38,122, +12.80% from previous year)
- 2022: $379,152 (+$43,212, +12.86% from previous year)
- 2023: $369,066 (−$10,086, −2.66% from previous year)
- 2024: $381,858 (+$12,792, +3.47% from previous year)
- 2025: $400,111 (+$18,254, +4.78% from previous year)
Spring Creek’s home values have risen 77% since 2012, climbing from $225,692 to $400,111 in 2025. Though not as explosive as some other towns, the growth has been steady, with consistent year-over-year gains through most of the 2010s. A brief price correction in 2023 was quickly reversed, and values are now higher than ever. This slow-but-steady growth reflects long-term demand in a community that’s stable, desirable, and well-positioned in eastern Nevada.
Spring Creek – Steady Growth in Northeastern Nevada
Spring Creek is a census-designated place just outside Elko, nestled in the foothills of the Ruby Mountains. Known for its rugged beauty and access to outdoor recreation, the area appeals to families, retirees, and workers in the mining and energy industries. Unlike some boom-and-bust housing markets in the West, Spring Creek’s price trajectory has been relatively smooth — and that stability is a major draw for residents seeking predictability. The town offers space, quiet living, and some of the state’s most scenic backdrops.
Although not a tourist destination, Spring Creek benefits from its proximity to Elko and the broader northeastern Nevada economic base. Home prices have climbed gradually but firmly, and the recent upward tick in 2024 and 2025 suggests demand is still strong. At just over $400,000, homes here are approaching the price levels of larger towns, but the value lies in what residents get in return: land, views, and a slower pace of life. It’s a different Nevada than Las Vegas or Reno — but no less valuable in today’s market.
22. North Las Vegas – 307% Home Price Increase Since 2012
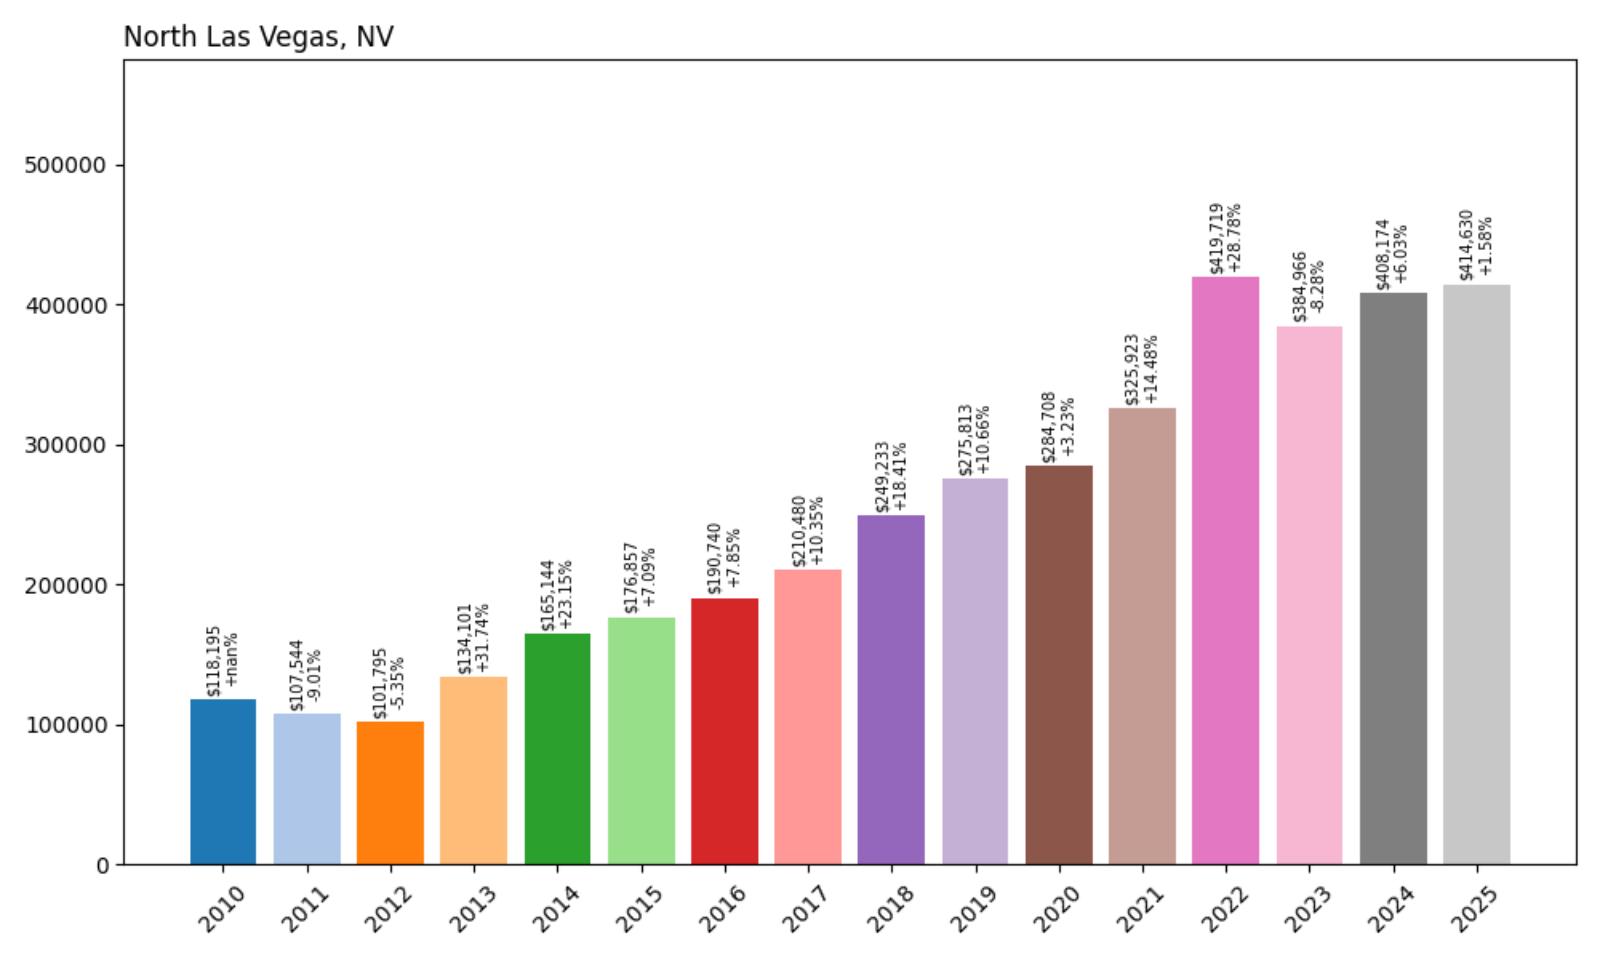
- 2010: $118,195
- 2011: $107,544 (−$10,651, −9.01% from previous year)
- 2012: $101,795 (−$5,749, −5.35% from previous year)
- 2013: $134,101 (+$32,306, +31.74% from previous year)
- 2014: $165,144 (+$31,043, +23.15% from previous year)
- 2015: $176,857 (+$11,714, +7.09% from previous year)
- 2016: $190,740 (+$13,883, +7.85% from previous year)
- 2017: $210,480 (+$19,740, +10.35% from previous year)
- 2018: $249,233 (+$38,753, +18.41% from previous year)
- 2019: $275,813 (+$26,580, +10.66% from previous year)
- 2020: $284,708 (+$8,895, +3.23% from previous year)
- 2021: $325,923 (+$41,215, +14.48% from previous year)
- 2022: $419,719 (+$93,797, +28.78% from previous year)
- 2023: $384,966 (−$34,753, −8.28% from previous year)
- 2024: $408,174 (+$23,207, +6.03% from previous year)
- 2025: $414,630 (+$6,456, +1.58% from previous year)
North Las Vegas has seen a massive 307% jump in home values since 2012, rising from $101,795 to $414,630 by 2025. The town’s growth has been marked by rapid appreciation during the 2013–2022 stretch, including a nearly $94,000 surge in 2022 alone. While prices did cool slightly in 2023 with an 8% dip, they quickly bounced back in 2024 and 2025. The recent data points to a leveling market, but one that remains significantly elevated compared to a decade ago.
North Las Vegas – From Undervalued to In-Demand

Long viewed as a more affordable alternative to Las Vegas proper, North Las Vegas has undergone a striking transformation over the last decade. Located directly north of the Strip, the city has become a magnet for families, first-time buyers, and developers looking to capitalize on cheaper land. It’s also seen a surge in warehouse, industrial, and logistics investment, which has brought jobs and spurred demand for housing. That economic base — paired with proximity to major highways and urban amenities — has helped drive the housing boom.
Today’s prices reflect not just the cost of homes, but the city’s evolution into a more complete urban center. While still more affordable than many surrounding areas, North Las Vegas has largely shed its reputation as an undervalued market. Its recovery after the 2023 dip suggests continued buyer interest, even as broader market conditions cool. With ongoing residential and commercial growth — including new master-planned communities — the city is likely to remain a key player in the Southern Nevada housing story for years to come.
21. Sun Valley – 320% Home Price Increase Since 2012
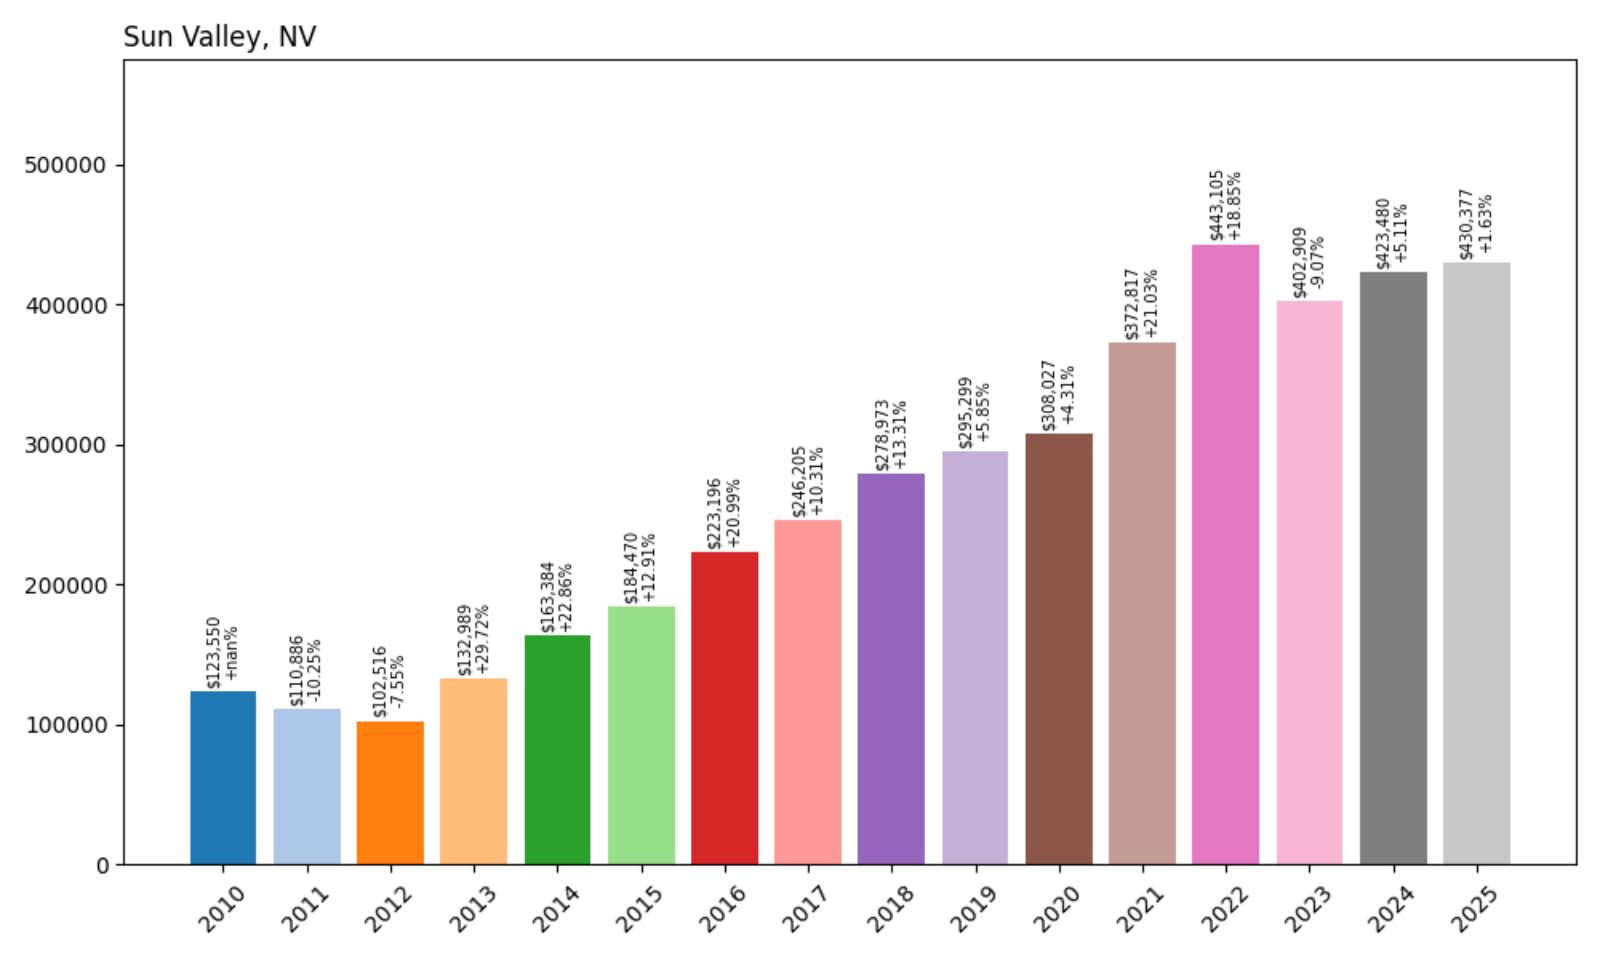
- 2010: $123,550
- 2011: $110,886 (−$12,664, −10.25% from previous year)
- 2012: $102,516 (−$8,369, −7.55% from previous year)
- 2013: $132,989 (+$30,473, +29.72% from previous year)
- 2014: $163,384 (+$30,395, +22.86% from previous year)
- 2015: $184,470 (+$21,086, +12.91% from previous year)
- 2016: $223,196 (+$38,725, +20.99% from previous year)
- 2017: $246,205 (+$23,009, +10.31% from previous year)
- 2018: $278,973 (+$32,768, +13.31% from previous year)
- 2019: $295,299 (+$16,325, +5.85% from previous year)
- 2020: $308,027 (+$12,728, +4.31% from previous year)
- 2021: $372,817 (+$64,790, +21.03% from previous year)
- 2022: $443,105 (+$70,288, +18.85% from previous year)
- 2023: $402,909 (−$40,196, −9.07% from previous year)
- 2024: $423,480 (+$20,571, +5.11% from previous year)
- 2025: $430,377 (+$6,898, +1.63% from previous year)
Sun Valley has posted a remarkable 320% home price increase since 2012, climbing from just $102,516 to $430,377 in 2025. The area saw particularly intense growth from 2013 to 2022, including back-to-back double-digit percentage gains. Although there was a sharp correction in 2023, values have started climbing again, signaling ongoing interest. Despite fluctuations, the long-term trend is one of dramatic appreciation, putting Sun Valley firmly among Nevada’s most expensive smaller towns.
Sun Valley – Reno’s Fast-Rising Neighbor

Just north of Reno, Sun Valley has long been seen as a more affordable option within Washoe County. That perception has changed as home prices have surged over the past decade, fueled by overflow demand from Reno and Sparks. The area’s accessibility, growing infrastructure, and lower starting prices made it a natural target for buyers looking for value — and that demand quickly translated into soaring valuations. As Reno’s real estate boom spilled outward, Sun Valley became one of its biggest beneficiaries.
Though often overlooked in favor of more high-profile towns, Sun Valley has matured into a market with real momentum. Its recent recovery after the 2023 dip shows resilience, and current values above $430,000 suggest that buyers continue to see potential here. The community has invested in schools, retail, and recreation, which has helped it appeal to families and first-time buyers alike. While its early price growth was steep, Sun Valley now seems to be settling into a more measured, sustainable path forward.
20. Moapa – 210% Home Price Increase Since 2012
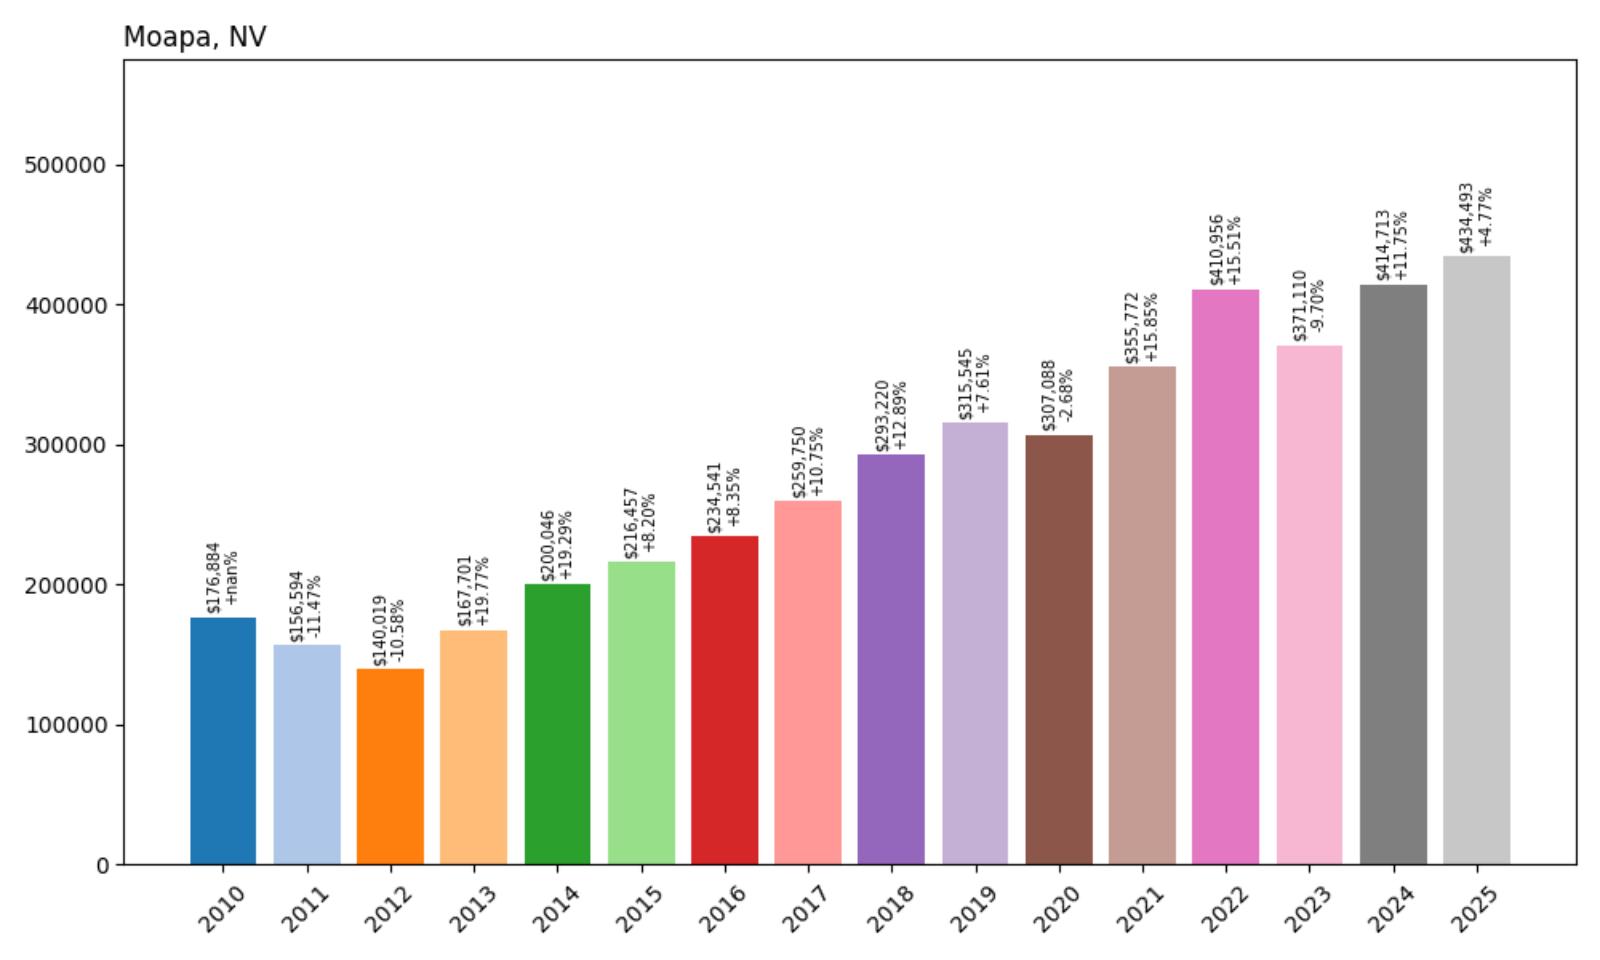
- 2010: $176,884
- 2011: $156,594 (−$20,290, −11.47% from previous year)
- 2012: $140,019 (−$16,574, −10.58% from previous year)
- 2013: $167,701 (+$27,682, +19.77% from previous year)
- 2014: $200,046 (+$32,345, +19.29% from previous year)
- 2015: $216,457 (+$16,411, +8.20% from previous year)
- 2016: $234,541 (+$18,085, +8.35% from previous year)
- 2017: $259,750 (+$25,208, +10.75% from previous year)
- 2018: $293,220 (+$33,470, +12.89% from previous year)
- 2019: $315,545 (+$22,325, +7.61% from previous year)
- 2020: $307,088 (−$8,457, −2.68% from previous year)
- 2021: $355,772 (+$48,684, +15.85% from previous year)
- 2022: $410,956 (+$55,184, +15.51% from previous year)
- 2023: $371,110 (−$39,846, −9.70% from previous year)
- 2024: $414,713 (+$43,603, +11.75% from previous year)
- 2025: $434,493 (+$19,779, +4.77% from previous year)
Moapa’s housing market has more than tripled in value since 2012, rising from $140,019 to $434,493 — a 210% increase. This rural Clark County town experienced steady growth throughout the 2010s, with brief slowdowns offset by major gains during the 2020–2022 boom. The market dipped in 2023, but a strong rebound in 2024 and 2025 has pushed prices to new highs, demonstrating sustained interest in the area.
Moapa – Rural Growth with Real Staying Power

Moapa is located northeast of Las Vegas and is part of the broader Moapa Valley region, which includes nearby Overton and Logandale. While the town is small and largely agricultural, it’s increasingly viewed as a retreat from the busier Las Vegas Valley. Buyers are drawn by the quiet environment, affordable land, and proximity to Lake Mead and the Muddy River. Infrastructure improvements and improved internet connectivity have also made Moapa a more feasible option for remote workers.
Housing prices here are now over $430,000 — a staggering number for a town of its size. But Moapa’s appeal lies in its mix of rural tranquility and practical livability. The town has held up well during periods of economic turbulence, and recent growth indicates long-term viability. With buyers continuing to look beyond city centers for space and affordability, Moapa’s blend of lifestyle and location could keep it on the upswing.
19. Las Vegas – 215% Home Price Increase Since 2012
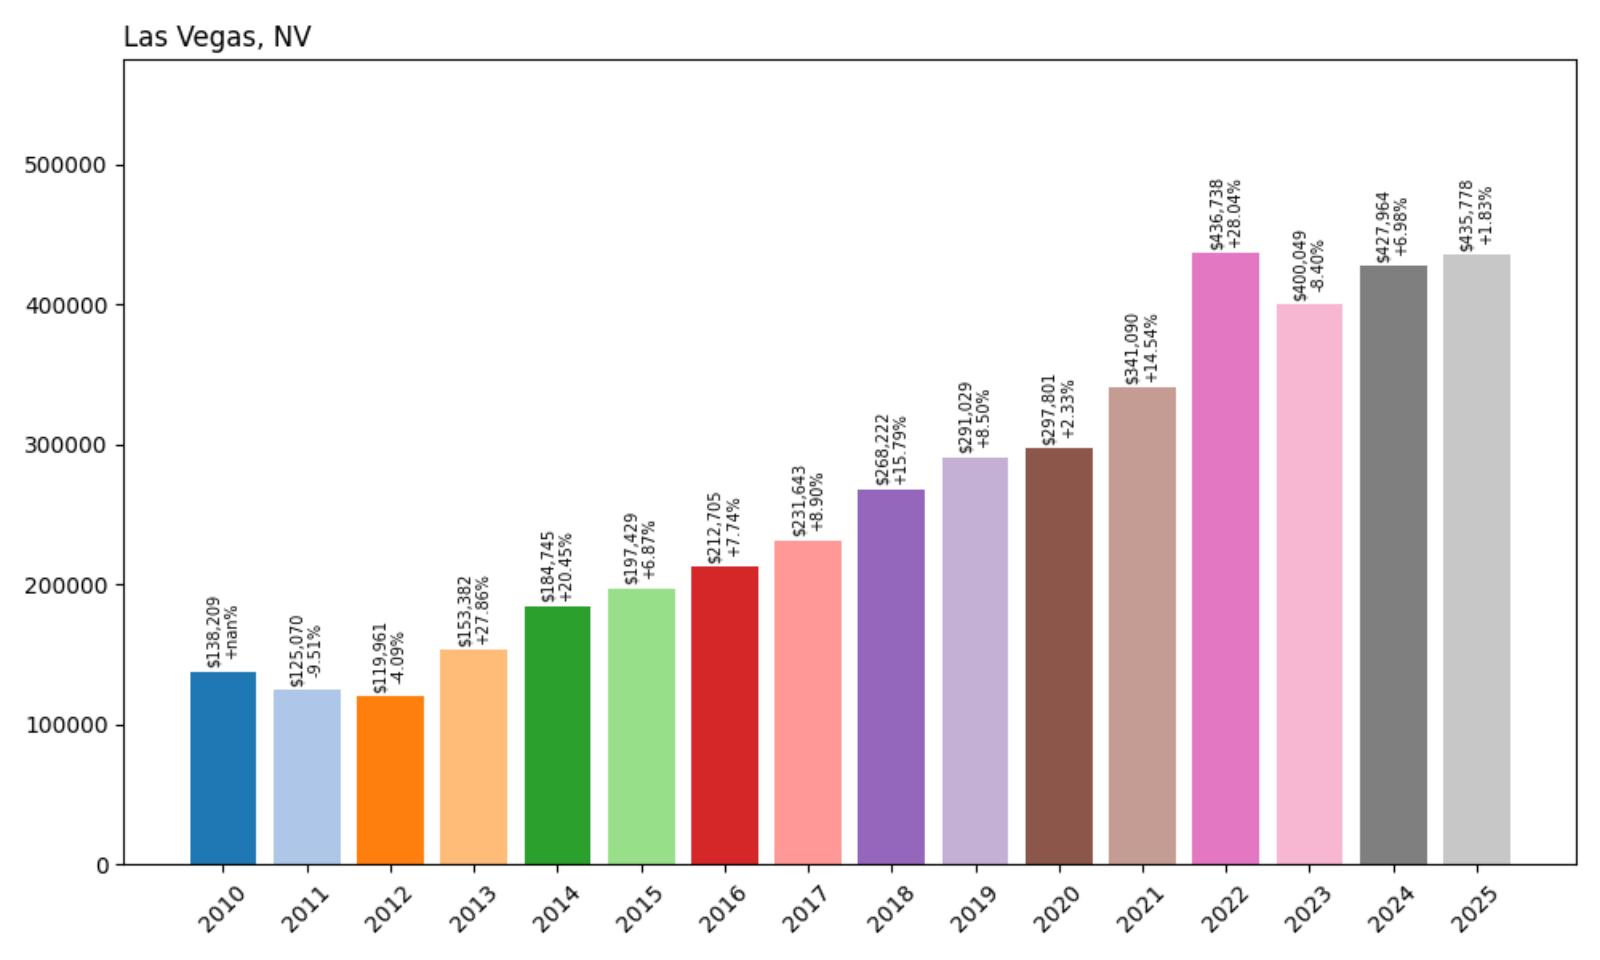
- 2010: $138,209
- 2011: $125,070 (−$13,139, −9.51% from previous year)
- 2012: $119,961 (−$5,109, −4.09% from previous year)
- 2013: $153,382 (+$33,421, +27.86% from previous year)
- 2014: $184,745 (+$31,362, +20.45% from previous year)
- 2015: $197,429 (+$12,684, +6.87% from previous year)
- 2016: $212,705 (+$15,276, +7.74% from previous year)
- 2017: $231,643 (+$18,938, +8.90% from previous year)
- 2018: $268,222 (+$36,580, +15.79% from previous year)
- 2019: $291,029 (+$22,807, +8.50% from previous year)
- 2020: $297,801 (+$6,771, +2.33% from previous year)
- 2021: $341,090 (+$43,289, +14.54% from previous year)
- 2022: $436,738 (+$95,648, +28.04% from previous year)
- 2023: $400,049 (−$36,688, −8.40% from previous year)
- 2024: $427,964 (+$27,915, +6.98% from previous year)
- 2025: $435,778 (+$7,814, +1.83% from previous year)
Las Vegas home prices have more than tripled since their lowest point in 2012. After bottoming out at just under $120,000, the median home value soared to over $435,000 by 2025—a 215% increase. The most dramatic surges came between 2013 and 2022, when consistent double-digit gains pushed prices well above pre-recession highs. Despite a brief correction in 2023, the market rebounded quickly and continues to hold strong.
Las Vegas – Strong Growth and Urban Momentum
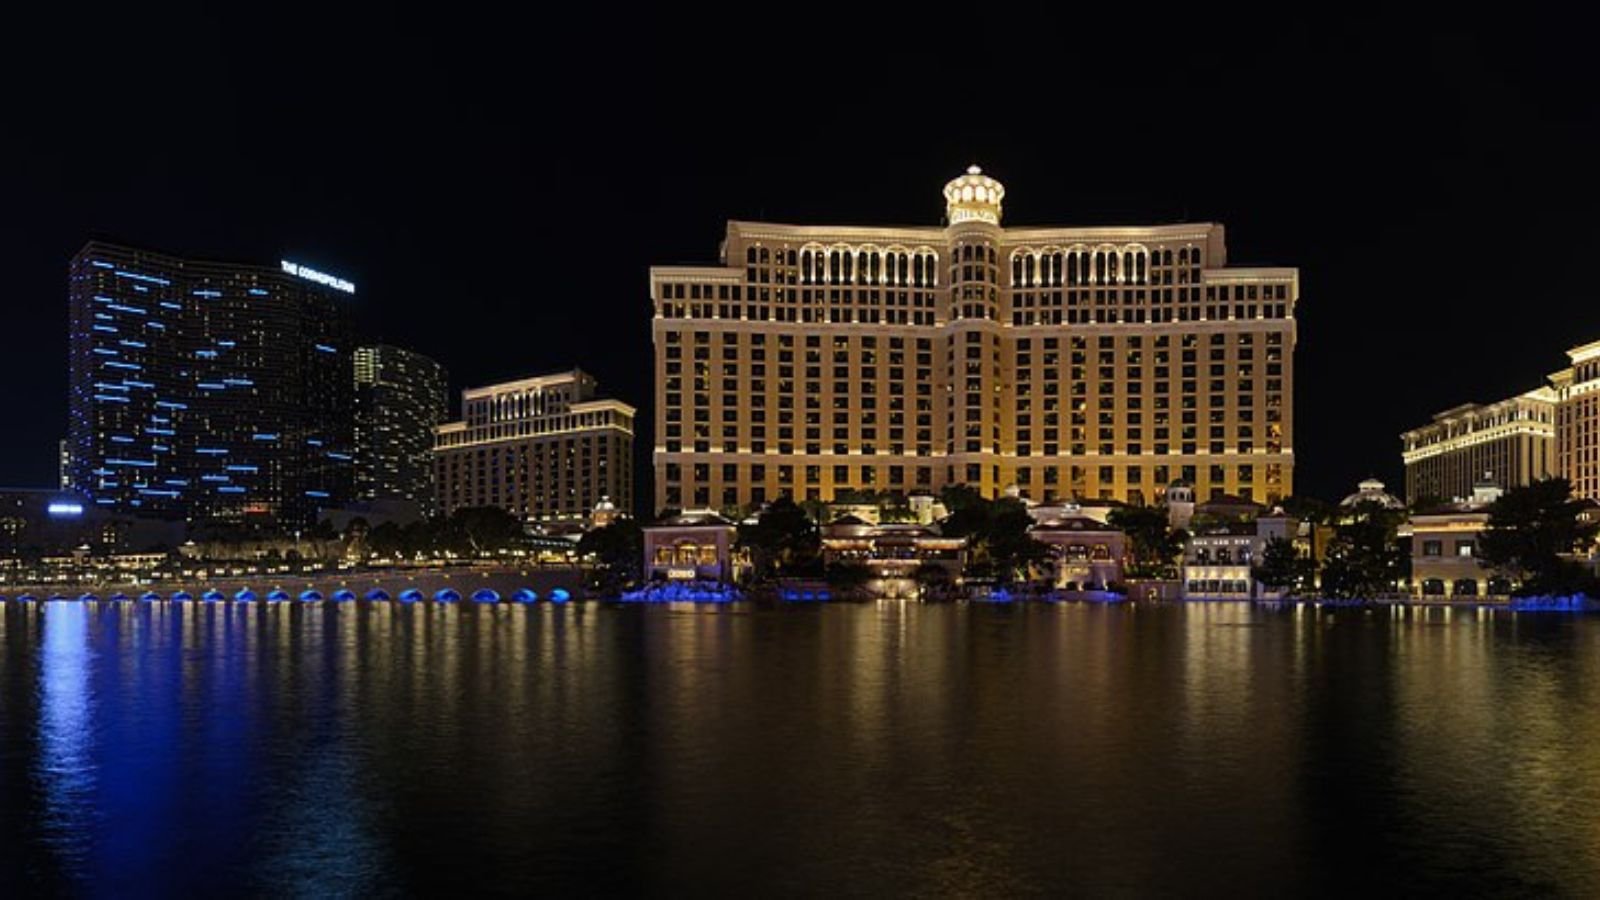
As Nevada’s largest city, Las Vegas has seen immense population growth, major infrastructure investments, and nonstop demand for housing. The city’s affordability relative to coastal metros made it a hotspot for relocation, especially during the pandemic. Developments in entertainment, sports (like the arrival of the Raiders), and tech startups have added momentum to the economy, fueling a robust property market that recovered quickly from past downturns.
Las Vegas’s housing growth has been shaped by both urban sprawl and infill development. While new construction continues to push outward, popular neighborhoods like Summerlin and Henderson remain in high demand for buyers seeking established amenities. Though 2023 brought a slight dip, the long-term outlook remains upward. As of mid-2025, Vegas combines lifestyle appeal, job access, and steady growth—making it one of Nevada’s most dynamic markets for home values.
18. Dayton – 255% Home Price Increase Since 2012

🔥 Would you like to save this?
- 2010: $148,769
- 2011: $129,525 (−$19,244, −12.94% from previous year)
- 2012: $128,153 (−$1,372, −1.06% from previous year)
- 2013: $146,946 (+$18,793, +14.66% from previous year)
- 2014: $177,799 (+$30,853, +21.00% from previous year)
- 2015: $192,966 (+$15,167, +8.53% from previous year)
- 2016: $223,434 (+$30,468, +15.79% from previous year)
- 2017: $251,737 (+$28,303, +12.67% from previous year)
- 2018: $292,869 (+$41,132, +16.34% from previous year)
- 2019: $318,544 (+$25,675, +8.77% from previous year)
- 2020: $335,397 (+$16,853, +5.29% from previous year)
- 2021: $403,798 (+$68,402, +20.39% from previous year)
- 2022: $469,488 (+$65,689, +16.27% from previous year)
- 2023: $429,685 (−$39,802, −8.48% from previous year)
- 2024: $445,127 (+$15,442, +3.59% from previous year)
- 2025: $455,062 (+$9,935, +2.23% from previous year)
Dayton’s housing market has more than tripled since 2012, climbing from $128,153 to $455,062 in 2025 — a 255% increase over 13 years. Growth accelerated sharply after 2015, driven by steady year-over-year gains and surging demand during the pandemic. Though prices dropped back slightly in 2023, they’ve since begun to rise again, signaling continued strength. At over $450,000, Dayton is no longer an affordable outlier — it now ranks among the more expensive towns in Nevada.
Dayton – Historic Roots and Strong Regional Growth
Situated along the Carson River southeast of Carson City, Dayton is one of Nevada’s oldest communities — and now one of its fastest-growing in terms of housing value. Originally a Gold Rush stop, Dayton has steadily evolved into a commuter-friendly suburb thanks to its scenic setting, access to U.S. Route 50, and relatively large supply of developable land. Its mix of newer housing tracts and historic charm appeals to families and retirees alike, and many workers commute to jobs in Carson City, Reno, or even Fernley. The town’s historic downtown and open space add to its appeal in a region where demand continues to rise.
Dayton’s sharp price appreciation in recent years reflects broader market trends in western Nevada. The town’s affordability advantage compared to Reno has narrowed, but its livability remains high. With the Lyon County School District investing in facilities and local infrastructure expanding slowly, Dayton continues to attract steady buyer interest. Its high housing value doesn’t come from flash — it’s the product of slow, sustained, practical growth in a part of Nevada that’s gaining more attention every year.
17. Boulder City – 210% Home Price Increase Since 2012
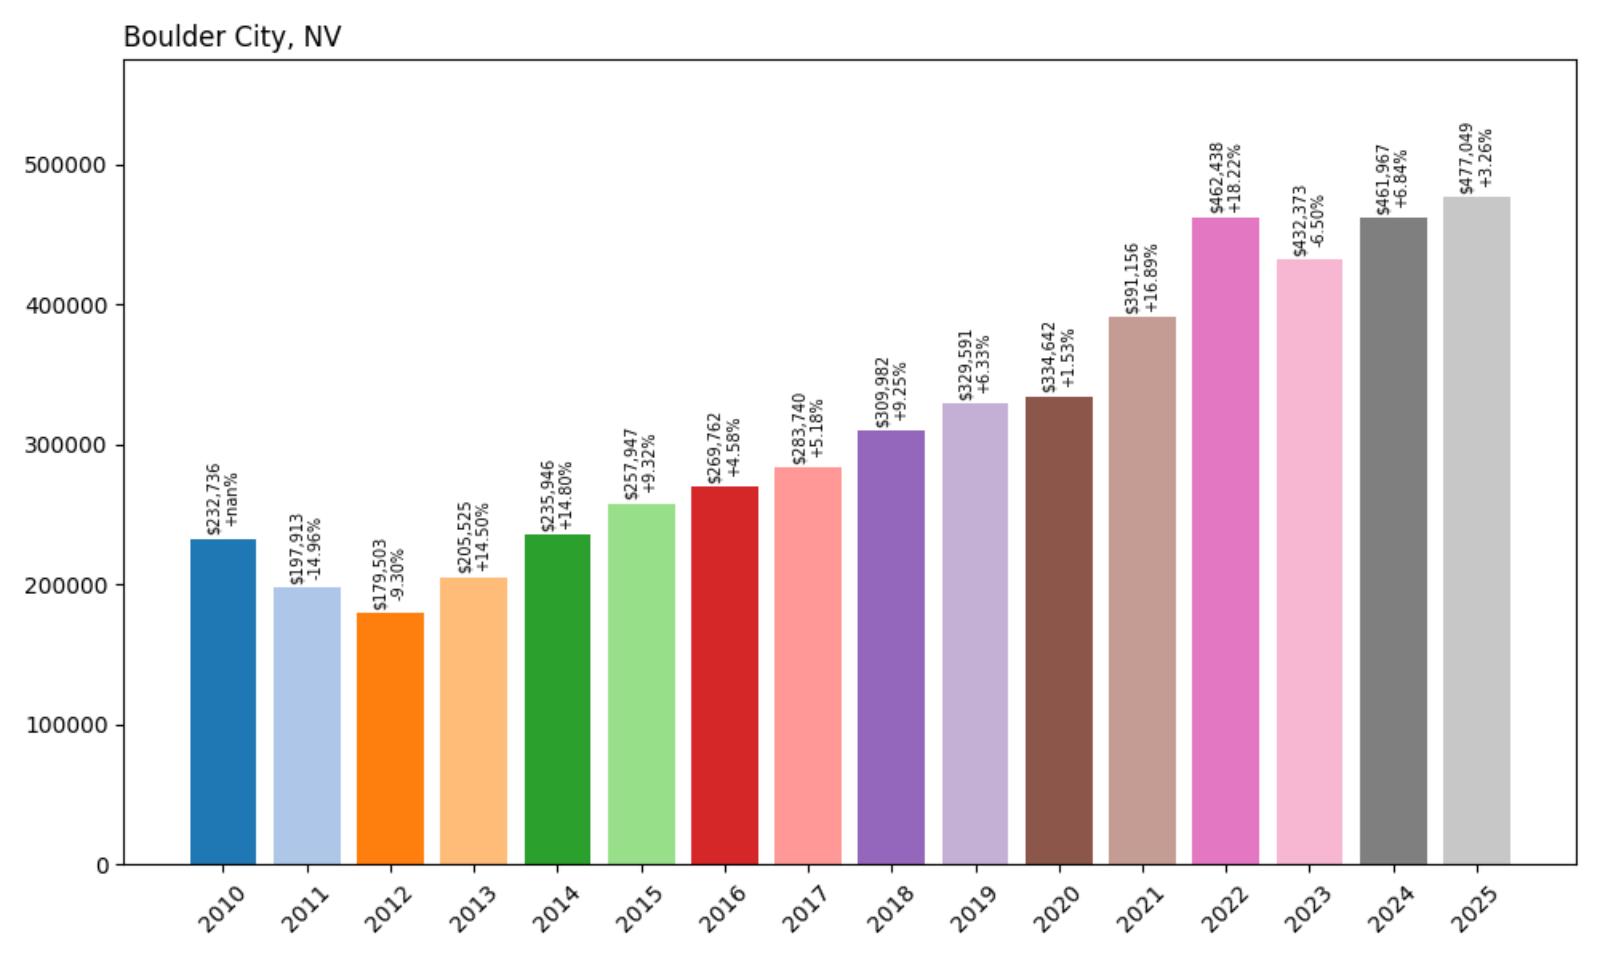
- 2010: $232,736
- 2011: $197,913 (−$34,823, −14.96% from previous year)
- 2012: $179,503 (−$18,410, −9.30% from previous year)
- 2013: $205,525 (+$26,022, +14.50% from previous year)
- 2014: $235,946 (+$30,422, +14.80% from previous year)
- 2015: $257,947 (+$22,000, +9.32% from previous year)
- 2016: $269,762 (+$11,816, +4.58% from previous year)
- 2017: $283,740 (+$13,978, +5.18% from previous year)
- 2018: $309,982 (+$26,242, +9.25% from previous year)
- 2019: $329,591 (+$19,609, +6.33% from previous year)
- 2020: $334,642 (+$5,050, +1.53% from previous year)
- 2021: $391,156 (+$56,514, +16.89% from previous year)
- 2022: $462,438 (+$71,283, +18.22% from previous year)
- 2023: $432,373 (−$30,065, −6.50% from previous year)
- 2024: $461,967 (+$29,594, +6.84% from previous year)
- 2025: $477,049 (+$15,081, +3.26% from previous year)
Boulder City’s housing values have jumped from $179,503 in 2012 to $477,049 in 2025 — a 210% increase. The market saw steady, moderate gains throughout the 2010s, followed by a surge from 2020 to 2022 when annual increases exceeded $50,000. Even with a temporary setback in 2023, the rebound in the following years reflects solid demand and the area’s enduring appeal. Today, Boulder City ranks among Nevada’s most desirable and most expensive small cities.
Boulder City – Scenic Living with Strict Growth Controls

Boulder City stands apart from much of Nevada for one major reason: it’s one of the few towns in the state that actively restricts growth. With a population cap in place and a legacy of slow, deliberate development, the city has managed to maintain its small-town charm despite its proximity to Las Vegas and Hoover Dam. Those policies — along with spectacular desert and lake views — have helped drive housing demand and protect long-term values. For buyers, limited supply makes the market competitive; for residents, it ensures a high quality of life.
The town’s layout is defined by quiet neighborhoods, historic buildings, and clean streets — a rarity for a town within commuting distance of a metro area like Las Vegas. Boulder City offers the benefits of Southern Nevada weather and access, without the density or urban sprawl. As water issues and zoning debates continue to shape development across the state, Boulder City’s preservation-first model may become even more attractive. Its rising home prices reflect not just demand, but a lifestyle that’s increasingly rare in Nevada.
16. Henderson – 212% Home Price Increase Since 2012
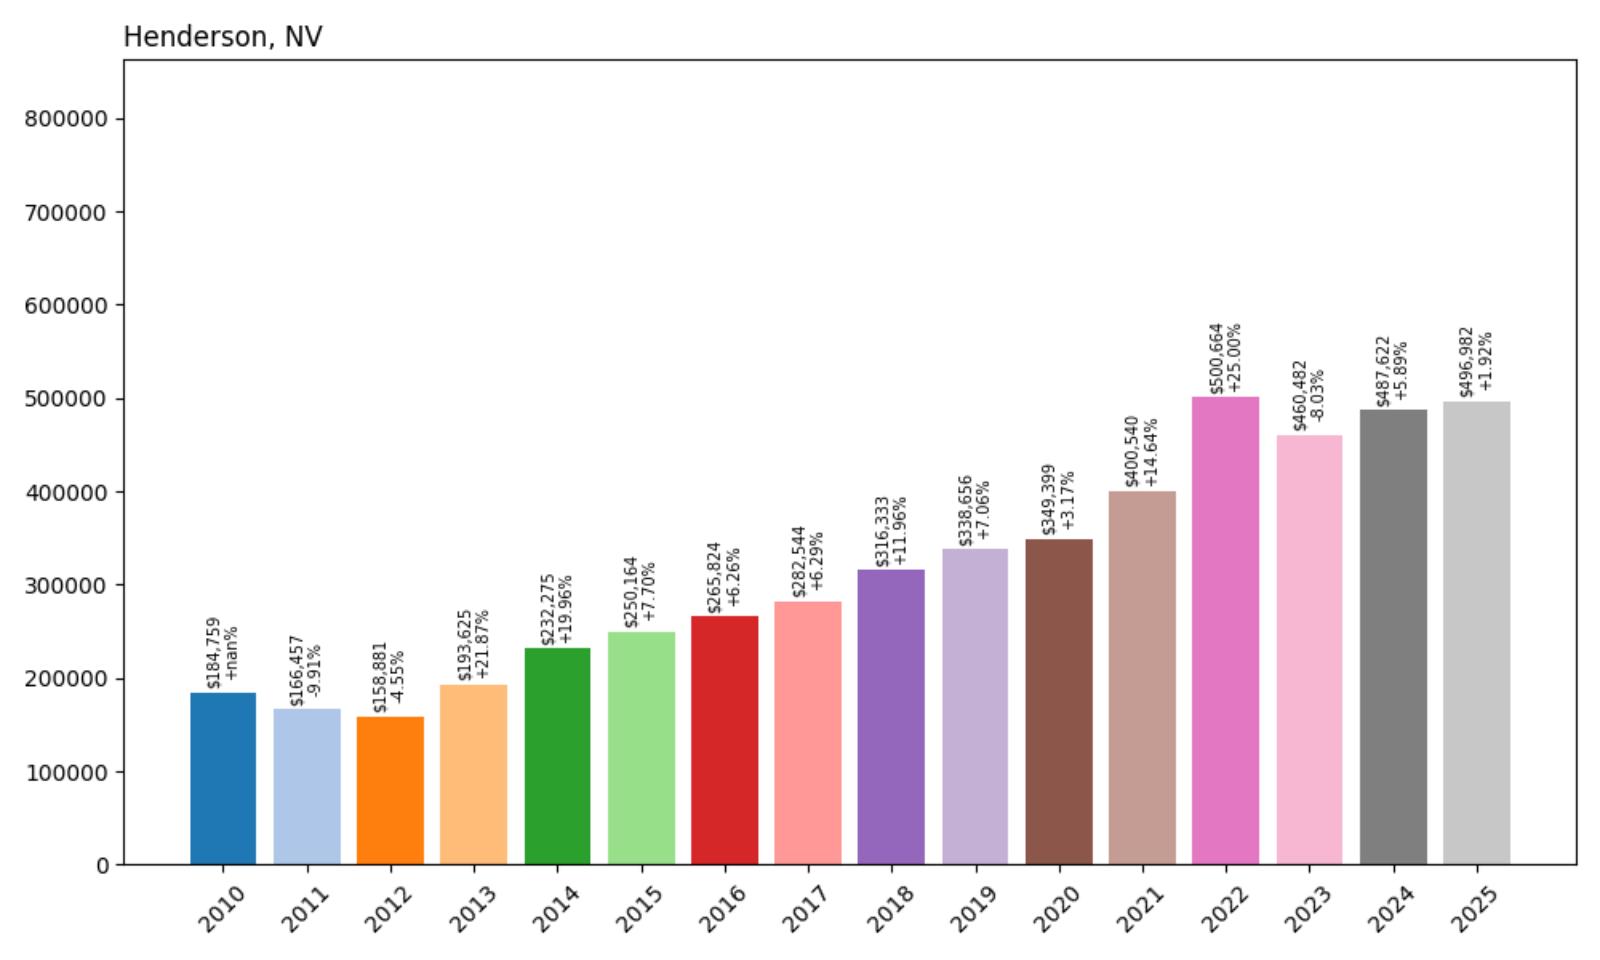
- 2010: $184,759
- 2011: $166,457 (−$18,302, −9.91% from previous year)
- 2012: $158,881 (−$7,576, −4.55% from previous year)
- 2013: $193,625 (+$34,744, +21.87% from previous year)
- 2014: $232,275 (+$38,650, +19.96% from previous year)
- 2015: $250,164 (+$17,890, +7.70% from previous year)
- 2016: $265,824 (+$15,660, +6.26% from previous year)
- 2017: $282,544 (+$16,720, +6.29% from previous year)
- 2018: $316,333 (+$33,789, +11.96% from previous year)
- 2019: $338,656 (+$22,323, +7.06% from previous year)
- 2020: $349,399 (+$10,743, +3.17% from previous year)
- 2021: $400,540 (+$51,142, +14.64% from previous year)
- 2022: $500,664 (+$100,124, +25.00% from previous year)
- 2023: $460,482 (−$40,182, −8.03% from previous year)
- 2024: $487,622 (+$27,139, +5.89% from previous year)
- 2025: $496,982 (+$9,360, +1.92% from previous year)
Henderson home prices have more than tripled since 2012, rising from $158,881 to $496,982 by 2025 — a 212% increase. While the city experienced some volatility in 2023, its overall growth trajectory has been strong and steady. The market’s peak came in 2022 during the pandemic boom, but values remain high and appear to be stabilizing. Henderson continues to be one of the most sought-after cities in Nevada thanks to its location, quality of life, and diversified economy.
Henderson – A Polished Suburban Powerhouse

Henderson is more than just a suburb of Las Vegas — it’s a self-sustaining city with a thriving job market, top-ranked schools, and carefully planned neighborhoods. Often regarded as one of the best places to live in Nevada, Henderson has seen massive investment in infrastructure, shopping centers, medical campuses, and recreational areas over the past two decades. Buyers are drawn to the city’s master-planned communities, including Green Valley and Inspirada, as well as its proximity to the Strip without the congestion.
The city’s appeal spans a wide demographic — from young families to retirees — and its housing market reflects that versatility. Henderson’s value proposition lies in its livability: great parks, scenic desert trails, and a general sense of order. As Las Vegas continues to expand, Henderson holds its own as a premium destination, not just an overflow area. With home values now pushing $500,000, the city is competing with high-end markets across the state and holding strong.
15. Carson City – 227% Home Price Increase Since 2012

- 2010: $174,764
- 2011: $153,540 (−$21,224, −12.14% from previous year)
- 2012: $152,037 (−$1,503, −0.98% from previous year)
- 2013: $171,649 (+$19,611, +12.90% from previous year)
- 2014: $196,567 (+$24,918, +14.52% from previous year)
- 2015: $216,431 (+$19,864, +10.11% from previous year)
- 2016: $253,468 (+$37,037, +17.11% from previous year)
- 2017: $282,236 (+$28,768, +11.35% from previous year)
- 2018: $313,519 (+$31,283, +11.08% from previous year)
- 2019: $339,754 (+$26,235, +8.37% from previous year)
- 2020: $356,052 (+$16,298, +4.80% from previous year)
- 2021: $435,685 (+$79,634, +22.37% from previous year)
- 2022: $498,536 (+$62,851, +14.43% from previous year)
- 2023: $459,321 (−$39,215, −7.87% from previous year)
- 2024: $486,670 (+$27,349, +5.95% from previous year)
- 2025: $497,575 (+$10,905, +2.24% from previous year)
Carson City has seen housing values rise from $152,037 in 2012 to $497,575 in 2025, marking a 227% increase over that period. The capital city’s growth has been consistent, with strong gains throughout the late 2010s and a major surge during the 2020–2022 period. Even after a brief cooldown in 2023, the market has regained upward momentum, confirming Carson City’s place as a top-tier market in northern Nevada.
Carson City – A Capital That Keeps Climbing
As Nevada’s capital, Carson City blends small-town accessibility with state-level prominence. It’s home to government institutions, a historic downtown, and a growing network of schools, trails, and healthcare options. Located near the eastern edge of Lake Tahoe and just south of Reno, Carson City attracts residents who want proximity to outdoor adventure without sacrificing essential amenities. Over the past decade, the city has quietly become a favorite among professionals, retirees, and telecommuters alike.
The strong housing appreciation here reflects both improved quality of life and a limited housing stock. Carson City’s growth has been deliberate, and while not as explosive as Las Vegas, it’s been more stable. Prices near $500,000 are now the norm, and demand remains consistent thanks to the city’s regional importance and attractive lifestyle. With increased investment in housing and public works, Carson City is poised to continue its upward trajectory well into the next cycle.
14. Logandale Home Prices Over Time (+145.7% from 2012 to 2025)
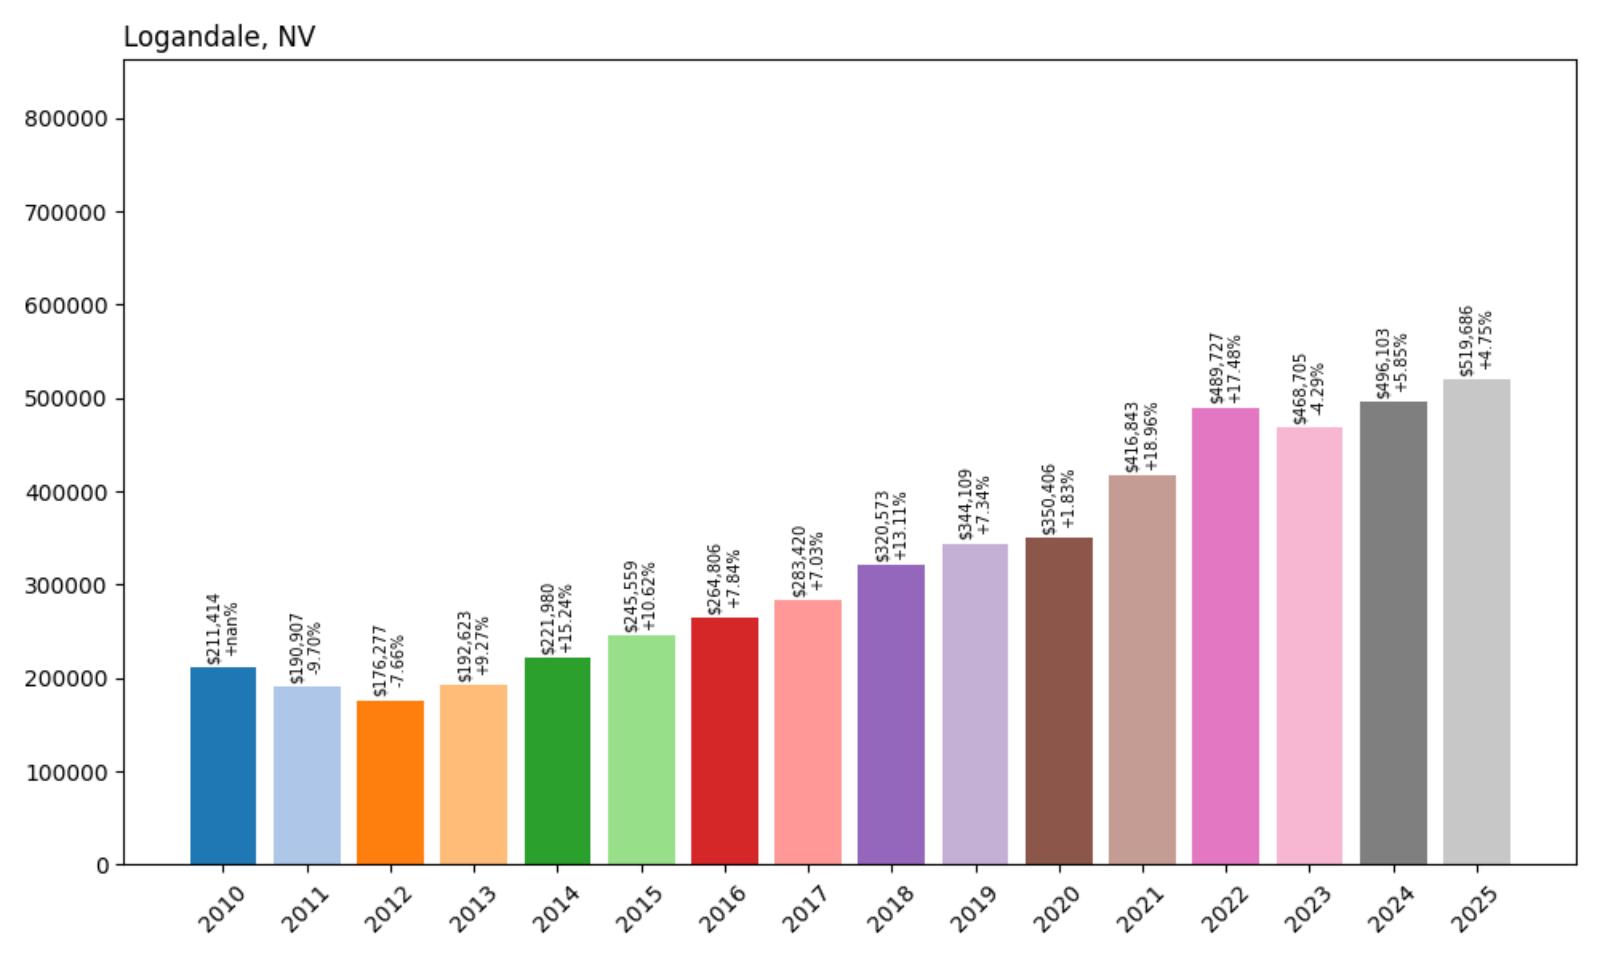
- 2010: $211,414
- 2011: $190,907 (−$20,507, −9.70% from previous year)
- 2012: $176,277 (−$14,630, −7.66% from previous year)
- 2013: $192,623 (+$16,345, +9.27% from previous year)
- 2014: $221,980 (+$29,357, +15.24% from previous year)
- 2015: $245,559 (+$23,579, +10.62% from previous year)
- 2016: $264,806 (+$19,248, +7.84% from previous year)
- 2017: $283,420 (+$18,613, +7.03% from previous year)
- 2018: $320,573 (+$37,153, +13.11% from previous year)
- 2019: $344,109 (+$23,536, +7.34% from previous year)
- 2020: $350,406 (+$6,297, +1.83% from previous year)
- 2021: $416,843 (+$66,437, +18.96% from previous year)
- 2022: $489,727 (+$72,884, +17.48% from previous year)
- 2023: $468,705 (−$21,022, −4.29% from previous year)
- 2024: $496,103 (+$27,397, +5.85% from previous year)
- 2025: $519,686 (+$23,584, +4.75% from previous year)
Logandale’s home values have more than doubled since 2012, rising from $176,277 to $519,686 by 2025 — an impressive 145.7% increase over 13 years. After bottoming out in the early 2010s, prices steadily recovered with year-after-year gains, particularly from 2014 to 2018 when appreciation exceeded 10% annually. A modest dip occurred in 2023 during broader market corrections, but the town bounced back by 2025 to set a new record high. Even during years of slower national growth, Logandale demonstrated a consistent upward trajectory that’s lifted it into the upper echelon of Nevada’s most expensive housing markets.
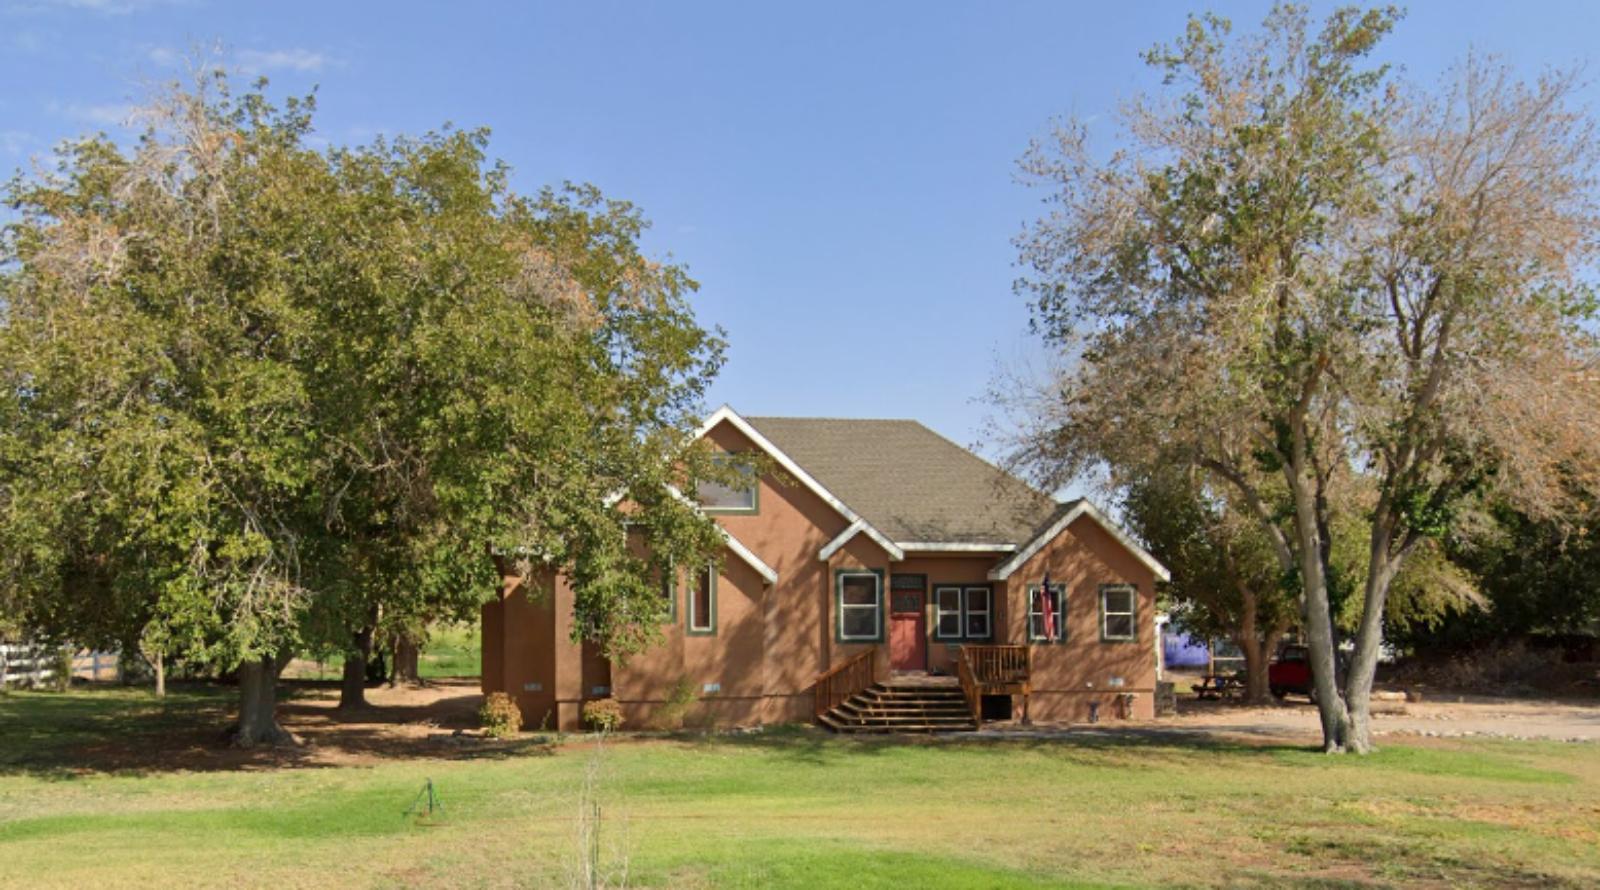
Logandale: A Quiet Town with Surging Demand
🔥 Would you like to save this?
Logandale’s price boom reflects a broader shift in demand toward quieter, less urbanized parts of Clark County. Traditionally viewed as a sleepy agricultural area on the outskirts of Las Vegas’s influence, Logandale has seen growing appeal among buyers seeking more space, scenic surroundings, and fewer crowds. The town benefits from proximity to Valley of Fire State Park and the recreational attractions of Lake Mead, making it an appealing base for outdoor enthusiasts. At the same time, improved infrastructure and work-from-home flexibility have made rural living more viable — pushing prices higher as new buyers entered the market.
Local housing stock remains limited, which has contributed to competitive bidding and robust appreciation. Many homes are on larger lots or ranch-style parcels, catering to buyers who value land and privacy. Unlike Las Vegas suburbs that saw volatile investor activity, Logandale’s rise has been steadier and driven by owner-occupants. The price climb in the mid-to-late 2010s coincided with infrastructure improvements and better highway connectivity, allowing residents to commute when needed but still enjoy a small-town lifestyle. Today, Logandale represents one of the most dramatic turnarounds in Nevada real estate — transforming from overlooked farmland into one of the state’s top high-value markets.
13. Sparks Home Prices Over Time (+248.0% from 2012 to 2025)
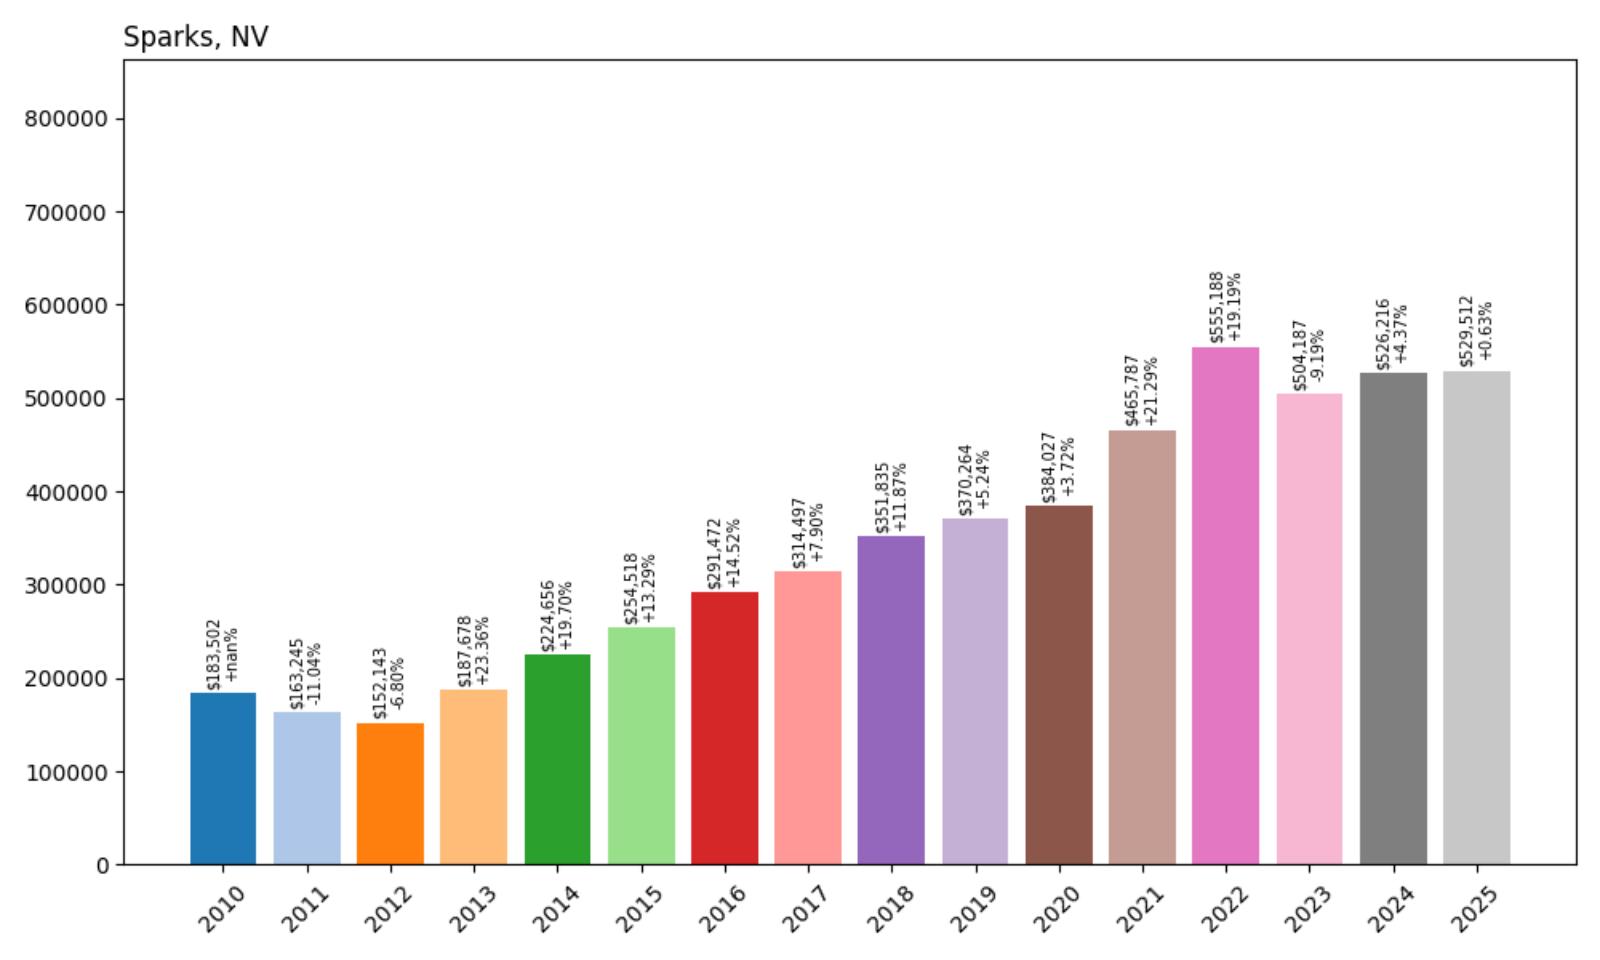
- 2010: $183,502
- 2011: $163,245 (−$20,257, −11.04% from previous year)
- 2012: $152,143 (−$11,102, −6.80% from previous year)
- 2013: $187,678 (+$35,535, +23.36% from previous year)
- 2014: $224,656 (+$36,977, +19.70% from previous year)
- 2015: $254,518 (+$29,862, +13.29% from previous year)
- 2016: $291,472 (+$36,955, +14.52% from previous year)
- 2017: $314,497 (+$23,024, +7.90% from previous year)
- 2018: $351,835 (+$37,338, +11.87% from previous year)
- 2019: $370,264 (+$18,429, +5.24% from previous year)
- 2020: $384,027 (+$13,763, +3.72% from previous year)
- 2021: $465,787 (+$81,760, +21.29% from previous year)
- 2022: $555,188 (+$89,401, +19.19% from previous year)
- 2023: $504,187 (−$51,001, −9.19% from previous year)
- 2024: $526,216 (+$22,029, +4.37% from previous year)
- 2025: $529,512 (+$3,296, +0.63% from previous year)
Since reaching its post-recession low in 2012 at $152,143, Sparks has experienced an extraordinary housing price surge — increasing by a remarkable 248.0% to $529,512 by 2025. This robust growth unfolded in two major waves: an initial recovery from 2013 to 2018 marked by double-digit annual gains, followed by another acceleration from 2020 through the peak in 2022. While 2023 brought a brief decline, Sparks quickly stabilized, and home values have now surpassed pre-dip levels. The long-term price trajectory positions Sparks as one of the fastest-appreciating cities in Nevada over the past decade.
Sparks: Reno’s Partner in a Regional Real Estate Boom

Often viewed as Reno’s lesser-known sibling, Sparks has forged its own identity during Northern Nevada’s real estate boom. The city’s transformation over the past 15 years reflects a strategic mix of residential development, revitalized industrial zones, and increased migration from neighboring states. As Reno grew more expensive, buyers seeking value without sacrificing access to employment and entertainment turned to Sparks. The city’s historic neighborhoods, master-planned communities like Spanish Springs, and proximity to Tesla’s Gigafactory have all fueled rapid price appreciation. Demand has been especially strong among first-time buyers and tech transplants priced out of coastal markets.
Infrastructural improvements, such as the Southeast Connector and expanded public transportation options, have further boosted Sparks’ appeal by improving connectivity across the metro area. At the same time, the local government has actively supported housing development to meet rising demand. Though the 2023 downturn briefly interrupted its momentum, Sparks has already resumed a positive growth trajectory, and affordability remains strong compared to coastal metros. With sustained in-migration, limited housing inventory, and a diversified economic base that includes logistics, manufacturing, and tech, Sparks is well-positioned to remain a key player in Nevada’s housing future.
12. Wellington Home Prices Over Time (+178.4% from 2012 to 2025)
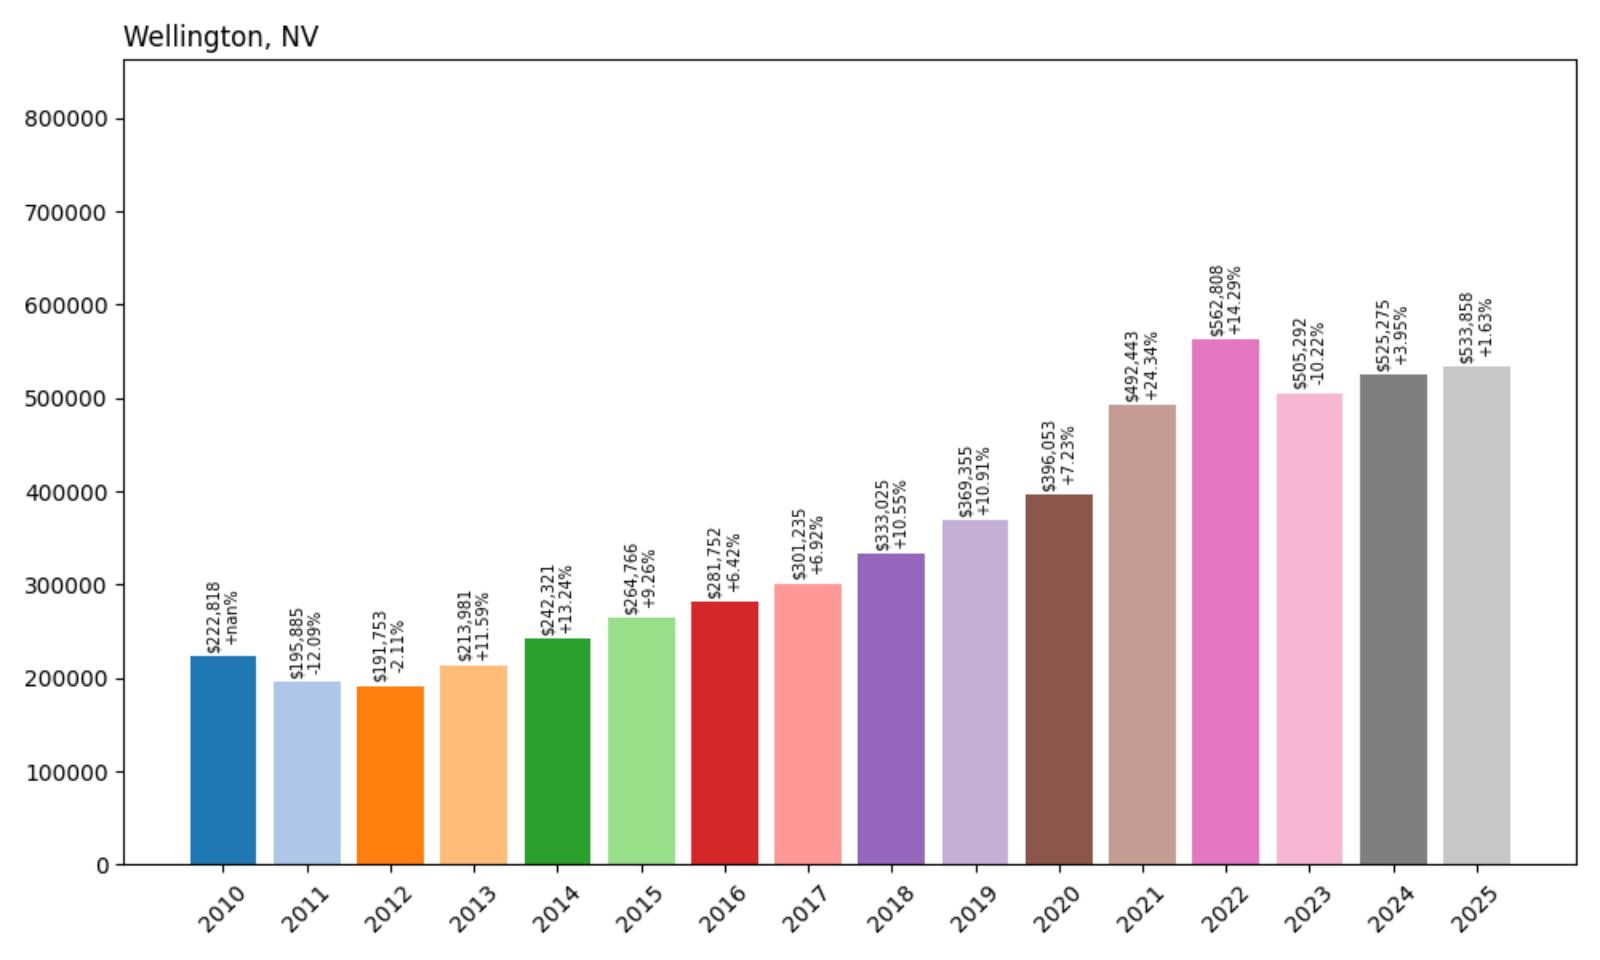
- 2010: $222,818
- 2011: $195,885 (−$26,933, −12.09% from previous year)
- 2012: $191,753 (−$4,132, −2.11% from previous year)
- 2013: $213,981 (+$22,228, +11.59% from previous year)
- 2014: $242,321 (+$28,340, +13.24% from previous year)
- 2015: $264,766 (+$22,445, +9.26% from previous year)
- 2016: $281,752 (+$16,986, +6.42% from previous year)
- 2017: $301,235 (+$19,483, +6.92% from previous year)
- 2018: $333,025 (+$31,790, +10.55% from previous year)
- 2019: $369,355 (+$36,330, +10.91% from previous year)
- 2020: $396,053 (+$26,698, +7.23% from previous year)
- 2021: $492,443 (+$96,390, +24.34% from previous year)
- 2022: $562,808 (+$70,365, +14.29% from previous year)
- 2023: $505,292 (−$57,516, −10.22% from previous year)
- 2024: $525,275 (+$19,983, +3.95% from previous year)
- 2025: $533,858 (+$8,583, +1.63% from previous year)
Home values in Wellington have climbed significantly over the last decade-plus, rebounding from a 2012 low of $191,753 to reach $533,858 in 2025 — a total gain of 178.4%. The town saw especially strong appreciation between 2013 and 2022, with consistent year-over-year increases often exceeding 10%. Like many communities, Wellington experienced a setback in 2023, but the market quickly corrected with two consecutive years of modest gains. Despite the recent volatility, the long-term trend reflects steady and substantial value growth that far outpaces national averages.
Wellington: A Rural Stronghold with Big Market Momentum
Located in southern Lyon County near the Smith Valley agricultural region, Wellington offers a unique real estate story within Nevada’s landscape. What sets this town apart is its rural charm combined with access to vital regional routes like Highway 208. While it doesn’t share the fast-paced development of urban centers, Wellington has become a magnet for buyers seeking space, views, and privacy — particularly among retirees, remote workers, and Californians relocating for affordability. Larger land parcels and custom-built homes give Wellington a distinct value proposition, and its scenic surroundings make it especially appealing for those prioritizing lifestyle over density.
The area has also benefited from increased interest in rural and exurban housing in the post-pandemic era, as buyers reassess their living priorities. That trend helped drive Wellington’s peak pricing in 2022, before a temporary correction in 2023 brought prices down from their highs. Importantly, this was not a market crash but a rebalancing after years of accelerated appreciation. With affordability still favorable compared to Reno or Lake Tahoe regions, and ample room for controlled development, Wellington is poised for long-term resilience. Its steady price recovery since 2023 suggests a market that is adapting to new realities while holding strong appeal for discerning buyers.
11. Mount Charleston Home Prices Since 2010: +110.8%
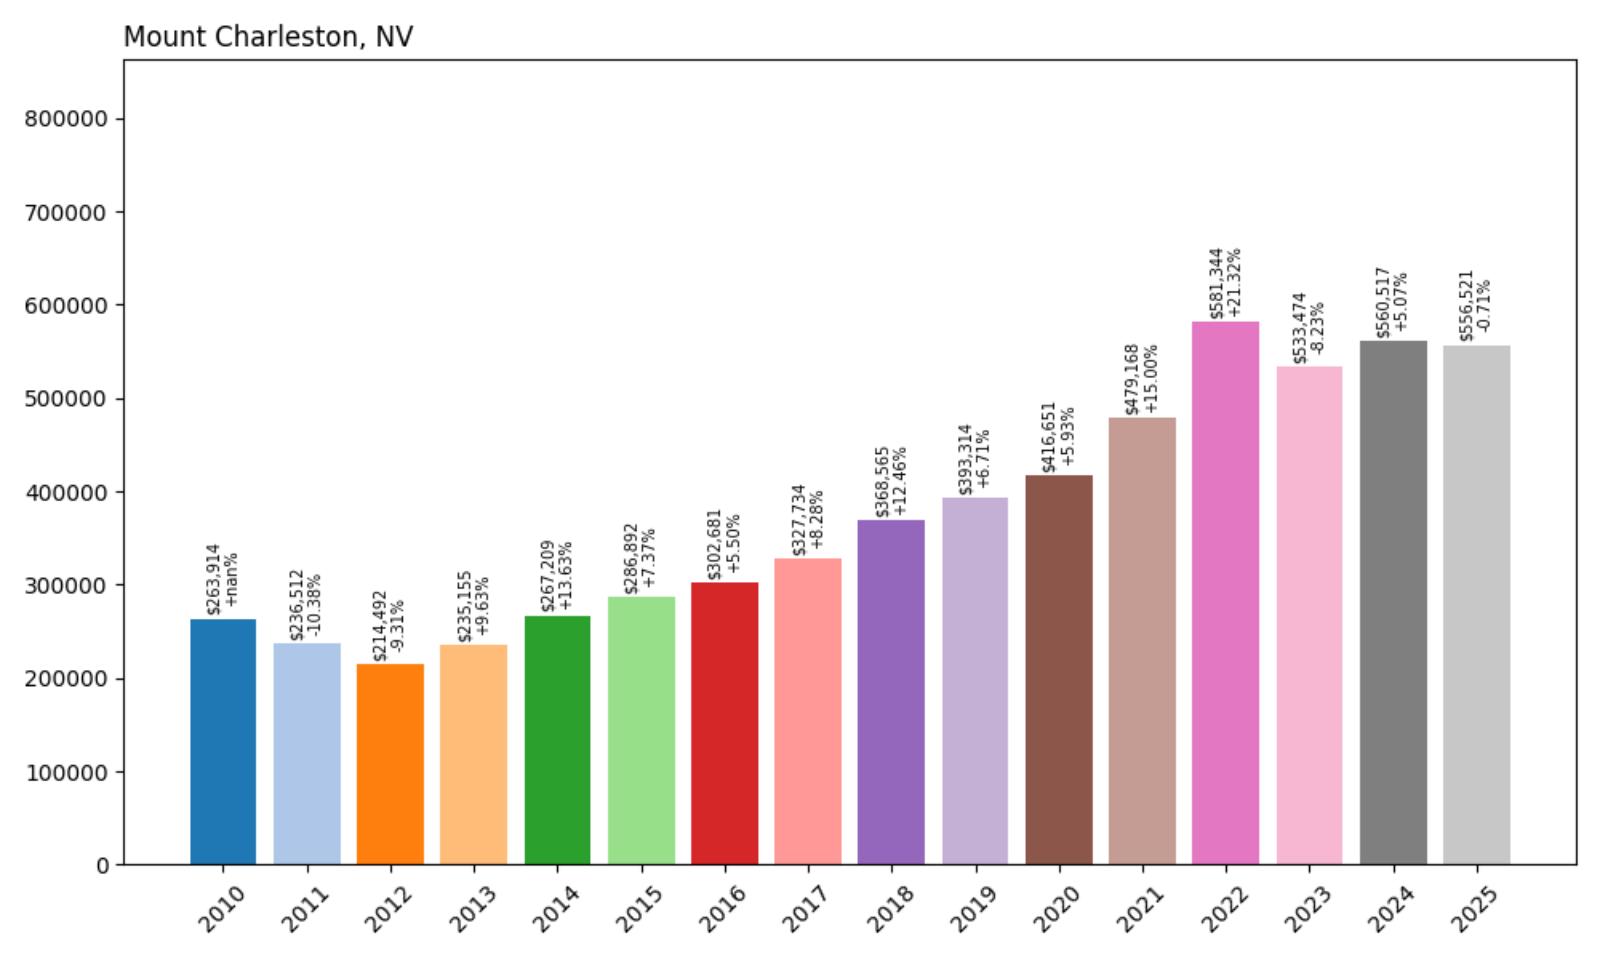
- 2010: $263,914
- 2011: $236,512 (−$27,402, −10.38% from previous year)
- 2012: $214,492 (−$22,020, −9.31% from previous year)
- 2013: $235,155 (+$20,663, +9.63% from previous year)
- 2014: $267,209 (+$32,054, +13.63% from previous year)
- 2015: $286,892 (+$19,683, +7.37% from previous year)
- 2016: $302,681 (+$15,790, +5.50% from previous year)
- 2017: $327,734 (+$25,053, +8.28% from previous year)
- 2018: $368,565 (+$40,831, +12.46% from previous year)
- 2019: $393,314 (+$24,749, +6.71% from previous year)
- 2020: $416,651 (+$23,337, +5.93% from previous year)
- 2021: $479,168 (+$62,517, +15.00% from previous year)
- 2022: $581,344 (+$102,176, +21.32% from previous year)
- 2023: $533,474 (−$47,870, −8.23% from previous year)
- 2024: $560,517 (+$27,043, +5.07% from previous year)
- 2025: $556,521 (−$3,995, −0.71% from previous year)
Mount Charleston’s home prices have seen a 110.8% increase since 2010, rising from $263,914 to $556,521 by 2025. The most dramatic appreciation occurred between 2020 and 2022, including a jump of over $100,000 in 2022 alone. Even with a moderate dip in 2023, the market has mostly stabilized, indicating robust long-term demand in this mountainous enclave.
Mount Charleston’s Alpine Appeal
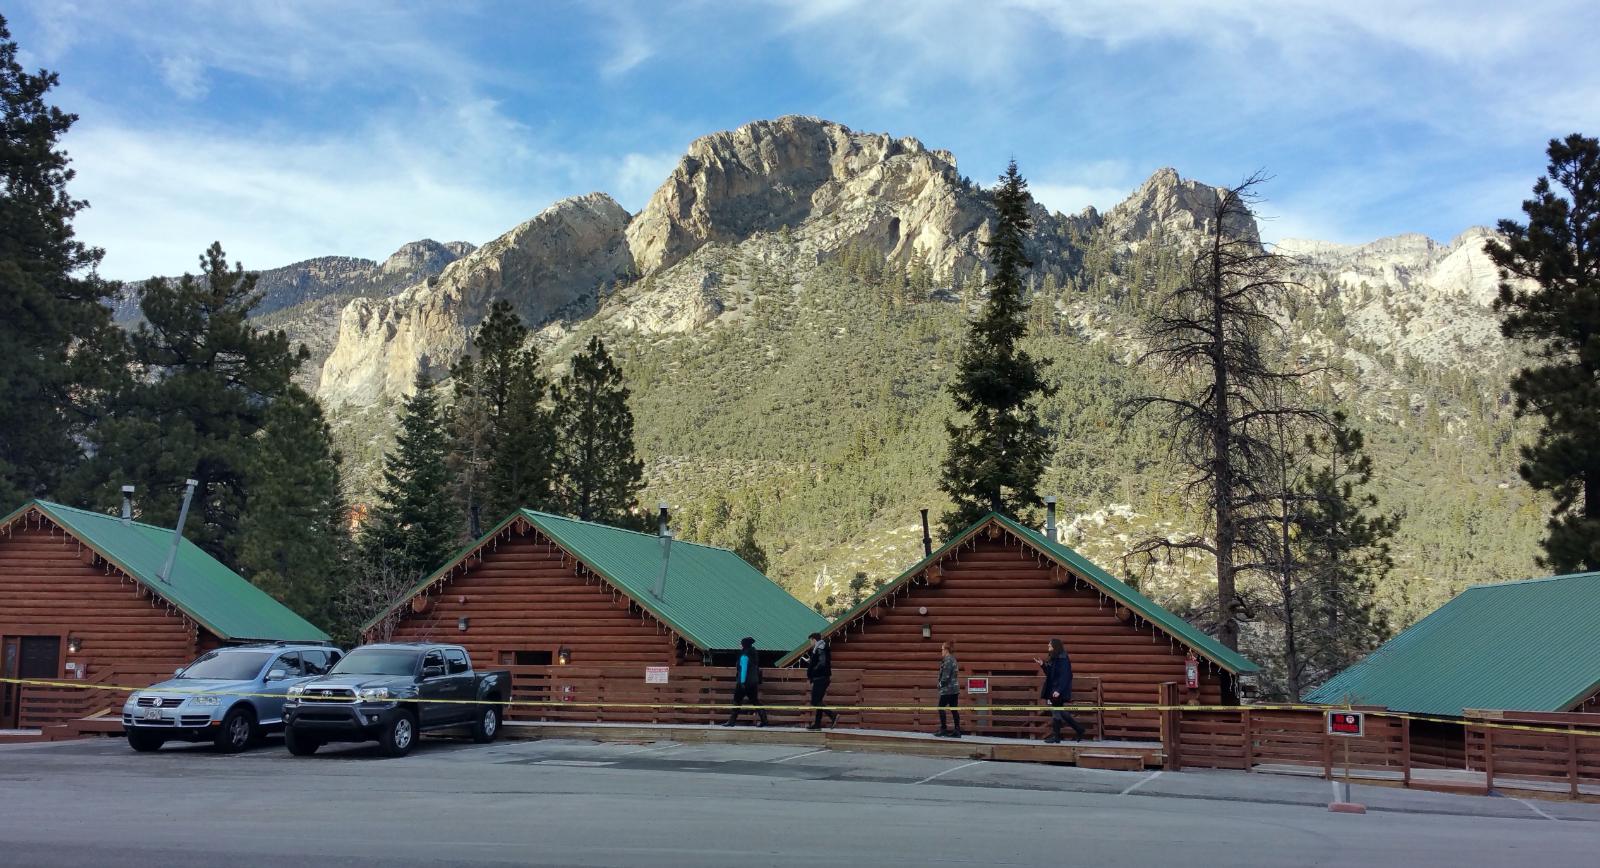
Mount Charleston offers a distinctly different lifestyle from the rest of Nevada. Tucked into the Spring Mountains, it feels worlds away from Las Vegas despite being less than an hour’s drive. Buyers here are typically drawn to the serene setting, snowy winters, and hiking trails through pine forests—rare amenities in a desert state. With limited housing stock, prices have consistently risen as more urban dwellers seek cooler and quieter alternatives for second homes or full-time living.
What’s especially noteworthy is how this market weathered the post-2022 cooling period. Even after a noticeable drop in 2023, prices bounced back in 2024 and barely declined in 2025, reflecting strong underlying confidence. This resilience, combined with Mount Charleston’s exclusivity and scenic character, positions it as a premium long-term investment spot in Southern Nevada. Real estate here isn’t just about square footage—it’s about access to year-round outdoor living, clean air, and a close-knit mountain community.
10. Reno Home Prices Since 2010: +187.4%
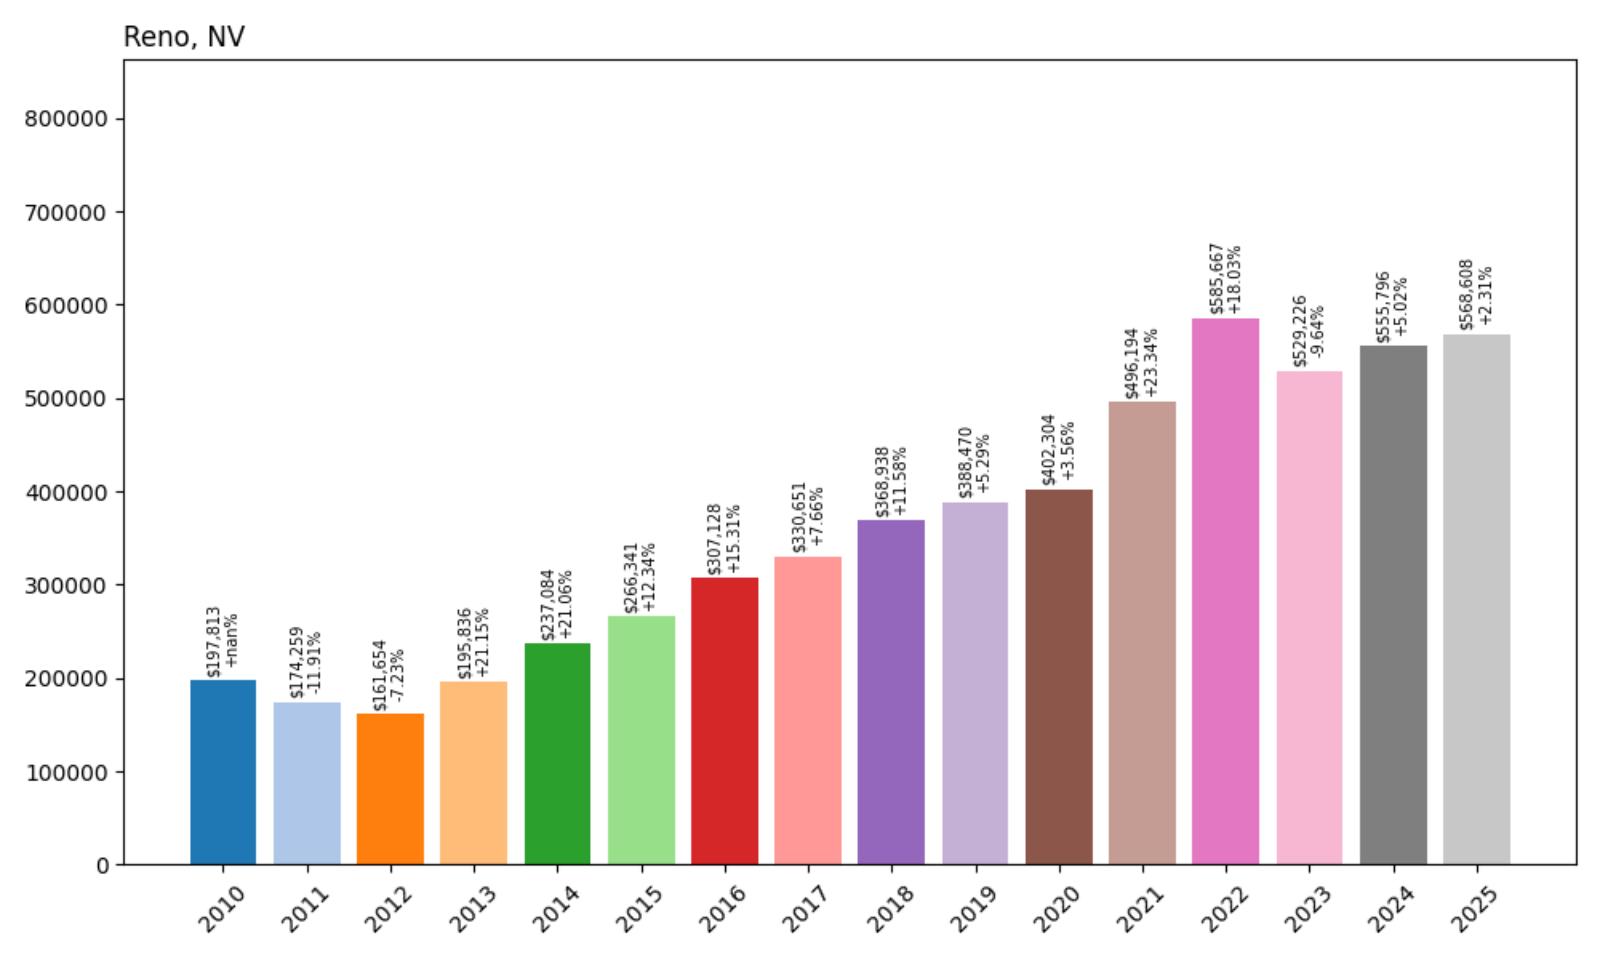
- 2010: $197,813
- 2011: $174,259 (−$23,553, −11.91% from previous year)
- 2012: $161,654 (−$12,606, −7.23% from previous year)
- 2013: $195,836 (+$34,182, +21.15% from previous year)
- 2014: $237,084 (+$41,248, +21.06% from previous year)
- 2015: $266,341 (+$29,257, +12.34% from previous year)
- 2016: $307,128 (+$40,787, +15.31% from previous year)
- 2017: $330,651 (+$23,523, +7.66% from previous year)
- 2018: $368,938 (+$38,287, +11.58% from previous year)
- 2019: $388,470 (+$19,531, +5.29% from previous year)
- 2020: $402,304 (+$13,835, +3.56% from previous year)
- 2021: $496,194 (+$93,890, +23.34% from previous year)
- 2022: $585,667 (+$89,474, +18.03% from previous year)
- 2023: $529,226 (−$56,441, −9.64% from previous year)
- 2024: $555,796 (+$26,570, +5.02% from previous year)
- 2025: $568,608 (+$12,812, +2.31% from previous year)
Reno’s home values have surged 187.4% over 15 years, growing from $197,813 in 2010 to $568,608 in 2025. While the early 2010s were a period of correction, the market rebounded sharply, especially from 2013 to 2022. The peak came in 2022, followed by a cooling in 2023, but the overall growth trend remains solid and upward-sloping.
Reno’s Tech Boom and Market Momentum

Once known mainly for its casinos, Reno has transformed into one of the West’s fastest-growing tech hubs. The arrival of companies like Tesla, Apple, and Switch to the Tahoe-Reno Industrial Center has ignited a jobs and housing boom. This economic diversification has added resilience to Reno’s real estate, helping it recover from dips quicker than other Nevada cities. The city also benefits from spillover demand from California buyers seeking tax relief and affordability without giving up proximity to Lake Tahoe and major urban centers.
The recent moderation in prices is more a reflection of national trends than local weakness. Reno still offers relatively affordable options for homebuyers compared to its coastal neighbors, and its amenities—from arts districts to skiing—continue to attract remote workers and retirees alike. Infrastructure improvements, including expanded transportation and housing developments, signal that this upward momentum is sustainable, even if the pace has slowed slightly in 2024–2025.
9. Smith Home Prices Since 2010: +150.7%
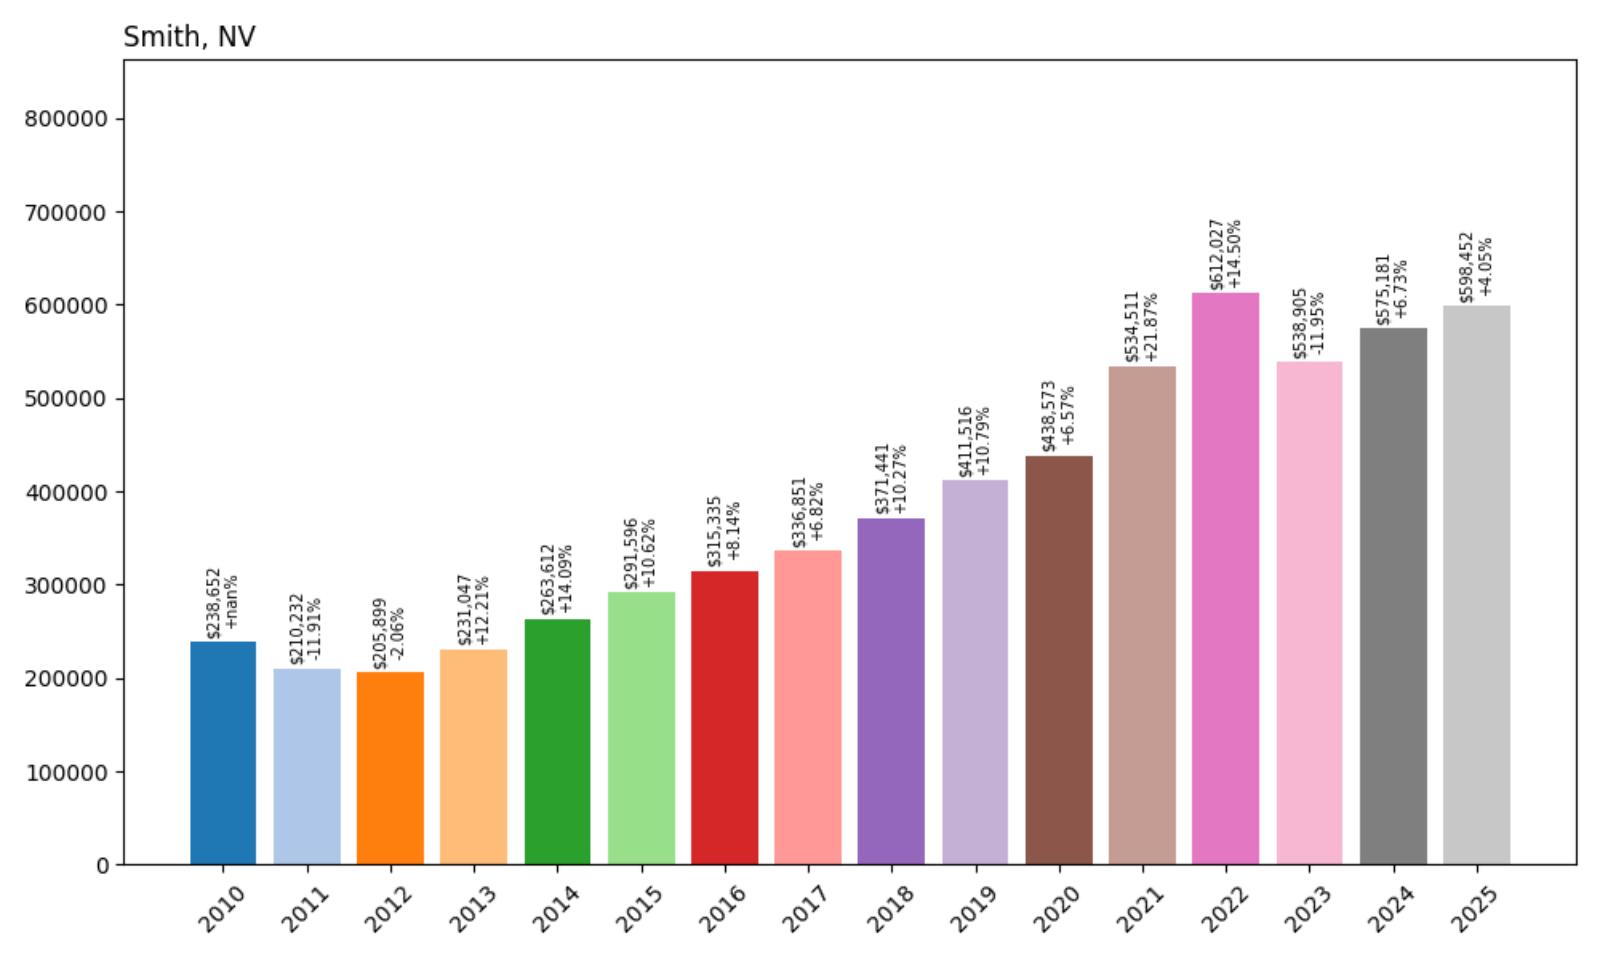
- 2010: $238,652
- 2011: $210,232 (−$28,419, −11.91% from previous year)
- 2012: $205,899 (−$4,333, −2.06% from previous year)
- 2013: $231,047 (+$25,148, +12.21% from previous year)
- 2014: $263,612 (+$32,564, +14.09% from previous year)
- 2015: $291,596 (+$27,985, +10.62% from previous year)
- 2016: $315,335 (+$23,739, +8.14% from previous year)
- 2017: $336,851 (+$21,516, +6.82% from previous year)
- 2018: $371,441 (+$34,590, +10.27% from previous year)
- 2019: $411,516 (+$40,075, +10.79% from previous year)
- 2020: $438,573 (+$27,057, +6.57% from previous year)
- 2021: $534,511 (+$95,938, +21.87% from previous year)
- 2022: $612,027 (+$77,516, +14.50% from previous year)
- 2023: $538,905 (−$73,122, −11.95% from previous year)
- 2024: $575,181 (+$36,277, +6.73% from previous year)
- 2025: $598,452 (+$23,271, +4.05% from previous year)
Smith’s home prices have increased 150.7% from $238,652 in 2010 to $598,452 in 2025. The town witnessed especially strong gains between 2020 and 2022, followed by a sharp drop in 2023 before prices began to recover. Despite volatility, long-term appreciation remains firmly in positive territory.
Smith’s Rural Growth and Recovery

Located in Lyon County, Smith appeals to those looking for a quieter lifestyle away from city congestion. Its growth is driven largely by affordability and proximity to larger employment centers like Yerington or even the Reno metro area. As remote work became more common, Smith attracted interest from families and individuals seeking more space and a lower cost of living. The town’s real estate market capitalized on this trend during the pandemic boom, with prices rising rapidly between 2020 and 2022.
While 2023 brought a noticeable correction, Smith has managed to regain some of that lost value in 2024 and 2025. The community’s continued appeal lies in its small-town charm and access to outdoor activities like fishing and hiking. With more Nevadans considering rural alternatives for primary or secondary homes, Smith stands out as a place that balances value with lifestyle. Infrastructure improvements and housing developments are helping stabilize this once-volatile market.
8. Gardnerville – 166.5% Home Price Increase Since 2012
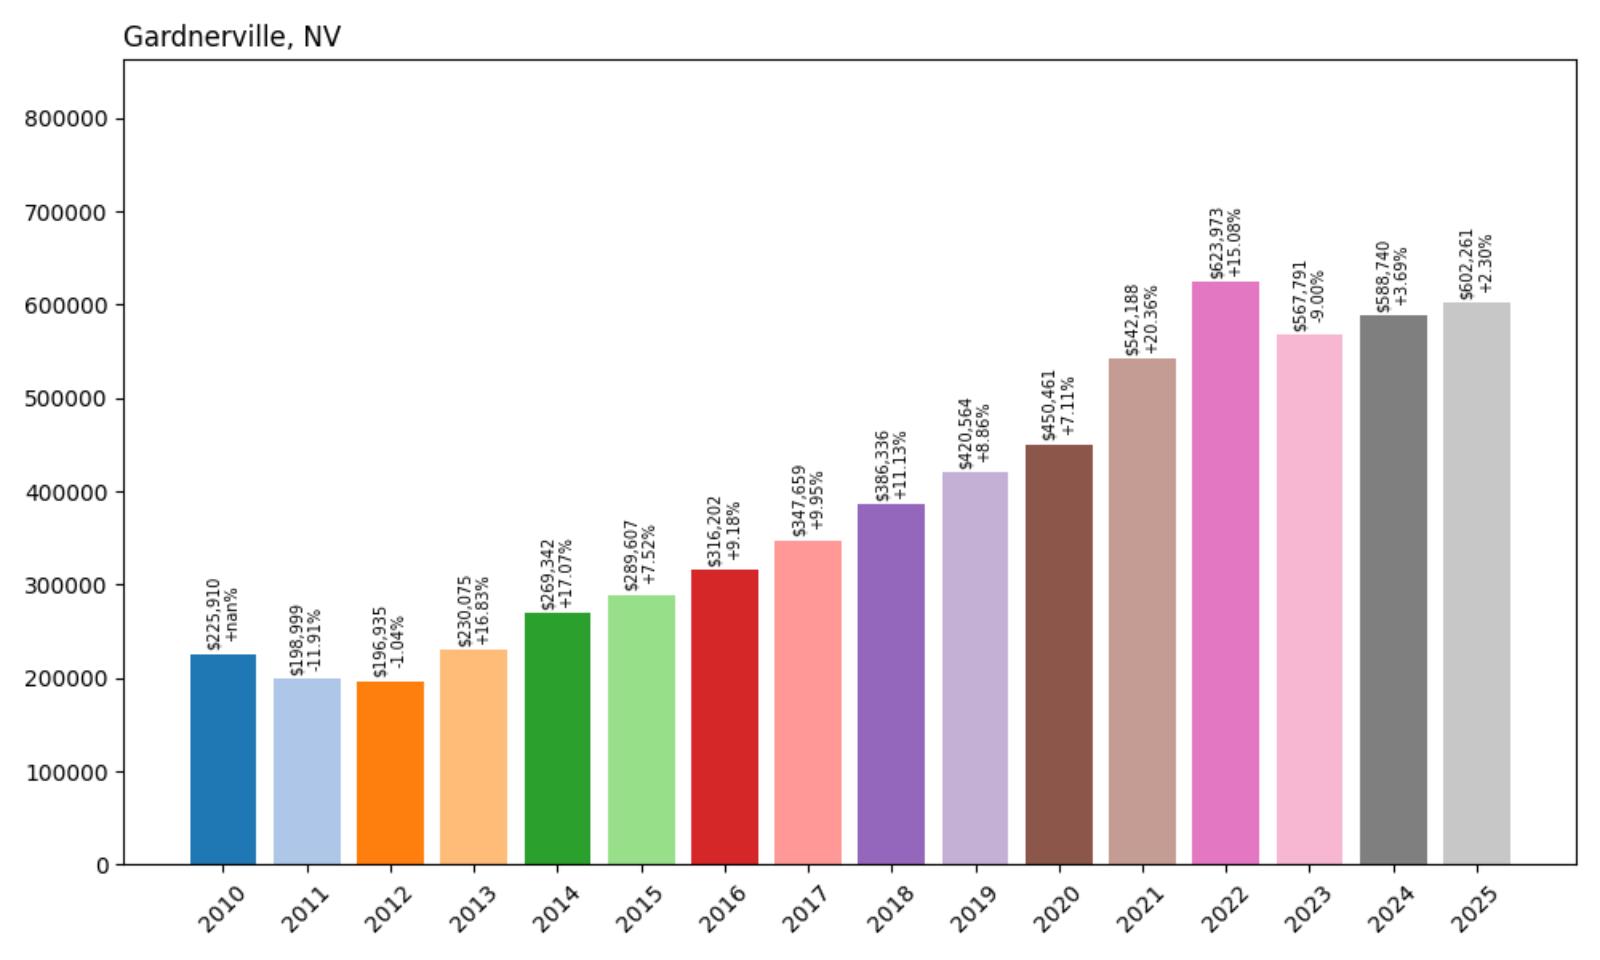
- 2010: $225,910
- 2011: $198,999 (−$26,911, −11.91% from previous year)
- 2012: $196,935 (−$2,064, −1.04% from previous year)
- 2013: $230,075 (+$33,140, +16.83% from previous year)
- 2014: $269,342 (+$39,267, +17.07% from previous year)
- 2015: $289,607 (+$20,265, +7.52% from previous year)
- 2016: $316,202 (+$26,595, +9.18% from previous year)
- 2017: $347,659 (+$31,456, +9.95% from previous year)
- 2018: $386,336 (+$38,677, +11.13% from previous year)
- 2019: $420,564 (+$34,228, +8.86% from previous year)
- 2020: $450,461 (+$29,897, +7.11% from previous year)
- 2021: $542,188 (+$91,728, +20.36% from previous year)
- 2022: $623,973 (+$81,785, +15.08% from previous year)
- 2023: $567,791 (−$56,182, −9.00% from previous year)
- 2024: $588,740 (+$20,949, +3.69% from previous year)
- 2025: $602,261 (+$13,520, +2.30% from previous year)
Gardnerville saw home prices surge by over 166% between 2012 and 2022, rising from $196,935 to a peak of $623,973. That’s a remarkable climb for a town that has historically offered a quieter, more affordable lifestyle in Douglas County. Though prices dipped in 2023, the recovery in 2024 and 2025 suggests continued buyer interest. Gardnerville’s appeal stems from its blend of small-town charm, mountain views, and proximity to both Reno and Lake Tahoe. The market appears to be stabilizing at a much higher baseline than a decade ago.
Gardnerville – Rural Comfort with Modern Growth

Located in western Nevada near the Sierra Nevada foothills, Gardnerville has become a magnet for families, retirees, and remote workers who value space without sacrificing convenience. Its location just south of Carson City and east of Lake Tahoe makes it ideal for those who want access to both nature and amenities. Gardnerville’s growth over the past decade reflects broader trends in western migration: a push away from city centers toward more scenic, peaceful living environments.
Infrastructure has improved along with population growth, bringing new schools, healthcare facilities, and retail development. The town’s housing market has followed suit, moving from the low-$200Ks in the early 2010s to well over $600K at the height of the boom. While a slight price correction hit in 2023, demand remains strong for properties that offer both views and value. Continued interest in rural Nevada is likely to keep Gardnerville on the radar for homebuyers across the region.
7. Minden – 185.7% Home Price Increase Since 2012
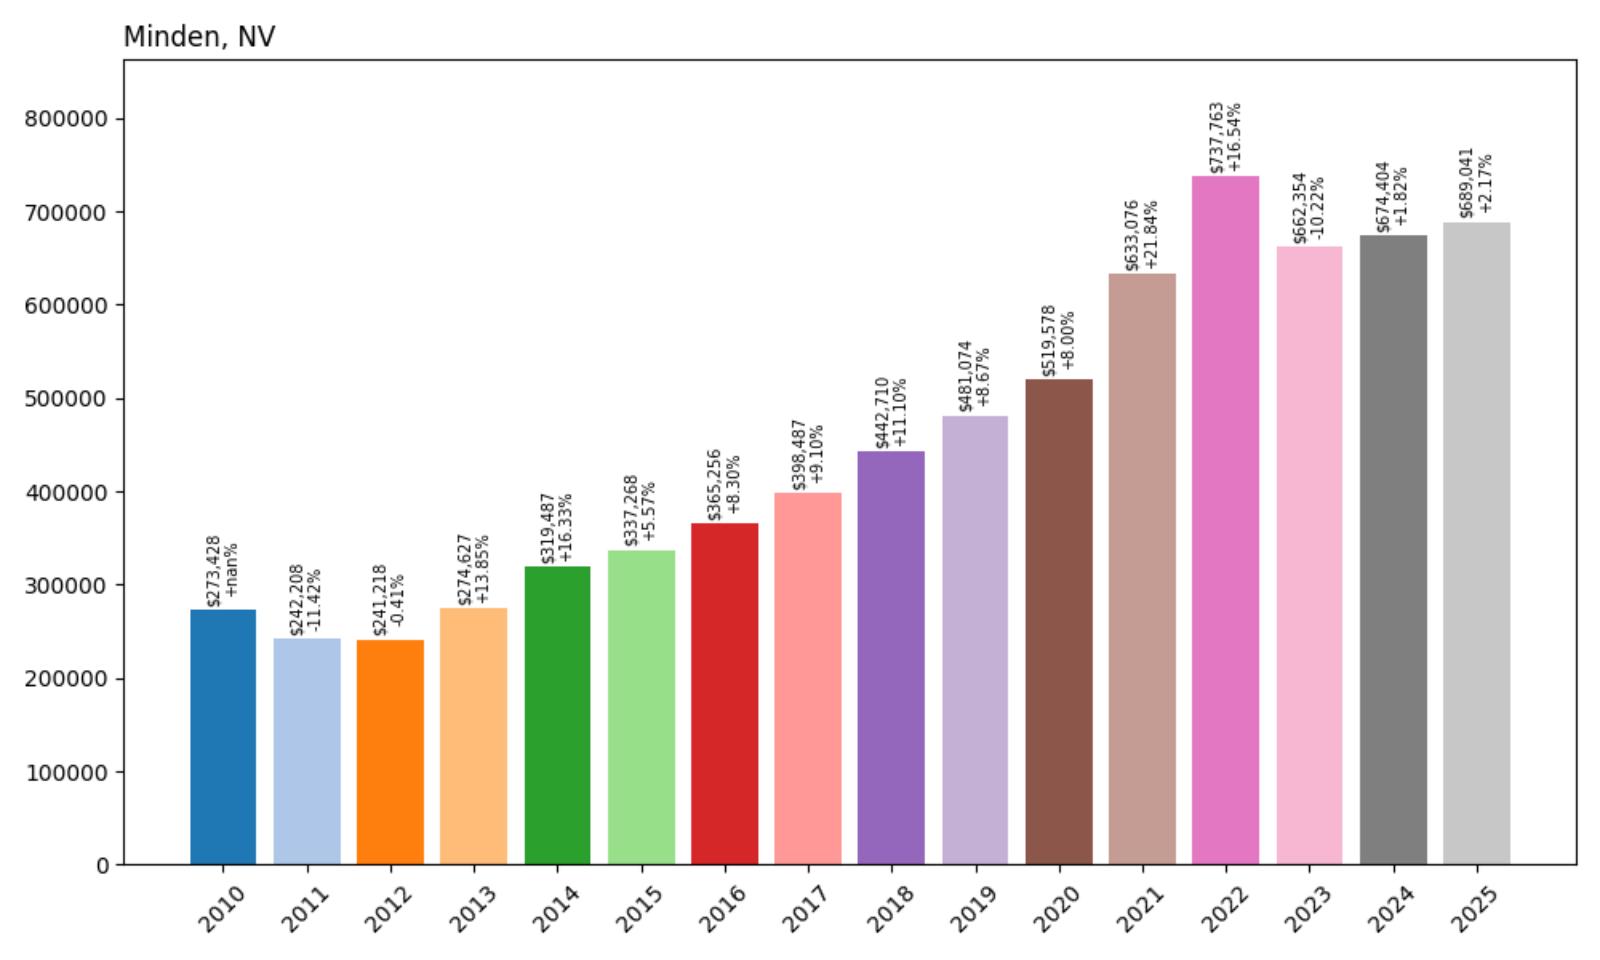
- 2010: $273,428
- 2011: $242,208 (−$31,220, −11.42% from previous year)
- 2012: $241,218 (−$991, −0.41% from previous year)
- 2013: $274,627 (+$33,410, +13.85% from previous year)
- 2014: $319,487 (+$44,860, +16.33% from previous year)
- 2015: $337,268 (+$17,782, +5.57% from previous year)
- 2016: $365,256 (+$27,987, +8.30% from previous year)
- 2017: $398,487 (+$33,231, +9.10% from previous year)
- 2018: $442,710 (+$44,223, +11.10% from previous year)
- 2019: $481,074 (+$38,364, +8.67% from previous year)
- 2020: $519,578 (+$38,504, +8.00% from previous year)
- 2021: $633,076 (+$113,498, +21.84% from previous year)
- 2022: $737,763 (+$104,687, +16.54% from previous year)
- 2023: $662,354 (−$75,409, −10.22% from previous year)
- 2024: $674,404 (+$12,050, +1.82% from previous year)
- 2025: $689,041 (+$14,637, +2.17% from previous year)
Minden’s property market exploded between 2012 and 2022, with home prices climbing from $241,218 to $737,763 — a massive 185.7% increase. Prices have softened slightly since then but remain well above pre-2020 levels. Like neighboring Gardnerville, Minden is located in scenic Douglas County and benefits from both natural beauty and increasing accessibility. Even with a drop in 2023, the recent rebound suggests long-term demand isn’t going away.
Minden – Small Town Living, Big Market Gains

Minden has long been known for its historic downtown, wide open spaces, and proximity to Tahoe’s alpine recreation. It’s a place where agriculture and affluence often meet — and recent years have seen a steady influx of buyers looking for just that balance. The local economy has diversified beyond farming, and newer housing developments have offered modern amenities without crowding out the town’s charm.
The housing surge from 2012 to 2022 mirrored broader interest in rural western living, especially as remote work made smaller towns more attractive. Minden’s quick rebound after the 2023 correction shows the resilience of this market. Buyers continue to seek homes here not only for the lifestyle, but also for the investment stability offered by a high-demand, low-inventory region just a short drive from Nevada’s capital and Lake Tahoe.
6. Stateline – 181.7% Home Price Increase Since 2012
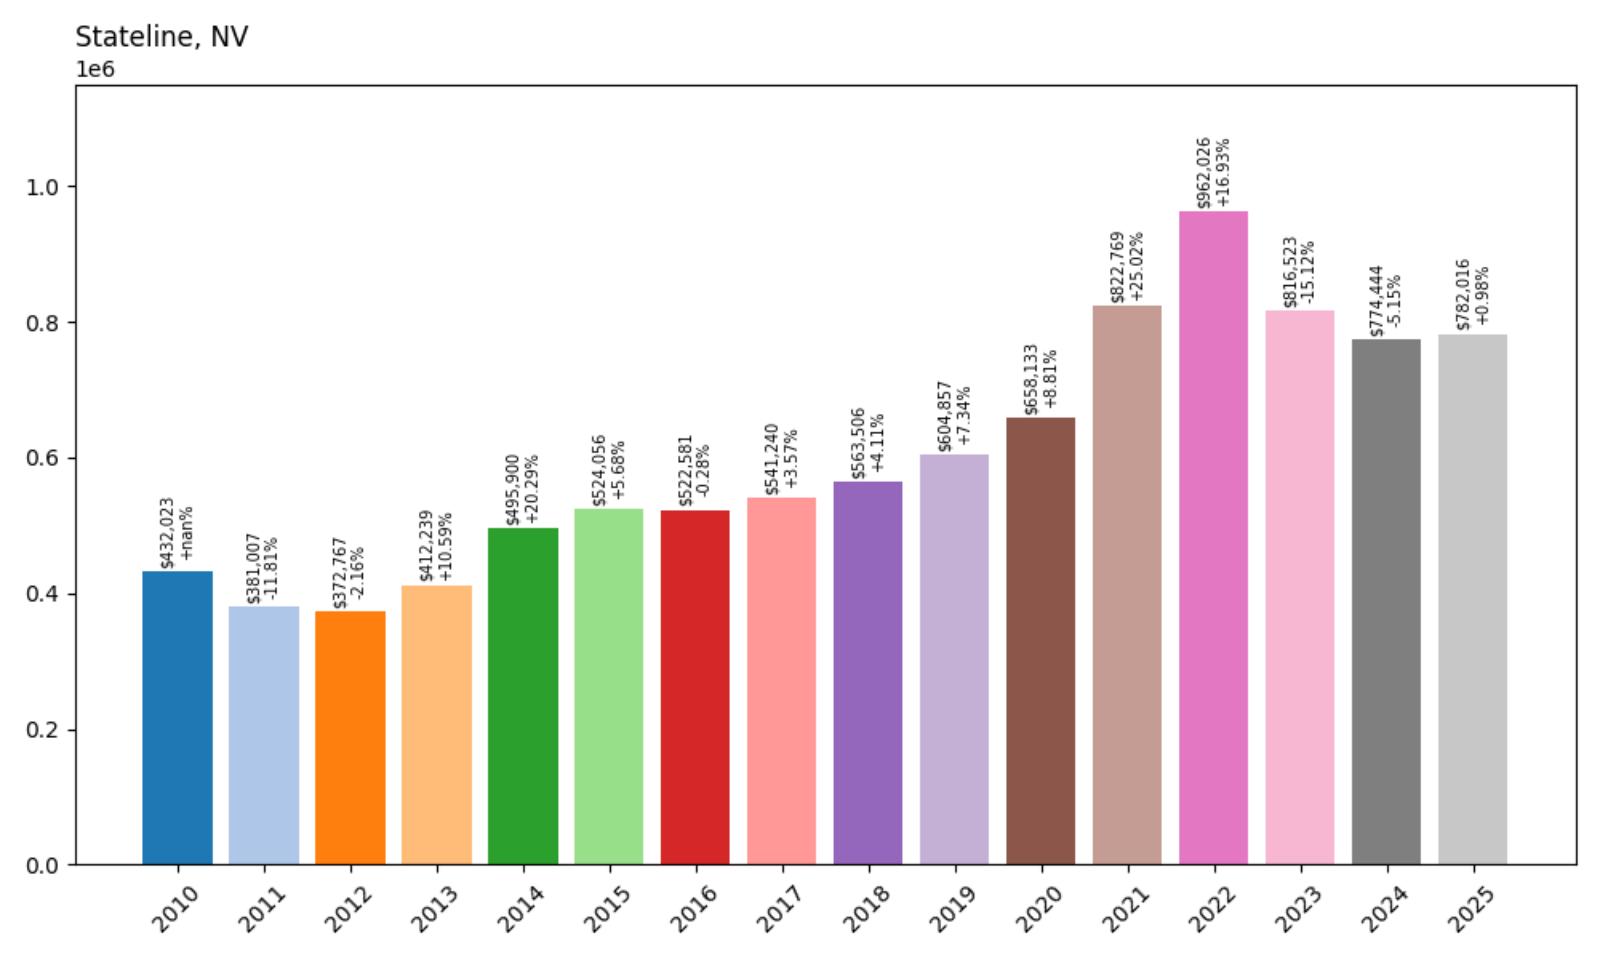
- 2010: $432,023
- 2011: $381,007 (−$51,016, −11.81% from previous year)
- 2012: $372,767 (−$8,240, −2.16% from previous year)
- 2013: $412,239 (+$39,472, +10.59% from previous year)
- 2014: $495,900 (+$83,661, +20.29% from previous year)
- 2015: $524,056 (+$28,156, +5.68% from previous year)
- 2016: $522,581 (−$1,475, −0.28% from previous year)
- 2017: $541,240 (+$18,659, +3.57% from previous year)
- 2018: $563,506 (+$22,266, +4.11% from previous year)
- 2019: $604,857 (+$41,351, +7.34% from previous year)
- 2020: $658,133 (+$53,276, +8.81% from previous year)
- 2021: $822,769 (+$164,636, +25.02% from previous year)
- 2022: $962,026 (+$139,257, +16.93% from previous year)
- 2023: $816,523 (−$145,503, −15.12% from previous year)
- 2024: $774,444 (−$42,080, −5.15% from previous year)
- 2025: $782,016 (+$7,572, +0.98% from previous year)
Stateline experienced a staggering 181.7% jump in home values between 2012 and 2022, peaking at over $960K. However, the years that followed saw a notable correction, with prices falling to around $782K by 2025. Despite the volatility, home values are still dramatically higher than a decade ago, reflecting Stateline’s popularity as a vacation and investment destination near Lake Tahoe. The high peaks and dips suggest both investor interest and sensitivity to broader market shifts.
Stateline – Tourism, Tahoe, and High-Stakes Real Estate

Stateline sits right on the Nevada–California border, known for its cluster of casinos, ski access, and unbeatable lakefront property. The town attracts both tourists and real estate investors, which has added volatility to the market. The sharp rise in values through 2022 can be tied to the pandemic-era demand for vacation homes and investment properties in leisure destinations. The subsequent correction, while significant, hasn’t erased the long-term gains.
Unlike purely residential towns, Stateline’s real estate is heavily influenced by tourism and the hospitality economy. That creates opportunities — and risks — for buyers. Prices in 2025 remain more than double what they were in 2012, proving Stateline’s staying power as a luxury and recreation-driven market. As tourism rebounds and infrastructure improves, Stateline may regain ground and continue to appeal to high-net-worth buyers looking to blend fun and investment in one place.
5. Verdi – 195.8% Home Price Increase Since 2012
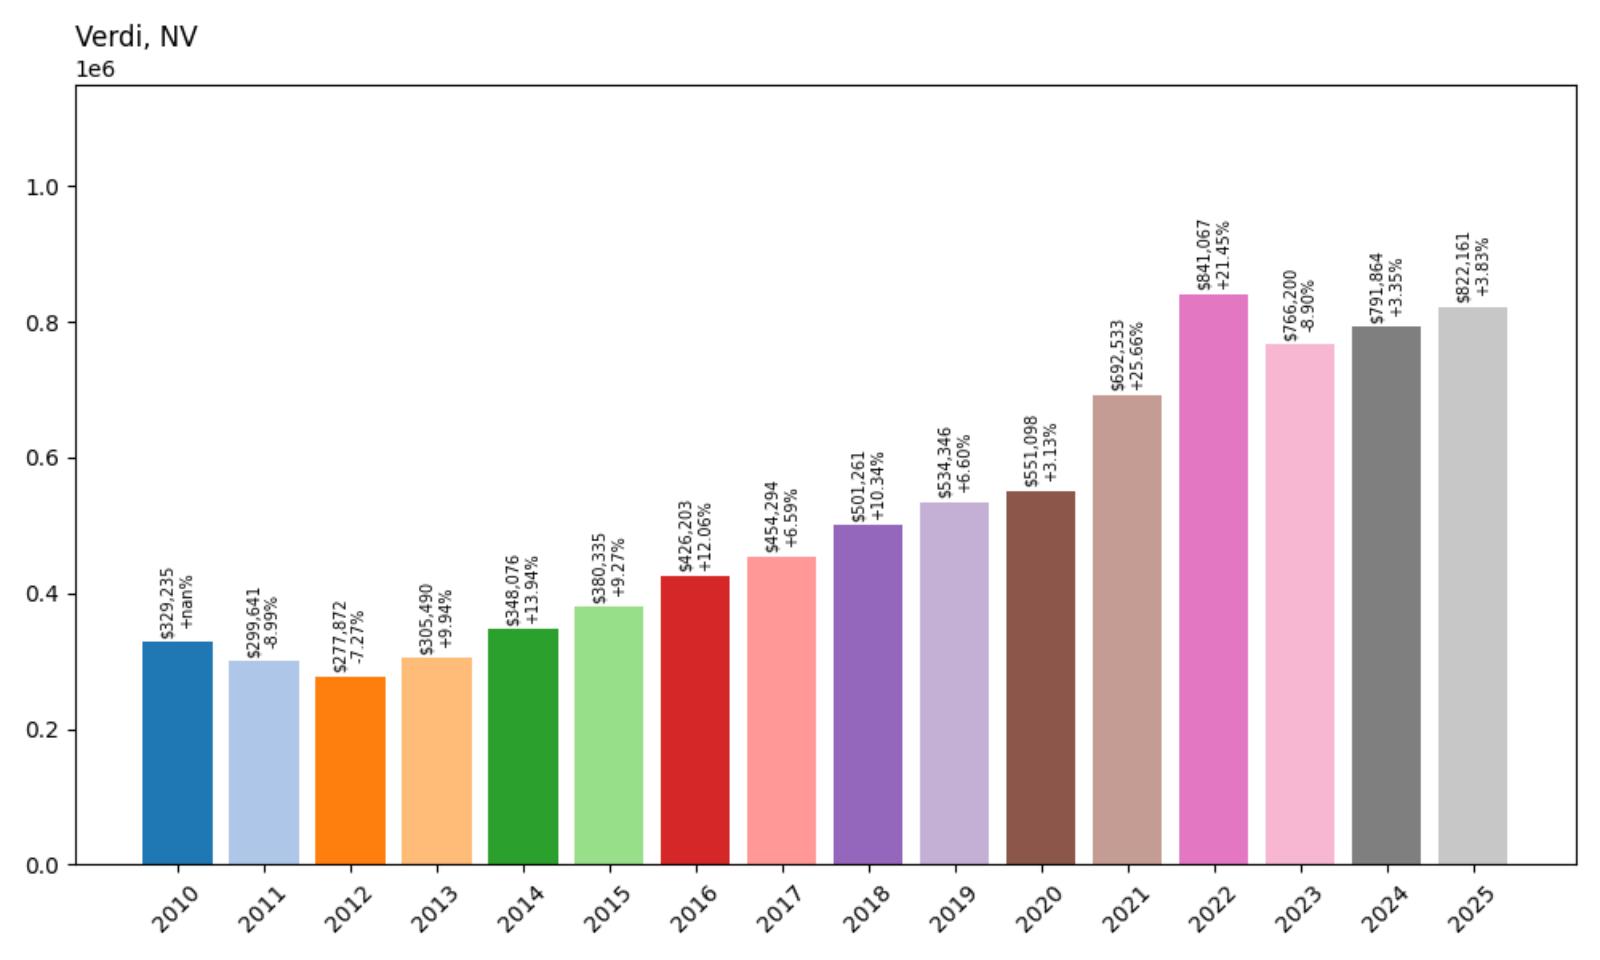
- 2010: $329,235
- 2011: $299,641 (−$29,594, −8.99% from previous year)
- 2012: $277,872 (−$21,769, −7.27% from previous year)
- 2013: $305,490 (+$27,619, +9.94% from previous year)
- 2014: $348,076 (+$42,586, +13.94% from previous year)
- 2015: $380,335 (+$32,259, +9.27% from previous year)
- 2016: $426,203 (+$45,868, +12.06% from previous year)
- 2017: $454,294 (+$28,091, +6.59% from previous year)
- 2018: $501,261 (+$46,967, +10.34% from previous year)
- 2019: $534,346 (+$33,085, +6.60% from previous year)
- 2020: $551,098 (+$16,751, +3.13% from previous year)
- 2021: $692,533 (+$141,435, +25.66% from previous year)
- 2022: $841,067 (+$148,534, +21.45% from previous year)
- 2023: $766,200 (−$74,866, −8.90% from previous year)
- 2024: $791,864 (+$25,664, +3.35% from previous year)
- 2025: $822,161 (+$30,297, +3.83% from previous year)
Verdi’s housing market skyrocketed nearly 196% between 2012 and 2022, driven by rapid demand for scenic, upscale living close to Reno. Although prices dipped slightly in 2023, the town has bounced back and continues to post steady gains. The town’s unique position along the California-Nevada border makes it particularly appealing to buyers who want rural beauty with city access. Despite market volatility, Verdi’s long-term outlook remains strong.
Verdi – Upscale Living Just Outside Reno
Nestled at the base of the Sierra Nevada mountains, Verdi offers a high-end suburban feel with a rustic twist. The town’s exclusivity, natural surroundings, and proximity to both I-80 and downtown Reno have made it one of the most desirable locations in the Truckee Meadows area. Its real estate landscape has evolved significantly over the past decade, attracting custom home builders and buyers seeking privacy, views, and quick access to amenities.
Verdi also benefits from its location just a stone’s throw from the California border, luring transplants looking for tax advantages without sacrificing lifestyle. New luxury developments, riverfront properties, and an expanding community have pushed home values higher, even amid corrections. With a strong rebound in 2024 and 2025, Verdi continues to represent a premium slice of Nevada living — one that appeals to executives, outdoor enthusiasts, and long-term investors alike.
4. Genoa – 161.1% Home Price Increase Since 2012
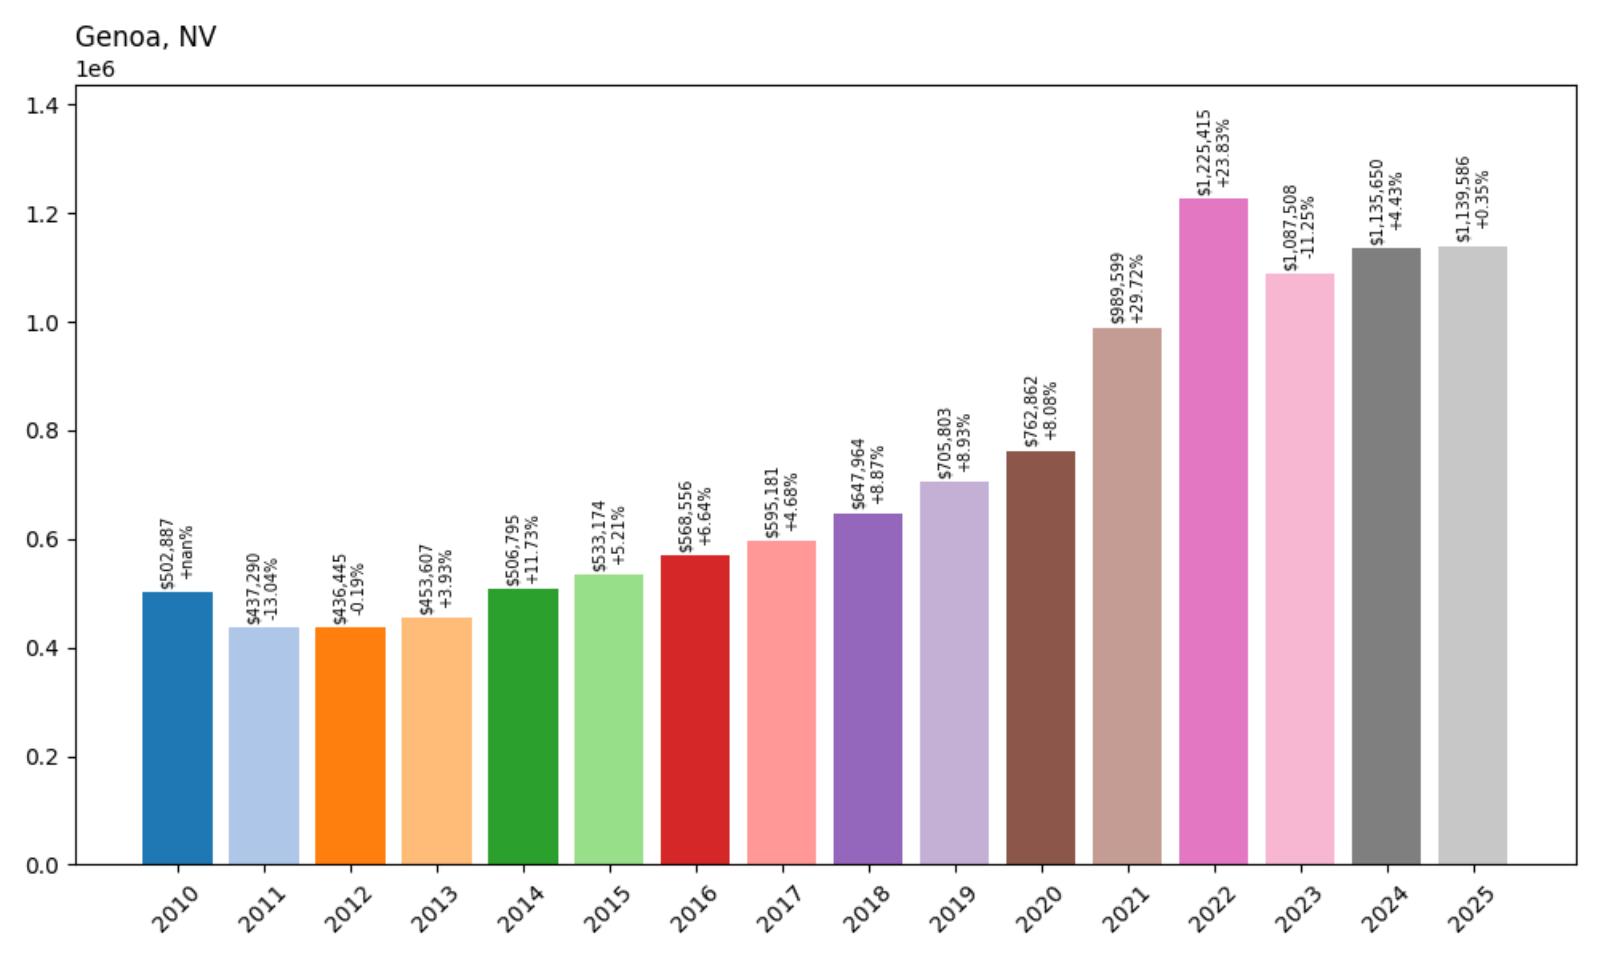
- 2010: $502,887
- 2011: $437,290 (−$65,597, −13.04% from previous year)
- 2012: $436,445 (−$845, −0.19% from previous year)
- 2013: $453,607 (+$17,162, +3.93% from previous year)
- 2014: $506,795 (+$53,188, +11.73% from previous year)
- 2015: $533,174 (+$26,379, +5.21% from previous year)
- 2016: $568,556 (+$35,382, +6.64% from previous year)
- 2017: $595,181 (+$26,625, +4.68% from previous year)
- 2018: $647,964 (+$52,783, +8.87% from previous year)
- 2019: $705,803 (+$57,839, +8.93% from previous year)
- 2020: $762,862 (+$57,059, +8.08% from previous year)
- 2021: $989,599 (+$226,737, +29.72% from previous year)
- 2022: $1,225,415 (+$235,817, +23.83% from previous year)
- 2023: $1,087,508 (−$137,908, −11.25% from previous year)
- 2024: $1,135,650 (+$48,143, +4.43% from previous year)
- 2025: $1,139,586 (+$3,936, +0.35% from previous year)
Genoa’s home prices more than doubled between 2012 and 2022, with a 161% increase that took values from $436K to over $1.2 million. Although a moderate correction followed, current prices remain above $1.13 million — a sign of persistent demand for this historic town. As Nevada’s oldest settlement, Genoa combines rustic elegance with modern luxury, and its small-town feel continues to attract high-income buyers.
Genoa – Historic Elegance Meets Million-Dollar Views
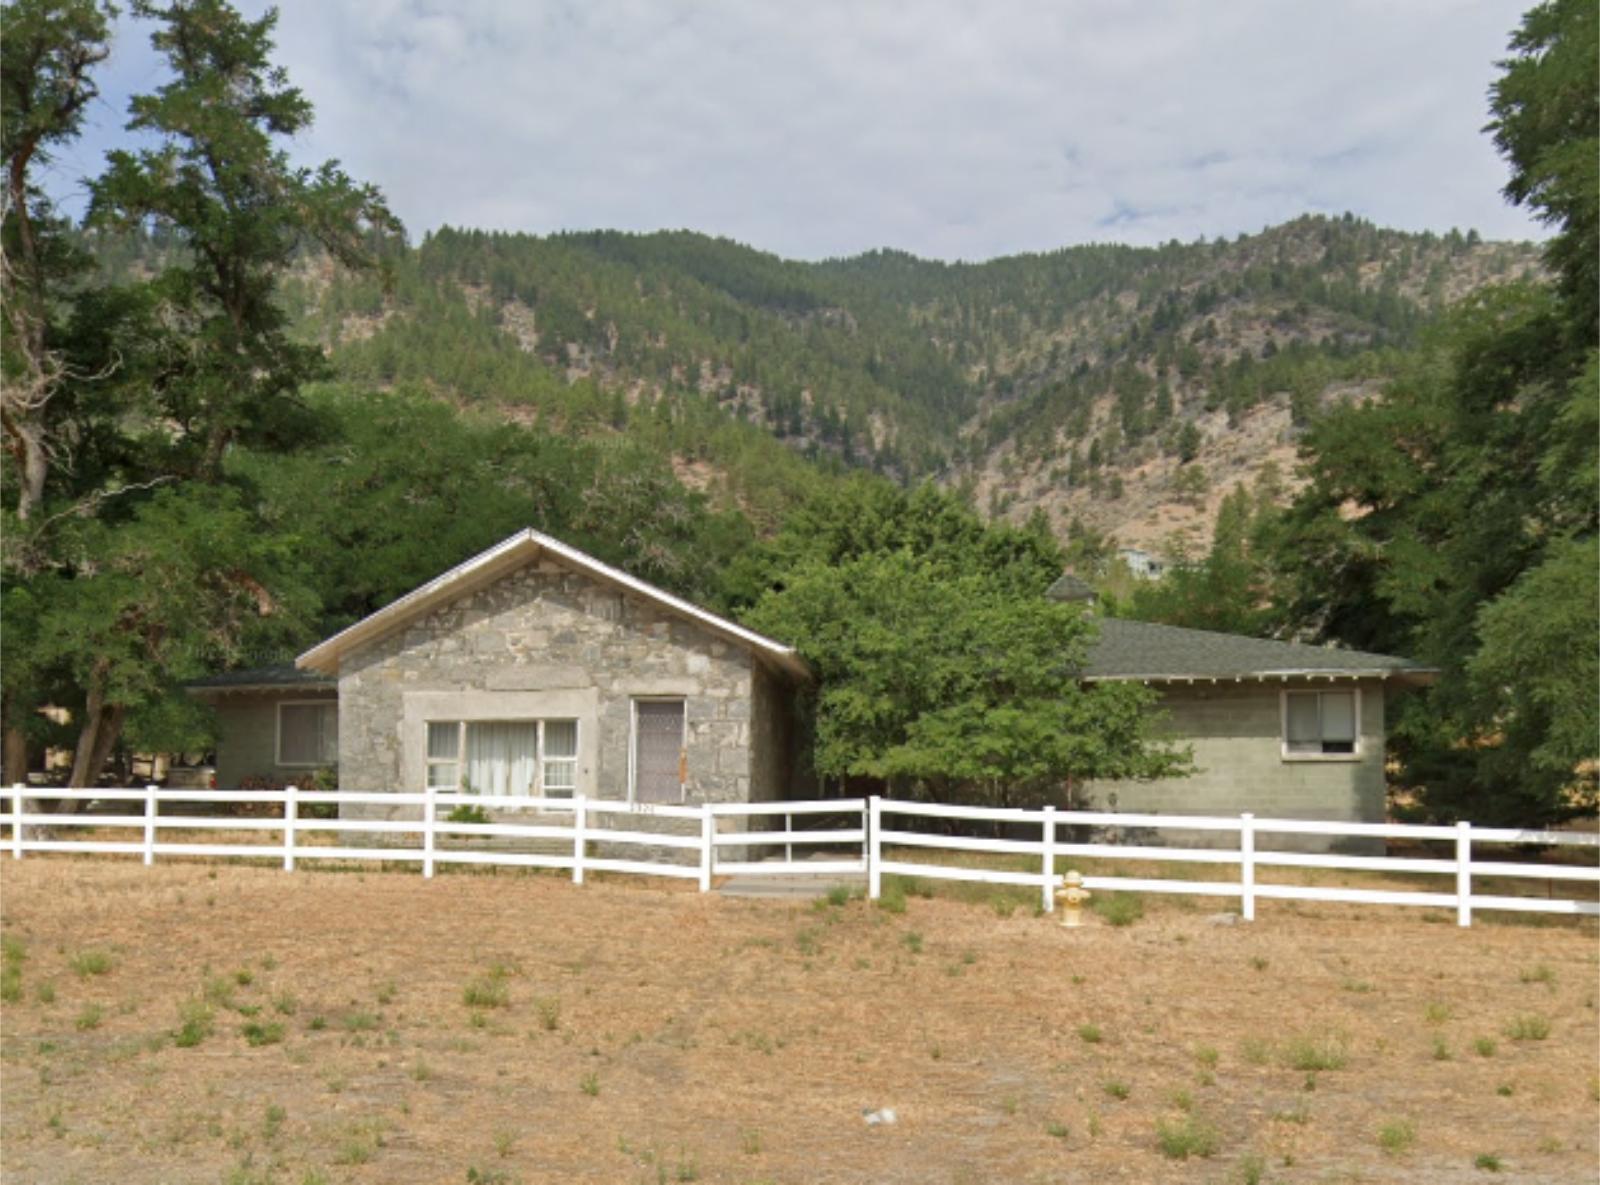
Tucked in the Carson Valley beneath the Sierra Nevada, Genoa blends Old West charm with elite real estate appeal. The town’s limited housing stock, walkable core, and prestigious golf and spa resorts contribute to its consistently high property values. Genoa is where history and affluence intersect — and where homes rarely stay on the market long. Buyers are drawn to its exclusivity and the tranquil pace of life, just 30 minutes from Lake Tahoe.
Genoa’s housing boom was supercharged by post-2020 migration patterns, especially among affluent buyers from California. The price correction in 2023 was notable, but it hasn’t shaken the town’s long-term appeal. Even modest year-over-year gains in 2024 and 2025 point to a stable, mature market that continues to attract well-heeled buyers seeking a scenic and historic enclave with luxury real estate pedigree.
3. Zephyr Cove – 179.2% Home Price Increase Since 2012

- 2010: $566,360
- 2011: $506,526 (−$59,833, −10.56% from previous year)
- 2012: $500,884 (−$5,642, −1.11% from previous year)
- 2013: $522,873 (+$21,989, +4.39% from previous year)
- 2014: $620,012 (+$97,139, +18.58% from previous year)
- 2015: $666,590 (+$46,578, +7.51% from previous year)
- 2016: $664,571 (−$2,019, −0.30% from previous year)
- 2017: $737,328 (+$72,757, +10.95% from previous year)
- 2018: $825,472 (+$88,144, +11.95% from previous year)
- 2019: $893,107 (+$67,636, +8.19% from previous year)
- 2020: $941,554 (+$48,446, +5.42% from previous year)
- 2021: $1,287,467 (+$345,913, +36.74% from previous year)
- 2022: $1,560,918 (+$273,451, +21.24% from previous year)
- 2023: $1,374,548 (−$186,371, −11.94% from previous year)
- 2024: $1,377,522 (+$2,974, +0.22% from previous year)
- 2025: $1,398,294 (+$20,772, +1.51% from previous year)
Zephyr Cove saw home values jump nearly 180% between 2012 and 2022, with a dramatic rise from just over $500K to more than $1.5 million. Even with a market correction in 2023, current values hover near $1.4 million, making this lakeside community one of the priciest in the state. Its combination of lakefront access, forested privacy, and upscale homes keeps demand strong, even in a cooling market.
Zephyr Cove – Elite Lake Tahoe Real Estate
Zephyr Cove offers some of the most coveted lakefront real estate on the Nevada side of Lake Tahoe. The town is home to multimillion-dollar estates, private beaches, and a low-density community that appeals to high-net-worth individuals. Boating, skiing, and hiking are all within minutes, and the serenity of the eastern shore draws a more private clientele than the busier South Lake Tahoe corridor.
The town’s housing trajectory reflects elite buyer interest more than broader economic trends. During the height of the pandemic-era housing boom, Zephyr Cove homes gained hundreds of thousands in value year-over-year. Even as prices adjusted downward in 2023, modest gains in 2024 and 2025 show continued confidence in this niche luxury market. Zephyr Cove is less about speculation — and more about securing a legacy property in a one-of-a-kind location.
2. Incline Village – 181.2% Home Price Increase Since 2012
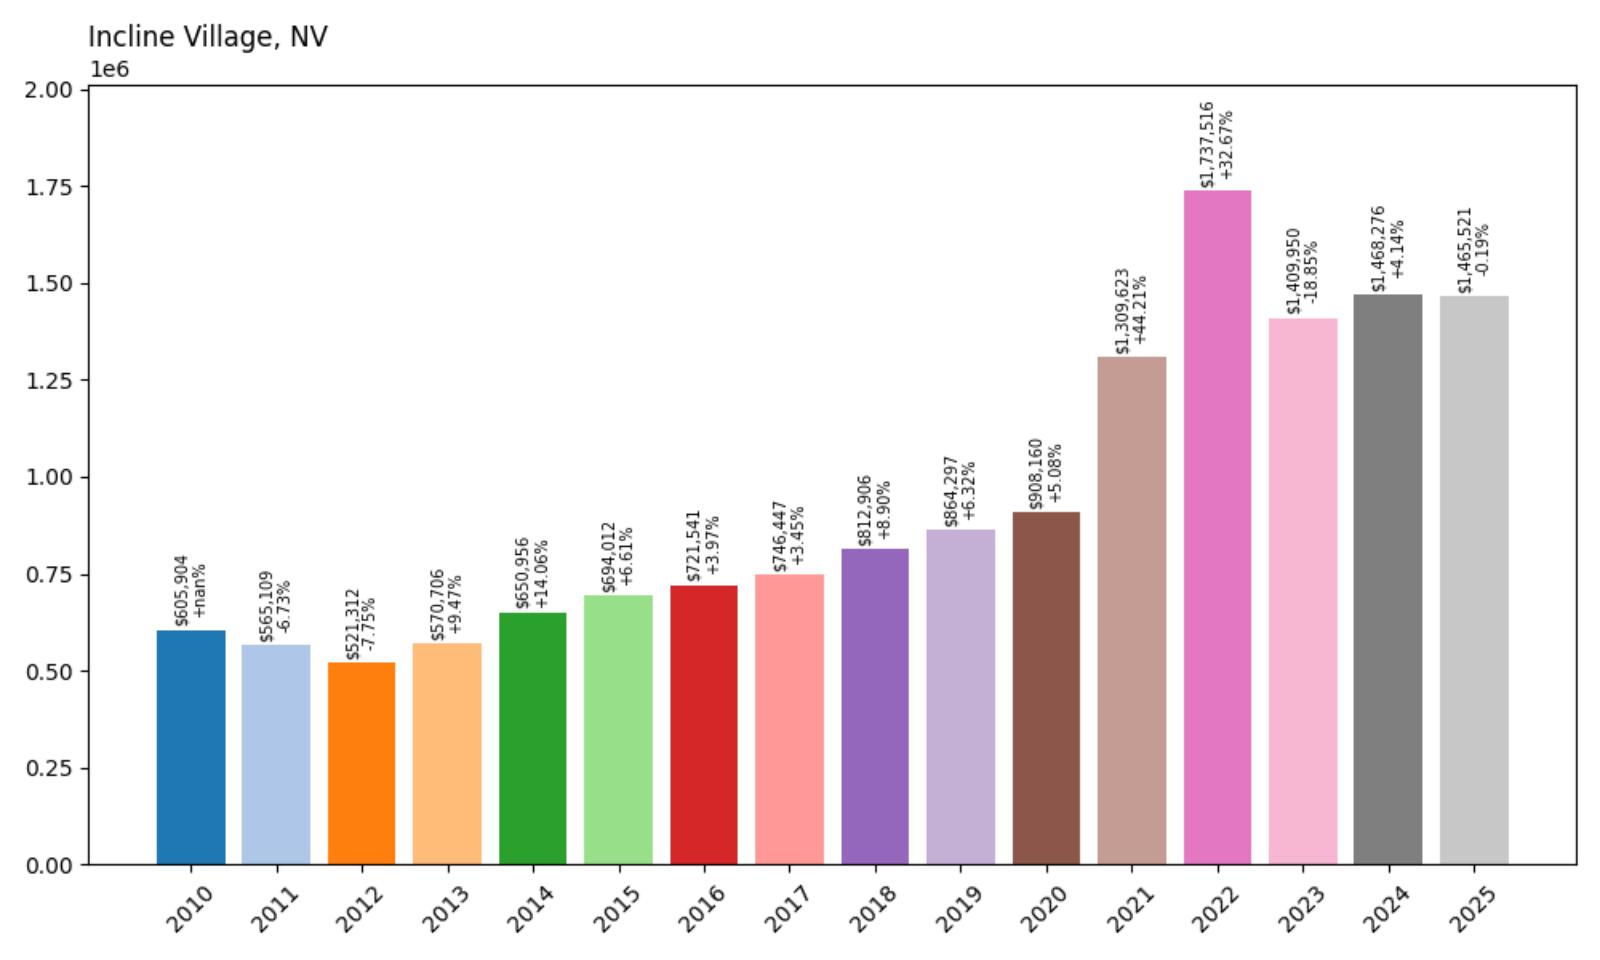
- 2010: $605,904
- 2011: $565,109 (−$40,795, −6.73% from previous year)
- 2012: $521,312 (−$43,797, −7.75% from previous year)
- 2013: $570,706 (+$49,393, +9.47% from previous year)
- 2014: $650,956 (+$80,250, +14.06% from previous year)
- 2015: $694,012 (+$43,056, +6.61% from previous year)
- 2016: $721,541 (+$27,529, +3.97% from previous year)
- 2017: $746,447 (+$24,906, +3.45% from previous year)
- 2018: $812,906 (+$66,459, +8.90% from previous year)
- 2019: $864,297 (+$51,391, +6.32% from previous year)
- 2020: $908,160 (+$43,863, +5.08% from previous year)
- 2021: $1,309,623 (+$401,463, +44.21% from previous year)
- 2022: $1,737,516 (+$427,893, +32.67% from previous year)
- 2023: $1,409,950 (−$327,566, −18.85% from previous year)
- 2024: $1,468,276 (+$58,326, +4.14% from previous year)
- 2025: $1,465,521 (−$2,755, −0.19% from previous year)
Home values in Incline Village surged an astonishing 181% between 2012 and 2022, lifting the average from $521K to over $1.73 million. Though 2023 saw a steep decline of nearly 19%, prices have remained remarkably resilient above $1.46 million, underscoring the neighborhood’s position as one of Nevada’s most prestigious housing markets. With its sweeping lakefront views and no state income tax, Incline Village continues to be a magnet for ultra-wealthy buyers, retirees, and remote professionals looking for a luxury lifestyle with outdoor access.
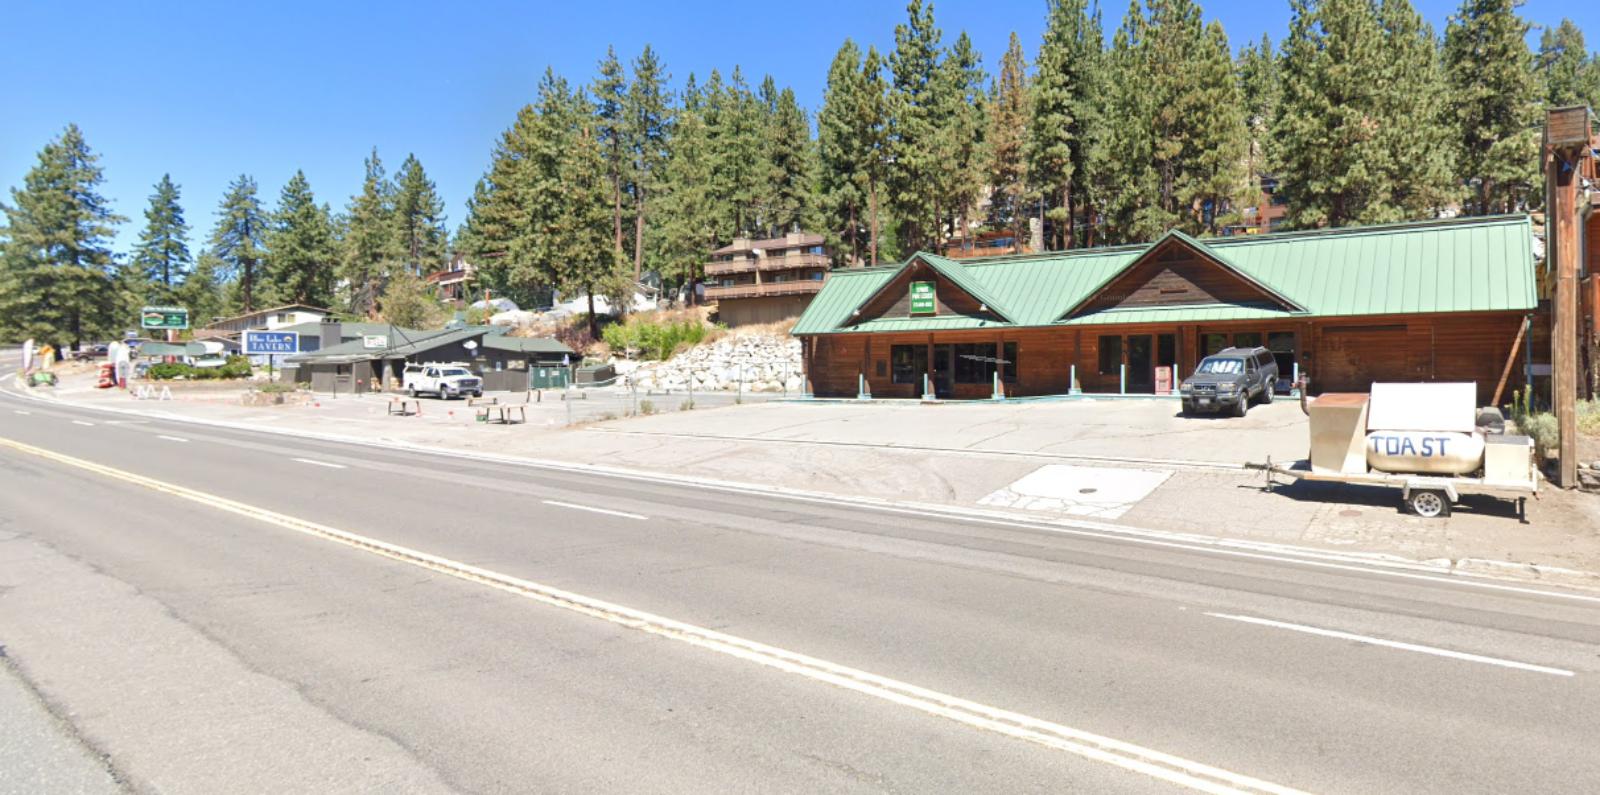
Incline Village – Lake Tahoe’s Luxury Haven

Perched on the northeastern shore of Lake Tahoe, Incline Village is a rare blend of exclusivity, natural beauty, and community amenities that attract some of the nation’s most discerning buyers. The town is home to lavish lakefront estates, gated golf communities, and luxury ski homes, all set against a backdrop of pine forests and snow-capped peaks. Residents have access to private beaches, championship golf courses, and the Diamond Peak ski resort. These perks, combined with Nevada’s favorable tax climate, have driven long-term demand and lifted property values to new heights. Even during downturns, Incline Village remains insulated compared to other mountain or resort towns — its limited inventory and reputation help it hold value even through price corrections.
The dramatic growth during the 2020–2022 boom was fueled by migration from Silicon Valley and other high-tax coastal regions, with affluent buyers purchasing second homes or relocating entirely. That influx led to a significant revaluation of real estate in the area, as new buyers competed for a limited number of premium properties. Even as the market pulled back in 2023, Incline Village quickly rebounded with a 4.1% gain in 2024 and remained nearly flat in 2025, signaling long-term confidence in the area’s fundamentals. Its enduring appeal lies not just in scenic views or recreational access, but in a lifestyle that blends luxury, privacy, and a strong sense of community — all just a short drive from Reno or Truckee.
1. Glenbrook – 161.1% Home Price Increase Since 2012
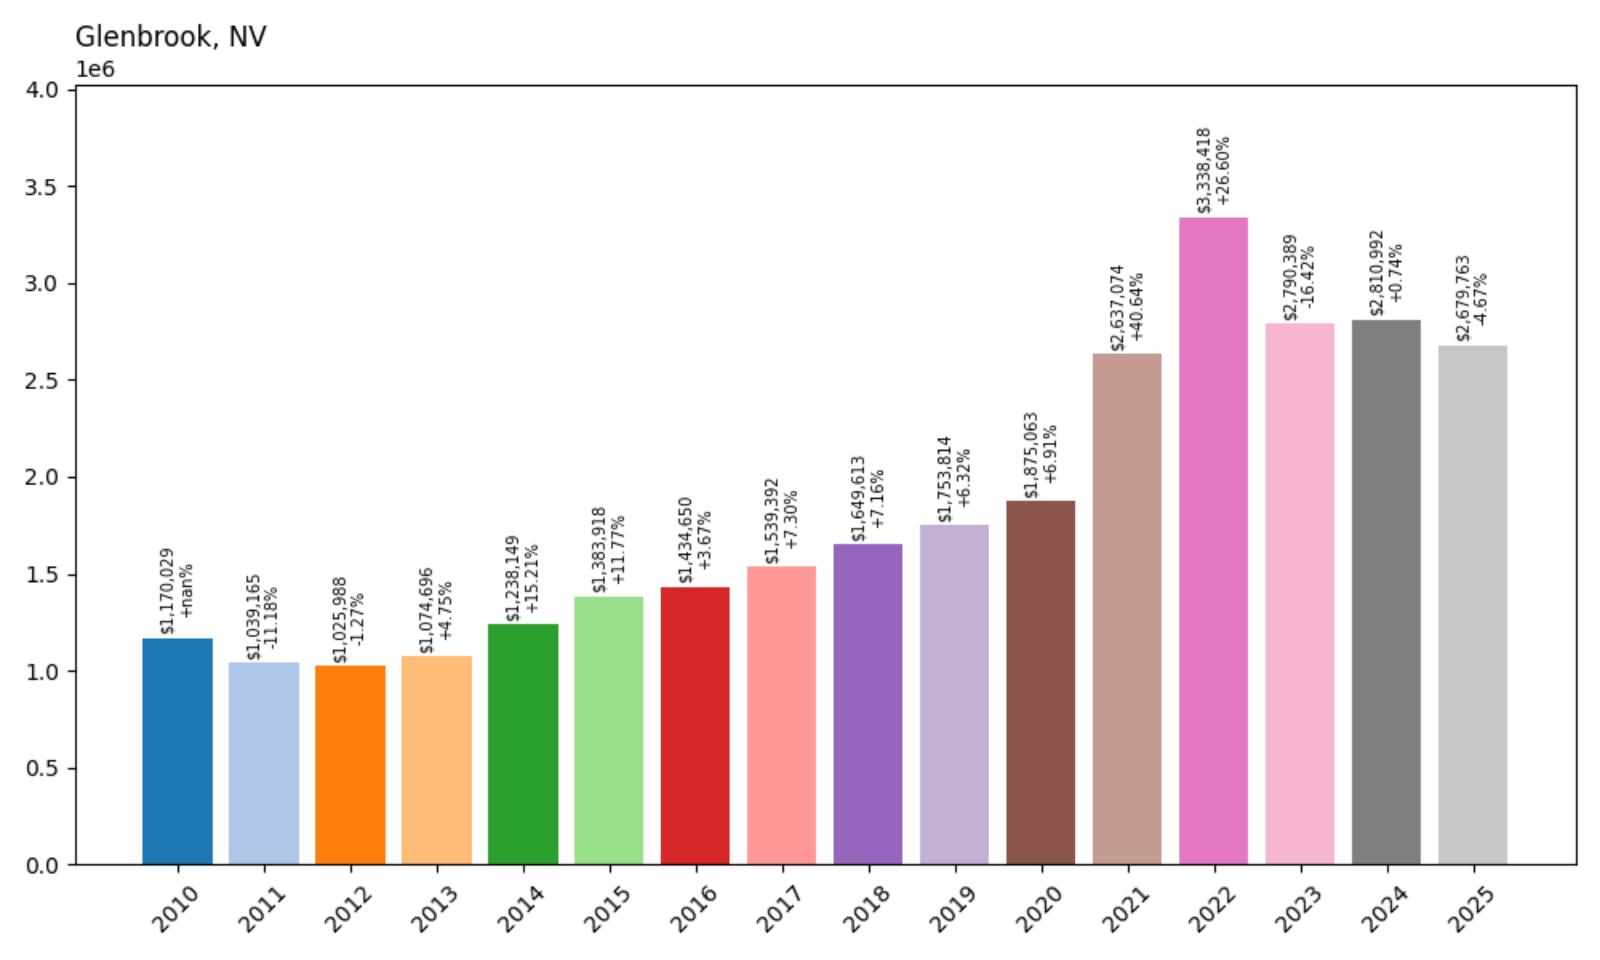
- 2010: $1,170,029
- 2011: $1,039,165 (−$130,865, −11.18% from previous year)
- 2012: $1,025,988 (−$13,177, −1.27% from previous year)
- 2013: $1,074,696 (+$48,709, +4.75% from previous year)
- 2014: $1,238,149 (+$163,453, +15.21% from previous year)
- 2015: $1,383,918 (+$145,769, +11.77% from previous year)
- 2016: $1,434,650 (+$50,732, +3.67% from previous year)
- 2017: $1,539,392 (+$104,743, +7.30% from previous year)
- 2018: $1,649,613 (+$110,220, +7.16% from previous year)
- 2019: $1,753,814 (+$104,202, +6.32% from previous year)
- 2020: $1,875,063 (+$121,249, +6.91% from previous year)
- 2021: $2,637,074 (+$762,010, +40.64% from previous year)
- 2022: $3,338,418 (+$701,344, +26.60% from previous year)
- 2023: $2,790,389 (−$548,029, −16.42% from previous year)
- 2024: $2,810,992 (+$20,603, +0.74% from previous year)
- 2025: $2,679,763 (−$131,229, −4.67% from previous year)
Glenbrook tops the list as Nevada’s most expensive town, with home values peaking at $3.3 million in 2022 — up 161% from 2012 levels. Though prices declined by over 16% in 2023 and again modestly in 2025, Glenbrook remains far above its pre-2020 values. This community is unlike any other in the state: ultra-exclusive, completely gated, and set along one of the most picturesque coves on Lake Tahoe. Its appeal goes beyond luxury — it’s about seclusion, prestige, and legacy real estate.
Glenbrook – The Pinnacle of Prestige on Lake Tahoe

Glenbrook is Nevada’s crown jewel — a private enclave on Lake Tahoe’s east shore, home to some of the most valuable waterfront properties in the western United States. The town is entirely gated and offers unparalleled seclusion, with amenities like a private golf course, tennis courts, and resident-only lake access. Historically a retreat for elite San Francisco families, Glenbrook maintains strict development limits, preserving its wooded charm and ensuring that demand always outpaces supply. With fewer than 200 homes in total, many passed down generationally, inventory is scarce and competition fierce. These dynamics help explain why Glenbrook consistently commands multi-million-dollar price tags and remains largely immune to broader market fluctuations.
During the height of the housing surge in 2021–2022, Glenbrook homes saw nearly $1.5 million in average appreciation in just two years — driven by ultra-wealthy buyers fleeing cities during the pandemic. Even though prices retreated slightly afterward, the average 2025 value still hovers near $2.68 million, far above even other Lake Tahoe communities. Buyers here aren’t just seeking a residence; they’re investing in an ultra-rare asset that confers both prestige and exclusivity. With essentially no new construction and stringent access, Glenbrook’s status as Nevada’s most elite housing market seems unshakable. It is, in many ways, the ultimate trophy address for those who demand privacy, luxury, and natural beauty — all rolled into one.