🔥 Would you like to save this?
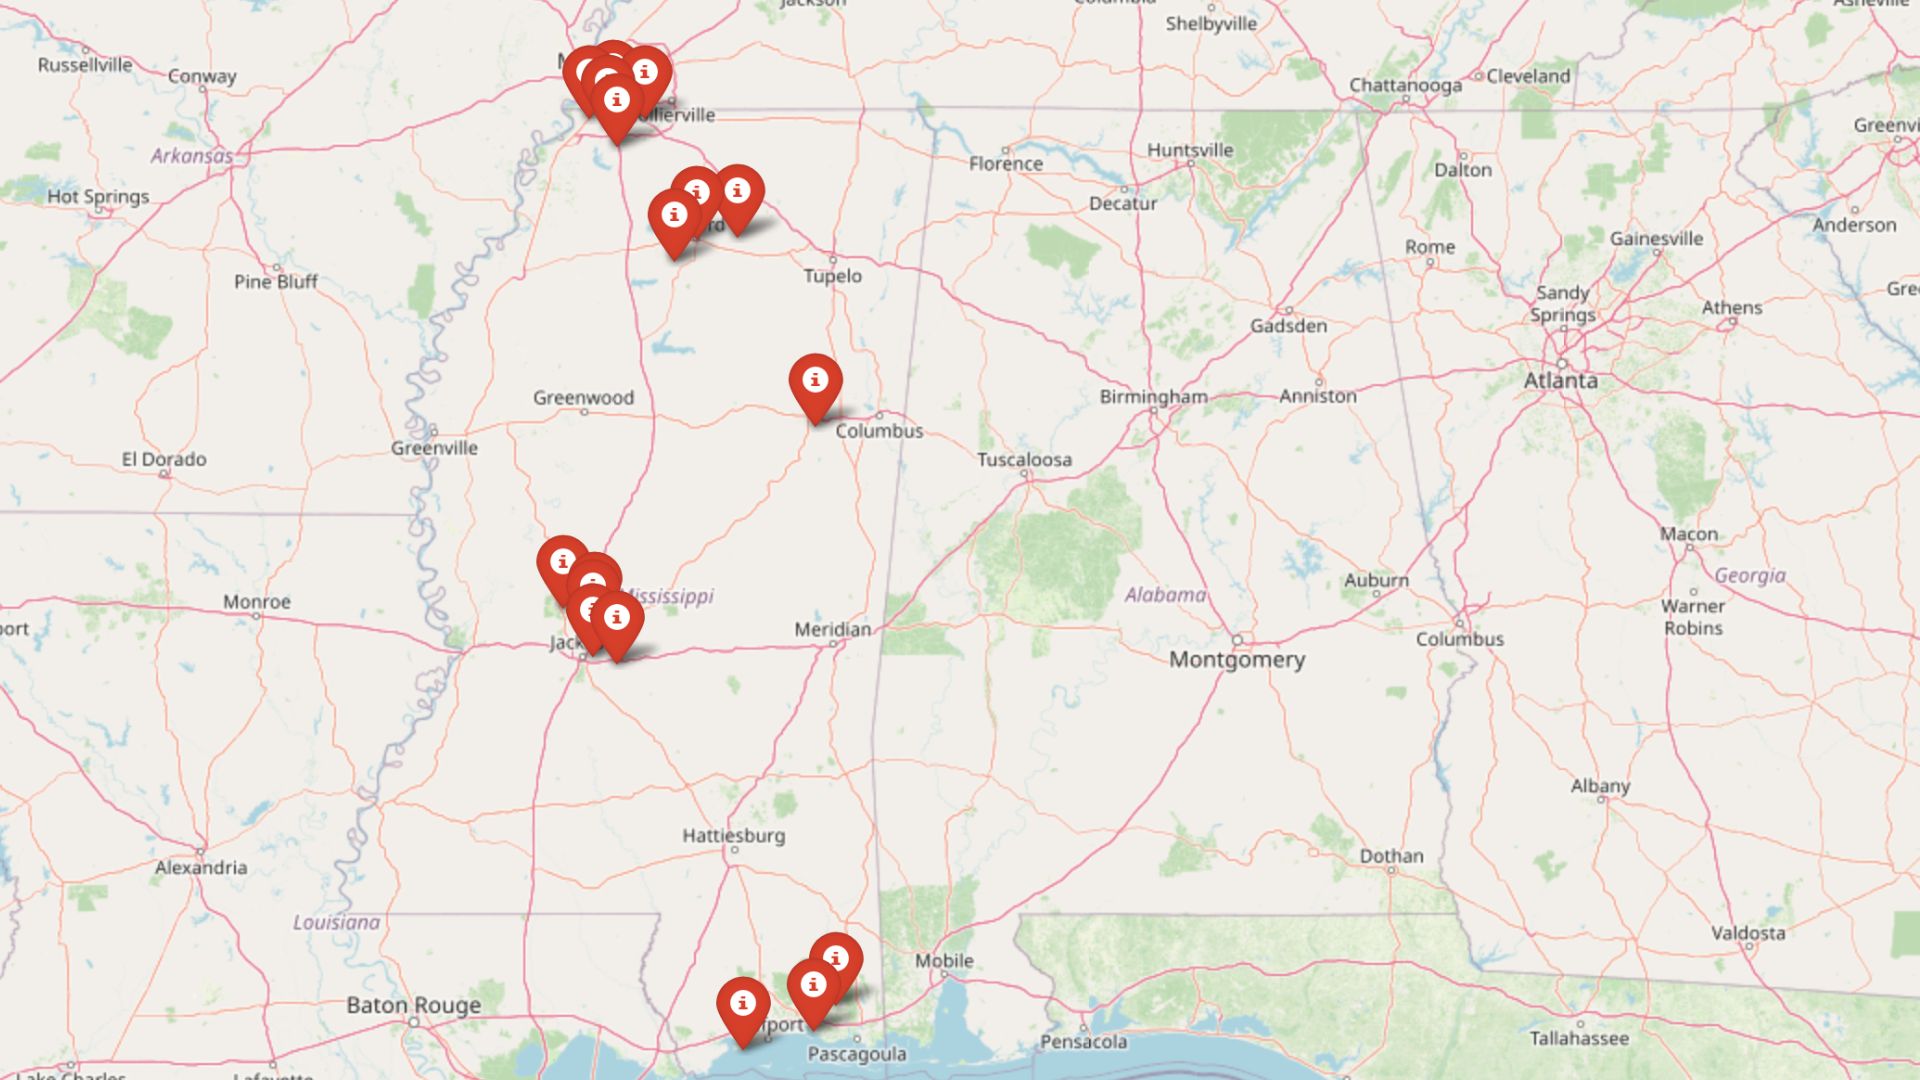
Mississippi might still be one of the country’s most affordable states—but the Zillow Home Value Index tells a more layered story. In these 17 towns, home prices have climbed into luxury territory for 2025, showing where demand and development are reshaping the market.
From Oxford’s cultural pull to Ocean Springs’ coastal charm, these places have more going on than just big numbers. Some are academic hubs, some are commuter favorites, and others are just now hitting their stride. Whether you’re scouting your next move or watching where the market heats up, these towns are rewriting the rules in Mississippi.
In order to come up with the very specific design ideas, we create most designs with the assistance of state-of-the-art AI interior design software.
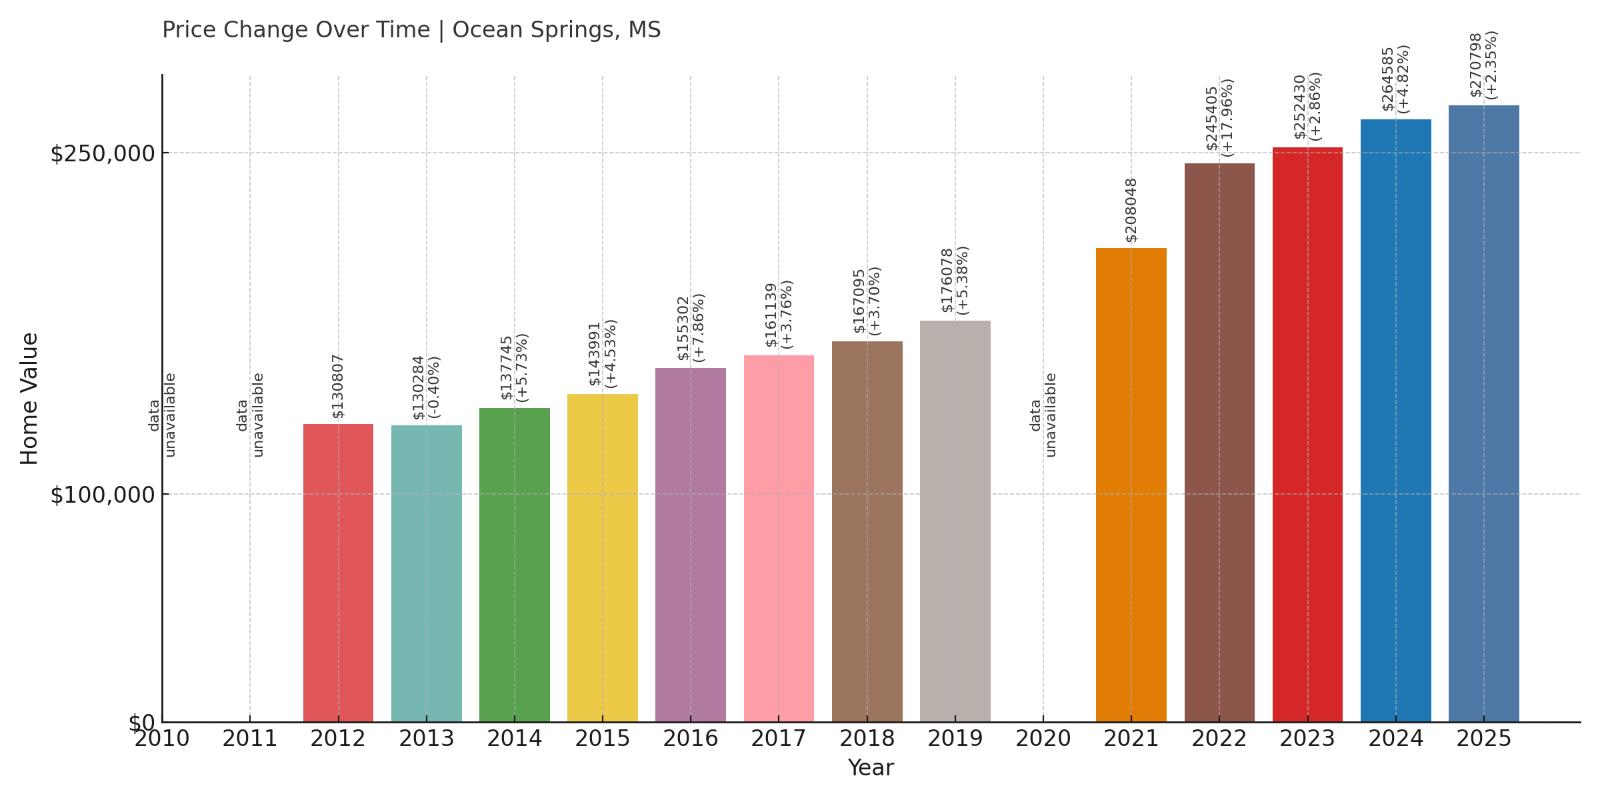
17. Ocean Springs – 107% Home Price Increase Since 2012
- 2010: N/A
- 2011: N/A
- 2012: $130,807
- 2013: $130,284 (-$523, -0.40% from previous year)
- 2014: $137,745 (+$7,460, +5.73% from previous year)
- 2015: $143,991 (+$6,246, +4.53% from previous year)
- 2016: $155,302 (+$11,311, +7.86% from previous year)
- 2017: $161,139 (+$5,837, +3.76% from previous year)
- 2018: $167,095 (+$5,956, +3.70% from previous year)
- 2019: $176,078 (+$8,983, +5.38% from previous year)
- 2020: N/A
- 2021: $208,048 (+$31,970, +18.16% from previous year)
- 2022: $245,405 (+$37,357, +17.96% from previous year)
- 2023: $252,430 (+$7,026, +2.86% from previous year)
- 2024: $264,585 (+$12,154, +4.81% from previous year)
- 2025: $270,798 (+$6,213, +2.35% from previous year)
Ocean Springs has seen a steady and consistent rise in home prices since 2012, with values more than doubling over that period. After moderate growth through the 2010s, the town experienced a sharp jump between 2020 and 2022, with double-digit annual increases that pushed the median home price past $270,000 by 2025. Despite a slower pace recently, prices continue to edge upward.
Ocean Springs – Popular With Gulf Coast Buyers
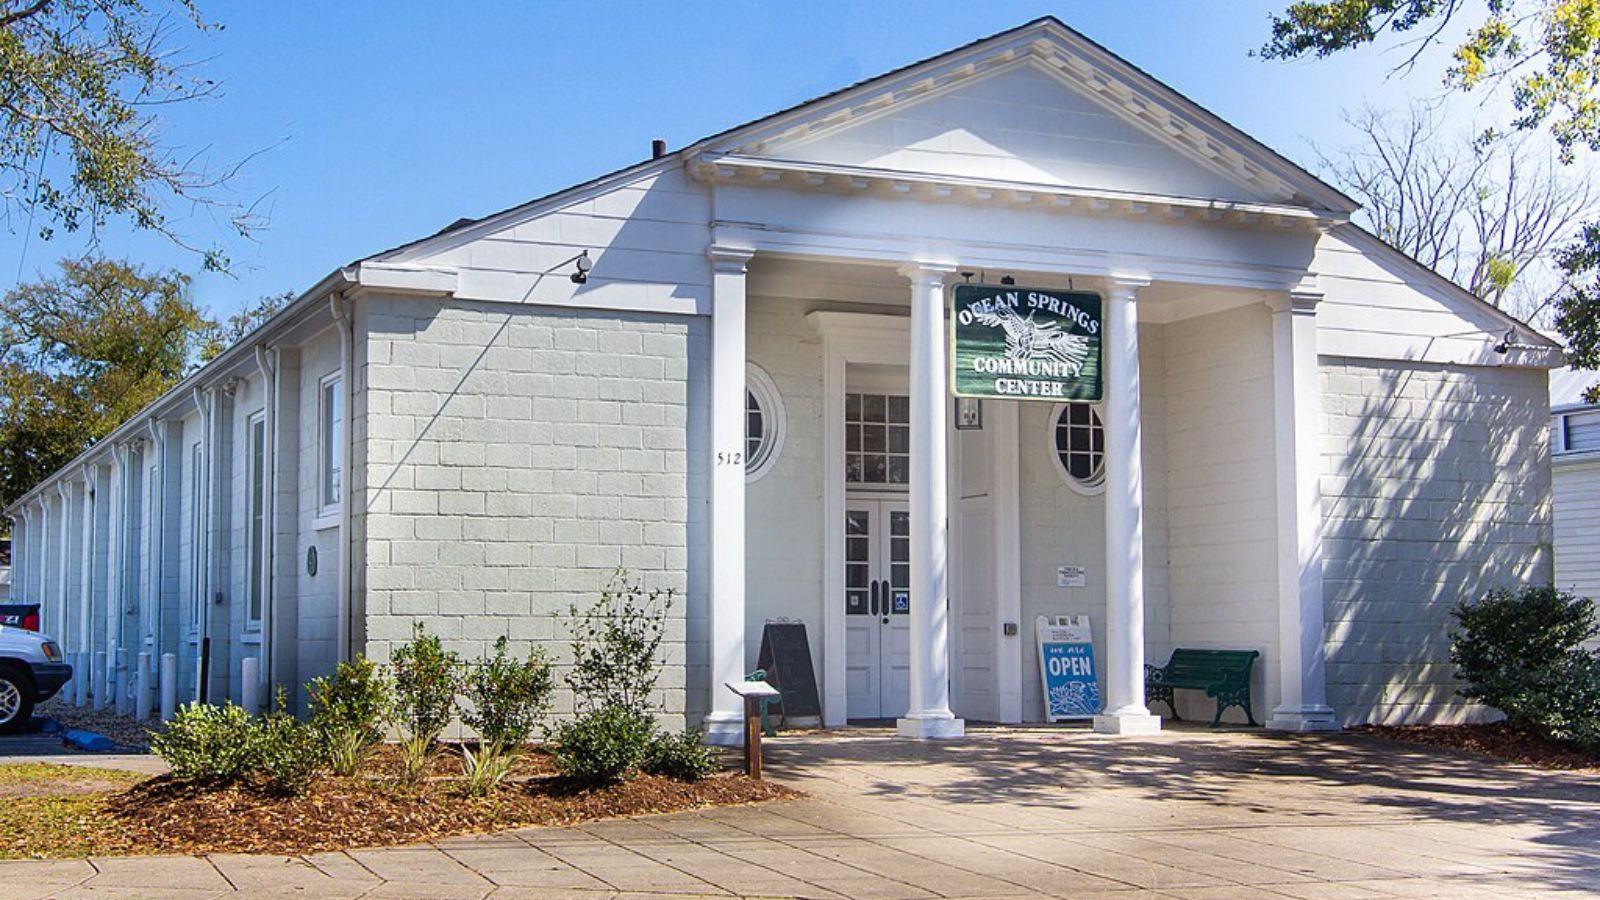
Located on the Gulf Coast just east of Biloxi, Ocean Springs is known for its walkable downtown, art galleries, and waterfront access. It’s a desirable location for retirees and families alike, with beaches, parks, and top-rated schools adding to its appeal. The post-pandemic migration to scenic, lower-cost coastal towns helped drive demand, especially in 2021 and 2022 when prices spiked.
Ocean Springs offers a blend of small-town charm and urban access, with a strong sense of local identity. With limited land for development and increasing demand, the growth in prices reflects its status as a standout market on Mississippi’s coastline.
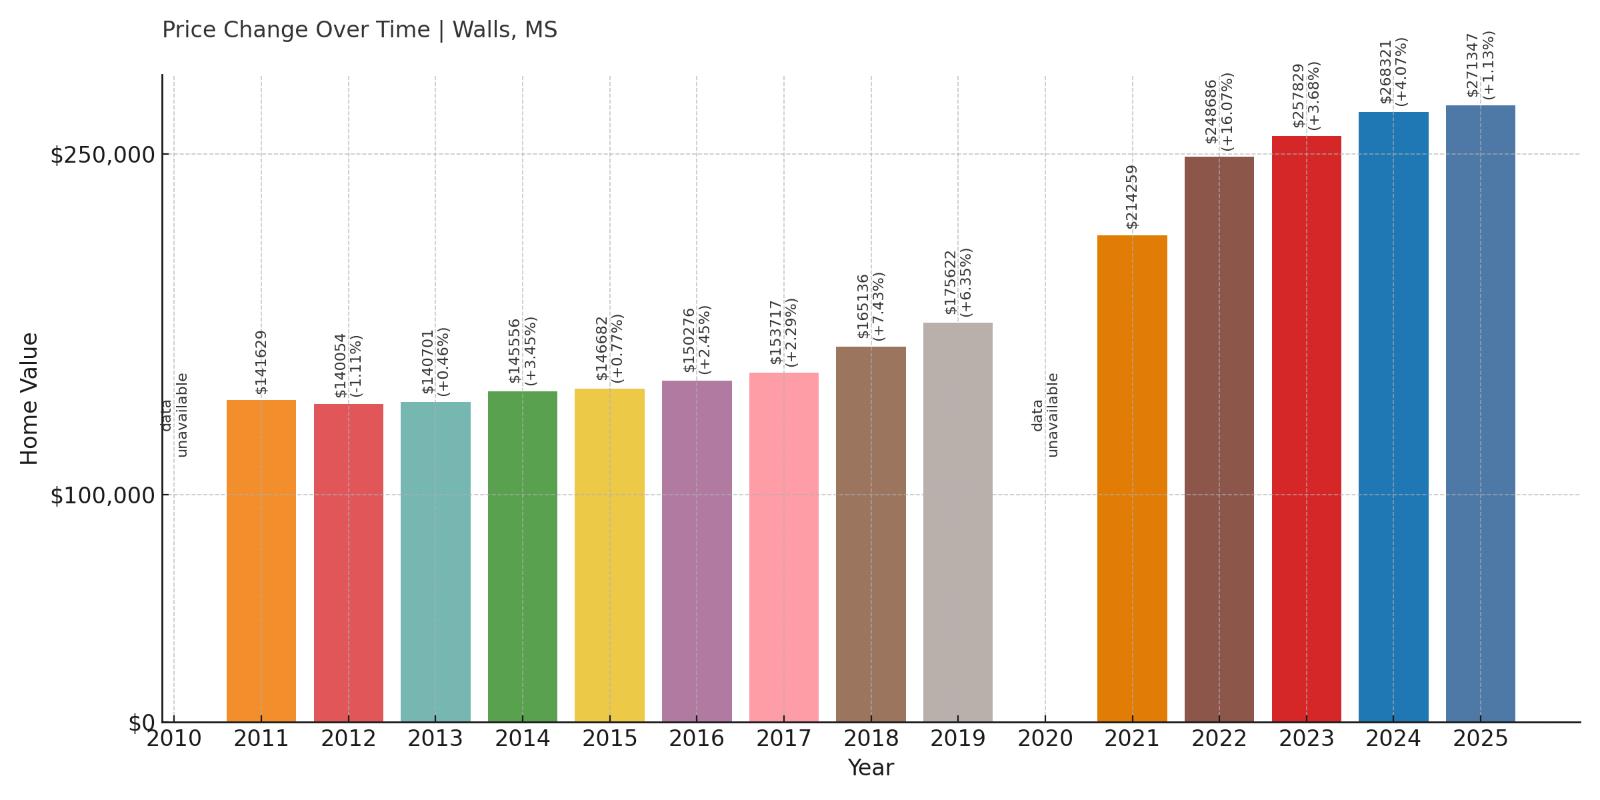
16. Walls – 91% Home Price Increase Since 2011
- 2010: N/A
- 2011: $141,629
- 2012: $140,054 (-$1,575, -1.11% from previous year)
- 2013: $140,701 (+$647, +0.46% from previous year)
- 2014: $145,556 (+$4,855, +3.45% from previous year)
- 2015: $146,682 (+$1,126, +0.77% from previous year)
- 2016: $150,276 (+$3,594, +2.45% from previous year)
- 2017: $153,717 (+$3,441, +2.29% from previous year)
- 2018: $165,136 (+$11,419, +7.43% from previous year)
- 2019: $175,622 (+$10,486, +6.35% from previous year)
- 2020: N/A
- 2021: $214,259 (+$38,637, +22.00% from previous year)
- 2022: $248,686 (+$34,427, +16.07% from previous year)
- 2023: $257,829 (+$9,143, +3.68% from previous year)
- 2024: $268,321 (+$10,492, +4.07% from previous year)
- 2025: $271,347 (+$3,026, +1.13% from previous year)
Walls’ home prices have climbed by more than 90% since 2011, with the most dramatic increases happening between 2020 and 2022. Though the rate of growth has cooled recently, home values still reached $271,347 in 2025. Strong year-over-year growth in the late 2010s and the post-2020 boom pushed it firmly into the top 20 most expensive towns in Mississippi.
Walls – Suburban Growth Just South of Memphis
Walls sits just south of the Tennessee state line, functioning as a quiet suburban alternative to busier parts of the Memphis metro area. Its affordability compared to nearby suburbs, plus access to DeSoto County schools and major highways, has made it attractive to commuters and growing families.
The influx of buyers during the pandemic years created rapid home price inflation, especially in 2021 and 2022. Now that demand has steadied, growth is more modest, but Walls remains one of the state’s most in-demand suburban areas.
15. Vancleave – 82% Home Price Increase Since 2012
- 2010: N/A
- 2011: N/A
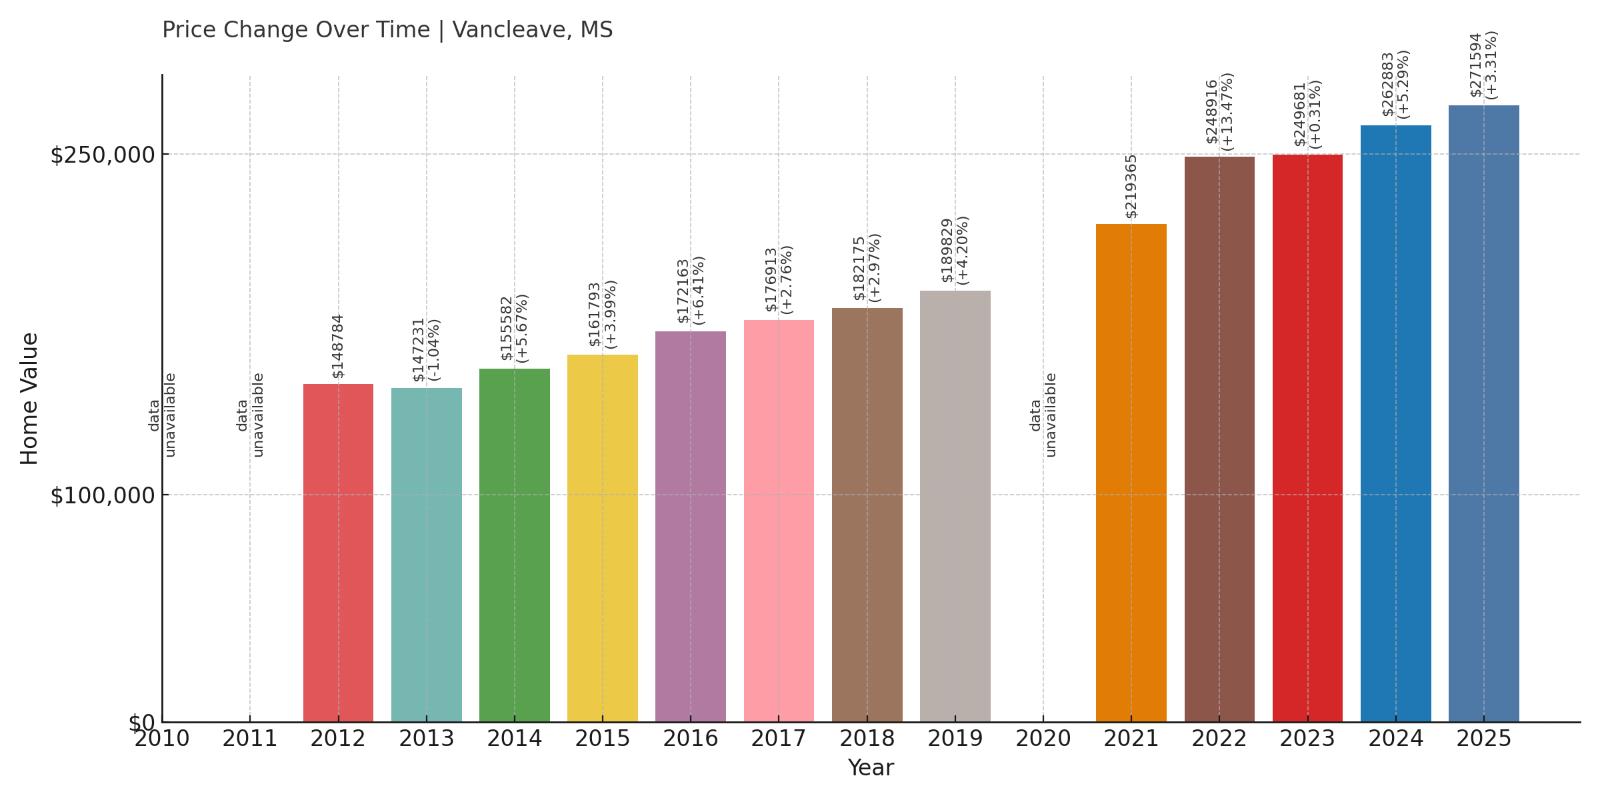
- 2012: $148,784
- 2013: $147,231 (-$1,553, -1.04% from previous year)
- 2014: $155,582 (+$8,352, +5.67% from previous year)
- 2015: $161,793 (+$6,211, +3.99% from previous year)
- 2016: $172,163 (+$10,370, +6.41% from previous year)
- 2017: $176,913 (+$4,749, +2.76% from previous year)
- 2018: $182,175 (+$5,262, +2.97% from previous year)
- 2019: $189,829 (+$7,654, +4.20% from previous year)
- 2020: N/A
- 2021: $219,365 (+$29,536, +15.56% from previous year)
- 2022: $248,916 (+$29,551, +13.47% from previous year)
- 2023: $249,681 (+$766, +0.31% from previous year)
- 2024: $262,883 (+$13,201, +5.29% from previous year)
- 2025: $271,594 (+$8,711, +3.31% from previous year)
Vancleave’s home prices have steadily increased since 2012, now sitting over $271,000. Early price growth was consistent, and like many towns on this list, the largest jumps happened during the early 2020s. The market remains active with modest annual gains in the past two years.
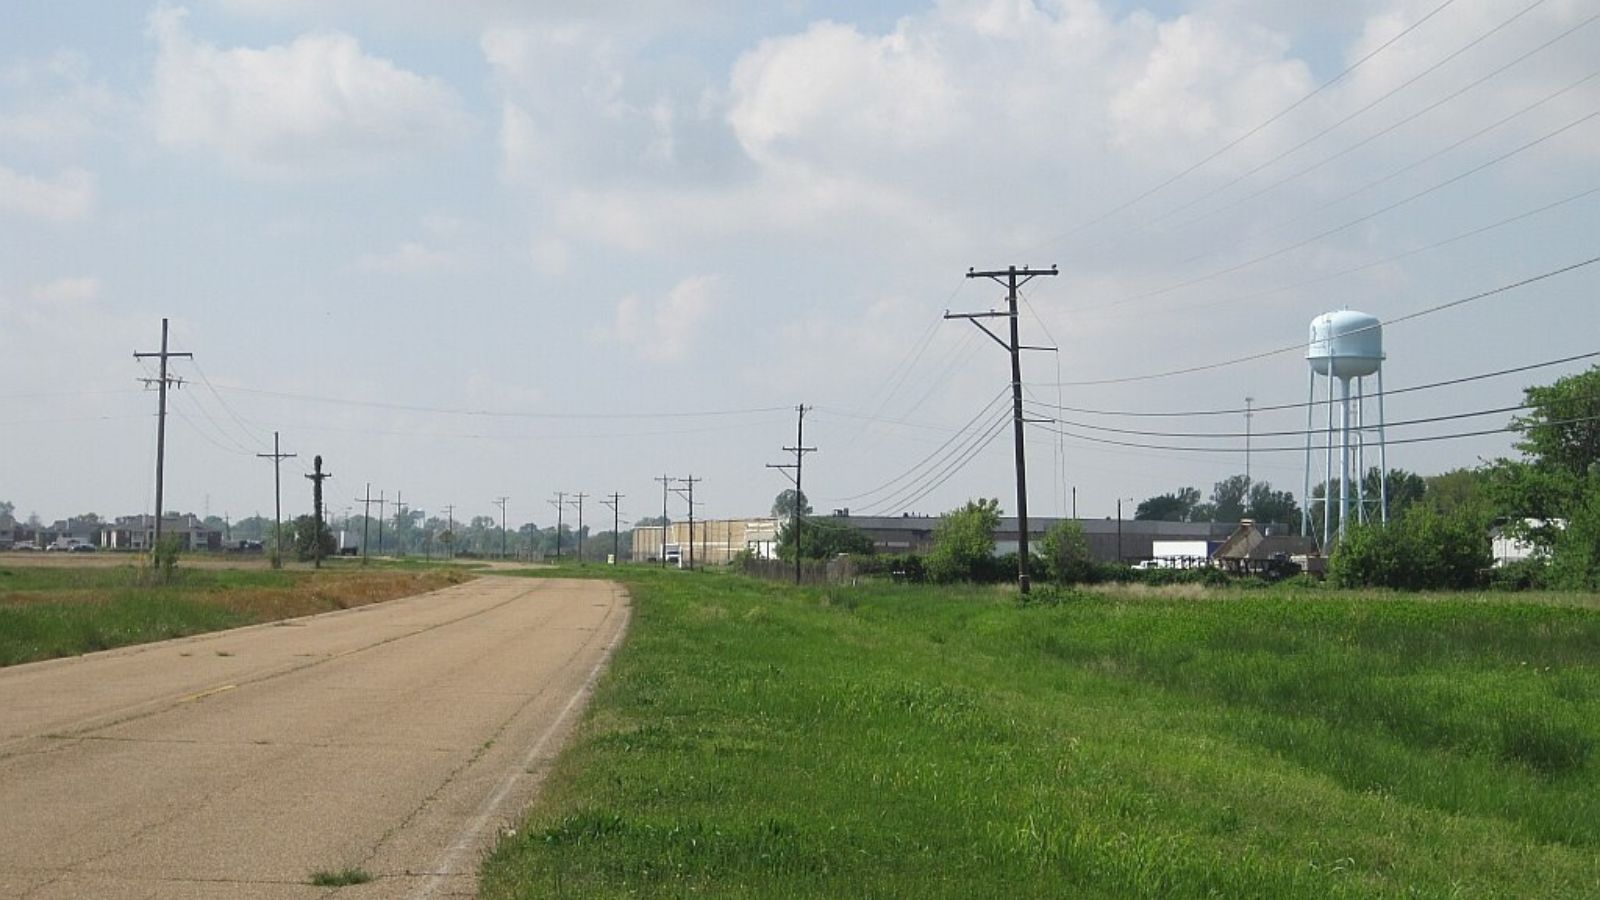
Vancleave – Quiet and Rising on the Coast
Vancleave lies north of Ocean Springs and Biloxi, offering a more rural and spacious lifestyle while still within reach of coastal jobs and amenities. Its appeal includes good schools, wooded lots, and a low-key atmosphere that draws buyers looking for affordability and privacy.
With coastal Mississippi seeing increased interest from both retirees and remote workers, Vancleave has benefited from nearby growth without losing its quiet character. Steady appreciation and a healthy housing stock have kept it in demand.
14. Paris – 21% Home Price Increase Since 2021
- 2010: N/A
- 2011: N/A
- 2012: N/A
- 2013: N/A
- 2014: N/A
- 2015: N/A
- 2016: N/A
- 2017: N/A
- 2018: N/A
- 2019: N/A
- 2020: N/A
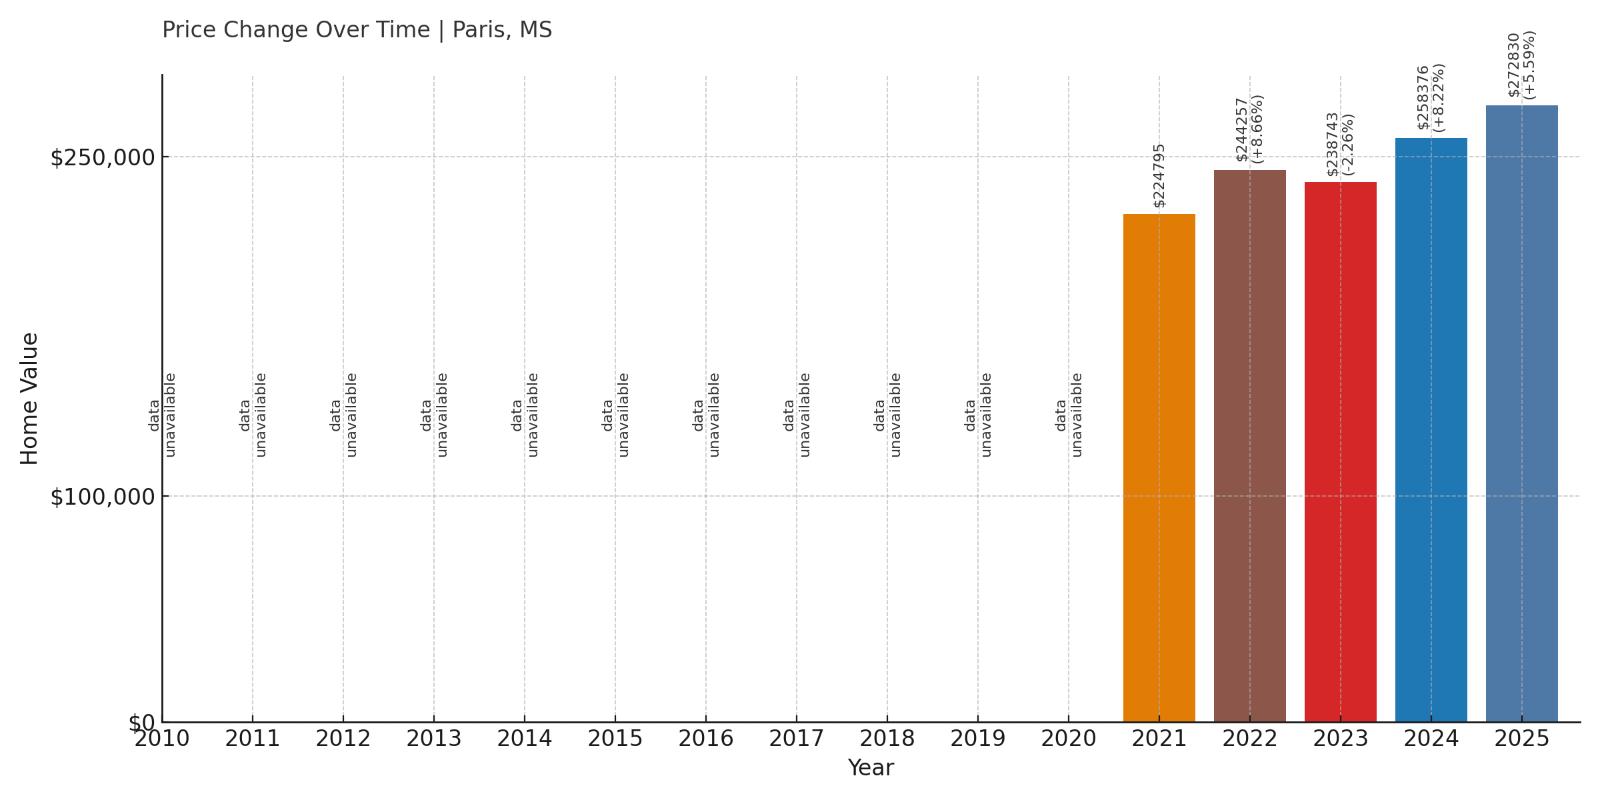
- 2021: $224,795
- 2022: $244,257 (+$19,461, +8.66% from previous year)
- 2023: $238,743 (-$5,514, -2.26% from previous year)
- 2024: $258,376 (+$19,633, +8.22% from previous year)
- 2025: $272,830 (+$14,454, +5.59% from previous year)
Home values in Paris, Mississippi have grown sharply since 2021, despite a brief dip in 2023. The median price hit $272,830 in 2025—up nearly $50,000 in just four years. This suggests increasing interest in the town, even though longer-term data is unavailable.
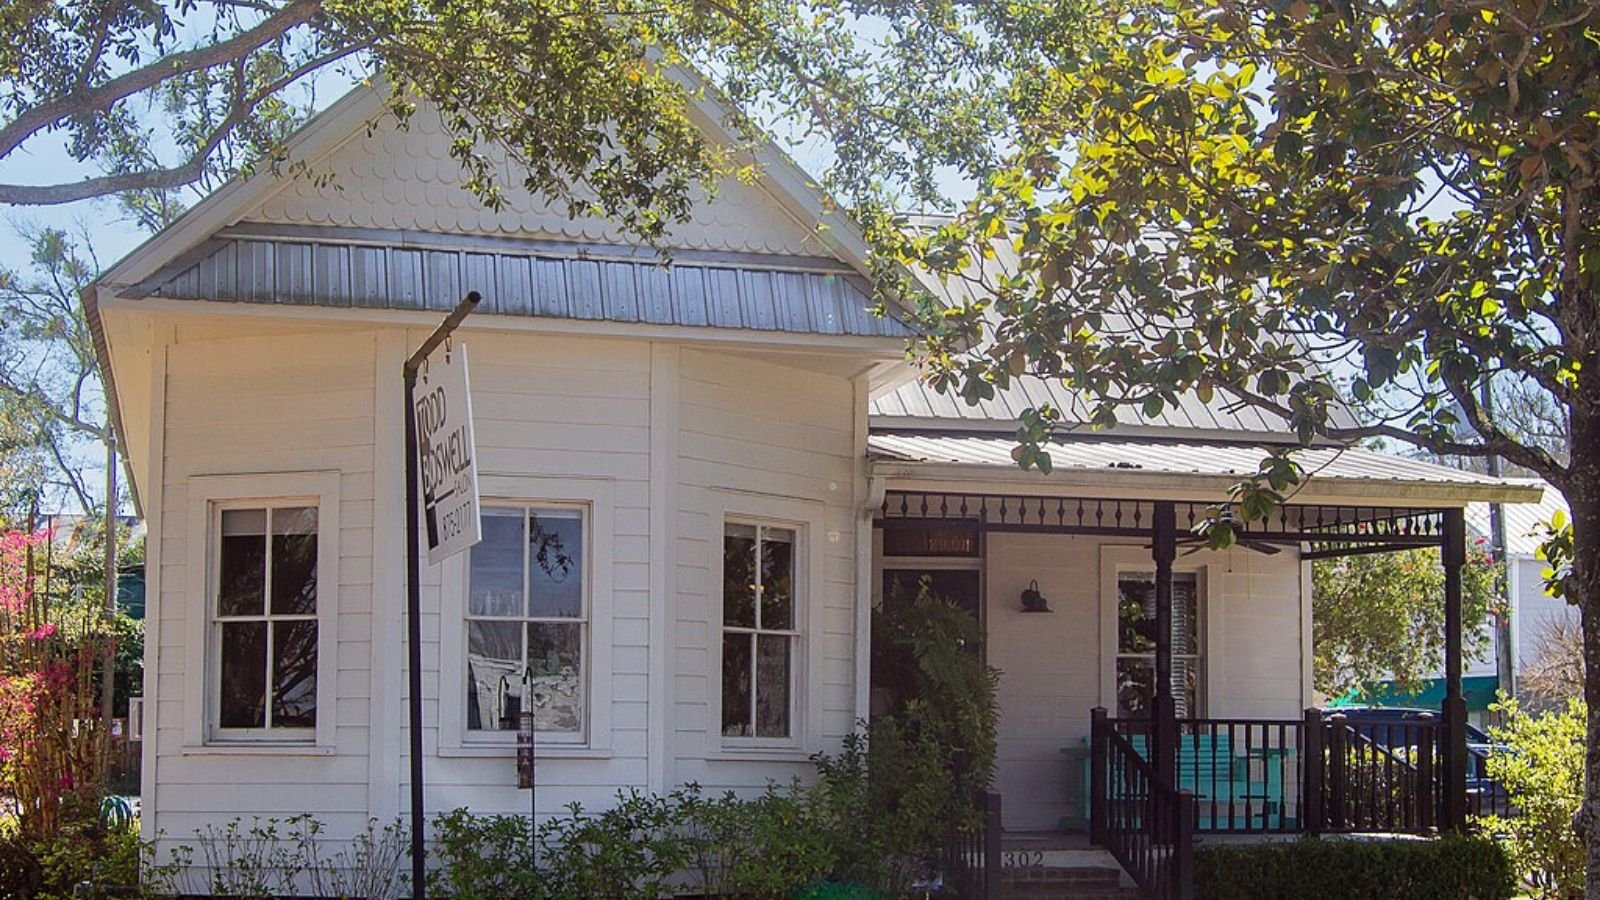
Paris – Small Market With Sudden Interest
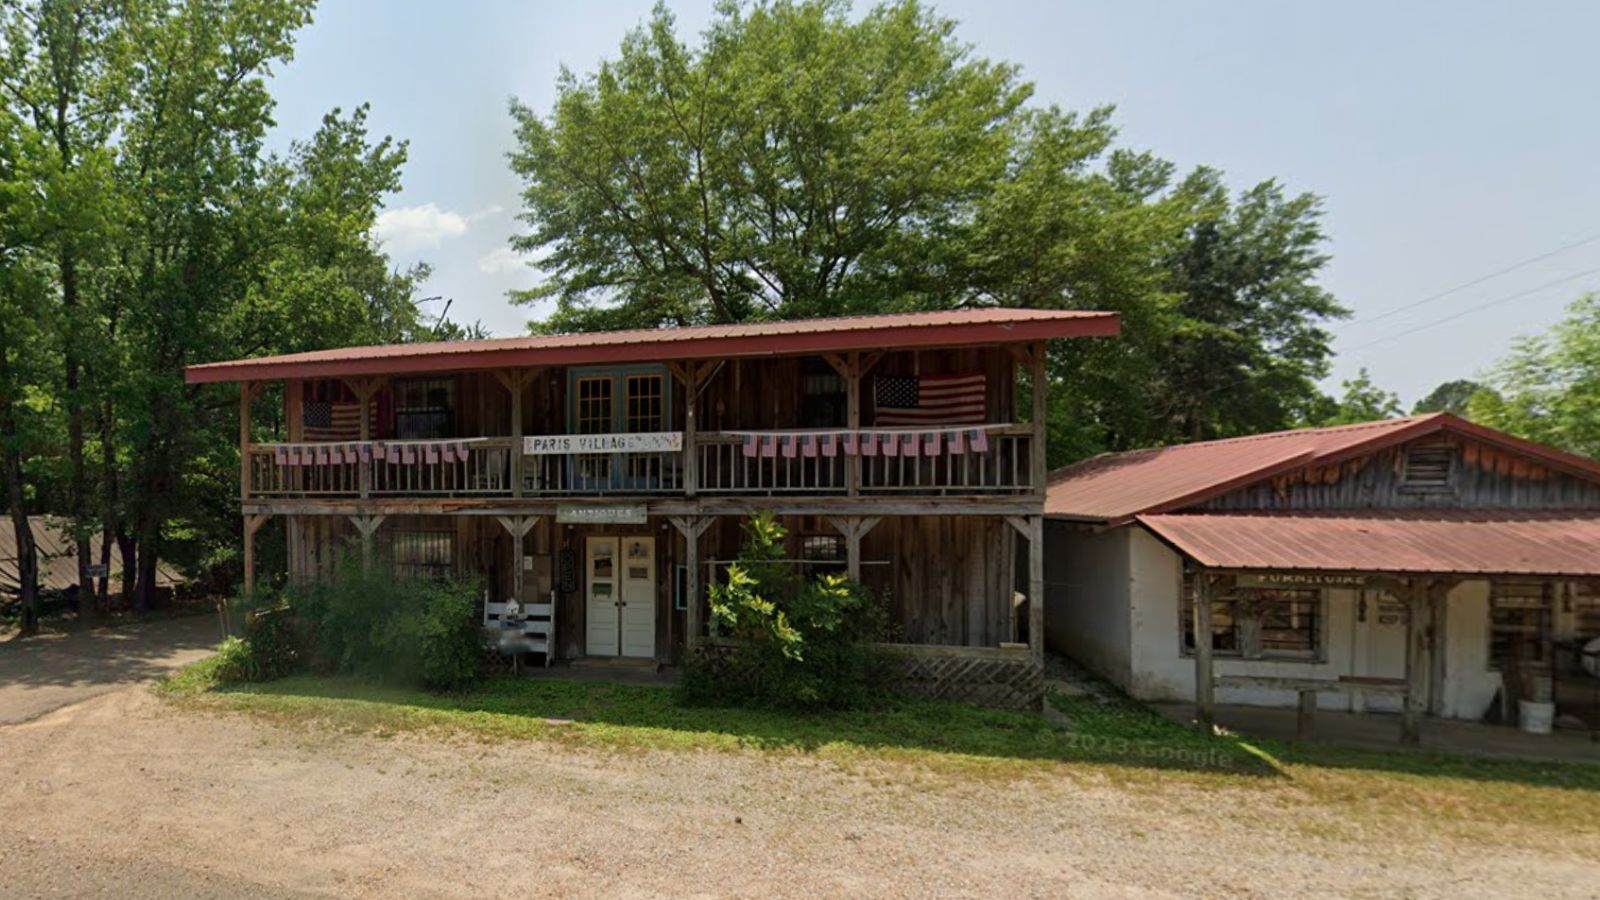
Paris is a small, rural town in Lafayette County, not far from Oxford. While it doesn’t have the size or amenities of larger cities, its location near high-growth areas likely contributed to the recent uptick in demand.
The lack of earlier data makes it hard to track long-term trends, but recent growth and its proximity to Oxford hint that buyers may be turning to Paris as a lower-cost alternative with good access to jobs and schools.
13. Ridgeland – 47% Home Price Increase Since 2010
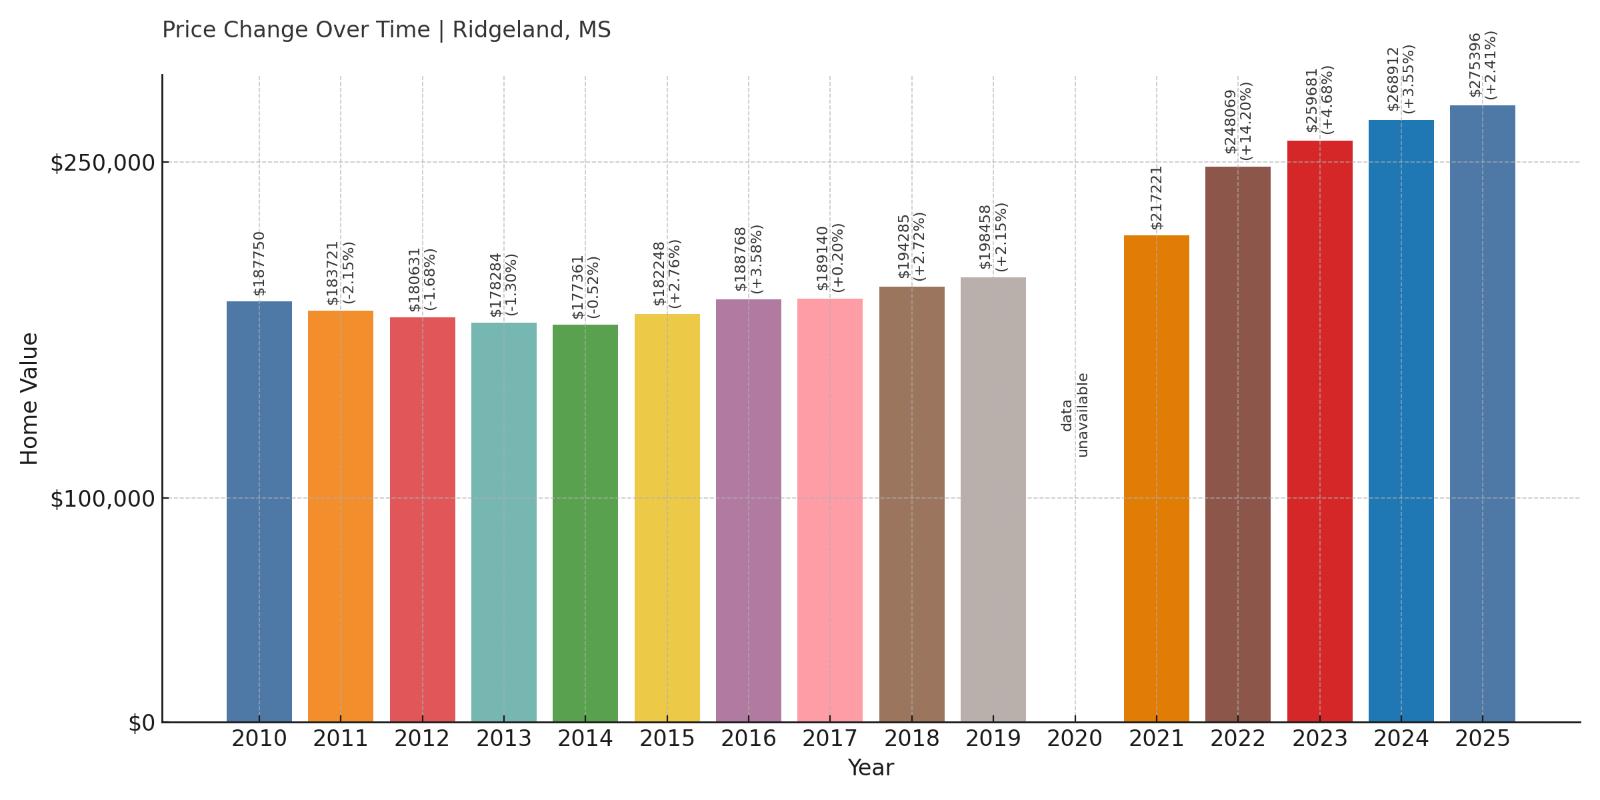
- 2010: $187,750
- 2011: $183,721 (-$4,030, -2.15% from previous year)
- 2012: $180,631 (-$3,090, -1.68% from previous year)
- 2013: $178,284 (-$2,347, -1.30% from previous year)
- 2014: $177,361 (-$923, -0.52% from previous year)
- 2015: $182,248 (+$4,887, +2.76% from previous year)
- 2016: $188,768 (+$6,520, +3.58% from previous year)
- 2017: $189,140 (+$372, +0.20% from previous year)
- 2018: $194,285 (+$5,146, +2.72% from previous year)
- 2019: $198,458 (+$4,172, +2.15% from previous year)
- 2020: N/A
- 2021: $217,221 (+$18,763, +9.45% from previous year)
- 2022: $248,069 (+$30,848, +14.20% from previous year)
- 2023: $259,681 (+$11,612, +4.68% from previous year)
- 2024: $268,912 (+$9,231, +3.55% from previous year)
- 2025: $275,396 (+$6,484, +2.41% from previous year)
Ridgeland’s home values dipped slightly in the early 2010s but began a consistent recovery by 2015. Since then, appreciation has been steady, especially in 2021 and 2022 when growth exceeded 9% and 14%, respectively. By 2025, values reached $275,396—a nearly 47% gain over 15 years.
Ridgeland – Steady Growth Near the Capital
Part of the Jackson metro area, Ridgeland is known for its shopping, medical facilities, and access to the Natchez Trace Parkway. It has a mix of older neighborhoods and newer subdivisions, drawing buyers from across central Mississippi.
While it hasn’t seen the explosive jumps of smaller markets, its long-term upward trend and high livability keep Ridgeland firmly among the most expensive places to buy a home in the state.
12. Southaven – 98% Home Price Increase Since 2011
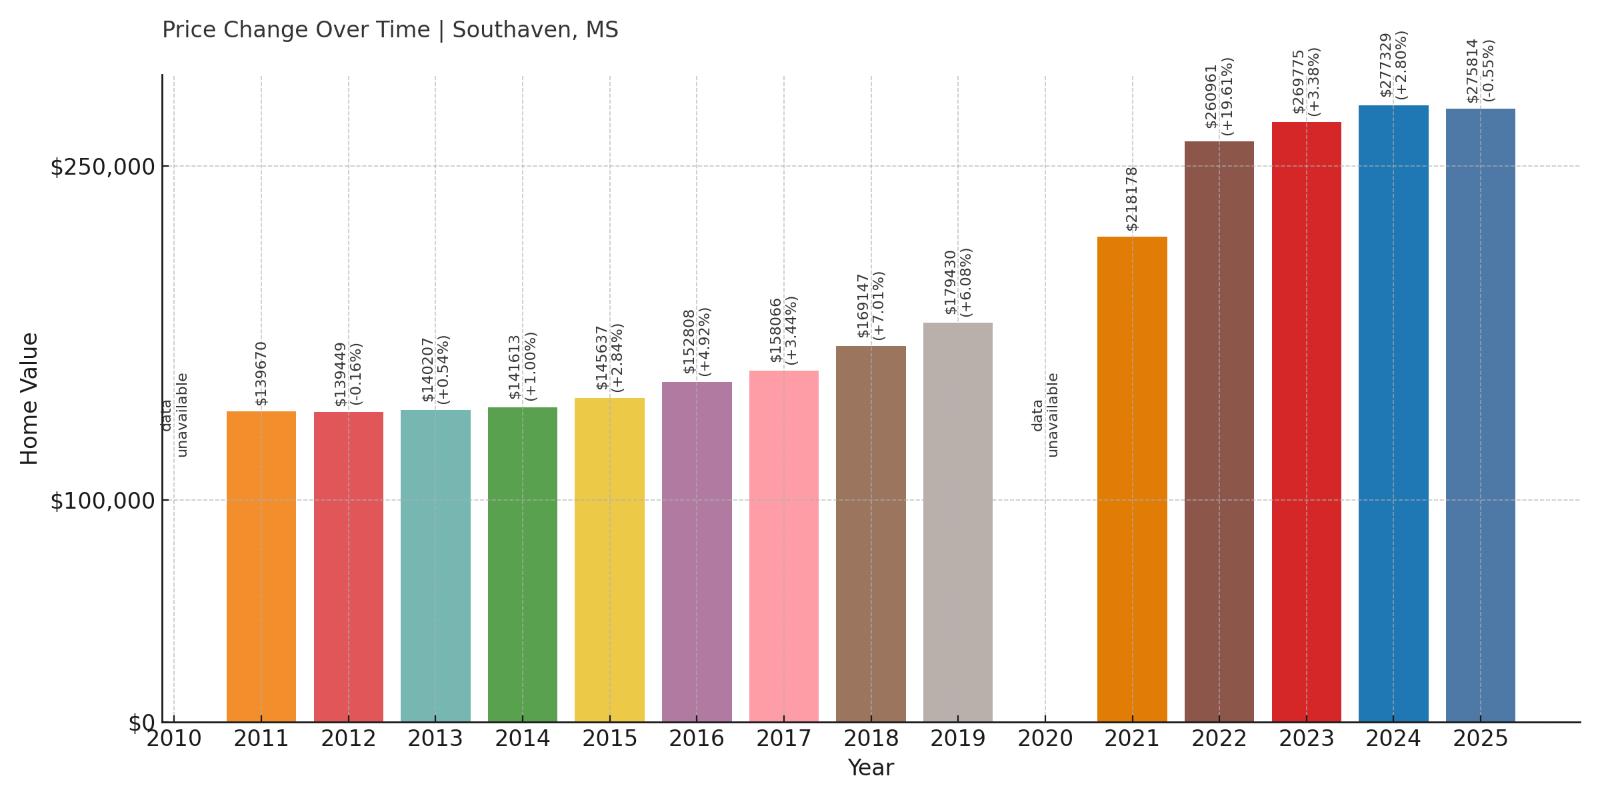
- 2010: N/A
- 2011: $139,670
- 2012: $139,449 (-$221, -0.16% from previous year)
- 2013: $140,207 (+$758, +0.54% from previous year)
- 2014: $141,613 (+$1,405, +1.00% from previous year)
- 2015: $145,637 (+$4,024, +2.84% from previous year)
- 2016: $152,808 (+$7,172, +4.92% from previous year)
- 2017: $158,066 (+$5,258, +3.44% from previous year)
- 2018: $169,147 (+$11,081, +7.01% from previous year)
- 2019: $179,430 (+$10,283, +6.08% from previous year)
- 2020: N/A
- 2021: $218,178 (+$38,748, +21.59% from previous year)
- 2022: $260,961 (+$42,783, +19.61% from previous year)
- 2023: $269,775 (+$8,814, +3.38% from previous year)
- 2024: $277,329 (+$7,554, +2.80% from previous year)
- 2025: $275,814 (-$1,516, -0.55% from previous year)
Southaven’s home values have nearly doubled since 2011, with the sharpest increases happening between 2020 and 2022. After two years of explosive growth, price gains cooled significantly, and by 2025 the median home price slightly dipped to $275,814. But overall, long-term appreciation has been strong, especially for a town its size.
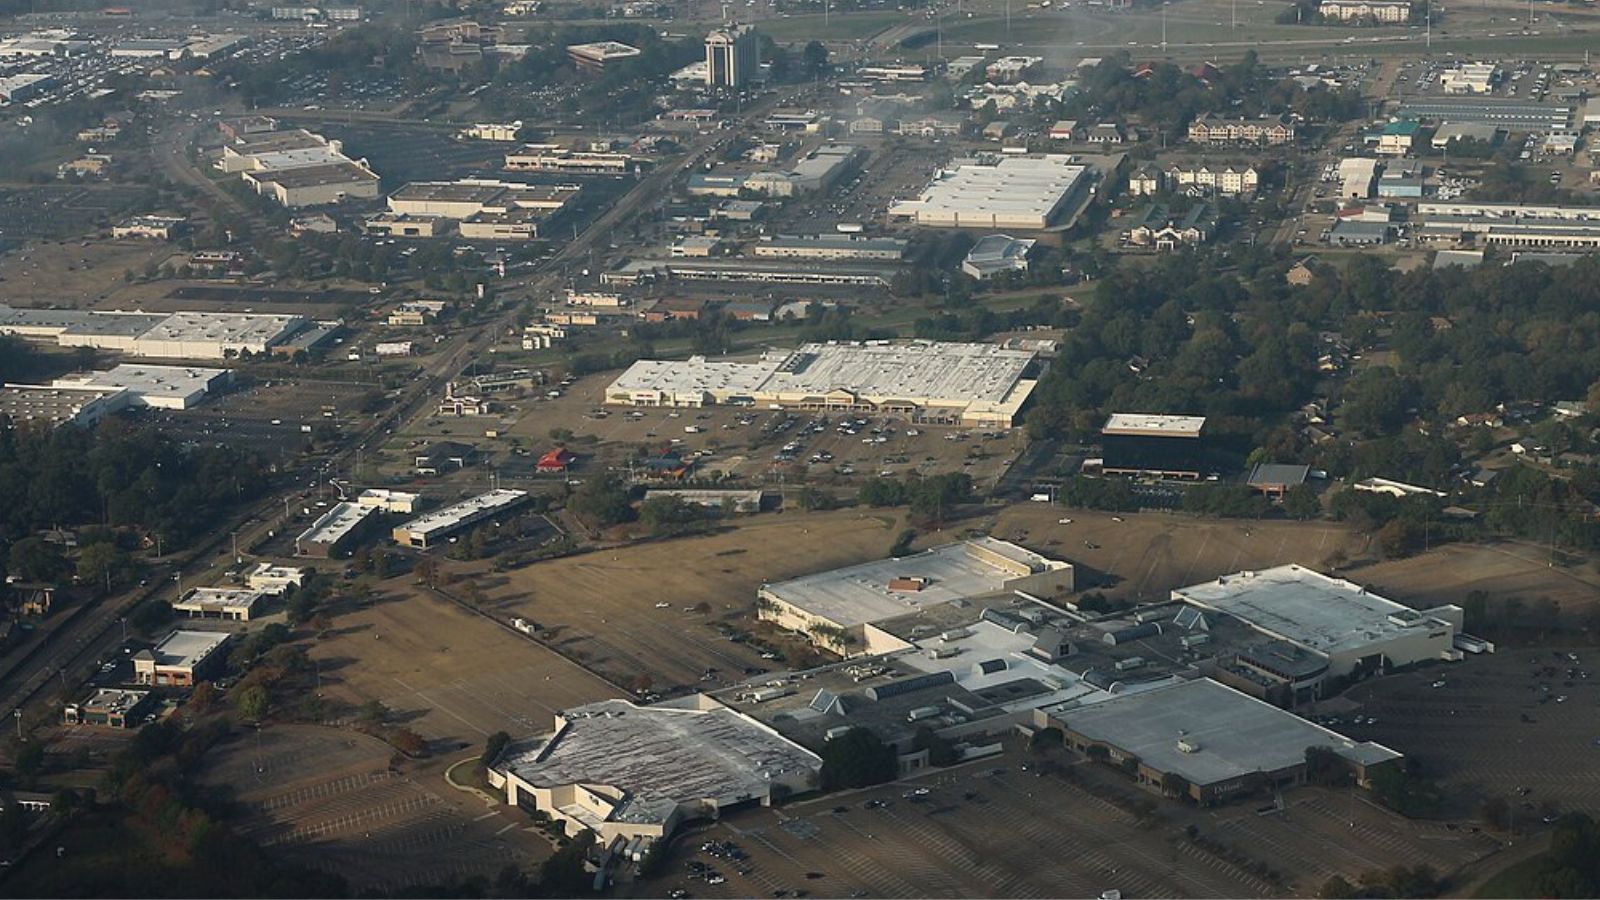
Southaven – Memphis Suburb With Big Momentum

Southaven is the largest suburb of Memphis and one of the fastest-growing cities in Mississippi. Its combination of retail, schools, and proximity to major highways has made it a magnet for both commuters and businesses. That blend of amenities helped push home values well above the state average.
The town’s housing demand surged during the early 2020s, especially as buyers looked for larger homes with suburban convenience. While growth has tapered recently, Southaven’s size and location continue to make it a hot market within north Mississippi.
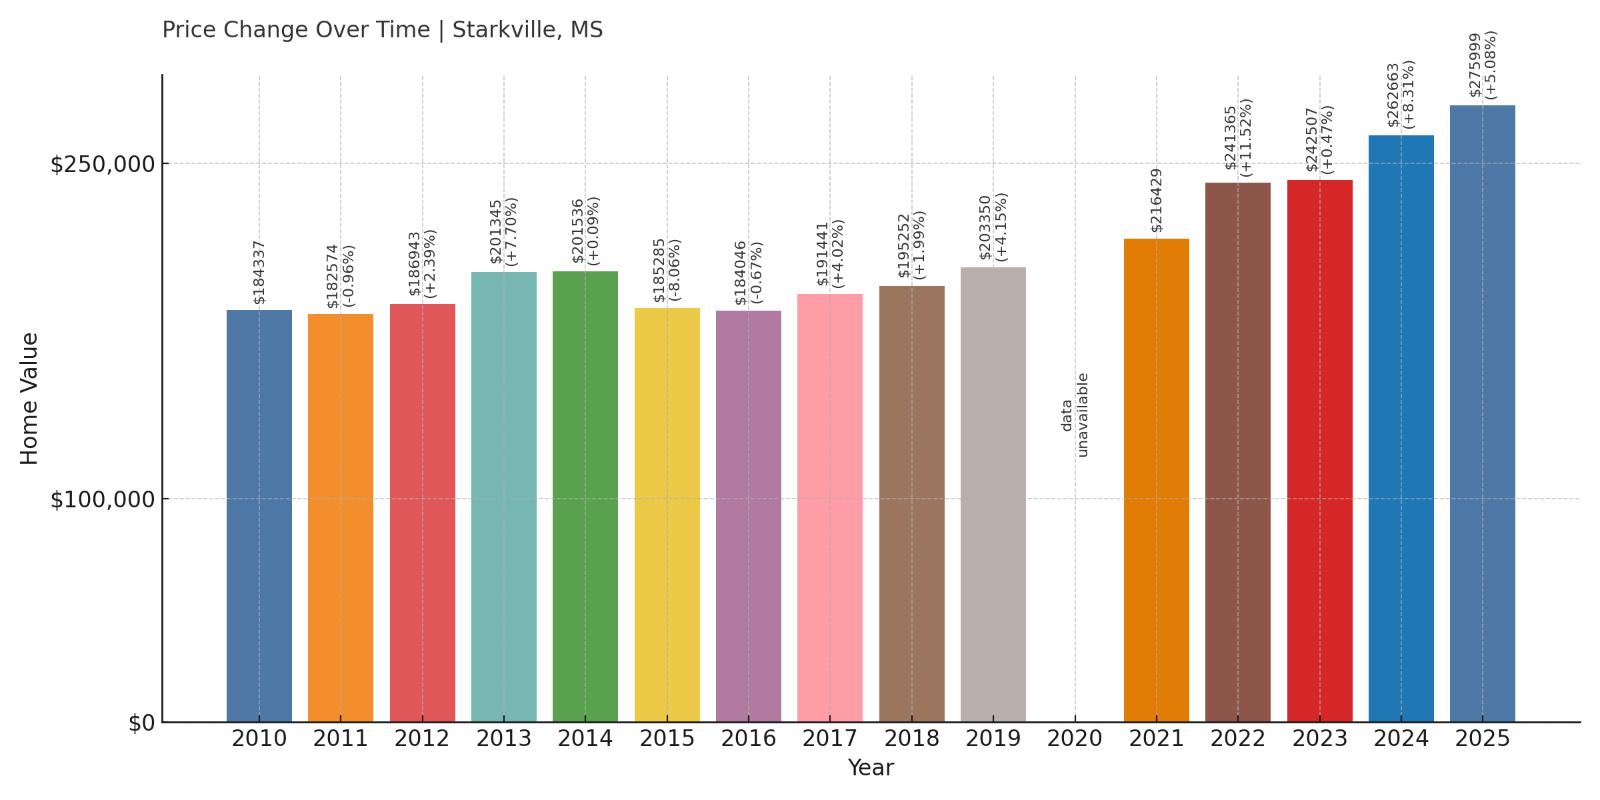
11. Starkville – 50% Home Price Increase Since 2010
🔥 Would you like to save this?
- 2010: $184,337
- 2011: $182,574 (-$1,763, -0.96% from previous year)
- 2012: $186,943 (+$4,369, +2.39% from previous year)
- 2013: $201,345 (+$14,402, +7.70% from previous year)
- 2014: $201,536 (+$191, +0.09% from previous year)
- 2015: $185,285 (-$16,251, -8.06% from previous year)
- 2016: $184,046 (-$1,239, -0.67% from previous year)
- 2017: $191,441 (+$7,396, +4.02% from previous year)
- 2018: $195,252 (+$3,810, +1.99% from previous year)
- 2019: $203,350 (+$8,098, +4.15% from previous year)
- 2020: N/A
- 2021: $216,429 (+$13,080, +6.43% from previous year)
- 2022: $241,365 (+$24,936, +11.52% from previous year)
- 2023: $242,507 (+$1,142, +0.47% from previous year)
- 2024: $262,663 (+$20,156, +8.31% from previous year)
- 2025: $275,999 (+$13,335, +5.08% from previous year)
Starkville’s home prices have had ups and downs since 2010, but the overall trend is upward. After stagnating in the mid-2010s, the market rebounded strongly in the early 2020s. Prices reached $275,999 in 2025, marking a 50% increase from 2010 despite some periods of volatility.
Starkville – College Town With Steady Draw
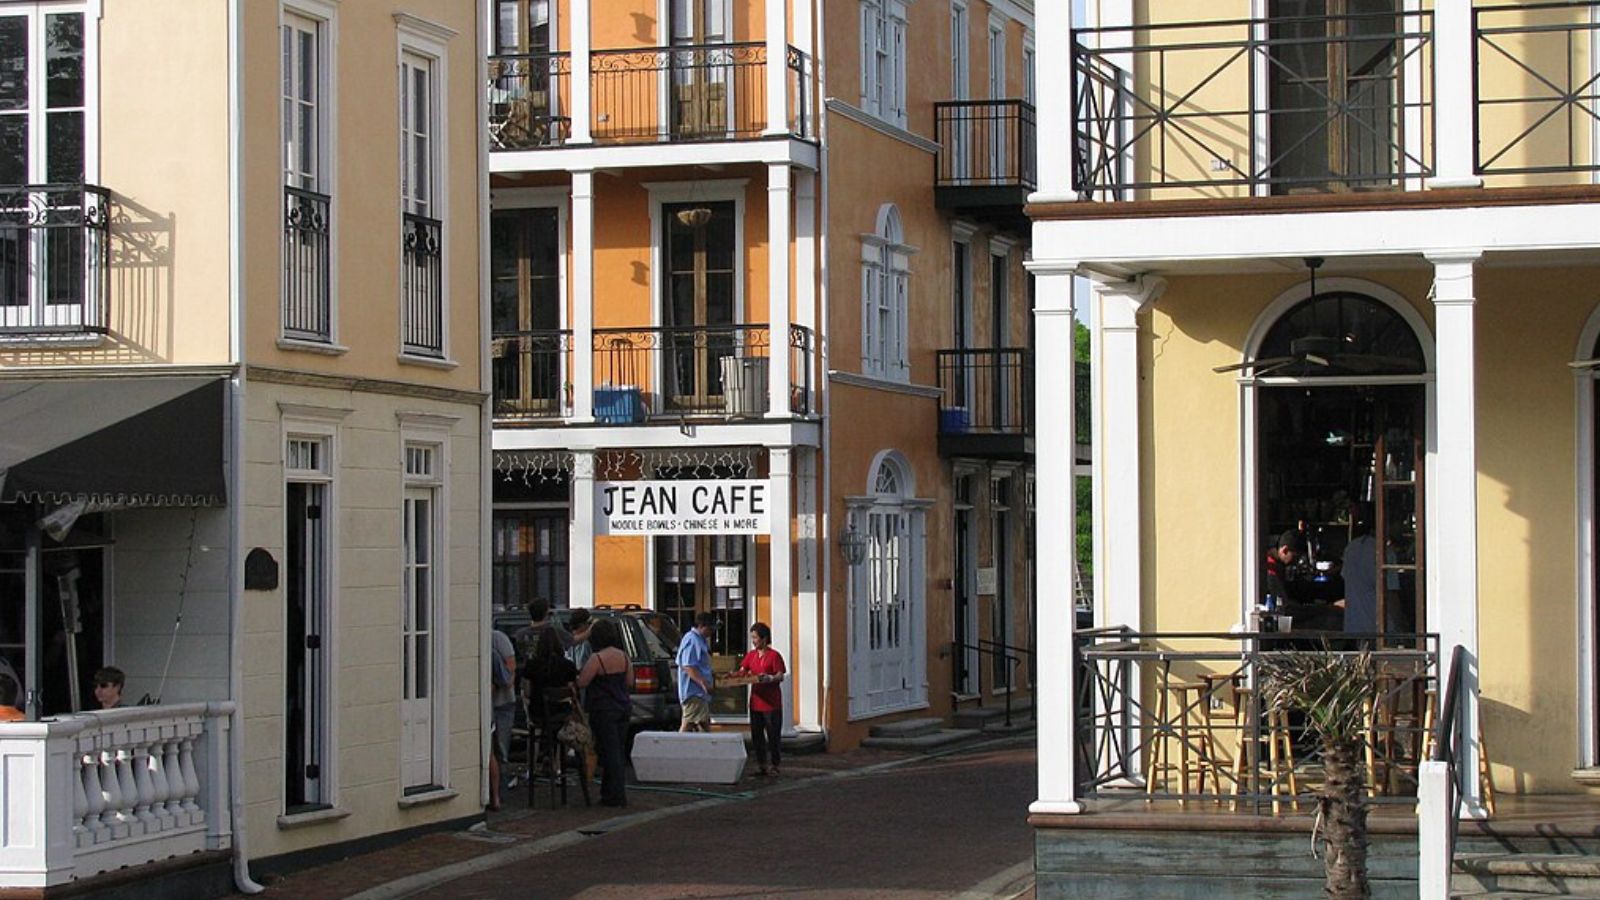
Home to Mississippi State University, Starkville benefits from a built-in base of renters, faculty, and students that keep its housing market active. While price growth slowed at times, recent years have shown renewed buyer interest—especially from remote workers and retirees looking for small-town amenities with university access.
Its location in northeast Mississippi, vibrant college-town culture, and new development projects have helped reenergize the local market. The town’s home prices reflect that renewed attention and improved investor confidence.
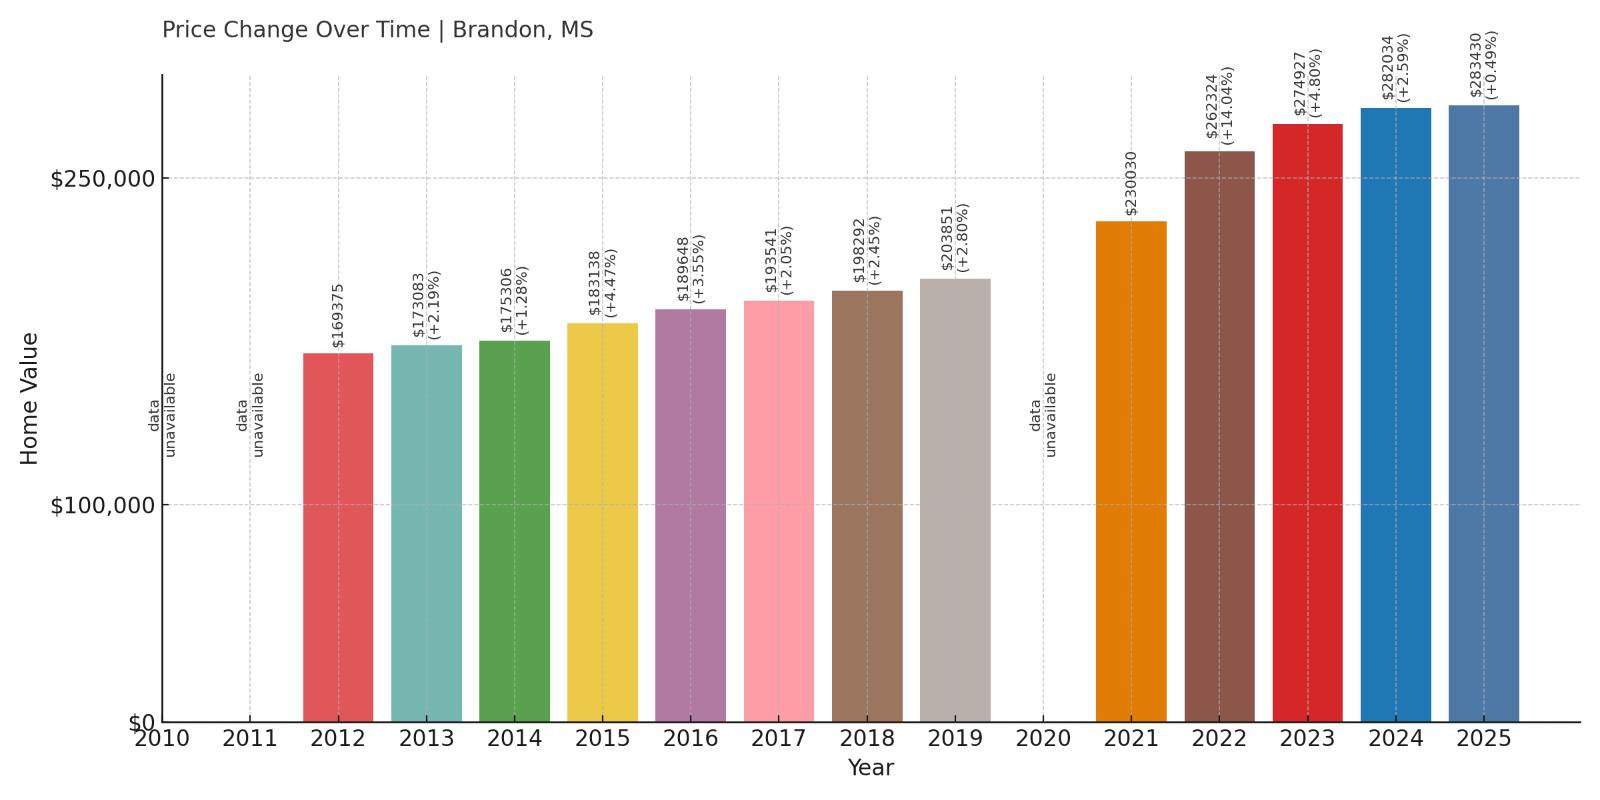
10. Brandon – 67% Home Price Increase Since 2012
- 2010: N/A
- 2011: N/A
- 2012: $169,375
- 2013: $173,083 (+$3,707, +2.19% from previous year)
- 2014: $175,306 (+$2,223, +1.28% from previous year)
- 2015: $183,138 (+$7,833, +4.47% from previous year)
- 2016: $189,648 (+$6,510, +3.55% from previous year)
- 2017: $193,541 (+$3,893, +2.05% from previous year)
- 2018: $198,292 (+$4,751, +2.45% from previous year)
- 2019: $203,851 (+$5,559, +2.80% from previous year)
- 2020: N/A
- 2021: $230,030 (+$26,178, +12.84% from previous year)
- 2022: $262,324 (+$32,295, +14.04% from previous year)
- 2023: $274,927 (+$12,602, +4.80% from previous year)
- 2024: $282,034 (+$7,107, +2.59% from previous year)
- 2025: $283,430 (+$1,397, +0.50% from previous year)
Brandon’s home values rose steadily throughout the 2010s and surged during the early 2020s. Prices climbed from around $169,000 in 2012 to over $283,000 in 2025—a 67% gain. Although recent growth has slowed, the town remains one of Mississippi’s most expensive markets.
Brandon – Suburban Stronghold Near Jackson
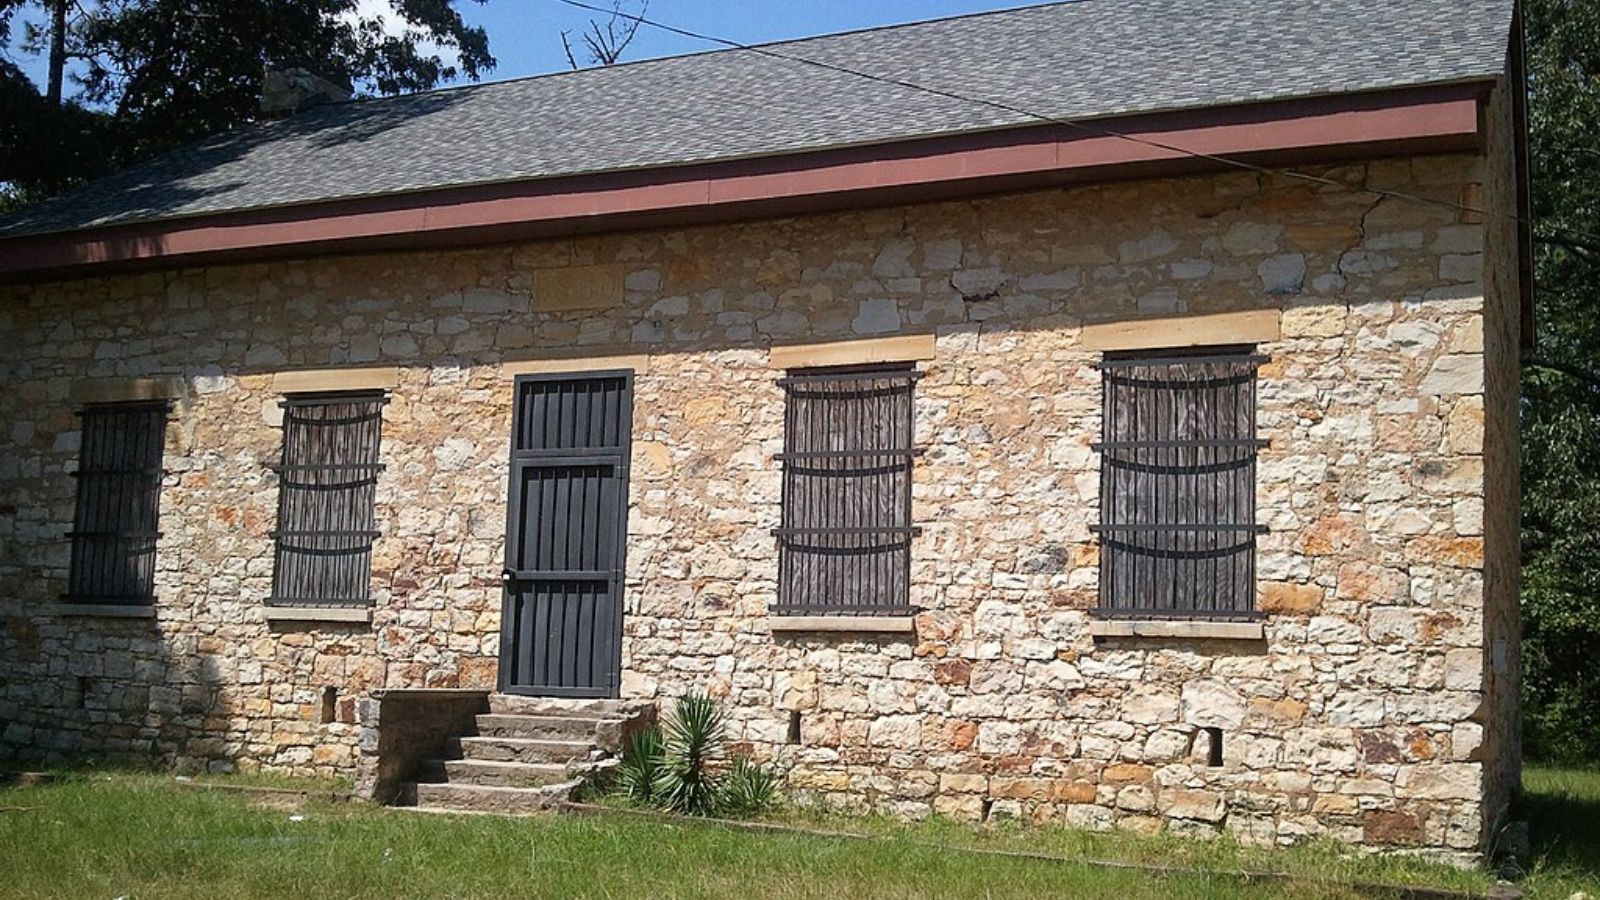
Located just east of Jackson, Brandon has long been a popular choice for homebuyers seeking safe neighborhoods, good schools, and manageable commutes. It has a strong community feel and growing amenities, making it a reliable pick for families and professionals alike.
Its housing market saw especially strong demand during 2021 and 2022. Even with more moderate gains since then, Brandon continues to attract steady buyer interest and holds its position among the state’s highest-value towns.
9. Flora – 73% Home Price Increase Since 2010
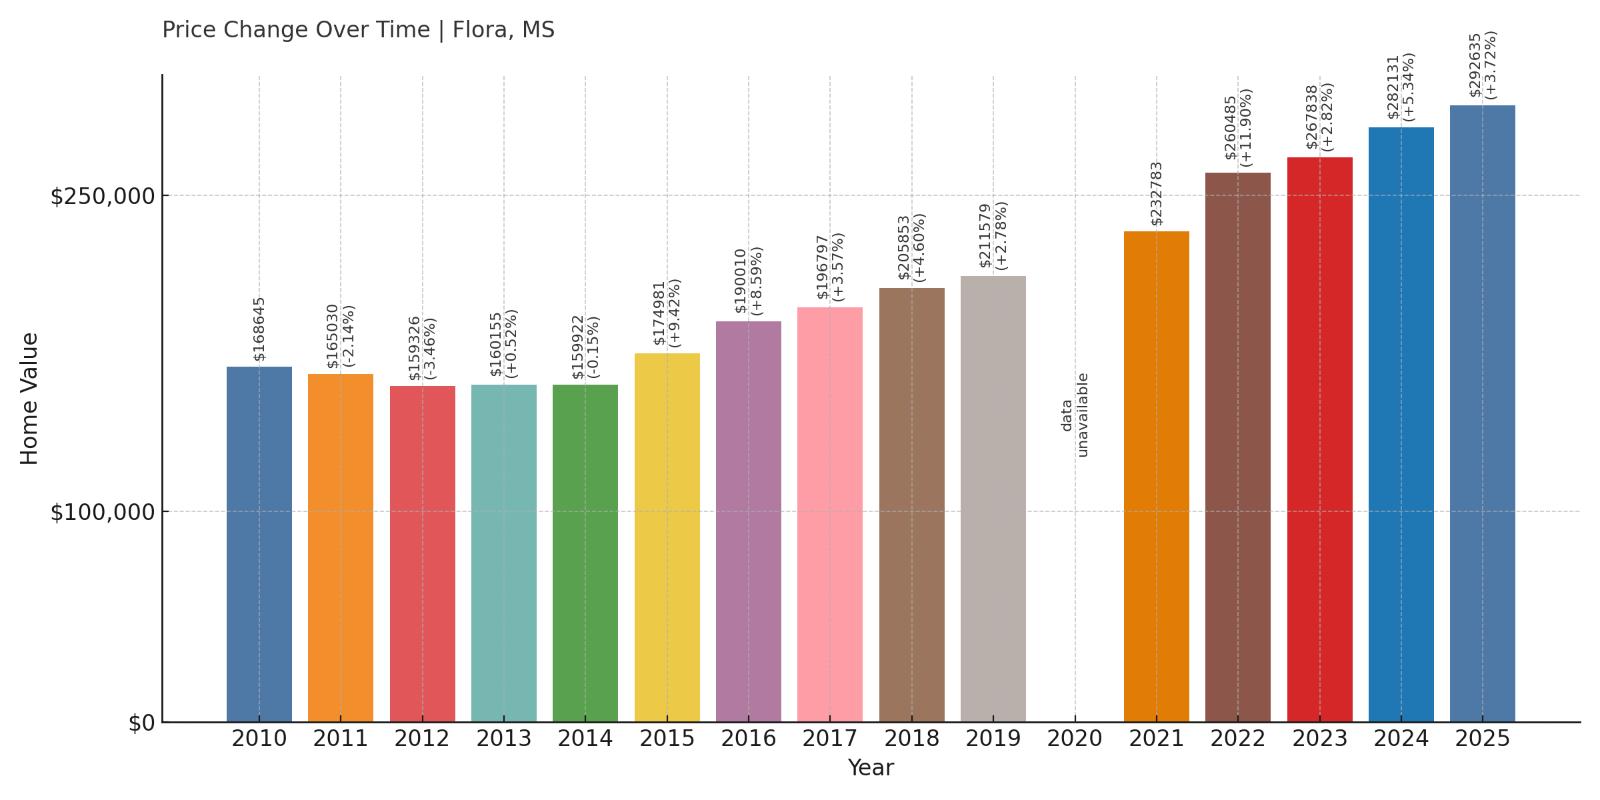
- 2010: $168,645
- 2011: $165,030 (-$3,615, -2.14% from previous year)
- 2012: $159,326 (-$5,704, -3.46% from previous year)
- 2013: $160,155 (+$829, +0.52% from previous year)
- 2014: $159,922 (-$233, -0.15% from previous year)
- 2015: $174,981 (+$15,059, +9.42% from previous year)
- 2016: $190,010 (+$15,029, +8.59% from previous year)
- 2017: $196,797 (+$6,787, +3.57% from previous year)
- 2018: $205,853 (+$9,056, +4.60% from previous year)
- 2019: $211,579 (+$5,727, +2.78% from previous year)
- 2020: N/A
- 2021: $232,783 (+$21,204, +10.02% from previous year)
- 2022: $260,485 (+$27,702, +11.90% from previous year)
- 2023: $267,838 (+$7,353, +2.82% from previous year)
- 2024: $282,131 (+$14,293, +5.34% from previous year)
- 2025: $292,635 (+$10,504, +3.72% from previous year)
Flora’s housing market began with slow declines in the early 2010s but has since posted strong growth. Home values rebounded sharply after 2015, and by 2025, prices reached $292,635—a 73% increase over the 15-year span. The most significant appreciation occurred from 2020 onward.
Flora – Charming and Convenient
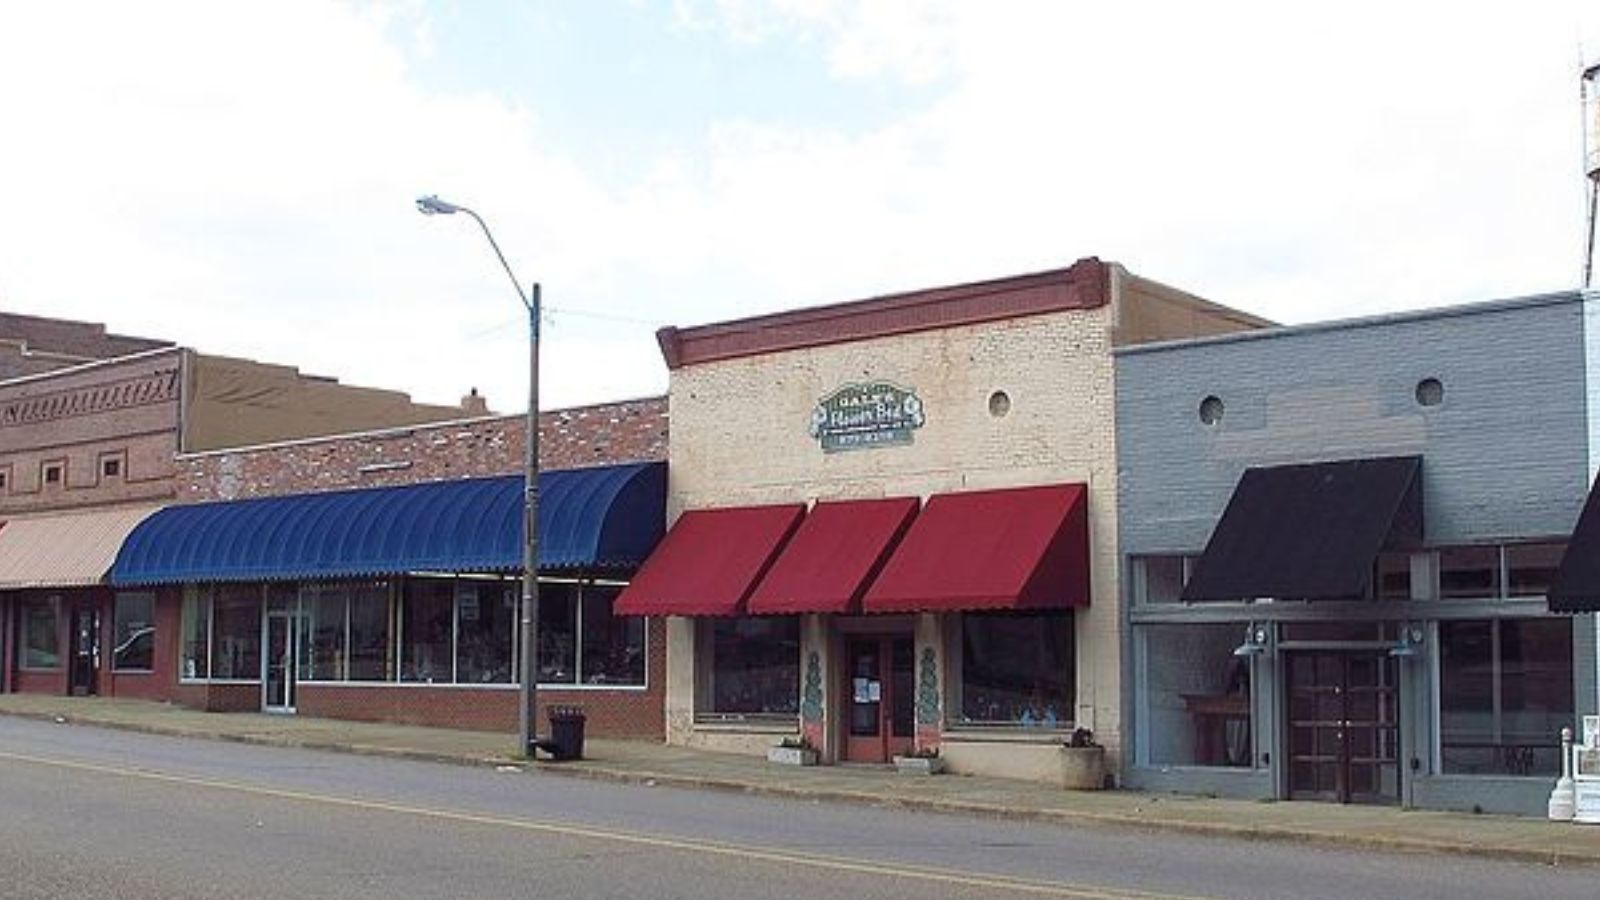
Flora is located in Madison County, offering rural tranquility with easy access to Jackson and nearby suburbs. It has become a favored destination for buyers seeking more space, less traffic, and a slower pace of life without sacrificing proximity to urban job centers.
Its appeal has grown steadily over the past decade, especially with the rise of remote work and the popularity of small-town living. Flora’s mix of new construction and scenic settings has helped it land in the top 10 most expensive towns in Mississippi.
8. Pass Christian – 76% Home Price Increase Since 2011
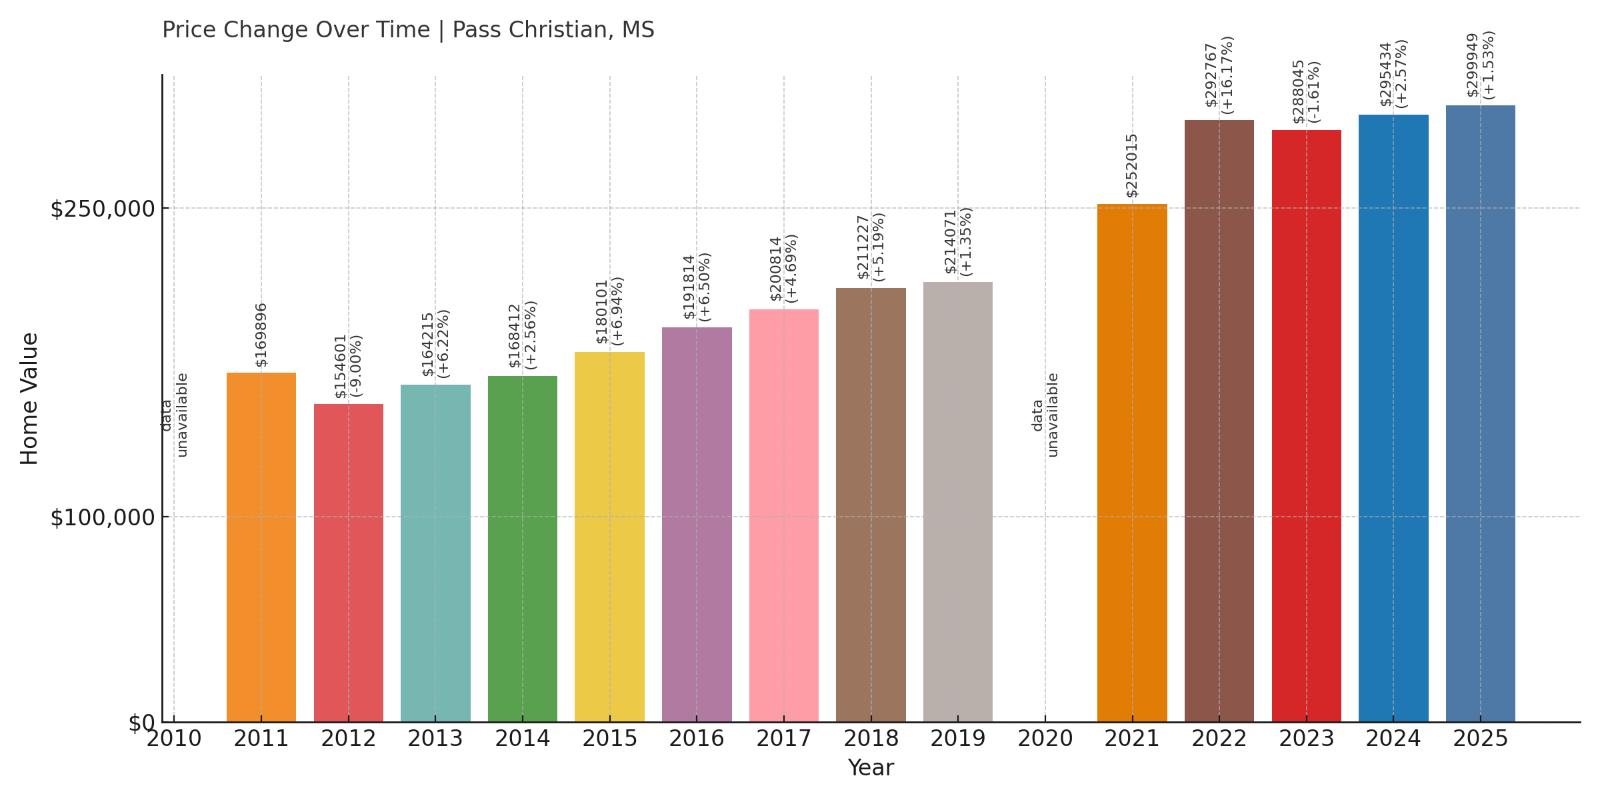
- 2010: N/A
- 2011: $169,896
- 2012: $154,601 (-$15,295, -9.00% from previous year)
- 2013: $164,215 (+$9,614, +6.22% from previous year)
- 2014: $168,412 (+$4,197, +2.56% from previous year)
- 2015: $180,101 (+$11,688, +6.94% from previous year)
- 2016: $191,814 (+$11,714, +6.50% from previous year)
- 2017: $200,814 (+$8,999, +4.69% from previous year)
- 2018: $211,227 (+$10,413, +5.19% from previous year)
- 2019: $214,071 (+$2,844, +1.35% from previous year)
- 2020: N/A
- 2021: $252,015 (+$37,944, +17.72% from previous year)
- 2022: $292,767 (+$40,752, +16.17% from previous year)
- 2023: $288,045 (-$4,722, -1.61% from previous year)
- 2024: $295,434 (+$7,389, +2.57% from previous year)
- 2025: $299,949 (+$4,515, +1.53% from previous year)
Pass Christian’s home prices surged between 2011 and 2025, gaining nearly 76% overall. Values saw their biggest increases in 2021 and 2022, with annual gains over 16%. Though 2023 saw a brief dip, prices recovered and stabilized near $300,000 by 2025, placing Pass Christian firmly among Mississippi’s most expensive markets.
Pass Christian – A Coastal Comeback Story
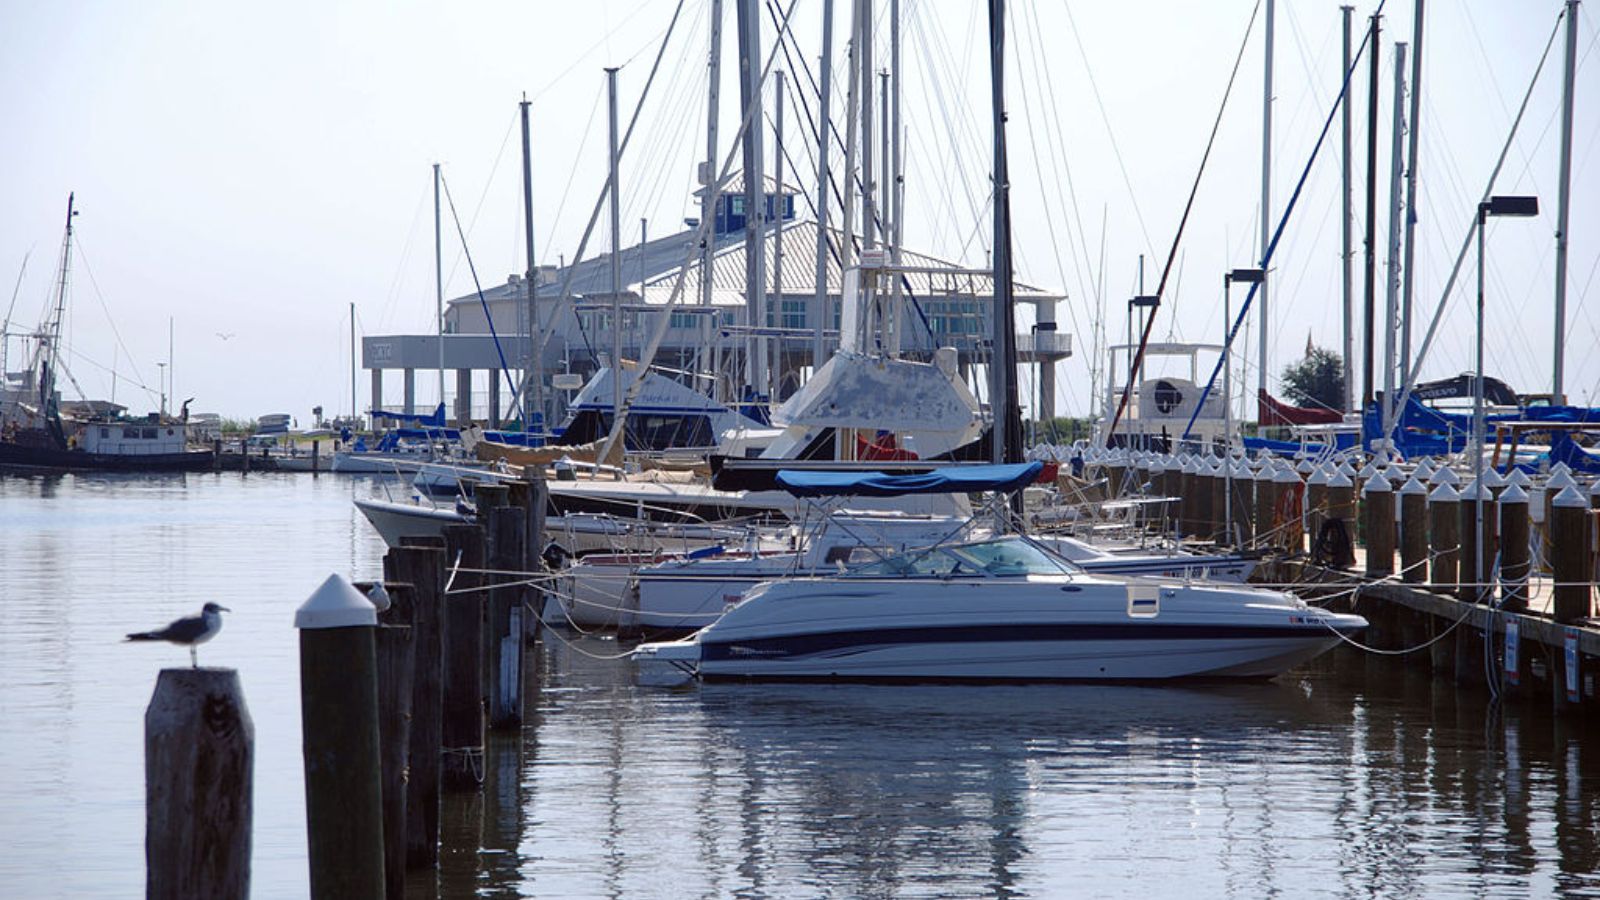
Once devastated by Hurricane Katrina, Pass Christian has seen years of rebuilding and revitalization. Located on the Gulf of Mexico, it blends beautiful waterfront views with a laid-back pace of life, drawing interest from both retirees and second-home buyers. The strong post-2020 price jumps reflect a new wave of investment and in-migration.
With its mix of historic charm, white-sand beaches, and new development, Pass Christian is now one of the most desirable coastal towns in the state. Limited supply and renewed demand have pushed home prices steadily upward, especially in the last few years.
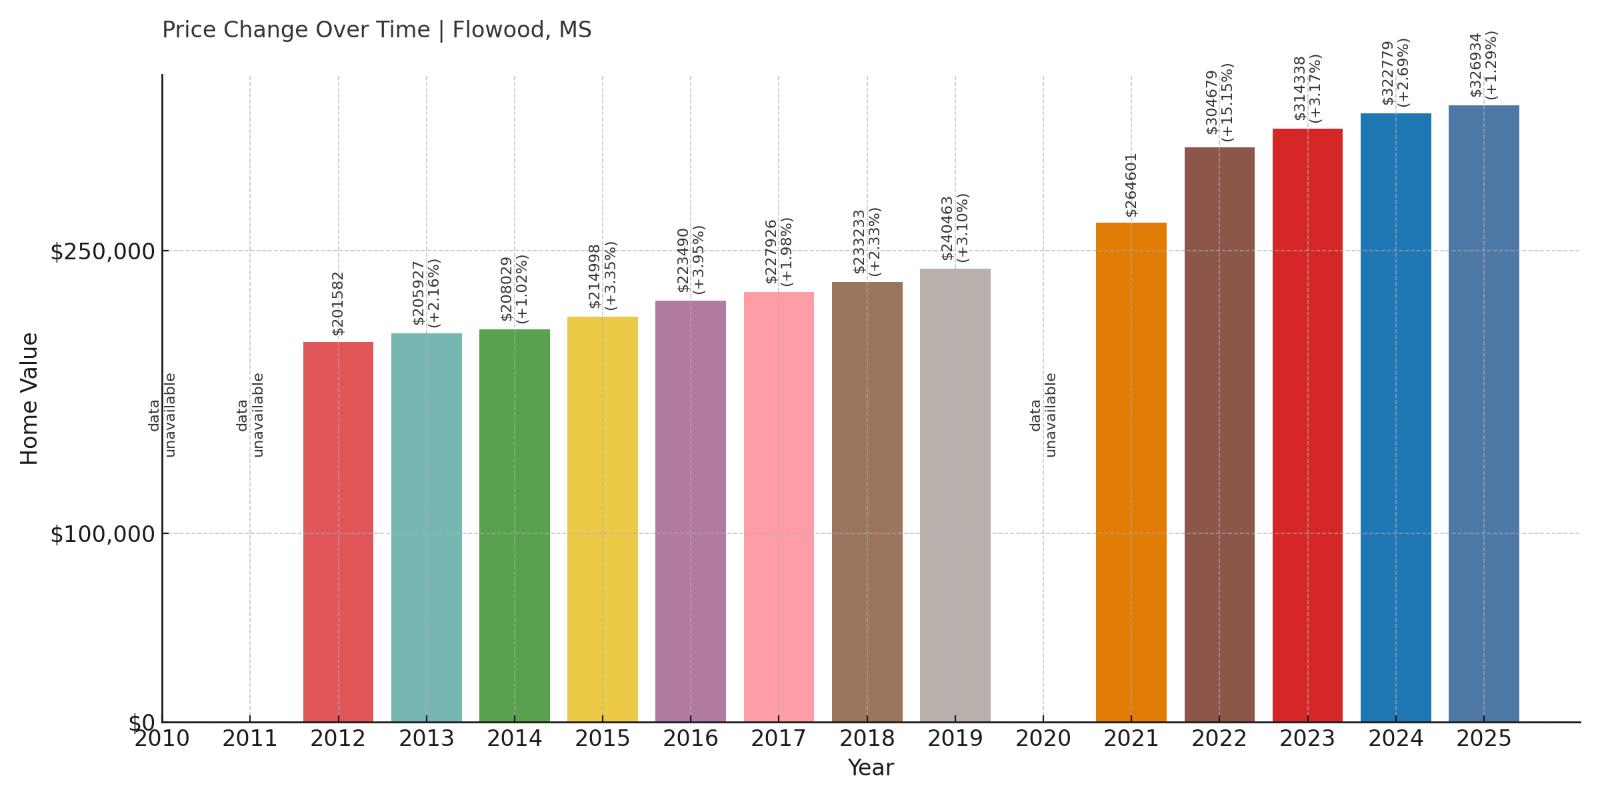
7. Flowood – 62% Home Price Increase Since 2012
- 2010: N/A
- 2011: N/A
- 2012: $201,582
- 2013: $205,927 (+$4,345, +2.16% from previous year)
- 2014: $208,029 (+$2,102, +1.02% from previous year)
- 2015: $214,998 (+$6,969, +3.35% from previous year)
- 2016: $223,490 (+$8,492, +3.95% from previous year)
- 2017: $227,926 (+$4,436, +1.99% from previous year)
- 2018: $233,233 (+$5,307, +2.33% from previous year)
- 2019: $240,463 (+$7,230, +3.10% from previous year)
- 2020: N/A
- 2021: $264,601 (+$24,138, +10.04% from previous year)
- 2022: $304,679 (+$40,079, +15.15% from previous year)
- 2023: $314,338 (+$9,659, +3.17% from previous year)
- 2024: $322,779 (+$8,441, +2.69% from previous year)
- 2025: $326,934 (+$4,155, +1.29% from previous year)
Flowood’s home values have steadily increased from just over $200,000 in 2012 to nearly $327,000 in 2025. The town saw strong, steady growth throughout the 2010s and experienced its most significant spikes in 2021 and 2022. Gains have slowed since then, but prices remain elevated and continue to inch upward.
Flowood – Upscale and Expanding in Central Mississippi
East of Jackson, Flowood has become one of the most desirable places to live in central Mississippi. Its upscale shopping centers, expanding healthcare facilities, and new subdivisions have made it a destination for middle- and upper-income buyers. The city’s strong infrastructure and steady development have supported long-term price growth.
Flowood’s appeal surged during the post-COVID housing rush, and its housing stock continues to attract professionals and families looking for quality schools and modern amenities. Limited inventory and sustained demand are keeping values high in 2025.
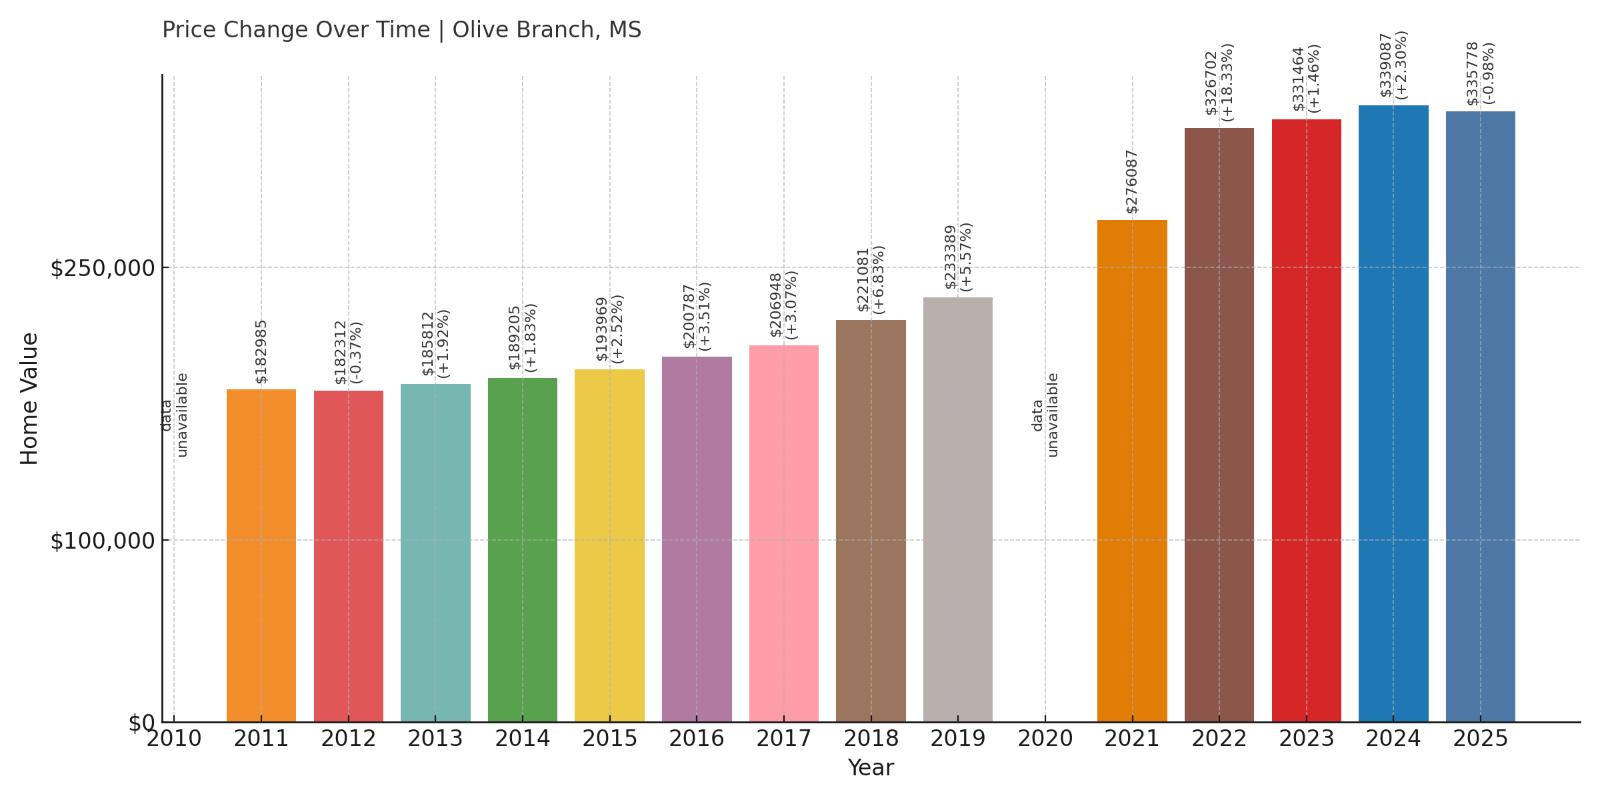
6. Olive Branch – 84% Home Price Increase Since 2011
- 2010: N/A
- 2011: $182,985
- 2012: $182,312 (-$673, -0.37% from previous year)
- 2013: $185,812 (+$3,500, +1.92% from previous year)
- 2014: $189,205 (+$3,393, +1.83% from previous year)
- 2015: $193,969 (+$4,764, +2.52% from previous year)
- 2016: $200,787 (+$6,818, +3.52% from previous year)
- 2017: $206,948 (+$6,162, +3.07% from previous year)
- 2018: $221,081 (+$14,132, +6.83% from previous year)
- 2019: $233,389 (+$12,308, +5.57% from previous year)
- 2020: N/A
- 2021: $276,087 (+$42,698, +18.29% from previous year)
- 2022: $326,702 (+$50,615, +18.33% from previous year)
- 2023: $331,464 (+$4,762, +1.46% from previous year)
- 2024: $339,087 (+$7,623, +2.30% from previous year)
- 2025: $335,778 (-$3,309, -0.98% from previous year)
Home prices in Olive Branch have nearly doubled since 2011, with values peaking above $335,000 in 2024. The market exploded in 2021 and 2022, when back-to-back annual gains topped 18%. While prices dipped slightly in 2025, the overall trajectory over the past decade has been one of strong, sustained appreciation.
Olive Branch – Growth Magnet in DeSoto County
Just across the Tennessee line from Memphis, Olive Branch offers suburban comfort with city access. It’s part of one of the fastest-growing counties in the state, and its mix of new housing, business development, and strong schools has fueled demand year after year.
Buyers priced out of Memphis or Southaven often look to Olive Branch, where new subdivisions have kept supply competitive. Although recent price movement has been flat, long-term prospects remain solid thanks to its strategic location and amenities.
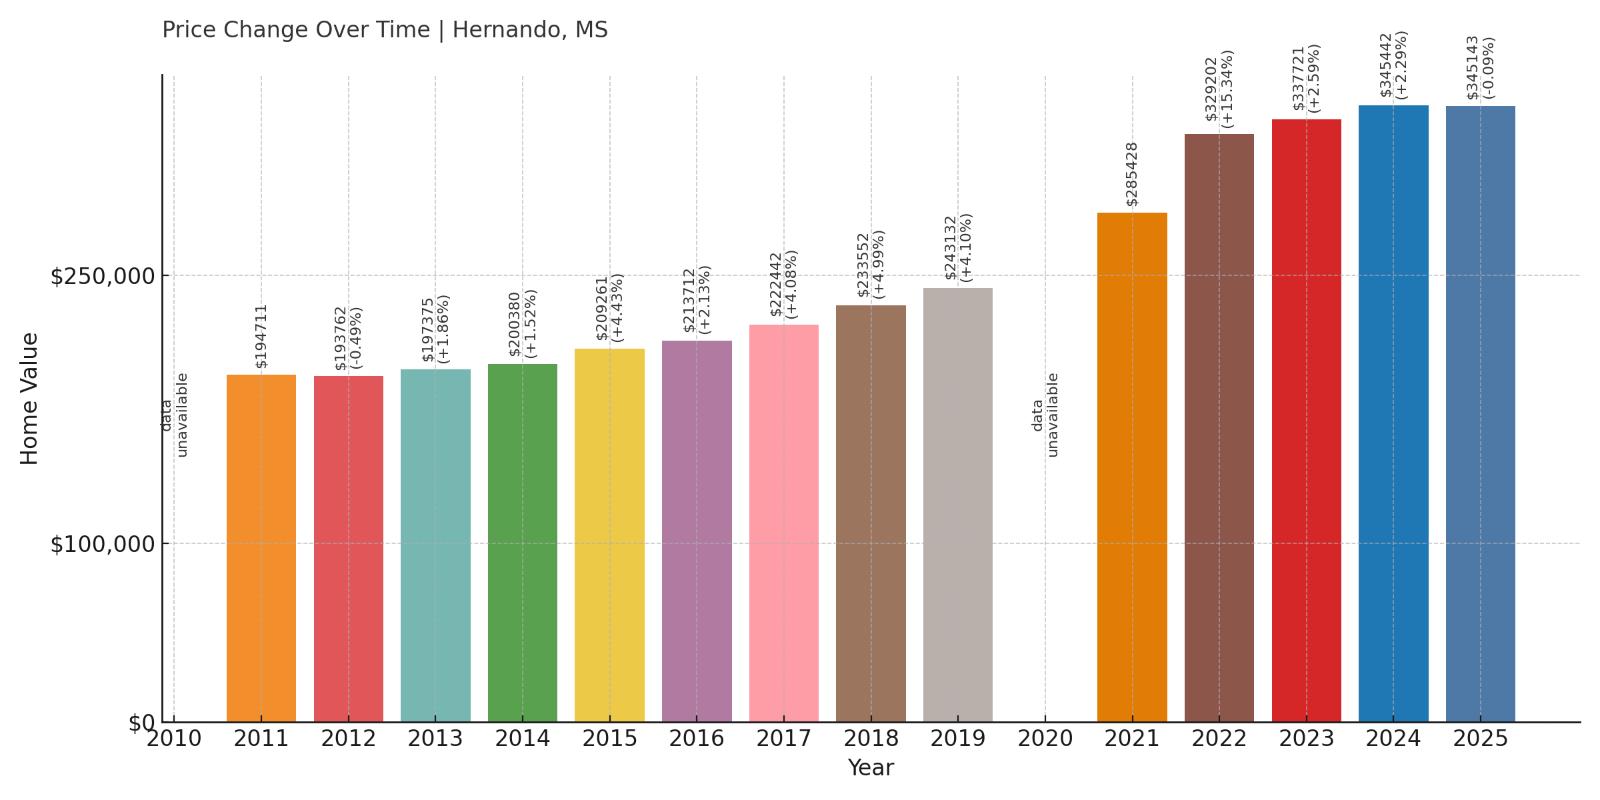
5. Hernando – 77% Home Price Increase Since 2011
🔥 Would you like to save this?
- 2010: N/A
- 2011: $194,711
- 2012: $193,762 (-$950, -0.49% from previous year)
- 2013: $197,375 (+$3,613, +1.86% from previous year)
- 2014: $200,380 (+$3,005, +1.52% from previous year)
- 2015: $209,261 (+$8,881, +4.43% from previous year)
- 2016: $213,712 (+$4,451, +2.13% from previous year)
- 2017: $222,442 (+$8,730, +4.08% from previous year)
- 2018: $233,552 (+$11,110, +4.99% from previous year)
- 2019: $243,132 (+$9,580, +4.10% from previous year)
- 2020: N/A
- 2021: $285,428 (+$42,296, +17.40% from previous year)
- 2022: $329,202 (+$43,774, +15.34% from previous year)
- 2023: $337,721 (+$8,519, +2.59% from previous year)
- 2024: $345,442 (+$7,722, +2.29% from previous year)
- 2025: $345,143 (-$300, -0.09% from previous year)
Hernando’s home values jumped from just under $195,000 in 2011 to over $345,000 in 2025—a rise of 77%. After more than a decade of strong but steady growth, the early 2020s brought steep increases, especially in 2021 and 2022. Prices have flattened out recently, but the town remains one of the priciest in Mississippi.
Hernando – Historic and In-Demand
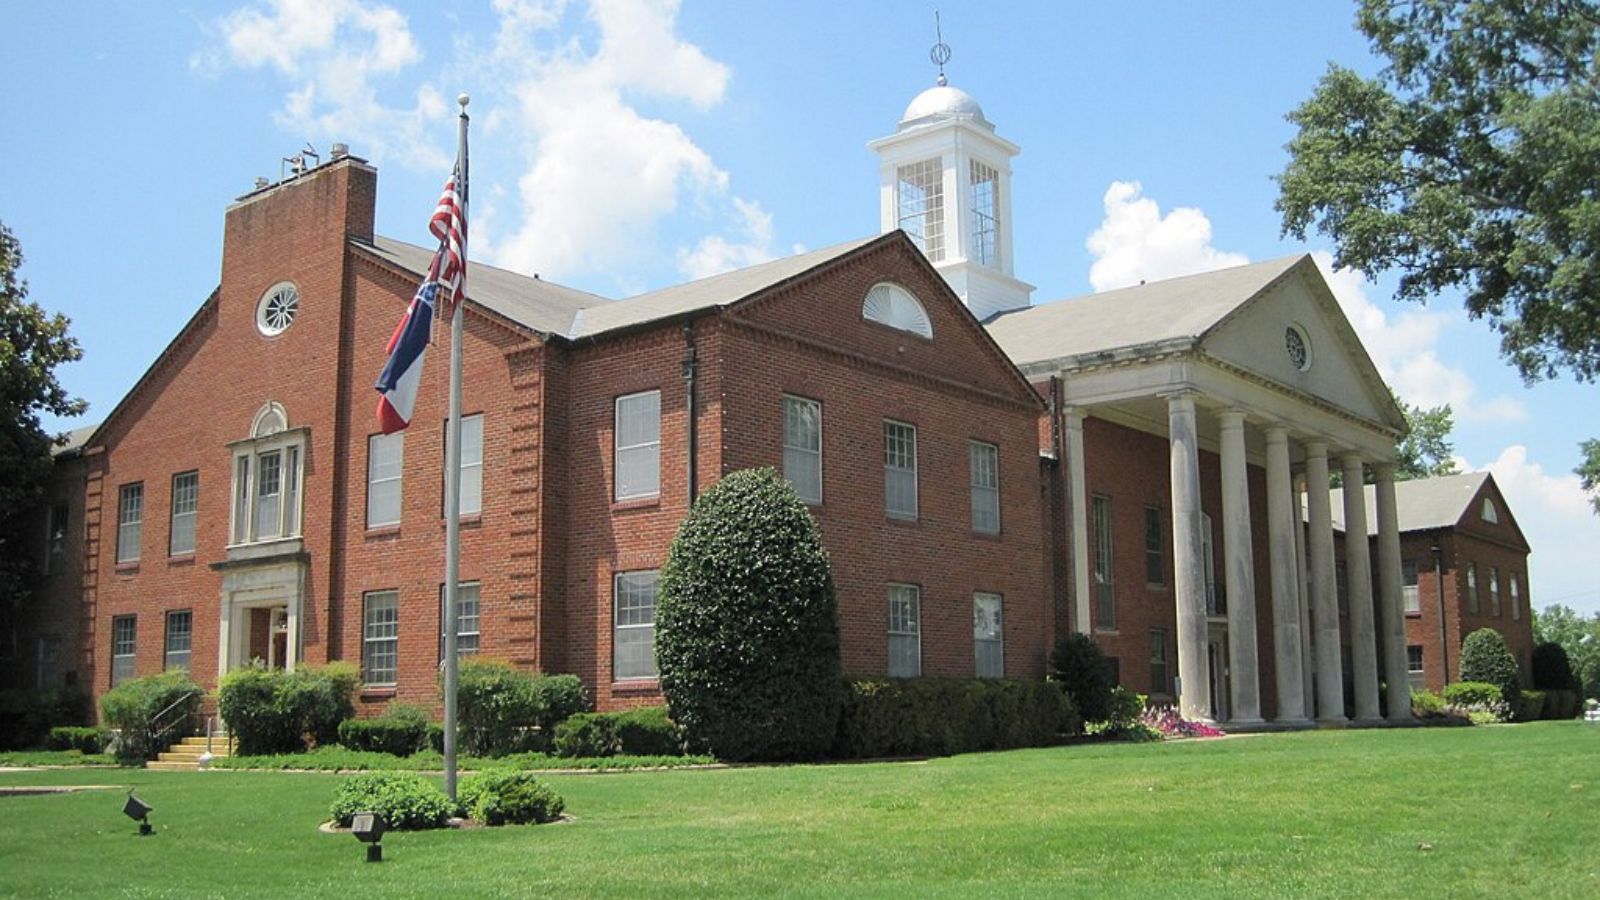
Hernando is a historic town in DeSoto County, popular for its courthouse square, community events, and access to top-rated schools. Though part of the greater Memphis metro area, it has its own identity and charm that continues to draw buyers from across the region.
Its real estate market reflects that desirability. Hernando has seen steady demand from professionals and families looking for safety, community, and space—all within commuting range of the city. That demand has kept home values consistently rising.
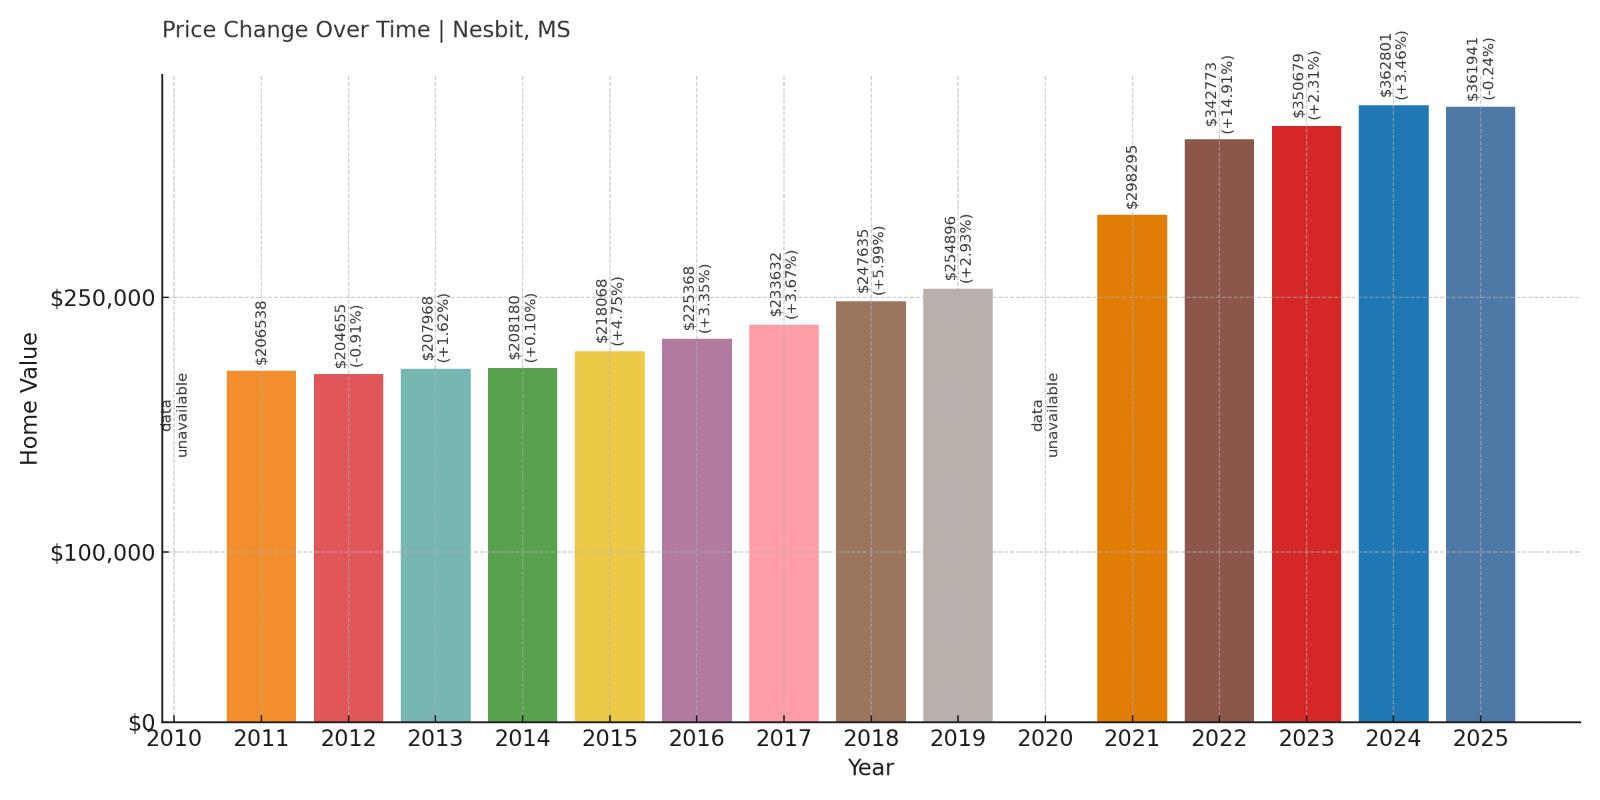
4. Nesbit – 75% Home Price Increase Since 2011
- 2010: N/A
- 2011: $206,538
- 2012: $204,655 (-$1,882, -0.91% from previous year)
- 2013: $207,968 (+$3,312, +1.62% from previous year)
- 2014: $208,180 (+$212, +0.10% from previous year)
- 2015: $218,068 (+$9,889, +4.75% from previous year)
- 2016: $225,368 (+$7,299, +3.35% from previous year)
- 2017: $233,632 (+$8,264, +3.67% from previous year)
- 2018: $247,635 (+$14,003, +5.99% from previous year)
- 2019: $254,896 (+$7,261, +2.93% from previous year)
- 2020: N/A
- 2021: $298,295 (+$43,399, +17.03% from previous year)
- 2022: $342,773 (+$44,478, +14.91% from previous year)
- 2023: $350,679 (+$7,906, +2.31% from previous year)
- 2024: $362,801 (+$12,122, +3.46% from previous year)
- 2025: $361,941 (-$861, -0.24% from previous year)
Home prices in Nesbit have climbed steadily over the last decade, jumping from around $206,000 in 2011 to nearly $362,000 by 2025. Much of the recent appreciation came in the early 2020s, particularly 2021 and 2022 when values soared by more than 30% combined. Growth has slowed since, but the long-term gain remains impressive.
Nesbit – Quiet Suburb With Rising Prices
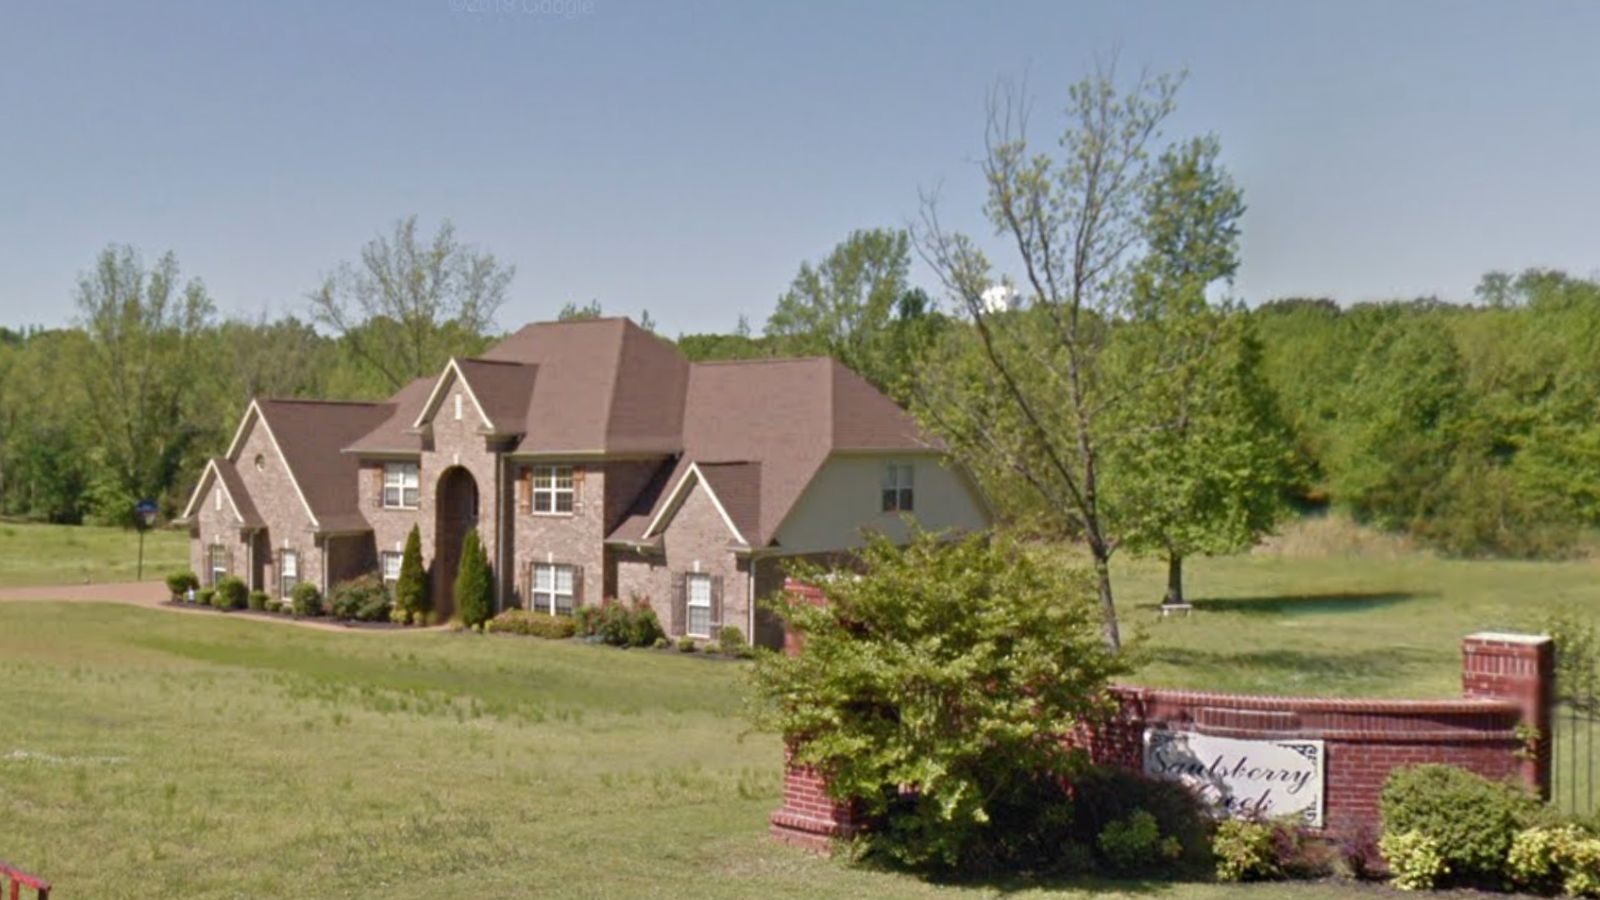
Part of DeSoto County and located south of Southaven, Nesbit offers larger lots, a slower pace, and a semi-rural feel while remaining close to urban amenities. It’s a top pick for families who want space and privacy without sacrificing access to shopping and schools.
Nesbit’s housing market has matured, with a mix of older homes and upscale new builds. Its growth reflects the broader surge in north Mississippi real estate, and even with a slight dip in 2025, the town remains one of the most expensive in the state.
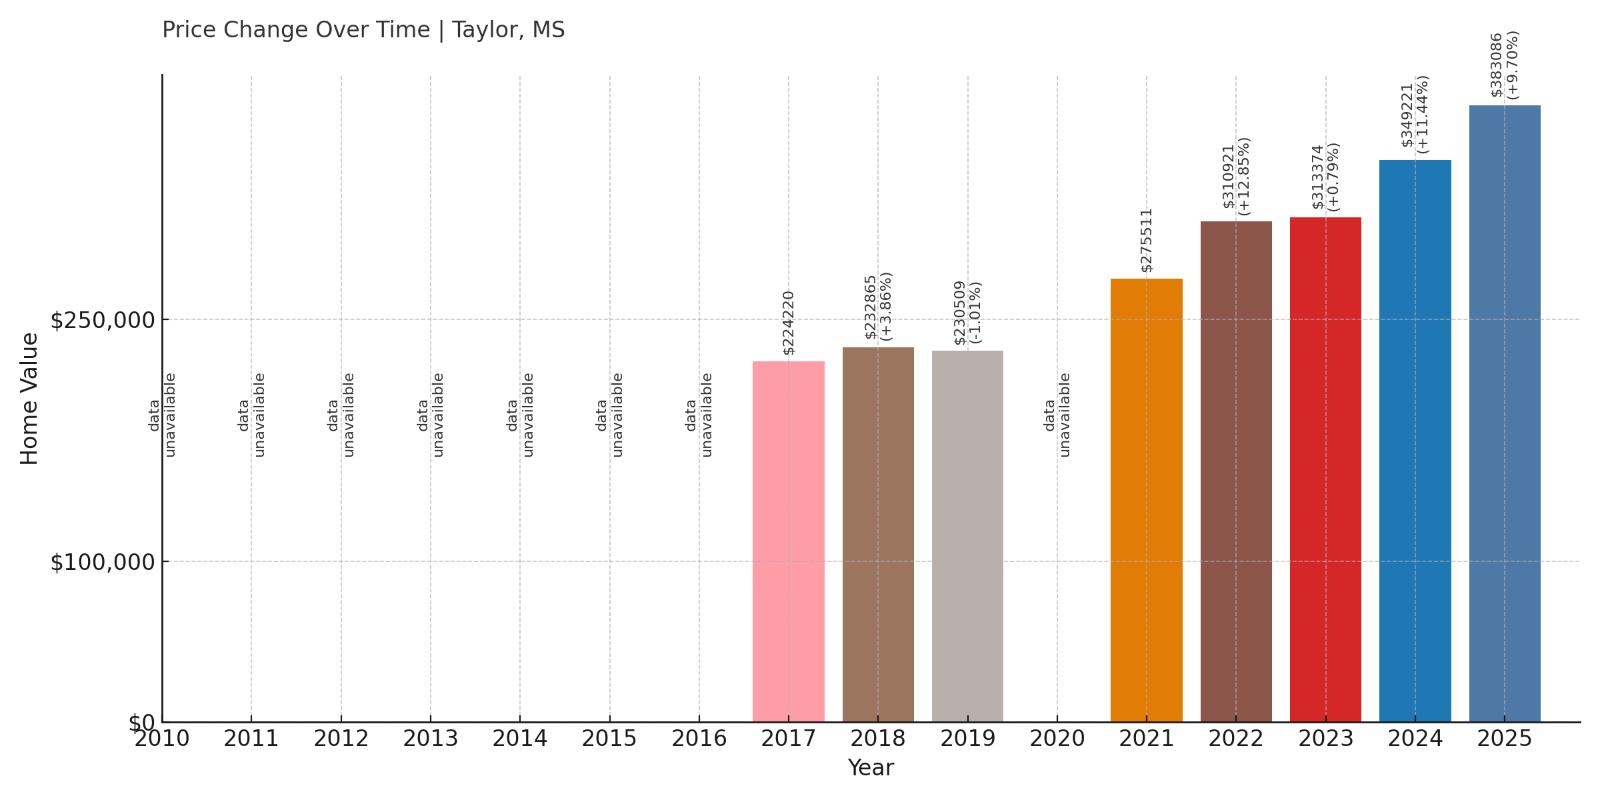
3. Taylor – 71% Home Price Increase Since 2017
- 2010: N/A
- 2011: N/A
- 2012: N/A
- 2013: N/A
- 2014: N/A
- 2015: N/A
- 2016: N/A
- 2017: $224,220
- 2018: $232,865 (+$8,645, +3.86% from previous year)
- 2019: $230,509 (-$2,356, -1.01% from previous year)
- 2020: N/A
- 2021: $275,511 (+$45,001, +19.52% from previous year)
- 2022: $310,921 (+$35,411, +12.85% from previous year)
- 2023: $313,374 (+$2,453, +0.79% from previous year)
- 2024: $349,221 (+$35,847, +11.44% from previous year)
- 2025: $383,086 (+$33,864, +9.70% from previous year)
Though Taylor’s housing data only begins in 2017, the growth since then has been steep. Prices have increased from $224,220 to $383,086—a 71% gain in just eight years. The biggest jumps came during the early 2020s, particularly 2021, 2022, and again in 2024.
Taylor – Tiny Town, Big Value
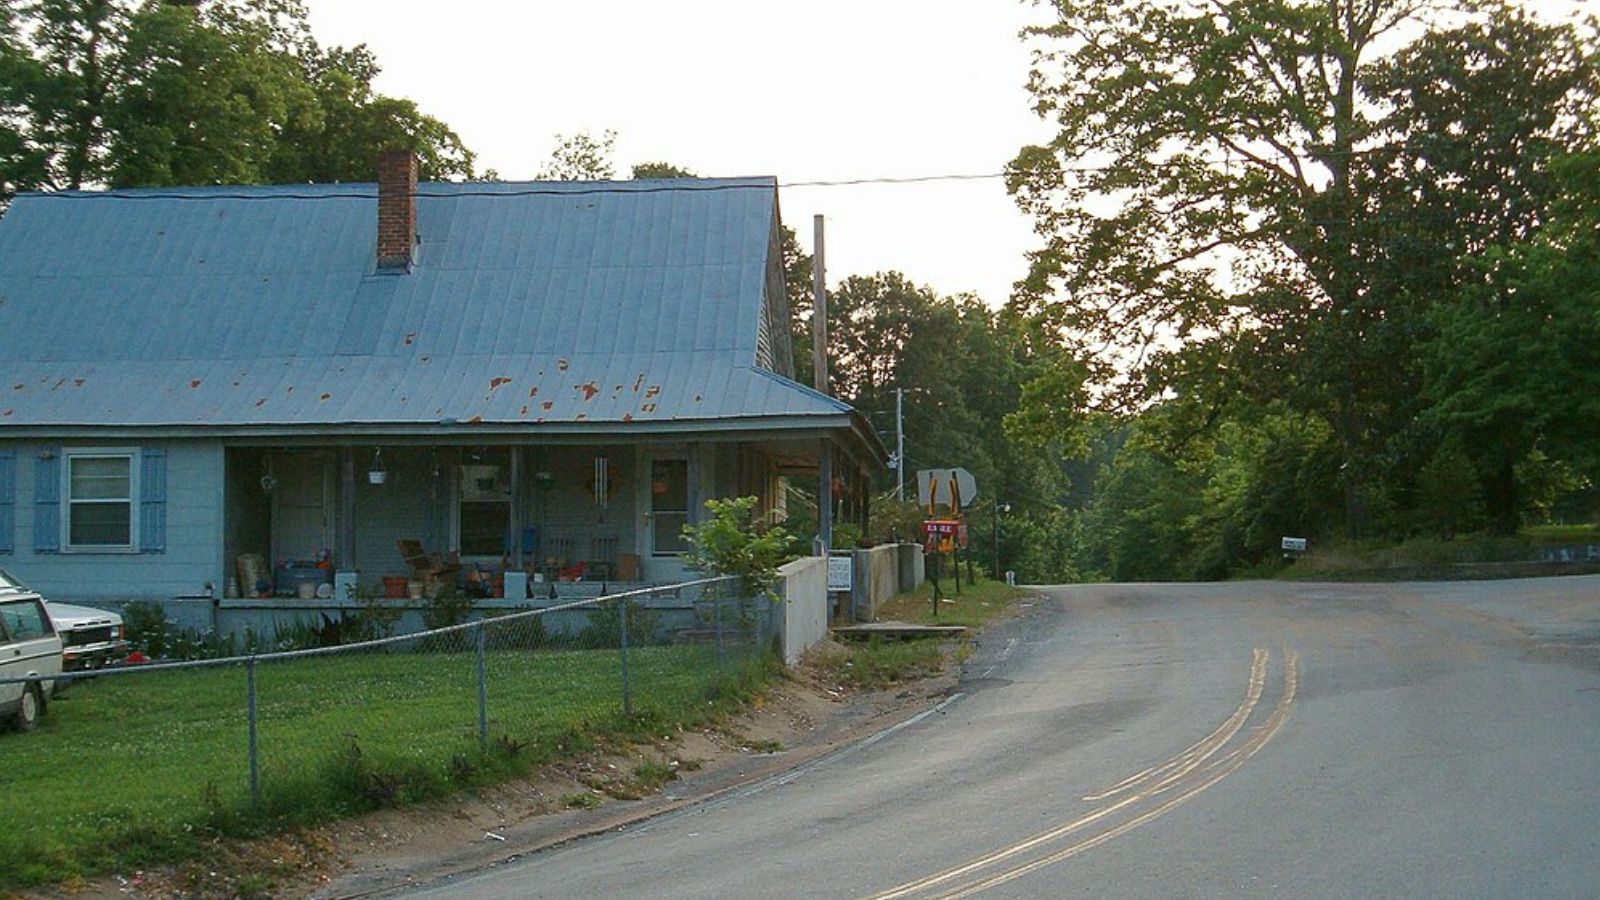
Located in Lafayette County just south of Oxford, Taylor is a small community with a reputation for arts, food, and peaceful living. While it has a modest population, its proximity to Oxford and the University of Mississippi has made it increasingly popular for those seeking space and privacy with access to college-town amenities.
Taylor’s limited housing stock combined with increased demand has pushed prices upward quickly. Its identity as a rural retreat for Oxford professionals and creatives has helped it become one of the priciest towns in the state.
2. Oxford – 105% Home Price Increase Since 2010
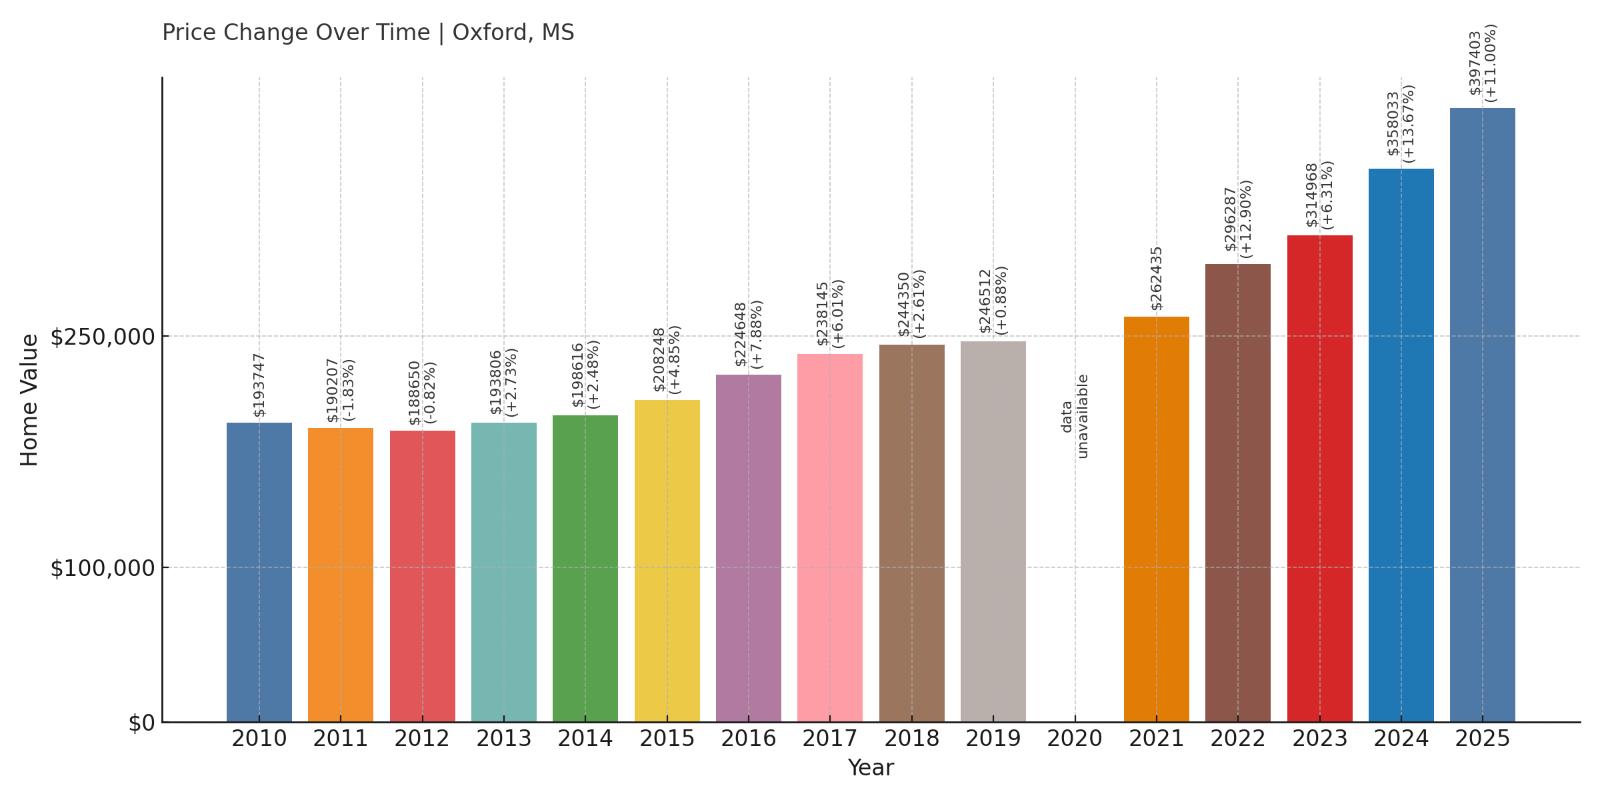
- 2010: $193,747
- 2011: $190,207 (-$3,540, -1.83% from previous year)
- 2012: $188,650 (-$1,557, -0.82% from previous year)
- 2013: $193,806 (+$5,156, +2.73% from previous year)
- 2014: $198,616 (+$4,810, +2.48% from previous year)
- 2015: $208,248 (+$9,632, +4.85% from previous year)
- 2016: $224,648 (+$16,400, +7.88% from previous year)
- 2017: $238,145 (+$13,497, +6.01% from previous year)
- 2018: $244,350 (+$6,205, +2.61% from previous year)
- 2019: $246,512 (+$2,162, +0.88% from previous year)
- 2020: N/A
- 2021: $262,435 (+$15,923, +6.46% from previous year)
- 2022: $296,287 (+$33,852, +12.90% from previous year)
- 2023: $314,968 (+$18,681, +6.30% from previous year)
- 2024: $358,033 (+$43,066, +13.67% from previous year)
- 2025: $397,403 (+$39,370, +11.00% from previous year)
Oxford’s home prices have more than doubled since 2010, rising from $193,747 to nearly $400,000. While values grew steadily through the 2010s, the post-2020 years brought especially sharp gains, including a $43,000 jump in 2024 alone. As of 2025, Oxford ranks as the second most expensive housing market in Mississippi.
Oxford – A Destination for Education and Culture
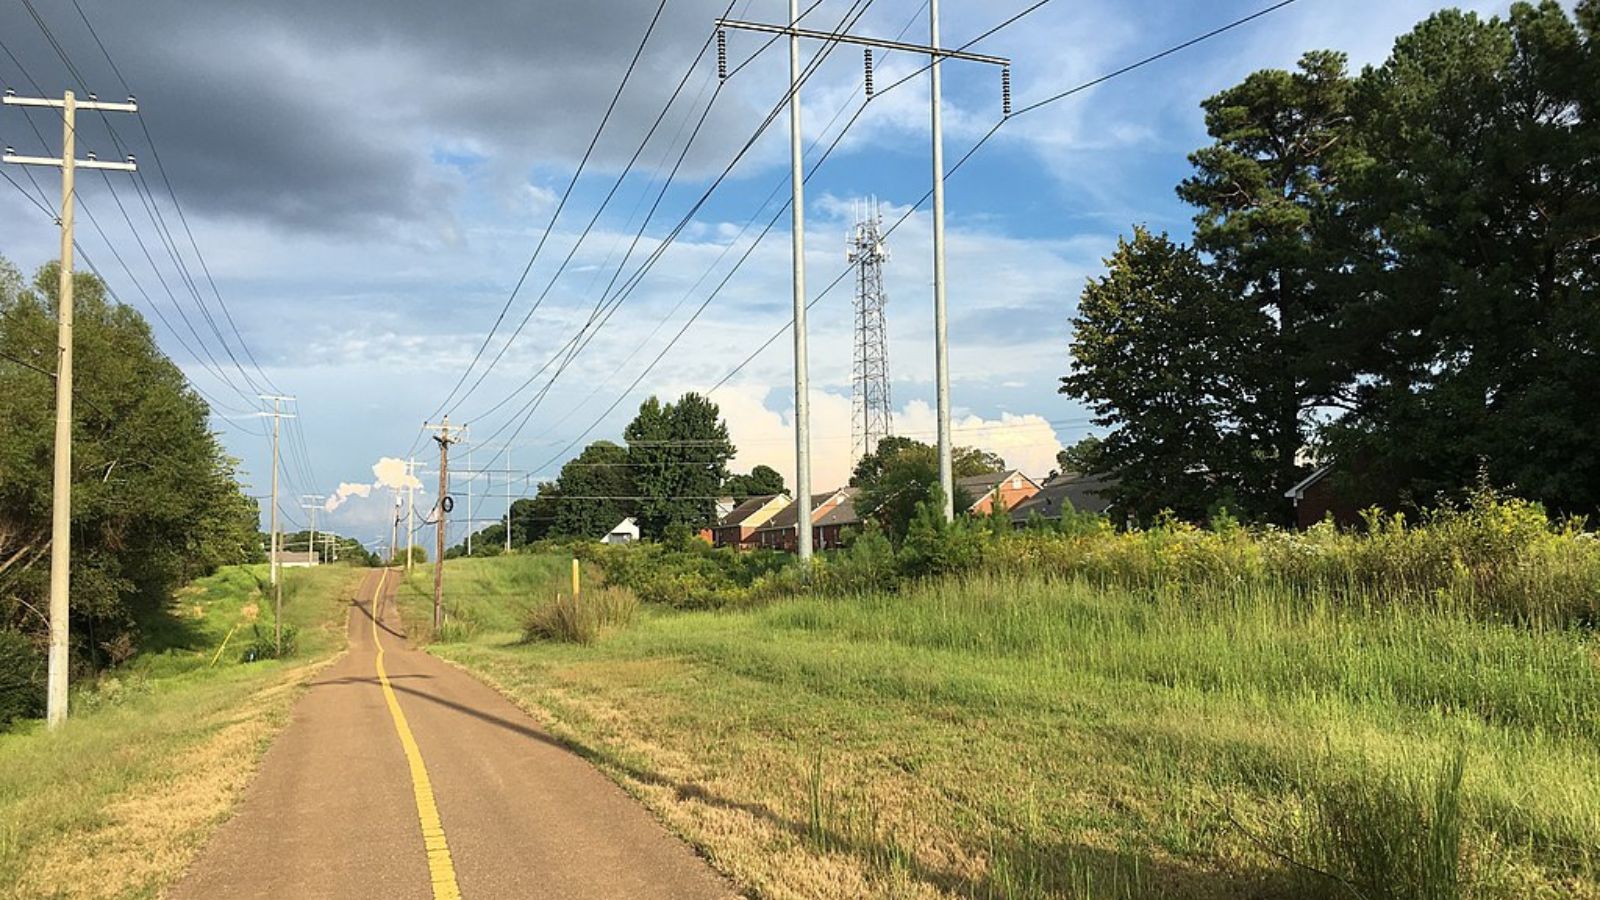
Home to the University of Mississippi, Oxford is the state’s best-known college town and one of its most culturally vibrant communities. With a celebrated literary history, strong public schools, and an active arts and dining scene, Oxford attracts buyers well beyond state lines.
Its real estate market has been bolstered by steady growth, new construction, and demand from faculty, alumni, and retirees. With limited space and rising costs, home prices have accelerated, making Oxford one of the hottest and most expensive places to buy in the state.
1. Madison – 49% Home Price Increase Since 2010
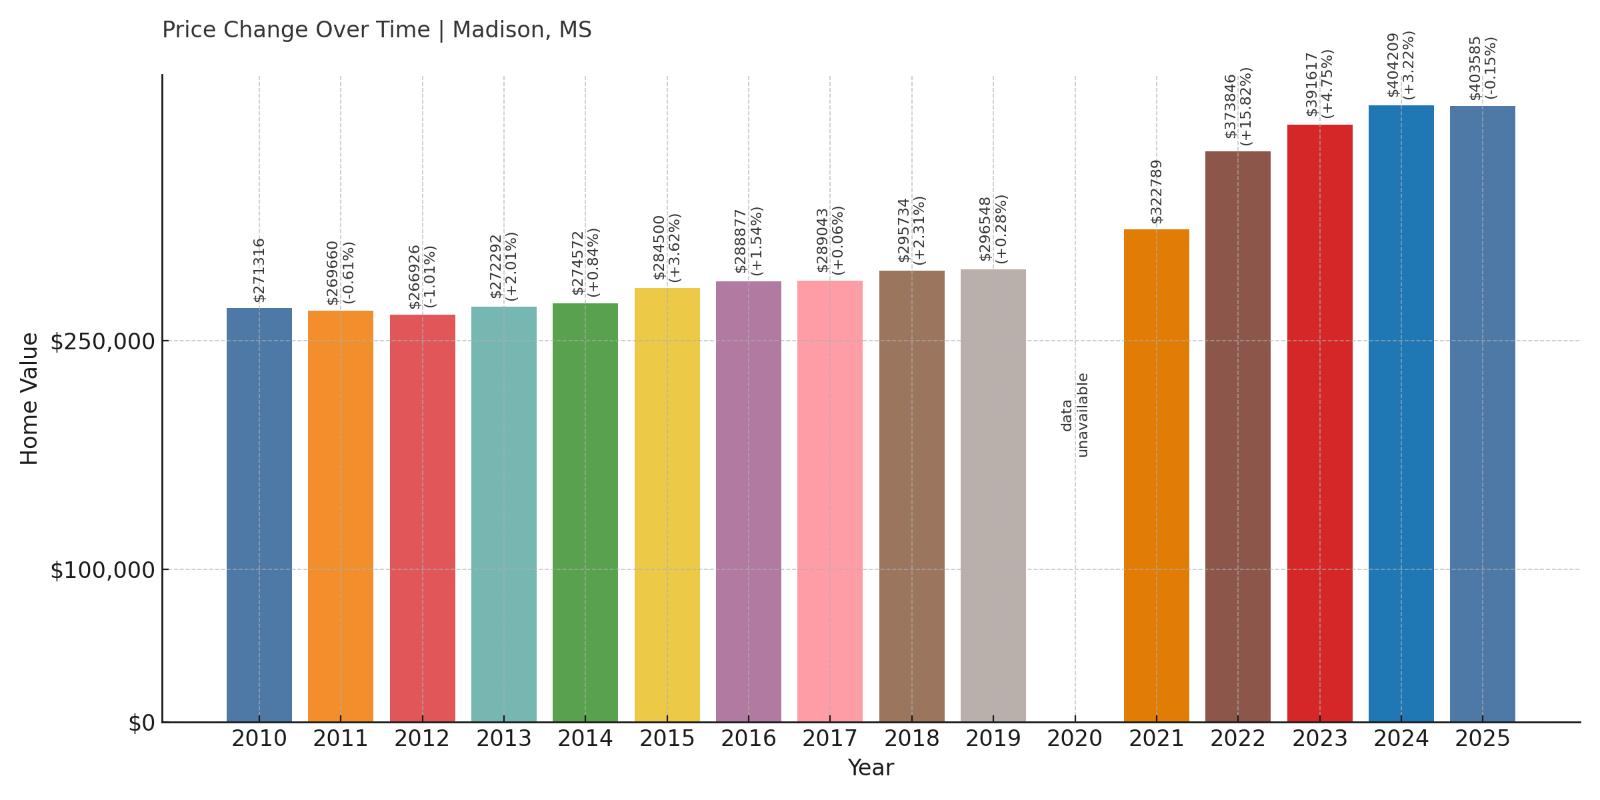
- 2010: $271,316
- 2011: $269,660 (-$1,655, -0.61% from previous year)
- 2012: $266,926 (-$2,734, -1.01% from previous year)
- 2013: $272,292 (+$5,366, +2.01% from previous year)
- 2014: $274,572 (+$2,279, +0.84% from previous year)
- 2015: $284,500 (+$9,929, +3.62% from previous year)
- 2016: $288,877 (+$4,376, +1.54% from previous year)
- 2017: $289,043 (+$166, +0.06% from previous year)
- 2018: $295,734 (+$6,691, +2.31% from previous year)
- 2019: $296,548 (+$815, +0.28% from previous year)
- 2020: N/A
- 2021: $322,789 (+$26,241, +8.85% from previous year)
- 2022: $373,846 (+$51,057, +15.82% from previous year)
- 2023: $391,617 (+$17,772, +4.75% from previous year)
- 2024: $404,209 (+$12,592, +3.22% from previous year)
- 2025: $403,585 (-$624, -0.15% from previous year)
Madison leads the state with the highest median home price in 2025 at just over $403,000. While its rate of growth has been slower than others on this list, the city has maintained high values consistently over the last 15 years. Even with a slight dip in 2025, Madison remains the most expensive housing market in Mississippi.
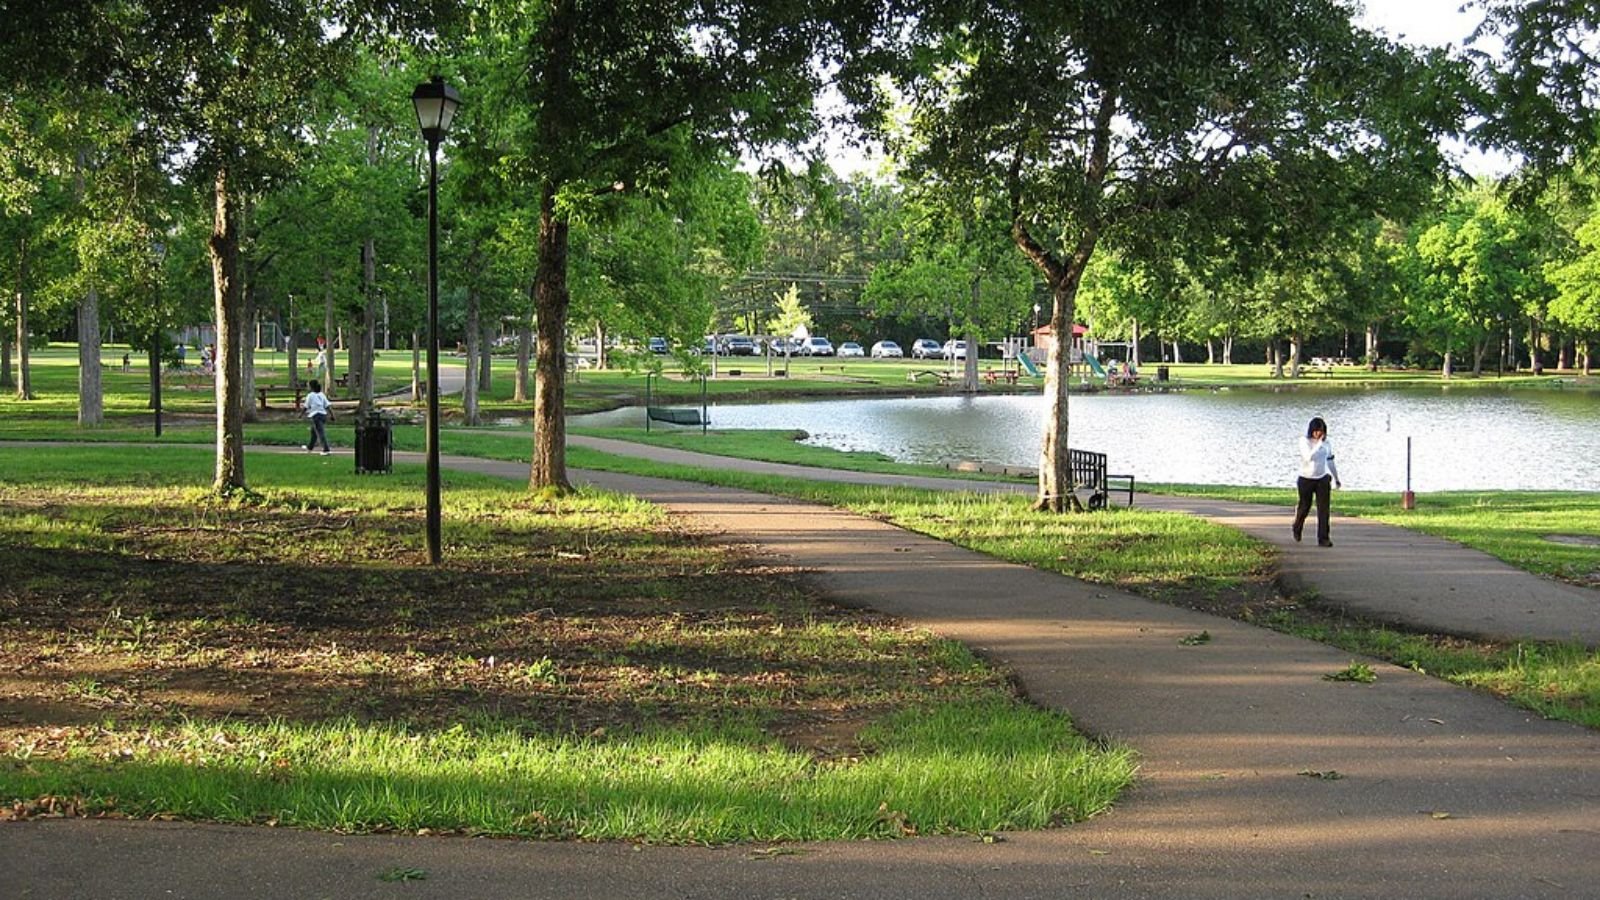
Madison – High-Value Homes, Long-Term Stability
🔥 Would you like to save this?
Located just north of Jackson, Madison is known for its excellent schools, manicured neighborhoods, and high quality of life. It’s long been one of Mississippi’s most sought-after places to live, especially for professionals and families seeking safety, education, and attractive homes.
Madison hasn’t needed dramatic jumps to stay on top—it’s relied on consistency, careful development, and sustained demand. That reliability is exactly what’s kept prices high and stable, even through recent market shifts.


