🔥 Would you like to save this?
Home prices in Michigan’s top towns have climbed to record highs in 2025, and the Zillow Home Value Index shows just how steep the rise has been. From waterfront hideaways to fast-growing suburbs, these 15 places now stand out with median values far above the state average. Each one reflects growing demand, tight supply, and the changing ways people choose where to live—whether it’s retirees chasing views or remote workers reshaping old patterns.
15. Suttons Bay – 136% Home Price Increase Since 2011
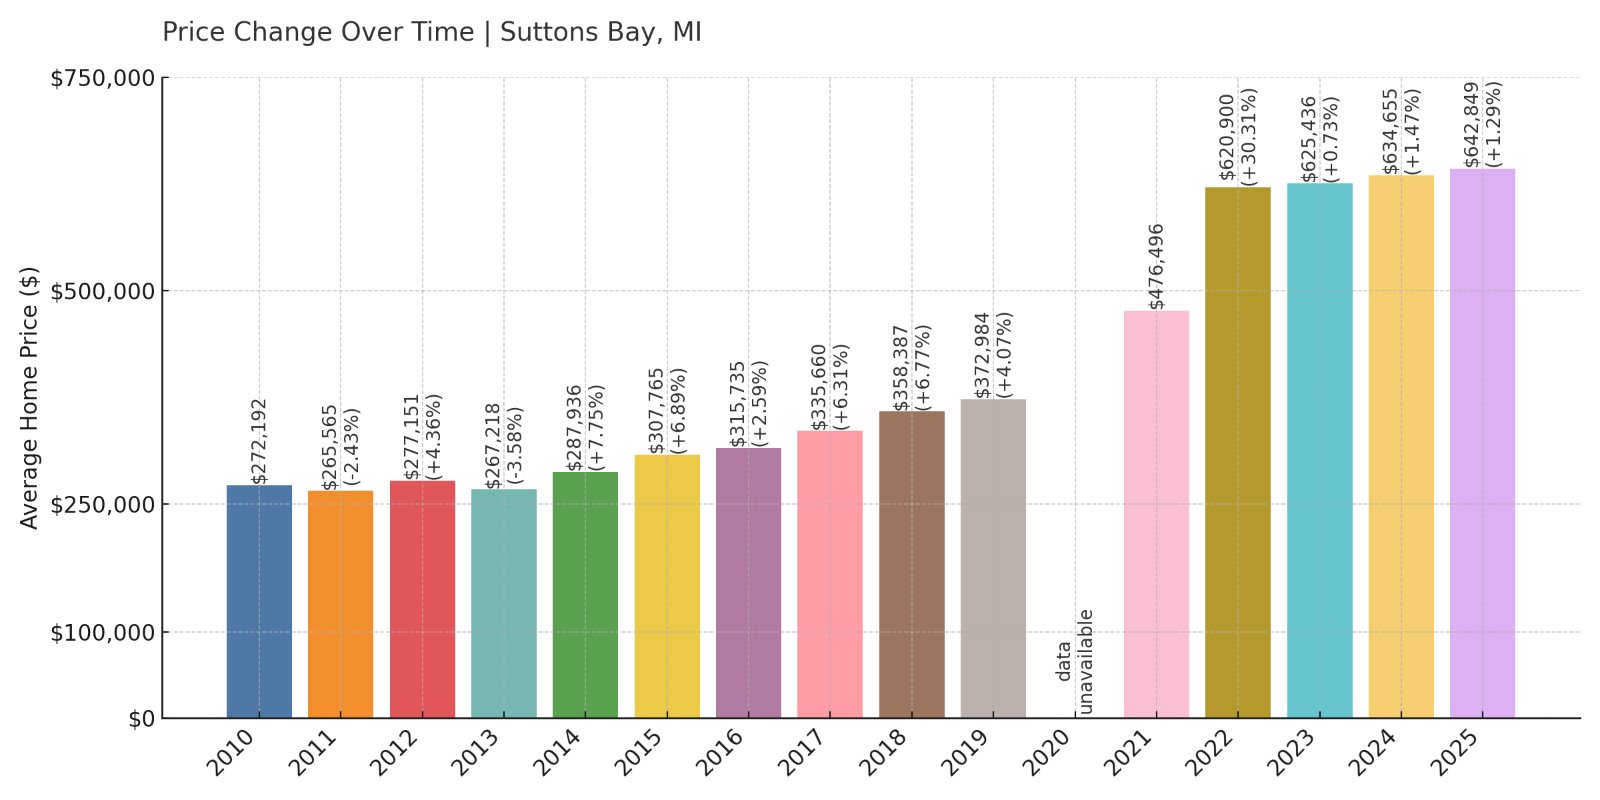
- 2010: $272,192
- 2011: $265,565 (-$6,627, -2.43% from previous year)
- 2012: $277,151 (+$11,586, +4.36% from previous year)
- 2013: $267,218 (-$9,933, -3.58% from previous year)
- 2014: $287,936 (+$20,718, +7.75% from previous year)
- 2015: $307,765 (+$19,829, +6.89% from previous year)
- 2016: $315,735 (+$7,969, +2.59% from previous year)
- 2017: $335,660 (+$19,925, +6.31% from previous year)
- 2018: $358,387 (+$22,727, +6.77% from previous year)
- 2019: $372,984 (+$14,598, +4.07% from previous year)
- 2020: N/A
- 2021: $476,496
- 2022: $620,900 (+$144,404, +30.31% from previous year)
- 2023: $625,436 (+$4,536, +0.73% from previous year)
- 2024: $634,655 (+$9,219, +1.47% from previous year)
- 2025: $642,849 (+$8,194, +1.29% from previous year)
Since 2011, Suttons Bay has seen home values rise by over 136%, climbing from around $265,000 to more than $642,000 in 2025. The most striking jump occurred in 2022, when prices leapt over 30% in just one year. Though the pace has slowed, the upward trend has continued steadily into 2025.
In order to come up with the very specific design ideas, we create most designs with the assistance of state-of-the-art AI interior design software. Also, assume links that take you off the site are affiliate links such as links to Amazon. this means we may earn a commission if you buy something.
Suttons Bay – A Lakeside Favorite in Northwest Michigan
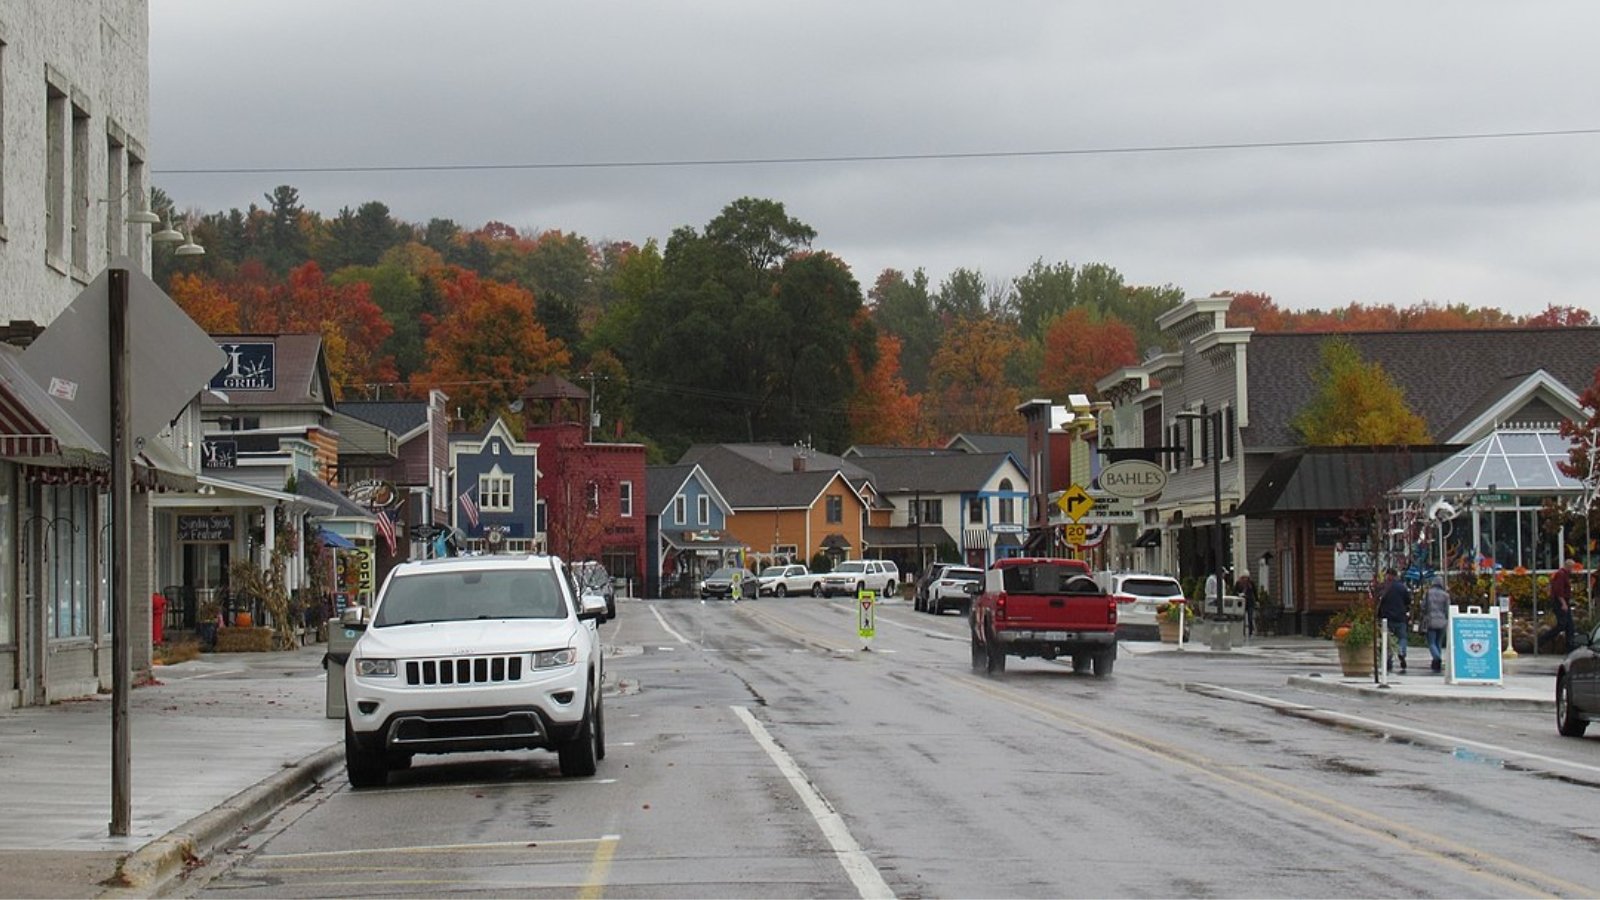
Nestled along the shore of Grand Traverse Bay, Suttons Bay is a scenic community in Leelanau County. Known for its boutique shops, art galleries, and walkable downtown, it appeals to retirees, vacation home seekers, and wine-country tourists alike. Its charm and shoreline proximity have long made it a sought-after location.
The 2022 home price surge likely reflects an influx of remote workers and second-home buyers reevaluating where—and how—they want to live. With limited inventory and persistent demand, prices remain high. As of 2025, the average home value is above $640,000, well beyond the state average.
14. East Grand Rapids – 170% Home Price Increase Since 2011
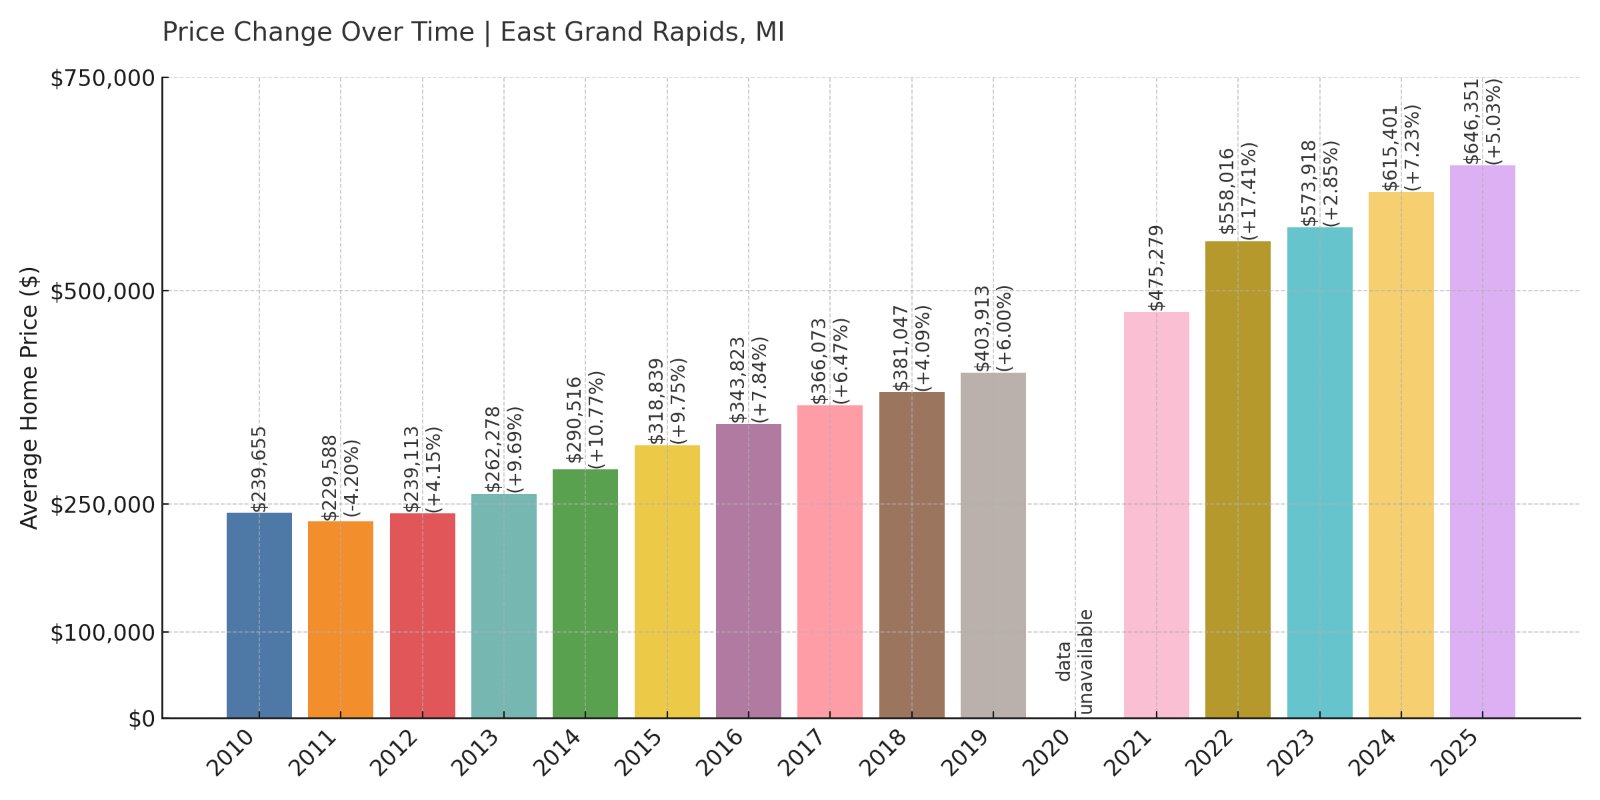
- 2010: $239,655
- 2011: $229,588 (-$10,067, -4.20% from previous year)
- 2012: $239,113 (+$9,525, +4.15% from previous year)
- 2013: $262,278 (+$23,165, +9.69% from previous year)
- 2014: $290,516 (+$28,239, +10.77% from previous year)
- 2015: $318,839 (+$28,323, +9.75% from previous year)
- 2016: $343,823 (+$24,984, +7.84% from previous year)
- 2017: $366,073 (+$22,250, +6.47% from previous year)
- 2018: $381,047 (+$14,974, +4.09% from previous year)
- 2019: $403,913 (+$22,866, +6.00% from previous year)
- 2020: N/A
- 2021: $475,279
- 2022: $558,016 (+$82,737, +17.41% from previous year)
- 2023: $573,918 (+$15,902, +2.85% from previous year)
- 2024: $615,401 (+$41,483, +7.23% from previous year)
- 2025: $646,351 (+$30,950, +5.03% from previous year)
East Grand Rapids has more than doubled its home prices since 2011, growing 170% from $229,588 to $646,351 in 2025. The rapid gains in 2021 and 2022 accelerated this trend, with values jumping by more than $140,000 in those two years alone.
East Grand Rapids – A Prestigious Enclave Near Downtown
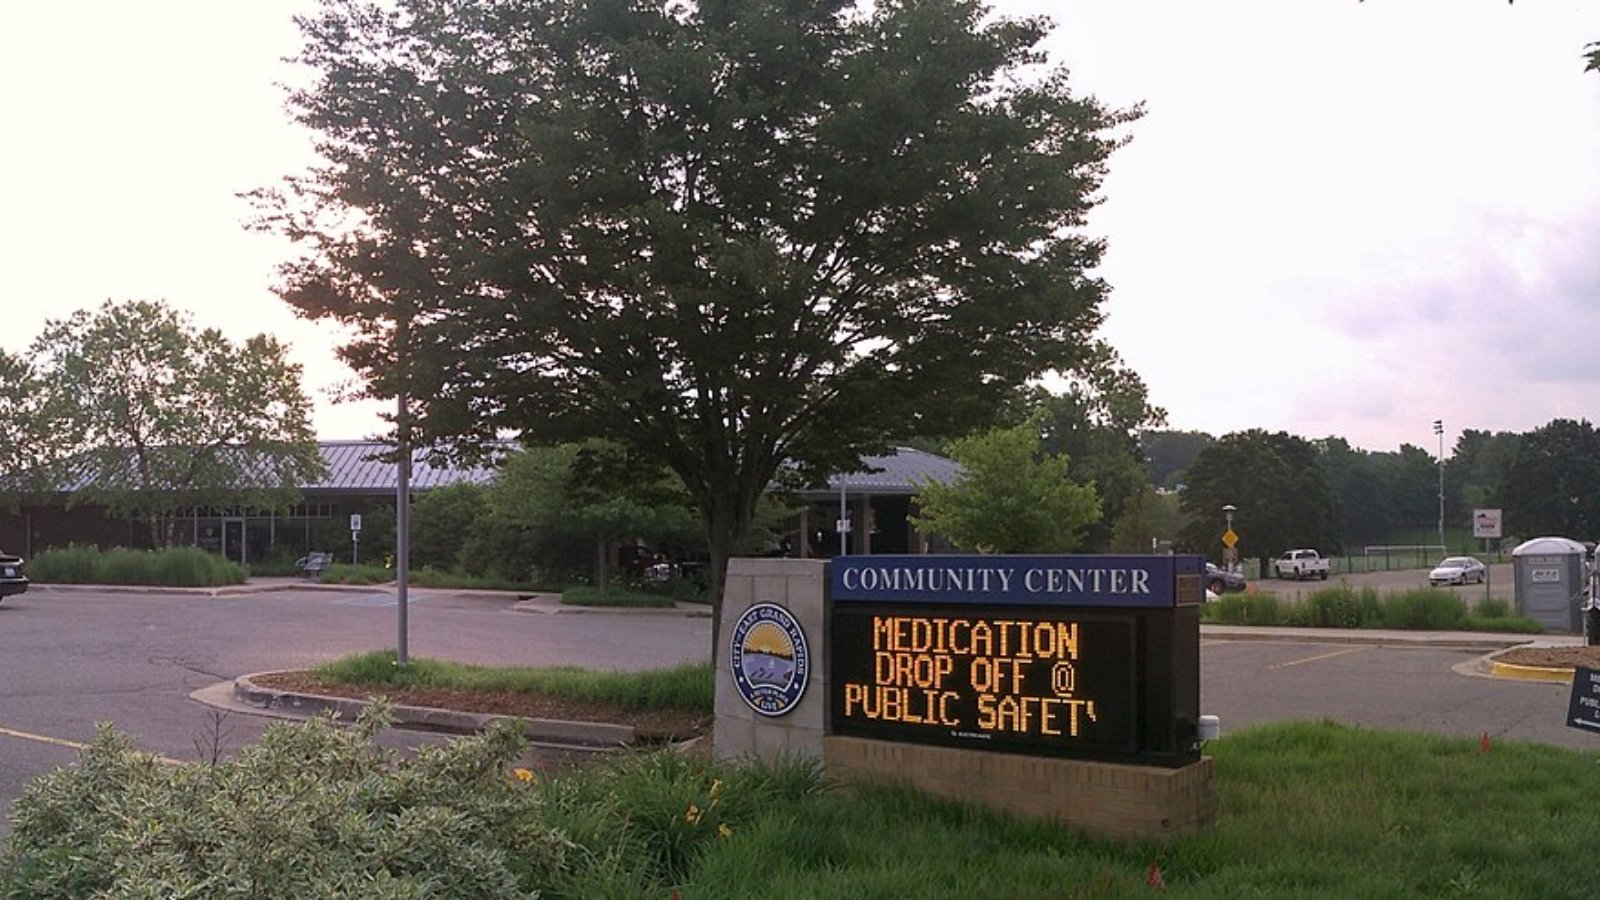
Just outside of Grand Rapids, this historic suburb is known for its elite schools, charming homes, and scenic Reeds Lake. With tree-lined streets and classic architecture, it’s been a top destination for families looking to stay close to the city without sacrificing charm or convenience.
The dramatic rise in home values likely reflects not only demand but East Grand Rapids’ limited housing supply and desirable amenities. With median home prices now north of $640,000, affordability is shrinking even as interest in the area continues to grow.
13. Douglas – 132% Home Price Increase Since 2012
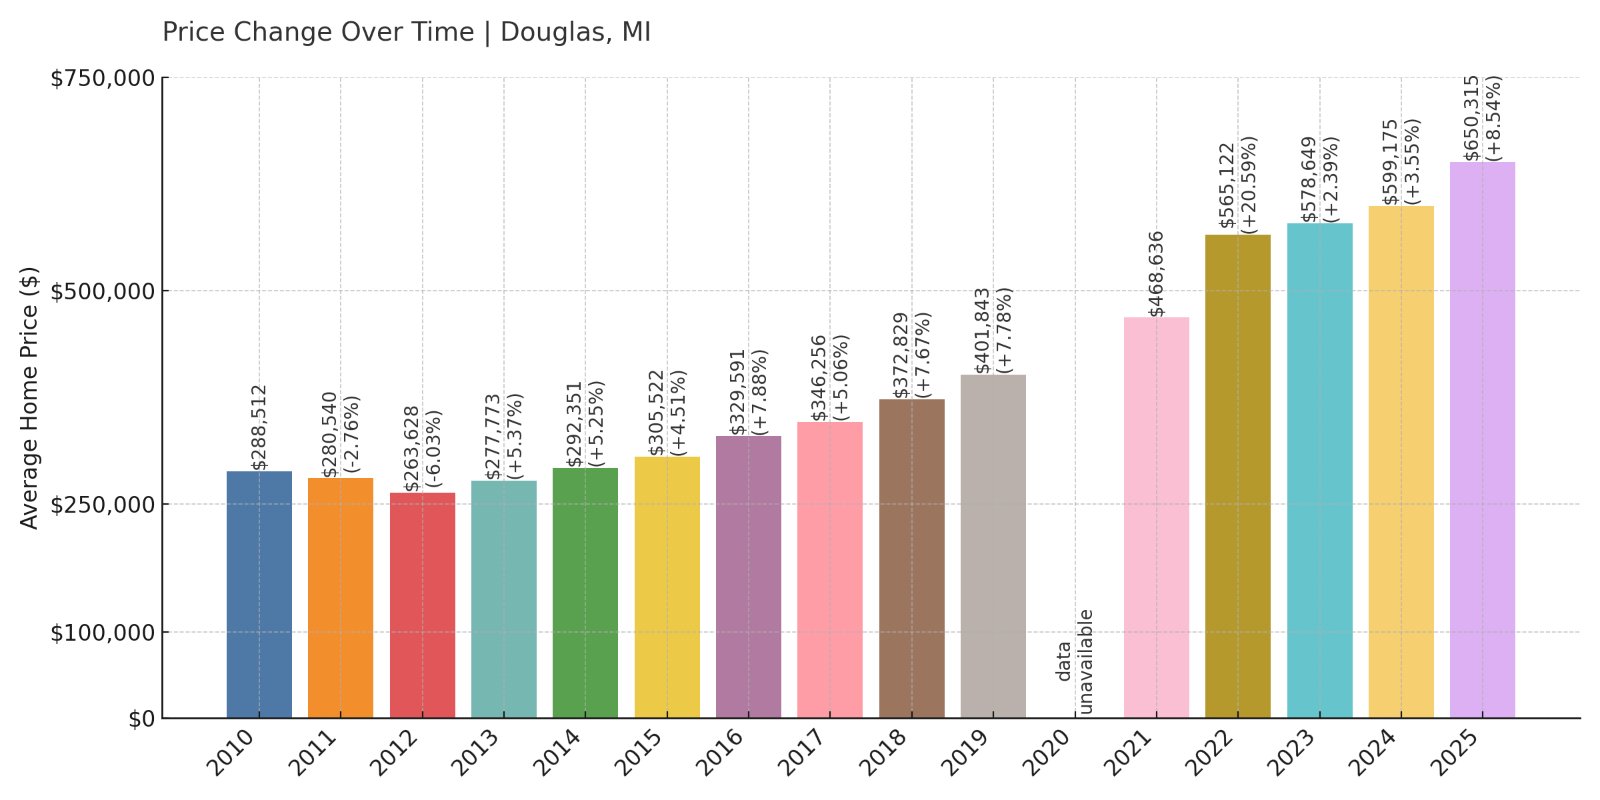
- 2010: $288,512
- 2011: $280,540 (-$7,971, -2.76% from previous year)
- 2012: $263,628 (-$16,913, -6.03% from previous year)
- 2013: $277,773 (+$14,146, +5.37% from previous year)
- 2014: $292,351 (+$14,578, +5.25% from previous year)
- 2015: $305,522 (+$13,171, +4.51% from previous year)
- 2016: $329,591 (+$24,069, +7.88% from previous year)
- 2017: $346,256 (+$16,665, +5.06% from previous year)
- 2018: $372,829 (+$26,573, +7.67% from previous year)
- 2019: $401,843 (+$29,014, +7.78% from previous year)
- 2020: N/A
- 2021: $468,636
- 2022: $565,122 (+$96,486, +20.59% from previous year)
- 2023: $578,649 (+$13,527, +2.39% from previous year)
- 2024: $599,175 (+$20,526, +3.55% from previous year)
- 2025: $650,315 (+$51,139, +8.53% from previous year)
Douglas home prices have climbed over 130% since 2012, from just over $263,000 to more than $650,000 today. Growth has been remarkably steady, with big leaps in 2021 and 2022 and another solid bump in 2025.
Douglas – A Cultural and Coastal Magnet
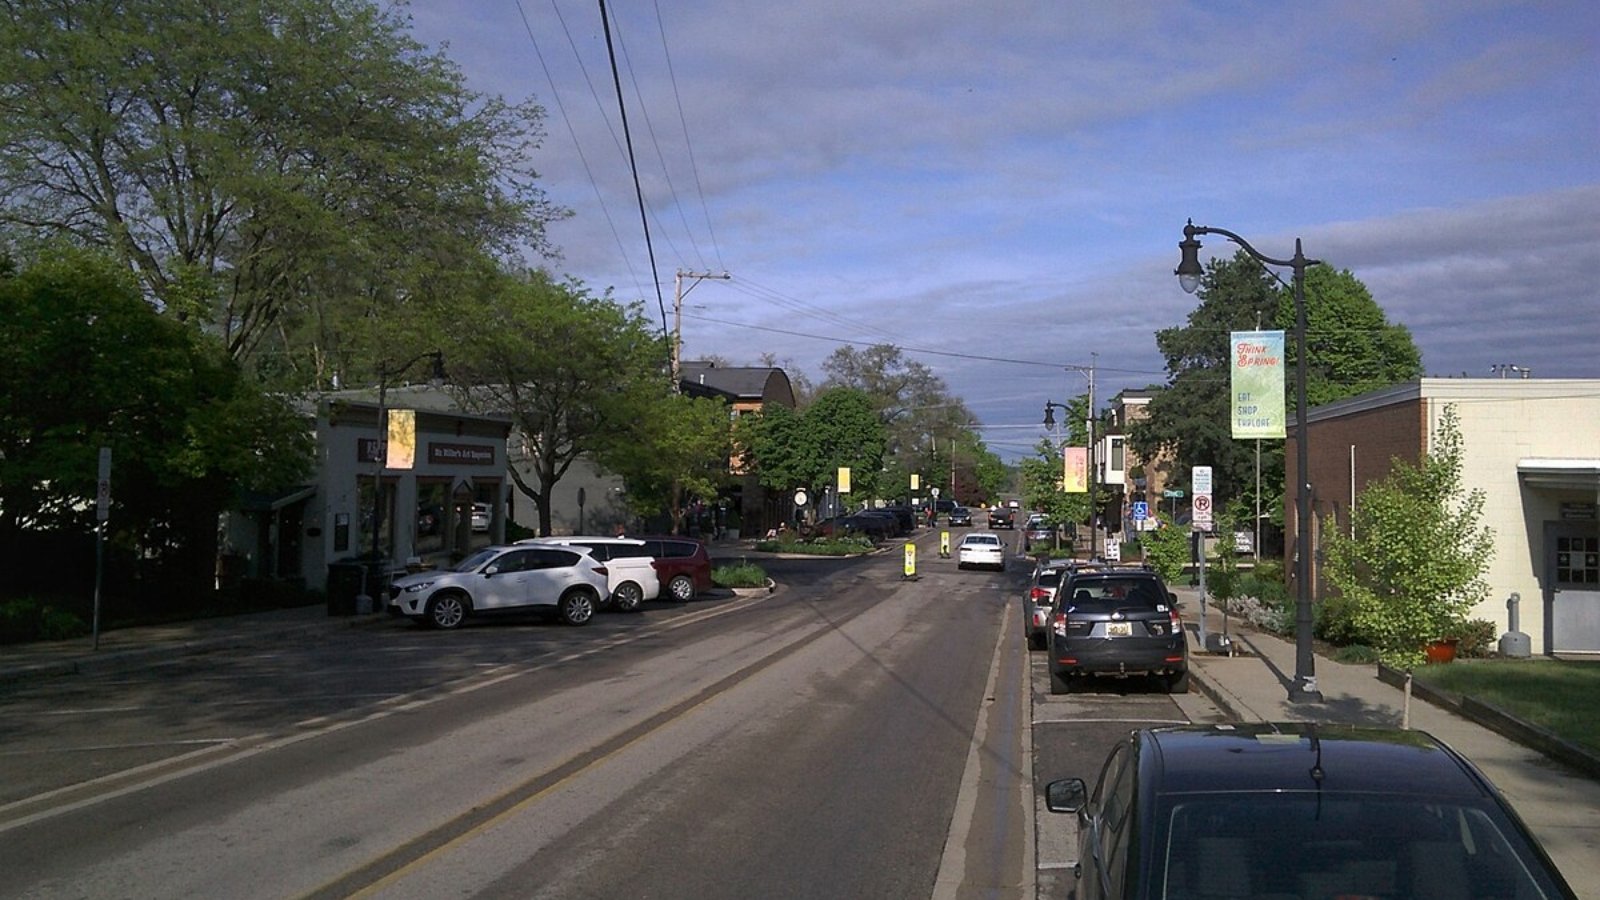
Located along the Lake Michigan shoreline near Saugatuck, Douglas offers a mix of natural beauty, art galleries, and walkable neighborhoods. It draws tourists and seasonal residents, which has added demand and driven prices higher over time.
The town’s price trajectory is shaped by consistent investment in the area, a lively tourism economy, and limited space for development. With prices still rising in 2025, it remains one of the most sought-after communities in western Michigan.
12. Harbert – 102% Home Price Increase Since 2014
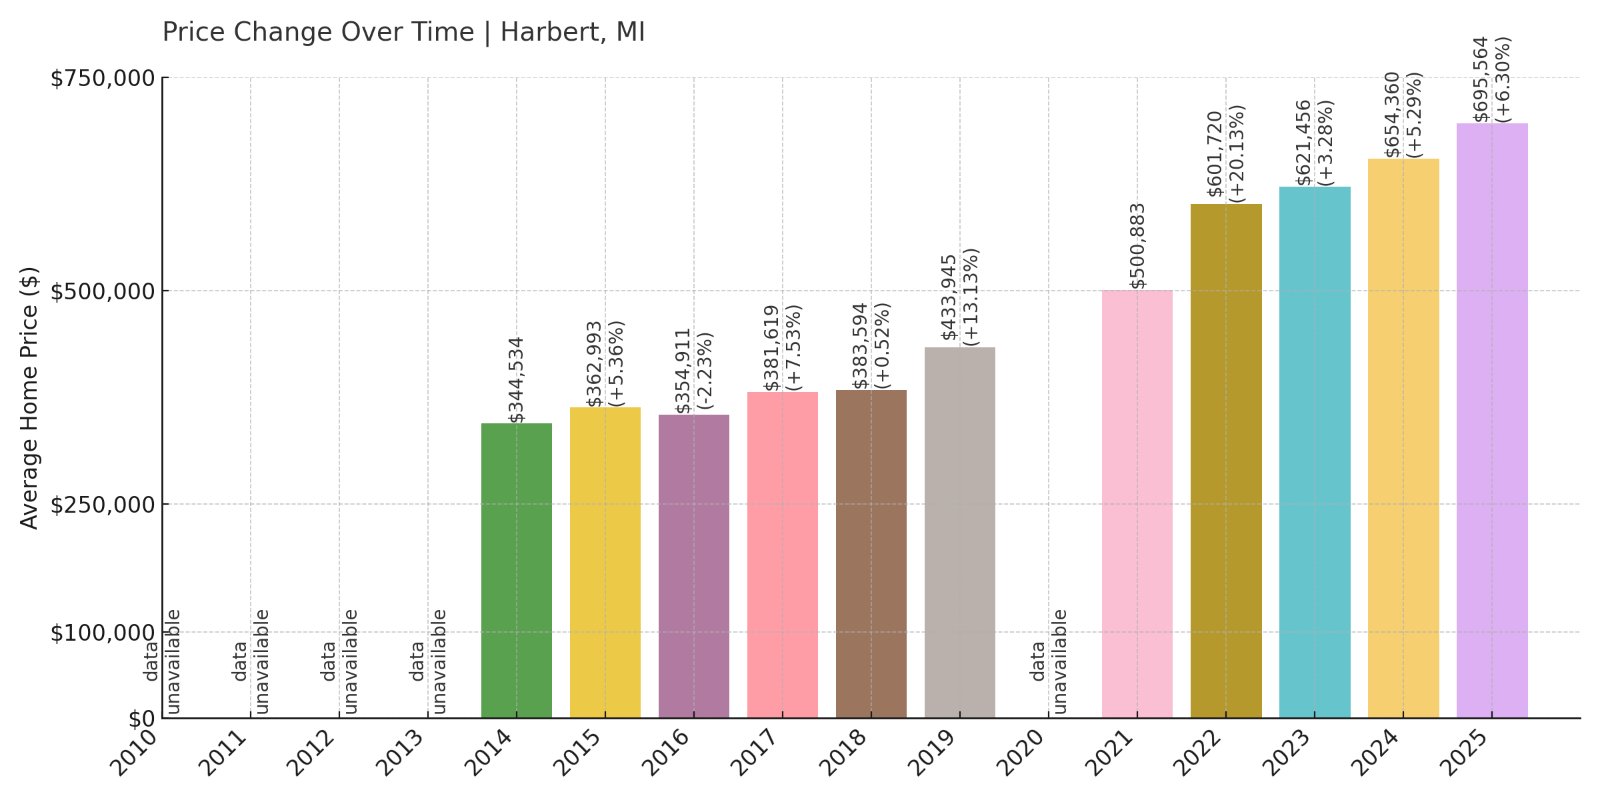
- 2010: N/A
- 2011: N/A
- 2012: N/A
- 2013: N/A
- 2014: $344,534
- 2015: $362,993 (+$18,459, +5.36% from previous year)
- 2016: $354,911 (-$8,082, -2.23% from previous year)
- 2017: $381,619 (+$26,708, +7.53% from previous year)
- 2018: $383,594 (+$1,975, +0.52% from previous year)
- 2019: $433,945 (+$50,352, +13.13% from previous year)
- 2020: N/A
- 2021: $500,883
- 2022: $601,720 (+$100,837, +20.13% from previous year)
- 2023: $621,456 (+$19,736, +3.28% from previous year)
- 2024: $654,360 (+$32,904, +5.29% from previous year)
- 2025: $695,564 (+$41,204, +6.30% from previous year)
In just over a decade, Harbert has seen prices surge from $344,534 in 2014 to nearly $696,000 in 2025. The biggest leap occurred in 2022, with values jumping by more than $100,000 in one year.
Harbert – Small Town, Big Growth on the Shoreline
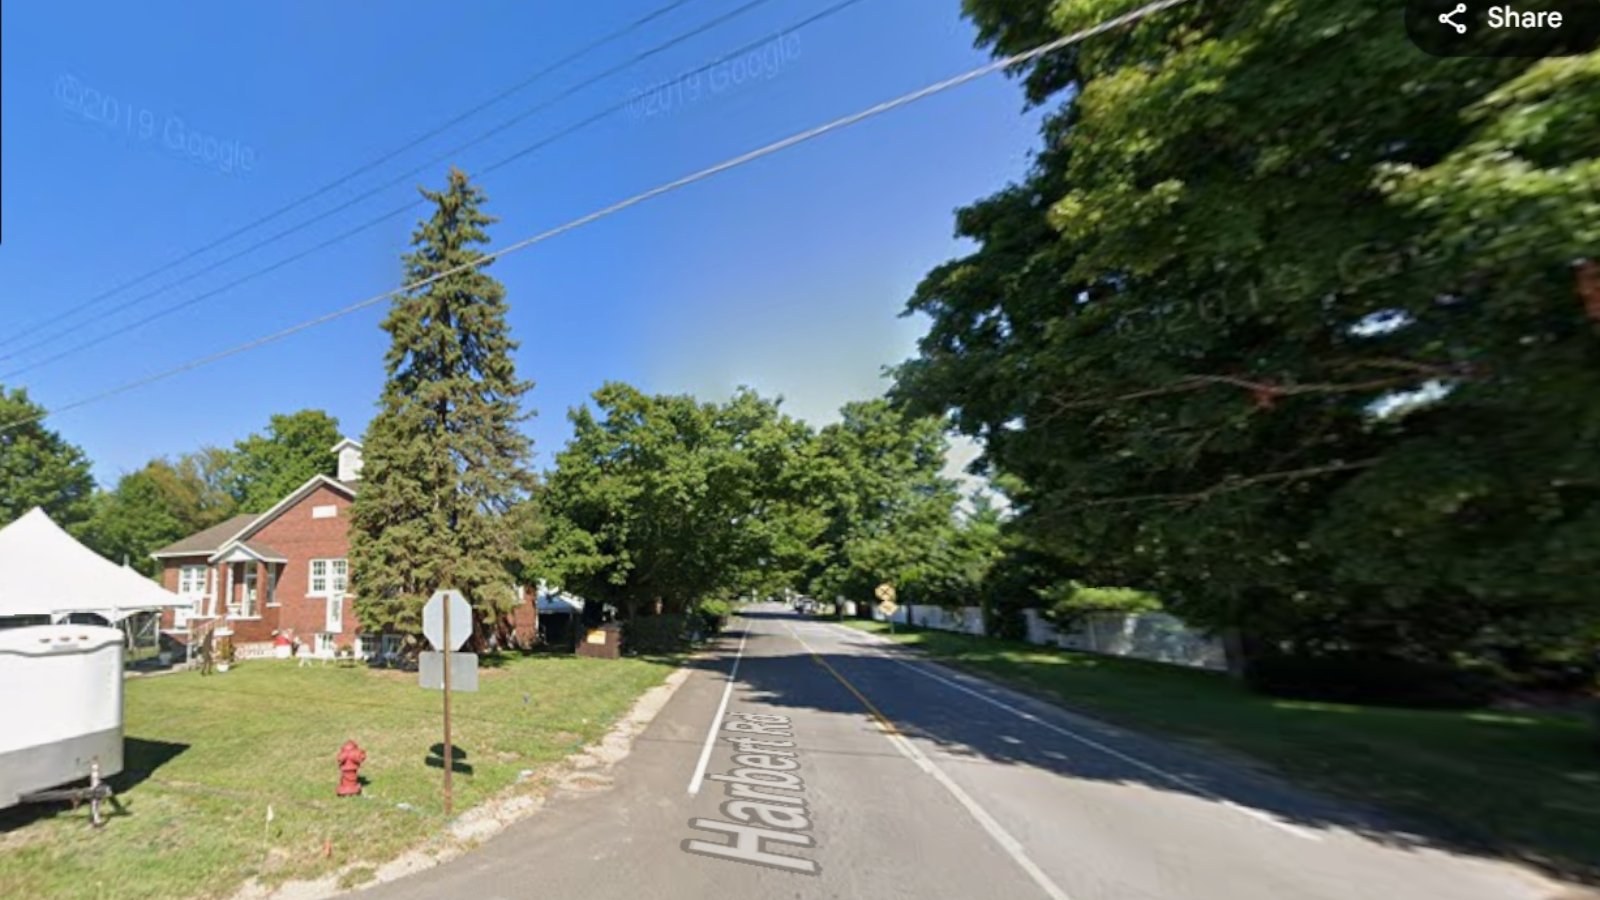
Harbert is a small community along the Red Arrow Highway in Berrien County, part of Michigan’s “Harbor Country.” Despite its size, Harbert has grown into a popular destination for second-home buyers, especially those traveling from Chicago.
Real estate here benefits from proximity to Lake Michigan, privacy, and a boutique feel. That combination continues to drive significant value growth year after year, making Harbert one of the pricier towns in the state today.
11. Birmingham – 141% Home Price Increase Since 2011
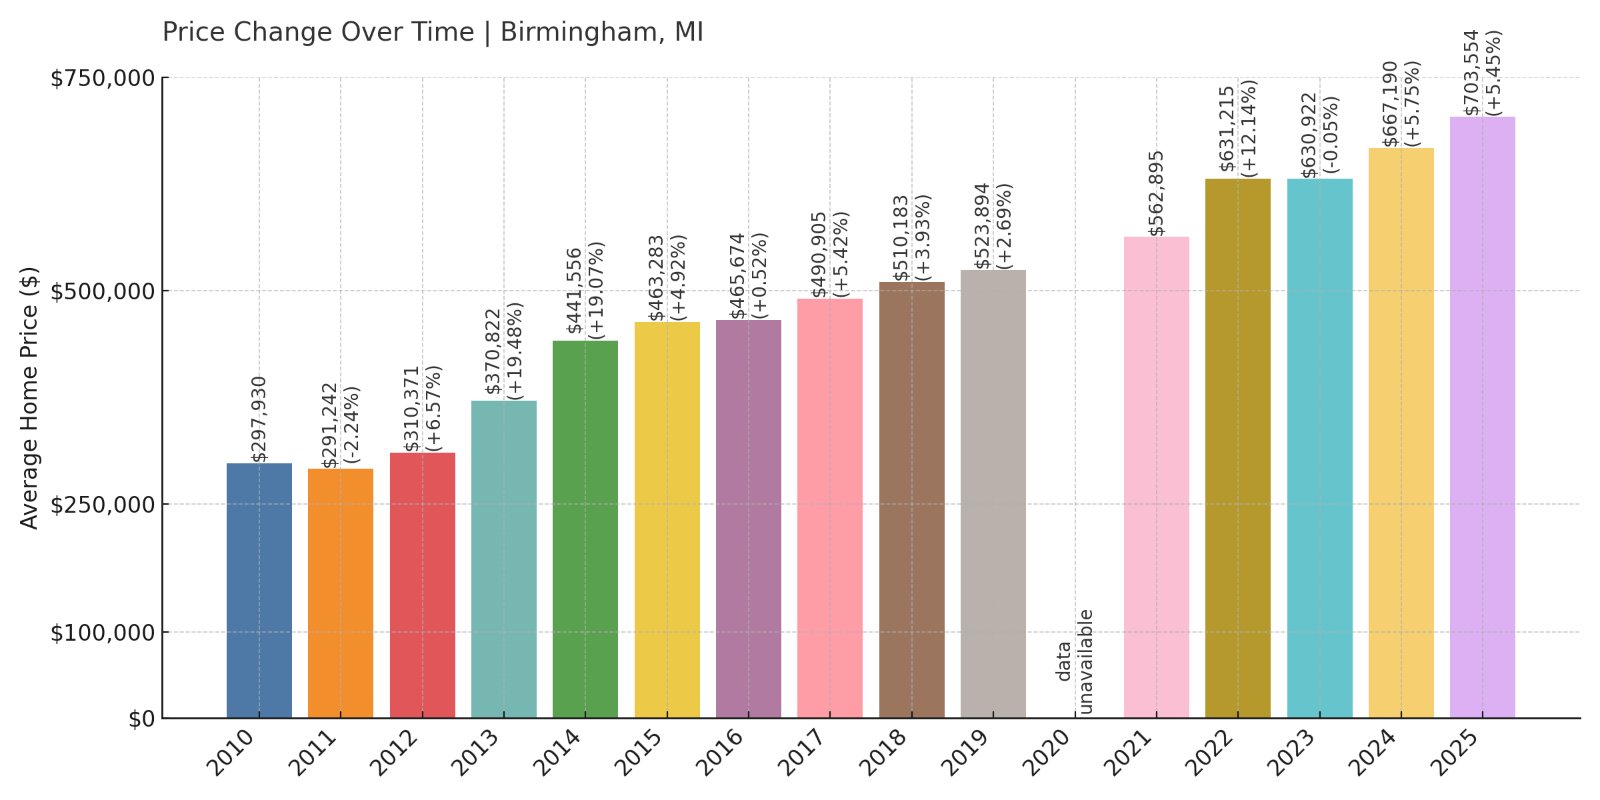
- 2010: $297,930
- 2011: $291,242 (-$6,688, -2.24% from previous year)
- 2012: $310,371 (+$19,129, +6.57% from previous year)
- 2013: $370,822 (+$60,451, +19.48% from previous year)
- 2014: $441,556 (+$70,734, +19.07% from previous year)
- 2015: $463,283 (+$21,727, +4.92% from previous year)
- 2016: $465,674 (+$2,391, +0.52% from previous year)
- 2017: $490,905 (+$25,232, +5.42% from previous year)
- 2018: $510,183 (+$19,278, +3.93% from previous year)
- 2019: $523,894 (+$13,711, +2.69% from previous year)
- 2020: N/A
- 2021: $562,895
- 2022: $631,215 (+$68,320, +12.14% from previous year)
- 2023: $630,922 (-$293, -0.05% from previous year)
- 2024: $667,190 (+$36,268, +5.75% from previous year)
- 2025: $703,554 (+$36,364, +5.45% from previous year)
Birmingham’s real estate market has more than doubled since 2011. Home values rose from $291,000 to over $703,000, with rapid gains in 2013–2014 and another notable jump in 2022.
Birmingham – A Sophisticated Hub in Metro Detroit
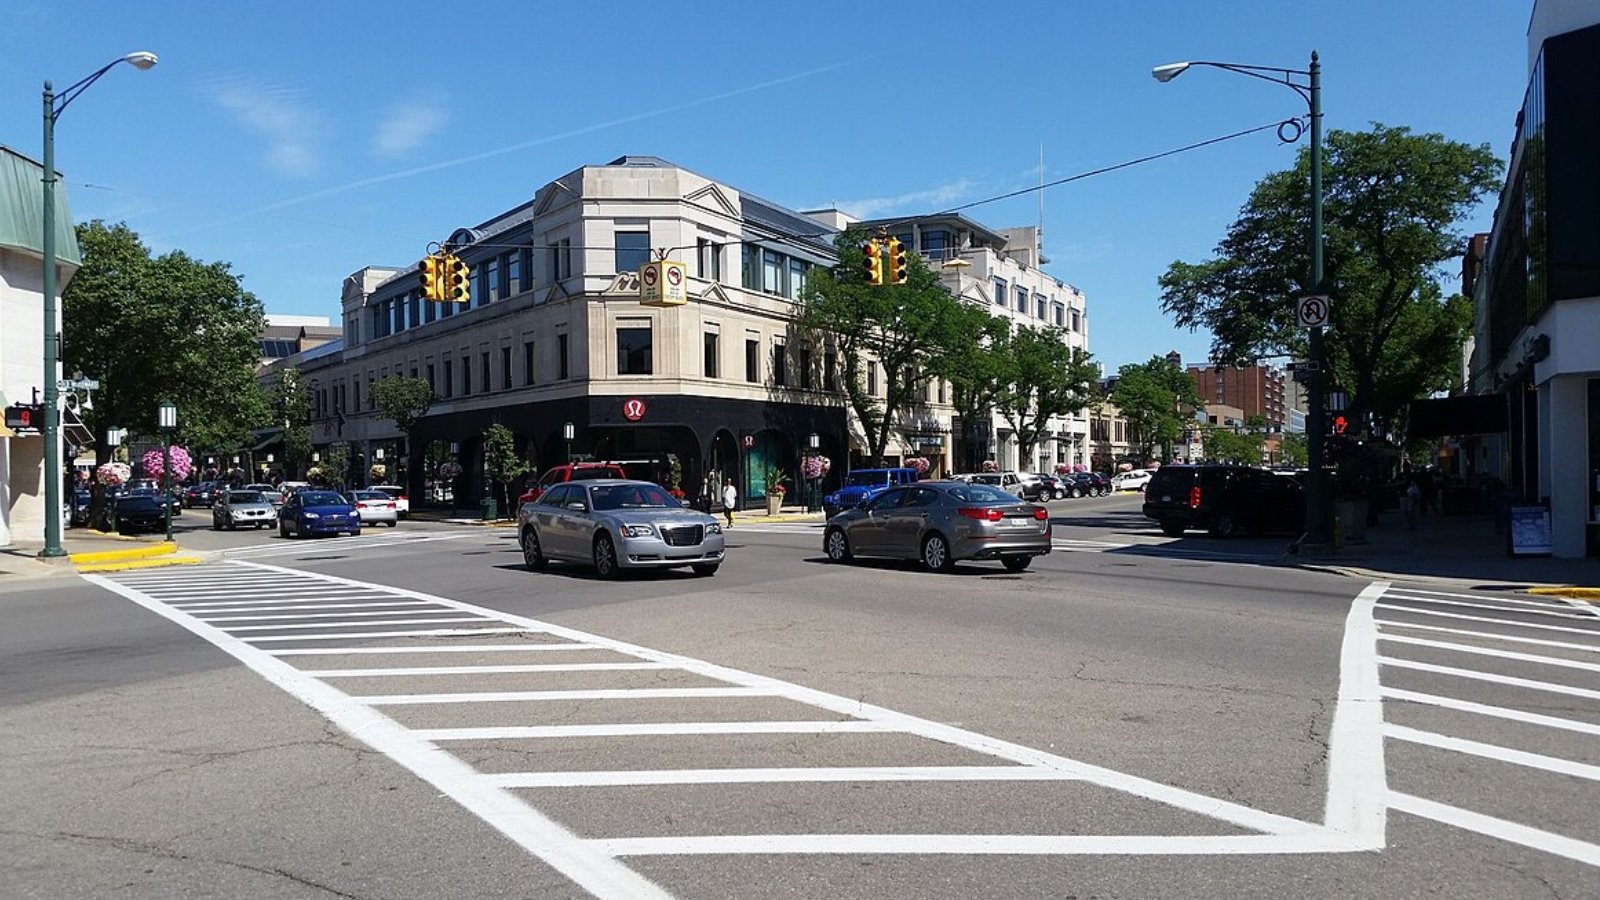
Located just north of Detroit, Birmingham blends walkability with upscale retail, top-rated schools, and cultural amenities. It’s long been one of metro Detroit’s most desirable places to live.
With its high-end housing stock and demand from executives and professionals, it’s no surprise that prices continue to climb. Even as the pace of growth slows slightly, 2025 shows no signs of reversal.
10. Grosse Pointe Shores – 170% Home Price Increase Since 2011
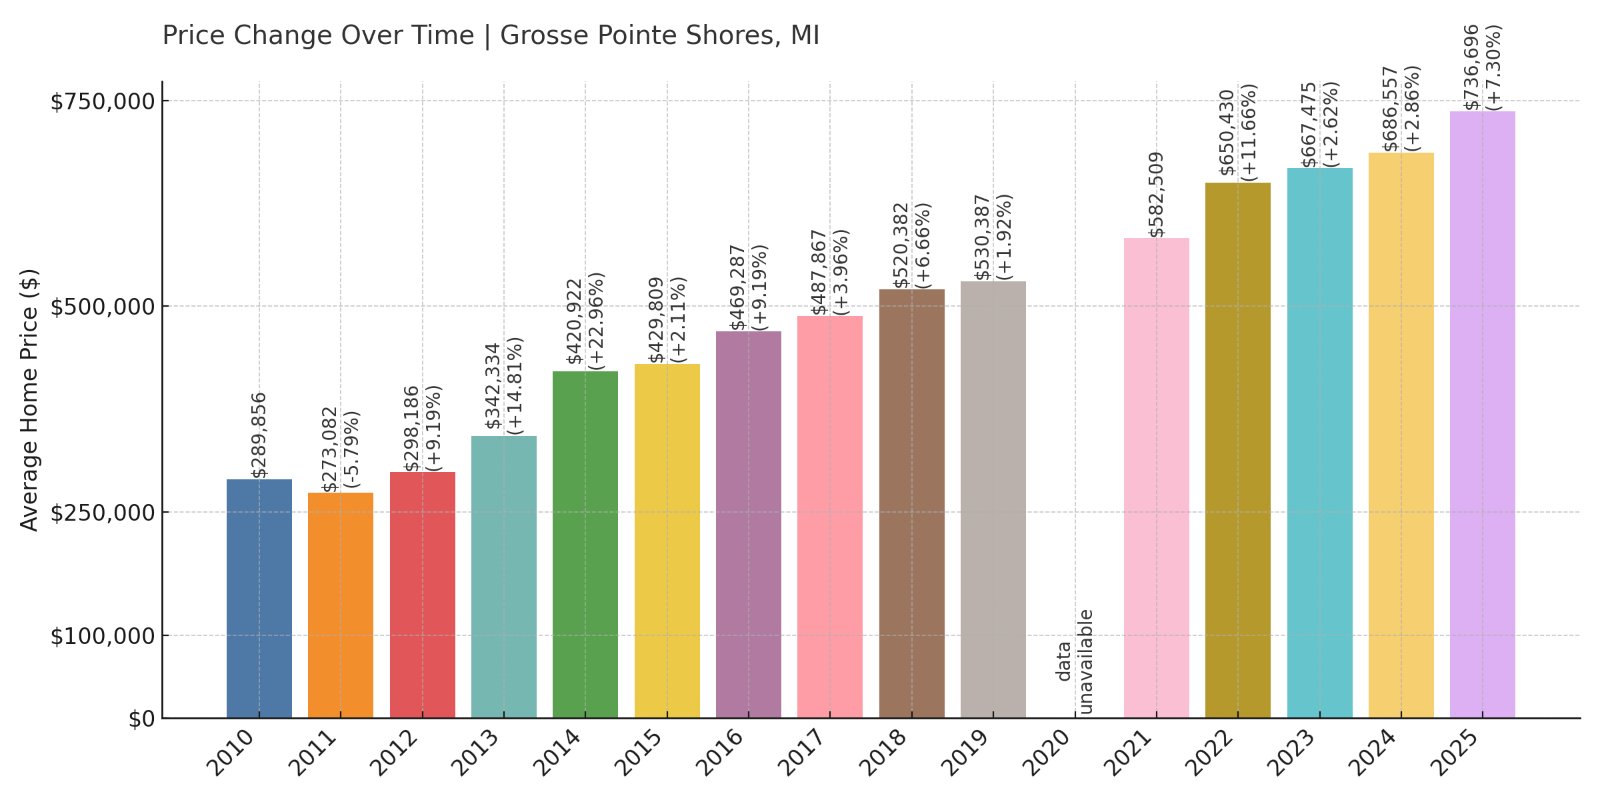
- 2010: $289,856
- 2011: $273,082 (-$16,774, -5.79% from previous year)
- 2012: $298,186 (+$25,104, +9.19% from previous year)
- 2013: $342,334 (+$44,147, +14.81% from previous year)
- 2014: $420,922 (+$78,589, +22.96% from previous year)
- 2015: $429,809 (+$8,887, +2.11% from previous year)
- 2016: $469,287 (+$39,478, +9.18% from previous year)
- 2017: $487,867 (+$18,580, +3.96% from previous year)
- 2018: $520,382 (+$32,516, +6.66% from previous year)
- 2019: $530,387 (+$10,004, +1.92% from previous year)
- 2020: N/A
- 2021: $582,509
- 2022: $650,430 (+$67,921, +11.66% from previous year)
- 2023: $667,475 (+$17,045, +2.62% from previous year)
- 2024: $686,557 (+$19,081, +2.86% from previous year)
- 2025: $736,696 (+$50,139, +7.30% from previous year)
Grosse Pointe Shores has seen prices climb more than 170% since 2011, beginning at just over $273,000 and reaching nearly $737,000 in 2025. Notable spikes in 2014 and 2022 pushed the town into Michigan’s top 10 most expensive markets.
Grosse Pointe Shores – Elegance Along Lake St. Clair
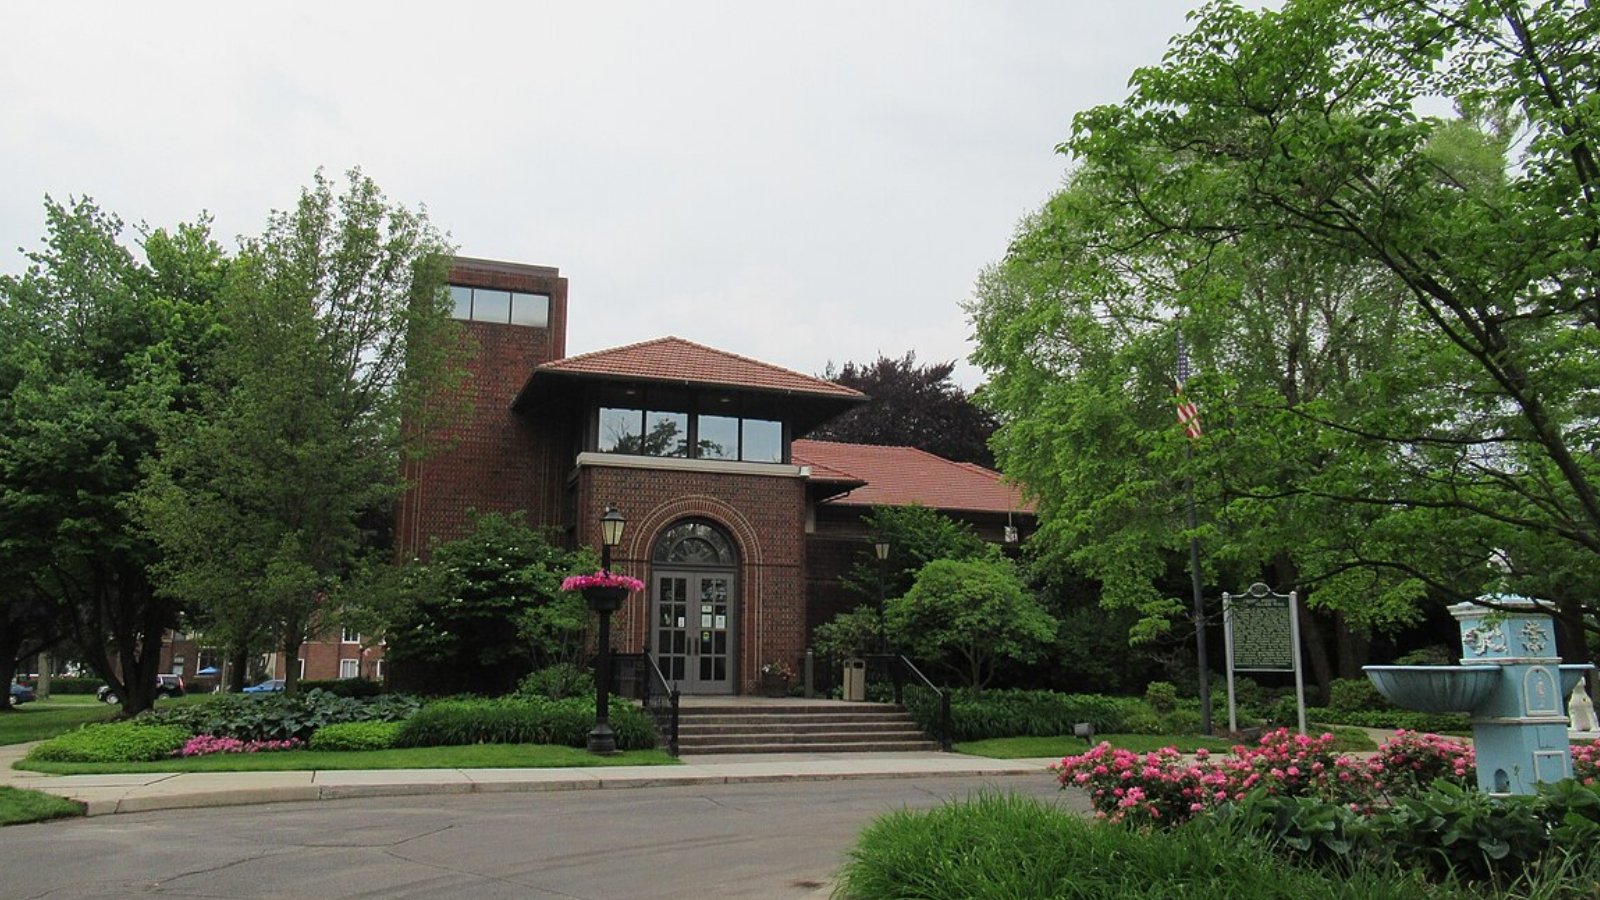
Sitting along the Lake St. Clair shoreline, Grosse Pointe Shores is known for its mansions, manicured streets, and close-knit residential feel. It is the easternmost of the Grosse Pointe communities and home to the Edsel & Eleanor Ford House and scenic marinas.
Residents enjoy proximity to both Detroit and water recreation. Its combination of lakefront beauty and exclusivity drives demand. That demand, coupled with limited land, helps explain why prices have grown steadily over the last decade and continue to climb today.
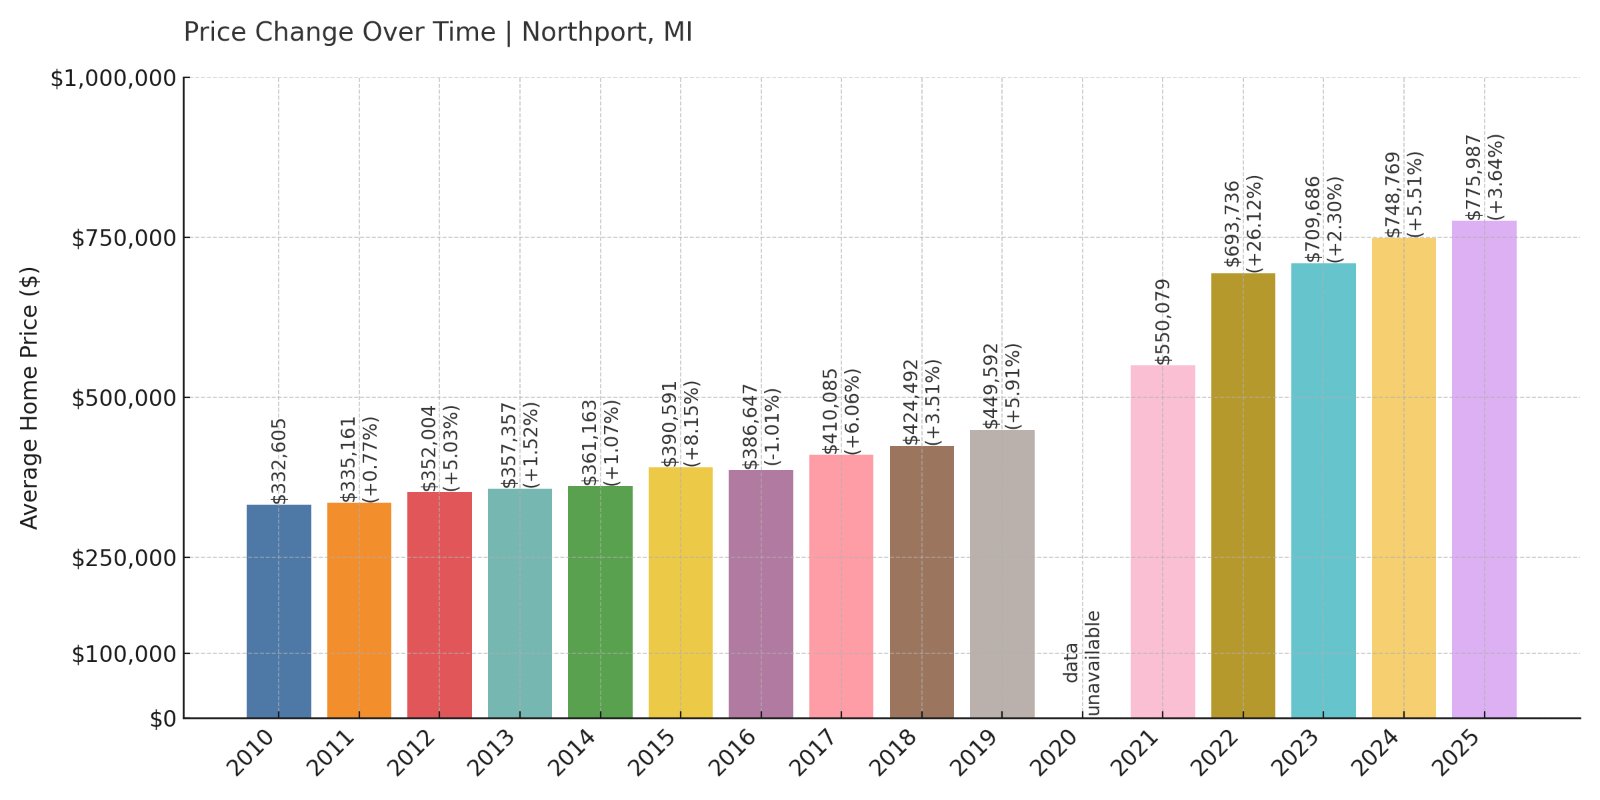
9. Northport – 132% Home Price Increase Since 2011
🔥 Would you like to save this?
- 2010: $332,605
- 2011: $335,161 (+$2,557, +0.77% from previous year)
- 2012: $352,004 (+$16,843, +5.03% from previous year)
- 2013: $357,357 (+$5,353, +1.52% from previous year)
- 2014: $361,163 (+$3,806, +1.07% from previous year)
- 2015: $390,591 (+$29,428, +8.15% from previous year)
- 2016: $386,647 (-$3,944, -1.01% from previous year)
- 2017: $410,085 (+$23,438, +6.06% from previous year)
- 2018: $424,492 (+$14,407, +3.51% from previous year)
- 2019: $449,592 (+$25,100, +5.91% from previous year)
- 2020: N/A
- 2021: $550,079
- 2022: $693,736 (+$143,657, +26.12% from previous year)
- 2023: $709,686 (+$15,949, +2.30% from previous year)
- 2024: $748,769 (+$39,083, +5.51% from previous year)
- 2025: $775,987 (+$27,218, +3.64% from previous year)
Since 2011, home prices in Northport have climbed from $335,161 to $775,987—an increase of 132%. Growth was particularly sharp in 2022 and has continued upward through 2025.
Northport – Quiet Charm at the Tip of Leelanau
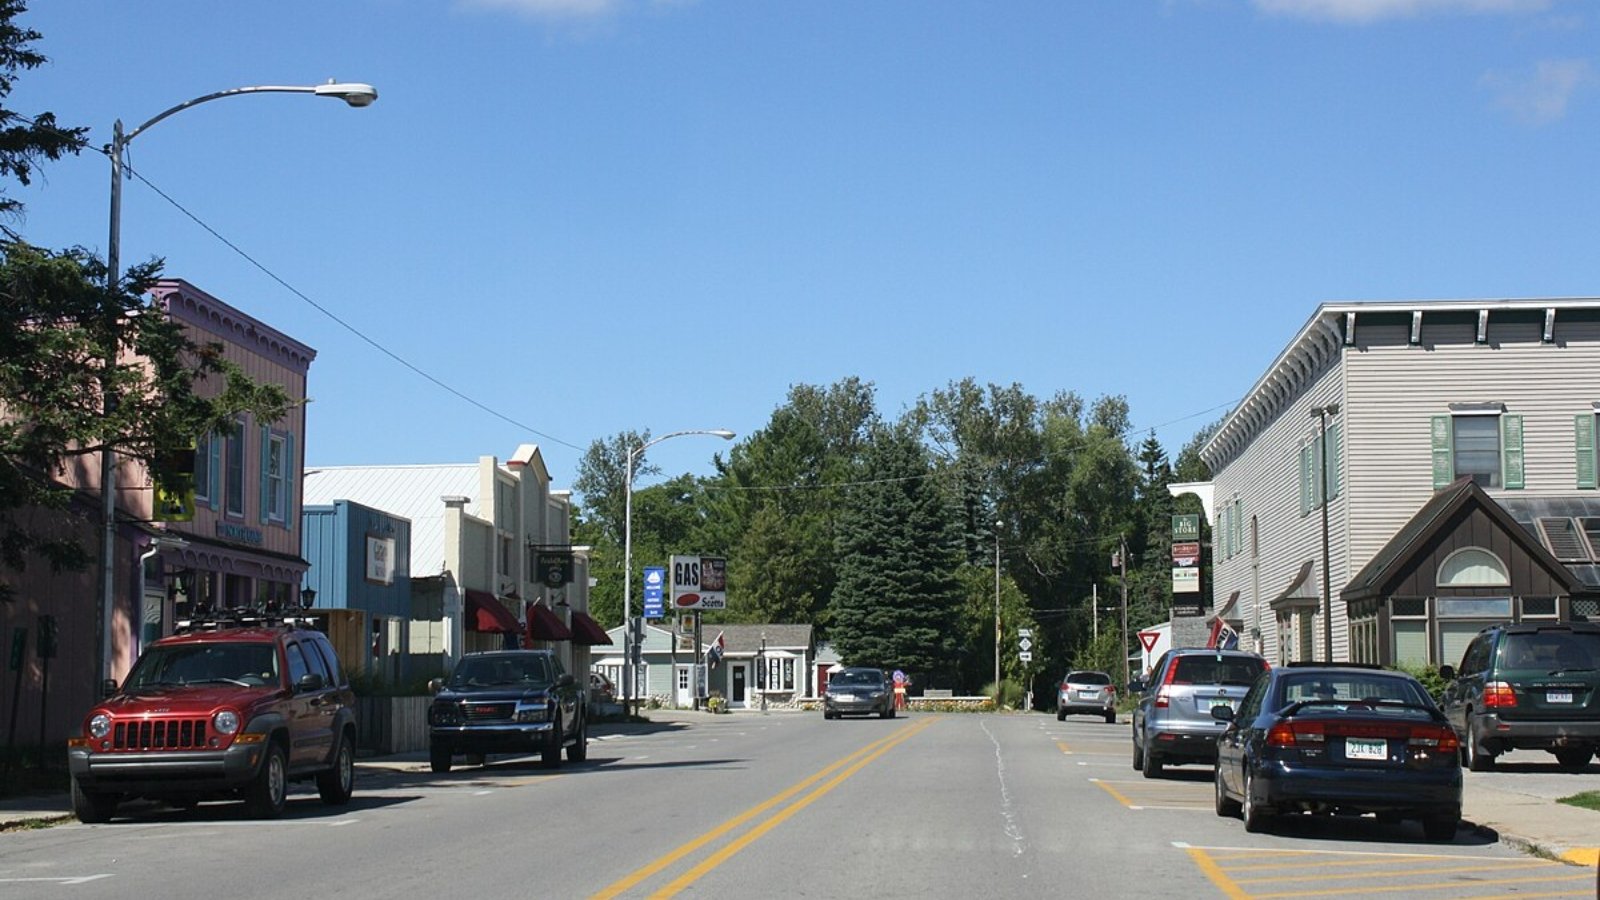
Northport is a peaceful village at the northern end of the Leelanau Peninsula. Surrounded by Lake Michigan and Grand Traverse Bay, it offers a remote yet idyllic setting, with harbors, vineyards, and scenic vistas attracting buyers who value tranquility.
As one of the most isolated towns on the list, its surge in prices may reflect increased demand for secluded properties and vacation homes. It’s also a gateway to Leelanau State Park and the Grand Traverse Lighthouse, which draw steady seasonal traffic.
8. Union Pier – 100% Home Price Increase Since 2011
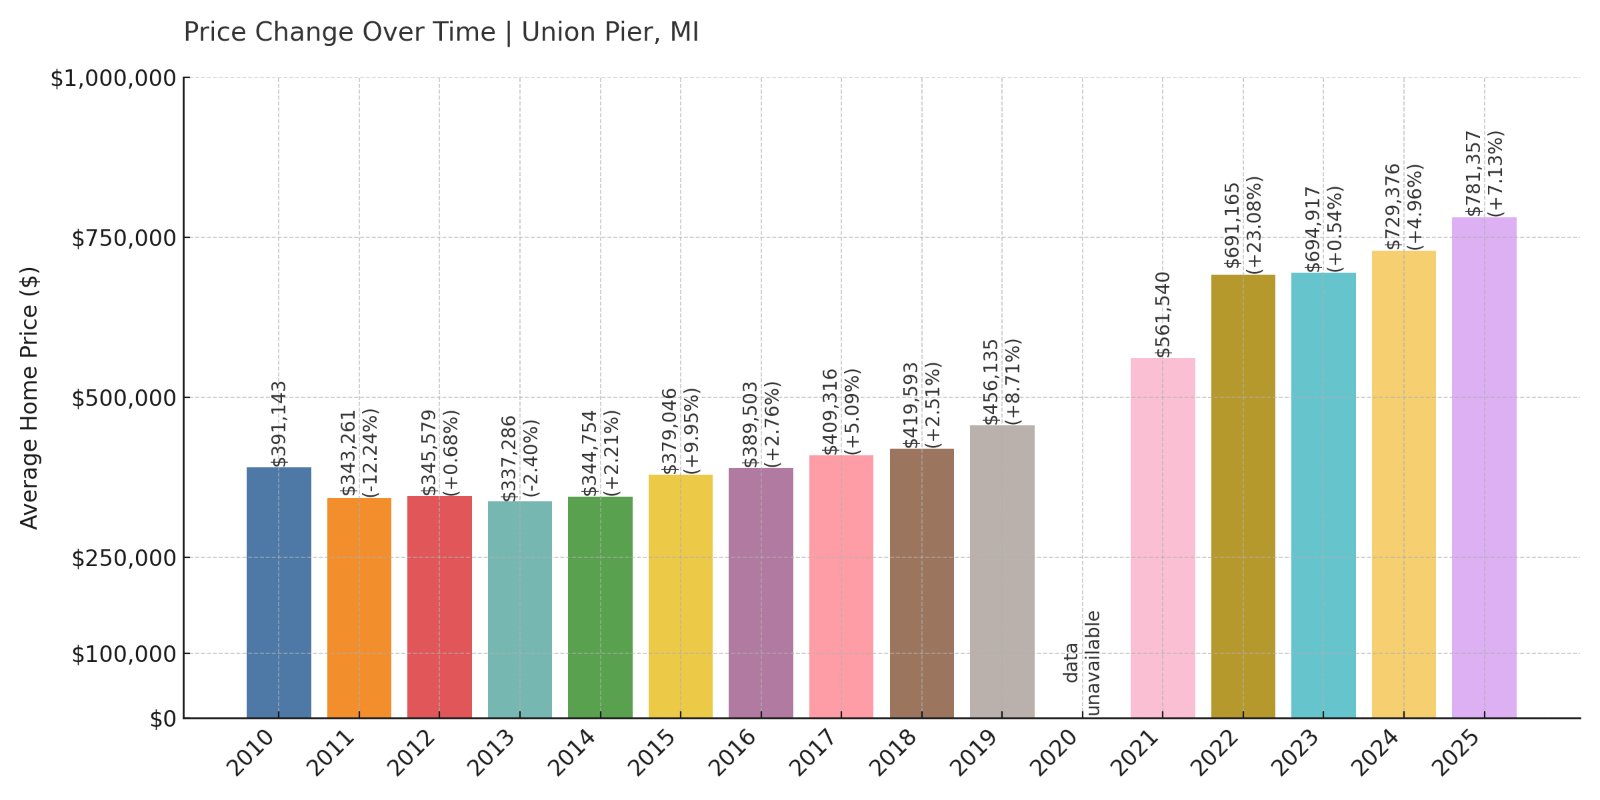
- 2010: $391,143
- 2011: $343,261 (-$47,882, -12.24% from previous year)
- 2012: $345,579 (+$2,318, +0.68% from previous year)
- 2013: $337,286 (-$8,293, -2.40% from previous year)
- 2014: $344,754 (+$7,469, +2.21% from previous year)
- 2015: $379,046 (+$34,291, +9.95% from previous year)
- 2016: $389,503 (+$10,458, +2.76% from previous year)
- 2017: $409,316 (+$19,812, +5.09% from previous year)
- 2018: $419,593 (+$10,277, +2.51% from previous year)
- 2019: $456,135 (+$36,543, +8.71% from previous year)
- 2020: N/A
- 2021: $561,540
- 2022: $691,165 (+$129,625, +23.08% from previous year)
- 2023: $694,917 (+$3,752, +0.54% from previous year)
- 2024: $729,376 (+$34,459, +4.96% from previous year)
- 2025: $781,357 (+$51,981, +7.13% from previous year)
Union Pier’s home values have doubled since 2011, rising from $343,261 to $781,357. While prices dipped early in the decade, steady gains since 2015 and a huge bump in 2022 have made it one of Michigan’s most valuable markets.
Union Pier – A Beach Town with Chicago Ties
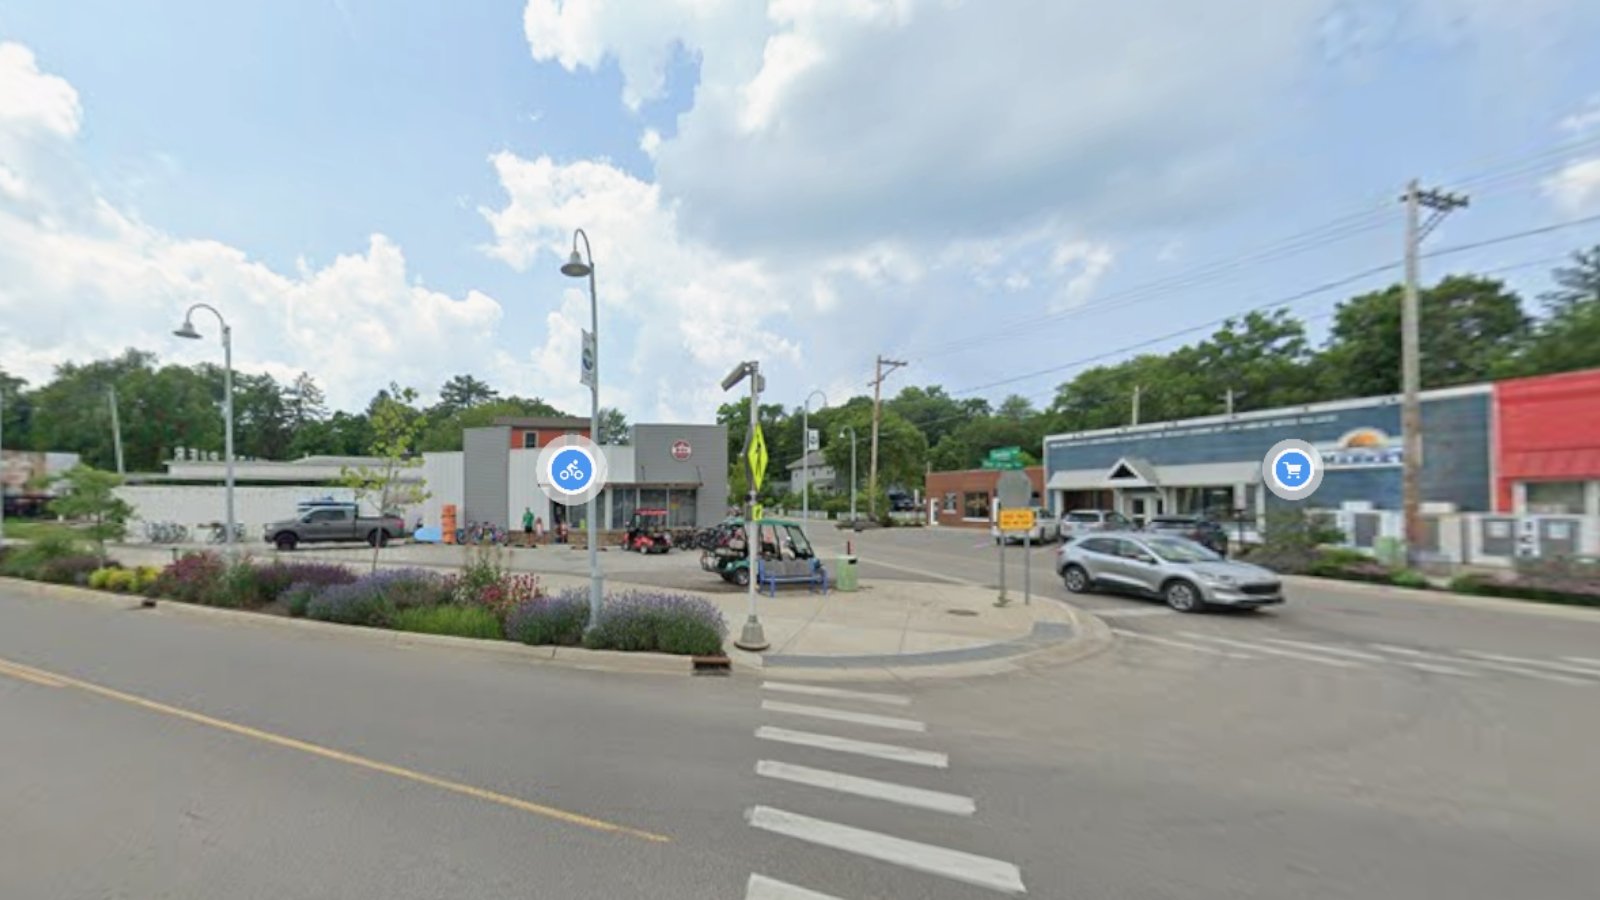
Part of the Harbor Country stretch along Lake Michigan, Union Pier is a favorite weekend escape for Chicago residents. Its proximity to the lake, quiet beaches, and historic charm make it a top destination for second-home buyers.
Real estate here is largely driven by out-of-state interest, and the market reflects that—homes are in demand, inventory is limited, and values are holding strong. With price increases continuing into 2025, Union Pier remains a top-tier beach town investment.
7. Lakeside – 130% Home Price Increase Since 2010
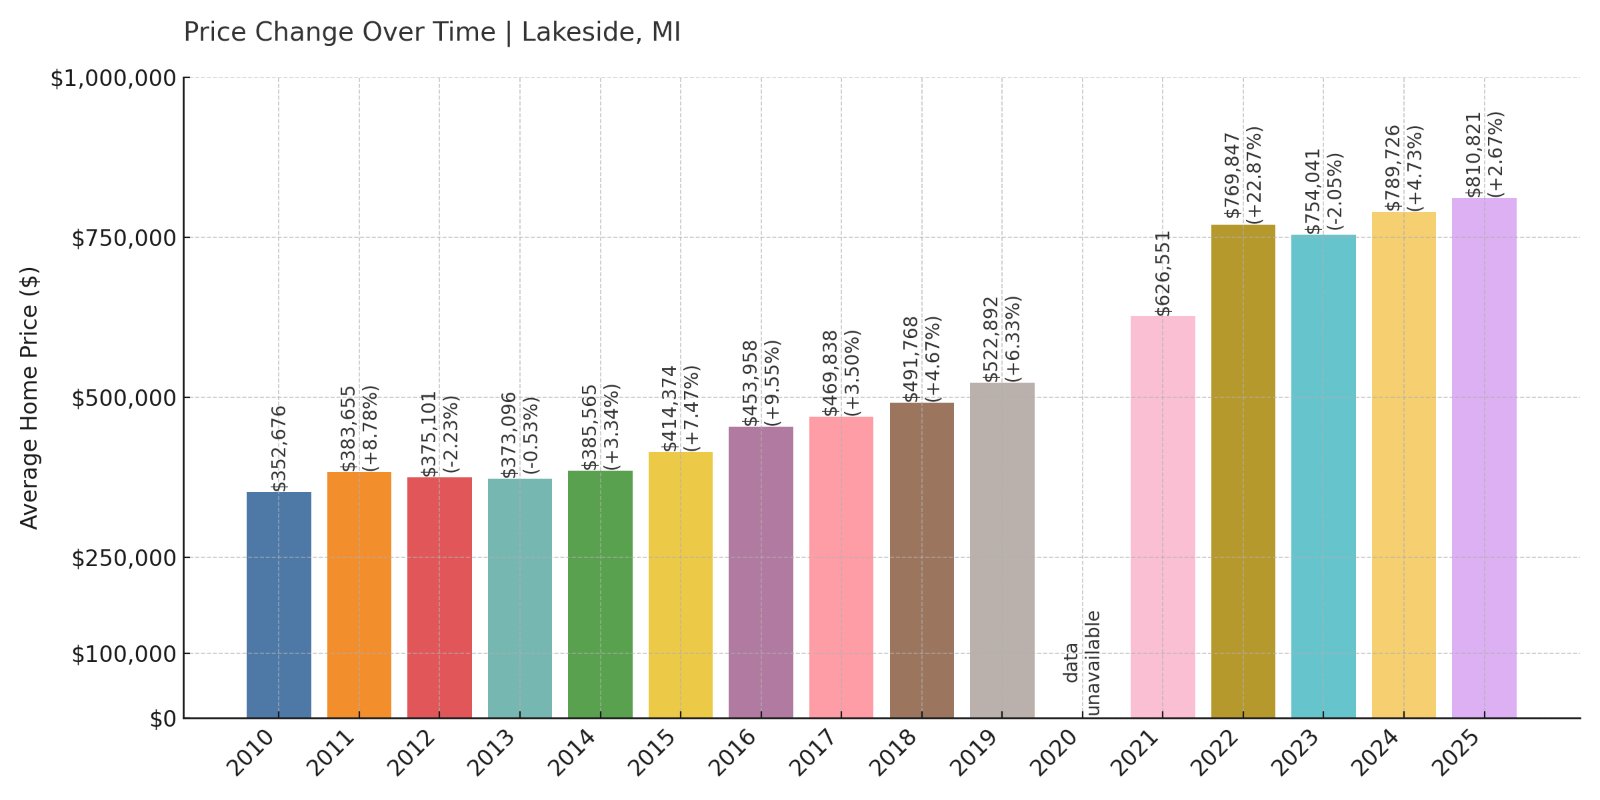
- 2010: $352,676
- 2011: $383,655 (+$30,979, +8.78% from previous year)
- 2012: $375,101 (-$8,554, -2.23% from previous year)
- 2013: $373,096 (-$2,004, -0.53% from previous year)
- 2014: $385,565 (+$12,468, +3.34% from previous year)
- 2015: $414,374 (+$28,809, +7.47% from previous year)
- 2016: $453,958 (+$39,585, +9.55% from previous year)
- 2017: $469,838 (+$15,880, +3.50% from previous year)
- 2018: $491,768 (+$21,929, +4.67% from previous year)
- 2019: $522,892 (+$31,124, +6.33% from previous year)
- 2020: N/A
- 2021: $626,551
- 2022: $769,847 (+$143,296, +22.87% from previous year)
- 2023: $754,041 (-$15,805, -2.05% from previous year)
- 2024: $789,726 (+$35,685, +4.73% from previous year)
- 2025: $810,821 (+$21,095, +2.67% from previous year)
Lakeside’s prices have grown by 130% since 2010, starting at $352,676 and rising to over $810,000 in 2025. The biggest price hike came in 2022, with a jump of over $140,000 in a single year.
Lakeside – A Hidden Retreat in Harbor Country
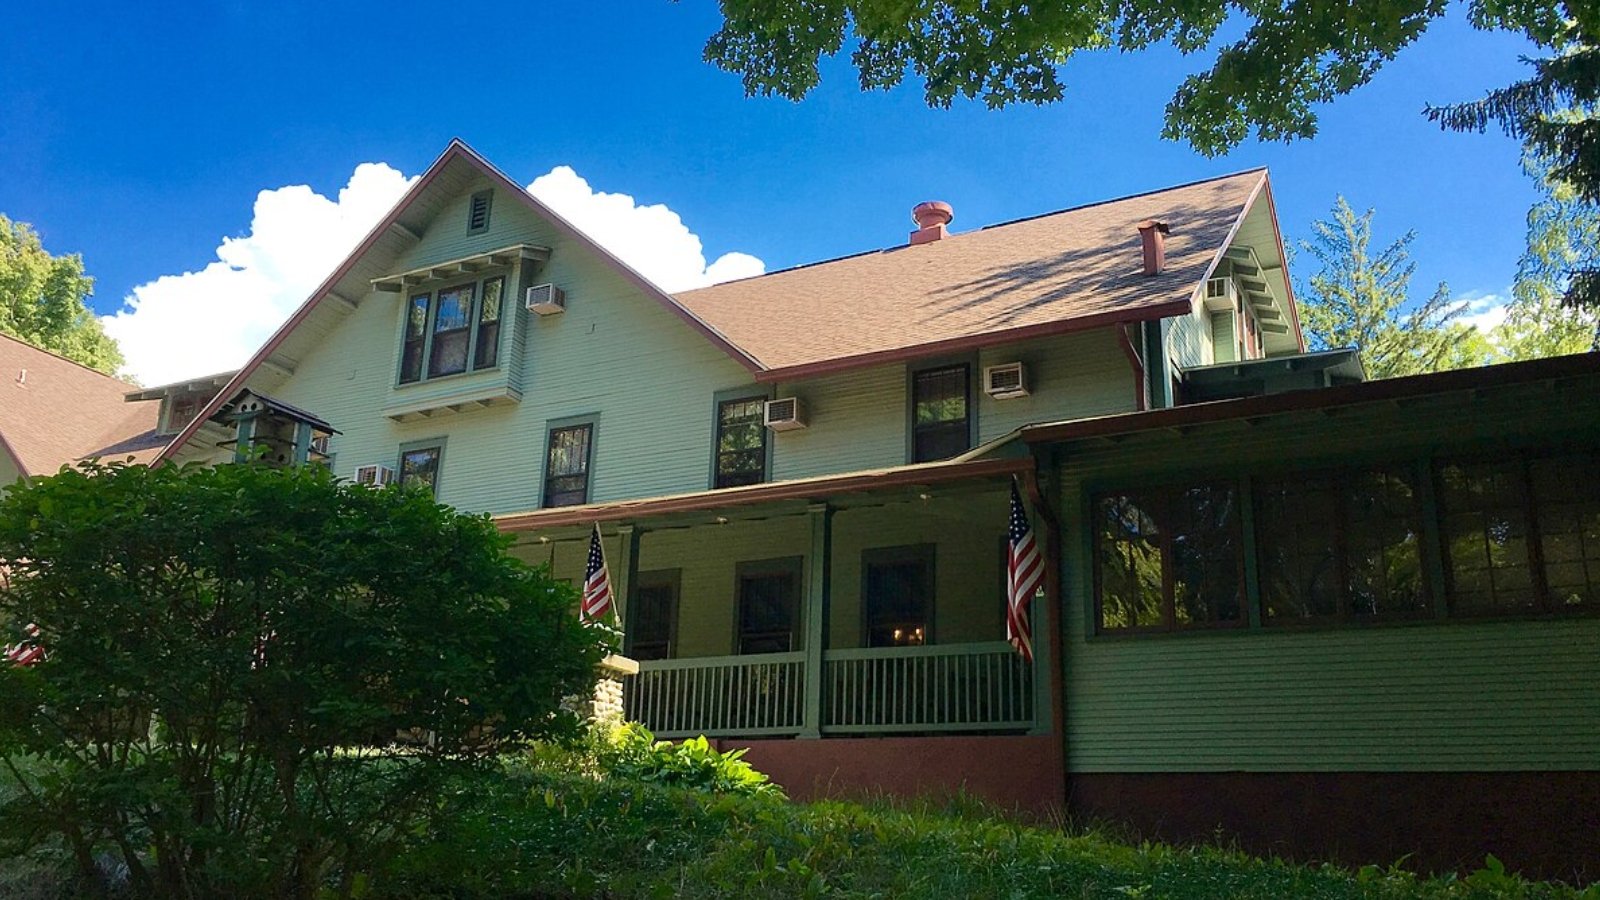
One of the lesser-known Harbor Country communities, Lakeside offers peace and seclusion with access to beaches, art galleries, and farm stands. It’s a tranquil alternative to more developed vacation towns.
The area appeals to well-heeled buyers looking for privacy and natural beauty. Strong interest from out-of-state residents continues to shape the market, and prices reflect that. While values dipped briefly in 2023, they have rebounded and continue to climb in 2025.
6. Kewadin – 184% Home Price Increase Since 2010
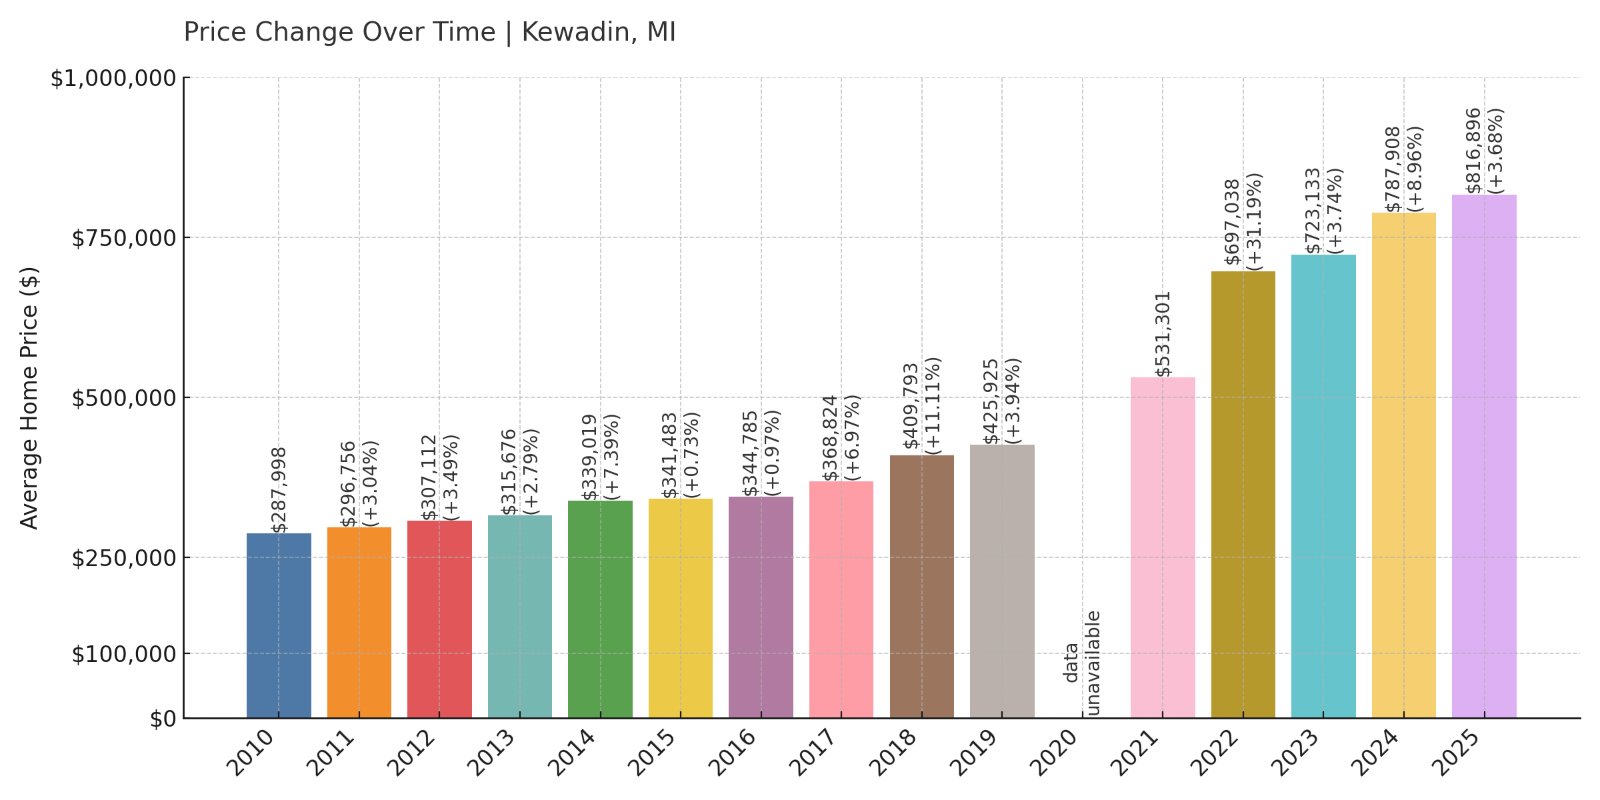
- 2010: $287,998
- 2011: $296,756 (+$8,758, +3.04% from previous year)
- 2012: $307,112 (+$10,356, +3.49% from previous year)
- 2013: $315,676 (+$8,564, +2.79% from previous year)
- 2014: $339,019 (+$23,343, +7.39% from previous year)
- 2015: $341,483 (+$2,464, +0.73% from previous year)
- 2016: $344,785 (+$3,302, +0.97% from previous year)
- 2017: $368,824 (+$24,039, +6.97% from previous year)
- 2018: $409,793 (+$40,968, +11.11% from previous year)
- 2019: $425,925 (+$16,133, +3.94% from previous year)
- 2020: N/A
- 2021: $531,301
- 2022: $697,038 (+$165,737, +31.19% from previous year)
- 2023: $723,133 (+$26,095, +3.74% from previous year)
- 2024: $787,908 (+$64,775, +8.96% from previous year)
- 2025: $816,896 (+$28,988, +3.68% from previous year)
Home values in Kewadin have climbed from just under $288,000 in 2010 to over $816,000 in 2025, marking an increase of 184%. The most substantial growth occurred in 2022, with a 31% surge that helped push it into the top six statewide.
Kewadin – Scenic Shores and Steady Appreciation
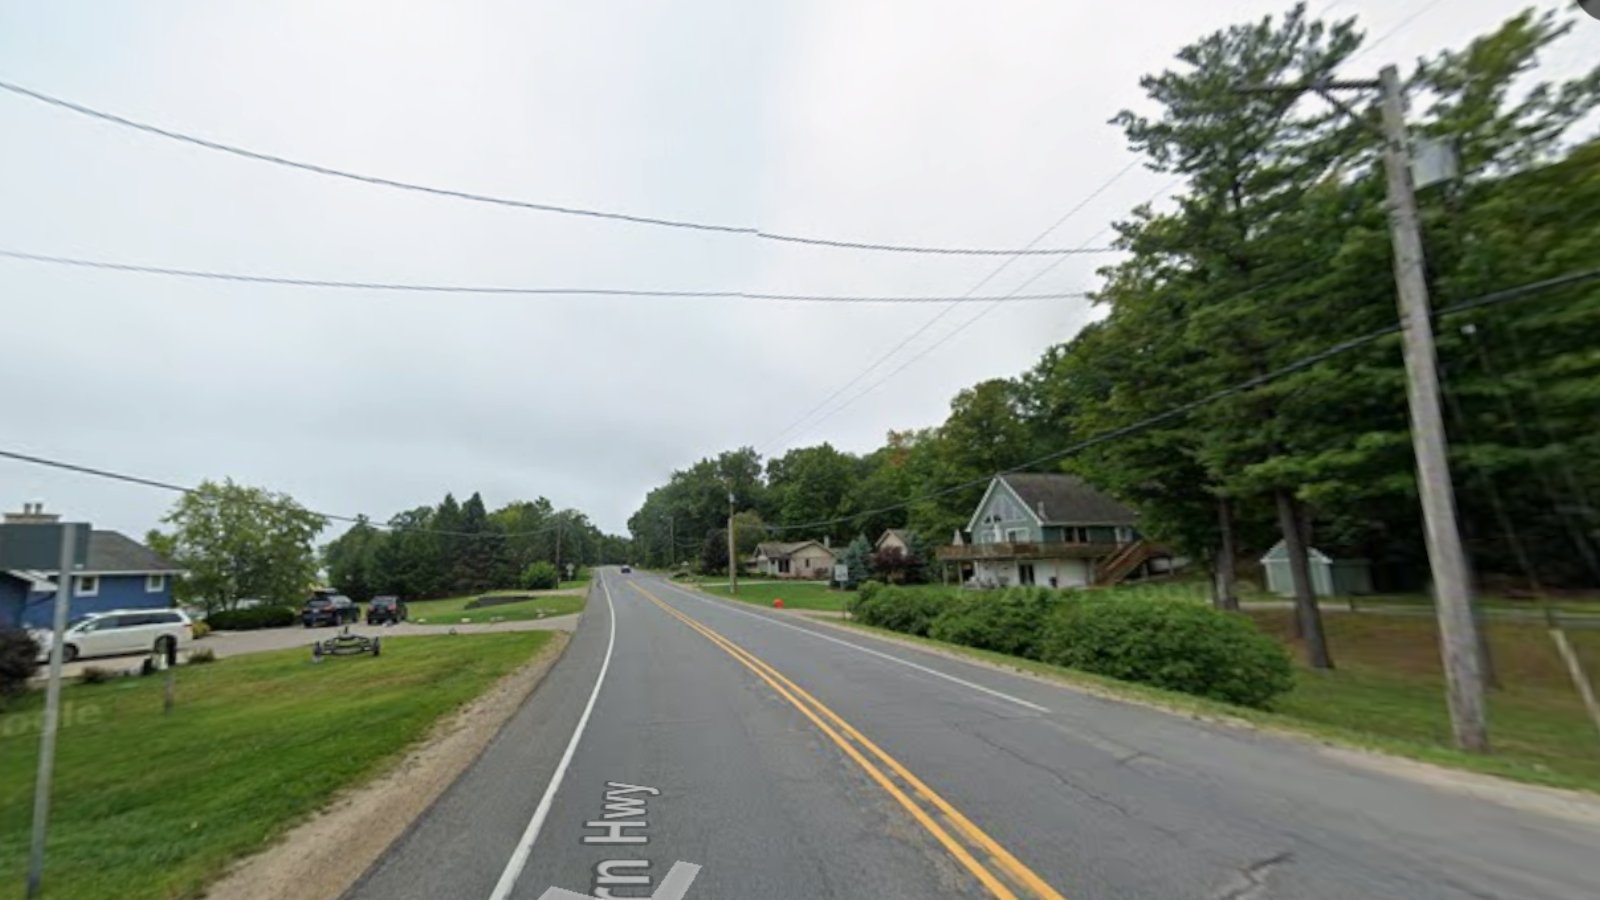
Located near the eastern edge of Grand Traverse Bay, Kewadin is a small, scenic community known for its natural beauty and proximity to Torch Lake. It’s a popular spot for vacation homes and retirees seeking peaceful surroundings and water access.
With its rural charm and lakefront properties, Kewadin continues to see demand despite its remote location. The area’s strong performance in 2022 and sustained growth into 2025 suggests that buyers are increasingly seeking out premium space far from urban bustle.
5. Franklin – 130% Home Price Increase Since 2011
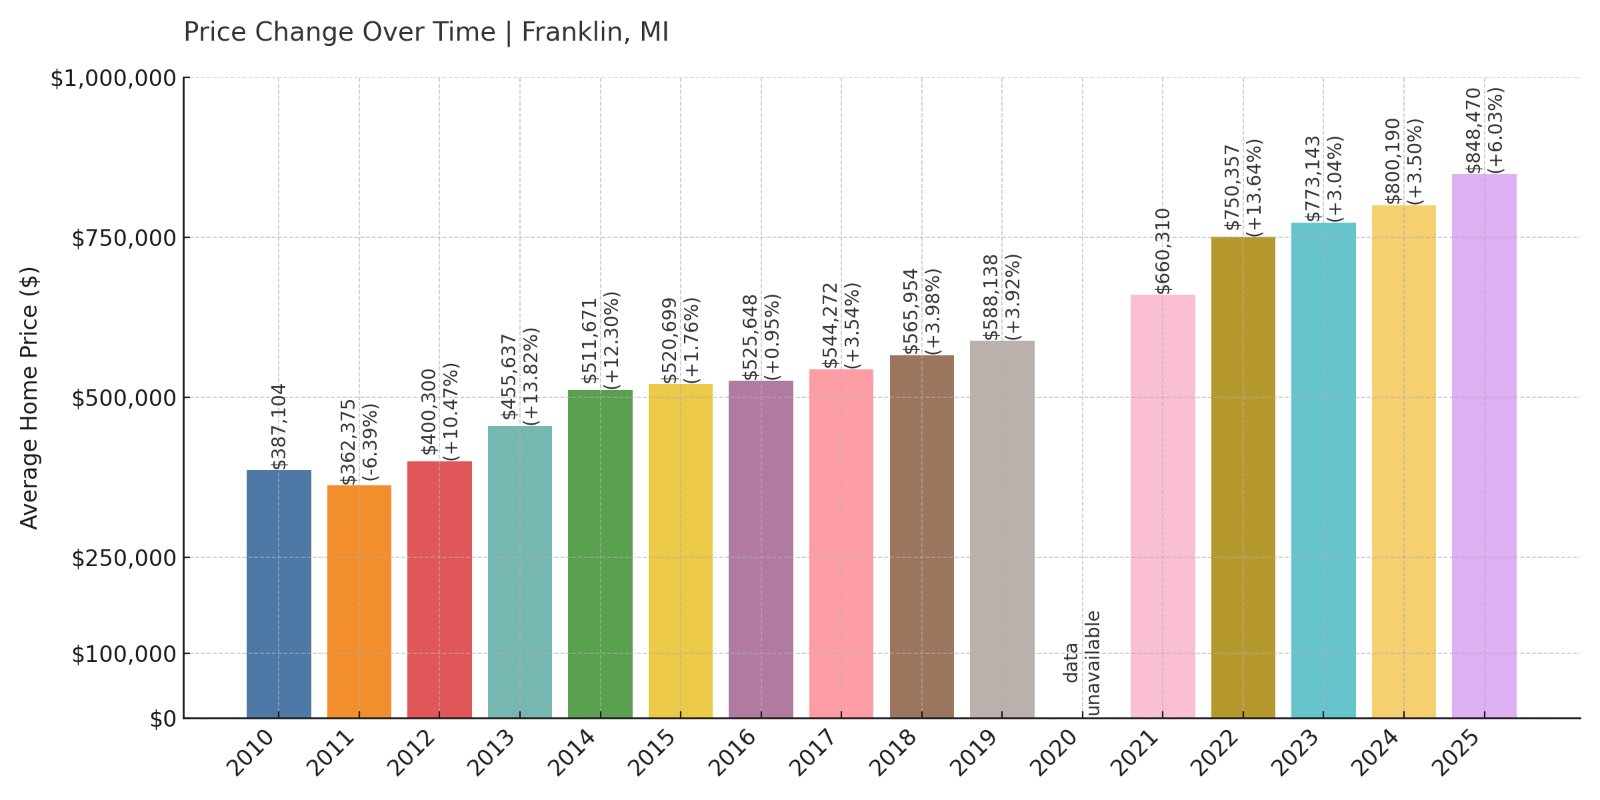
- 2010: $387,104
- 2011: $362,375 (-$24,729, -6.39% from previous year)
- 2012: $400,300 (+$37,925, +10.47% from previous year)
- 2013: $455,637 (+$55,337, +13.82% from previous year)
- 2014: $511,671 (+$56,034, +12.30% from previous year)
- 2015: $520,699 (+$9,028, +1.76% from previous year)
- 2016: $525,648 (+$4,949, +0.95% from previous year)
- 2017: $544,272 (+$18,625, +3.54% from previous year)
- 2018: $565,954 (+$21,682, +3.98% from previous year)
- 2019: $588,138 (+$22,183, +3.92% from previous year)
- 2020: N/A
- 2021: $660,310
- 2022: $750,357 (+$90,047, +13.64% from previous year)
- 2023: $773,143 (+$22,786, +3.04% from previous year)
- 2024: $800,190 (+$27,047, +3.50% from previous year)
- 2025: $848,470 (+$48,280, +6.03% from previous year)
Franklin’s average home value rose from $362,375 in 2011 to $848,470 in 2025—a gain of more than 130%. While growth was consistent throughout the decade, 2022 stands out with a notable $90,000 leap in a single year.
Franklin – Historic Character Meets Modern Demand
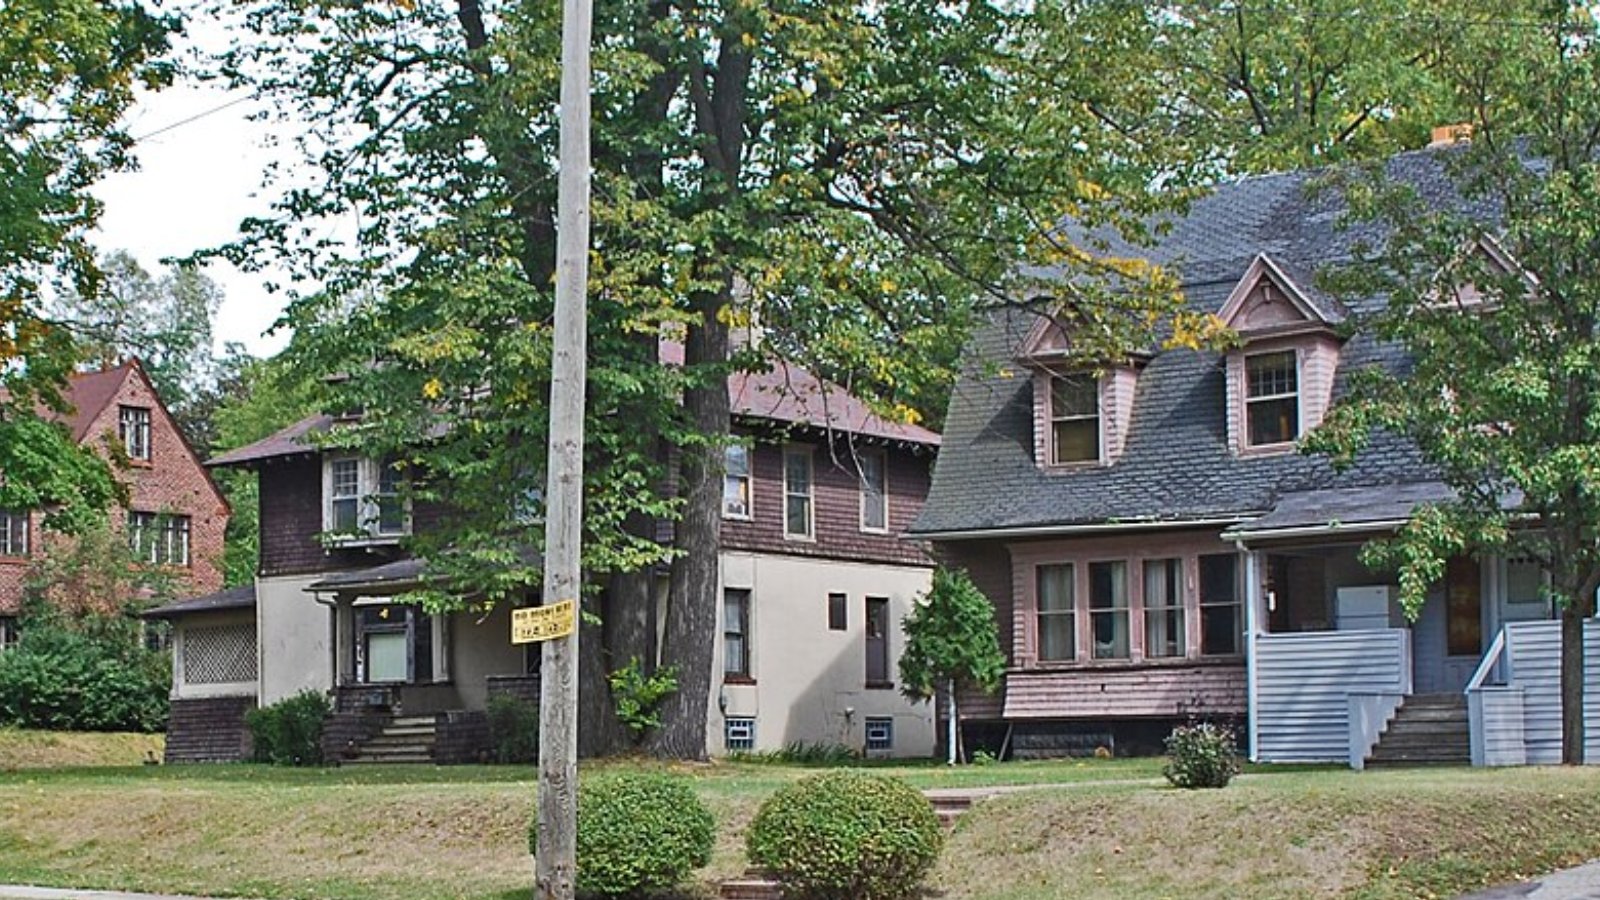
Often referred to as “The Town That Time Forgot,” Franklin is a picturesque village with a rich history and a distinctly rural feel, despite being located just northwest of Detroit. Its charming downtown, horse barns, and historical preservation give it a timeless appeal.
The town’s exclusivity and small population have helped drive consistent price appreciation. With limited housing stock and proximity to major job centers, Franklin remains one of the state’s most desirable and expensive suburbs.
4. Lake Leelanau – 137% Home Price Increase Since 2011

- 2010: $360,114
- 2011: $354,320 (-$5,793, -1.61% from previous year)
- 2012: $378,471 (+$24,151, +6.82% from previous year)
- 2013: $367,142 (-$11,330, -2.99% from previous year)
- 2014: $399,056 (+$31,915, +8.69% from previous year)
- 2015: $432,934 (+$33,877, +8.49% from previous year)
- 2016: $444,440 (+$11,506, +2.66% from previous year)
- 2017: $458,736 (+$14,296, +3.22% from previous year)
- 2018: $485,382 (+$26,646, +5.81% from previous year)
- 2019: $478,906 (-$6,476, -1.33% from previous year)
- 2020: N/A
- 2021: $621,433
- 2022: $764,224 (+$142,791, +22.98% from previous year)
- 2023: $769,229 (+$5,005, +0.65% from previous year)
- 2024: $831,898 (+$62,669, +8.15% from previous year)
- 2025: $852,598 (+$20,700, +2.49% from previous year)
From $354,320 in 2011 to $852,598 in 2025, Lake Leelanau has experienced a 137% increase in home prices. Major gains in 2022 and 2024 have reinforced its spot among Michigan’s most high-value towns.
Lake Leelanau – Water Views and Wine Country
Sitting between North and South Lake Leelanau, this small village is a centerpiece of Leelanau County’s wine region. With its rolling hills, vineyards, and waterfront homes, the area attracts both seasonal visitors and long-term investors.
Lake access and a strong tourism economy have helped boost real estate values. As interest in Michigan’s wine regions continues to grow, demand in Lake Leelanau remains high, keeping price growth steady into 2025.
3. Orchard Lake – 93% Home Price Increase Since 2011
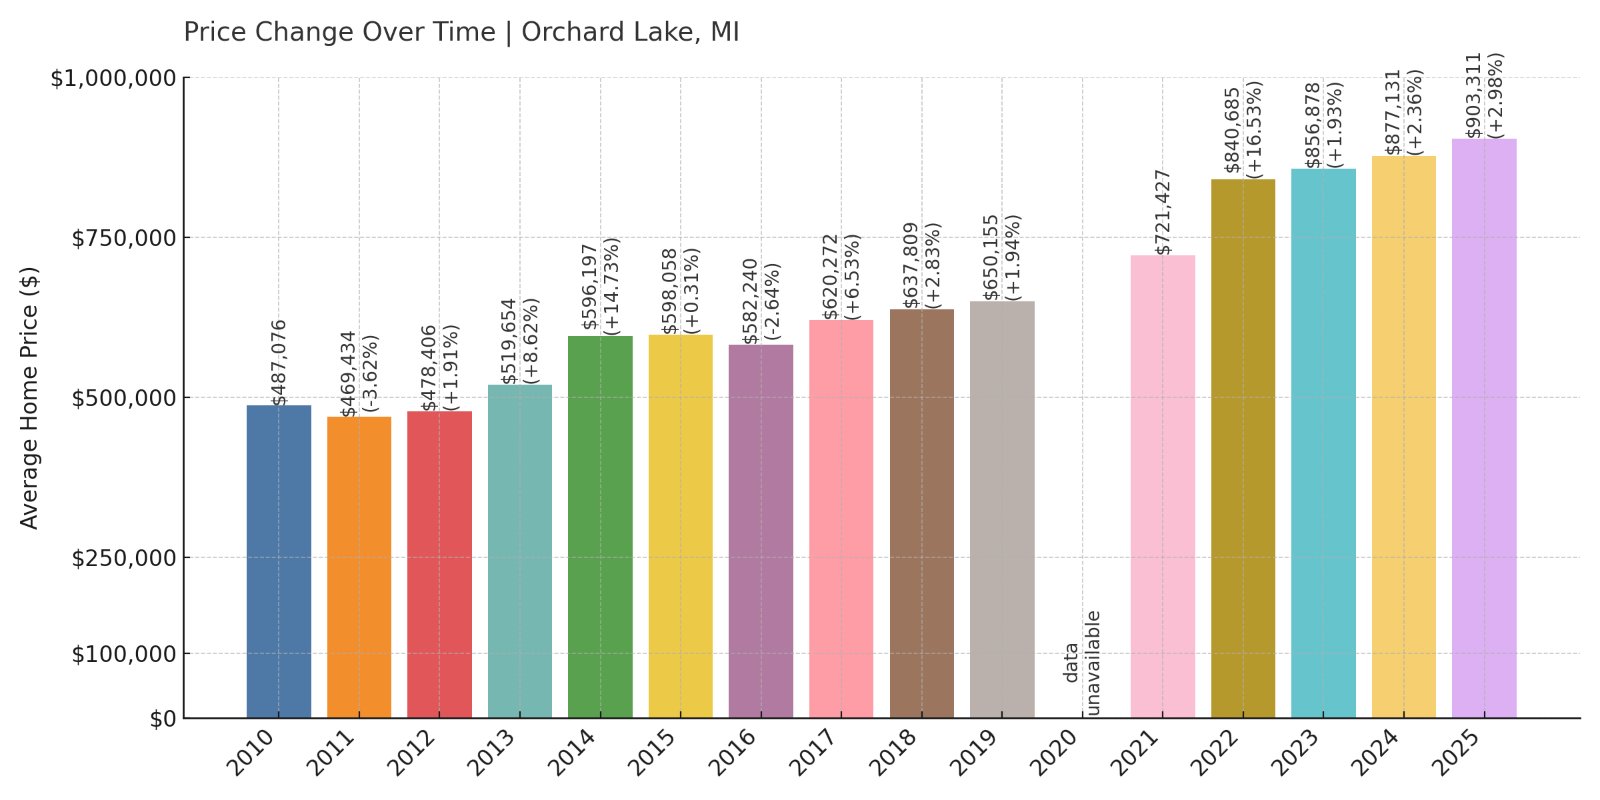
🔥 Would you like to save this?
- 2010: $487,076
- 2011: $469,434 (-$17,641, -3.62% from previous year)
- 2012: $478,406 (+$8,972, +1.91% from previous year)
- 2013: $519,654 (+$41,248, +8.62% from previous year)
- 2014: $596,197 (+$76,543, +14.73% from previous year)
- 2015: $598,058 (+$1,861, +0.31% from previous year)
- 2016: $582,240 (-$15,818, -2.64% from previous year)
- 2017: $620,272 (+$38,032, +6.53% from previous year)
- 2018: $637,809 (+$17,537, +2.83% from previous year)
- 2019: $650,155 (+$12,345, +1.94% from previous year)
- 2020: N/A
- 2021: $721,427
- 2022: $840,685 (+$119,257, +16.53% from previous year)
- 2023: $856,878 (+$16,193, +1.93% from previous year)
- 2024: $877,131 (+$20,252, +2.36% from previous year)
- 2025: $903,311 (+$26,181, +2.98% from previous year)
Home prices in Orchard Lake have grown from $469,434 in 2011 to $903,311 in 2025—an increase of 93%. A significant boost in 2022, followed by steady growth, reflects strong ongoing demand.
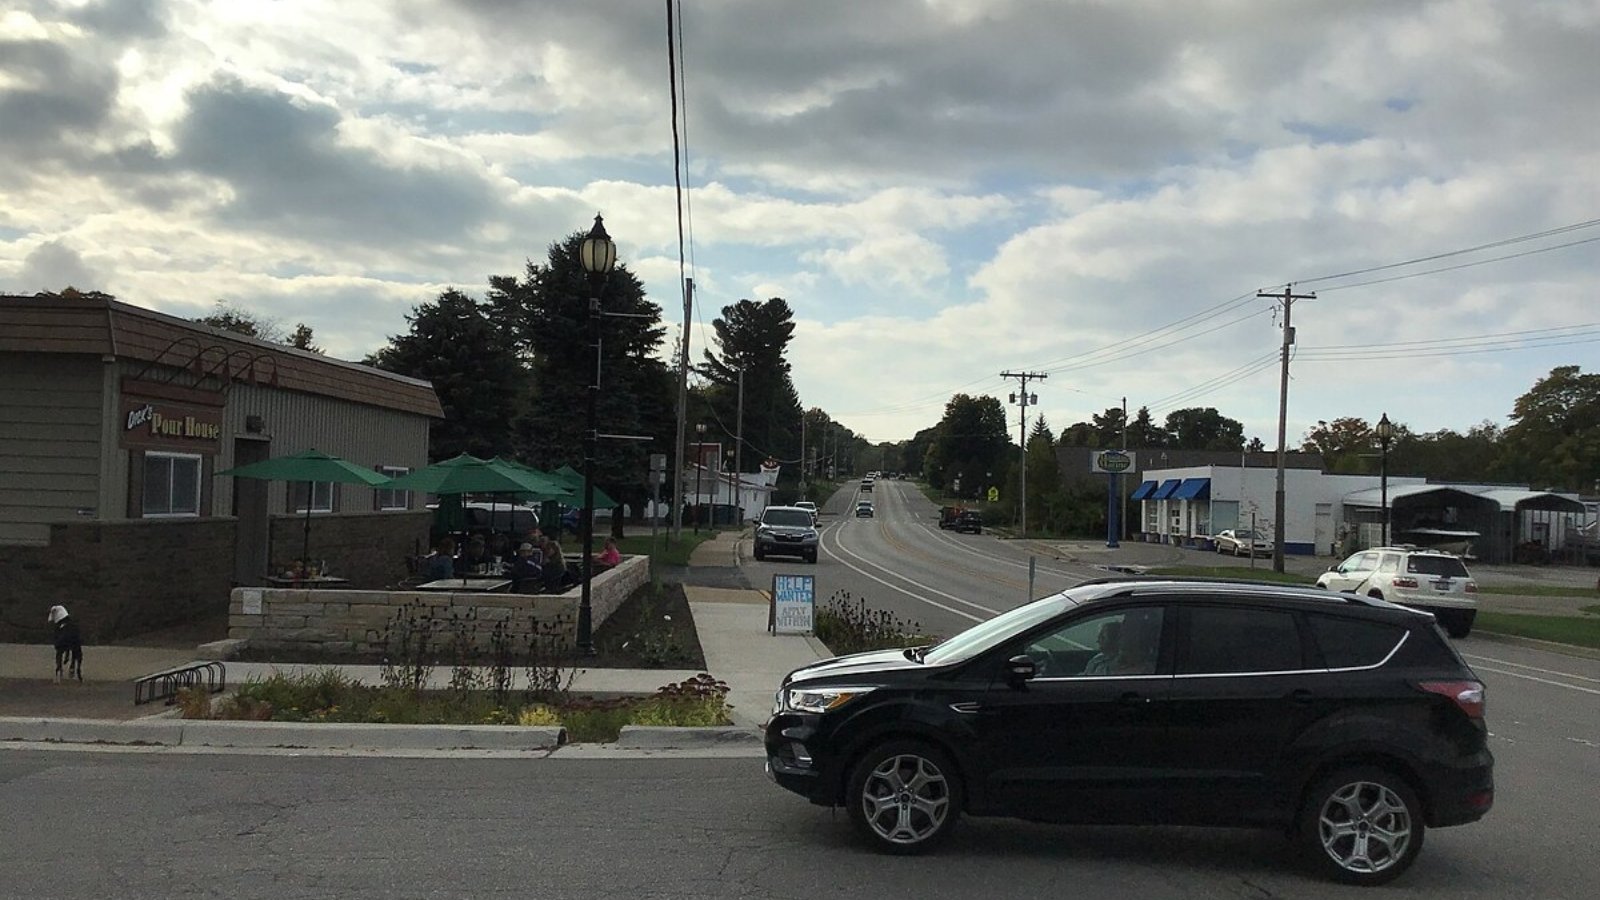
Orchard Lake – Luxury Living in Oakland County
Orchard Lake Village is a wealthy enclave in Oakland County, surrounded by multiple lakes and home to expansive properties. It offers a blend of privacy, exclusivity, and access to outdoor recreation, making it a favorite among affluent buyers.
As one of the most prestigious communities in southeast Michigan, it commands consistently high prices. The 2022 surge pushed it closer to the $900K threshold, and by 2025, it continues its trajectory as one of the state’s premier residential destinations.
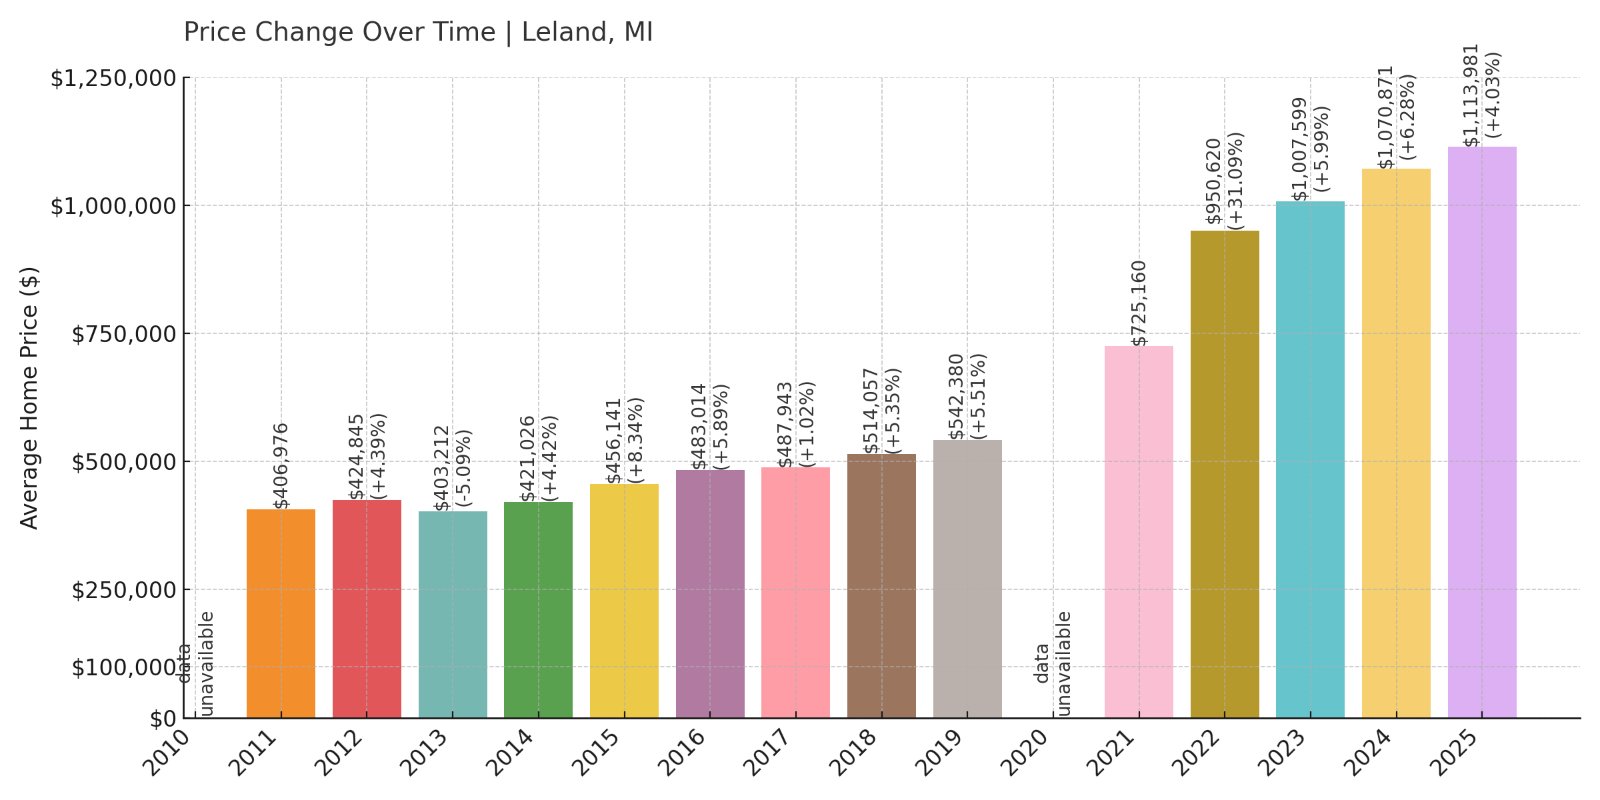
2. Leland – 174% Home Price Increase Since 2011
- 2010: N/A
- 2011: $406,976
- 2012: $424,845 (+$17,869, +4.39% from previous year)
- 2013: $403,212 (-$21,633, -5.09% from previous year)
- 2014: $421,026 (+$17,813, +4.42% from previous year)
- 2015: $456,141 (+$35,115, +8.34% from previous year)
- 2016: $483,014 (+$26,873, +5.89% from previous year)
- 2017: $487,943 (+$4,929, +1.02% from previous year)
- 2018: $514,057 (+$26,114, +5.35% from previous year)
- 2019: $542,380 (+$28,324, +5.51% from previous year)
- 2020: N/A
- 2021: $725,160
- 2022: $950,620 (+$225,460, +31.09% from previous year)
- 2023: $1,007,599 (+$56,979, +5.99% from previous year)
- 2024: $1,070,871 (+$63,272, +6.28% from previous year)
- 2025: $1,113,981 (+$43,110, +4.03% from previous year)
Leland’s home values have nearly tripled since 2011, increasing from $406,976 to over $1.1 million in 2025—a 174% gain. A massive surge in 2022, with a single-year increase of more than $225,000, catapulted Leland to the #2 spot statewide.
Leland – Million-Dollar Homes on Lake Michigan’s Shore
Known for its picturesque harbor, historic Fishtown district, and charming downtown, Leland is a jewel of Michigan’s northwest coast. Tucked between Lake Michigan and Lake Leelanau, it attracts high-end buyers looking for a blend of natural beauty and exclusivity.
Real estate here is scarce and highly sought after, particularly for waterfront properties. This scarcity, paired with growing interest from out-of-state investors, has driven a dramatic climb in prices. By 2025, Leland stands out as one of the few Michigan towns to break the million-dollar average home mark.
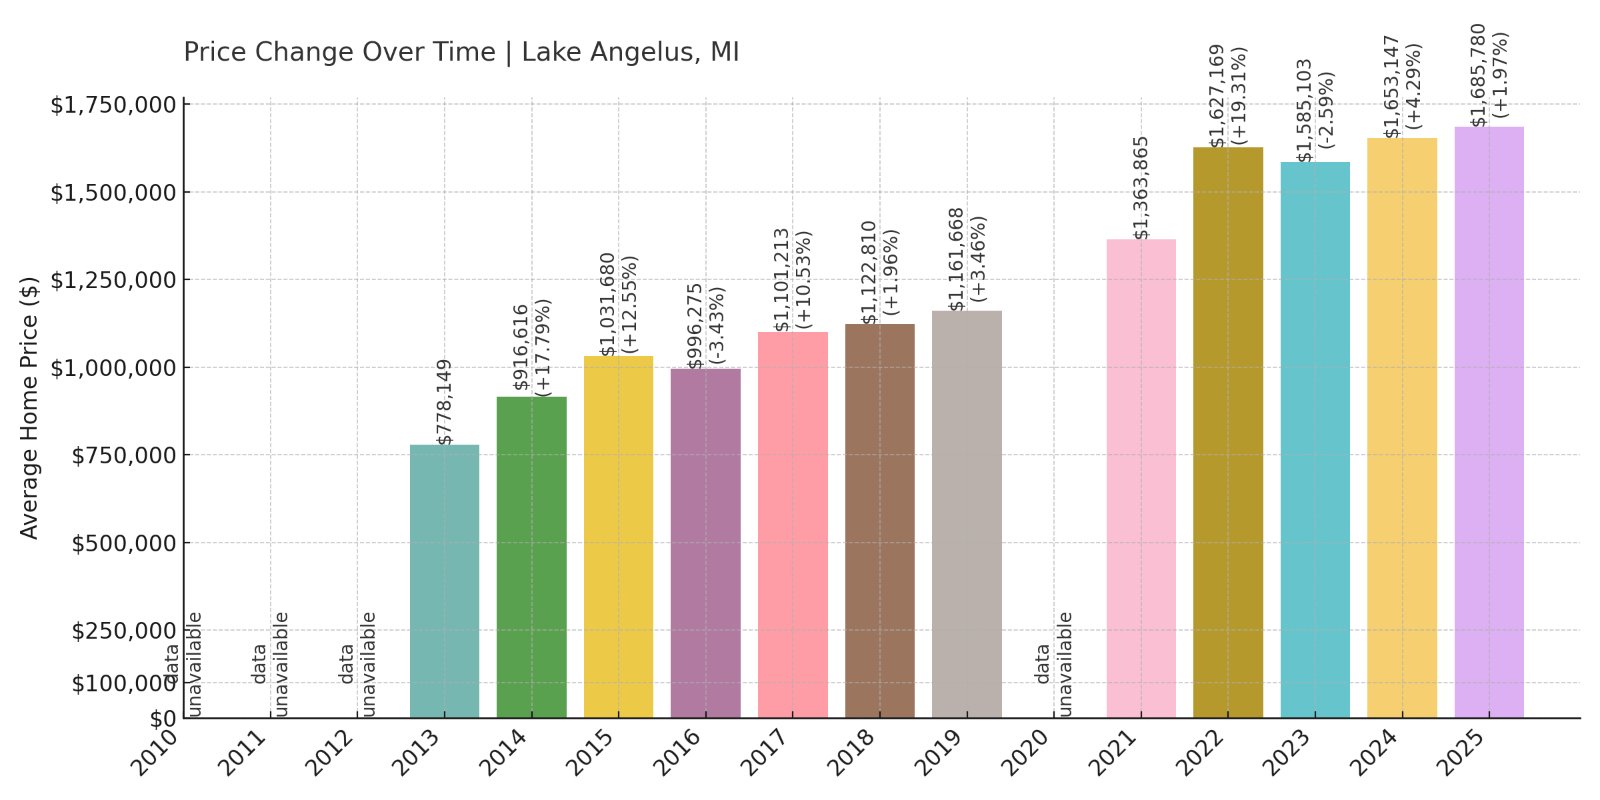
1. Lake Angelus – 117% Home Price Increase Since 2013
- 2010: N/A
- 2011: N/A
- 2012: N/A
- 2013: $778,149
- 2014: $916,616 (+$138,467, +17.79% from previous year)
- 2015: $1,031,680 (+$115,063, +12.55% from previous year)
- 2016: $996,275 (-$35,405, -3.43% from previous year)
- 2017: $1,101,213 (+$104,939, +10.53% from previous year)
- 2018: $1,122,810 (+$21,596, +1.96% from previous year)
- 2019: $1,161,668 (+$38,859, +3.46% from previous year)
- 2020: N/A
- 2021: $1,363,865
- 2022: $1,627,169 (+$263,304, +19.31% from previous year)
- 2023: $1,585,103 (-$42,066, -2.59% from previous year)
- 2024: $1,653,147 (+$68,045, +4.29% from previous year)
- 2025: $1,685,780 (+$32,633, +1.97% from previous year)
Lake Angelus tops the list with home prices climbing from $778,149 in 2013 to nearly $1.69 million in 2025. That’s a 117% increase in just over a decade. While prices dipped slightly in 2023, they’ve since resumed upward growth.
Lake Angelus – Michigan’s Most Exclusive Address
Located in Oakland County, Lake Angelus is one of the smallest cities in Michigan by population and one of the wealthiest by income. It’s centered around a private, spring-fed lake with no public access, and homeownership here offers unmatched seclusion and status.
The market is defined by ultra-luxury lakefront properties and long-term homeowners, which limits turnover and inflates value. With average prices approaching $1.7 million in 2025, Lake Angelus remains in a league of its own for exclusivity and price.