🔥 Would you like to save this?
Million-dollar homes aren’t hard to find in Massachusetts—but the prices in some towns might still make you blink. The Zillow Home Value Index shows 39 communities where property prices now top $1 million—and in some cases, nearly $3 million. From the exclusive shores of Martha’s Vineyard to the polished suburbs outside Boston, these towns have climbed the luxury ladder fast, especially during the post-pandemic property boom. Whether you’re house-hunting or just curious how the top 1% lives, these are the places where buyers need serious money just to compete.
39. Wenham – 106% Home Price Increase Since 2010

- 2010: $512,136
- 2011: $512,344 (+$209, +0.04% from previous year)
- 2012: $509,762 (−$2,582, −0.50% from previous year)
- 2013: $523,830 (+$14,067, +2.76% from previous year)
- 2014: $541,357 (+$17,527, +3.35% from previous year)
- 2015: $568,420 (+$27,064, +5.00% from previous year)
- 2016: $588,333 (+$19,913, +3.50% from previous year)
- 2017: $605,352 (+$17,019, +2.89% from previous year)
- 2018: $628,857 (+$23,505, +3.88% from previous year)
- 2019: $650,150 (+$21,293, +3.39% from previous year)
- 2020: $671,370 (+$21,220, +3.26% from previous year)
- 2021: $788,282 (+$116,911, +17.41% from previous year)
- 2022: $888,881 (+$100,600, +12.76% from previous year)
- 2023: $894,802 (+$5,921, +0.67% from previous year)
- 2024: $1,022,480 (+$127,679, +14.27% from previous year)
- 2025: $1,057,533 (+$35,053, +3.43% from previous year)
Wenham’s housing market demonstrates remarkable consistency in growth, with the median home price more than doubling from $512,136 in 2010 to $1,057,533 in 2025. The town experienced particularly strong growth during the pandemic years, jumping 17.41% in 2021 and maintaining momentum with a substantial 14.27% increase in 2024. This steady appreciation reflects the community’s appeal as a desirable North Shore destination that has successfully crossed the million-dollar threshold.
In order to come up with the very specific design ideas, we create most designs with the assistance of state-of-the-art AI interior design software. Also, assume links that take you off the site are affiliate links such as links to Amazon. this means we may earn a commission if you buy something.
Wenham – North Shore Charm Meets Premium Values
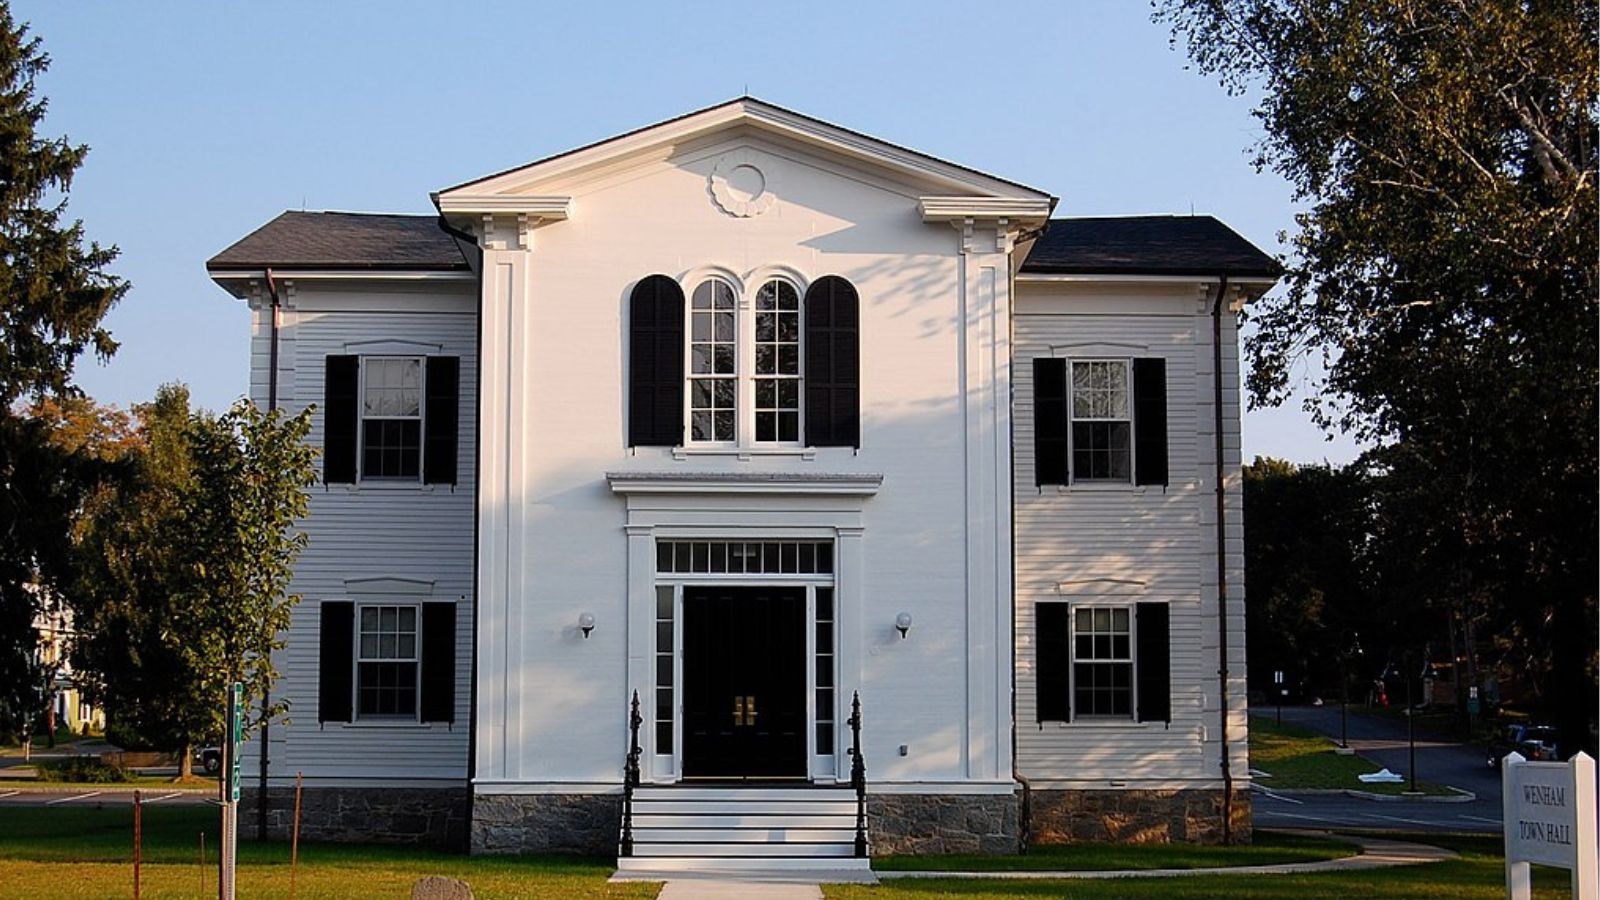
Located on Massachusetts’ scenic North Shore, Wenham combines small-town New England charm with proximity to both Boston and the region’s beautiful coastline. This Essex County community of approximately 5,000 residents sits just 25 miles north of Boston, making it an attractive option for professionals seeking a quieter lifestyle while maintaining reasonable access to urban employment centers. The town’s rural character, featuring historic homes, horse farms, and conservation land, creates an exclusive atmosphere that appeals to affluent buyers.
The town’s recent surge past the million-dollar mark represents a significant milestone that places Wenham firmly among Massachusetts’ premium markets. With limited new construction due to large lot requirements and conservation restrictions, supply remains constrained while demand from Boston-area professionals continues to drive values higher. The combination of excellent schools, natural beauty, and convenient commuter rail access to Boston positions Wenham for continued appreciation.
38. Truro – 86% Home Price Increase Since 2010

- 2010: $568,357
- 2011: $501,890 (−$66,467, −11.69% from previous year)
- 2012: $477,740 (−$24,150, −4.81% from previous year)
- 2013: $498,716 (+$20,976, +4.39% from previous year)
- 2014: $513,129 (+$14,413, +2.89% from previous year)
- 2015: $527,021 (+$13,891, +2.71% from previous year)
- 2016: $544,271 (+$17,250, +3.27% from previous year)
- 2017: $570,423 (+$26,152, +4.80% from previous year)
- 2018: $597,410 (+$26,987, +4.73% from previous year)
- 2019: $617,724 (+$20,314, +3.40% from previous year)
- 2020: $622,871 (+$5,146, +0.83% from previous year)
- 2021: $777,110 (+$154,239, +24.76% from previous year)
- 2022: $936,015 (+$158,906, +20.45% from previous year)
- 2023: $963,475 (+$27,460, +2.93% from previous year)
- 2024: $1,032,985 (+$69,510, +7.21% from previous year)
- 2025: $1,058,776 (+$25,791, +2.50% from previous year)
Truro’s housing market tells a story of dramatic recovery and growth, particularly following the initial dip during the early 2010s recession. After falling to $477,740 in 2012, home values began a steady climb that accelerated dramatically during the pandemic years. The town saw explosive growth of 24.76% in 2021 and 20.45% in 2022, pushing median prices well above the million-dollar mark for the first time. This Cape Cod community has become increasingly attractive to buyers seeking coastal properties.
Truro – Outer Cape Wilderness and Coastal Beauty
Positioned on Cape Cod’s outer reaches, Truro offers some of the most pristine and undeveloped coastline in Massachusetts. This Barnstable County town encompasses both Atlantic Ocean and Cape Cod Bay shorelines, providing residents with diverse beach experiences from the dramatic surf of the outer beach to the calmer waters of the bay side. Much of Truro falls within the Cape Cod National Seashore, ensuring permanent protection of its natural landscapes and limiting development opportunities.
Truro’s recent price surge reflects growing demand for Cape Cod properties, particularly those offering extensive privacy and ocean access. The town’s strict zoning regulations and environmental protections limit new construction, creating scarcity that drives values higher. With climate change increasing awareness of coastal property risks, Truro’s elevated locations and natural beauty continue to attract buyers willing to pay premium prices for one of New England’s most spectacular coastal settings.
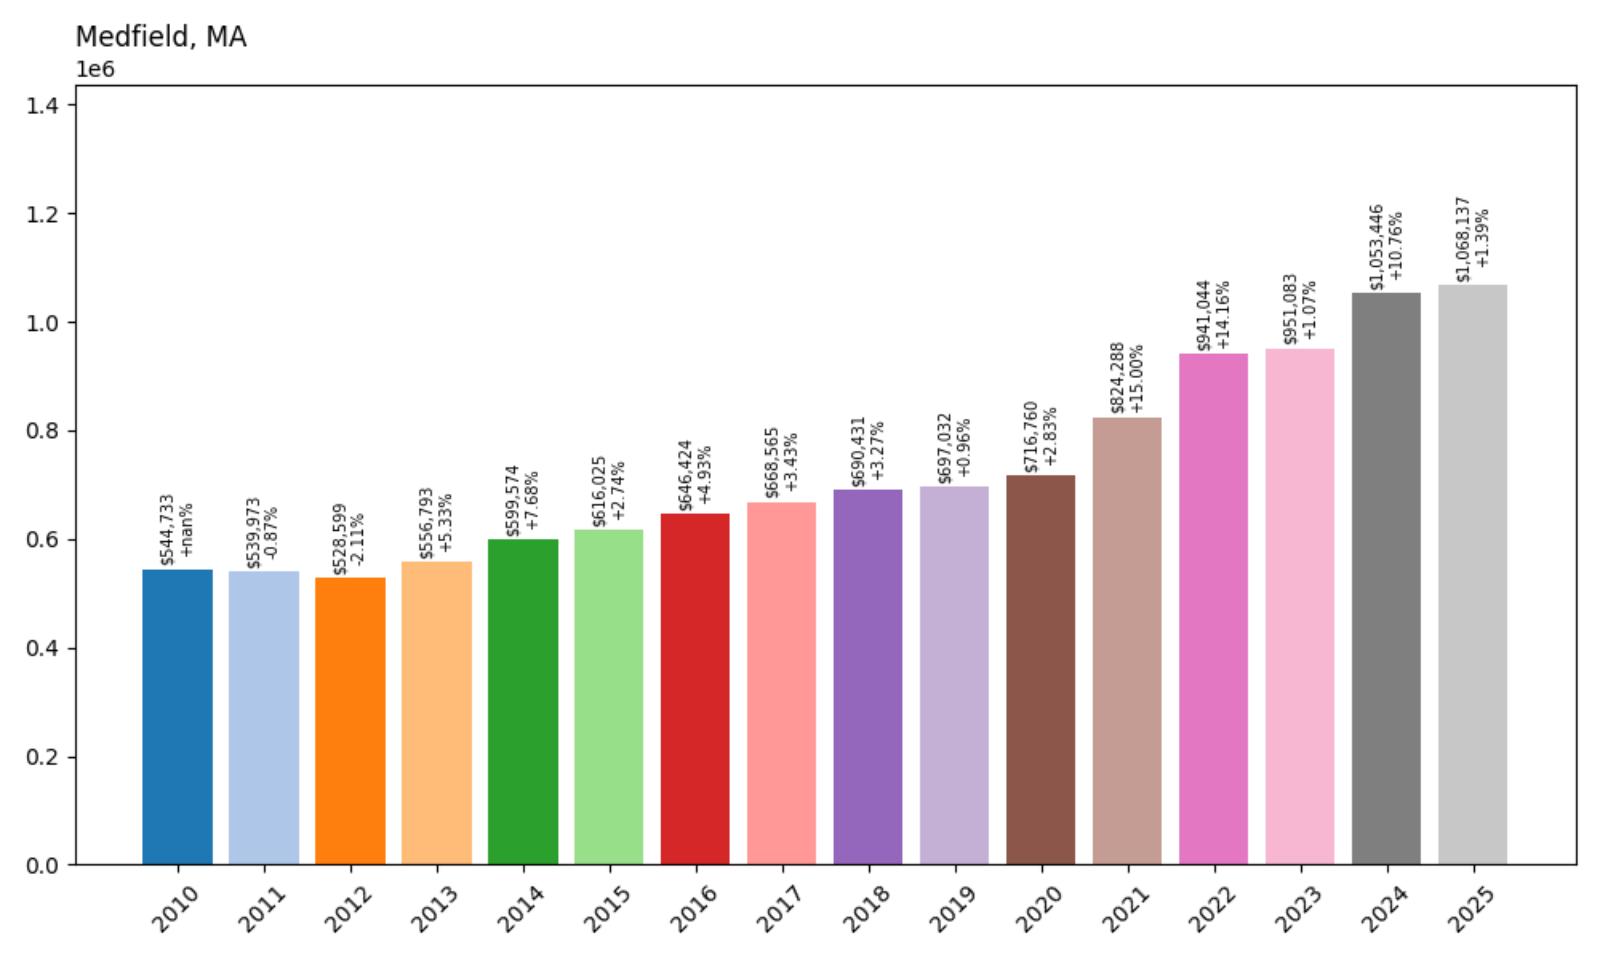
37. Medfield – 96% Home Price Increase Since 2010
- 2010: $544,733
- 2011: $539,973 (−$4,761, −0.87% from previous year)
- 2012: $528,599 (−$11,374, −2.11% from previous year)
- 2013: $556,793 (+$28,194, +5.33% from previous year)
- 2014: $599,574 (+$42,781, +7.68% from previous year)
- 2015: $616,025 (+$16,451, +2.74% from previous year)
- 2016: $646,424 (+$30,399, +4.93% from previous year)
- 2017: $668,565 (+$22,141, +3.43% from previous year)
- 2018: $690,431 (+$21,866, +3.27% from previous year)
- 2019: $697,032 (+$6,601, +0.96% from previous year)
- 2020: $716,760 (+$19,728, +2.83% from previous year)
- 2021: $824,288 (+$107,528, +15.00% from previous year)
- 2022: $941,044 (+$116,756, +14.16% from previous year)
- 2023: $951,083 (+$10,039, +1.07% from previous year)
- 2024: $1,053,446 (+$102,363, +10.76% from previous year)
- 2025: $1,068,137 (+$14,691, +1.39% from previous year)
Medfield’s housing market showcases steady, sustainable growth that nearly doubled home values from $544,733 in 2010 to $1,068,137 in 2025. The town experienced particularly strong momentum during the pandemic years with consecutive double-digit increases of 15.00% in 2021 and 14.16% in 2022. After a brief cooling period in 2023, the market resurged with a robust 10.76% gain in 2024, demonstrating the community’s enduring appeal to homebuyers seeking quality suburban living.
Medfield – Family-Friendly Excellence in MetroWest
Located in Norfolk County about 20 miles southwest of Boston, Medfield has established itself as one of Massachusetts’ premier family communities. This MetroWest town of approximately 12,500 residents combines excellent public schools with a strong sense of community, creating an environment that consistently attracts families willing to pay premium prices for quality of life. The Medfield Public Schools regularly rank among the state’s top performers, with high school students achieving exceptional standardized test scores and college acceptance rates.
Medfield’s consistent price appreciation reflects its position as a highly desirable suburban community that successfully balances growth with character preservation. The town’s strict zoning regulations ensure that new development maintains quality standards while protecting existing neighborhoods. With excellent commuter rail access to Boston and a reputation for municipal services and low crime rates, Medfield continues to attract affluent families driving sustained demand for its limited housing stock.
36. Harwich Port – 122% Home Price Increase Since 2010
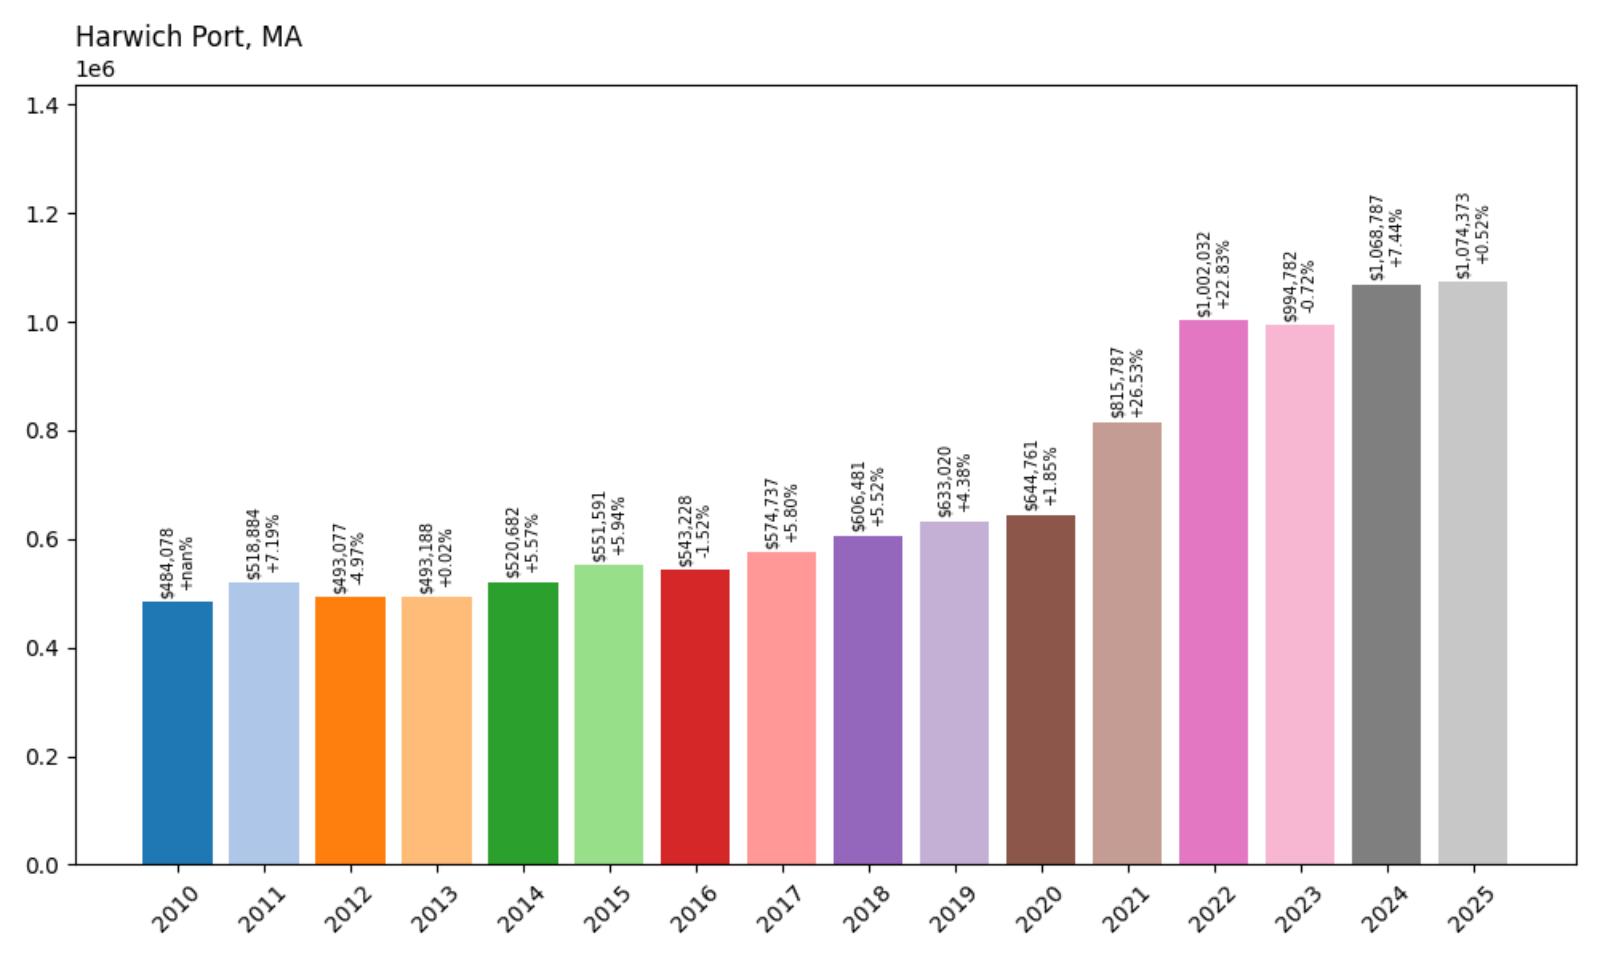
- 2010: $484,078
- 2011: $518,884 (+$34,806, +7.19% from previous year)
- 2012: $493,077 (−$25,808, −4.97% from previous year)
- 2013: $493,188 (+$111, +0.02% from previous year)
- 2014: $520,682 (+$27,495, +5.57% from previous year)
- 2015: $551,591 (+$30,909, +5.94% from previous year)
- 2016: $543,228 (−$8,363, −1.52% from previous year)
- 2017: $574,737 (+$31,509, +5.80% from previous year)
- 2018: $606,481 (+$31,745, +5.52% from previous year)
- 2019: $633,020 (+$26,539, +4.38% from previous year)
- 2020: $644,761 (+$11,740, +1.85% from previous year)
- 2021: $815,787 (+$171,026, +26.53% from previous year)
- 2022: $1,002,032 (+$186,245, +22.83% from previous year)
- 2023: $994,782 (−$7,250, −0.72% from previous year)
- 2024: $1,068,787 (+$74,005, +7.44% from previous year)
- 2025: $1,074,373 (+$5,586, +0.52% from previous year)
Harwich Port’s real estate market demonstrates the volatile yet ultimately rewarding nature of Cape Cod coastal properties. Starting at $484,078 in 2010, the market experienced steady growth before exploding during the pandemic with gains of 26.53% in 2021 and 22.83% in 2022, pushing values above the million-dollar threshold. The community’s transformation from a modest coastal town to a million-dollar market reflects the increasing desirability of Cape Cod waterfront properties and the limited supply of coastal real estate.
Harwich Port – Quintessential Cape Cod Harbor Community
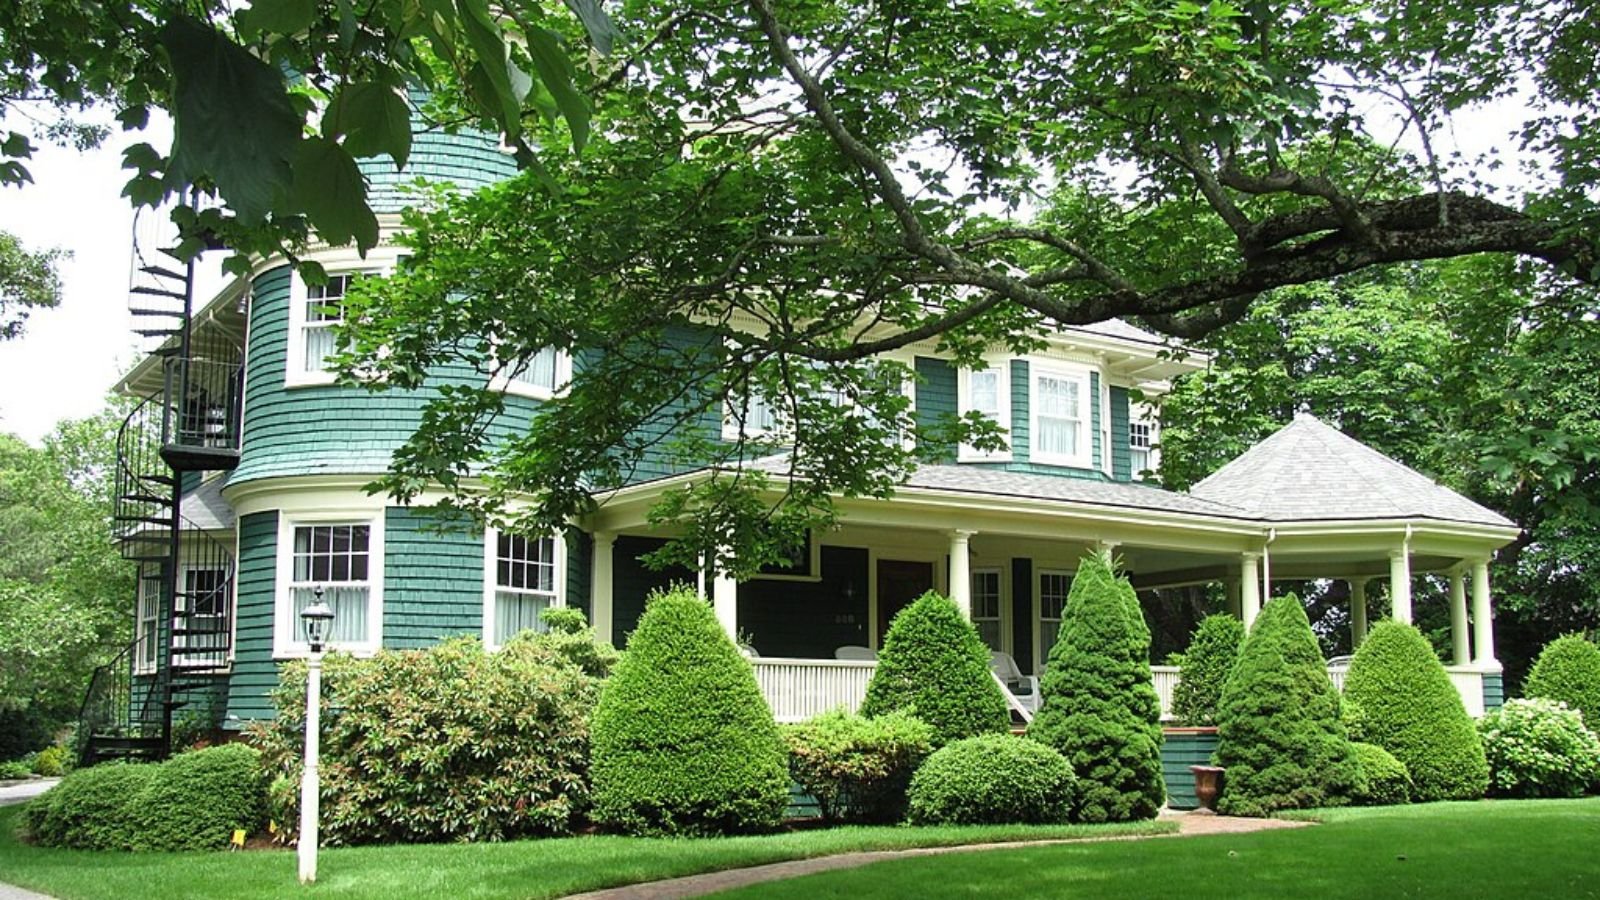
Harwich Port serves as one of Cape Cod’s most charming harbor communities, offering classic New England coastal living with a protected harbor that attracts boating enthusiasts from throughout the region. Located on Nantucket Sound in Barnstable County, this village within the larger town of Harwich features beautiful beaches, a working harbor, and a walkable downtown area filled with shops, restaurants, and galleries. The community’s maritime character is preserved through strict zoning that maintains the scale and character of traditional Cape architecture.
The dramatic price appreciation reflects growing recognition of Harwich Port’s unique assets and the broader trend toward Cape Cod properties as both lifestyle choices and investment opportunities. Limited developable land due to environmental restrictions and the community’s commitment to preserving its historic character have created scarcity that drives values higher. With climate change making coastal property increasingly precious, Harwich Port’s established infrastructure and elevated locations continue to attract buyers seeking authentic Cape Cod living.
35. Cambridge – 113% Home Price Increase Since 2010
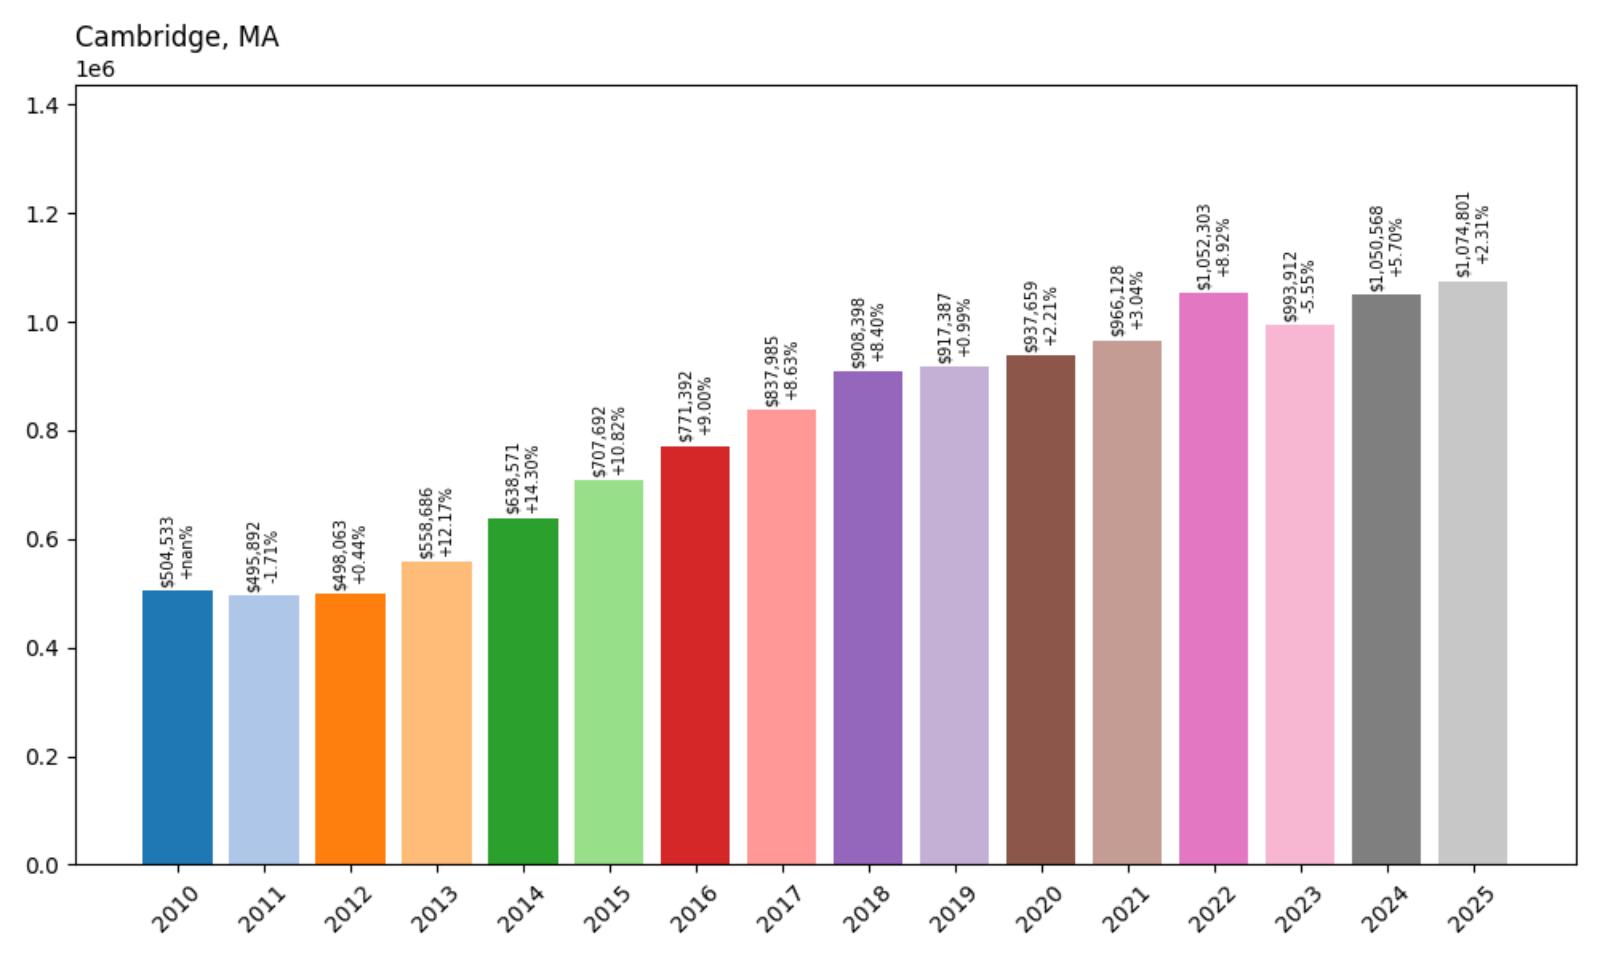
- 2010: $504,533
- 2011: $495,892 (−$8,640, −1.71% from previous year)
- 2012: $498,063 (+$2,171, +0.44% from previous year)
- 2013: $558,686 (+$60,622, +12.17% from previous year)
- 2014: $638,571 (+$79,885, +14.30% from previous year)
- 2015: $707,692 (+$69,121, +10.82% from previous year)
- 2016: $771,392 (+$63,699, +9.00% from previous year)
- 2017: $837,985 (+$66,593, +8.63% from previous year)
- 2018: $908,398 (+$70,413, +8.40% from previous year)
- 2019: $917,387 (+$8,990, +0.99% from previous year)
- 2020: $937,659 (+$20,271, +2.21% from previous year)
- 2021: $966,128 (+$28,469, +3.04% from previous year)
- 2022: $1,052,303 (+$86,176, +8.92% from previous year)
- 2023: $993,912 (−$58,391, −5.55% from previous year)
- 2024: $1,050,568 (+$56,656, +5.70% from previous year)
- 2025: $1,074,801 (+$24,232, +2.31% from previous year)
Cambridge’s housing market reflects the city’s status as a global center for education and innovation, with median home prices more than doubling from $504,533 in 2010 to $1,074,801 in 2025. The market showed remarkable consistency through the 2010s with steady annual gains typically ranging from 8% to 14%, before moderating during the pandemic years. Unlike many communities that saw explosive pandemic-era growth, Cambridge experienced more measured increases, reflecting its mature market status and diverse housing stock.
Cambridge – Innovation Hub and Academic Powerhouse
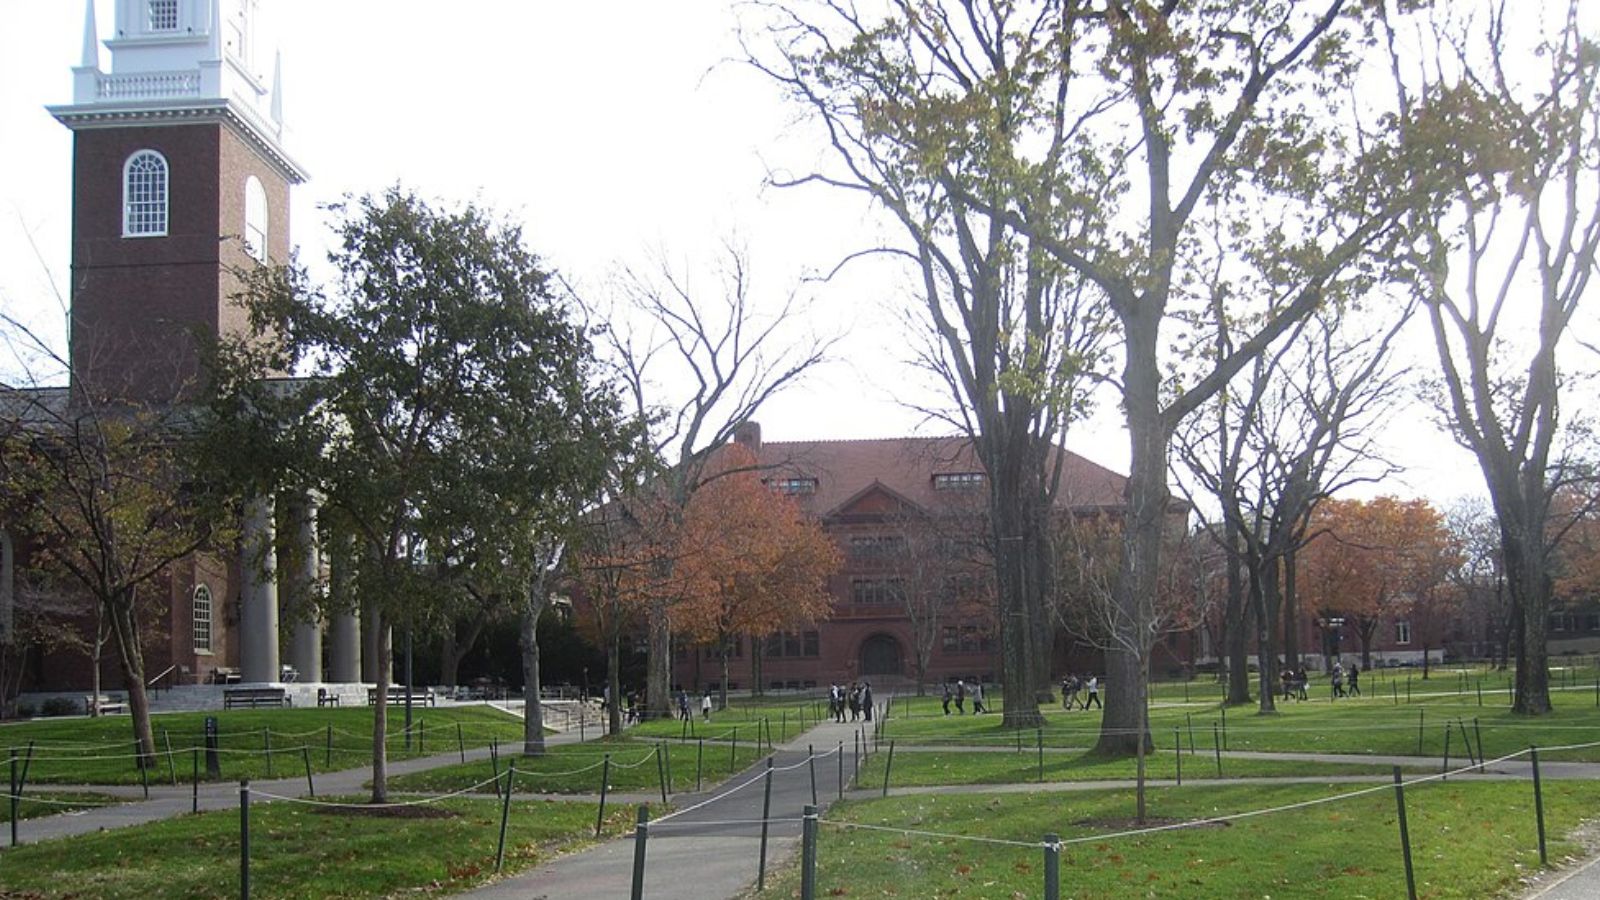
Home to Harvard University and the Massachusetts Institute of Technology, Cambridge stands as one of the world’s premier centers for higher education and technological innovation. This Middlesex County city of approximately 120,000 residents has transformed from a traditional college town into a global hub for biotechnology, software development, and startups. The presence of these prestigious institutions, along with numerous research facilities and technology companies, creates a unique economic ecosystem that supports high property values and attracts highly educated residents.
Cambridge’s steady price appreciation reflects its fundamental economic strengths and limited supply of housing relative to demand from the education and technology sectors. The city’s strict zoning regulations and historic preservation requirements limit new construction while maintaining neighborhood character. With continued growth in the biotech and technology industries, plus the enduring presence of world-class universities, Cambridge remains one of Massachusetts’ most economically resilient markets, supporting sustained high property values despite periodic market fluctuations.
34. Milton – 119% Home Price Increase Since 2010

- 2010: $492,561
- 2011: $489,503 (−$3,057, −0.62% from previous year)
- 2012: $480,247 (−$9,256, −1.89% from previous year)
- 2013: $517,676 (+$37,429, +7.79% from previous year)
- 2014: $566,916 (+$49,240, +9.51% from previous year)
- 2015: $597,892 (+$30,976, +5.46% from previous year)
- 2016: $652,812 (+$54,920, +9.19% from previous year)
- 2017: $685,659 (+$32,846, +5.03% from previous year)
- 2018: $729,713 (+$44,055, +6.43% from previous year)
- 2019: $759,545 (+$29,832, +4.09% from previous year)
- 2020: $772,337 (+$12,792, +1.68% from previous year)
- 2021: $883,984 (+$111,647, +14.46% from previous year)
- 2022: $975,262 (+$91,278, +10.33% from previous year)
- 2023: $971,304 (−$3,958, −0.41% from previous year)
- 2024: $1,074,667 (+$103,362, +10.64% from previous year)
- 2025: $1,079,693 (+$5,027, +0.47% from previous year)
Milton’s real estate market demonstrates the strong appeal of communities offering both suburban tranquility and urban accessibility, with home values more than doubling from $492,561 in 2010 to $1,079,693 in 2025. The town experienced consistent growth throughout the 2010s, with particularly strong performance in 2016 and 2018. The pandemic period brought accelerated appreciation with a 14.46% jump in 2021, followed by sustained momentum that pushed the market above the million-dollar threshold for the first time in 2024.
Milton – Historic Elegance Meets Modern Convenience

Located just eight miles south of downtown Boston in Norfolk County, Milton combines rich colonial history with modern suburban amenities to create one of Greater Boston’s most desirable residential communities. This town of approximately 28,000 residents features an impressive collection of historic homes, including numerous properties dating to the 18th and 19th centuries, alongside well-planned modern developments. Milton’s elevation provides many properties with sweeping views of Boston Harbor and the Blue Hills, adding to the community’s visual appeal and property values.
Milton’s steady price appreciation reflects its unique combination of historic character, natural beauty, and practical advantages for Boston-area professionals. The town maintains excellent public transportation connections to downtown Boston through both subway and commuter rail service, making it attractive to workers across various industries. With strict zoning that preserves neighborhood character and limited opportunities for new construction, Milton’s housing market benefits from constrained supply while demand remains strong from buyers seeking established communities with proven track records of value retention.
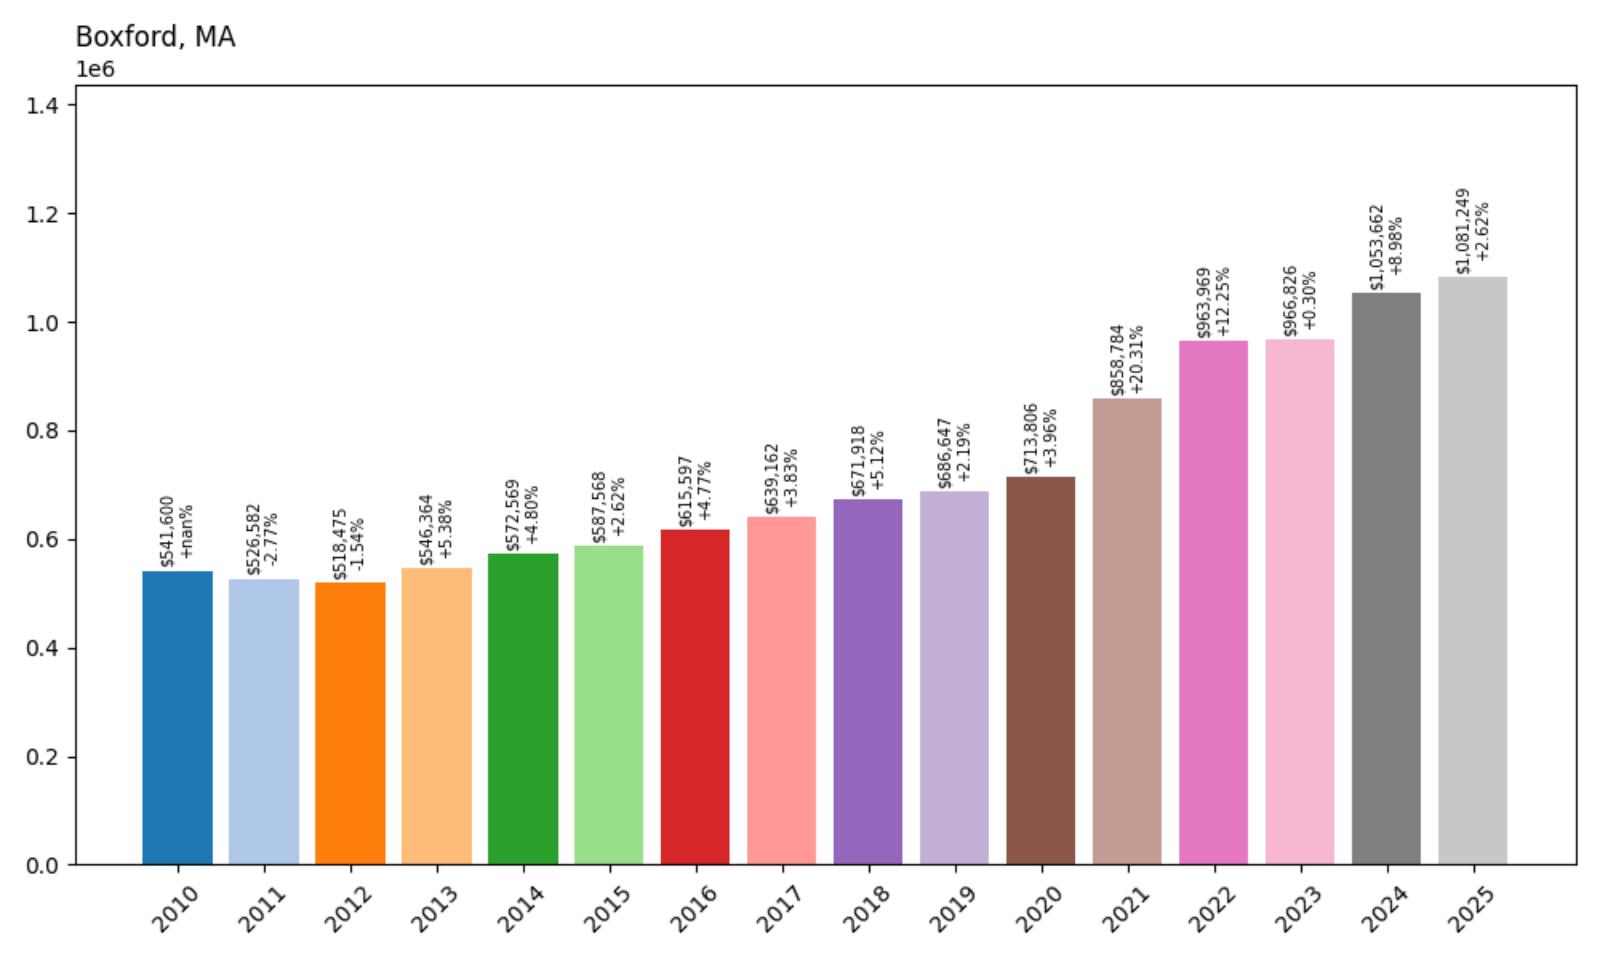
33. Boxford – 100% Home Price Increase Since 2010
🔥 Would you like to save this?
- 2010: $541,600
- 2011: $526,582 (−$15,018, −2.77% from previous year)
- 2012: $518,475 (−$8,106, −1.54% from previous year)
- 2013: $546,364 (+$27,888, +5.38% from previous year)
- 2014: $572,569 (+$26,206, +4.80% from previous year)
- 2015: $587,568 (+$14,999, +2.62% from previous year)
- 2016: $615,597 (+$28,029, +4.77% from previous year)
- 2017: $639,162 (+$23,565, +3.83% from previous year)
- 2018: $671,918 (+$32,756, +5.12% from previous year)
- 2019: $686,647 (+$14,729, +2.19% from previous year)
- 2020: $713,806 (+$27,159, +3.96% from previous year)
- 2021: $858,784 (+$144,978, +20.31% from previous year)
- 2022: $963,969 (+$105,185, +12.25% from previous year)
- 2023: $966,826 (+$2,857, +0.30% from previous year)
- 2024: $1,053,662 (+$86,837, +8.98% from previous year)
- 2025: $1,081,249 (+$27,587, +2.62% from previous year)
Boxford’s housing market achieved the remarkable milestone of exactly doubling in value from $541,600 in 2010 to $1,081,249 in 2025, representing a perfect 100% increase over the 15-year period. The town experienced modest but steady growth through the 2010s before accelerating dramatically during the pandemic with a 20.31% surge in 2021. This Essex County community successfully transitioned from an upper-middle-class suburb to a million-dollar market, reflecting growing demand for rural character within commuting distance of Boston.
Boxford – Rural Tranquility on the North Shore

Boxford epitomizes the rural New England lifestyle while remaining accessible to major employment centers, making it increasingly attractive to affluent buyers seeking space and privacy. This Essex County town of approximately 8,500 residents features large lots, horse properties, and extensive conservation land that preserves its agricultural character. Located about 25 miles north of Boston, Boxford offers the rare combination of rural living with reasonable access to both Boston and the North Shore’s coastal communities.
Boxford’s dramatic price appreciation reflects the premium buyers place on privacy, space, and rural character in an increasingly developed region. The town’s zoning restrictions effectively limit the housing supply while demand grows from Boston-area professionals seeking larger properties and outdoor amenities. With excellent public schools, low crime rates, and a location that provides access to both urban employment and coastal recreation, Boxford represents a lifestyle choice that commands increasingly premium prices in today’s competitive real estate market.
32. Orleans – 92% Home Price Increase Since 2010

- 2010: $562,992
- 2011: $544,705 (−$18,287, −3.25% from previous year)
- 2012: $521,084 (−$23,622, −4.34% from previous year)
- 2013: $543,075 (+$21,992, +4.22% from previous year)
- 2014: $559,789 (+$16,713, +3.08% from previous year)
- 2015: $575,296 (+$15,507, +2.77% from previous year)
- 2016: $587,504 (+$12,208, +2.12% from previous year)
- 2017: $615,021 (+$27,517, +4.68% from previous year)
- 2018: $643,135 (+$28,114, +4.57% from previous year)
- 2019: $661,755 (+$18,620, +2.90% from previous year)
- 2020: $659,392 (−$2,363, −0.36% from previous year)
- 2021: $826,267 (+$166,875, +25.31% from previous year)
- 2022: $994,348 (+$168,082, +20.34% from previous year)
- 2023: $1,002,383 (+$8,035, +0.81% from previous year)
- 2024: $1,078,067 (+$75,683, +7.55% from previous year)
- 2025: $1,082,426 (+$4,359, +0.40% from previous year)
Orleans experienced a gradual recovery from early 2010s recession impacts before exploding during the pandemic years, with home values climbing 92% from $562,992 in 2010 to $1,082,426 in 2025. The town’s market showed remarkable acceleration in 2021 and 2022 with consecutive gains of 25.31% and 20.34%, pushing median prices above the million-dollar mark for the first time. This Cape Cod community has transformed from a moderately priced coastal town to a premium market that attracts affluent buyers seeking authentic New England seaside living.
Orleans – Gateway to Cape Cod’s Natural Wonders
Strategically positioned where Cape Cod begins to narrow toward its outer reaches, Orleans serves as both a year-round community and a gateway to some of New England’s most spectacular natural areas. This Barnstable County town of approximately 6,000 residents offers access to both Nauset Beach on the Atlantic Ocean and calmer waters along Cape Cod Bay, providing diverse coastal experiences within a single community. The town’s location places it within easy reach of the Cape Cod National Seashore while maintaining the amenities and services needed for comfortable year-round living.
The town’s dramatic price appreciation reflects growing recognition of Orleans as an ideal base for Cape Cod living, offering both coastal beauty and year-round viability. Limited development opportunities due to environmental restrictions and the community’s location within the Cape Cod National Seashore create natural constraints on housing supply. With increasing numbers of remote workers able to live anywhere and growing appreciation for coastal lifestyle, Orleans continues to attract buyers willing to pay premium prices for authentic Cape Cod living with modern conveniences.
31. Arlington – 132% Home Price Increase Since 2010
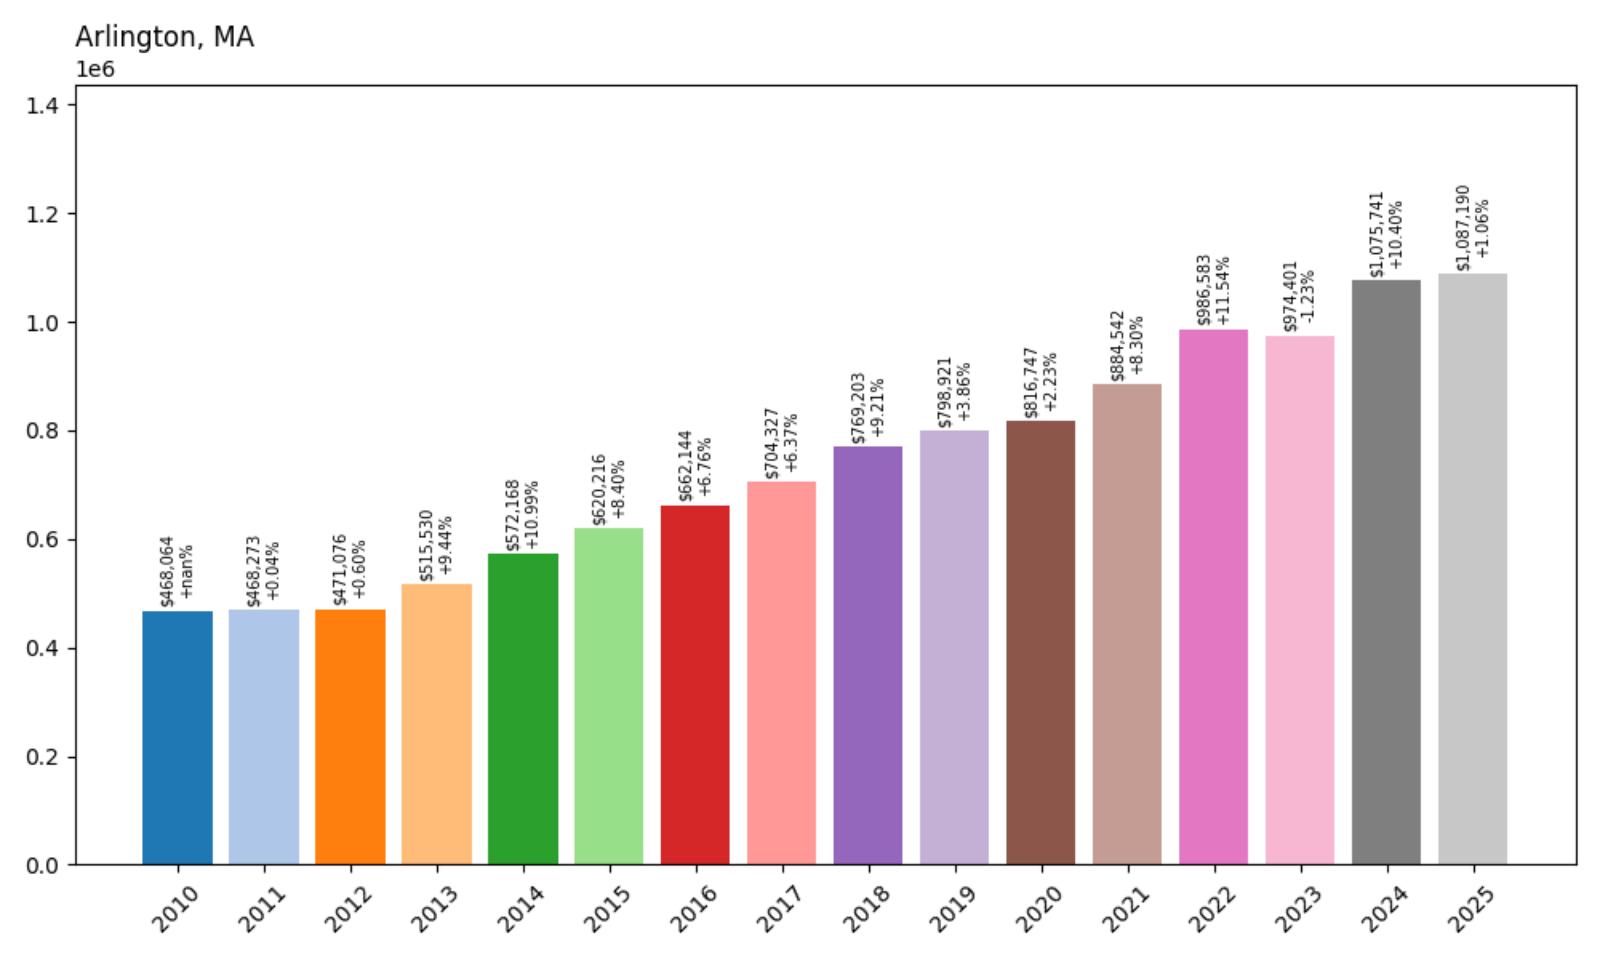
- 2010: $468,064
- 2011: $468,273 (+$209, +0.04% from previous year)
- 2012: $471,076 (+$2,804, +0.60% from previous year)
- 2013: $515,530 (+$44,454, +9.44% from previous year)
- 2014: $572,168 (+$56,638, +10.99% from previous year)
- 2015: $620,216 (+$48,048, +8.40% from previous year)
- 2016: $662,144 (+$41,927, +6.76% from previous year)
- 2017: $704,327 (+$42,184, +6.37% from previous year)
- 2018: $769,203 (+$64,876, +9.21% from previous year)
- 2019: $798,921 (+$29,718, +3.86% from previous year)
- 2020: $816,747 (+$17,826, +2.23% from previous year)
- 2021: $884,542 (+$67,795, +8.30% from previous year)
- 2022: $986,583 (+$102,041, +11.54% from previous year)
- 2023: $974,401 (−$12,182, −1.23% from previous year)
- 2024: $1,075,741 (+$101,341, +10.40% from previous year)
- 2025: $1,087,190 (+$11,448, +1.06% from previous year)
Arlington’s real estate market demonstrates exceptional growth, with home values more than doubling from $468,064 in 2010 to $1,087,190 in 2025, representing a remarkable 132% increase. The town showed consistent strength throughout the 2010s with particularly robust years in 2014, 2016, 2017, and 2018 when annual increases frequently exceeded 6%. Even during the pandemic period, Arlington maintained steady appreciation without the extreme volatility seen in some markets, crossing the million-dollar threshold in 2024 and continuing to build value in 2025.
Arlington – Urban Convenience Meets Suburban Comfort
Tim Pierce, CC BY 3.0, via Wikimedia Commons
Located just six miles northwest of downtown Boston in Middlesex County, Arlington perfectly balances urban accessibility with suburban livability, making it increasingly attractive to professionals who want the best of both worlds. This community of approximately 46,000 residents features excellent public transportation connections to Boston through multiple subway stations on the Red Line, enabling car-free commuting to downtown employment centers. The town’s compact, walkable neighborhoods provide easy access to local shops, restaurants, and services while maintaining distinct residential character.
The town’s dramatic price appreciation reflects its position as one of Greater Boston’s most desirable inner suburbs, offering urban amenities without urban problems. Arlington’s excellent school system, low crime rates, and strong local economy create fundamentals that support continued value growth. With limited opportunities for new construction due to the town’s developed nature and strict zoning, housing supply remains constrained while demand continues from buyers seeking convenient access to Boston’s employment centers and cultural attractions.
30. Duxbury – 100% Home Price Increase Since 2010
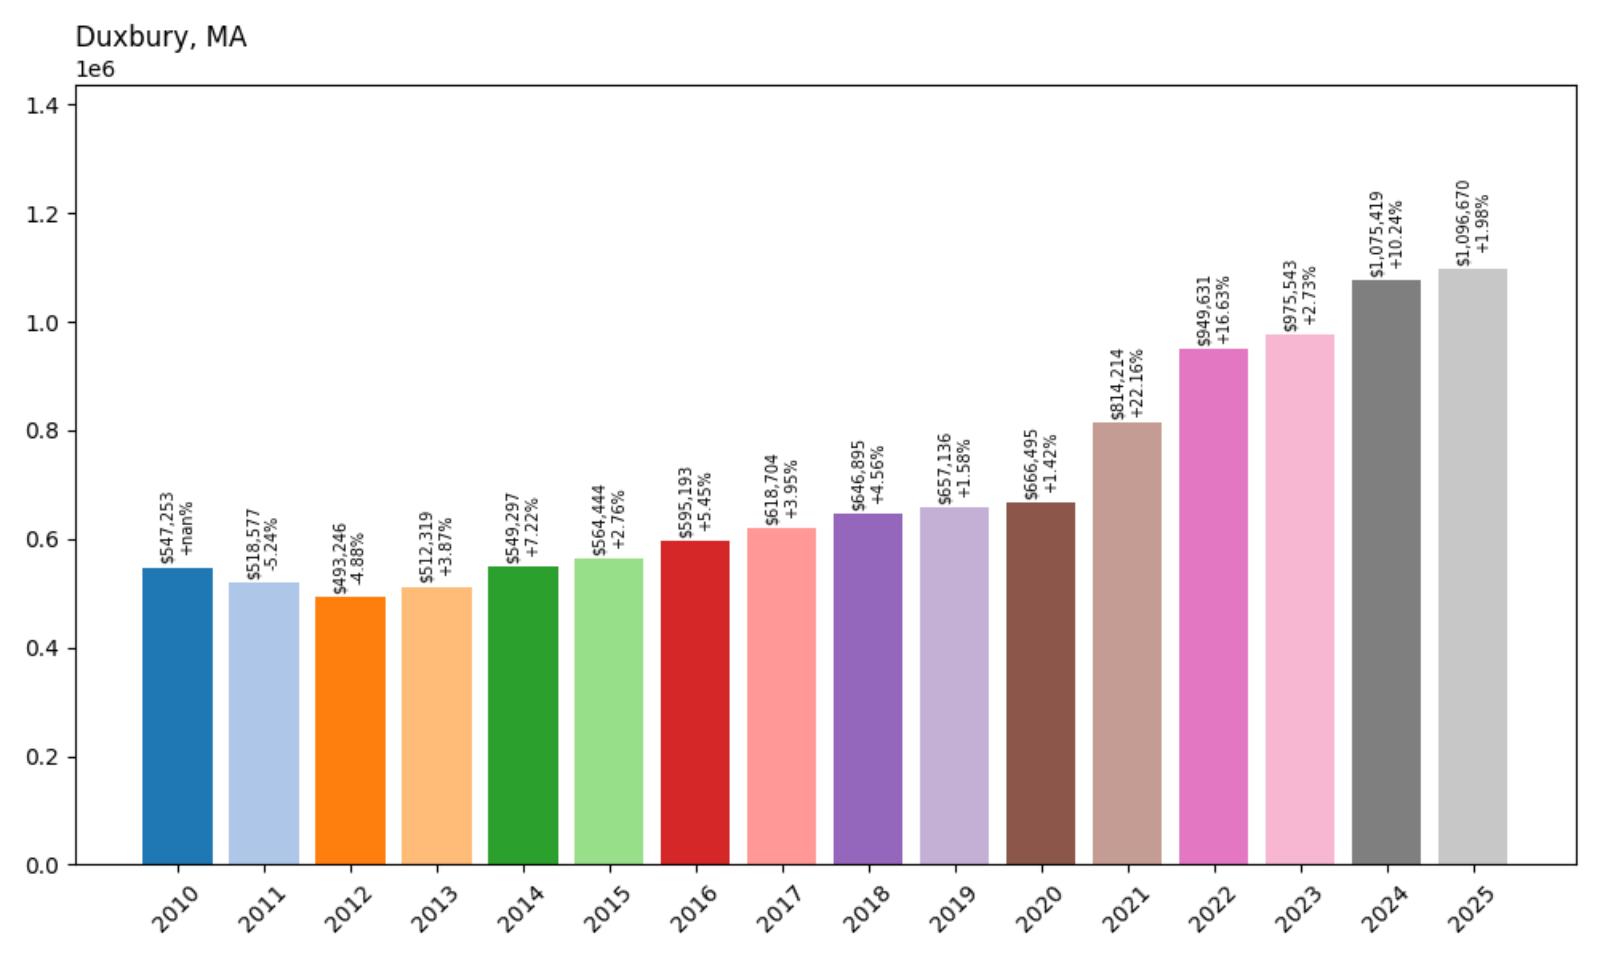
- 2010: $547,253
- 2011: $518,577 (−$28,676, −5.24% from previous year)
- 2012: $493,246 (−$25,330, −4.88% from previous year)
- 2013: $512,319 (+$19,073, +3.87% from previous year)
- 2014: $549,297 (+$36,978, +7.22% from previous year)
- 2015: $564,444 (+$15,147, +2.76% from previous year)
- 2016: $595,193 (+$30,749, +5.45% from previous year)
- 2017: $618,704 (+$23,511, +3.95% from previous year)
- 2018: $646,895 (+$28,190, +4.56% from previous year)
- 2019: $657,136 (+$10,241, +1.58% from previous year)
- 2020: $666,495 (+$9,360, +1.42% from previous year)
- 2021: $814,214 (+$147,718, +22.16% from previous year)
- 2022: $949,631 (+$135,417, +16.63% from previous year)
- 2023: $975,543 (+$25,913, +2.73% from previous year)
- 2024: $1,075,419 (+$99,875, +10.24% from previous year)
- 2025: $1,096,670 (+$21,251, +1.98% from previous year)
Duxbury achieved exactly 100% price appreciation from $547,253 in 2010 to $1,096,670 in 2025, marking a perfect doubling of home values over the 15-year period. After experiencing recession-related declines in the early 2010s, the market began steady recovery that accelerated dramatically during the pandemic years. The town saw explosive growth of 22.16% in 2021 and 16.63% in 2022, successfully crossing the million-dollar threshold and establishing itself as a premium South Shore community.
Duxbury – Historic Coastal Living on the South Shore
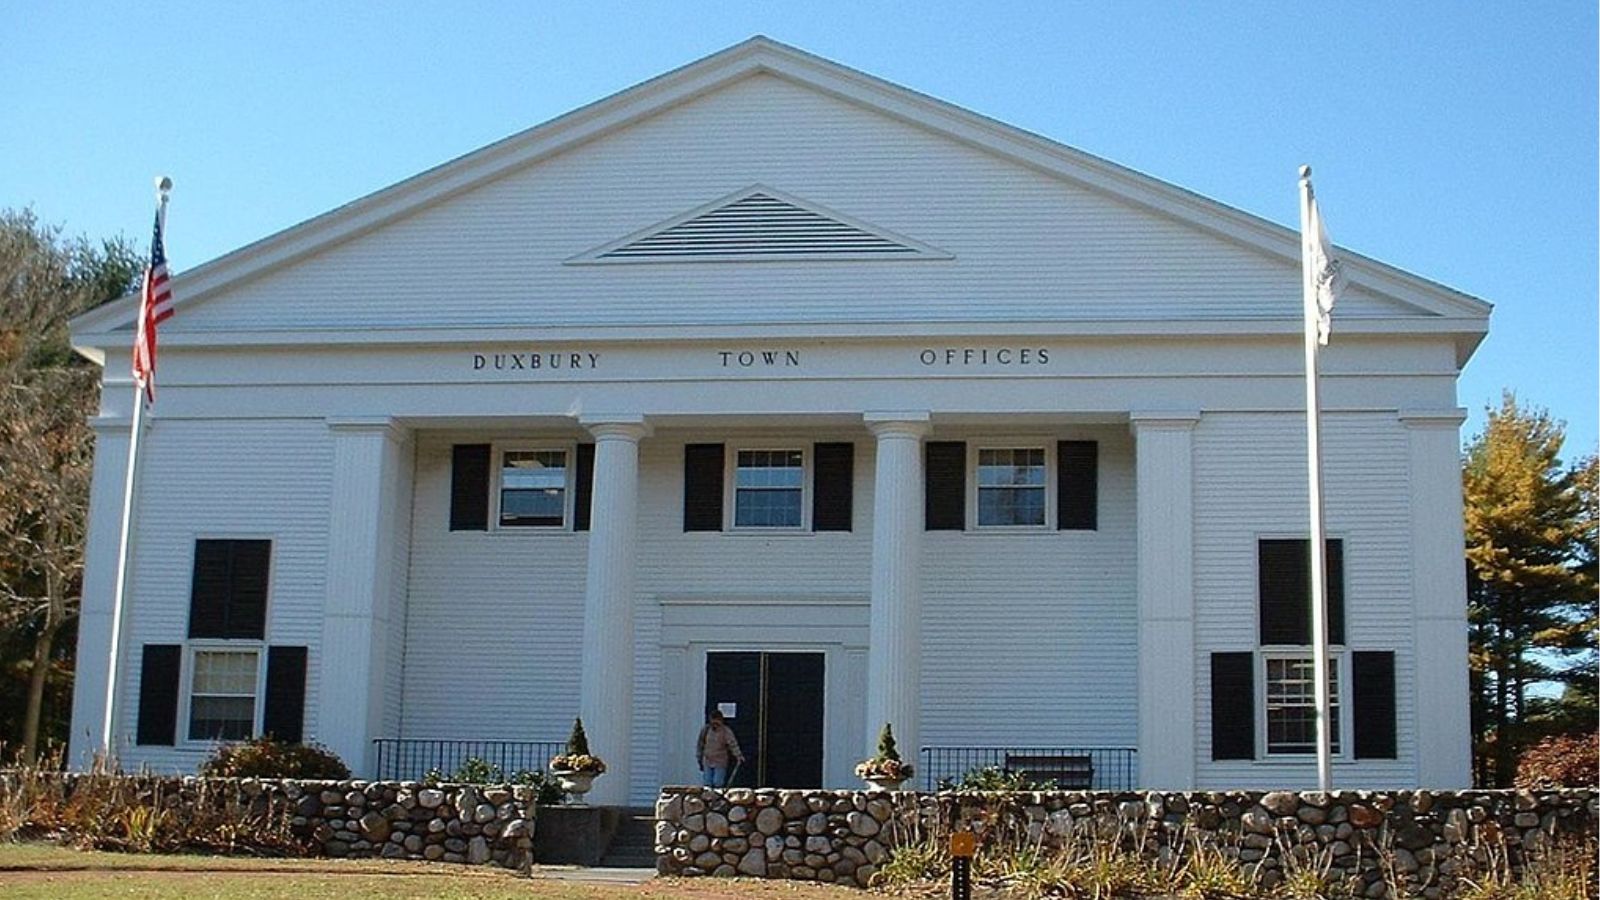
Rich in Plymouth Colony history and blessed with beautiful coastal access, Duxbury combines historical significance with modern coastal living to create one of the South Shore’s most desirable communities. This Plymouth County town of approximately 16,000 residents features miles of pristine beach along Duxbury Bay and direct access to Plymouth Bay, providing residents with exceptional recreational opportunities. The community’s deep roots trace back to 1637, when it was settled by passengers from the Mayflower, creating a unique historical character preserved through numerous landmarks and museums.
The town’s remarkable price doubling reflects growing demand for South Shore coastal properties that offer both lifestyle advantages and investment potential. Duxbury’s strict zoning regulations and commitment to historical preservation limit new construction while maintaining community character, creating natural constraints on housing supply. With increasing recognition of the South Shore as an alternative to more expensive North Shore communities, Duxbury continues to attract affluent buyers seeking coastal living with historical character and modern conveniences.
29. Lynnfield – 115% Home Price Increase Since 2010
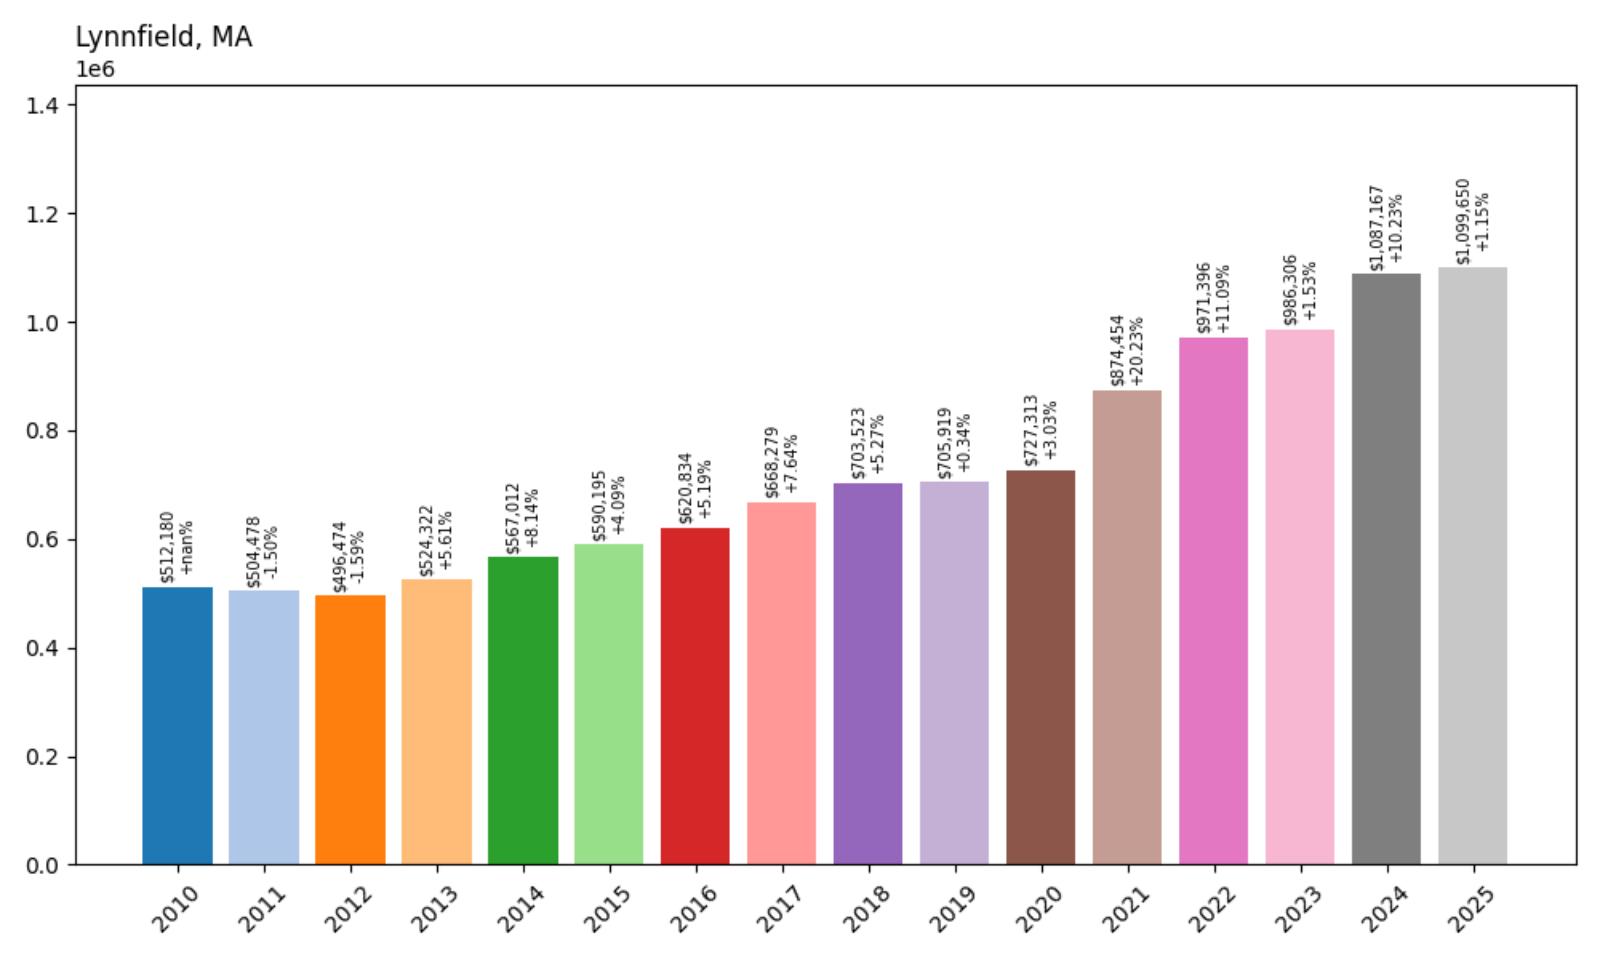
- 2010: $512,180
- 2011: $504,478 (−$7,702, −1.50% from previous year)
- 2012: $496,474 (−$8,004, −1.59% from previous year)
- 2013: $524,322 (+$27,849, +5.61% from previous year)
- 2014: $567,012 (+$42,689, +8.14% from previous year)
- 2015: $590,195 (+$23,183, +4.09% from previous year)
- 2016: $620,834 (+$30,639, +5.19% from previous year)
- 2017: $668,279 (+$47,446, +7.64% from previous year)
- 2018: $703,523 (+$35,244, +5.27% from previous year)
- 2019: $705,919 (+$2,396, +0.34% from previous year)
- 2020: $727,313 (+$21,394, +3.03% from previous year)
- 2021: $874,454 (+$147,141, +20.23% from previous year)
- 2022: $971,396 (+$96,941, +11.09% from previous year)
- 2023: $986,306 (+$14,910, +1.53% from previous year)
- 2024: $1,087,167 (+$100,861, +10.23% from previous year)
- 2025: $1,099,650 (+$12,483, +1.15% from previous year)
Lynnfield’s housing market delivered impressive returns for homeowners, with values more than doubling from $512,180 in 2010 to $1,099,650 in 2025, representing a strong 115% increase. The town demonstrated remarkable consistency throughout the 2010s with particularly strong performance in 2014, 2016, and 2017. The pandemic period brought explosive growth with a 20.23% surge in 2021, followed by sustained momentum that carried the market well above the million-dollar threshold. Lynnfield’s transformation into a premium market reflects its growing recognition as a highly desirable North Shore community.
Lynnfield – North Shore Sophistication and Natural Beauty
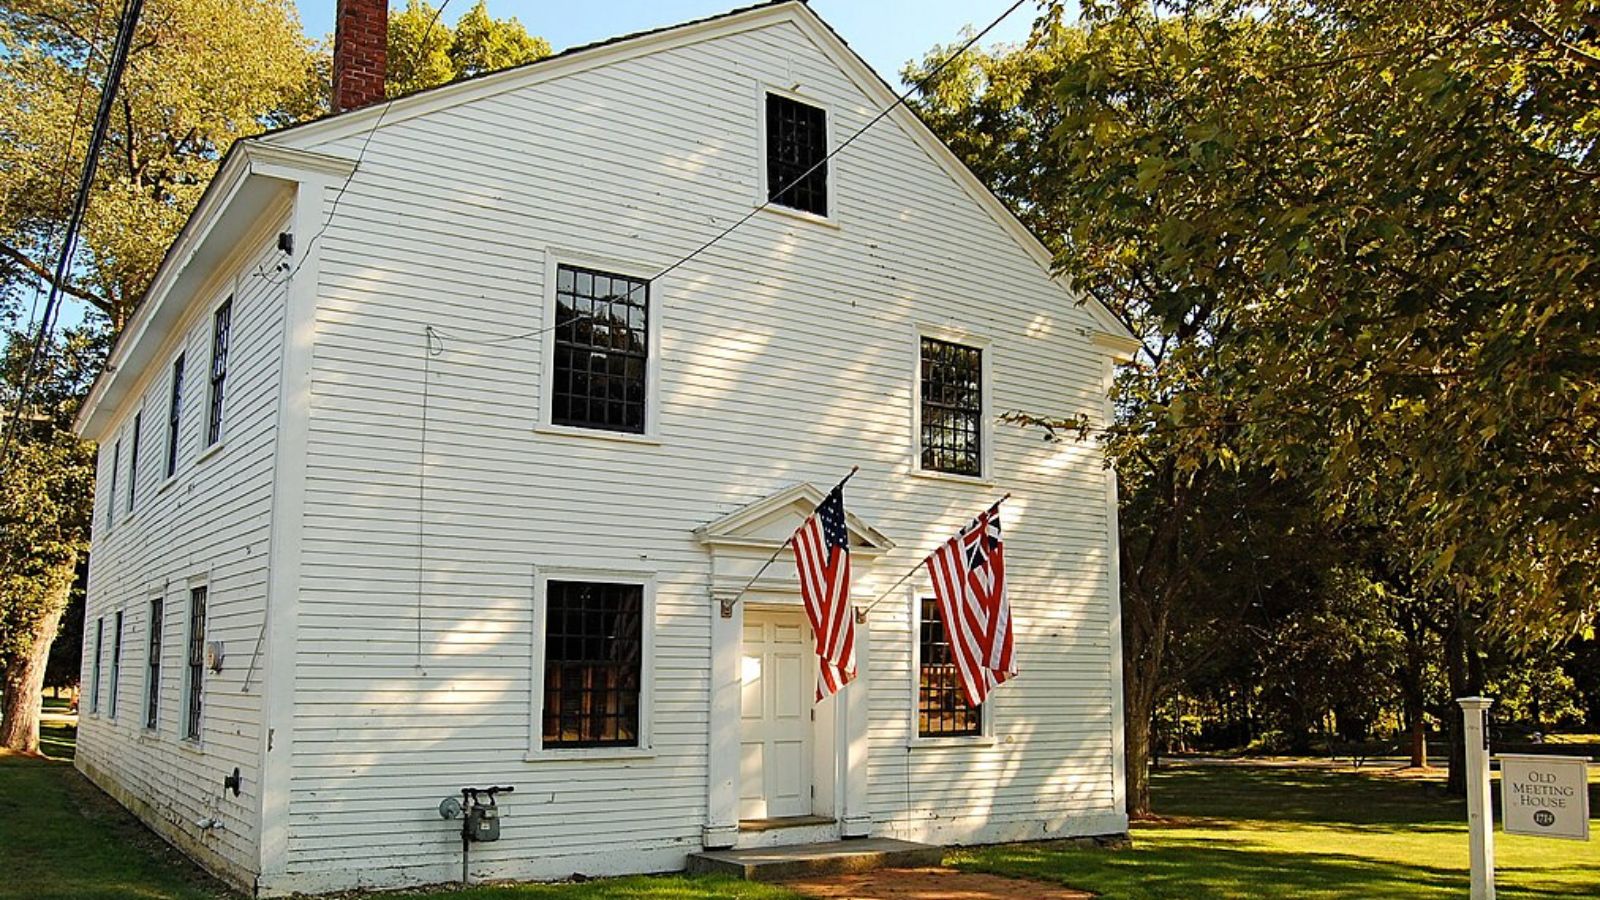
Located approximately 15 miles north of Boston in Essex County, Lynnfield combines upscale suburban living with easy access to both urban employment centers and North Shore recreational opportunities. This community of about 13,000 residents has established itself as one of the region’s most family-friendly towns, featuring excellent public schools, well-maintained neighborhoods, and abundant recreational facilities. The town’s strategic location provides convenient access to major highways while maintaining a quiet, residential character that appeals to professionals seeking quality suburban living.
The town’s substantial price appreciation reflects its position as a premium North Shore community that successfully balances suburban tranquility with urban accessibility. Lynnfield’s excellent school system attracts families willing to pay premium prices for educational quality, while its low crime rates and well-maintained neighborhoods create an environment that supports sustained property values. With limited opportunities for new construction due to the town’s largely developed nature and strict zoning standards, housing supply remains constrained while demand continues from buyers seeking established communities with proven track records.
28. Sudbury – 88% Home Price Increase Since 2010
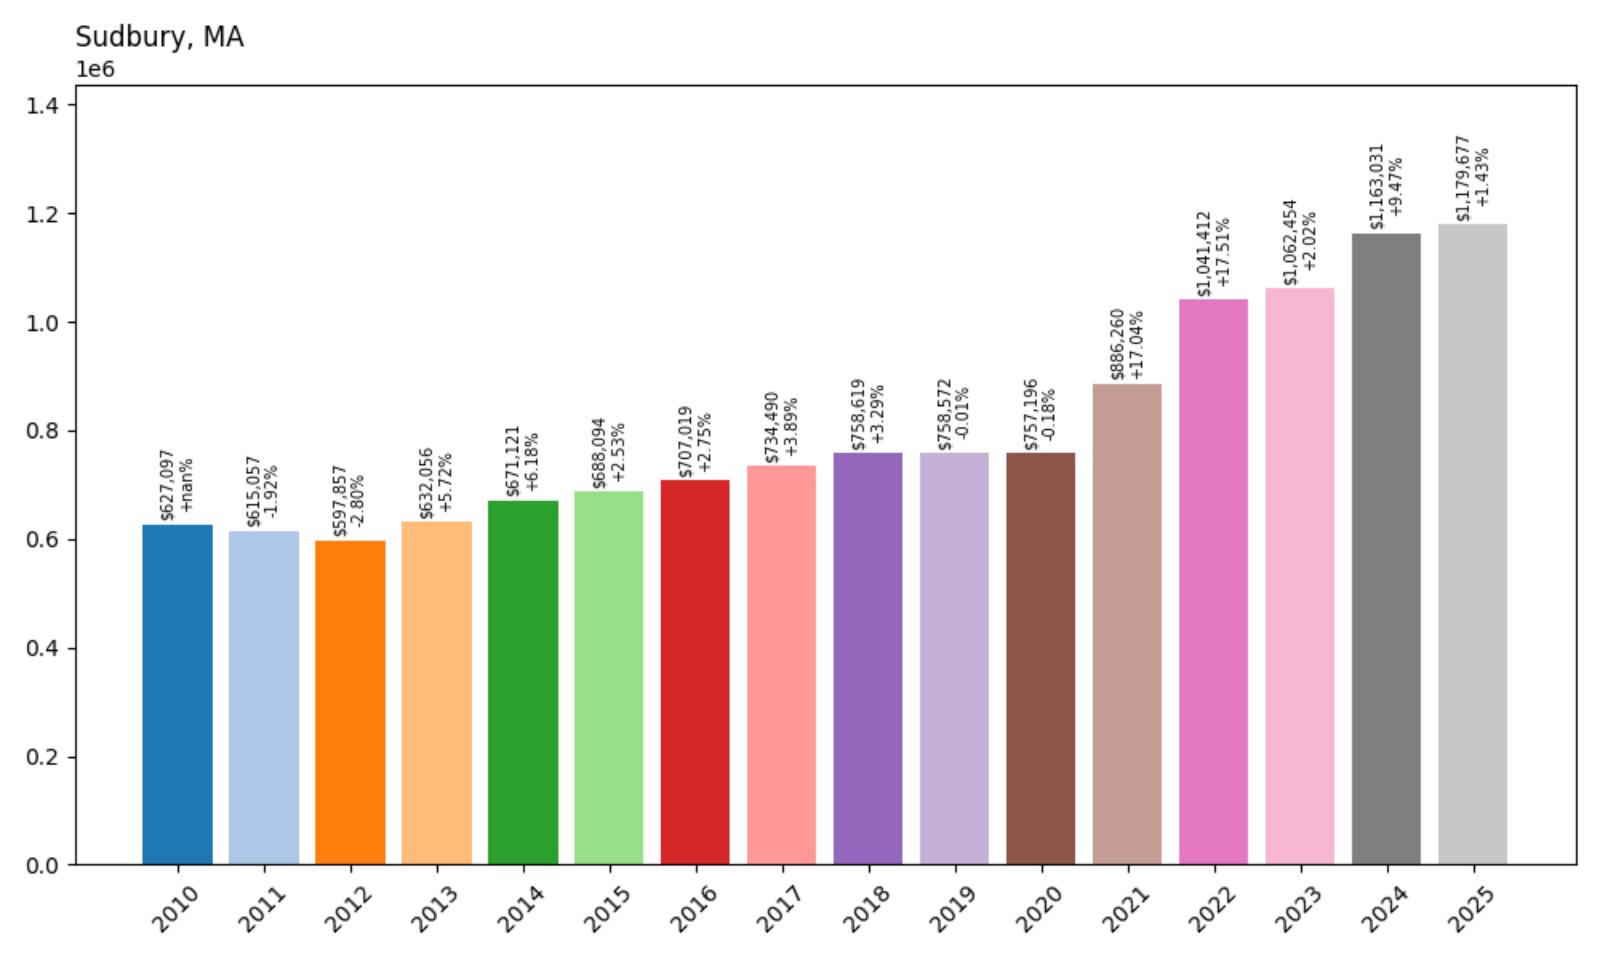
- 2010: $627,097
- 2011: $615,057 (−$12,041, −1.92% from previous year)
- 2012: $597,857 (−$17,200, −2.80% from previous year)
- 2013: $632,056 (+$34,199, +5.72% from previous year)
- 2014: $671,121 (+$39,064, +6.18% from previous year)
- 2015: $688,094 (+$16,973, +2.53% from previous year)
- 2016: $707,019 (+$18,925, +2.75% from previous year)
- 2017: $734,490 (+$27,470, +3.89% from previous year)
- 2018: $758,619 (+$24,129, +3.29% from previous year)
- 2019: $758,572 (−$47, −0.01% from previous year)
- 2020: $757,196 (−$1,376, −0.18% from previous year)
- 2021: $886,260 (+$129,063, +17.04% from previous year)
- 2022: $1,041,412 (+$155,152, +17.51% from previous year)
- 2023: $1,062,454 (+$21,043, +2.02% from previous year)
- 2024: $1,163,031 (+$100,576, +9.47% from previous year)
- 2025: $1,179,677 (+$16,646, +1.43% from previous year)
Sudbury’s real estate market shows the steady, sustainable growth characteristic of established MetroWest communities, with home values climbing 88% from $627,097 in 2010 to $1,179,677 in 2025. The town experienced measured growth through the 2010s before accelerating during the pandemic with consecutive gains of 17.04% in 2021 and 17.51% in 2022. This consistent appreciation pattern reflects Sudbury’s enduring appeal as a family-oriented community that offers rural character within commuting distance of Boston’s technology corridor.
Sudbury – Revolutionary War History Meets Modern Suburban Excellence
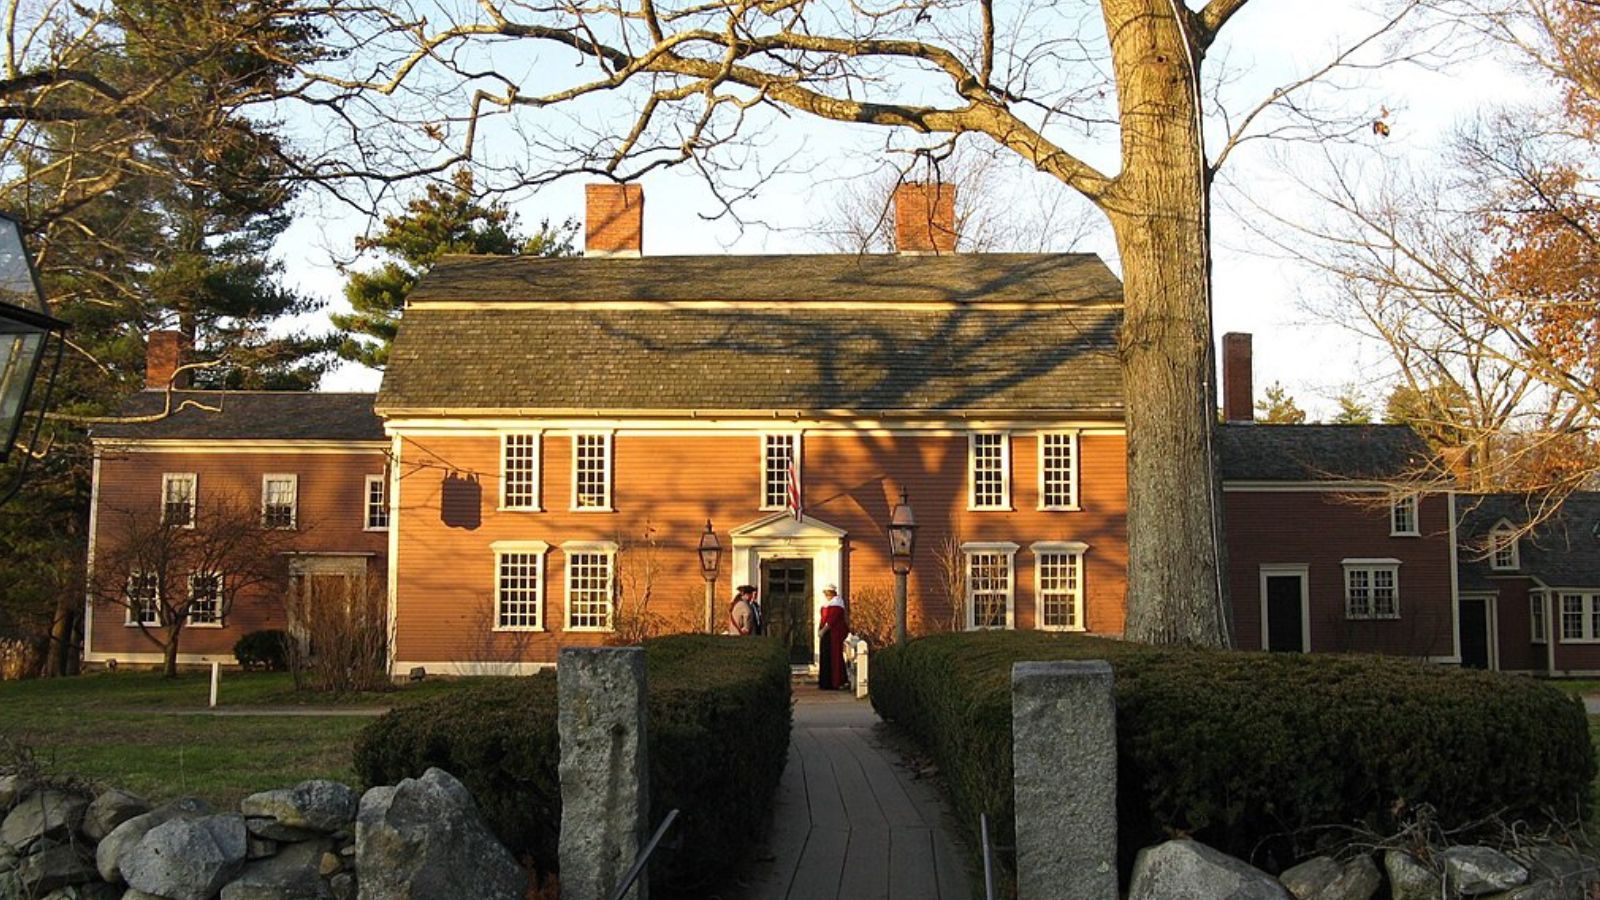
Steeped in American Revolutionary War history yet thoroughly modern in its amenities, Sudbury represents the best of MetroWest living for families seeking space, excellent schools, and historical character. This Middlesex County town of approximately 18,000 residents features numerous historical sites, including the famous Wayside Inn and several Revolutionary War battlefields, creating a unique sense of place that sets it apart from typical suburban communities. The town’s commitment to preserving its historical heritage while supporting modern development creates an environment that appeals to families seeking both educational value and contemporary convenience.
The town’s steady price appreciation reflects its position as a premier family destination that successfully balances historical preservation with modern needs. Sudbury’s strict zoning requirements maintain large lot sizes and protect open space, creating natural constraints on housing supply while preserving the rural character that attracts buyers. With excellent highway access to both Boston and the Route 128 technology corridor, plus outstanding schools and low crime rates, Sudbury continues to command premium prices from families seeking the ideal suburban lifestyle.
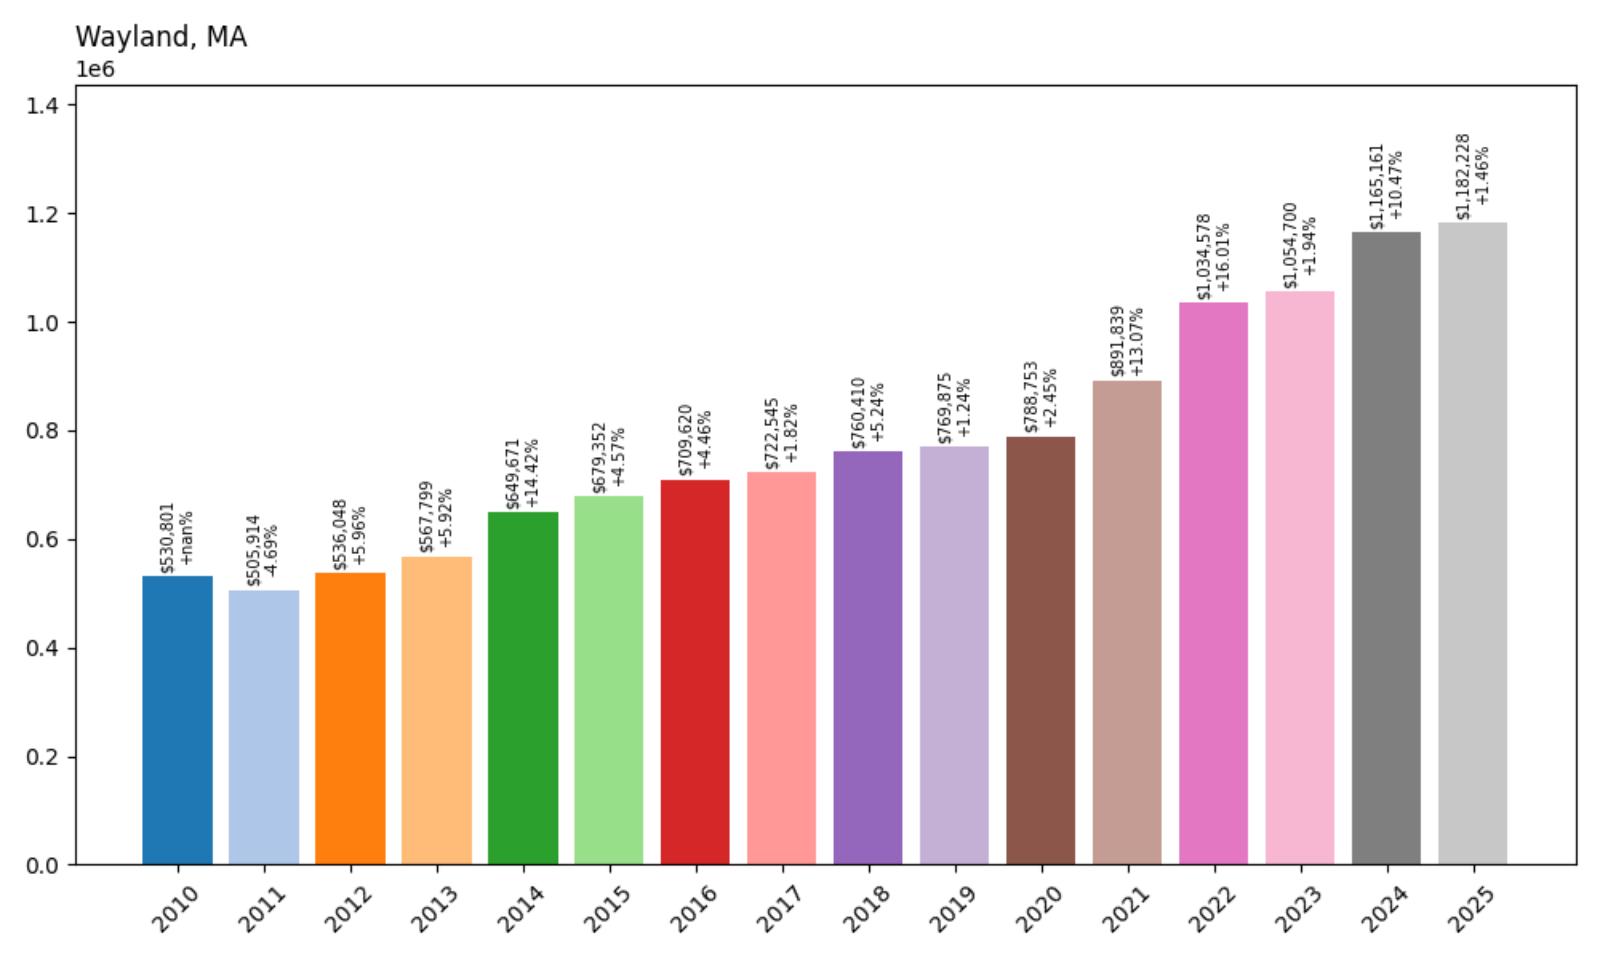
27. Wayland – 123% Home Price Increase Since 2010
🔥 Would you like to save this?
- 2010: $530,801
- 2011: $505,914 (−$24,887, −4.69% from previous year)
- 2012: $536,048 (+$30,134, +5.96% from previous year)
- 2013: $567,799 (+$31,752, +5.92% from previous year)
- 2014: $649,671 (+$81,871, +14.42% from previous year)
- 2015: $679,352 (+$29,681, +4.57% from previous year)
- 2016: $709,620 (+$30,268, +4.46% from previous year)
- 2017: $722,545 (+$12,925, +1.82% from previous year)
- 2018: $760,410 (+$37,865, +5.24% from previous year)
- 2019: $769,875 (+$9,465, +1.24% from previous year)
- 2020: $788,753 (+$18,878, +2.45% from previous year)
- 2021: $891,839 (+$103,087, +13.07% from previous year)
- 2022: $1,034,578 (+$142,739, +16.01% from previous year)
- 2023: $1,054,700 (+$20,122, +1.94% from previous year)
- 2024: $1,165,161 (+$110,461, +10.47% from previous year)
- 2025: $1,182,228 (+$17,067, +1.46% from previous year)
Wayland’s housing market achieved remarkable growth of 123% from $530,801 in 2010 to $1,182,228 in 2025, with particularly impressive acceleration during the pandemic years when values jumped from $788,753 in 2020 to over $1 million by 2022. The town demonstrated strong fundamentals throughout the 2010s with a standout year in 2014 showing 14.42% growth. This MetroWest community has successfully established itself as a premium market that attracts families seeking excellent schools and convenient access to Boston-area employment.
Wayland – Educational Excellence in MetroWest
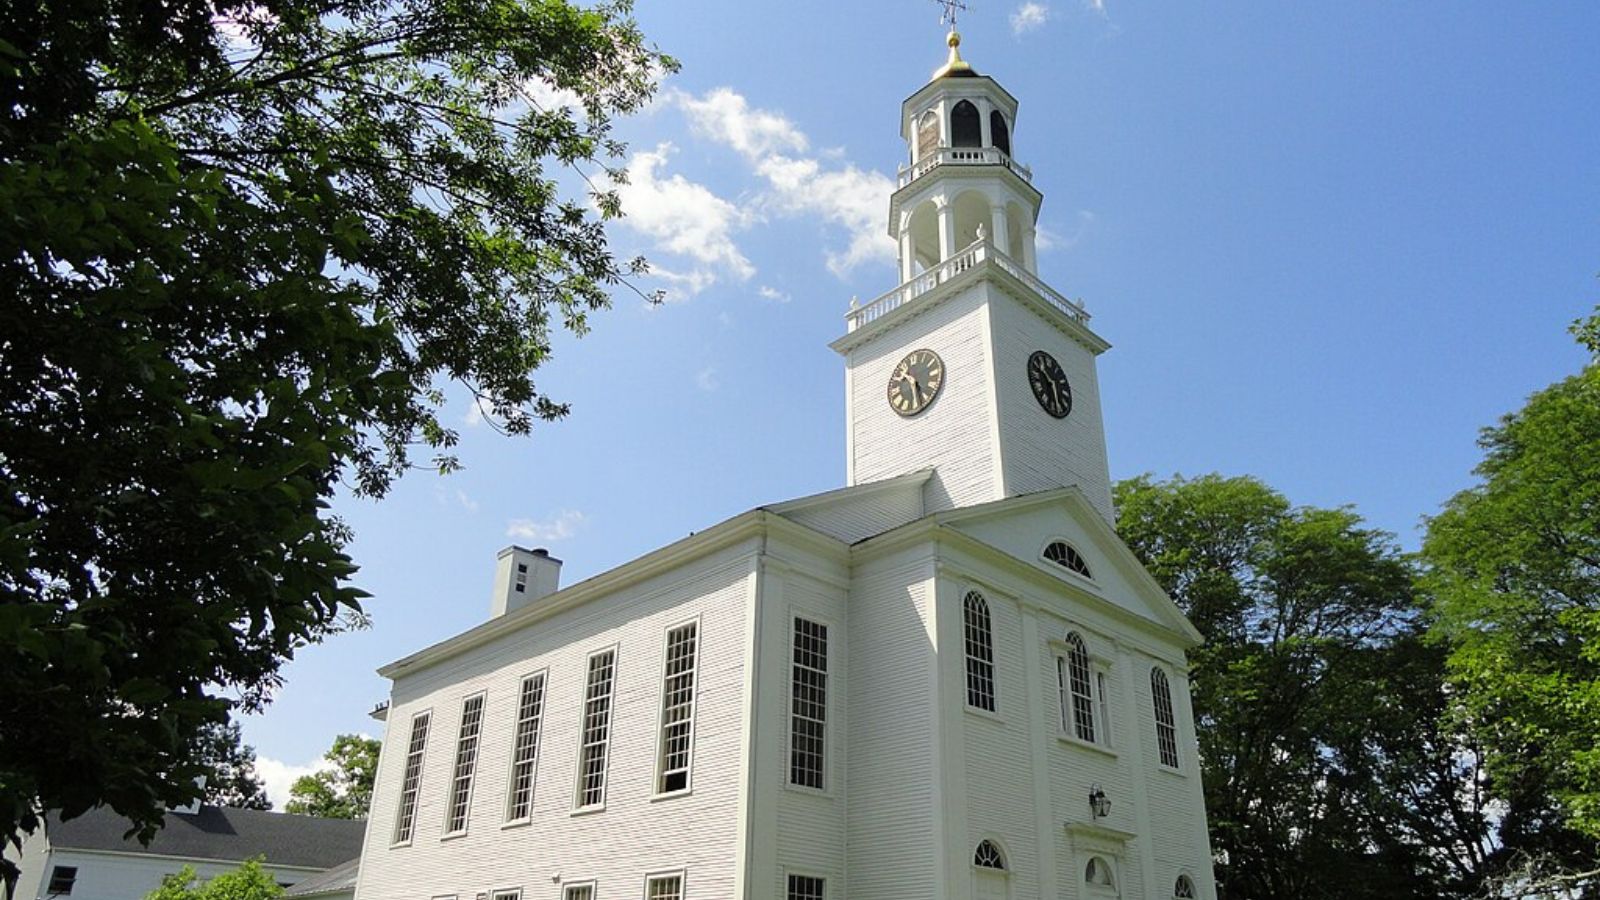
Renowned throughout Massachusetts for its outstanding public school system, Wayland has built a reputation as one of the state’s premier educational communities, consistently attracting families willing to pay premium prices for academic excellence. This Middlesex County town of approximately 13,500 residents features schools that regularly rank among the top performers statewide, with Wayland High School achieving exceptional standardized test scores and college acceptance rates that rival many private institutions. The community’s deep commitment to education shows in its willingness to invest in facilities, technology, and programs that maintain its competitive edge.
Wayland’s substantial price appreciation reflects its position as a highly sought-after destination for educated professionals seeking the best possible environment for raising families. The town’s excellent schools, low crime rates, and strong sense of community create fundamentals that support sustained high property values. With limited opportunities for new construction due to environmental constraints and the community’s commitment to preserving its character, housing supply remains tight while demand continues from buyers seeking proven educational excellence and quality of life.
26. Oak Bluffs – 160% Home Price Increase Since 2010
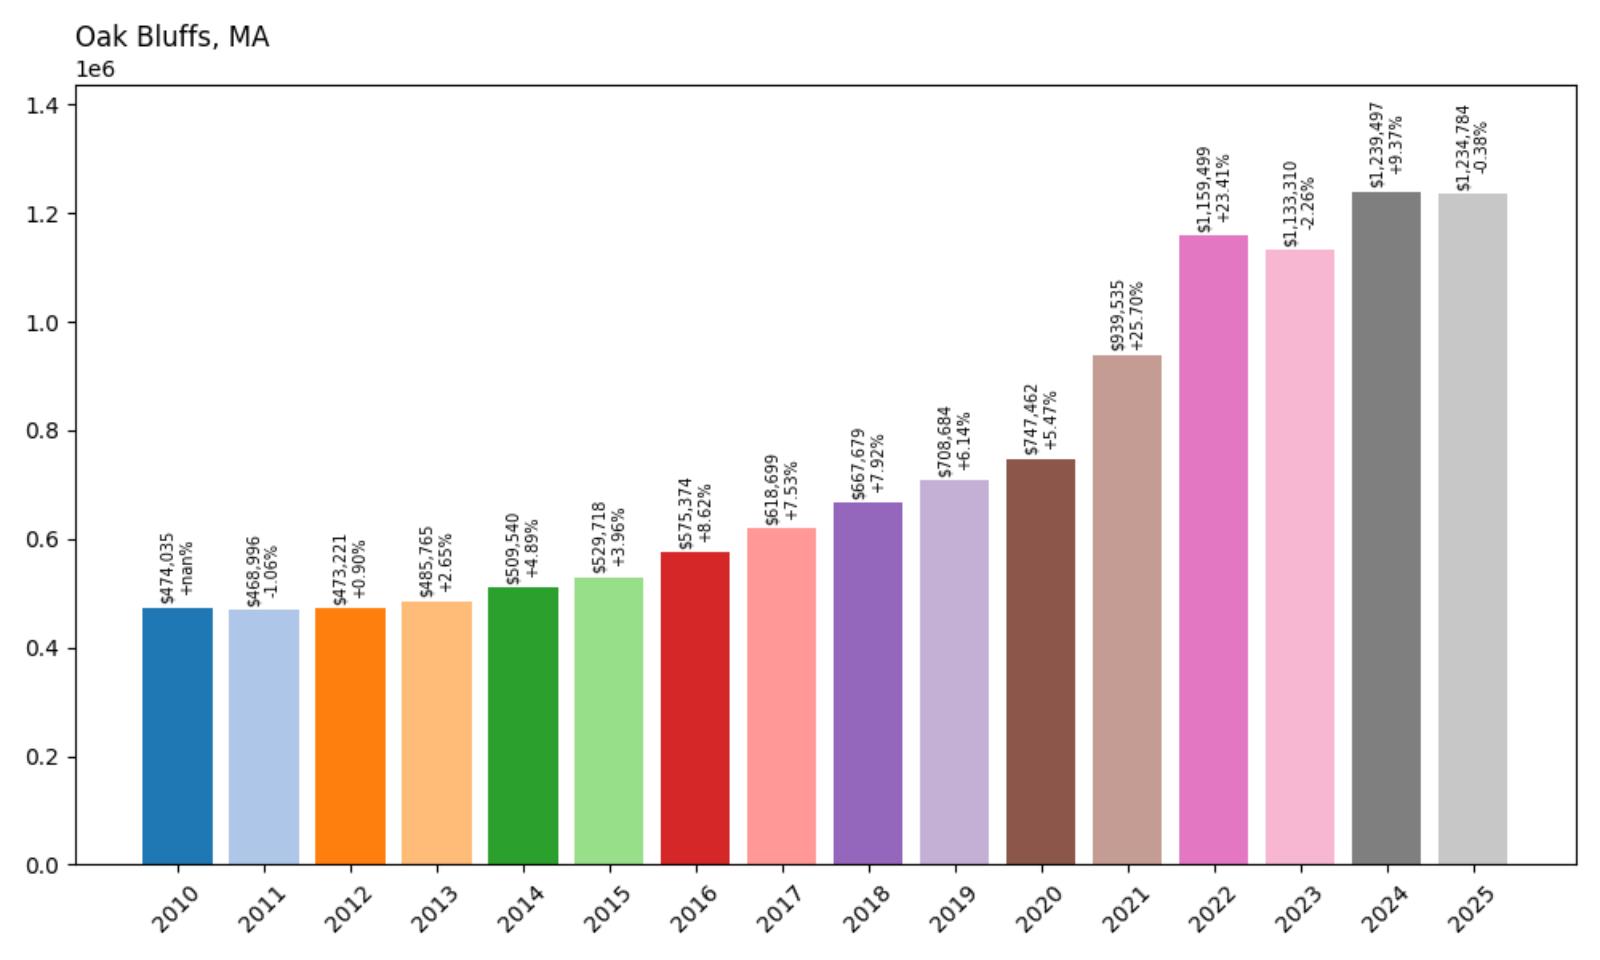
- 2010: $474,035
- 2011: $468,996 (−$5,039, −1.06% from previous year)
- 2012: $473,221 (+$4,225, +0.90% from previous year)
- 2013: $485,765 (+$12,544, +2.65% from previous year)
- 2014: $509,540 (+$23,775, +4.89% from previous year)
- 2015: $529,718 (+$20,179, +3.96% from previous year)
- 2016: $575,374 (+$45,655, +8.62% from previous year)
- 2017: $618,699 (+$43,325, +7.53% from previous year)
- 2018: $667,679 (+$48,980, +7.92% from previous year)
- 2019: $708,684 (+$41,005, +6.14% from previous year)
- 2020: $747,462 (+$38,777, +5.47% from previous year)
- 2021: $939,535 (+$192,073, +25.70% from previous year)
- 2022: $1,159,499 (+$219,963, +23.41% from previous year)
- 2023: $1,133,310 (−$26,188, −2.26% from previous year)
- 2024: $1,239,497 (+$106,187, +9.37% from previous year)
- 2025: $1,234,784 (−$4,713, −0.38% from previous year)
Oak Bluffs delivered exceptional returns with home values increasing 160% from $474,035 in 2010 to $1,234,784 in 2025, making it one of the strongest-performing markets among Massachusetts’ most expensive towns. The community showed consistent strength throughout the 2010s with accelerating growth from 2016 onward, before exploding during the pandemic with massive gains of 25.70% in 2021 and 23.41% in 2022. This Martha’s Vineyard community has transformed from a moderately priced island destination to a luxury market that attracts affluent buyers from around the world.
Oak Bluffs – Vibrant Island Culture and Victorian Charm
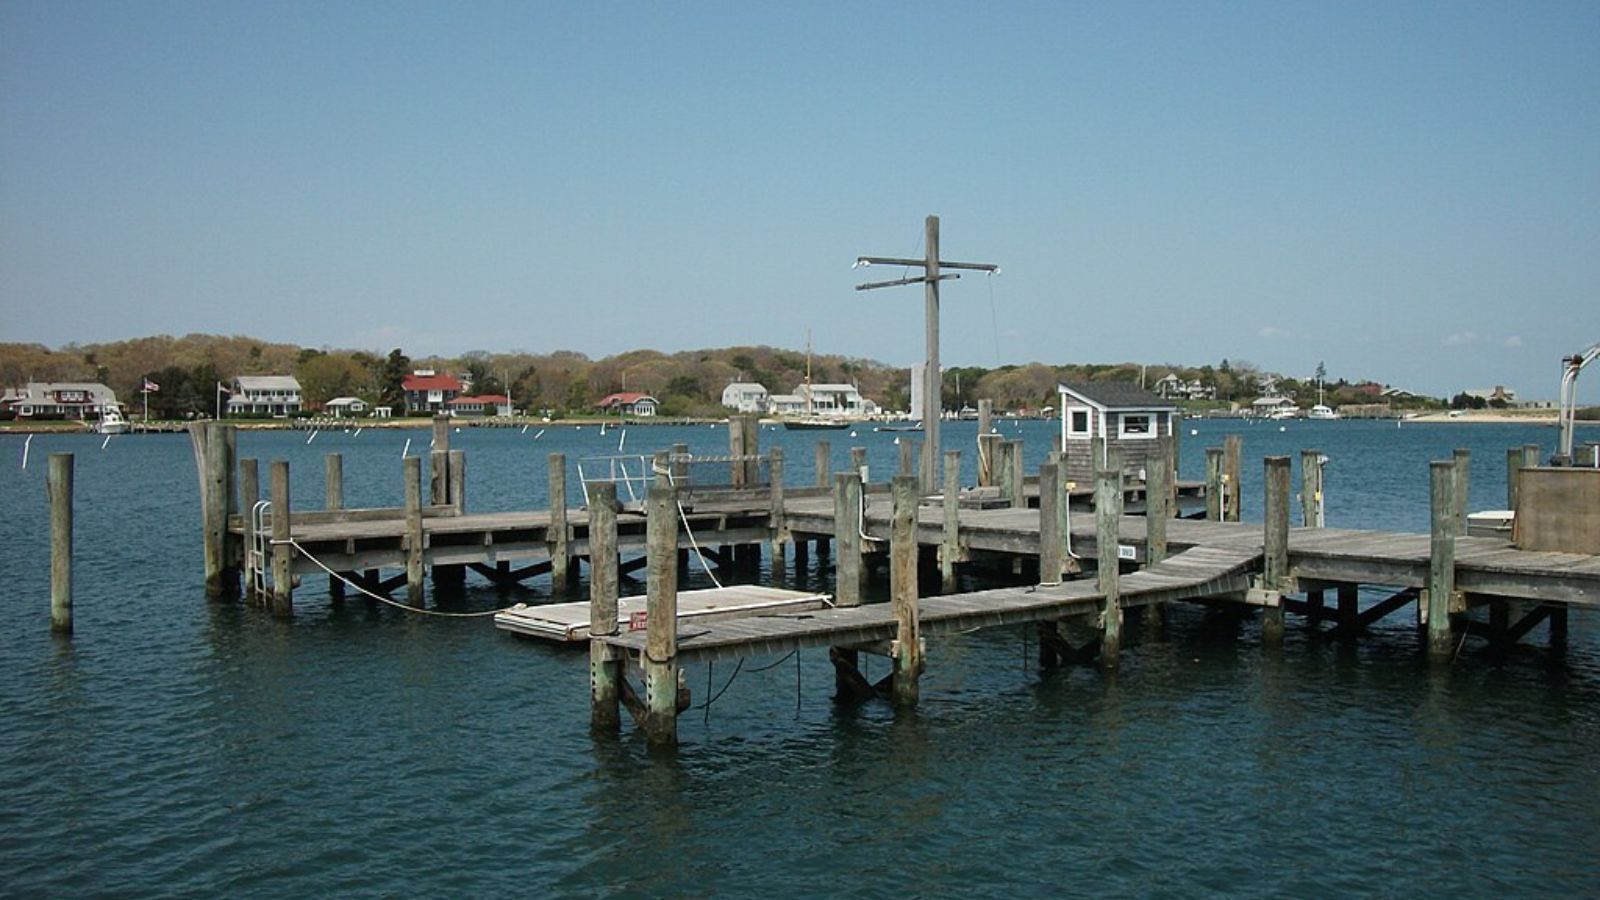
Known for its colorful Victorian “Gingerbread Houses” and vibrant summer community, Oak Bluffs stands as Martha’s Vineyard’s most eclectic and culturally diverse town, offering a unique blend of historical significance and contemporary island living. This Dukes County community of about 5,000 year-round residents features the famous Campground area with its collection of tiny, ornate cottages that create one of America’s most photographed neighborhoods. The town’s rich African American heritage, dating back to the 19th century when it became a popular destination for Black vacationers, continues to influence its welcoming, inclusive character.
The town’s remarkable price appreciation reflects both the broader Martha’s Vineyard real estate boom and Oak Bluffs’ unique position as the island’s most culturally vibrant community. Limited development opportunities due to island geography and strict environmental regulations create natural constraints on housing supply, while demand continues to grow from buyers seeking authentic New England island living. With increasing recognition of Oak Bluffs as both a lifestyle destination and investment opportunity, the community continues to attract premium prices despite occasional market fluctuations.
25. Westwood – 113% Home Price Increase Since 2010
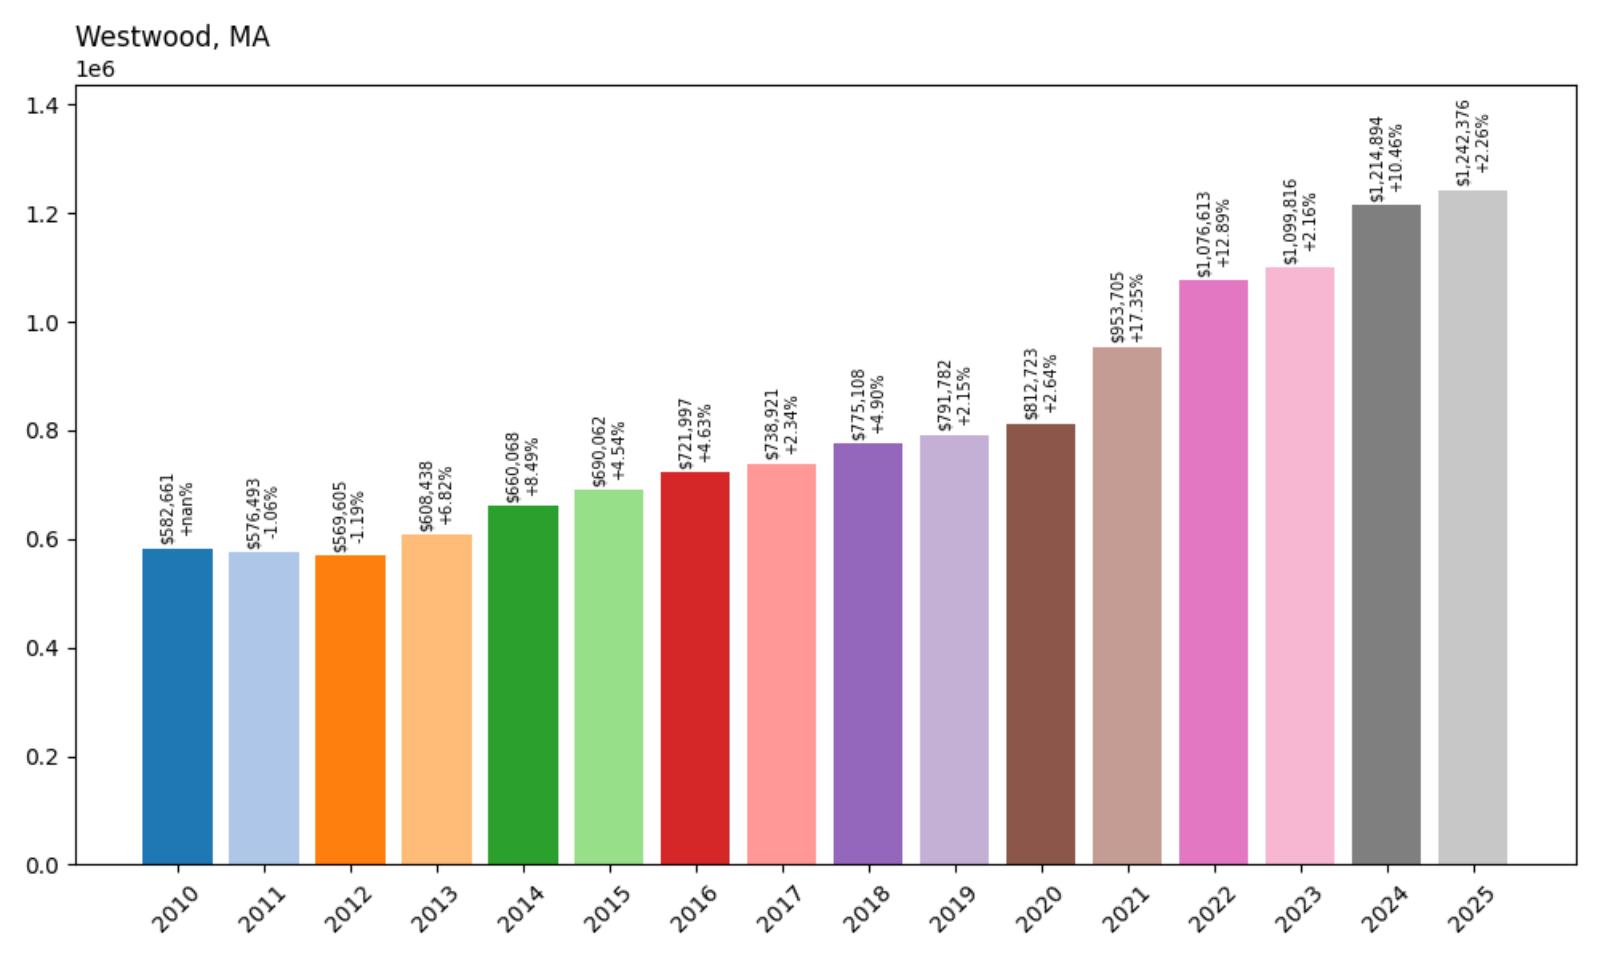
- 2010: $582,661
- 2011: $576,493 (−$6,169, −1.06% from previous year)
- 2012: $569,605 (−$6,887, −1.19% from previous year)
- 2013: $608,438 (+$38,832, +6.82% from previous year)
- 2014: $660,068 (+$51,630, +8.49% from previous year)
- 2015: $690,062 (+$29,995, +4.54% from previous year)
- 2016: $721,997 (+$31,935, +4.63% from previous year)
- 2017: $738,921 (+$16,923, +2.34% from previous year)
- 2018: $775,108 (+$36,187, +4.90% from previous year)
- 2019: $791,782 (+$16,674, +2.15% from previous year)
- 2020: $812,723 (+$20,941, +2.64% from previous year)
- 2021: $953,705 (+$140,983, +17.35% from previous year)
- 2022: $1,076,613 (+$122,907, +12.89% from previous year)
- 2023: $1,099,816 (+$23,203, +2.16% from previous year)
- 2024: $1,214,894 (+$115,079, +10.46% from previous year)
- 2025: $1,242,376 (+$27,482, +2.26% from previous year)
Westwood’s real estate market demonstrated strong, consistent performance with home values more than doubling from $582,661 in 2010 to $1,242,376 in 2025, representing solid 113% growth over the period. The town showed steady appreciation throughout the 2010s with particularly strong years in 2013 and 2014, before accelerating during the pandemic with a 17.35% jump in 2021. This Norfolk County community successfully transitioned into the premium market category, crossing the million-dollar threshold in 2022 and continuing to build value through 2025.
Westwood – Suburban Excellence South of Boston
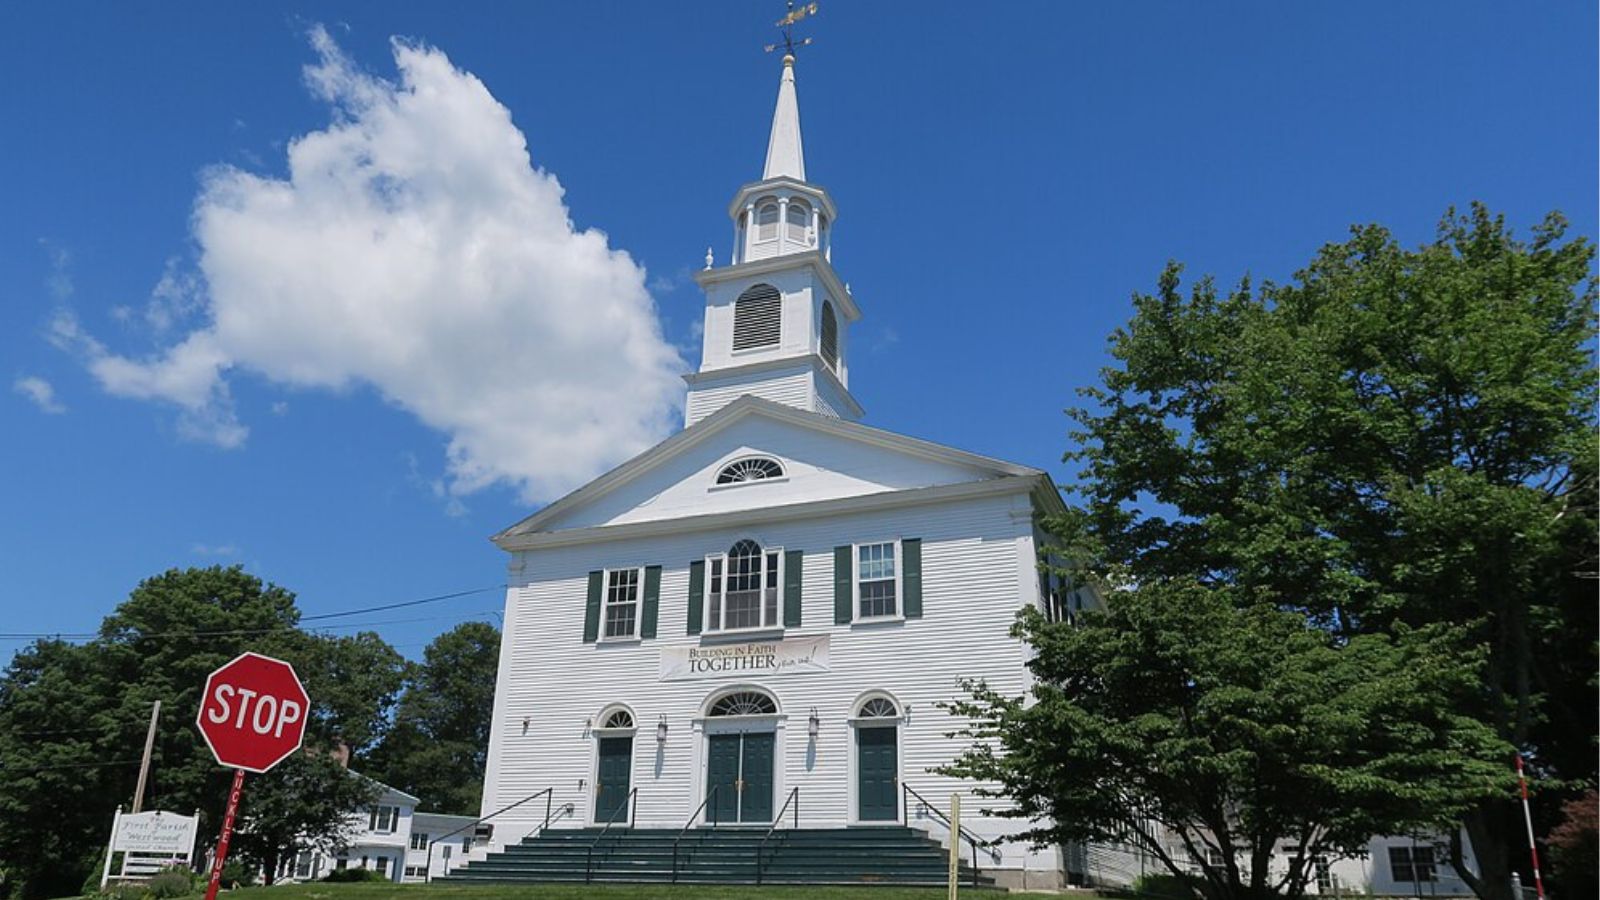
Located just 12 miles southwest of downtown Boston in Norfolk County, Westwood offers an ideal combination of suburban tranquility and urban accessibility that has made it increasingly popular among professionals and families seeking quality of life without sacrificing career opportunities. This community of approximately 15,000 residents features excellent public schools, well-maintained neighborhoods, and convenient transportation options including commuter rail service to Boston. The town’s strategic location provides easy access to major highways while maintaining a quiet, residential character that appeals to families with children.
The town’s substantial price appreciation reflects its growing recognition as one of the South Shore’s premier family communities, offering an excellent balance of location, amenities, and value. Westwood’s strong school system and low crime rates create fundamentals that support sustained property value growth, while its proximity to major employment centers makes it attractive to a broad range of professionals. With limited opportunities for new construction due to the town’s largely developed nature and environmental constraints, housing supply remains constrained while demand continues from buyers seeking established communities with proven track records.
24. Sherborn – 81% Home Price Increase Since 2010
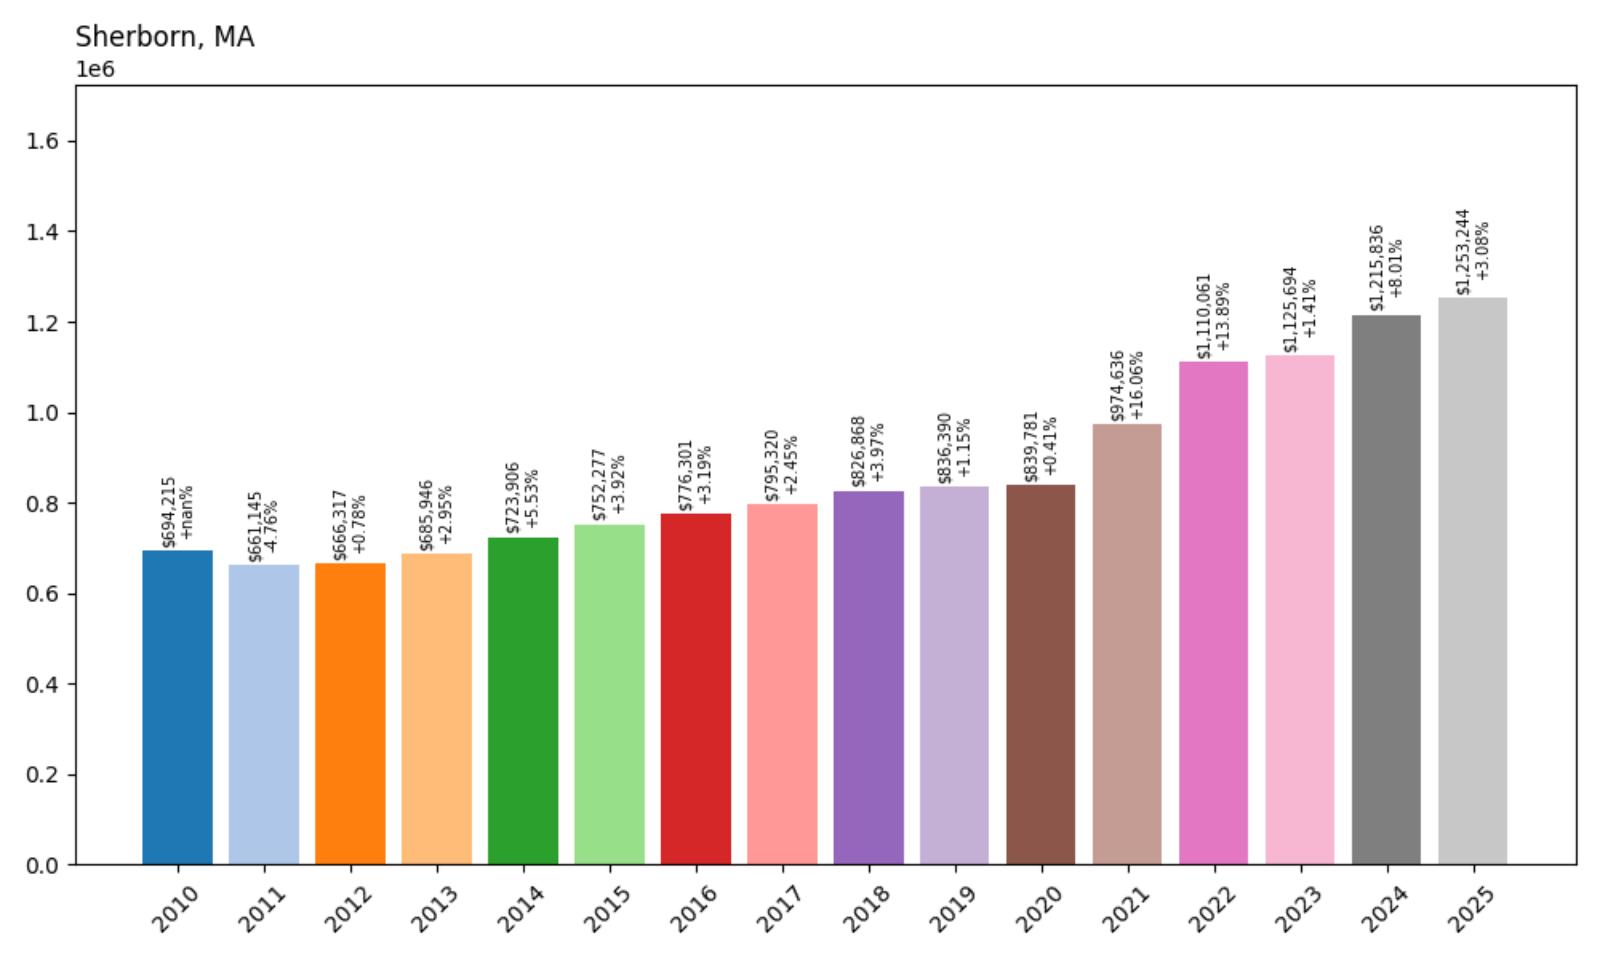
- 2010: $694,215
- 2011: $661,145 (−$33,070, −4.76% from previous year)
- 2012: $666,317 (+$5,172, +0.78% from previous year)
- 2013: $685,946 (+$19,628, +2.95% from previous year)
- 2014: $723,906 (+$37,960, +5.53% from previous year)
- 2015: $752,277 (+$28,371, +3.92% from previous year)
- 2016: $776,301 (+$24,024, +3.19% from previous year)
- 2017: $795,320 (+$19,019, +2.45% from previous year)
- 2018: $826,868 (+$31,548, +3.97% from previous year)
- 2019: $836,390 (+$9,522, +1.15% from previous year)
- 2020: $839,781 (+$3,391, +0.41% from previous year)
- 2021: $974,636 (+$134,855, +16.06% from previous year)
- 2022: $1,110,061 (+$135,425, +13.89% from previous year)
- 2023: $1,125,694 (+$15,633, +1.41% from previous year)
- 2024: $1,215,836 (+$90,142, +8.01% from previous year)
- 2025: $1,253,244 (+$37,408, +3.08% from previous year)
Sherborn’s housing market achieved solid 81% appreciation from $694,215 in 2010 to $1,253,244 in 2025, demonstrating the steady, measured growth characteristic of established rural communities. The town showed consistent but modest increases through the 2010s before accelerating during the pandemic years with gains of 16.06% in 2021 and 13.89% in 2022. This MetroWest community successfully crossed the million-dollar threshold and continues building value, reflecting its appeal as a rural enclave within commuting distance of Boston.
Sherborn – Rural Elegance in MetroWest
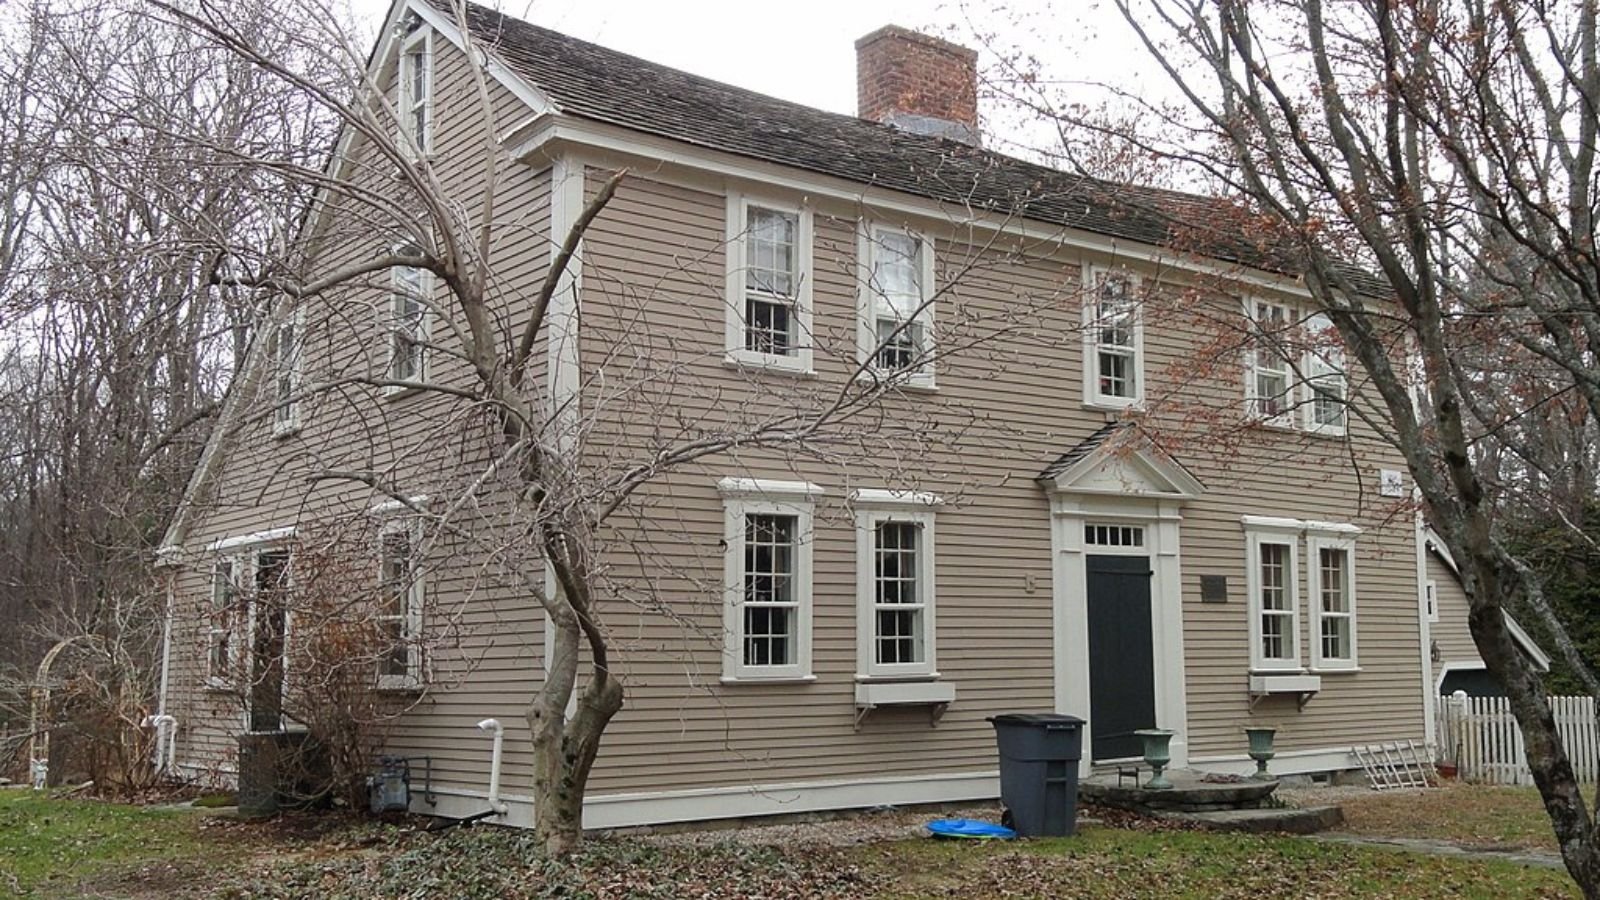
Sherborn epitomizes the rural New England lifestyle while remaining accessible to major employment centers, making it a highly sought-after destination for affluent families seeking space, privacy, and natural beauty. This Middlesex County town of approximately 4,500 residents features large lots, horse properties, and extensive conservation land that preserves its agricultural character despite pressure from suburban development. Located about 20 miles southwest of Boston, Sherborn offers the increasingly rare combination of rural living with reasonable access to urban employment and cultural opportunities.
Sherborn’s steady price appreciation reflects the premium buyers place on privacy, space, and rural lifestyle in an increasingly developed region. The town’s zoning restrictions effectively limit housing supply while demand grows from Boston-area professionals seeking larger properties and outdoor amenities for their families. With excellent public schools, extremely low crime rates, and a location that provides access to both urban employment and rural recreation, Sherborn represents a lifestyle choice that commands premium prices in today’s competitive real estate market.
23. Chatham – 105% Home Price Increase Since 2010

- 2010: $613,872
- 2011: $587,801 (−$26,071, −4.25% from previous year)
- 2012: $573,617 (−$14,185, −2.41% from previous year)
- 2013: $599,679 (+$26,062, +4.54% from previous year)
- 2014: $612,493 (+$12,814, +2.14% from previous year)
- 2015: $625,230 (+$12,737, +2.08% from previous year)
- 2016: $650,199 (+$24,969, +3.99% from previous year)
- 2017: $670,175 (+$19,976, +3.07% from previous year)
- 2018: $700,033 (+$29,859, +4.46% from previous year)
- 2019: $724,495 (+$24,461, +3.49% from previous year)
- 2020: $728,410 (+$3,916, +0.54% from previous year)
- 2021: $921,224 (+$192,814, +26.47% from previous year)
- 2022: $1,135,007 (+$213,783, +23.21% from previous year)
- 2023: $1,159,708 (+$24,700, +2.18% from previous year)
- 2024: $1,231,243 (+$71,536, +6.17% from previous year)
- 2025: $1,257,028 (+$25,785, +2.09% from previous year)
Chatham’s real estate market delivered impressive 105% growth from $613,872 in 2010 to $1,257,028 in 2025, with the most dramatic acceleration occurring during the pandemic years when values more than doubled. After modest growth through the 2010s, the town experienced explosive increases of 26.47% in 2021 and 23.21% in 2022, transforming from a mid-range Cape Cod market to a premium destination. This outer Cape community has successfully established itself among Massachusetts’ most expensive towns, reflecting growing demand for authentic coastal New England living.
Chatham – Classic Cape Cod at Its Finest
🔥 Would you like to save this?
Positioned at Cape Cod’s “elbow” where the peninsula curves northward, Chatham embodies everything visitors imagine when they think of classic New England seaside communities, with pristine beaches, a working fishing fleet, and meticulously preserved architecture that maintains its maritime character. This Barnstable County town of approximately 6,500 residents features both ocean and bay frontage, providing diverse coastal experiences from the dramatic surf of the Atlantic to the calmer waters of Pleasant Bay. The community’s commitment to architectural preservation through strict design guidelines ensures that new construction maintains the Cape Cod aesthetic that attracts visitors and residents alike.
The town’s remarkable price appreciation reflects both its unique position as Cape Cod’s most complete year-round community and the broader trend toward coastal property as both lifestyle choice and investment opportunity. Chatham’s strict zoning regulations and environmental protections limit new construction while preserving the character that attracts buyers from around the world. With increasing numbers of remote workers able to live anywhere and growing appreciation for coastal lifestyle, Chatham continues to command premium prices for what many consider the quintessential Cape Cod experience.
22. Tisbury – 141% Home Price Increase Since 2010
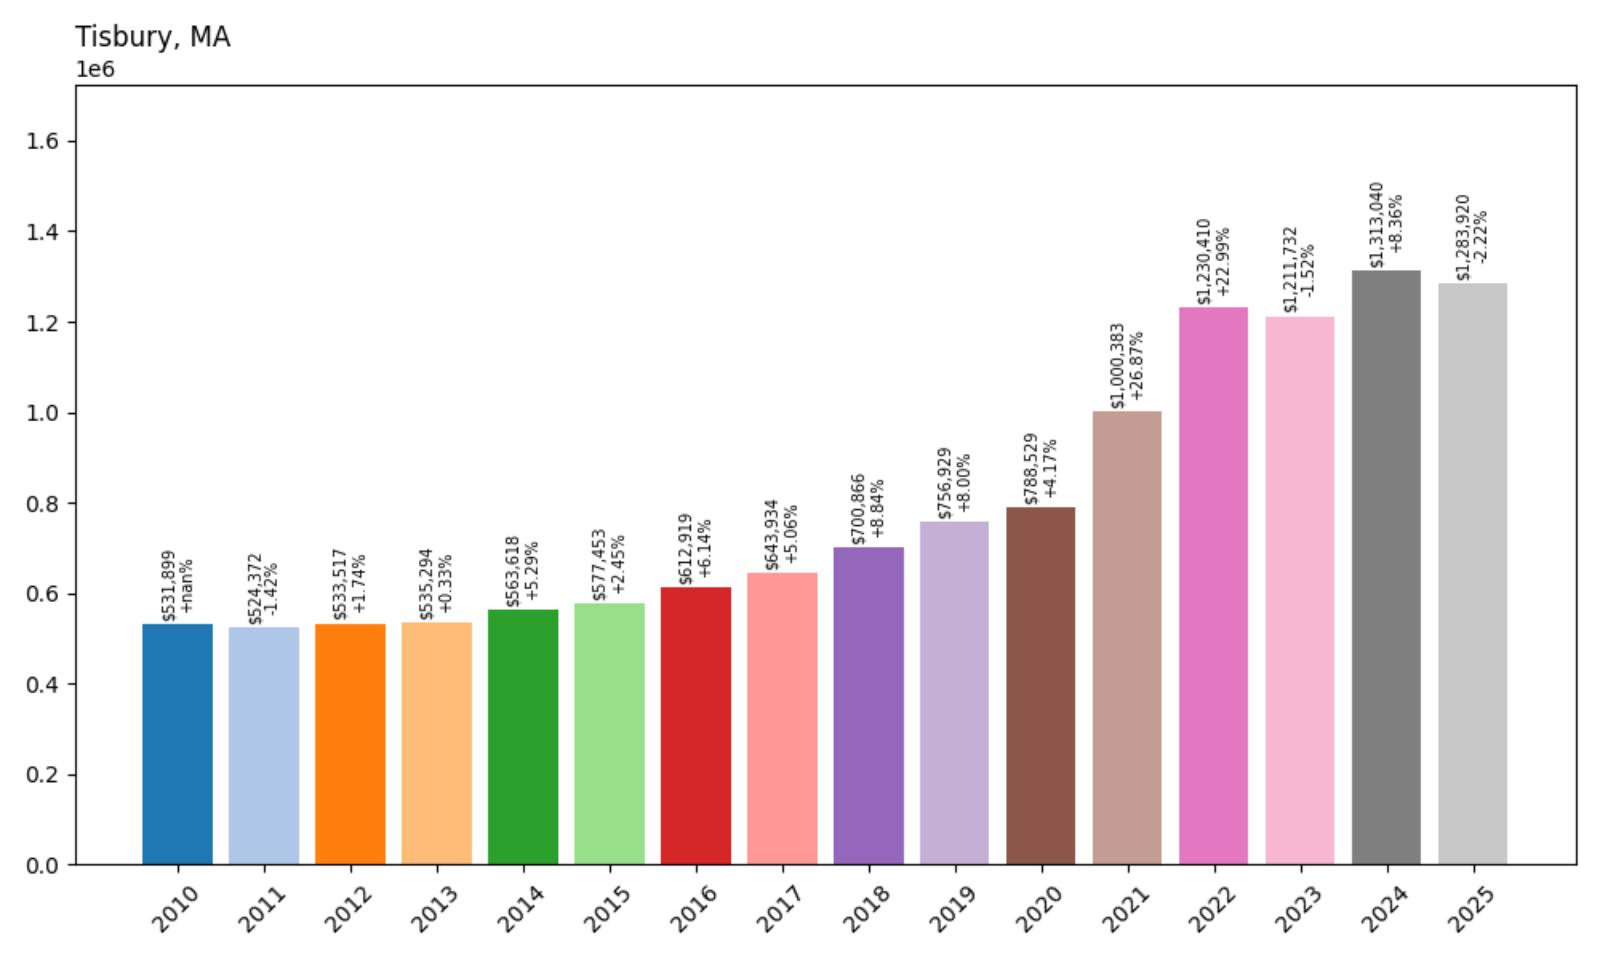
- 2010: $531,899
- 2011: $524,372 (−$7,526, −1.42% from previous year)
- 2012: $533,517 (+$9,145, +1.74% from previous year)
- 2013: $535,294 (+$1,777, +0.33% from previous year)
- 2014: $563,618 (+$28,324, +5.29% from previous year)
- 2015: $577,453 (+$13,835, +2.45% from previous year)
- 2016: $612,919 (+$35,467, +6.14% from previous year)
- 2017: $643,934 (+$31,015, +5.06% from previous year)
- 2018: $700,866 (+$56,932, +8.84% from previous year)
- 2019: $756,929 (+$56,063, +8.00% from previous year)
- 2020: $788,529 (+$31,600, +4.17% from previous year)
- 2021: $1,000,383 (+$211,854, +26.87% from previous year)
- 2022: $1,230,410 (+$230,027, +22.99% from previous year)
- 2023: $1,211,732 (−$18,678, −1.52% from previous year)
- 2024: $1,313,040 (+$101,308, +8.36% from previous year)
- 2025: $1,283,920 (−$29,120, −2.22% from previous year)
Tisbury achieved remarkable 141% appreciation from $531,899 in 2010 to $1,283,920 in 2025, making it one of the strongest-performing markets among Massachusetts’ premium communities. The town showed accelerating growth through the late 2010s before exploding during the pandemic with massive gains of 26.87% in 2021 and 22.99% in 2022. This Martha’s Vineyard community, which includes the island’s main port of Vineyard Haven, has transformed from a moderate-priced island destination to a luxury market that reflects the broader appreciation for island living and limited supply.
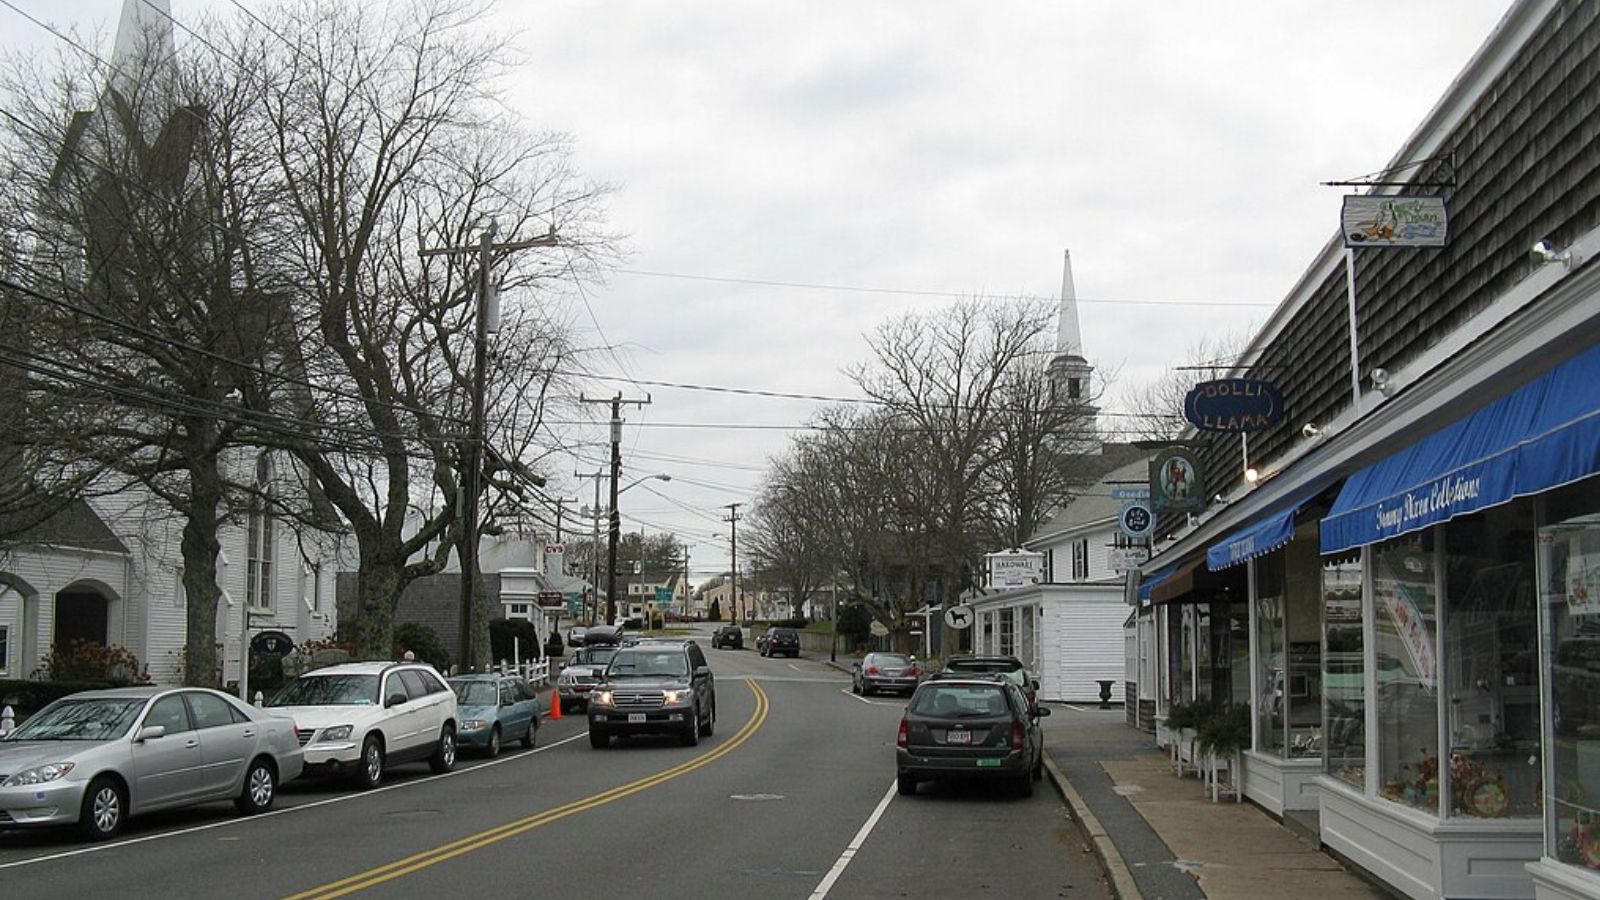
Tisbury – Martha’s Vineyard’s Vibrant Heart

Home to Vineyard Haven, Martha’s Vineyard’s main port and year-round commercial center, Tisbury serves as the island’s most dynamic and accessible community, combining working-town authenticity with sophisticated island living. This Dukes County town of approximately 4,500 residents functions as the primary gateway to Martha’s Vineyard, with ferry terminals, shops, restaurants, and services that support both residents and the millions of annual visitors. The community’s year-round vitality distinguishes it from more seasonal island areas, creating a authentic sense of place that appeals to both full-time residents and vacation homeowners.
The town’s exceptional price appreciation reflects both the broader Martha’s Vineyard real estate boom and Tisbury’s particular advantages as the island’s most complete community. Limited development opportunities due to island geography and strict environmental regulations create natural constraints on housing supply, while demand continues to grow from buyers seeking authentic New England island living with modern conveniences. With ferry access making the community more accessible than some island areas, Tisbury continues to attract premium prices from buyers seeking the perfect balance of island lifestyle and practical advantages.
21. Hingham – 110% Home Price Increase Since 2010
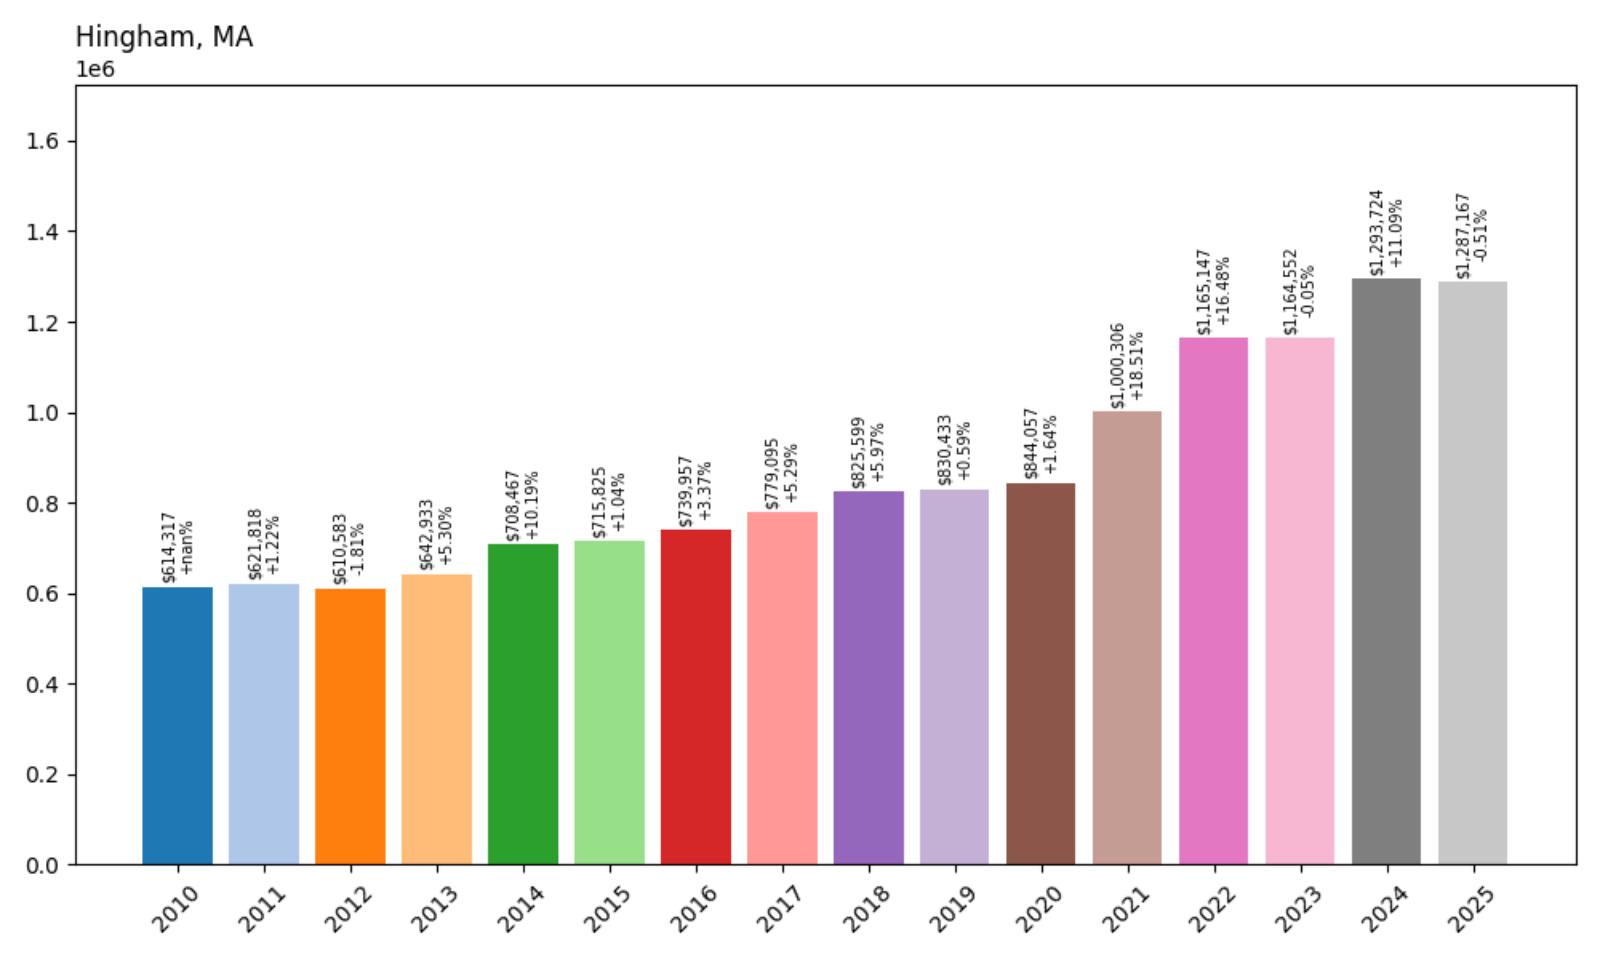
- 2010: $614,317
- 2011: $621,818 (+$7,500, +1.22% from previous year)
- 2012: $610,583 (−$11,234, −1.81% from previous year)
- 2013: $642,933 (+$32,350, +5.30% from previous year)
- 2014: $708,467 (+$65,533, +10.19% from previous year)
- 2015: $715,825 (+$7,359, +1.04% from previous year)
- 2016: $739,957 (+$24,132, +3.37% from previous year)
- 2017: $779,095 (+$39,138, +5.29% from previous year)
- 2018: $825,599 (+$46,504, +5.97% from previous year)
- 2019: $830,433 (+$4,834, +0.59% from previous year)
- 2020: $844,057 (+$13,625, +1.64% from previous year)
- 2021: $1,000,306 (+$156,249, +18.51% from previous year)
- 2022: $1,165,147 (+$164,841, +16.48% from previous year)
- 2023: $1,164,552 (−$595, −0.05% from previous year)
- 2024: $1,293,724 (+$129,173, +11.09% from previous year)
- 2025: $1,287,167 (−$6,557, −0.51% from previous year)
Hingham’s housing market delivered strong 110% appreciation from $614,317 in 2010 to $1,287,167 in 2025, with consistent growth throughout the period punctuated by explosive pandemic-era gains. The town showed steady increases through the 2010s before accelerating dramatically with consecutive gains of 18.51% in 2021 and 16.48% in 2022, successfully crossing the million-dollar threshold. This South Shore community has established itself as one of the region’s premier coastal destinations, combining historical significance with modern amenities and excellent transportation access.
Hingham – Historic Harbor Town with Modern Appeal
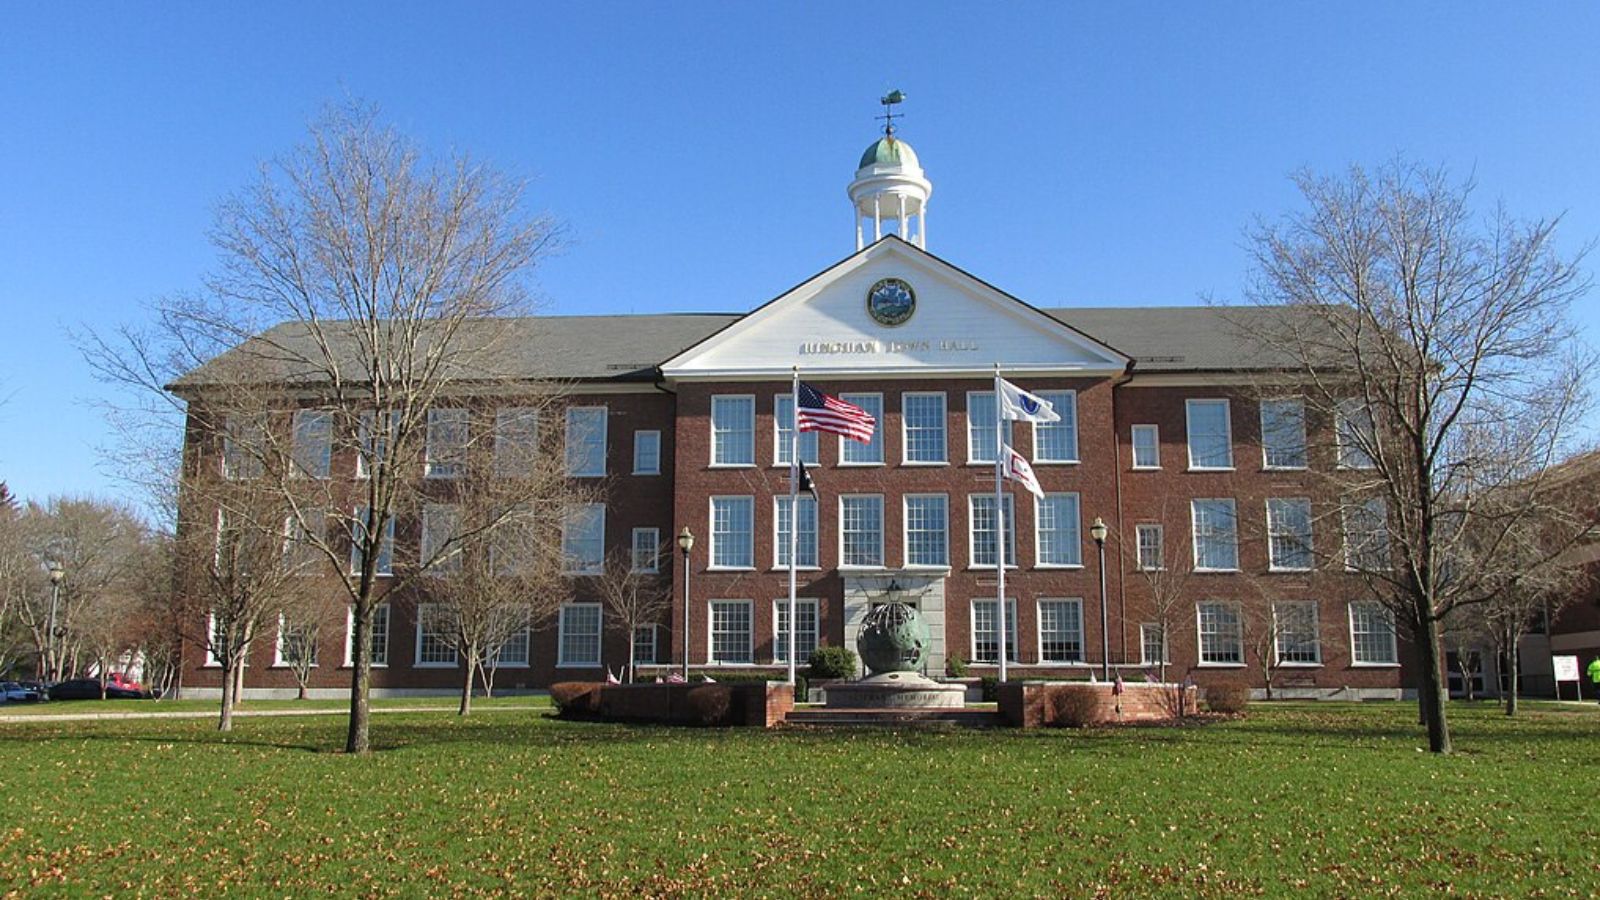
Rich in colonial history and blessed with a beautiful natural harbor, Hingham combines historical preservation with contemporary coastal living to create one of the South Shore’s most desirable communities. This Plymouth County town of approximately 23,000 residents traces its roots to 1635, featuring numerous historical landmarks including the Old Ship Church, the oldest church building in continuous use in the United States. The community’s deep historical character is preserved through active historical societies and strict architectural guidelines that maintain the town’s distinctive New England charm while allowing for thoughtful modern development.
The town’s substantial price appreciation reflects its position as the South Shore’s premier historical community, offering coastal lifestyle with urban accessibility and small-town character. Hingham’s strict zoning regulations and commitment to historical preservation limit new construction while maintaining the character that attracts buyers from throughout the region. With excellent schools, low crime rates, beautiful harbor access, and unique commuter boat service to Boston, Hingham continues to command premium prices from buyers seeking the perfect balance of history, beauty, and modern convenience.
20. Brookline – 91% Home Price Increase Since 2010
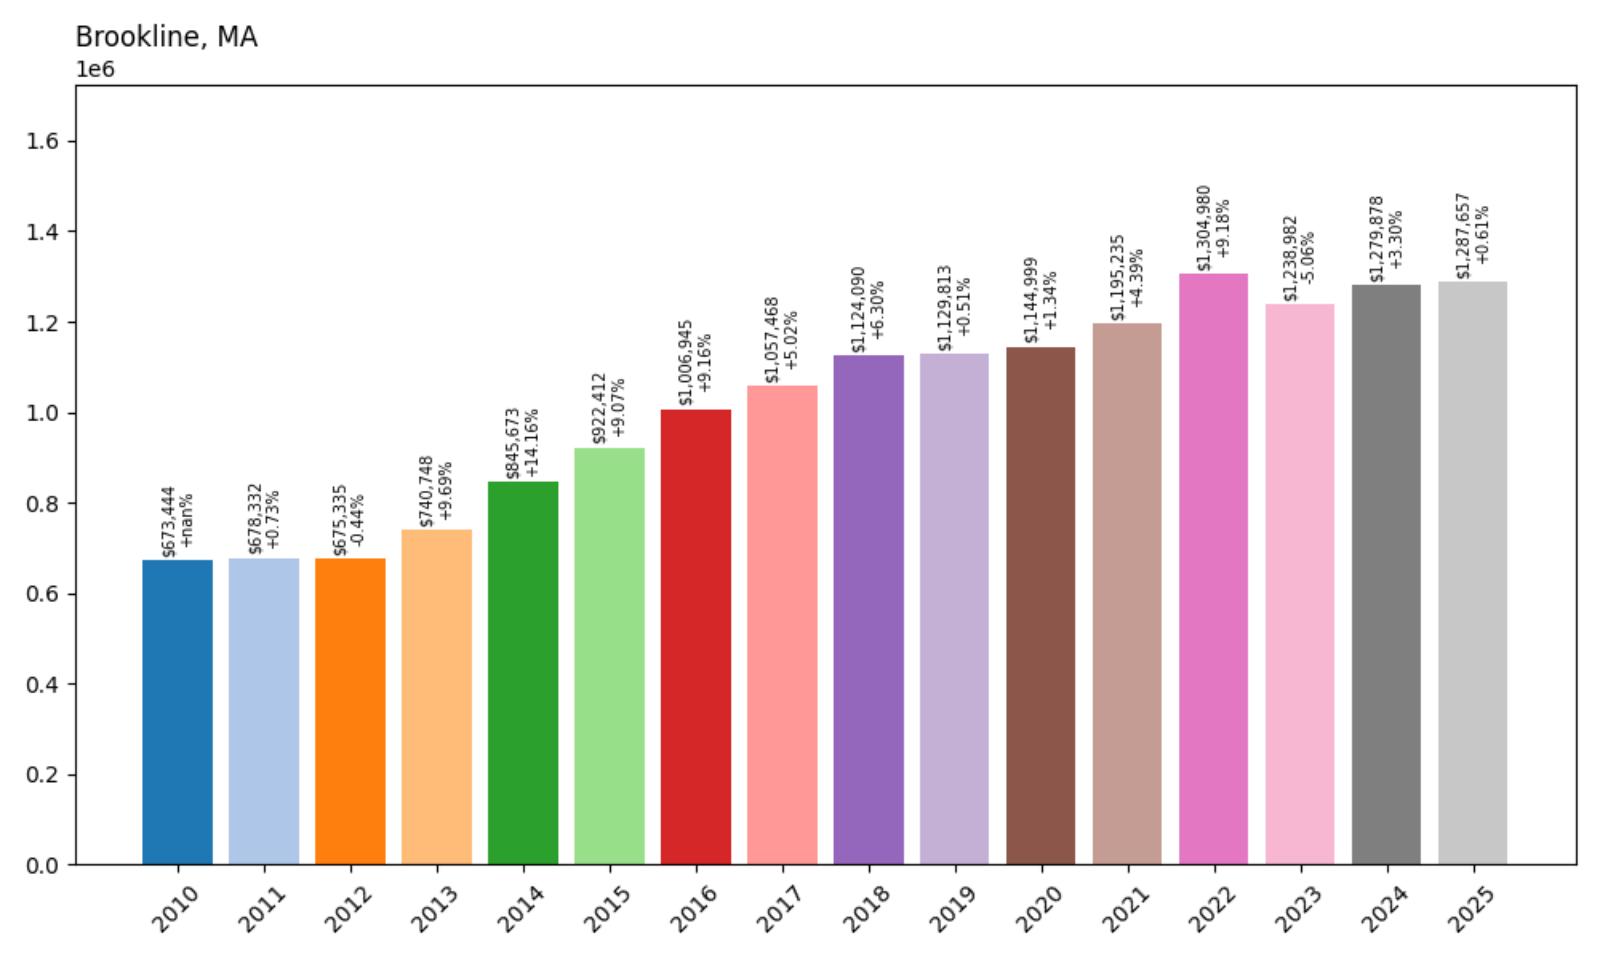
- 2010: $673,444
- 2011: $678,332 (+$4,888, +0.73% from previous year)
- 2012: $675,335 (−$2,997, −0.44% from previous year)
- 2013: $740,748 (+$65,413, +9.69% from previous year)
- 2014: $845,673 (+$104,925, +14.16% from previous year)
- 2015: $922,412 (+$76,739, +9.07% from previous year)
- 2016: $1,006,945 (+$84,533, +9.16% from previous year)
- 2017: $1,057,468 (+$50,523, +5.02% from previous year)
- 2018: $1,124,090 (+$66,622, +6.30% from previous year)
- 2019: $1,129,813 (+$5,723, +0.51% from previous year)
- 2020: $1,144,999 (+$15,186, +1.34% from previous year)
- 2021: $1,195,235 (+$50,236, +4.39% from previous year)
- 2022: $1,304,980 (+$109,744, +9.18% from previous year)
- 2023: $1,238,982 (−$65,998, −5.06% from previous year)
- 2024: $1,279,878 (+$40,896, +3.30% from previous year)
- 2025: $1,287,657 (+$7,779, +0.61% from previous year)
Brookline achieved solid 91% appreciation from $673,444 in 2010 to $1,287,657 in 2025, with particularly strong performance during the mid-2010s when the market crossed the million-dollar threshold in 2016. Unlike many communities that saw explosive pandemic growth, Brookline experienced more measured increases, reflecting its status as an already-established premium market. This inner suburb has maintained its position as one of Greater Boston’s most desirable communities, offering urban amenities with suburban character just minutes from downtown Boston.
Brookline – Urban Sophistication Meets Suburban Comfort
Perfectly positioned between Boston and Newton, Brookline offers the unique advantage of urban amenities without urban compromises, making it one of Greater Boston’s most consistently desirable residential communities. This Norfolk County town of approximately 60,000 residents features excellent public transportation with multiple subway lines, walkable neighborhoods filled with shops and restaurants, and some of the region’s best public schools. The community’s diverse housing stock ranges from luxury condominiums to grand single-family homes, providing options for various lifestyles while maintaining consistently high property values.
The town’s steady price appreciation reflects its position as one of the most fundamentally sound real estate markets in Greater Boston, offering proven value retention and quality of life advantages. Brookline’s excellent schools, diverse housing options, and unmatched access to Boston’s employment centers create sustained demand from buyers across various demographics. With limited opportunities for new construction due to the town’s developed nature and strict zoning, housing supply remains constrained while demand continues from buyers seeking the ultimate in urban-suburban living.
19. Gosnold – 71% Home Price Increase Since 2012
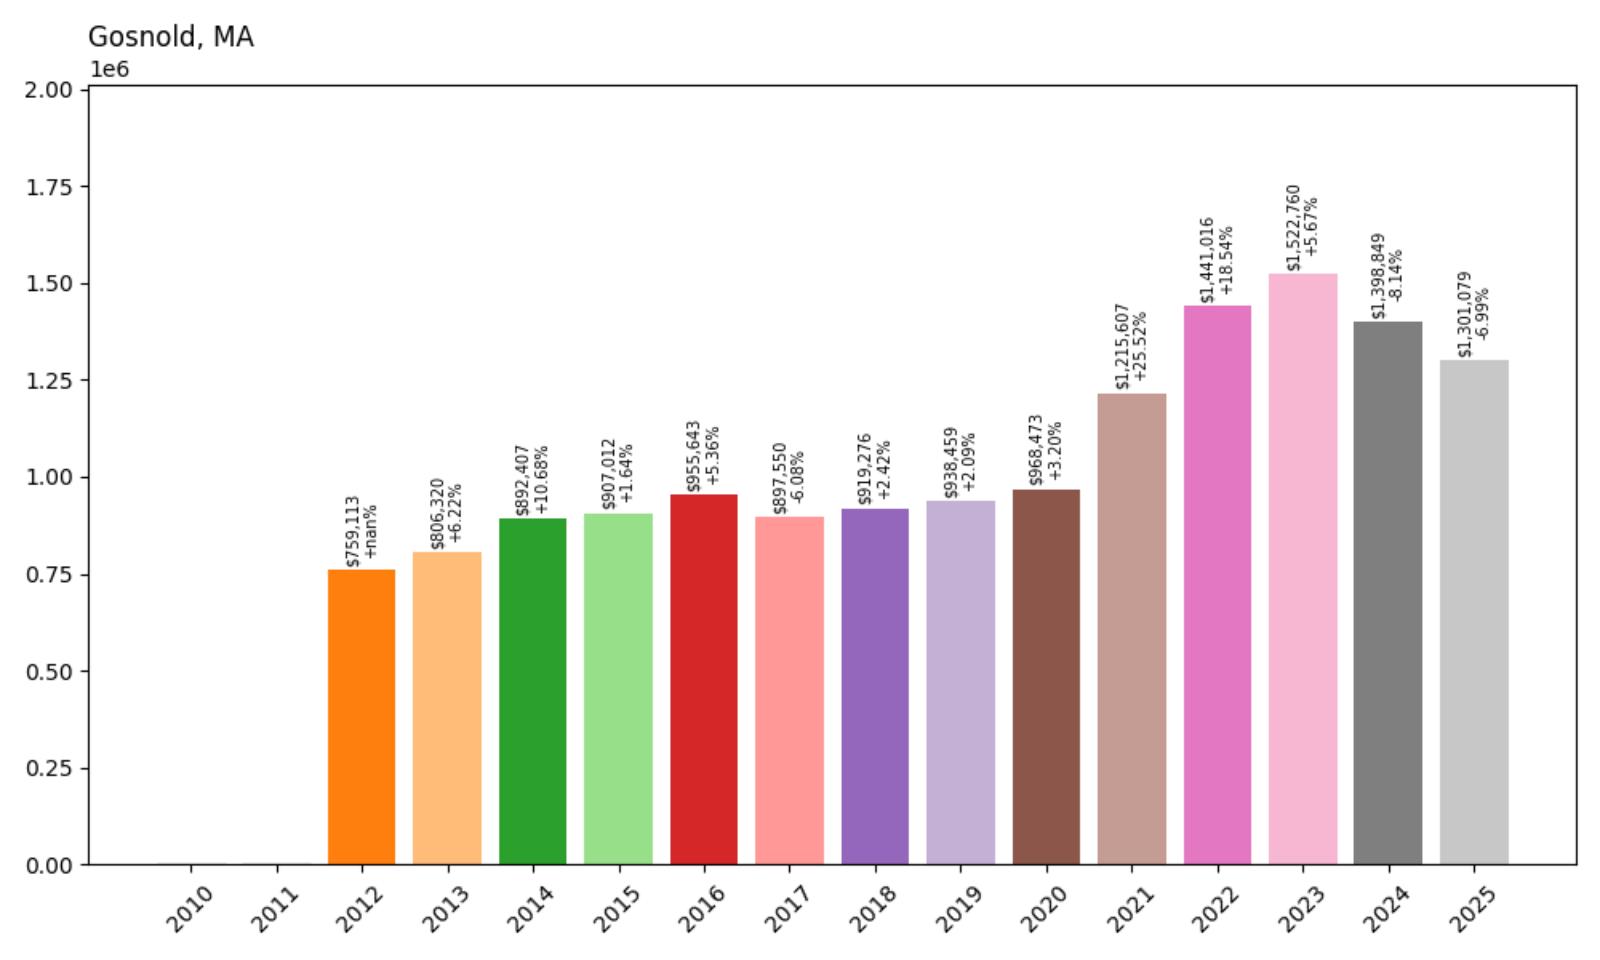
- 2010: N/A
- 2011: N/A
- 2012: $759,113
- 2013: $806,320 (+$47,207, +6.22% from previous year)
- 2014: $892,407 (+$86,088, +10.68% from previous year)
- 2015: $907,012 (+$14,605, +1.64% from previous year)
- 2016: $955,643 (+$48,631, +5.36% from previous year)
- 2017: $897,550 (−$58,093, −6.08% from previous year)
- 2018: $919,276 (+$21,726, +2.42% from previous year)
- 2019: $938,459 (+$19,182, +2.09% from previous year)
- 2020: $968,473 (+$30,014, +3.20% from previous year)
- 2021: $1,215,607 (+$247,135, +25.52% from previous year)
- 2022: $1,441,016 (+$225,409, +18.54% from previous year)
- 2023: $1,522,760 (+$81,743, +5.67% from previous year)
- 2024: $1,398,849 (−$123,911, −8.14% from previous year)
- 2025: $1,301,079 (−$97,770, −6.99% from previous year)
Gosnold achieved 71% appreciation from $759,113 in 2012 to $1,301,079 in 2025, though the market has shown considerable volatility in recent years. The town experienced explosive growth during the pandemic with gains of 25.52% in 2021 and 18.54% in 2022, reaching a peak of over $1.5 million in 2023 before moderating. This unique island community, which consists primarily of the Elizabeth Islands, represents one of Massachusetts’ most exclusive and geographically isolated markets, where limited supply and exceptional privacy command premium prices despite periodic fluctuations.
Gosnold – Exclusive Island Privacy in Buzzards Bay

Consisting primarily of the Elizabeth Islands chain in Buzzards Bay, Gosnold represents one of New England’s most exclusive and private residential opportunities, accessible only by private boat or helicopter. This Dukes County town has a year-round population of fewer than 100 residents spread across several islands, with Cuttyhunk Island serving as the primary community center. The islands’ remote location and limited development create an atmosphere of extraordinary privacy and natural beauty that attracts affluent buyers seeking the ultimate escape from modern life while remaining within reach of Boston and New York metropolitan areas.
Gosnold’s price volatility reflects the unique nature of this ultra-exclusive market, where a small number of high-value transactions can significantly impact median prices. The recent price moderation following pandemic-era peaks suggests market normalization rather than fundamental weakness, as demand for private island properties remains strong among ultra-high-net-worth individuals. With no possibility of increasing supply due to geographic constraints and environmental protections, Gosnold continues to represent one of the most exclusive real estate opportunities in New England, commanding premium prices for unparalleled privacy and natural beauty.
18. Manchester – 108% Home Price Increase Since 2010
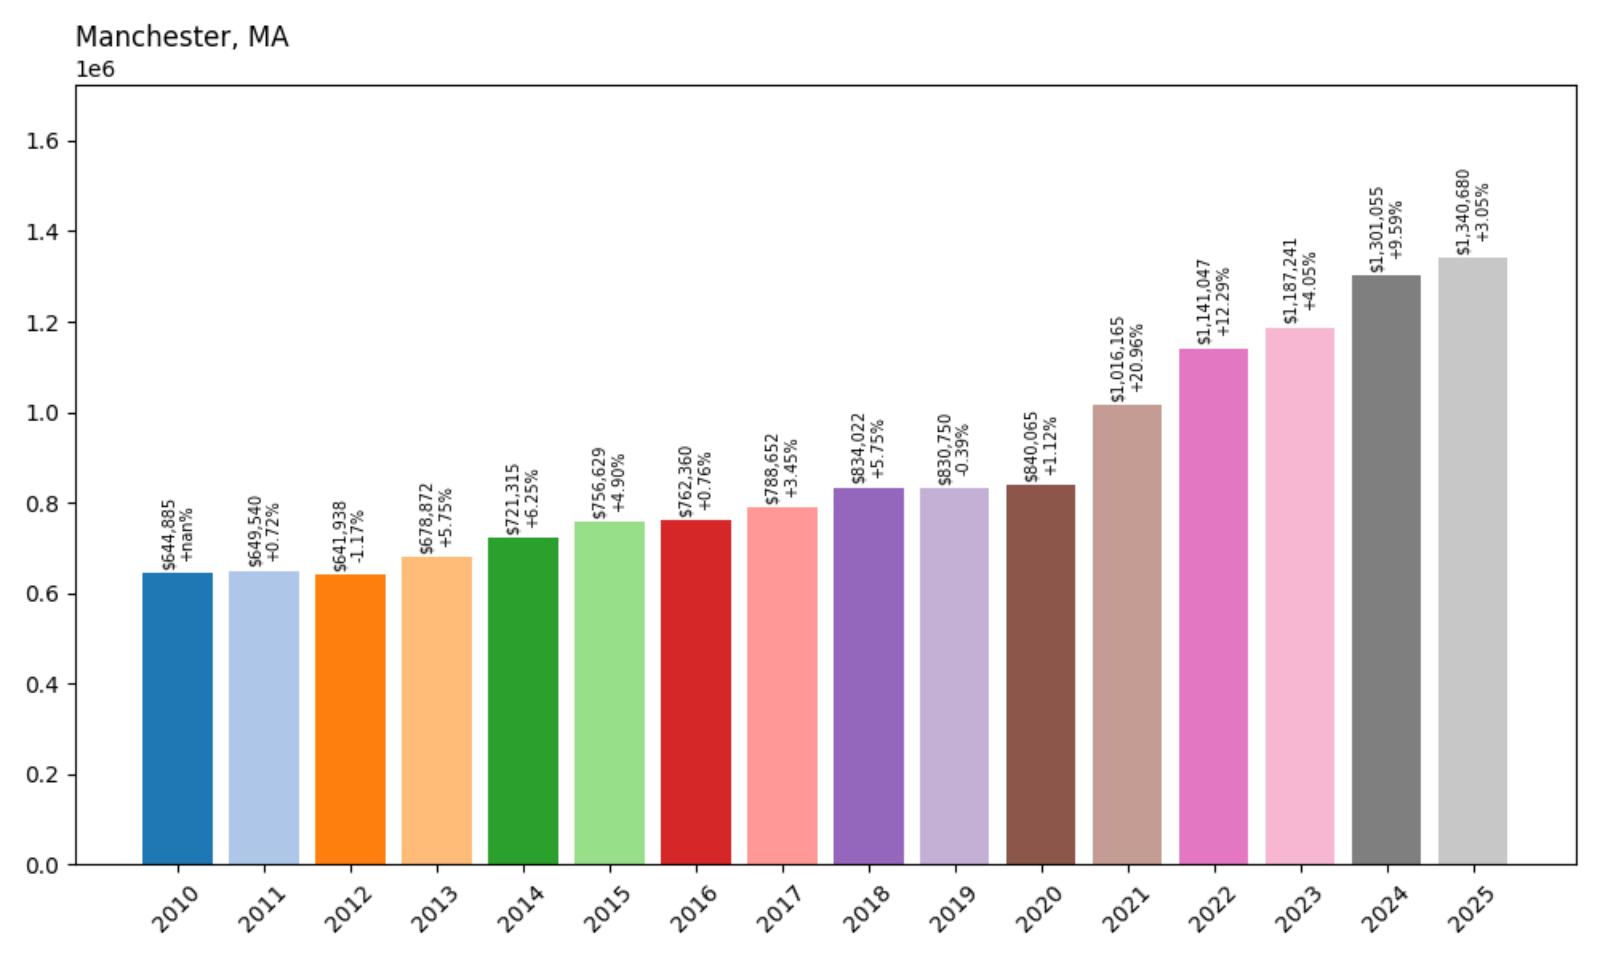
- 2010: $644,885
- 2011: $649,540 (+$4,655, +0.72% from previous year)
- 2012: $641,938 (−$7,602, −1.17% from previous year)
- 2013: $678,872 (+$36,934, +5.75% from previous year)
- 2014: $721,315 (+$42,443, +6.25% from previous year)
- 2015: $756,629 (+$35,314, +4.90% from previous year)
- 2016: $762,360 (+$5,731, +0.76% from previous year)
- 2017: $788,652 (+$26,292, +3.45% from previous year)
- 2018: $834,022 (+$45,371, +5.75% from previous year)
- 2019: $830,750 (−$3,272, −0.39% from previous year)
- 2020: $840,065 (+$9,315, +1.12% from previous year)
- 2021: $1,016,165 (+$176,100, +20.96% from previous year)
- 2022: $1,141,047 (+$124,882, +12.29% from previous year)
- 2023: $1,187,241 (+$46,194, +4.05% from previous year)
- 2024: $1,301,055 (+$113,814, +9.59% from previous year)
- 2025: $1,340,680 (+$39,625, +3.05% from previous year)
Manchester achieved impressive 108% appreciation from $644,885 in 2010 to $1,340,680 in 2025, with particularly strong acceleration during the pandemic years when the market crossed the million-dollar threshold for the first time. The town showed consistent growth through the 2010s before exploding with a 20.96% gain in 2021, followed by sustained momentum that has continued through 2025. This North Shore coastal community has successfully established itself among Massachusetts’ premier seaside destinations, reflecting growing demand for authentic New England coastal living with sophisticated amenities.
Manchester – North Shore Elegance and Coastal Beauty

Known officially as Manchester-by-the-Sea, this Essex County coastal community of approximately 5,500 residents epitomizes North Shore elegance with its pristine beaches, historic estates, and charming downtown area that has attracted affluent families for generations. The town features Singing Beach, one of New England’s most famous and beautiful beaches, along with several other coastal access points that provide residents with exceptional recreational opportunities. Manchester’s commitment to preserving its historic character while supporting modern amenities creates an atmosphere of timeless sophistication that appeals to discerning buyers seeking authentic coastal New England living.
Manchester’s substantial price appreciation reflects its position as one of the North Shore’s most complete and desirable communities, offering coastal beauty with cultural sophistication and convenient access to Boston. The town’s strict zoning regulations and historic preservation requirements limit new construction while maintaining the character that attracts buyers from around the world. With excellent commuter rail service to Boston, outstanding schools, and some of the region’s most beautiful coastal access, Manchester continues to command premium prices from buyers seeking the ultimate in North Shore coastal living.
17. Carlisle – 81% Home Price Increase Since 2010
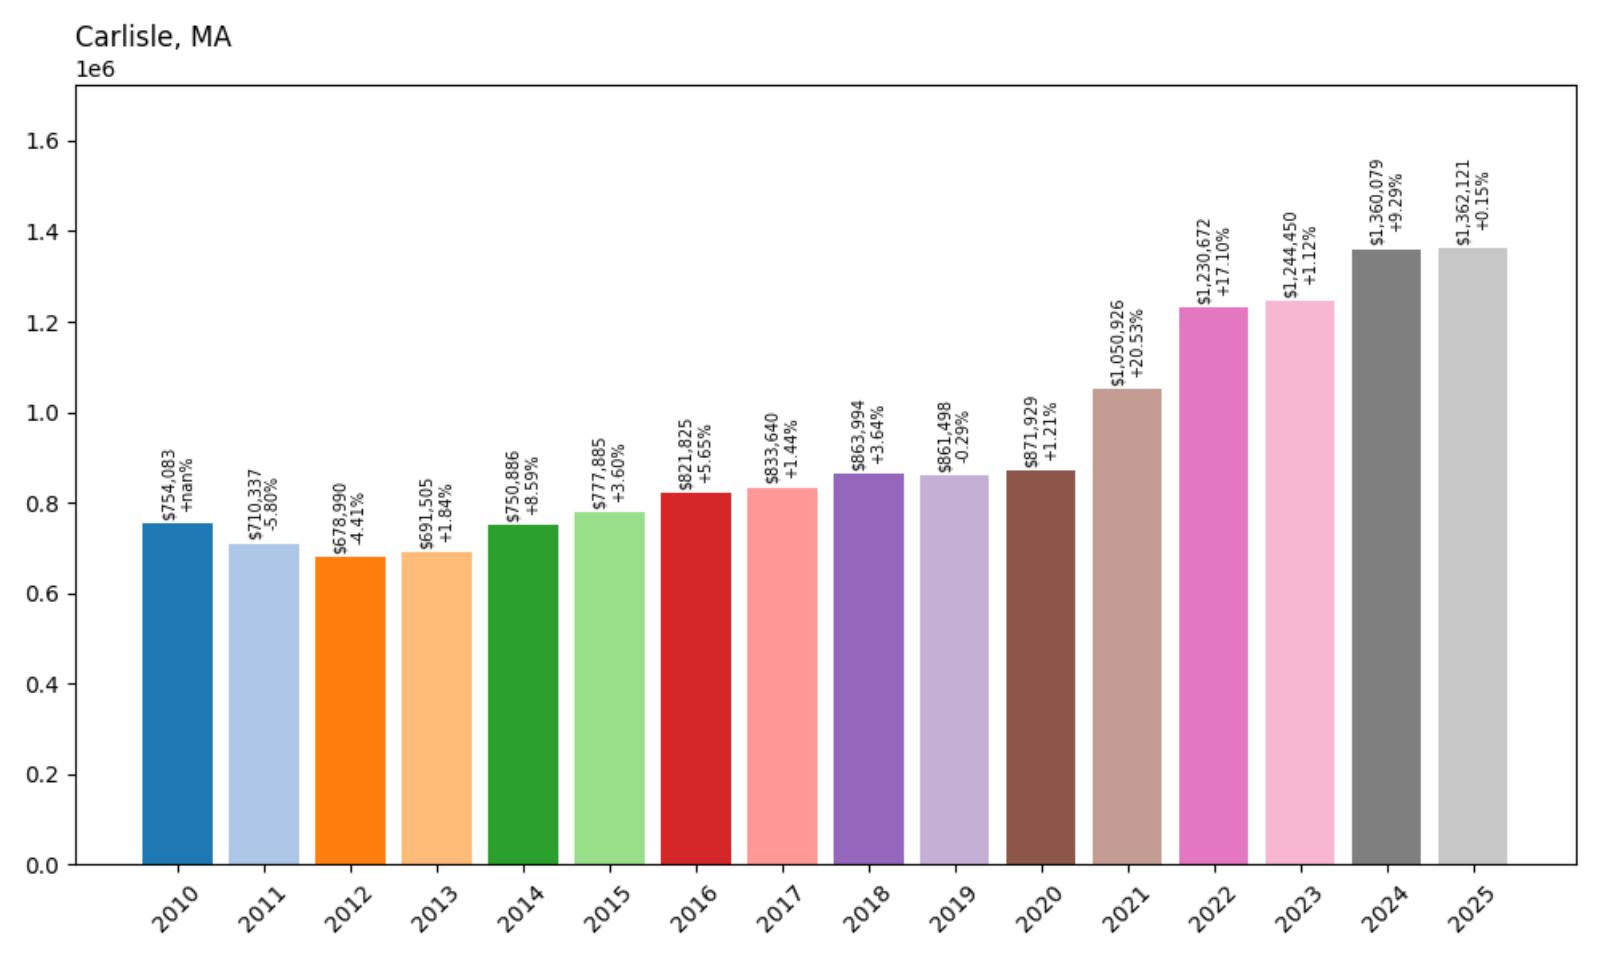
- 2010: $754,083
- 2011: $710,337 (−$43,746, −5.80% from previous year)
- 2012: $678,990 (−$31,347, −4.41% from previous year)
- 2013: $691,505 (+$12,515, +1.84% from previous year)
- 2014: $750,886 (+$59,381, +8.59% from previous year)
- 2015: $777,885 (+$26,999, +3.60% from previous year)
- 2016: $821,825 (+$43,939, +5.65% from previous year)
- 2017: $833,640 (+$11,816, +1.44% from previous year)
- 2018: $863,994 (+$30,354, +3.64% from previous year)
- 2019: $861,498 (−$2,497, −0.29% from previous year)
- 2020: $871,929 (+$10,431, +1.21% from previous year)
- 2021: $1,050,926 (+$178,998, +20.53% from previous year)
- 2022: $1,230,672 (+$179,746, +17.10% from previous year)
- 2023: $1,244,450 (+$13,778, +1.12% from previous year)
- 2024: $1,360,079 (+$115,629, +9.29% from previous year)
- 2025: $1,362,121 (+$2,042, +0.15% from previous year)
Carlisle’s housing market achieved solid 81% appreciation from $754,083 in 2010 to $1,362,121 in 2025, overcoming early 2010s recession impacts to deliver strong long-term returns. The town experienced particularly dramatic growth during the pandemic years with consecutive gains of 20.53% in 2021 and 17.10% in 2022, successfully crossing the million-dollar threshold. This MetroWest community has established itself as one of the region’s most desirable rural enclaves, offering large estates and countryside living within reasonable commuting distance of Boston.
Carlisle – Historic Rural Elegance in Middlesex County

Carlisle represents the pinnacle of rural New England living while remaining accessible to major employment centers, making it one of Massachusetts’ most exclusive countryside communities. This Middlesex County town of approximately 5,200 residents features large estates, horse properties, and extensive conservation land that preserves its agricultural character despite proximity to Boston’s sprawling suburbs. The community’s commitment to maintaining rural character through strict zoning requirements creates an environment of extraordinary privacy and natural beauty that attracts affluent buyers seeking space, tranquility, and outdoor recreation opportunities.
Carlisle’s substantial price appreciation reflects the premium buyers place on privacy, space, and rural lifestyle in an increasingly developed region. The town’s zoning restrictions effectively limit housing supply while demand grows from affluent professionals seeking larger properties and outdoor amenities for their families. With excellent access to major highways, top-rated schools, and proximity to both Boston and high-tech employment centers along Route 128, Carlisle continues to command premium prices from buyers seeking the ultimate in rural elegance and natural beauty.
16. Cohasset – 102% Home Price Increase Since 2010

- 2010: $700,238
- 2011: $699,758 (−$479, −0.07% from previous year)
- 2012: $687,181 (−$12,577, −1.80% from previous year)
- 2013: $717,138 (+$29,957, +4.36% from previous year)
- 2014: $773,415 (+$56,277, +7.85% from previous year)
- 2015: $798,542 (+$25,127, +3.25% from previous year)
- 2016: $822,972 (+$24,430, +3.06% from previous year)
- 2017: $846,494 (+$23,522, +2.86% from previous year)
- 2018: $869,196 (+$22,702, +2.68% from previous year)
- 2019: $889,878 (+$20,682, +2.38% from previous year)
- 2020: $908,750 (+$18,872, +2.12% from previous year)
- 2021: $1,070,551 (+$161,801, +17.80% from previous year)
- 2022: $1,252,616 (+$182,065, +17.01% from previous year)
- 2023: $1,274,902 (+$22,286, +1.78% from previous year)
- 2024: $1,398,270 (+$123,368, +9.68% from previous year)
- 2025: $1,413,622 (+$15,352, +1.10% from previous year)
Cohasset achieved exactly 102% appreciation from $700,238 in 2010 to $1,413,622 in 2025, demonstrating the remarkably consistent growth that characterizes premier South Shore coastal communities. The town showed extraordinary stability throughout the 2010s with steady annual gains rarely exceeding 3%, before accelerating during the pandemic with consecutive increases of 17.80% in 2021 and 17.01% in 2022. This Norfolk County community has successfully doubled its median home values while maintaining the character and appeal that make it one of Massachusetts’ most desirable coastal destinations.
Cohasset – South Shore Coastal Sophistication

Blessed with a dramatic rocky coastline and charming village center, Cohasset combines natural coastal beauty with New England sophistication to create one of the South Shore’s most prestigious communities. This Norfolk County town of approximately 8,500 residents features stunning ocean views, pristine beaches, and a picturesque harbor that attracts boating enthusiasts from throughout the region. The community’s commitment to preserving its coastal character while supporting high-quality development creates an environment that successfully balances natural beauty with modern amenities and convenience.
The town’s steady price doubling reflects its position as one of New England’s premier coastal communities, offering the perfect combination of natural beauty, cultural sophistication, and convenient access to Boston. Cohasset’s strict zoning regulations and commitment to coastal preservation limit new construction while maintaining the character that attracts buyers from around the world. With excellent commuter rail service to Boston, outstanding schools, and some of the region’s most spectacular coastal scenery, Cohasset continues to command premium prices from buyers seeking authentic New England coastal living at its finest.
15. Concord – 101% Home Price Increase Since 2010

- 2010: $734,546
- 2011: $663,979 (−$70,567, −9.61% from previous year)
- 2012: $645,699 (−$18,280, −2.75% from previous year)
- 2013: $678,259 (+$32,560, +5.04% from previous year)
- 2014: $767,560 (+$89,300, +13.17% from previous year)
- 2015: $842,030 (+$74,470, +9.70% from previous year)
- 2016: $902,851 (+$60,821, +7.22% from previous year)
- 2017: $907,287 (+$4,436, +0.49% from previous year)
- 2018: $946,178 (+$38,891, +4.29% from previous year)
- 2019: $945,398 (−$780, −0.08% from previous year)
- 2020: $960,366 (+$14,968, +1.58% from previous year)
- 2021: $1,115,172 (+$154,807, +16.12% from previous year)
- 2022: $1,315,528 (+$200,356, +17.97% from previous year)
- 2023: $1,311,289 (−$4,240, −0.32% from previous year)
- 2024: $1,465,180 (+$153,891, +11.74% from previous year)
- 2025: $1,479,766 (+$14,586, +1.00% from previous year)
Concord achieved remarkable 101% appreciation from $734,546 in 2010 to $1,479,766 in 2025, overcoming significant early recession impacts to deliver strong long-term returns for homeowners. After falling nearly 22% from 2010 to 2012, the market began steady recovery that accelerated through the mid-2010s and exploded during the pandemic with gains of 16.12% in 2021 and 17.97% in 2022. This historic Middlesex County community has successfully established itself among Massachusetts’ most expensive towns, reflecting its unique combination of American history, natural beauty, and contemporary amenities.
Concord – Where American History Meets Modern Luxury

As the birthplace of the American Revolution and home to literary giants like Ralph Waldo Emerson and Henry David Thoreau, Concord combines unparalleled historical significance with modern suburban excellence to create one of Massachusetts’ most prestigious communities. This Middlesex County town of approximately 18,000 residents features numerous National Historic Landmarks, including the Old North Bridge where “the shot heard ’round the world” was fired, alongside contemporary amenities that support comfortable modern living. The community’s deep commitment to preserving its historical heritage while embracing thoughtful development creates an environment that appeals to educated, affluent families seeking both cultural enrichment and practical advantages.
The town’s dramatic price appreciation reflects its unique position as America’s most historically significant suburban community, offering cultural and educational advantages that cannot be replicated elsewhere. Concord’s strict zoning regulations and commitment to historical preservation limit new construction while maintaining the character that attracts buyers from around the world. With excellent schools, extensive conservation land, convenient access to Boston, and unmatched historical significance, Concord continues to command premium prices from buyers seeking to live where American democracy was born while enjoying all the advantages of modern suburban life.
14. Belmont – 130% Home Price Increase Since 2010
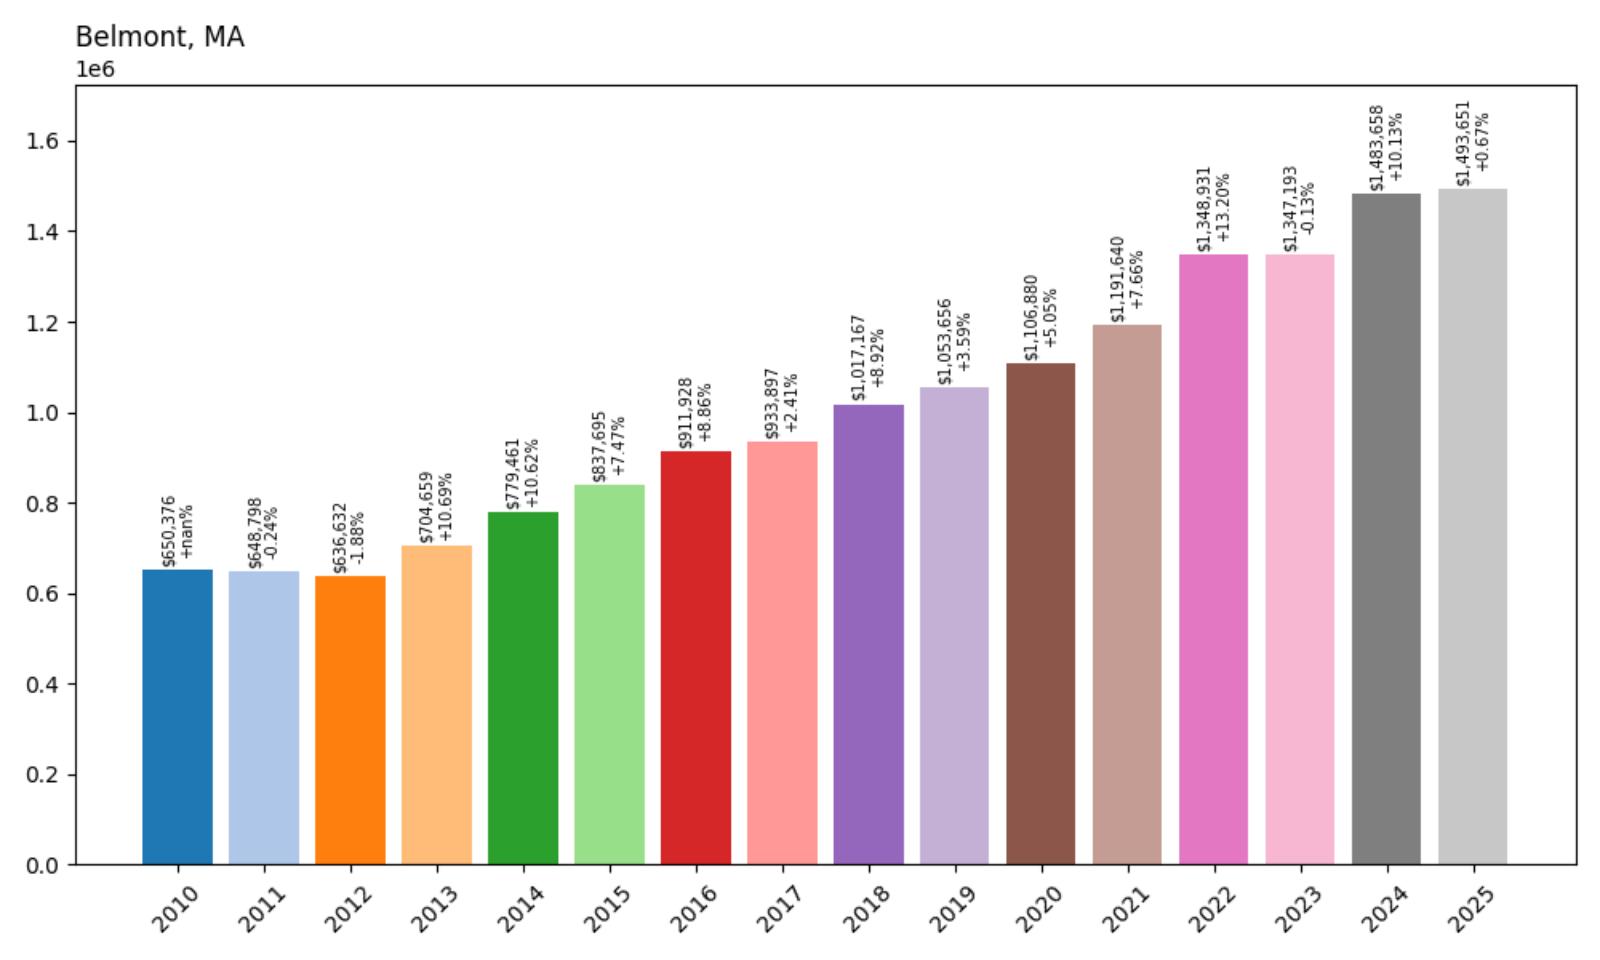
- 2010: $650,376
- 2011: $648,798 (−$1,578, −0.24% from previous year)
- 2012: $636,632 (−$12,166, −1.88% from previous year)
- 2013: $704,659 (+$68,027, +10.69% from previous year)
- 2014: $779,461 (+$74,801, +10.62% from previous year)
- 2015: $837,695 (+$58,234, +7.47% from previous year)
- 2016: $911,928 (+$74,233, +8.86% from previous year)
- 2017: $933,897 (+$21,969, +2.41% from previous year)
- 2018: $1,017,167 (+$83,270, +8.92% from previous year)
- 2019: $1,053,656 (+$36,489, +3.59% from previous year)
- 2020: $1,106,880 (+$53,224, +5.05% from previous year)
- 2021: $1,191,640 (+$84,760, +7.66% from previous year)
- 2022: $1,348,931 (+$157,291, +13.20% from previous year)
- 2023: $1,347,193 (−$1,738, −0.13% from previous year)
- 2024: $1,483,658 (+$136,465, +10.13% from previous year)
- 2025: $1,493,651 (+$9,993, +0.67% from previous year)
Belmont achieved exceptional 130% appreciation from $650,376 in 2010 to $1,493,651 in 2025, making it one of the strongest-performing markets among Massachusetts’ premium communities. The town showed remarkable consistency through the 2010s with particularly strong years in 2013, 2014, and 2016, crossing the million-dollar threshold in 2018. Even during the pandemic period, Belmont demonstrated measured growth rather than explosive volatility, reflecting its status as a mature, established market that attracts sophisticated buyers seeking proximity to Boston with suburban comfort.
Belmont – Suburban Excellence Adjacent to Cambridge

Strategically positioned between Cambridge and the western suburbs, Belmont offers the rare combination of urban accessibility and suburban tranquility that makes it one of Greater Boston’s most consistently desirable communities. This Middlesex County town of approximately 26,000 residents features tree-lined streets, well-maintained neighborhoods, and excellent public transportation connections that provide easy access to Boston’s employment centers and cultural attractions. The community’s commitment to maintaining high residential standards while preserving its suburban character creates an environment that appeals to professionals and families seeking the best of both urban and suburban living.
The town’s substantial price appreciation reflects its position as one of the most fundamentally sound real estate markets in Greater Boston, offering proven value retention and exceptional quality of life. Belmont’s excellent schools, convenient location, and well-maintained infrastructure create sustained demand from educated, affluent buyers who recognize the community’s long-term advantages. With limited opportunities for new construction due to the town’s developed nature and strict zoning requirements, housing supply remains constrained while demand continues from buyers seeking established communities with excellent schools and convenient access to Boston.
13. Needham – 76% Home Price Increase Since 2010
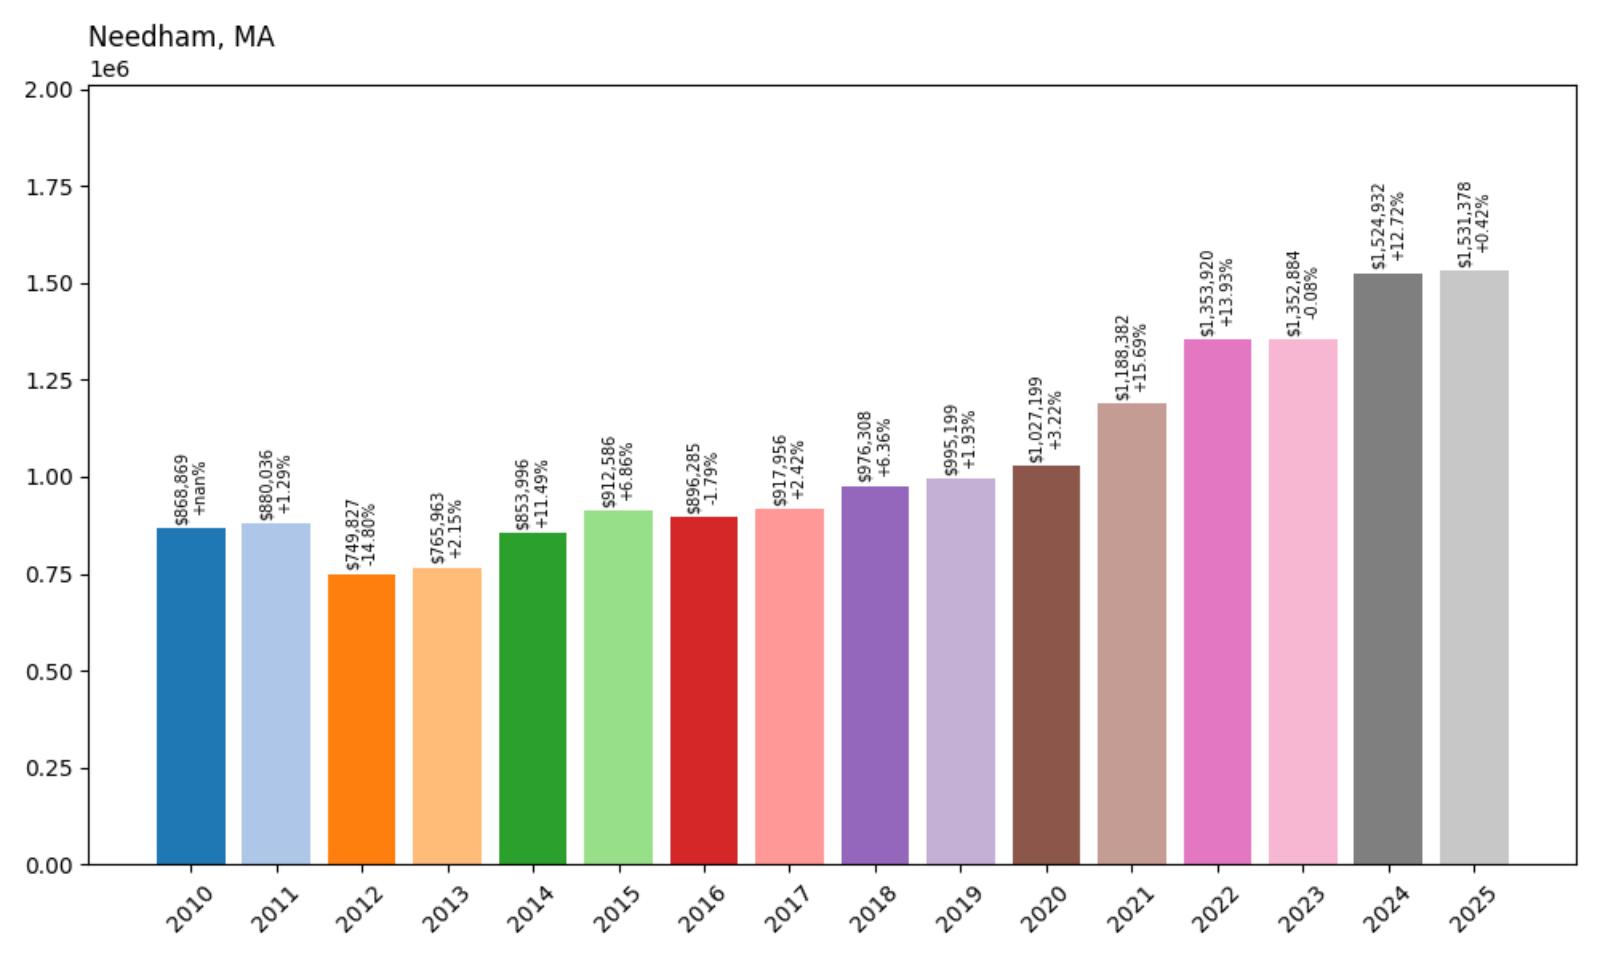
- 2010: $868,869
- 2011: $880,036 (+$11,167, +1.29% from previous year)
- 2012: $749,827 (−$130,209, −14.80% from previous year)
- 2013: $765,963 (+$16,136, +2.15% from previous year)
- 2014: $853,996 (+$88,034, +11.49% from previous year)
- 2015: $912,586 (+$58,590, +6.86% from previous year)
- 2016: $896,285 (−$16,301, −1.79% from previous year)
- 2017: $917,956 (+$21,671, +2.42% from previous year)
- 2018: $976,308 (+$58,352, +6.36% from previous year)
- 2019: $995,199 (+$18,891, +1.93% from previous year)
- 2020: $1,027,199 (+$32,000, +3.22% from previous year)
- 2021: $1,188,382 (+$161,183, +15.69% from previous year)
- 2022: $1,353,920 (+$165,537, +13.93% from previous year)
- 2023: $1,352,884 (−$1,036, −0.08% from previous year)
- 2024: $1,524,932 (+$172,048, +12.72% from previous year)
- 2025: $1,531,378 (+$6,447, +0.42% from previous year)
Needham achieved solid 76% appreciation from $868,869 in 2010 to $1,531,378 in 2025, though the journey included significant volatility including a dramatic 14.80% decline in 2012 during the recession recovery period. The market demonstrated resilience with strong growth through the mid-2010s before accelerating during the pandemic years with consecutive gains of 15.69% in 2021 and 13.93% in 2022. This MetroWest community has established itself as one of the region’s most expensive markets, reflecting its exceptional schools and convenient location.
Needham – MetroWest’s Educational Powerhouse

Renowned throughout Massachusetts for having one of the state’s most exceptional public school systems, Needham has built an unassailable reputation as an educational powerhouse that consistently attracts families willing to pay premium prices for academic excellence. This Norfolk County town of approximately 32,000 residents features schools that regularly achieve the highest standardized test scores in the state, with Needham High School maintaining an extraordinary track record of college acceptances to the nation’s most prestigious universities. The community’s deep commitment to educational investment shows in its willingness to fund cutting-edge facilities, technology, and programs that maintain its competitive advantage.
The town’s strong price appreciation despite periodic volatility reflects its fundamental appeal to educated, affluent families who prioritize educational quality above all other considerations. Needham’s schools create a competitive advantage that supports sustained high property values, while the community’s excellent amenities and convenient location provide additional value propositions. With strict zoning that maintains neighborhood quality and limited opportunities for new construction, housing supply remains constrained while demand continues from buyers seeking the state’s best public education combined with suburban comfort and convenience.
12. Newton – 114% Home Price Increase Since 2010
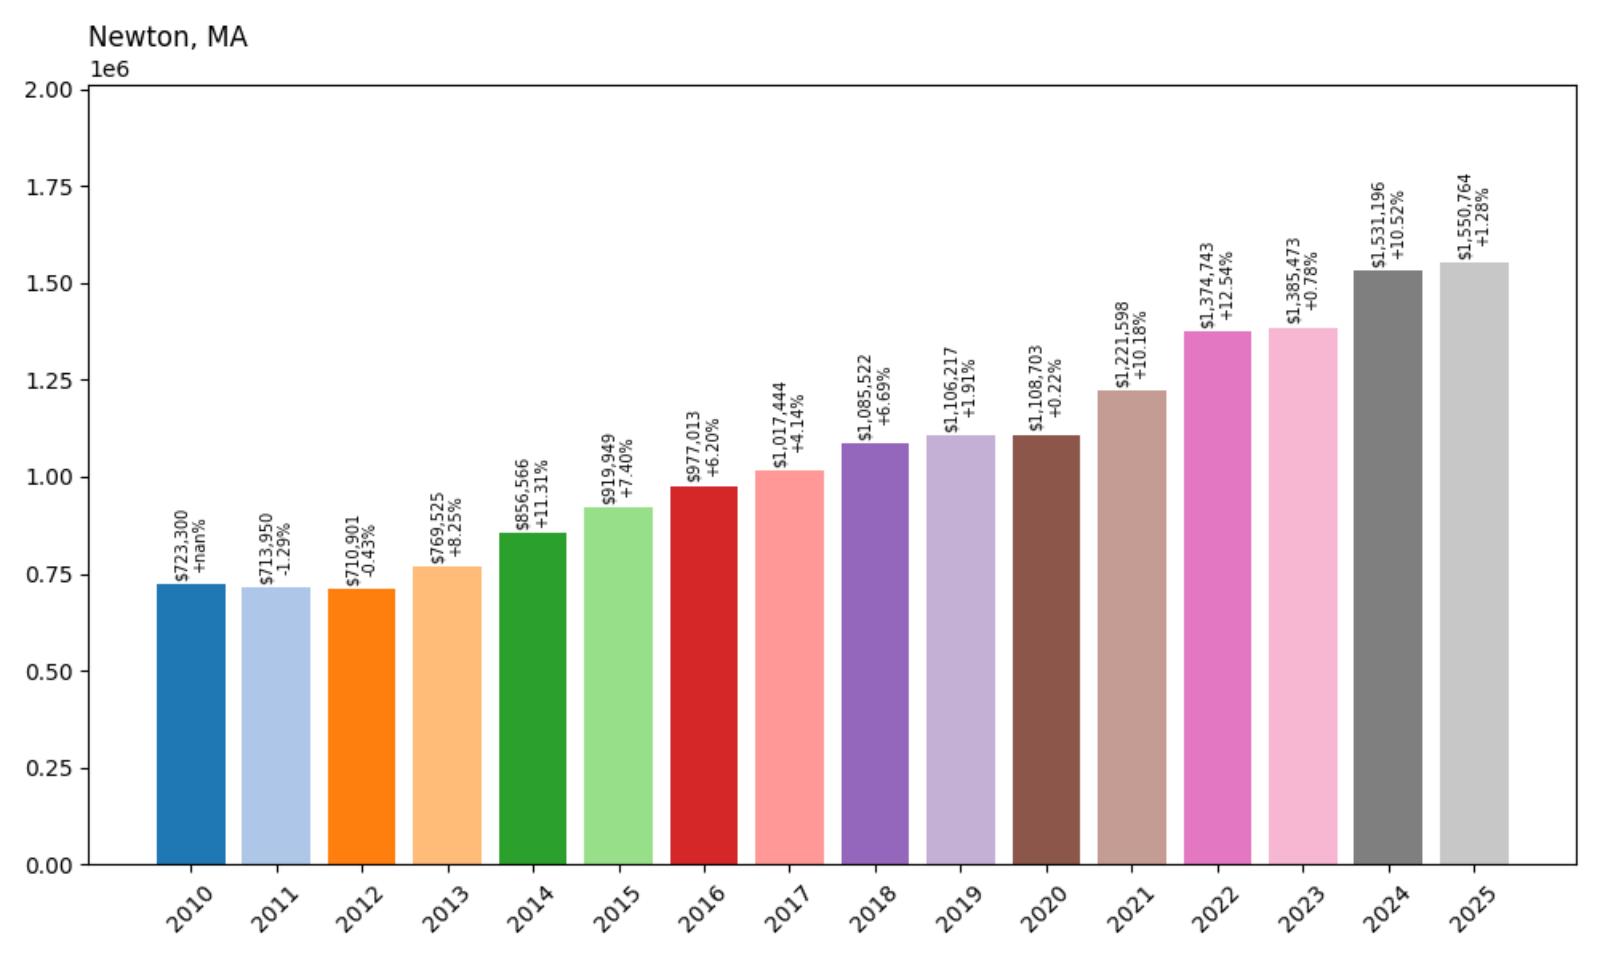
- 2010: $723,300
- 2011: $713,950 (−$9,351, −1.29% from previous year)
- 2012: $710,901 (−$3,049, −0.43% from previous year)
- 2013: $769,525 (+$58,624, +8.25% from previous year)
- 2014: $856,566 (+$87,041, +11.31% from previous year)
- 2015: $919,949 (+$63,383, +7.40% from previous year)
- 2016: $977,013 (+$57,064, +6.20% from previous year)
- 2017: $1,017,444 (+$40,432, +4.14% from previous year)
- 2018: $1,085,522 (+$68,077, +6.69% from previous year)
- 2019: $1,106,217 (+$20,696, +1.91% from previous year)
- 2020: $1,108,703 (+$2,486, +0.22% from previous year)
- 2021: $1,221,598 (+$112,895, +10.18% from previous year)
- 2022: $1,374,743 (+$153,145, +12.54% from previous year)
- 2023: $1,385,473 (+$10,730, +0.78% from previous year)
- 2024: $1,531,196 (+$145,723, +10.52% from previous year)
- 2025: $1,550,764 (+$19,568, +1.28% from previous year)
Newton delivered impressive 114% appreciation from $723,300 in 2010 to $1,550,764 in 2025, with particularly strong performance during the 2013-2016 period when the market crossed the million-dollar threshold. The city showed consistent growth throughout the 2010s before accelerating during the pandemic years, demonstrating the sustained appeal of this prestigious MetroWest community. Newton’s transformation into a $1.5 million median market reflects its unique combination of urban sophistication, suburban comfort, and unmatched convenience to Boston’s employment centers.
Newton – The Garden City’s Urban Sophistication

Known as “The Garden City” for its tree-lined streets and abundant green space, Newton combines urban sophistication with suburban tranquility to create one of Greater Boston’s most desirable residential destinations. This Middlesex County city of approximately 88,000 residents features 13 distinct villages, each with its own character and amenities, from the upscale shops of Newton Centre to the quiet residential streets of Newton Highlands. The community’s commitment to preserving its garden-like atmosphere while supporting thoughtful development creates an environment that successfully balances urban convenience with suburban quality of life.
The city’s substantial price appreciation reflects its position as Greater Boston’s most complete suburban community, offering urban amenities without urban compromises. Newton’s excellent schools, diverse housing options, and unmatched access to Boston’s employment centers create sustained demand from sophisticated buyers who recognize the community’s fundamental advantages. With multiple subway lines providing convenient access to downtown Boston and a well-established infrastructure that supports both residential and commercial activity, Newton continues to command premium prices from buyers seeking the ultimate in suburban sophistication and convenience.
11. Lincoln – 94% Home Price Increase Since 2010
- 2010: $799,046
- 2011: $696,328 (−$102,718, −12.86% from previous year)
- 2012: $704,476 (+$8,148, +1.17% from previous year)
- 2013: $751,093 (+$46,617, +6.62% from previous year)
- 2014: $872,025 (+$120,932, +16.10% from previous year)
- 2015: $923,707 (+$51,682, +5.93% from previous year)
- 2016: $969,159 (+$45,452, +4.92% from previous year)
- 2017: $992,266 (+$23,107, +2.38% from previous year)
- 2018: $1,019,125 (+$26,859, +2.71% from previous year)
- 2019: $1,017,377 (−$1,748, −0.17% from previous year)
- 2020: $1,024,804 (+$7,427, +0.73% from previous year)
- 2021: $1,199,273 (+$174,469, +17.02% from previous year)
- 2022: $1,398,465 (+$199,192, +16.61% from previous year)
- 2023: $1,432,145 (+$33,679, +2.41% from previous year)
- 2024: $1,547,857 (+$115,712, +8.08% from previous year)
- 2025: $1,550,921 (+$3,064, +0.20% from previous year)
Lincoln achieved solid 94% appreciation from $799,046 in 2010 to $1,550,921 in 2025, overcoming a significant early recession impact that saw values drop nearly 13% in 2011. The market demonstrated remarkable resilience with particularly strong recovery in 2014, showing a 16.10% gain that restored confidence in this premium community. Lincoln’s pandemic-era acceleration with consecutive gains of 17.02% in 2021 and 16.61% in 2022 established the town firmly among Massachusetts’ most expensive markets, reflecting its unique appeal as a rural sanctuary within commuting distance of Boston.
Lincoln – Preserved Rural Beauty in MetroWest

Lincoln stands as one of Massachusetts’ most successful examples of rural preservation, maintaining its agricultural character and natural beauty while remaining accessible to major employment centers. This Middlesex County town of approximately 6,500 residents features extensive conservation land, working farms, and large residential lots that create a countryside atmosphere increasingly rare in eastern Massachusetts. The community’s commitment to land preservation through strict zoning and active conservation programs ensures that Lincoln retains its rural character while providing residents with exceptional privacy and outdoor recreation opportunities.
Lincoln’s substantial price appreciation reflects the premium buyers place on rural lifestyle and environmental quality in an increasingly developed region. The town’s strict zoning requirements and commitment to conservation effectively limit housing supply while demand grows from Boston-area professionals seeking larger properties and natural amenities. With excellent access to major highways, proximity to high-tech employment centers along Route 128, and a reputation for environmental excellence, Lincoln continues to attract premium prices from buyers seeking the ultimate in rural sophistication and natural beauty.
10. Winchester – 111% Home Price Increase Since 2010
- 2010: $748,565
- 2011: $740,638 (−$7,926, −1.06% from previous year)
- 2012: $729,063 (−$11,575, −1.56% from previous year)
- 2013: $782,055 (+$52,992, +7.27% from previous year)
- 2014: $858,897 (+$76,842, +9.83% from previous year)
- 2015: $918,374 (+$59,477, +6.92% from previous year)
- 2016: $993,340 (+$74,967, +8.16% from previous year)
- 2017: $1,027,741 (+$34,400, +3.46% from previous year)
- 2018: $1,084,562 (+$56,821, +5.53% from previous year)
- 2019: $1,093,693 (+$9,130, +0.84% from previous year)
- 2020: $1,121,622 (+$27,930, +2.55% from previous year)
- 2021: $1,245,616 (+$123,994, +11.05% from previous year)
- 2022: $1,412,937 (+$167,321, +13.43% from previous year)
- 2023: $1,431,228 (+$18,290, +1.29% from previous year)
- 2024: $1,562,277 (+$131,050, +9.16% from previous year)
- 2025: $1,582,303 (+$20,026, +1.28% from previous year)
Winchester achieved impressive 111% appreciation from $748,565 in 2010 to $1,582,303 in 2025, with particularly strong performance during the mid-2010s when the market crossed the million-dollar threshold in 2016. The town demonstrated consistent growth throughout the period with notable acceleration during the pandemic years, establishing itself firmly among Greater Boston’s most expensive communities. Winchester’s journey to becoming a $1.5 million median market reflects its exceptional appeal as a family-oriented community that successfully balances suburban tranquility with urban accessibility.
Winchester – Lakeside Living North of Boston

Centered around the scenic Mystic Lakes and featuring some of Greater Boston’s most desirable residential neighborhoods, Winchester combines natural beauty with suburban sophistication to create one of the region’s premier family communities. This Middlesex County town of approximately 22,000 residents features tree-lined streets, well-maintained Victorian and colonial homes, and abundant recreational opportunities centered around its beautiful lake system. The community’s commitment to preserving its natural assets while maintaining high residential standards creates an environment that consistently attracts affluent families seeking quality of life and educational excellence.
The town’s substantial price appreciation reflects its position as one of Greater Boston’s most complete family communities, offering natural beauty, excellent schools, and convenient access to employment centers. Winchester’s lakeside location provides unique recreational advantages that distinguish it from other suburban communities, while its excellent public transportation connections make Boston easily accessible. With limited opportunities for new construction due to the town’s developed nature and environmental constraints around the lakes, housing supply remains constrained while demand continues from families seeking the ideal suburban lifestyle with natural amenities.
9. Lexington – 121% Home Price Increase Since 2010

- 2010: $732,917
- 2011: $721,335 (−$11,582, −1.58% from previous year)
- 2012: $726,210 (+$4,875, +0.68% from previous year)
- 2013: $786,099 (+$59,889, +8.25% from previous year)
- 2014: $864,943 (+$78,844, +10.03% from previous year)
- 2015: $926,717 (+$61,774, +7.14% from previous year)
- 2016: $990,415 (+$63,697, +6.87% from previous year)
- 2017: $1,023,539 (+$33,125, +3.34% from previous year)
- 2018: $1,077,606 (+$54,067, +5.28% from previous year)
- 2019: $1,099,783 (+$22,177, +2.06% from previous year)
- 2020: $1,097,150 (−$2,633, −0.24% from previous year)
- 2021: $1,242,803 (+$145,653, +13.28% from previous year)
- 2022: $1,427,699 (+$184,896, +14.88% from previous year)
- 2023: $1,451,475 (+$23,776, +1.67% from previous year)
- 2024: $1,605,620 (+$154,145, +10.62% from previous year)
- 2025: $1,616,818 (+$11,198, +0.70% from previous year)
Lexington achieved remarkable 121% appreciation from $732,917 in 2010 to $1,616,818 in 2025, with exceptionally strong performance during the 2013-2016 period when the market crossed the million-dollar threshold. The town demonstrated consistent growth throughout the 2010s before accelerating during the pandemic years with gains of 13.28% in 2021 and 14.88% in 2022. This historic Middlesex County community has established itself among Massachusetts’ most expensive markets, reflecting its unique combination of revolutionary history, exceptional schools, and convenient access to Boston’s high-tech employment corridor.
Lexington – Revolutionary History Meets Modern Excellence

Forever etched in American history as the site where the Revolutionary War began on April 19, 1775, Lexington combines unparalleled historical significance with modern suburban excellence to create one of Massachusetts’ most prestigious communities. This Middlesex County town of approximately 34,000 residents features the famous Lexington Battle Green, numerous historic sites, and well-preserved colonial architecture that creates a unique sense of place rooted in the nation’s founding story. The community’s deep commitment to preserving its revolutionary heritage while embracing contemporary development creates an environment that appeals to educated families seeking both historical enrichment and modern conveniences.
The town’s substantial price appreciation reflects its position as one of America’s most historically significant suburban communities, offering educational and cultural advantages that cannot be replicated elsewhere. Lexington’s excellent schools attract families from around the world, particularly those in high-tech industries who value the town’s proximity to Route 128’s technology corridor. With strict zoning that preserves historical character, limited opportunities for new construction, and sustained demand from educated professionals, Lexington continues to command premium prices from buyers seeking to live where American independence began while enjoying world-class suburban amenities.
8. West Tisbury – 145% Home Price Increase Since 2010
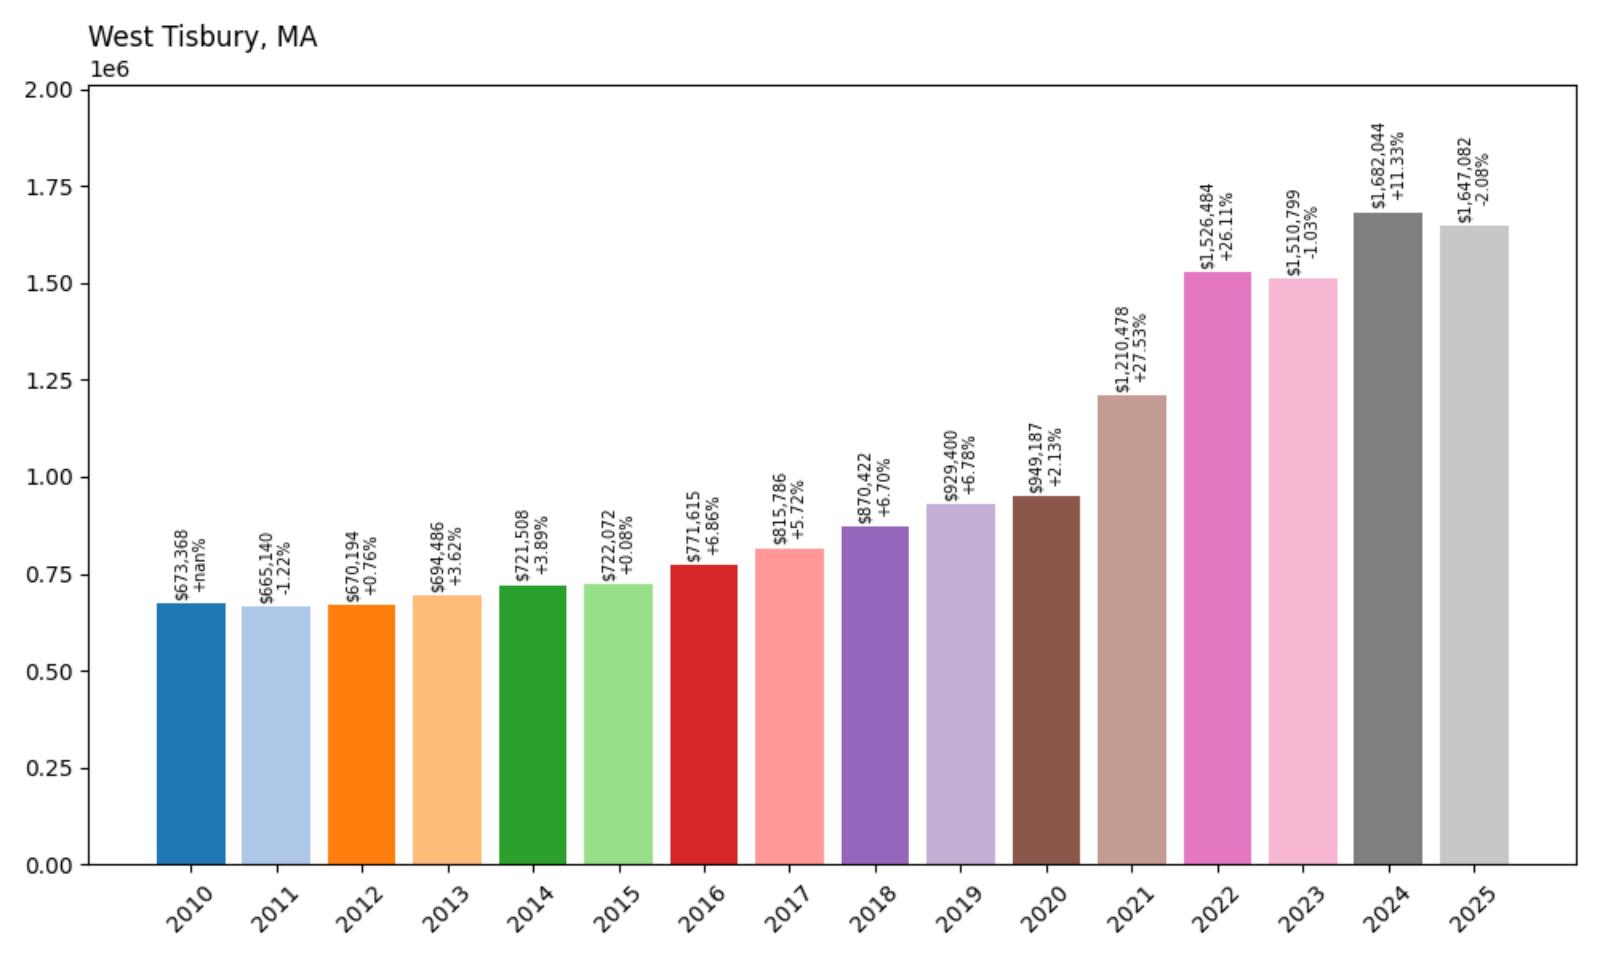
- 2010: $673,368
- 2011: $665,140 (−$8,229, −1.22% from previous year)
- 2012: $670,194 (+$5,054, +0.76% from previous year)
- 2013: $694,486 (+$24,292, +3.62% from previous year)
- 2014: $721,508 (+$27,022, +3.89% from previous year)
- 2015: $722,072 (+$564, +0.08% from previous year)
- 2016: $771,615 (+$49,543, +6.86% from previous year)
- 2017: $815,786 (+$44,172, +5.72% from previous year)
- 2018: $870,422 (+$54,636, +6.70% from previous year)
- 2019: $929,400 (+$58,978, +6.78% from previous year)
- 2020: $949,187 (+$19,787, +2.13% from previous year)
- 2021: $1,210,478 (+$261,291, +27.53% from previous year)
- 2022: $1,526,484 (+$316,006, +26.11% from previous year)
- 2023: $1,510,799 (−$15,686, −1.03% from previous year)
- 2024: $1,682,044 (+$171,245, +11.33% from previous year)
- 2025: $1,647,082 (−$34,961, −2.08% from previous year)
West Tisbury delivered exceptional 145% appreciation from $673,368 in 2010 to $1,647,082 in 2025, with the most dramatic growth occurring during the pandemic years when values more than doubled. The town showed accelerating momentum through the late 2010s before exploding with massive gains of 27.53% in 2021 and 26.11% in 2022, transforming from a moderately priced Martha’s Vineyard community to one of the state’s most expensive markets. This rural island town has become a premier destination for affluent buyers seeking privacy and natural beauty in one of New England’s most exclusive locations.
West Tisbury – Martha’s Vineyard’s Rural Sanctuary

West Tisbury represents Martha’s Vineyard at its most unspoiled and authentic, featuring rolling hills, stone walls, and working farms that create a countryside atmosphere unique among island communities. This Dukes County town of approximately 3,000 residents encompasses much of the island’s agricultural land and conservation areas, including the iconic Gay Head Cliffs and numerous protected forests and ponds. The community’s commitment to preserving its rural character through strict zoning and conservation efforts ensures that West Tisbury maintains the pastoral beauty that has attracted artists, writers, and nature lovers for generations.
West Tisbury’s remarkable price appreciation reflects the premium buyers place on authentic rural character and environmental quality in an increasingly developed world. The town’s strict conservation regulations and large minimum lot sizes effectively limit development while preserving the natural beauty that attracts buyers from around the globe. With no commercial development and a commitment to agricultural preservation, West Tisbury continues to command exceptional prices from buyers seeking the ultimate in privacy, natural beauty, and authentic New England island living.
7. Dover – 79% Home Price Increase Since 2010

- 2010: $999,897
- 2011: $977,398 (−$22,499, −2.25% from previous year)
- 2012: $955,338 (−$22,060, −2.26% from previous year)
- 2013: $992,648 (+$37,309, +3.91% from previous year)
- 2014: $1,058,001 (+$65,353, +6.58% from previous year)
- 2015: $1,085,313 (+$27,312, +2.58% from previous year)
- 2016: $1,111,926 (+$26,613, +2.45% from previous year)
- 2017: $1,143,328 (+$31,402, +2.82% from previous year)
- 2018: $1,183,925 (+$40,598, +3.55% from previous year)
- 2019: $1,207,091 (+$23,166, +1.96% from previous year)
- 2020: $1,220,159 (+$13,068, +1.08% from previous year)
- 2021: $1,390,281 (+$170,122, +13.94% from previous year)
- 2022: $1,636,950 (+$246,669, +17.74% from previous year)
- 2023: $1,662,733 (+$25,783, +1.58% from previous year)
- 2024: $1,760,426 (+$97,693, +5.88% from previous year)
- 2025: $1,787,935 (+$27,509, +1.56% from previous year)
Dover achieved solid 79% appreciation from $999,897 in 2010 to $1,787,935 in 2025, notable for starting the period already very close to the million-dollar threshold and maintaining steady growth throughout. The town showed consistent but measured increases through the 2010s before accelerating during the pandemic years with gains of 13.94% in 2021 and 17.74% in 2022. As one of the few communities that began the decade above $900,000, Dover has maintained its position among Massachusetts’ most exclusive markets while continuing to build substantial value for homeowners.
Dover – Equestrian Excellence and Rural Luxury

Dover stands as Massachusetts’ premier equestrian community, featuring expansive horse properties, bridle trails, and a rural atmosphere that attracts affluent families seeking space, privacy, and outdoor recreation opportunities. This Norfolk County town of approximately 6,000 residents features some of the largest residential lots in the Boston metropolitan area, with many properties exceeding five acres and supporting stables, riding rings, and other equestrian facilities. The community’s deep commitment to preserving its rural character through strict zoning requirements ensures that Dover maintains the countryside atmosphere that has attracted wealthy residents for generations.
Dover’s steady price appreciation reflects its position as Greater Boston’s most exclusive rural community, offering lifestyle advantages that cannot be replicated in more developed areas. The town’s large lot requirements and commitment to agricultural and equestrian uses effectively limit housing supply while demand remains strong from affluent buyers seeking space and privacy. With excellent schools, extensive conservation land, and convenient access to major employment centers, Dover continues to attract premium prices from buyers seeking the ultimate in rural luxury and equestrian lifestyle within commuting distance of Boston.
6. Edgartown – 165% Home Price Increase Since 2010
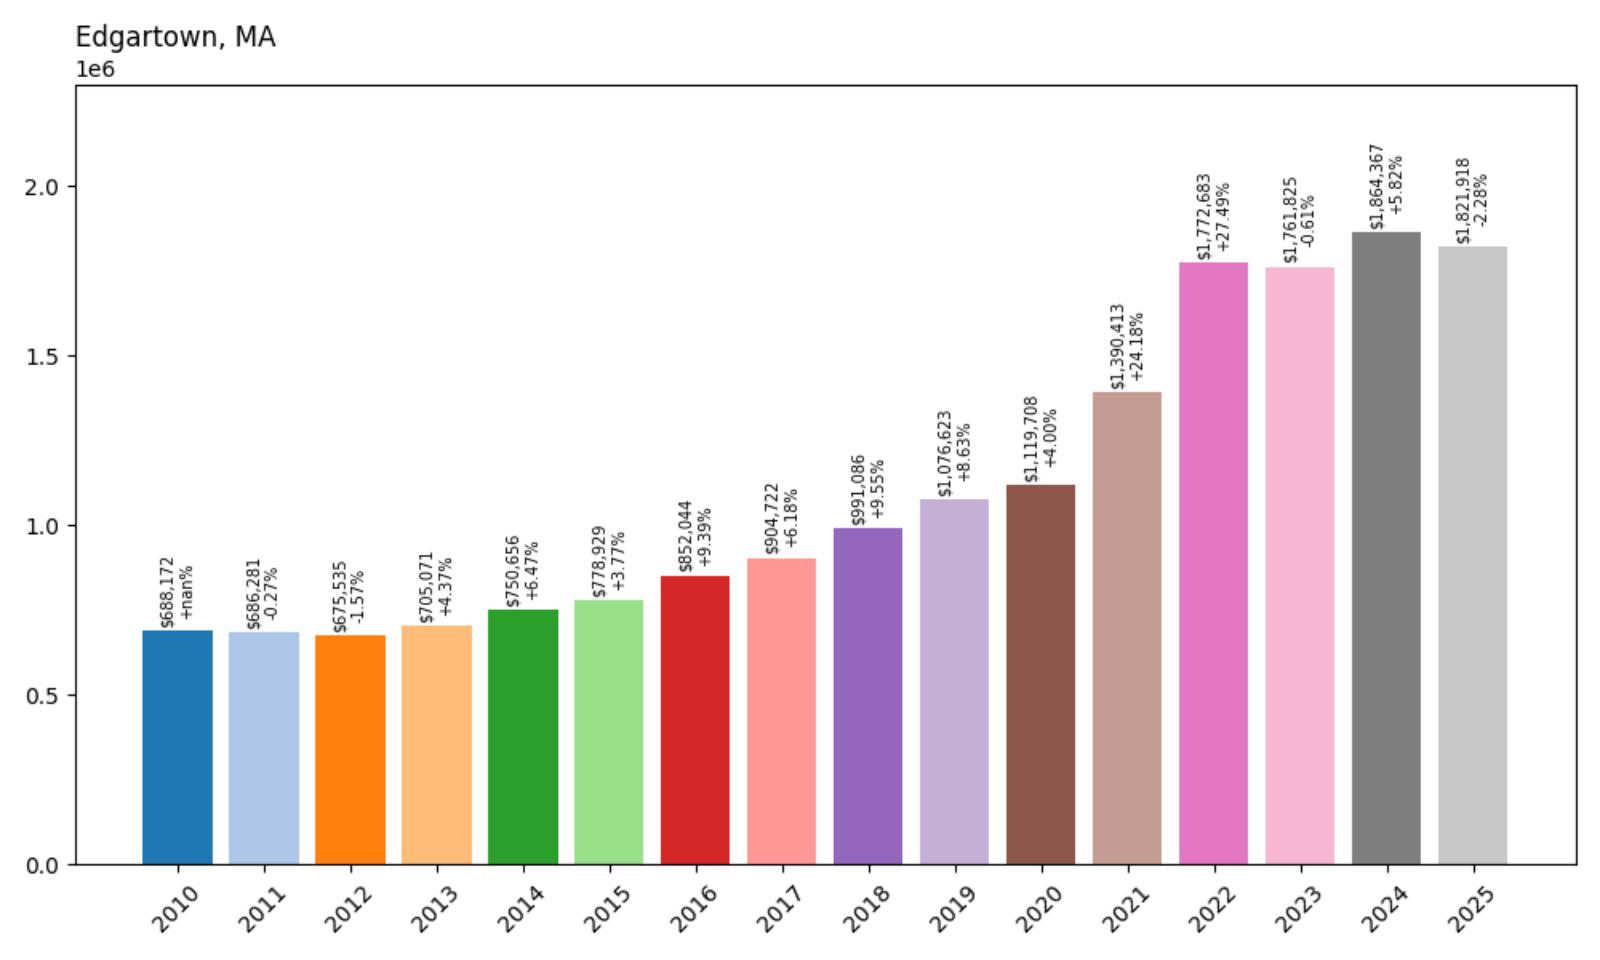
- 2010: $688,172
- 2011: $686,281 (−$1,891, −0.27% from previous year)
- 2012: $675,535 (−$10,746, −1.57% from previous year)
- 2013: $705,071 (+$29,537, +4.37% from previous year)
- 2014: $750,656 (+$45,585, +6.47% from previous year)
- 2015: $778,929 (+$28,273, +3.77% from previous year)
- 2016: $852,044 (+$73,115, +9.39% from previous year)
- 2017: $904,722 (+$52,678, +6.18% from previous year)
- 2018: $991,086 (+$86,363, +9.55% from previous year)
- 2019: $1,076,623 (+$85,538, +8.63% from previous year)
- 2020: $1,119,708 (+$43,084, +4.00% from previous year)
- 2021: $1,390,413 (+$270,705, +24.18% from previous year)
- 2022: $1,772,683 (+$382,270, +27.49% from previous year)
- 2023: $1,761,825 (−$10,858, −0.61% from previous year)
- 2024: $1,864,367 (+$102,542, +5.82% from previous year)
- 2025: $1,821,918 (−$42,449, −2.28% from previous year)
Edgartown delivered outstanding 165% appreciation from $688,172 in 2010 to $1,821,918 in 2025, making it one of the strongest-performing markets among Massachusetts’ most expensive communities. The town showed accelerating growth through the 2010s, crossing the million-dollar threshold in 2019, before exploding during the pandemic with massive gains of 24.18% in 2021 and 27.49% in 2022. This Martha’s Vineyard community has transformed from a moderately priced island destination to an ultra-luxury market that attracts affluent buyers from around the world seeking premier New England coastal living.
Edgartown – Martha’s Vineyard’s Crown Jewel

As Martha’s Vineyard’s most prestigious and historically significant community, Edgartown combines pristine coastal beauty with sophisticated amenities to create one of New England’s most exclusive destinations. This Dukes County town of approximately 5,000 residents features the island’s most elegant architecture, including magnificent sea captains’ houses from the whaling era and meticulously preserved historic districts that maintain the community’s 18th and 19th-century character. The town’s commitment to architectural preservation through strict design guidelines ensures that new construction maintains the classical New England aesthetic that attracts visitors and residents from around the globe.
The town’s remarkable price appreciation reflects its position as Martha’s Vineyard’s premier community and one of America’s most desirable coastal destinations. Edgartown’s strict zoning regulations and commitment to historic preservation limit new construction while maintaining the character that attracts buyers from around the world. With increasing recognition as both a lifestyle destination and investment opportunity, plus the fundamental scarcity of coastal real estate, Edgartown continues to command exceptional prices from buyers seeking the ultimate in New England coastal sophistication and historic charm.
5. Aquinnah – 99% Home Price Increase Since 2010
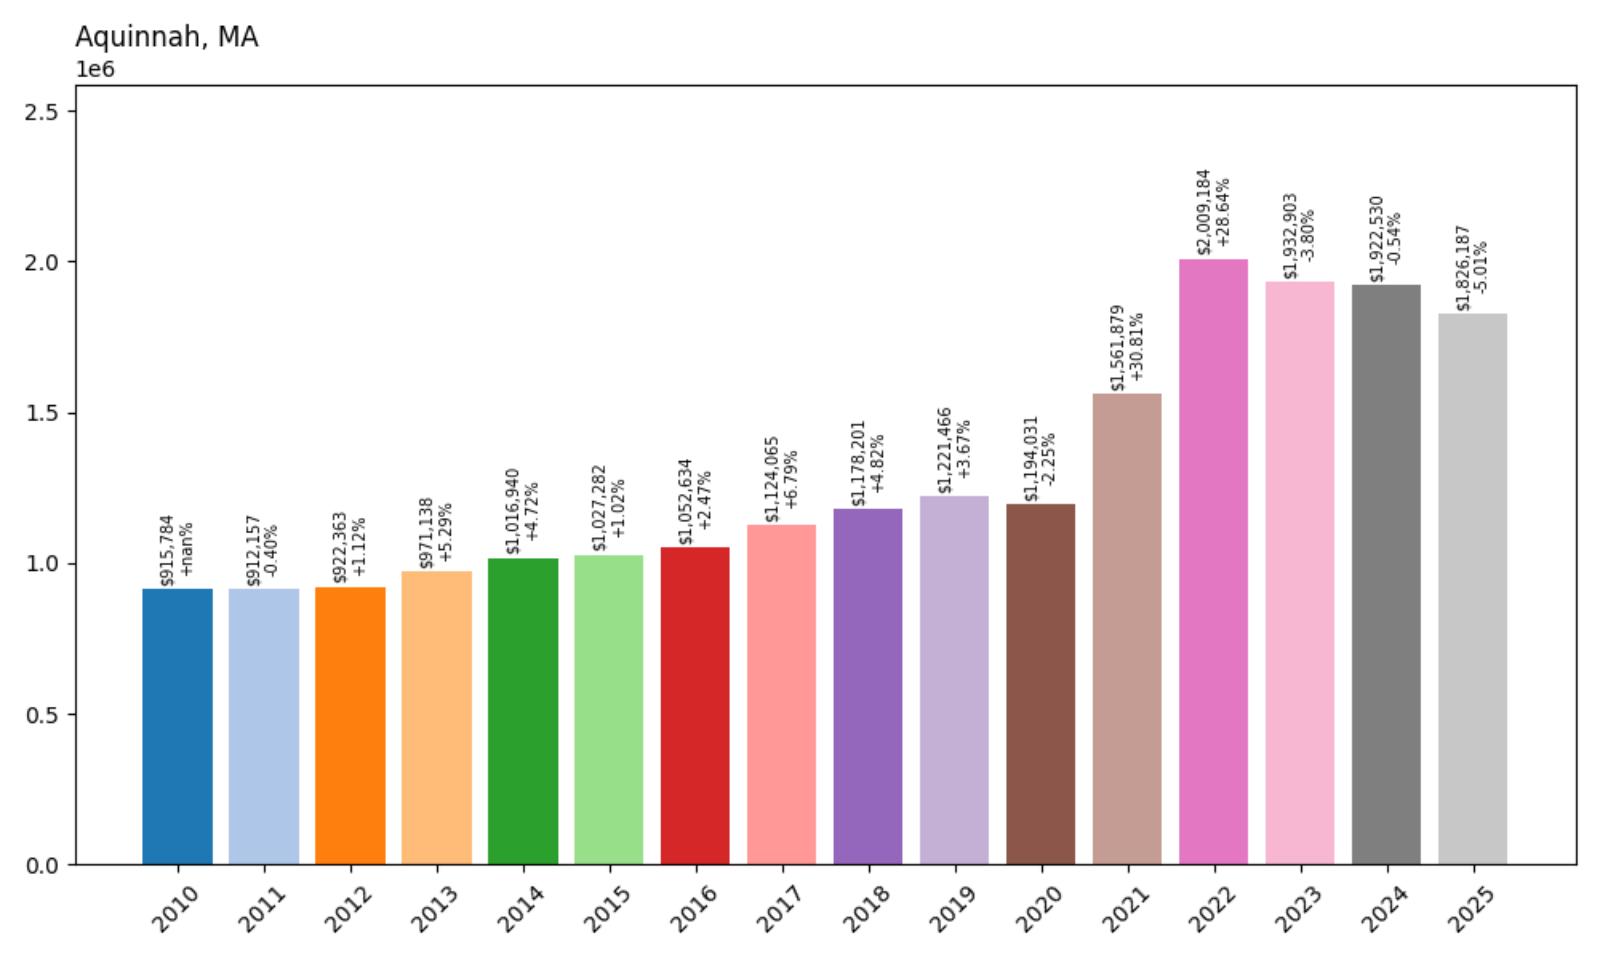
- 2010: $915,784
- 2011: $912,157 (−$3,628, −0.40% from previous year)
- 2012: $922,363 (+$10,207, +1.12% from previous year)
- 2013: $971,138 (+$48,774, +5.29% from previous year)
- 2014: $1,016,940 (+$45,802, +4.72% from previous year)
- 2015: $1,027,282 (+$10,342, +1.02% from previous year)
- 2016: $1,052,634 (+$25,352, +2.47% from previous year)
- 2017: $1,124,065 (+$71,431, +6.79% from previous year)
- 2018: $1,178,201 (+$54,137, +4.82% from previous year)
- 2019: $1,221,466 (+$43,264, +3.67% from previous year)
- 2020: $1,194,031 (−$27,435, −2.25% from previous year)
- 2021: $1,561,879 (+$367,848, +30.81% from previous year)
- 2022: $2,009,184 (+$447,305, +28.64% from previous year)
- 2023: $1,932,903 (−$76,281, −3.80% from previous year)
- 2024: $1,922,530 (−$10,373, −0.54% from previous year)
- 2025: $1,826,187 (−$96,343, −5.01% from previous year)
Aquinnah achieved nearly 100% appreciation from $915,784 in 2010 to $1,826,187 in 2025, with the most dramatic growth occurring during the pandemic years when values more than doubled from 2020 levels. Starting the decade already close to the million-dollar mark, the town showed steady growth through the 2010s before exploding with gains of 30.81% in 2021 and 28.64% in 2022, reaching a peak above $2 million. This remote Martha’s Vineyard community has established itself among the state’s most expensive markets, reflecting its unique combination of natural beauty, privacy, and cultural significance.
Aquinnah – Dramatic Cliffs and Native Heritage

Home to Martha’s Vineyard’s most spectacular natural landmark, the Gay Head Cliffs, Aquinnah combines breathtaking coastal scenery with rich Native American heritage to create one of New England’s most unique and exclusive communities. This Dukes County town of approximately 400 residents features the famous multicolored clay cliffs that rise 150 feet above the Atlantic Ocean, creating some of the most photographed and dramatic coastal views on the East Coast. The community’s commitment to preserving both its natural beauty and cultural heritage through strict environmental protections ensures that Aquinnah maintains its pristine character while honoring its significance to the Wampanoag Tribe.
The town’s remarkable price appreciation reflects its position as one of America’s most exclusive and naturally beautiful residential destinations, where the combination of dramatic scenery and extreme privacy commands premium prices. Aquinnah’s environmental protections and limited development opportunities create natural constraints on housing supply, while demand continues to grow from buyers seeking unique properties with unparalleled natural beauty. With the famous cliffs, pristine beaches, and cultural significance that cannot be replicated elsewhere, Aquinnah continues to attract exceptional prices from buyers seeking the ultimate in coastal exclusivity and natural splendor.
4. Wellesley – 104% Home Price Increase Since 2010

- 2010: $996,161
- 2011: $982,166 (−$13,995, −1.40% from previous year)
- 2012: $943,021 (−$39,145, −3.99% from previous year)
- 2013: $1,029,425 (+$86,404, +9.16% from previous year)
- 2014: $1,121,890 (+$92,466, +8.98% from previous year)
- 2015: $1,189,526 (+$67,635, +6.03% from previous year)
- 2016: $1,235,416 (+$45,890, +3.86% from previous year)
- 2017: $1,243,842 (+$8,426, +0.68% from previous year)
- 2018: $1,282,293 (+$38,451, +3.09% from previous year)
- 2019: $1,322,341 (+$40,048, +3.12% from previous year)
- 2020: $1,352,715 (+$30,374, +2.30% from previous year)
- 2021: $1,526,359 (+$173,643, +12.84% from previous year)
- 2022: $1,755,432 (+$229,074, +15.01% from previous year)
- 2023: $1,802,366 (+$46,934, +2.67% from previous year)
- 2024: $1,973,996 (+$171,630, +9.52% from previous year)
- 2025: $2,028,372 (+$54,376, +2.75% from previous year)
Wellesley achieved impressive 104% appreciation from $996,161 in 2010 to $2,028,372 in 2025, starting the decade already near the million-dollar mark and doubling in value over the 15-year period. The town showed strong recovery from early recession impacts with particularly robust growth in 2013 and 2014, before maintaining steady appreciation through the late 2010s. The pandemic years brought accelerated growth with gains of 12.84% in 2021 and 15.01% in 2022, establishing Wellesley firmly above the $2 million threshold as one of Massachusetts’ most elite markets.
Wellesley – Academic Excellence and Suburban Sophistication

Home to prestigious Wellesley College and renowned for having one of the nation’s finest public school systems, Wellesley combines academic excellence with sophisticated suburban living to create one of Greater Boston’s most desirable communities. This Norfolk County town of approximately 29,000 residents features tree-lined streets, meticulously maintained neighborhoods, and cultural amenities that reflect its status as an intellectual and social hub. The presence of Wellesley College adds cultural vibrancy and intellectual sophistication while maintaining the town’s residential character, creating an environment that attracts educated, affluent families from around the world.
The town’s substantial price appreciation reflects its position as one of America’s premier educational communities, where academic excellence and suburban sophistication combine to create exceptional long-term value. Wellesley’s excellent schools attract families willing to pay premium prices for educational quality, while the town’s beautiful setting and convenient location provide additional value propositions. With strict zoning that maintains neighborhood quality, limited opportunities for new construction, and sustained demand from educated professionals worldwide, Wellesley continues to command exceptional prices from buyers seeking the ultimate combination of academic excellence and suburban refinement.
3. Weston – 94% Home Price Increase Since 2010
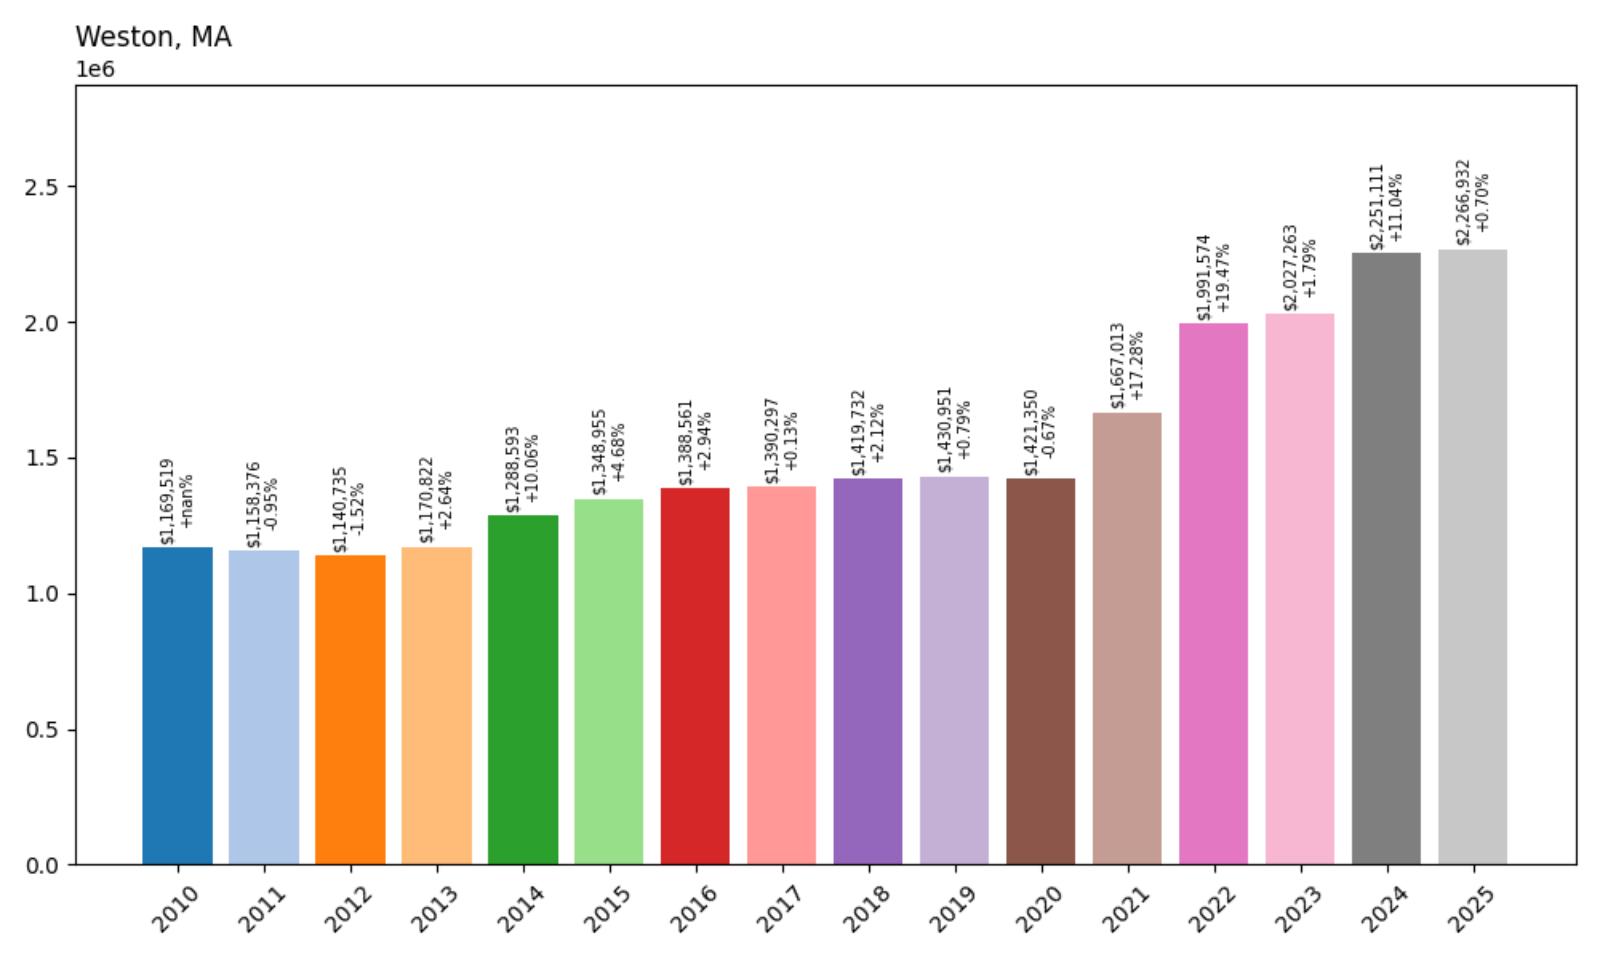
- 2010: $1,169,519
- 2011: $1,158,376 (−$11,143, −0.95% from previous year)
- 2012: $1,140,735 (−$17,641, −1.52% from previous year)
- 2013: $1,170,822 (+$30,087, +2.64% from previous year)
- 2014: $1,288,593 (+$117,771, +10.06% from previous year)
- 2015: $1,348,955 (+$60,362, +4.68% from previous year)
- 2016: $1,388,561 (+$39,606, +2.94% from previous year)
- 2017: $1,390,297 (+$1,737, +0.13% from previous year)
- 2018: $1,419,732 (+$29,434, +2.12% from previous year)
- 2019: $1,430,951 (+$11,220, +0.79% from previous year)
- 2020: $1,421,350 (−$9,601, −0.67% from previous year)
- 2021: $1,667,013 (+$245,663, +17.28% from previous year)
- 2022: $1,991,574 (+$324,561, +19.47% from previous year)
- 2023: $2,027,263 (+$35,689, +1.79% from previous year)
- 2024: $2,251,111 (+$223,848, +11.04% from previous year)
- 2025: $2,266,932 (+$15,821, +0.70% from previous year)
Weston achieved solid 94% appreciation from $1,169,519 in 2010 to $2,266,932 in 2025, notable for starting the decade already above the million-dollar mark and maintaining steady growth throughout the period. The town demonstrated remarkable stability through most of the 2010s before accelerating dramatically during the pandemic years with consecutive gains of 17.28% in 2021 and 19.47% in 2022. This MetroWest community has established itself as one of the state’s most exclusive markets, consistently maintaining median home prices above $2.2 million as one of Massachusetts’ ultra-premium residential destinations.
Weston – Ultra-Luxury Rural Estate Living

Weston represents the pinnacle of suburban luxury in Massachusetts, featuring expansive estate properties, pristine conservation land, and an atmosphere of refined elegance that attracts the region’s most affluent residents. This Middlesex County town of approximately 12,000 residents features some of Greater Boston’s largest residential lots, with many properties exceeding multiple acres and supporting magnificent homes, formal gardens, and recreational facilities. The community’s commitment to preserving its rural character through strict zoning requirements ensures that Weston maintains the countryside atmosphere and natural beauty that have attracted wealthy families for generations.
Weston’s substantial price appreciation reflects its position as Greater Boston’s most exclusive suburban community, where luxury, privacy, and convenience combine to create exceptional long-term value. The town’s large lot requirements and commitment to environmental preservation effectively limit housing supply while demand remains strong from ultra-affluent buyers seeking the ultimate in suburban luxury. With excellent schools, extensive conservation land, and unmatched privacy within commuting distance of major employment centers, Weston continues to command the highest prices among Massachusetts’ suburban communities, representing the absolute pinnacle of New England luxury living.
2. Chilmark – 69% Home Price Increase Since 2017
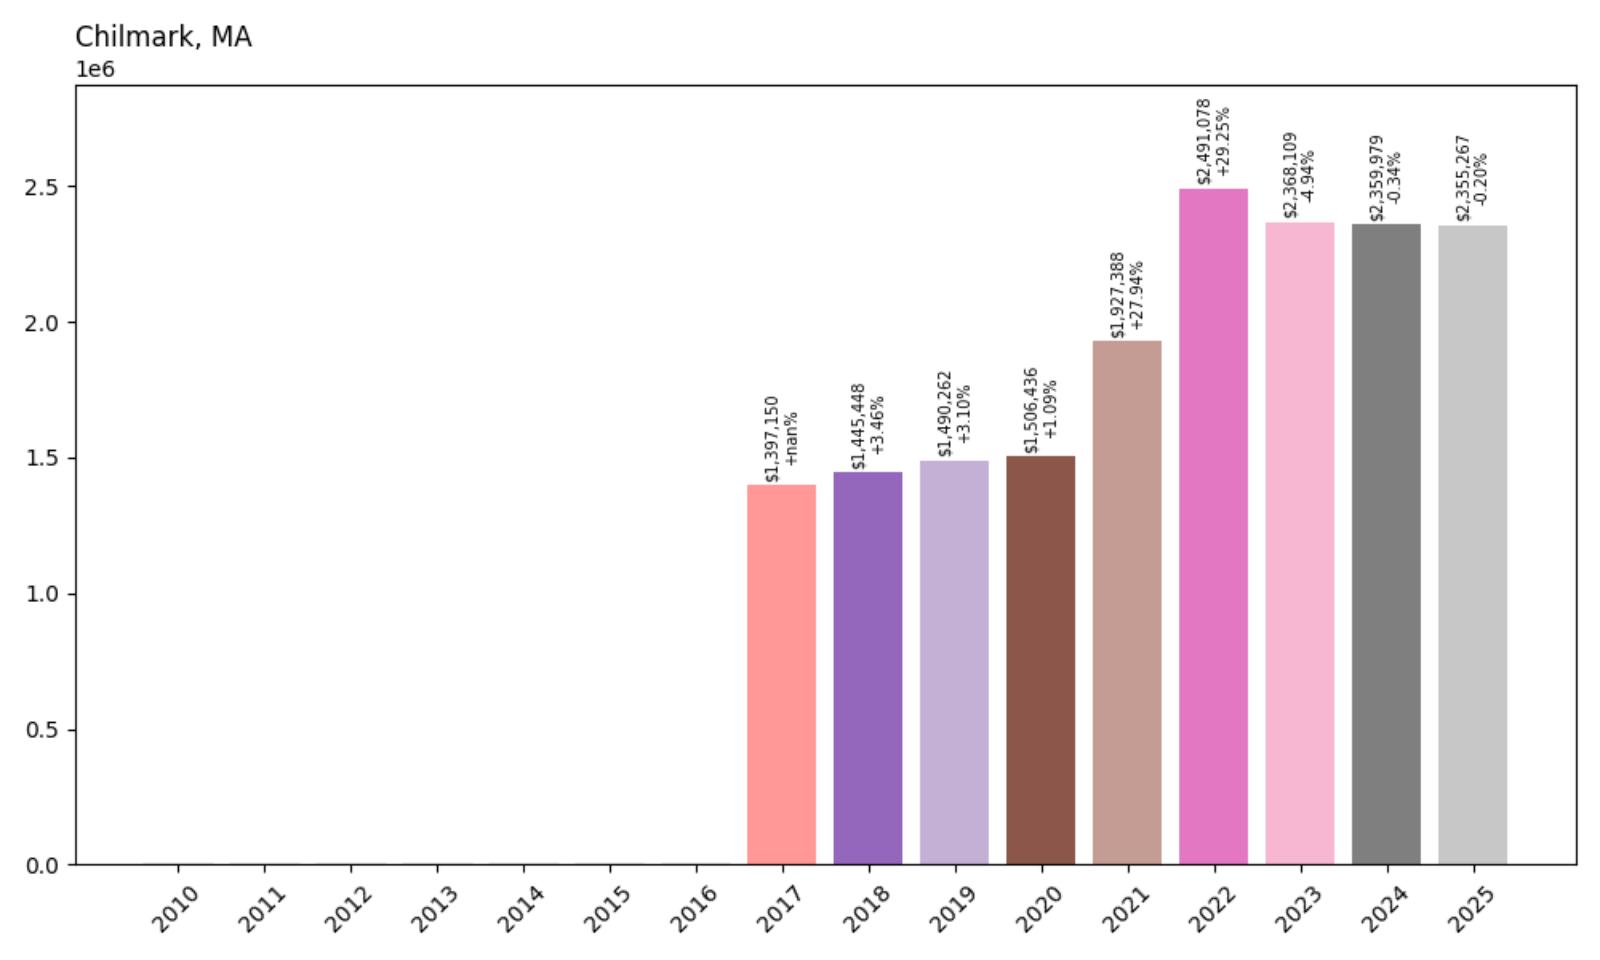
- 2010: N/A
- 2011: N/A
- 2012: N/A
- 2013: N/A
- 2014: N/A
- 2015: N/A
- 2016: N/A
- 2017: $1,397,150
- 2018: $1,445,448 (+$48,298, +3.46% from previous year)
- 2019: $1,490,262 (+$44,814, +3.10% from previous year)
- 2020: $1,506,436 (+$16,174, +1.09% from previous year)
- 2021: $1,927,388 (+$420,952, +27.94% from previous year)
- 2022: $2,491,078 (+$563,691, +29.25% from previous year)
- 2023: $2,368,109 (−$122,969, −4.94% from previous year)
- 2024: $2,359,979 (−$8,130, −0.34% from previous year)
- 2025: $2,355,267 (−$4,712, −0.20% from previous year)
Chilmark achieved remarkable 69% appreciation from $1,397,150 in 2017 to $2,355,267 in 2025, with explosive growth during the pandemic years that transformed this remote Martha’s Vineyard community into one of the nation’s most expensive markets. The town showed modest growth through 2020 before exploding with gains of 27.94% in 2021 and 29.25% in 2022, reaching a peak above $2.4 million. Despite recent modest declines from pandemic highs, Chilmark has maintained its position as Massachusetts’ second-most expensive community, reflecting its unique appeal as an ultra-exclusive island destination.
Chilmark – Martha’s Vineyard’s Most Exclusive Enclave

Representing the ultimate in Martha’s Vineyard exclusivity, Chilmark combines dramatic up-island scenery with absolute privacy to create one of America’s most prestigious residential destinations. This Dukes County town of approximately 1,200 residents features rolling hills, pristine beaches, and expansive properties that provide residents with extraordinary privacy and natural beauty. The community’s remote location and extremely limited development create an atmosphere of unparalleled exclusivity that attracts ultra-high-net-worth individuals seeking the ultimate escape while remaining within reach of major metropolitan areas.
The town’s exceptional price appreciation reflects its position as one of America’s most exclusive residential destinations, where the combination of island location, natural beauty, and absolute privacy commands ultra-premium prices. Chilmark’s strict zoning regulations and commitment to conservation effectively limit development opportunities while preserving the character that attracts buyers from around the world. With no possibility of significant new construction and sustained demand from ultra-affluent buyers seeking the ultimate in privacy and natural beauty, Chilmark continues to represent the pinnacle of New England coastal luxury, commanding prices that reflect its status as one of the nation’s most exclusive communities.
1. Nantucket – 155% Home Price Increase Since 2010
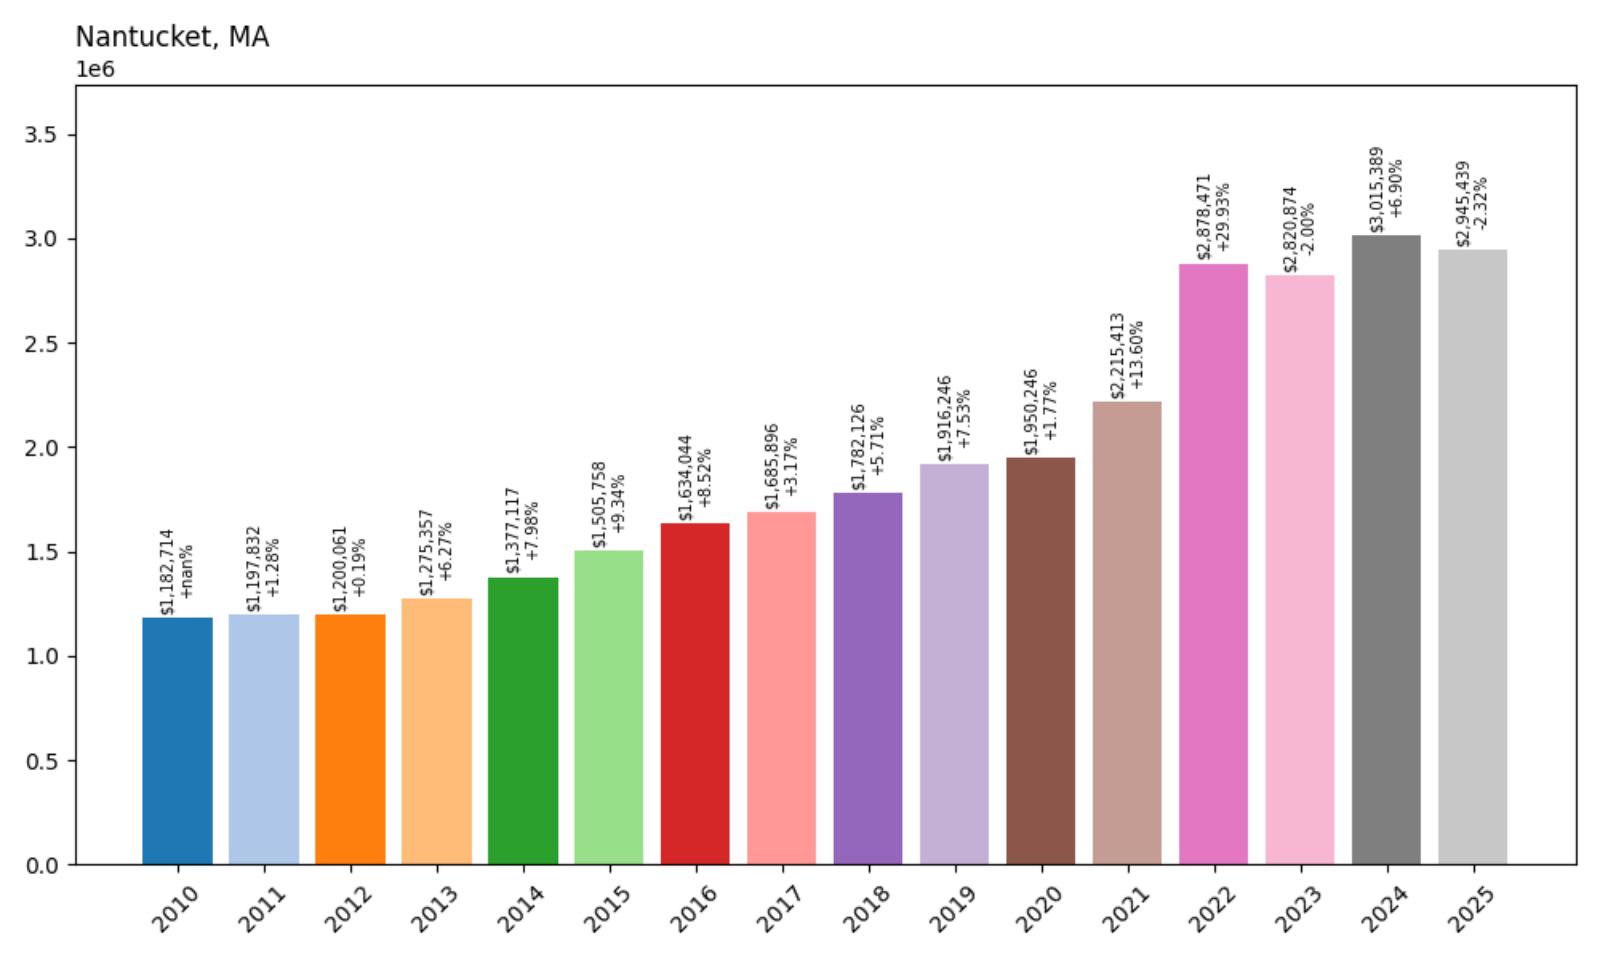
- 2010: $1,182,714
- 2011: $1,197,832 (+$15,118, +1.28% from previous year)
- 2012: $1,200,061 (+$2,229, +0.19% from previous year)
- 2013: $1,275,357 (+$75,295, +6.27% from previous year)
- 2014: $1,377,117 (+$101,761, +7.98% from previous year)
- 2015: $1,505,758 (+$128,640, +9.34% from previous year)
- 2016: $1,634,044 (+$128,287, +8.52% from previous year)
- 2017: $1,685,896 (+$51,851, +3.17% from previous year)
- 2018: $1,782,126 (+$96,231, +5.71% from previous year)
- 2019: $1,916,246 (+$134,120, +7.53% from previous year)
- 2020: $1,950,246 (+$34,001, +1.77% from previous year)
- 2021: $2,215,413 (+$265,167, +13.60% from previous year)
- 2022: $2,878,471 (+$663,057, +29.93% from previous year)
- 2023: $2,820,874 (−$57,597, −2.00% from previous year)
- 2024: $3,015,389 (+$194,516, +6.90% from previous year)
- 2025: $2,945,439 (−$69,950, −2.32% from previous year)
Nantucket achieved extraordinary 155% appreciation from $1,182,714 in 2010 to $2,945,439 in 2025, establishing itself as Massachusetts’ most expensive community with median home prices approaching $3 million. The island showed consistent strength throughout the 2010s with particularly robust growth from 2013-2016 and 2018-2019, before exploding during the pandemic with a massive 29.93% gain in 2022 that pushed values above $2.8 million. Despite recent modest adjustments from pandemic peaks, Nantucket has maintained its position as the state’s premier luxury market, reflecting its unique combination of island exclusivity, historical charm, and unmatched coastal beauty.
Nantucket – The Crown Jewel of New England Luxury

As America’s premier island destination, Nantucket represents the absolute pinnacle of New England coastal luxury, combining pristine natural beauty with sophisticated amenities and unmatched exclusivity. This remote island community 30 miles off the Massachusetts coast features cobblestone streets, historic whaling captain’s mansions, and miles of pristine beaches that create an atmosphere of timeless elegance and natural splendor. The island’s commitment to architectural preservation through strict design guidelines ensures that new construction maintains the distinctive Nantucket aesthetic that has attracted affluent visitors and residents for generations.
The island’s remarkable price appreciation reflects its position as America’s most exclusive and desirable coastal community, where the combination of natural beauty, historical significance, and absolute exclusivity commands the highest prices in New England. Nantucket’s geographic isolation and strict development controls create fundamental supply constraints while demand continues to grow from ultra-affluent buyers worldwide seeking the ultimate in coastal luxury. With limited ferry access maintaining exclusivity and a finite amount of developable land, Nantucket continues to represent the absolute pinnacle of American coastal real estate, commanding prices that reflect its status as the crown jewel of New England luxury living.