🔥 Would you like to save this?
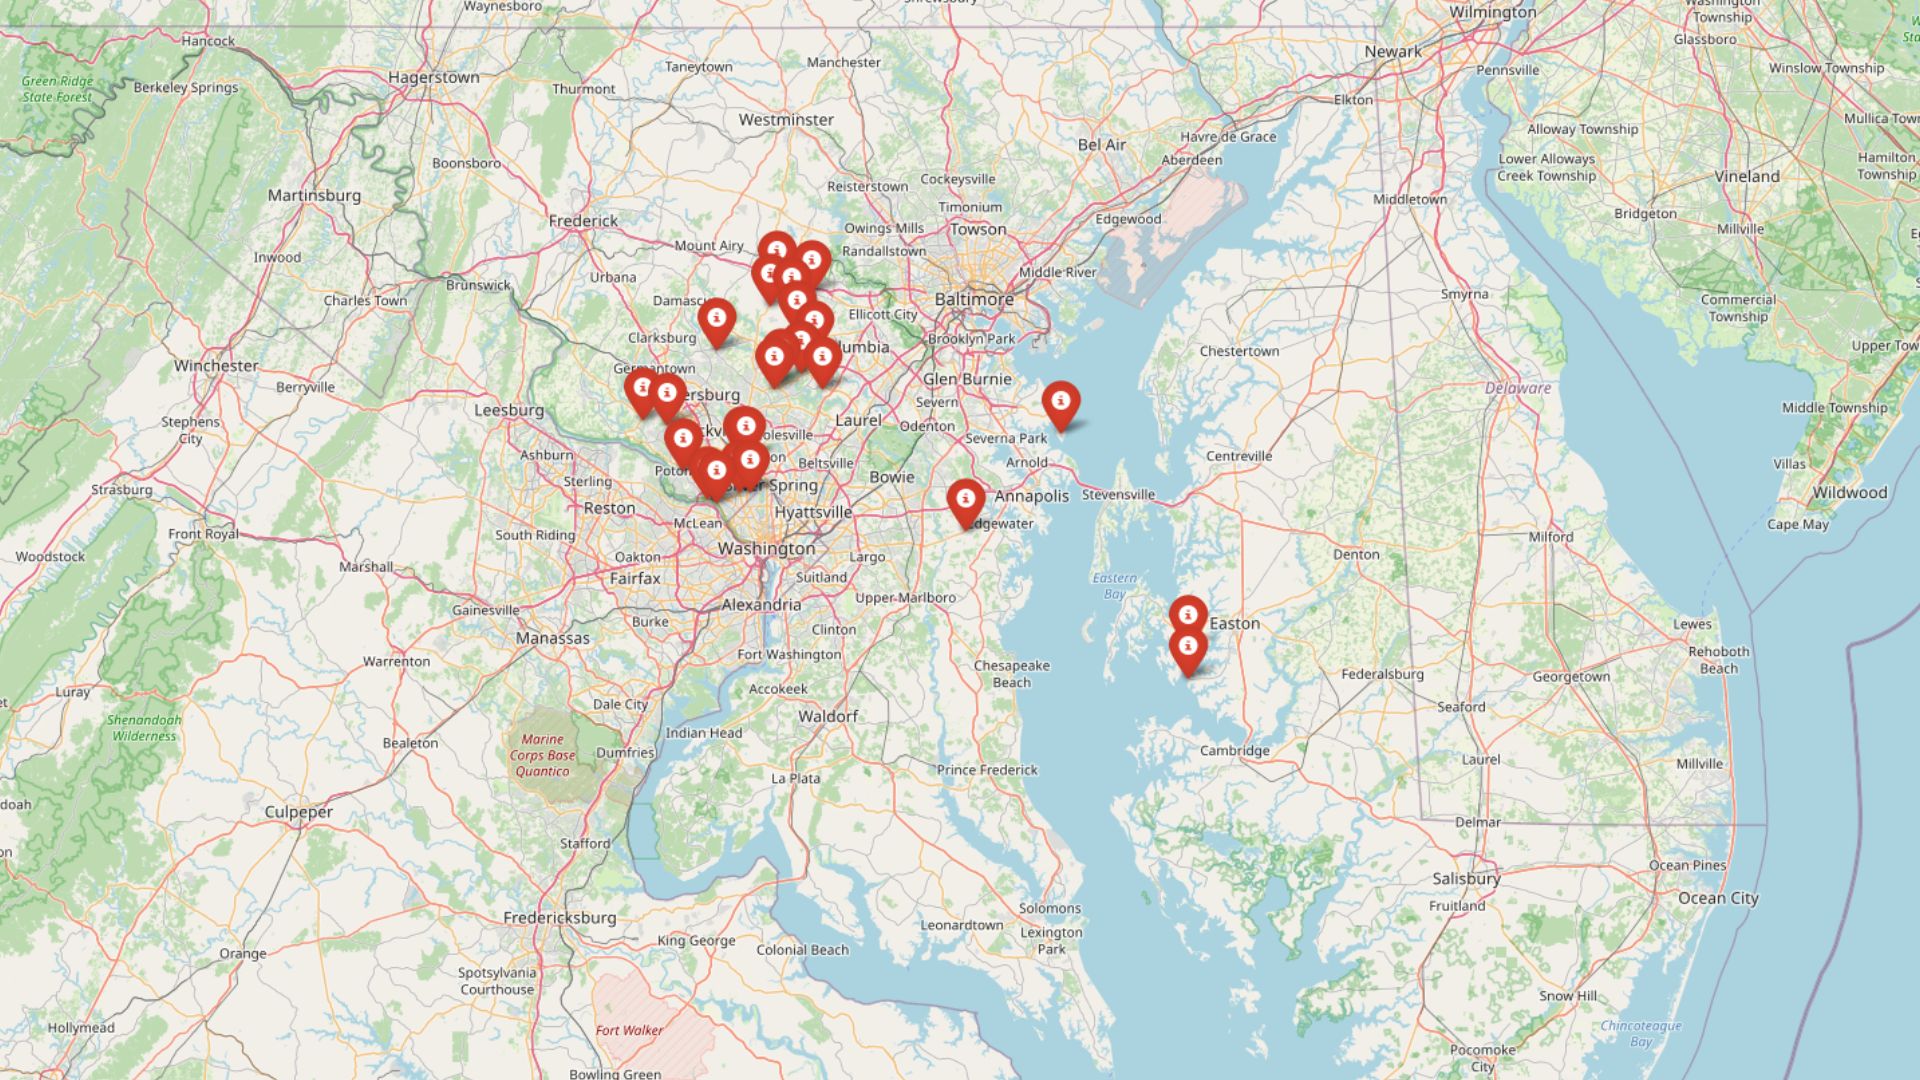
The latest Zillow Home Value Index puts a spotlight on 24 Maryland towns where home prices are in a league of their own. From quiet waterfronts along the Chesapeake Bay to suburbs within shouting distance of D.C., these are the places where location, schools, and long-term demand have sent prices soaring. Some towns have seen a slow, steady climb; others took off after 2020. What they all share now? Serious competition, serious price tags, and a growing crowd of buyers willing to spend big for the right address.
24. Sandy Spring – 45% Home Price Increase Since 2010
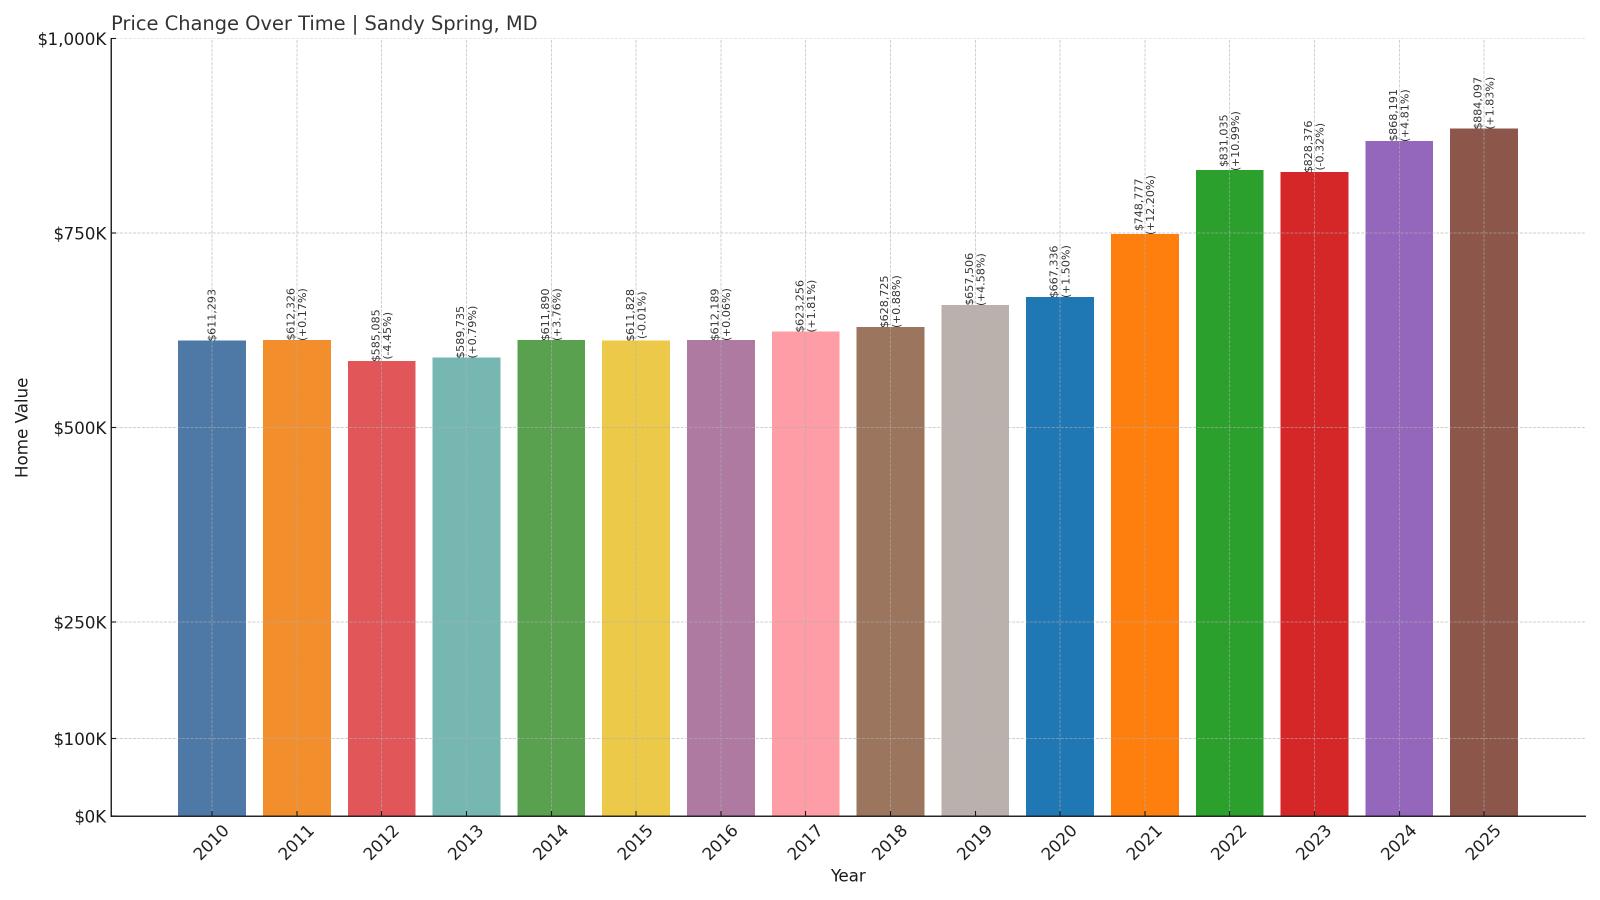
- 2010: $611,293
- 2011: $612,326 (+$1,033, +0.17% from previous year)
- 2012: $585,085 (-$27,241, -4.45% from previous year)
- 2013: $589,735 (+$4,650, +0.79% from previous year)
- 2014: $611,890 (+$22,155, +3.76% from previous year)
- 2015: $611,828 (-$62, -0.01% from previous year)
- 2016: $612,189 (+$361, +0.06% from previous year)
- 2017: $623,256 (+$11,067, +1.81% from previous year)
- 2018: $628,725 (+$5,469, +0.88% from previous year)
- 2019: $657,506 (+$28,781, +4.58% from previous year)
- 2020: $667,336 (+$9,830, +1.50% from previous year)
- 2021: $748,777 (+$81,441, +12.20% from previous year)
- 2022: $831,035 (+$82,258, +10.99% from previous year)
- 2023: $828,376 (-$2,659, -0.32% from previous year)
- 2024: $868,191 (+$39,815, +4.81% from previous year)
- 2025: $884,097 (+$15,906, +1.83% from previous year)
Home values in Sandy Spring have climbed nearly $273,000 since 2010, representing a 45% increase over 15 years. While the early 2010s were relatively flat, the market picked up dramatically from 2019 through 2022, with double-digit annual gains in both 2021 and 2022. Though prices cooled slightly in 2023, they bounced back again in 2024 and 2025.
In order to come up with the very specific design ideas, we create most designs with the assistance of state-of-the-art AI interior design software.
Sandy Spring – Rural Charm with Steady Appeal
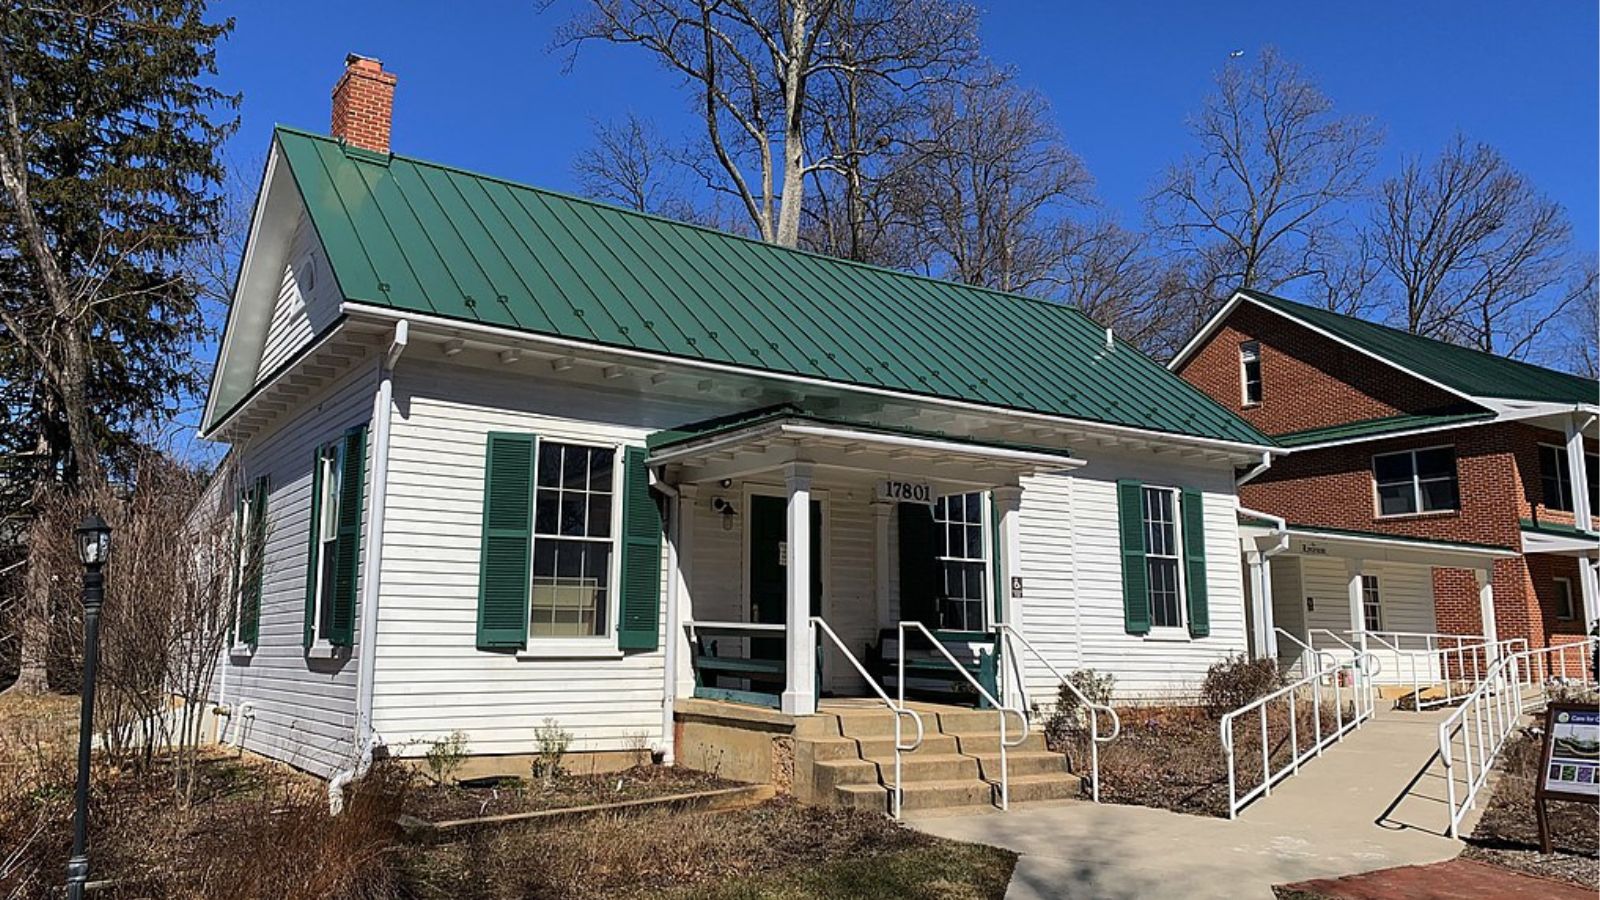
Thayer Young, CC BY-SA 4.0, via Wikimedia Commons
Located in Montgomery County near Olney, Sandy Spring blends rural landscapes with proximity to major job centers. Its roots as a Quaker settlement are still visible in its historic architecture and open farmland. Despite being just a short drive from D.C., the town has maintained its peaceful character, making it a desirable alternative to more densely built suburbs.
The strong run-up in home values from 2020 onward suggests growing interest among buyers looking for space without sacrificing location. With homes now approaching $900,000 on average, Sandy Spring is no longer a quiet bargain—but its blend of serenity and access continues to attract high-end buyers.
23. Oxford – 42% Home Price Increase Since 2010

- 2010: $643,047
- 2011: $615,150 (-$27,897, -4.34% from previous year)
- 2012: $563,517 (-$51,633, -8.39% from previous year)
- 2013: $532,592 (-$30,925, -5.49% from previous year)
- 2014: $547,495 (+$14,903, +2.80% from previous year)
- 2015: $564,877 (+$17,382, +3.17% from previous year)
- 2016: $561,304 (-$3,573, -0.63% from previous year)
- 2017: $563,290 (+$1,986, +0.35% from previous year)
- 2018: $584,750 (+$21,460, +3.81% from previous year)
- 2019: $601,540 (+$16,790, +2.87% from previous year)
- 2020: $593,955 (-$7,585, -1.26% from previous year)
- 2021: $686,864 (+$92,909, +15.64% from previous year)
- 2022: $823,661 (+$136,797, +19.92% from previous year)
- 2023: $839,964 (+$16,303, +1.98% from previous year)
- 2024: $887,329 (+$47,365, +5.64% from previous year)
- 2025: $912,312 (+$24,983, +2.82% from previous year)
Oxford’s housing market had a rocky start in the early 2010s, with prices declining significantly through 2013. Since then, it has experienced a major turnaround, particularly from 2020 through 2022, when prices jumped by more than $229,000 in just two years. In total, home values are now up 42% from their 2010 levels.
Oxford – Waterfront Luxury on the Eastern Shore
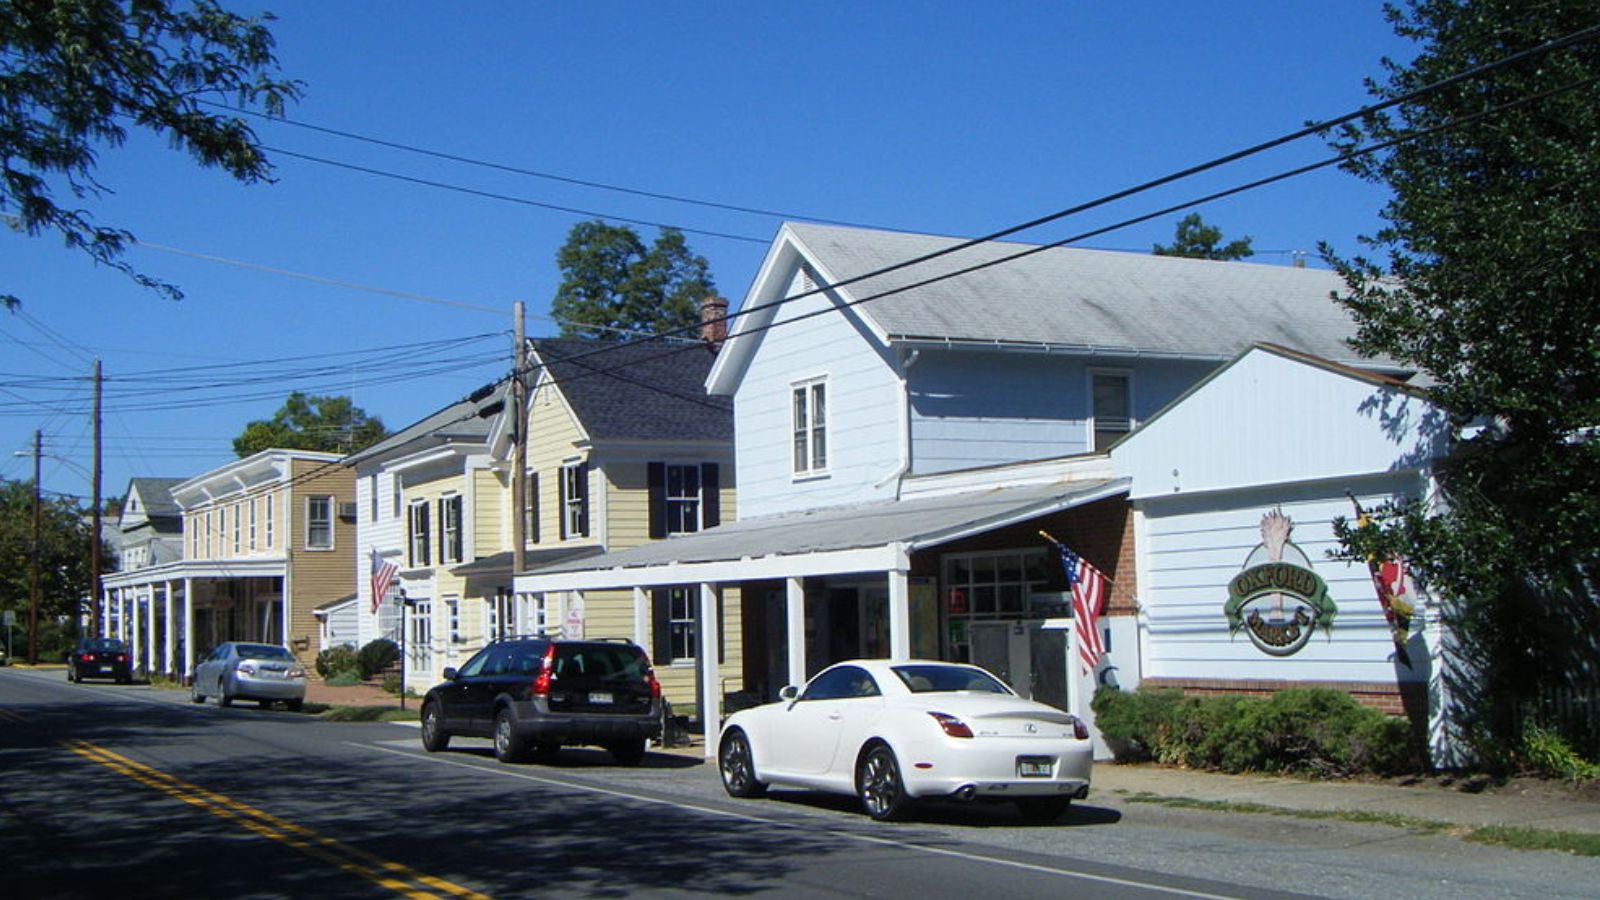
Nestled on Maryland’s Eastern Shore in Talbot County, Oxford is one of the state’s most exclusive waterfront enclaves. Bordered by the Tred Avon River and the Chesapeake Bay, it attracts second-home buyers and retirees looking for maritime charm. The town is known for its yacht clubs, historic inns, and quiet streets lined with 18th- and 19th-century homes.
The rapid price increases in recent years reflect growing demand for coastal living, especially among high-income buyers. With current values north of $900,000, Oxford remains a top-tier destination for those seeking historic character and water access.
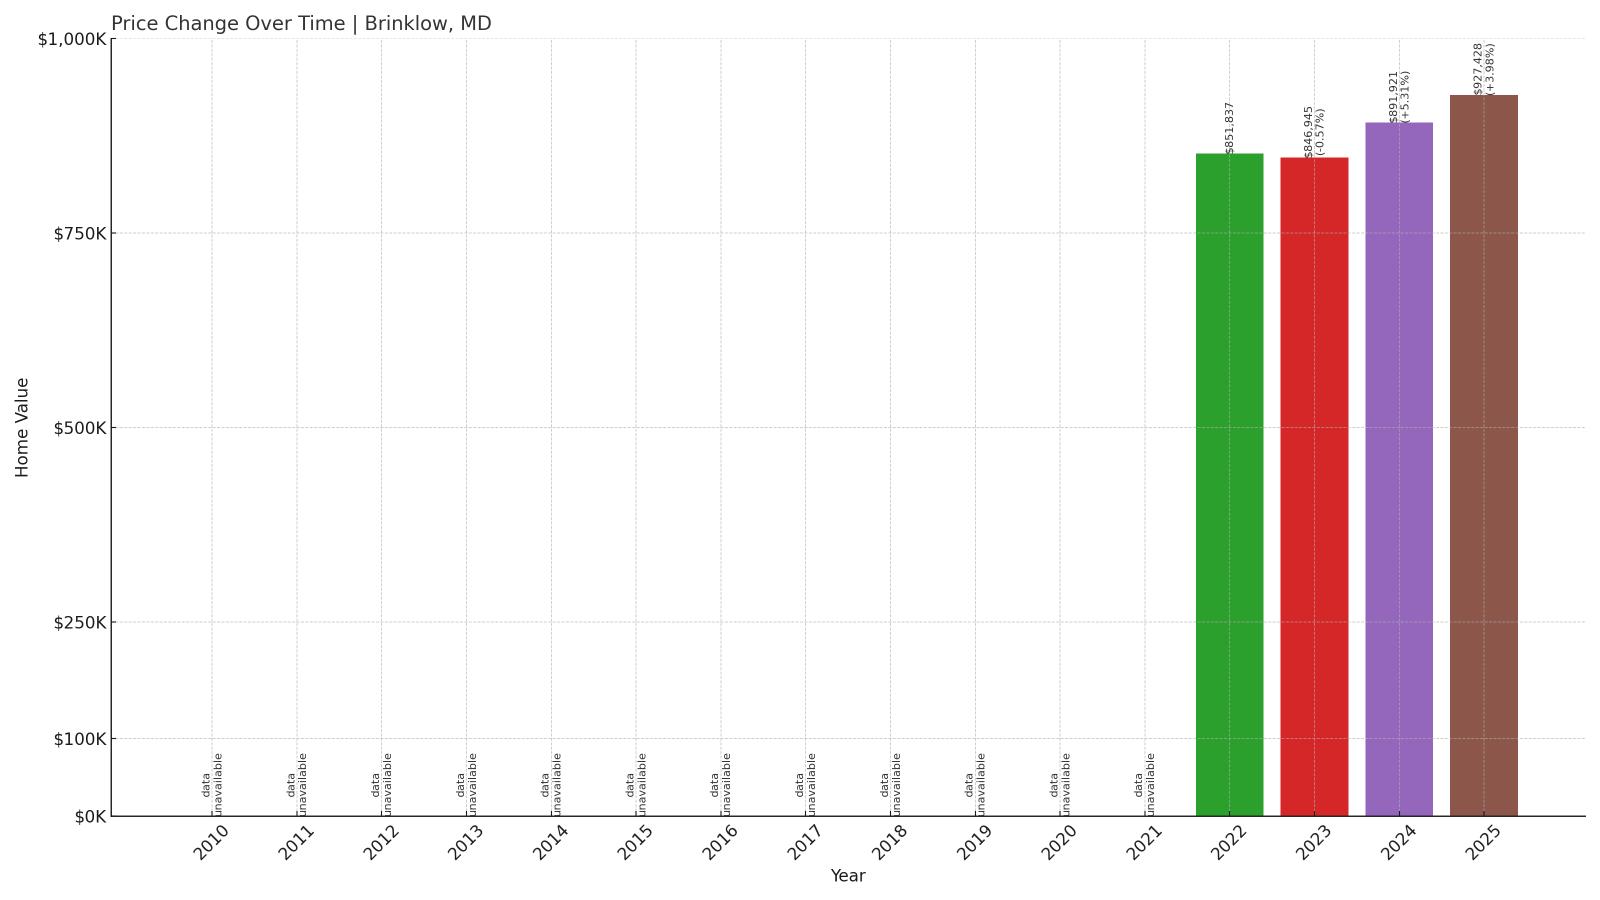
22. Brinklow – 9% Home Price Increase Since 2022
- 2010: N/A
- 2011: N/A
- 2012: N/A
- 2013: N/A
- 2014: N/A
- 2015: N/A
- 2016: N/A
- 2017: N/A
- 2018: N/A
- 2019: N/A
- 2020: N/A
- 2021: N/A
- 2022: $851,837
- 2023: $846,945 (-$4,892, -0.57% from previous year)
- 2024: $891,921 (+$44,976, +5.31% from previous year)
- 2025: $927,428 (+$35,507, +3.98% from previous year)
Although Zillow only began tracking Brinklow’s home prices in 2022, the short-term trend is upward. After a slight dip in 2023, prices rose sharply in both 2024 and 2025, bringing the total increase to 9% in just three years.
Brinklow – A Small Market with Big Numbers
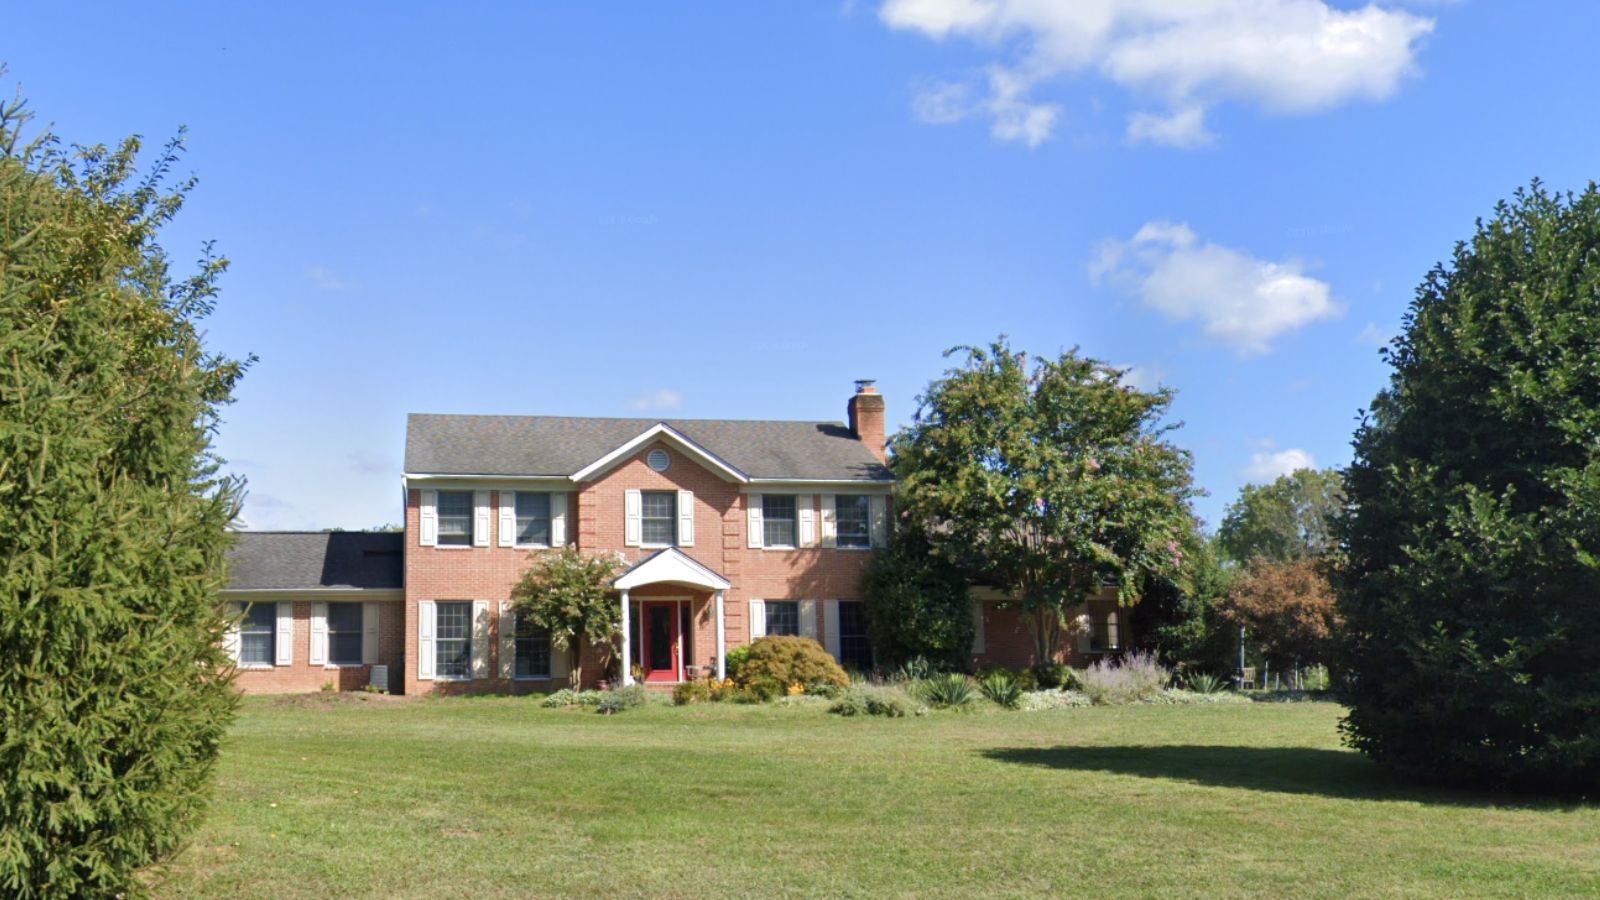
Brinklow is an unincorporated area in Montgomery County, situated between Olney and Ashton. It’s a quiet pocket of upscale homes on large lots, often hidden from the main roads. While it’s not large in population, the homes here are substantial, and many include custom construction or estate-style properties.
The limited housing inventory means even modest market interest can drive sharp price shifts. Brinklow’s recent uptick suggests growing demand from buyers seeking seclusion and land, especially in affluent suburban markets just outside D.C.
21. North Potomac – 47% Home Price Increase Since 2010

- 2010: $631,524
- 2011: $629,544 (-$1,980, -0.31% from previous year)
- 2012: $606,370 (-$23,174, -3.68% from previous year)
- 2013: $631,785 (+$25,415, +4.19% from previous year)
- 2014: $664,275 (+$32,490, +5.14% from previous year)
- 2015: $661,214 (-$3,061, -0.46% from previous year)
- 2016: $663,416 (+$2,202, +0.33% from previous year)
- 2017: $681,587 (+$18,171, +2.74% from previous year)
- 2018: $688,731 (+$7,144, +1.05% from previous year)
- 2019: $707,461 (+$18,730, +2.72% from previous year)
- 2020: $711,217 (+$3,756, +0.53% from previous year)
- 2021: $788,151 (+$76,934, +10.82% from previous year)
- 2022: $864,332 (+$76,181, +9.67% from previous year)
- 2023: $848,495 (-$15,837, -1.83% from previous year)
- 2024: $906,119 (+$57,624, +6.79% from previous year)
- 2025: $928,277 (+$22,158, +2.45% from previous year)
North Potomac has added nearly $297,000 to its average home value since 2010, a 47% gain over 15 years. After steady, moderate growth throughout the 2010s, values surged during the pandemic era and have continued climbing, even with a dip in 2023.
North Potomac – Suburban Comfort with Urban Access
North Potomac sits on the western edge of Montgomery County and is often favored by commuters for its easy access to I-270 and the tech corridor near Gaithersburg and Rockville. The area features a mix of single-family homes, quiet cul-de-sacs, and excellent public schools, making it especially popular with families.
The housing market here has remained resilient, and the continued price growth suggests sustained demand from buyers looking for a blend of suburban living and metropolitan convenience. At over $900,000, North Potomac’s homes are among the most desirable in the region.
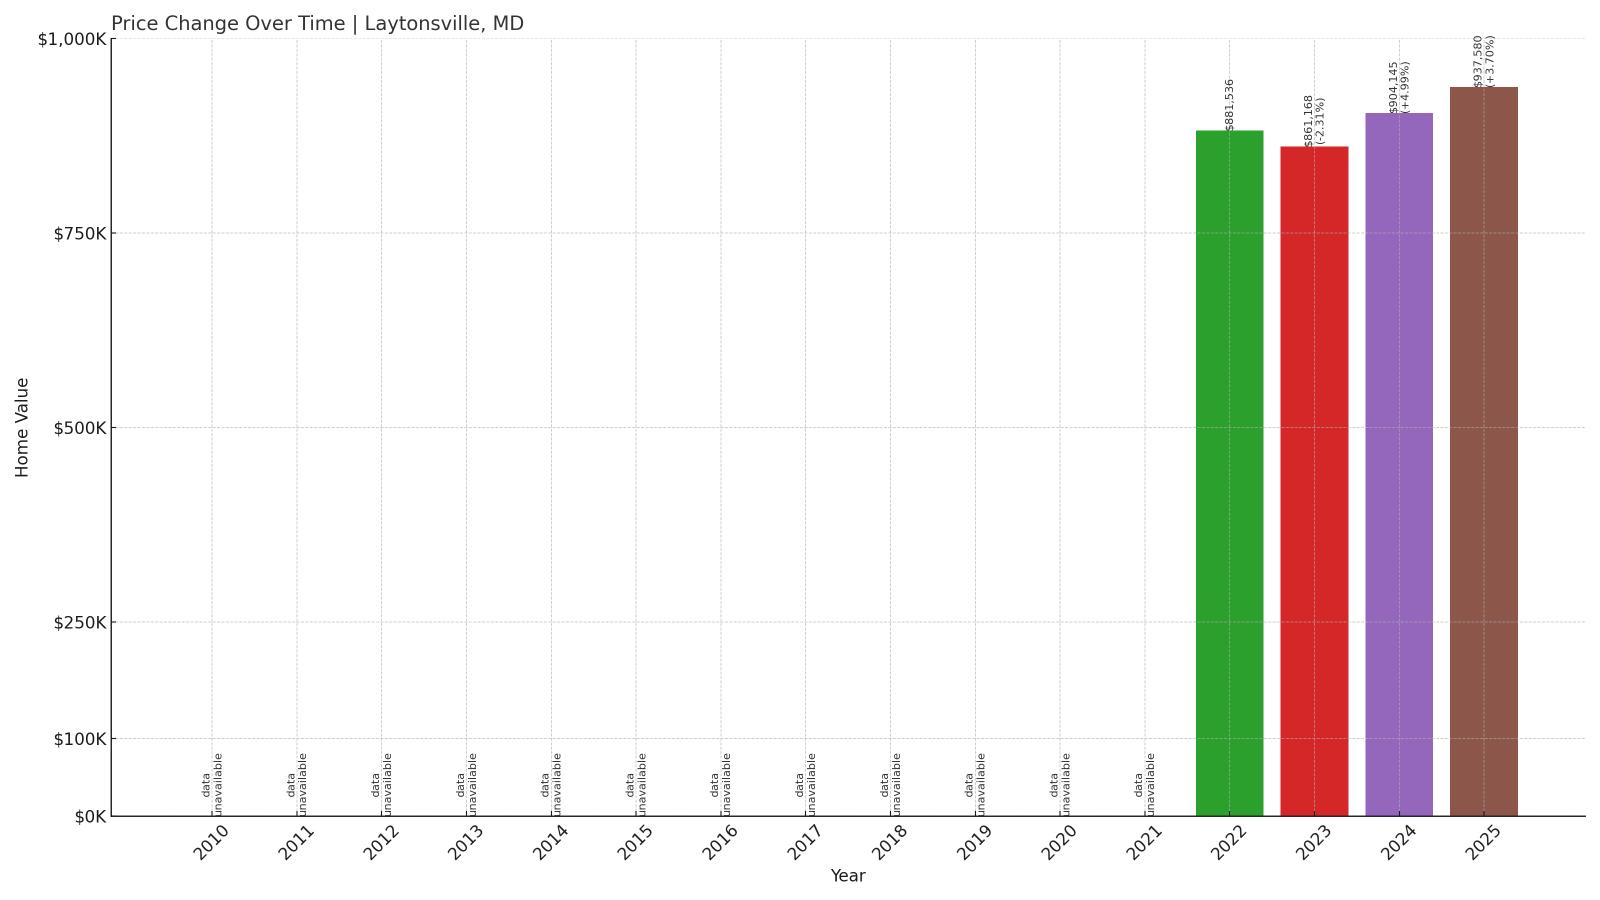
20. Laytonsville – 6% Home Price Increase Since 2022
- 2010: N/A
- 2011: N/A
- 2012: N/A
- 2013: N/A
- 2014: N/A
- 2015: N/A
- 2016: N/A
- 2017: N/A
- 2018: N/A
- 2019: N/A
- 2020: N/A
- 2021: N/A
- 2022: $881,536
- 2023: $861,168 (-$20,368, -2.31% from previous year)
- 2024: $904,145 (+$42,977, +4.99% from previous year)
- 2025: $937,580 (+$33,435, +3.70% from previous year)
Laytonsville’s home values have climbed more than 6% since 2022, recovering from a dip in 2023 with solid gains in the two most recent years. Though the dataset begins in 2022, current prices now sit just under $940,000, reflecting its status as a high-end market.
Laytonsville – A Small Town with Room to Breathe

Laytonsville is a historic town in Montgomery County known for its spacious properties, farmland, and equestrian communities. Despite its small population, the town’s rural character and large-lot homes command premium prices, especially among buyers seeking privacy and space within driving distance of Washington, D.C.
The housing stock here tends to be newer or custom-built, often with features not found in denser suburbs. That scarcity—combined with desirable schools and country charm—has helped keep prices strong and rising.
19. Davidsonville – 47% Home Price Increase Since 2010
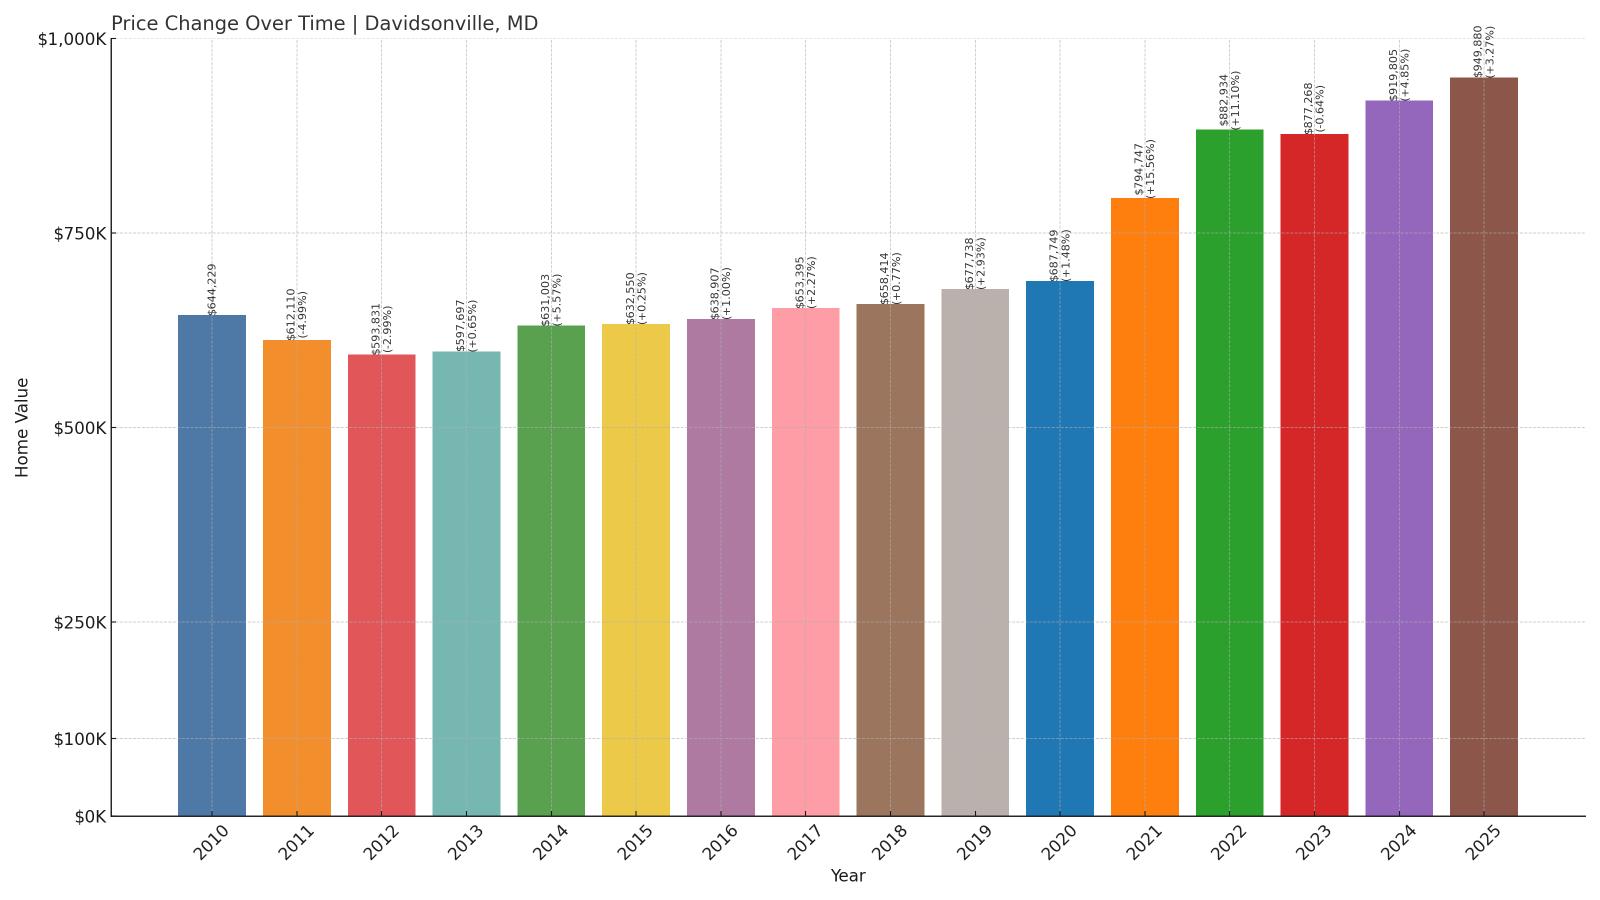
- 2010: $644,229
- 2011: $612,110 (-$32,119, -4.99% from previous year)
- 2012: $593,831 (-$18,279, -2.99% from previous year)
- 2013: $597,697 (+$3,866, +0.65% from previous year)
- 2014: $631,003 (+$33,306, +5.57% from previous year)
- 2015: $632,550 (+$1,547, +0.25% from previous year)
- 2016: $638,907 (+$6,357, +1.00% from previous year)
- 2017: $653,395 (+$14,488, +2.27% from previous year)
- 2018: $658,414 (+$5,019, +0.77% from previous year)
- 2019: $677,738 (+$19,324, +2.93% from previous year)
- 2020: $687,749 (+$10,011, +1.48% from previous year)
- 2021: $794,747 (+$106,998, +15.56% from previous year)
- 2022: $882,934 (+$88,187, +11.10% from previous year)
- 2023: $877,268 (-$5,666, -0.64% from previous year)
- 2024: $919,805 (+$42,537, +4.85% from previous year)
- 2025: $949,880 (+$30,075, +3.27% from previous year)
Davidsonville’s home prices have grown by more than $305,000 since 2010, a 47% increase. The town experienced modest gains for most of the 2010s, followed by a dramatic acceleration in 2021 and 2022. Prices dipped slightly in 2023 but quickly rebounded and now sit just under the $950,000 mark.
Davidsonville – Spacious Estates with Suburban Access
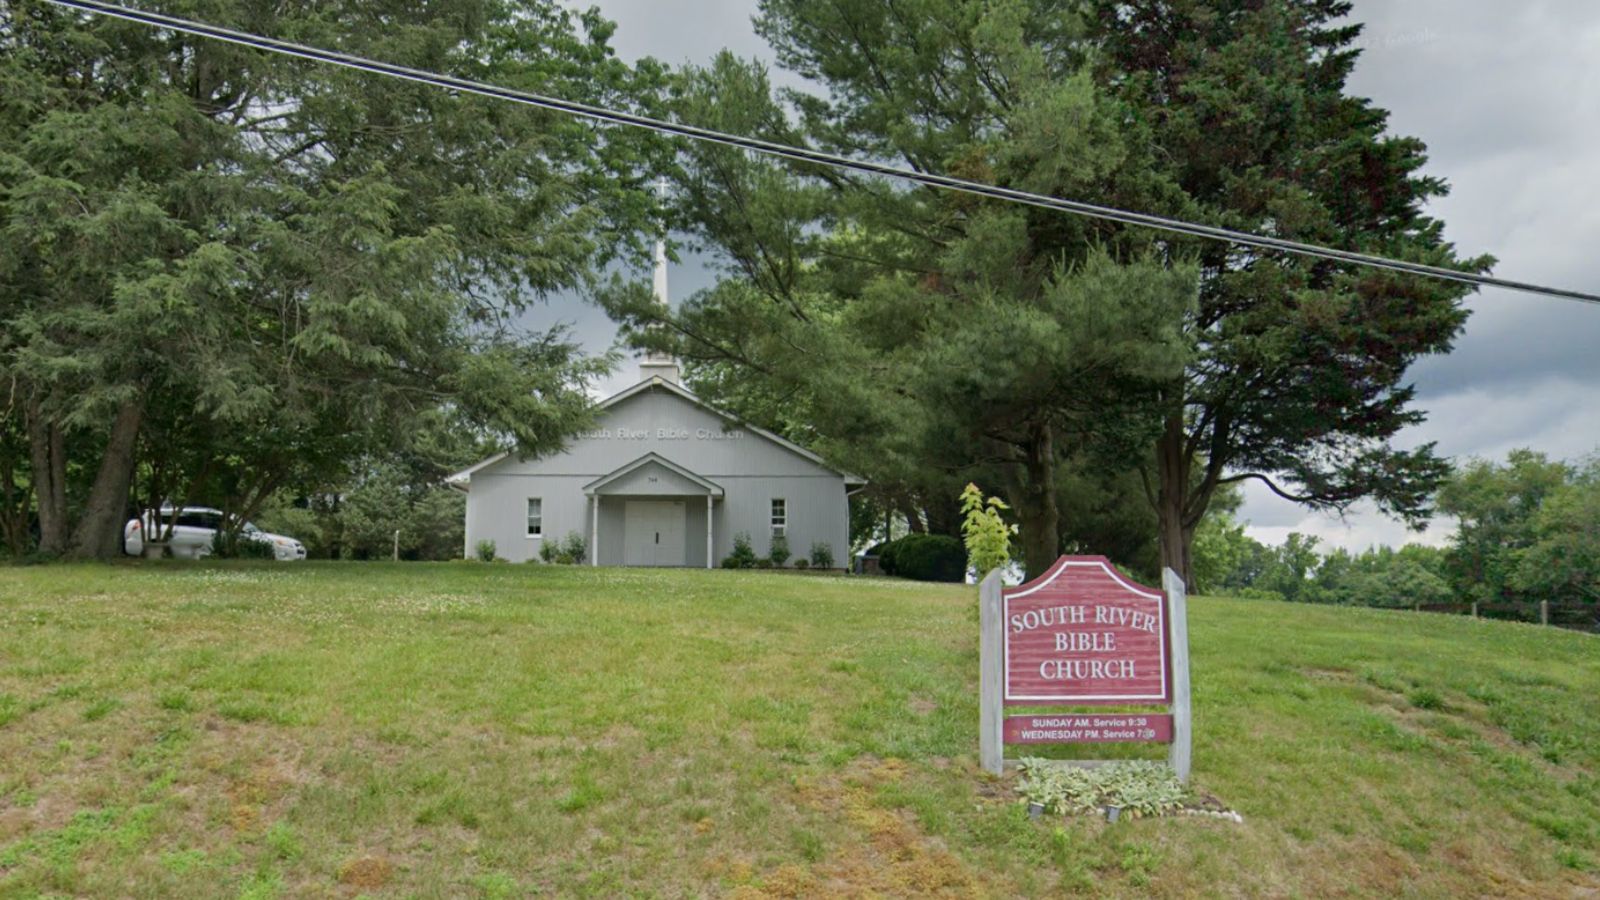
Davidsonville is located in Anne Arundel County, just west of Annapolis and within commuting distance of both D.C. and Baltimore. Known for its semi-rural setting, the town features large single-family homes on generous lots, many of which are custom-built. It’s a favorite among professionals who want suburban convenience without sacrificing space and greenery.
The spike in values during the pandemic era reflects growing demand for exactly that mix—quiet surroundings, access to urban centers, and room to breathe. The recent growth in home values shows that Davidsonville continues to attract affluent buyers looking for privacy and space close to major job markets.
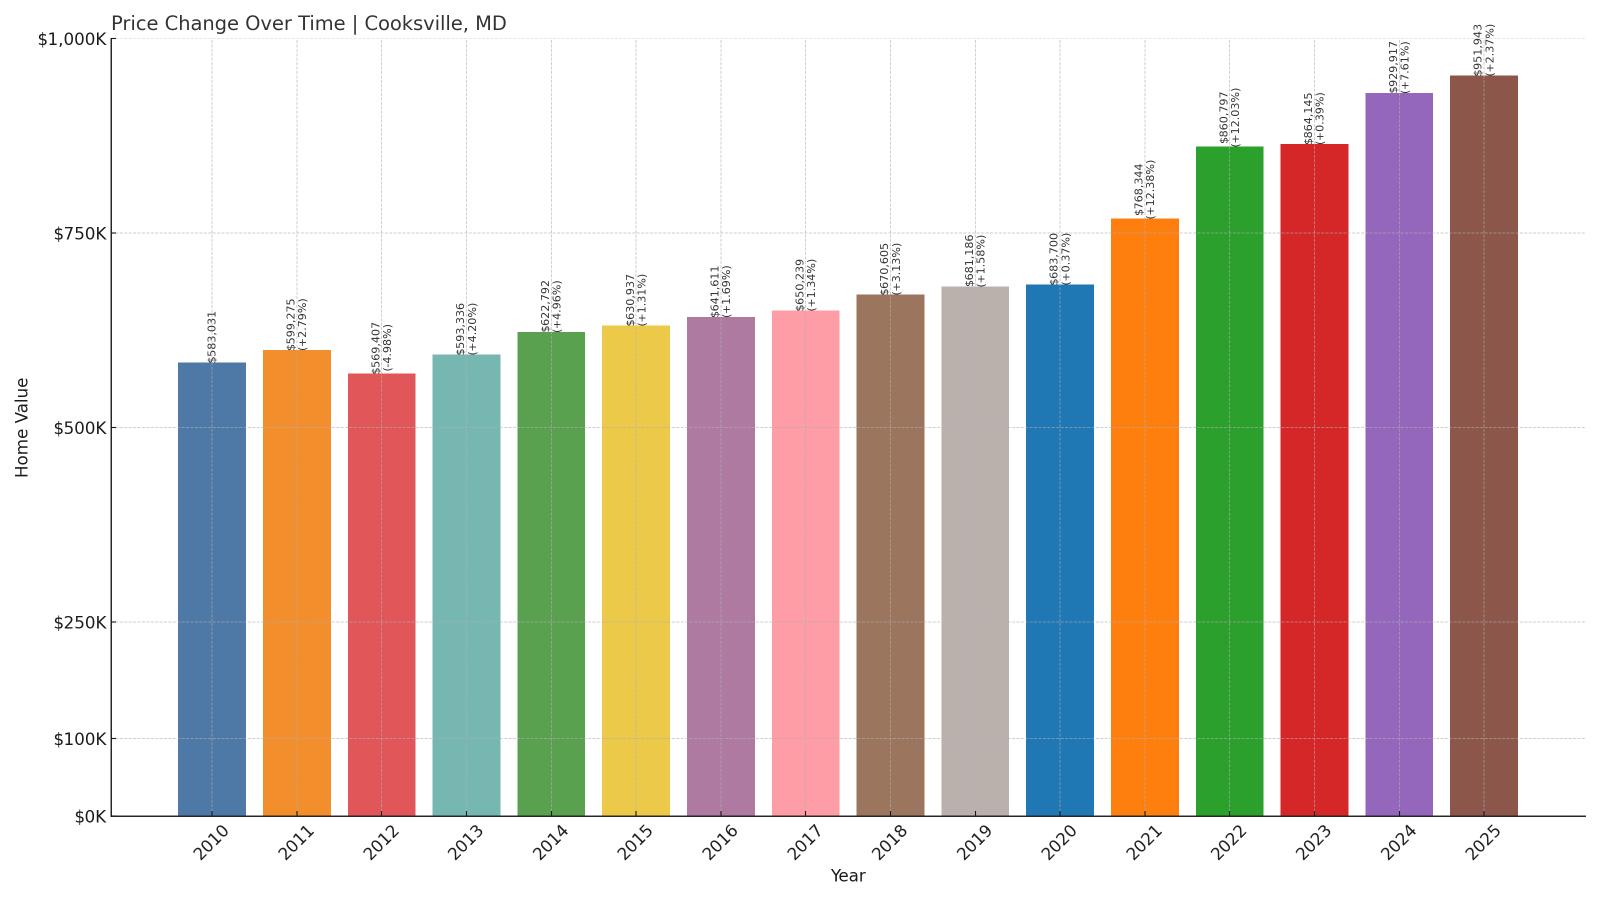
18. Cooksville – 63% Home Price Increase Since 2010
🔥 Would you like to save this?
- 2010: $583,031
- 2011: $599,275 (+$16,244, +2.79% from previous year)
- 2012: $569,407 (-$29,868, -4.98% from previous year)
- 2013: $593,336 (+$23,929, +4.20% from previous year)
- 2014: $622,792 (+$29,456, +4.96% from previous year)
- 2015: $630,937 (+$8,145, +1.31% from previous year)
- 2016: $641,611 (+$10,674, +1.69% from previous year)
- 2017: $650,239 (+$8,628, +1.34% from previous year)
- 2018: $670,605 (+$20,366, +3.13% from previous year)
- 2019: $681,186 (+$10,581, +1.58% from previous year)
- 2020: $683,700 (+$2,514, +0.37% from previous year)
- 2021: $768,344 (+$84,644, +12.38% from previous year)
- 2022: $860,797 (+$92,453, +12.03% from previous year)
- 2023: $864,145 (+$3,348, +0.39% from previous year)
- 2024: $929,917 (+$65,772, +7.61% from previous year)
- 2025: $951,943 (+$22,026, +2.37% from previous year)
Cooksville has seen home values rise by nearly $369,000 since 2010, amounting to a 63% increase. After a brief dip in 2012, the town’s property values have trended steadily upward, with major jumps between 2020 and 2022. Price growth has continued more gradually since then, pushing values just past $950,000 in 2025.
Cooksville – Rural Affluence in Howard County

Cooksville is a rural community in western Howard County known for its scenic farmland and large, upscale homes. It offers an alternative to more densely populated suburban areas like Columbia, attracting those who want land, luxury, and a quieter lifestyle within reach of Baltimore and D.C.
The area’s real estate reflects this balance—premium homes on expansive lots, often with custom features and high-end finishes. Cooksville’s sharp rise in value during the pandemic period underscores its growing appeal as buyers sought more space and tranquility without leaving the region entirely behind.
17. Fulton – 59% Home Price Increase Since 2010
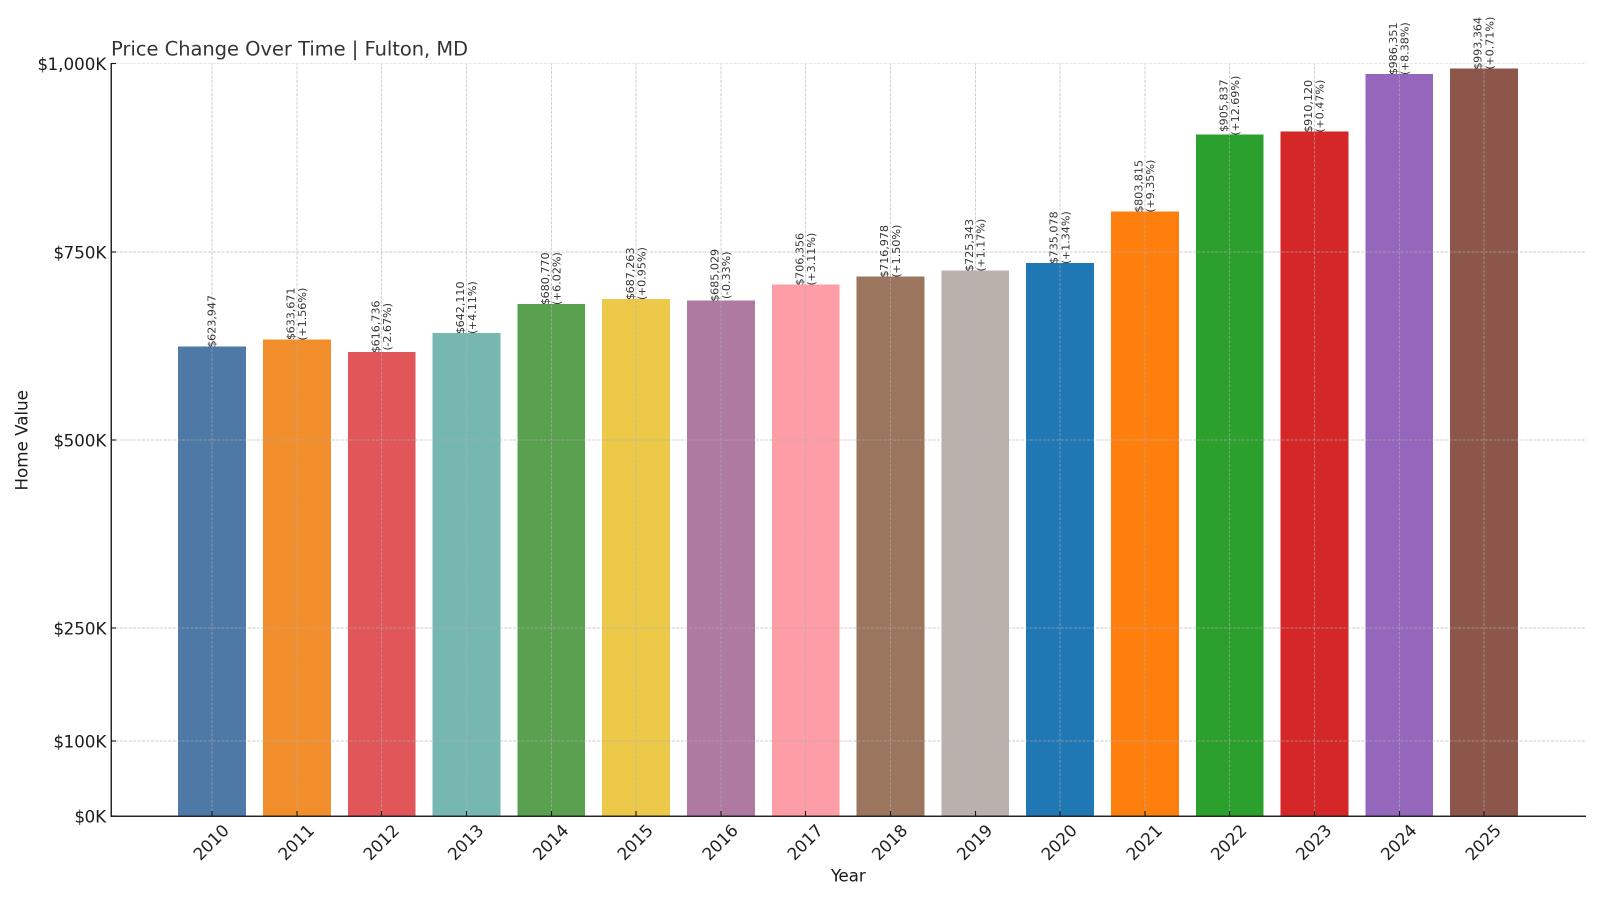
- 2010: $623,947
- 2011: $633,671 (+$9,724, +1.56% from previous year)
- 2012: $616,736 (-$16,935, -2.67% from previous year)
- 2013: $642,110 (+$25,374, +4.11% from previous year)
- 2014: $680,770 (+$38,660, +6.02% from previous year)
- 2015: $687,263 (+$6,493, +0.95% from previous year)
- 2016: $685,029 (-$2,234, -0.33% from previous year)
- 2017: $706,356 (+$21,327, +3.11% from previous year)
- 2018: $716,978 (+$10,622, +1.50% from previous year)
- 2019: $725,343 (+$8,365, +1.17% from previous year)
- 2020: $735,078 (+$9,735, +1.34% from previous year)
- 2021: $803,815 (+$68,737, +9.35% from previous year)
- 2022: $905,837 (+$102,022, +12.69% from previous year)
- 2023: $910,120 (+$4,283, +0.47% from previous year)
- 2024: $986,351 (+$76,231, +8.38% from previous year)
- 2025: $993,364 (+$7,013, +0.71% from previous year)
Since 2010, home values in Fulton have grown by about $369,000—a 59% increase. The past few years have been especially strong, with sharp gains in 2021 and 2022 followed by steadier growth through 2025. The average home value now approaches $1 million.
Fulton – Modern Homes and Top Schools

Located in southern Howard County, Fulton has become one of the county’s most sought-after communities. Much of its growth centers on the planned Maple Lawn development, known for its walkability, mixed-use layout, and high-end homes. Fulton is also served by some of the best-rated public schools in Maryland, which continues to draw families year after year.
With newer construction, a strong sense of community, and proximity to both Baltimore and Washington, Fulton has transformed from a rural outpost to a luxury suburb. The price data shows that the town has more than kept up with the wider market—outpacing many nearby areas in appreciation.
16. Glenelg – 55% Home Price Increase Since 2010
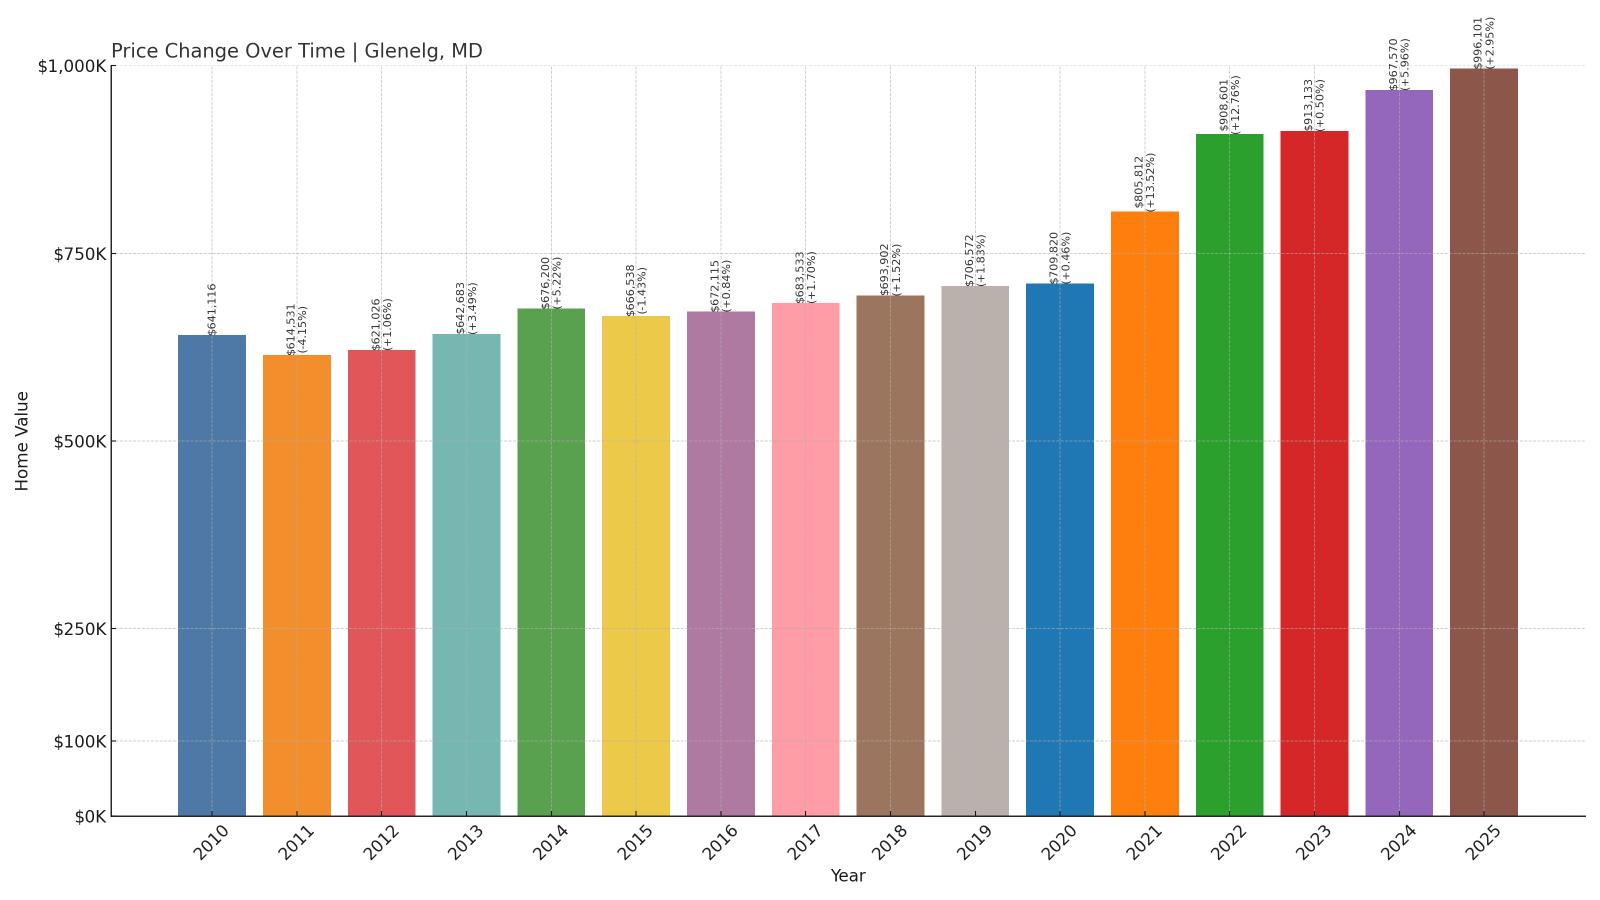
- 2010: $641,116
- 2011: $614,531 (-$26,585, -4.15% from previous year)
- 2012: $621,026 (+$6,495, +1.06% from previous year)
- 2013: $642,683 (+$21,657, +3.49% from previous year)
- 2014: $676,200 (+$33,517, +5.22% from previous year)
- 2015: $666,538 (-$9,662, -1.43% from previous year)
- 2016: $672,115 (+$5,577, +0.84% from previous year)
- 2017: $683,533 (+$11,418, +1.70% from previous year)
- 2018: $693,902 (+$10,369, +1.52% from previous year)
- 2019: $706,572 (+$12,670, +1.83% from previous year)
- 2020: $709,820 (+$3,248, +0.46% from previous year)
- 2021: $805,812 (+$95,992, +13.52% from previous year)
- 2022: $908,601 (+$102,789, +12.76% from previous year)
- 2023: $913,133 (+$4,532, +0.50% from previous year)
- 2024: $967,570 (+$54,437, +5.96% from previous year)
- 2025: $996,101 (+$28,531, +2.95% from previous year)
Home values in Glenelg have risen from just over $641,000 in 2010 to nearly $1 million in 2025, a 55% jump. Most of that growth has occurred since 2020, particularly during the boom years of 2021 and 2022, with consistent gains continuing through 2025.
Glenelg – Elite Living in Western Howard County
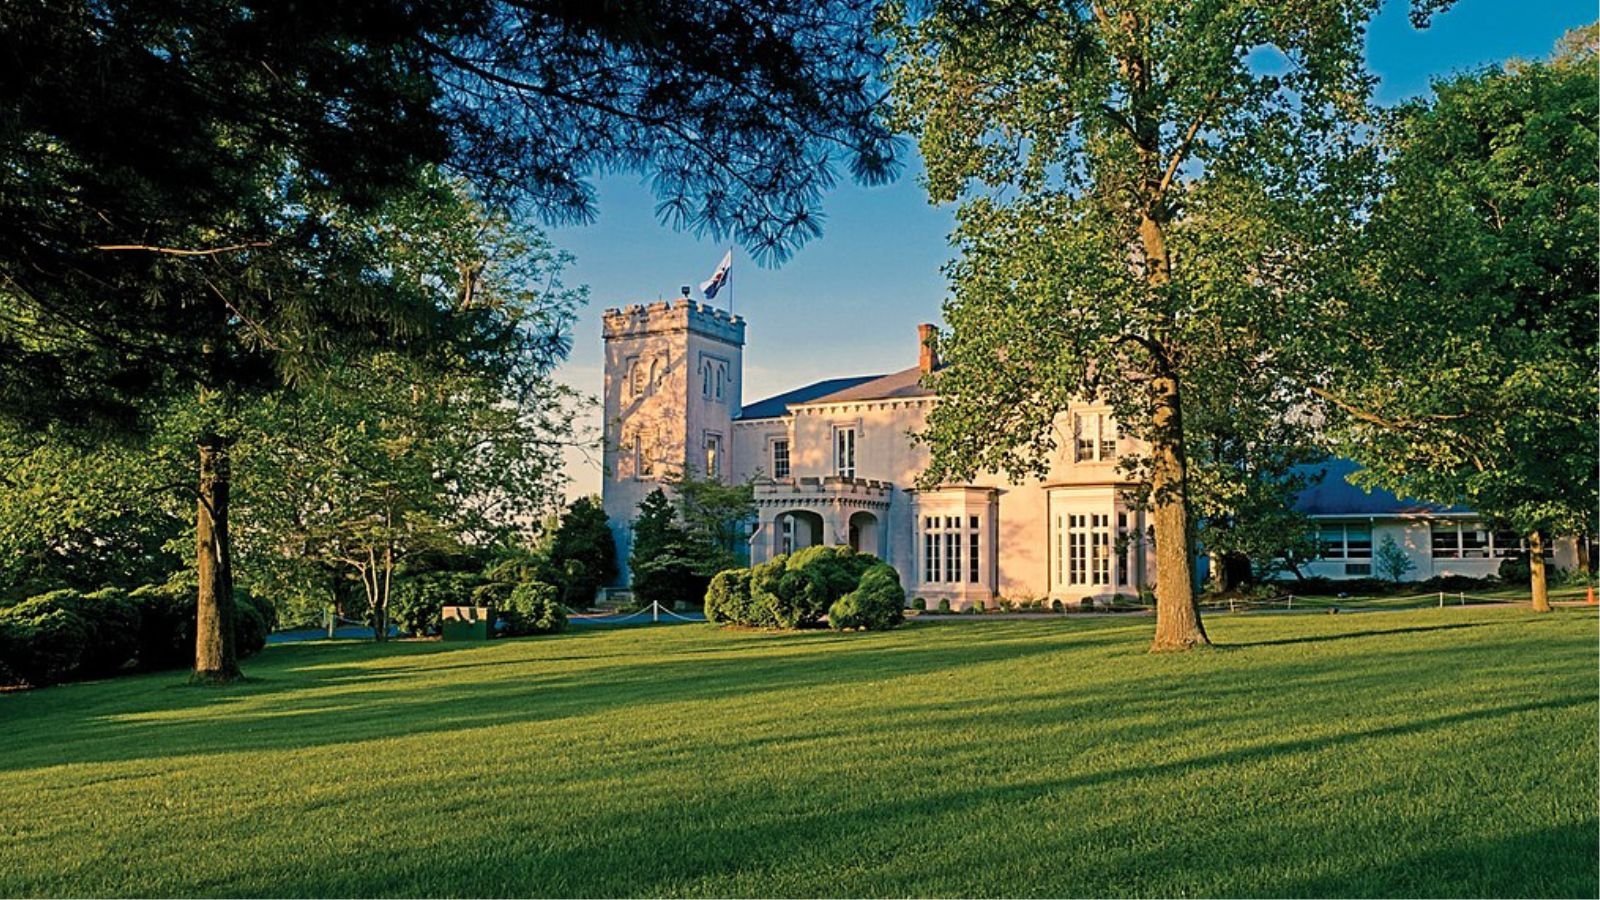
Glenelg is one of Howard County’s most prestigious communities, known for its luxury homes, top-ranked schools, and quiet rural setting. Many of the properties here are custom builds with expansive lots and high-end finishes. It’s the kind of place where privacy, quality, and exclusivity define the housing stock.
Homebuyers looking for estate-style living without sacrificing access to Baltimore or D.C. have fueled Glenelg’s steady climb in value. The nearly $1 million average price reflects strong demand and the enduring appeal of one of Maryland’s wealthiest zip codes.
15. Highland – 59% Home Price Increase Since 2010
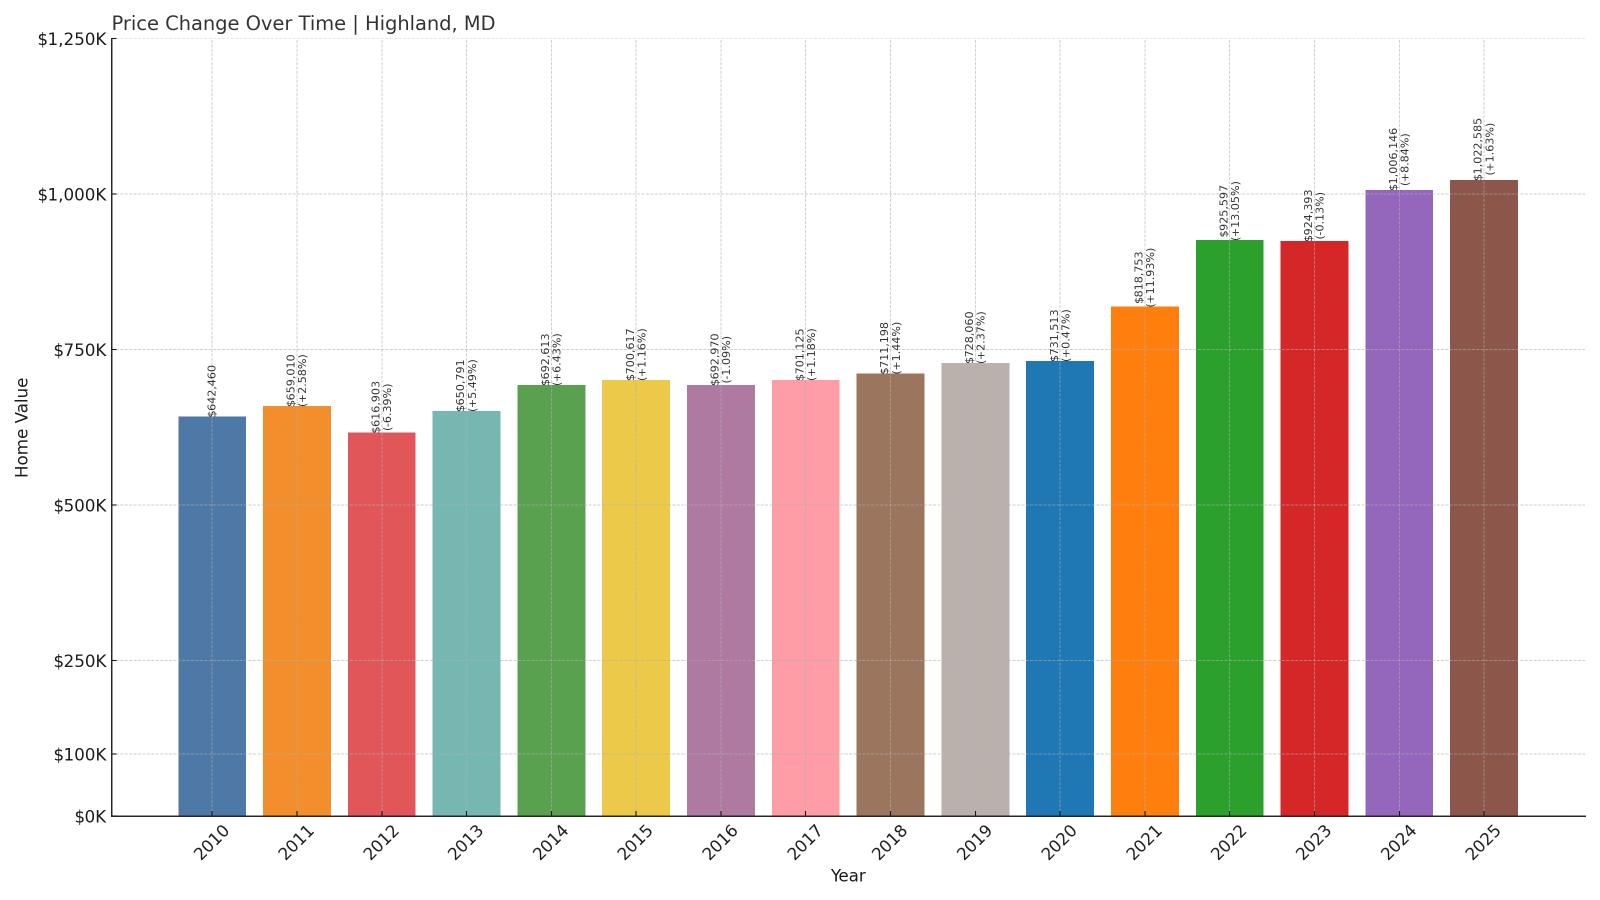
- 2010: $642,460
- 2011: $659,010 (+$16,550, +2.58% from previous year)
- 2012: $616,903 (-$42,107, -6.39% from previous year)
- 2013: $650,791 (+$33,888, +5.49% from previous year)
- 2014: $692,613 (+$41,822, +6.43% from previous year)
- 2015: $700,617 (+$8,004, +1.16% from previous year)
- 2016: $692,970 (-$7,647, -1.09% from previous year)
- 2017: $701,125 (+$8,155, +1.18% from previous year)
- 2018: $711,198 (+$10,073, +1.44% from previous year)
- 2019: $728,060 (+$16,862, +2.37% from previous year)
- 2020: $731,513 (+$3,453, +0.47% from previous year)
- 2021: $818,753 (+$87,240, +11.93% from previous year)
- 2022: $925,597 (+$106,844, +13.05% from previous year)
- 2023: $924,393 (-$1,204, -0.13% from previous year)
- 2024: $1,006,146 (+$81,753, +8.84% from previous year)
- 2025: $1,022,585 (+$16,439, +1.63% from previous year)
Home prices in Highland have risen nearly $380,000 since 2010, a 59% gain driven by rapid growth in the last five years. After modest increases in the 2010s, the market took off in 2021 and has remained strong through 2025, with values now topping $1 million.
Highland – Luxury in a Pastoral Setting
Highland is a quiet, upscale community in southern Howard County, prized for its large homes, wide-open lots, and minimal commercial development. Residents enjoy the serenity of country living paired with the convenience of being within commuting distance of both Baltimore and Washington, D.C.
The spike in values during the pandemic reflects a broader trend: buyers looking to trade city living for more land and privacy. Highland fits that bill perfectly, with limited housing stock and strong demand pushing prices ever higher in recent years.
14. West Friendship – 61% Home Price Increase Since 2010

- 2010: $645,873
- 2011: $618,437 (-$27,436, -4.25% from previous year)
- 2012: $638,286 (+$19,849, +3.21% from previous year)
- 2013: $663,954 (+$25,668, +4.02% from previous year)
- 2014: $687,057 (+$23,103, +3.48% from previous year)
- 2015: $683,685 (-$3,372, -0.49% from previous year)
- 2016: $682,799 (-$886, -0.13% from previous year)
- 2017: $702,212 (+$19,413, +2.84% from previous year)
- 2018: $716,641 (+$14,429, +2.05% from previous year)
- 2019: $730,508 (+$13,867, +1.93% from previous year)
- 2020: $743,887 (+$13,379, +1.83% from previous year)
- 2021: $838,167 (+$94,280, +12.67% from previous year)
- 2022: $946,236 (+$108,069, +12.89% from previous year)
- 2023: $961,111 (+$14,875, +1.57% from previous year)
- 2024: $1,004,757 (+$43,646, +4.54% from previous year)
- 2025: $1,037,868 (+$33,111, +3.30% from previous year)
West Friendship’s home values have grown by $392,000 since 2010, a 61% increase. While early growth was steady, the market accelerated sharply beginning in 2021, with double-digit annual increases followed by continued gains through 2025.
West Friendship – Affluent and Agricultural
Located in western Howard County, West Friendship offers a mix of pastoral beauty and upscale living. The area is known for its large estates, equestrian properties, and the long-standing Howard County Fairgrounds. Residents benefit from strong schools and quick access to Route 70 and other major roads.
The jump in home values over the last several years reflects growing demand for high-end properties in rural-suburban hybrids. With limited commercial development and a strong sense of privacy, West Friendship has become one of Maryland’s premier high-cost housing markets.
13. Darnestown – 42% Home Price Increase Since 2010
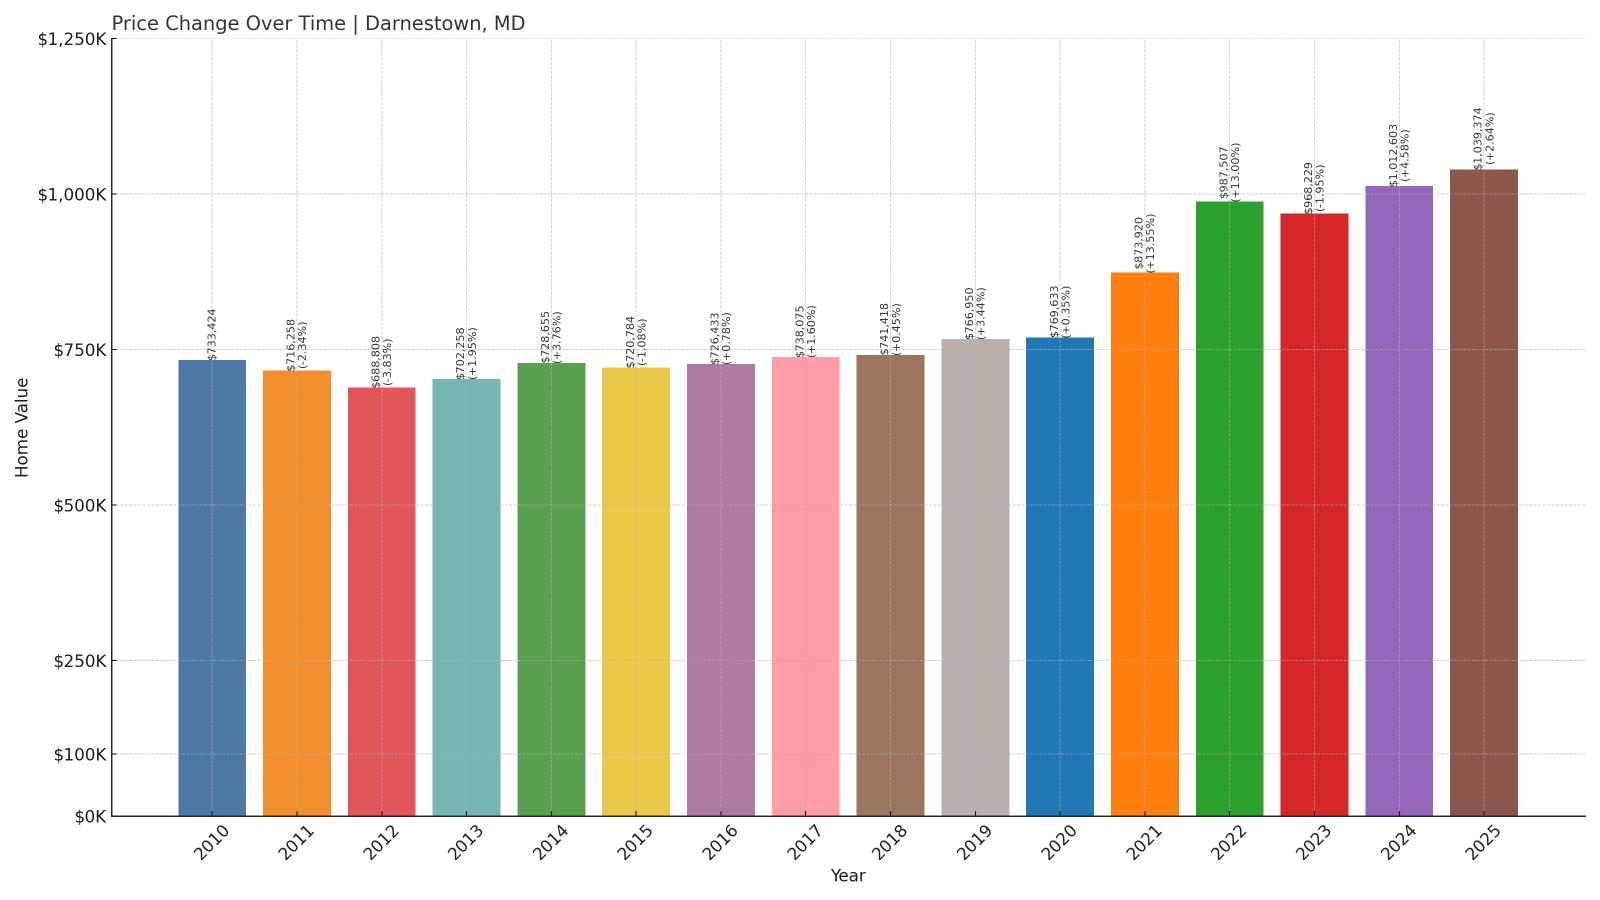
- 2010: $733,424
- 2011: $716,258 (-$17,166, -2.34% from previous year)
- 2012: $688,808 (-$27,450, -3.83% from previous year)
- 2013: $702,258 (+$13,450, +1.95% from previous year)
- 2014: $728,655 (+$26,397, +3.76% from previous year)
- 2015: $720,784 (-$7,871, -1.08% from previous year)
- 2016: $726,433 (+$5,649, +0.78% from previous year)
- 2017: $738,075 (+$11,642, +1.60% from previous year)
- 2018: $741,418 (+$3,343, +0.45% from previous year)
- 2019: $766,950 (+$25,532, +3.44% from previous year)
- 2020: $769,633 (+$2,683, +0.35% from previous year)
- 2021: $873,920 (+$104,287, +13.55% from previous year)
- 2022: $987,507 (+$113,587, +13.00% from previous year)
- 2023: $968,229 (-$19,278, -1.95% from previous year)
- 2024: $1,012,603 (+$44,374, +4.58% from previous year)
- 2025: $1,039,374 (+$26,771, +2.64% from previous year)
Darnestown home values have risen by $305,950 since 2010, a 42% increase. Most of that growth has occurred since 2020, including back-to-back double-digit jumps in 2021 and 2022. Prices cooled slightly in 2023 but have since rebounded past $1 million.
Darnestown – Roomy Properties in the Tech Corridor

Darnestown is located in Montgomery County, west of Gaithersburg and Rockville. Known for its spacious homes and proximity to employment centers along the I-270 corridor, it offers a suburban-rural feel with access to high-paying jobs and excellent schools.
The area has long attracted professionals looking for privacy and quality housing. As demand for large, high-end homes surged during the pandemic, Darnestown saw a corresponding rise in value that has pushed it into the top tier of Maryland’s most expensive places to live.
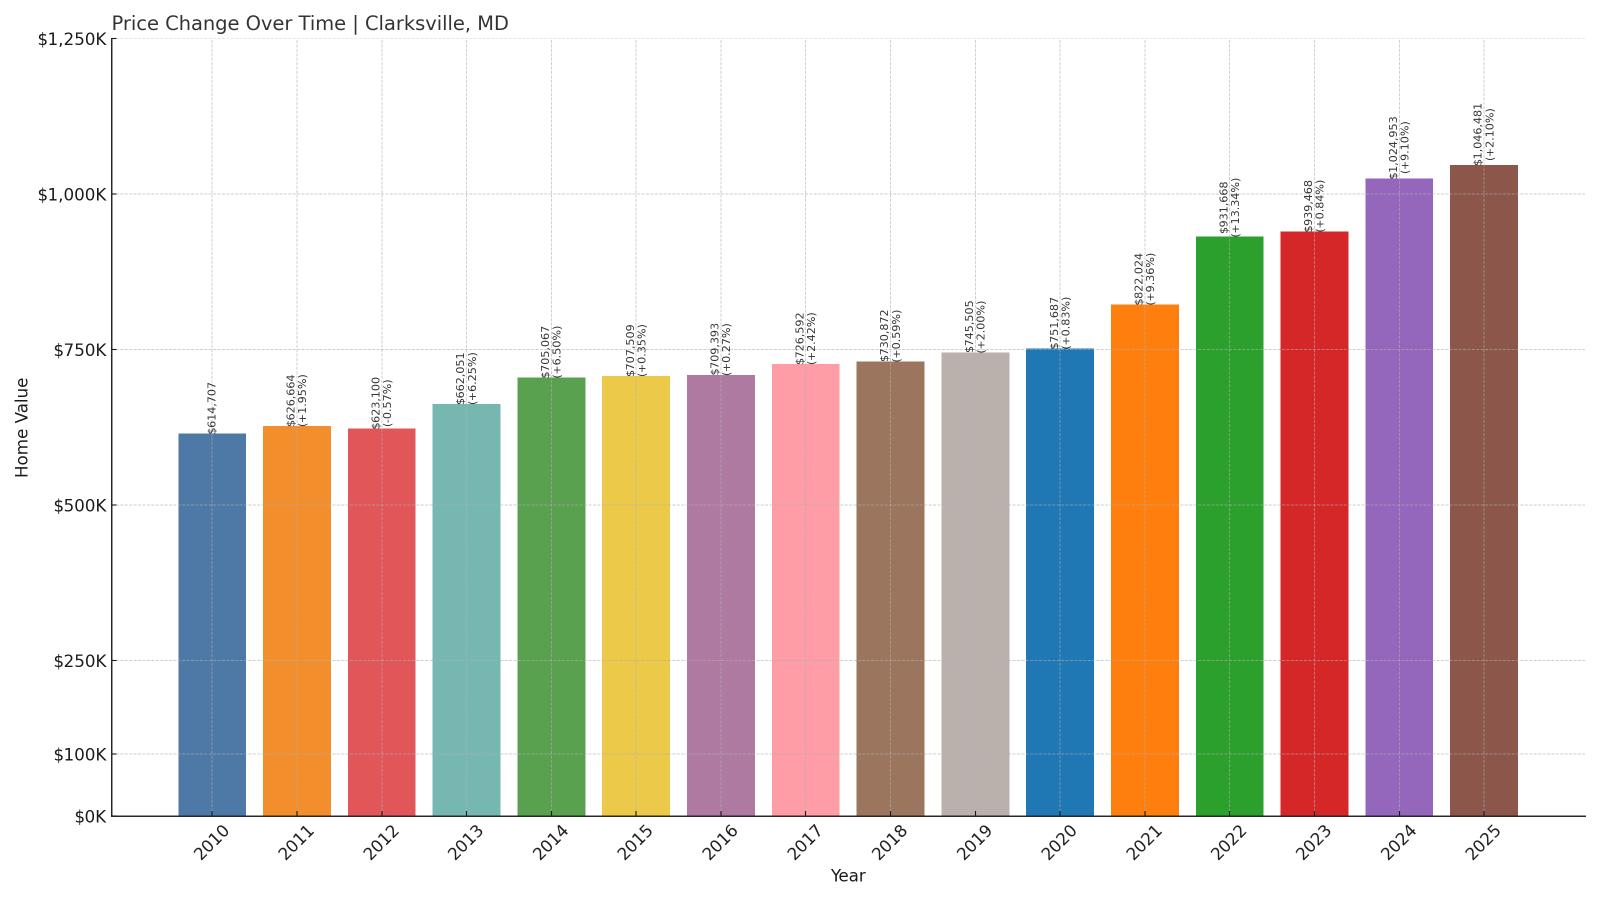
12. Clarksville – 70% Home Price Increase Since 2010
🔥 Would you like to save this?
- 2010: $614,707
- 2011: $626,664 (+$11,957, +1.95% from previous year)
- 2012: $623,100 (-$3,564, -0.57% from previous year)
- 2013: $662,051 (+$38,951, +6.25% from previous year)
- 2014: $705,067 (+$43,016, +6.50% from previous year)
- 2015: $707,509 (+$2,442, +0.35% from previous year)
- 2016: $709,393 (+$1,884, +0.27% from previous year)
- 2017: $726,592 (+$17,199, +2.42% from previous year)
- 2018: $730,872 (+$4,280, +0.59% from previous year)
- 2019: $745,505 (+$14,633, +2.00% from previous year)
- 2020: $751,687 (+$6,182, +0.83% from previous year)
- 2021: $822,024 (+$70,337, +9.36% from previous year)
- 2022: $931,668 (+$109,644, +13.34% from previous year)
- 2023: $939,468 (+$7,800, +0.84% from previous year)
- 2024: $1,024,953 (+$85,485, +9.10% from previous year)
- 2025: $1,046,481 (+$21,528, +2.10% from previous year)
Clarksville has experienced a 70% jump in home values since 2010, adding more than $430,000 over that span. While growth was moderate early on, prices took off starting in 2021 and have remained strong, putting average home values above $1 million in 2025.
Clarksville – Elite Living with Top-Tier Schools

Clarksville is one of Howard County’s most desirable places to live, with a reputation for luxury housing and nationally ranked public schools. The area features a mix of upscale developments and estate-style homes on large lots, often with custom features and modern finishes.
Its location between Baltimore and D.C. makes it ideal for affluent commuters, and demand has only grown in recent years. The consistent upward trend in home prices is a reflection of Clarksville’s enduring status as one of Maryland’s most prestigious addresses.
11. Glenwood – 56% Home Price Increase Since 2010
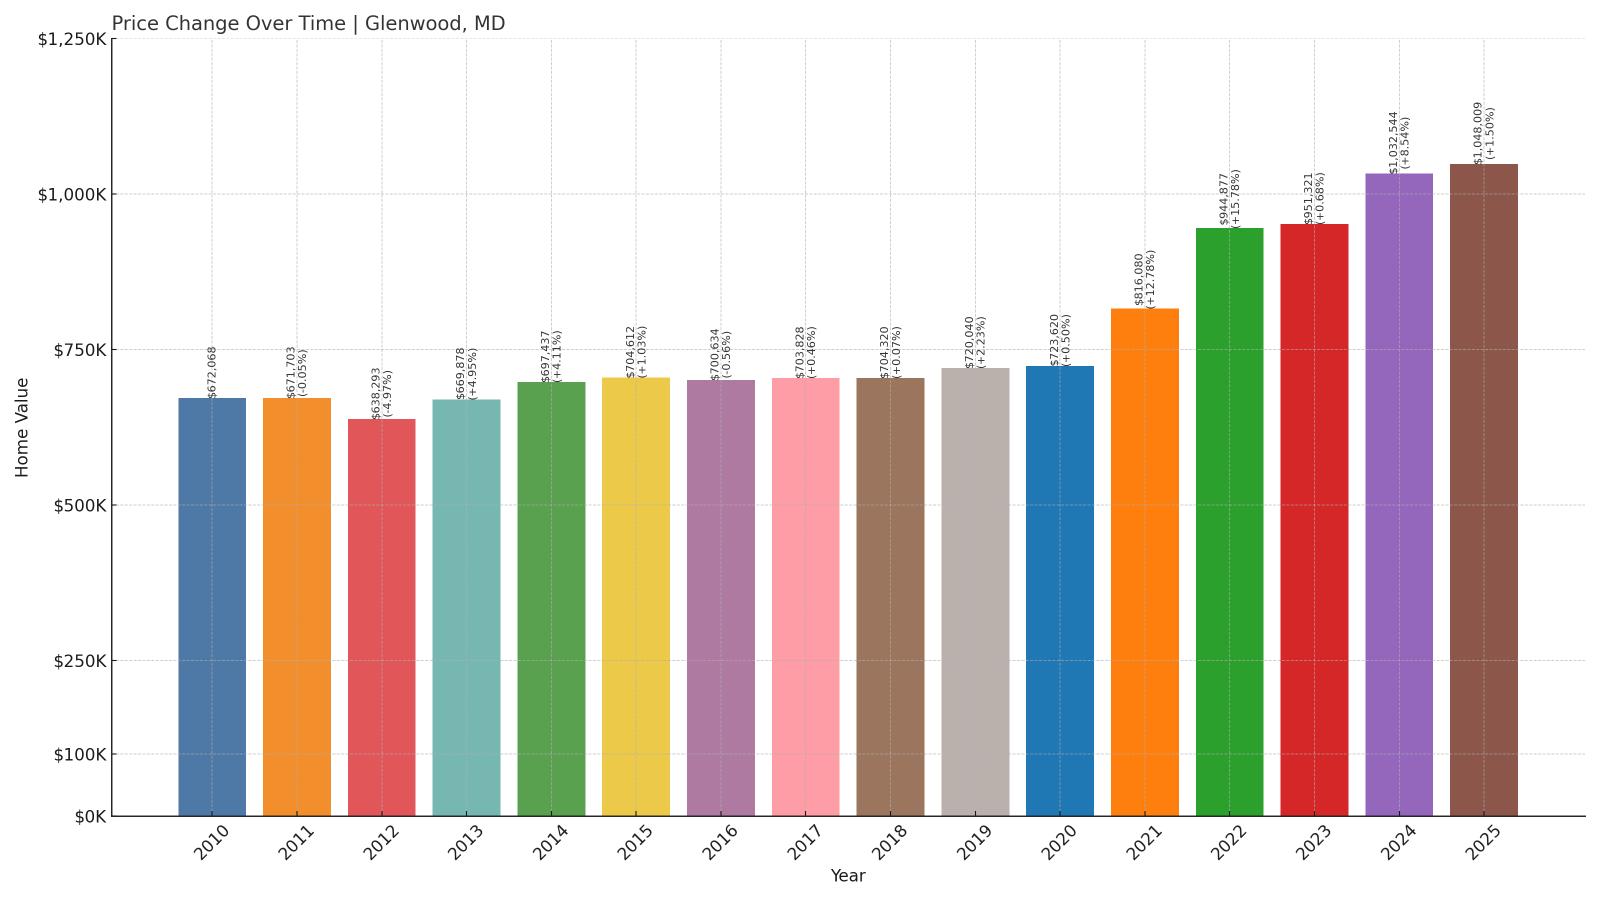
- 2010: $672,068
- 2011: $671,703 (-$365, -0.05% from previous year)
- 2012: $638,293 (-$33,410, -4.97% from previous year)
- 2013: $669,878 (+$31,585, +4.95% from previous year)
- 2014: $697,437 (+$27,559, +4.11% from previous year)
- 2015: $704,612 (+$7,175, +1.03% from previous year)
- 2016: $700,634 (-$3,978, -0.56% from previous year)
- 2017: $703,828 (+$3,194, +0.46% from previous year)
- 2018: $704,320 (+$492, +0.07% from previous year)
- 2019: $720,040 (+$15,720, +2.23% from previous year)
- 2020: $723,620 (+$3,580, +0.50% from previous year)
- 2021: $816,080 (+$92,460, +12.78% from previous year)
- 2022: $944,877 (+$128,797, +15.78% from previous year)
- 2023: $951,321 (+$6,444, +0.68% from previous year)
- 2024: $1,032,544 (+$81,223, +8.54% from previous year)
- 2025: $1,048,009 (+$15,465, +1.50% from previous year)
Glenwood’s home values have climbed more than $375,000 since 2010, a 56% increase. After a quiet first half of the decade, the market exploded in 2021 and 2022, with annual gains topping 12%. Prices have continued upward since then, pushing average values above $1 million.
Glenwood – Estate Living in Western Howard County

Glenwood offers upscale living in a peaceful, countryside setting in western Howard County. Known for its luxury homes, horse properties, and strong public schools, the area draws buyers looking for space, quality construction, and a slower pace—without being far from major job centers.
With few commercial developments and a low-density layout, Glenwood’s appeal lies in its exclusivity. That’s reflected in its recent price growth, which places it firmly among Maryland’s most expensive places to live in 2025.
10. Dayton – 58% Home Price Increase Since 2010
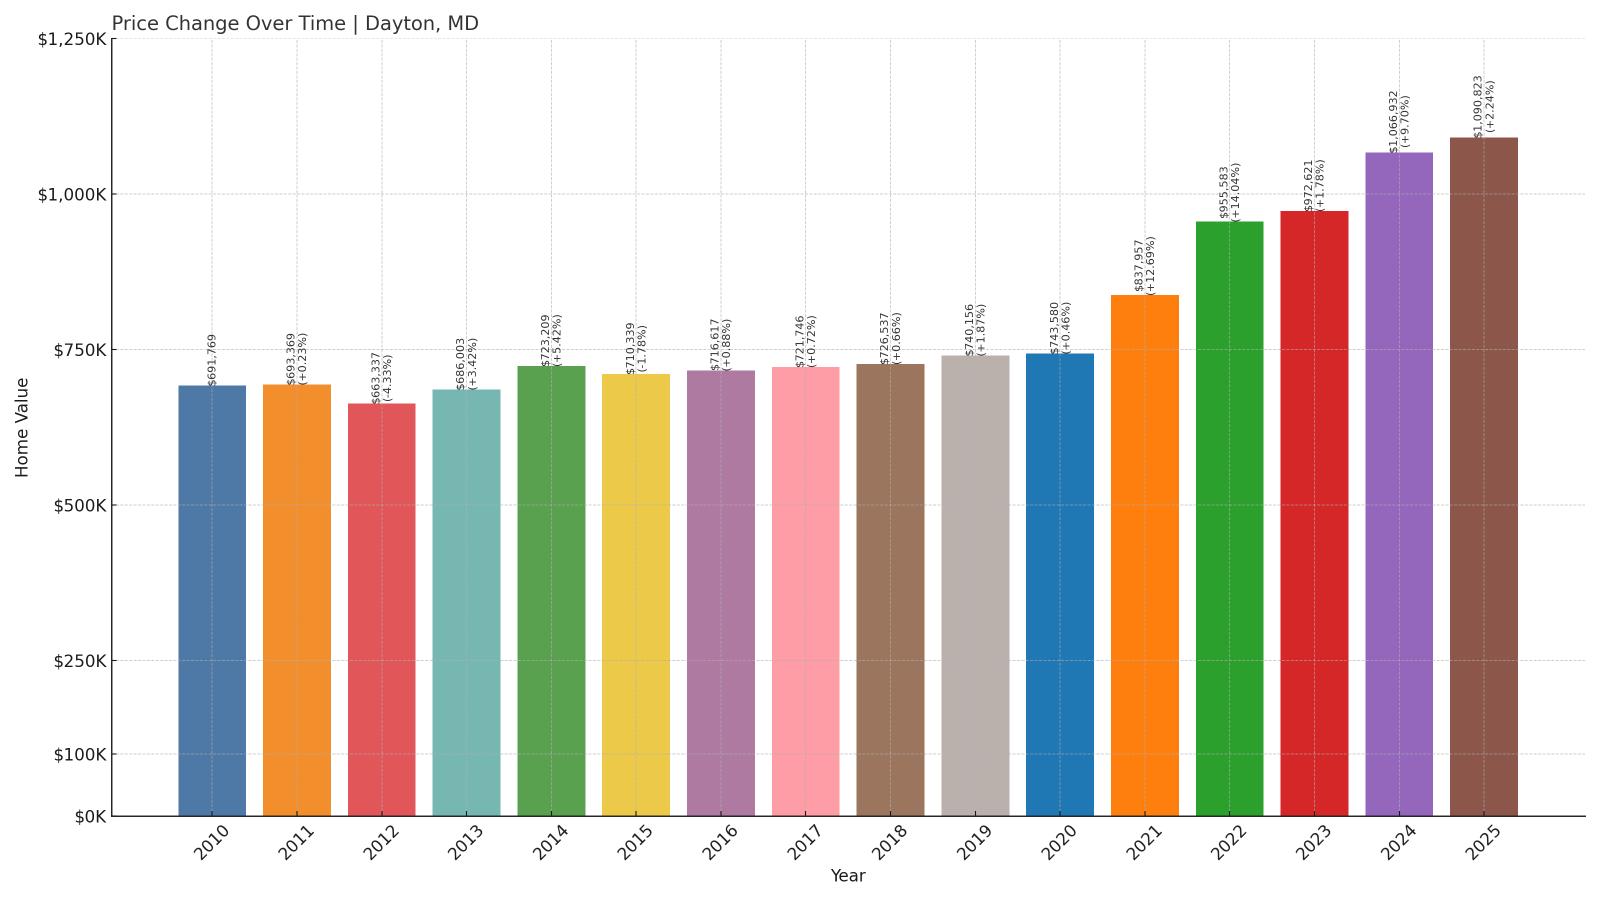
- 2010: $691,769
- 2011: $693,369 (+$1,600, +0.23% from previous year)
- 2012: $663,337 (-$30,032, -4.33% from previous year)
- 2013: $686,003 (+$22,666, +3.42% from previous year)
- 2014: $723,209 (+$37,206, +5.42% from previous year)
- 2015: $710,339 (-$12,870, -1.78% from previous year)
- 2016: $716,617 (+$6,278, +0.88% from previous year)
- 2017: $721,746 (+$5,129, +0.72% from previous year)
- 2018: $726,537 (+$4,791, +0.66% from previous year)
- 2019: $740,156 (+$13,619, +1.87% from previous year)
- 2020: $743,580 (+$3,424, +0.46% from previous year)
- 2021: $837,957 (+$94,377, +12.69% from previous year)
- 2022: $955,583 (+$117,626, +14.04% from previous year)
- 2023: $972,621 (+$17,038, +1.78% from previous year)
- 2024: $1,066,932 (+$94,311, +9.70% from previous year)
- 2025: $1,090,823 (+$23,891, +2.24% from previous year)
Dayton’s home values have increased by nearly $400,000 since 2010—a 58% rise. Gains were relatively slow until 2021, when values took off, followed by continued momentum through 2025. The town now sits comfortably above the $1 million mark.
Dayton – Quiet Luxury in Howard County

Dayton is a small but affluent area in Howard County, known for custom-built homes on large lots and limited commercial activity. This low-density, high-value market appeals to buyers seeking privacy and rural charm paired with top-ranked schools and proximity to Columbia, Baltimore, and Washington, D.C.
The sharp rise in values from 2021 onward reflects that premium, as demand for spacious, well-appointed homes has remained high. With limited turnover and no large-scale development, Dayton’s home values continue to rise steadily.
9. Garrett Park – 66% Home Price Increase Since 2010
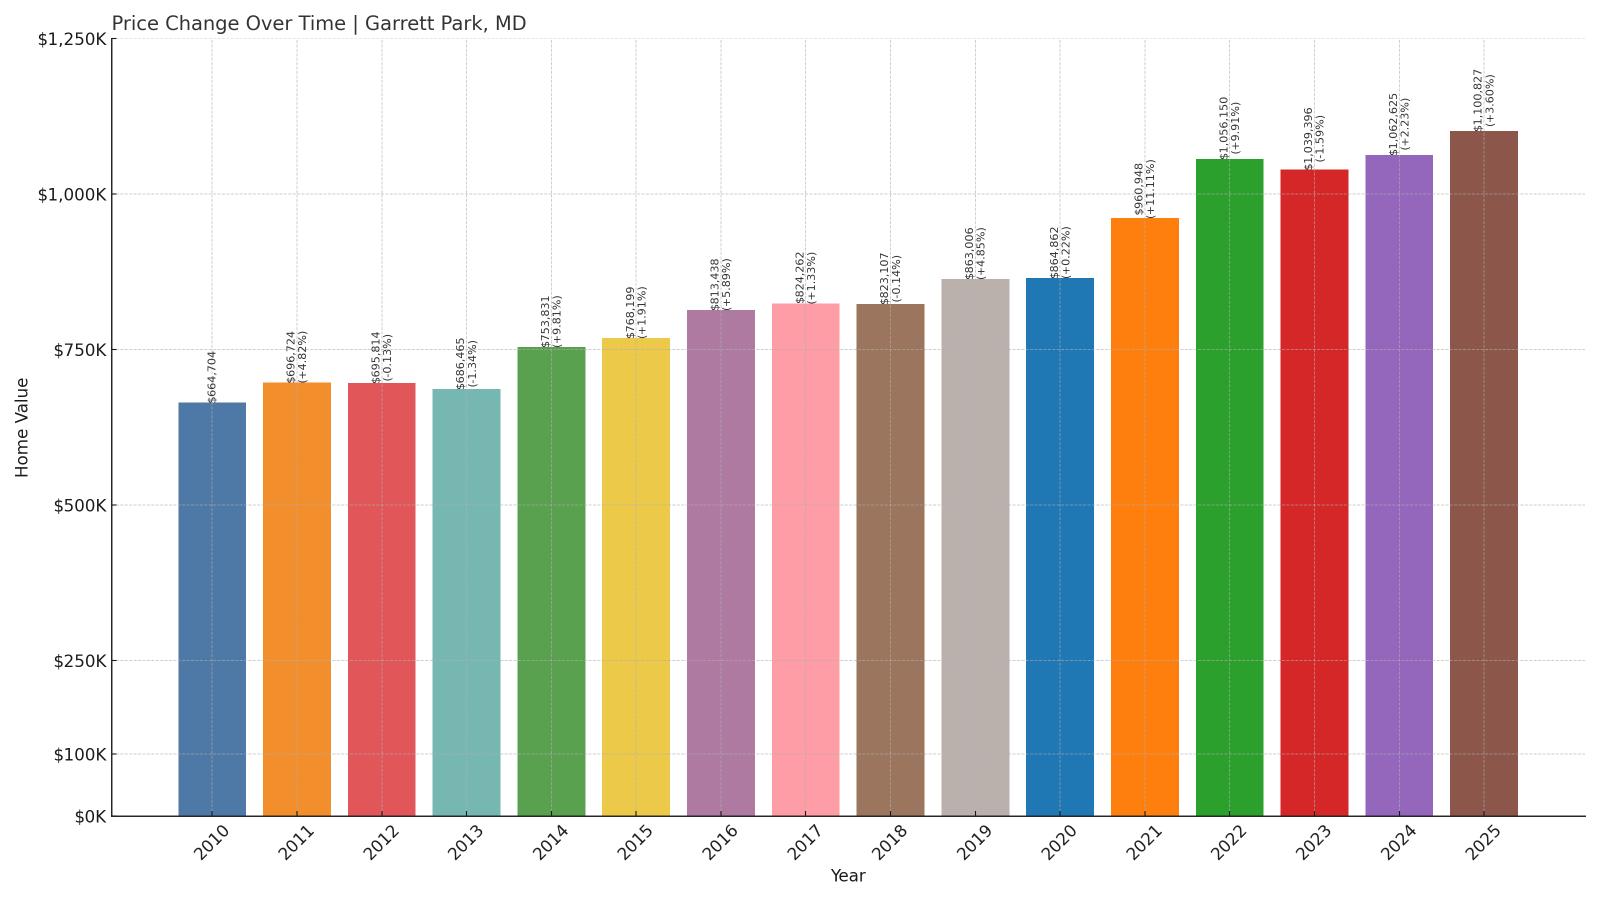
- 2010: $664,704
- 2011: $696,724 (+$32,020, +4.82% from previous year)
- 2012: $695,814 (-$910, -0.13% from previous year)
- 2013: $686,465 (-$9,349, -1.34% from previous year)
- 2014: $753,831 (+$67,366, +9.81% from previous year)
- 2015: $768,199 (+$14,368, +1.91% from previous year)
- 2016: $813,438 (+$45,239, +5.89% from previous year)
- 2017: $824,262 (+$10,824, +1.33% from previous year)
- 2018: $823,107 (-$1,155, -0.14% from previous year)
- 2019: $863,006 (+$39,899, +4.85% from previous year)
- 2020: $864,862 (+$1,856, +0.22% from previous year)
- 2021: $960,948 (+$96,086, +11.11% from previous year)
- 2022: $1,056,150 (+$95,202, +9.91% from previous year)
- 2023: $1,039,396 (-$16,754, -1.59% from previous year)
- 2024: $1,062,625 (+$23,229, +2.23% from previous year)
- 2025: $1,100,827 (+$38,202, +3.60% from previous year)
Garrett Park’s average home price has increased by $436,123 since 2010, a 66% gain. The biggest spikes came in 2021 and 2022, with strong follow-up growth through 2025 pushing prices past $1.1 million.
Garrett Park – Historic and High-End

Garrett Park, a small incorporated town in Montgomery County, is known for its historic charm, tree-lined streets, and emphasis on preservation. With a MARC rail station and Metro access nearby, it offers an idyllic residential setting just outside the urban bustle of Bethesda and Washington, D.C.
The combination of old-world architecture and modern accessibility has helped keep demand—and prices—high. Garrett Park’s carefully preserved homes, tight-knit community, and central location make it one of Maryland’s most desirable and expensive enclaves.
8. Royal Oak – 67% Home Price Increase Since 2010
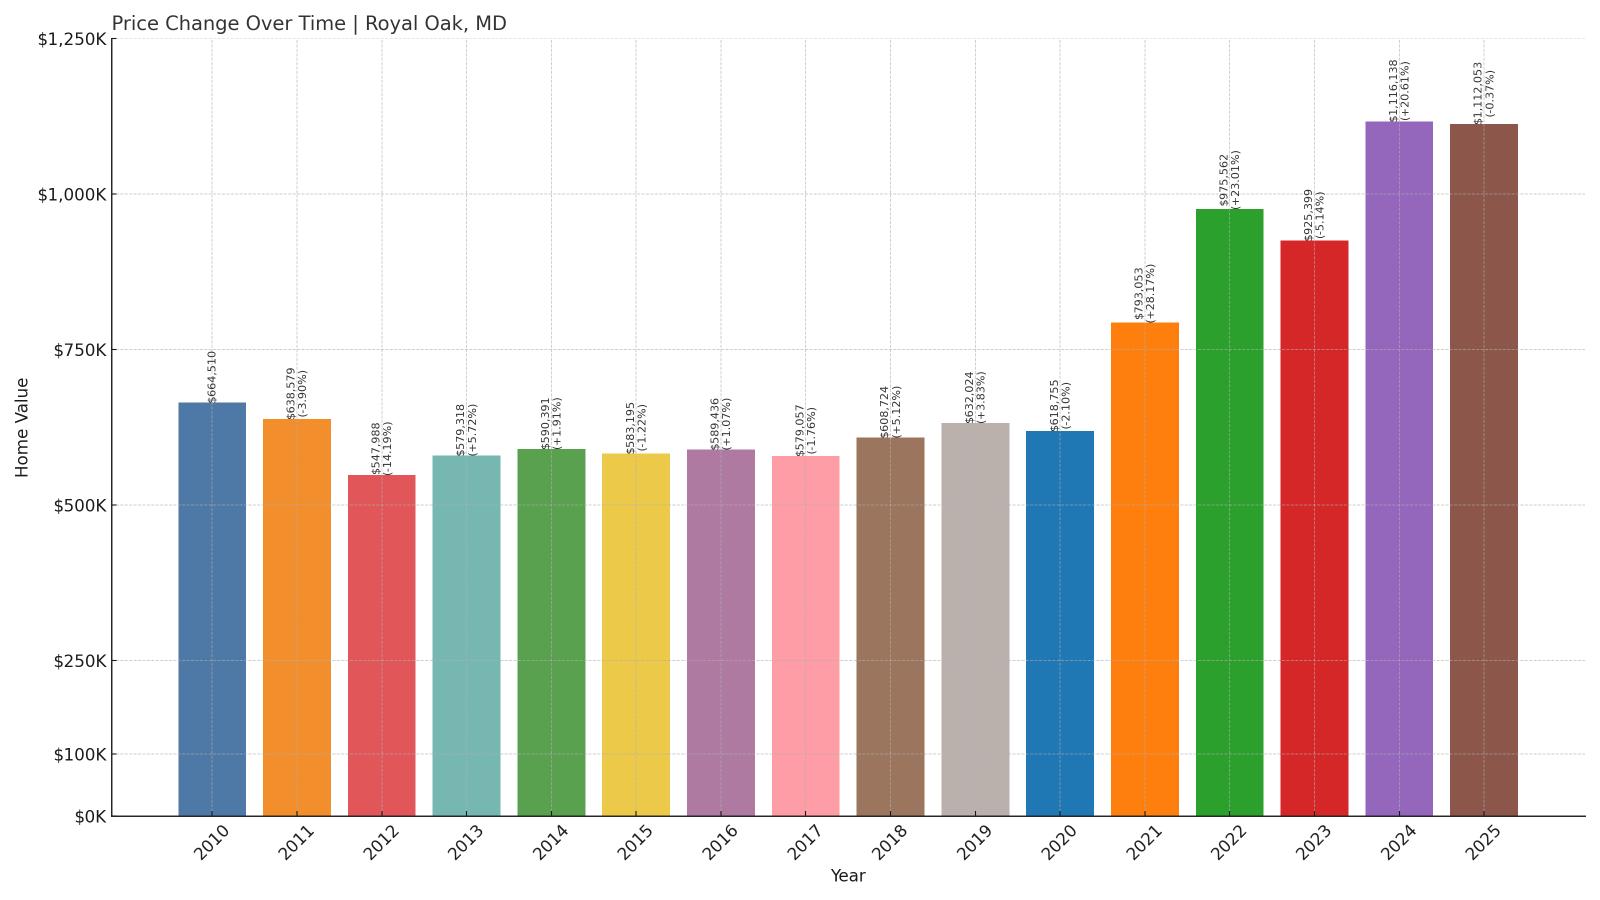
- 2010: $664,510
- 2011: $638,579 (-$25,931, -3.90% from previous year)
- 2012: $547,988 (-$90,591, -14.19% from previous year)
- 2013: $579,318 (+$31,330, +5.72% from previous year)
- 2014: $590,391 (+$11,073, +1.91% from previous year)
- 2015: $583,195 (-$7,196, -1.22% from previous year)
- 2016: $589,436 (+$6,241, +1.07% from previous year)
- 2017: $579,057 (-$10,379, -1.76% from previous year)
- 2018: $608,724 (+$29,667, +5.12% from previous year)
- 2019: $632,024 (+$23,300, +3.83% from previous year)
- 2020: $618,755 (-$13,269, -2.10% from previous year)
- 2021: $793,053 (+$174,298, +28.17% from previous year)
- 2022: $975,562 (+$182,509, +23.01% from previous year)
- 2023: $925,399 (-$50,163, -5.14% from previous year)
- 2024: $1,116,138 (+$190,739, +20.61% from previous year)
- 2025: $1,112,053 (-$4,085, -0.37% from previous year)
Royal Oak’s housing market has climbed nearly $448,000 since 2010, a 67% increase. After years of volatility, values skyrocketed from 2021 to 2024, fueled by surging demand for luxury waterfront properties.
Royal Oak – Chesapeake Bay Prestige
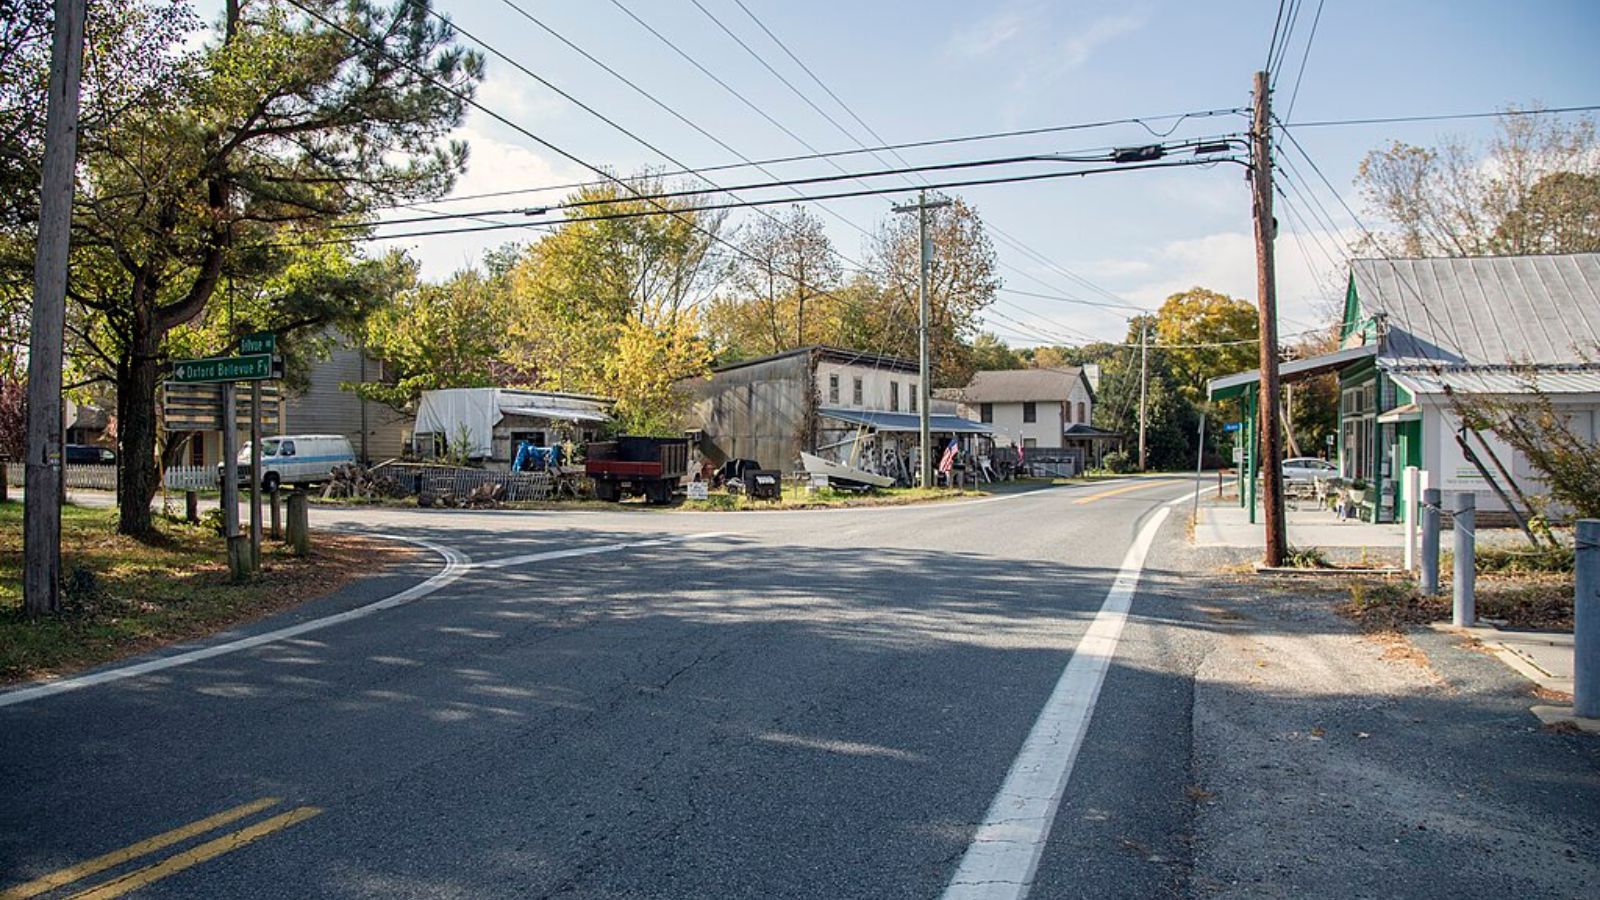
🔥 Would you like to save this?
Royal Oak is a scenic, upscale community in Talbot County along Maryland’s Eastern Shore. It offers premium waterfront living on the Chesapeake Bay, complete with private docks, sweeping views, and a quiet retreat from urban life.
The area attracts wealthy retirees and second-home buyers, especially since the pandemic renewed interest in serene, remote properties. Though prices dipped slightly in 2023 and again in 2025, the long-term trend shows strong appreciation in one of Maryland’s most exclusive markets.
7. Bethesda – 51% Home Price Increase Since 2010
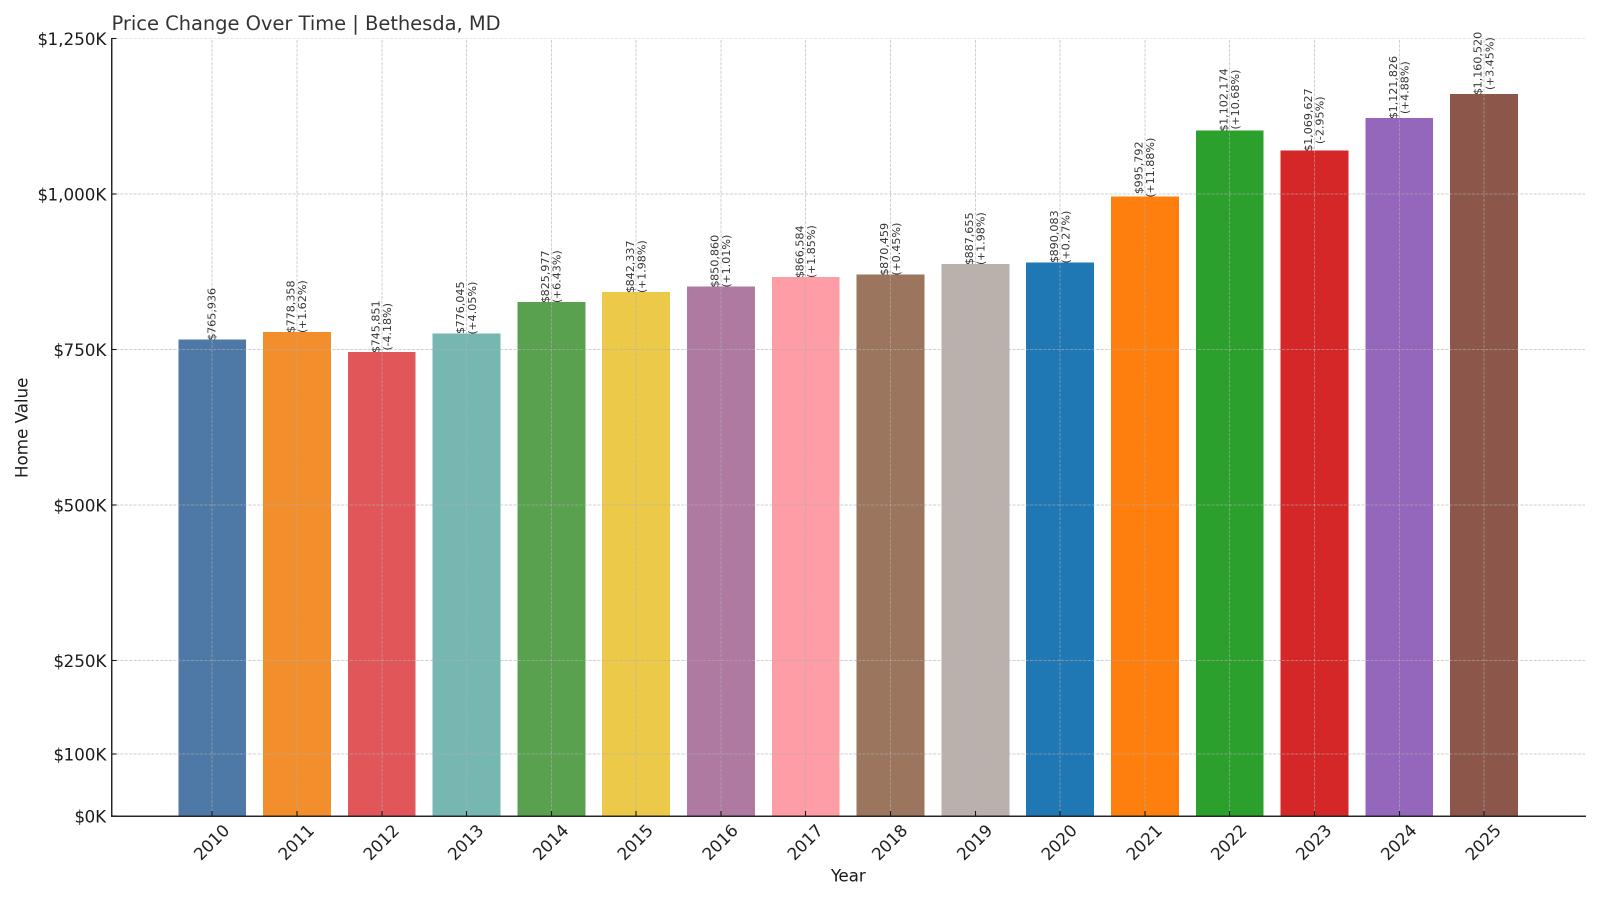
- 2010: $765,936
- 2011: $778,358 (+$12,422, +1.62% from previous year)
- 2012: $745,851 (-$32,507, -4.18% from previous year)
- 2013: $776,045 (+$30,194, +4.05% from previous year)
- 2014: $825,977 (+$49,932, +6.43% from previous year)
- 2015: $842,337 (+$16,360, +1.98% from previous year)
- 2016: $850,860 (+$8,523, +1.01% from previous year)
- 2017: $866,584 (+$15,724, +1.85% from previous year)
- 2018: $870,459 (+$3,875, +0.45% from previous year)
- 2019: $887,655 (+$17,196, +1.98% from previous year)
- 2020: $890,083 (+$2,428, +0.27% from previous year)
- 2021: $995,792 (+$105,709, +11.88% from previous year)
- 2022: $1,102,174 (+$106,382, +10.68% from previous year)
- 2023: $1,069,627 (-$32,547, -2.95% from previous year)
- 2024: $1,121,826 (+$52,199, +4.88% from previous year)
- 2025: $1,160,520 (+$38,694, +3.45% from previous year)
Bethesda has added nearly $395,000 in home value since 2010, a 51% increase. After consistent growth through the 2010s, the market surged in 2021 and 2022. Despite a slight dip in 2023, prices rebounded in the two years following, now reaching over $1.16 million.
Bethesda – Urban Sophistication and High Demand

Located just northwest of Washington, D.C., Bethesda is one of the most affluent and educated communities in the country. With top-tier schools, luxury shopping, and major employers like NIH and Walter Reed, the area attracts high-income professionals and families alike.
The housing stock includes everything from upscale condos to historic single-family homes, and demand remains strong. The recent rise in home values highlights Bethesda’s resilience and enduring appeal in the face of broader market fluctuations.
6. Chevy Chase – 63% Home Price Increase Since 2010
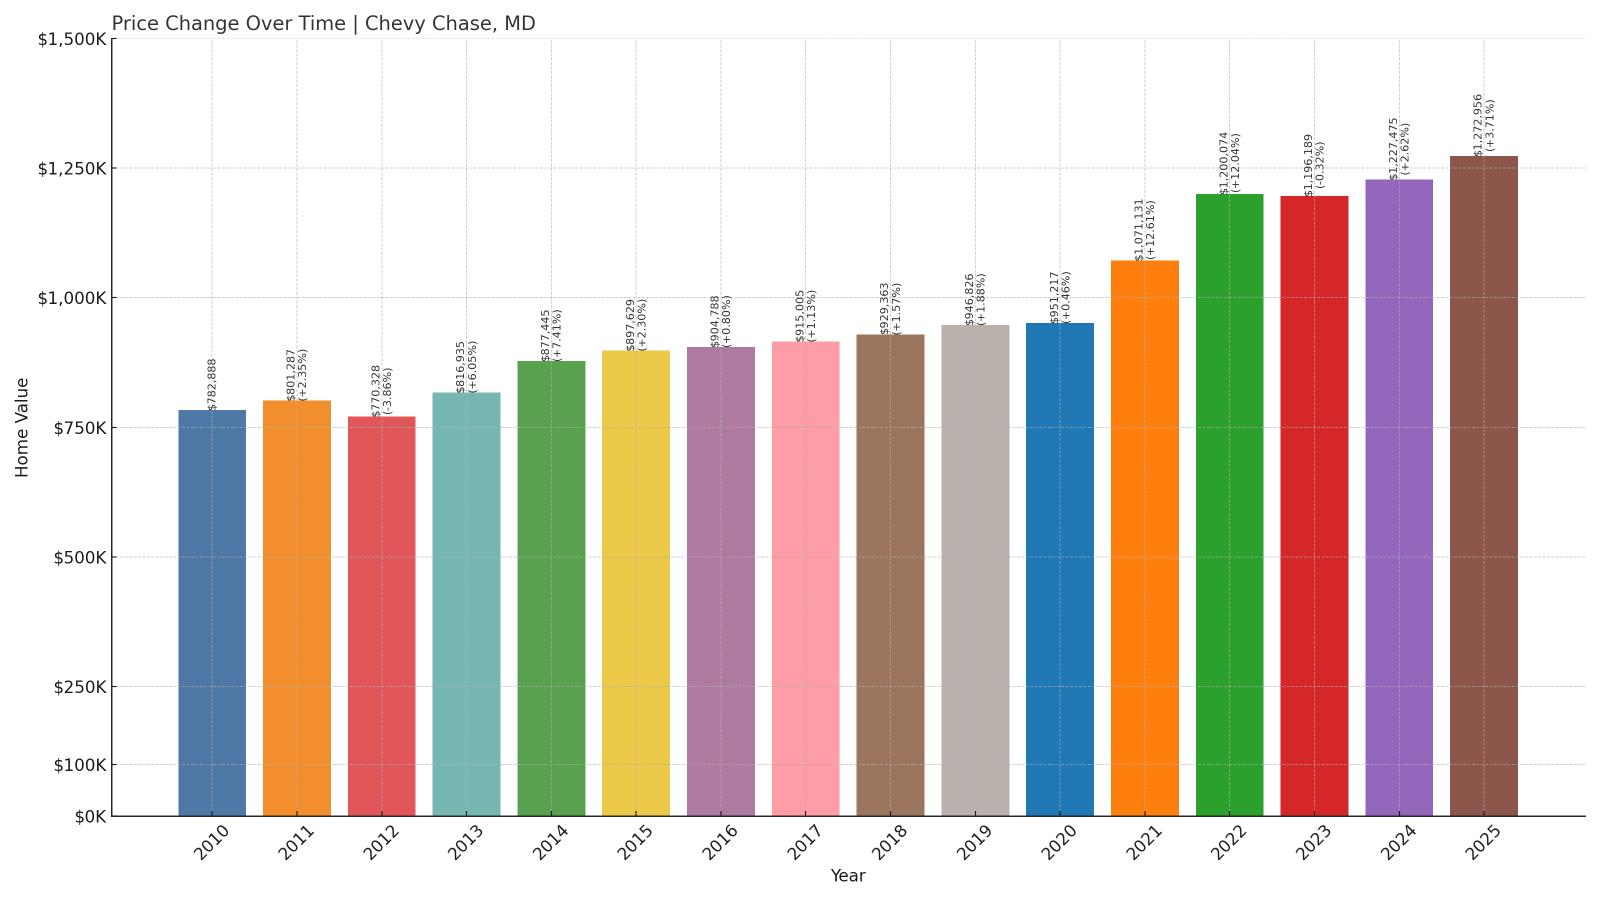
- 2010: $782,888
- 2011: $801,287 (+$18,399, +2.35% from previous year)
- 2012: $770,328 (-$30,959, -3.86% from previous year)
- 2013: $816,935 (+$46,607, +6.05% from previous year)
- 2014: $877,445 (+$60,510, +7.41% from previous year)
- 2015: $897,629 (+$20,184, +2.30% from previous year)
- 2016: $904,788 (+$7,159, +0.80% from previous year)
- 2017: $915,005 (+$10,217, +1.13% from previous year)
- 2018: $929,363 (+$14,358, +1.57% from previous year)
- 2019: $946,826 (+$17,463, +1.88% from previous year)
- 2020: $951,217 (+$4,391, +0.46% from previous year)
- 2021: $1,071,131 (+$119,914, +12.61% from previous year)
- 2022: $1,200,074 (+$128,943, +12.04% from previous year)
- 2023: $1,196,189 (-$3,885, -0.32% from previous year)
- 2024: $1,227,475 (+$31,286, +2.62% from previous year)
- 2025: $1,272,956 (+$45,481, +3.71% from previous year)
Chevy Chase home prices have grown by nearly $490,000 since 2010, a 63% increase. After steady growth through the 2010s, values soared during the early 2020s, particularly in 2021 and 2022. The area has continued to appreciate through 2025, reaching an average of $1.27 million.
Chevy Chase – Wealth, Elegance, and Accessibility

Chevy Chase sits at the Maryland-D.C. border and has long been one of the most prestigious addresses in the region. With well-preserved historic homes, leafy streets, and access to elite schools and institutions, it’s a top choice for those seeking old-money charm with modern convenience.
Its proximity to downtown D.C., combined with a low housing turnover rate, makes inventory tight and prices high. The sustained rise in home values confirms its status as one of the state’s most exclusive real estate markets.
5. Cabin John – 59% Home Price Increase Since 2010
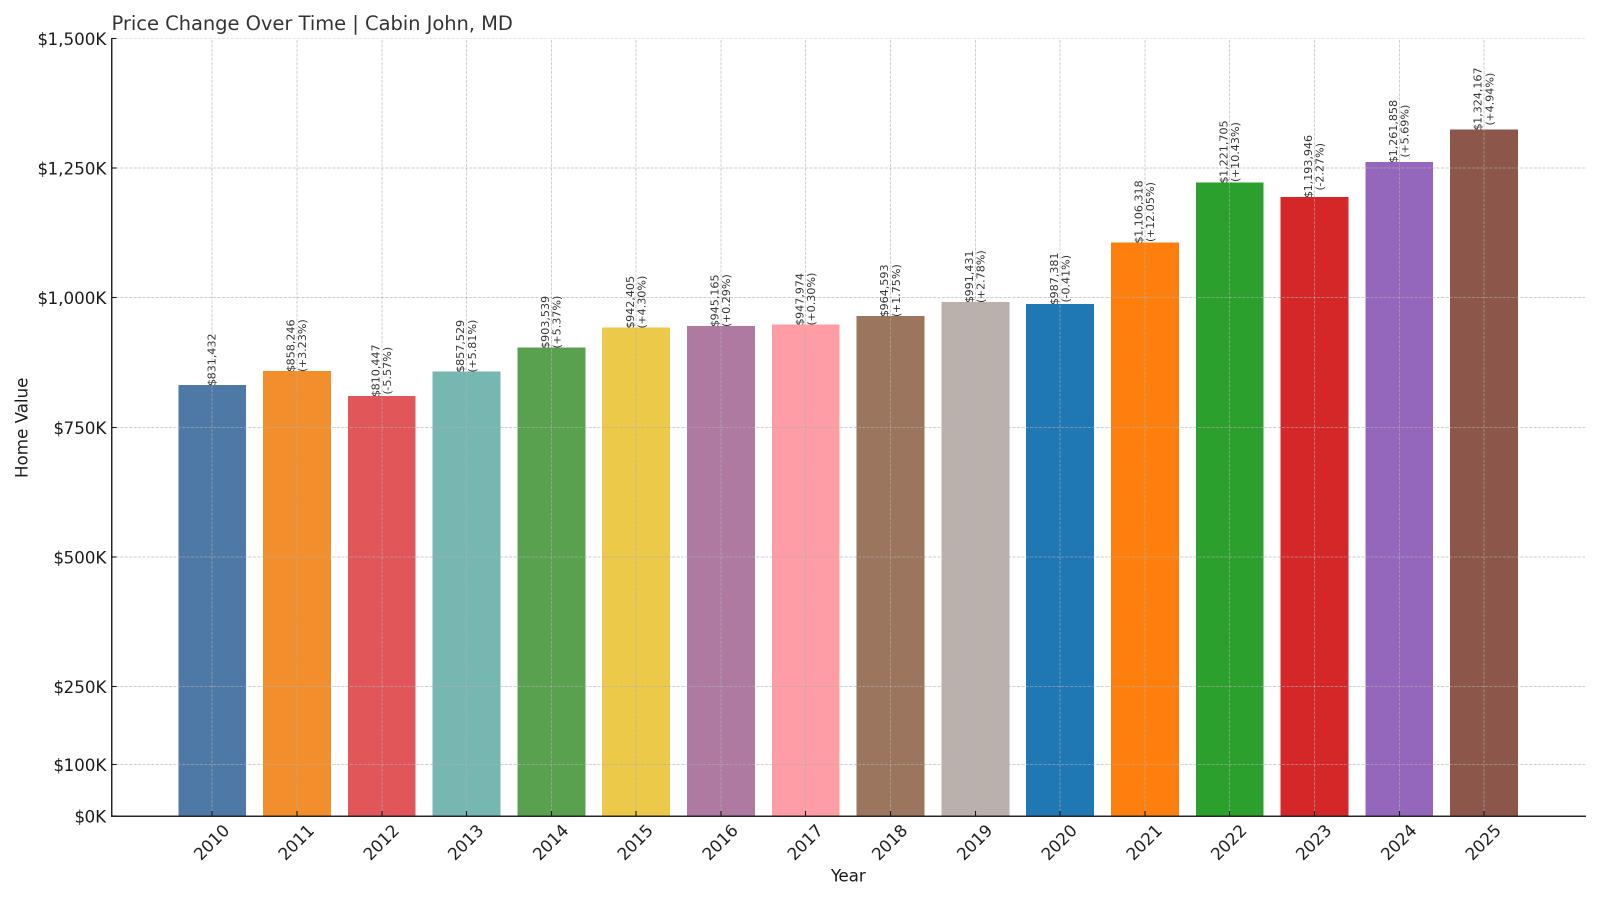
- 2010: $831,432
- 2011: $858,246 (+$26,814, +3.23% from previous year)
- 2012: $810,447 (-$47,799, -5.57% from previous year)
- 2013: $857,529 (+$47,082, +5.81% from previous year)
- 2014: $903,539 (+$46,010, +5.37% from previous year)
- 2015: $942,405 (+$38,866, +4.30% from previous year)
- 2016: $945,165 (+$2,760, +0.29% from previous year)
- 2017: $947,974 (+$2,809, +0.30% from previous year)
- 2018: $964,593 (+$16,619, +1.75% from previous year)
- 2019: $991,431 (+$26,838, +2.78% from previous year)
- 2020: $987,381 (-$4,050, -0.41% from previous year)
- 2021: $1,106,318 (+$118,937, +12.05% from previous year)
- 2022: $1,221,705 (+$115,387, +10.43% from previous year)
- 2023: $1,193,946 (-$27,759, -2.27% from previous year)
- 2024: $1,261,858 (+$67,912, +5.69% from previous year)
- 2025: $1,324,167 (+$62,309, +4.94% from previous year)
Cabin John’s home values have increased by nearly $493,000 since 2010, a 59% gain. Growth has been especially strong over the past five years, with consistent appreciation even during market dips. The average home is now worth over $1.32 million.
Cabin John – Riverfront Prestige Near the Capital

Cabin John is a small, upscale community nestled between the Potomac River and Bethesda. Despite its modest footprint, it boasts some of the priciest real estate in Maryland, thanks to its natural beauty, elite school access, and proximity to D.C.
High-value homes, a walkable town center, and outdoor attractions like the C&O Canal make it highly attractive to professionals and retirees alike. Tight inventory and sustained demand have kept values climbing steadily—even when broader markets faltered.
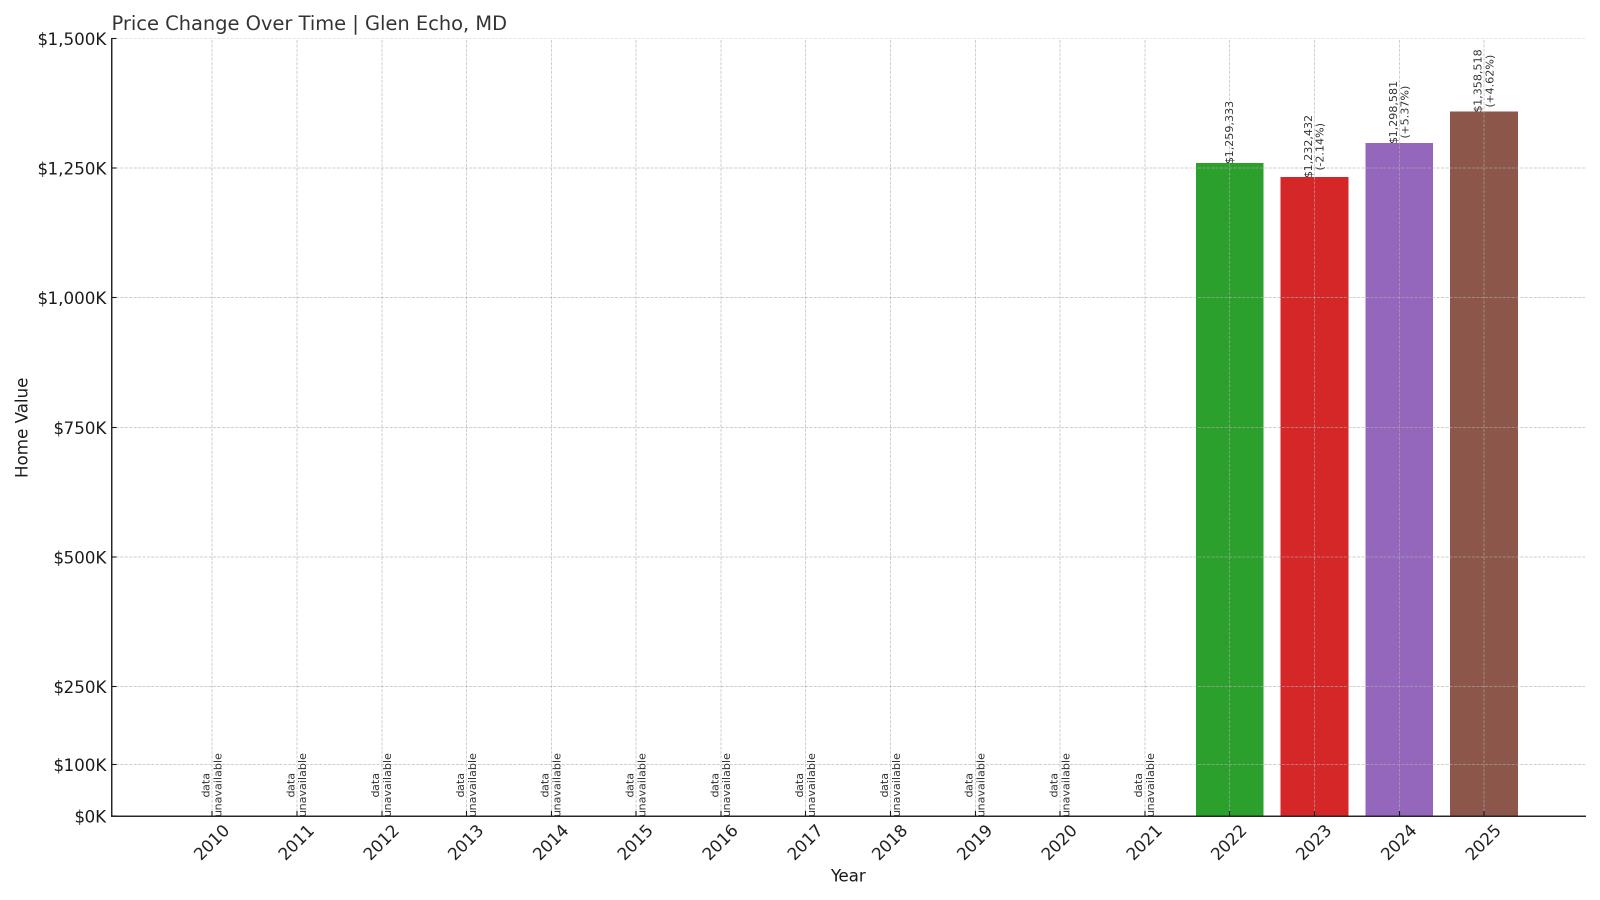
4. Glen Echo – 8% Home Price Increase Since 2022
- 2010: N/A
- 2011: N/A
- 2012: N/A
- 2013: N/A
- 2014: N/A
- 2015: N/A
- 2016: N/A
- 2017: N/A
- 2018: N/A
- 2019: N/A
- 2020: N/A
- 2021: N/A
- 2022: $1,259,333
- 2023: $1,232,432 (-$26,901, -2.14% from previous year)
- 2024: $1,298,581 (+$66,149, +5.37% from previous year)
- 2025: $1,358,518 (+$59,937, +4.62% from previous year)
Glen Echo’s home values have climbed 8% since Zillow began tracking them in 2022. Despite a small dip in 2023, prices recovered sharply in the two following years, with homes now averaging more than $1.35 million.
Glen Echo – Arts, History, and Affluent Living

Glen Echo is a compact and historically rich town along the Potomac River. Known for the Glen Echo Park arts and cultural center, the town combines turn-of-the-century charm with million-dollar price tags. Though small in size, it draws interest for its distinct identity and high-value properties.
Proximity to D.C., beautiful scenery, and a unique community vibe have made Glen Echo one of the most exclusive places to buy in Maryland. With limited inventory and lasting appeal, prices are likely to keep rising.
3. Potomac – 49% Home Price Increase Since 2010
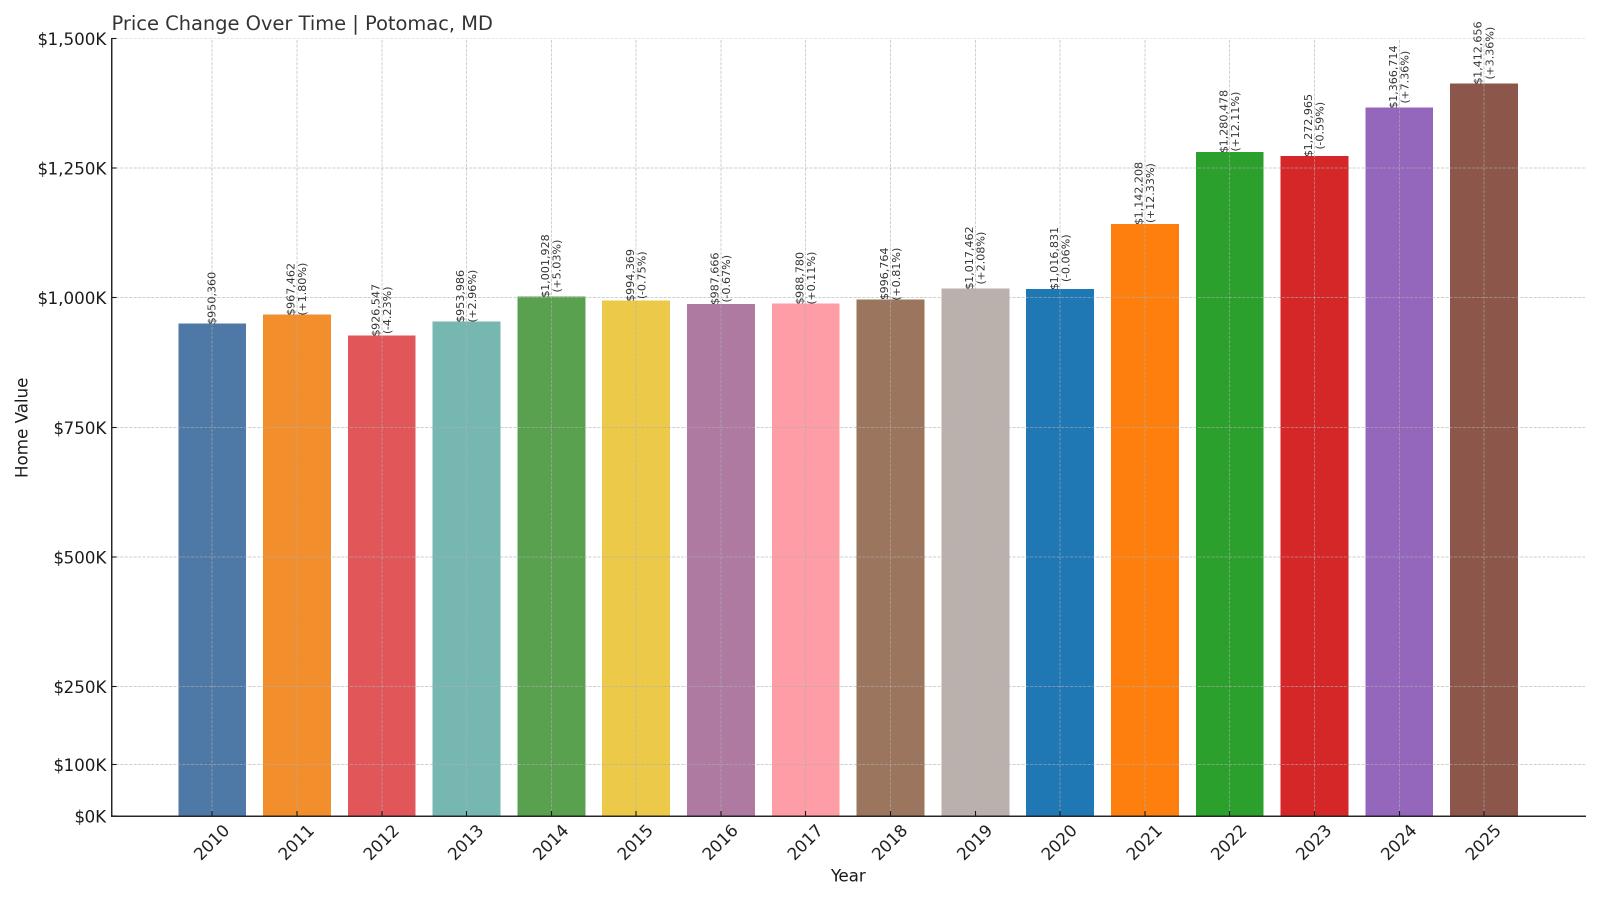
- 2010: $950,360
- 2011: $967,462 (+$17,102, +1.80% from previous year)
- 2012: $926,547 (-$40,915, -4.23% from previous year)
- 2013: $953,986 (+$27,439, +2.96% from previous year)
- 2014: $1,001,928 (+$47,942, +5.03% from previous year)
- 2015: $994,369 (-$7,559, -0.75% from previous year)
- 2016: $987,666 (-$6,703, -0.67% from previous year)
- 2017: $988,780 (+$1,114, +0.11% from previous year)
- 2018: $996,764 (+$7,984, +0.81% from previous year)
- 2019: $1,017,462 (+$20,698, +2.08% from previous year)
- 2020: $1,016,831 (-$631, -0.06% from previous year)
- 2021: $1,142,208 (+$125,377, +12.33% from previous year)
- 2022: $1,280,478 (+$138,270, +12.11% from previous year)
- 2023: $1,272,965 (-$7,513, -0.59% from previous year)
- 2024: $1,366,714 (+$93,749, +7.36% from previous year)
- 2025: $1,412,656 (+$45,942, +3.36% from previous year)
Potomac home values have risen 49% since 2010, adding over $462,000 in value. While the 2010s saw modest movement, growth accelerated sharply in the early 2020s, with consecutive double-digit increases in 2021 and 2022. Prices dipped slightly in 2023 but have since recovered, hitting $1.41 million by mid-2025.
Potomac – Maryland’s Benchmark for Prestige
Potomac is one of Maryland’s most prominent luxury suburbs, known for its grand estates, excellent schools, and proximity to Washington, D.C. The town has long been home to high-level executives and political figures, which has helped keep its real estate market competitive even in times of economic uncertainty.
While it took some time for major price increases to arrive, the recent surge in values reflects ongoing demand for upscale, low-density housing with quick access to the capital. Limited inventory and its entrenched reputation for wealth continue to make Potomac a top-tier housing market in the state.
2. Chevy Chase View – 64% Home Price Increase Since 2010
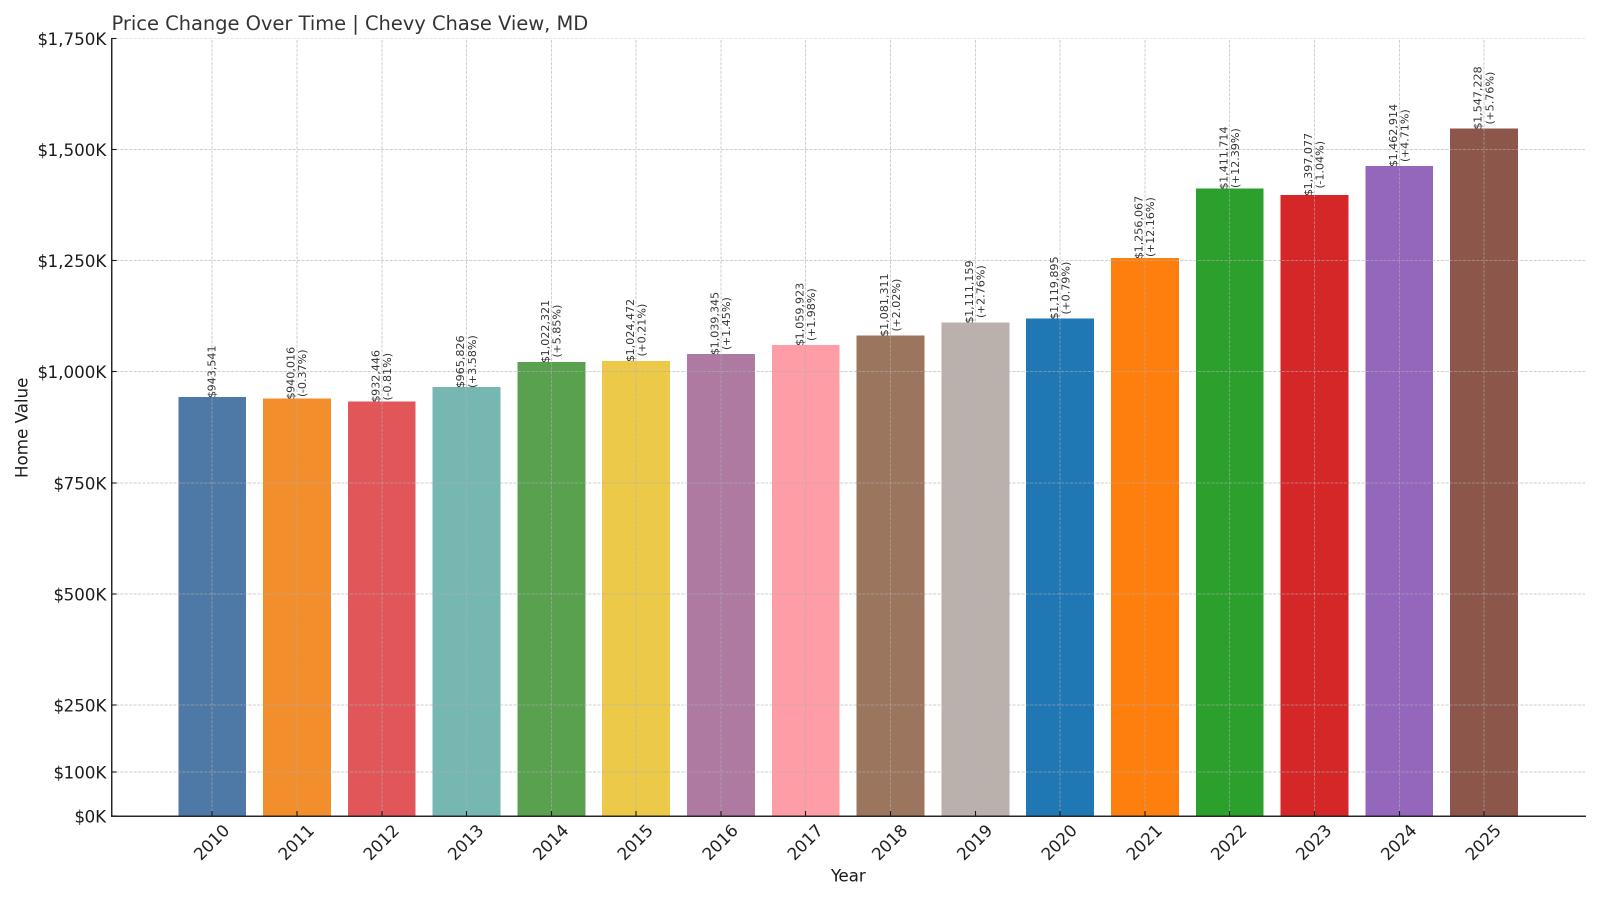
- 2010: $943,541
- 2011: $940,016 (-$3,525, -0.37% from previous year)
- 2012: $932,446 (-$7,570, -0.81% from previous year)
- 2013: $965,826 (+$33,380, +3.58% from previous year)
- 2014: $1,022,321 (+$56,495, +5.85% from previous year)
- 2015: $1,024,472 (+$2,151, +0.21% from previous year)
- 2016: $1,039,345 (+$14,873, +1.45% from previous year)
- 2017: $1,059,923 (+$20,578, +1.98% from previous year)
- 2018: $1,081,311 (+$21,388, +2.02% from previous year)
- 2019: $1,111,159 (+$29,848, +2.76% from previous year)
- 2020: $1,119,895 (+$8,736, +0.79% from previous year)
- 2021: $1,256,067 (+$136,172, +12.16% from previous year)
- 2022: $1,411,714 (+$155,647, +12.39% from previous year)
- 2023: $1,397,077 (-$14,637, -1.04% from previous year)
- 2024: $1,462,914 (+$65,837, +4.71% from previous year)
- 2025: $1,547,228 (+$84,314, +5.76% from previous year)
Chevy Chase View’s home prices have climbed by more than $600,000 since 2010, marking a 64% increase. After steady growth throughout the 2010s, values began rising more aggressively in the 2020s, including a 12% jump in both 2021 and 2022. By 2025, the average home here is worth more than $1.54 million.
Chevy Chase View – Quiet, Affluent, and Always in Demand

Chevy Chase View is a residential enclave within Montgomery County that blends quiet suburban living with high-end housing stock. While less widely known than nearby Chevy Chase Village, it boasts large homes, mature trees, and close proximity to amenities, schools, and transit.
This low-profile prestige makes it especially attractive to buyers seeking luxury without the noise of trendier zip codes. Tight supply and strong desirability have steadily pushed prices higher, and the market shows little sign of slowing.
1. Gibson Island – 78% Home Price Increase Since 2010
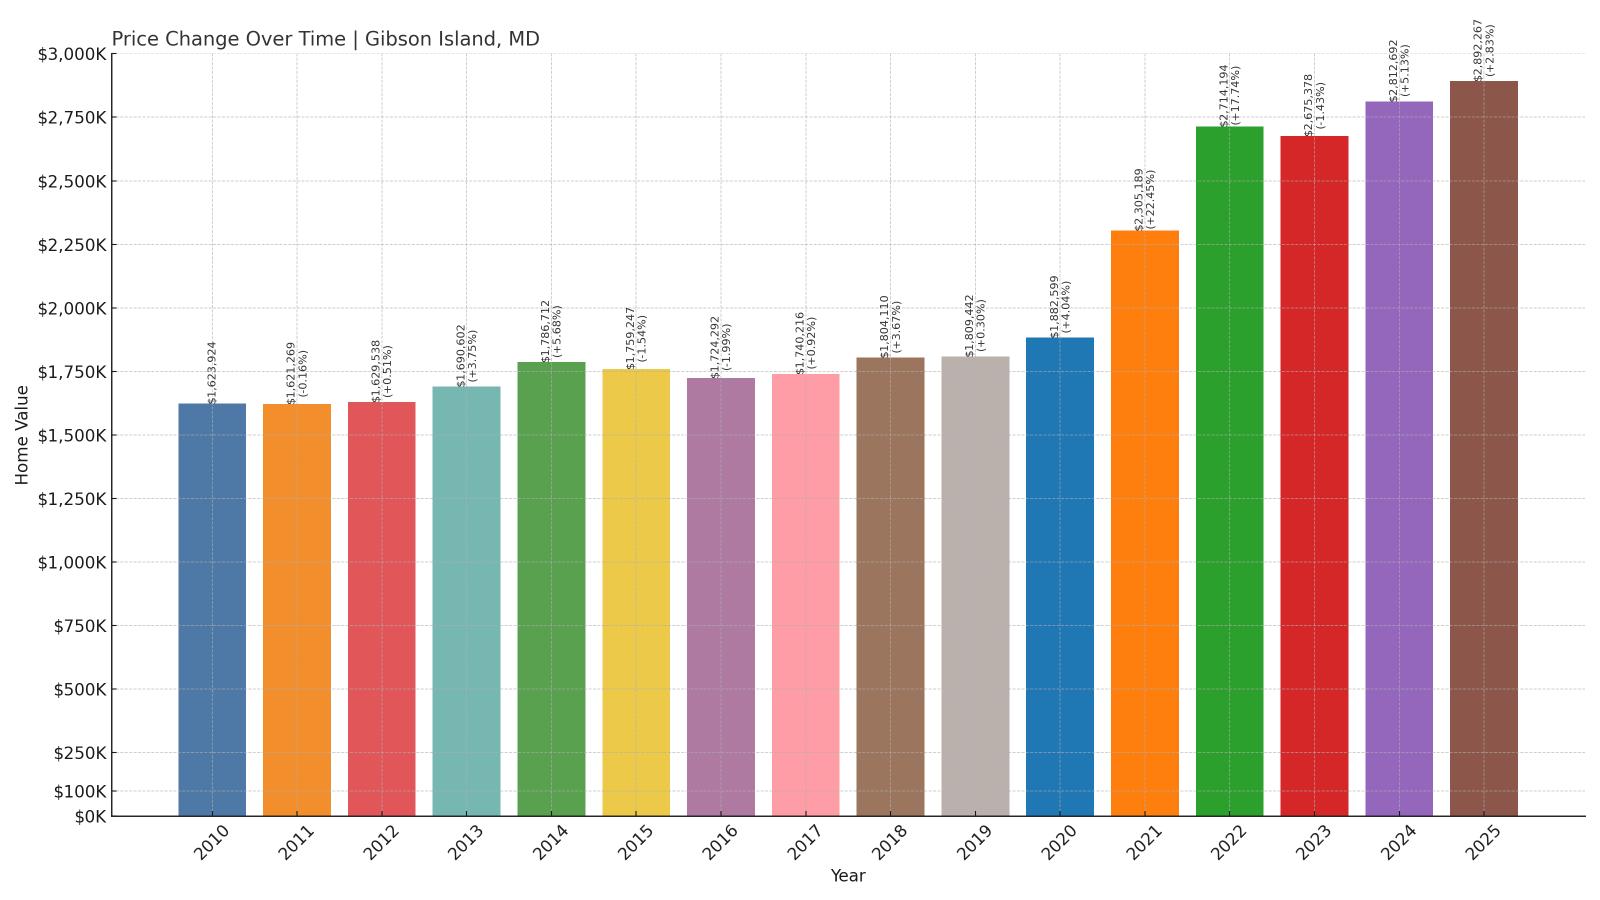
- 2010: $1,623,924
- 2011: $1,621,269 (-$2,655, -0.16% from previous year)
- 2012: $1,629,538 (+$8,269, +0.51% from previous year)
- 2013: $1,690,602 (+$61,064, +3.75% from previous year)
- 2014: $1,786,712 (+$96,110, +5.68% from previous year)
- 2015: $1,759,247 (-$27,465, -1.54% from previous year)
- 2016: $1,724,292 (-$34,955, -1.99% from previous year)
- 2017: $1,740,216 (+$15,924, +0.92% from previous year)
- 2018: $1,804,110 (+$63,894, +3.67% from previous year)
- 2019: $1,809,442 (+$5,332, +0.30% from previous year)
- 2020: $1,882,599 (+$73,157, +4.04% from previous year)
- 2021: $2,305,189 (+$422,590, +22.45% from previous year)
- 2022: $2,714,194 (+$409,005, +17.74% from previous year)
- 2023: $2,675,378 (-$38,816, -1.43% from previous year)
- 2024: $2,812,692 (+$137,314, +5.13% from previous year)
- 2025: $2,892,267 (+$79,575, +2.83% from previous year)
Gibson Island has seen home prices rise by more than $1.26 million since 2010—an extraordinary 78% gain. Values climbed steadily through the 2010s, then exploded between 2020 and 2022, when prices jumped by more than $800,000 in just two years. With values nearing $2.9 million, it’s now the most expensive housing market in Maryland.
Gibson Island – Maryland’s Most Exclusive Address

Gibson Island is a private, gated community located on the western shore of the Chesapeake Bay. With limited public access and just a few hundred homes, it’s more like a private club than a typical town. Residents enjoy stunning waterfront views, a yacht club, golf course, and unmatched seclusion.
The extreme exclusivity of the island—paired with its natural beauty and elite amenities—has made it a magnet for ultra-high-net-worth buyers. Its real estate market has little competition, and that scarcity keeps prices at the top of the Maryland market year after year.


