
🔥 Would you like to save this?
The Zillow Home Value Index shows a clear trend in Louisiana—home prices have surged in certain towns, especially as 2025 rolls in. From lakeside getaways to polished suburbs with city perks, these 18 places now sit at the top of the state’s housing market.
Each town on this list has climbed the ranks through a mix of demand, location, and limited inventory. Whether it’s Baton Rouge-adjacent zip codes or quiet, upscale retreats, these are Louisiana’s most expensive places to buy a home right now—backed by years of rising values and solid local appeal.
In order to come up with the very specific design ideas, we create most designs with the assistance of state-of-the-art AI interior design software. Also, assume links that take you off the site are affiliate links such as links to Amazon. this means we may earn a commission if you buy something.
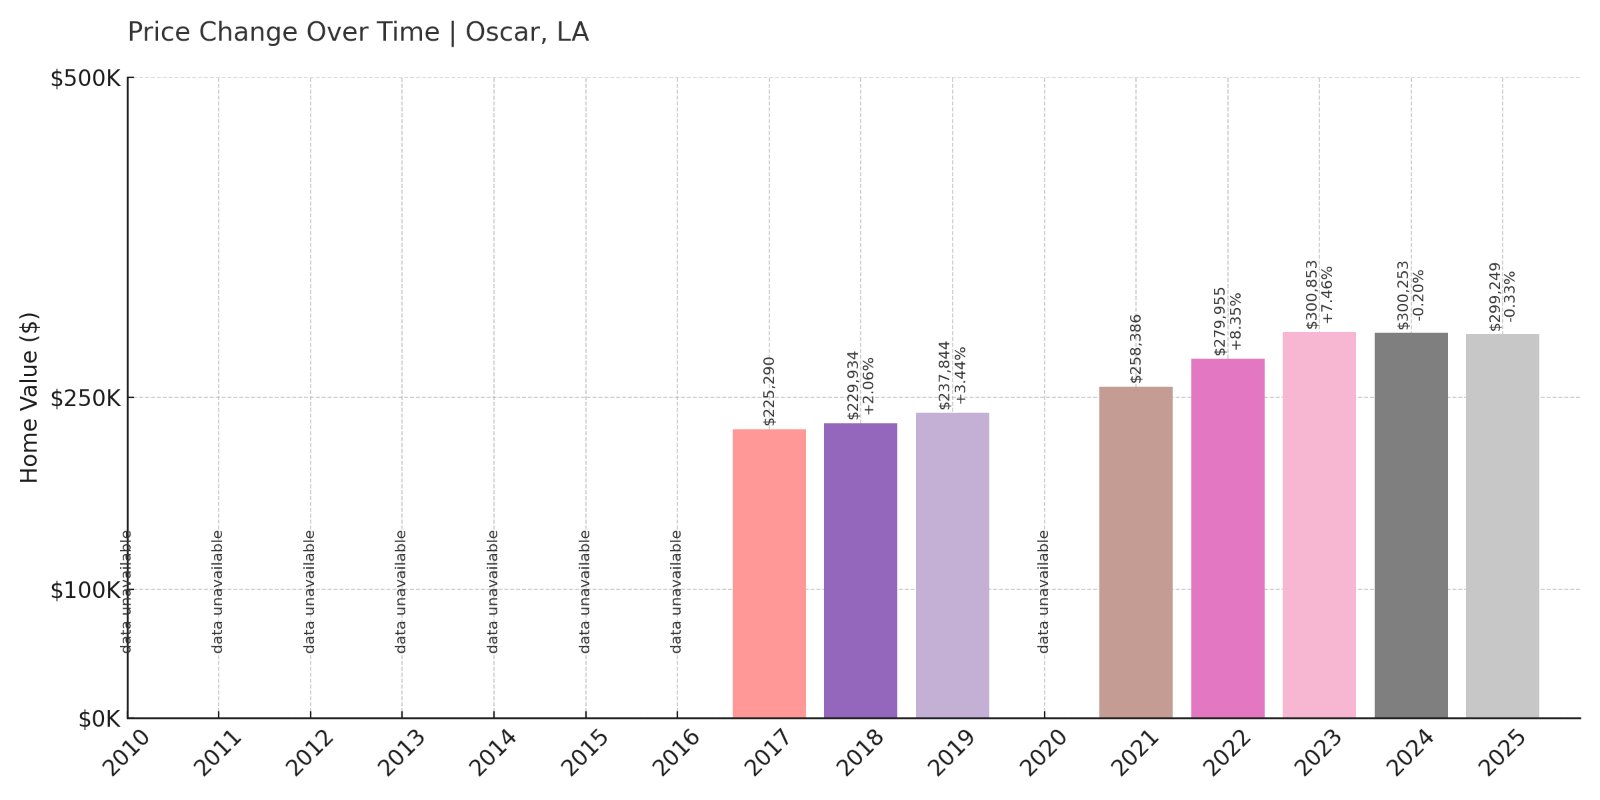
18. Oscar – 32.84% Home Price Increase Since 2017
- 2010: N/A
- 2011: N/A
- 2012: N/A
- 2013: N/A
- 2014: N/A
- 2015: N/A
- 2016: N/A
- 2017: $225,290
- 2018: $229,934 (+$4,644, +2.06% from previous year)
- 2019: $237,844 (+$7,910, +3.44% from previous year)
- 2020: N/A
- 2021: $258,386
- 2022: $279,955 (+$21,569, +8.35% from previous year)
- 2023: $300,853 (+$20,898, +7.46% from previous year)
- 2024: $300,253 (-$600, -0.20% from previous year)
- 2025: $299,249 (-$1,004, -0.33% from previous year)
Oscar’s home values have grown by nearly 33% since 2017, even with small setbacks in the last two years. The bulk of that growth occurred between 2021 and 2023, when prices surged by over $40,000. Despite the missing 2020 data, the trend is clear: Oscar is gaining attention among homebuyers.
Oscar – Modest Growth, Big Gains
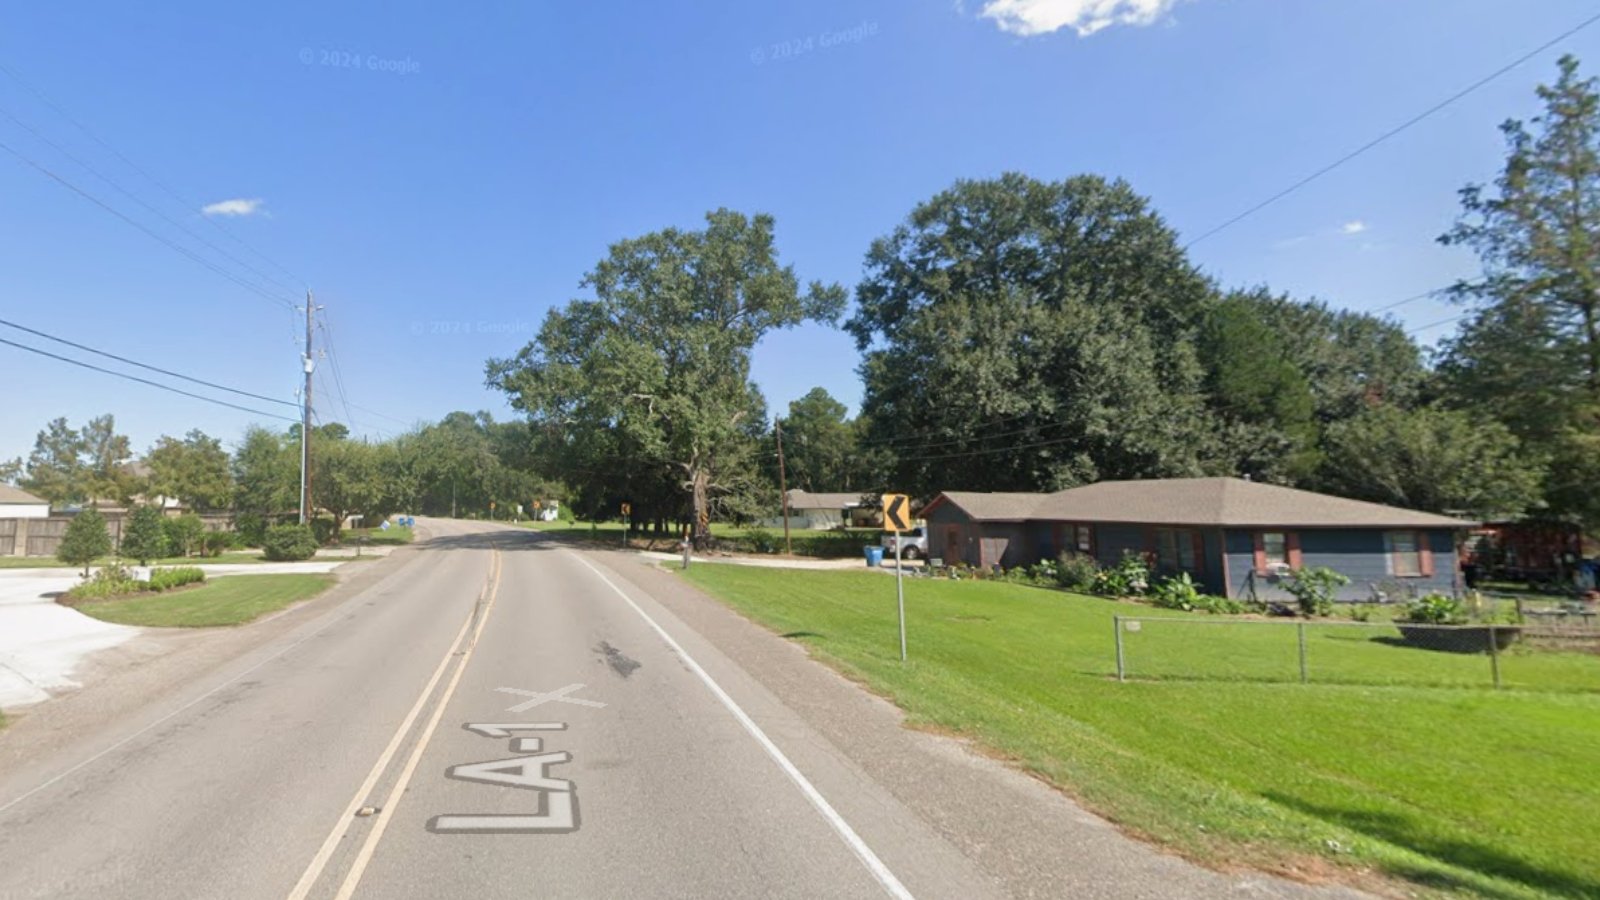
Oscar is a quiet lakeside community in Pointe Coupee Parish, nestled along the False River. Known for its scenic views and recreational fishing, this area appeals to retirees and second-home seekers who want a rural setting with water access. Though unincorporated, Oscar’s limited housing supply has contributed to rising property values.
With its proximity to Baton Rouge—about 30 minutes away—Oscar offers a balance of seclusion and convenience. Homes along the riverfront tend to command higher prices, and the growing interest in recreational living has helped sustain its steady market appreciation, even as other towns saw cooling trends in 2024 and 2025.
17. Folsom – 44.09% Home Price Increase Since 2012
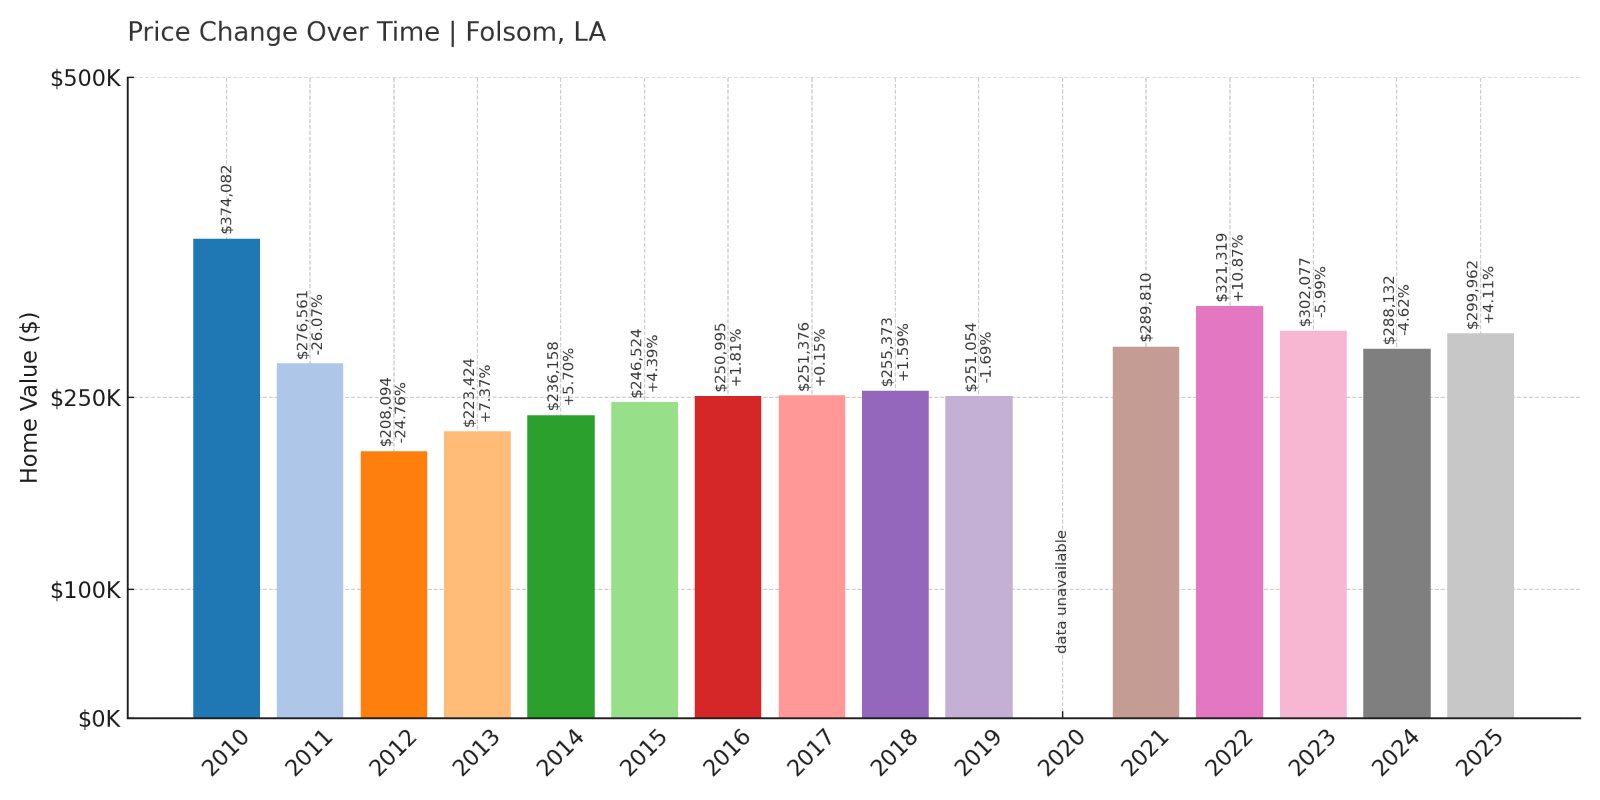
- 2010: $374,082
- 2011: $276,561 (-$97,521, -26.07% from previous year)
- 2012: $208,094 (-$68,467, -24.76% from previous year)
- 2013: $223,424 (+$15,330, +7.37% from previous year)
- 2014: $236,158 (+$12,734, +5.70% from previous year)
- 2015: $246,524 (+$10,366, +4.39% from previous year)
- 2016: $250,995 (+$4,470, +1.81% from previous year)
- 2017: $251,376 (+$382, +0.15% from previous year)
- 2018: $255,373 (+$3,997, +1.59% from previous year)
- 2019: $251,054 (-$4,319, -1.69% from previous year)
- 2020: N/A
- 2021: $289,810
- 2022: $321,319 (+$31,509, +10.87% from previous year)
- 2023: $302,077 (-$19,242, -5.99% from previous year)
- 2024: $288,132 (-$13,945, -4.62% from previous year)
- 2025: $299,962 (+$11,830, +4.11% from previous year)
Folsom’s home values have grown over 44% since bottoming out in 2012. After severe losses in the early 2010s, the market found its footing. While recent years brought some fluctuation, the long-term recovery trajectory is strong.
Folsom – Country Charm With Market Momentum
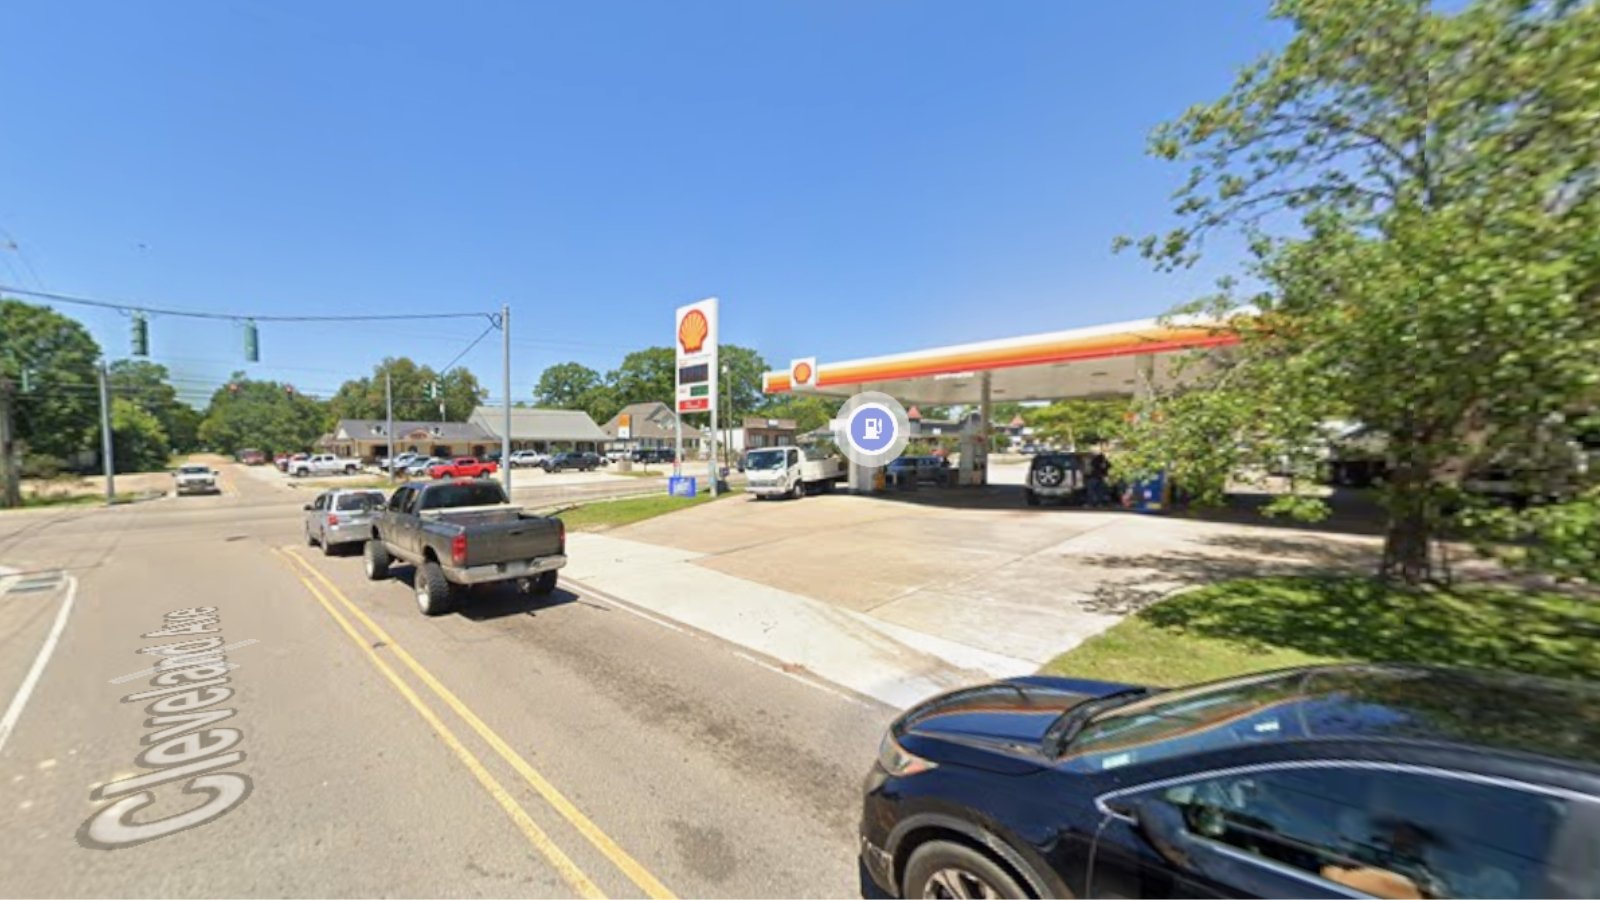
Located north of Covington, Folsom is known for its rolling countryside, equestrian culture, and large residential lots. It offers a slower pace of life, attracting buyers who want land, privacy, and small-town living within driving distance of the Northshore’s economic centers.
The pandemic-era boom helped prices spike, with a sharp increase in 2022. While values dipped slightly in the following two years, 2025 shows renewed upward movement. Demand for semi-rural living combined with limited development has likely kept home prices above pre-pandemic levels.
16. Harahan – 22.46% Home Price Increase Since 2012
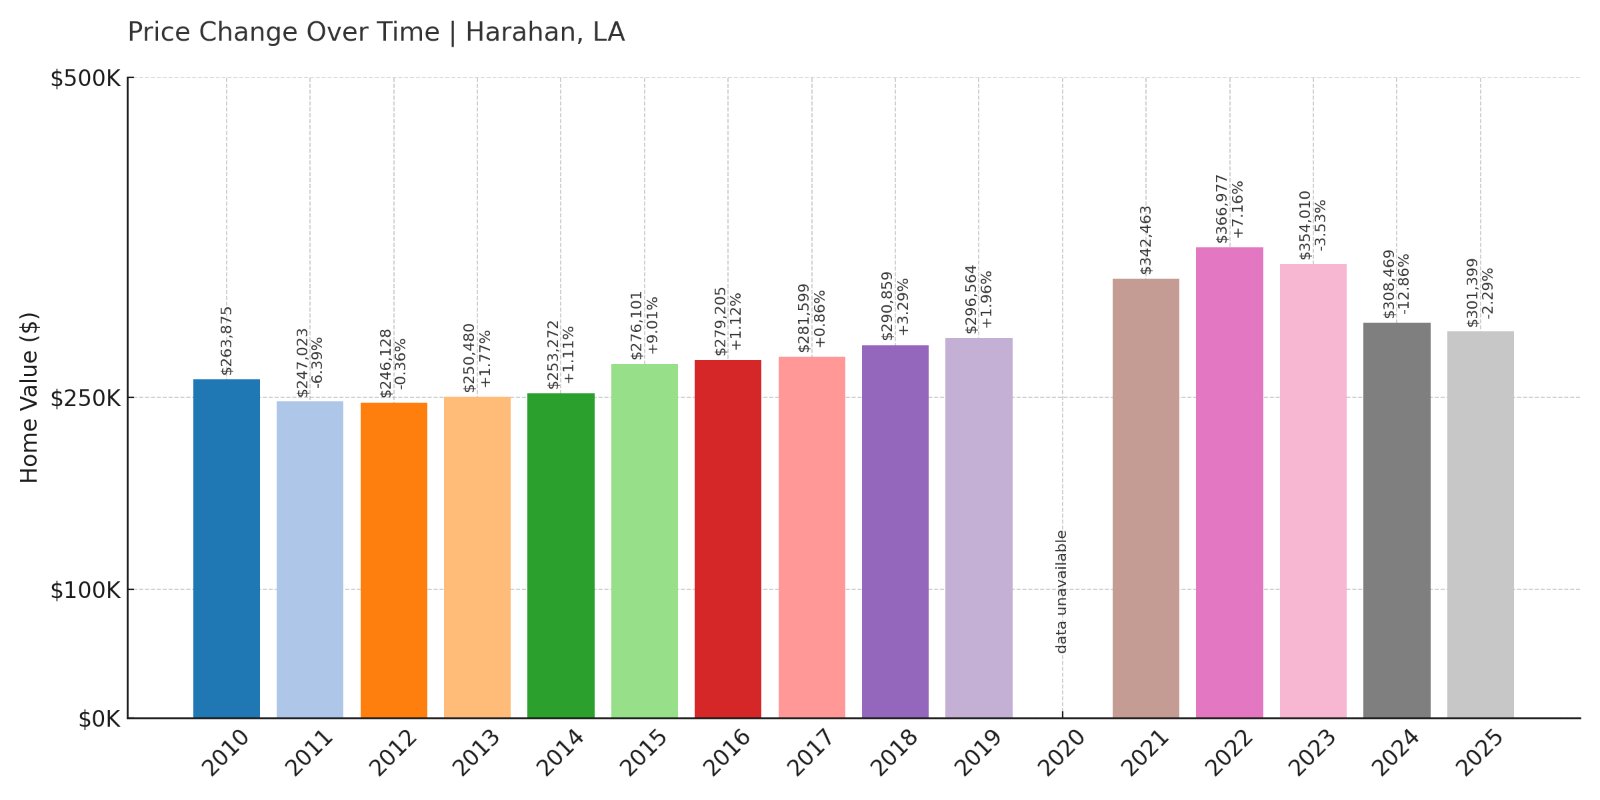
- 2010: $263,875
- 2011: $247,023 (-$16,852, -6.39% from previous year)
- 2012: $246,128 (-$895, -0.36% from previous year)
- 2013: $250,480 (+$4,352, +1.77% from previous year)
- 2014: $253,272 (+$2,792, +1.11% from previous year)
- 2015: $276,101 (+$22,829, +9.01% from previous year)
- 2016: $279,205 (+$3,105, +1.12% from previous year)
- 2017: $281,599 (+$2,394, +0.86% from previous year)
- 2018: $290,859 (+$9,260, +3.29% from previous year)
- 2019: $296,564 (+$5,705, +1.96% from previous year)
- 2020: N/A
- 2021: $342,463
- 2022: $366,977 (+$24,514, +7.16% from previous year)
- 2023: $354,010 (-$12,967, -3.53% from previous year)
- 2024: $308,469 (-$45,541, -12.86% from previous year)
- 2025: $301,399 (-$7,070, -2.29% from previous year)
Since 2012, home values in Harahan have climbed more than 22%. A surge from 2020 to 2022 pushed prices to their peak, before a notable correction in the following two years. Still, the town remains among the most expensive in Louisiana for 2025.
Harahan – Suburban Stability in Jefferson Parish
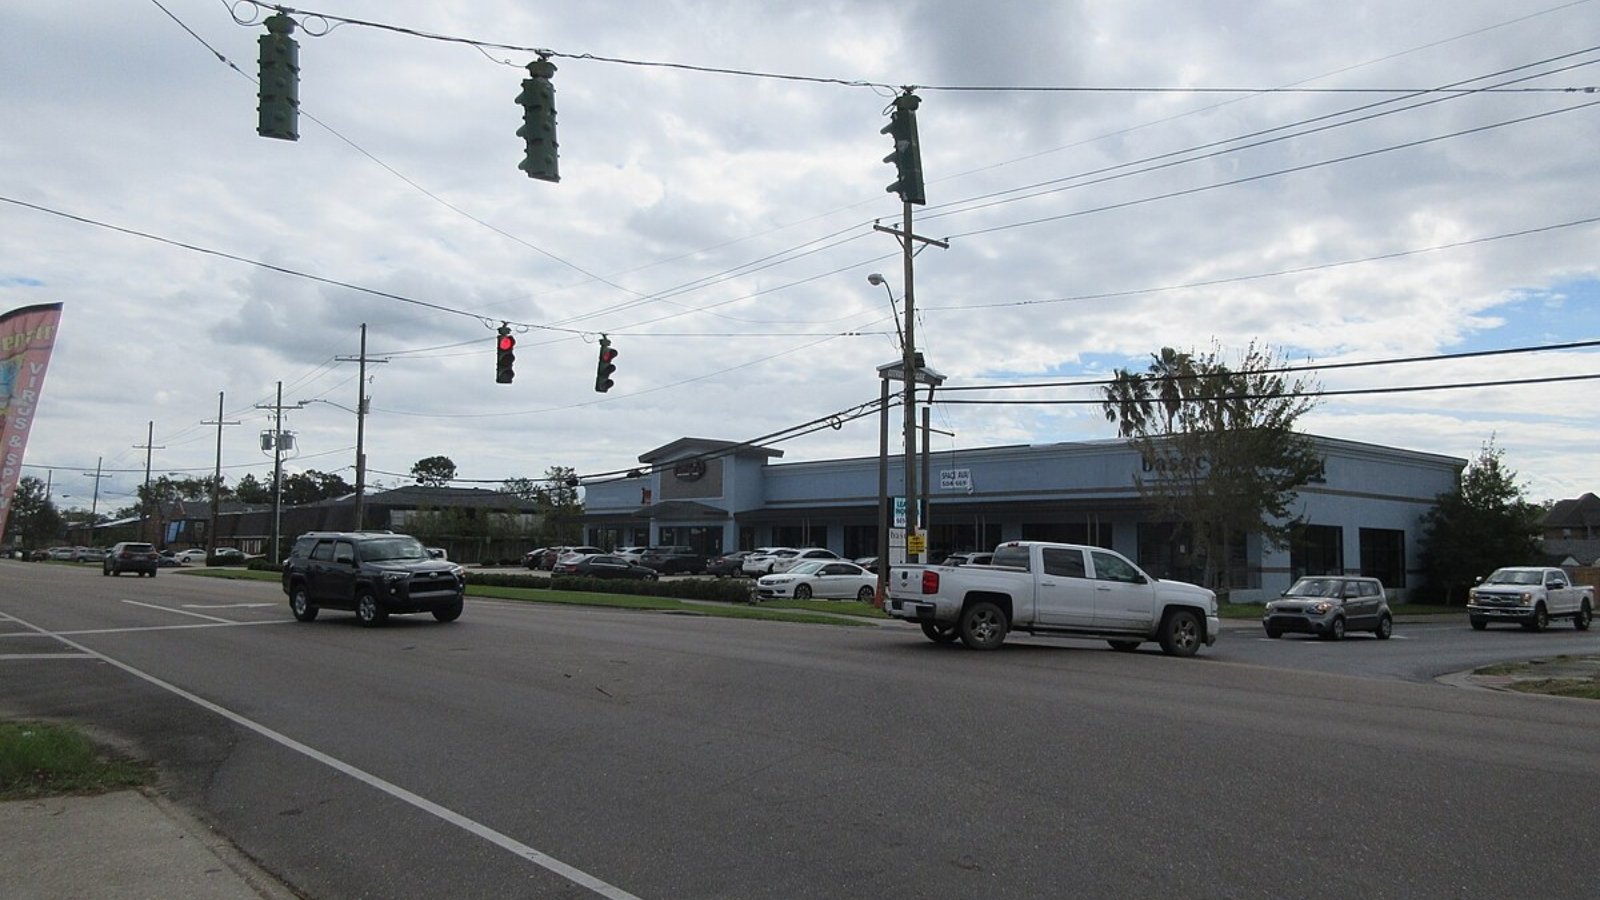
Harahan is a close-knit suburb just west of New Orleans, nestled along the Mississippi River. With easy access to downtown, Elmwood, and Metairie, it has long appealed to families and commuters. The housing stock ranges from modest ranch homes to larger post-war builds with sizable lots.
The town’s popularity surged during the housing boom of the early 2020s, thanks to its strong location and school access. While prices have cooled since the 2022 high, the 2025 value still represents long-term strength compared to its early-decade levels.
15. Sorrento – 62.38% Home Price Increase Since 2012
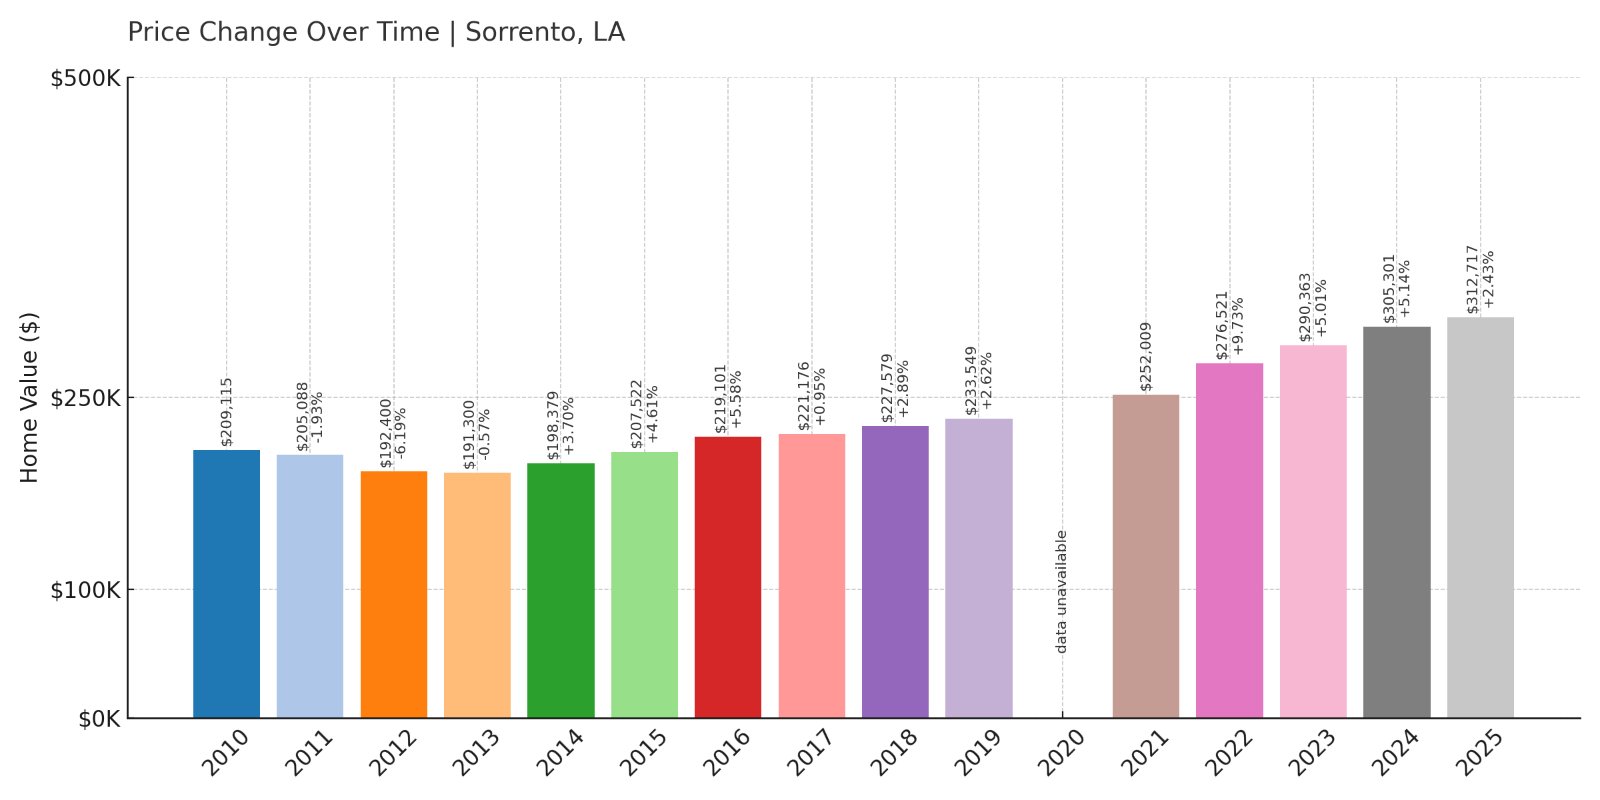
- 2010: $209,115
- 2011: $205,088 (-$4,027, -1.93% from previous year)
- 2012: $192,400 (-$12,688, -6.19% from previous year)
- 2013: $191,300 (-$1,100, -0.57% from previous year)
- 2014: $198,379 (+$7,079, +3.70% from previous year)
- 2015: $207,522 (+$9,143, +4.61% from previous year)
- 2016: $219,101 (+$11,579, +5.58% from previous year)
- 2017: $221,176 (+$2,075, +0.95% from previous year)
- 2018: $227,579 (+$6,403, +2.90% from previous year)
- 2019: $233,549 (+$5,970, +2.62% from previous year)
- 2020: N/A
- 2021: $252,009
- 2022: $276,521 (+$24,512, +9.73% from previous year)
- 2023: $290,363 (+$13,843, +5.01% from previous year)
- 2024: $305,301 (+$14,937, +5.14% from previous year)
- 2025: $312,717 (+$7,416, +2.43% from previous year)
Sorrento’s home prices have risen over 62% since 2012, driven by consistent year-over-year increases and a pandemic-era boost. Notably, prices grew every year from 2013 through 2025 (except the missing 2020), showing strong and steady market confidence.
Sorrento – Steady Growth at the Crossroads
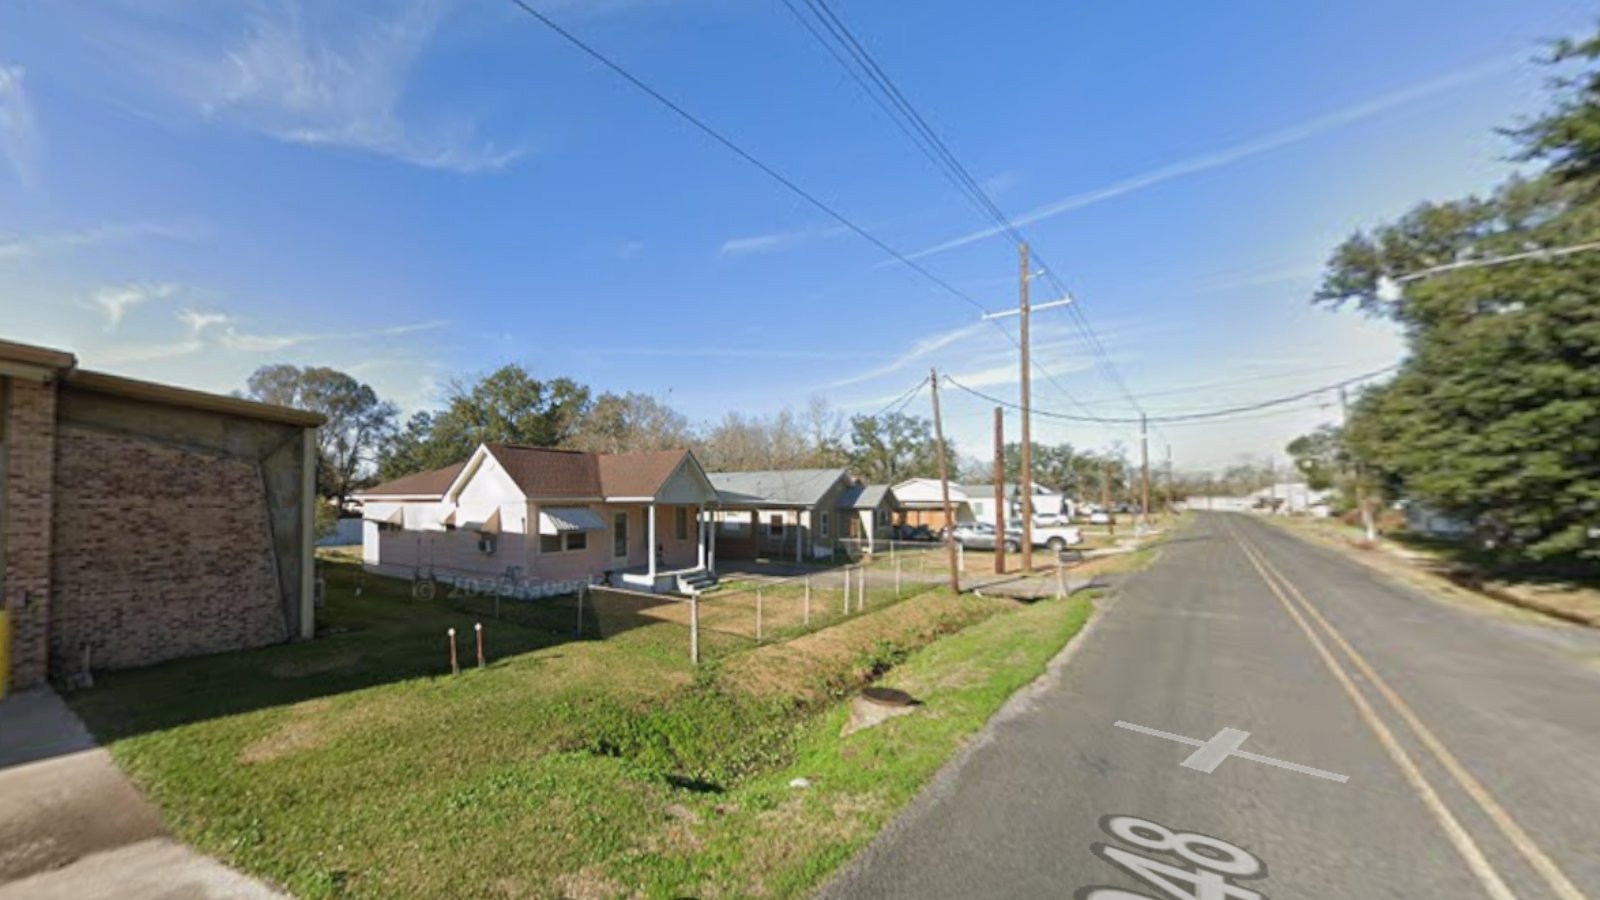
Positioned between Baton Rouge and Gonzales, Sorrento is a convenient hub for commuters along I-10. Its location has made it increasingly attractive to those priced out of larger cities. The town offers small-town quiet with access to larger job markets.
With new development and improved infrastructure, demand has remained high. The upward trajectory in recent years—especially during and after 2021—suggests ongoing appeal, possibly tied to its balance of affordability and location within Ascension Parish.
14. Covington – 51.32% Home Price Increase Since 2012

- 2010: $230,077
- 2011: $228,545 (-$1,532, -0.67% from previous year)
- 2012: $214,625 (-$13,919, -6.09% from previous year)
- 2013: $225,668 (+$11,043, +5.15% from previous year)
- 2014: $234,338 (+$8,670, +3.84% from previous year)
- 2015: $244,008 (+$9,670, +4.13% from previous year)
- 2016: $251,703 (+$7,695, +3.15% from previous year)
- 2017: $257,170 (+$5,467, +2.17% from previous year)
- 2018: $263,873 (+$6,703, +2.61% from previous year)
- 2019: $259,828 (-$4,045, -1.53% from previous year)
- 2020: N/A
- 2021: $288,224
- 2022: $330,444 (+$42,220, +14.65% from previous year)
- 2023: $322,391 (-$8,053, -2.44% from previous year)
- 2024: $321,071 (-$1,320, -0.41% from previous year)
- 2025: $324,685 (+$3,614, +1.13% from previous year)
Covington has seen home values rise by more than 51% since 2012. Following a dip that year, the market rebounded strongly, with particularly steep gains between 2021 and 2022. Prices have steadied in the last few years but remain near their peak.
Covington – Historic Charm Meets Suburban Appeal
Covington, on the north shore of Lake Pontchartrain, blends historic downtown charm with modern suburban amenities. As the seat of St. Tammany Parish, it’s a hub for commerce, healthcare, and education in the region. Its walkable core and arts scene add to its broad appeal.
Home prices took off after the COVID-era housing surge, when many buyers sought more space outside of New Orleans. Covington’s mix of historic cottages, newer subdivisions, and top-rated schools has helped maintain demand—and prices—even as the broader market cooled slightly after 2022.
13. Woodworth – 67.54% Home Price Increase Since 2012
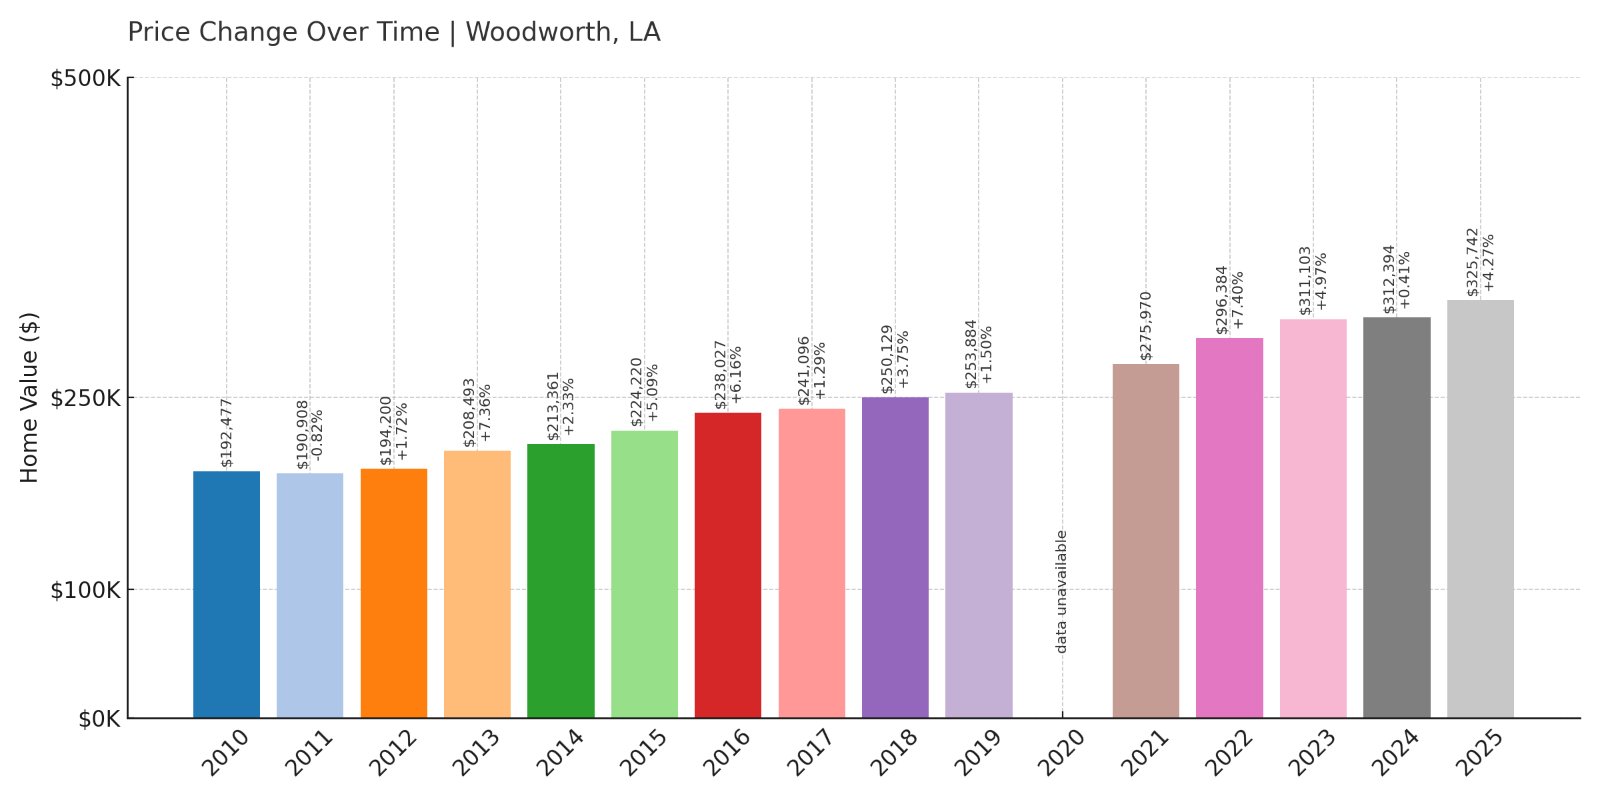
- 2010: $192,477
- 2011: $190,908 (-$1,568, -0.81% from previous year)
- 2012: $194,200 (+$3,292, +1.72% from previous year)
- 2013: $208,493 (+$14,293, +7.36% from previous year)
- 2014: $213,361 (+$4,868, +2.33% from previous year)
- 2015: $224,220 (+$10,859, +5.09% from previous year)
- 2016: $238,027 (+$13,807, +6.16% from previous year)
- 2017: $241,096 (+$3,069, +1.29% from previous year)
- 2018: $250,129 (+$9,033, +3.75% from previous year)
- 2019: $253,884 (+$3,754, +1.50% from previous year)
- 2020: N/A
- 2021: $275,970
- 2022: $296,384 (+$20,413, +7.40% from previous year)
- 2023: $311,103 (+$14,720, +4.97% from previous year)
- 2024: $312,394 (+$1,290, +0.41% from previous year)
- 2025: $325,742 (+$13,349, +4.27% from previous year)
Woodworth’s home prices have climbed nearly 68% since 2012, with a notable surge between 2021 and 2025. The town has posted year-over-year gains consistently, showing one of the most stable upward trends in this list.
Woodworth – Consistent Growth in Central Louisiana
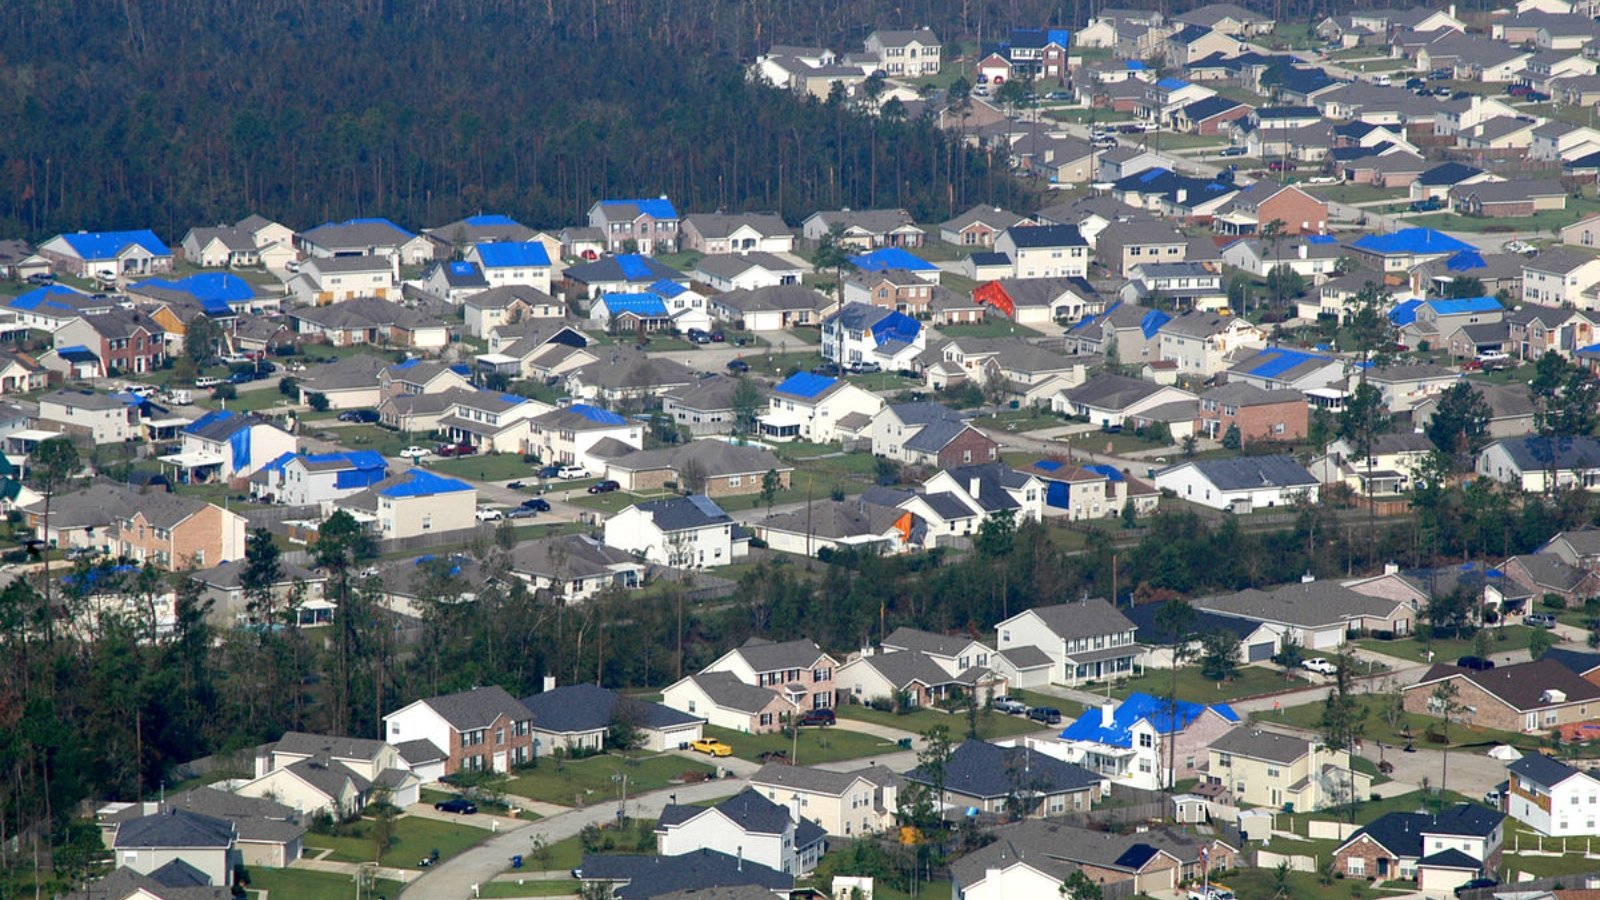
Located just south of Alexandria, Woodworth is a small town known for its residential developments, forested surroundings, and access to Kisatchie National Forest. While it’s not a large commercial center, its quality of life and access to nature have attracted long-term homeowners and retirees.
The strong and steady rise in home values here is likely driven by the limited inventory and growing demand from people moving away from city congestion. With strong upward momentum even into 2025, Woodworth stands out for consistency in a market full of peaks and troughs.
12. River Ridge – 20.32% Home Price Increase Since 2012

🔥 Would you like to save this?
- 2010: $289,835
- 2011: $279,308 (-$10,527, -3.63% from previous year)
- 2012: $276,324 (-$2,984, -1.07% from previous year)
- 2013: $278,629 (+$2,305, +0.83% from previous year)
- 2014: $279,380 (+$751, +0.27% from previous year)
- 2015: $301,521 (+$22,141, +7.93% from previous year)
- 2016: $313,697 (+$12,176, +4.04% from previous year)
- 2017: $316,505 (+$2,808, +0.90% from previous year)
- 2018: $322,729 (+$6,223, +1.97% from previous year)
- 2019: $331,045 (+$8,316, +2.58% from previous year)
- 2020: N/A
- 2021: $364,702
- 2022: $393,136 (+$28,433, +7.80% from previous year)
- 2023: $390,239 (-$2,897, -0.74% from previous year)
- 2024: $335,097 (-$55,142, -14.13% from previous year)
- 2025: $332,526 (-$2,572, -0.77% from previous year)
Home values in River Ridge are up 20.32% since 2012, despite a significant drop in 2024. The gains made between 2012 and 2022 were substantial, peaking in 2022 before sliding back in the years following.
River Ridge – Strong Roots, Recent Cooling
River Ridge sits between Harahan and Kenner in Jefferson Parish, offering suburban comfort with quick access to New Orleans. It’s a sought-after residential area known for solid schools, mature oak trees, and walkable streets.
The sharp rise in values leading into 2022 reflects the pandemic-era housing boom. Since then, cooling prices may reflect buyer hesitation or affordability limits after rapid growth. Still, with a 2025 median home value above $330,000, River Ridge remains a top-dollar ZIP in Louisiana.
11. Prairieville – 57.12% Home Price Increase Since 2012

- 2010: $230,186
- 2011: $225,689 (-$4,497, -1.95% from previous year)
- 2012: $211,881 (-$13,808, -6.12% from previous year)
- 2013: $214,583 (+$2,702, +1.28% from previous year)
- 2014: $223,735 (+$9,152, +4.26% from previous year)
- 2015: $233,651 (+$9,917, +4.43% from previous year)
- 2016: $240,099 (+$6,448, +2.76% from previous year)
- 2017: $239,171 (-$929, -0.39% from previous year)
- 2018: $243,889 (+$4,719, +1.97% from previous year)
- 2019: $242,798 (-$1,091, -0.45% from previous year)
- 2020: N/A
- 2021: $260,781
- 2022: $286,710 (+$25,929, +9.94% from previous year)
- 2023: $304,414 (+$17,704, +6.18% from previous year)
- 2024: $323,943 (+$19,529, +6.42% from previous year)
- 2025: $333,147 (+$9,203, +2.84% from previous year)
Prairieville has seen home prices rise by more than 57% since 2012, with particularly fast growth from 2021 onward. The pace of appreciation has accelerated recently, positioning it as one of the top-performing housing markets in Ascension Parish.
Prairieville – A Fast-Rising Suburban Favorite
Prairieville is one of the fastest-growing suburbs outside Baton Rouge, popular with families seeking top-rated schools and larger homes. Its proximity to major highways and shopping centers adds to the convenience without sacrificing community feel.
The town’s consistent growth reflects both new development and strong local demand. As more buyers relocate from Baton Rouge and New Orleans, Prairieville continues to attract attention—and higher home prices—with no signs of slowing.
10. Benton – 50.26% Home Price Increase Since 2012
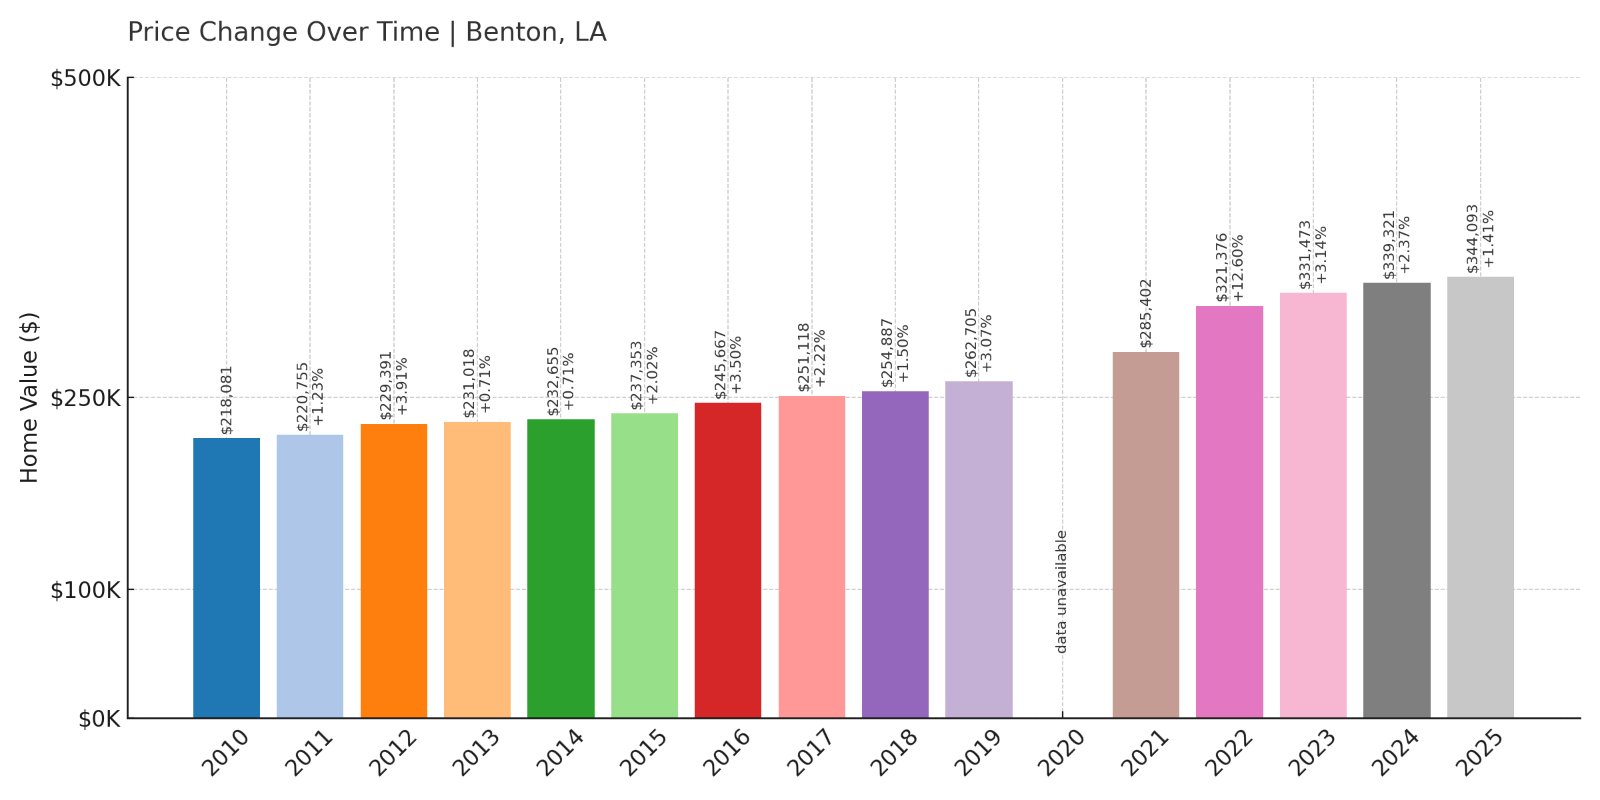
- 2010: $218,081
- 2011: $220,755 (+$2,674, +1.23% from previous year)
- 2012: $229,391 (+$8,635, +3.91% from previous year)
- 2013: $231,018 (+$1,628, +0.71% from previous year)
- 2014: $232,655 (+$1,636, +0.71% from previous year)
- 2015: $237,353 (+$4,698, +2.02% from previous year)
- 2016: $245,667 (+$8,314, +3.50% from previous year)
- 2017: $251,118 (+$5,451, +2.22% from previous year)
- 2018: $254,887 (+$3,769, +1.50% from previous year)
- 2019: $262,705 (+$7,818, +3.07% from previous year)
- 2020: N/A
- 2021: $285,402
- 2022: $321,376 (+$35,974, +12.60% from previous year)
- 2023: $331,473 (+$10,097, +3.14% from previous year)
- 2024: $339,321 (+$7,848, +2.37% from previous year)
- 2025: $344,093 (+$4,772, +1.41% from previous year)
Home values in Benton have increased by just over 50% since 2012, with steady growth throughout the past decade. The strongest spike occurred between 2021 and 2022, when prices rose by more than 12% in a single year. Since then, growth has remained positive and moderate.
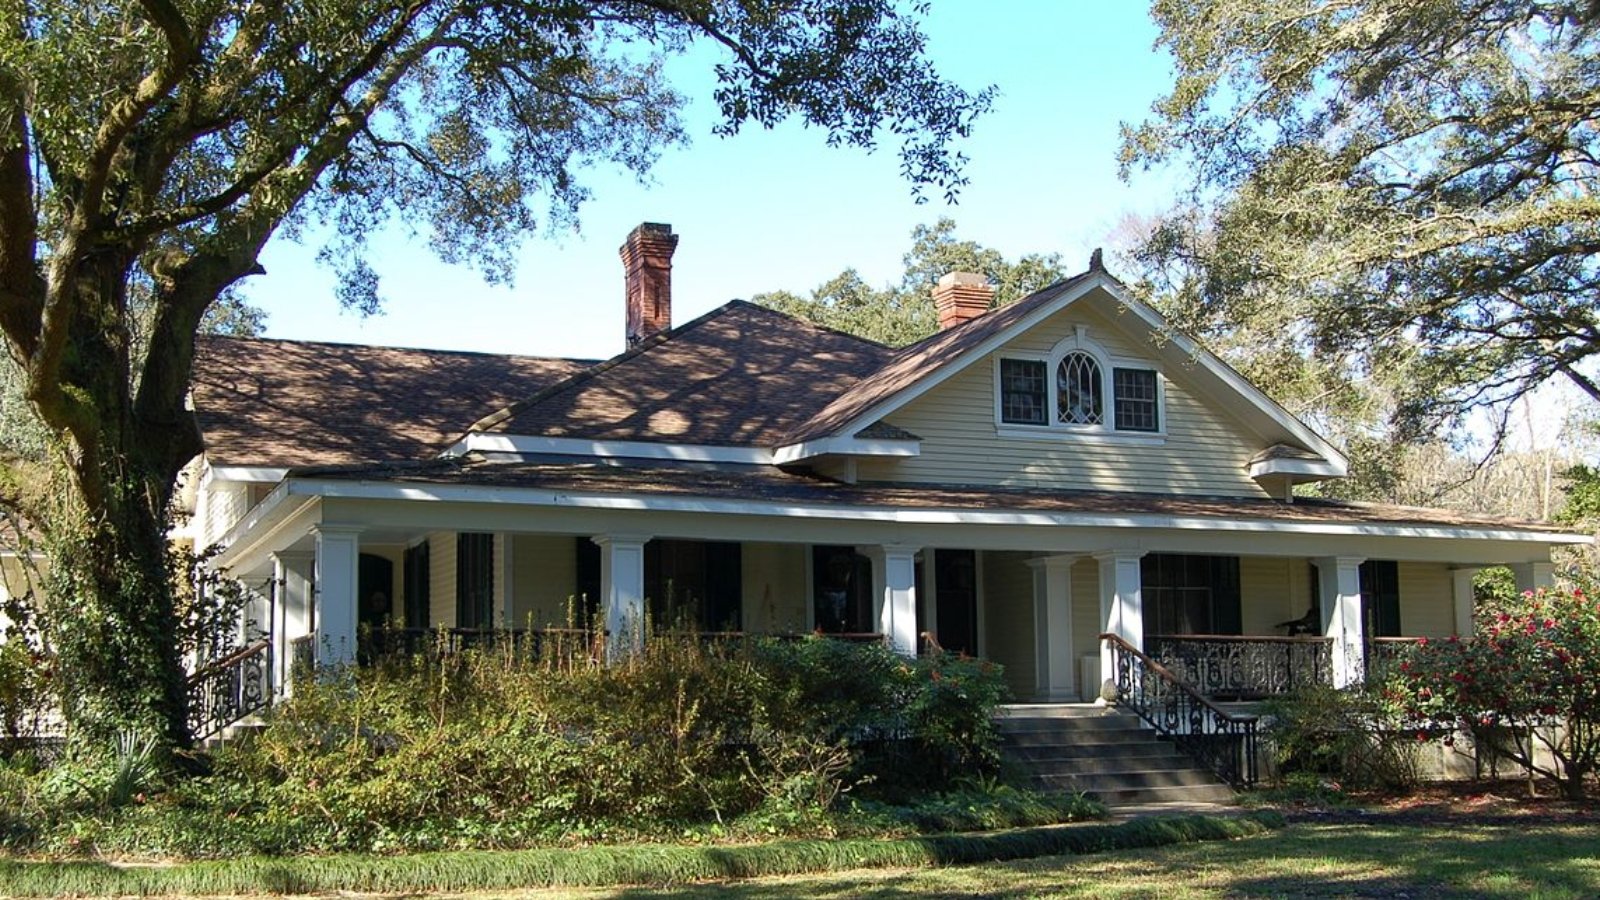
Benton – Suburban Growth Anchored by Schools
Benton is a well-established community in Bossier Parish, north of Shreveport. Known for its top-rated schools and quiet, suburban layout, Benton has become one of the more desirable places for families in northwest Louisiana. Its mix of new construction and older homes offers a range of price points—though even the entry-level has risen notably.
Its proximity to Barksdale Air Force Base and expanding infrastructure has attracted steady buyer interest. The 2025 numbers show that Benton’s market remains on solid footing, with affordability and quality of life continuing to draw in demand.
9. Eden Isle – 49.60% Home Price Increase Since 2012
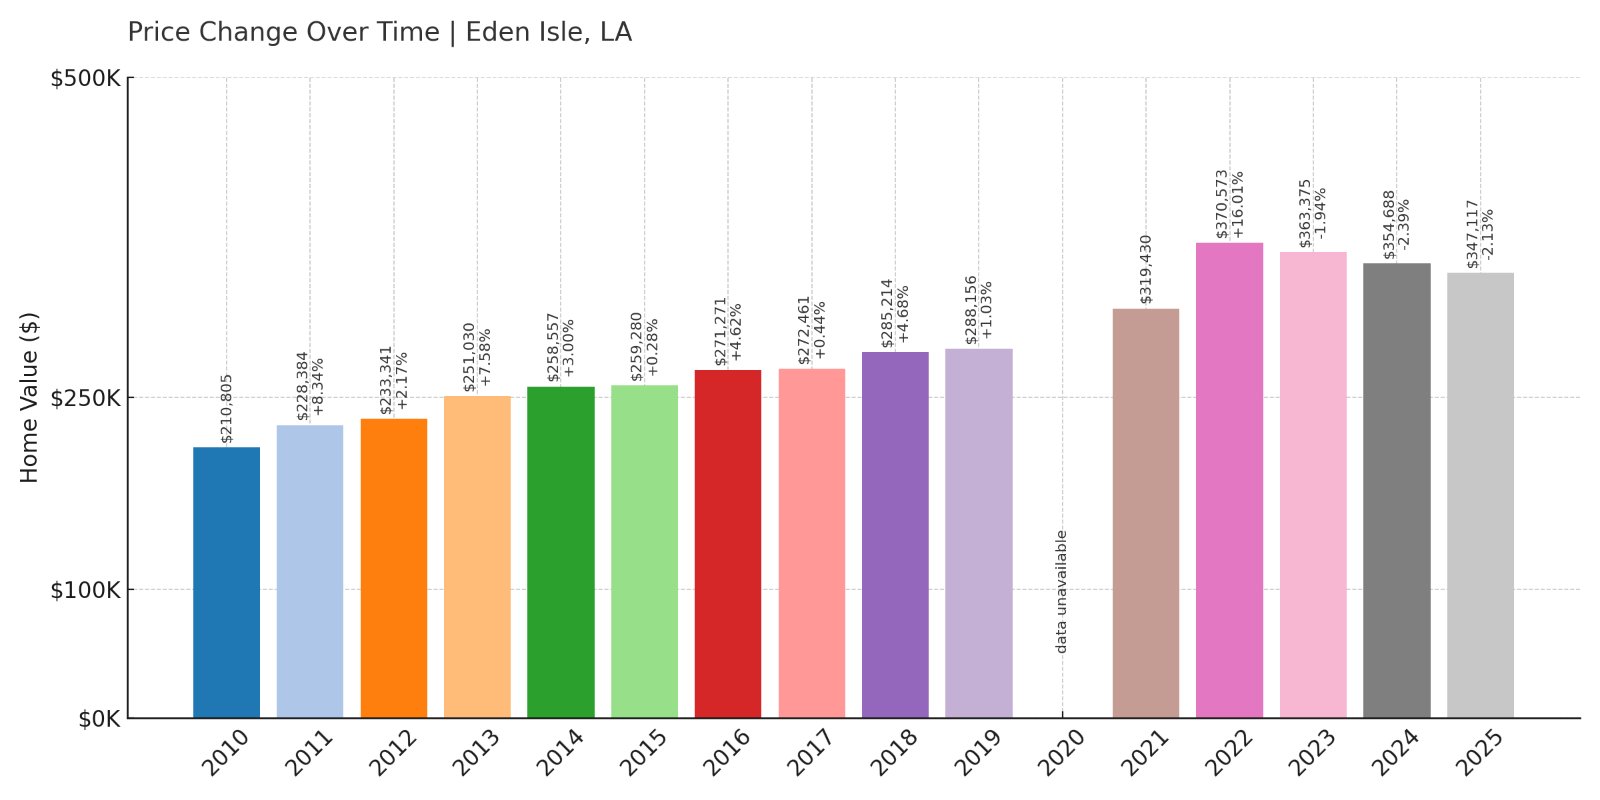
- 2010: $210,805
- 2011: $228,384 (+$17,579, +8.34% from previous year)
- 2012: $233,341 (+$4,957, +2.17% from previous year)
- 2013: $251,030 (+$17,690, +7.58% from previous year)
- 2014: $258,557 (+$7,526, +3.00% from previous year)
- 2015: $259,280 (+$723, +0.28% from previous year)
- 2016: $271,271 (+$11,991, +4.62% from previous year)
- 2017: $272,461 (+$1,191, +0.44% from previous year)
- 2018: $285,214 (+$12,752, +4.68% from previous year)
- 2019: $288,156 (+$2,943, +1.03% from previous year)
- 2020: N/A
- 2021: $319,430
- 2022: $370,573 (+$51,143, +16.01% from previous year)
- 2023: $363,375 (-$7,198, -1.94% from previous year)
- 2024: $354,688 (-$8,687, -2.39% from previous year)
- 2025: $347,117 (-$7,571, -2.13% from previous year)
Since 2012, home values in Eden Isle have grown by nearly 50%, with the highest leap occurring between 2021 and 2022. Despite some price corrections in recent years, the long-term growth trajectory remains strong.
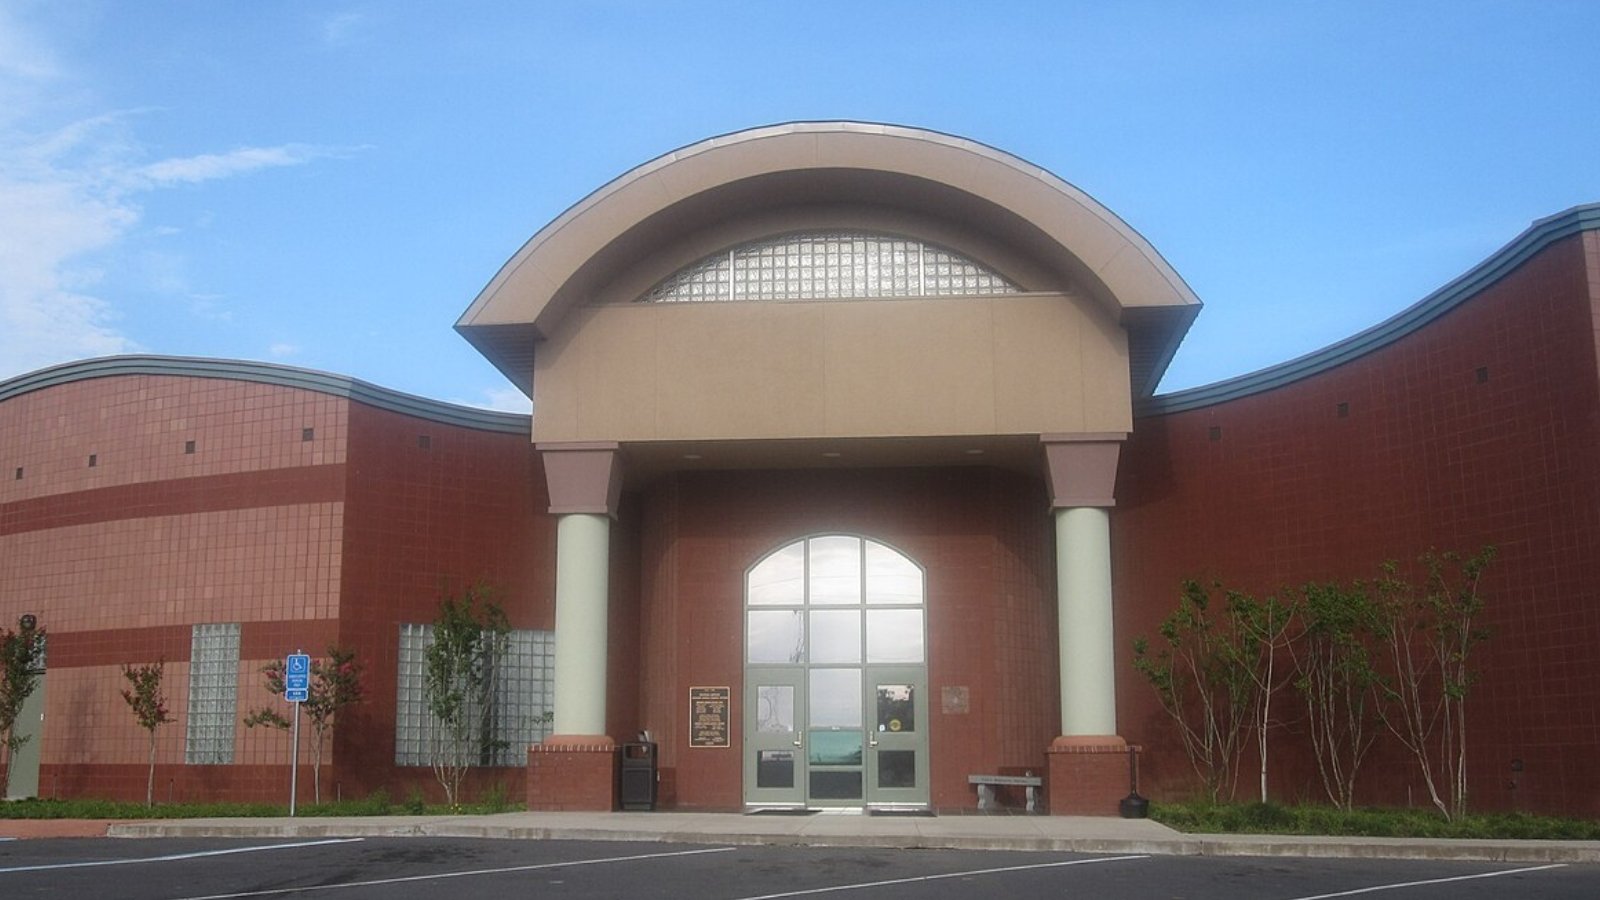
Eden Isle – Waterfront Living on Louisiana’s North Shore
Eden Isle, located near Slidell along the edge of Lake Pontchartrain, offers waterfront living that combines suburban amenities with direct access to boating and fishing. It’s part of a growing stretch of North Shore communities that appeal to both retirees and professionals commuting to New Orleans.
The strong price increases from 2016 onward suggest increasing demand for waterfront properties. Though recent dips hint at market correction, Eden Isle remains a highly valued destination for those prioritizing access to water and a slower pace of life.
8. Elmwood – 33.88% Home Price Increase Since 2012
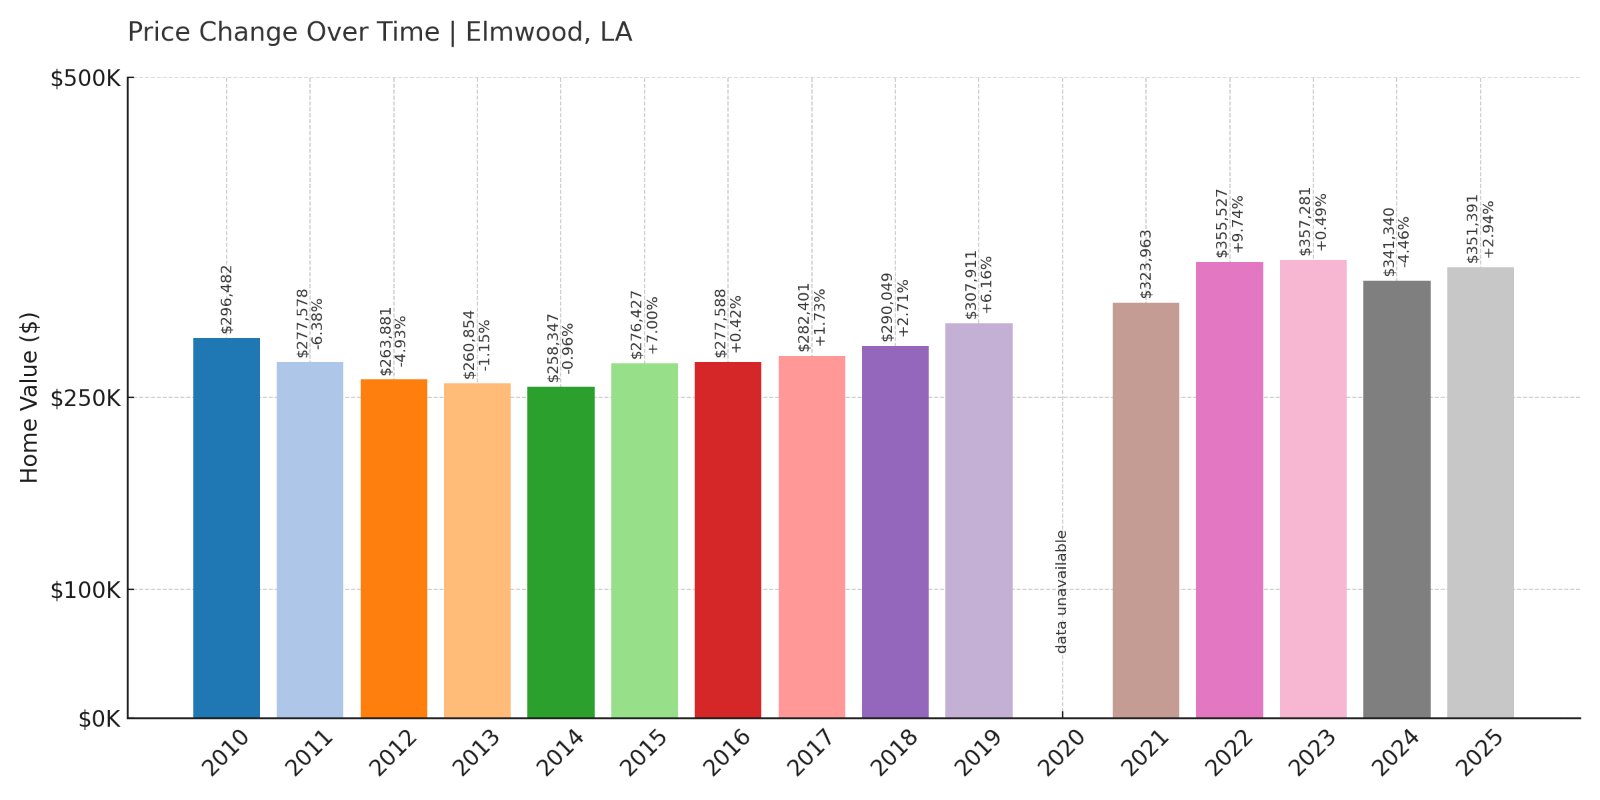
- 2010: $296,482
- 2011: $277,578 (-$18,904, -6.38% from previous year)
- 2012: $263,881 (-$13,697, -4.93% from previous year)
- 2013: $260,854 (-$3,027, -1.15% from previous year)
- 2014: $258,347 (-$2,507, -0.96% from previous year)
- 2015: $276,427 (+$18,080, +7.00% from previous year)
- 2016: $277,588 (+$1,161, +0.42% from previous year)
- 2017: $282,401 (+$4,813, +1.73% from previous year)
- 2018: $290,049 (+$7,648, +2.71% from previous year)
- 2019: $307,911 (+$17,863, +6.16% from previous year)
- 2020: N/A
- 2021: $323,963
- 2022: $355,527 (+$31,564, +9.74% from previous year)
- 2023: $357,281 (+$1,754, +0.49% from previous year)
- 2024: $341,340 (-$15,941, -4.46% from previous year)
- 2025: $351,391 (+$10,051, +2.94% from previous year)
Elmwood’s home values have grown by nearly 34% since 2012, with the largest gains occurring after 2020. A dip in 2024 didn’t erase the broader trend, which has remained upward thanks to renewed demand and recovery in 2025.
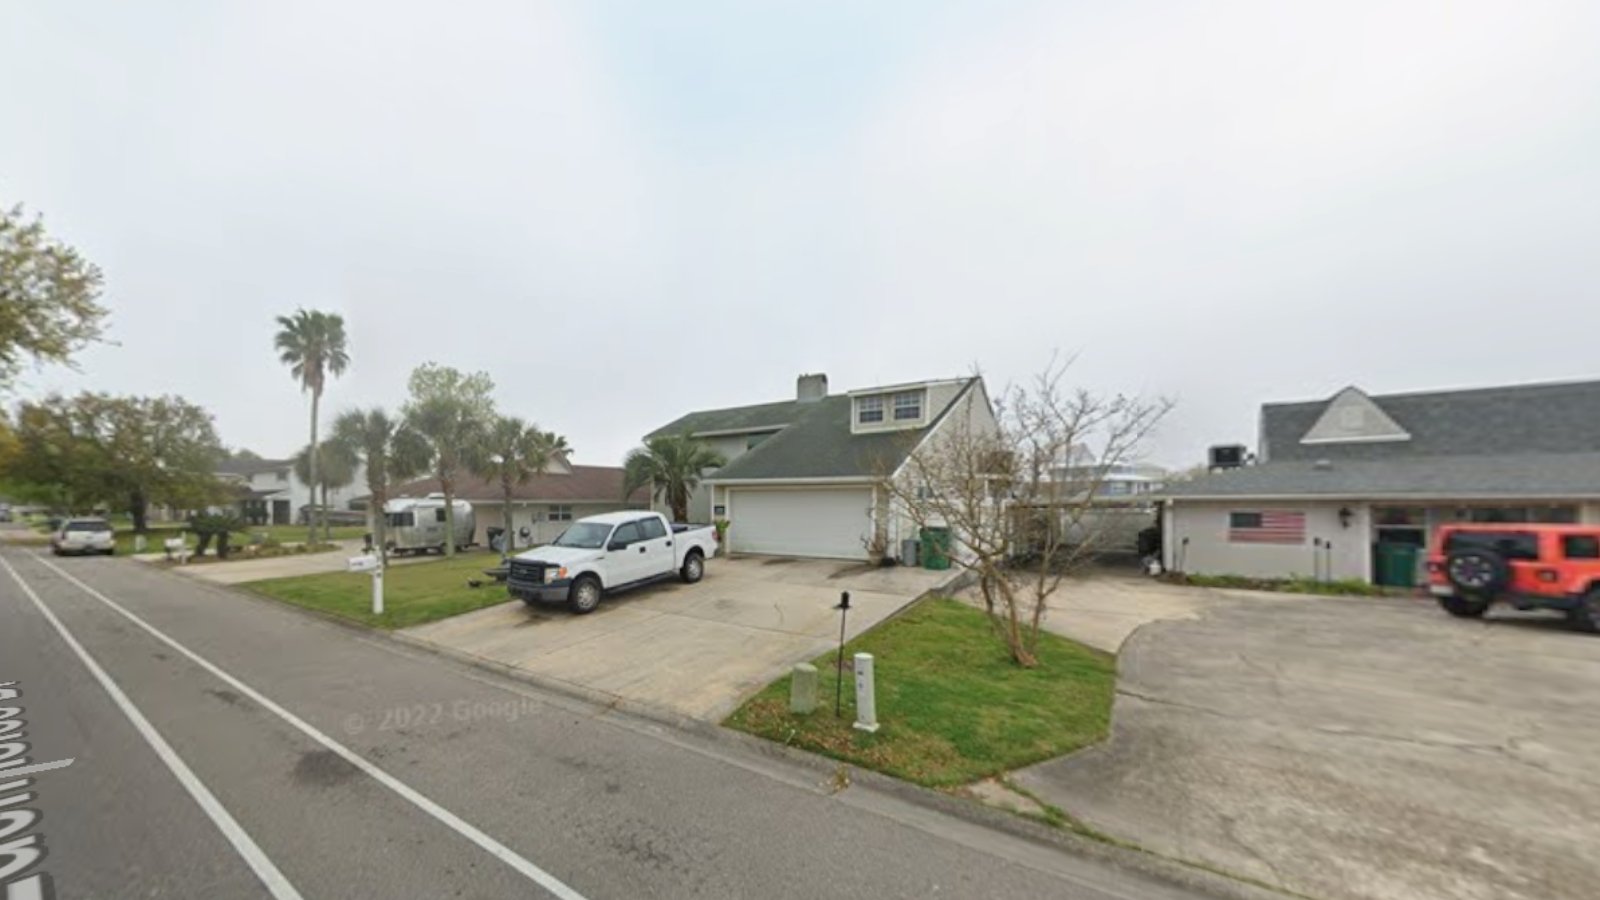
Elmwood – Convenience Meets High Demand

Elmwood is a commercial and residential hotspot just outside New Orleans. With big-box stores, restaurants, and proximity to Uptown and the airport, it draws both homeowners and investors looking for central locations with modern infrastructure.
Growth in home values has mirrored redevelopment and population shifts, especially post-2020. While a short-term dip in 2024 slowed momentum, the quick rebound in 2025 suggests a market that remains desirable, particularly for commuters and young professionals.
7. Belle Chasse – 25.17% Home Price Increase Since 2012
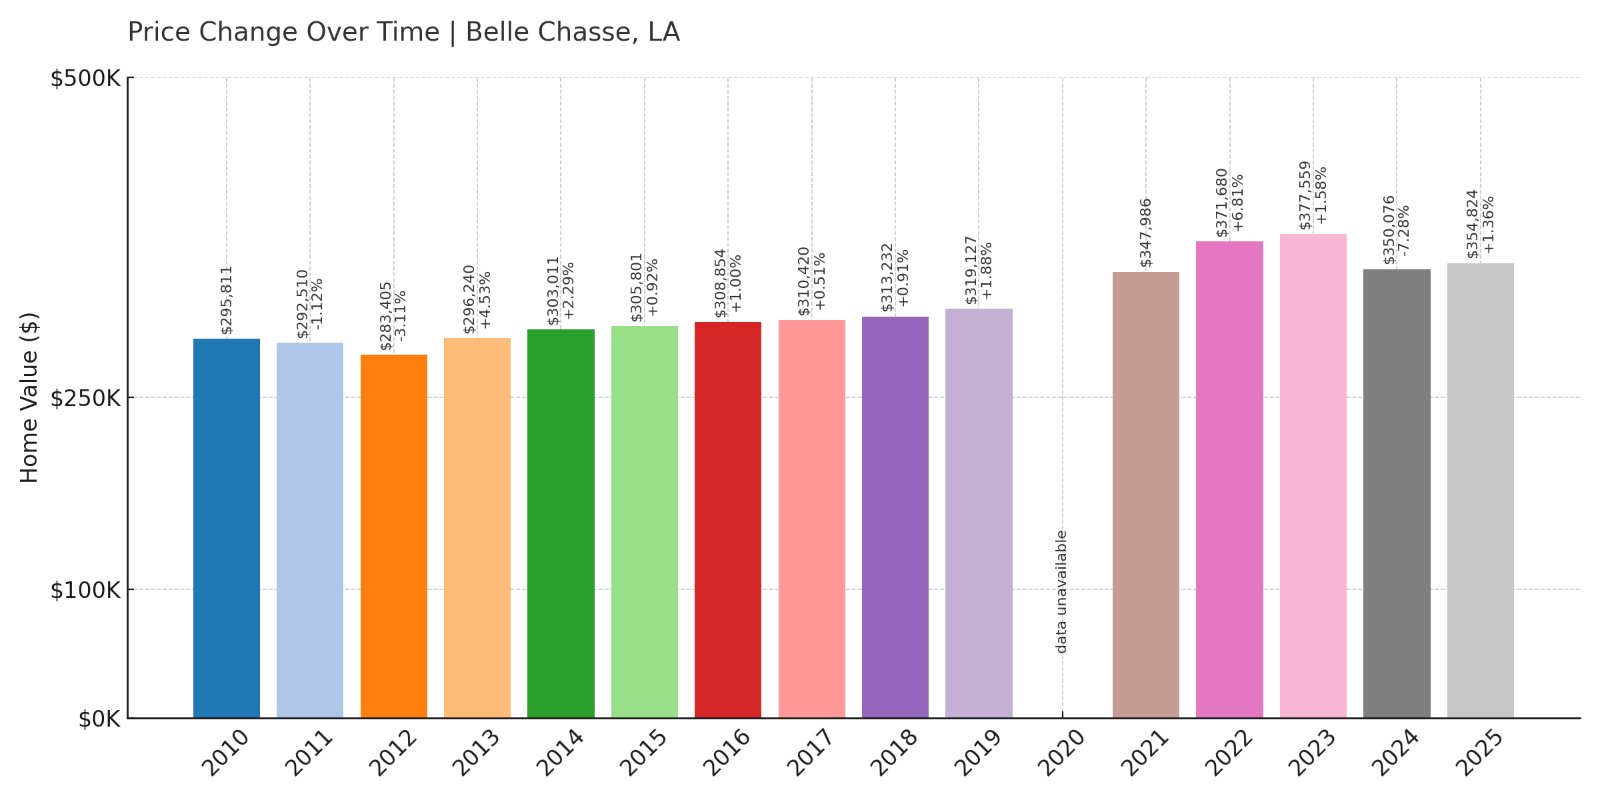
- 2010: $295,811
- 2011: $292,510 (-$3,301, -1.12% from previous year)
- 2012: $283,405 (-$9,105, -3.11% from previous year)
- 2013: $296,240 (+$12,834, +4.53% from previous year)
- 2014: $303,011 (+$6,771, +2.29% from previous year)
- 2015: $305,801 (+$2,791, +0.92% from previous year)
- 2016: $308,854 (+$3,053, +1.00% from previous year)
- 2017: $310,420 (+$1,565, +0.51% from previous year)
- 2018: $313,232 (+$2,813, +0.91% from previous year)
- 2019: $319,127 (+$5,895, +1.88% from previous year)
- 2020: N/A
- 2021: $347,986
- 2022: $371,680 (+$23,693, +6.81% from previous year)
- 2023: $377,559 (+$5,880, +1.58% from previous year)
- 2024: $350,076 (-$27,483, -7.28% from previous year)
- 2025: $354,824 (+$4,747, +1.36% from previous year)
Belle Chasse has seen a 25% increase in home values since 2012, with growth peaking during the early 2020s. The 2024 dip pulled values down slightly, but the 2025 rebound signals ongoing strength in this desirable riverfront town.
Belle Chasse – Strategic Location With Staying Power
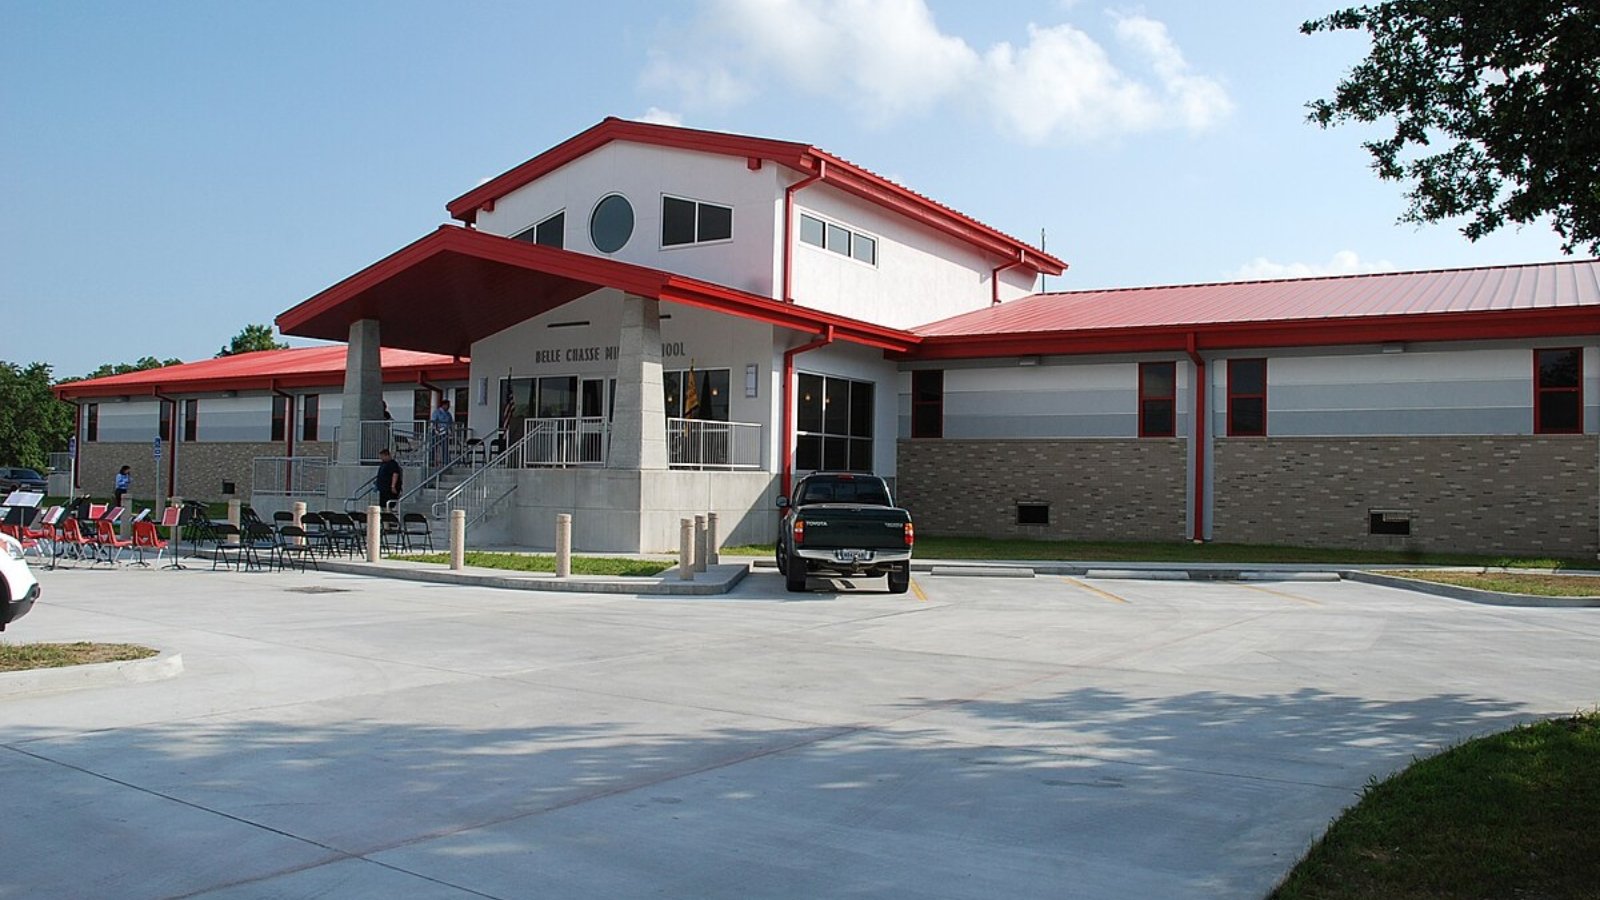
Located on the west bank of the Mississippi in Plaquemines Parish, Belle Chasse combines quiet living with close proximity to the New Orleans metro area. Its mix of military families (due to NAS JRB New Orleans), long-time locals, and new arrivals keeps the housing market moving.
The 2021–2023 growth years reflect heightened demand, while the 2024 dip suggests either overpricing or buyer hesitance during broader economic shifts. With 2025 showing stabilization, Belle Chasse continues to be one of the state’s most stable high-end markets.
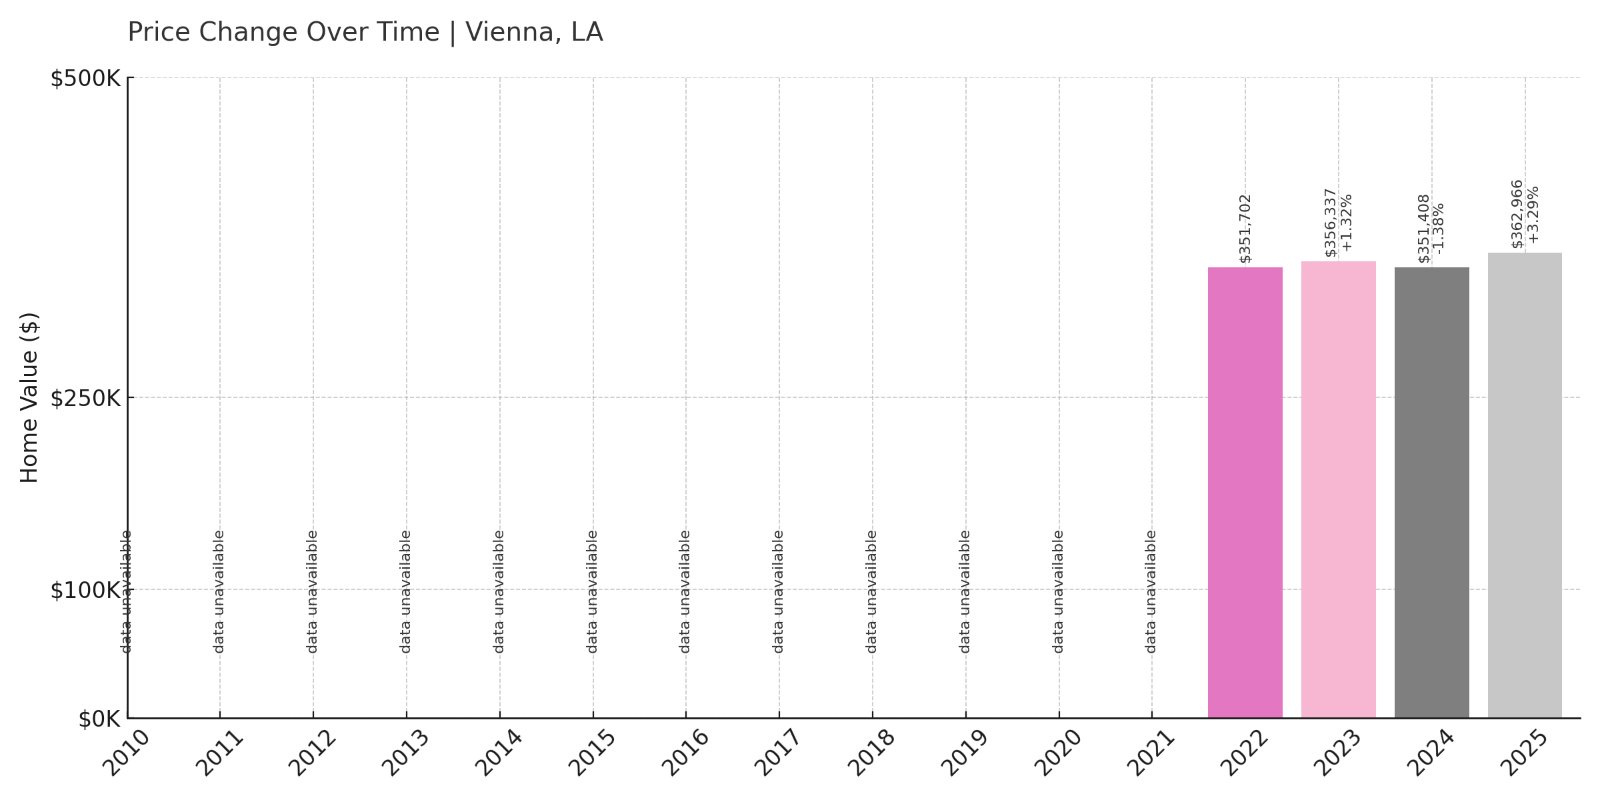
6. Vienna – 3.20% Home Price Increase Since 2022
🔥 Would you like to save this?
- 2010: N/A
- 2011: N/A
- 2012: N/A
- 2013: N/A
- 2014: N/A
- 2015: N/A
- 2016: N/A
- 2017: N/A
- 2018: N/A
- 2019: N/A
- 2020: N/A
- 2021: N/A
- 2022: $351,702
- 2023: $356,337 (+$4,635, +1.32% from previous year)
- 2024: $351,408 (-$4,929, -1.38% from previous year)
- 2025: $362,966 (+$11,557, +3.29% from previous year)
Vienna’s available data begins in 2022, and within just three years, prices have inched upward by over 3%. Despite a slight dip in 2024, 2025 prices show recovery and renewed market confidence.
Vienna – A Quiet Climber in Northern Louisiana
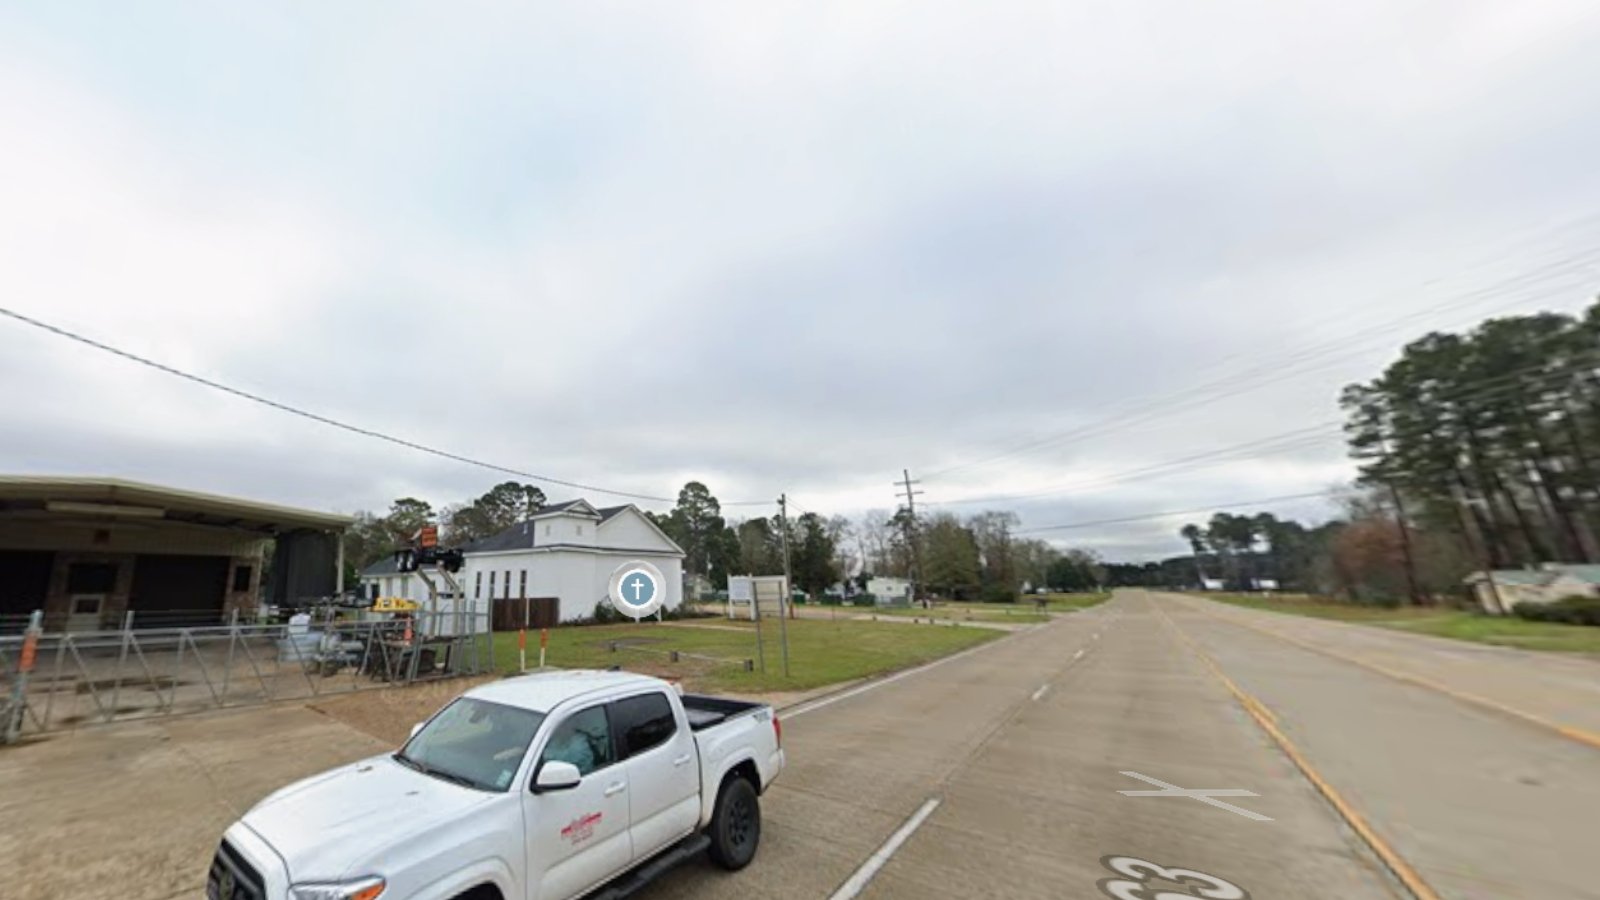
Located just north of Ruston, Vienna is a small, residential town surrounded by pine forests and rural landscapes. It offers a peaceful setting while still being within a short drive of Louisiana Tech University and I-20 access.
With limited housing stock and growing interest in the area, prices have crept upward despite brief fluctuations. As more buyers seek space without sacrificing convenience, towns like Vienna may continue to show slow but steady gains in home value.
5. Stonewall – 66.93% Home Price Increase Since 2012

- 2010: $214,883
- 2011: $216,742 (+$1,859, +0.86% from previous year)
- 2012: $220,280 (+$3,538, +1.63% from previous year)
- 2013: $219,091 (-$1,189, -0.54% from previous year)
- 2014: $221,964 (+$2,874, +1.31% from previous year)
- 2015: $237,149 (+$15,184, +6.84% from previous year)
- 2016: $236,378 (-$770, -0.32% from previous year)
- 2017: $237,623 (+$1,244, +0.53% from previous year)
- 2018: $246,372 (+$8,750, +3.68% from previous year)
- 2019: $253,240 (+$6,868, +2.79% from previous year)
- 2020: N/A
- 2021: $281,028
- 2022: $299,797 (+$18,769, +6.68% from previous year)
- 2023: $313,057 (+$13,259, +4.42% from previous year)
- 2024: $328,601 (+$15,544, +4.97% from previous year)
- 2025: $367,551 (+$38,949, +11.85% from previous year)
Stonewall’s home values have soared nearly 67% since 2012, with major increases since 2021. The most dramatic jump occurred between 2024 and 2025, when values rose by almost $39,000 in a single year.
Stonewall – North Louisiana’s Breakout Market
Stonewall, located in DeSoto Parish just south of Shreveport, is a fast-growing suburb with excellent schools and a tight-knit feel. Though once a rural community, its growing subdivisions and family-friendly appeal have turned it into one of the most desirable towns in the region.
The surge in home values mirrors an influx of new residents and demand for housing within commuting distance of Shreveport. The town’s combination of space, schools, and new construction options have driven recent appreciation—and made it a standout performer across the state.
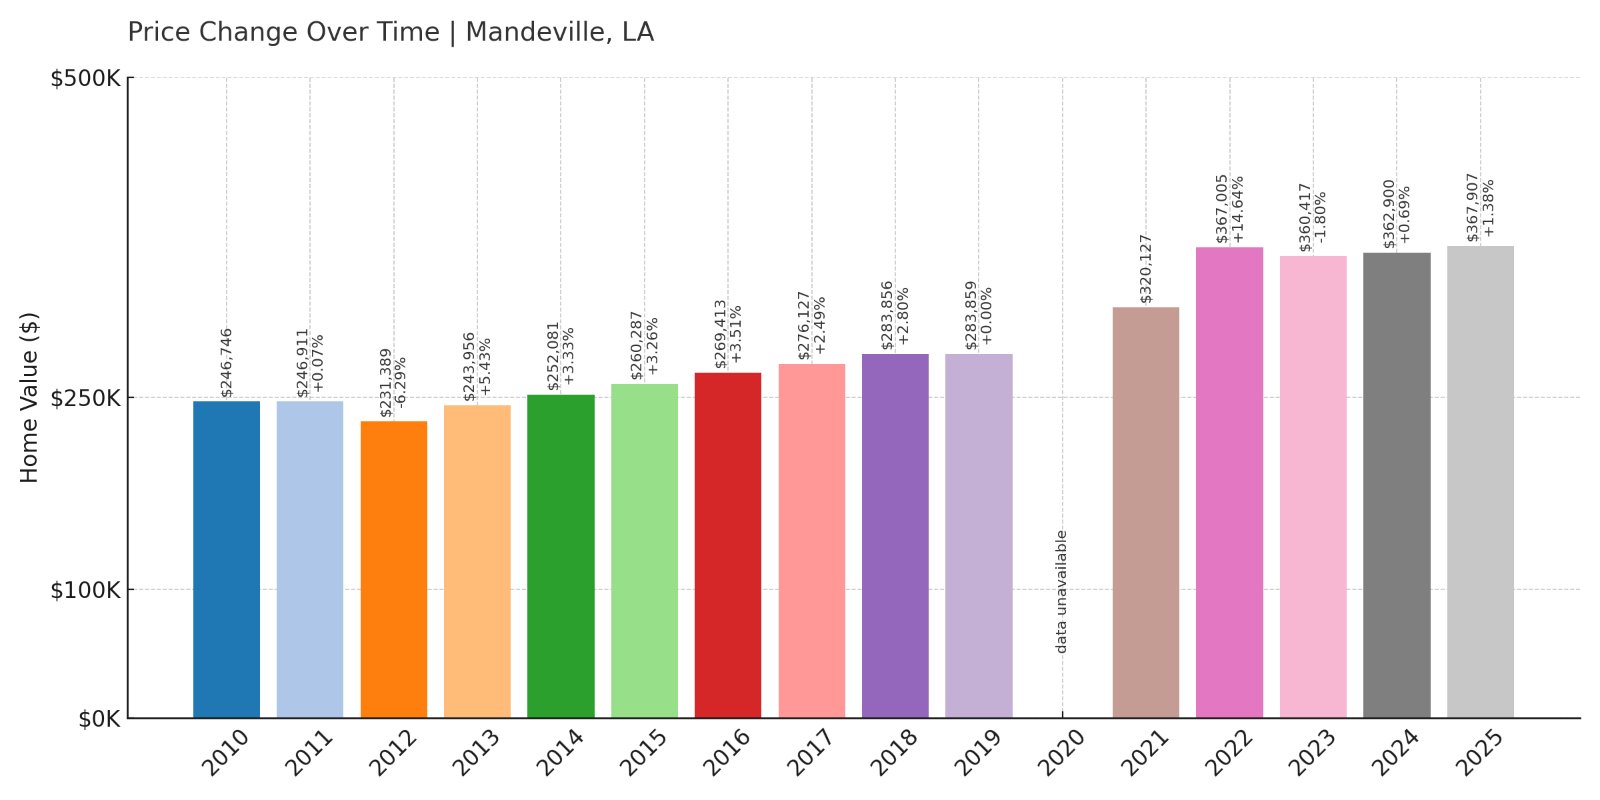
4. Mandeville – 58.99% Home Price Increase Since 2012
- 2010: $246,746
- 2011: $246,911 (+$165, +0.07% from previous year)
- 2012: $231,389 (-$15,523, -6.29% from previous year)
- 2013: $243,956 (+$12,567, +5.43% from previous year)
- 2014: $252,081 (+$8,125, +3.33% from previous year)
- 2015: $260,287 (+$8,206, +3.26% from previous year)
- 2016: $269,413 (+$9,126, +3.51% from previous year)
- 2017: $276,127 (+$6,714, +2.49% from previous year)
- 2018: $283,856 (+$7,729, +2.80% from previous year)
- 2019: $283,859 (+$3, +0.00% from previous year)
- 2020: N/A
- 2021: $320,127
- 2022: $367,005 (+$46,878, +14.64% from previous year)
- 2023: $360,417 (-$6,587, -1.79% from previous year)
- 2024: $362,900 (+$2,483, +0.69% from previous year)
- 2025: $367,907 (+$5,007, +1.38% from previous year)
Mandeville home prices are up nearly 59% since 2012. The biggest leap came in 2022, following a strong post-pandemic housing surge. Despite a brief correction, prices have regained ground and remain near peak levels.
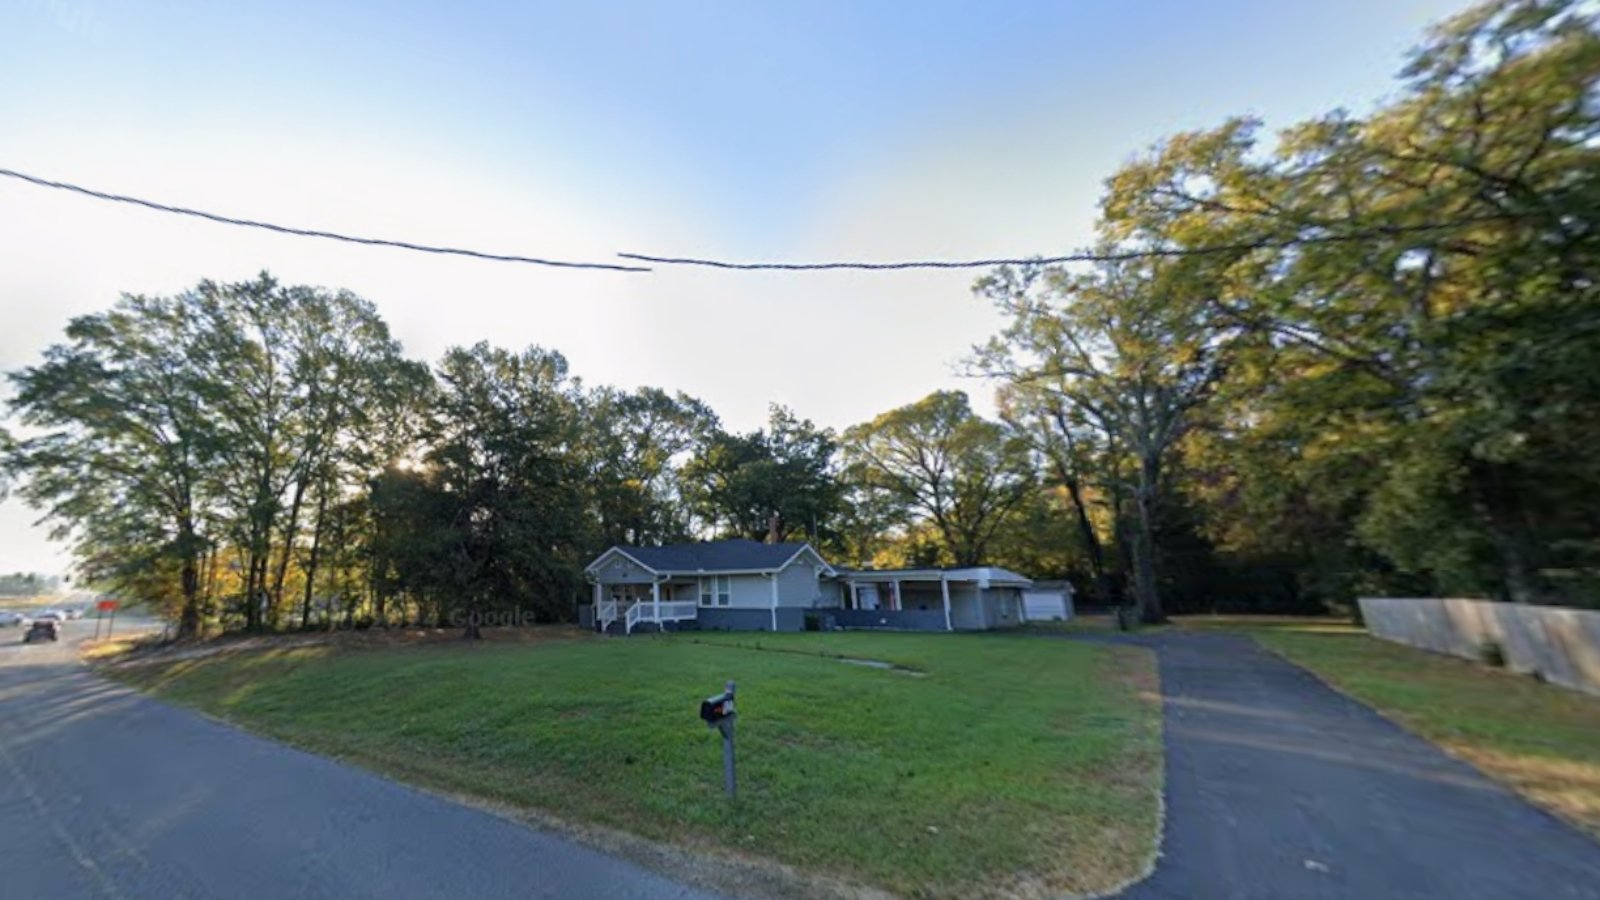
Mandeville – Upscale and Anchored by the Lake

Mandeville is one of the most desirable towns on the North Shore, known for its charming lakefront, walkable historic district, and excellent public schools. Just across the Causeway from New Orleans, it has long been a go-to suburb for professionals seeking space and stability.
The area’s housing market has benefited from a combination of location, lifestyle, and limited supply. Continued interest from New Orleans transplants and second-home buyers has kept prices elevated and rising into 2025, solidifying Mandeville’s position as one of Louisiana’s priciest towns.
3. Geismar – 62.89% Home Price Increase Since 2012
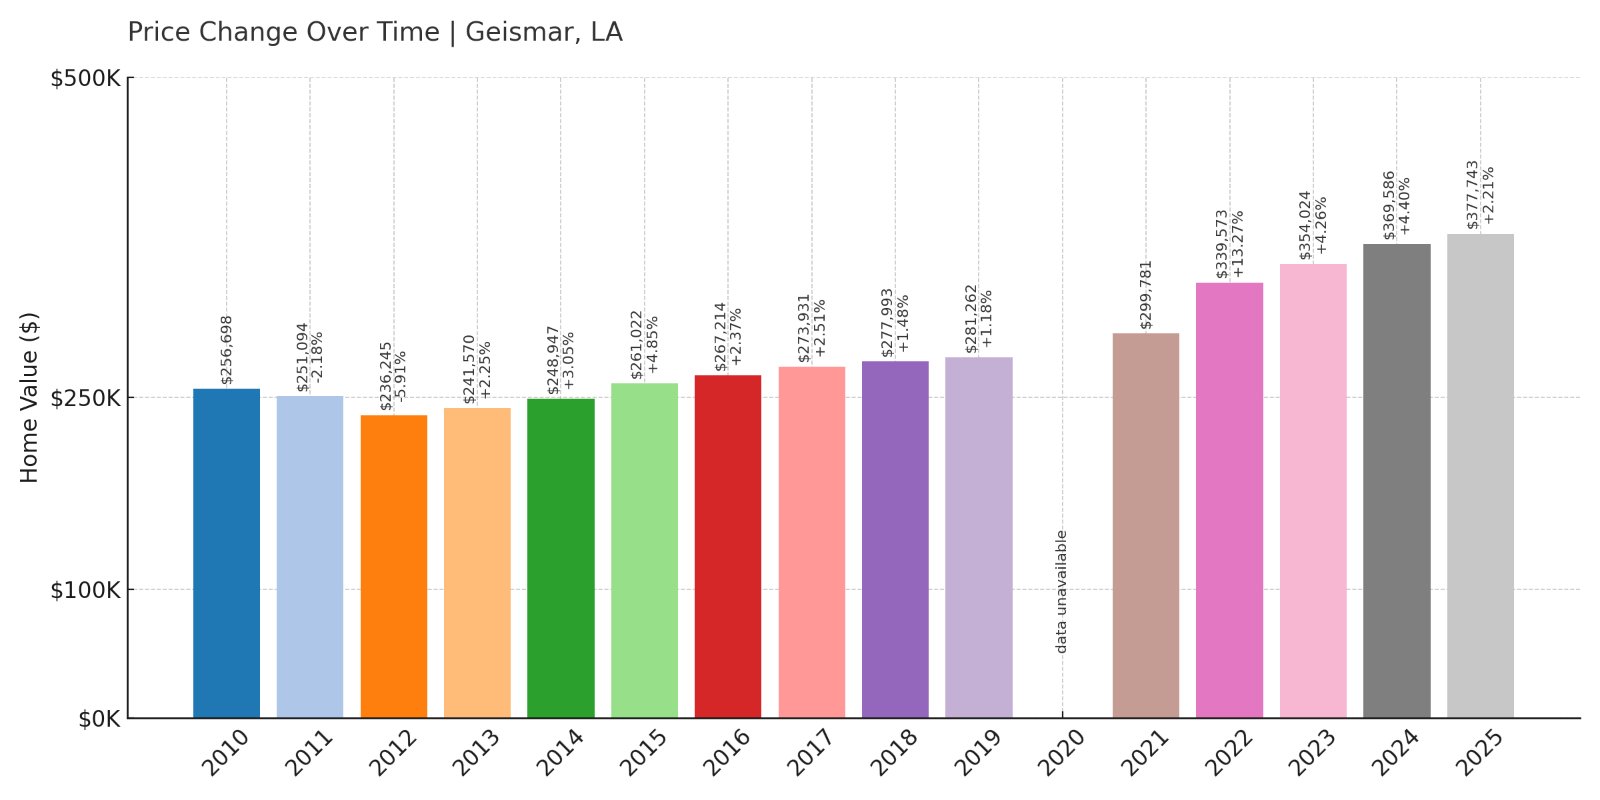
- 2010: $256,698
- 2011: $251,094 (-$5,604, -2.18% from previous year)
- 2012: $236,245 (-$14,849, -5.91% from previous year)
- 2013: $241,570 (+$5,325, +2.25% from previous year)
- 2014: $248,947 (+$7,377, +3.05% from previous year)
- 2015: $261,022 (+$12,075, +4.85% from previous year)
- 2016: $267,214 (+$6,191, +2.37% from previous year)
- 2017: $273,931 (+$6,717, +2.51% from previous year)
- 2018: $277,993 (+$4,062, +1.48% from previous year)
- 2019: $281,262 (+$3,269, +1.18% from previous year)
- 2020: N/A
- 2021: $299,781
- 2022: $339,573 (+$39,791, +13.27% from previous year)
- 2023: $354,024 (+$14,451, +4.26% from previous year)
- 2024: $369,586 (+$15,562, +4.40% from previous year)
- 2025: $377,743 (+$8,157, +2.21% from previous year)
Geismar’s home values have increased nearly 63% since 2012. Growth has been strong and stable over the past decade, with especially fast gains during the post-2020 housing market boom.
Geismar – High-Earning Hub in Ascension Parish
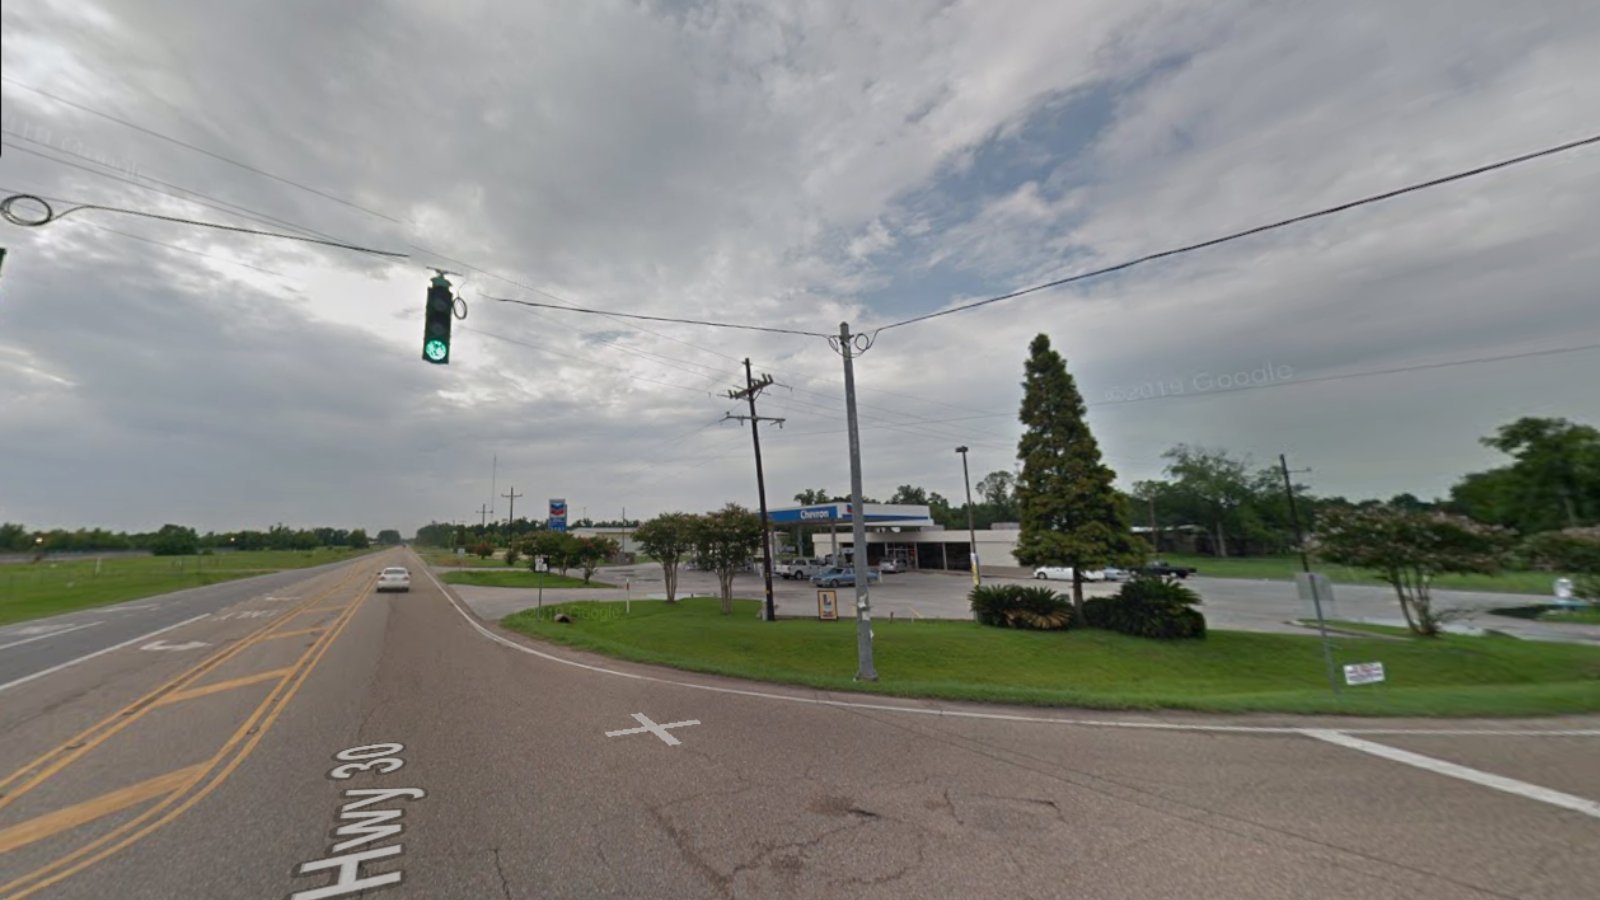
Located between Baton Rouge and Gonzales, Geismar is known for its concentration of chemical plants and high-income households. The area draws industry professionals and executives, creating a stable base for housing demand.
With newer subdivisions, good schools, and proximity to major employers, Geismar has quietly become one of the most expensive places to buy a home in the state. Recent growth in 2023 and 2024 continues to push values upward, even as some neighboring towns have cooled.
2. Saint Francisville – 65.31% Home Price Increase Since 2012
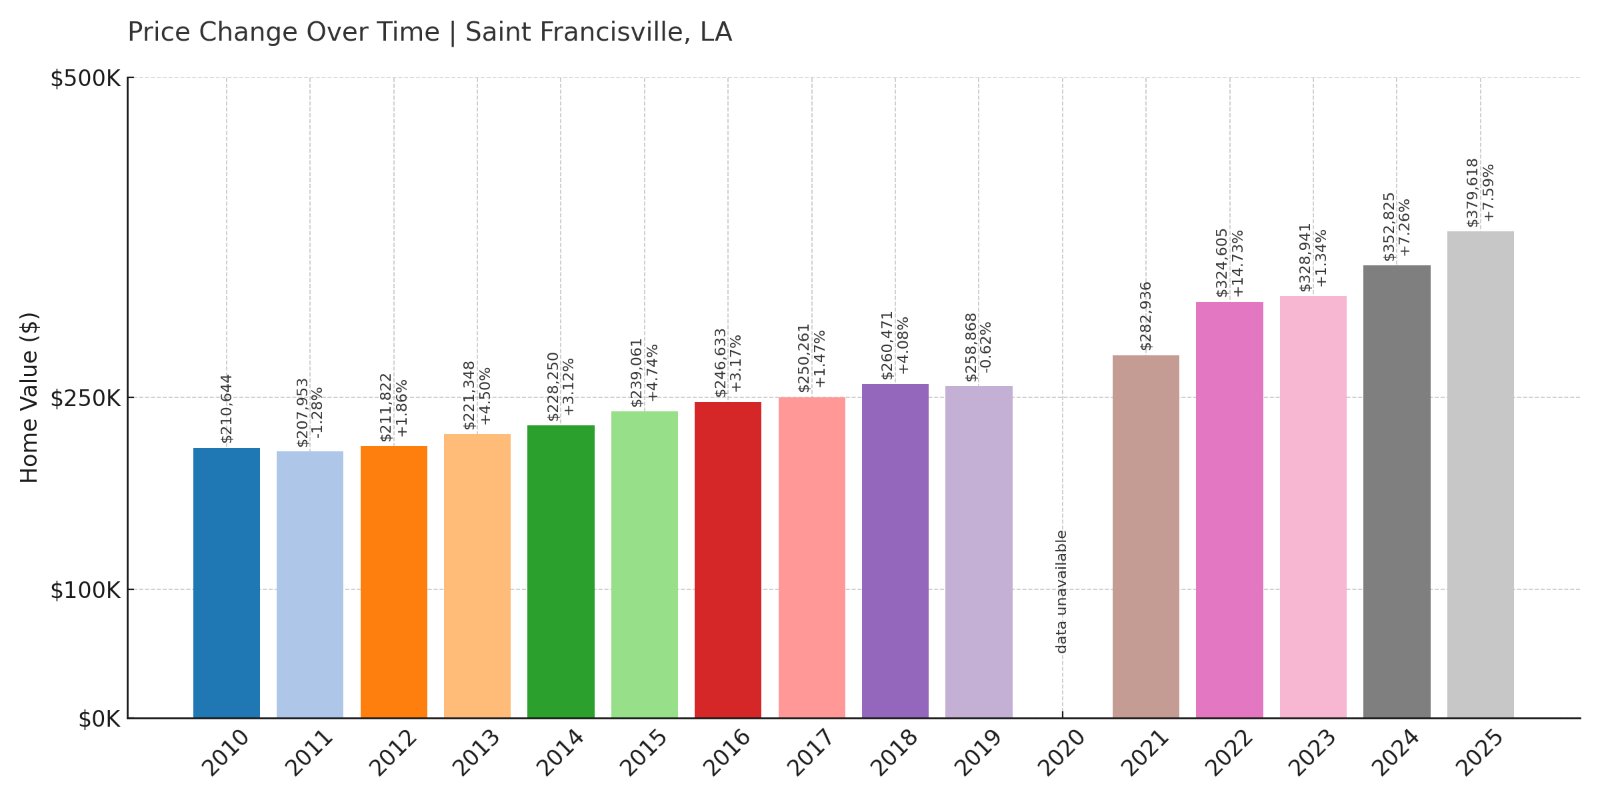
- 2010: $210,644
- 2011: $207,953 (-$2,691, -1.28% from previous year)
- 2012: $211,822 (+$3,868, +1.86% from previous year)
- 2013: $221,348 (+$9,526, +4.50% from previous year)
- 2014: $228,250 (+$6,902, +3.12% from previous year)
- 2015: $239,061 (+$10,811, +4.74% from previous year)
- 2016: $246,633 (+$7,572, +3.17% from previous year)
- 2017: $250,261 (+$3,628, +1.47% from previous year)
- 2018: $260,471 (+$10,210, +4.08% from previous year)
- 2019: $258,868 (-$1,604, -0.62% from previous year)
- 2020: N/A
- 2021: $282,936
- 2022: $324,605 (+$41,669, +14.73% from previous year)
- 2023: $328,941 (+$4,335, +1.34% from previous year)
- 2024: $352,825 (+$23,884, +7.26% from previous year)
- 2025: $379,618 (+$26,793, +7.59% from previous year)
Home prices in Saint Francisville are up more than 65% since 2012. The most impressive gains came after 2021, with values rising by nearly $100,000 in just four years.
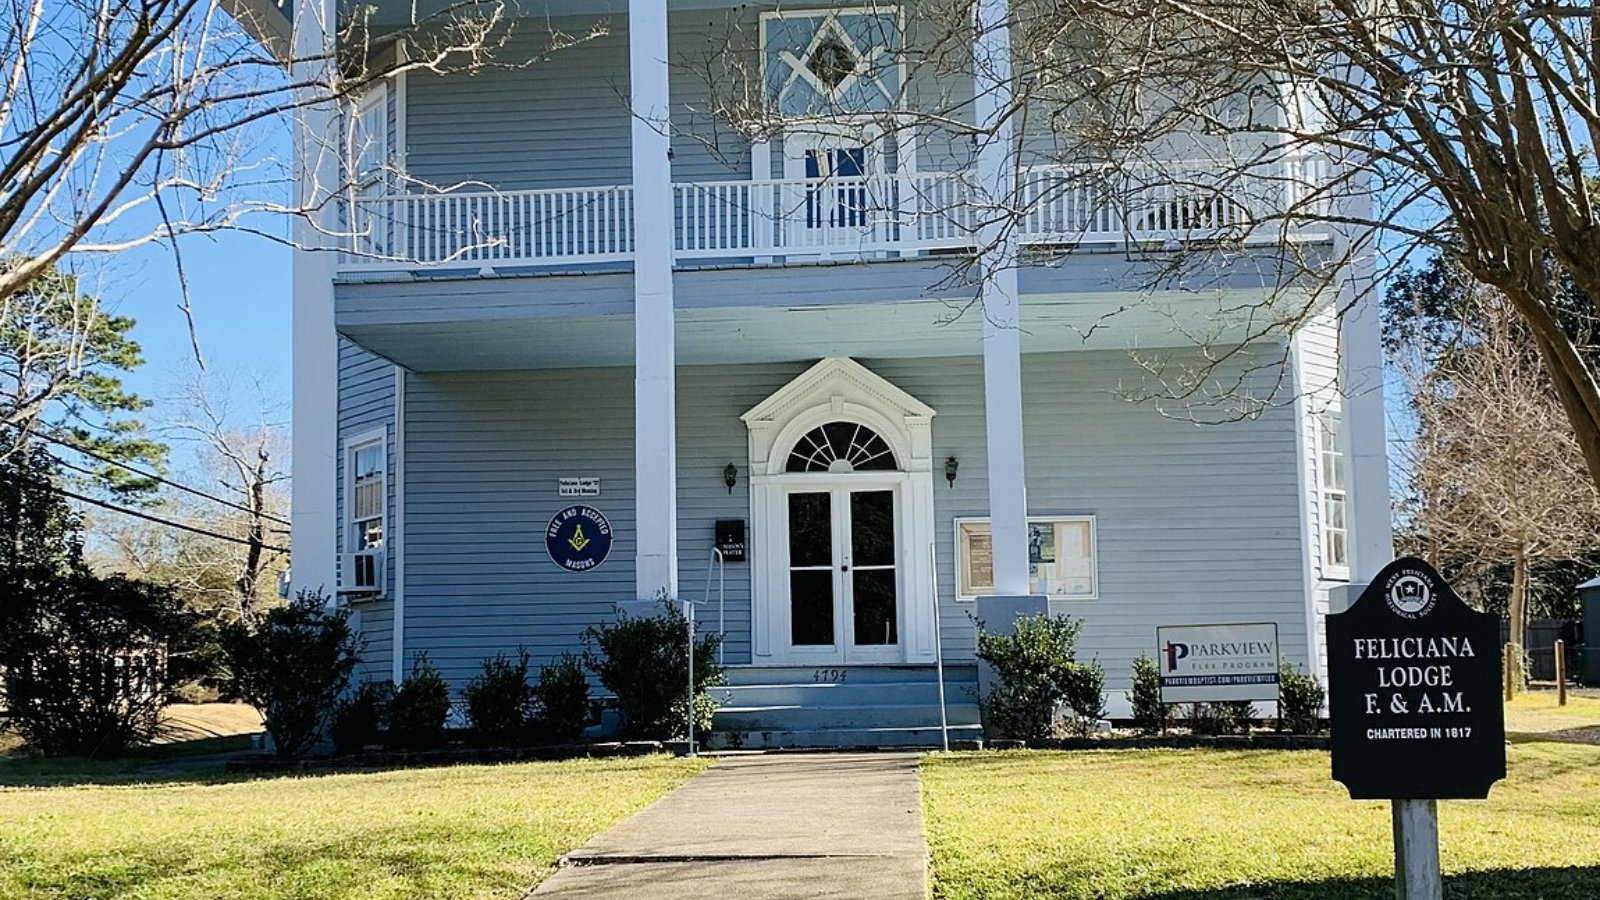
Saint Francisville – Historic Elegance With Modern Appeal
🔥 Would you like to save this?
Perched along the bluffs of the Mississippi River, Saint Francisville is known for its antebellum homes, oak-lined streets, and preserved southern charm. It attracts both weekend visitors and full-time residents who appreciate its mix of history and natural beauty.
The strong housing demand reflects limited supply and high desirability. With scenic views, boutique shops, and excellent schools, the town has transformed into one of the most exclusive addresses in the Baton Rouge region.
1. Madisonville – 52.77% Home Price Increase Since 2012

- 2010: $268,177
- 2011: $271,569 (+$3,392, +1.26% from previous year)
- 2012: $251,740 (-$19,830, -7.30% from previous year)
- 2013: $267,053 (+$15,313, +6.08% from previous year)
- 2014: $281,334 (+$14,280, +5.35% from previous year)
- 2015: $292,111 (+$10,777, +3.83% from previous year)
- 2016: $298,488 (+$6,377, +2.18% from previous year)
- 2017: $302,708 (+$4,220, +1.41% from previous year)
- 2018: $306,712 (+$4,004, +1.32% from previous year)
- 2019: $302,192 (-$4,520, -1.47% from previous year)
- 2020: N/A
- 2021: $324,149
- 2022: $373,001 (+$48,852, +15.07% from previous year)
- 2023: $372,960 (-$41, -0.01% from previous year)
- 2024: $376,190 (+$3,230, +0.87% from previous year)
- 2025: $384,653 (+$8,464, +2.25% from previous year)
Madisonville’s home prices have increased more than 52% since 2012. The standout moment came in 2022, when values jumped over 15% year-over-year, solidifying its place as Louisiana’s most expensive town by 2025.
Madisonville – Waterfront Prestige on the North Shore
Madisonville sits at the mouth of the Tchefuncte River and offers some of the most picturesque and prestigious addresses in southeast Louisiana. Its riverfront homes, upscale neighborhoods, and historic district make it a magnet for affluent buyers.
Though growth has leveled out since 2022, values continue to trend upward. Madisonville’s limited inventory and enduring popularity have kept demand high, and its position at the top of this list reflects just how far it’s come in a little over a decade.


