🔥 Would you like to save this?
Home values in Delaware have been climbing quietly but steadily—and in some places, the gains are downright dramatic. The latest Zillow Home Value Index data shows which 15 towns now top the charts for price growth and long-term appreciation. From charming beach towns to suburbs that used to fly under the radar, these spots are now commanding serious attention (and serious cash). Whether you’re scouting investment potential or just wondering where prices have soared, these are the towns leading the pack.
15. Milton – 92% Home Price Increase Since 2010
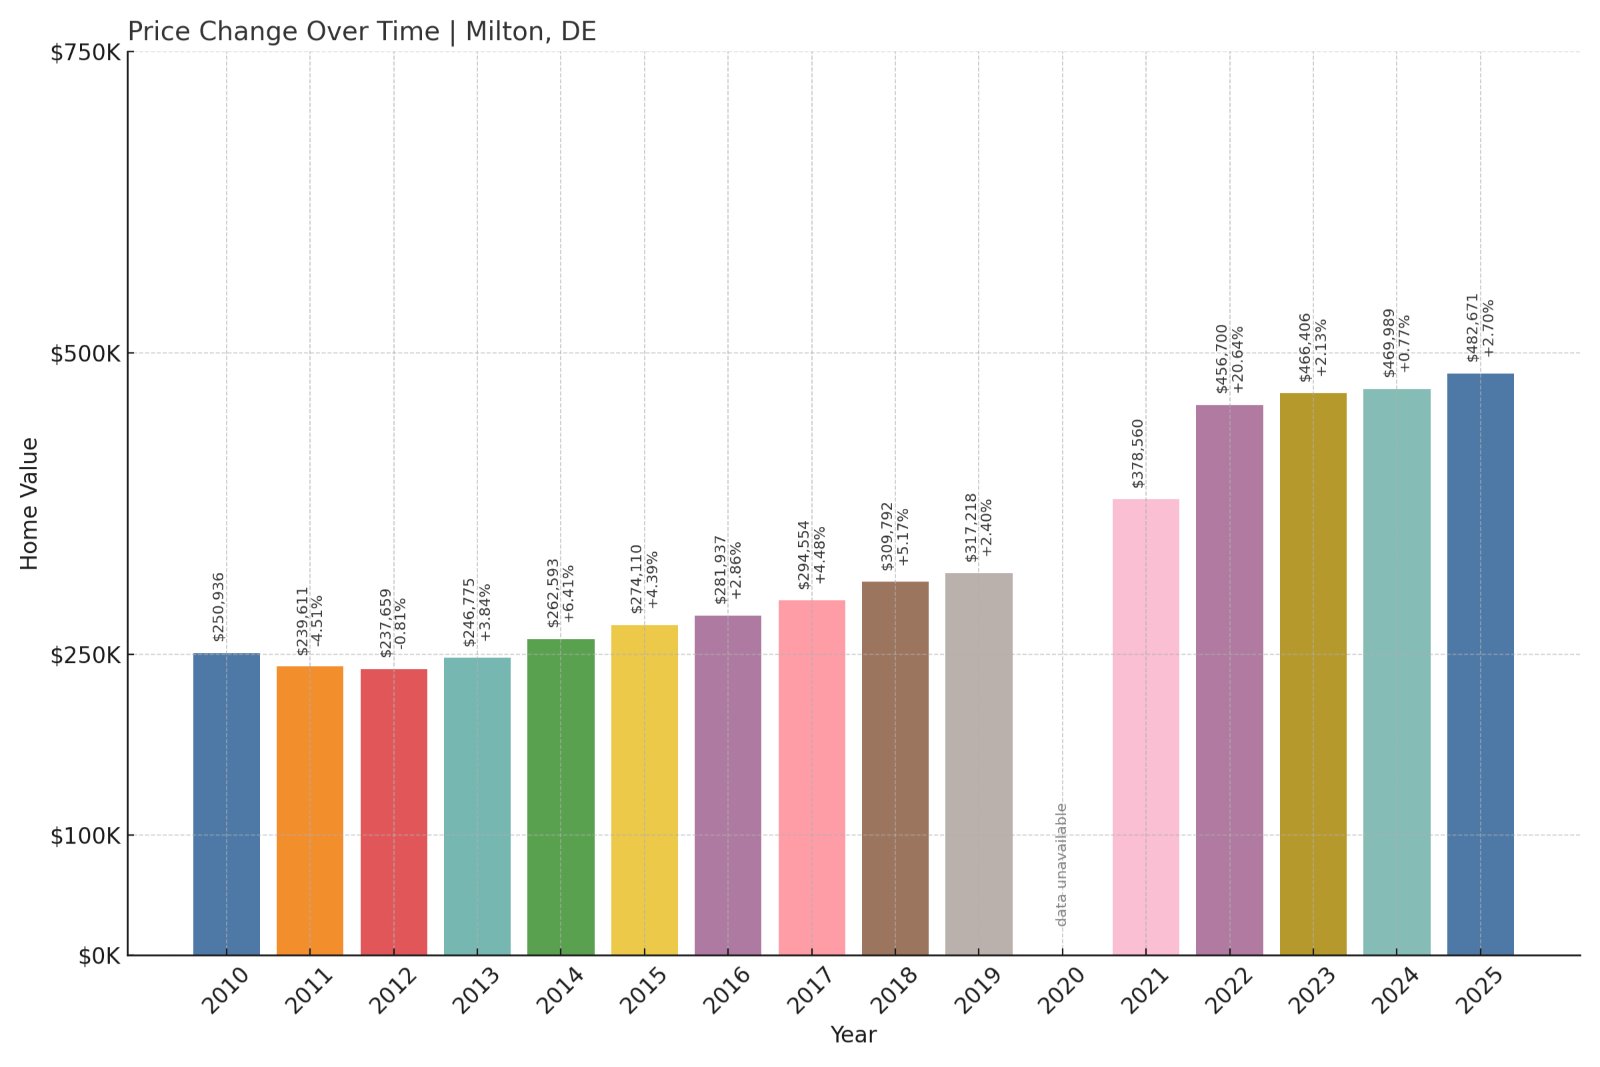
- 2010: $250,936
- 2011: $239,611 (-$11,324, -4.51% from previous year)
- 2012: $237,659 (-$1,952, -0.81% from previous year)
- 2013: $246,775 (+$9,117, +3.84% from previous year)
- 2014: $262,593 (+$15,817, +6.41% from previous year)
- 2015: $274,110 (+$11,517, +4.39% from previous year)
- 2016: $281,937 (+$7,827, +2.86% from previous year)
- 2017: $294,554 (+$12,617, +4.48% from previous year)
- 2018: $309,792 (+$15,238, +5.17% from previous year)
- 2019: $317,218 (+$7,427, +2.40% from previous year)
- 2020: N/A
- 2021: $378,560
- 2022: $456,700 (+$78,140, +20.64% from previous year)
- 2023: $466,406 (+$9,705, +2.13% from previous year)
- 2024: $469,989 (+$3,583, +0.77% from previous year)
- 2025: $482,671 (+$12,682, +2.70% from previous year)
Home values in Milton have nearly doubled since 2010, with an overall gain of 92%. While early growth was steady, a huge jump occurred after 2020—prices surged from $378K in 2021 to over $482K in 2025. The town’s recent value growth has slowed to low single-digit gains, but it’s holding strong at historically high levels.
In order to come up with the very specific design ideas, we create most designs with the assistance of state-of-the-art AI interior design software.
Milton – A Steady Climber With Big Gains Post-2020
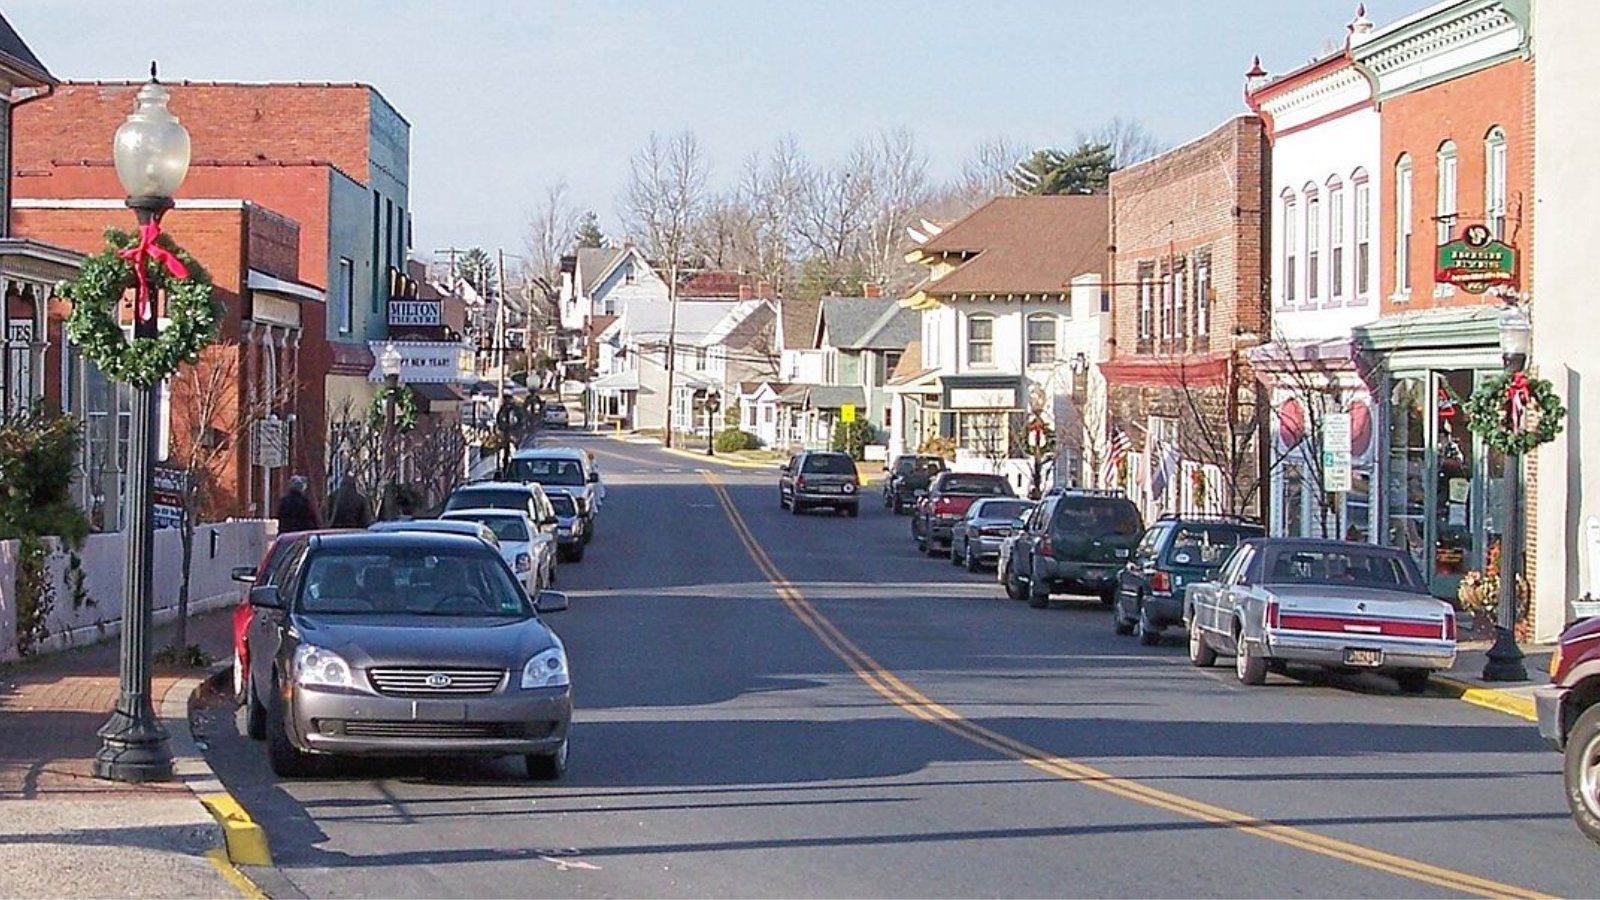
Located in Sussex County, Milton has grown from a quiet historic town into one of Delaware’s most desirable places to settle. It’s known for its charming downtown, access to the Broadkill River, and proximity to Delaware Bay beaches. These features have drawn buyers looking for a mix of history, nature, and convenience.
Milton’s sharp increase in home prices after 2020 likely reflects increased demand during and after the pandemic-era migration surge, when more buyers looked for homes near outdoor amenities. With easy access to Lewes and Rehoboth Beach, but more affordable prices than either, Milton’s appeal has remained high even as market conditions cool slightly in 2024 and 2025.
14. Frankford – 92% Home Price Increase Since 2010
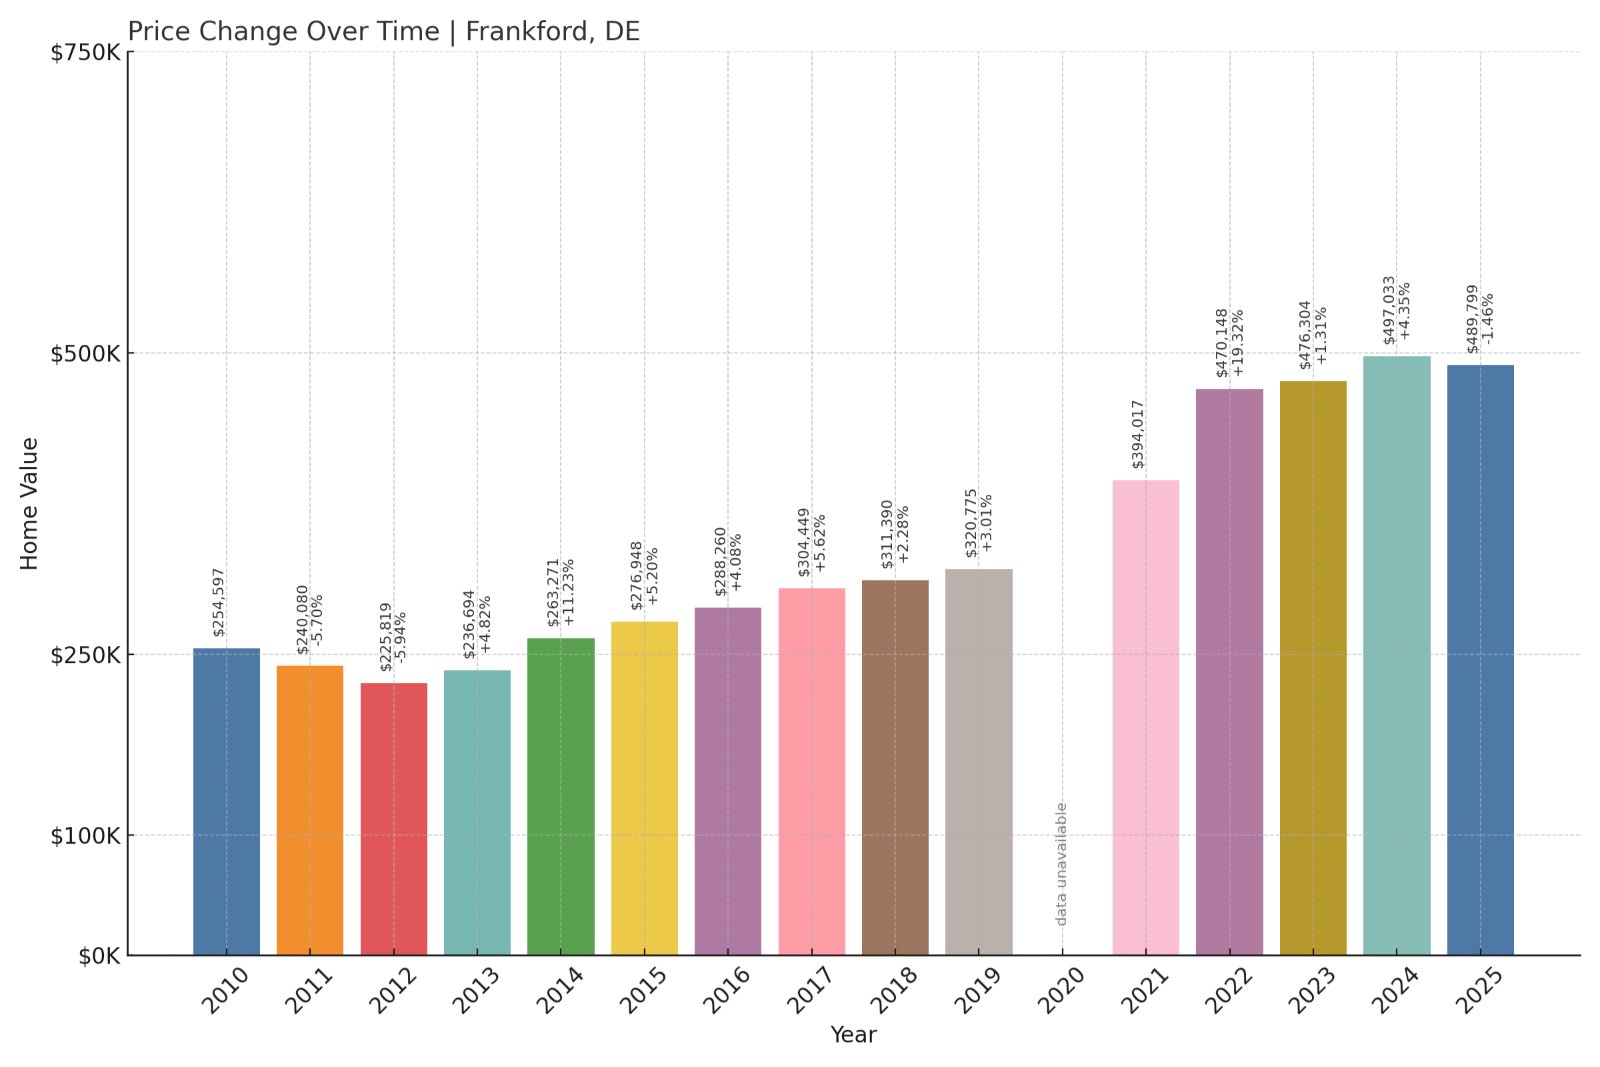
- 2010: $254,597
- 2011: $240,080 (-$14,517, -5.70% from previous year)
- 2012: $225,819 (-$14,260, -5.94% from previous year)
- 2013: $236,694 (+$10,875, +4.82% from previous year)
- 2014: $263,271 (+$26,576, +11.23% from previous year)
- 2015: $276,948 (+$13,677, +5.20% from previous year)
- 2016: $288,260 (+$11,311, +4.08% from previous year)
- 2017: $304,449 (+$16,190, +5.62% from previous year)
- 2018: $311,390 (+$6,941, +2.28% from previous year)
- 2019: $320,775 (+$9,385, +3.01% from previous year)
- 2020: N/A
- 2021: $394,017
- 2022: $470,148 (+$76,131, +19.32% from previous year)
- 2023: $476,304 (+$6,156, +1.31% from previous year)
- 2024: $497,033 (+$20,729, +4.35% from previous year)
- 2025: $489,799 (-$7,234, -1.46% from previous year)
Frankford’s home prices have climbed 92% over the last 15 years. The town saw significant growth beginning in the mid-2010s, followed by a major price leap between 2020 and 2022. While the past year shows a slight dip, values remain far above their pre-pandemic levels.
Frankford – Quiet but In Demand Along Delaware’s Coast
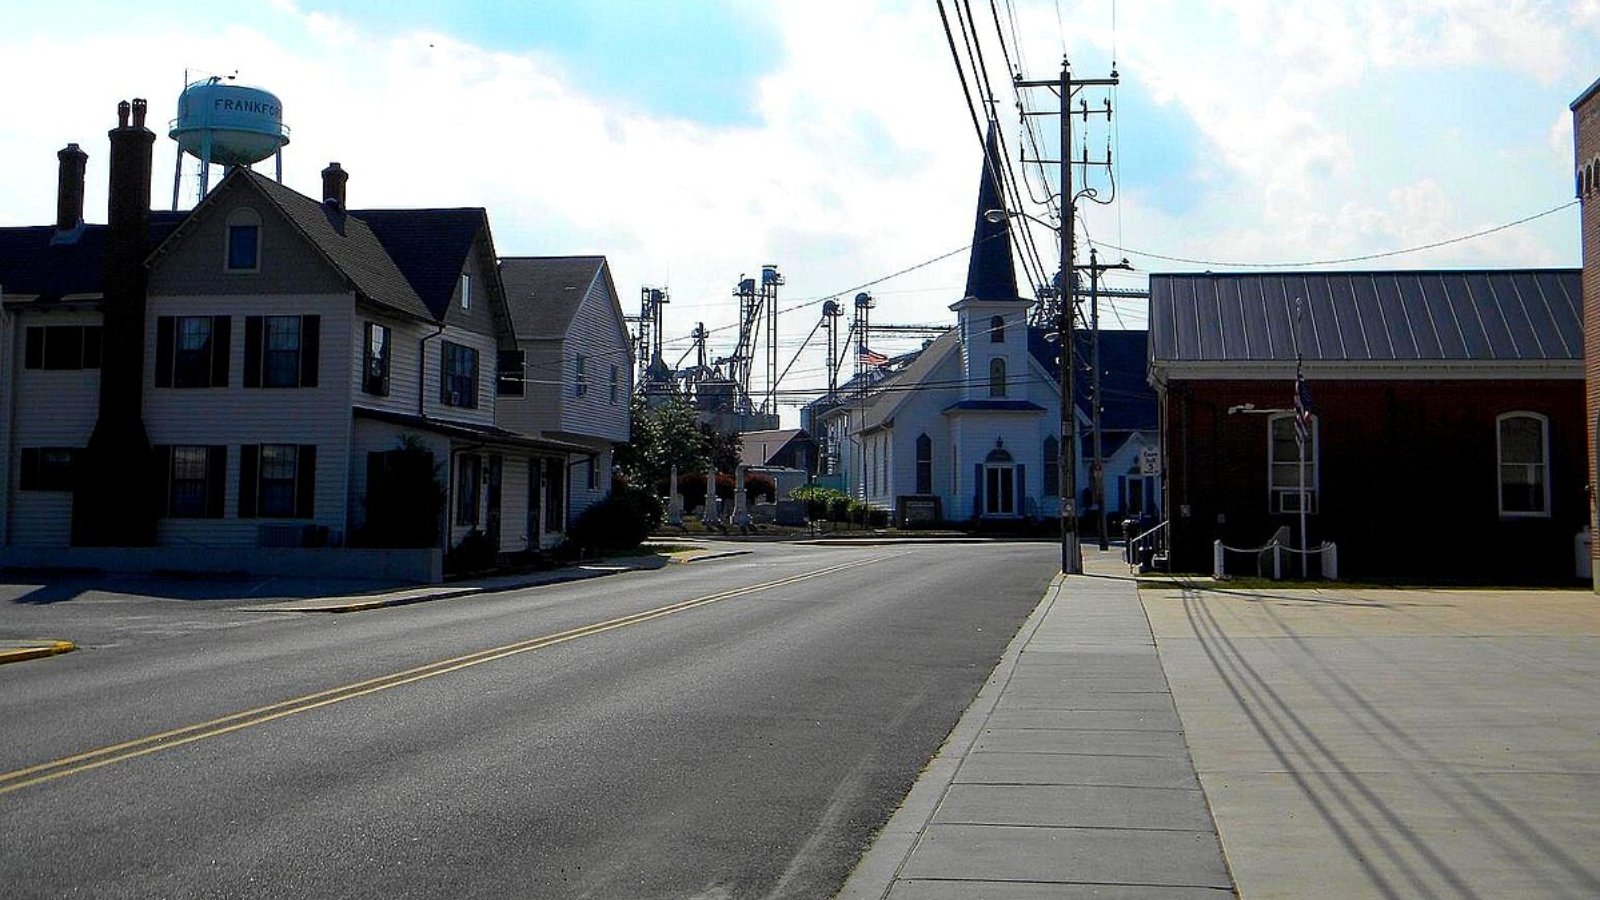
Tucked just a few miles inland from Bethany Beach, Frankford offers buyers more space and lower taxes than its coastal neighbors—without giving up beach proximity. That combination has long made it appealing for retirees and second-home buyers alike.
Recent housing spikes have been driven by increased demand for seasonal and year-round homes in lower Sussex County. Frankford’s modest recent decline in 2025 comes after several years of aggressive gains. Its long-term trend remains firmly upward, especially given its location near major resort towns without the beachfront premiums.
13. Townsend – 79% Home Price Increase Since 2010
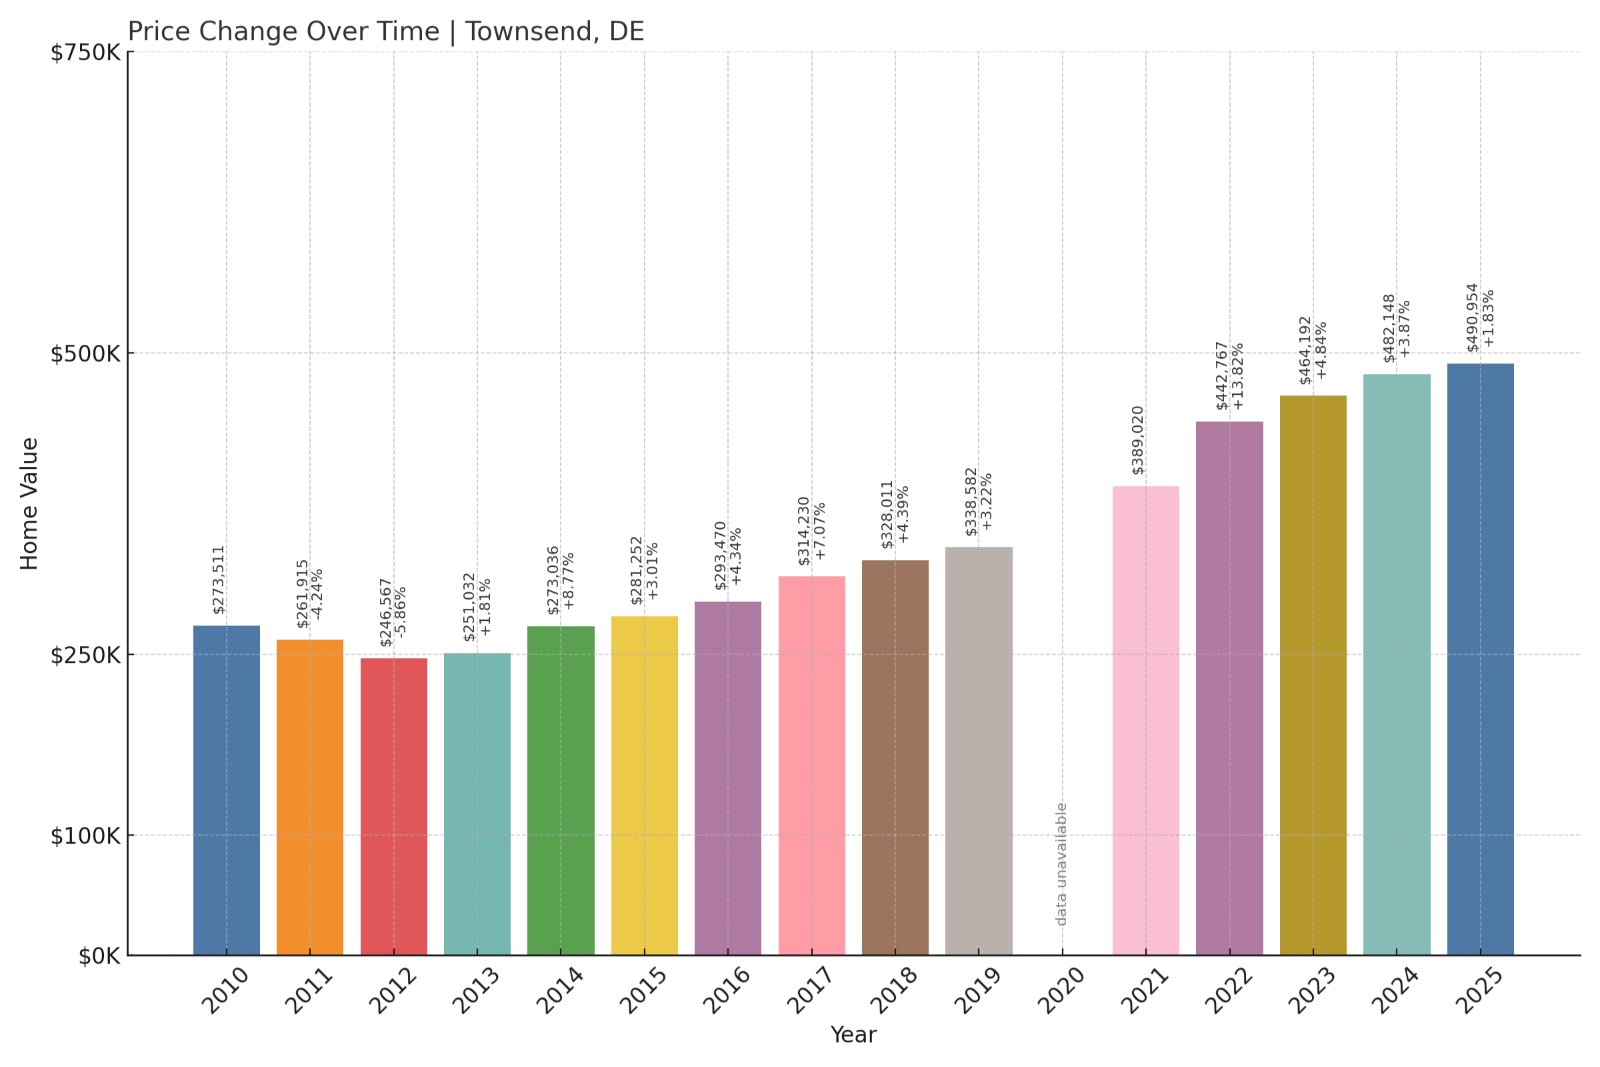
- 2010: $273,511
- 2011: $261,915 (-$11,596, -4.24% from previous year)
- 2012: $246,567 (-$15,348, -5.86% from previous year)
- 2013: $251,032 (+$4,465, +1.81% from previous year)
- 2014: $273,036 (+$22,004, +8.77% from previous year)
- 2015: $281,252 (+$8,216, +3.01% from previous year)
- 2016: $293,470 (+$12,218, +4.34% from previous year)
- 2017: $314,230 (+$20,760, +7.07% from previous year)
- 2018: $328,011 (+$13,781, +4.39% from previous year)
- 2019: $338,582 (+$10,570, +3.22% from previous year)
- 2020: N/A
- 2021: $389,020
- 2022: $442,767 (+$53,748, +13.82% from previous year)
- 2023: $464,192 (+$21,425, +4.84% from previous year)
- 2024: $482,148 (+$17,956, +3.87% from previous year)
- 2025: $490,954 (+$8,806, +1.83% from previous year)
Townsend’s home values have risen steadily, gaining 79% since 2010. Much of that increase came after 2020, with particularly strong gains from 2021 to 2023. While appreciation slowed slightly in 2024–2025, the town continues to see healthy year-over-year growth.
Townsend – Affordable Suburban Growth in Northern Delaware

Situated in New Castle County, Townsend offers an affordable suburban lifestyle that appeals to commuters working in Wilmington or even Philadelphia. With newer housing developments and good schools, it’s become a draw for families seeking more space without breaking the bank.
Rising prices in recent years reflect increased demand for suburban living, especially during the pandemic housing boom. Though growth has eased, Townsend continues to attract attention for its mix of affordability, access, and community feel.
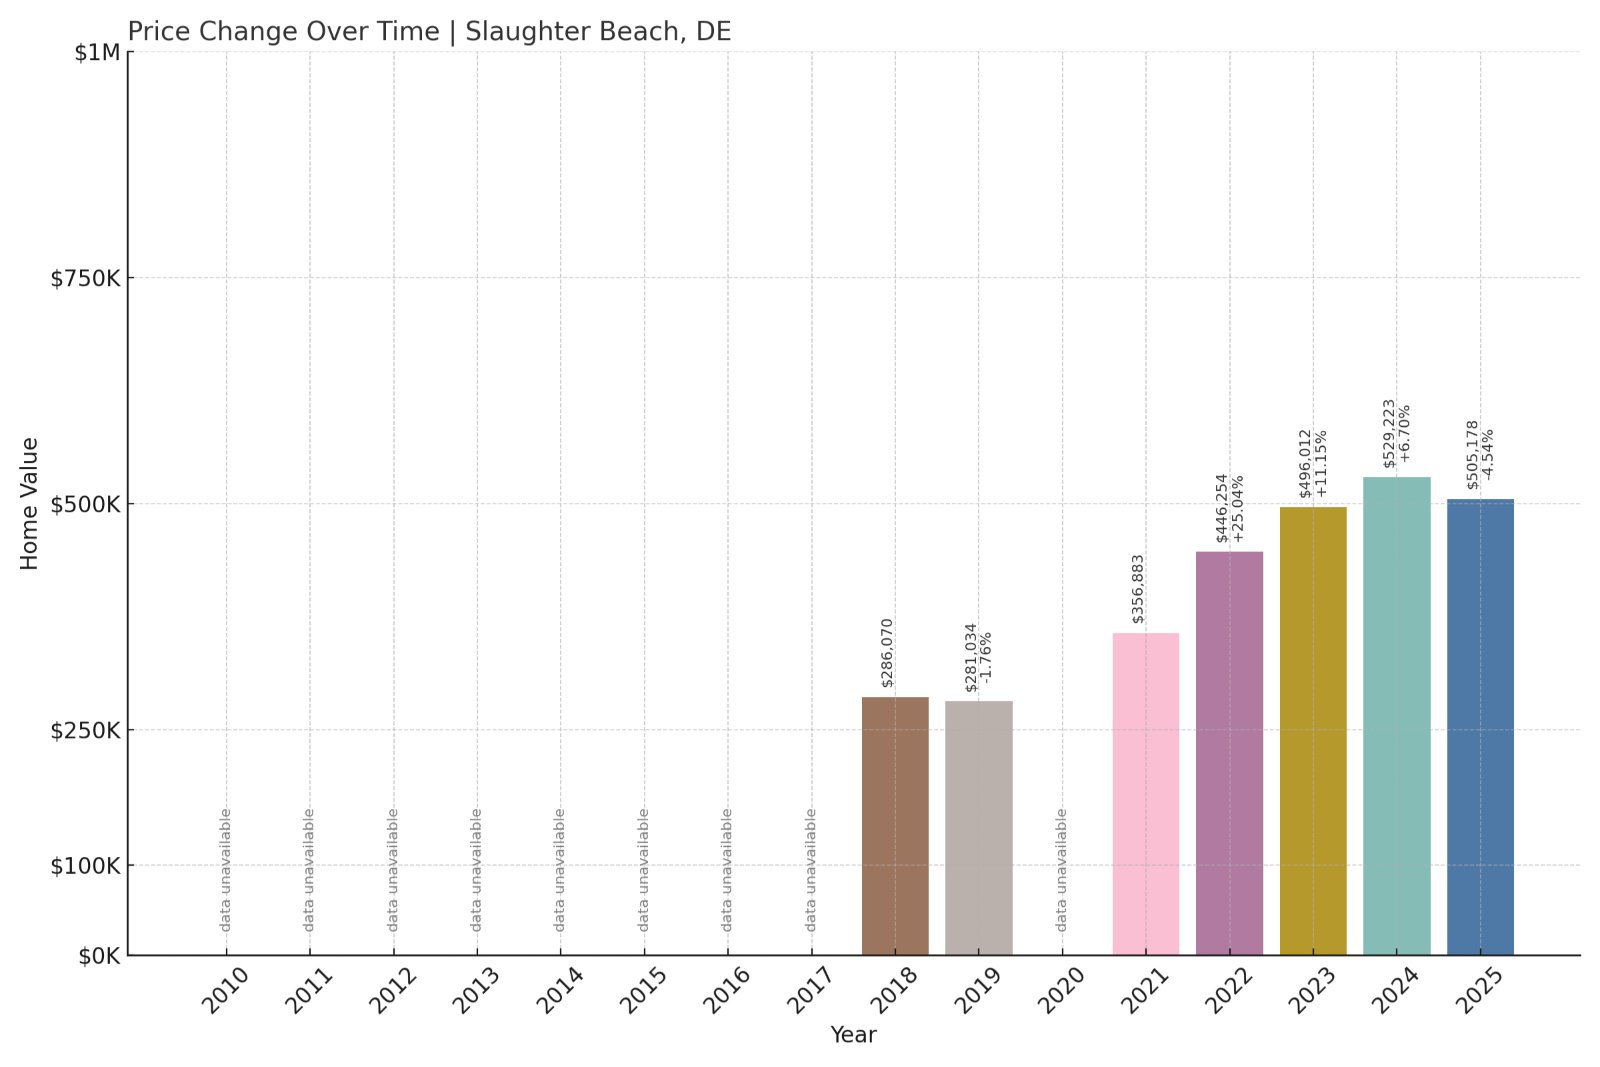
12. Slaughter Beach – 77% Home Price Increase Since 2018
- 2010: N/A
- 2011: N/A
- 2012: N/A
- 2013: N/A
- 2014: N/A
- 2015: N/A
- 2016: N/A
- 2017: N/A
- 2018: $286,070
- 2019: $281,034 (-$5,036, -1.76% from previous year)
- 2020: N/A
- 2021: $356,883
- 2022: $446,254 (+$89,370, +25.04% from previous year)
- 2023: $496,012 (+$49,758, +11.15% from previous year)
- 2024: $529,223 (+$33,212, +6.70% from previous year)
- 2025: $505,178 (-$24,046, -4.54% from previous year)
With available data starting in 2018, Slaughter Beach has seen a 77% increase in home values. The town posted significant double-digit gains from 2021 to 2023, though prices pulled back slightly in 2025 after rapid appreciation in prior years.
Slaughter Beach – Nature and Privacy Drive Premium Prices
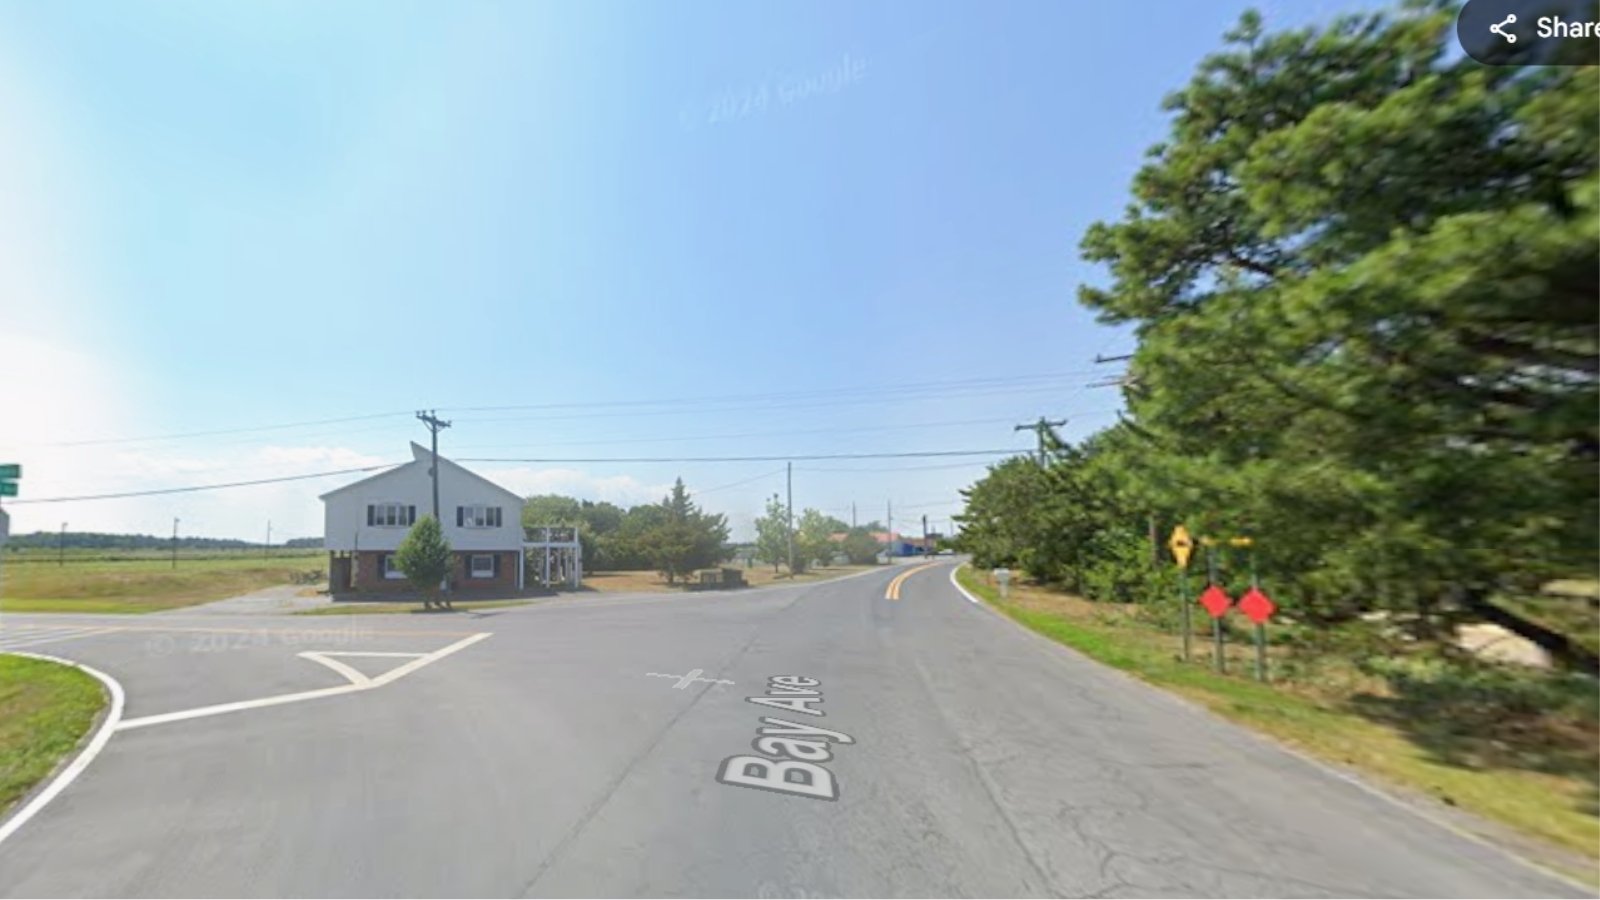
Slaughter Beach, located on the shores of Delaware Bay, is a peaceful and ecologically rich community. It’s known for its horseshoe crab spawning grounds, prime birdwatching, and protected coastline. These natural assets have helped boost its real estate value, especially among buyers looking for secluded waterfront homes.
The post-2020 surge in remote work increased interest in off-the-beaten-path locations, and Slaughter Beach fit the bill. Despite a slight dip in 2025, the long-term trend remains strong as inventory stays limited and interest in quiet coastal escapes endures.
11. Middletown – 105% Home Price Increase Since 2010
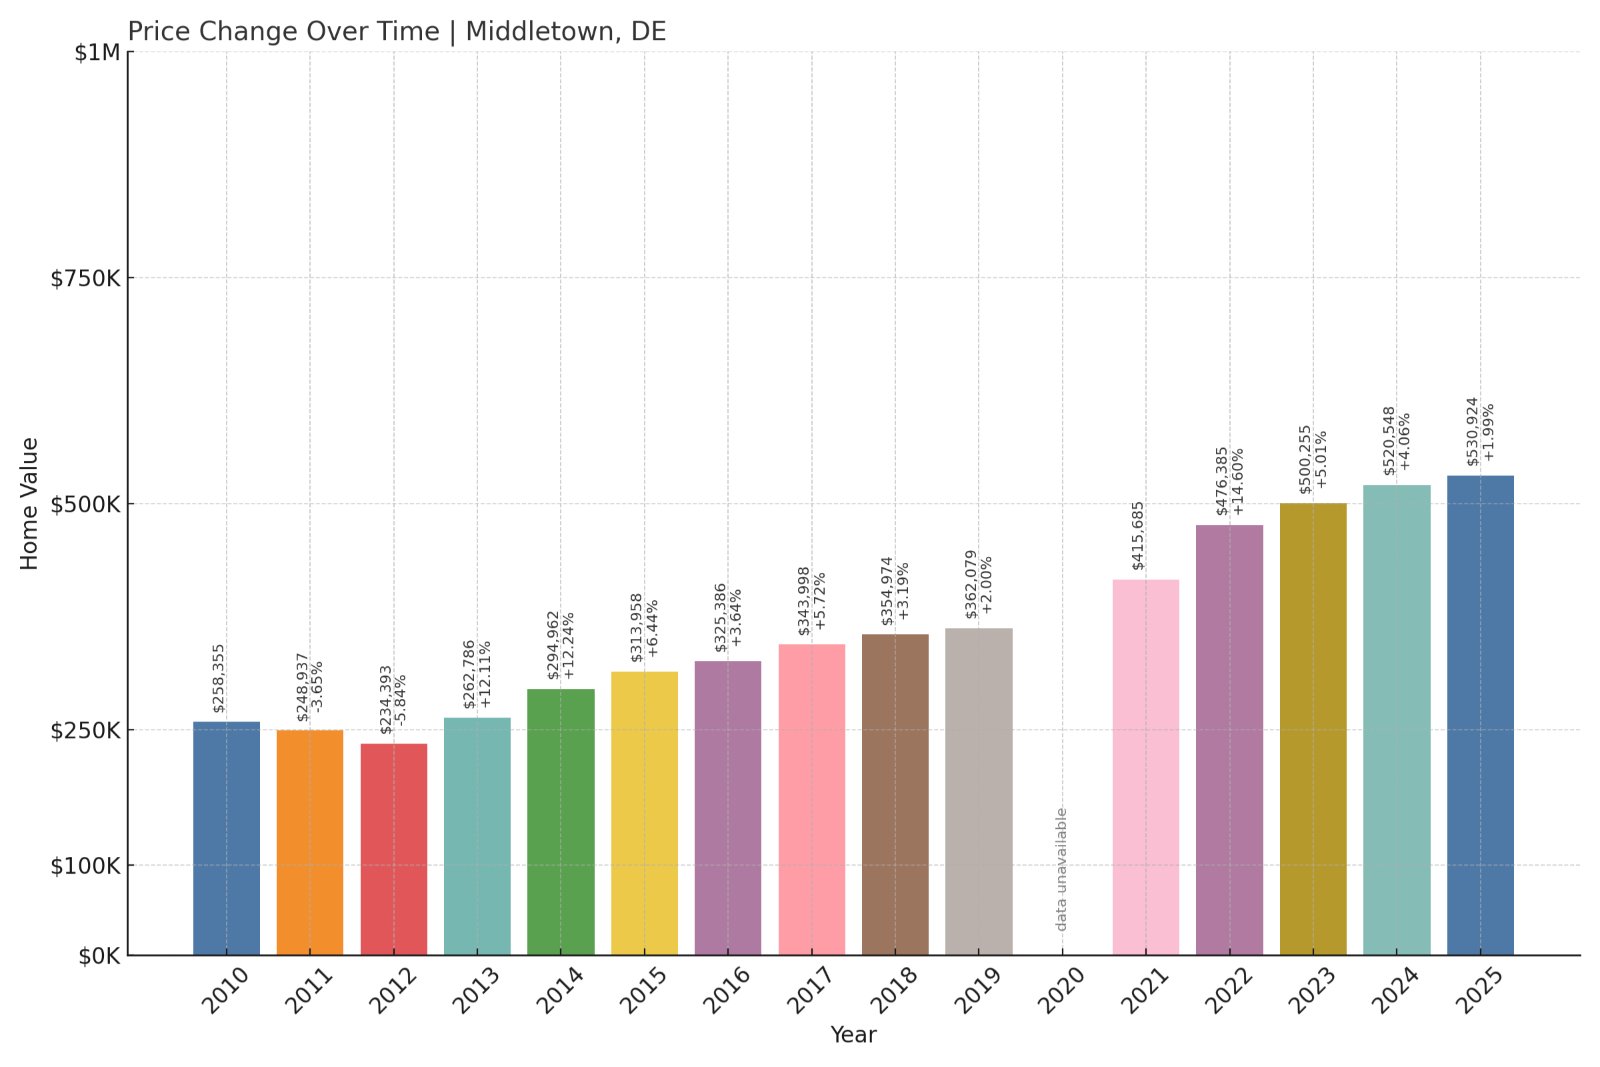
- 2010: $258,355
- 2011: $248,937 (-$9,418, -3.65% from previous year)
- 2012: $234,393 (-$14,545, -5.84% from previous year)
- 2013: $262,786 (+$28,394, +12.11% from previous year)
- 2014: $294,962 (+$32,176, +12.24% from previous year)
- 2015: $313,958 (+$18,996, +6.44% from previous year)
- 2016: $325,386 (+$11,428, +3.64% from previous year)
- 2017: $343,998 (+$18,612, +5.72% from previous year)
- 2018: $354,974 (+$10,976, +3.19% from previous year)
- 2019: $362,079 (+$7,106, +2.00% from previous year)
- 2020: N/A
- 2021: $415,685
- 2022: $476,385 (+$60,700, +14.60% from previous year)
- 2023: $500,255 (+$23,870, +5.01% from previous year)
- 2024: $520,548 (+$20,293, +4.06% from previous year)
- 2025: $530,924 (+$10,376, +1.99% from previous year)
Home values in Middletown have surged 105% since 2010. While annual gains have moderated since 2022, the long-term growth reflects consistent demand and population growth in the area.
Middletown – A Fast-Growing Hub With Suburban Appeal
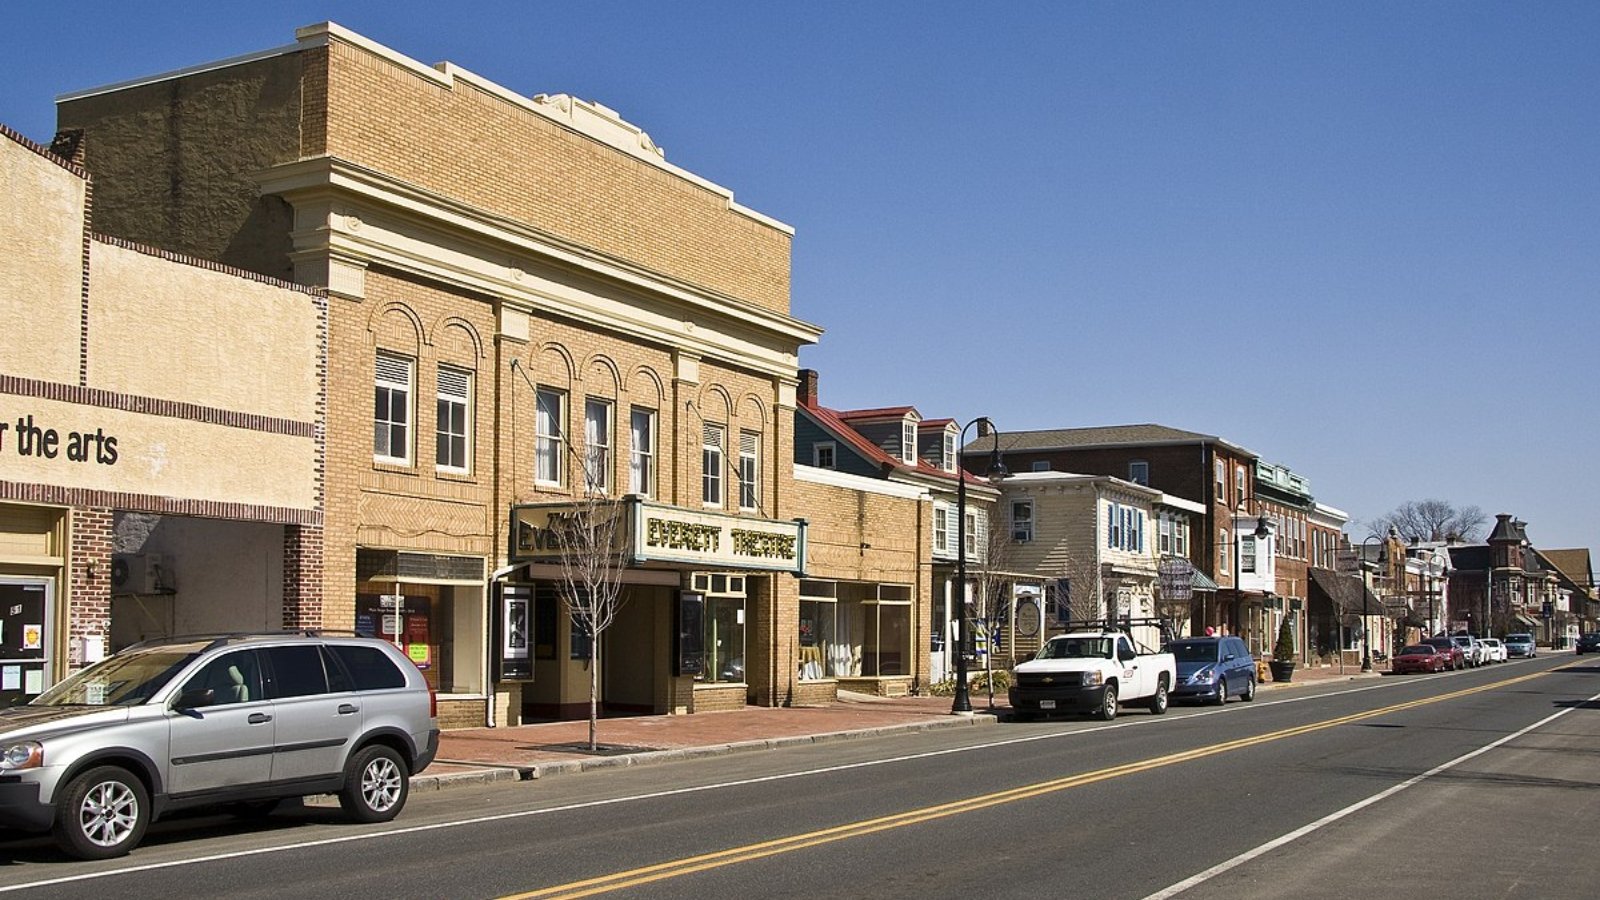
Middletown is one of Delaware’s fastest-growing towns, and that growth is clearly reflected in its home prices. Located in southern New Castle County, it has expanded rapidly thanks to new developments, good schools, and access to Wilmington and Newark.
The town’s price gains accelerated notably in the early 2020s. As more people sought larger homes and outdoor space, Middletown delivered. The housing market here shows continued momentum, even if the pace is more modest in 2025.
10. Selbyville – 85% Home Price Increase Since 2010
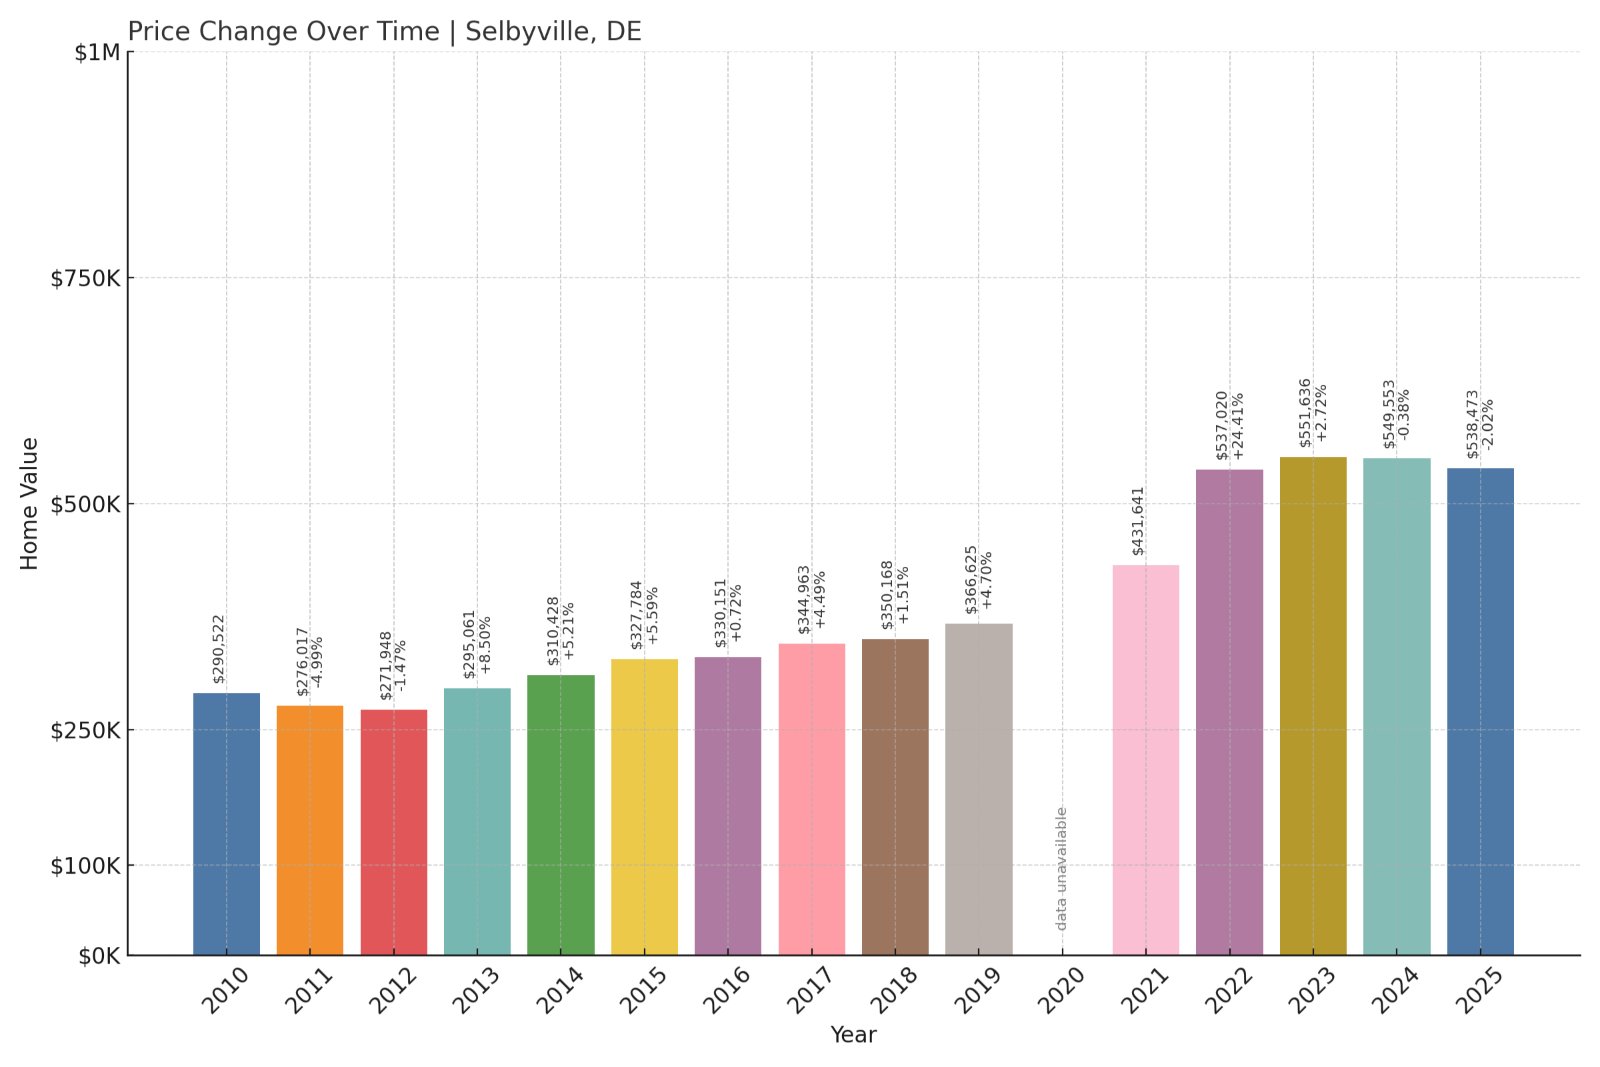
- 2010: $290,522
- 2011: $276,017 (-$14,505, -4.99% from previous year)
- 2012: $271,948 (-$4,069, -1.47% from previous year)
- 2013: $295,061 (+$23,112, +8.50% from previous year)
- 2014: $310,428 (+$15,367, +5.21% from previous year)
- 2015: $327,784 (+$17,357, +5.59% from previous year)
- 2016: $330,151 (+$2,366, +0.72% from previous year)
- 2017: $344,963 (+$14,812, +4.49% from previous year)
- 2018: $350,168 (+$5,205, +1.51% from previous year)
- 2019: $366,625 (+$16,457, +4.70% from previous year)
- 2020: N/A
- 2021: $431,641
- 2022: $537,020 (+$105,379, +24.41% from previous year)
- 2023: $551,636 (+$14,617, +2.72% from previous year)
- 2024: $549,553 (-$2,083, -0.38% from previous year)
- 2025: $538,473 (-$11,080, -2.02% from previous year)
Selbyville’s housing market has climbed 85% in value since 2010. After a major surge between 2021 and 2022, price momentum slowed and slightly reversed by 2025. Even with recent dips, homes in Selbyville remain significantly more expensive than a decade ago.
Selbyville – From Farming Community to Coastal Hotspot
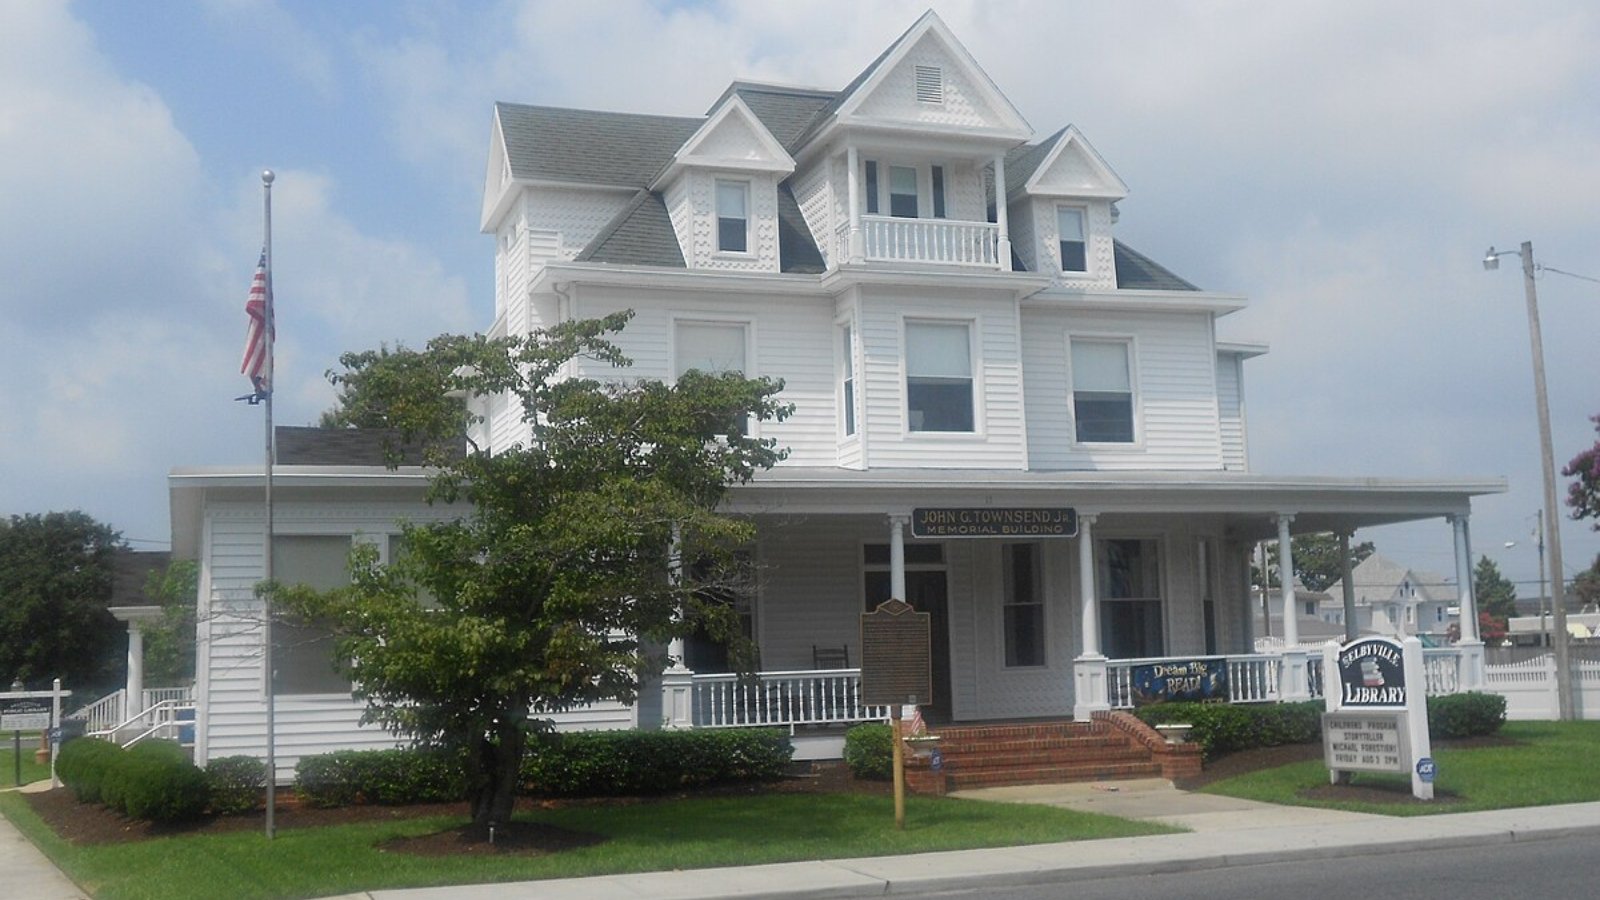
Just a few miles from the Maryland border and Fenwick Island, Selbyville has transformed from a small agricultural town into a thriving residential community. Its location near the beaches, combined with relatively lower prices compared to direct coastal areas, has made it attractive to both retirees and second-home buyers.
Recent price volatility may reflect a cooling demand post-peak, but the long-term trend is strong. Selbyville continues to benefit from proximity to Ocean City and resort-area growth, especially as more buyers seek alternatives to pricier beachfront towns.
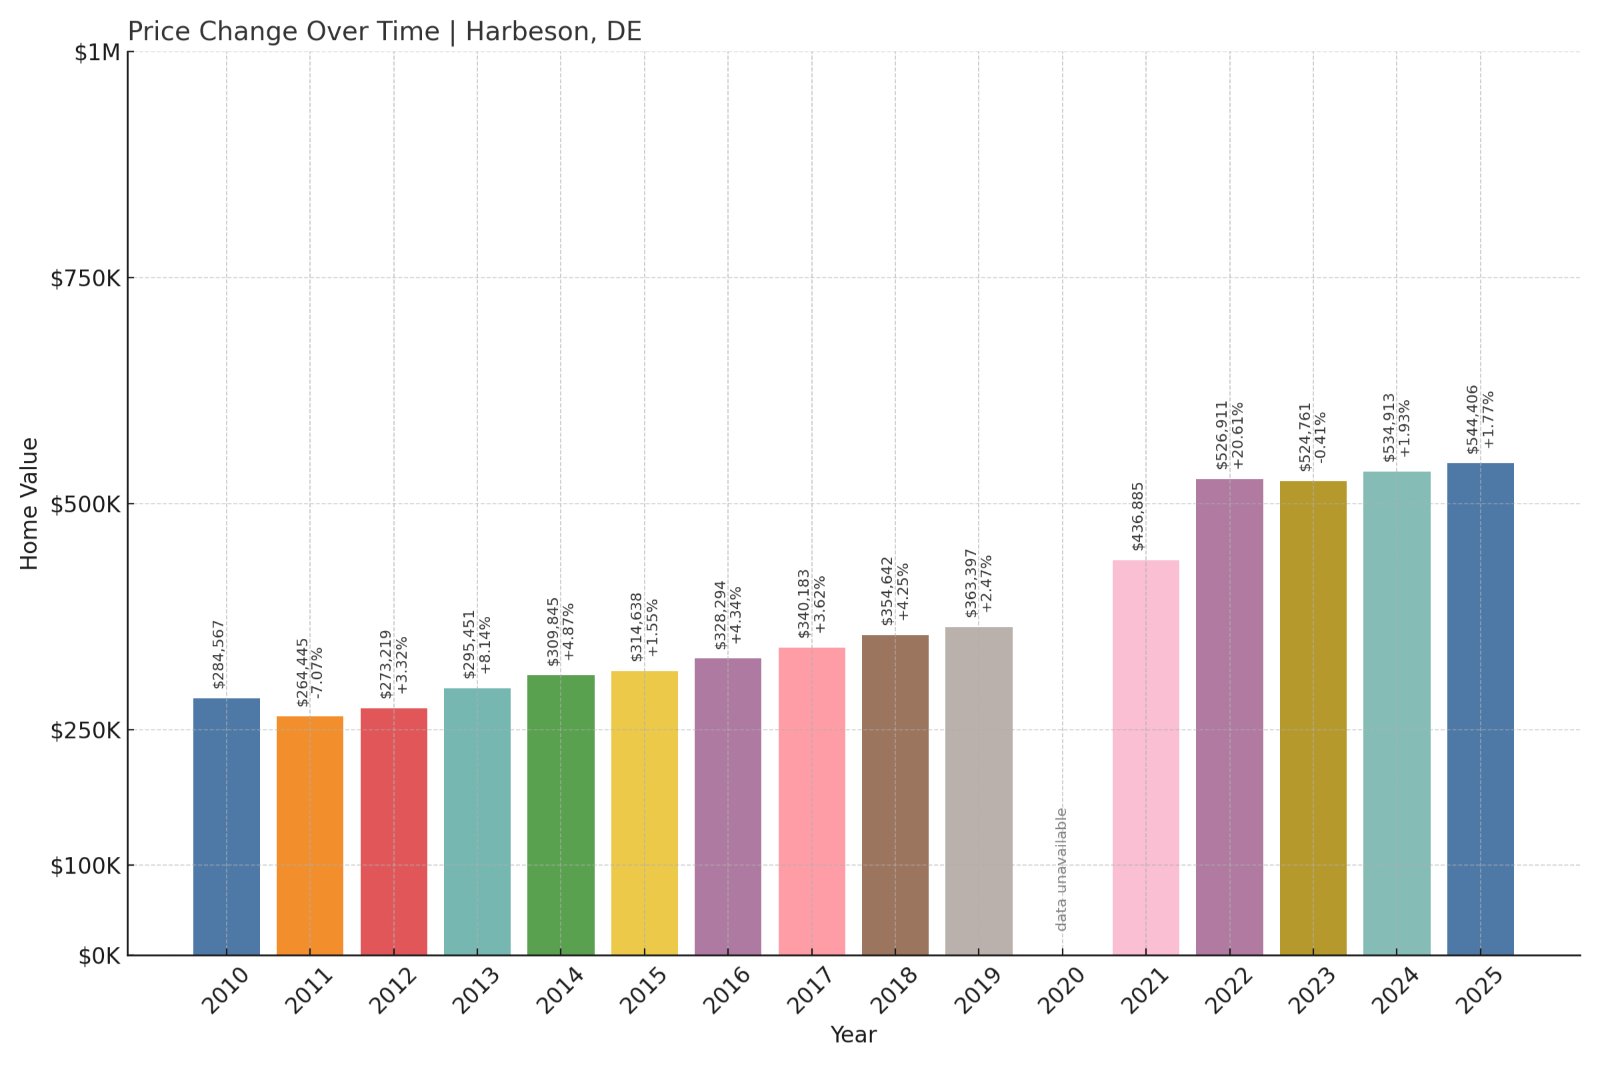
9. Harbeson – 91% Home Price Increase Since 2010
🔥 Would you like to save this?
- 2010: $284,567
- 2011: $264,445 (-$20,122, -7.07% from previous year)
- 2012: $273,219 (+$8,774, +3.32% from previous year)
- 2013: $295,451 (+$22,231, +8.14% from previous year)
- 2014: $309,845 (+$14,394, +4.87% from previous year)
- 2015: $314,638 (+$4,793, +1.55% from previous year)
- 2016: $328,294 (+$13,656, +4.34% from previous year)
- 2017: $340,183 (+$11,889, +3.62% from previous year)
- 2018: $354,642 (+$14,459, +4.25% from previous year)
- 2019: $363,397 (+$8,755, +2.47% from previous year)
- 2020: N/A
- 2021: $436,885
- 2022: $526,911 (+$90,026, +20.61% from previous year)
- 2023: $524,761 (-$2,150, -0.41% from previous year)
- 2024: $534,913 (+$10,153, +1.93% from previous year)
- 2025: $544,406 (+$9,492, +1.77% from previous year)
Harbeson has experienced a 91% jump in home values since 2010. Prices soared in the early 2020s and have stayed relatively steady since, posting mild gains after a small dip in 2023. The 2025 average sits at just over $544,000.
Harbeson – A Quiet Countryside With Rising Prices
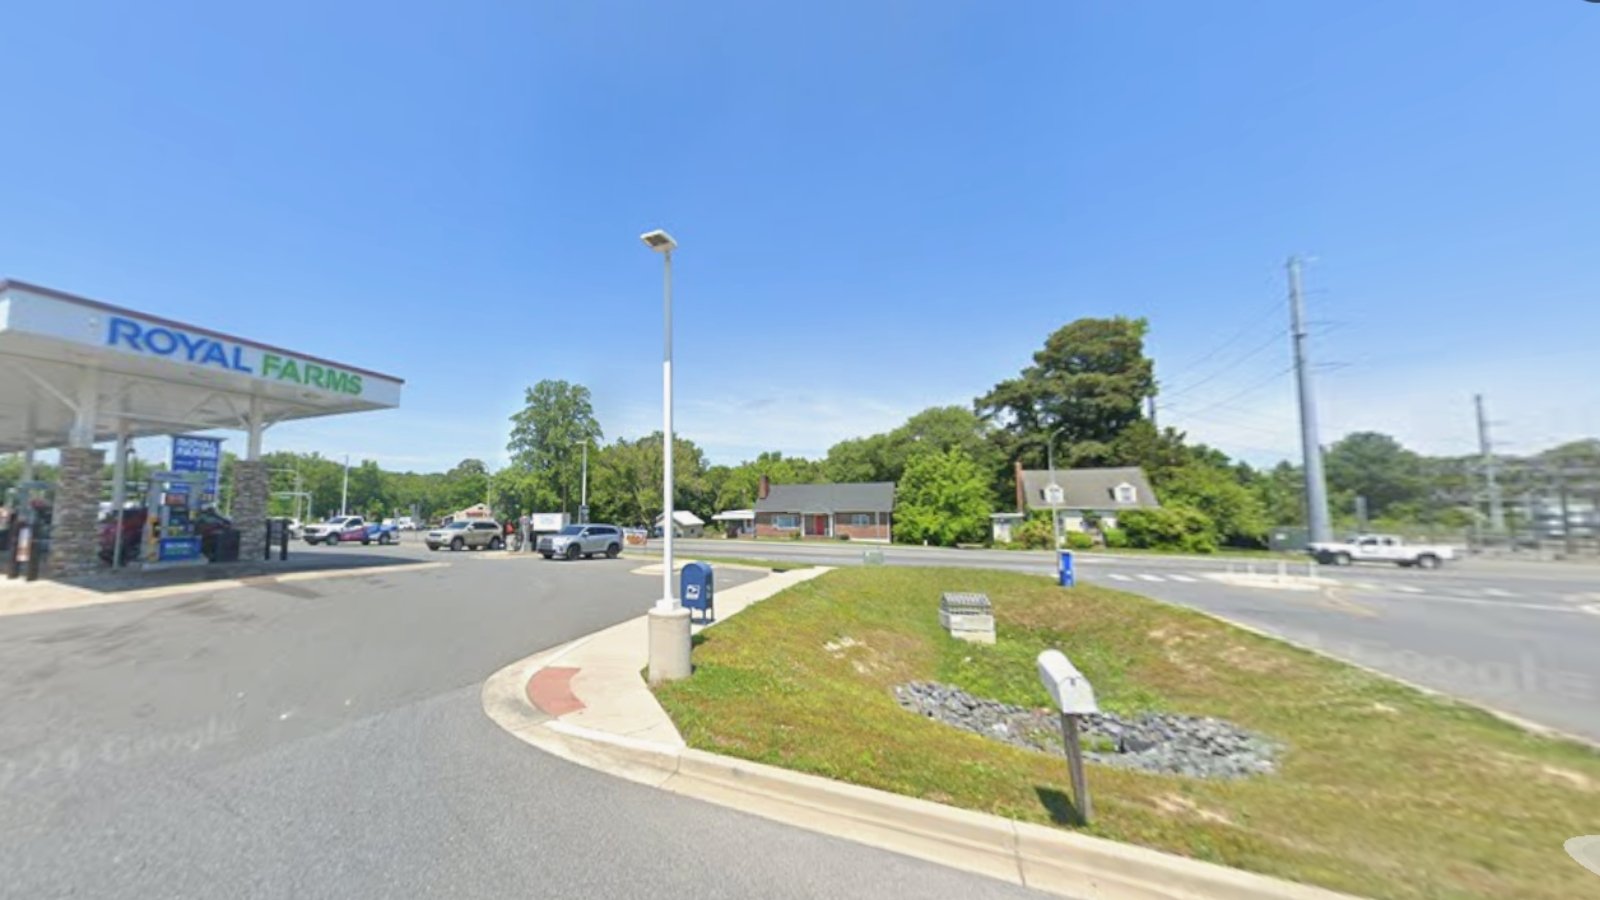
Harbeson lies inland from Lewes and Rehoboth Beach, offering a quieter, more rural feel while still being close to the coast. Once a quiet agricultural area, it’s become a target for homebuyers who want space and tranquility without sacrificing access to the beach.
The surge in prices after 2020 likely reflects increased interest in less dense areas during the pandemic. As new construction fills in and infrastructure improves, Harbeson’s value continues to inch upward at a steady pace, even as other towns fluctuate more wildly.
8. Ocean View – 60% Home Price Increase Since 2010
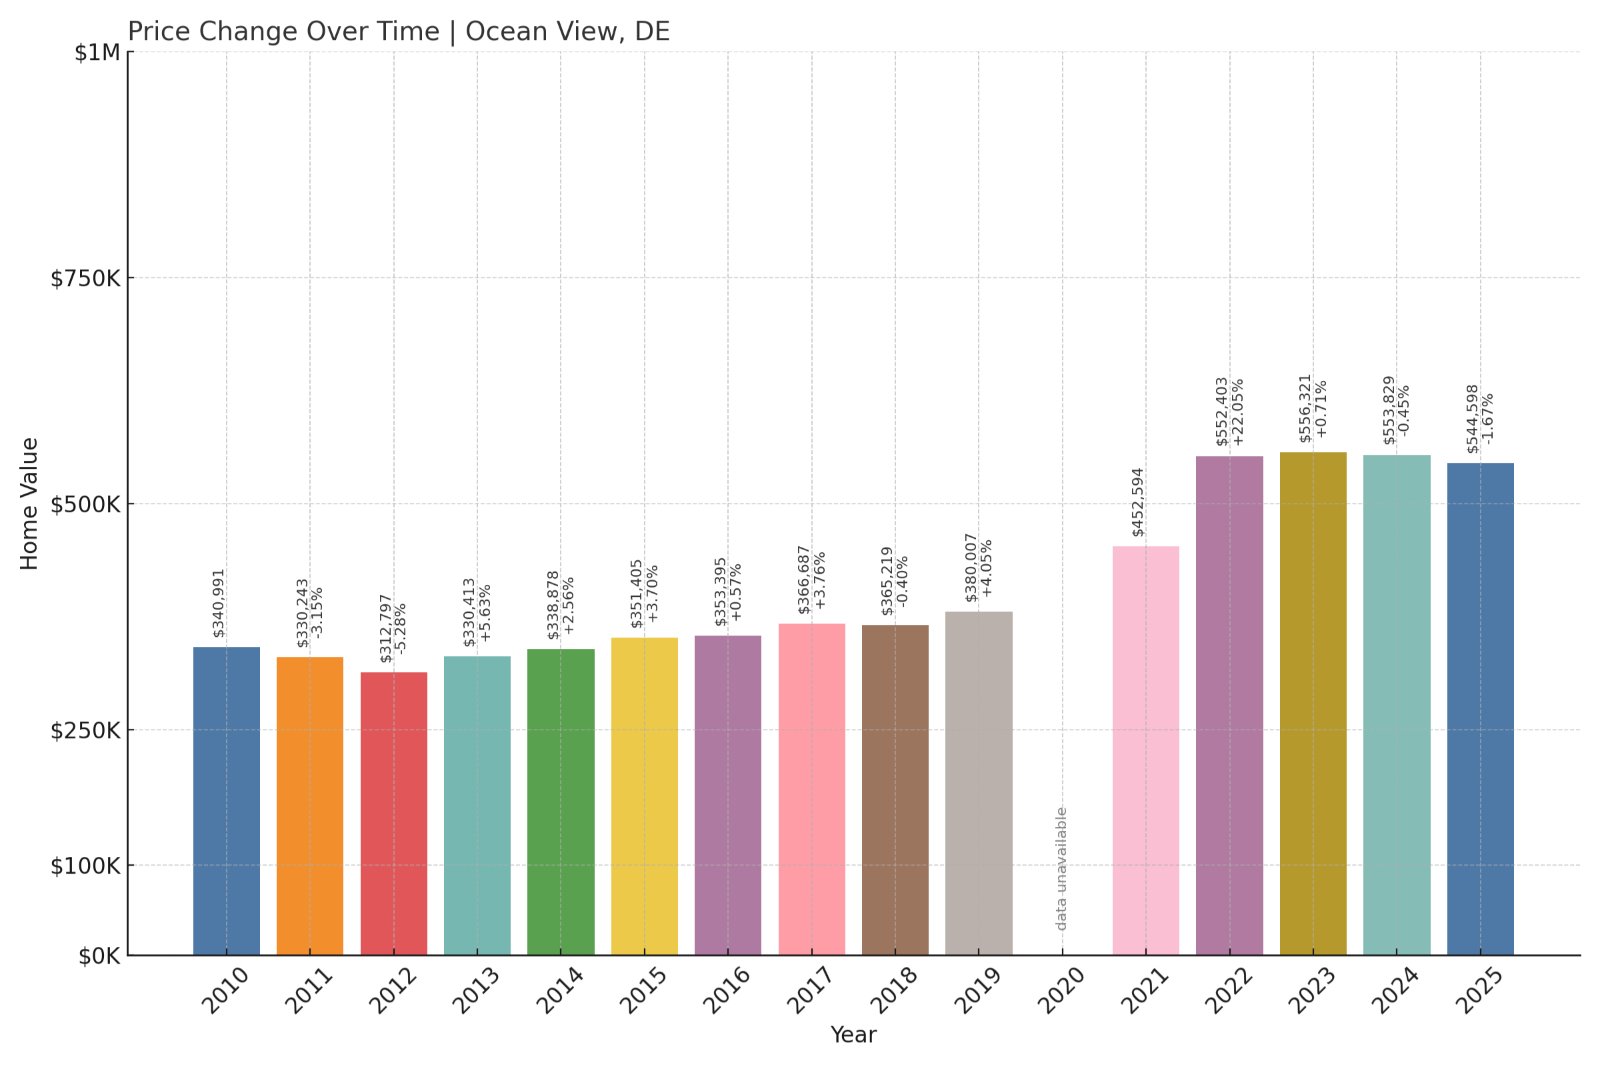
- 2010: $340,991
- 2011: $330,243 (-$10,748, -3.15% from previous year)
- 2012: $312,797 (-$17,446, -5.28% from previous year)
- 2013: $330,413 (+$17,616, +5.63% from previous year)
- 2014: $338,878 (+$8,465, +2.56% from previous year)
- 2015: $351,405 (+$12,527, +3.70% from previous year)
- 2016: $353,395 (+$1,990, +0.57% from previous year)
- 2017: $366,687 (+$13,292, +3.76% from previous year)
- 2018: $365,219 (-$1,467, -0.40% from previous year)
- 2019: $380,007 (+$14,788, +4.05% from previous year)
- 2020: N/A
- 2021: $452,594
- 2022: $552,403 (+$99,809, +22.05% from previous year)
- 2023: $556,321 (+$3,919, +0.71% from previous year)
- 2024: $553,829 (-$2,492, -0.45% from previous year)
- 2025: $544,598 (-$9,231, -1.67% from previous year)
Ocean View’s home prices have risen 60% since 2010. After peaking in 2022, values have ticked down slightly, ending at $544,598 in 2025. Even so, prices remain far higher than they were pre-pandemic, and well above state averages.
Ocean View – Proximity to Bethany Keeps Prices Elevated
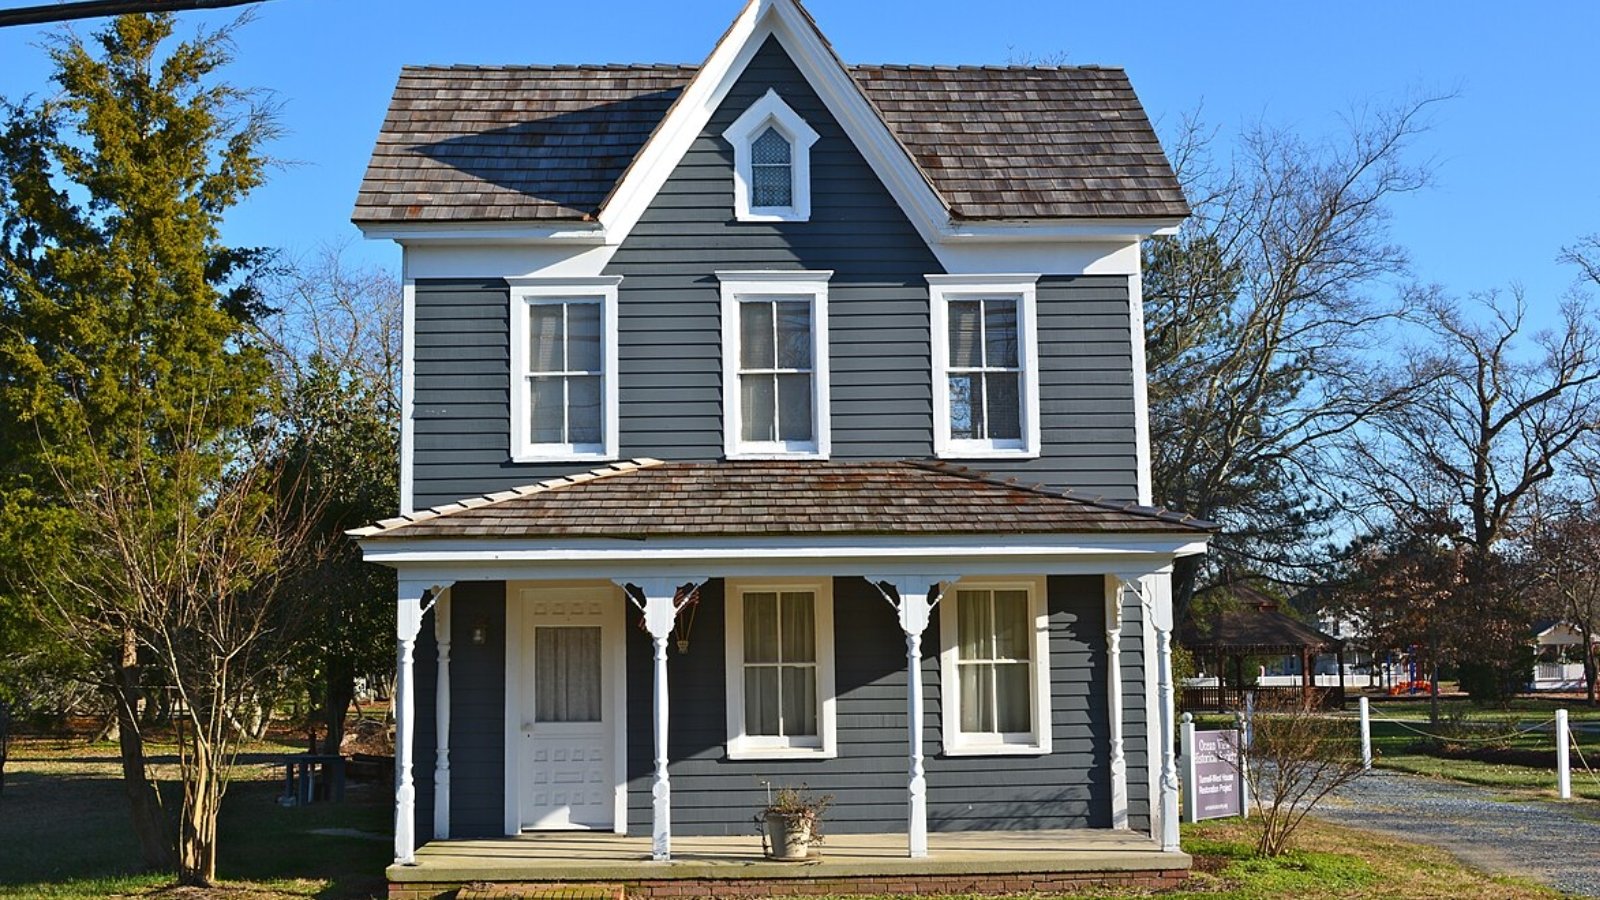
Ocean View benefits from being just a short drive from Bethany Beach, making it a highly desirable location for those who want to be near the ocean without paying beachfront premiums. It has grown steadily in popularity with retirees and second-home owners.
Its property values soared in the early 2020s as demand for coastal living boomed. Despite a slight cooling over the past two years, Ocean View remains one of Delaware’s most in-demand spots, thanks to its blend of charm, walkability, and nearby recreation.
7. Hockessin – 56% Home Price Increase Since 2010
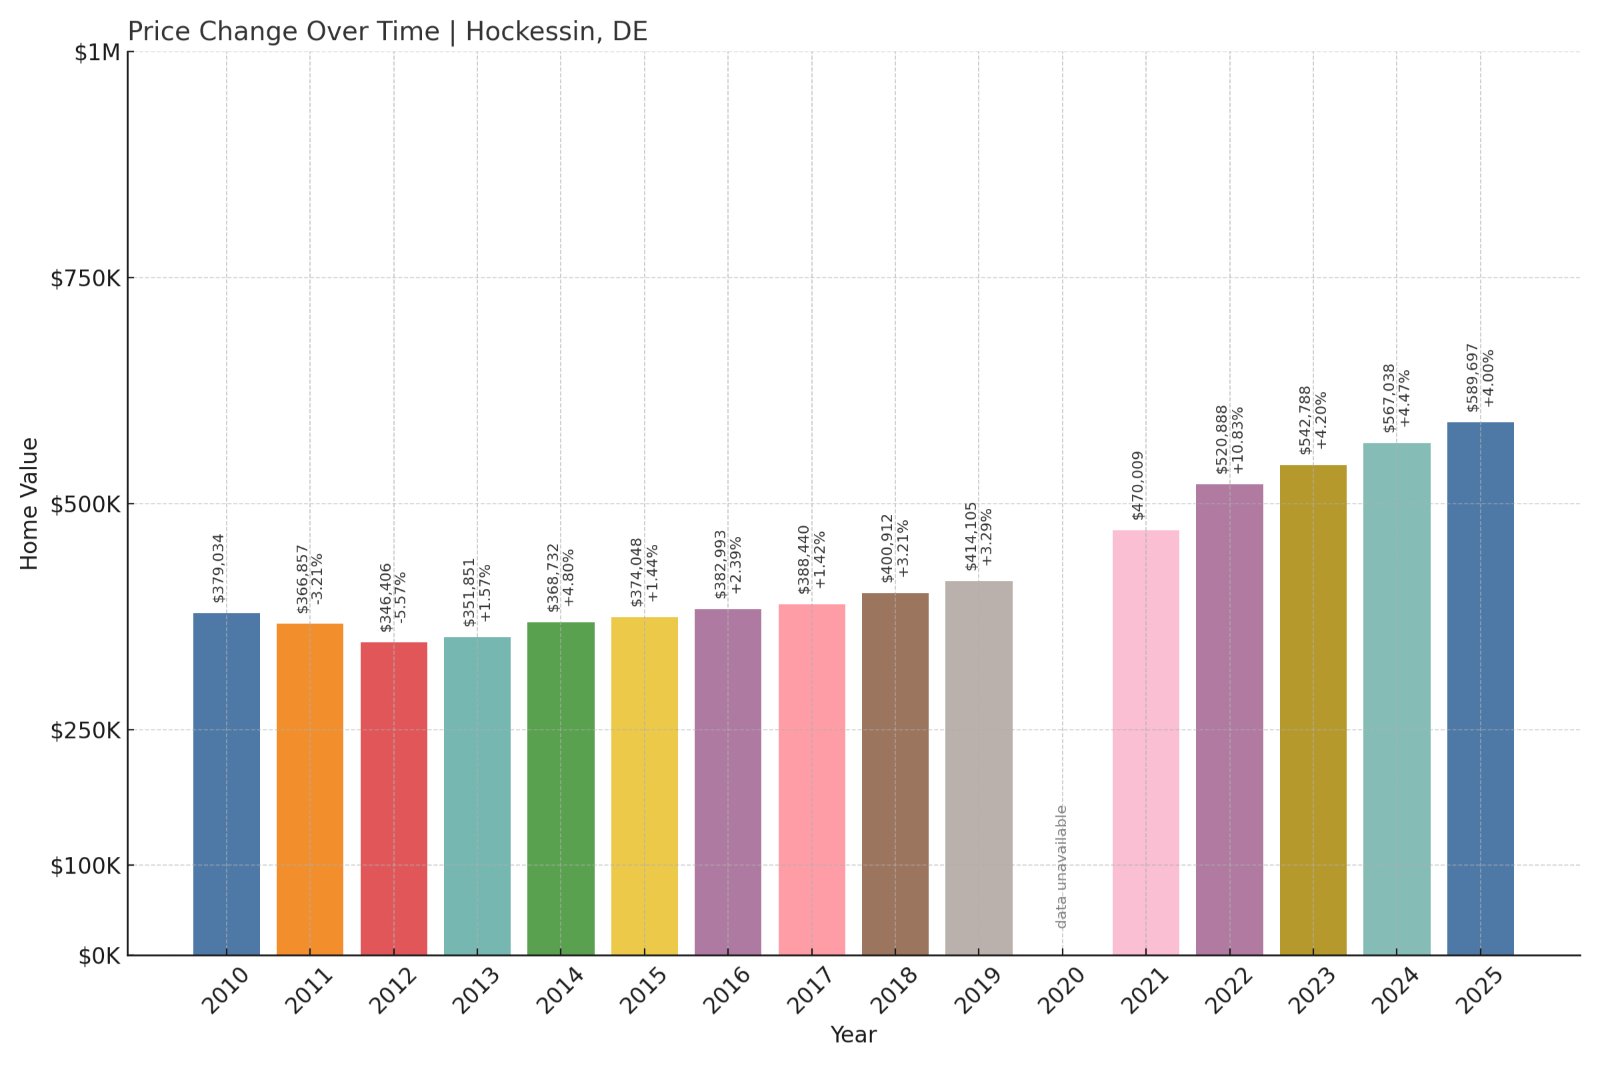
- 2010: $379,034
- 2011: $366,857 (-$12,177, -3.21% from previous year)
- 2012: $346,406 (-$20,451, -5.57% from previous year)
- 2013: $351,851 (+$5,445, +1.57% from previous year)
- 2014: $368,732 (+$16,881, +4.80% from previous year)
- 2015: $374,048 (+$5,316, +1.44% from previous year)
- 2016: $382,993 (+$8,945, +2.39% from previous year)
- 2017: $388,440 (+$5,448, +1.42% from previous year)
- 2018: $400,912 (+$12,472, +3.21% from previous year)
- 2019: $414,105 (+$13,192, +3.29% from previous year)
- 2020: N/A
- 2021: $470,009
- 2022: $520,888 (+$50,879, +10.83% from previous year)
- 2023: $542,788 (+$21,900, +4.20% from previous year)
- 2024: $567,038 (+$24,251, +4.47% from previous year)
- 2025: $589,697 (+$22,659, +4.00% from previous year)
Hockessin has posted a 56% increase in home values since 2010, with especially strong growth since 2021. Prices rose each year from 2021 to 2025, showing consistent buyer interest and high demand for this well-established suburb.
Hockessin – A Stronghold of Stability and Upscale Living
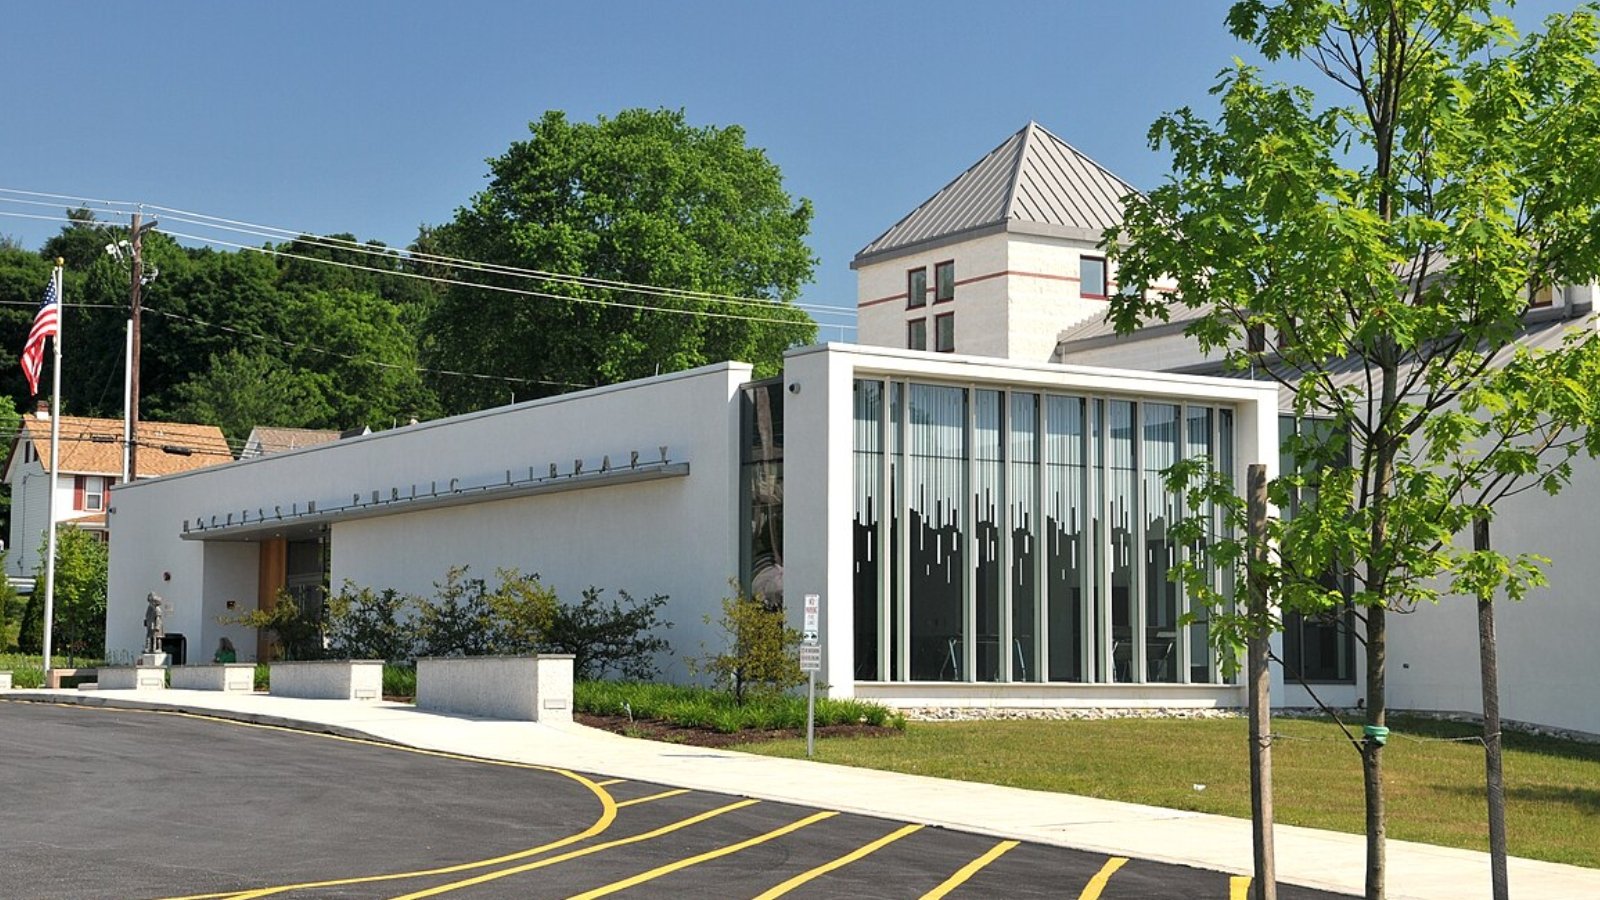
One of northern Delaware’s most affluent communities, Hockessin is known for its top-rated schools, spacious homes, and well-maintained neighborhoods. Its proximity to Wilmington and access to Pennsylvania’s job markets make it a favorite among professionals and families.
The town’s price growth has been gradual but steady, reflecting a mature market with enduring appeal. As newer developments slowed across the region, Hockessin’s established housing stock has held—and grown—its value year after year.
6. Lewes – 71% Home Price Increase Since 2010
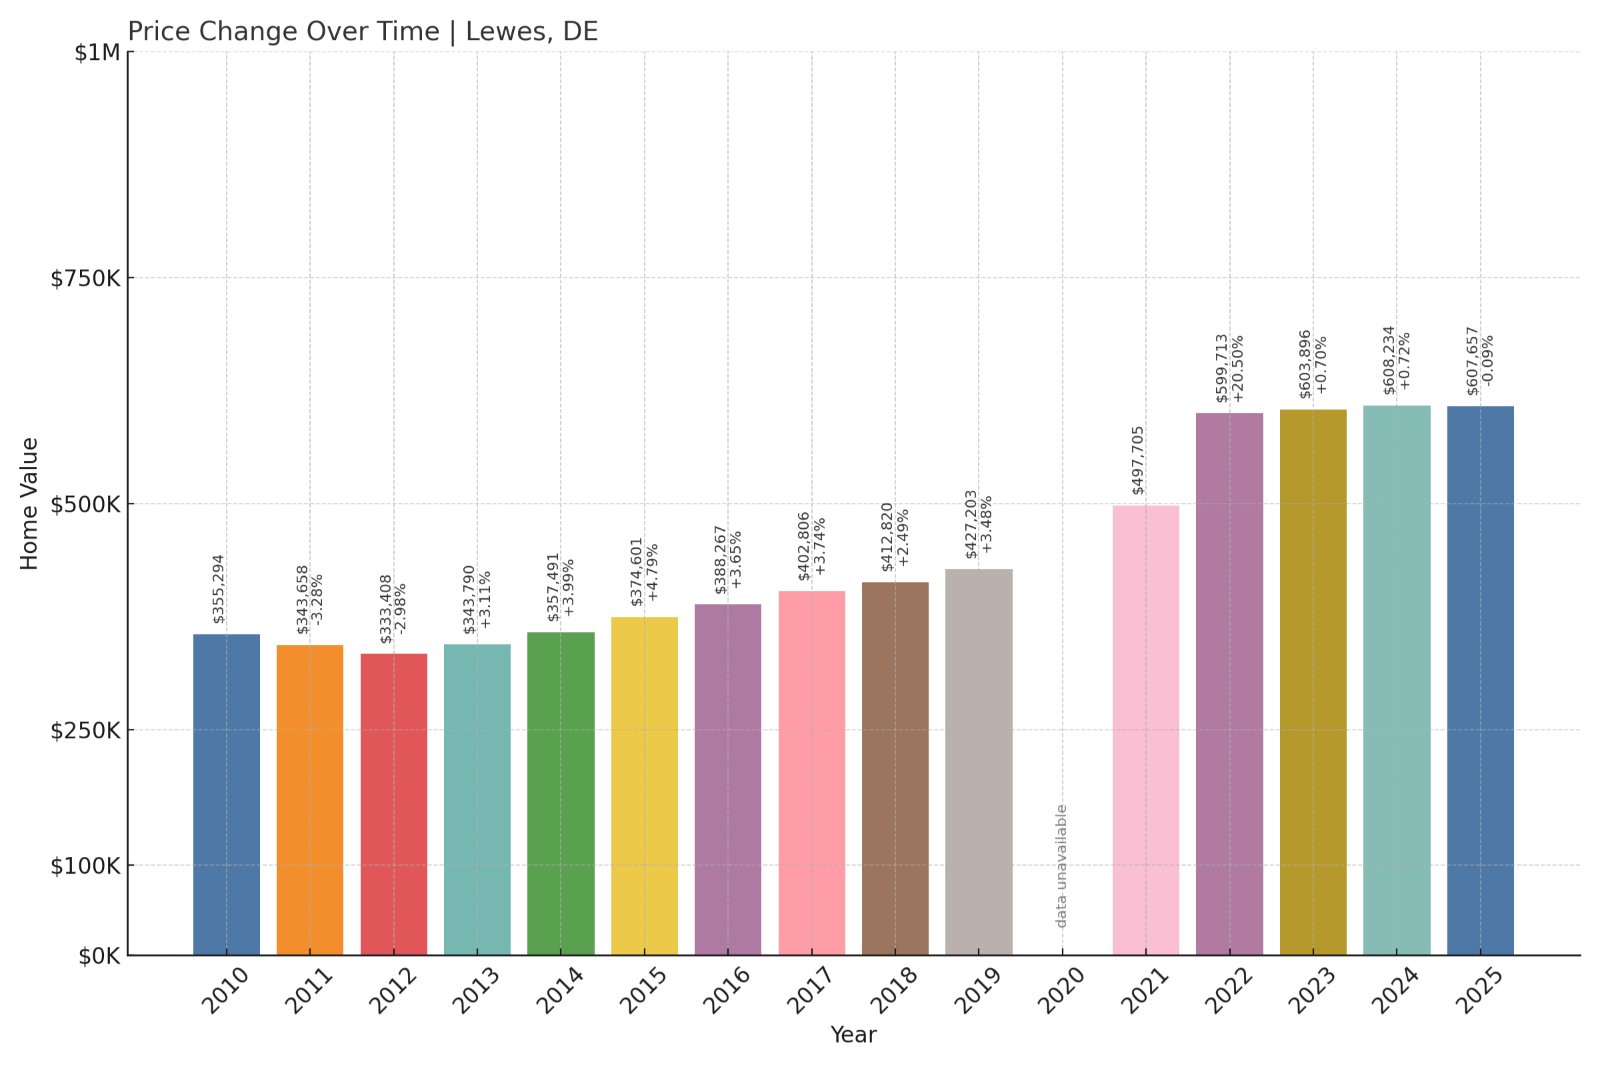
- 2010: $355,294
- 2011: $343,658 (-$11,636, -3.28% from previous year)
- 2012: $333,408 (-$10,250, -2.98% from previous year)
- 2013: $343,790 (+$10,382, +3.11% from previous year)
- 2014: $357,491 (+$13,701, +3.99% from previous year)
- 2015: $374,601 (+$17,111, +4.79% from previous year)
- 2016: $388,267 (+$13,666, +3.65% from previous year)
- 2017: $402,806 (+$14,539, +3.74% from previous year)
- 2018: $412,820 (+$10,014, +2.49% from previous year)
- 2019: $427,203 (+$14,382, +3.48% from previous year)
- 2020: N/A
- 2021: $497,705
- 2022: $599,713 (+$102,008, +20.50% from previous year)
- 2023: $603,896 (+$4,183, +0.70% from previous year)
- 2024: $608,234 (+$4,338, +0.72% from previous year)
- 2025: $607,657 (-$577, -0.09% from previous year)
Lewes has seen a 71% rise in home prices since 2010, with the biggest increase coming between 2021 and 2022. While recent years have shown more modest gains—and even a slight dip in 2025—the long-term trend remains firmly upward, with prices stabilizing above the $600K mark.
Lewes – Historic Charm and Strong Coastal Demand
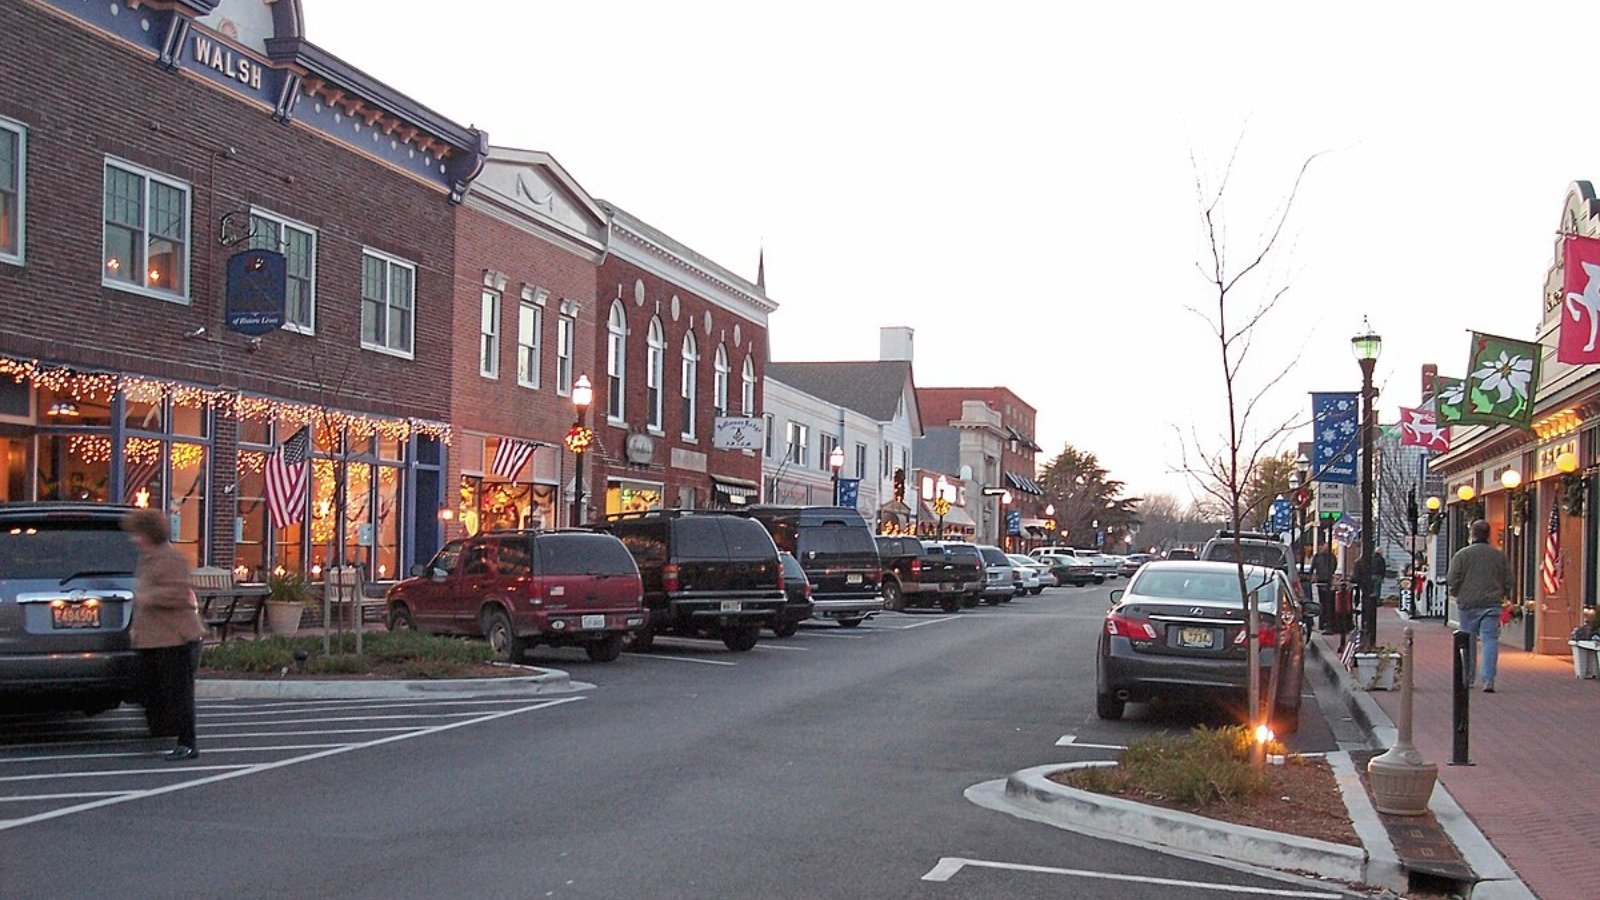
As one of Delaware’s oldest towns, Lewes offers a unique mix of colonial heritage, walkable streets, and beach access. Located where the Delaware Bay meets the Atlantic Ocean, it’s a hotspot for both full-time residents and seasonal visitors.
The real estate boom here reflects Lewes’s blend of history and high livability. Its 2022 price spike suggests a wave of demand during the remote work migration, when coastal towns saw explosive interest. While prices have leveled out, Lewes remains a sought-after—and expensive—place to live.
5. Rehoboth Beach – 79% Home Price Increase Since 2010
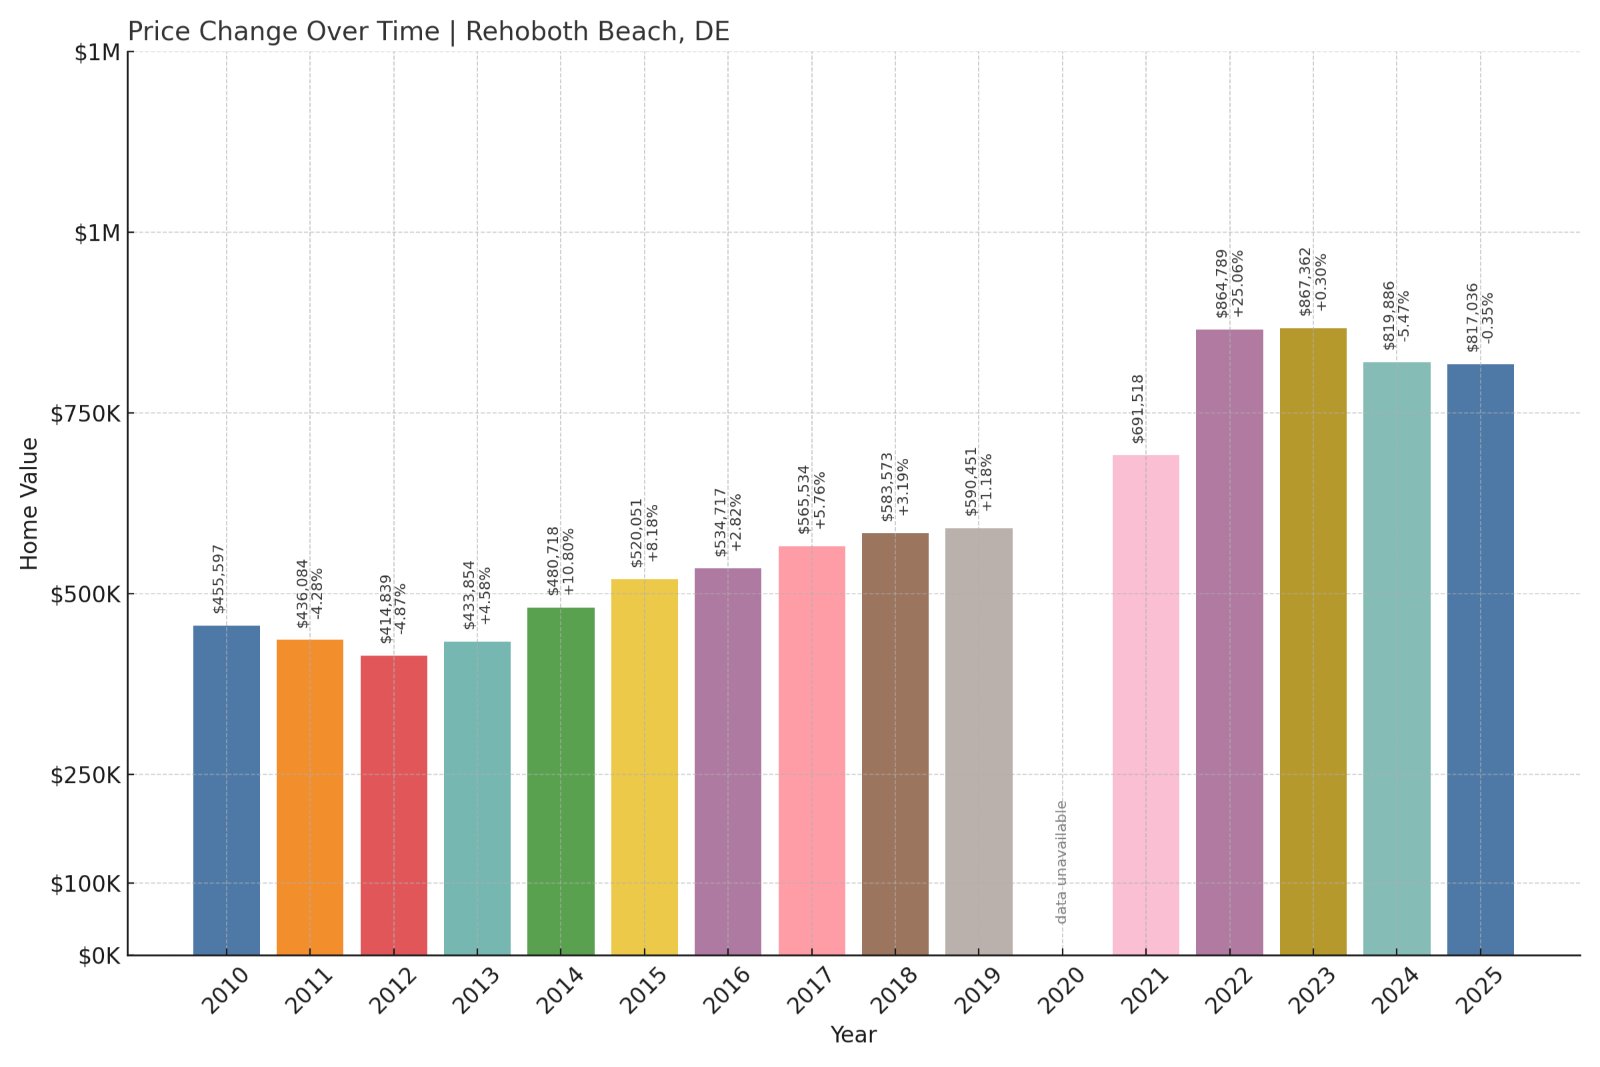
- 2010: $455,597
- 2011: $436,084 (-$19,513, -4.28% from previous year)
- 2012: $414,839 (-$21,245, -4.87% from previous year)
- 2013: $433,854 (+$19,015, +4.58% from previous year)
- 2014: $480,718 (+$46,863, +10.80% from previous year)
- 2015: $520,051 (+$39,334, +8.18% from previous year)
- 2016: $534,717 (+$14,666, +2.82% from previous year)
- 2017: $565,534 (+$30,817, +5.76% from previous year)
- 2018: $583,573 (+$18,038, +3.19% from previous year)
- 2019: $590,451 (+$6,878, +1.18% from previous year)
- 2020: N/A
- 2021: $691,518
- 2022: $864,789 (+$173,271, +25.06% from previous year)
- 2023: $867,362 (+$2,573, +0.30% from previous year)
- 2024: $819,886 (-$47,476, -5.47% from previous year)
- 2025: $817,036 (-$2,850, -0.35% from previous year)
Home prices in Rehoboth Beach have climbed 79% since 2010, bolstered by a huge leap in 2022. While the market has cooled since, values remain high—averaging over $800K in 2025—and well above pre-pandemic levels.
Rehoboth Beach – Delaware’s Flagship Resort Town
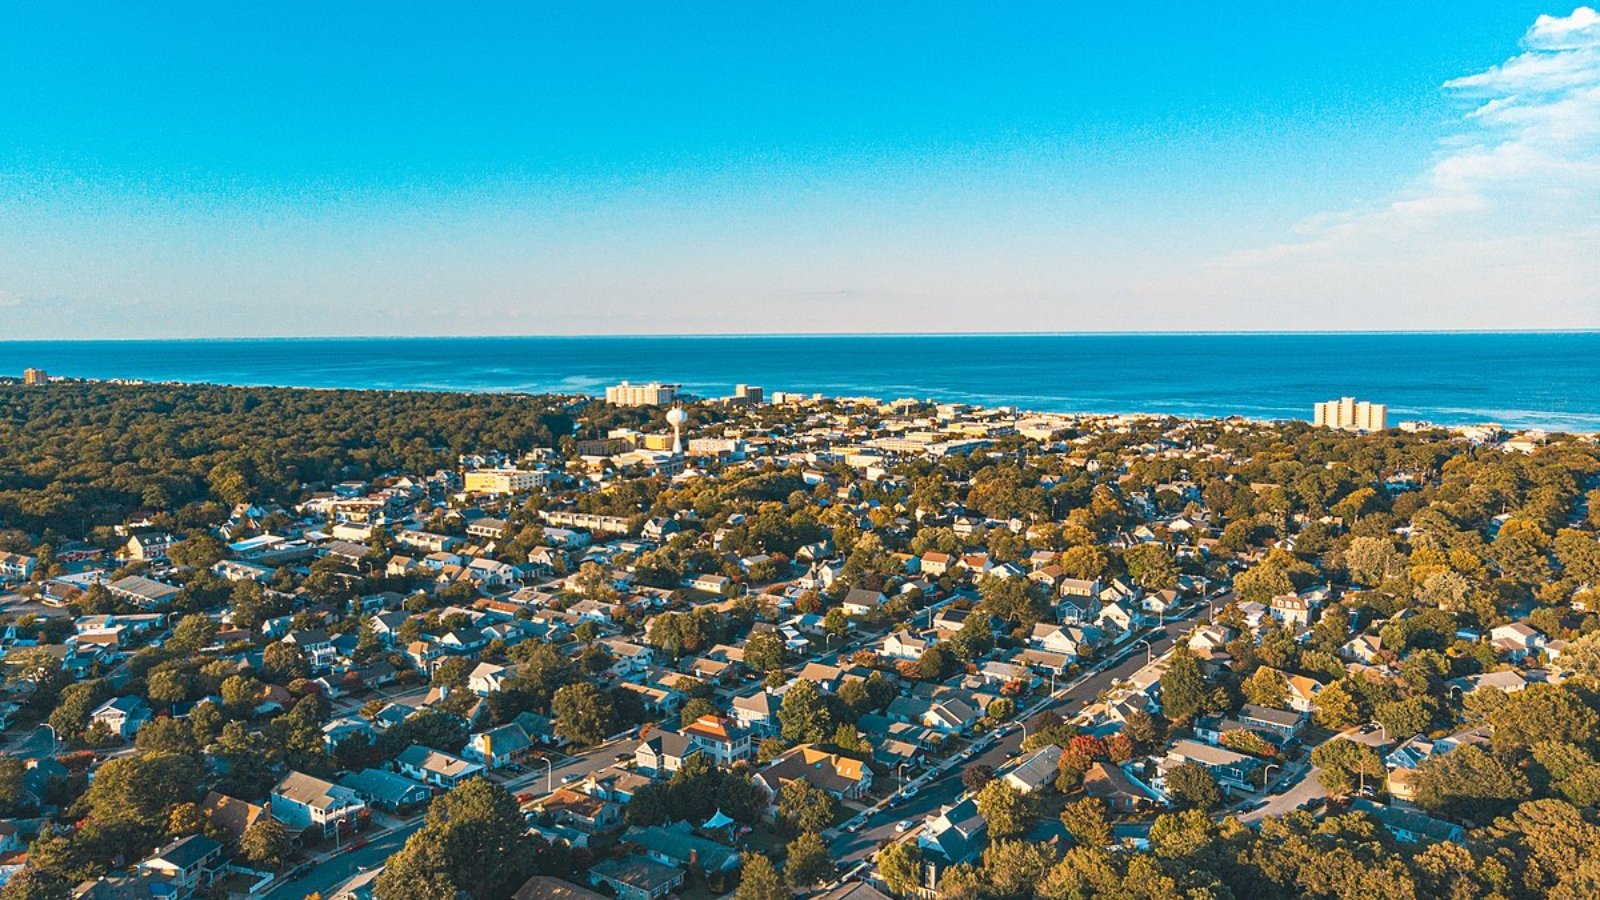
Rehoboth Beach is arguably Delaware’s most recognizable coastal destination. With a lively boardwalk, boutique shops, restaurants, and oceanfront homes, it attracts both tourists and long-term homeowners.
The explosive price growth in 2022 mirrored national trends in high-demand vacation areas, as buyers sought space and flexibility. While prices have tapered slightly since then, the town’s enduring popularity ensures it remains among the most expensive markets in the state.
4. Bethany Beach – 30% Home Price Increase Since 2010
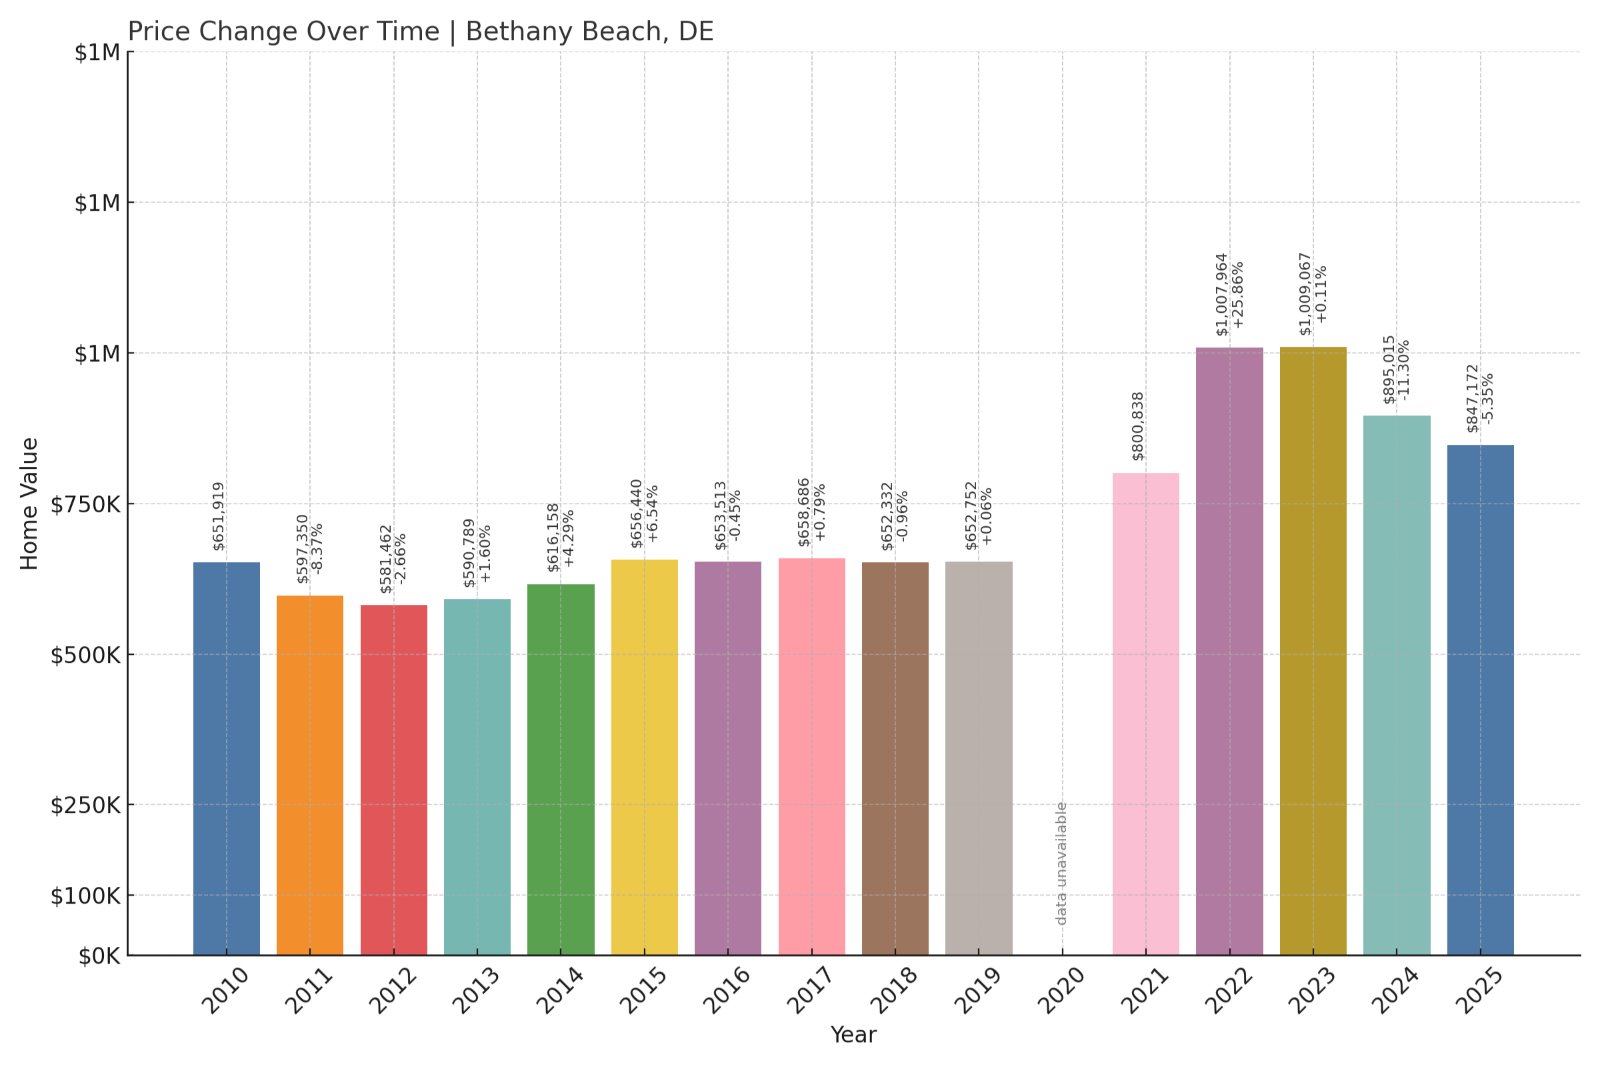
- 2010: $651,919
- 2011: $597,350 (-$54,569, -8.37% from previous year)
- 2012: $581,462 (-$15,888, -2.66% from previous year)
- 2013: $590,789 (+$9,327, +1.60% from previous year)
- 2014: $616,158 (+$25,369, +4.29% from previous year)
- 2015: $656,440 (+$40,283, +6.54% from previous year)
- 2016: $653,513 (-$2,927, -0.45% from previous year)
- 2017: $658,686 (+$5,173, +0.79% from previous year)
- 2018: $652,332 (-$6,354, -0.96% from previous year)
- 2019: $652,752 (+$420, +0.06% from previous year)
- 2020: N/A
- 2021: $800,838
- 2022: $1,007,964 (+$207,126, +25.86% from previous year)
- 2023: $1,009,067 (+$1,102, +0.11% from previous year)
- 2024: $895,015 (-$114,052, -11.30% from previous year)
- 2025: $847,172 (-$47,843, -5.35% from previous year)
Bethany Beach has seen a 30% price increase since 2010, though the path has been uneven. A sharp rise in 2021–2022 was followed by steep drops in 2024 and 2025. Despite that, average prices remain high—well over $800K in 2025.
Bethany Beach – Premium Pricing in a Laid-Back Beach Community
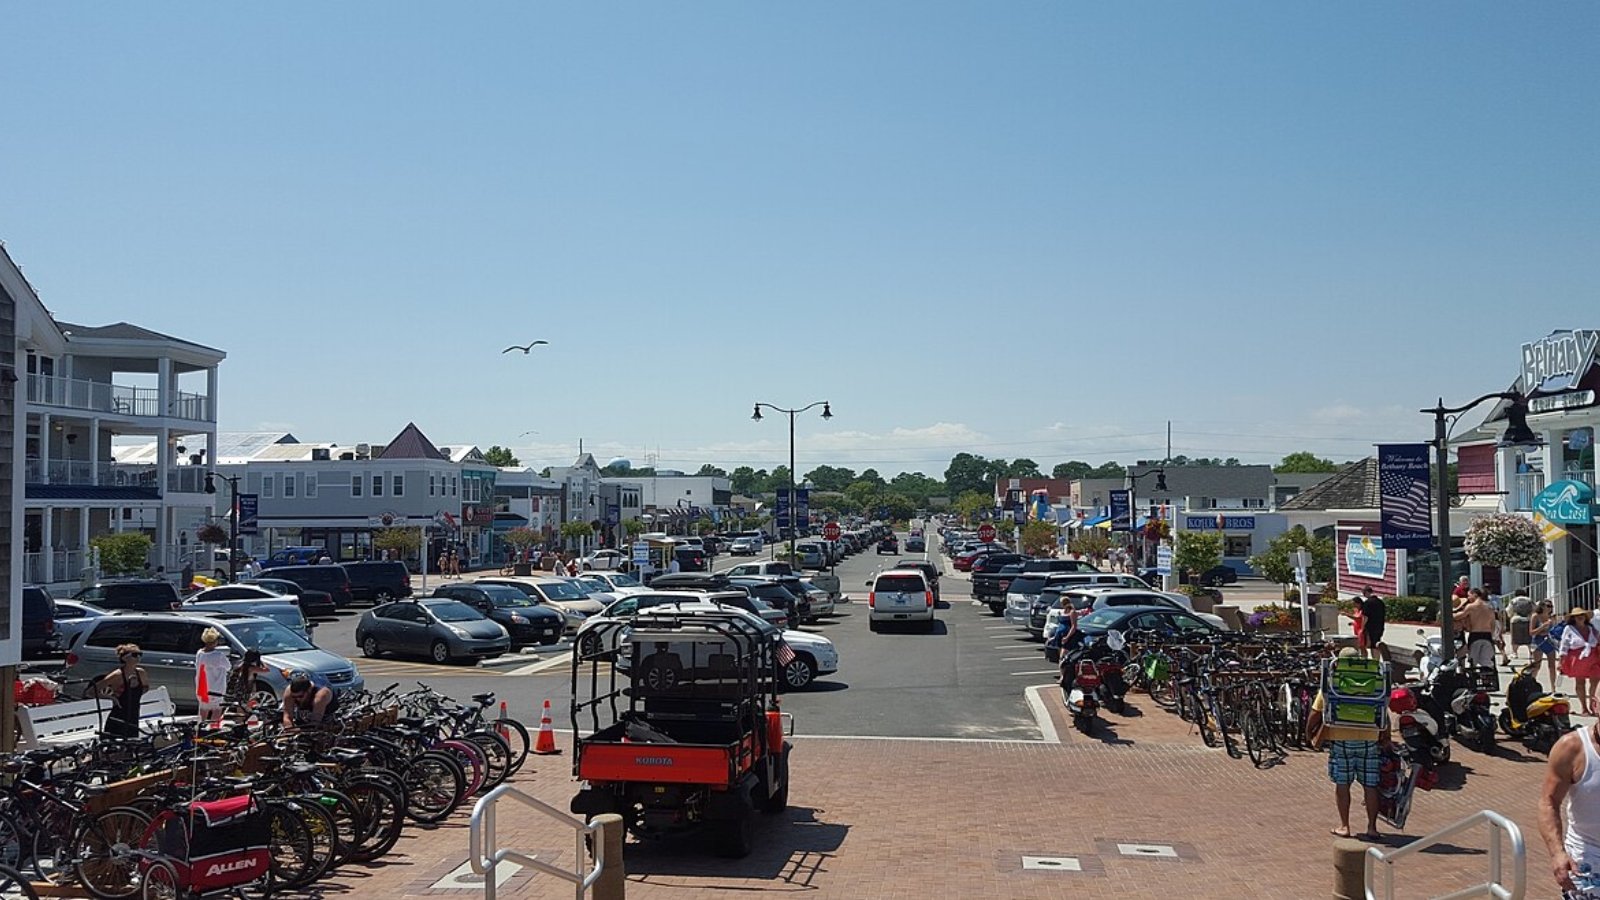
Known for its quieter, more family-oriented vibe compared to nearby Rehoboth, Bethany Beach attracts buyers seeking peace and relaxation. Its wide beaches, low-rise development, and tight-knit community make it a standout along the coast.
Recent volatility reflects the market adjusting after a post-COVID surge. Even so, prices remain among the highest in the state, driven by limited inventory and strong seasonal demand for luxury properties.
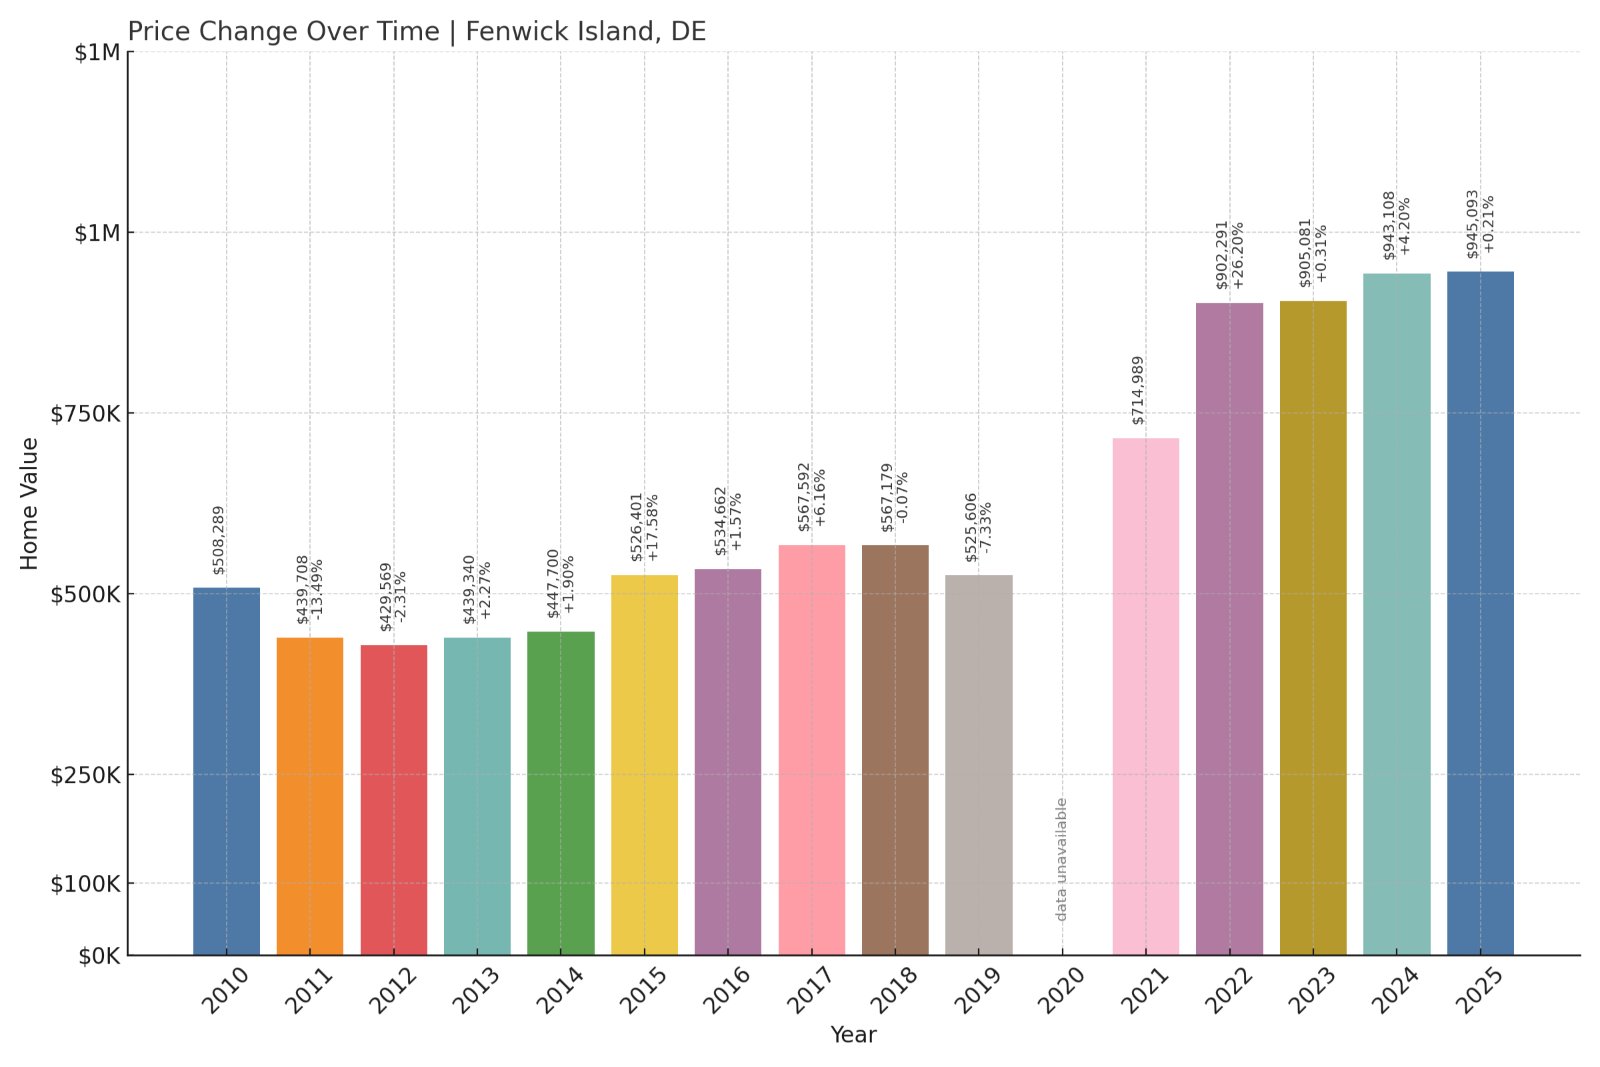
3. Fenwick Island – 86% Home Price Increase Since 2010
🔥 Would you like to save this?
- 2010: $508,289
- 2011: $439,708 (-$68,580, -13.49% from previous year)
- 2012: $429,569 (-$10,139, -2.31% from previous year)
- 2013: $439,340 (+$9,771, +2.27% from previous year)
- 2014: $447,700 (+$8,360, +1.90% from previous year)
- 2015: $526,401 (+$78,701, +17.58% from previous year)
- 2016: $534,662 (+$8,261, +1.57% from previous year)
- 2017: $567,592 (+$32,930, +6.16% from previous year)
- 2018: $567,179 (-$413, -0.07% from previous year)
- 2019: $525,606 (-$41,572, -7.33% from previous year)
- 2020: N/A
- 2021: $714,989
- 2022: $902,291 (+$187,301, +26.20% from previous year)
- 2023: $905,081 (+$2,790, +0.31% from previous year)
- 2024: $943,108 (+$38,027, +4.20% from previous year)
- 2025: $945,093 (+$1,985, +0.21% from previous year)
Home values in Fenwick Island have risen 86% since 2010, with the largest gains coming post-2020. Prices peaked in 2025 at over $945K after dramatic growth in the early 2020s.
Fenwick Island – Small in Size, Big on Value
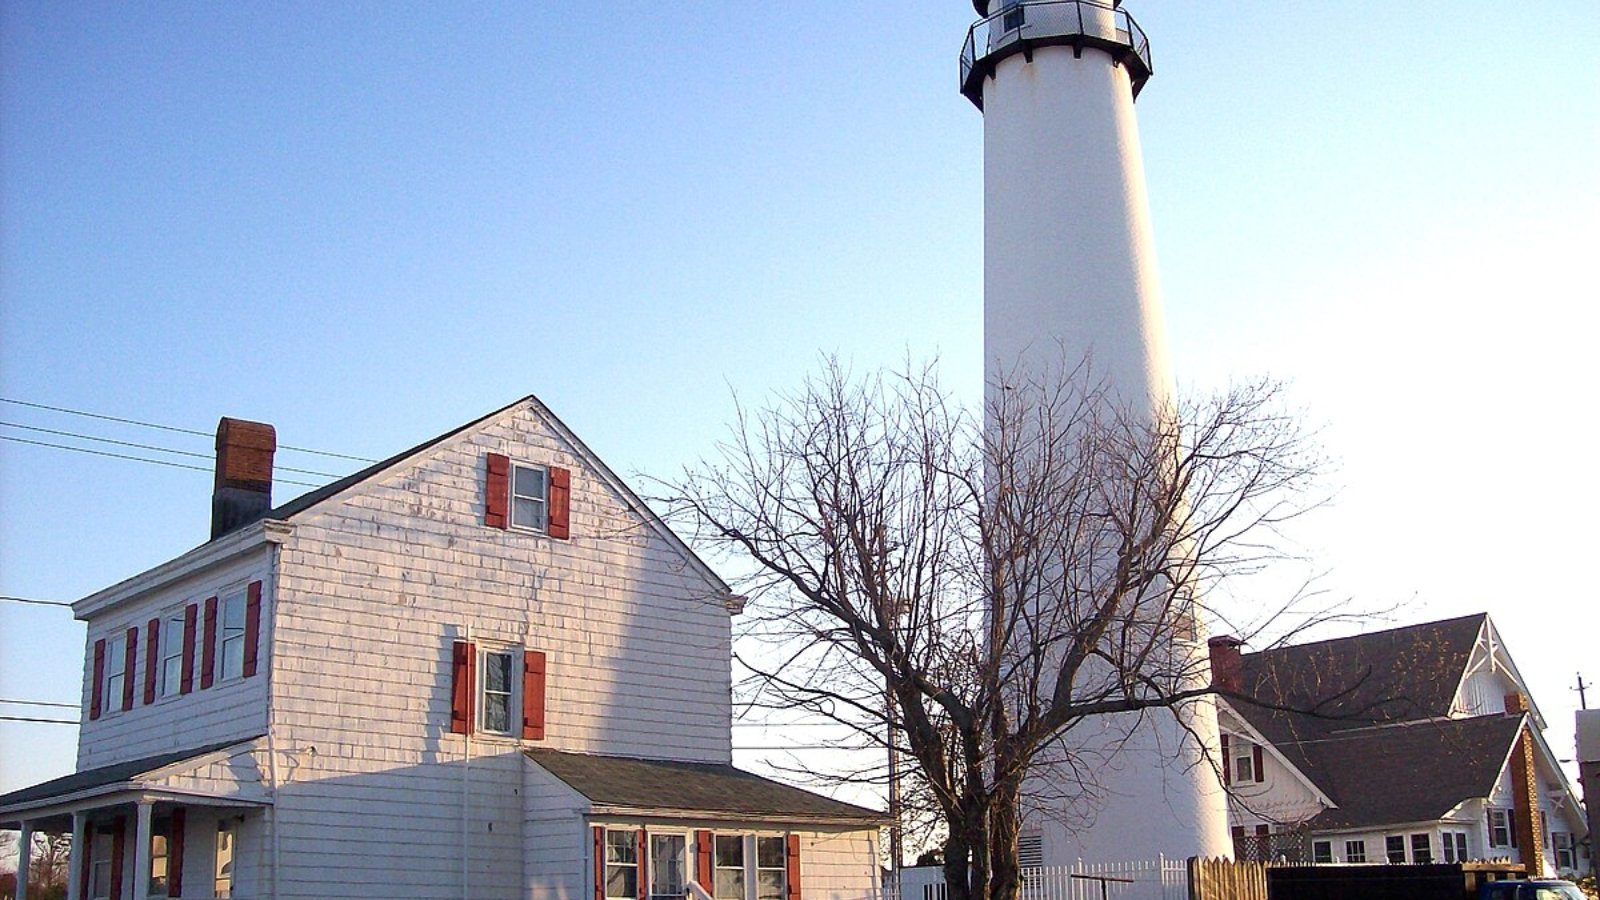
Fenwick Island sits right on the southern tip of Delaware’s coastline, bordering Ocean City, Maryland. Its small size, tight zoning rules, and walkable beachside layout contribute to its appeal—and its high prices.
Limited supply and strong demand have kept values climbing. It’s a favorite for high-end second homes and rental properties, with owners paying top dollar for a prime piece of coastal real estate.
2. Dewey Beach – 46% Home Price Increase Since 2010
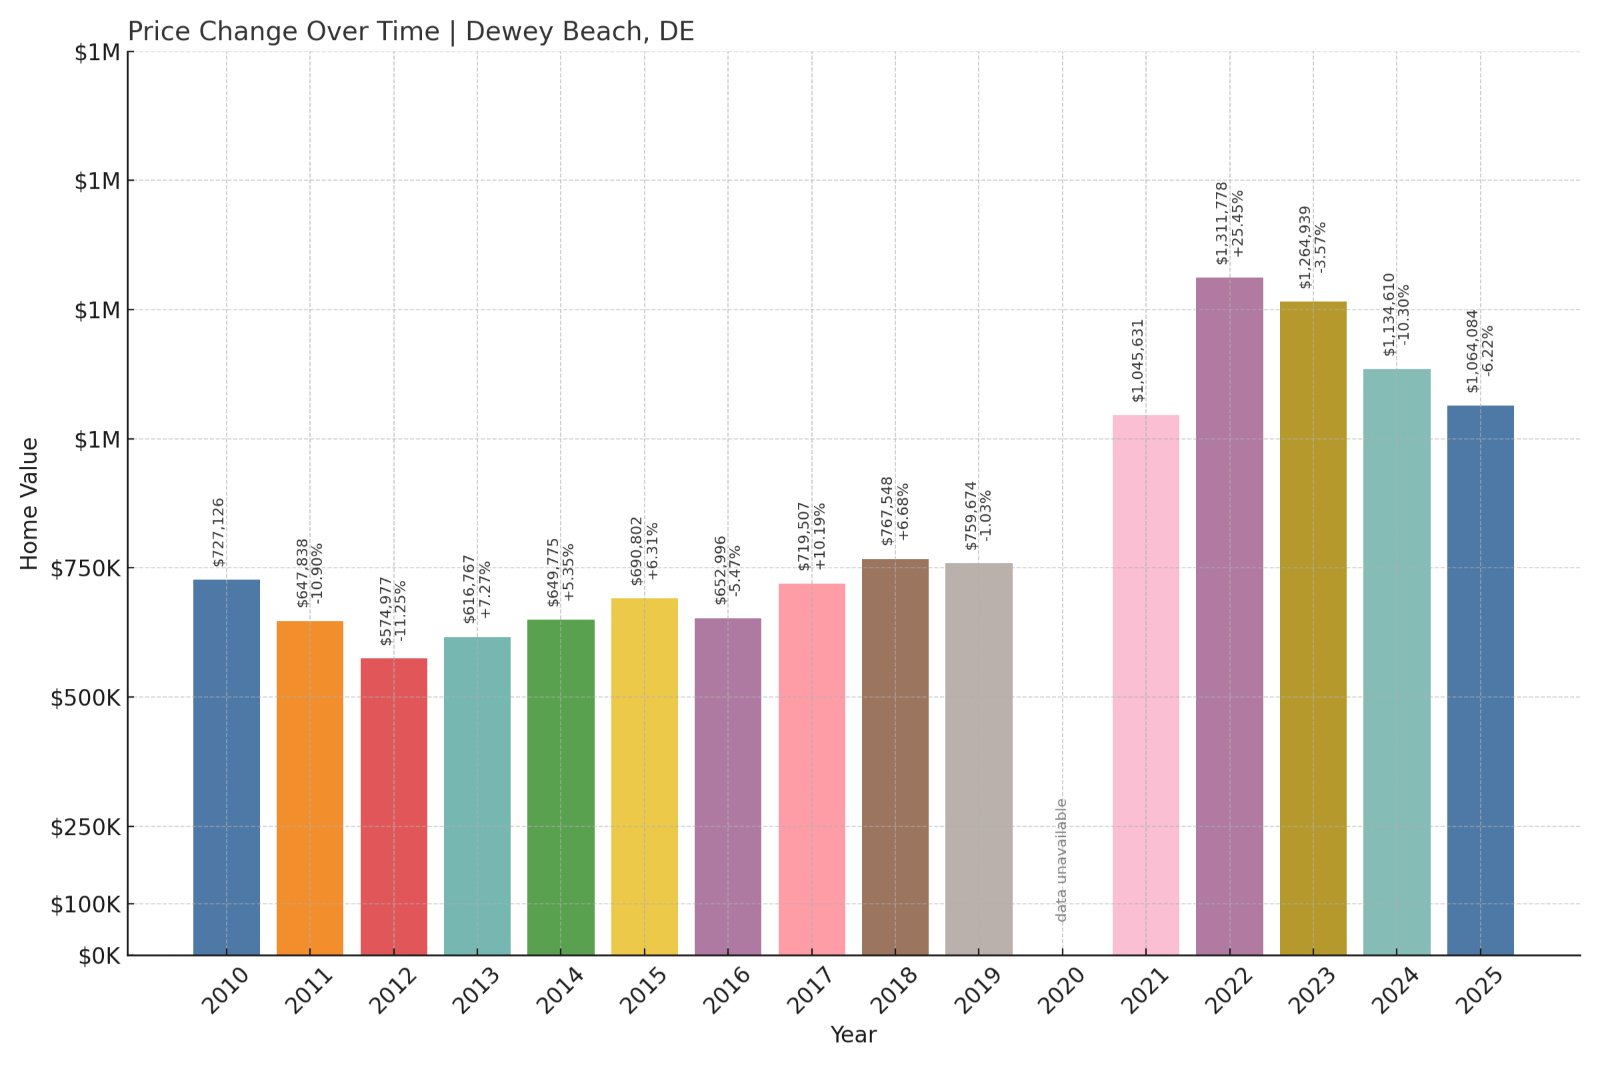
- 2010: $727,126
- 2011: $647,838 (-$79,288, -10.90% from previous year)
- 2012: $574,977 (-$72,861, -11.25% from previous year)
- 2013: $616,767 (+$41,790, +7.27% from previous year)
- 2014: $649,775 (+$33,008, +5.35% from previous year)
- 2015: $690,802 (+$41,027, +6.31% from previous year)
- 2016: $652,996 (-$37,807, -5.47% from previous year)
- 2017: $719,507 (+$66,512, +10.19% from previous year)
- 2018: $767,548 (+$48,041, +6.68% from previous year)
- 2019: $759,674 (-$7,874, -1.03% from previous year)
- 2020: N/A
- 2021: $1,045,631
- 2022: $1,311,778 (+$266,147, +25.45% from previous year)
- 2023: $1,264,939 (-$46,839, -3.57% from previous year)
- 2024: $1,134,610 (-$130,328, -10.30% from previous year)
- 2025: $1,064,084 (-$70,526, -6.22% from previous year)
Dewey Beach has seen a 46% increase in home prices since 2010, with a massive surge in 2021 and 2022 pushing values over the $1.3 million mark. Prices have corrected somewhat since, but Dewey remains among the most expensive markets in Delaware.
Dewey Beach – Skyrocketing Prices in a High-Energy Beach Town
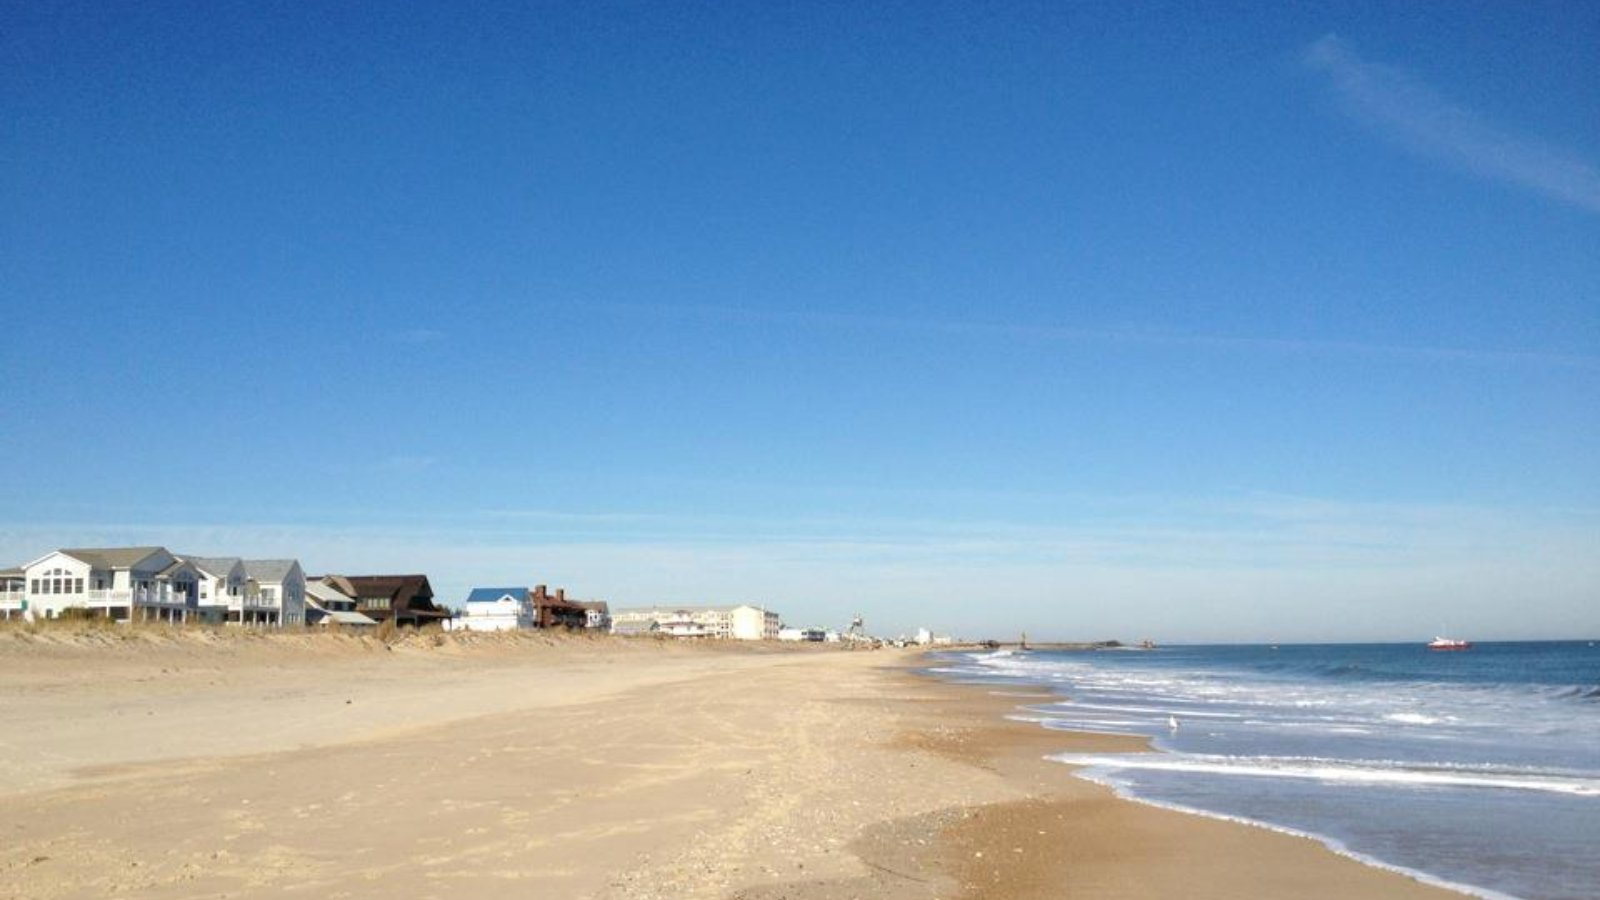
Dewey Beach is known for its nightlife, events, and summer crowds, making it one of Delaware’s most vibrant—and competitive—real estate markets. The town draws vacationers and buyers looking for rental income or a weekend place right on the ocean.
The sharp spike in prices between 2021 and 2022 reflected increased demand for coastal properties and second homes. While the market cooled in 2024 and 2025, high base values and ongoing interest from affluent buyers keep Dewey Beach near the top of the list for home prices in the state.
1. South Bethany – 61% Home Price Increase Since 2010
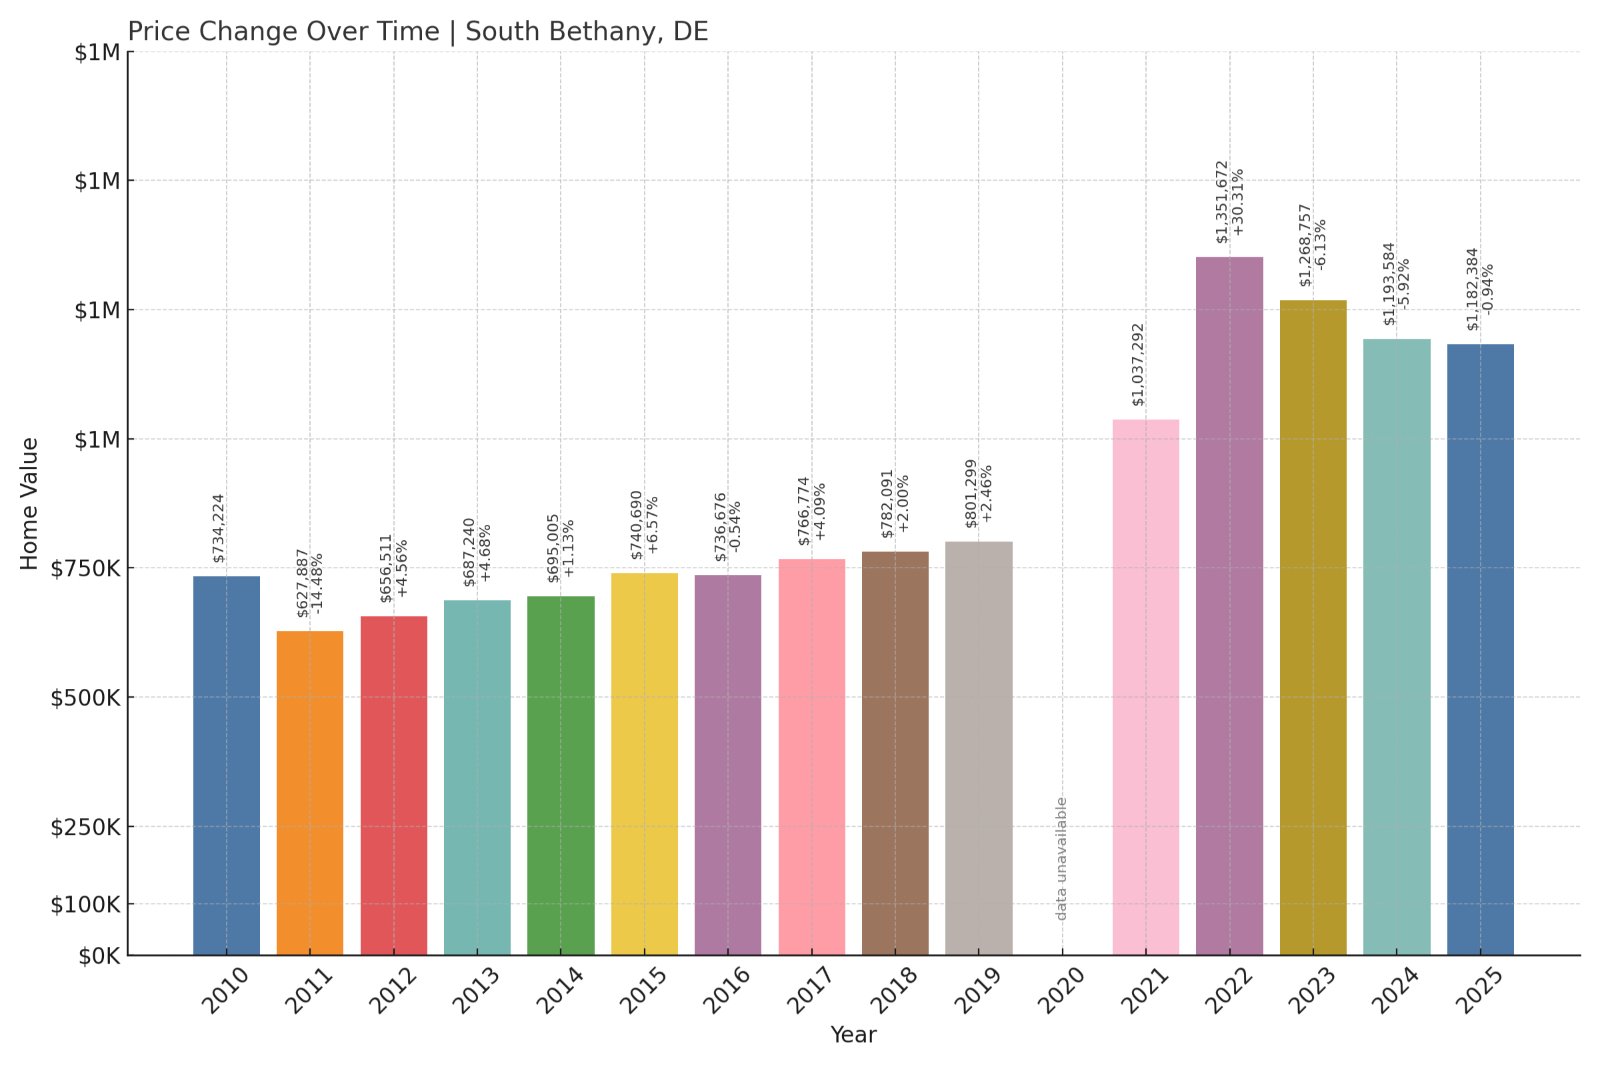
- 2010: $734,224
- 2011: $627,887 (-$106,337, -14.48% from previous year)
- 2012: $656,511 (+$28,624, +4.56% from previous year)
- 2013: $687,240 (+$30,729, +4.68% from previous year)
- 2014: $695,005 (+$7,765, +1.13% from previous year)
- 2015: $740,690 (+$45,686, +6.57% from previous year)
- 2016: $736,676 (-$4,014, -0.54% from previous year)
- 2017: $766,774 (+$30,098, +4.09% from previous year)
- 2018: $782,091 (+$15,317, +2.00% from previous year)
- 2019: $801,299 (+$19,208, +2.46% from previous year)
- 2020: N/A
- 2021: $1,037,292
- 2022: $1,351,672 (+$314,380, +30.31% from previous year)
- 2023: $1,268,757 (-$82,915, -6.13% from previous year)
- 2024: $1,193,584 (-$75,173, -5.92% from previous year)
- 2025: $1,182,384 (-$11,201, -0.94% from previous year)
South Bethany has experienced a 61% increase in home values since 2010. Prices peaked in 2022 after a 30% year-over-year leap and have gradually adjusted downward since, but values remain well above $1.1 million in 2025.
South Bethany – Exclusive, Quiet, and Consistently Expensive
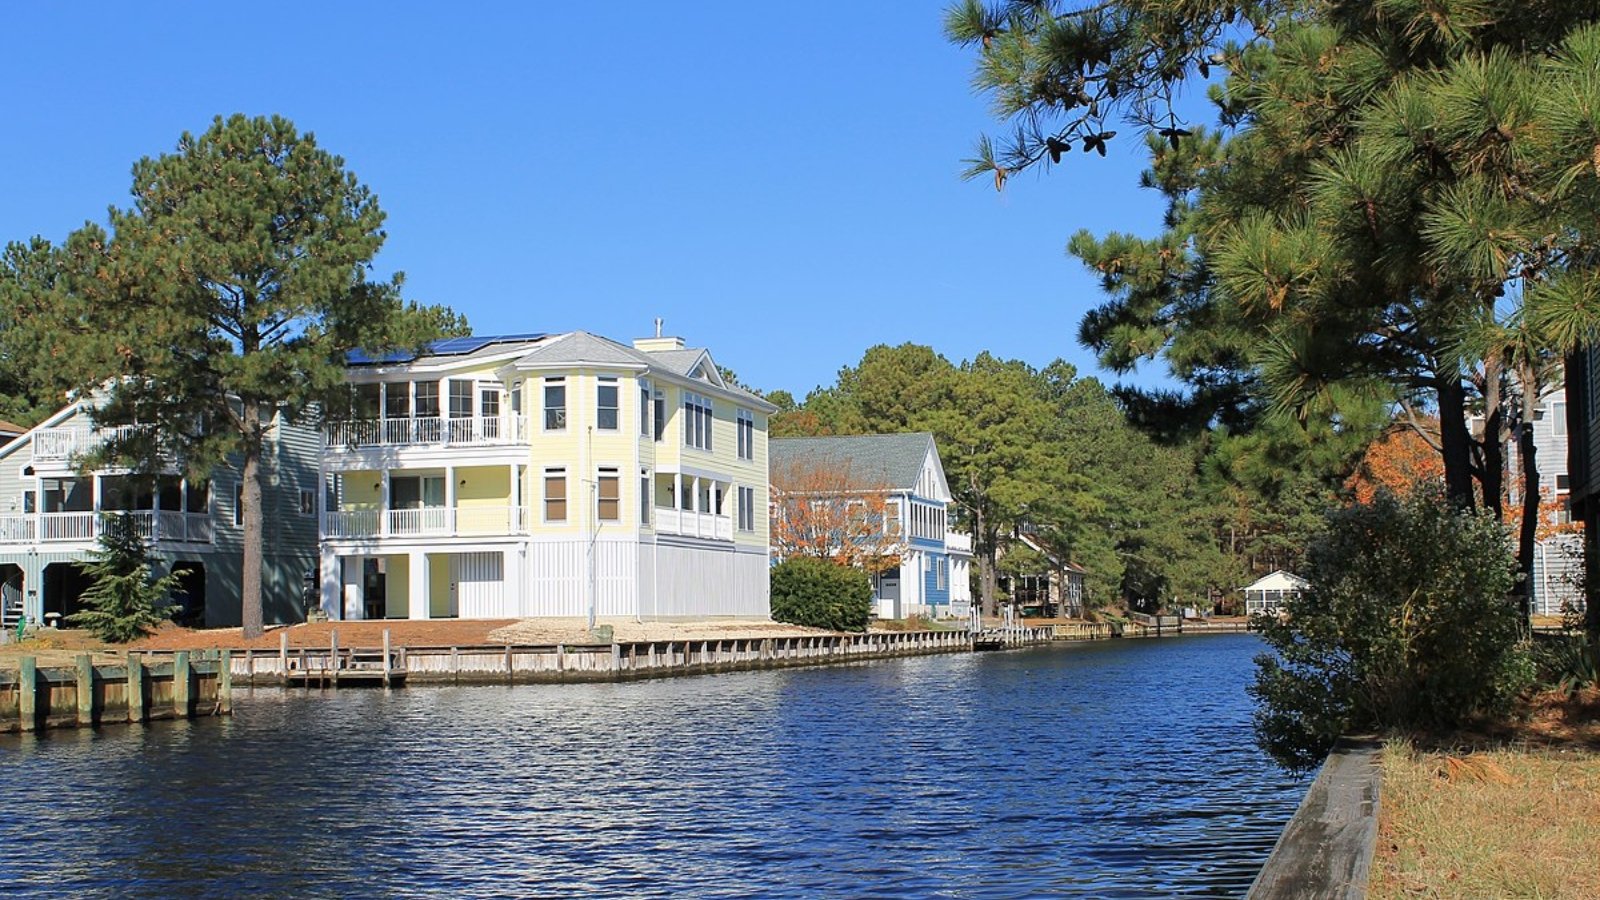
Known for its residential character and strict zoning rules, South Bethany offers a quieter alternative to the region’s busier beach towns. The canals, private homes, and absence of high-rises make it appealing to buyers looking for privacy and long-term value.
The post-2020 boom drove up prices dramatically, especially as remote work allowed more buyers to live near the beach full-time. Even with recent declines, South Bethany continues to command some of the highest home prices in the state, thanks to limited inventory and persistent demand.


