🔥 Would you like to save this?
Delaware’s small size doesn’t mean small property prices. In 2025, some of its coastal and inland towns are seeing home values surge, according to the Zillow Home Value Index. While beachside favorites continue to attract deep-pocketed buyers, even quieter inland communities are feeling the pressure of rising prices. Whether you’re thinking of moving or just keeping an eye on the market, Delaware’s real estate scene has some eye-opening numbers this year.
17. Bear – 63.4% Home Price Increase Since 2012

- 2010: $256,247
- 2011: $240,704 (-$15,543, -6.07% from previous year)
- 2012: $223,950 (-$16,754, -6.96% from previous year)
- 2013: $228,105 (+$4,155, +1.86% from previous year)
- 2014: $239,342 (+$11,238, +4.93% from previous year)
- 2015: $251,524 (+$12,181, +5.09% from previous year)
- 2016: $267,906 (+$16,382, +6.51% from previous year)
- 2017: $283,320 (+$15,414, +5.75% from previous year)
- 2018: $291,412 (+$8,093, +2.86% from previous year)
- 2019: $297,044 (+$5,632, +1.93% from previous year)
- 2020: $298,928 (+$1,884, +0.63% from previous year)
- 2021: $341,012 (+$42,084, +14.08% from previous year)
- 2022: $376,962 (+$35,950, +10.54% from previous year)
- 2023: $391,633 (+$14,671, +3.89% from previous year)
- 2024: $410,587 (+$18,954, +4.84% from previous year)
- 2025: $418,922 (+$8,335, +2.03% from previous year)
Bear’s home prices rose steadily from $223,950 in 2012 to $418,922 in 2025, marking a 63.4% increase over this period. Prices saw their largest single-year jump in 2021, with a 14.08% rise. Even as growth has slowed recently, Bear remains an attractive mid-priced option within New Castle County’s busy commuter region.
In order to come up with the very specific design ideas, we create most designs with the assistance of state-of-the-art AI interior design software.
Bear – Suburban Convenience and Steady Growth
Bear is located in northern Delaware near Wilmington, making it a convenient spot for commuters working in Delaware or nearby Pennsylvania. Its neighborhoods feature a mix of newer subdivisions and established communities with easy access to Route 1 and I-95. The town’s growth aligns with continued demand for suburban homes offering larger lots and local amenities.
With a current average home price above $418,000, Bear remains affordable compared to coastal resort towns while delivering consistent property value growth. Families are drawn to Bear for its schools, shopping centers, and access to Delaware’s corporate hubs. Recent growth trends suggest the market here is stabilizing, but long-term demand should keep prices from falling dramatically.
Historically, Bear evolved from rural farmland into a suburban area in the late 20th century, and its real estate market continues to reflect regional employment patterns and steady suburban development.
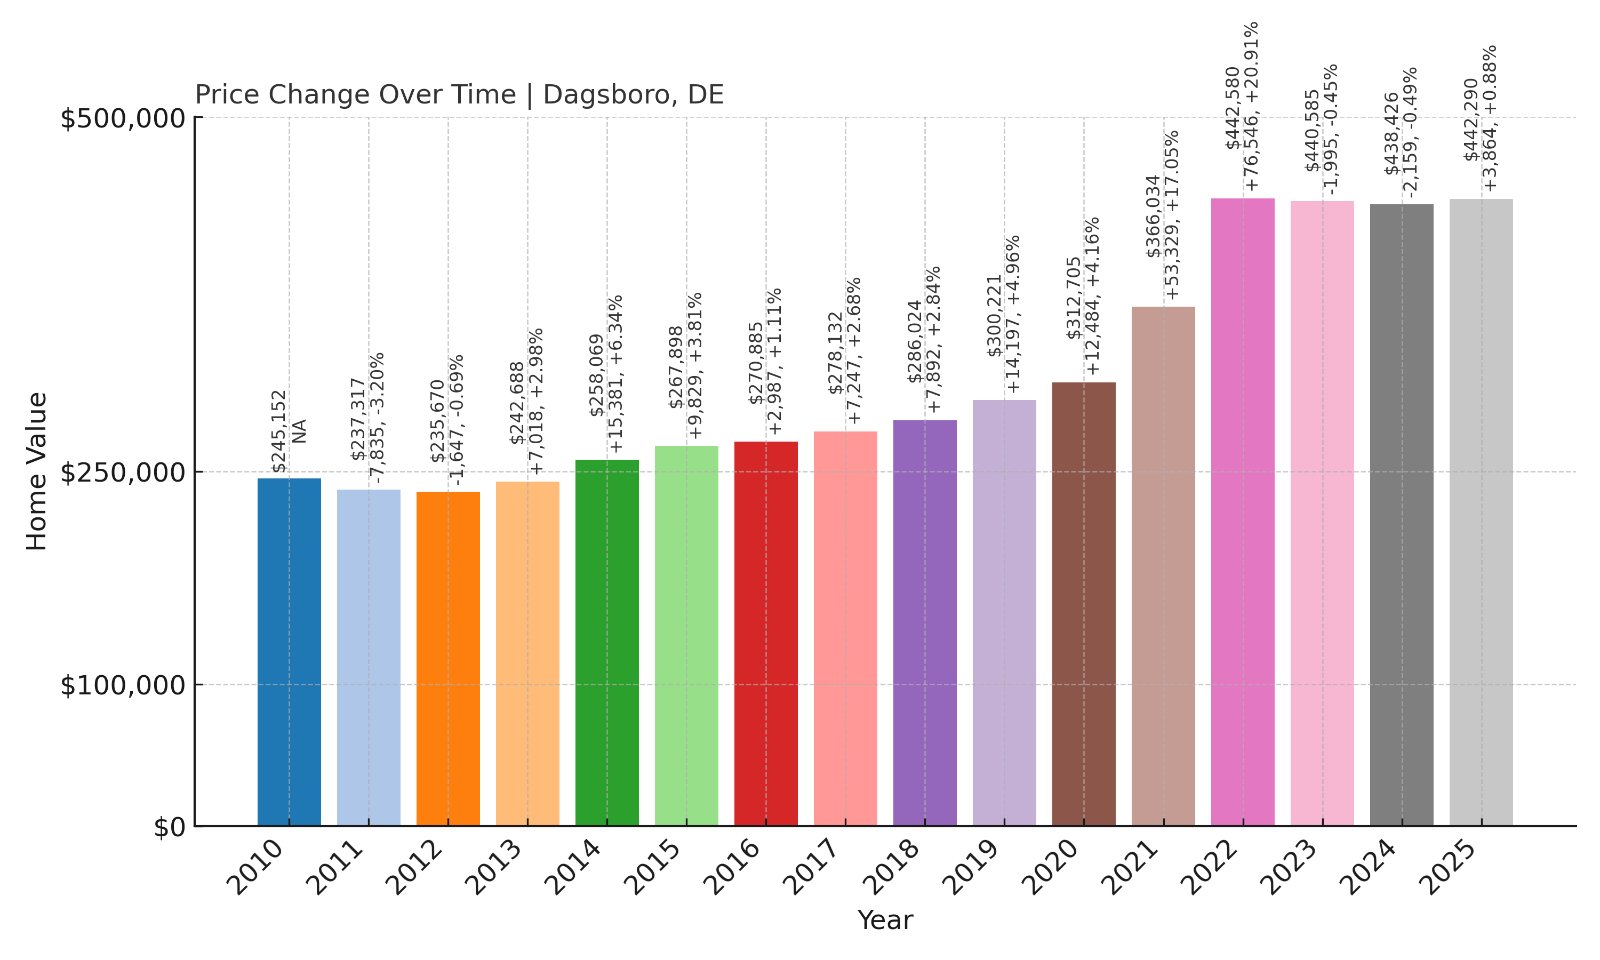
16. Dagsboro – 80% Home Price Increase Since 2012
- 2010: $245,152
- 2011: $237,317 (-$7,835, -3.20% from previous year)
- 2012: $235,670 (-$1,647, -0.69% from previous year)
- 2013: $242,688 (+$7,018, +2.98% from previous year)
- 2014: $258,069 (+$15,382, +6.34% from previous year)
- 2015: $267,898 (+$9,829, +3.81% from previous year)
- 2016: $270,885 (+$2,987, +1.11% from previous year)
- 2017: $278,132 (+$7,247, +2.68% from previous year)
- 2018: $286,024 (+$7,892, +2.84% from previous year)
- 2019: $300,221 (+$14,196, +4.96% from previous year)
- 2020: $312,705 (+$12,484, +4.16% from previous year)
- 2021: $366,034 (+$53,330, +17.05% from previous year)
- 2022: $442,580 (+$76,546, +20.91% from previous year)
- 2023: $440,585 (-$1,995, -0.45% from previous year)
- 2024: $438,426 (-$2,159, -0.49% from previous year)
- 2025: $442,290 (+$3,864, +0.88% from previous year)
Dagsboro’s home prices climbed from $235,670 in 2012 to $442,290 in 2025, showing an impressive 80% increase. Major jumps in 2021 and 2022 drove most of this growth. Recent slight declines suggest a market cooling phase following a dramatic rise during the pandemic demand peak.
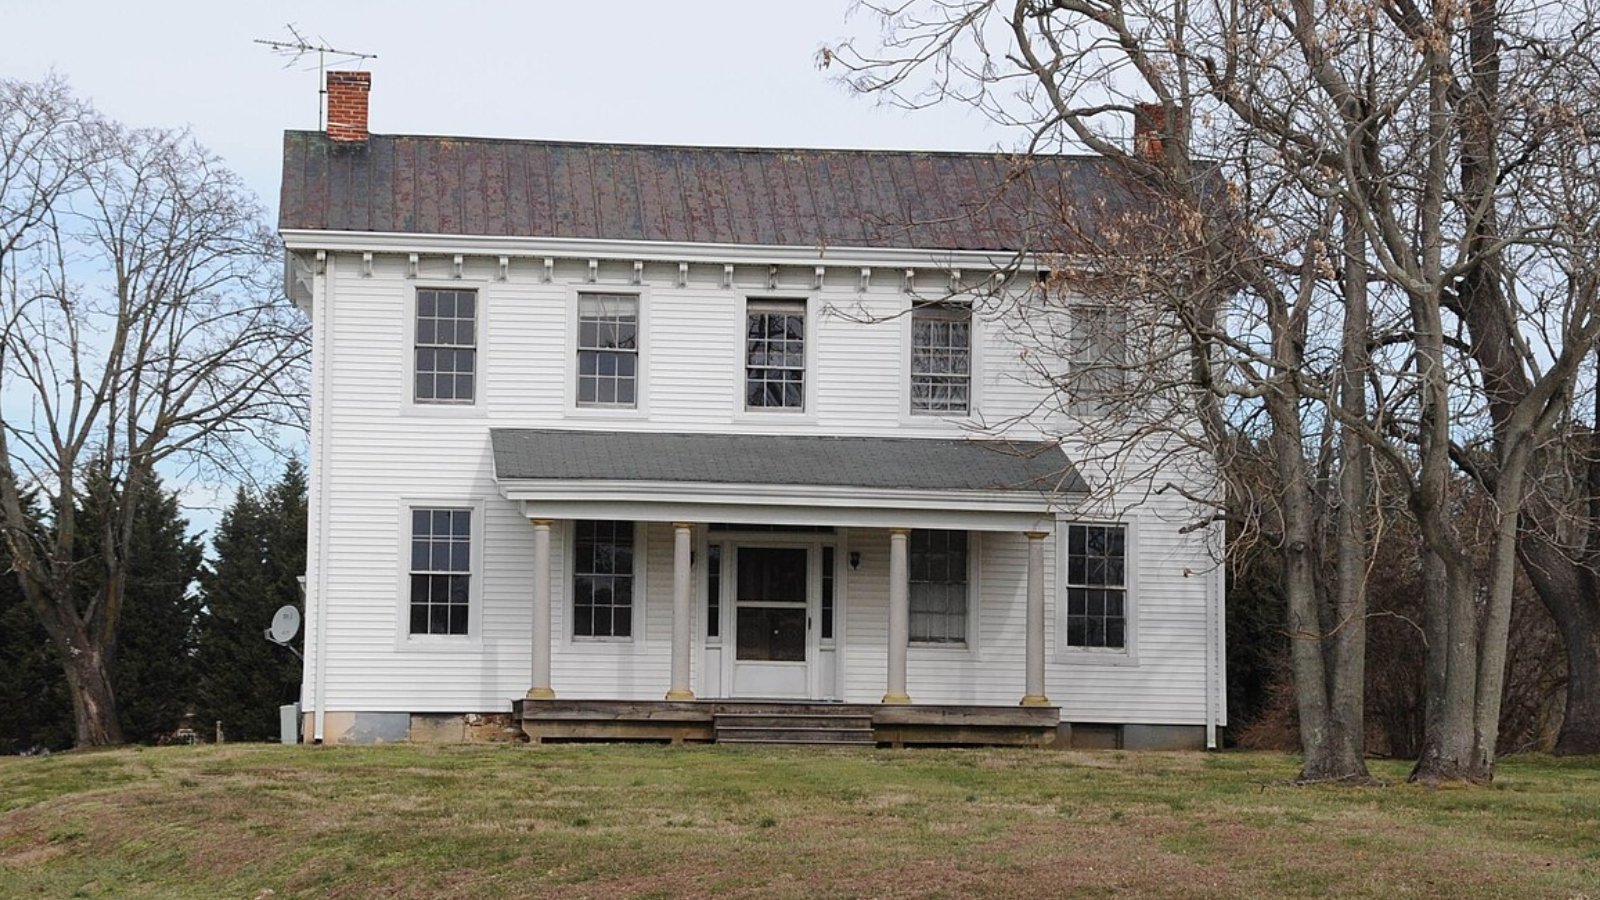
Dagsboro – Small Town Life with Coastal Access
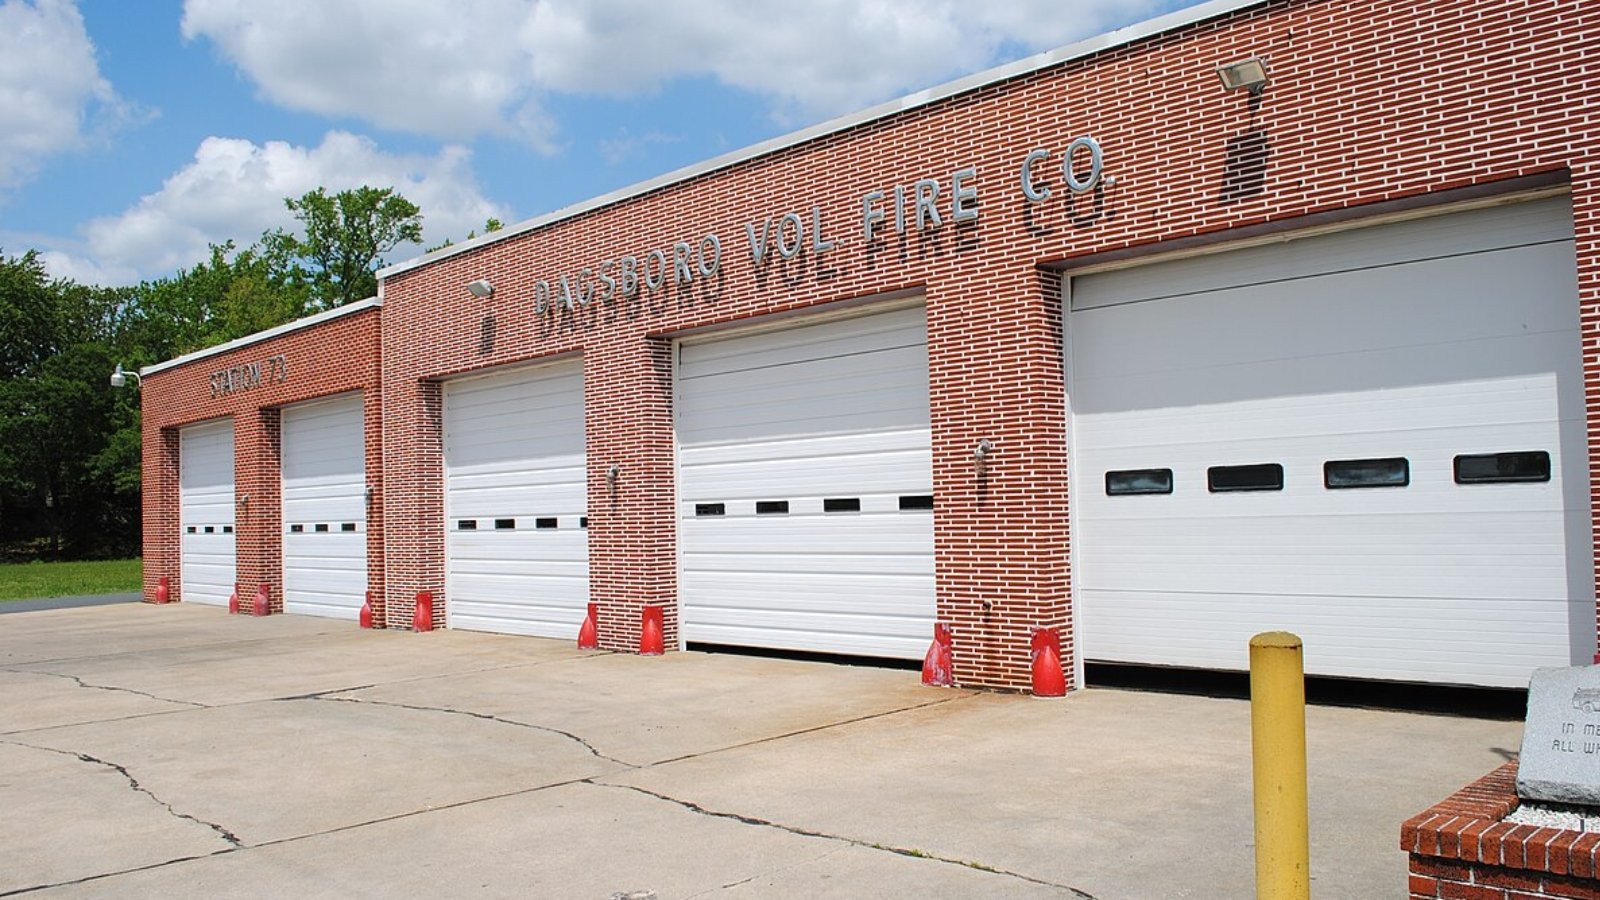
Situated in Sussex County, Dagsboro is just a short drive inland from Bethany Beach. This quiet town features historic sites, local dining, and a welcoming small-town atmosphere. The significant price increases here reflect its appeal to buyers seeking affordable options near coastal amenities without paying direct beachfront premiums.
Home prices currently average around $442,000, placing Dagsboro among Delaware’s more expensive inland markets. Many buyers are retirees or commuters working in nearby coastal resorts or regional hubs like Salisbury, MD. Growth has stabilized in recent years, but its strategic location keeps demand strong.
Dagsboro was settled in the early 1700s and remains rooted in historic charm with quick access to beaches, golf courses, and shopping districts, explaining its appeal among homebuyers who want both tranquility and convenience.
15. Milton – 102.5% Home Price Increase Since 2012
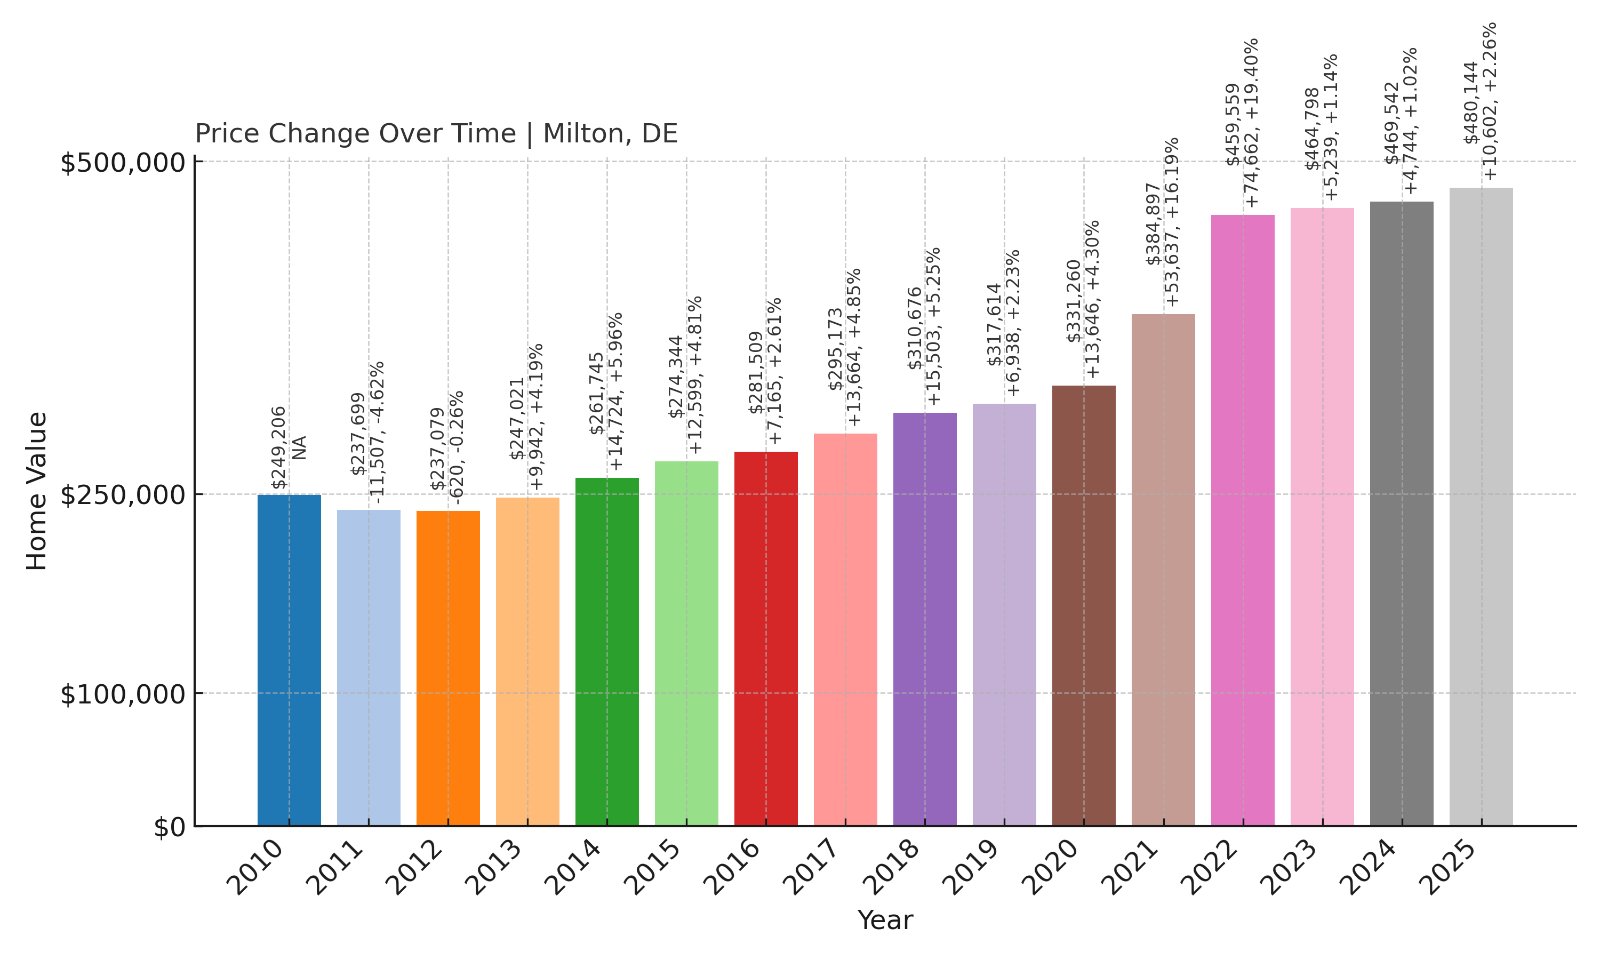
- 2010: $249,206
- 2011: $237,699 (-$11,508, -4.62% from previous year)
- 2012: $237,079 (-$620, -0.26% from previous year)
- 2013: $247,021 (+$9,942, +4.19% from previous year)
- 2014: $261,745 (+$14,725, +5.96% from previous year)
- 2015: $274,344 (+$12,599, +4.81% from previous year)
- 2016: $281,509 (+$7,165, +2.61% from previous year)
- 2017: $295,173 (+$13,664, +4.85% from previous year)
- 2018: $310,676 (+$15,503, +5.25% from previous year)
- 2019: $317,614 (+$6,938, +2.23% from previous year)
- 2020: $331,260 (+$13,647, +4.30% from previous year)
- 2021: $384,897 (+$53,636, +16.19% from previous year)
- 2022: $459,559 (+$74,662, +19.40% from previous year)
- 2023: $464,798 (+$5,239, +1.14% from previous year)
- 2024: $469,542 (+$4,744, +1.02% from previous year)
- 2025: $480,144 (+$10,602, +2.26% from previous year)
Milton’s home prices have more than doubled from $237,079 in 2012 to $480,144 in 2025, a 102.5% increase. Price growth accelerated sharply from 2020 through 2022 before moderating over the past two years.
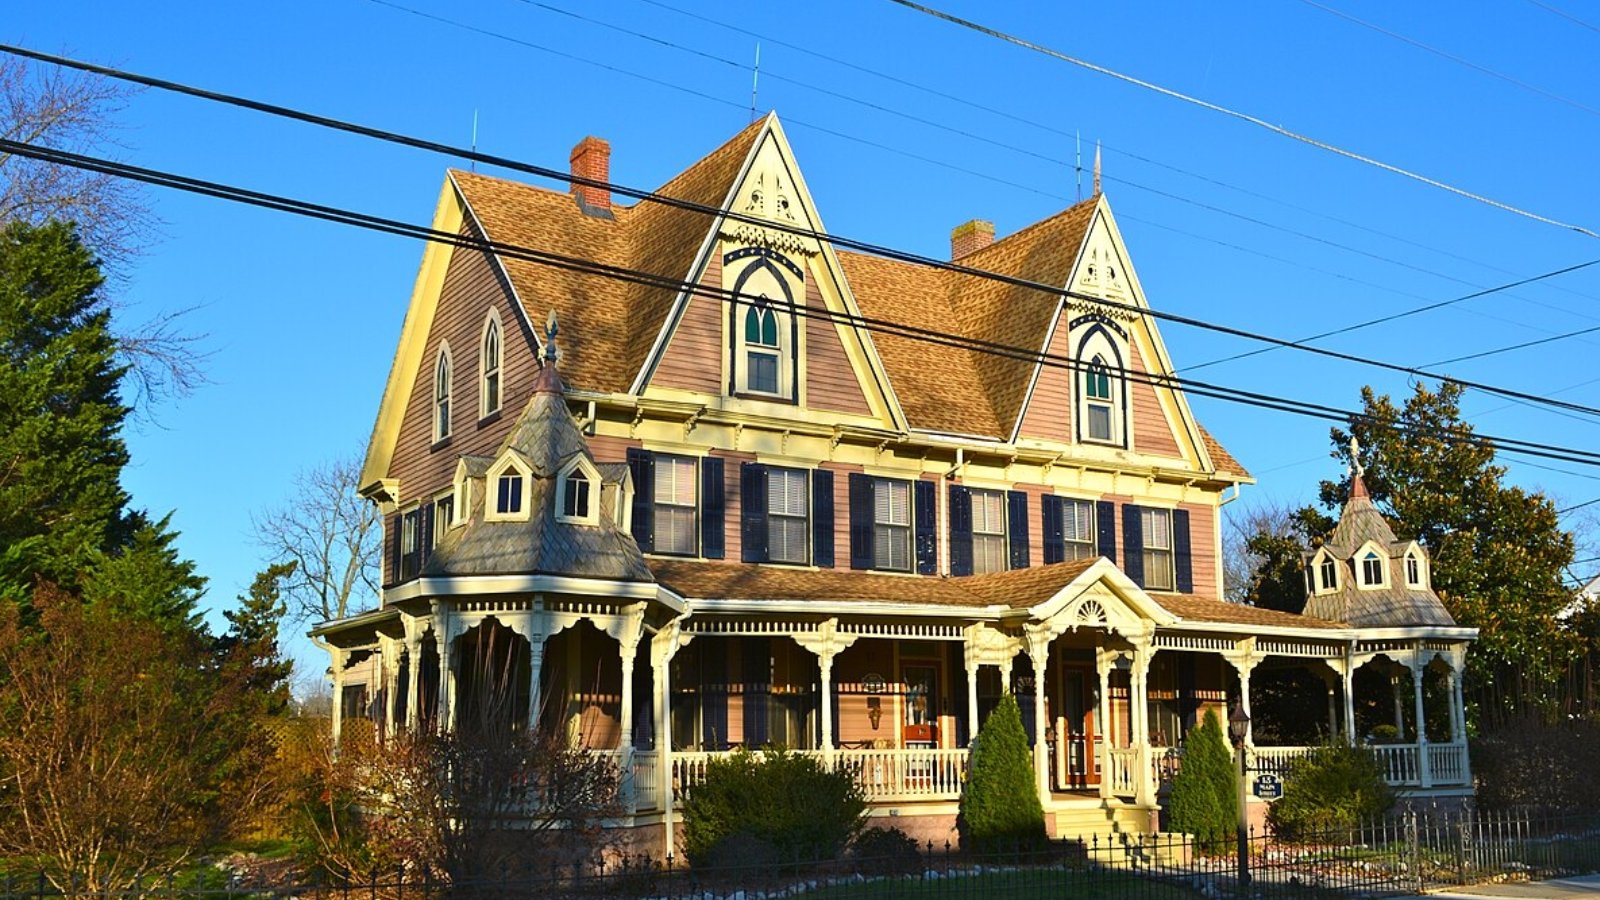
Milton – Historic Charm Meets New Development
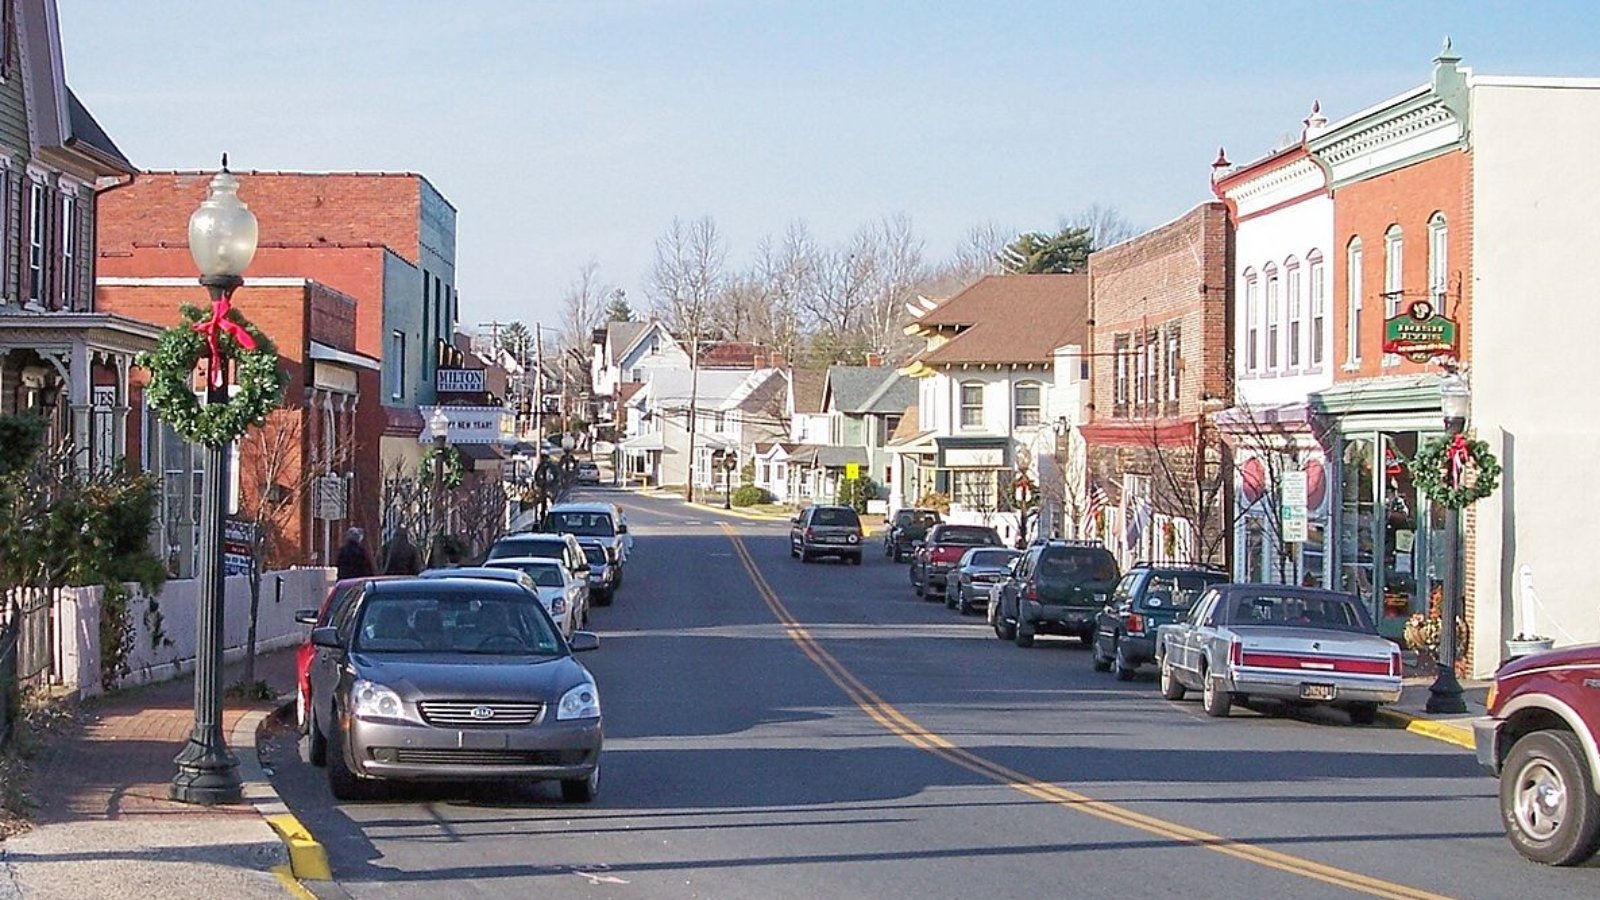
Milton lies in Sussex County, close to Delaware’s beaches, and is known for its preserved historic downtown and community events. Buyers are attracted to its blend of heritage homes and newer developments, driving demand upward over the past decade.
The current average home price exceeds $480,000, reflecting its transformation from a modest inland town to a desirable hub for commuters and retirees. The town’s strategic location near Lewes and Rehoboth Beach further supports property values, giving residents easy coastal access.
Once a thriving shipbuilding town in the 1800s, Milton now balances small-town atmosphere with modern amenities, which continues to attract residents seeking community life without the beachfront crowds and prices.
14. Frankford – 114.5% Home Price Increase Since 2012

- 2010: $254,155
- 2011: $238,347 (-$15,808, -6.22% from previous year)
- 2012: $225,906 (-$12,441, -5.22% from previous year)
- 2013: $236,524 (+$10,618, +4.70% from previous year)
- 2014: $262,197 (+$25,673, +10.85% from previous year)
- 2015: $275,786 (+$13,589, +5.18% from previous year)
- 2016: $288,182 (+$12,396, +4.49% from previous year)
- 2017: $303,373 (+$15,191, +5.27% from previous year)
- 2018: $312,486 (+$9,113, +3.00% from previous year)
- 2019: $321,863 (+$9,377, +3.00% from previous year)
- 2020: $341,655 (+$19,793, +6.15% from previous year)
- 2021: $399,343 (+$57,688, +16.88% from previous year)
- 2022: $475,570 (+$76,226, +19.09% from previous year)
- 2023: $477,207 (+$1,637, +0.34% from previous year)
- 2024: $495,988 (+$18,781, +3.94% from previous year)
- 2025: $484,589 (-$11,399, -2.30% from previous year)
Frankford saw home prices rise from $225,906 in 2012 to $484,589 in 2025, a 114.5% increase. Growth was strongest from 2020 to 2022, before a slight recent decline reflecting market adjustments after rapid appreciation.
Frankford – Quiet Living Near Popular Beaches
Frankford is a small town located just west of Bethany Beach in Sussex County. Its rural setting combined with close proximity to beaches makes it a sought-after location for those seeking tranquility within reach of the coast.
Today’s average price of nearly $485,000 reflects sustained interest from retirees, second-home buyers, and residents moving inland from pricier beachfront towns. Frankford’s market is more affordable than direct beachfront properties while still offering fast coastal access.
The town is known for its agricultural roots, historic churches, and community atmosphere, all of which continue to attract buyers who value space, peace, and local connections alongside appreciating home values.
13. Townsend – 101% Home Price Increase Since 2012
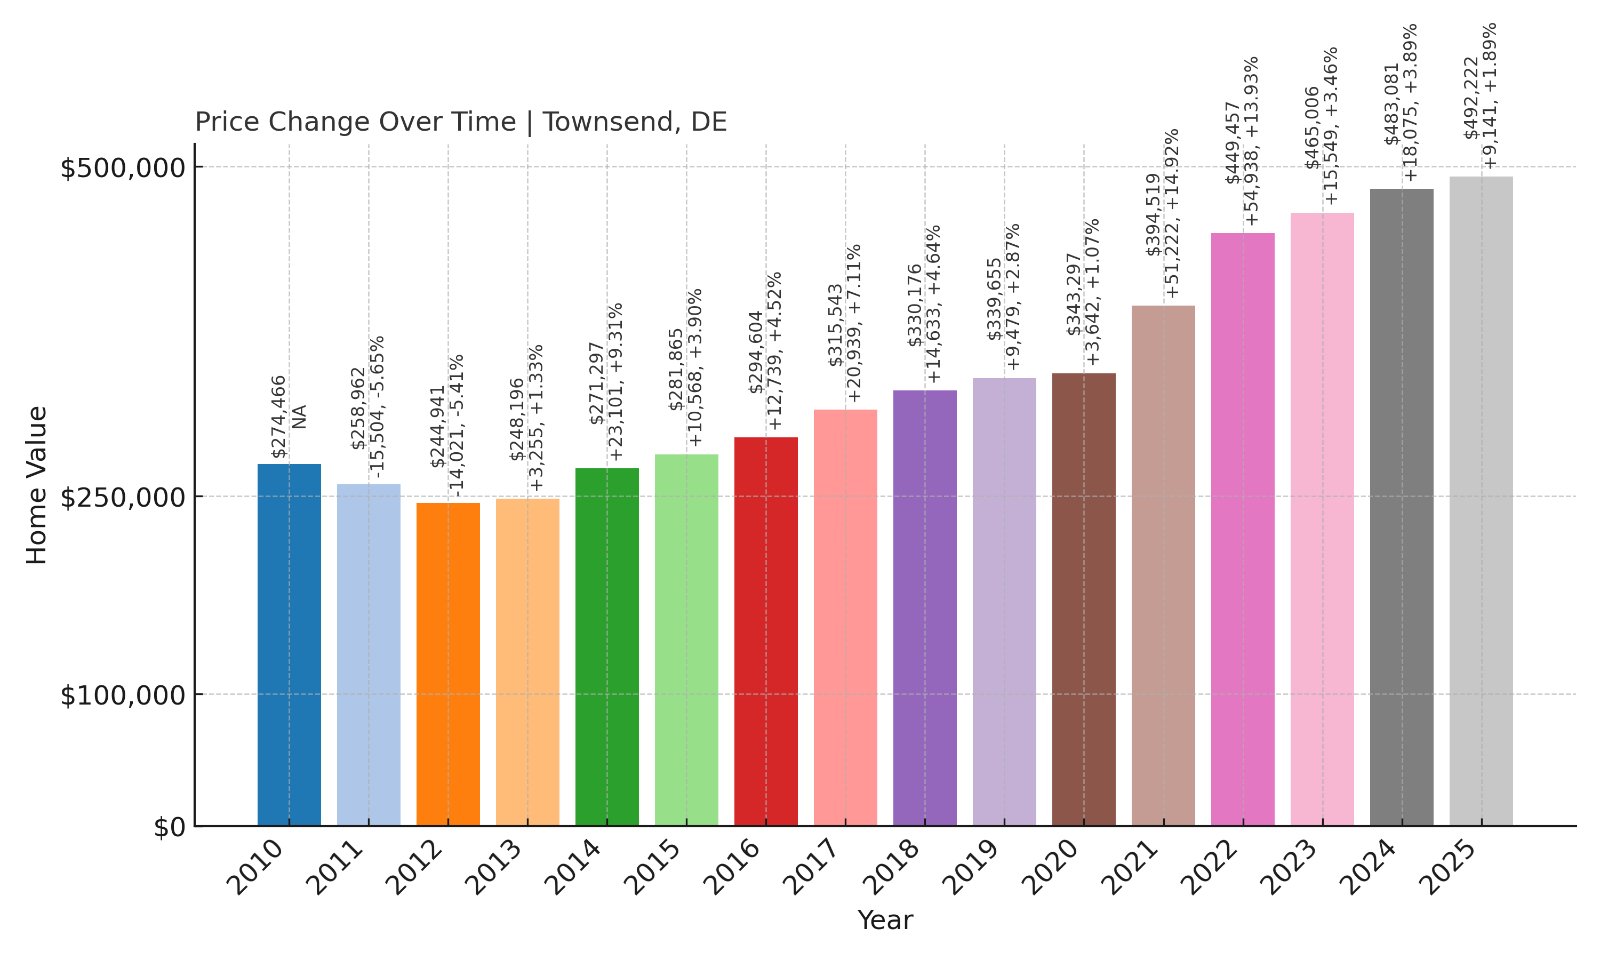
- 2010: $274,466
- 2011: $258,962 (-$15,504, -5.65% from previous year)
- 2012: $244,941 (-$14,021, -5.41% from previous year)
- 2013: $248,196 (+$3,255, +1.33% from previous year)
- 2014: $271,297 (+$23,101, +9.31% from previous year)
- 2015: $281,865 (+$10,568, +3.90% from previous year)
- 2016: $294,604 (+$12,739, +4.52% from previous year)
- 2017: $315,543 (+$20,939, +7.11% from previous year)
- 2018: $330,176 (+$14,633, +4.64% from previous year)
- 2019: $339,655 (+$9,478, +2.87% from previous year)
- 2020: $343,297 (+$3,642, +1.07% from previous year)
- 2021: $394,519 (+$51,222, +14.92% from previous year)
- 2022: $449,457 (+$54,938, +13.93% from previous year)
- 2023: $465,006 (+$15,549, +3.46% from previous year)
- 2024: $483,081 (+$18,074, +3.89% from previous year)
- 2025: $492,222 (+$9,141, +1.89% from previous year)
Townsend’s home prices rose from $244,941 in 2012 to $492,222 in 2025, showing a 101% increase. Strongest growth occurred between 2020 and 2022, with the market maintaining smaller annual increases since then.
Townsend – Family-Friendly Suburban Growth
Townsend is located in southern New Castle County, offering a suburban-rural mix within commuting distance of Wilmington and Dover. It’s known for newer developments and sought-after schools, making it a popular choice for families.
With current home prices nearing $500,000, Townsend has seen major growth as buyers seek larger homes and land at prices still below those in major metro suburbs. Steady job markets nearby support continued demand in this area.
Founded in the mid-1800s, Townsend retains a small-town feel with parks and historic homes while accommodating rapid new construction that has driven property values upward over the past decade.
12. Slaughter Beach – 76% Home Price Increase Since 2018
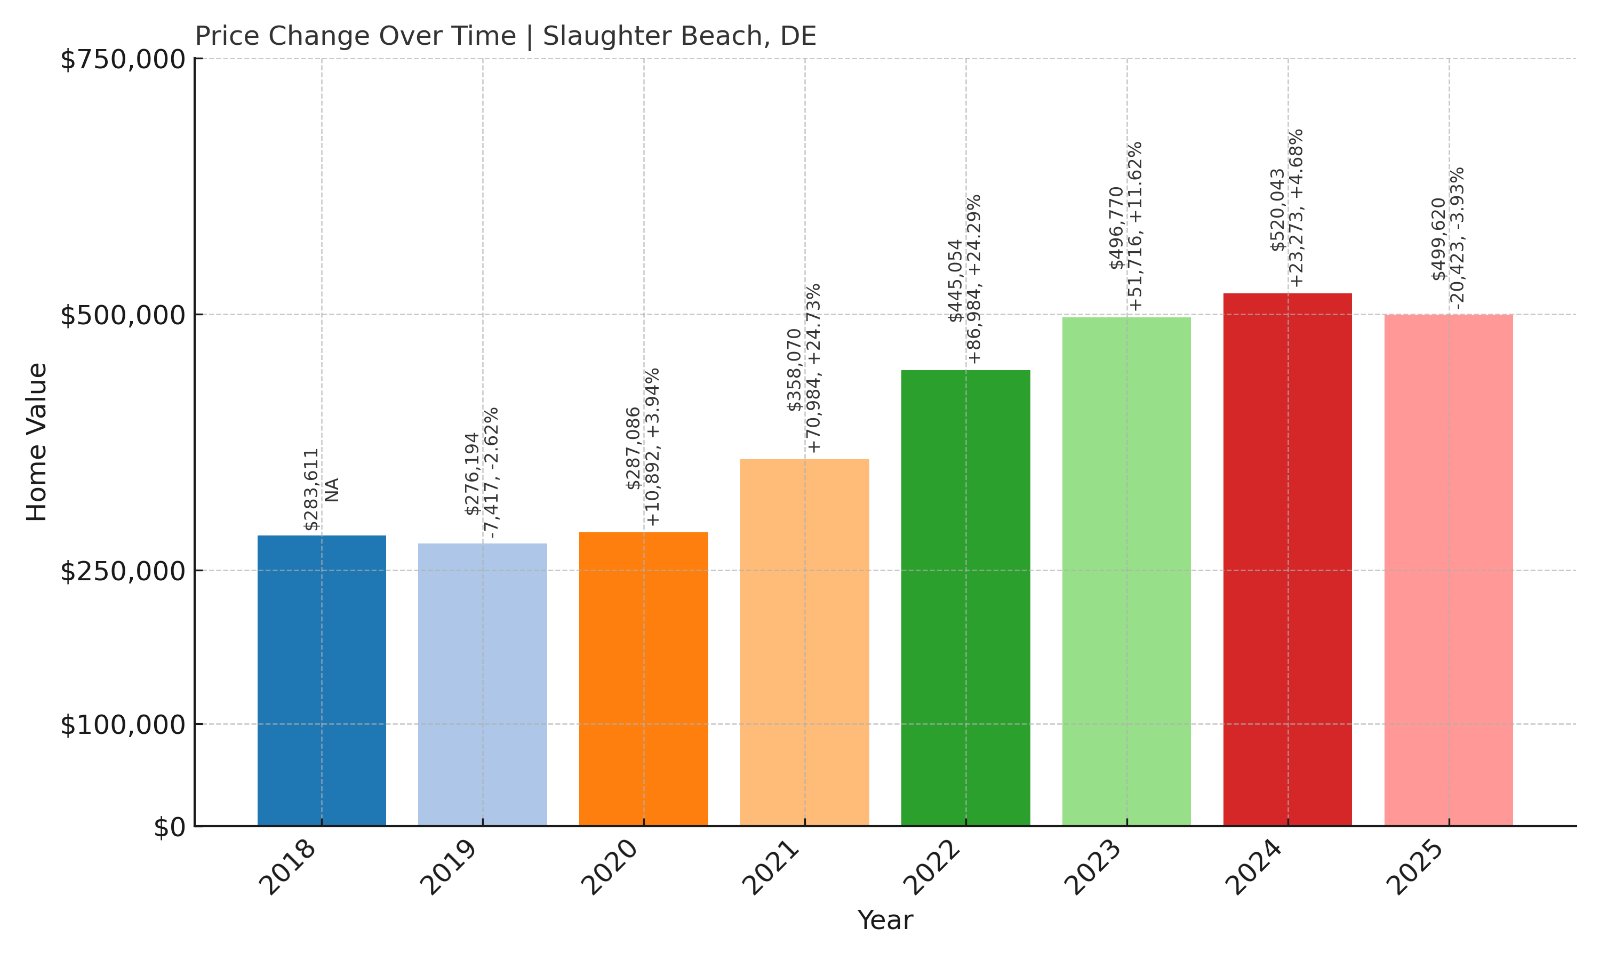
- 2018: $283,611
- 2019: $276,194 (-$7,417, -2.62% from previous year)
- 2020: $287,086 (+$10,892, +3.94% from previous year)
- 2021: $358,070 (+$70,984, +24.73% from previous year)
- 2022: $445,054 (+$86,983, +24.29% from previous year)
- 2023: $496,770 (+$51,716, +11.62% from previous year)
- 2024: $520,043 (+$23,274, +4.68% from previous year)
- 2025: $499,620 (-$20,424, -3.93% from previous year)
Slaughter Beach’s home prices jumped from $283,611 in 2018 to $499,620 in 2025, marking a 76% increase over this period. The town saw especially strong gains in 2021 and 2022, driven by heightened demand for waterfront properties during the pandemic era.
Slaughter Beach – Coastal Wildlife and Rising Appeal

Located along Delaware Bay in Sussex County, Slaughter Beach is a small seaside community known for its horseshoe crab sanctuary and the Delaware Bayshore Byway. Its name, while unique, has not deterred buyers seeking waterfront living at prices below ocean-facing beaches.
The current average price sits just under $500,000, reflecting robust demand for homes with direct beach access and views of migratory bird habitats. However, the recent slight decline in 2025 indicates a possible market correction after rapid appreciation.
Slaughter Beach remains attractive for nature enthusiasts and retirees seeking quiet living with close-knit community life and rich ecological surroundings. Its limited housing inventory also helps sustain higher property values compared to other inland areas.
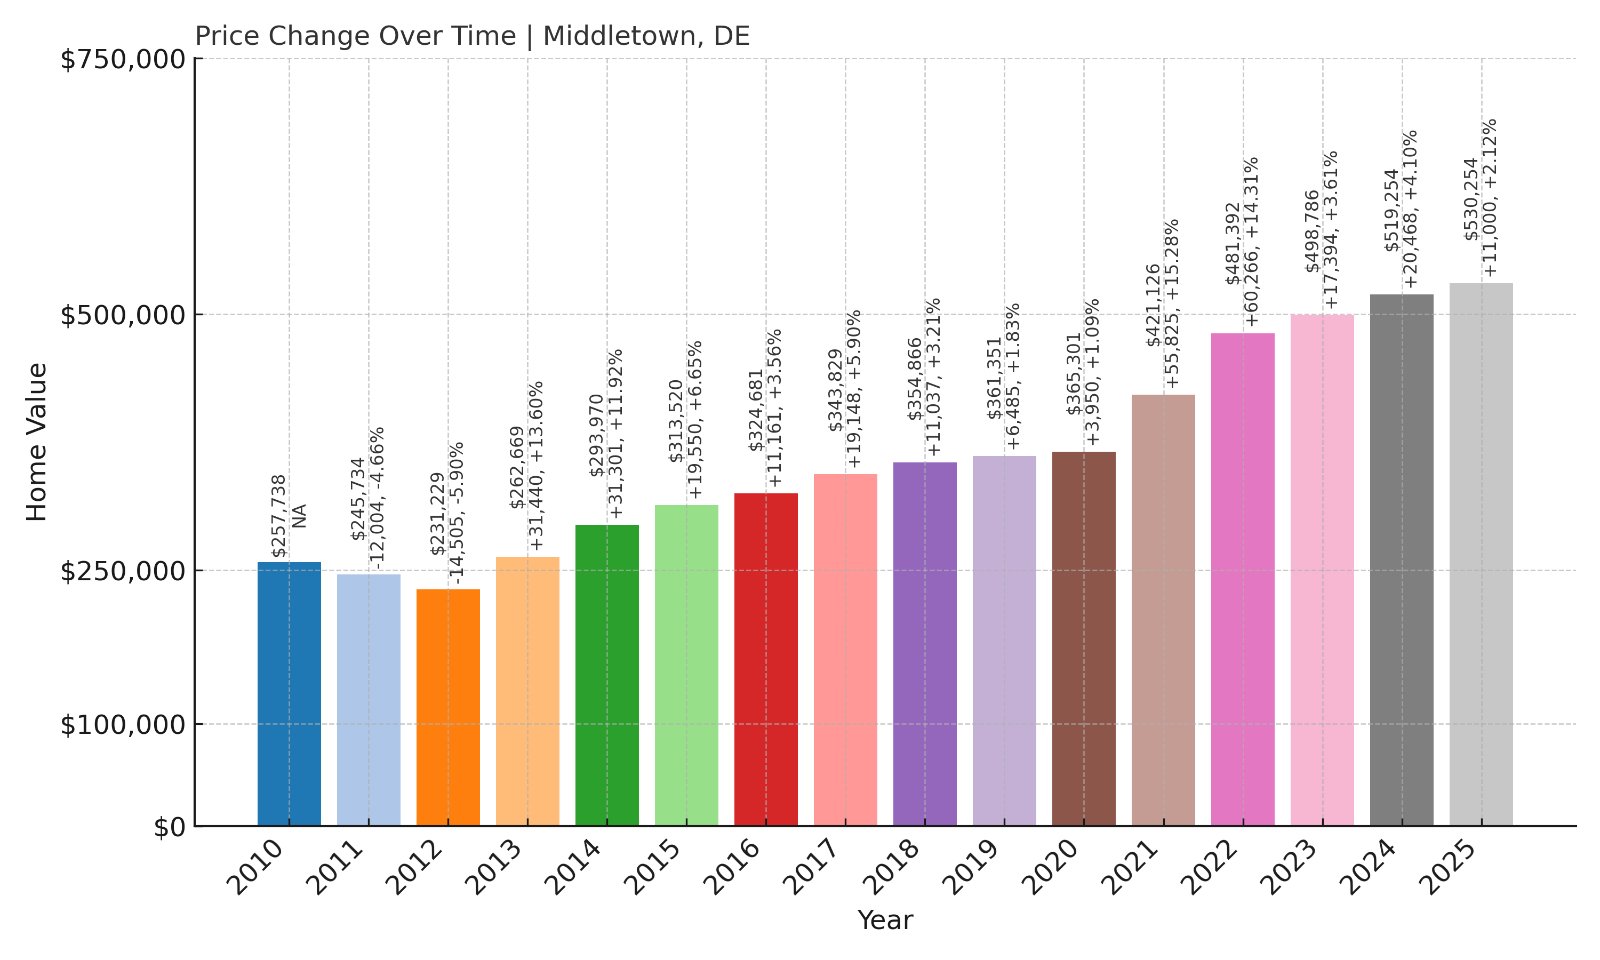
11. Middletown – 129.3% Home Price Increase Since 2012
🔥 Would you like to save this?
- 2010: $257,738
- 2011: $245,734 (-$12,004, -4.66% from previous year)
- 2012: $231,229 (-$14,505, -5.90% from previous year)
- 2013: $262,669 (+$31,440, +13.60% from previous year)
- 2014: $293,970 (+$31,301, +11.92% from previous year)
- 2015: $313,520 (+$19,550, +6.65% from previous year)
- 2016: $324,681 (+$11,161, +3.56% from previous year)
- 2017: $343,829 (+$19,148, +5.90% from previous year)
- 2018: $354,866 (+$11,037, +3.21% from previous year)
- 2019: $361,351 (+$6,485, +1.83% from previous year)
- 2020: $365,301 (+$3,950, +1.09% from previous year)
- 2021: $421,126 (+$55,825, +15.28% from previous year)
- 2022: $481,392 (+$60,266, +14.31% from previous year)
- 2023: $498,786 (+$17,395, +3.61% from previous year)
- 2024: $519,254 (+$20,468, +4.10% from previous year)
- 2025: $530,254 (+$11,000, +2.12% from previous year)
Middletown’s home prices rose dramatically from $231,229 in 2012 to $530,254 in 2025, a 129.3% increase. Its growth was especially strong between 2013 and 2015, and again from 2020 to 2022, reflecting consistent demand over the years.
Middletown – Rapid Expansion and Family Living
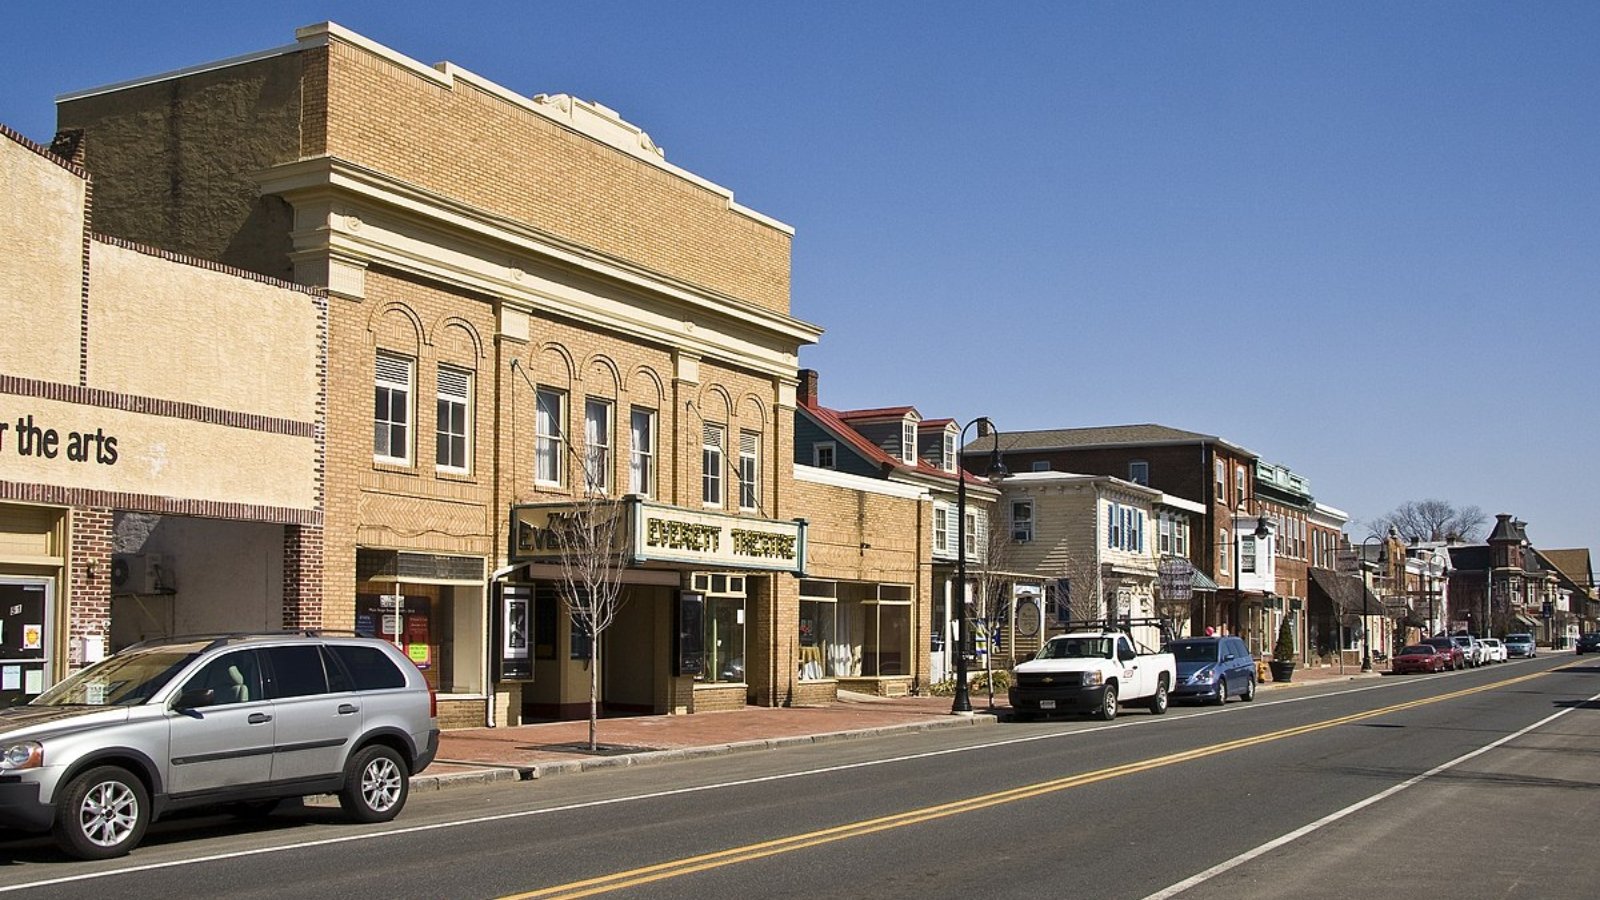
Middletown is one of Delaware’s fastest-growing towns, located in southern New Castle County. It offers a blend of suburban developments, shopping centers, and well-rated schools, drawing many families from Wilmington and surrounding areas.
With current home prices exceeding $530,000, Middletown’s expansion includes new subdivisions and retail centers. Its strategic location along Route 301 provides easy access to both Delaware and Maryland job markets, bolstering housing demand.
Historically an agricultural hub, Middletown has transformed into a residential hotspot while retaining historic charm in its downtown district. This growth, alongside infrastructure investments, continues to strengthen its real estate market outlook.
10. Selbyville – 95.3% Home Price Increase Since 2012
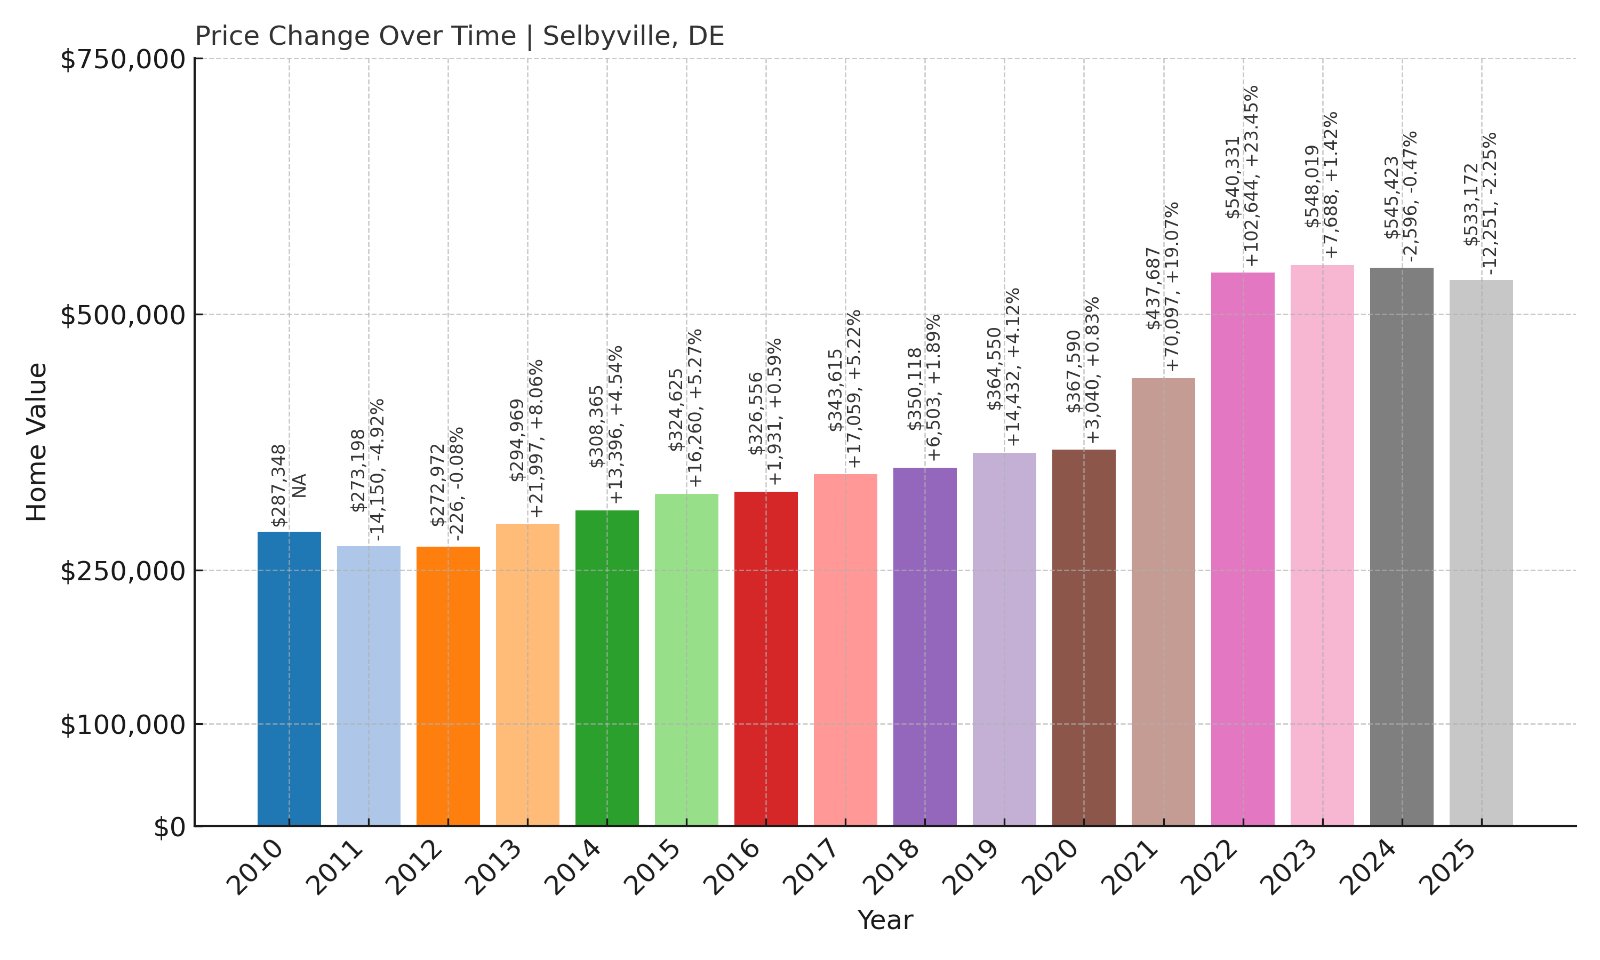
- 2010: $287,348
- 2011: $273,198 (-$14,150, -4.92% from previous year)
- 2012: $272,972 (-$226, -0.08% from previous year)
- 2013: $294,969 (+$21,997, +8.06% from previous year)
- 2014: $308,365 (+$13,395, +4.54% from previous year)
- 2015: $324,625 (+$16,260, +5.27% from previous year)
- 2016: $326,556 (+$1,931, +0.59% from previous year)
- 2017: $343,615 (+$17,059, +5.22% from previous year)
- 2018: $350,118 (+$6,504, +1.89% from previous year)
- 2019: $364,550 (+$14,431, +4.12% from previous year)
- 2020: $367,590 (+$3,040, +0.83% from previous year)
- 2021: $437,687 (+$70,097, +19.07% from previous year)
- 2022: $540,331 (+$102,644, +23.45% from previous year)
- 2023: $548,019 (+$7,687, +1.42% from previous year)
- 2024: $545,423 (-$2,595, -0.47% from previous year)
- 2025: $533,172 (-$12,252, -2.25% from previous year)
Selbyville’s home prices nearly doubled from $272,972 in 2012 to $533,172 in 2025, a 95.3% increase. Large spikes in 2021 and 2022 boosted its market, while slight declines in the past two years reflect a market readjustment.
Selbyville – Gateway to Fenwick Island and Ocean Resorts
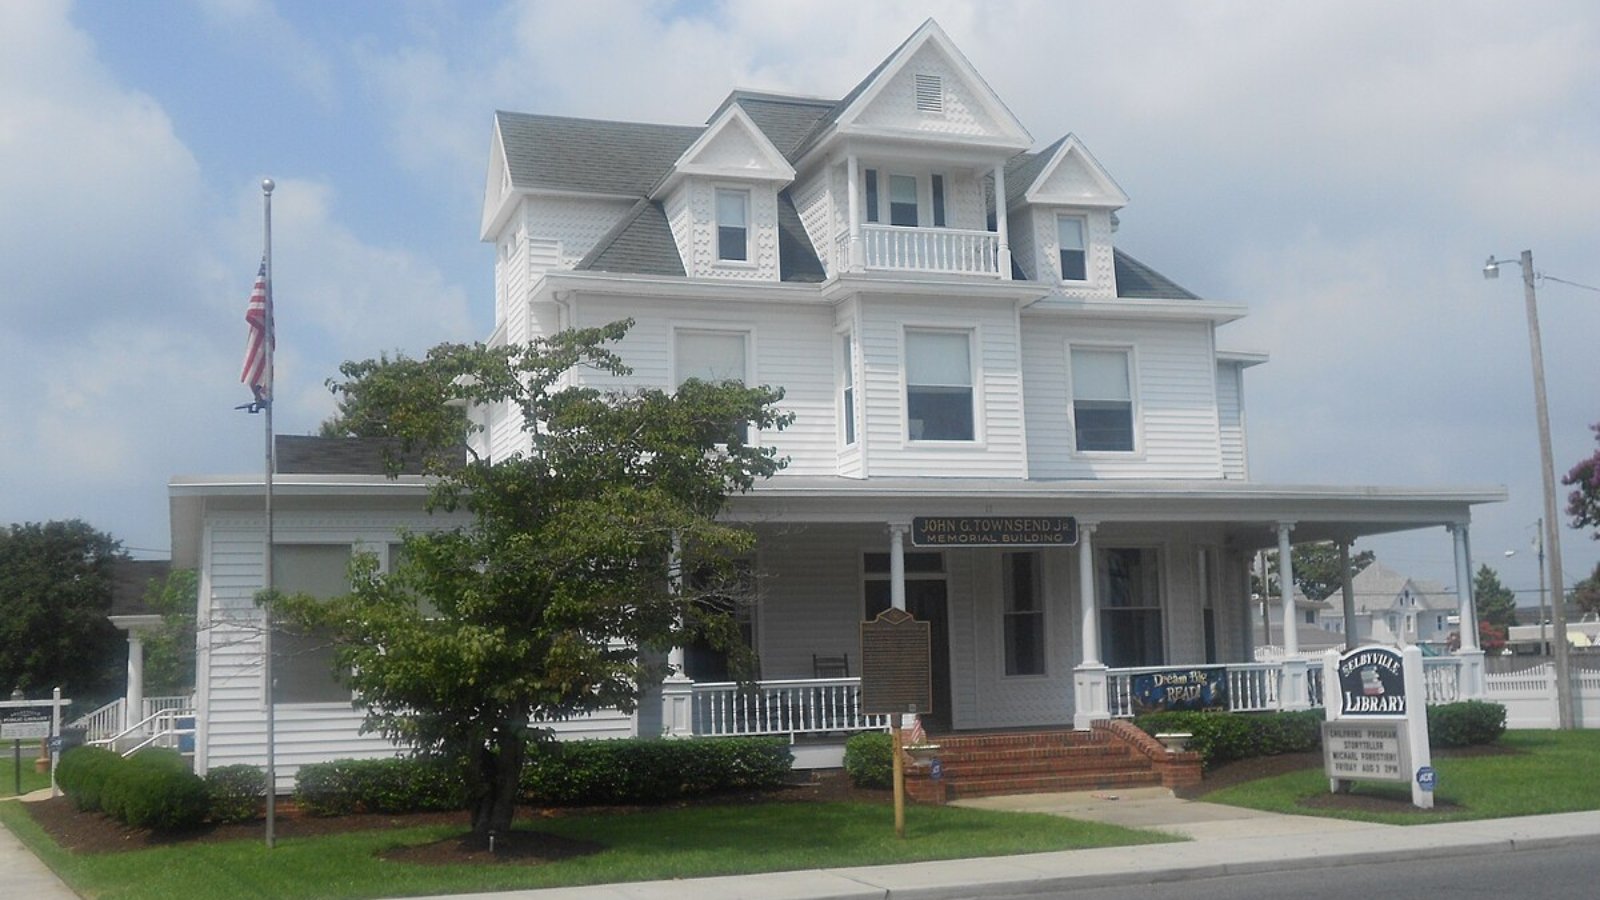
Selbyville sits in southern Sussex County, just inland from Fenwick Island and Ocean City, Maryland. Its strategic location makes it popular among retirees and seasonal residents who want proximity to the beaches without direct oceanfront costs.
With current home prices averaging over $530,000, Selbyville offers residential developments, historic neighborhoods, and farmland settings. The town is also known for The Freeman Stage, a popular outdoor entertainment venue drawing regional visitors.
Founded in the 19th century as a rail and farming hub, Selbyville retains its small-town charm while benefiting from coastal tourism spillover, supporting its housing market despite recent softening.
9. Ocean View – 73.2% Home Price Increase Since 2012
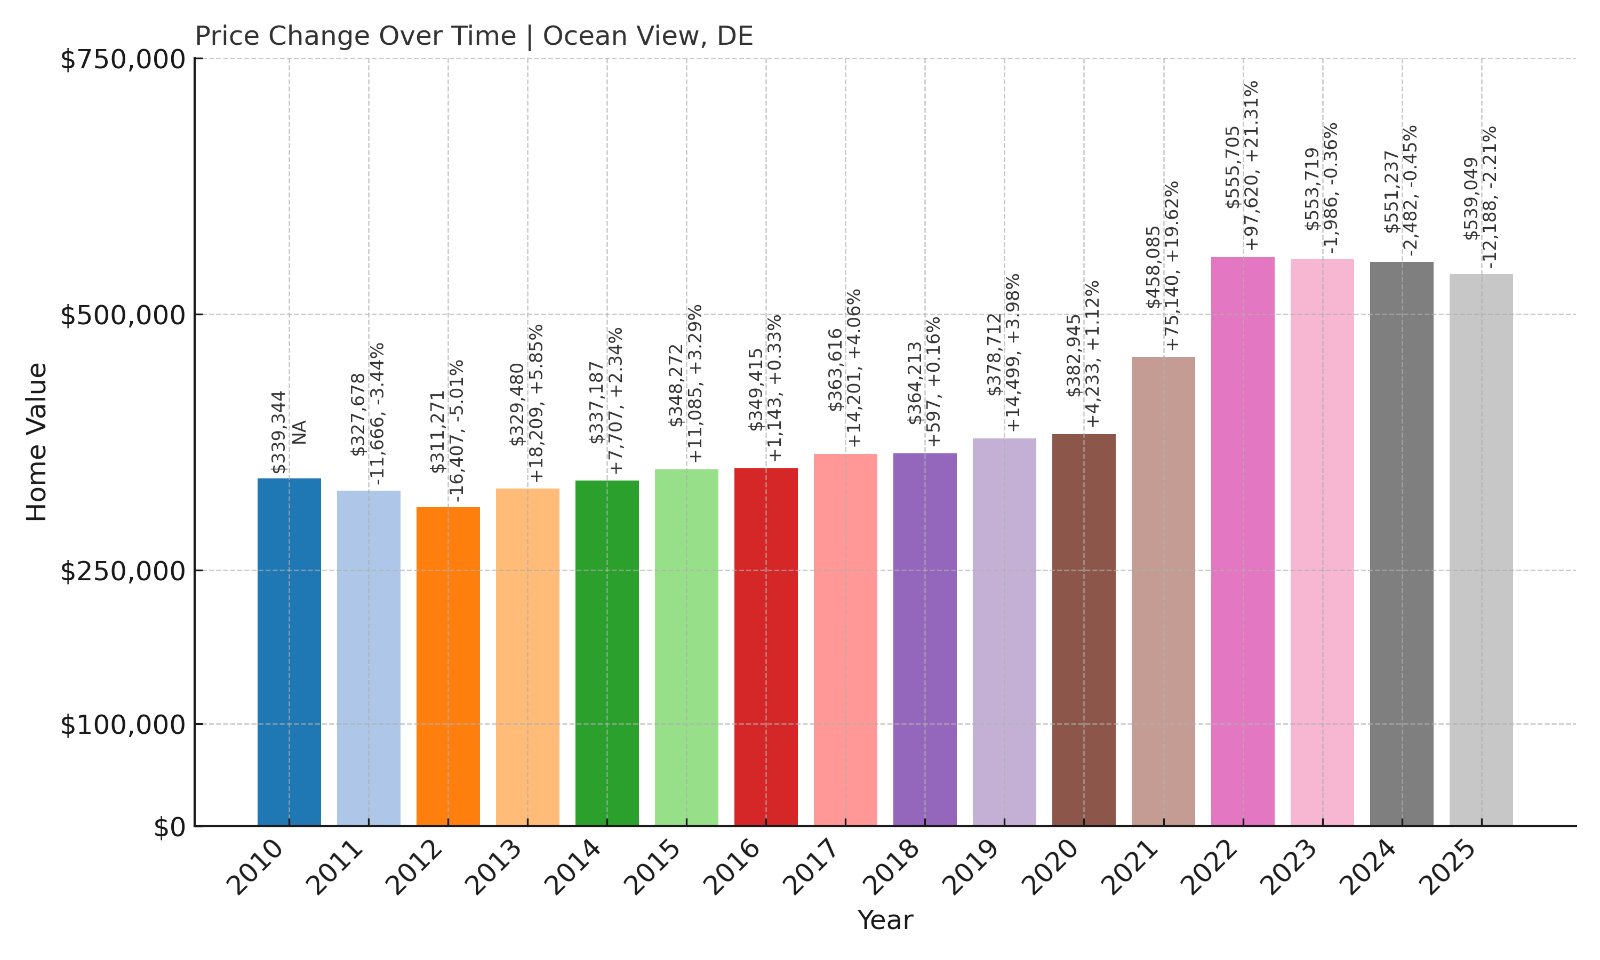
- 2010: $339,344
- 2011: $327,678 (-$11,665, -3.44% from previous year)
- 2012: $311,271 (-$16,407, -5.01% from previous year)
- 2013: $329,480 (+$18,209, +5.85% from previous year)
- 2014: $337,187 (+$7,707, +2.34% from previous year)
- 2015: $348,272 (+$11,085, +3.29% from previous year)
- 2016: $349,415 (+$1,142, +0.33% from previous year)
- 2017: $363,616 (+$14,201, +4.06% from previous year)
- 2018: $364,213 (+$597, +0.16% from previous year)
- 2019: $378,712 (+$14,499, +3.98% from previous year)
- 2020: $382,945 (+$4,233, +1.12% from previous year)
- 2021: $458,085 (+$75,140, +19.62% from previous year)
- 2022: $555,705 (+$97,620, +21.31% from previous year)
- 2023: $553,719 (-$1,986, -0.36% from previous year)
- 2024: $551,237 (-$2,482, -0.45% from previous year)
- 2025: $539,049 (-$12,189, -2.21% from previous year)
Ocean View saw home prices rise from $311,271 in 2012 to $539,049 in 2025, a 73.2% increase. Prices spiked sharply between 2020 and 2022 before stabilizing with small decreases over the past three years.
Ocean View – Close-Knit Community Near the Coast
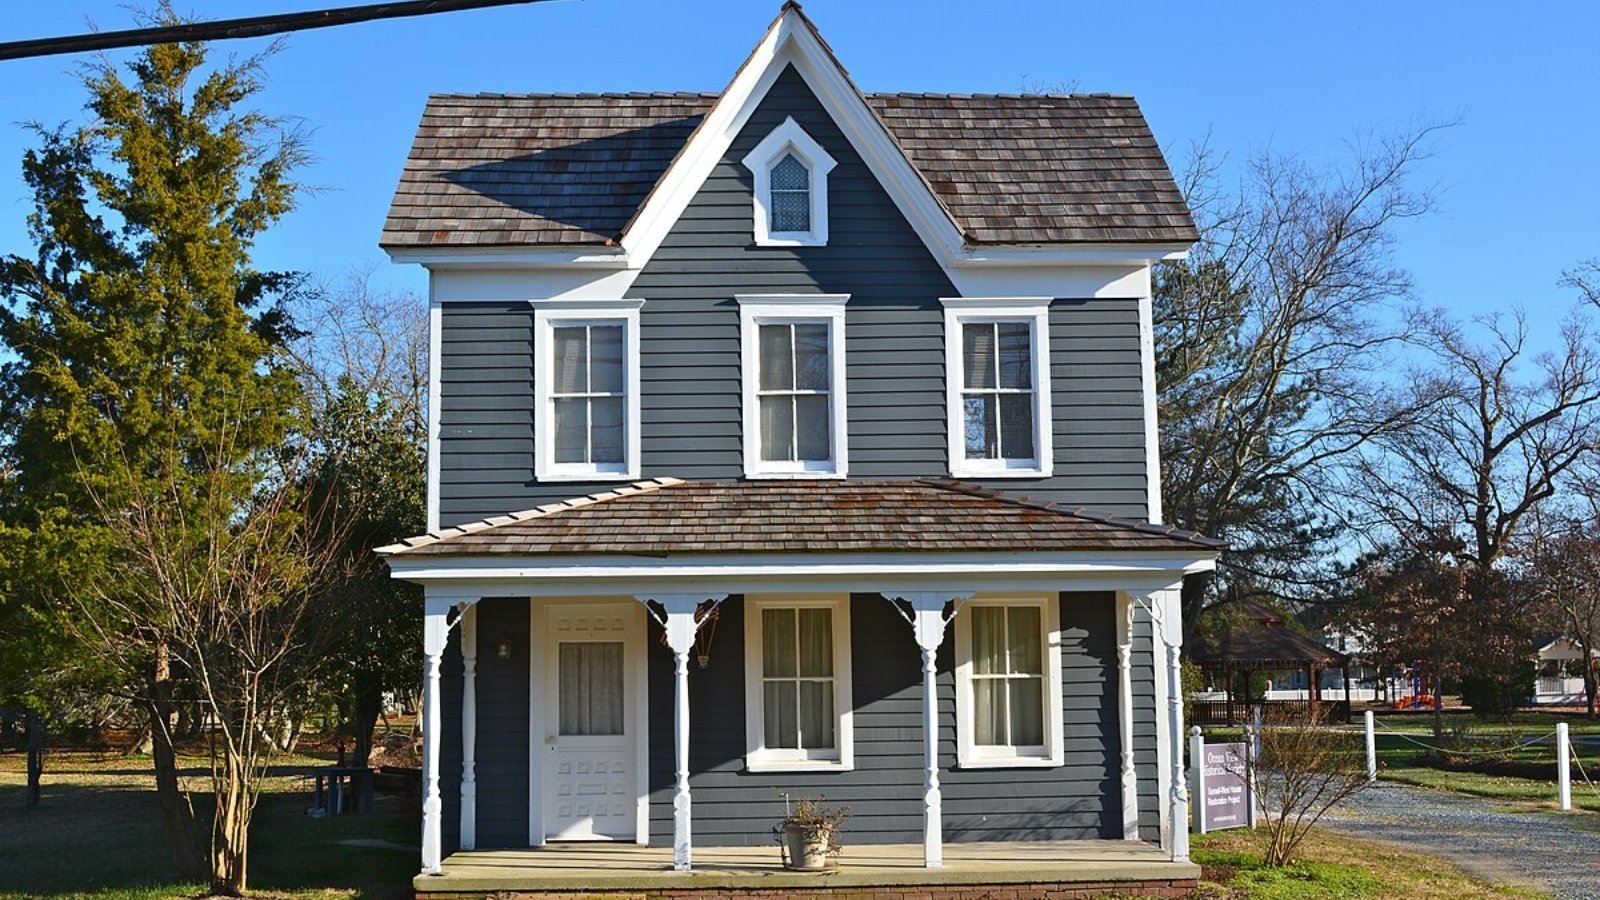
Ocean View is located just a few miles inland from Bethany Beach, offering residents a quieter lifestyle with quick access to sand and surf. Its neighborhoods include a mix of retirement communities and family developments.
The current average home price exceeds $539,000, driven by demand from buyers seeking coastal proximity without direct beachfront pricing. The town’s local shops, restaurants, and community parks add to its appeal.
Founded in the 1800s, Ocean View has evolved from a small farming settlement into a thriving residential town serving both year-round residents and seasonal homeowners drawn to Delaware’s scenic coastal region.
8. Harbeson – 96.5% Home Price Increase Since 2012
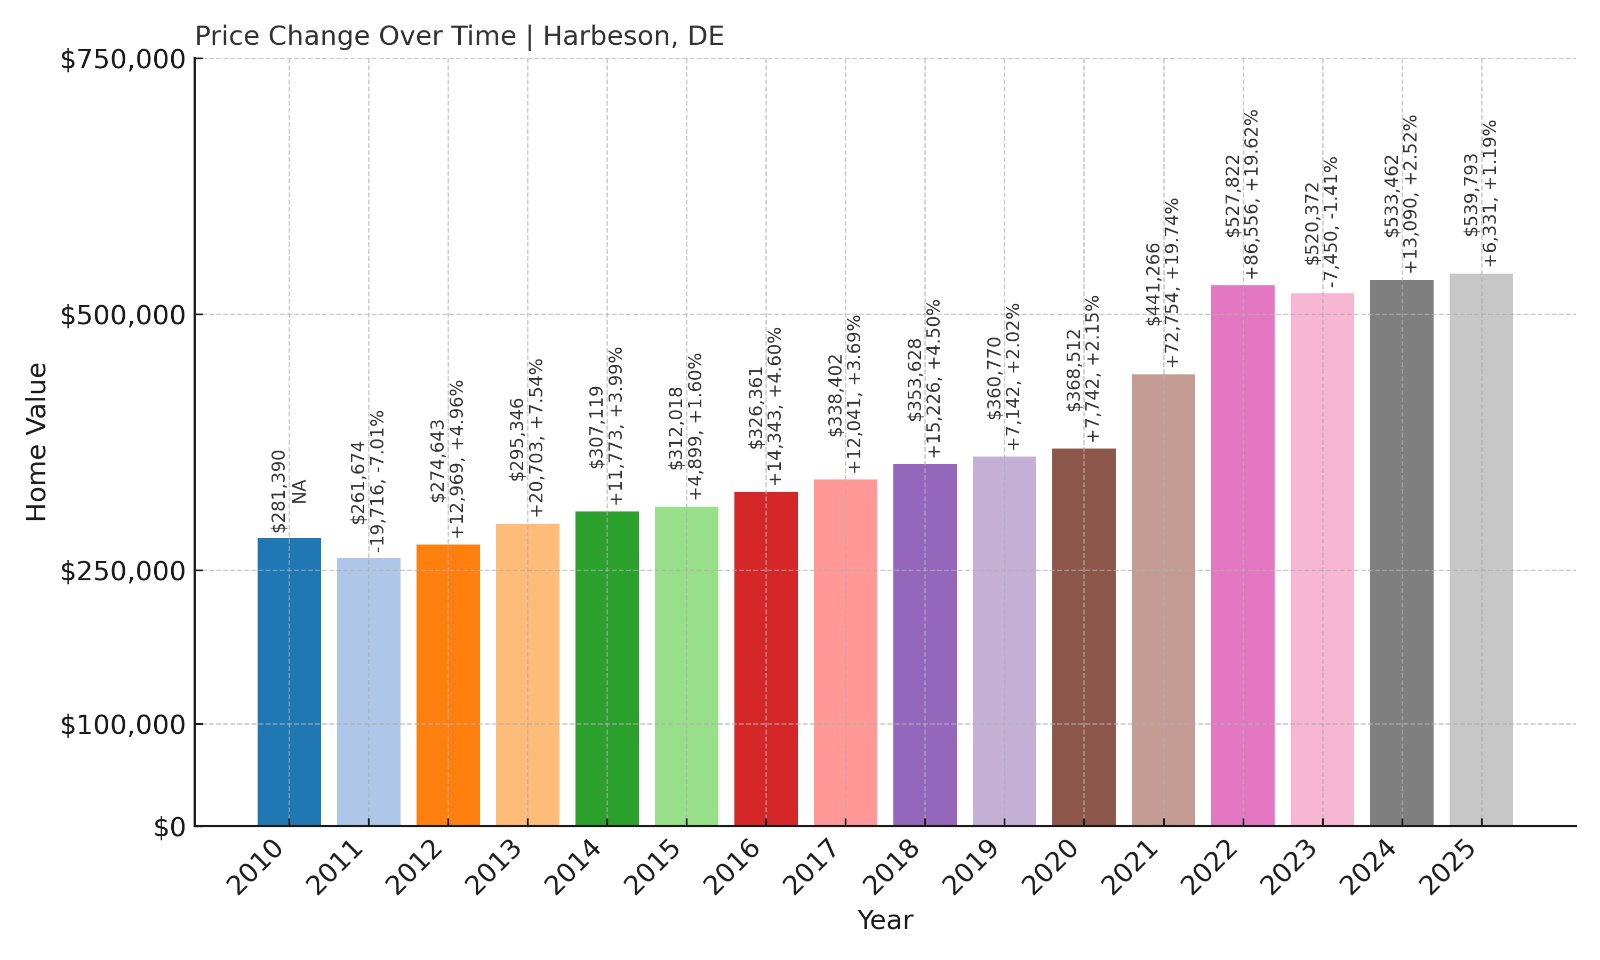
- 2010: $281,390
- 2011: $261,674 (-$19,715, -7.01% from previous year)
- 2012: $274,643 (+$12,969, +4.96% from previous year)
- 2013: $295,346 (+$20,703, +7.54% from previous year)
- 2014: $307,119 (+$11,773, +3.99% from previous year)
- 2015: $312,018 (+$4,899, +1.60% from previous year)
- 2016: $326,361 (+$14,343, +4.60% from previous year)
- 2017: $338,402 (+$12,041, +3.69% from previous year)
- 2018: $353,628 (+$15,226, +4.50% from previous year)
- 2019: $360,770 (+$7,142, +2.02% from previous year)
- 2020: $368,512 (+$7,742, +2.15% from previous year)
- 2021: $441,266 (+$72,754, +19.74% from previous year)
- 2022: $527,822 (+$86,555, +19.62% from previous year)
- 2023: $520,372 (-$7,450, -1.41% from previous year)
- 2024: $533,462 (+$13,090, +2.52% from previous year)
- 2025: $539,793 (+$6,331, +1.19% from previous year)
Harbeson’s home prices rose from $274,643 in 2012 to $539,793 in 2025, a 96.5% increase. The largest growth occurred between 2020 and 2022, before stabilizing with smaller gains in the last two years.
Harbeson – Rural Setting with Coastal Advantage
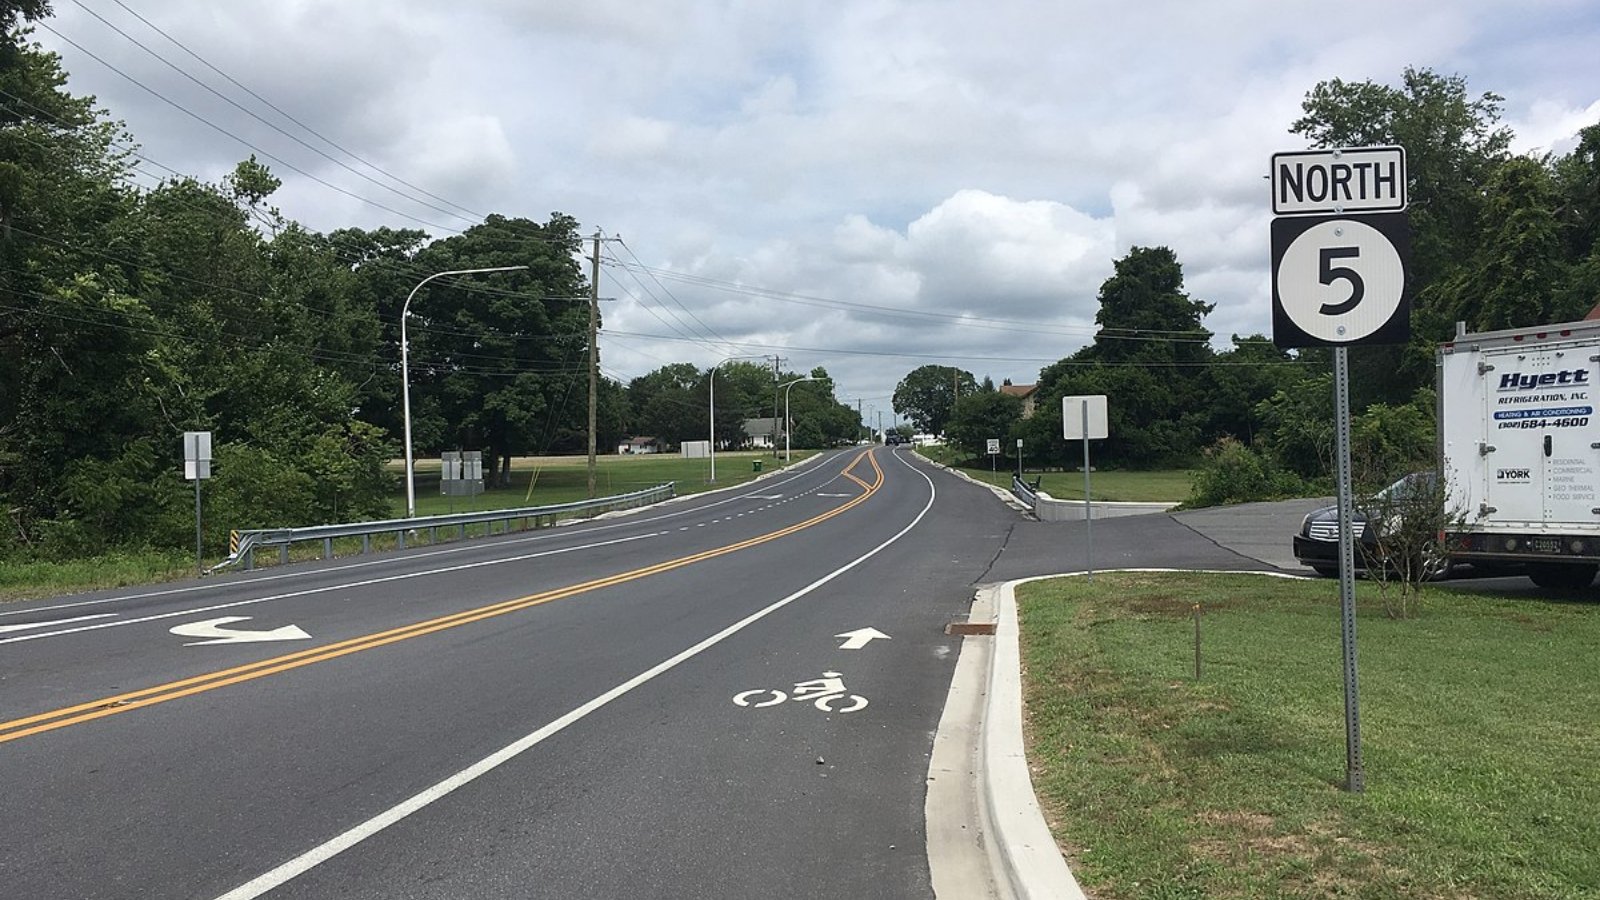
Harbeson is an unincorporated community located along Route 5 in Sussex County, positioned between Milton and Lewes. Its appeal lies in its peaceful rural setting combined with proximity to the popular Delaware beaches.
With current home prices exceeding $539,000, Harbeson’s market reflects strong demand for properties offering land, privacy, and quick coastal access. Buyers include retirees and professionals working in surrounding beach towns.
The area features agricultural lands, small businesses, and residential developments, making it an attractive choice for those seeking space without sacrificing convenience to shopping and seaside attractions.
7. Hockessin – 71.4% Home Price Increase Since 2012
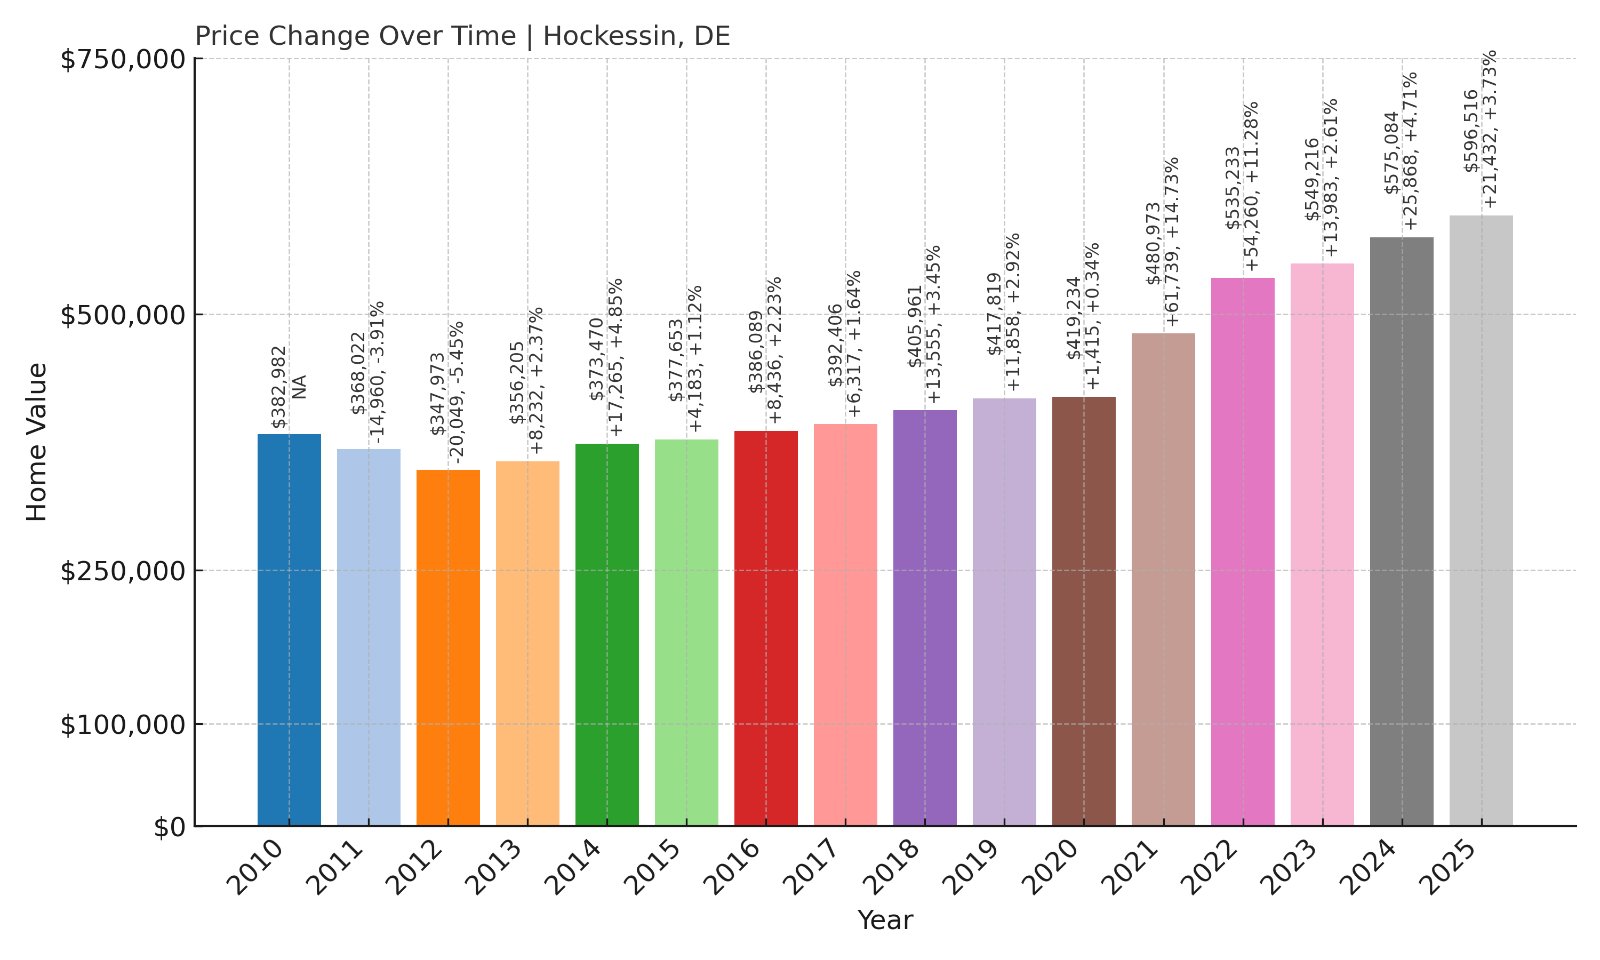
- 2010: $382,982
- 2011: $368,022 (-$14,960, -3.91% from previous year)
- 2012: $347,973 (-$20,049, -5.45% from previous year)
- 2013: $356,205 (+$8,232, +2.37% from previous year)
- 2014: $373,470 (+$17,265, +4.85% from previous year)
- 2015: $377,653 (+$4,183, +1.12% from previous year)
- 2016: $386,089 (+$8,436, +2.23% from previous year)
- 2017: $392,406 (+$6,317, +1.64% from previous year)
- 2018: $405,961 (+$13,555, +3.45% from previous year)
- 2019: $417,819 (+$11,858, +2.92% from previous year)
- 2020: $419,234 (+$1,415, +0.34% from previous year)
- 2021: $480,973 (+$61,739, +14.73% from previous year)
- 2022: $535,233 (+$54,260, +11.28% from previous year)
- 2023: $549,216 (+$13,984, +2.61% from previous year)
- 2024: $575,084 (+$25,867, +4.71% from previous year)
- 2025: $596,516 (+$21,432, +3.73% from previous year)
Hockessin’s home prices climbed from $347,973 in 2012 to $596,516 in 2025, a 71.4% increase. Strong gains were seen in 2021 and 2022, with steady growth continuing in recent years.
Hockessin – Affluent Community with Suburban Appeal
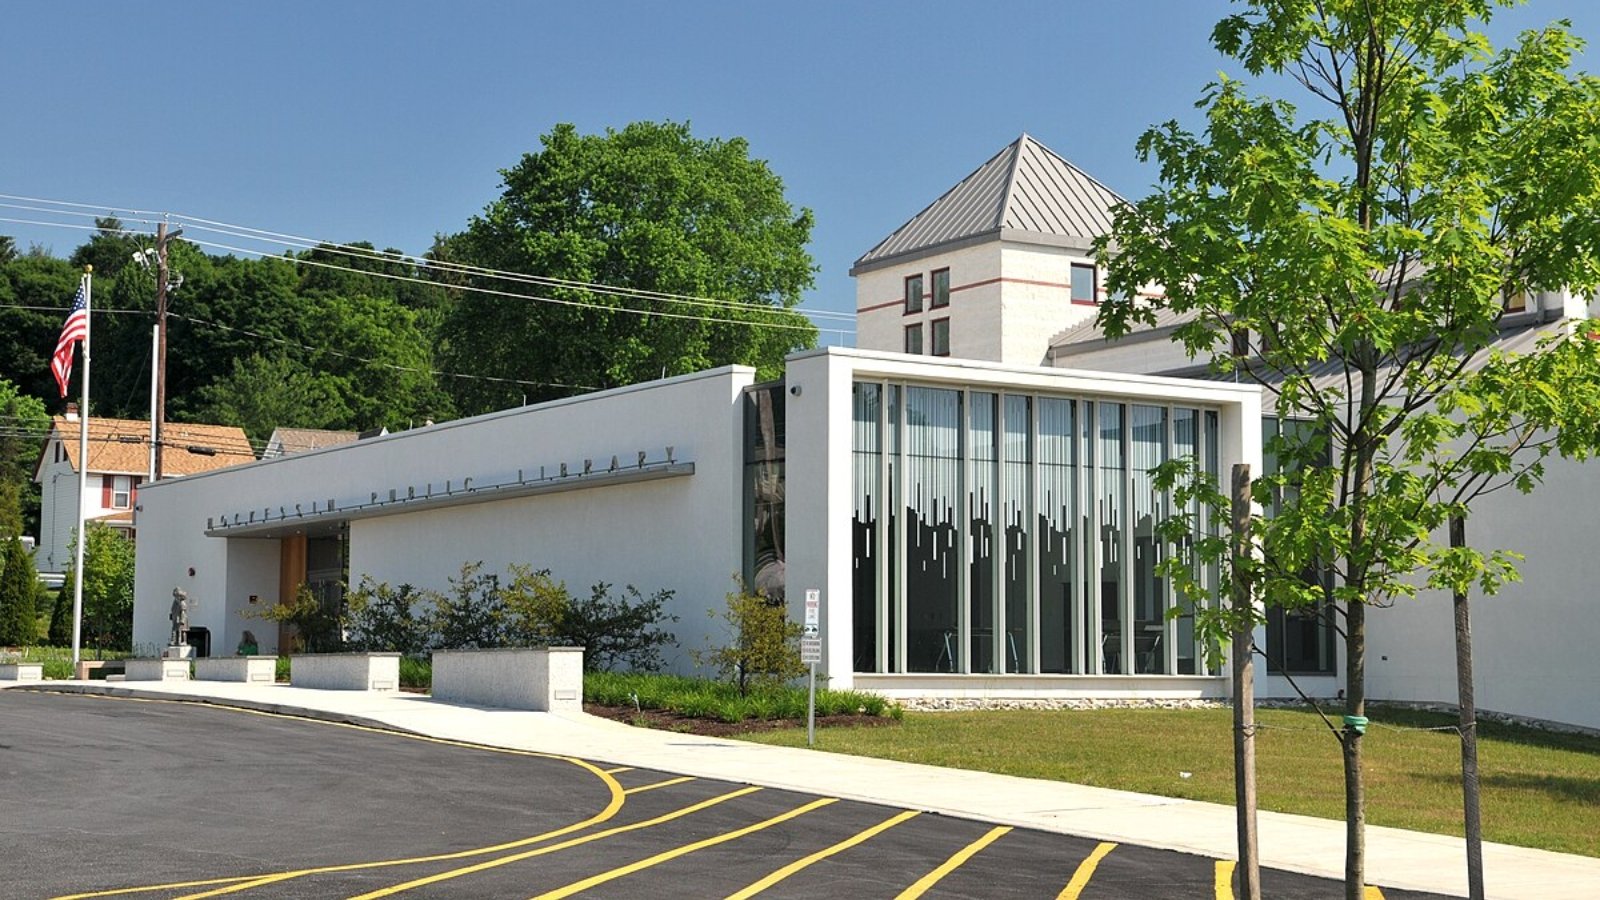
Hockessin is located in northern New Castle County near the Pennsylvania border. Known for its upscale homes, excellent schools, and recreational amenities, it’s a popular choice for professionals working in Wilmington or Philadelphia.
The current average home price is nearly $600,000, reflecting demand for larger properties with suburban privacy while remaining accessible to major employment centers. Hockessin’s parks, local shops, and community events add to its enduring appeal.
Historically a small farming village, Hockessin has evolved into a residential enclave with luxury developments alongside older estates, driving property values steadily upward over the past decade.
6. Lewes – 81.7% Home Price Increase Since 2012
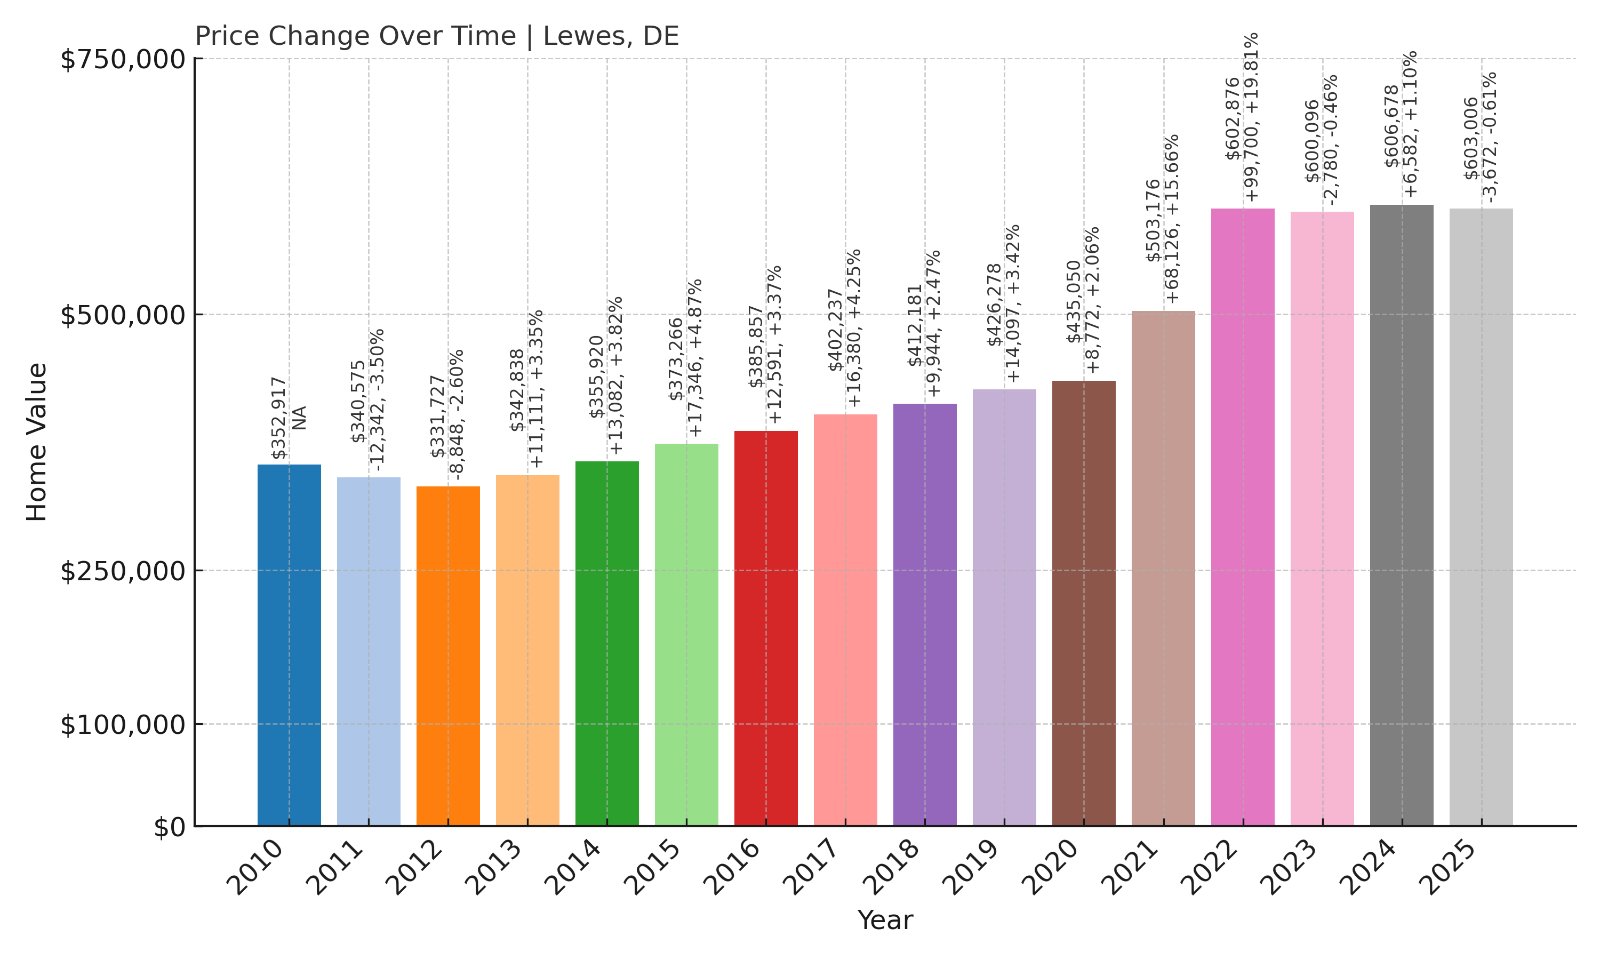
- 2010: $352,917
- 2011: $340,575 (-$12,341, -3.50% from previous year)
- 2012: $331,727 (-$8,848, -2.60% from previous year)
- 2013: $342,838 (+$11,111, +3.35% from previous year)
- 2014: $355,920 (+$13,082, +3.82% from previous year)
- 2015: $373,266 (+$17,346, +4.87% from previous year)
- 2016: $385,857 (+$12,591, +3.37% from previous year)
- 2017: $402,237 (+$16,380, +4.25% from previous year)
- 2018: $412,181 (+$9,944, +2.47% from previous year)
- 2019: $426,278 (+$14,097, +3.42% from previous year)
- 2020: $435,050 (+$8,772, +2.06% from previous year)
- 2021: $503,176 (+$68,126, +15.66% from previous year)
- 2022: $602,876 (+$99,700, +19.81% from previous year)
- 2023: $600,096 (-$2,780, -0.46% from previous year)
- 2024: $606,678 (+$6,582, +1.10% from previous year)
- 2025: $603,006 (-$3,672, -0.61% from previous year)
Lewes’s home prices rose from $331,727 in 2012 to $603,006 in 2025, an 81.7% increase. The sharpest gains came in 2021 and 2022, with recent years stabilizing at a high price point.
Lewes – Historic Coastal Town with High Demand
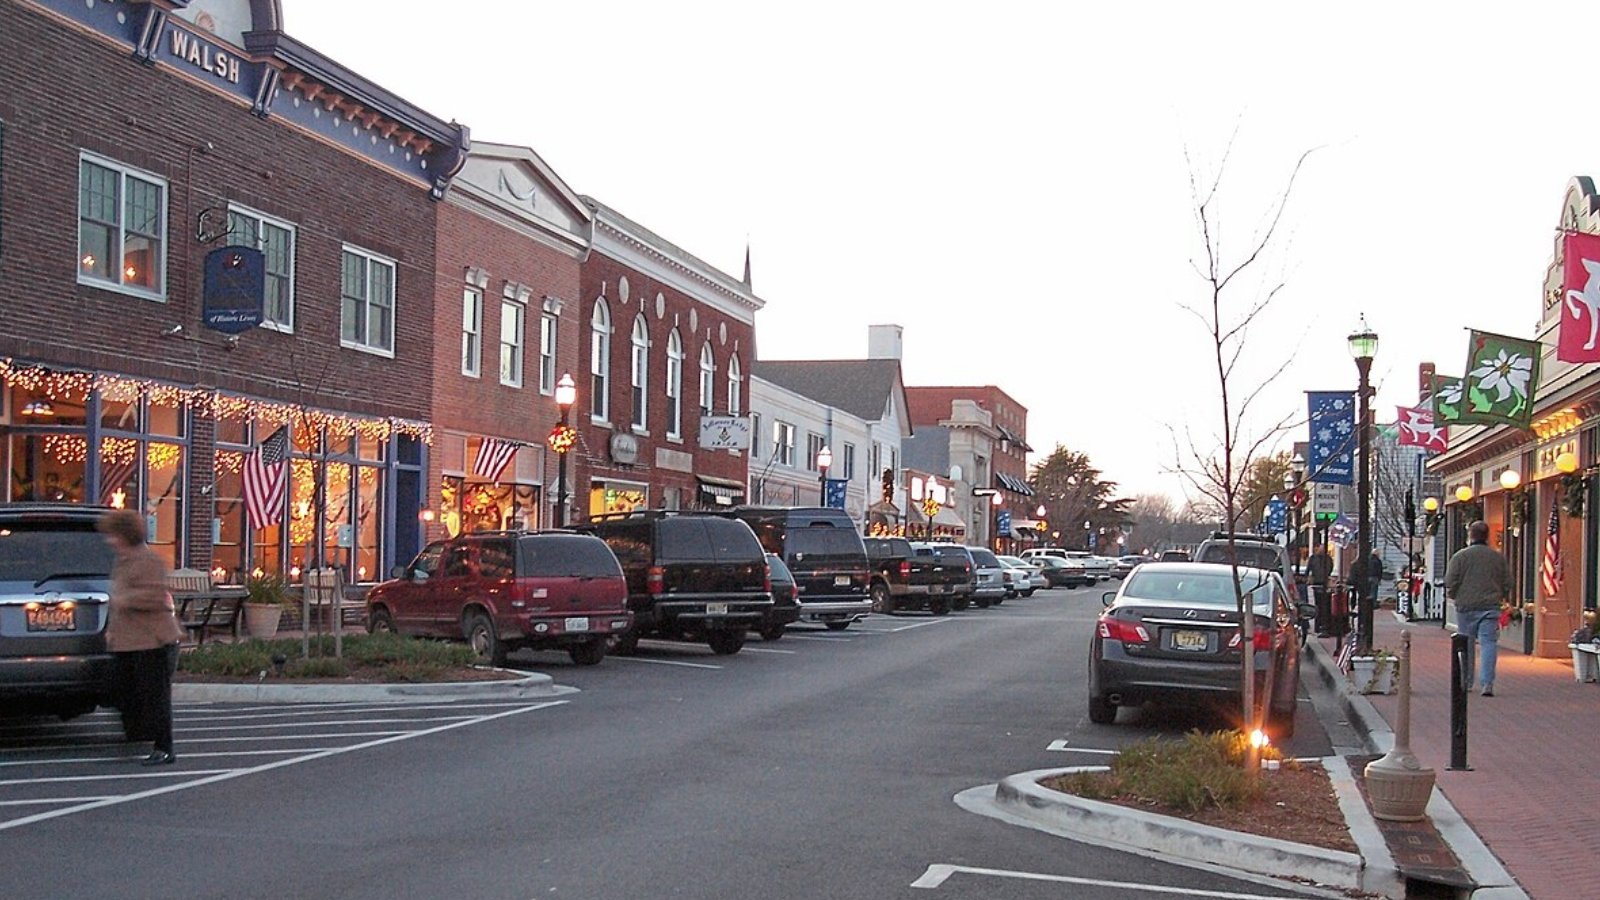
Lewes is one of Delaware’s oldest towns, located where the Delaware Bay meets the Atlantic Ocean. Its historic district, beach access, and maritime charm draw retirees, families, and vacation-home buyers alike.
With average prices over $600,000, Lewes combines heritage homes and modern coastal developments. Its bustling downtown, Cape Henlopen State Park, and ferry access to Cape May, New Jersey, further enhance its desirability.
Founded in 1631 as the first European settlement in Delaware, Lewes’s history and amenities continue to sustain strong homebuyer demand, maintaining its status as one of the state’s most expensive markets.
5. Rehoboth Beach – 95.4% Home Price Increase Since 2012

🔥 Would you like to save this?
- 2010: $450,701
- 2011: $431,535 (-$19,166, -4.25% from previous year)
- 2012: $413,451 (-$18,084, -4.19% from previous year)
- 2013: $432,245 (+$18,794, +4.55% from previous year)
- 2014: $478,966 (+$46,721, +10.81% from previous year)
- 2015: $517,737 (+$38,771, +8.09% from previous year)
- 2016: $528,736 (+$10,998, +2.12% from previous year)
- 2017: $561,575 (+$32,839, +6.21% from previous year)
- 2018: $585,310 (+$23,735, +4.23% from previous year)
- 2019: $588,028 (+$2,718, +0.46% from previous year)
- 2020: $602,261 (+$14,233, +2.42% from previous year)
- 2021: $702,505 (+$100,244, +16.64% from previous year)
- 2022: $874,700 (+$172,195, +24.51% from previous year)
- 2023: $859,004 (-$15,696, -1.79% from previous year)
- 2024: $813,612 (-$45,392, -5.28% from previous year)
- 2025: $808,072 (-$5,540, -0.68% from previous year)
Rehoboth Beach’s home prices rose from $413,451 in 2012 to $808,072 in 2025, a 95.4% increase. Price peaks in 2022 have since softened slightly but remain among the highest in Delaware.
Rehoboth Beach – Delaware’s Premier Resort Destination
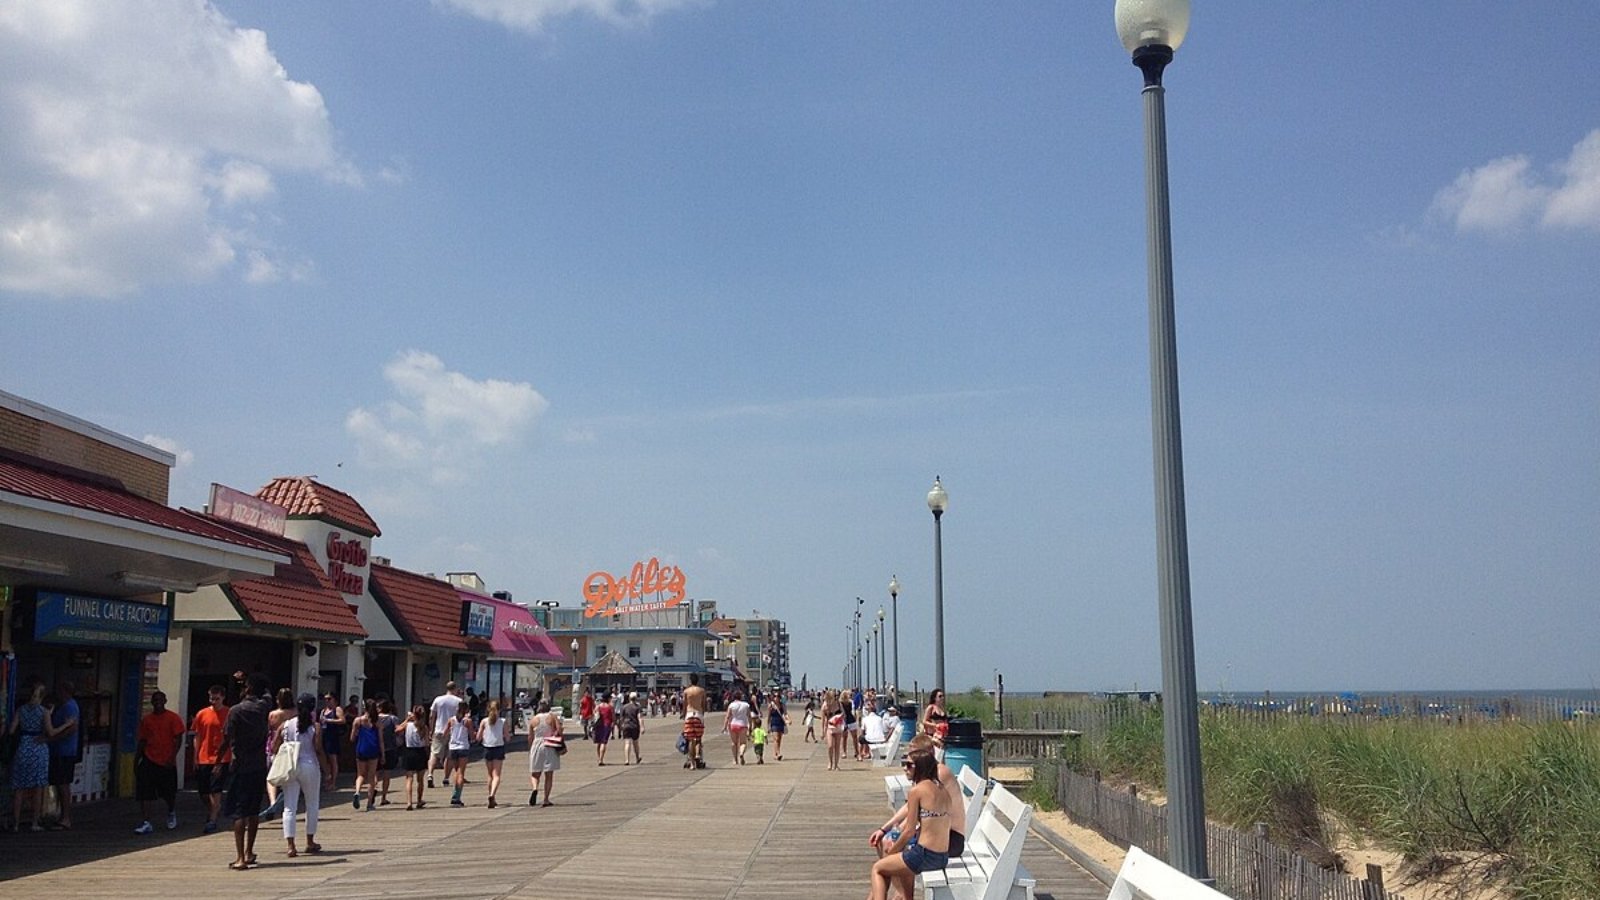
Located on the Atlantic coast, Rehoboth Beach is famous for its boardwalk, boutique shopping, and lively summer events. It draws vacationers and second-home buyers from across the Mid-Atlantic.
With current home prices exceeding $800,000, Rehoboth Beach’s market reflects the premium buyers pay for beachfront proximity and thriving local businesses. Even with slight recent declines, demand remains high.
Founded in 1873 as a seaside resort, Rehoboth Beach continues to balance modern tourism with small-town charm, securing its place as one of Delaware’s most sought-after coastal real estate markets.
4. Bethany Beach – 45.6% Home Price Increase Since 2012
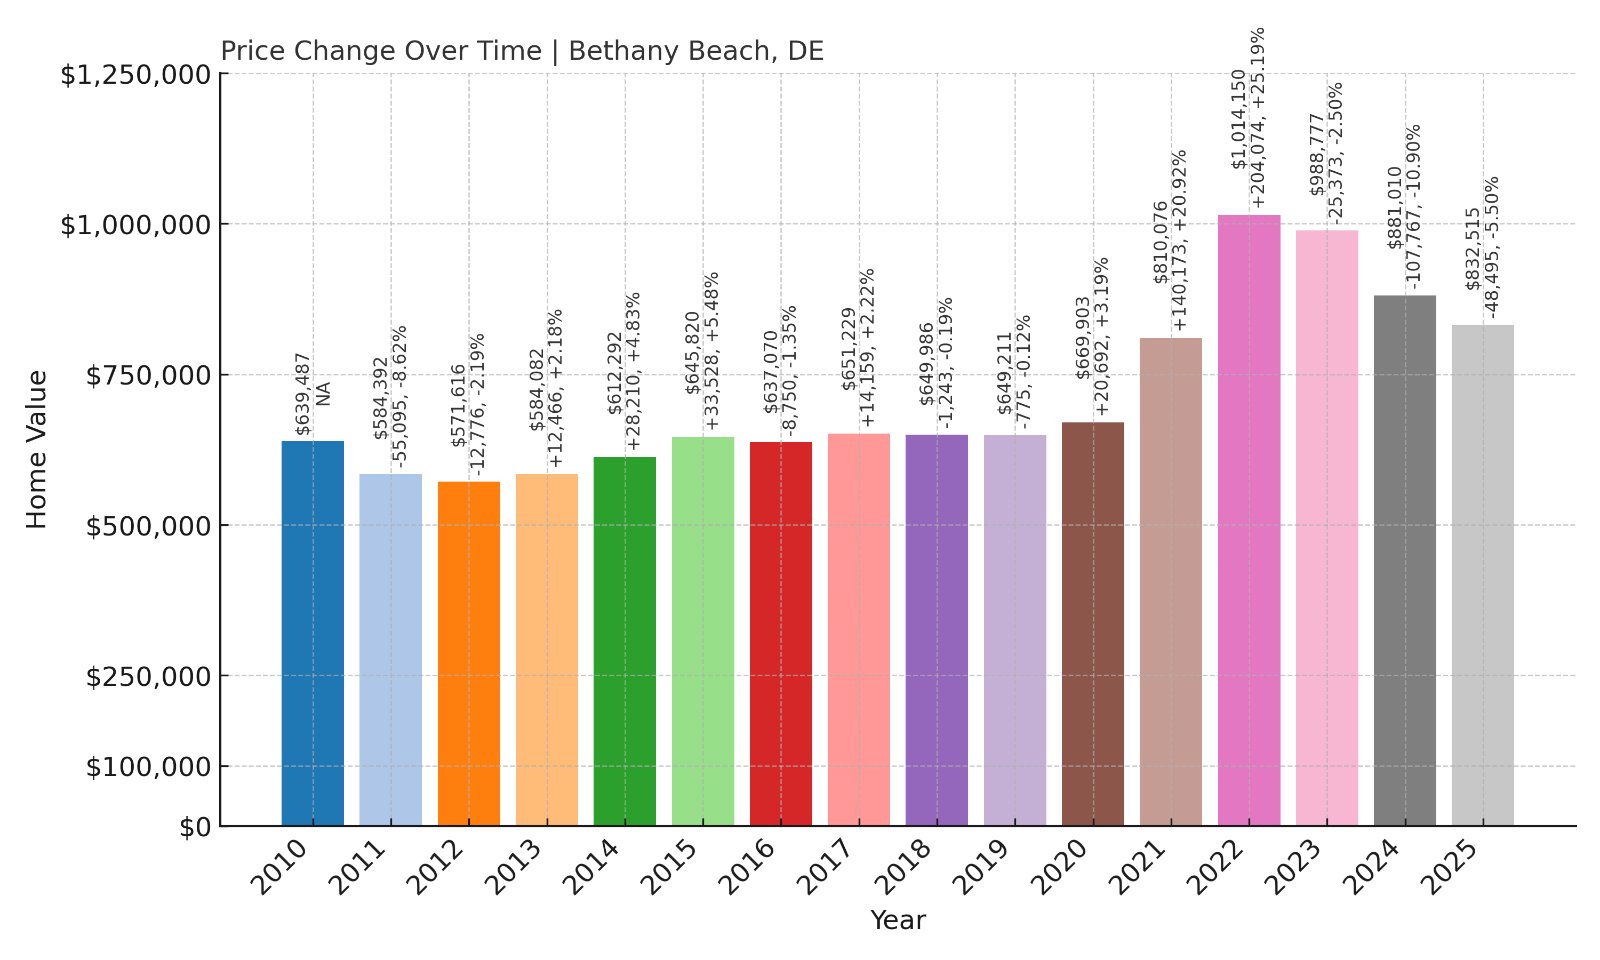
- 2010: $639,487
- 2011: $584,392 (-$55,094, -8.62% from previous year)
- 2012: $571,616 (-$12,777, -2.19% from previous year)
- 2013: $584,082 (+$12,466, +2.18% from previous year)
- 2014: $612,292 (+$28,211, +4.83% from previous year)
- 2015: $645,820 (+$33,528, +5.48% from previous year)
- 2016: $637,070 (-$8,750, -1.35% from previous year)
- 2017: $651,229 (+$14,159, +2.22% from previous year)
- 2018: $649,986 (-$1,243, -0.19% from previous year)
- 2019: $649,211 (-$775, -0.12% from previous year)
- 2020: $669,903 (+$20,692, +3.19% from previous year)
- 2021: $810,076 (+$140,173, +20.92% from previous year)
- 2022: $1,014,150 (+$204,074, +25.19% from previous year)
- 2023: $988,777 (-$25,374, -2.50% from previous year)
- 2024: $881,010 (-$107,767, -10.90% from previous year)
- 2025: $832,515 (-$48,495, -5.50% from previous year)
Bethany Beach home prices rose from $571,616 in 2012 to $832,515 in 2025, a 45.6% increase. Sharp rises in 2021 and 2022 were followed by multi-year corrections, yet prices remain high overall.
Bethany Beach – Quiet Resort Community with High Values
Bethany Beach offers a quieter alternative to nearby Rehoboth, with family-friendly beaches and a charming boardwalk. Its market attracts retirees and vacation-home buyers who prefer its calmer atmosphere.
Current average prices surpass $830,000, reflecting strong long-term demand despite recent market cooling. Its location near Fenwick Island and Ocean City, MD adds to its coastal draw.
Founded in 1901, Bethany Beach combines small-town hospitality with steady property appreciation, sustaining its status as one of Delaware’s premier coastal towns.
3. Fenwick Island – 116% Home Price Increase Since 2012
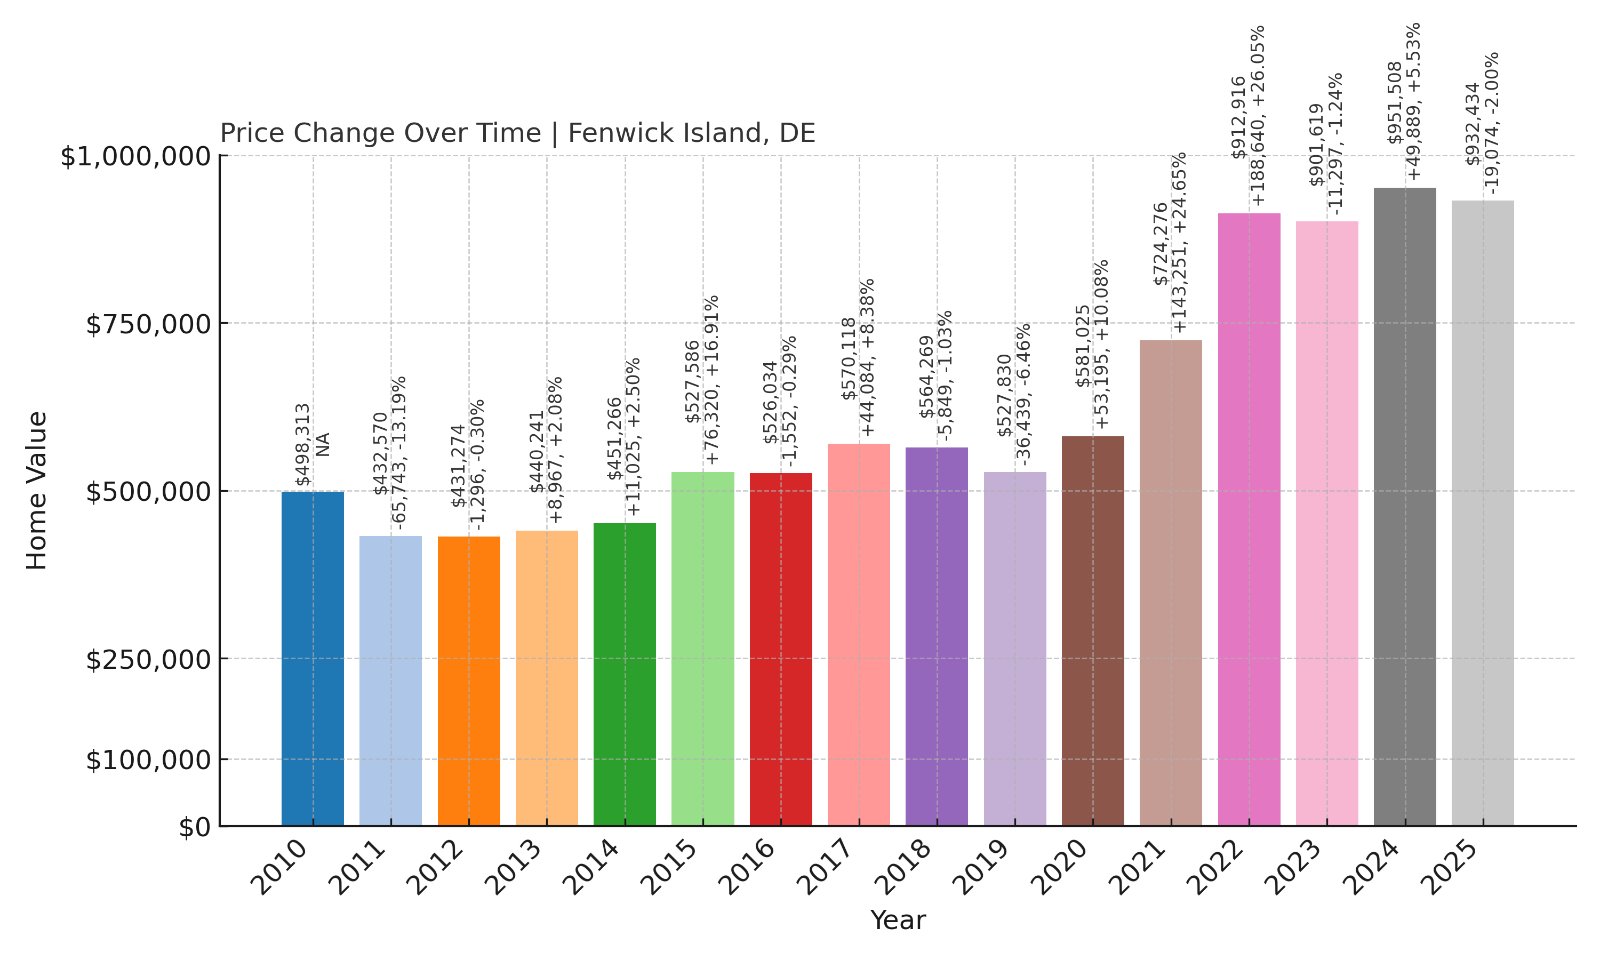
- 2010: $498,313
- 2011: $432,570 (-$65,743, -13.19% from previous year)
- 2012: $431,274 (-$1,297, -0.30% from previous year)
- 2013: $440,241 (+$8,967, +2.08% from previous year)
- 2014: $451,266 (+$11,026, +2.50% from previous year)
- 2015: $527,586 (+$76,320, +16.91% from previous year)
- 2016: $526,034 (-$1,552, -0.29% from previous year)
- 2017: $570,118 (+$44,085, +8.38% from previous year)
- 2018: $564,269 (-$5,850, -1.03% from previous year)
- 2019: $527,830 (-$36,439, -6.46% from previous year)
- 2020: $581,025 (+$53,195, +10.08% from previous year)
- 2021: $724,276 (+$143,251, +24.65% from previous year)
- 2022: $912,916 (+$188,640, +26.05% from previous year)
- 2023: $901,619 (-$11,297, -1.24% from previous year)
- 2024: $951,508 (+$49,889, +5.53% from previous year)
- 2025: $932,434 (-$19,074, -2.00% from previous year)
Fenwick Island’s home prices rose from $431,274 in 2012 to $932,434 in 2025, a 116% increase. Large jumps in 2015, 2021, and 2022 fuelled its premium market positioning.
Fenwick Island – Exclusive Beachfront Living
Fenwick Island is located at Delaware’s southern border, adjoining Ocean City, Maryland. Known for its upscale beachfront homes and quiet environment, it appeals to luxury buyers seeking exclusivity.
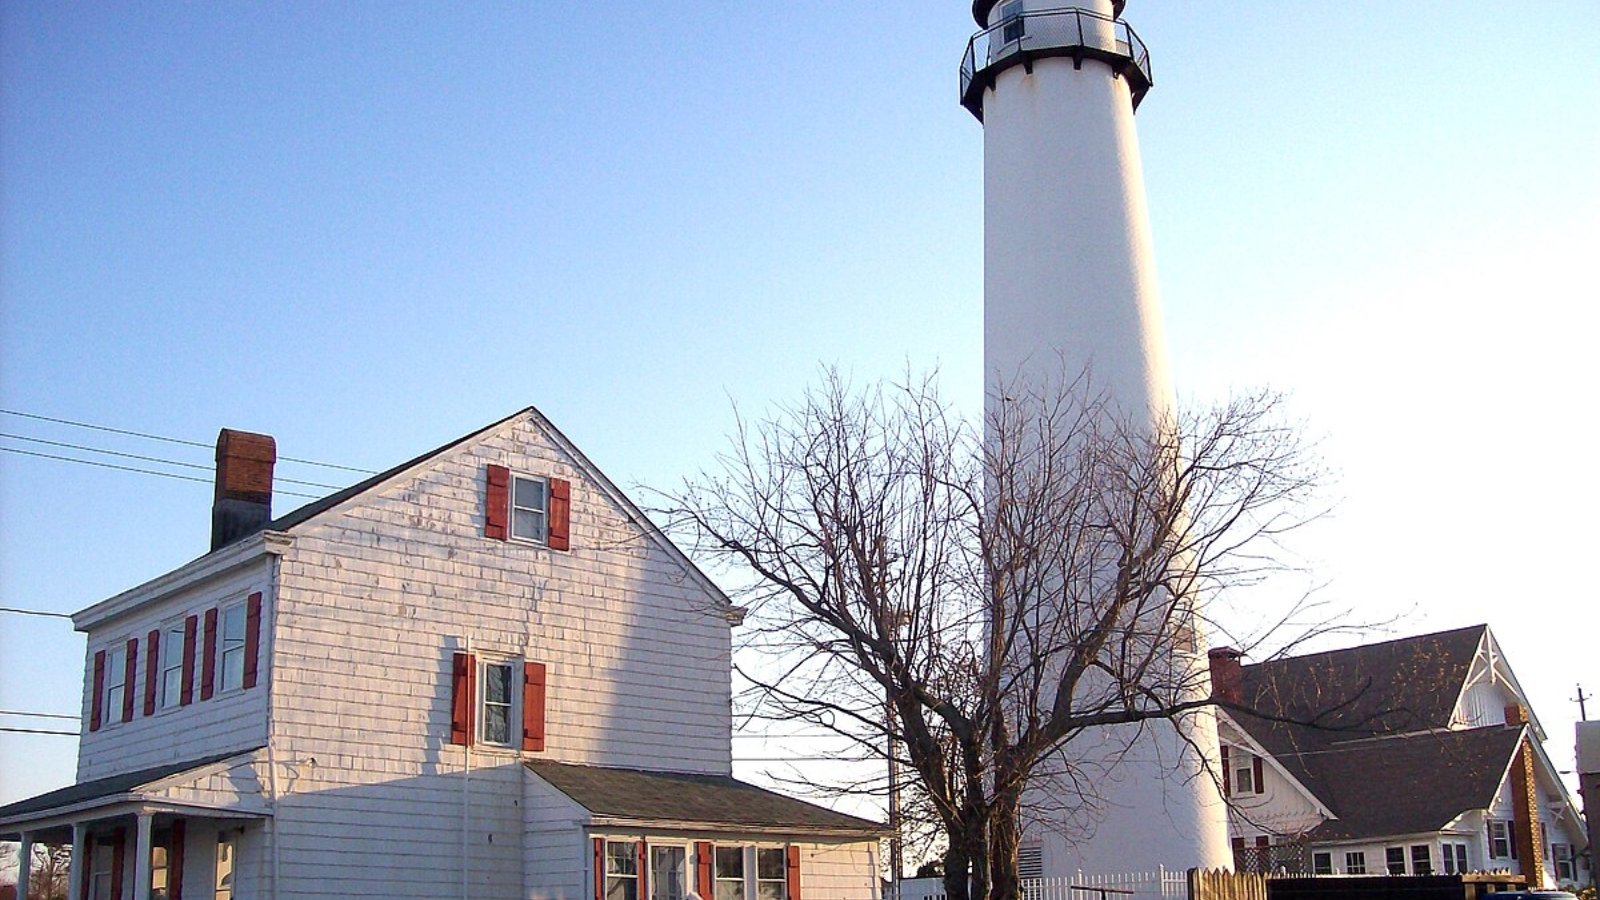
With current average prices near $930,000, Fenwick Island’s market reflects limited inventory and prime coastal placement. Its state park, lighthouse, and low-density zoning add to its allure.
Founded as a fishing village, Fenwick Island retains a tranquil atmosphere that contrasts with nearby Ocean City’s bustle, sustaining its strong home values over time.
2. Dewey Beach – 80.0% Home Price Increase Since 2012
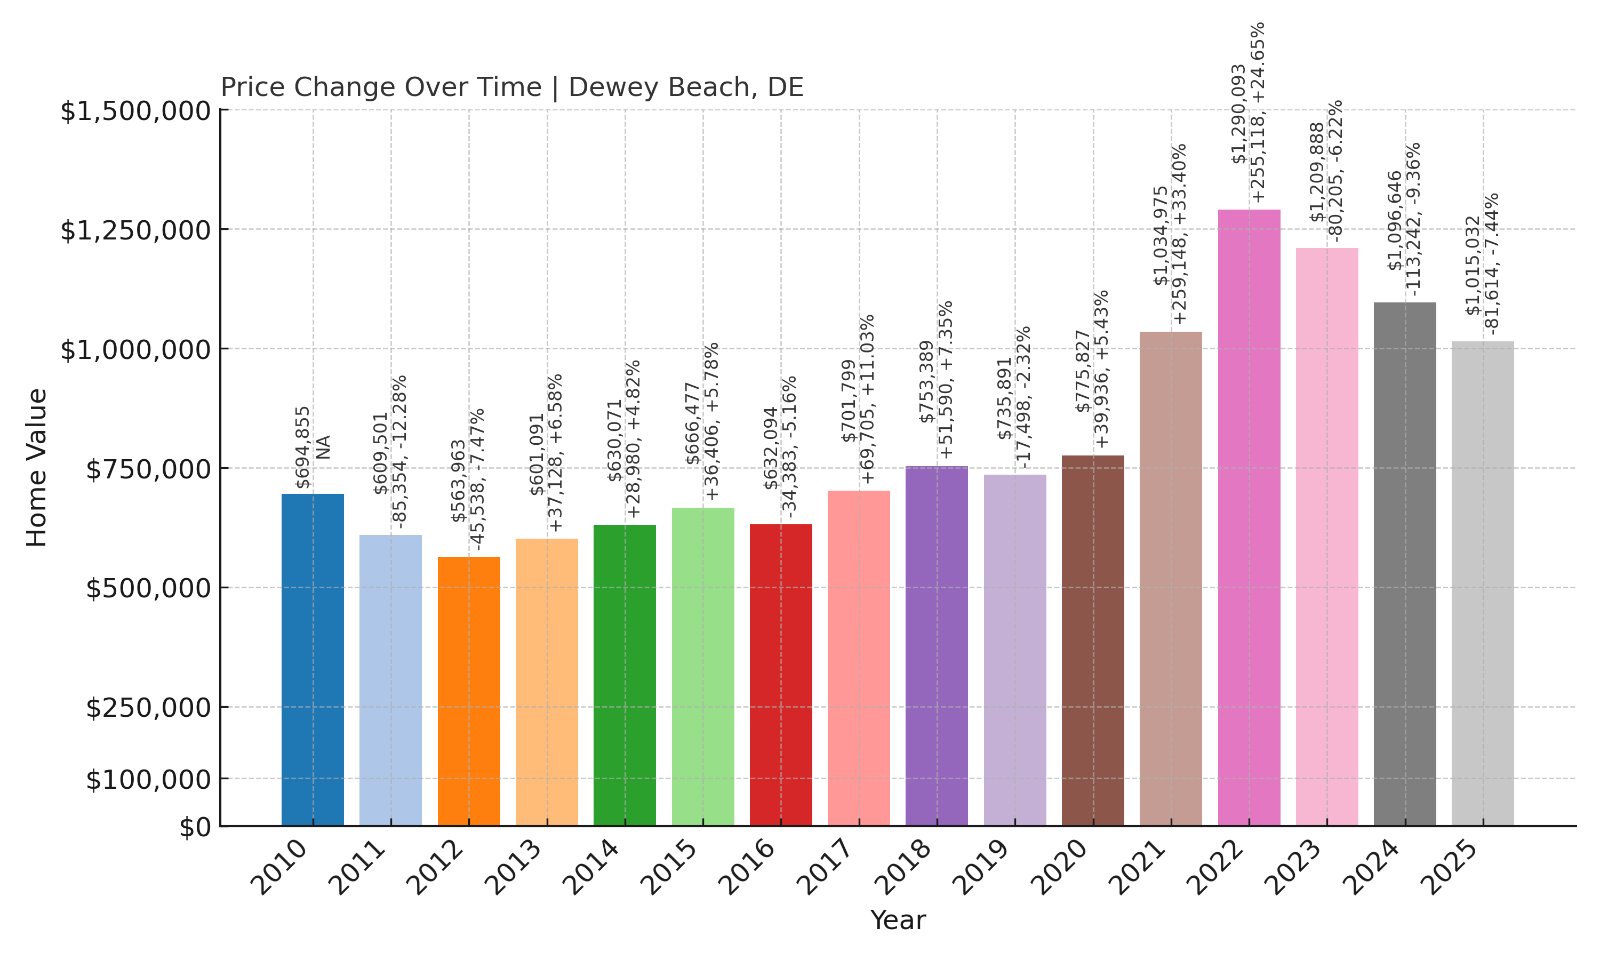
- 2010: $694,855
- 2011: $609,501 (-$85,353, -12.28% from previous year)
- 2012: $563,963 (-$45,538, -7.47% from previous year)
- 2013: $601,091 (+$37,127, +6.58% from previous year)
- 2014: $630,071 (+$28,981, +4.82% from previous year)
- 2015: $666,477 (+$36,405, +5.78% from previous year)
- 2016: $632,094 (-$34,383, -5.16% from previous year)
- 2017: $701,799 (+$69,705, +11.03% from previous year)
- 2018: $753,389 (+$51,590, +7.35% from previous year)
- 2019: $735,891 (-$17,498, -2.32% from previous year)
- 2020: $775,827 (+$39,936, +5.43% from previous year)
- 2021: $1,034,975 (+$259,148, +33.40% from previous year)
- 2022: $1,290,093 (+$255,118, +24.65% from previous year)
- 2023: $1,209,888 (-$80,204, -6.22% from previous year)
- 2024: $1,096,646 (-$113,242, -9.36% from previous year)
- 2025: $1,015,032 (-$81,615, -7.44% from previous year)
Dewey Beach’s home prices rose from $563,963 in 2012 to $1,015,032 in 2025, an 80.0% increase. Prices peaked in 2022 at over $1.29 million before declining each of the last three years, reflecting market corrections after rapid appreciation.
Dewey Beach – Lively Resort with High Home Values
Dewey Beach is known for its vibrant nightlife, live music venues, and busy summer crowds. Situated between Rehoboth Bay and the Atlantic Ocean, it appeals to younger vacationers and investors looking for rental income potential alongside beachfront enjoyment.
With current average prices exceeding $1 million, Dewey Beach maintains high property values despite recent declines, driven by its limited housing stock and prime location near Rehoboth Beach. Its popularity with seasonal visitors ensures enduring demand.
Originally developed in the mid-20th century as a summer community, Dewey Beach continues to attract buyers seeking entertainment, surfside relaxation, and quick access to surrounding Delaware coastal towns.
1. South Bethany – 78.9% Home Price Increase Since 2012
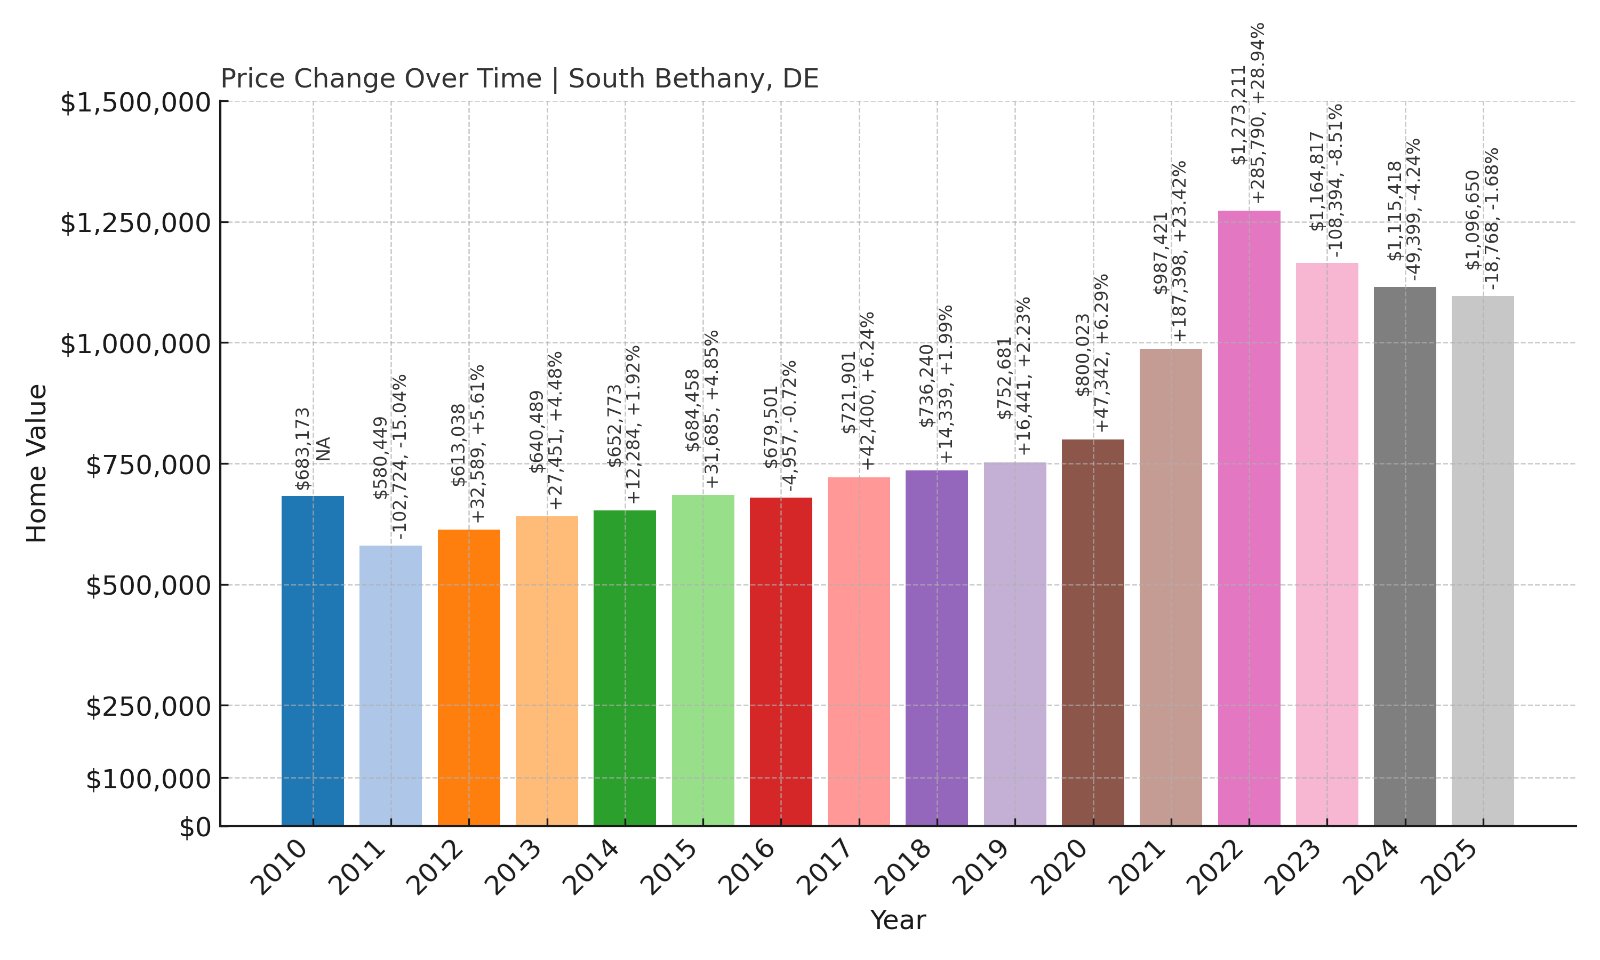
- 2010: $683,173
- 2011: $580,449 (-$102,723, -15.04% from previous year)
- 2012: $613,038 (+$32,588, +5.61% from previous year)
- 2013: $640,489 (+$27,451, +4.48% from previous year)
- 2014: $652,773 (+$12,284, +1.92% from previous year)
- 2015: $684,458 (+$31,684, +4.85% from previous year)
- 2016: $679,501 (-$4,956, -0.72% from previous year)
- 2017: $721,901 (+$42,399, +6.24% from previous year)
- 2018: $736,240 (+$14,340, +1.99% from previous year)
- 2019: $752,681 (+$16,441, +2.23% from previous year)
- 2020: $800,023 (+$47,342, +6.29% from previous year)
- 2021: $987,421 (+$187,398, +23.42% from previous year)
- 2022: $1,273,211 (+$285,789, +28.94% from previous year)
- 2023: $1,164,817 (-$108,394, -8.51% from previous year)
- 2024: $1,115,418 (-$49,399, -4.24% from previous year)
- 2025: $1,096,650 (-$18,768, -1.68% from previous year)
South Bethany’s home prices rose from $613,038 in 2012 to $1,096,650 in 2025, a 78.9% increase. After peaking in 2022 at over $1.27 million, prices have declined slightly each year, reflecting market rebalancing while remaining among Delaware’s highest.
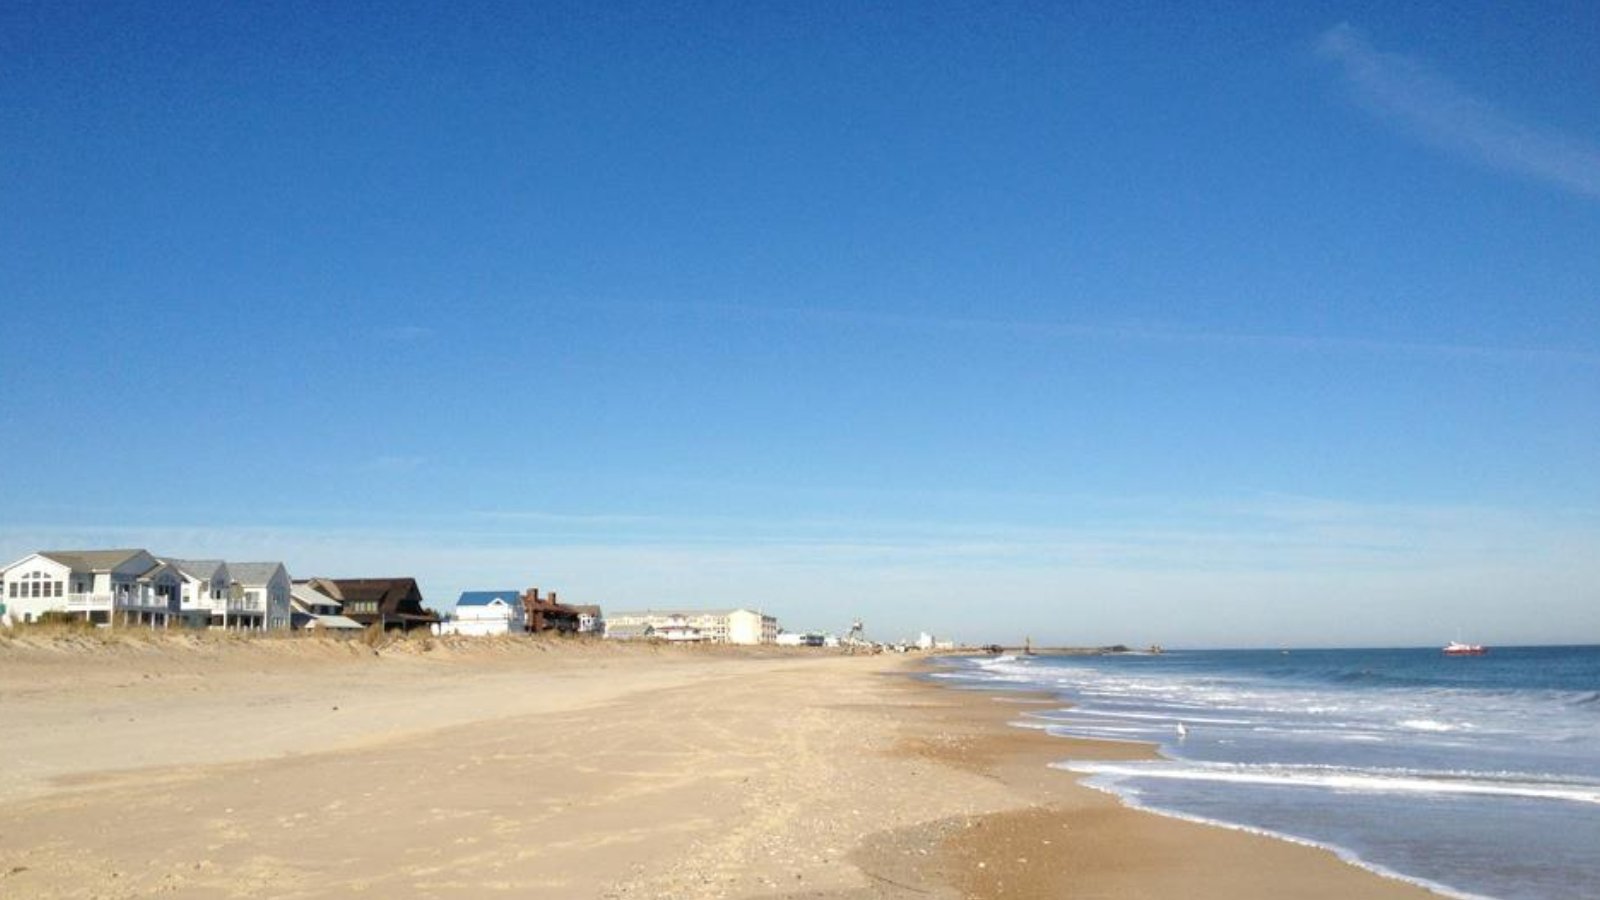
South Bethany – Quiet Beach Town with Premium Prices
🔥 Would you like to save this?
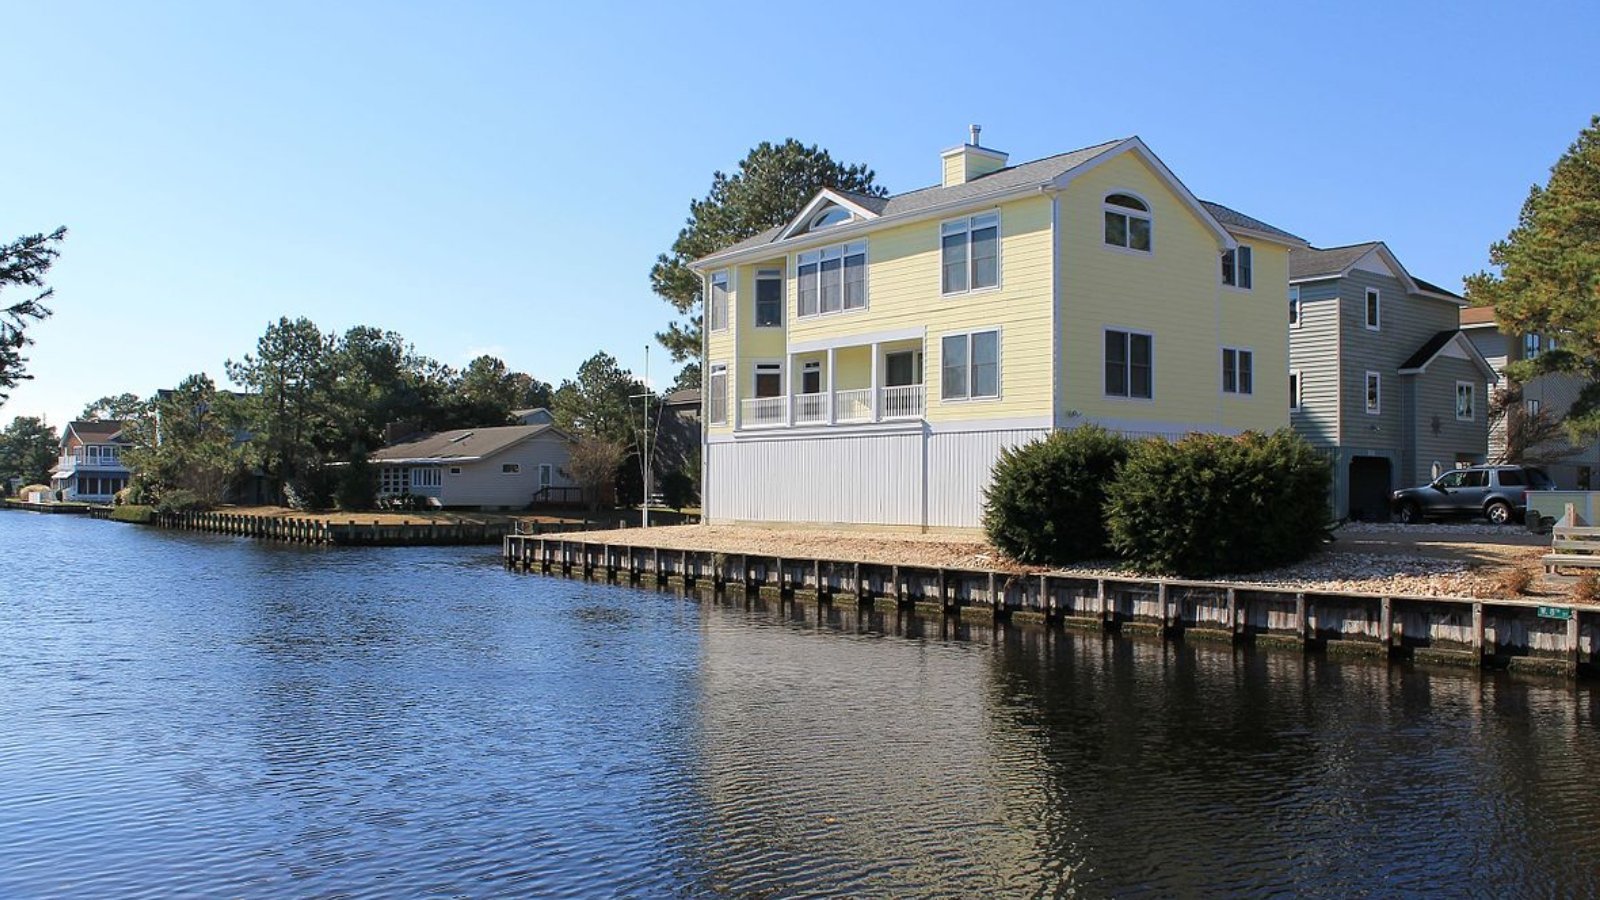
South Bethany is a peaceful residential beach community located just south of Bethany Beach. Known for its canals, quiet streets, and private beachfront areas, it attracts buyers seeking tranquility and ocean access without commercial crowds.
With average home prices exceeding $1 million, South Bethany remains one of Delaware’s most expensive housing markets. Its limited buildable land and exclusive waterfront properties sustain high valuations despite recent price drops.
Incorporated in 1969, South Bethany’s appeal lies in its family-friendly atmosphere, canal-front homes for boating, and close proximity to Fenwick Island and Ocean City, MD, maintaining its place among Delaware’s premier coastal destinations.


