🔥 Would you like to save this?
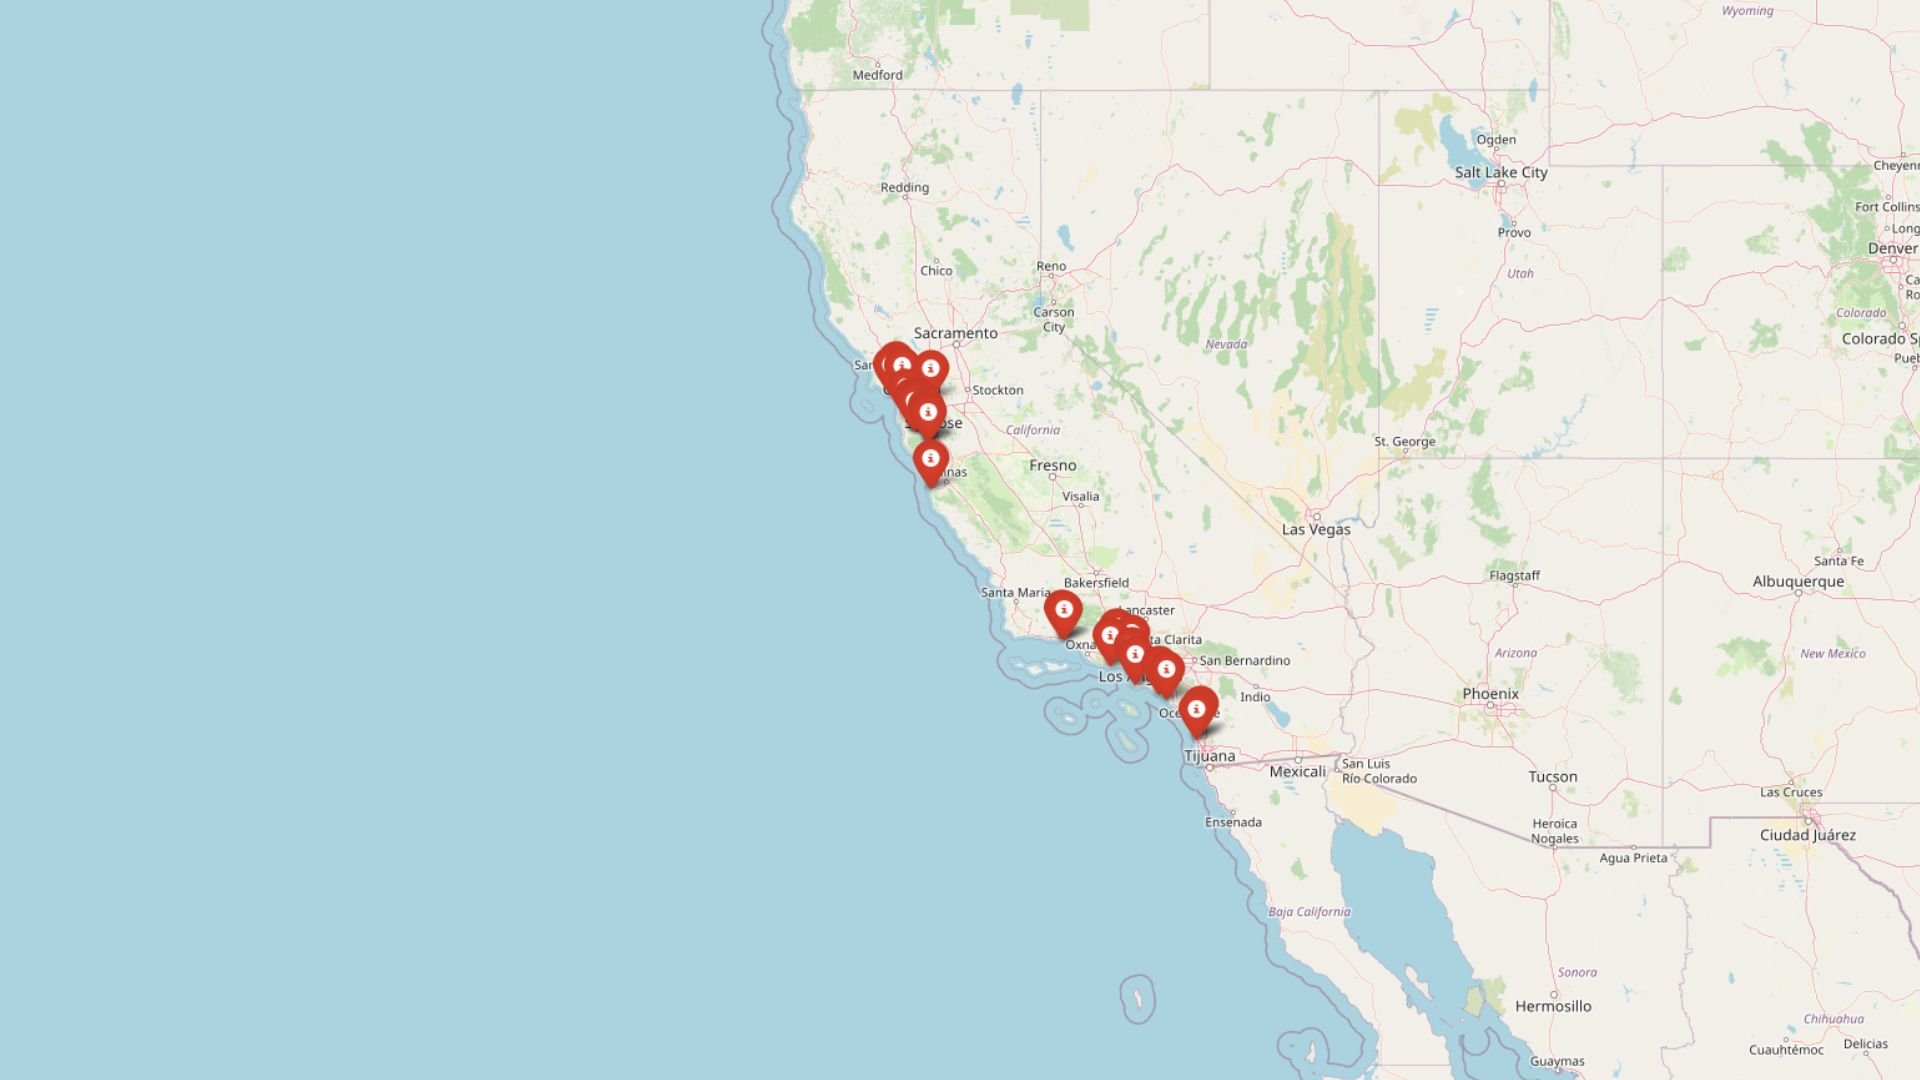
California’s most expensive towns aren’t just famous names anymore. According to the Zillow Home Value Index, 2025 has seen record-breaking property prices in 30 towns across the state. While luxury hubs like Beverly Hills and Palo Alto still top the charts, lesser-known communities are joining the list as tech wealth, remote work, and coastal demand push prices higher. Incomes haven’t kept pace, and even high earners are struggling to compete. From coastal enclaves to mountain retreats, these towns show just how far California’s housing market has climbed.
30. Menlo Park – 193% Home Price Increase Since 2010
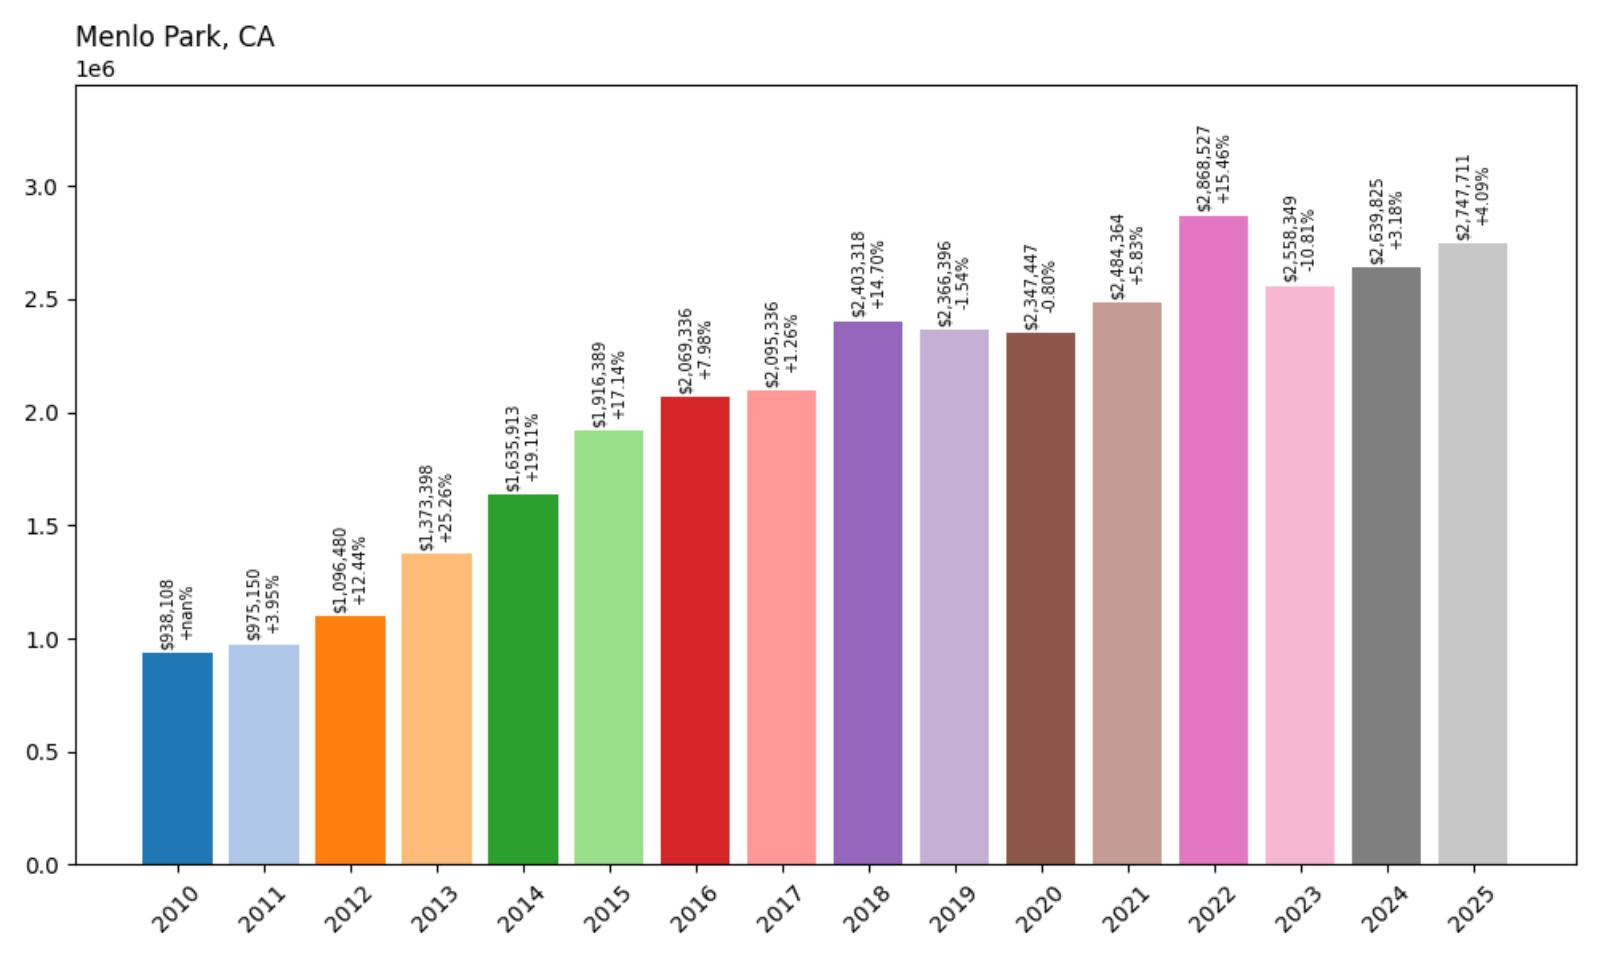
- 2010: $938,108
- 2011: $975,150 (+$37,041, +3.95% from previous year)
- 2012: $1,096,480 (+$121,330, +12.44% from previous year)
- 2013: $1,373,398 (+$276,919, +25.26% from previous year)
- 2014: $1,635,913 (+$262,514, +19.11% from previous year)
- 2015: $1,916,389 (+$280,476, +17.14% from previous year)
- 2016: $2,069,336 (+$152,947, +7.98% from previous year)
- 2017: $2,095,336 (+$26,000, +1.26% from previous year)
- 2018: $2,403,318 (+$307,982, +14.70% from previous year)
- 2019: $2,366,396 (−$36,922, −1.54% from previous year)
- 2020: $2,347,447 (−$18,949, −0.80% from previous year)
- 2021: $2,484,364 (+$136,917, +5.83% from previous year)
- 2022: $2,868,527 (+$384,164, +15.46% from previous year)
- 2023: $2,558,349 (−$310,179, −10.81% from previous year)
- 2024: $2,639,825 (+$81,476, +3.18% from previous year)
- 2025: $2,747,711 (+$107,887, +4.09% from previous year)
Menlo Park’s housing market demonstrates the remarkable wealth concentration in Silicon Valley, with median home prices nearly tripling since 2010. The data shows particularly explosive growth between 2012 and 2016, when prices jumped from just over $1 million to more than $2 million. After a brief plateau in 2019-2020, the market resumed its upward trajectory, reaching $2.75 million by 2025.
In order to come up with the very specific design ideas, we create most designs with the assistance of state-of-the-art AI interior design software. Also, assume links that take you off the site are affiliate links such as links to Amazon. this means we may earn a commission if you buy something.
Menlo Park – Tech Capital Price Pressures
Located in the heart of Silicon Valley, Menlo Park sits at the epicenter of the global technology industry, home to Facebook’s headquarters and countless venture capital firms along Sand Hill Road. The city’s proximity to Stanford University and major tech companies has created intense competition for housing, driving prices to levels that reflect the area’s concentration of high-earning professionals. The 2013-2014 period saw particularly dramatic increases, coinciding with the tech industry’s post-recession boom and the rise of major social media platforms.
The city’s desirable location between San Francisco and San Jose, combined with excellent schools and family-friendly neighborhoods, has made it a magnet for tech executives and venture capitalists. Menlo Park’s tree-lined streets and suburban feel provide a stark contrast to the urban density of San Francisco, attracting families willing to pay premium prices for space and top-rated schools. The slight price corrections in 2019 and 2023 reflect broader market adjustments, but the overall trajectory shows no signs of making housing accessible to middle-income families.
The current median price of $2.75 million represents not just the cost of housing, but the premium buyers pay for access to one of the world’s most innovative economic regions. Local zoning restrictions and limited developable land continue to constrain supply, while demand remains robust from tech industry growth and international investment in Silicon Valley real estate.
29. Emerald Lake Hills – 124% Home Price Increase Since 2010
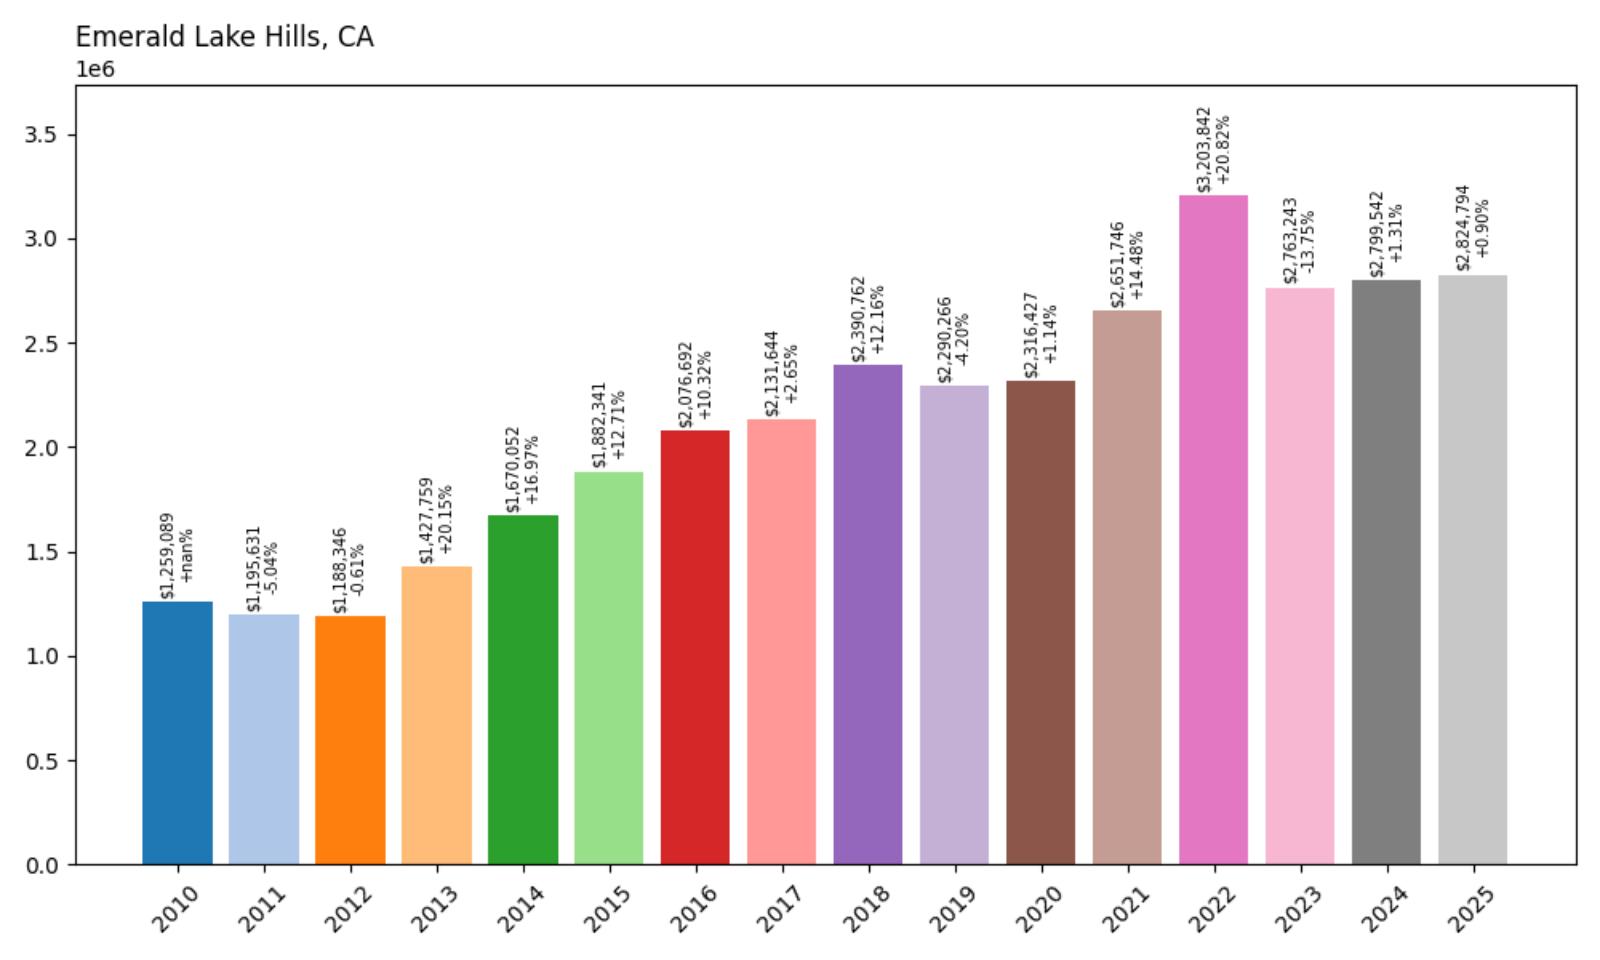
- 2010: $1,259,089
- 2011: $1,195,631 (−$63,458, −5.04% from previous year)
- 2012: $1,188,346 (−$7,285, −0.61% from previous year)
- 2013: $1,427,759 (+$239,413, +20.15% from previous year)
- 2014: $1,670,052 (+$242,292, +16.97% from previous year)
- 2015: $1,882,341 (+$212,289, +12.71% from previous year)
- 2016: $2,076,692 (+$194,351, +10.32% from previous year)
- 2017: $2,131,644 (+$54,952, +2.65% from previous year)
- 2018: $2,390,762 (+$259,117, +12.16% from previous year)
- 2019: $2,290,266 (−$100,496, −4.20% from previous year)
- 2020: $2,316,427 (+$26,161, +1.14% from previous year)
- 2021: $2,651,746 (+$335,320, +14.48% from previous year)
- 2022: $3,203,842 (+$552,096, +20.82% from previous year)
- 2023: $2,763,243 (−$440,599, −13.75% from previous year)
- 2024: $2,799,542 (+$36,299, +1.31% from previous year)
- 2025: $2,824,794 (+$25,252, +0.90% from previous year)
Emerald Lake Hills has experienced steady appreciation punctuated by significant market volatility, with the most dramatic swing occurring in 2022-2023 when prices jumped to over $3.2 million before correcting back to $2.8 million. The community’s 124% price increase since 2010 reflects its position as a premium Peninsula location, though the recent market correction suggests some cooling in the ultra-luxury segment.
Emerald Lake Hills – Secluded Peninsula Retreat
Nestled in the hills of San Mateo County, Emerald Lake Hills offers residents a secluded, almost rural atmosphere while maintaining close proximity to Silicon Valley employment centers. This unincorporated community surrounds a private lake and features winding roads, mature trees, and custom homes that take advantage of the area’s natural topography. The 2022 price peak of $3.2 million reflected the pandemic-era flight to larger homes and private outdoor spaces, as tech workers sought alternatives to urban condos.
The community’s appeal lies in its combination of privacy and convenience, offering residents a retreat-like setting within commuting distance of major tech companies. Many properties feature extensive grounds and water access, luxuries that became particularly valuable during remote work periods. The subsequent price correction in 2023 mirrors broader trends in high-end real estate as interest rates rose and buyer demand cooled.
Despite the recent price adjustment, Emerald Lake Hills maintains its position as one of the Peninsula’s most exclusive residential areas. The limited housing stock and restrictive development policies ensure that supply remains constrained, while the area’s natural beauty and proximity to both San Francisco and Silicon Valley continue to attract affluent buyers seeking a premium lifestyle.
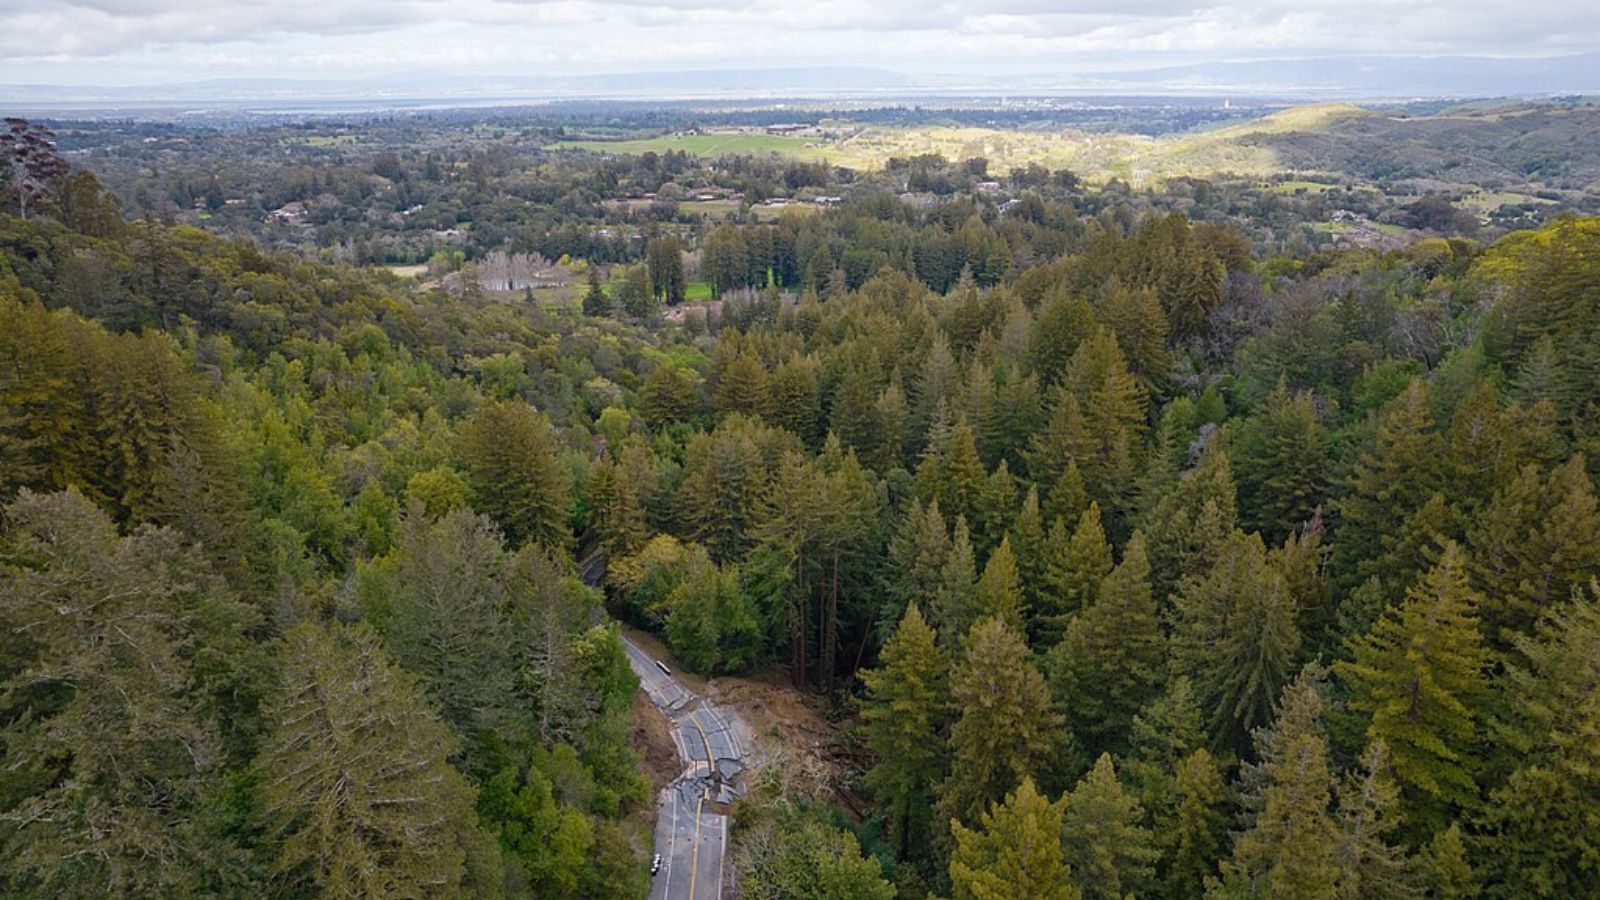
28. Del Monte Forest – 111% Home Price Increase Since 2010
- 2010: $1,340,193
- 2011: $1,275,588 (−$64,606, −4.82% from previous year)
- 2012: $1,205,686 (−$69,902, −5.48% from previous year)
- 2013: $1,256,396 (+$50,711, +4.21% from previous year)
- 2014: $1,366,518 (+$110,122, +8.76% from previous year)
- 2015: $1,452,763 (+$86,245, +6.31% from previous year)
- 2016: $1,606,906 (+$154,143, +10.61% from previous year)
- 2017: $1,657,153 (+$50,247, +3.13% from previous year)
- 2018: $1,721,476 (+$64,323, +3.88% from previous year)
- 2019: $1,819,482 (+$98,005, +5.69% from previous year)
- 2020: $1,829,939 (+$10,457, +0.57% from previous year)
- 2021: $2,271,978 (+$442,039, +24.16% from previous year)
- 2022: $2,822,880 (+$550,902, +24.25% from previous year)
- 2023: $2,686,841 (−$136,038, −4.82% from previous year)
- 2024: $2,866,056 (+$179,215, +6.67% from previous year)
- 2025: $2,826,787 (−$39,269, −1.37% from previous year)
Del Monte Forest showcases the appeal of coastal luxury living, with home prices more than doubling since 2010 to reach $2.83 million in 2025. The community experienced its most dramatic growth during 2021-2022, when prices surged nearly 50% over two years, reflecting increased demand for resort-style living during the pandemic. The recent slight decline suggests some market stabilization in this luxury coastal enclave.
Del Monte Forest – Pebble Beach Paradise
Home to the legendary Pebble Beach Golf Links and the annual AT&T Pro-Am, Del Monte Forest represents the pinnacle of California coastal living. This gated community on the Monterey Peninsula combines world-class golf courses with stunning ocean views and the famous 17-Mile Drive. The area’s exclusive nature and limited development have created a unique real estate market where properties command premiums for both their natural beauty and recreational amenities.
The dramatic price increases of 2021-2022 coincided with wealthy buyers seeking second homes and retreat properties during the pandemic, particularly drawn to the area’s outdoor recreational opportunities and relative isolation. Many properties offer direct golf course access or ocean views, amenities that became especially valuable as remote work enabled more flexible living arrangements. The community’s association with professional golf and celebrity residents adds to its prestige and market appeal.
Despite recent price adjustments, Del Monte Forest maintains its status as one of California’s most exclusive residential communities. The combination of natural beauty, recreational amenities, and strict development controls ensures continued demand from affluent buyers seeking a luxury coastal lifestyle. The area’s reputation as a world-class golf destination and its stunning natural setting continue to justify premium pricing in the luxury real estate market.
27. Tiburon – 110% Home Price Increase Since 2010
- 2010: $1,387,754
- 2011: $1,314,320 (−$73,434, −5.29% from previous year)
- 2012: $1,421,499 (+$107,179, +8.15% from previous year)
- 2013: $1,629,703 (+$208,204, +14.65% from previous year)
- 2014: $1,832,029 (+$202,327, +12.41% from previous year)
- 2015: $2,052,873 (+$220,843, +12.05% from previous year)
- 2016: $2,185,428 (+$132,556, +6.46% from previous year)
- 2017: $2,179,667 (−$5,762, −0.26% from previous year)
- 2018: $2,369,343 (+$189,677, +8.70% from previous year)
- 2019: $2,340,673 (−$28,670, −1.21% from previous year)
- 2020: $2,346,358 (+$5,685, +0.24% from previous year)
- 2021: $2,783,690 (+$437,331, +18.64% from previous year)
- 2022: $3,259,180 (+$475,490, +17.08% from previous year)
- 2023: $2,948,289 (−$310,891, −9.54% from previous year)
- 2024: $3,024,707 (+$76,419, +2.59% from previous year)
- 2025: $2,910,091 (−$114,617, −3.79% from previous year)
Tiburon’s waterfront location in Marin County has driven home prices from $1.39 million in 2010 to $2.91 million in 2025, representing a 110% increase over 15 years. The community experienced its strongest growth during the 2021-2022 period, when prices jumped over 35% in two years, before moderating in recent years. The recent decline reflects broader cooling in the luxury market, though prices remain well above historical levels.
Tiburon – Marin County Waterfront Luxury
Perched on a peninsula in Marin County with sweeping views of San Francisco Bay and the city skyline, Tiburon represents one of the Bay Area’s most coveted waterfront communities. The town’s Mediterranean-style architecture and yacht-filled harbor create an atmosphere of coastal sophistication, attracting affluent professionals who work in San Francisco but prefer suburban tranquility. Many homes feature private docks and panoramic water views, amenities that have become increasingly valuable as Bay Area wealth has concentrated.
The ferry service connecting Tiburon directly to San Francisco’s Financial District has made it particularly attractive to finance and tech executives seeking an alternative to urban living. The pandemic-era surge in prices reflected increased demand for homes with outdoor space and water access, as remote work made longer commutes less relevant. The town’s excellent schools and family-friendly environment have also attracted tech industry families willing to pay premium prices for waterfront living.
Recent price fluctuations reflect the broader luxury market’s sensitivity to interest rate changes and economic uncertainty, but Tiburon’s fundamental appeal remains strong. The combination of natural beauty, convenient ferry access to San Francisco, and limited developable waterfront land continues to support premium pricing. The town’s status as a premier Bay Area destination ensures continued demand from affluent buyers seeking the ultimate in waterfront lifestyle.
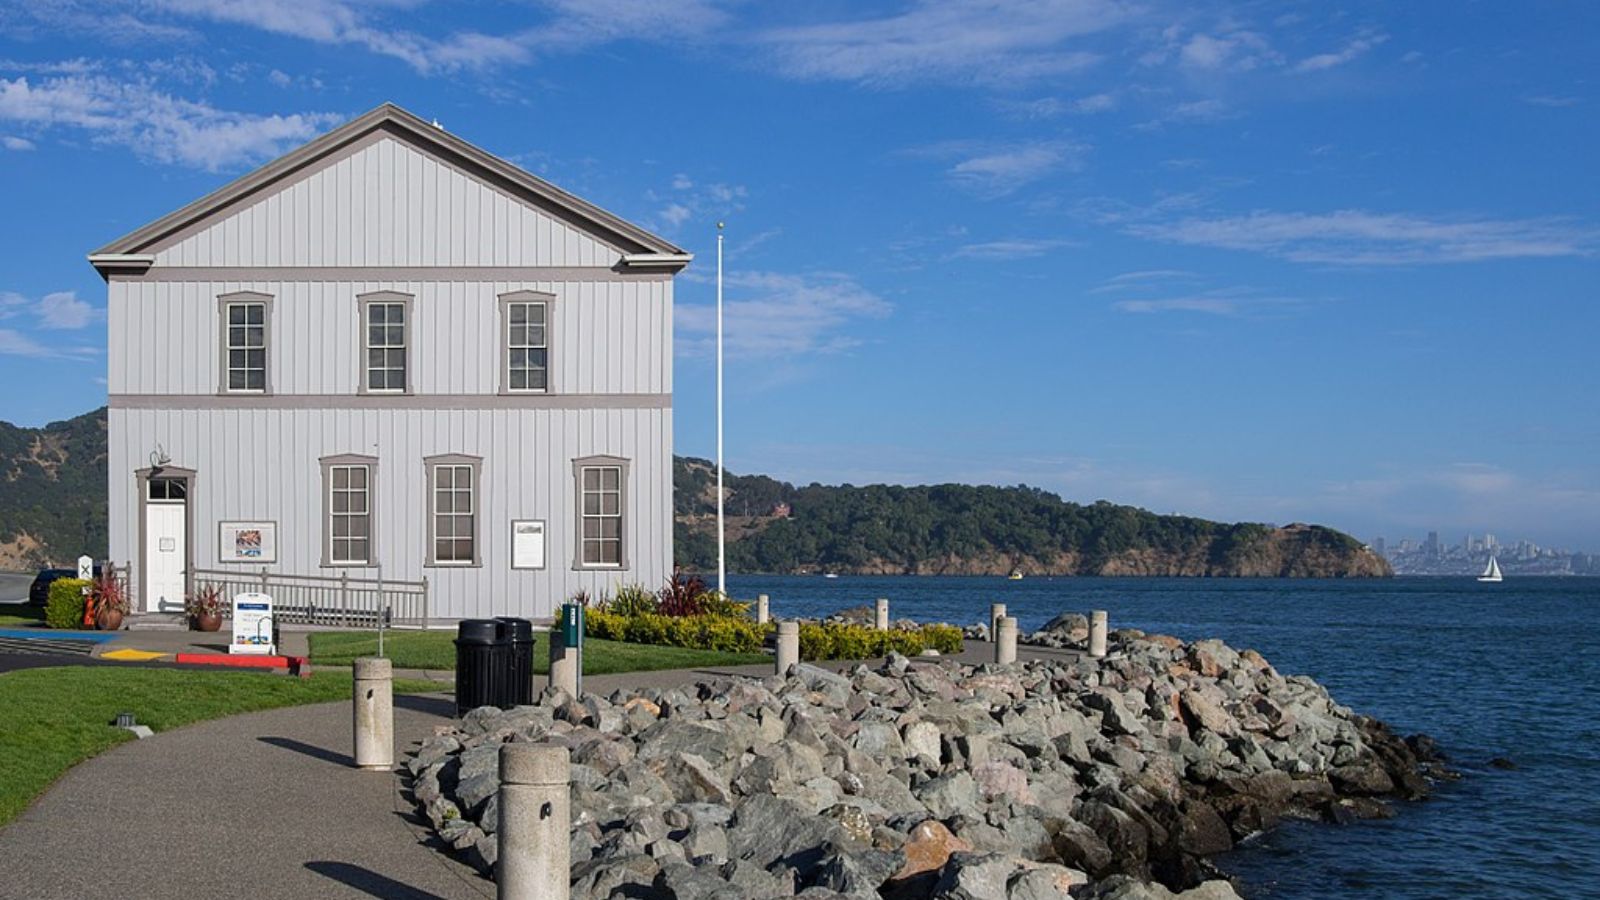
26. Stinson Beach – 199% Home Price Increase Since 2010
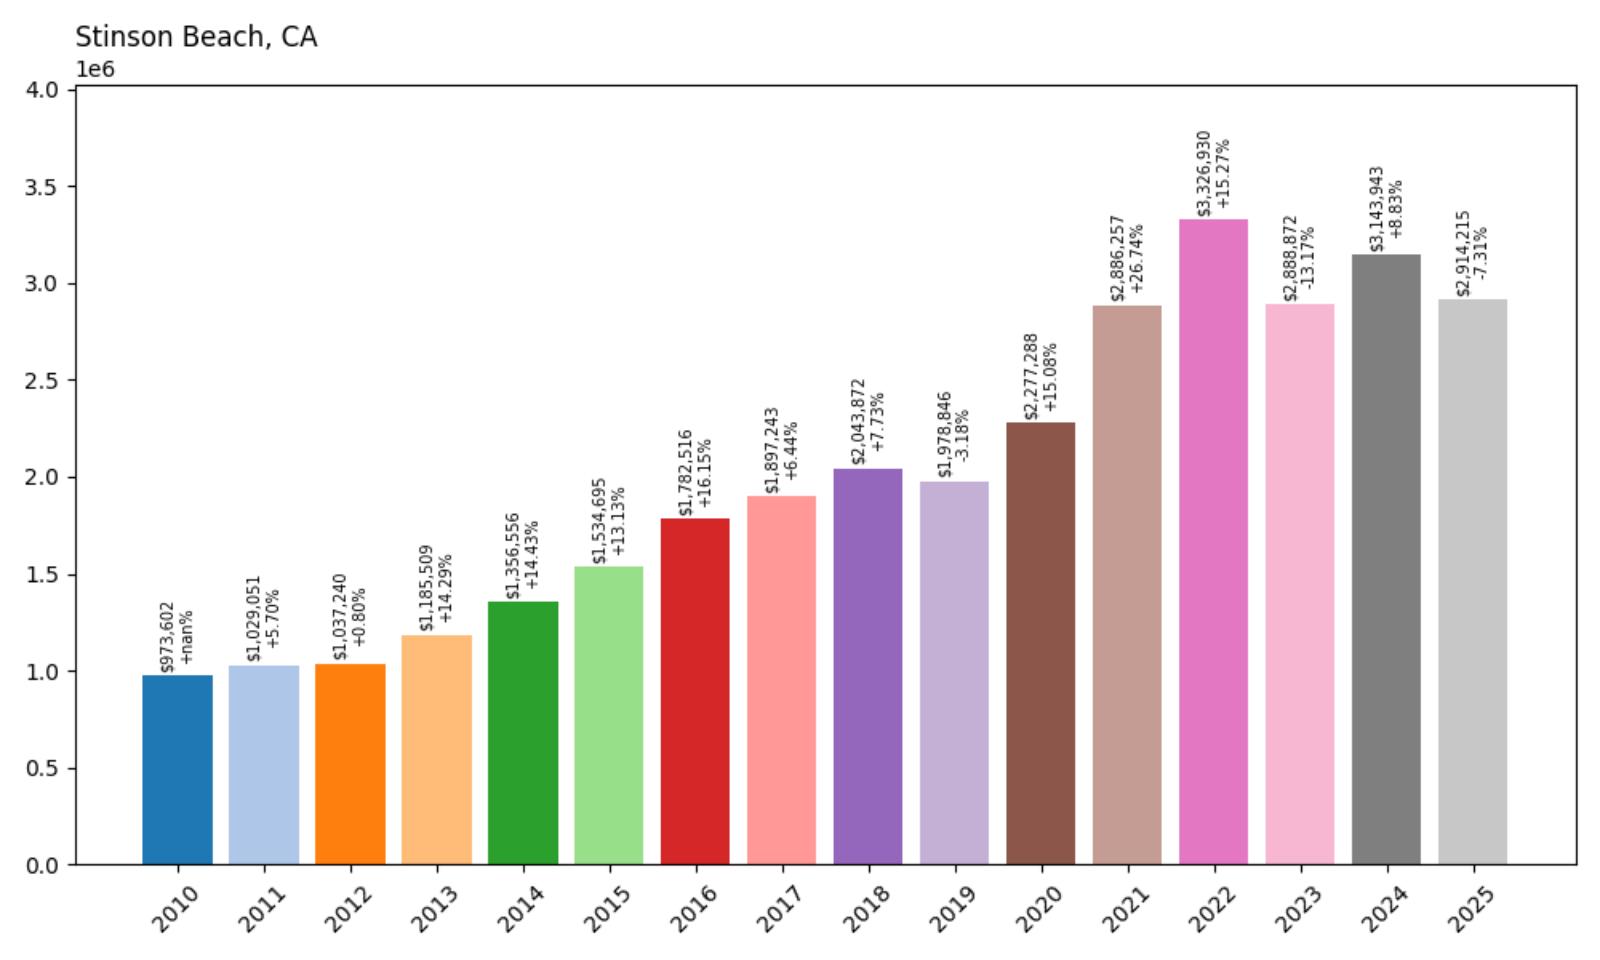
- 2010: $973,602
- 2011: $1,029,051 (+$55,449, +5.70% from previous year)
- 2012: $1,037,240 (+$8,190, +0.80% from previous year)
- 2013: $1,185,509 (+$148,269, +14.29% from previous year)
- 2014: $1,356,556 (+$171,047, +14.43% from previous year)
- 2015: $1,534,695 (+$178,139, +13.13% from previous year)
- 2016: $1,782,516 (+$247,821, +16.15% from previous year)
- 2017: $1,897,243 (+$114,727, +6.44% from previous year)
- 2018: $2,043,872 (+$146,629, +7.73% from previous year)
- 2019: $1,978,846 (−$65,026, −3.18% from previous year)
- 2020: $2,277,288 (+$298,442, +15.08% from previous year)
- 2021: $2,886,257 (+$608,969, +26.74% from previous year)
- 2022: $3,326,930 (+$440,673, +15.27% from previous year)
- 2023: $2,888,872 (−$438,058, −13.17% from previous year)
- 2024: $3,143,943 (+$255,071, +8.83% from previous year)
- 2025: $2,914,215 (−$229,727, −7.31% from previous year)
Stinson Beach has experienced the most dramatic price appreciation among these communities, with home values nearly tripling from under $1 million in 2010 to $2.91 million in 2025. The coastal community saw particularly explosive growth during 2020-2022, when prices surged over 60% in three years, reflecting the premium buyers placed on beachfront living during the pandemic. Recent volatility suggests some market adjustment, but prices remain at historically elevated levels.
Stinson Beach – Bohemian Coastal Retreat
Just an hour north of San Francisco, Stinson Beach offers a unique blend of laid-back coastal culture and proximity to urban amenities. This small beach town has long attracted artists, writers, and Bay Area professionals seeking a more relaxed lifestyle, but rising home prices have increasingly priced out the creative community that gave the area its character. The three-mile stretch of sandy beach and surrounding hills provide a dramatic natural setting that has become increasingly valuable as Bay Area development has intensified.
The pandemic-era price surge reflected a broader trend toward coastal and rural properties as remote work enabled more flexible living arrangements. Many San Francisco tech workers discovered they could maintain their careers while enjoying beachfront living, driving unprecedented demand for the limited housing stock. The town’s bohemian atmosphere and natural beauty became particularly appealing to those seeking alternatives to urban density during lockdowns.
Despite recent price corrections, Stinson Beach remains one of the most expensive small beach towns in California. The combination of limited developable land, environmental restrictions, and proximity to San Francisco ensures continued premium pricing. However, the dramatic price increases have fundamentally altered the community’s character, raising questions about affordability and the preservation of the area’s unique cultural identity.
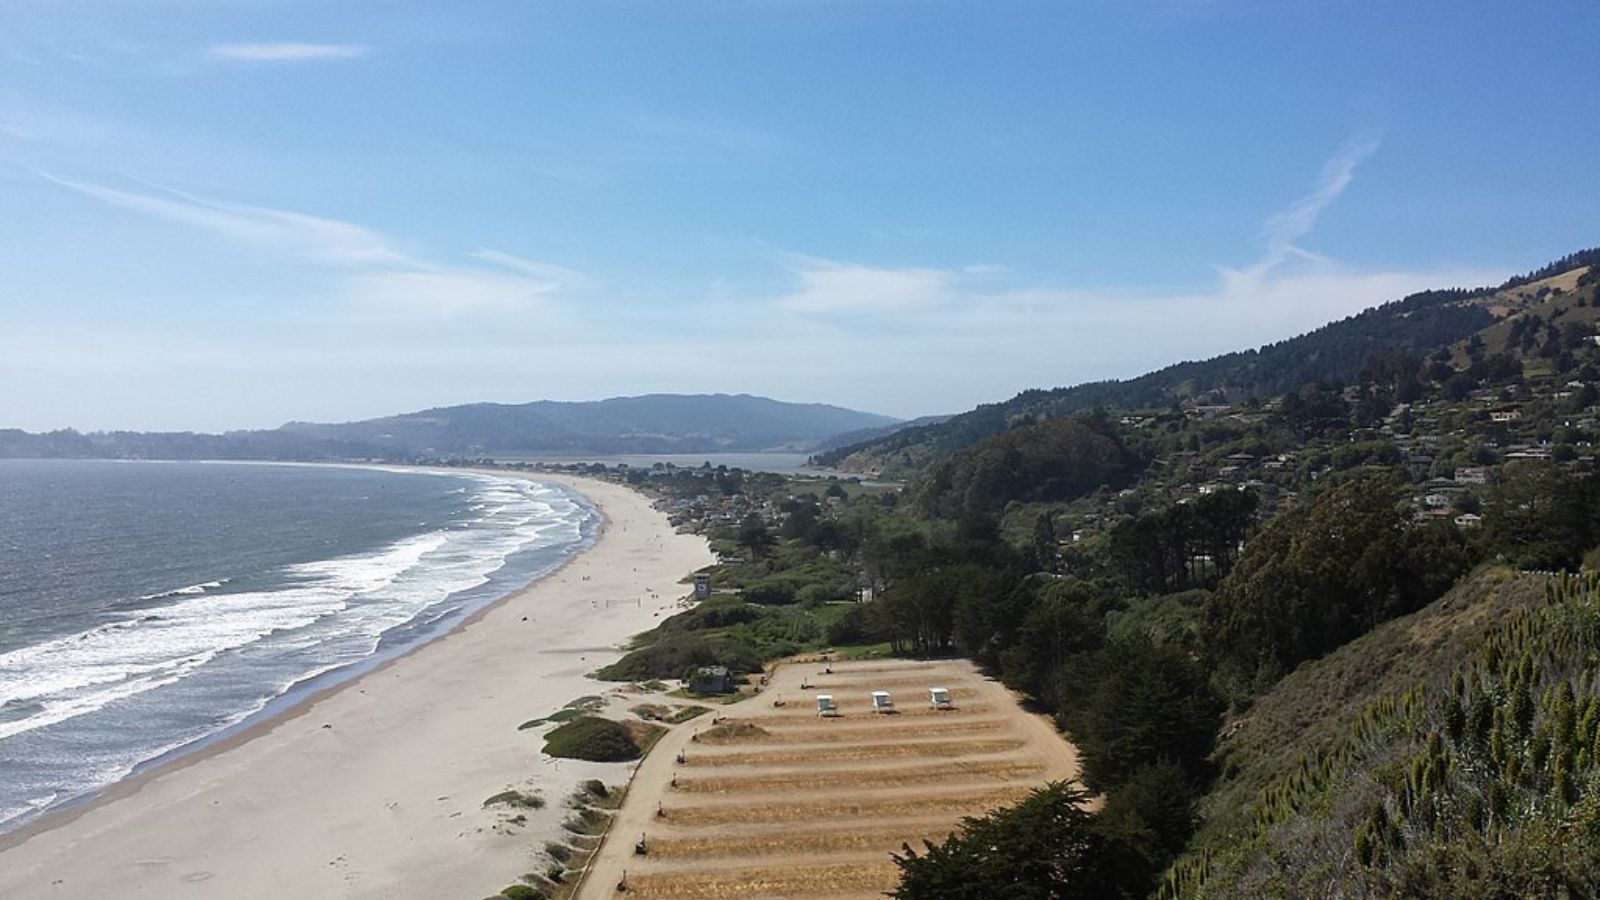
25. Laguna Beach – 127% Home Price Increase Since 2010
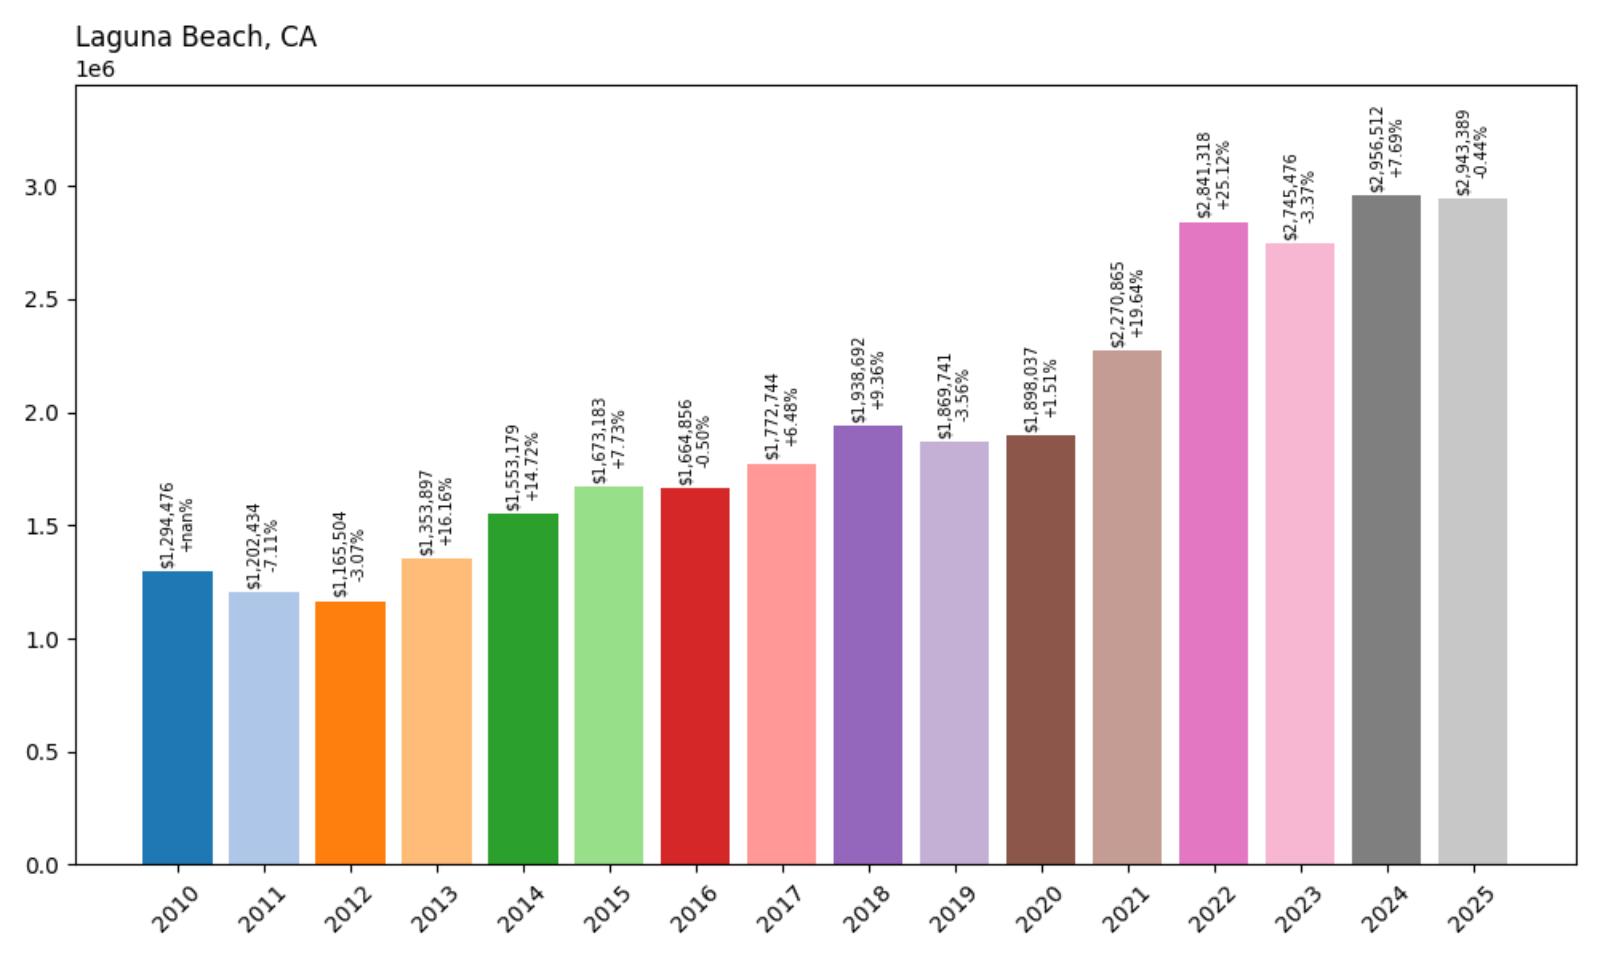
- 2010: $1,294,476
- 2011: $1,202,434 (−$92,042, −7.11% from previous year)
- 2012: $1,165,504 (−$36,930, −3.07% from previous year)
- 2013: $1,353,897 (+$188,392, +16.16% from previous year)
- 2014: $1,553,179 (+$199,283, +14.72% from previous year)
- 2015: $1,673,183 (+$120,004, +7.73% from previous year)
- 2016: $1,664,856 (−$8,327, −0.50% from previous year)
- 2017: $1,772,744 (+$107,888, +6.48% from previous year)
- 2018: $1,938,692 (+$165,948, +9.36% from previous year)
- 2019: $1,869,741 (−$68,951, −3.56% from previous year)
- 2020: $1,898,037 (+$28,296, +1.51% from previous year)
- 2021: $2,270,865 (+$372,829, +19.64% from previous year)
- 2022: $2,841,318 (+$570,453, +25.12% from previous year)
- 2023: $2,745,476 (−$95,843, −3.37% from previous year)
- 2024: $2,956,512 (+$211,037, +7.69% from previous year)
- 2025: $2,943,389 (−$13,123, −0.44% from previous year)
Laguna Beach has seen home prices more than double since 2010, reaching $2.94 million in 2025 despite a slight recent decline. The coastal community experienced its most dramatic growth during 2021-2022, when prices surged nearly 45% over two years, reflecting the premium placed on artistic coastal communities during the pandemic. The market has shown some volatility in recent years but remains well above historical levels.
Laguna Beach – Artistic Coastal Haven
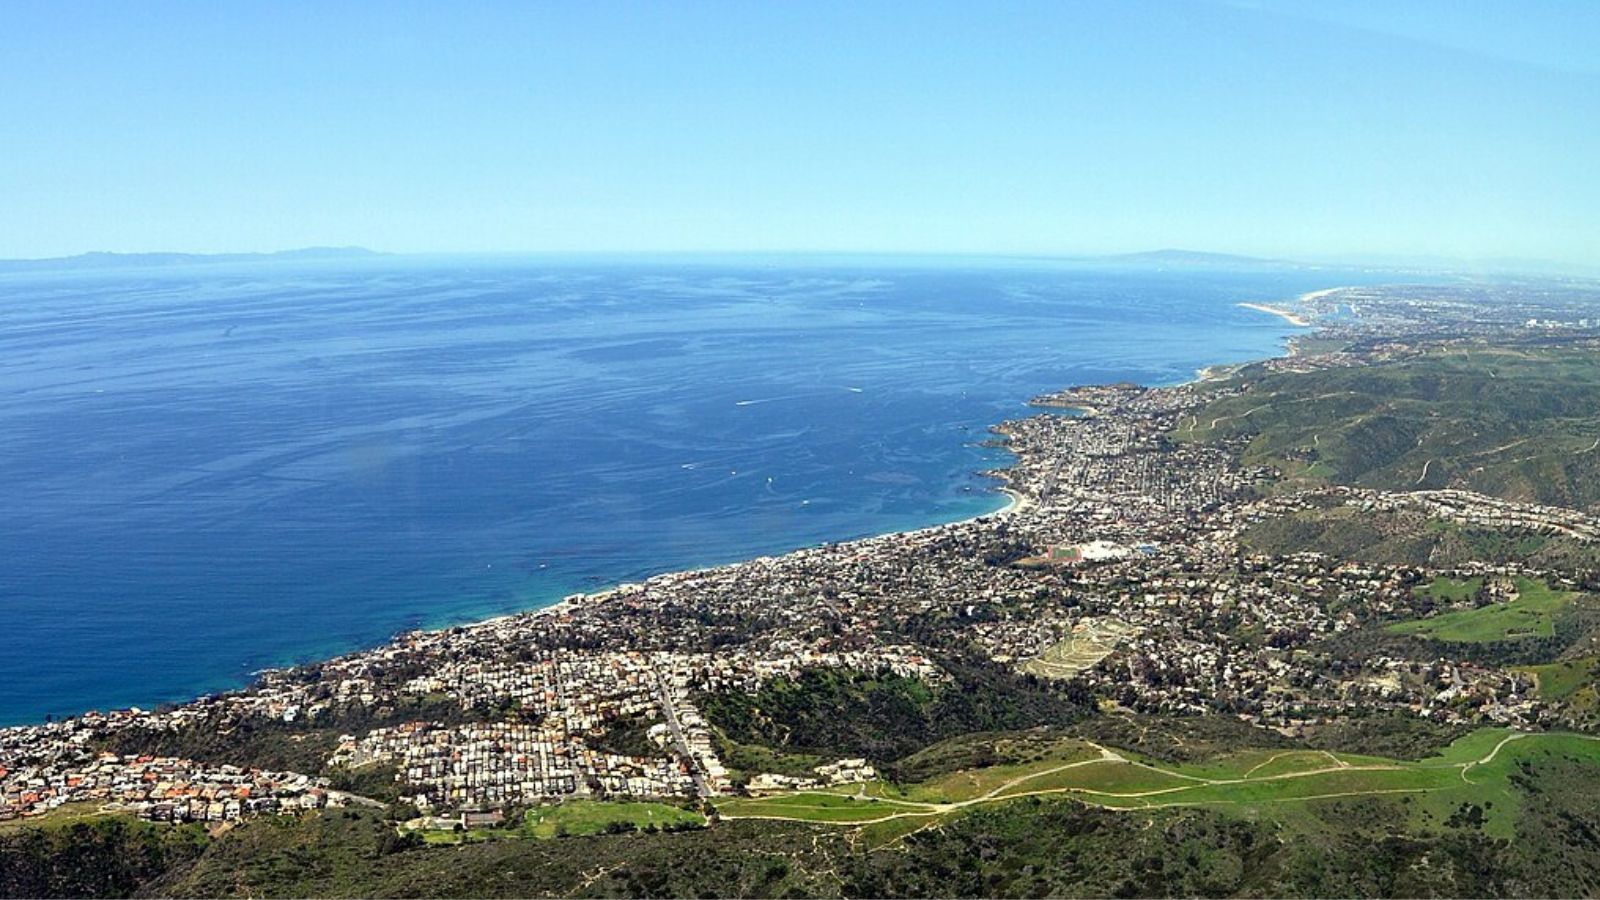
Renowned for its stunning coastline, vibrant arts scene, and bohemian atmosphere, Laguna Beach has long been a magnet for artists, writers, and creative professionals. The town’s dramatic cliffs, hidden coves, and year-round mild climate create an idyllic setting that has attracted both full-time residents and second-home buyers from across Southern California. The combination of natural beauty and cultural sophistication has made it one of Orange County’s most desirable communities, though rising prices have increasingly challenged the area’s traditionally diverse artistic community.
The pandemic-era surge in prices reflected increased demand for coastal properties with outdoor amenities and cultural attractions. Many Los Angeles-area professionals discovered they could work remotely while enjoying the town’s beaches, art galleries, and festivals. The annual Pageant of the Masters and numerous art festivals have maintained Laguna Beach’s reputation as a cultural destination, adding to its real estate appeal beyond just coastal location.
Recent price fluctuations reflect the broader luxury coastal market’s sensitivity to economic conditions, but Laguna Beach’s fundamental appeal remains strong. The town’s strict development controls and commitment to preserving its artistic character have limited new construction, keeping housing supply constrained. Despite concerns about affordability’s impact on the creative community, the combination of natural beauty, cultural amenities, and proximity to major employment centers continues to drive premium pricing.
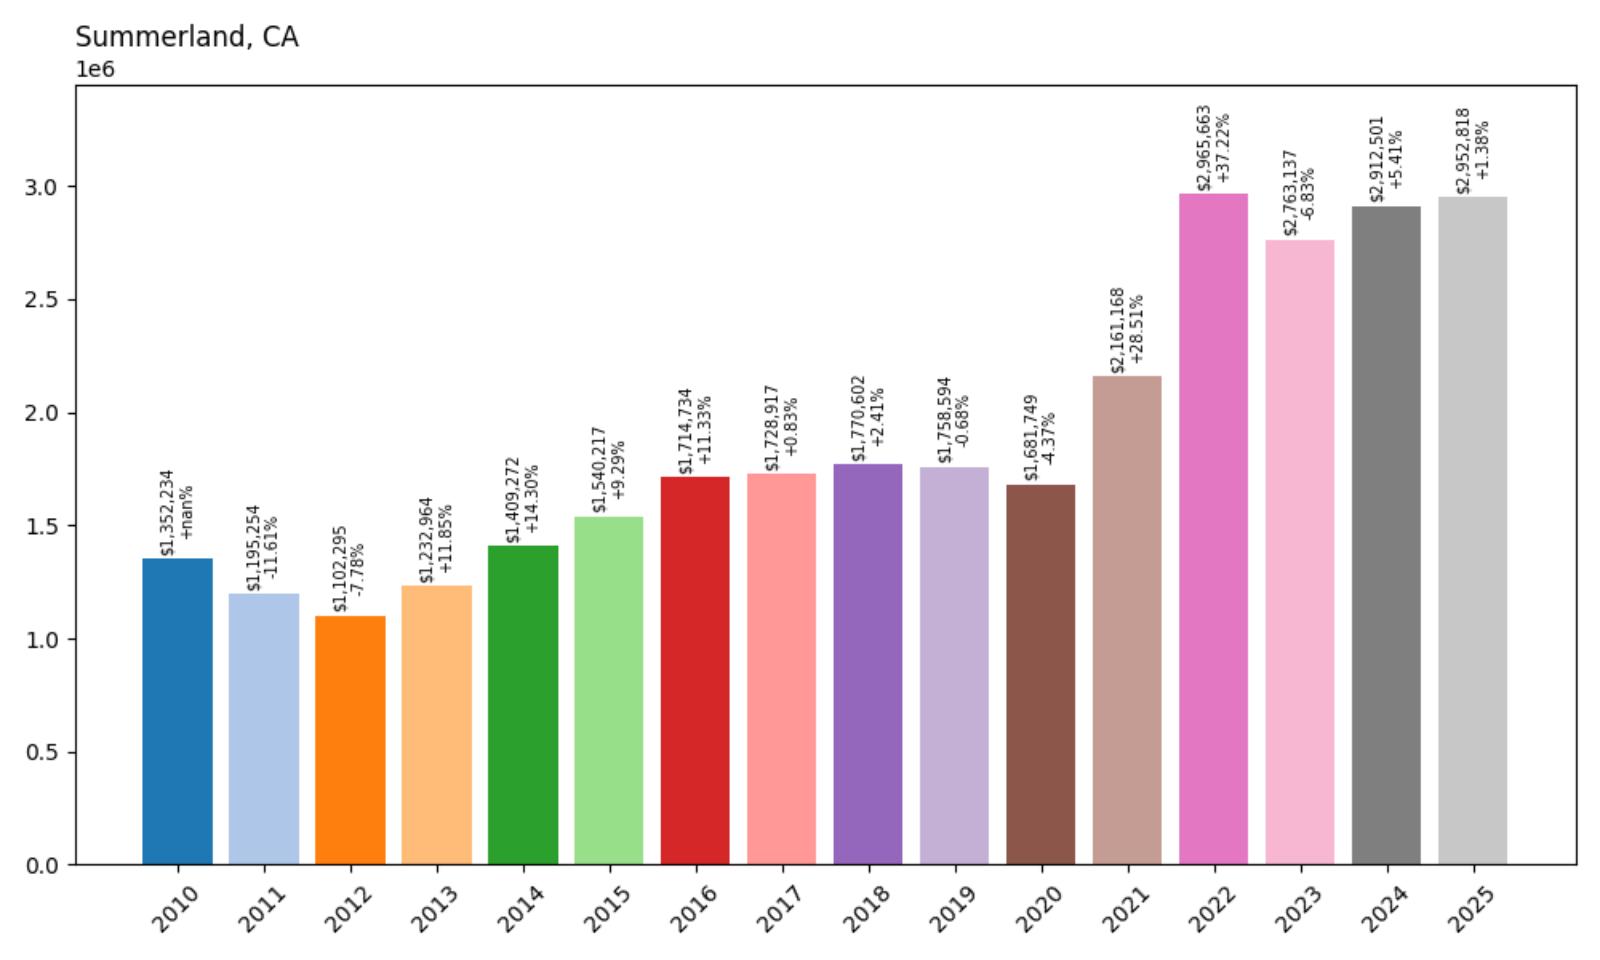
24. Summerland – 118% Home Price Increase Since 2010
🔥 Would you like to save this?
- 2010: $1,352,234
- 2011: $1,195,254 (−$156,980, −11.61% from previous year)
- 2012: $1,102,295 (−$92,960, −7.78% from previous year)
- 2013: $1,232,964 (+$130,669, +11.85% from previous year)
- 2014: $1,409,272 (+$176,308, +14.30% from previous year)
- 2015: $1,540,217 (+$130,945, +9.29% from previous year)
- 2016: $1,714,734 (+$174,517, +11.33% from previous year)
- 2017: $1,728,917 (+$14,183, +0.83% from previous year)
- 2018: $1,770,602 (+$41,685, +2.41% from previous year)
- 2019: $1,758,594 (−$12,008, −0.68% from previous year)
- 2020: $1,681,749 (−$76,845, −4.37% from previous year)
- 2021: $2,161,168 (+$479,420, +28.51% from previous year)
- 2022: $2,965,663 (+$804,494, +37.22% from previous year)
- 2023: $2,763,137 (−$202,525, −6.83% from previous year)
- 2024: $2,912,501 (+$149,364, +5.41% from previous year)
- 2025: $2,952,818 (+$40,316, +1.38% from previous year)
Summerland has experienced remarkable price appreciation, with home values rising from $1.35 million in 2010 to $2.95 million in 2025. The small coastal community saw explosive growth during 2021-2022, when prices surged over 75% in just two years, representing one of the most dramatic increases among California’s expensive towns. After a correction in 2023, prices have stabilized at nearly three times their 2010 levels.
Summerland – Intimate Coastal Enclave

This tiny unincorporated community between Montecito and Carpinteria occupies a unique position along the Santa Barbara County coast, offering residents a more intimate alternative to larger coastal cities. Summerland’s compact size and beachfront location have created an almost village-like atmosphere, with many homes enjoying direct ocean access or stunning coastal views. The community’s proximity to both Santa Barbara and Montecito provides access to upscale amenities while maintaining a more relaxed, small-town character.
The dramatic price increases of 2021-2022 reflected the premium buyers placed on small coastal communities during the pandemic, as remote work enabled more flexible living arrangements. Many properties in Summerland offer the rare combination of beachfront living and relative privacy, amenities that became especially valuable as urban density felt less appealing. The area’s limited housing stock and restrictive development policies have intensified competition among buyers seeking coastal retreats.
Despite recent price volatility, Summerland maintains its appeal as one of California’s most exclusive small coastal communities. The combination of natural beauty, privacy, and proximity to Santa Barbara’s cultural amenities continues to attract affluent buyers seeking an intimate coastal lifestyle. The community’s limited size and environmental constraints ensure that housing supply will remain constrained, supporting continued premium pricing despite broader market fluctuations.
23. Manhattan Beach – 144% Home Price Increase Since 2010

- 2010: $1,262,248
- 2011: $1,212,919 (−$49,330, −3.91% from previous year)
- 2012: $1,154,683 (−$58,236, −4.80% from previous year)
- 2013: $1,335,037 (+$180,354, +15.62% from previous year)
- 2014: $1,562,160 (+$227,123, +17.01% from previous year)
- 2015: $1,795,682 (+$233,522, +14.95% from previous year)
- 2016: $1,852,885 (+$57,203, +3.19% from previous year)
- 2017: $2,016,897 (+$164,012, +8.85% from previous year)
- 2018: $2,277,607 (+$260,710, +12.93% from previous year)
- 2019: $2,313,221 (+$35,614, +1.56% from previous year)
- 2020: $2,343,072 (+$29,850, +1.29% from previous year)
- 2021: $2,686,711 (+$343,639, +14.67% from previous year)
- 2022: $3,192,387 (+$505,676, +18.82% from previous year)
- 2023: $3,022,130 (−$170,257, −5.33% from previous year)
- 2024: $3,080,828 (+$58,698, +1.94% from previous year)
- 2025: $3,082,371 (+$1,543, +0.05% from previous year)
Manhattan Beach has demonstrated steady appreciation with home prices more than doubling from $1.26 million in 2010 to $3.08 million in 2025. The beachfront community experienced consistent growth throughout the 2010s, with acceleration during 2021-2022 when prices jumped over 30% in two years. The market has shown signs of stabilization recently, with minimal change in 2025 suggesting a maturing luxury beach market.
Manhattan Beach – Premium South Bay Lifestyle
Manhattan Beach epitomizes the Southern California beach town lifestyle, combining wide sandy beaches with upscale residential neighborhoods and excellent schools. The city’s famous beach volleyball courts, upscale dining scene, and family-friendly atmosphere have made it a premier destination for affluent professionals, particularly those in the entertainment and tech industries. The proximity to Los Angeles International Airport and major employment centers, combined with the beach lifestyle, creates a unique value proposition that justifies premium pricing.
The steady price appreciation reflects the community’s consistent appeal to high-earning professionals seeking the ultimate beach town experience. Many homes offer ocean views or easy beach access, while the town’s excellent schools and safe neighborhoods attract families willing to pay premium prices for the lifestyle. The pandemic period saw increased demand as remote work made beachfront living more feasible for professionals who previously required daily commutes to urban offices.
Recent price stabilization suggests the market may be reaching equilibrium at current luxury levels, but Manhattan Beach’s fundamental appeal remains strong. The combination of natural beauty, recreational amenities, and proximity to major employment centers continues to attract affluent buyers. Limited beachfront land and strict development controls ensure that housing supply remains constrained, supporting continued premium pricing in one of Southern California’s most desirable beach communities.
22. Cupertino – 223% Home Price Increase Since 2010
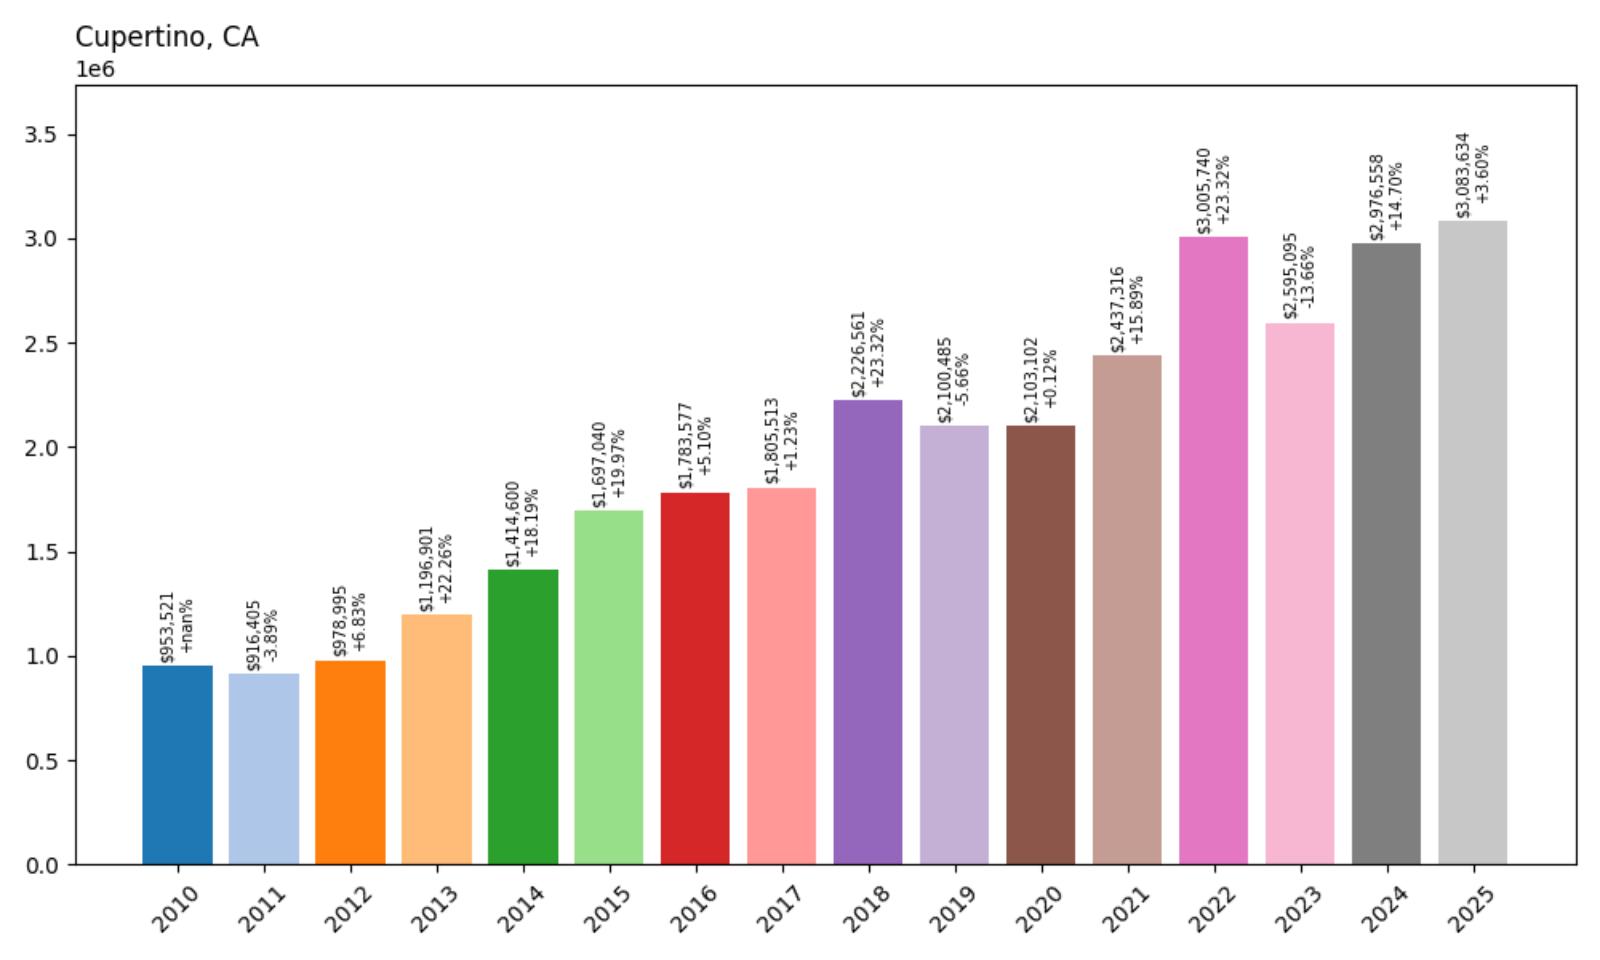
- 2010: $953,521
- 2011: $916,405 (−$37,117, −3.89% from previous year)
- 2012: $978,995 (+$62,590, +6.83% from previous year)
- 2013: $1,196,901 (+$217,906, +22.26% from previous year)
- 2014: $1,414,600 (+$217,699, +18.19% from previous year)
- 2015: $1,697,040 (+$282,440, +19.97% from previous year)
- 2016: $1,783,577 (+$86,537, +5.10% from previous year)
- 2017: $1,805,513 (+$21,936, +1.23% from previous year)
- 2018: $2,226,561 (+$421,048, +23.32% from previous year)
- 2019: $2,100,485 (−$126,076, −5.66% from previous year)
- 2020: $2,103,102 (+$2,617, +0.12% from previous year)
- 2021: $2,437,316 (+$334,214, +15.89% from previous year)
- 2022: $3,005,740 (+$568,424, +23.32% from previous year)
- 2023: $2,595,095 (−$410,646, −13.66% from previous year)
- 2024: $2,976,558 (+$381,463, +14.70% from previous year)
- 2025: $3,083,634 (+$107,076, +3.60% from previous year)
Cupertino has experienced the most dramatic price appreciation among these communities, with home values rising an extraordinary 223% from under $1 million in 2010 to over $3 million in 2025. The tech hub saw particularly explosive growth during 2013-2015 and again in 2018, with recent volatility reflecting broader market conditions. Despite a significant correction in 2023, prices have rebounded strongly, demonstrating the enduring appeal of this Silicon Valley location.
Cupertino – Apple’s Hometown Advantage
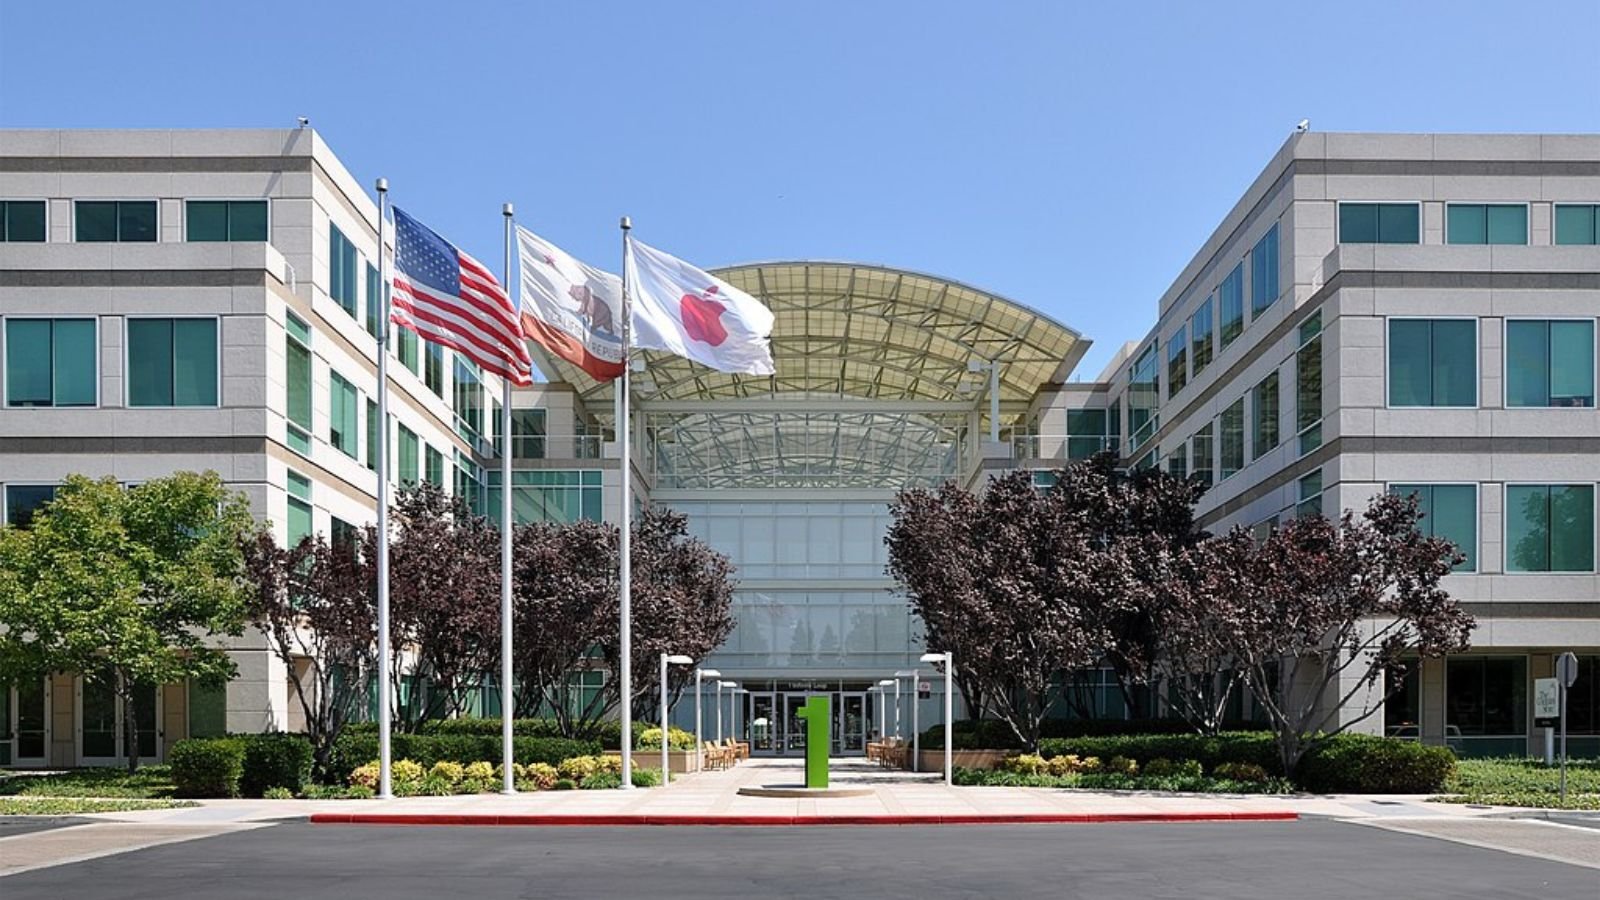
Home to Apple’s massive corporate campus and headquarters, Cupertino sits at the heart of the global technology industry’s most valuable company. The city’s transformation from a suburban community to a tech epicenter has driven unprecedented demand for housing, as Apple employees and other tech workers compete for homes within walking or biking distance of major campuses. The presence of Apple Park, with its 12,000 employees, has created intense pressure on the local housing market that shows no signs of abating.
The city’s excellent schools, particularly its highly-rated high schools, have made it especially attractive to tech industry families willing to pay premium prices for educational quality. Many properties have been extensively renovated or rebuilt to accommodate the wealth generated by tech industry success, creating a market where older homes are purchased primarily for their lot value. The 2018 surge coincided with Apple’s continued expansion and the broader tech industry boom, while recent fluctuations reflect market adjustments to interest rate changes.
Despite price volatility, Cupertino’s position as ground zero for the world’s largest technology company ensures continued premium pricing. The combination of employment proximity, educational quality, and tech industry wealth concentration creates a unique market dynamic that supports extraordinary home values. As Apple continues to expand its operations and other tech companies establish nearby presences, competition for Cupertino housing remains intense among highly compensated technology professionals.
21. Rolling Hills – 125% Home Price Increase Since 2010

- 2010: $1,374,888
- 2011: $1,325,797 (−$49,090, −3.57% from previous year)
- 2012: $1,327,071 (+$1,274, +0.10% from previous year)
- 2013: $1,512,352 (+$185,281, +13.96% from previous year)
- 2014: $1,713,426 (+$201,074, +13.30% from previous year)
- 2015: $1,836,523 (+$123,098, +7.18% from previous year)
- 2016: $1,826,271 (−$10,252, −0.56% from previous year)
- 2017: $1,990,910 (+$164,638, +9.02% from previous year)
- 2018: $2,142,495 (+$151,585, +7.61% from previous year)
- 2019: $2,260,281 (+$117,786, +5.50% from previous year)
- 2020: $2,241,006 (−$19,275, −0.85% from previous year)
- 2021: $2,669,159 (+$428,153, +19.11% from previous year)
- 2022: $3,297,756 (+$628,597, +23.55% from previous year)
- 2023: $3,053,590 (−$244,166, −7.40% from previous year)
- 2024: $3,164,369 (+$110,780, +3.63% from previous year)
- 2025: $3,096,439 (−$67,930, −2.15% from previous year)
Rolling Hills has seen home prices more than double from $1.37 million in 2010 to $3.10 million in 2025, with the most dramatic growth occurring during 2021-2022 when prices surged over 50% in two years. The exclusive equestrian community has shown some recent volatility, with prices declining slightly in 2023 and 2025, but remains well above historical levels. The 125% increase reflects the premium buyers place on privacy and luxury in the South Bay.
Rolling Hills – Equestrian Estate Living

Rolling Hills represents a unique enclave of rural luxury within the urban sprawl of Los Angeles County, offering residents large estates, horse facilities, and a gated community atmosphere. The city’s commitment to preserving its rural character through strict zoning that requires minimum lot sizes and allows horse keeping has created a distinctive market for buyers seeking privacy and space. Many properties feature extensive grounds, private stables, and custom homes that take advantage of the area’s rolling topography and distant ocean views.
The dramatic price increases of 2021-2022 reflected increased demand for large properties with outdoor amenities during the pandemic, as remote work enabled more flexible living arrangements. The community’s proximity to the beach cities and downtown Los Angeles, combined with its rural atmosphere, became particularly appealing to affluent professionals seeking alternatives to urban density. Many buyers were drawn to the ability to maintain horses and other livestock while remaining within commuting distance of major employment centers.
Recent price adjustments reflect the broader luxury market’s sensitivity to economic conditions, but Rolling Hills’ fundamental appeal as a rural retreat within urban Southern California remains strong. The combination of large estates, equestrian facilities, and privacy continues to attract affluent buyers seeking a unique lifestyle. The community’s strict development controls and commitment to preserving its rural character ensure that housing supply remains limited, supporting continued premium pricing despite market fluctuations.
20. Diablo – 40% Home Price Increase Since 2016

- 2010: N/A
- 2011: N/A
- 2012: N/A
- 2013: N/A
- 2014: N/A
- 2015: N/A
- 2016: $2,250,701
- 2017: $2,261,331 (+$10,630, +0.47% from previous year)
- 2018: $2,394,324 (+$132,994, +5.88% from previous year)
- 2019: $2,393,501 (−$823, −0.03% from previous year)
- 2020: $2,370,207 (−$23,294, −0.97% from previous year)
- 2021: $2,980,920 (+$610,713, +25.77% from previous year)
- 2022: $3,576,506 (+$595,586, +19.98% from previous year)
- 2023: $3,208,760 (−$367,746, −10.28% from previous year)
- 2024: $3,261,148 (+$52,388, +1.63% from previous year)
- 2025: $3,143,102 (−$118,046, −3.62% from previous year)
Diablo has experienced significant price appreciation since data became available in 2016, with home values rising 40% from $2.25 million to $3.14 million in 2025. The exclusive East Bay community saw explosive growth during 2021-2022, when prices surged over 50% in two years, before experiencing some correction in recent years. Despite recent volatility, prices remain well above pre-pandemic levels in this prestigious gated community.
Diablo – East Bay Exclusive Enclave
Nestled in the hills of Contra Costa County, Diablo represents one of the East Bay’s most exclusive residential communities, featuring large custom estates and the renowned Diablo Country Club. The gated community’s location at the base of Mount Diablo provides residents with privacy, security, and stunning views while maintaining convenient access to San Francisco via the nearby BART system. The area’s reputation for luxury living and prestigious country club membership has made it a magnet for successful professionals and business executives.
The dramatic price increases of 2021-2022 reflected the community’s appeal to affluent buyers seeking large properties with outdoor amenities during the pandemic. Many homes in Diablo feature extensive grounds, private pools, and golf course access, amenities that became particularly valuable as remote work enabled more flexible living arrangements. The area’s proximity to both San Francisco and Silicon Valley, combined with its suburban tranquility, attracted buyers looking for alternatives to urban density.
Recent price corrections reflect broader luxury market adjustments, but Diablo’s fundamental appeal as an exclusive East Bay retreat remains strong. The combination of gated community security, country club amenities, and proximity to major employment centers continues to attract affluent buyers. The limited number of properties and strict community standards ensure that housing supply remains constrained, supporting premium pricing despite market fluctuations.
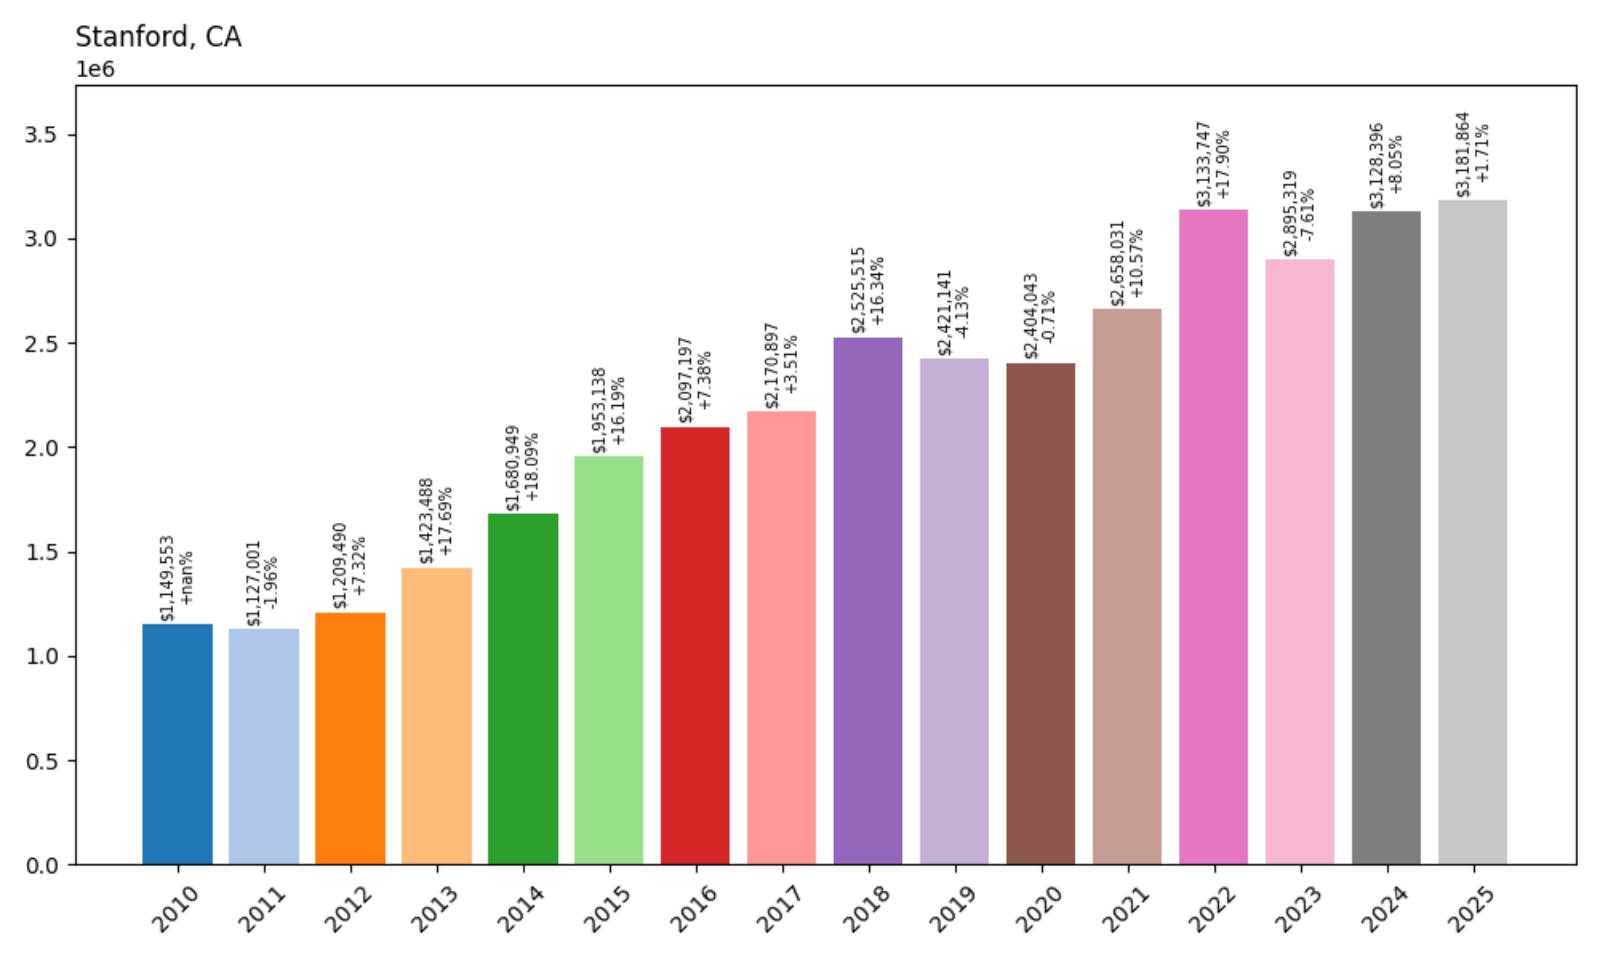
19. Stanford – 177% Home Price Increase Since 2010
- 2010: $1,149,553
- 2011: $1,127,001 (−$22,553, −1.96% from previous year)
- 2012: $1,209,490 (+$82,489, +7.32% from previous year)
- 2013: $1,423,488 (+$213,998, +17.69% from previous year)
- 2014: $1,680,949 (+$257,461, +18.09% from previous year)
- 2015: $1,953,138 (+$272,189, +16.19% from previous year)
- 2016: $2,097,197 (+$144,059, +7.38% from previous year)
- 2017: $2,170,897 (+$73,700, +3.51% from previous year)
- 2018: $2,525,515 (+$354,618, +16.34% from previous year)
- 2019: $2,421,141 (−$104,374, −4.13% from previous year)
- 2020: $2,404,043 (−$17,099, −0.71% from previous year)
- 2021: $2,658,031 (+$253,988, +10.57% from previous year)
- 2022: $3,133,747 (+$475,716, +17.90% from previous year)
- 2023: $2,895,319 (−$238,428, −7.61% from previous year)
- 2024: $3,128,396 (+$233,078, +8.05% from previous year)
- 2025: $3,181,864 (+$53,467, +1.71% from previous year)
Stanford has experienced remarkable price appreciation, with home values rising 177% from $1.15 million in 2010 to $3.18 million in 2025. The university community saw particularly strong growth during 2013-2016 and again in 2018, with recent years showing continued upward momentum despite some volatility. The consistent appreciation reflects the premium buyers place on proximity to one of the world’s most prestigious universities.
Stanford – Academic Excellence Premium
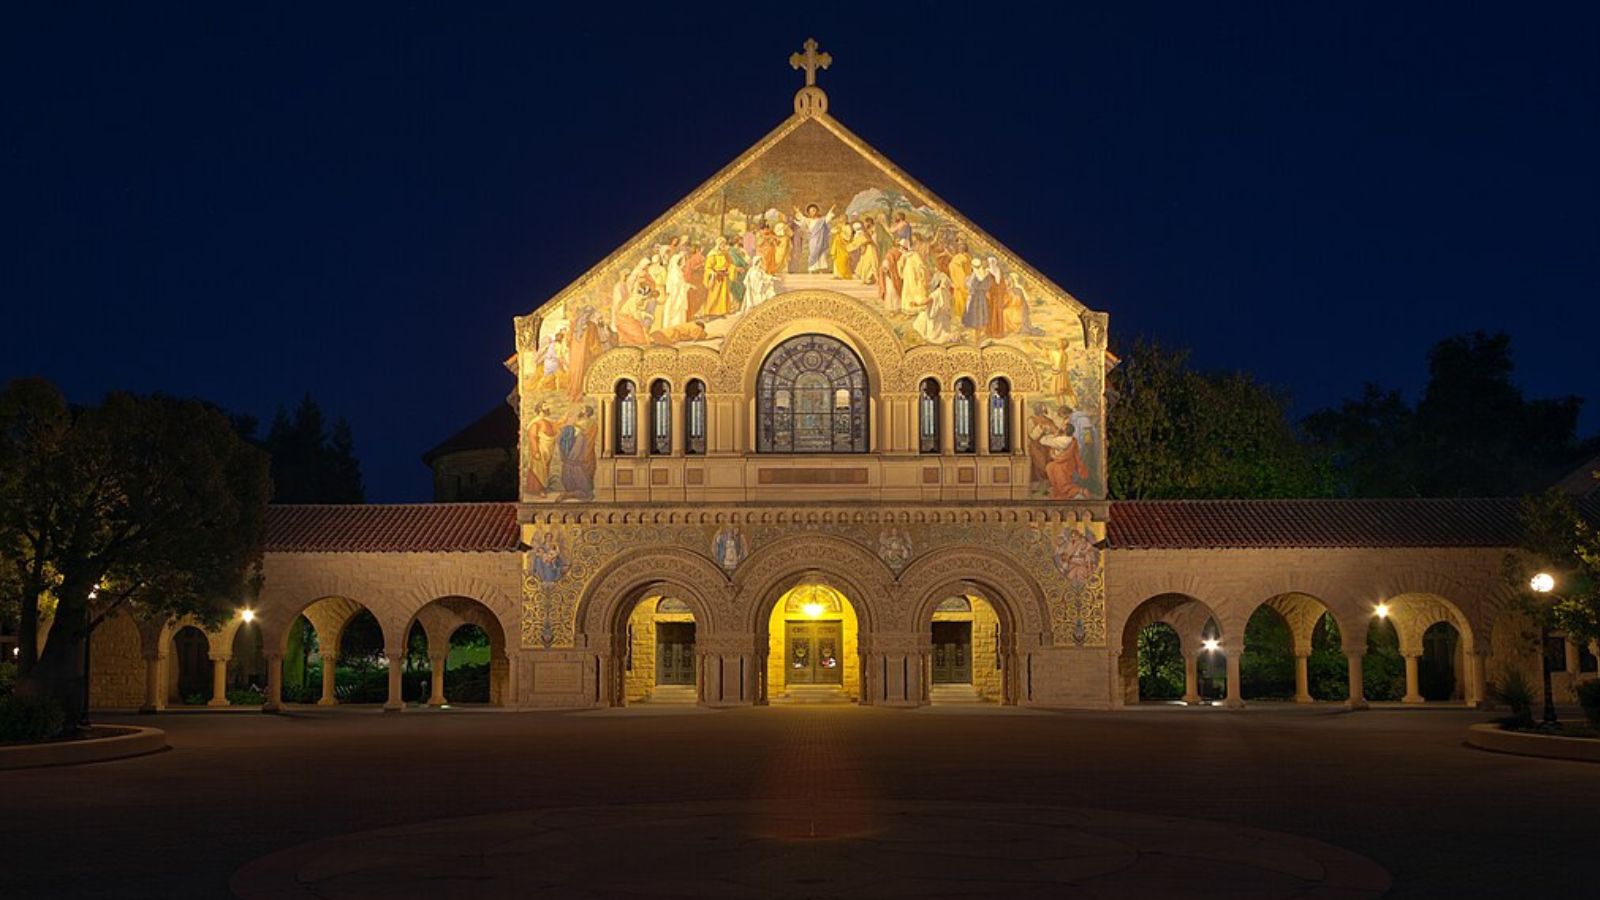
The Stanford area represents one of the most prestigious residential locations in Silicon Valley, offering residents proximity to Stanford University and its world-renowned academic and research facilities. The combination of university prestige, excellent schools, and location at the heart of the tech industry creates a unique market dynamic where housing demand far exceeds supply. Many properties attract faculty, administrators, and tech industry professionals who value the intellectual atmosphere and convenient access to both the university and major tech companies.
The steady price appreciation reflects the area’s consistent appeal to highly educated, high-earning professionals who prioritize educational quality and intellectual community. The university’s continued growth and prominence in technology research has attracted increasing numbers of venture capitalists, entrepreneurs, and tech executives to the area. The 2018 surge coincided with the university’s expansion and the broader tech industry boom, while recent growth reflects sustained demand despite market fluctuations.
The Stanford area’s position at the intersection of academic excellence and technological innovation ensures continued premium pricing. The combination of university prestige, proximity to major tech companies, and limited housing supply creates a market where demand consistently exceeds availability. As Stanford University continues to play a central role in Silicon Valley’s innovation ecosystem, the area’s appeal to affluent, educated buyers remains strong, supporting continued price appreciation.
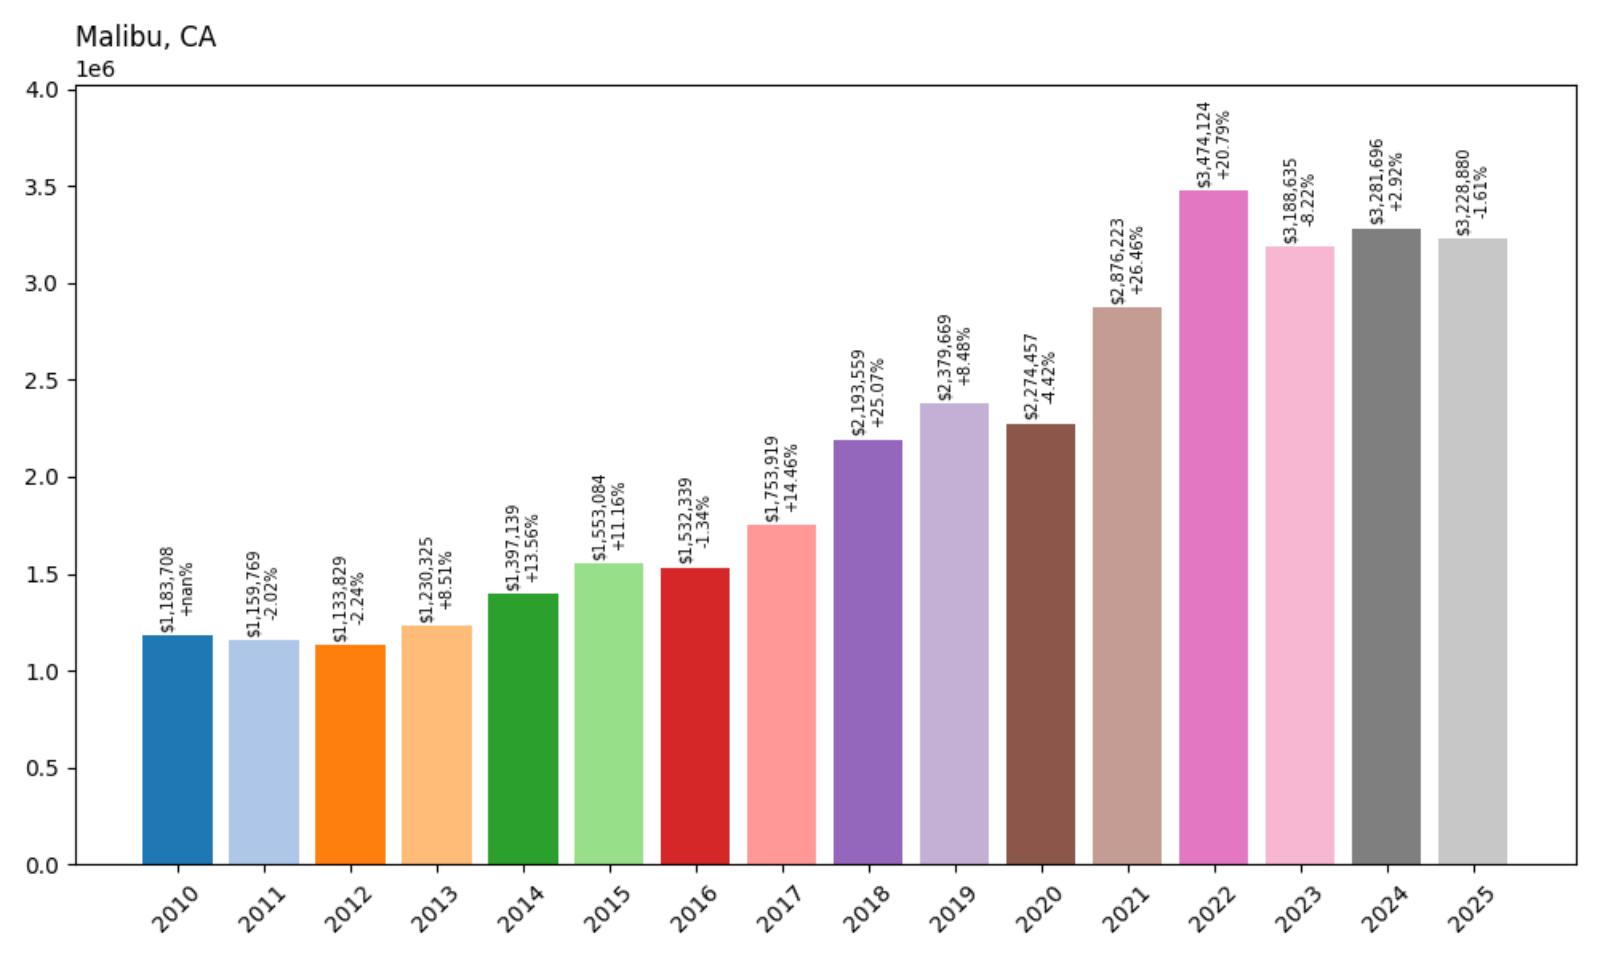
18. Malibu – 173% Home Price Increase Since 2010
🔥 Would you like to save this?
- 2010: $1,183,708
- 2011: $1,159,769 (−$23,939, −2.02% from previous year)
- 2012: $1,133,829 (−$25,941, −2.24% from previous year)
- 2013: $1,230,325 (+$96,497, +8.51% from previous year)
- 2014: $1,397,139 (+$166,814, +13.56% from previous year)
- 2015: $1,553,084 (+$155,945, +11.16% from previous year)
- 2016: $1,532,339 (−$20,745, −1.34% from previous year)
- 2017: $1,753,919 (+$221,580, +14.46% from previous year)
- 2018: $2,193,559 (+$439,640, +25.07% from previous year)
- 2019: $2,379,669 (+$186,110, +8.48% from previous year)
- 2020: $2,274,457 (−$105,212, −4.42% from previous year)
- 2021: $2,876,223 (+$601,766, +26.46% from previous year)
- 2022: $3,474,124 (+$597,902, +20.79% from previous year)
- 2023: $3,188,635 (−$285,489, −8.22% from previous year)
- 2024: $3,281,696 (+$93,060, +2.92% from previous year)
- 2025: $3,228,880 (−$52,815, −1.61% from previous year)
Malibu has seen home prices rise 173% from $1.18 million in 2010 to $3.23 million in 2025, with the most dramatic growth occurring during 2018-2019 and 2021-2022. The famous coastal community experienced explosive growth during these periods, with prices surging over 90% in just four years. Recent market adjustments have brought some price moderation, but values remain well above historical levels in this celebrity-favored beachfront enclave.
Malibu – Celebrity Coastal Paradise

Malibu epitomizes the California dream of coastal luxury living, stretching along 21 miles of Pacific coastline with dramatic cliffs, pristine beaches, and stunning ocean views. The city’s reputation as a celebrity haven has been built over decades, attracting entertainment industry professionals, business executives, and affluent buyers seeking the ultimate in coastal lifestyle. The combination of natural beauty, privacy, and proximity to Hollywood has created a unique market where properties command premiums for both their location and celebrity associations.
The dramatic price increases of 2018-2019 and 2021-2022 reflected the area’s appeal during periods of entertainment industry prosperity and pandemic-era demand for coastal properties. Many homes offer direct beach access, private compounds, and the kind of privacy that celebrities and high-net-worth individuals value. The area’s susceptibility to wildfires and mudslides has added complexity to the market, but buyers continue to pay premium prices for the unparalleled coastal lifestyle and prestige of Malibu addresses.
Despite recent price adjustments and ongoing environmental challenges, Malibu remains one of the world’s most desirable coastal real estate markets. The combination of natural beauty, celebrity culture, and proximity to Los Angeles entertainment industry centers continues to attract affluent buyers. Limited developable beachfront land and strict environmental regulations ensure that housing supply remains constrained, supporting continued premium pricing despite market volatility and natural disaster risks.
17. Beverly Hills – 117% Home Price Increase Since 2010
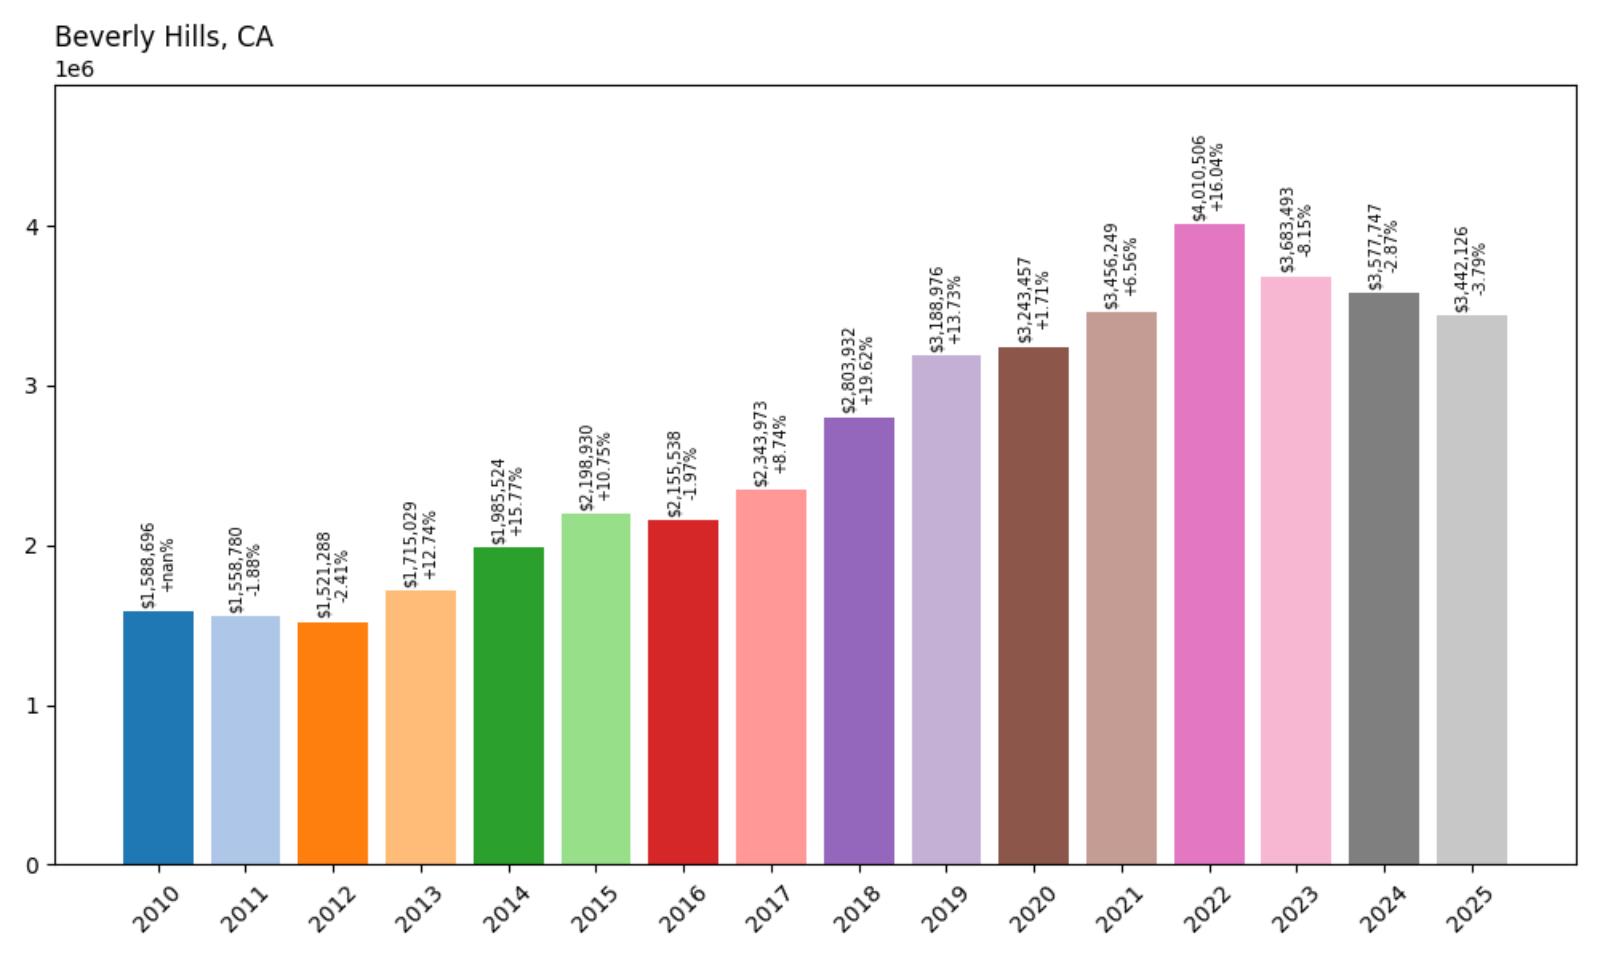
- 2010: $1,588,696
- 2011: $1,558,780 (−$29,916, −1.88% from previous year)
- 2012: $1,521,288 (−$37,492, −2.41% from previous year)
- 2013: $1,715,029 (+$193,741, +12.74% from previous year)
- 2014: $1,985,524 (+$270,496, +15.77% from previous year)
- 2015: $2,198,930 (+$213,405, +10.75% from previous year)
- 2016: $2,155,538 (−$43,392, −1.97% from previous year)
- 2017: $2,343,973 (+$188,435, +8.74% from previous year)
- 2018: $2,803,932 (+$459,959, +19.62% from previous year)
- 2019: $3,188,976 (+$385,044, +13.73% from previous year)
- 2020: $3,243,457 (+$54,481, +1.71% from previous year)
- 2021: $3,456,249 (+$212,792, +6.56% from previous year)
- 2022: $4,010,506 (+$554,257, +16.04% from previous year)
- 2023: $3,683,493 (−$327,013, −8.15% from previous year)
- 2024: $3,577,747 (−$105,746, −2.87% from previous year)
- 2025: $3,442,126 (−$135,621, −3.79% from previous year)
Beverly Hills has experienced steady appreciation with home prices rising 117% from $1.59 million in 2010 to $3.44 million in 2025. The iconic city saw particularly strong growth during 2018-2019 and reached its peak in 2022 at over $4 million, before experiencing corrections in recent years. Despite recent declines, prices remain more than double their 2010 levels in this globally recognized symbol of luxury living.
Beverly Hills – Global Luxury Icon
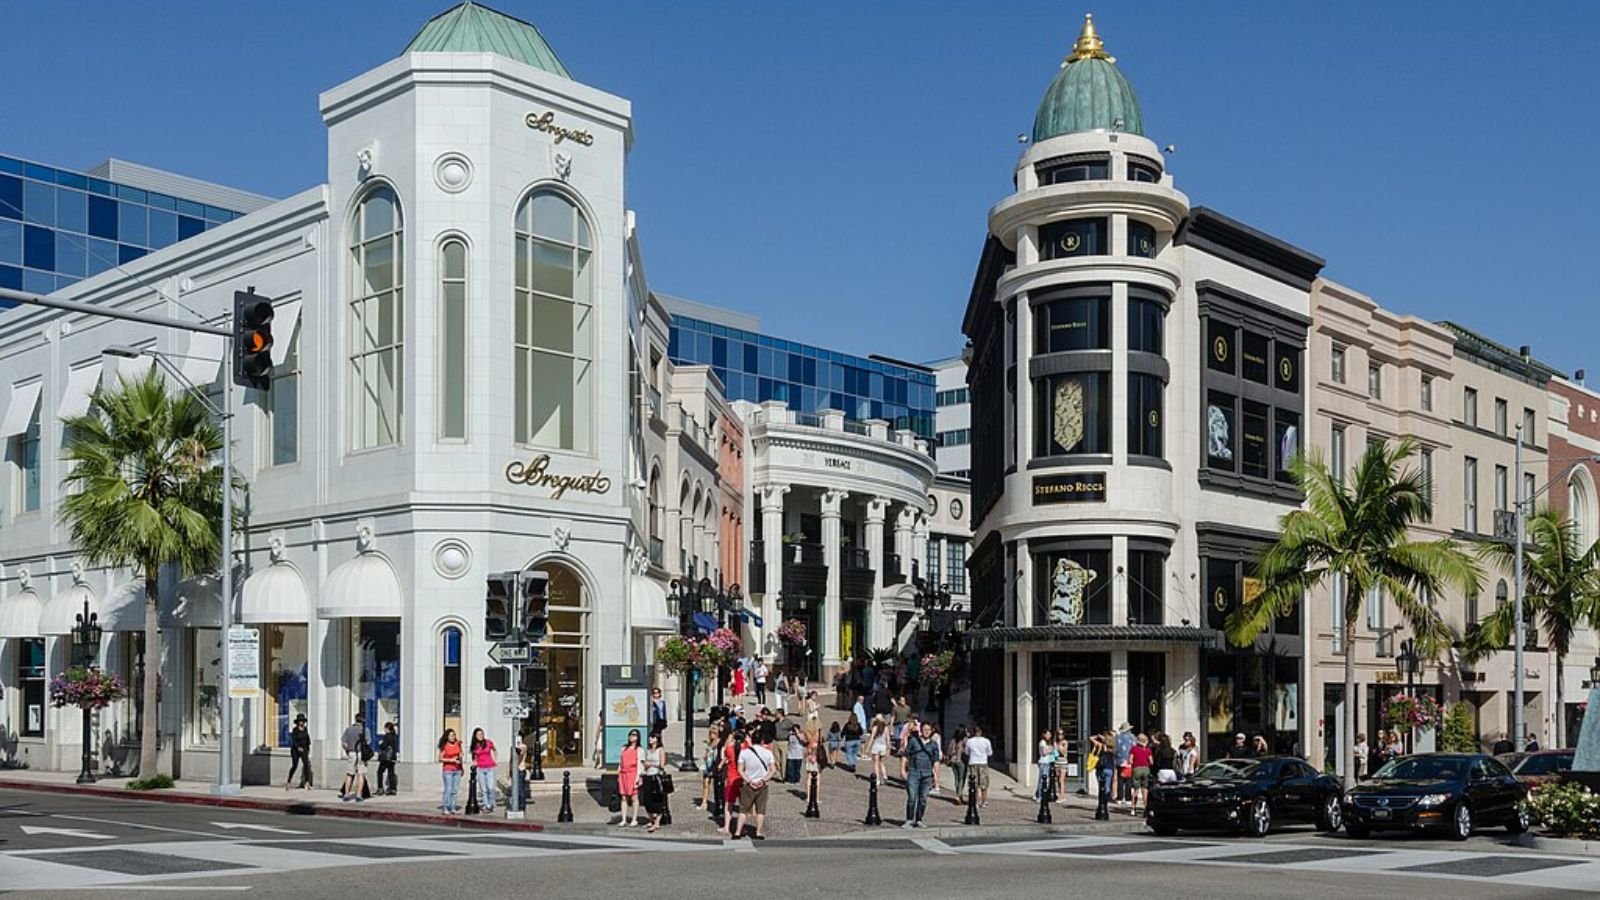
Beverly Hills represents the pinnacle of luxury living in Los Angeles, with its famous zip code 90210 serving as a global symbol of wealth and glamour. The city’s prime location between Hollywood and the Pacific Ocean, combined with its world-renowned shopping district on Rodeo Drive, has made it a magnet for entertainment industry professionals, international business executives, and affluent buyers seeking prestige addresses. The combination of luxury amenities, security, and cultural cache creates a unique market where properties command premiums for their Beverly Hills association.
The strong price appreciation during 2018-2019 coincided with robust entertainment industry performance and international investment in luxury real estate. Many properties offer not just luxury living but also the prestige and security that comes with Beverly Hills addresses, attracting buyers who value the city’s global reputation. The 2022 price peak reflected pandemic-era demand for luxury properties, while recent corrections mirror broader luxury market adjustments to changing economic conditions.
Despite recent price declines, Beverly Hills maintains its position as one of the world’s most prestigious real estate markets. The combination of luxury amenities, entertainment industry proximity, and global brand recognition continues to attract affluent buyers from around the world. The city’s commitment to maintaining its luxury character through strict zoning and high-end commercial development ensures that property values remain supported by the premium associated with Beverly Hills addresses.
16. Newport Beach – 156% Home Price Increase Since 2010
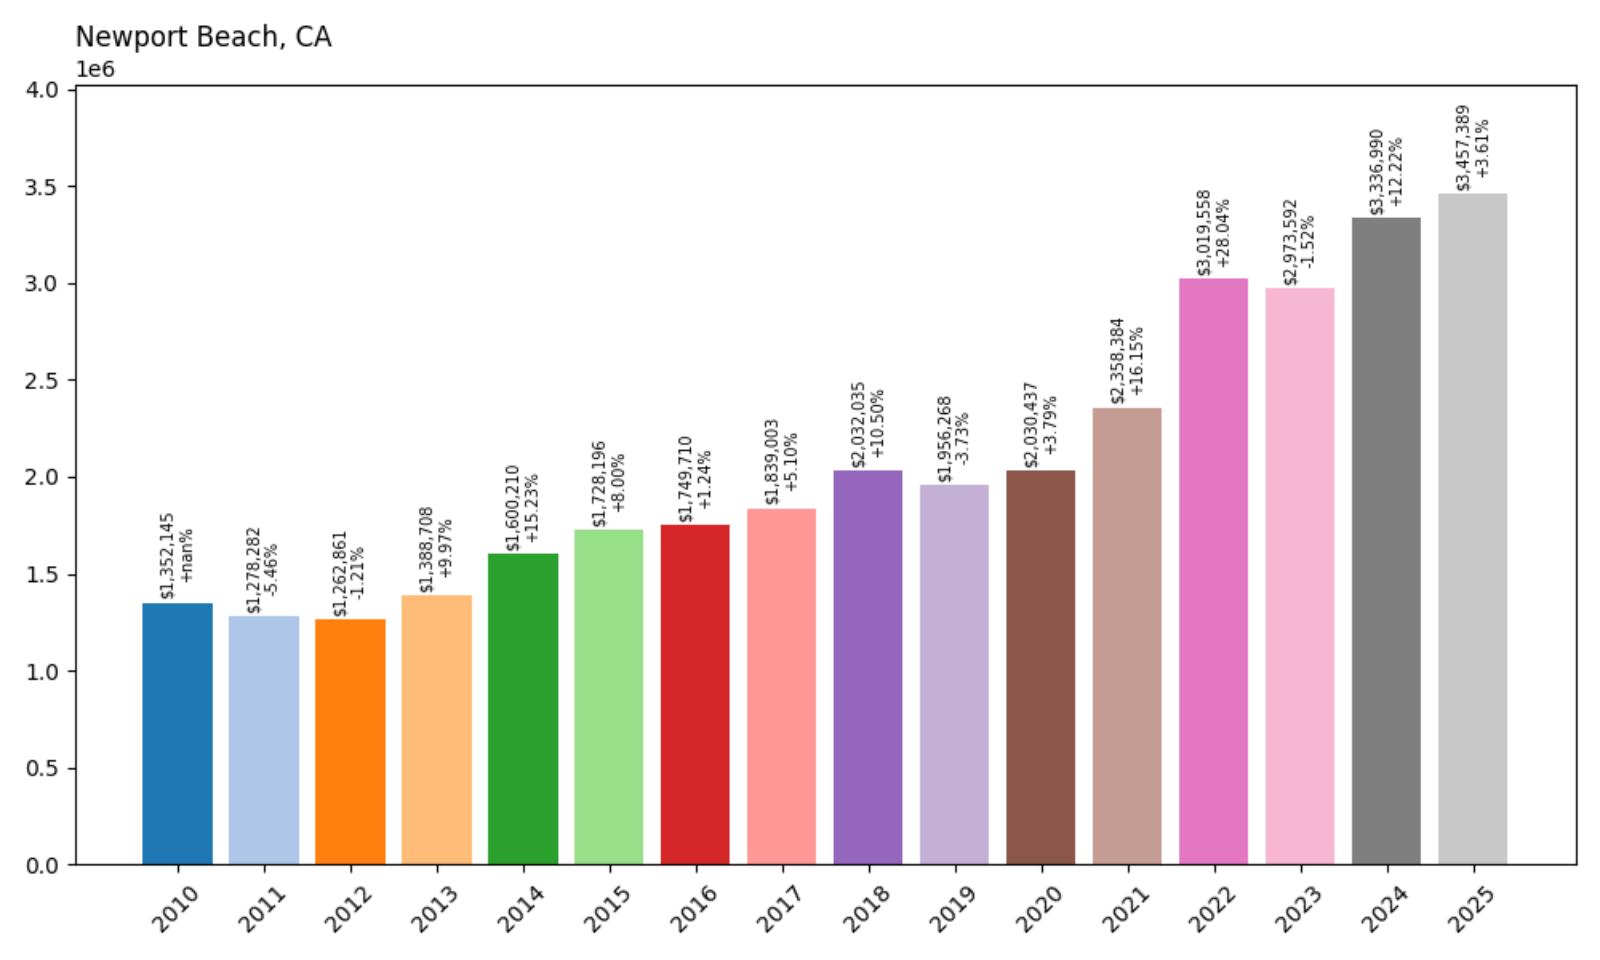
- 2010: $1,352,145
- 2011: $1,278,282 (−$73,863, −5.46% from previous year)
- 2012: $1,262,861 (−$15,421, −1.21% from previous year)
- 2013: $1,388,708 (+$125,847, +9.97% from previous year)
- 2014: $1,600,210 (+$211,502, +15.23% from previous year)
- 2015: $1,728,196 (+$127,986, +8.00% from previous year)
- 2016: $1,749,710 (+$21,514, +1.24% from previous year)
- 2017: $1,839,003 (+$89,293, +5.10% from previous year)
- 2018: $2,032,035 (+$193,031, +10.50% from previous year)
- 2019: $1,956,268 (−$75,767, −3.73% from previous year)
- 2020: $2,030,437 (+$74,170, +3.79% from previous year)
- 2021: $2,358,384 (+$327,946, +16.15% from previous year)
- 2022: $3,019,558 (+$661,175, +28.04% from previous year)
- 2023: $2,973,592 (−$45,966, −1.52% from previous year)
- 2024: $3,336,990 (+$363,397, +12.22% from previous year)
- 2025: $3,457,389 (+$120,400, +3.61% from previous year)
Newport Beach has demonstrated strong appreciation with home prices rising 156% from $1.35 million in 2010 to $3.46 million in 2025. The coastal Orange County city experienced explosive growth during 2021-2022, when prices surged over 45% in two years, followed by continued appreciation through 2024-2025. The upscale beach community has shown resilience despite market volatility, with current prices representing the highest levels in the data series.
Newport Beach – Orange County Coastal Luxury
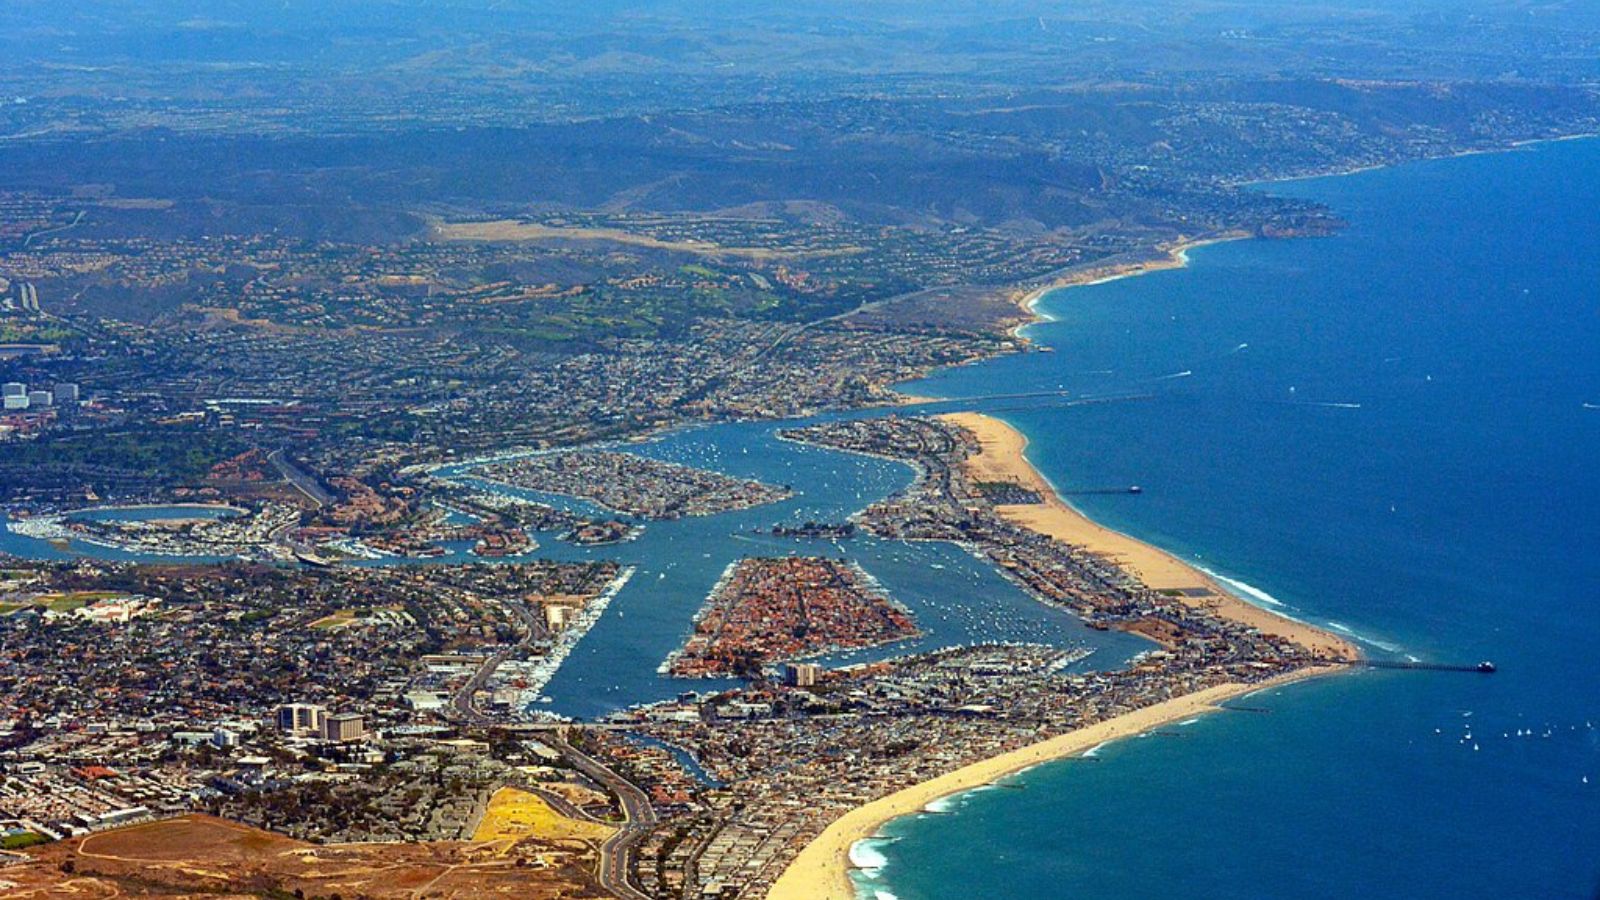
Newport Beach stands as Orange County’s premier coastal destination, combining world-class beaches with upscale shopping, dining, and recreational amenities. The city’s natural harbor, pristine beaches, and proximity to both Los Angeles and San Diego have made it a favorite among affluent professionals, business executives, and retirees seeking the ultimate coastal lifestyle. The combination of luxury living, boating culture, and year-round temperate climate creates a unique market where waterfront properties command exceptional premiums.
The dramatic price increases of 2021-2022 reflected the area’s appeal during the pandemic as remote work enabled more flexible living arrangements and buyers sought coastal properties with outdoor amenities. Many homes offer harbor or ocean views, private docks, and access to world-class beaches and recreational facilities. The area’s reputation for luxury shopping at Fashion Island and upscale dining has attracted buyers seeking a complete luxury lifestyle package.
Recent continued price appreciation demonstrates Newport Beach’s resilience and enduring appeal in the luxury coastal market. The combination of natural beauty, recreational amenities, and proximity to major employment centers continues to attract affluent buyers despite broader market uncertainties. Limited coastal land availability and strict development controls ensure that housing supply remains constrained, supporting continued premium pricing in one of California’s most desirable coastal communities.
15. Palo Alto – 176% Home Price Increase Since 2010
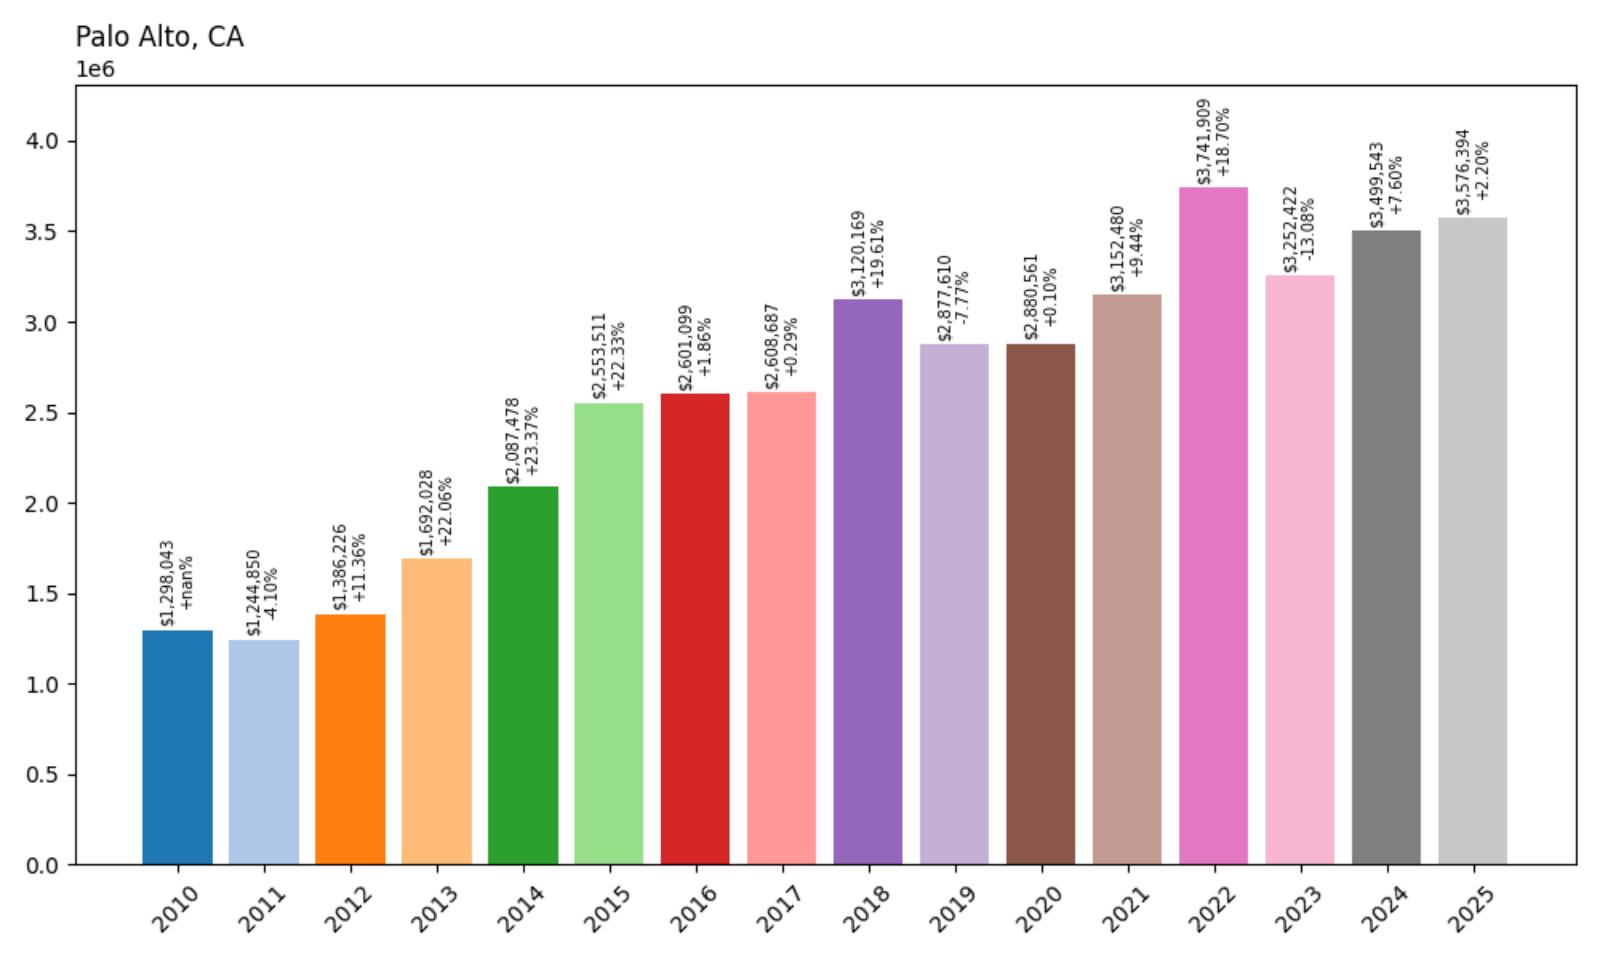
- 2010: $1,298,043
- 2011: $1,244,850 (−$53,193, −4.10% from previous year)
- 2012: $1,386,226 (+$141,376, +11.36% from previous year)
- 2013: $1,692,028 (+$305,802, +22.06% from previous year)
- 2014: $2,087,478 (+$395,449, +23.37% from previous year)
- 2015: $2,553,511 (+$466,034, +22.33% from previous year)
- 2016: $2,601,099 (+$47,588, +1.86% from previous year)
- 2017: $2,608,687 (+$7,588, +0.29% from previous year)
- 2018: $3,120,169 (+$511,482, +19.61% from previous year)
- 2019: $2,877,610 (−$242,559, −7.77% from previous year)
- 2020: $2,880,561 (+$2,952, +0.10% from previous year)
- 2021: $3,152,480 (+$271,919, +9.44% from previous year)
- 2022: $3,741,909 (+$589,429, +18.70% from previous year)
- 2023: $3,252,422 (−$489,487, −13.08% from previous year)
- 2024: $3,499,543 (+$247,122, +7.60% from previous year)
- 2025: $3,576,394 (+$76,851, +2.20% from previous year)
Palo Alto has experienced extraordinary price appreciation, with home values rising 176% from $1.30 million in 2010 to $3.58 million in 2025. The Silicon Valley hub saw particularly explosive growth during 2013-2015, when prices doubled in just three years, followed by another surge in 2018 and 2022. Despite significant volatility including a 13% correction in 2023, prices have rebounded to reach new highs, demonstrating the enduring appeal of this tech epicenter.
Palo Alto – Silicon Valley Ground Zero
Palo Alto serves as the intellectual and cultural heart of Silicon Valley, home to Stanford University and countless tech startups that have become global giants. The city’s tree-lined streets, excellent schools, and proximity to venture capital firms on Sand Hill Road have made it a magnet for tech entrepreneurs, executives, and academics. The combination of university prestige, tech industry proximity, and suburban charm creates a unique market where housing demand consistently exceeds supply among highly compensated professionals.
The dramatic price increases of 2013-2015 coincided with the tech industry’s post-recession boom and the rise of major social media and mobile technology companies. Many properties attract families from the tech industry who prioritize educational quality and professional networking opportunities. The 2018 and 2022 surges reflected continued tech industry growth and the area’s role as a global innovation center, while the 2023 correction mirrored broader market adjustments to changing economic conditions.
Despite price volatility, Palo Alto’s position at the intersection of academic excellence and technological innovation ensures continued premium pricing. The city’s excellent schools, including Palo Alto High School, attract tech industry families willing to pay extraordinary premiums for educational quality. As Silicon Valley continues to lead global technology innovation, competition for Palo Alto housing remains intense among venture capitalists, tech executives, and university faculty, supporting continued price appreciation.
14. Del Mar – 181% Home Price Increase Since 2010
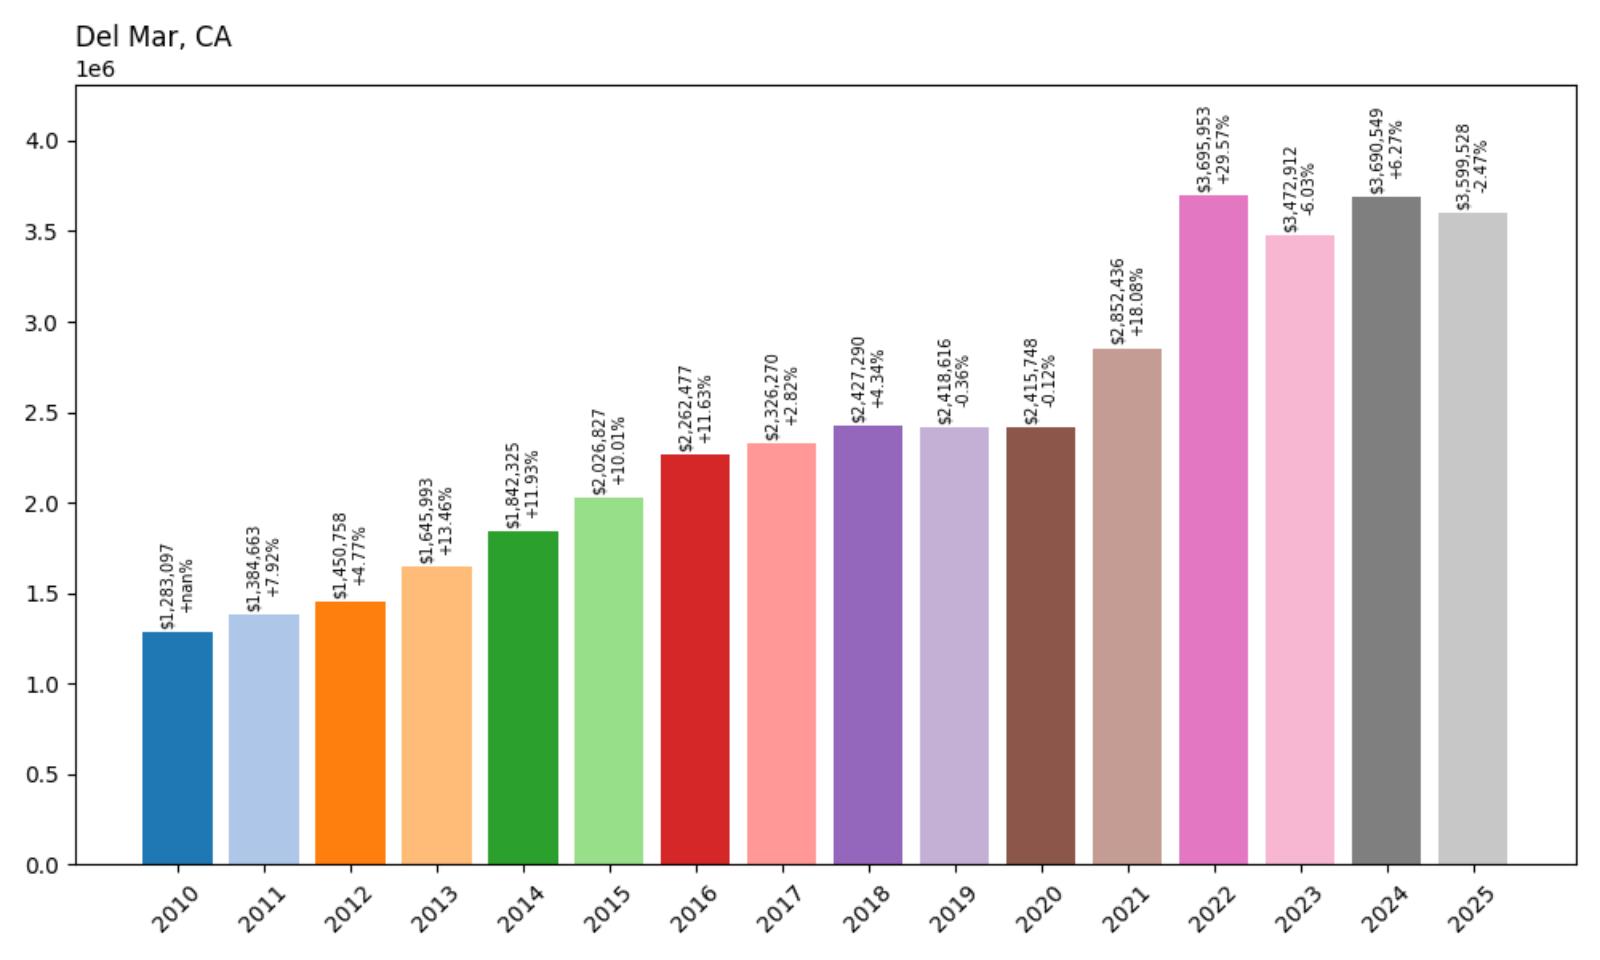
- 2010: $1,283,097
- 2011: $1,384,663 (+$101,566, +7.92% from previous year)
- 2012: $1,450,758 (+$66,095, +4.77% from previous year)
- 2013: $1,645,993 (+$195,235, +13.46% from previous year)
- 2014: $1,842,325 (+$196,332, +11.93% from previous year)
- 2015: $2,026,827 (+$184,502, +10.01% from previous year)
- 2016: $2,262,477 (+$235,650, +11.63% from previous year)
- 2017: $2,326,270 (+$63,793, +2.82% from previous year)
- 2018: $2,427,290 (+$101,020, +4.34% from previous year)
- 2019: $2,418,616 (−$8,674, −0.36% from previous year)
- 2020: $2,415,748 (−$2,869, −0.12% from previous year)
- 2021: $2,852,436 (+$436,688, +18.08% from previous year)
- 2022: $3,695,953 (+$843,517, +29.57% from previous year)
- 2023: $3,472,912 (−$223,041, −6.03% from previous year)
- 2024: $3,690,549 (+$217,637, +6.27% from previous year)
- 2025: $3,599,528 (−$91,021, −2.47% from previous year)
Del Mar has demonstrated remarkable appreciation with home prices rising 181% from $1.28 million in 2010 to $3.60 million in 2025. The coastal San Diego County community experienced steady growth through the 2010s, followed by explosive appreciation during 2021-2022 when prices surged nearly 50% in two years. Despite recent volatility, including a slight decline in 2025, prices remain nearly three times their 2010 levels in this premier North County coastal enclave.
Del Mar – San Diego’s Coastal Jewel
🔥 Would you like to save this?
Del Mar epitomizes the sophisticated coastal lifestyle of North County San Diego, combining pristine beaches with upscale amenities and a charming village atmosphere. The city’s famous Del Mar Racetrack, luxury shopping, and fine dining have made it a destination for affluent professionals, retirees, and second-home buyers seeking the ultimate Southern California coastal experience. The combination of natural beauty, recreational amenities, and proximity to both San Diego and Los Angeles creates a unique market where coastal properties command exceptional premiums.
The dramatic price increases of 2021-2022 reflected the area’s appeal during the pandemic as buyers sought coastal properties with outdoor amenities and resort-like atmospheres. Many homes offer ocean views, beach access, and proximity to world-class golf courses and recreational facilities. The area’s reputation for luxury living and its association with horse racing culture have attracted buyers seeking a complete lifestyle package that combines coastal beauty with sophisticated amenities.
Despite recent price adjustments, Del Mar maintains its position as one of San Diego County’s most prestigious coastal communities. The combination of natural beauty, recreational amenities, and small-town charm continues to attract affluent buyers despite broader market uncertainties. Limited coastal development opportunities and strict environmental regulations ensure that housing supply remains constrained, supporting continued premium pricing in this coveted North County location.
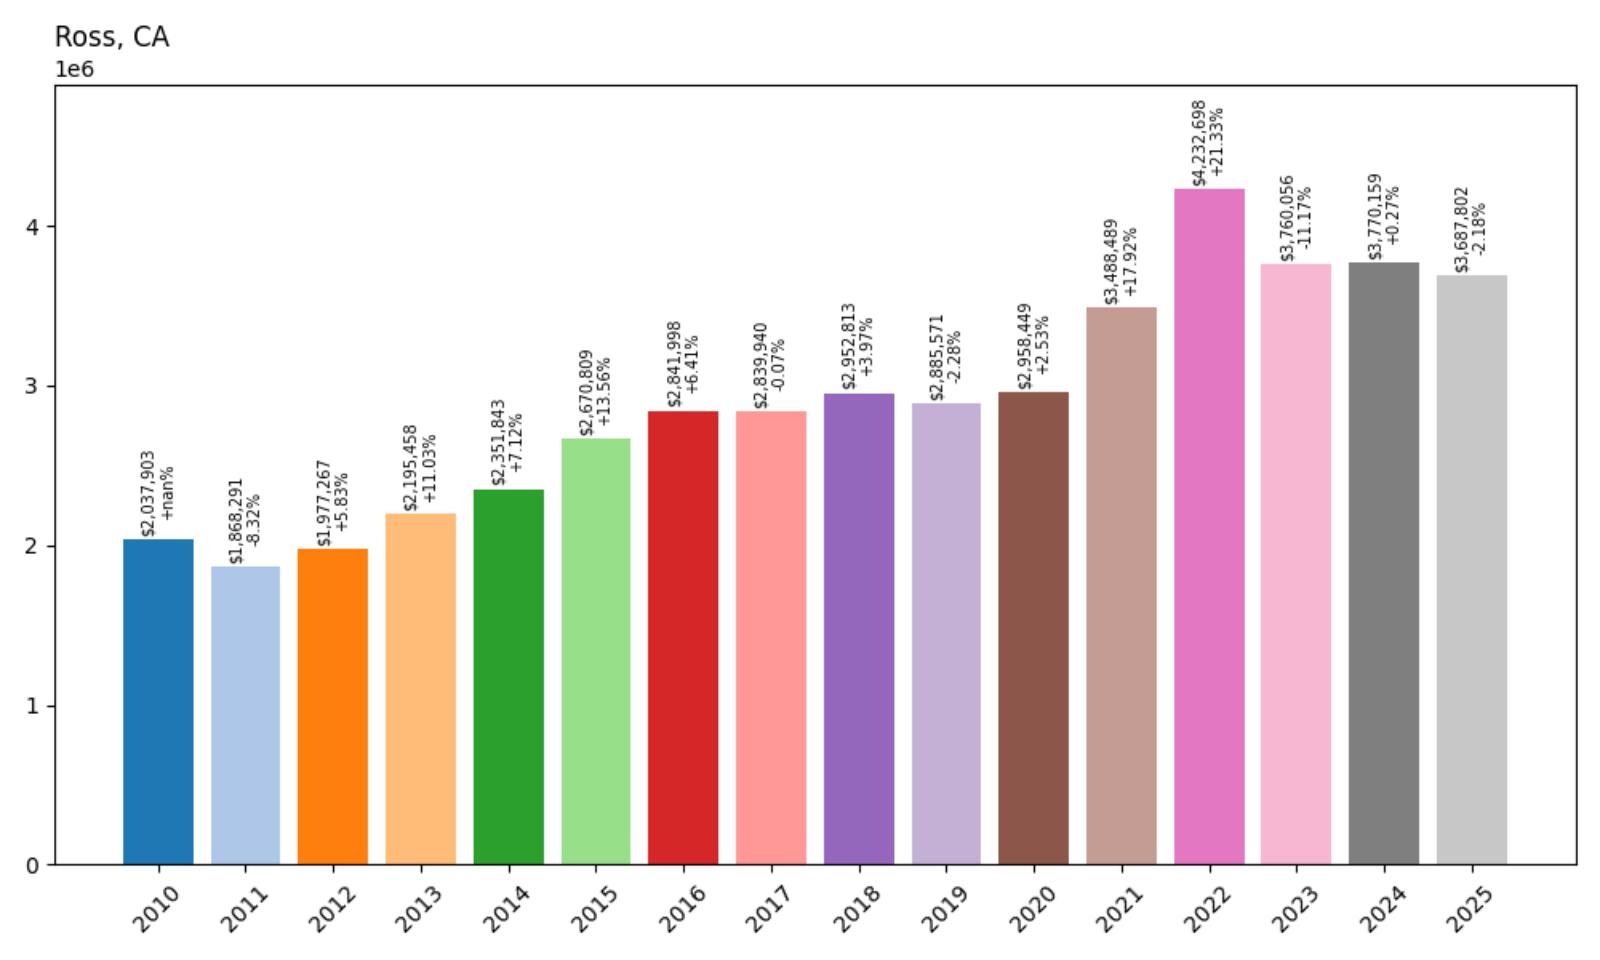
13. Ross – 81% Home Price Increase Since 2010
- 2010: $2,037,903
- 2011: $1,868,291 (−$169,612, −8.32% from previous year)
- 2012: $1,977,267 (+$108,976, +5.83% from previous year)
- 2013: $2,195,458 (+$218,191, +11.03% from previous year)
- 2014: $2,351,843 (+$156,385, +7.12% from previous year)
- 2015: $2,670,809 (+$318,966, +13.56% from previous year)
- 2016: $2,841,998 (+$171,189, +6.41% from previous year)
- 2017: $2,839,940 (−$2,058, −0.07% from previous year)
- 2018: $2,952,813 (+$112,873, +3.97% from previous year)
- 2019: $2,885,571 (−$67,243, −2.28% from previous year)
- 2020: $2,958,449 (+$72,878, +2.53% from previous year)
- 2021: $3,488,489 (+$530,040, +17.92% from previous year)
- 2022: $4,232,698 (+$744,209, +21.33% from previous year)
- 2023: $3,760,056 (−$472,642, −11.17% from previous year)
- 2024: $3,770,159 (+$10,103, +0.27% from previous year)
- 2025: $3,687,802 (−$82,356, −2.18% from previous year)
Ross has experienced moderate appreciation compared to other communities, with home prices rising 81% from $2.04 million in 2010 to $3.69 million in 2025. The exclusive Marin County town already started from a high base and saw steady growth through the 2010s, followed by dramatic increases during 2021-2022 when prices surged over 40% in two years. Recent corrections have brought some price moderation, but values remain well above historical levels in this prestigious wooded enclave.
Ross – Marin County Forest Retreat
Ross represents one of the most exclusive residential enclaves in Marin County, featuring large wooded lots, custom estates, and a commitment to preserving its natural forest setting. The town’s ban on retail establishments and dedication to maintaining its residential character have created a unique suburban retreat just 30 minutes from San Francisco. Many properties feature extensive grounds, mature trees, and privacy that appeals to affluent professionals seeking a sanctuary from urban intensity while maintaining access to city amenities.
The town’s appeal lies in its combination of natural beauty and exclusivity, with many homes situated on multi-acre lots that provide privacy and space for outdoor activities. The dramatic price increases of 2021-2022 reflected increased demand for large properties with extensive grounds during the pandemic, as remote work enabled more flexible living arrangements. The area’s excellent schools and family-friendly atmosphere have attracted tech industry executives and other high-earning professionals willing to pay premium prices for the unique Ross lifestyle.
Despite recent price adjustments, Ross maintains its position as one of the Bay Area’s most exclusive residential communities. The combination of natural beauty, privacy, and proximity to San Francisco continues to attract affluent buyers seeking a retreat-like atmosphere. The town’s commitment to preserving its forest character and restricting development ensures that housing supply remains limited, supporting continued premium pricing despite market fluctuations.
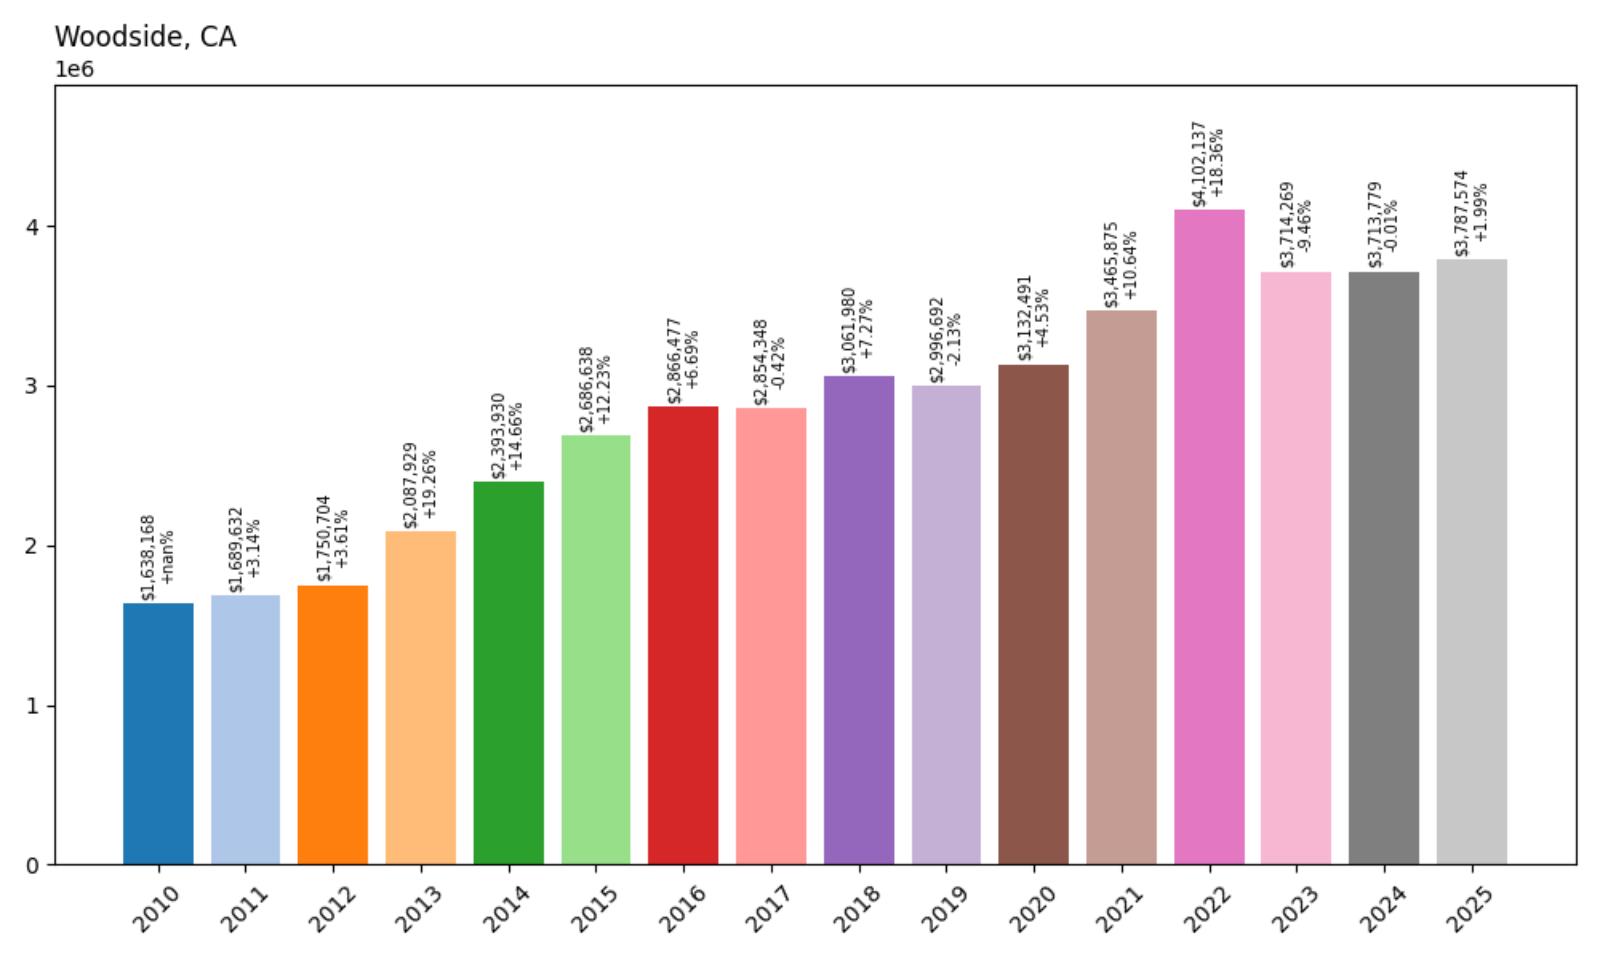
12. Woodside – 131% Home Price Increase Since 2010
- 2010: $1,638,168
- 2011: $1,689,632 (+$51,464, +3.14% from previous year)
- 2012: $1,750,704 (+$61,072, +3.61% from previous year)
- 2013: $2,087,929 (+$337,225, +19.26% from previous year)
- 2014: $2,393,930 (+$306,001, +14.66% from previous year)
- 2015: $2,686,638 (+$292,708, +12.23% from previous year)
- 2016: $2,866,477 (+$179,839, +6.69% from previous year)
- 2017: $2,854,348 (−$12,130, −0.42% from previous year)
- 2018: $3,061,980 (+$207,632, +7.27% from previous year)
- 2019: $2,996,692 (−$65,287, −2.13% from previous year)
- 2020: $3,132,491 (+$135,799, +4.53% from previous year)
- 2021: $3,465,875 (+$333,384, +10.64% from previous year)
- 2022: $4,102,137 (+$636,262, +18.36% from previous year)
- 2023: $3,714,269 (−$387,868, −9.46% from previous year)
- 2024: $3,713,779 (−$490, −0.01% from previous year)
- 2025: $3,787,574 (+$73,795, +1.99% from previous year)
Woodside has experienced substantial appreciation with home prices rising 131% from $1.64 million in 2010 to $3.79 million in 2025. The affluent Peninsula community saw particularly strong growth during 2013-2016 and again in 2022, when prices reached their peak above $4 million. Despite recent corrections, the wooded enclave has shown resilience with prices stabilizing around current levels, reflecting its enduring appeal as a rural retreat within Silicon Valley.
Woodside – Silicon Valley Horse Country
Woodside offers a unique blend of rural tranquility and Silicon Valley proximity, featuring horse properties, wooded estates, and a commitment to preserving its equestrian character. The town’s large lot sizes, mature redwood groves, and horse-friendly zoning have made it a favorite among tech executives and venture capitalists seeking a countryside retreat without sacrificing access to major employment centers. Many properties feature private stables, riding trails, and custom homes that take advantage of the area’s natural topography and forest setting.
The steady price appreciation reflects the area’s consistent appeal to affluent professionals who value privacy, space, and recreational opportunities. The 2022 price peak coincided with increased demand for large properties with outdoor amenities during the pandemic, as remote work enabled more flexible living arrangements. The area’s proximity to both Stanford University and major tech companies has attracted buyers seeking the best of both worlds: rural living with urban career opportunities.
Despite recent price adjustments, Woodside maintains its position as one of the Peninsula’s most desirable communities for those seeking a rural lifestyle within Silicon Valley. The combination of natural beauty, equestrian amenities, and privacy continues to attract affluent buyers despite broader market uncertainties. The town’s commitment to preserving its rural character and large lot requirements ensure that housing supply remains limited, supporting continued premium pricing in this unique Silicon Valley enclave.
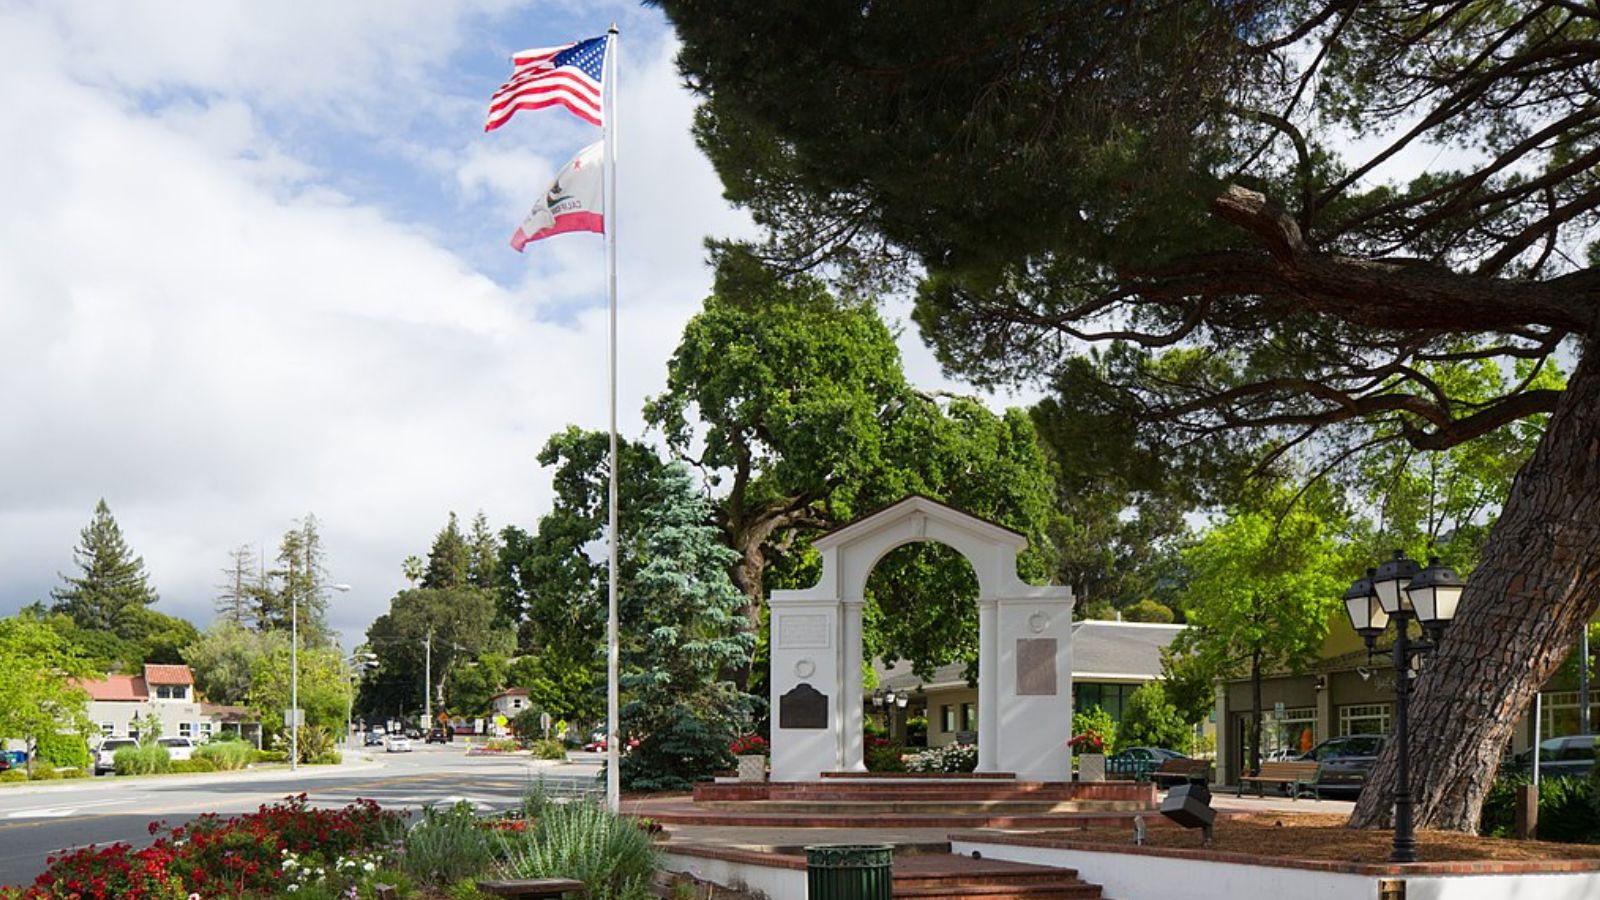
11. Saratoga – 198% Home Price Increase Since 2010
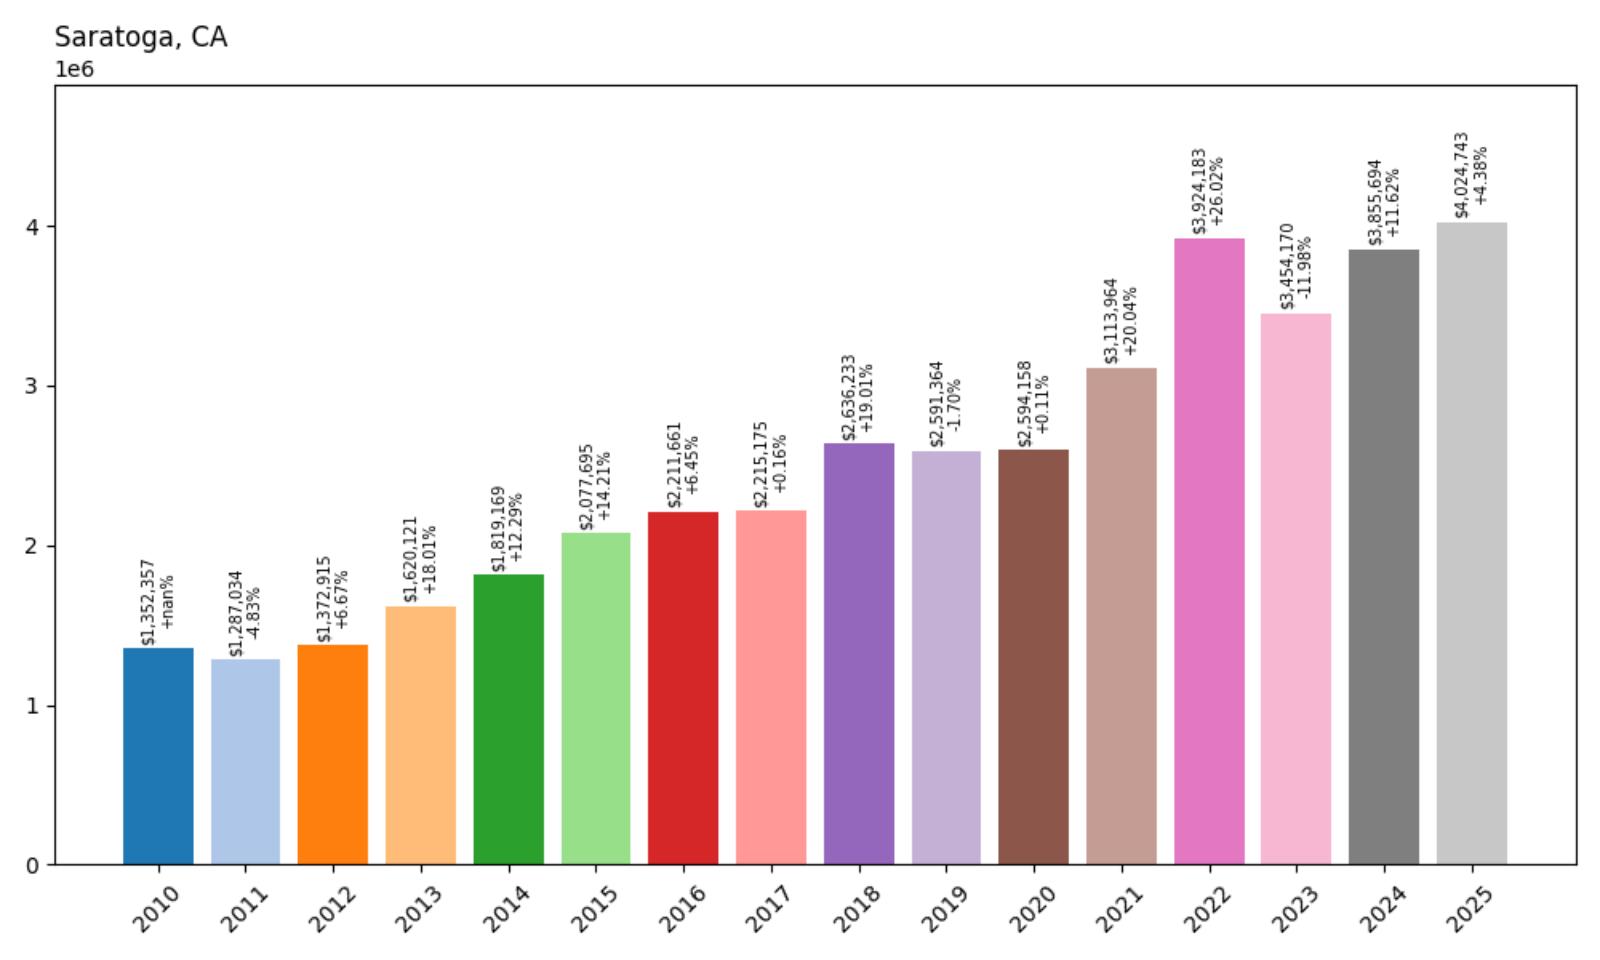
- 2010: $1,352,357
- 2011: $1,287,034 (−$65,323, −4.83% from previous year)
- 2012: $1,372,915 (+$85,881, +6.67% from previous year)
- 2013: $1,620,121 (+$247,205, +18.01% from previous year)
- 2014: $1,819,169 (+$199,048, +12.29% from previous year)
- 2015: $2,077,695 (+$258,526, +14.21% from previous year)
- 2016: $2,211,661 (+$133,965, +6.45% from previous year)
- 2017: $2,215,175 (+$3,515, +0.16% from previous year)
- 2018: $2,636,233 (+$421,057, +19.01% from previous year)
- 2019: $2,591,364 (−$44,868, −1.70% from previous year)
- 2020: $2,594,158 (+$2,794, +0.11% from previous year)
- 2021: $3,113,964 (+$519,806, +20.04% from previous year)
- 2022: $3,924,183 (+$810,219, +26.02% from previous year)
- 2023: $3,454,170 (−$470,013, −11.98% from previous year)
- 2024: $3,855,694 (+$401,524, +11.62% from previous year)
- 2025: $4,024,743 (+$169,048, +4.38% from previous year)
Saratoga has experienced remarkable price appreciation, with home values rising 198% from $1.35 million in 2010 to $4.02 million in 2025. The Silicon Valley community saw particularly strong growth during 2013-2015, 2018, and 2021-2022, with prices nearly tripling over the 15-year period. Despite significant volatility including an 11% correction in 2023, prices have rebounded strongly to reach new highs, demonstrating the enduring appeal of this prestigious foothill community.
Saratoga – Silicon Valley Foothill Sanctuary
Nestled in the foothills of the Santa Cruz Mountains, Saratoga combines natural beauty with Silicon Valley convenience, featuring tree-lined streets, excellent schools, and proximity to major tech companies. The city’s commitment to preserving its small-town character while maintaining access to world-class amenities has made it a magnet for tech industry families seeking a high-quality suburban lifestyle. Many properties offer mountain views, mature landscaping, and custom homes that reflect the area’s prosperity and sophisticated tastes.
The dramatic price increases reflect the area’s appeal to highly compensated tech professionals who prioritize educational quality and community amenities. Saratoga’s excellent schools, including Saratoga High School, consistently rank among California’s best, attracting families willing to pay premium prices for educational excellence. The 2021-2022 surge coincided with the tech industry’s pandemic-era boom and increased demand for suburban properties with outdoor space and privacy.
Despite recent volatility, Saratoga’s position as one of Silicon Valley’s premier family communities ensures continued premium pricing. The combination of natural beauty, educational excellence, and proximity to major tech employers continues to attract affluent buyers despite broader market uncertainties. The city’s commitment to preserving its character and limiting high-density development ensures that housing supply remains constrained, supporting continued price appreciation among tech industry professionals seeking the ultimate suburban Silicon Valley lifestyle.
10. Portola Valley – 104% Home Price Increase Since 2010
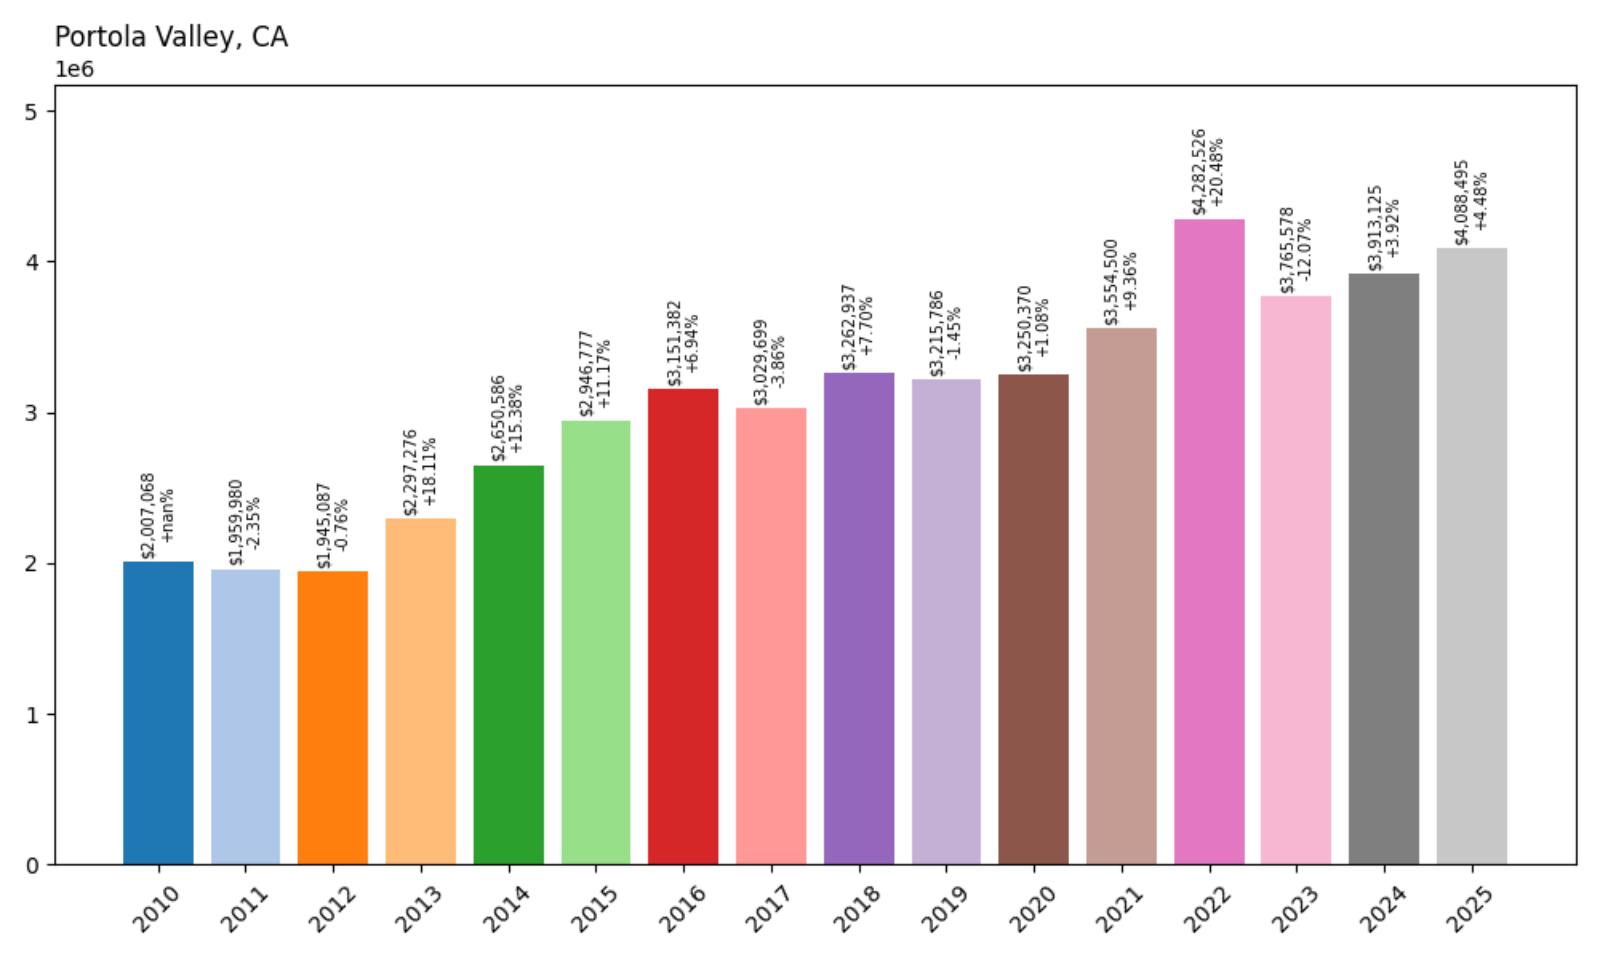
- 2010: $2,007,068
- 2011: $1,959,980 (−$47,088, −2.35% from previous year)
- 2012: $1,945,087 (−$14,892, −0.76% from previous year)
- 2013: $2,297,276 (+$352,188, +18.11% from previous year)
- 2014: $2,650,586 (+$353,311, +15.38% from previous year)
- 2015: $2,946,777 (+$296,190, +11.17% from previous year)
- 2016: $3,151,382 (+$204,605, +6.94% from previous year)
- 2017: $3,029,699 (−$121,682, −3.86% from previous year)
- 2018: $3,262,937 (+$233,238, +7.70% from previous year)
- 2019: $3,215,786 (−$47,151, −1.45% from previous year)
- 2020: $3,250,370 (+$34,584, +1.08% from previous year)
- 2021: $3,554,500 (+$304,130, +9.36% from previous year)
- 2022: $4,282,526 (+$728,026, +20.48% from previous year)
- 2023: $3,765,578 (−$516,947, −12.07% from previous year)
- 2024: $3,913,125 (+$147,547, +3.92% from previous year)
- 2025: $4,088,495 (+$175,370, +4.48% from previous year)
Portola Valley has experienced solid appreciation with home prices rising 104% from $2.01 million in 2010 to $4.09 million in 2025, though starting from an already elevated base. The exclusive Peninsula community saw particularly strong growth during 2013-2016 and again in 2022, when prices reached their peak above $4.2 million. Despite a significant correction in 2023, prices have recovered steadily, demonstrating the enduring appeal of this wooded Silicon Valley enclave.
Portola Valley – Peninsula Wilderness Luxury

Portola Valley offers a unique combination of wilderness tranquility and Silicon Valley proximity, featuring large wooded lots, extensive open space, and a commitment to preserving its natural environment. The town’s location in the Santa Cruz Mountains foothills provides residents with hiking trails, protected woodlands, and a rural atmosphere while maintaining convenient access to major tech companies. Many properties feature custom homes designed to blend with the natural landscape, private hiking trails, and panoramic views of the surrounding hills.
The steady price appreciation reflects the area’s appeal to affluent tech professionals who value privacy, natural beauty, and outdoor recreation. The 2022 price peak coincided with increased demand for large properties with extensive outdoor amenities during the pandemic, as remote work enabled more flexible living arrangements. The area’s proximity to both Stanford University and major tech companies has attracted buyers seeking a retreat-like atmosphere without sacrificing career opportunities.
Despite recent price adjustments, Portola Valley maintains its position as one of the Peninsula’s most exclusive communities for those seeking a wilderness lifestyle within Silicon Valley. The combination of natural beauty, privacy, and environmental preservation continues to attract affluent buyers despite broader market uncertainties. The town’s commitment to maintaining its rural character and extensive open space requirements ensure that housing supply remains severely limited, supporting continued premium pricing in this unique Silicon Valley sanctuary.
9. Monte Sereno – 165% Home Price Increase Since 2010

- 2010: $1,589,877
- 2011: $1,490,347 (−$99,530, −6.26% from previous year)
- 2012: $1,634,548 (+$144,201, +9.68% from previous year)
- 2013: $1,903,612 (+$269,064, +16.46% from previous year)
- 2014: $2,143,308 (+$239,695, +12.59% from previous year)
- 2015: $2,480,135 (+$336,828, +15.72% from previous year)
- 2016: $2,576,330 (+$96,195, +3.88% from previous year)
- 2017: $2,571,542 (−$4,788, −0.19% from previous year)
- 2018: $2,933,139 (+$361,597, +14.06% from previous year)
- 2019: $2,863,586 (−$69,553, −2.37% from previous year)
- 2020: $2,882,847 (+$19,261, +0.67% from previous year)
- 2021: $3,509,177 (+$626,330, +21.73% from previous year)
- 2022: $4,272,937 (+$763,760, +21.76% from previous year)
- 2023: $3,841,286 (−$431,651, −10.10% from previous year)
- 2024: $4,162,631 (+$321,345, +8.37% from previous year)
- 2025: $4,208,840 (+$46,209, +1.11% from previous year)
Monte Sereno has experienced substantial appreciation with home prices rising 165% from $1.59 million in 2010 to $4.21 million in 2025. The small Silicon Valley community saw particularly explosive growth during 2013-2015 and 2021-2022, with prices more than doubling over the 15-year period. Despite a significant correction in 2023, prices have rebounded strongly to reach new highs, demonstrating the enduring appeal of this exclusive Los Gatos hills enclave.
Monte Sereno – Los Gatos Hills Exclusive
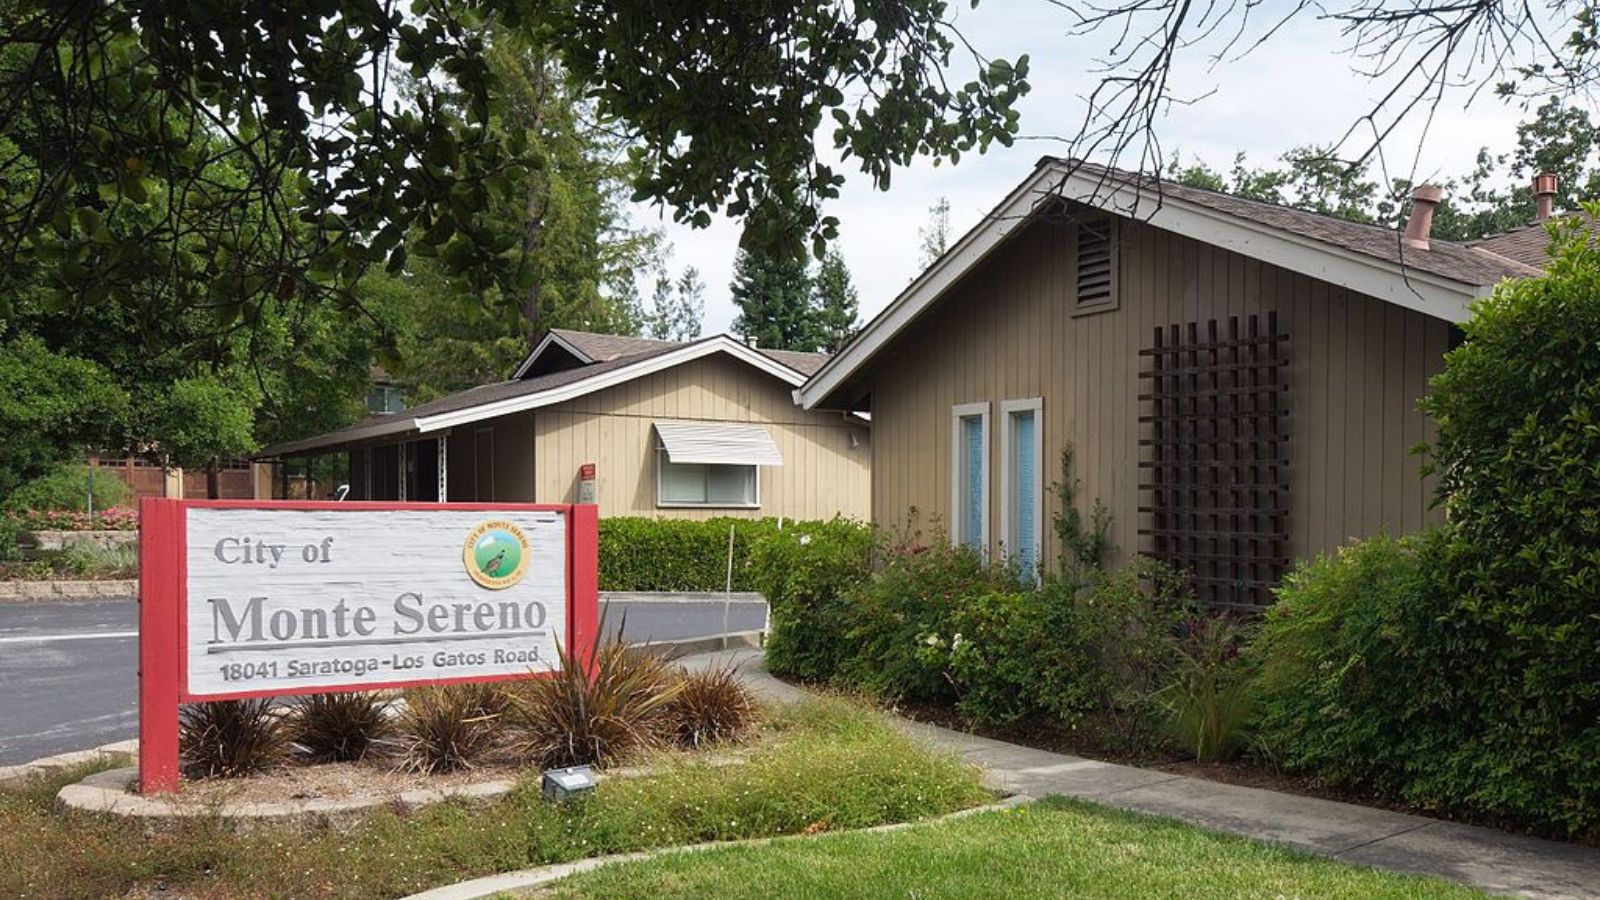
Monte Sereno represents one of Silicon Valley’s most exclusive small communities, featuring large custom estates nestled in the hills above Los Gatos with stunning views of the Santa Clara Valley. The city’s commitment to maintaining its residential character through large lot requirements and architectural standards has created a unique enclave where privacy and luxury intersect. Many properties feature custom homes designed by renowned architects, extensive landscaping, and panoramic views that showcase the natural beauty of the Santa Cruz Mountains foothills.
The dramatic price increases reflect the area’s appeal to tech industry executives and entrepreneurs who have achieved significant financial success and seek the ultimate in suburban luxury. The 2021-2022 surge coincided with the tech industry’s pandemic-era boom and increased demand for large properties with extensive outdoor space and privacy. The area’s proximity to major tech companies, combined with its small-town atmosphere and natural beauty, has attracted buyers seeking a prestigious address that reflects their professional achievements.
Despite recent volatility, Monte Sereno maintains its position as one of Silicon Valley’s most prestigious residential communities. The combination of natural beauty, exclusivity, and proximity to major tech employers continues to attract affluent buyers despite broader market uncertainties. The city’s commitment to preserving its exclusive character and limiting development ensures that housing supply remains extremely constrained, supporting continued premium pricing among successful tech professionals seeking the ultimate Silicon Valley lifestyle.
8. Rancho Santa Fe – 133% Home Price Increase Since 2010
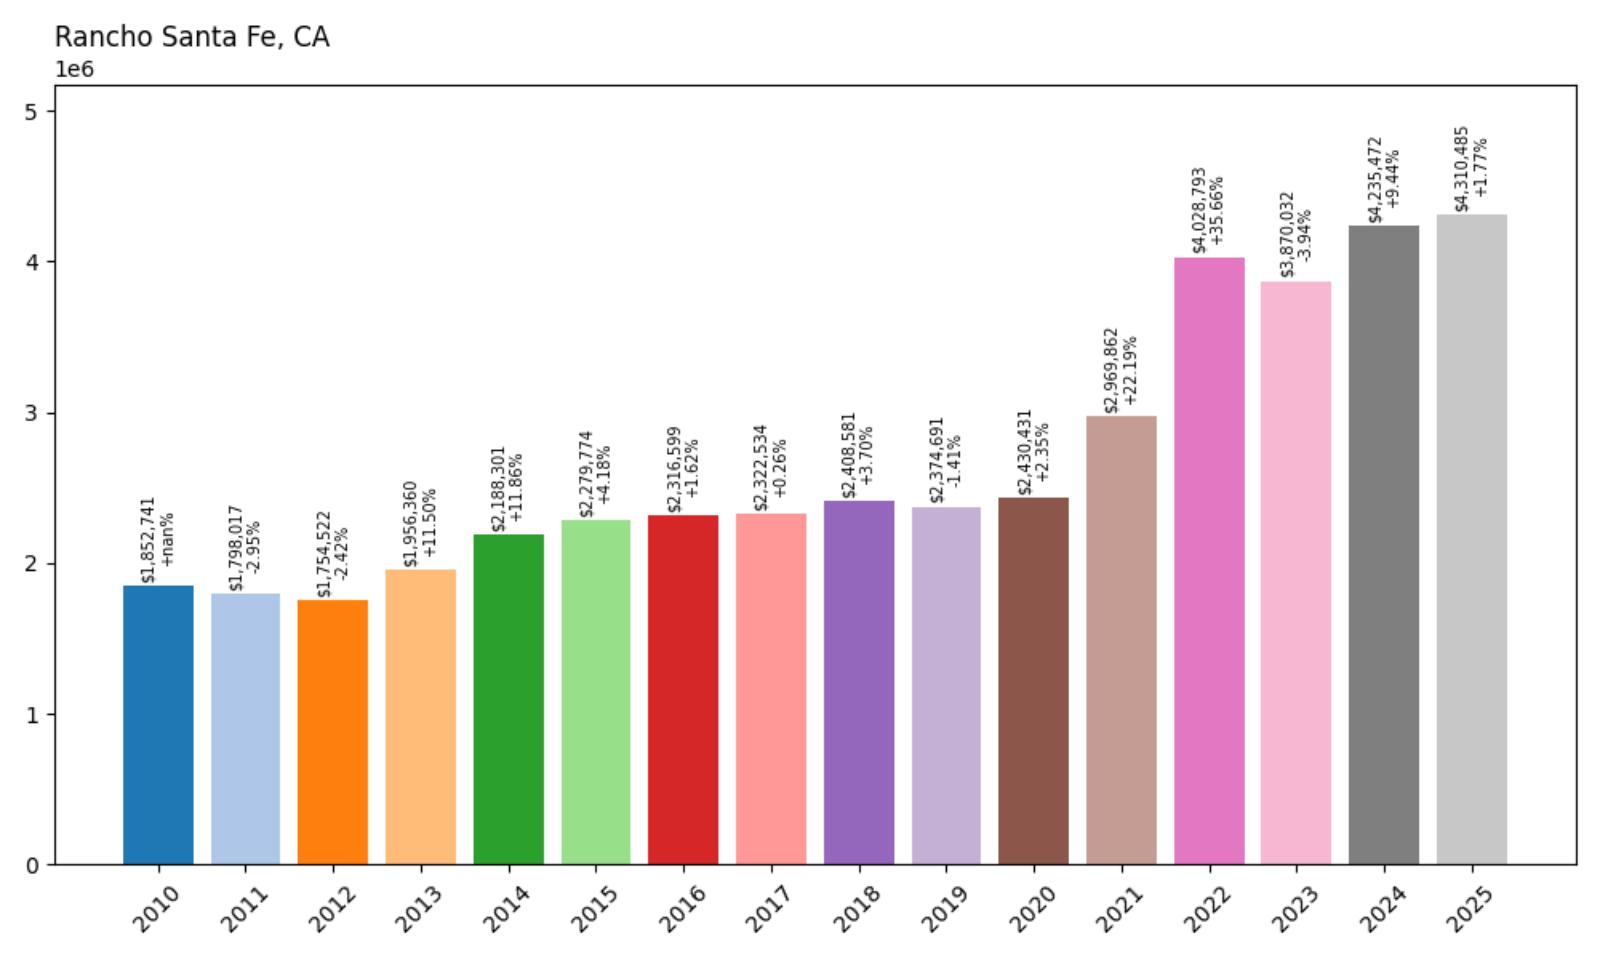
- 2010: $1,852,741
- 2011: $1,798,017 (−$54,725, −2.95% from previous year)
- 2012: $1,754,522 (−$43,494, −2.42% from previous year)
- 2013: $1,956,360 (+$201,838, +11.50% from previous year)
- 2014: $2,188,301 (+$231,941, +11.86% from previous year)
- 2015: $2,279,774 (+$91,472, +4.18% from previous year)
- 2016: $2,316,599 (+$36,826, +1.62% from previous year)
- 2017: $2,322,534 (+$5,935, +0.26% from previous year)
- 2018: $2,408,581 (+$86,047, +3.70% from previous year)
- 2019: $2,374,691 (−$33,890, −1.41% from previous year)
- 2020: $2,430,431 (+$55,740, +2.35% from previous year)
- 2021: $2,969,862 (+$539,431, +22.19% from previous year)
- 2022: $4,028,793 (+$1,058,931, +35.66% from previous year)
- 2023: $3,870,032 (−$158,761, −3.94% from previous year)
- 2024: $4,235,472 (+$365,440, +9.44% from previous year)
- 2025: $4,310,485 (+$75,013, +1.77% from previous year)
Rancho Santa Fe has experienced remarkable appreciation with home prices rising 133% from $1.85 million in 2010 to $4.31 million in 2025. The exclusive San Diego County community showed modest growth through most of the 2010s before exploding during 2021-2022, when prices surged over 60% in two years. Despite a brief correction in 2023, prices have continued to climb, reaching new highs and demonstrating the enduring appeal of this prestigious equestrian community.
Rancho Santa Fe – San Diego Equestrian Paradise

Rancho Santa Fe stands as one of Southern California’s most prestigious communities, featuring sprawling estates, world-class equestrian facilities, and a commitment to preserving its rural character within the San Diego metropolitan area. The community’s covenant-protected status ensures architectural consistency and maintains the area’s distinctive Spanish Colonial Revival character, while large lot sizes and horse-friendly zoning create a unique suburban environment. Many properties feature custom homes, private stables, and extensive grounds that reflect the area’s agricultural heritage and equestrian lifestyle.
The explosive price growth of 2021-2022 reflected the area’s appeal to affluent buyers seeking large properties with recreational amenities during the pandemic, as remote work enabled more flexible living arrangements. The community’s proximity to both San Diego and Los Angeles, combined with its resort-like atmosphere and recreational facilities, attracted buyers from the tech and entertainment industries. The area’s reputation for privacy and exclusivity has also made it popular among celebrities and business executives seeking a retreat from urban pressures.
Despite recent market adjustments, Rancho Santa Fe maintains its position as one of California’s most exclusive residential communities. The combination of natural beauty, equestrian amenities, and proximity to major employment centers continues to attract affluent buyers despite broader market uncertainties. The community’s covenant restrictions and commitment to preserving its rural character ensure that housing supply remains limited, supporting continued premium pricing in this unique Southern California enclave.
7. Los Altos – 208% Home Price Increase Since 2010
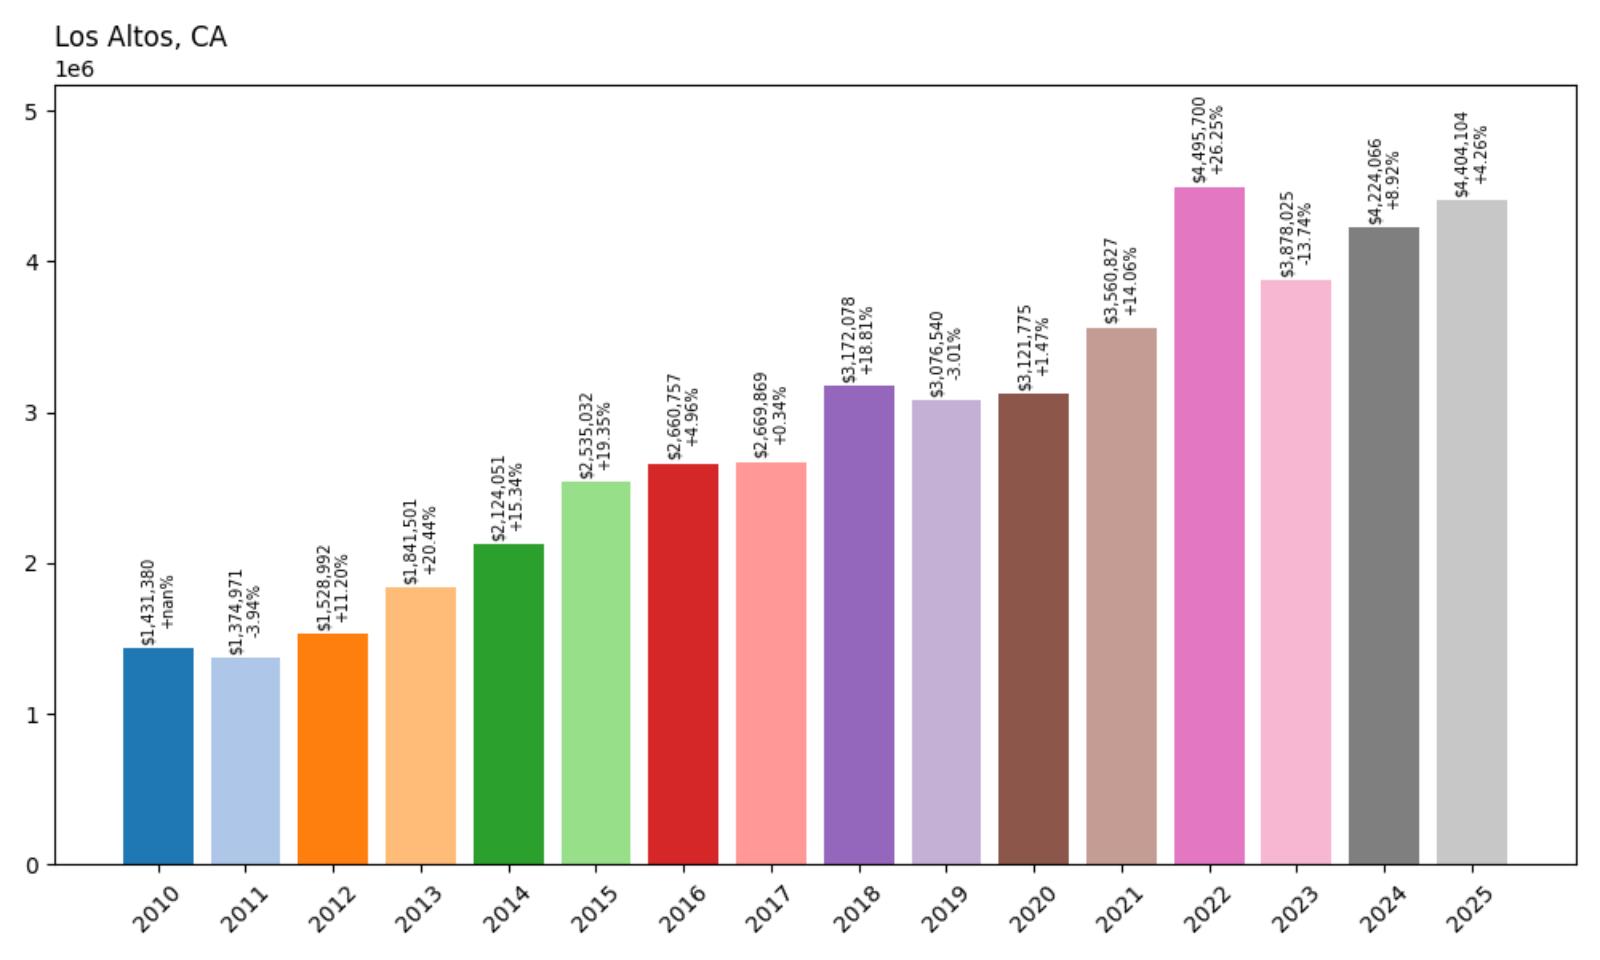
- 2010: $1,431,380
- 2011: $1,374,971 (−$56,409, −3.94% from previous year)
- 2012: $1,528,992 (+$154,021, +11.20% from previous year)
- 2013: $1,841,501 (+$312,509, +20.44% from previous year)
- 2014: $2,124,051 (+$282,550, +15.34% from previous year)
- 2015: $2,535,032 (+$410,981, +19.35% from previous year)
- 2016: $2,660,757 (+$125,724, +4.96% from previous year)
- 2017: $2,669,869 (+$9,112, +0.34% from previous year)
- 2018: $3,172,078 (+$502,209, +18.81% from previous year)
- 2019: $3,076,540 (−$95,538, −3.01% from previous year)
- 2020: $3,121,775 (+$45,235, +1.47% from previous year)
- 2021: $3,560,827 (+$439,051, +14.06% from previous year)
- 2022: $4,495,700 (+$934,873, +26.25% from previous year)
- 2023: $3,878,025 (−$617,675, −13.74% from previous year)
- 2024: $4,224,066 (+$346,041, +8.92% from previous year)
- 2025: $4,404,104 (+$180,038, +4.26% from previous year)
Los Altos has experienced extraordinary appreciation with home prices rising 208% from $1.43 million in 2010 to $4.40 million in 2025, more than tripling over the 15-year period. The Silicon Valley community saw particularly explosive growth during 2013-2015 and 2018, with another dramatic surge in 2022 when prices reached their peak above $4.5 million. Despite significant volatility including a 14% correction in 2023, prices have rebounded strongly, demonstrating the enduring appeal of this prestigious tech hub.
Los Altos – Silicon Valley’s Family Haven
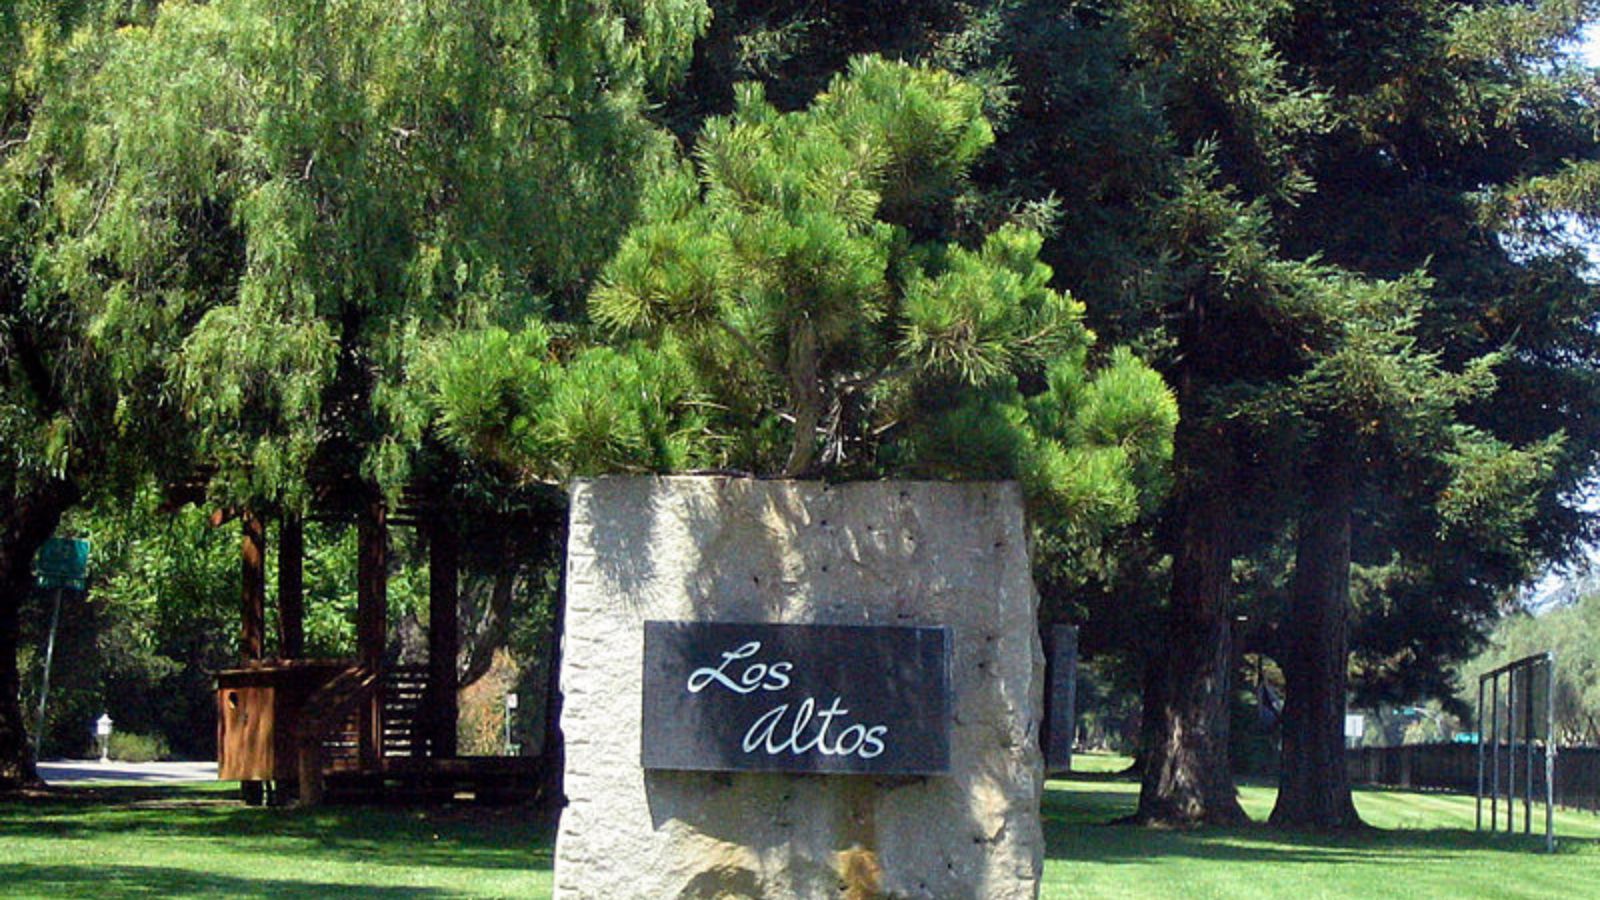
Los Altos represents the epitome of Silicon Valley suburban living, combining excellent schools, tree-lined streets, and proximity to major tech companies in a family-friendly environment. The city’s commitment to maintaining its residential character through strict zoning and architectural standards has created a unique community where tech industry families can enjoy a high-quality suburban lifestyle. Many properties feature custom homes on large lots, mature landscaping, and easy access to both downtown Los Altos’ charming commercial district and major employment centers.
The dramatic price increases reflect the area’s appeal to highly compensated tech professionals who prioritize educational quality and community amenities for their families. Los Altos’ excellent schools consistently rank among California’s best, attracting families willing to pay extraordinary premiums for educational excellence. The 2022 surge coincided with the tech industry’s pandemic-era boom and increased demand for suburban properties with space for home offices and outdoor activities.
Despite recent volatility, Los Altos maintains its position as one of Silicon Valley’s premier family communities. The combination of educational excellence, suburban charm, and proximity to major tech employers continues to attract affluent buyers despite broader market uncertainties. The city’s commitment to preserving its character and limiting high-density development ensures that housing supply remains constrained, supporting continued premium pricing among tech industry professionals seeking the ultimate suburban Silicon Valley lifestyle.
6. Belvedere – 92% Home Price Increase Since 2010
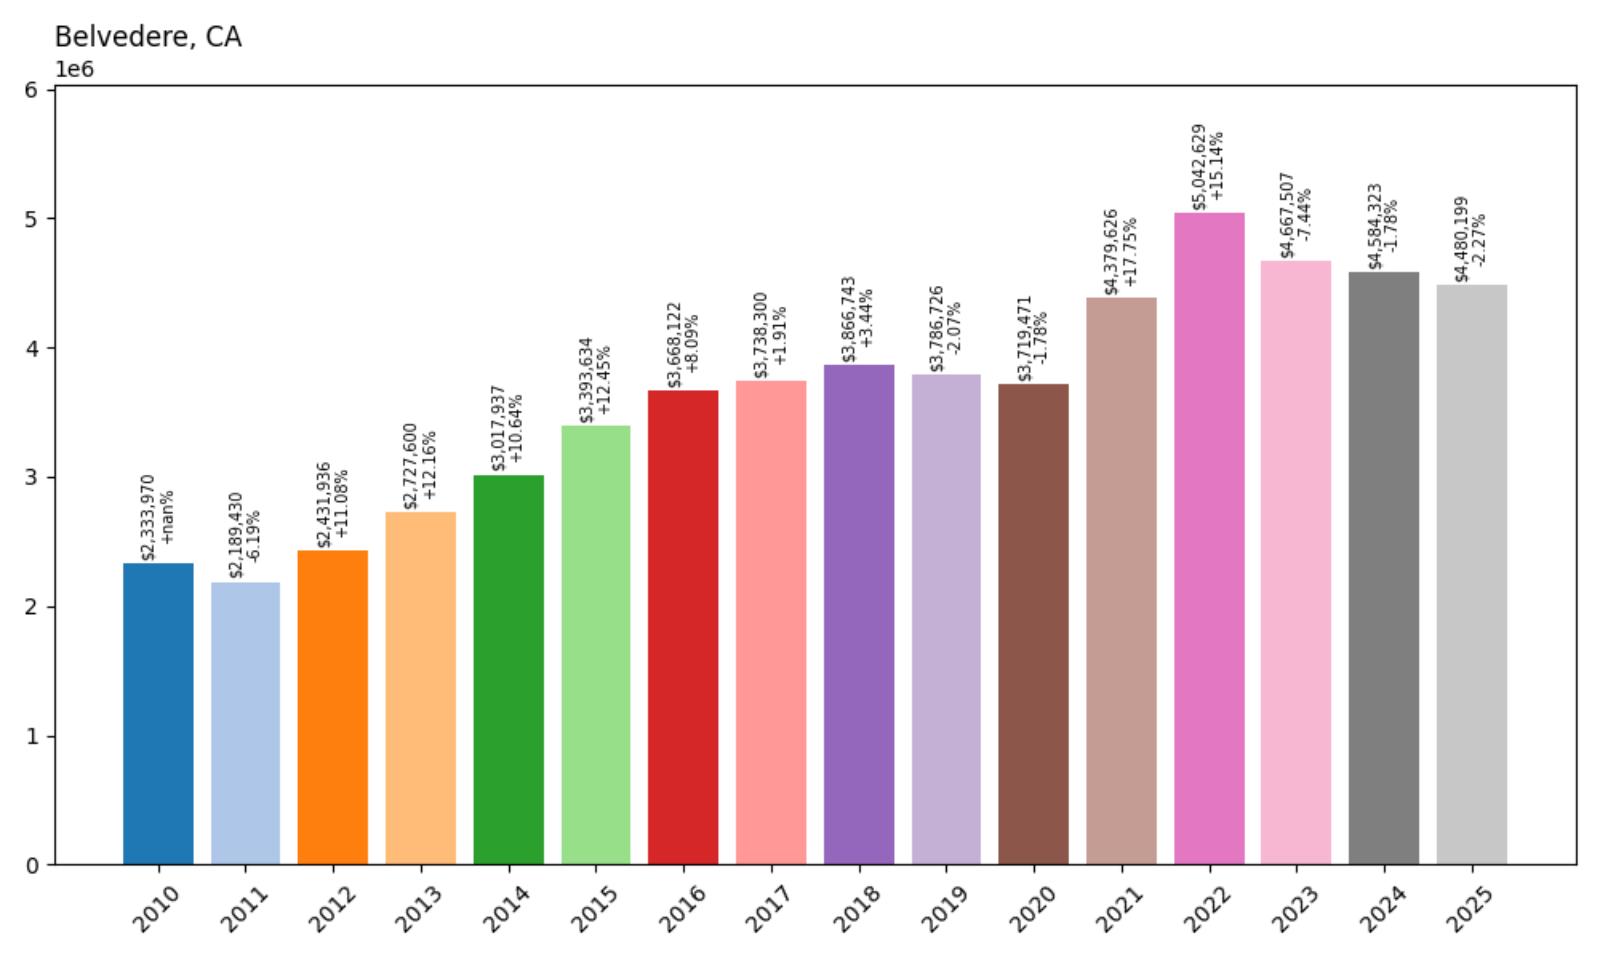
- 2010: $2,333,970
- 2011: $2,189,430 (−$144,539, −6.19% from previous year)
- 2012: $2,431,936 (+$242,506, +11.08% from previous year)
- 2013: $2,727,600 (+$295,664, +12.16% from previous year)
- 2014: $3,017,937 (+$290,337, +10.64% from previous year)
- 2015: $3,393,634 (+$375,697, +12.45% from previous year)
- 2016: $3,668,122 (+$274,488, +8.09% from previous year)
- 2017: $3,738,300 (+$70,178, +1.91% from previous year)
- 2018: $3,866,743 (+$128,443, +3.44% from previous year)
- 2019: $3,786,726 (−$80,017, −2.07% from previous year)
- 2020: $3,719,471 (−$67,255, −1.78% from previous year)
- 2021: $4,379,626 (+$660,155, +17.75% from previous year)
- 2022: $5,042,629 (+$663,003, +15.14% from previous year)
- 2023: $4,667,507 (−$375,122, −7.44% from previous year)
- 2024: $4,584,323 (−$83,184, −1.78% from previous year)
- 2025: $4,480,199 (−$104,125, −2.27% from previous year)
Belvedere has experienced substantial appreciation with home prices rising 92% from $2.33 million in 2010 to $4.48 million in 2025, though starting from an already elevated base. The exclusive Marin County island community saw steady growth through the 2010s, reaching a peak above $5 million in 2022 before experiencing corrections in recent years. Despite recent declines, prices remain nearly double their 2010 levels in this ultra-exclusive waterfront enclave.
Belvedere – Marin’s Private Island Paradise
Belvedere represents one of the most exclusive residential locations in the Bay Area, occupying a private island in Marin County with stunning panoramic views of San Francisco Bay, the Golden Gate Bridge, and the San Francisco skyline. The community’s unique geography creates an almost resort-like atmosphere, with waterfront homes, private beaches, and yacht clubs that attract affluent professionals seeking the ultimate in waterfront luxury. Many properties feature custom homes designed to maximize water views, private docks, and access to exclusive recreational facilities.
The steady price appreciation through the 2010s reflected the area’s consistent appeal to tech executives, finance professionals, and other high-net-worth individuals who value privacy and water access. The 2021-2022 surge coincided with pandemic-era demand for properties with extensive outdoor space and water amenities, as remote work enabled more flexible living arrangements. The community’s proximity to San Francisco via the Golden Gate Bridge has made it particularly attractive to professionals who work in the city but prefer a more secluded residential environment.
Despite recent price corrections, Belvedere maintains its position as one of the Bay Area’s most prestigious residential communities. The combination of waterfront luxury, privacy, and proximity to San Francisco continues to attract affluent buyers despite broader market uncertainties. The community’s limited land area and restrictive development policies ensure that housing supply remains extremely constrained, supporting continued premium pricing in this unique island paradise.
5. Hidden Hills – 190% Home Price Increase Since 2010
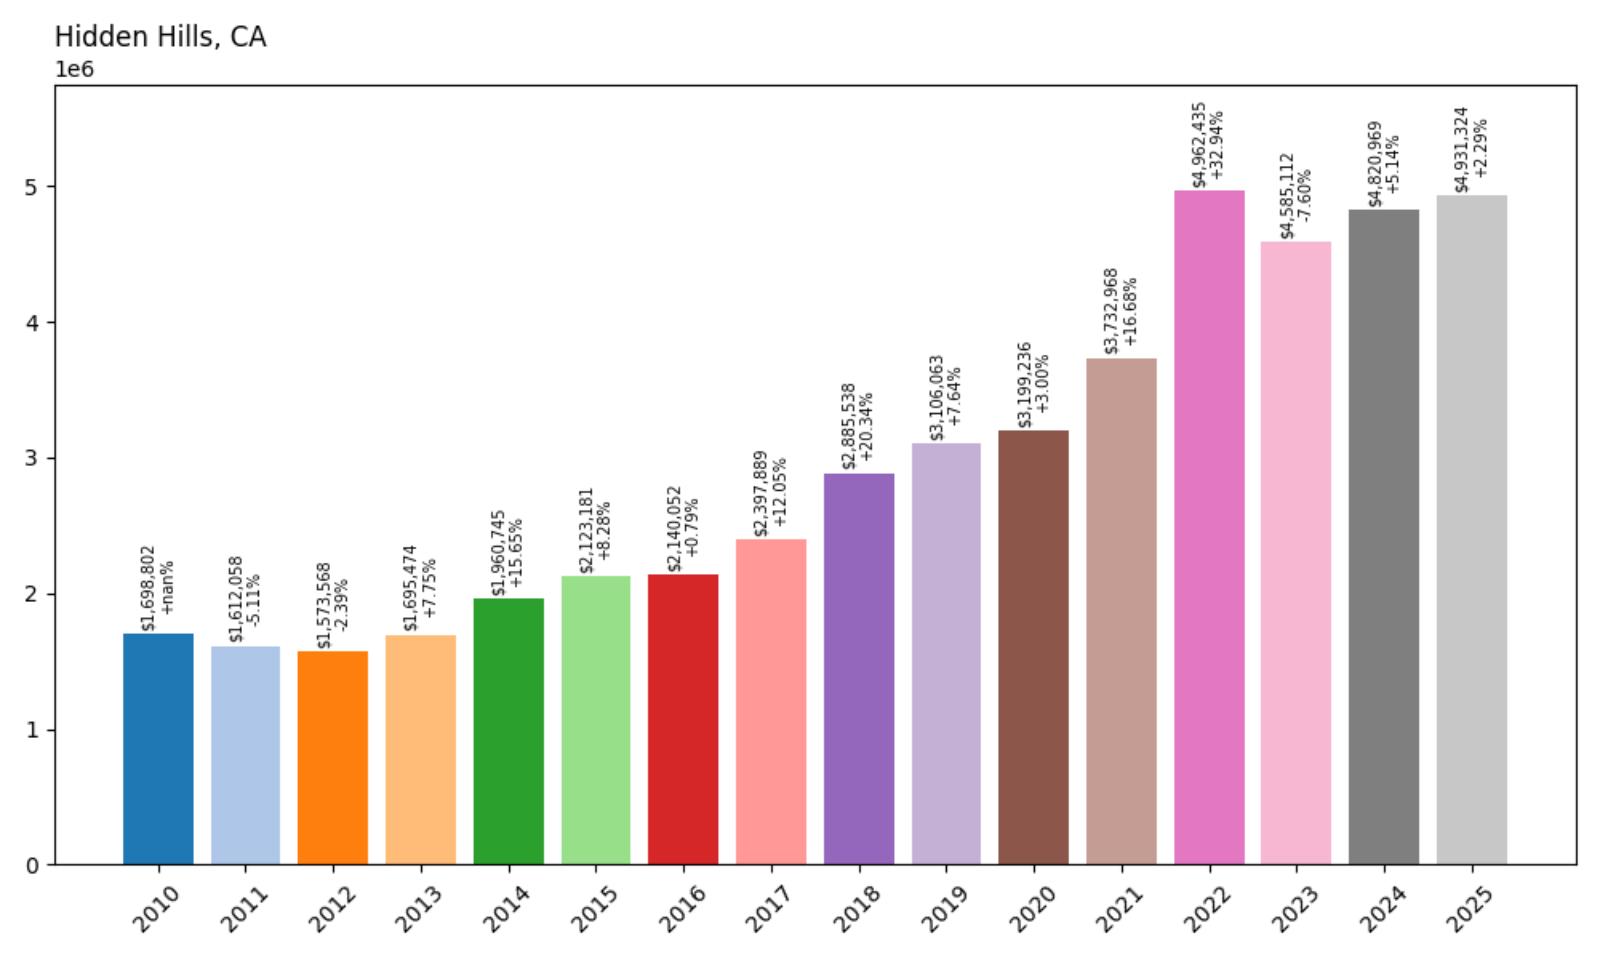
- 2010: $1,698,802
- 2011: $1,612,058 (−$86,744, −5.11% from previous year)
- 2012: $1,573,568 (−$38,490, −2.39% from previous year)
- 2013: $1,695,474 (+$121,906, +7.75% from previous year)
- 2014: $1,960,745 (+$265,271, +15.65% from previous year)
- 2015: $2,123,181 (+$162,436, +8.28% from previous year)
- 2016: $2,140,052 (+$16,871, +0.79% from previous year)
- 2017: $2,397,889 (+$257,837, +12.05% from previous year)
- 2018: $2,885,538 (+$487,649, +20.34% from previous year)
- 2019: $3,106,063 (+$220,525, +7.64% from previous year)
- 2020: $3,199,236 (+$93,172, +3.00% from previous year)
- 2021: $3,732,968 (+$533,733, +16.68% from previous year)
- 2022: $4,962,435 (+$1,229,466, +32.94% from previous year)
- 2023: $4,585,112 (−$377,323, −7.60% from previous year)
- 2024: $4,820,969 (+$235,857, +5.14% from previous year)
- 2025: $4,931,324 (+$110,355, +2.29% from previous year)
Hidden Hills has experienced extraordinary appreciation with home prices rising 190% from $1.70 million in 2010 to $4.93 million in 2025, nearly tripling over the 15-year period. The exclusive gated community saw particularly dramatic growth during 2018-2019 and 2021-2022, with the most explosive single-year increase occurring in 2022 when prices surged 33%. Despite a correction in 2023, prices have continued climbing to reach new highs, demonstrating the enduring appeal of this celebrity-favored enclave.
Hidden Hills – Celebrity Gated Paradise

Hidden Hills represents the ultimate in celebrity lifestyle living, featuring a gated community in the Santa Monica Mountains where privacy, luxury, and exclusivity converge. The city’s commitment to maintaining its rural character through large lot requirements and equestrian zoning has created a unique suburban environment where celebrities and entertainment industry executives can enjoy mansion-sized homes with horse facilities and extensive grounds. Many properties feature custom estates, private stables, and the kind of security and privacy that high-profile residents demand.
The dramatic price increases reflect the area’s appeal to entertainment industry professionals and other high-net-worth individuals who value privacy and space. The 2022 surge coincided with increased celebrity interest in the area and pandemic-era demand for large properties with extensive outdoor amenities. The community’s proximity to Hollywood and major entertainment centers, combined with its gated security and rural atmosphere, has made it particularly attractive to celebrities seeking alternatives to traditional luxury neighborhoods.
Despite recent market adjustments, Hidden Hills maintains its position as one of the most exclusive residential communities in Los Angeles County. The combination of celebrity culture, gated security, and equestrian amenities continues to attract affluent buyers despite broader market uncertainties. The community’s strict zoning requirements and commitment to preserving its rural character ensure that housing supply remains severely limited, supporting continued premium pricing among entertainment industry professionals and other high-net-worth individuals seeking the ultimate in private luxury living.
4. Hillsborough – 142% Home Price Increase Since 2010
- 2010: $2,113,499
- 2011: $2,022,213 (−$91,286, −4.32% from previous year)
- 2012: $2,440,624 (+$418,411, +20.69% from previous year)
- 2013: $2,966,385 (+$525,761, +21.54% from previous year)
- 2014: $3,325,019 (+$358,634, +12.09% from previous year)
- 2015: $3,768,292 (+$443,273, +13.33% from previous year)
- 2016: $4,019,441 (+$251,150, +6.66% from previous year)
- 2017: $4,019,553 (+$111, +0.00% from previous year)
- 2018: $4,315,450 (+$295,897, +7.36% from previous year)
- 2019: $4,131,341 (−$184,108, −4.27% from previous year)
- 2020: $4,316,672 (+$185,330, +4.49% from previous year)
- 2021: $4,885,857 (+$569,185, +13.19% from previous year)
- 2022: $5,748,984 (+$863,127, +17.67% from previous year)
- 2023: $5,130,104 (−$618,880, −10.77% from previous year)
- 2024: $5,085,726 (−$44,378, −0.87% from previous year)
- 2025: $5,118,161 (+$32,434, +0.64% from previous year)
Hillsborough has experienced substantial appreciation with home prices rising 142% from $2.11 million in 2010 to $5.12 million in 2025, though starting from an already elevated base. The exclusive Peninsula community saw particularly strong growth during 2012-2016 and again in 2021-2022, reaching a peak above $5.7 million before experiencing some correction. Despite recent adjustments, prices remain well above $5 million, demonstrating the enduring appeal of this prestigious Silicon Valley enclave.
Hillsborough – Peninsula’s Crown Jewel
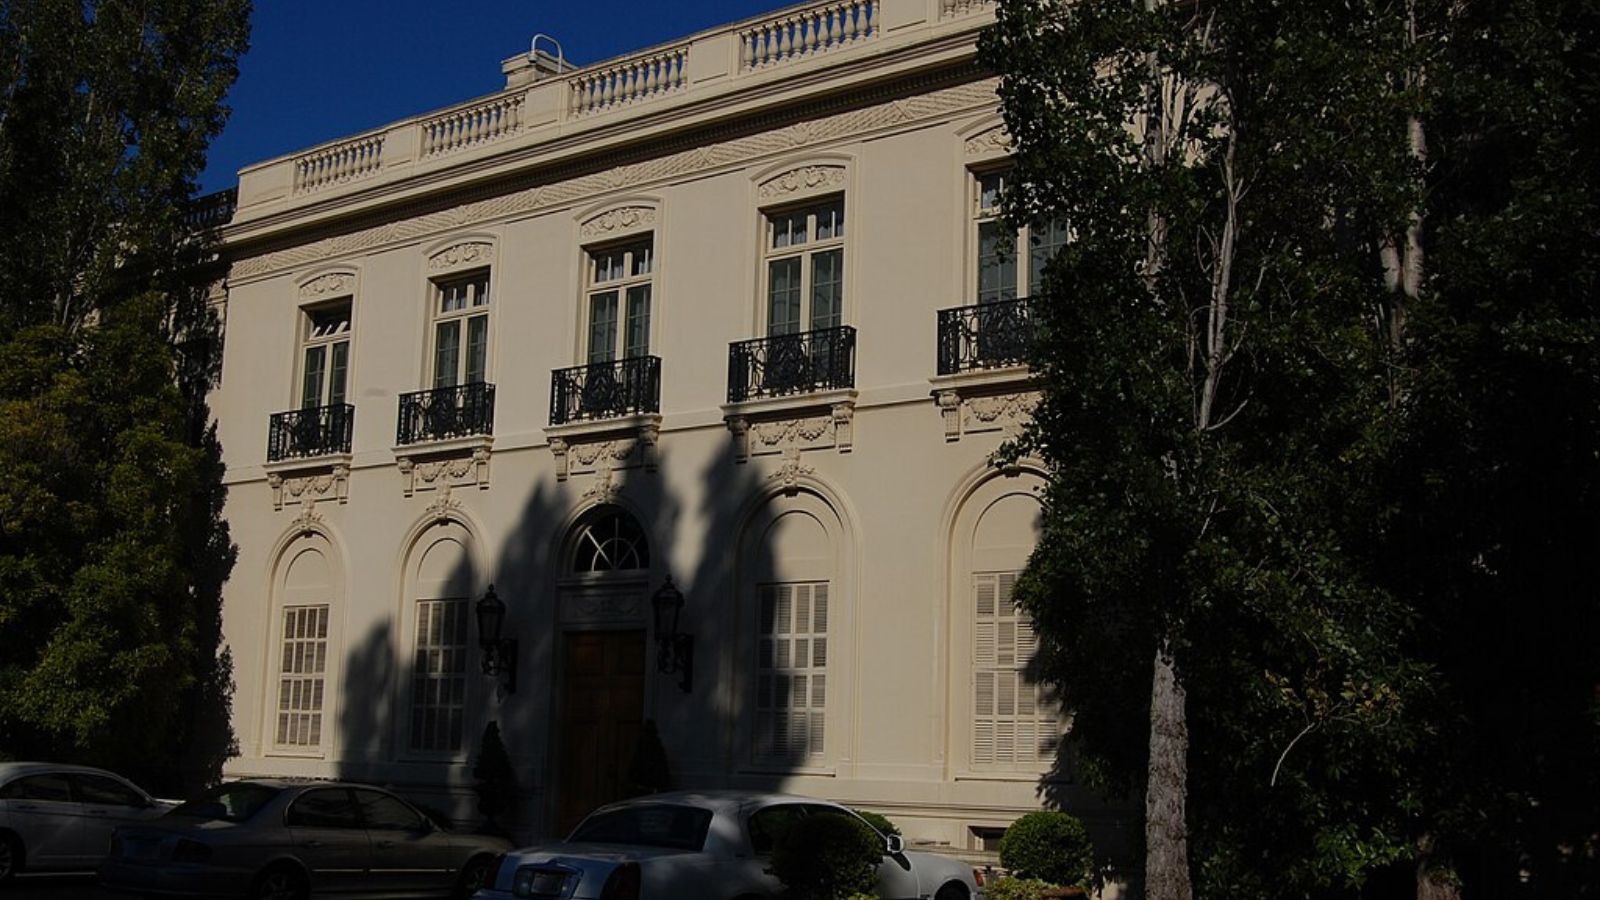
Hillsborough stands as one of the Peninsula’s most prestigious residential communities, featuring sprawling estates on large lots with a commitment to preserving its exclusive suburban character. The town’s location between San Francisco and Silicon Valley, combined with its excellent schools and family-friendly atmosphere, has made it a magnet for tech executives, venture capitalists, and other affluent professionals seeking the ultimate in suburban luxury. Many properties feature custom mansions, extensive landscaping, and the kind of privacy and space that reflects the area’s concentration of wealth.
The steady price appreciation reflects the area’s consistent appeal to highly successful professionals who prioritize educational quality, privacy, and prestige. The 2021-2022 surge coincided with the tech industry’s pandemic-era boom and increased demand for large properties with extensive grounds and home office space. The area’s proximity to both Stanford University and major tech companies has attracted buyers who value educational excellence and professional networking opportunities.
Despite recent price adjustments, Hillsborough maintains its position as one of the Bay Area’s most exclusive residential communities. The combination of educational excellence, suburban luxury, and proximity to major employment centers continues to attract affluent buyers despite broader market uncertainties. The town’s commitment to preserving its exclusive character through large lot requirements and architectural standards ensures that housing supply remains extremely limited, supporting continued premium pricing among Silicon Valley’s most successful professionals.
3. Montecito – 136% Home Price Increase Since 2010
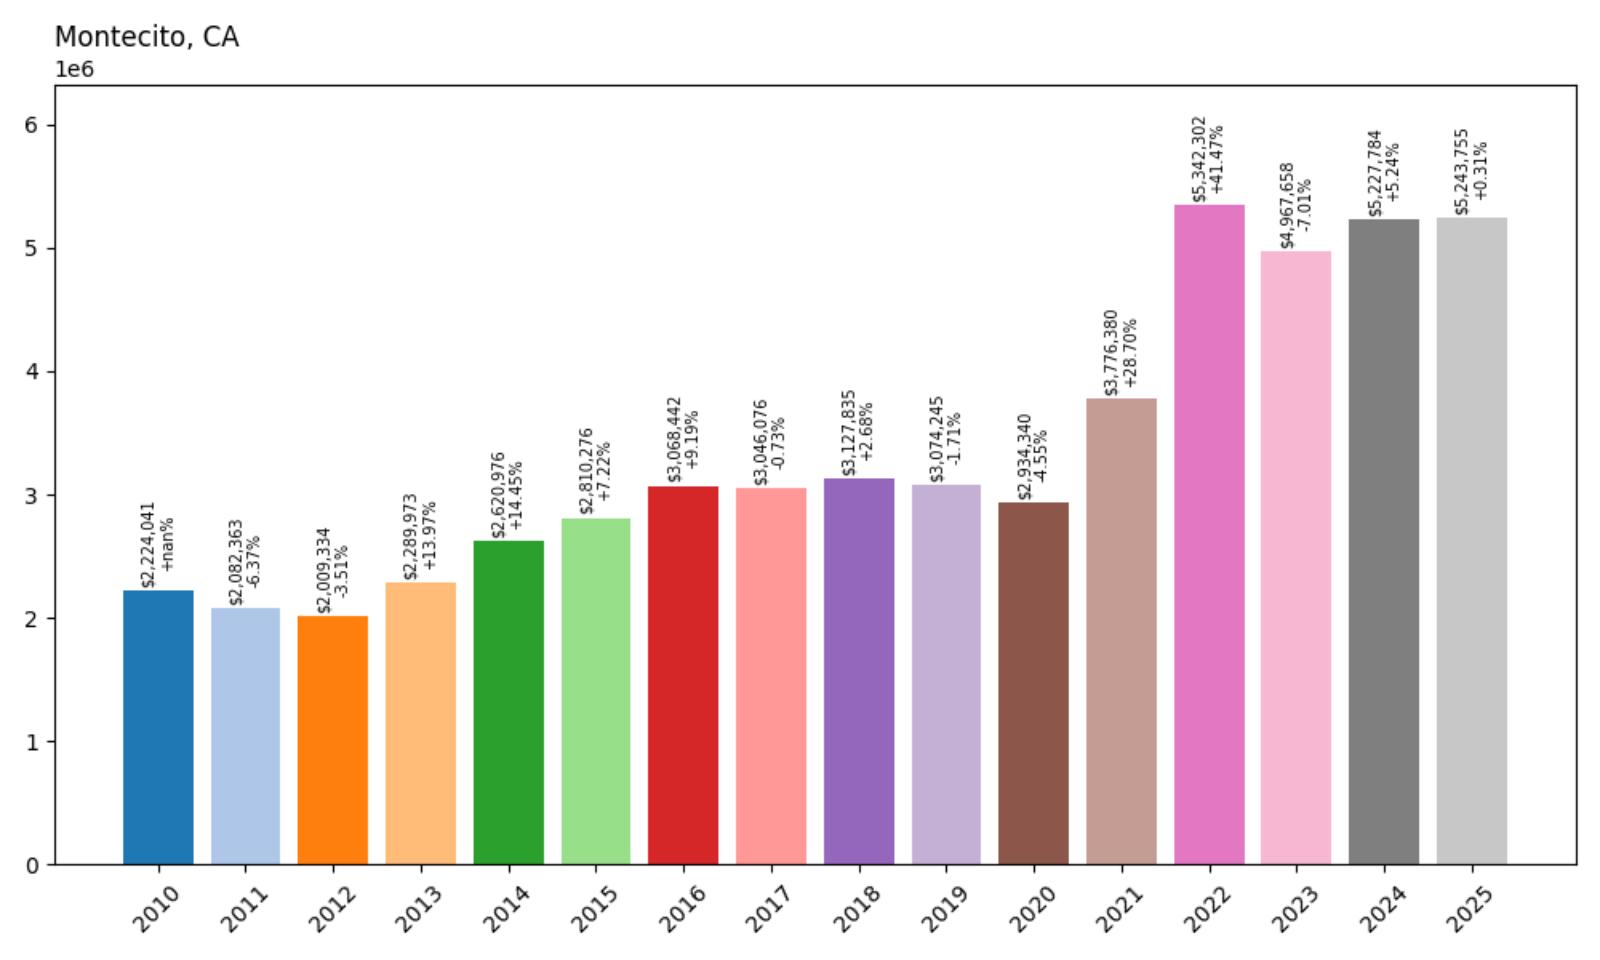
- 2010: $2,224,041
- 2011: $2,082,363 (−$141,678, −6.37% from previous year)
- 2012: $2,009,334 (−$73,029, −3.51% from previous year)
- 2013: $2,289,973 (+$280,639, +13.97% from previous year)
- 2014: $2,620,976 (+$331,004, +14.45% from previous year)
- 2015: $2,810,276 (+$189,299, +7.22% from previous year)
- 2016: $3,068,442 (+$258,167, +9.19% from previous year)
- 2017: $3,046,076 (−$22,367, −0.73% from previous year)
- 2018: $3,127,835 (+$81,759, +2.68% from previous year)
- 2019: $3,074,245 (−$53,589, −1.71% from previous year)
- 2020: $2,934,340 (−$139,905, −4.55% from previous year)
- 2021: $3,776,380 (+$842,041, +28.70% from previous year)
- 2022: $5,342,302 (+$1,565,922, +41.47% from previous year)
- 2023: $4,967,658 (−$374,644, −7.01% from previous year)
- 2024: $5,227,784 (+$260,126, +5.24% from previous year)
- 2025: $5,243,755 (+$15,972, +0.31% from previous year)
Montecito has experienced remarkable appreciation with home prices rising 136% from $2.22 million in 2010 to $5.24 million in 2025. The exclusive Santa Barbara County community showed modest growth through most of the 2010s before exploding during 2021-2022, when prices surged over 70% in two years, including a stunning 41% increase in 2022 alone. Despite a correction in 2023, prices have stabilized above $5 million, demonstrating the enduring appeal of this celebrity-favored coastal enclave.
Montecito – Santa Barbara’s Royal Retreat

Montecito represents the pinnacle of Southern California coastal luxury, featuring sprawling estates nestled between the Santa Ynez Mountains and the Pacific Ocean just outside Santa Barbara. The unincorporated community has long been a favorite retreat for celebrities, royalty, and business moguls, with its Mediterranean climate, stunning natural beauty, and commitment to preserving its exclusive character. Many properties feature custom mansions on multi-acre lots, private gardens, and the kind of privacy and luxury that attracts the world’s most affluent residents.
The explosive price growth of 2021-2022 reflected the area’s appeal to ultra-high-net-worth individuals seeking large coastal properties during the pandemic, as remote work enabled more flexible living arrangements. The community’s association with celebrities like Oprah Winfrey and Prince Harry and Meghan Markle has enhanced its global prestige, while its proximity to both Los Angeles and San Francisco has made it attractive to tech and entertainment industry executives. The area’s reputation for privacy and exclusivity has also drawn international buyers seeking prestigious American real estate.
Despite recent market adjustments, Montecito maintains its position as one of the world’s most exclusive residential communities. The combination of natural beauty, celebrity culture, and proximity to major metropolitan areas continues to attract ultra-affluent buyers despite broader market uncertainties. The community’s commitment to preserving its exclusive character and environmental restrictions ensure that housing supply remains severely limited, supporting continued premium pricing in this unique coastal paradise.
2. Los Altos Hills – 132% Home Price Increase Since 2010
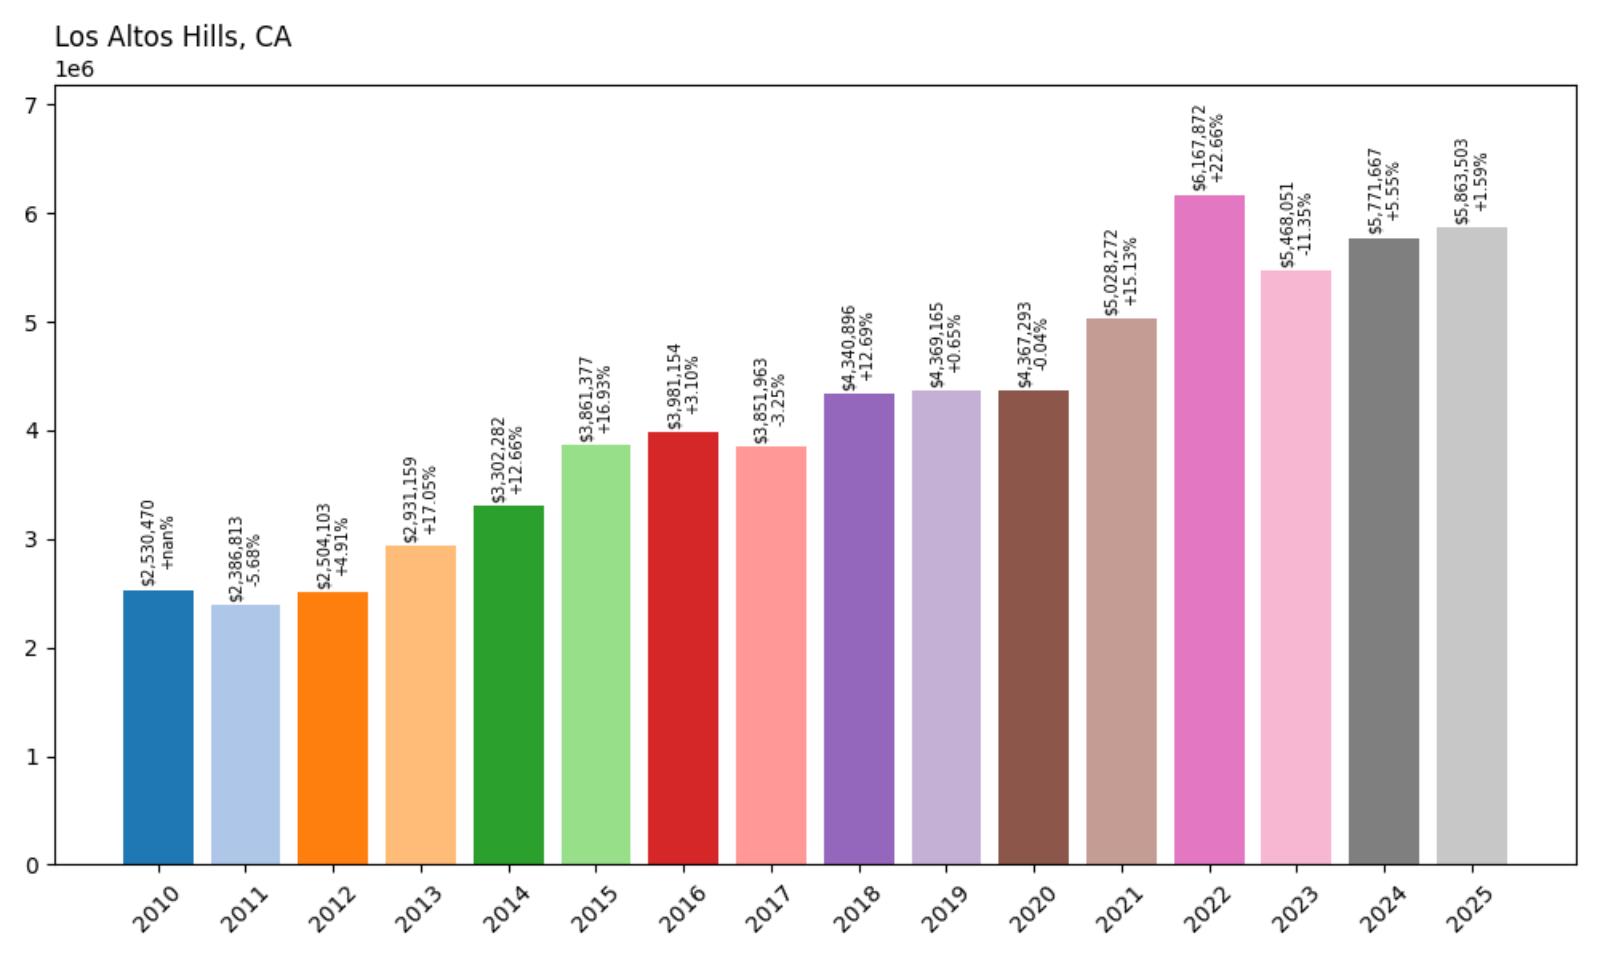
- 2010: $2,530,470
- 2011: $2,386,813 (−$143,657, −5.68% from previous year)
- 2012: $2,504,103 (+$117,291, +4.91% from previous year)
- 2013: $2,931,159 (+$427,056, +17.05% from previous year)
- 2014: $3,302,282 (+$371,123, +12.66% from previous year)
- 2015: $3,861,377 (+$559,095, +16.93% from previous year)
- 2016: $3,981,154 (+$119,777, +3.10% from previous year)
- 2017: $3,851,963 (−$129,191, −3.25% from previous year)
- 2018: $4,340,896 (+$488,933, +12.69% from previous year)
- 2019: $4,369,165 (+$28,268, +0.65% from previous year)
- 2020: $4,367,293 (−$1,871, −0.04% from previous year)
- 2021: $5,028,272 (+$660,979, +15.13% from previous year)
- 2022: $6,167,872 (+$1,139,600, +22.66% from previous year)
- 2023: $5,468,051 (−$699,821, −11.35% from previous year)
- 2024: $5,771,667 (+$303,616, +5.55% from previous year)
- 2025: $5,863,503 (+$91,836, +1.59% from previous year)
Los Altos Hills has experienced substantial appreciation with home prices rising 132% from $2.53 million in 2010 to $5.86 million in 2025, though starting from an already elevated base. The exclusive Silicon Valley hills community saw particularly strong growth during 2013-2015 and 2021-2022, reaching a peak above $6.1 million before experiencing some correction. Despite recent adjustments, prices remain well above historical levels, demonstrating the enduring appeal of this ultra-exclusive tech hub enclave.
Los Altos Hills – Silicon Valley’s Ultimate Sanctuary

Los Altos Hills represents the absolute pinnacle of Silicon Valley residential luxury, featuring sprawling estates on large lots with stunning views of the Santa Clara Valley and San Francisco Bay. The town’s commitment to preserving its rural character through minimum lot sizes and architectural standards has created a unique suburban environment where tech industry titans can enjoy mansion-sized homes with extensive grounds and privacy. Many properties feature custom estates designed by renowned architects, private vineyards, and the kind of space and luxury that reflects the area’s concentration of extraordinary wealth.
The steady price appreciation reflects the area’s appeal to the most successful tech entrepreneurs and executives who have achieved extraordinary financial success. The 2021-2022 surge coincided with the tech industry’s pandemic-era boom and increased demand for large properties with extensive outdoor space and home office facilities. The area’s proximity to major tech companies, combined with its natural beauty and privacy, has attracted buyers who represent the pinnacle of Silicon Valley success.
Despite recent price adjustments, Los Altos Hills maintains its position as one of the most exclusive residential communities in the United States. The combination of natural beauty, ultimate privacy, and proximity to the world’s most valuable technology companies continues to attract ultra-affluent buyers despite broader market uncertainties. The town’s commitment to preserving its exclusive character and environmental restrictions ensure that housing supply remains extremely limited, supporting continued premium pricing among Silicon Valley’s most successful entrepreneurs and executives.
1. Atherton – 147% Home Price Increase Since 2010

- 2010: $3,048,211
- 2011: $2,963,099 (−$85,112, −2.79% from previous year)
- 2012: $3,176,768 (+$213,669, +7.21% from previous year)
- 2013: $3,869,591 (+$692,823, +21.81% from previous year)
- 2014: $4,406,455 (+$536,864, +13.87% from previous year)
- 2015: $5,090,323 (+$683,868, +15.52% from previous year)
- 2016: $5,567,949 (+$477,626, +9.38% from previous year)
- 2017: $5,609,280 (+$41,331, +0.74% from previous year)
- 2018: $6,098,328 (+$489,048, +8.72% from previous year)
- 2019: $5,794,080 (−$304,248, −4.99% from previous year)
- 2020: $6,146,025 (+$351,945, +6.07% from previous year)
- 2021: $6,908,784 (+$762,759, +12.41% from previous year)
- 2022: $8,225,993 (+$1,317,209, +19.07% from previous year)
- 2023: $7,407,294 (−$818,699, −9.95% from previous year)
- 2024: $7,384,364 (−$22,930, −0.31% from previous year)
- 2025: $7,532,795 (+$148,431, +2.01% from previous year)
Atherton stands as California’s most expensive town, with home prices rising 147% from $3.05 million in 2010 to $7.53 million in 2025. The ultra-exclusive Silicon Valley community saw remarkable growth throughout the 2010s, reaching extraordinary heights during 2021-2022 when prices peaked above $8.2 million. Despite recent corrections, median home prices remain above $7.5 million, cementing Atherton’s position as the pinnacle of American residential real estate and the ultimate symbol of Silicon Valley wealth.
Atherton – America’s Most Expensive Town
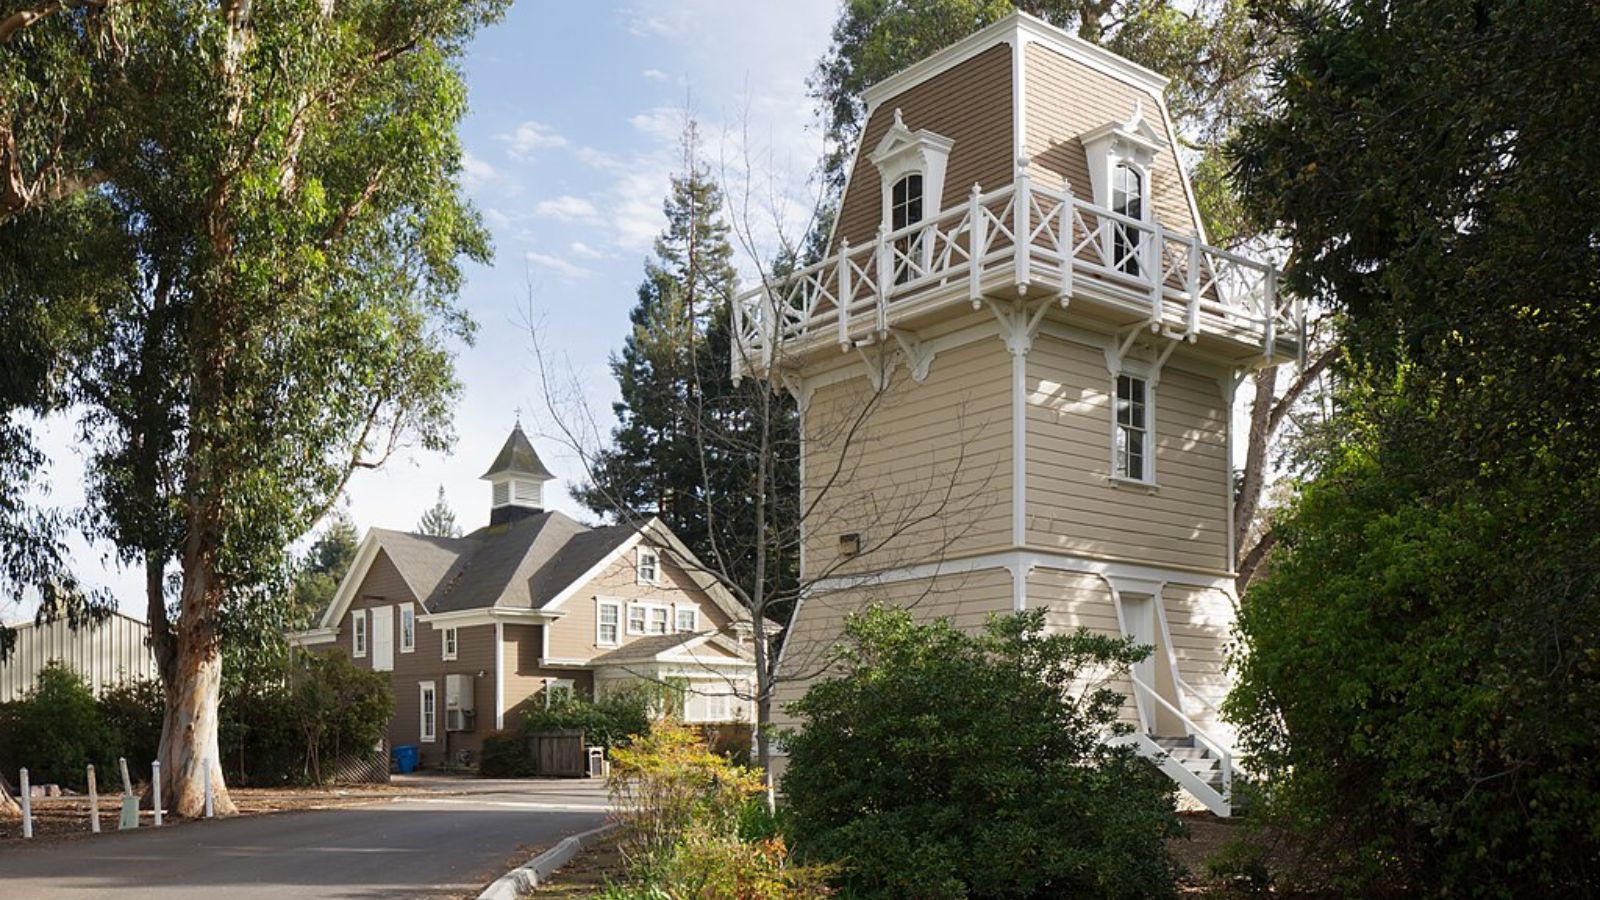
Atherton represents the absolute summit of American residential luxury, consistently ranking as the most expensive town in the United States with median home prices exceeding $7.5 million. Located in the heart of Silicon Valley, this exclusive enclave features sprawling estates on large lots with a commitment to preserving its suburban character through strict zoning and architectural standards. The town’s tree-lined streets, custom mansions, and proximity to the world’s most valuable technology companies have made it the ultimate destination for tech industry titans, venture capitalists, and other ultra-high-net-worth individuals.
The extraordinary price levels reflect the area’s appeal to the most successful entrepreneurs and executives in the global technology industry. Atherton’s residents include founders and leaders of major tech companies who have achieved unprecedented wealth through Silicon Valley’s innovation economy. The 2022 price peak above $8.2 million coincided with the tech industry’s pandemic-era boom and represented the highest residential prices ever recorded in American real estate history.
Despite recent market adjustments, Atherton maintains its position as the most exclusive residential community in the United States. The combination of ultimate luxury, proximity to the world’s most valuable companies, and strict preservation of its exclusive character continues to attract the world’s most affluent buyers. The town’s commitment to maintaining its ultra-exclusive status through large lot requirements and architectural controls ensures that housing supply remains extremely limited, supporting continued record-breaking pricing in America’s most expensive residential market.


