Would you like to save this?
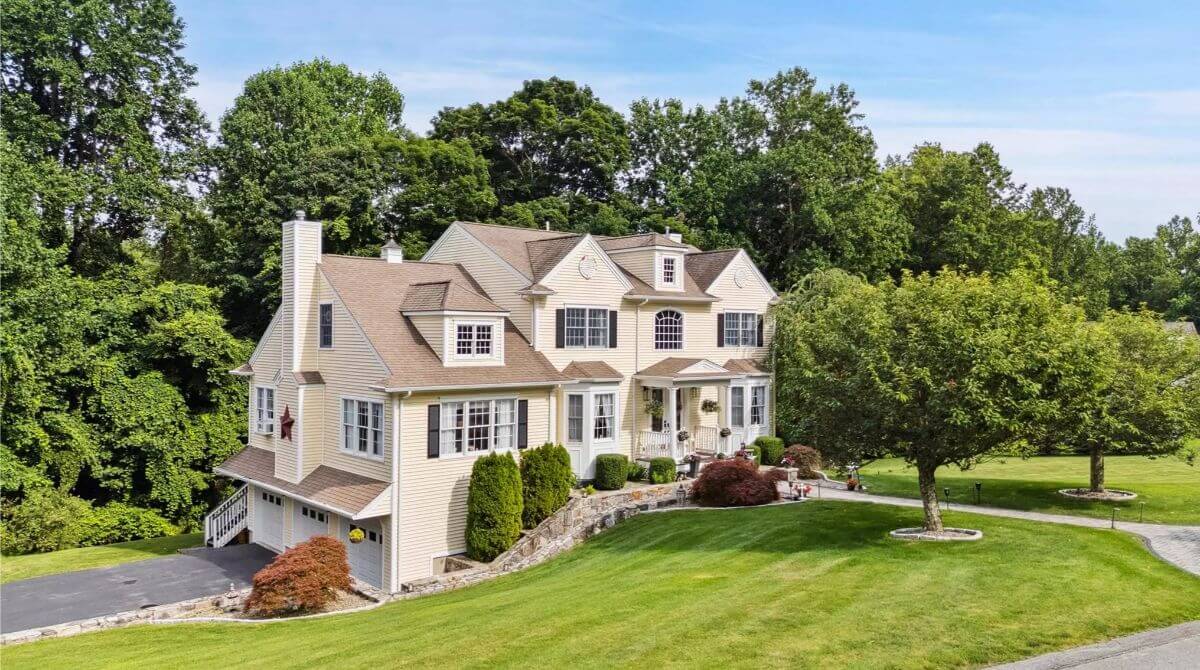
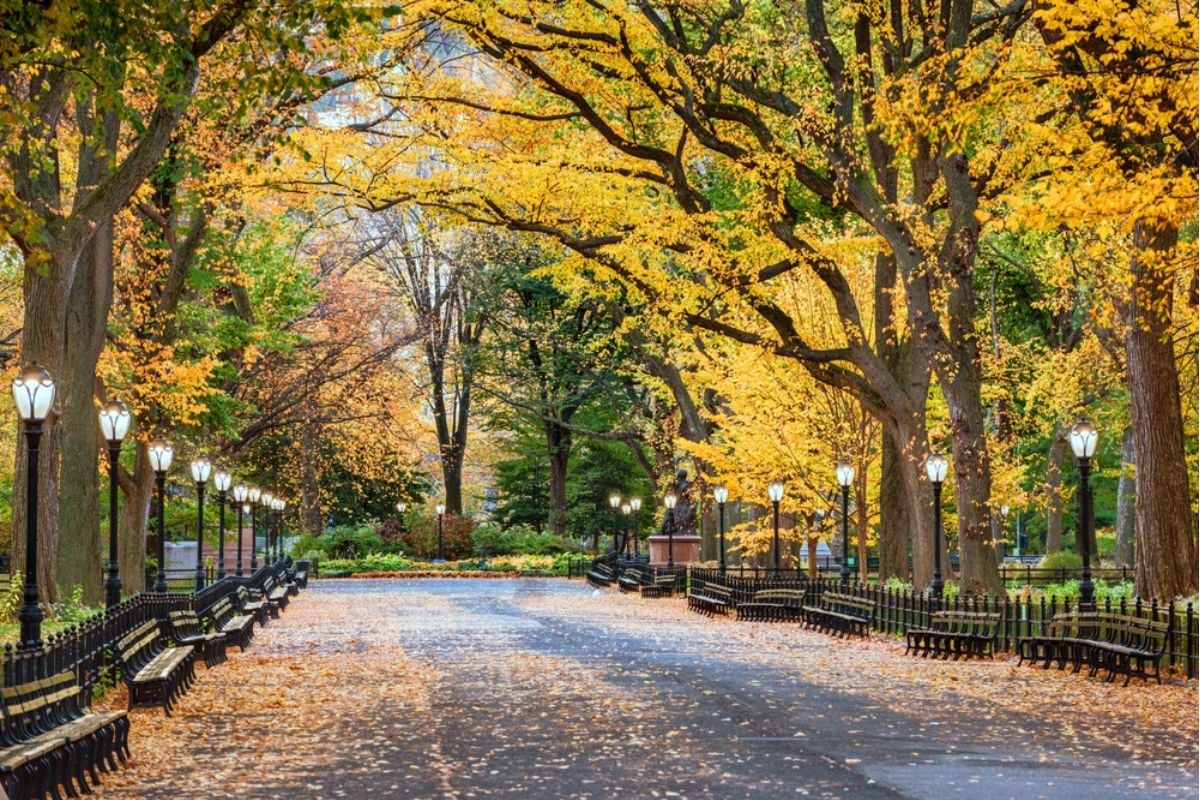
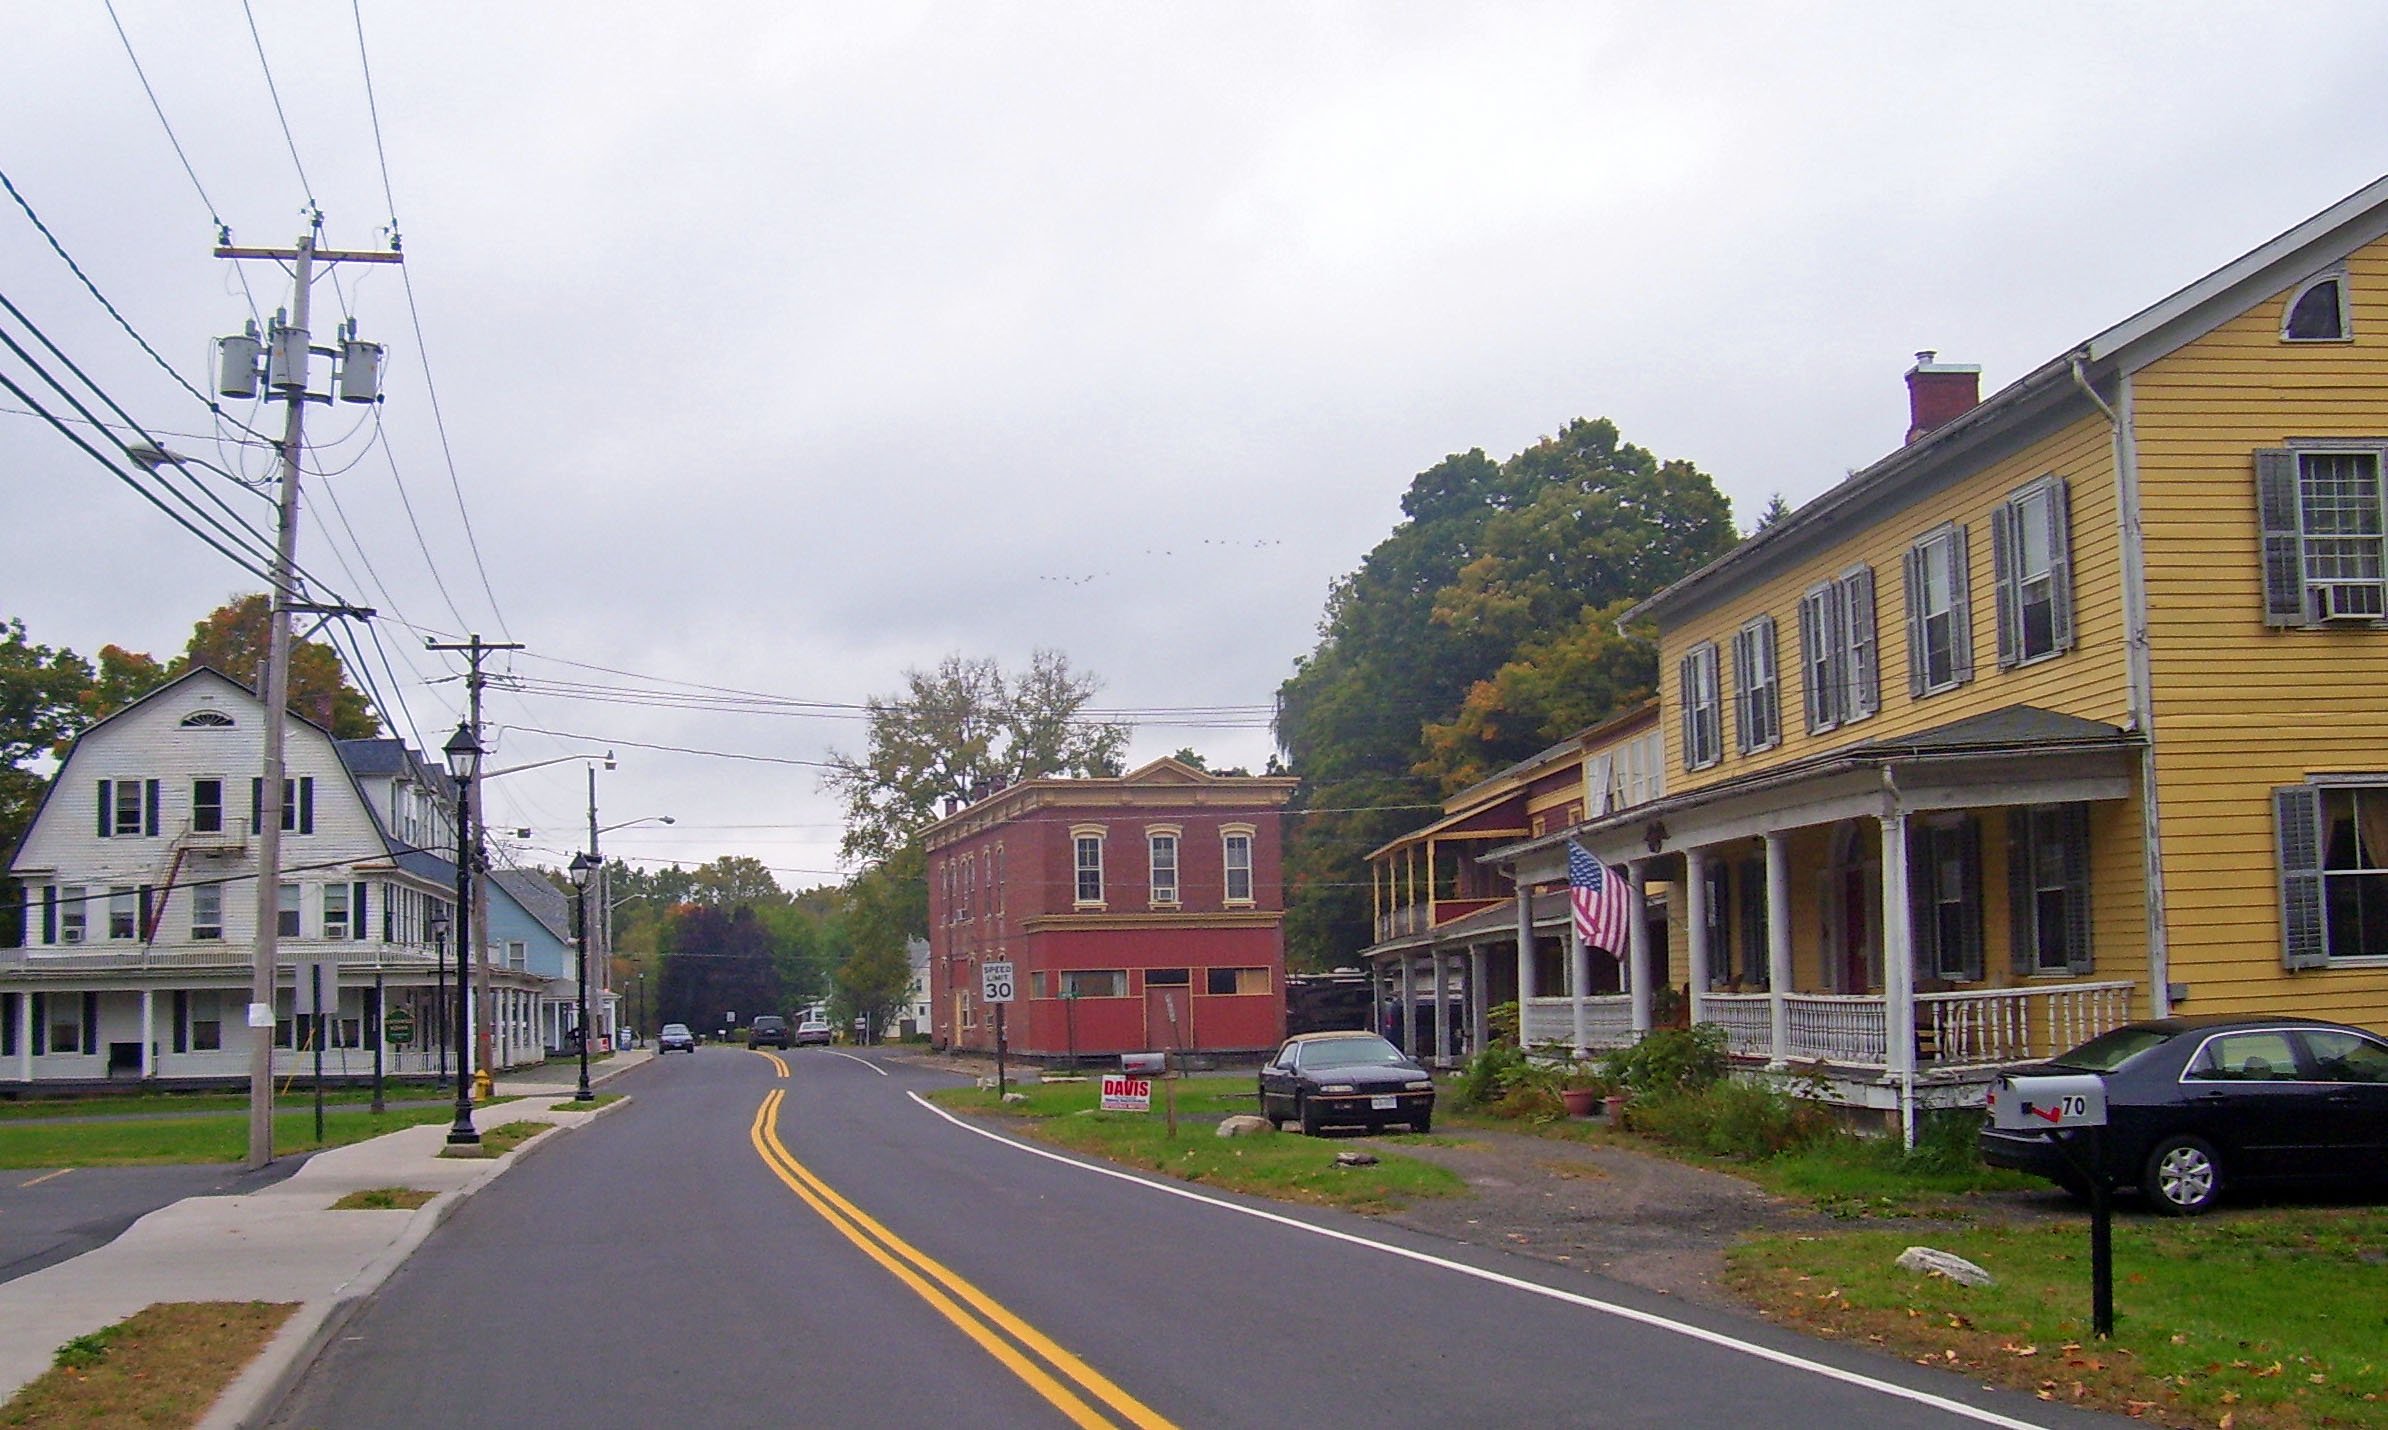
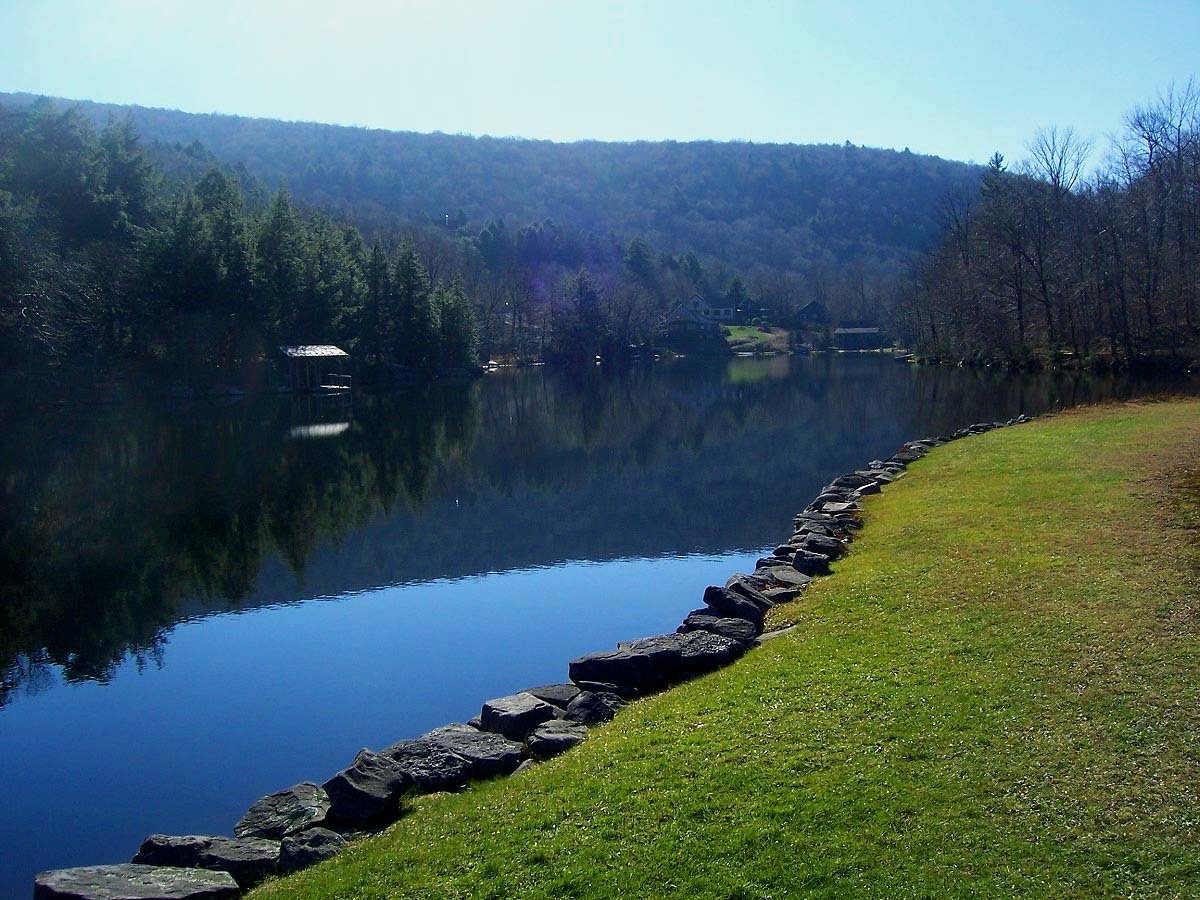
Cities with the most expensive homes in New York
Purchasing a home is one of the most important investments there is. More than a place to live, homeownership is an asset with the potential to tremendously rise in value. But with home prices reaching record heights, affordability plays a huge role for buyers.
The typical home value in the United States was $360,385 in October, 2.4% higher than the year before.
High mortgage rates are also making monthly payments more expensive; as of November 14, the 30-year fixed mortgage rate sits at 6.78%.
Although home prices have inflated all across the U.S., there are some cities that command a higher price tag than others. Location, size, age, and condition are all contributing factors to home value.
Stacker compiled a list of cities with the most expensive homes in New York using data from Zillow. Cities are ranked by the Zillow Home Values Index for all homes as of October 2024. The charts in this story were created automatically using Matplotlib.
All 30 cities on the list are in the New York-Newark-Jersey City, NY-NJ-PA metro area.
You may also like: How compensation compares between New York staff and travel nurses
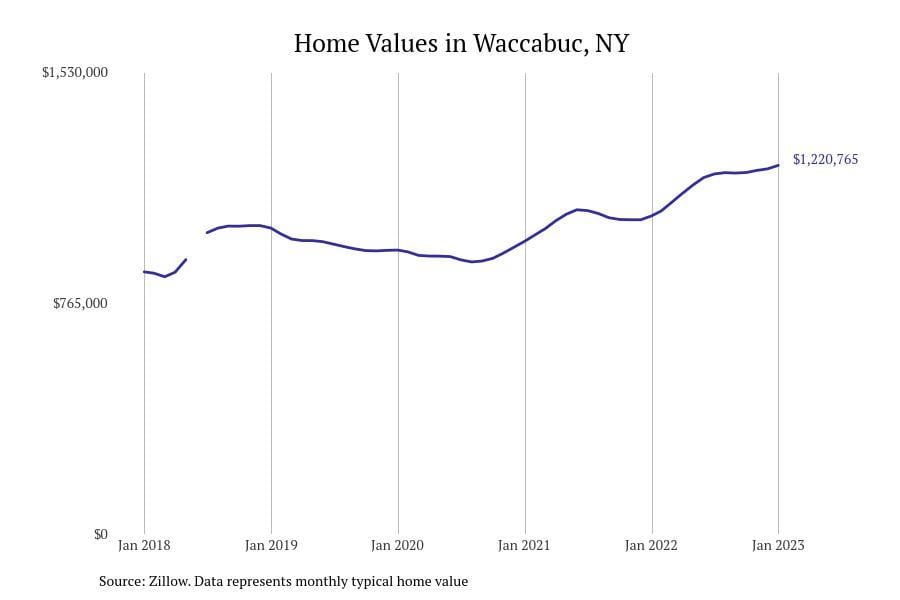
#30. Waccabuc
– Typical home value: $1,391,186
– 1-year price change: -0.9%
– 5-year price change: +5.5%
– Metro area: New York-Newark-Jersey City, NY-NJ-PA
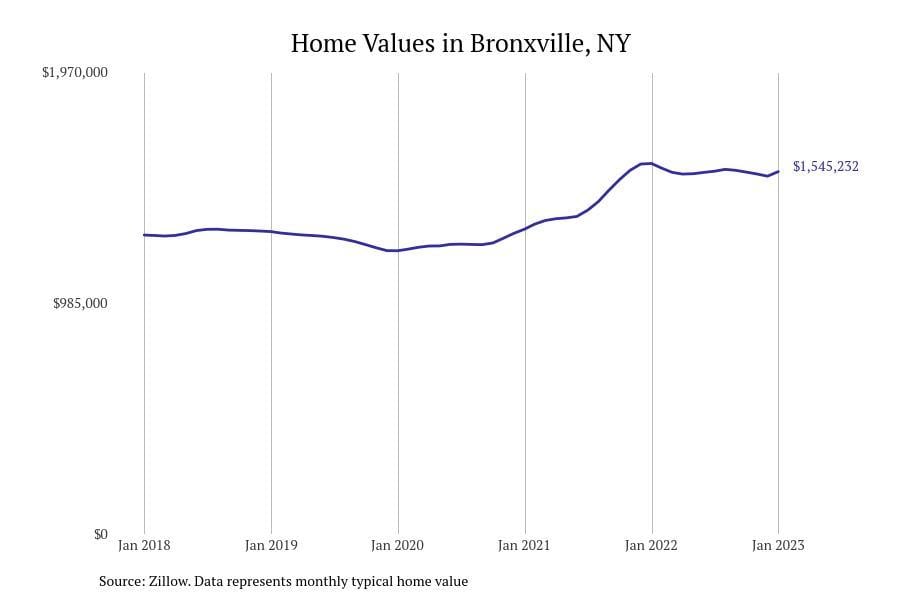
#29. Bronxville
– Typical home value: $1,468,416
– 1-year price change: -5.4%
– 5-year price change: +8.3%
– Metro area: New York-Newark-Jersey City, NY-NJ-PA
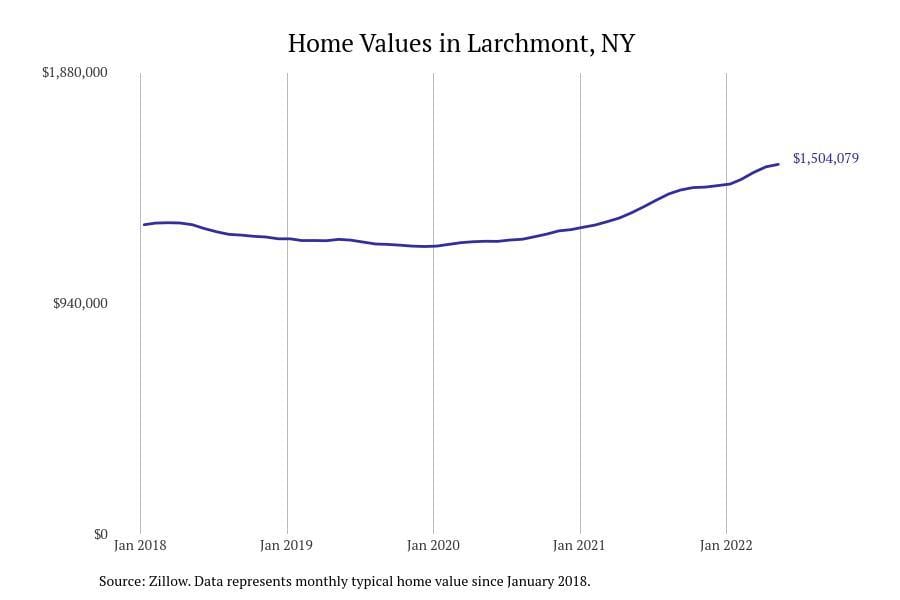
#28. Larchmont
– Typical home value: $1,541,403
– 1-year price change: +4.7%
– 5-year price change: +40.2%
– Metro area: New York-Newark-Jersey City, NY-NJ-PA
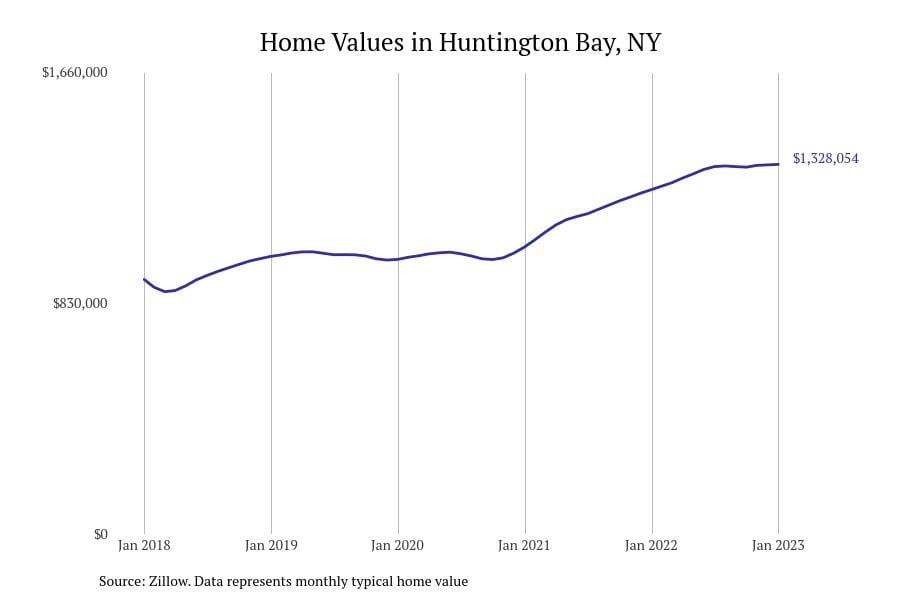
#27. Huntington Bay
– Typical home value: $1,559,062
– 1-year price change: +4.8%
– 5-year price change: +33.7%
– Metro area: New York-Newark-Jersey City, NY-NJ-PA
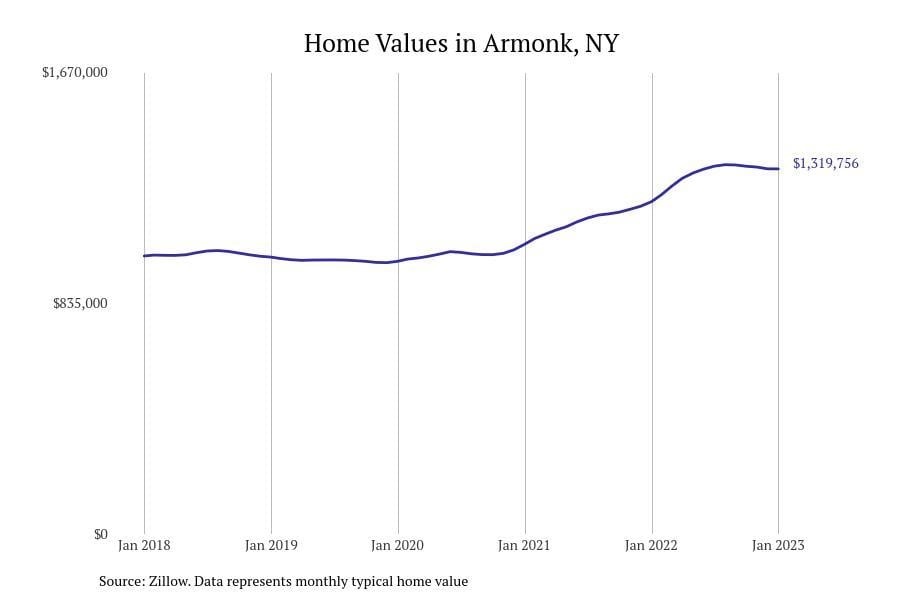
#26. Armonk
– Typical home value: $1,566,117
– 1-year price change: +8.6%
– 5-year price change: +30.1%
– Metro area: New York-Newark-Jersey City, NY-NJ-PA
You may also like: Counties where homes are selling the fastest in New York
Would you like to save this?
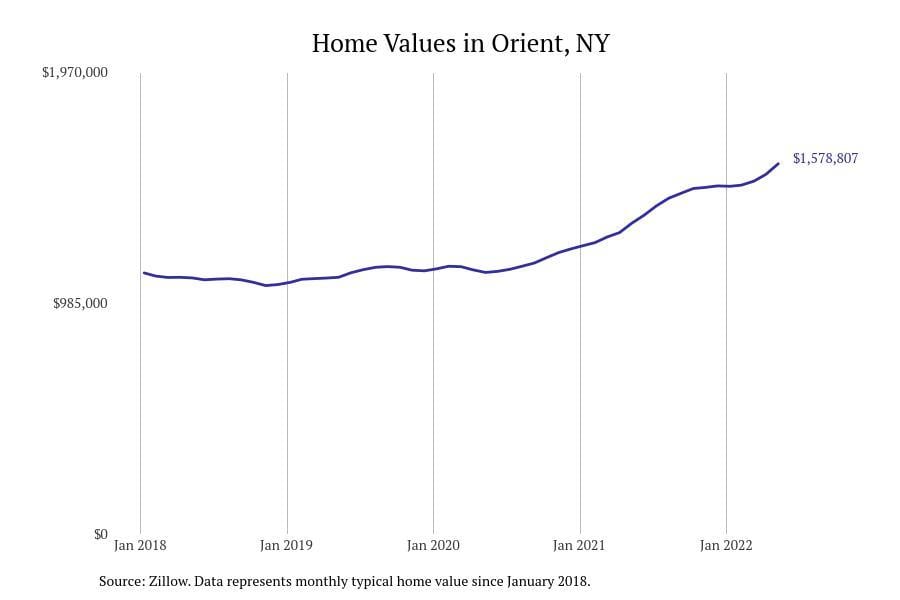
#25. Orient
– Typical home value: $1,587,247
– 1-year price change: +3.5%
– 5-year price change: +58.8%
– Metro area: New York-Newark-Jersey City, NY-NJ-PA
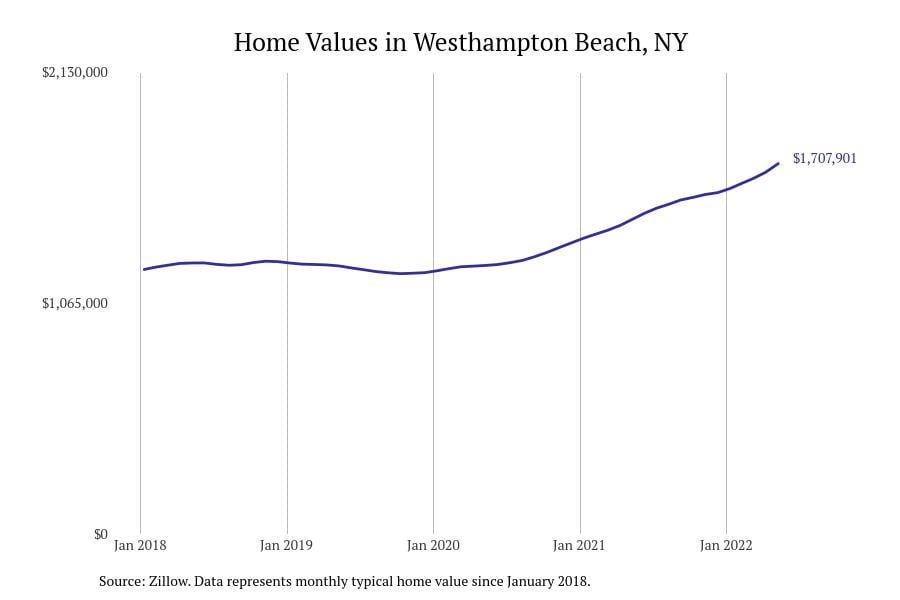
#24. Westhampton Beach
– Typical home value: $1,599,988
– 1-year price change: +5.9%
– 5-year price change: +54.1%
– Metro area: New York-Newark-Jersey City, NY-NJ-PA
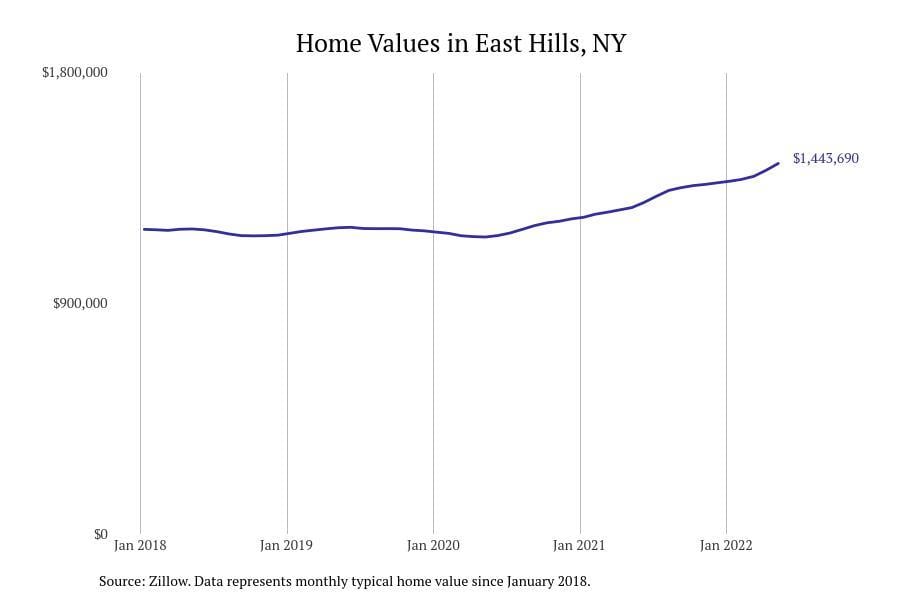
#23. East Hills
– Typical home value: $1,642,819
– 1-year price change: +11.0%
– 5-year price change: +47.8%
– Metro area: New York-Newark-Jersey City, NY-NJ-PA
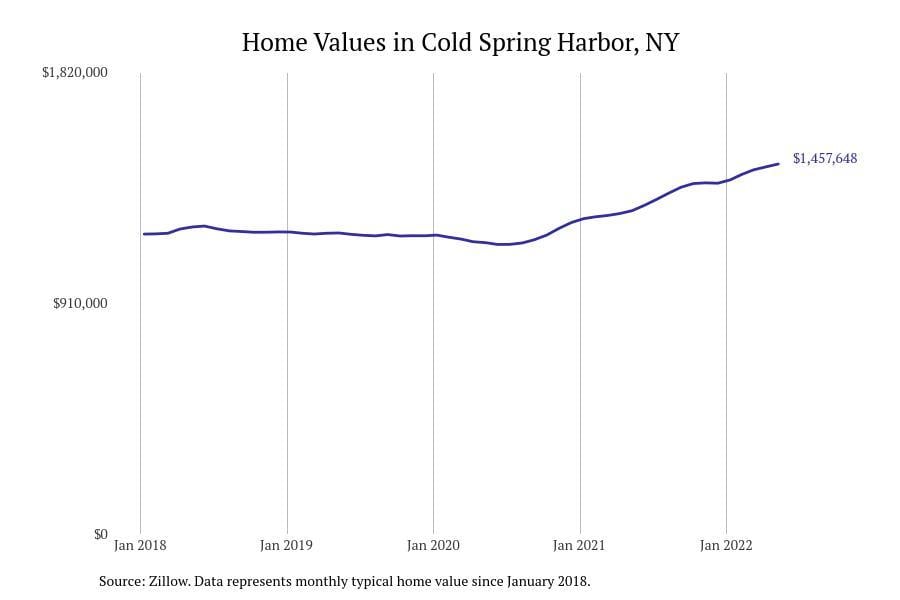
#22. Cold Spring Harbor
– Typical home value: $1,664,192
– 1-year price change: +4.1%
– 5-year price change: +27.9%
– Metro area: New York-Newark-Jersey City, NY-NJ-PA
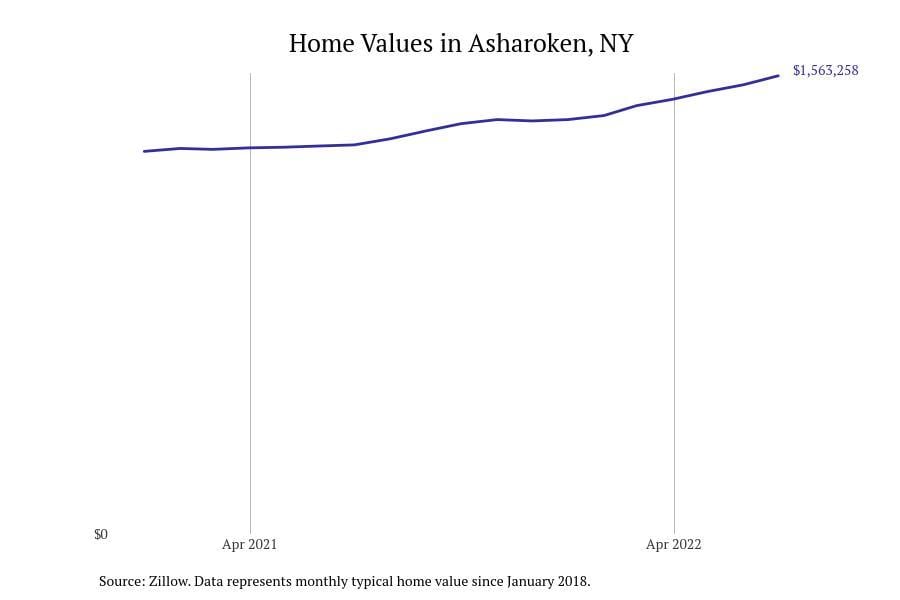
#21. Asharoken
– Typical home value: $1,707,749
– 1-year price change: +3.2%
– 5-year price change: +35.0%
– Metro area: New York-Newark-Jersey City, NY-NJ-PA
You may also like: Best- and worst-run cities in New York
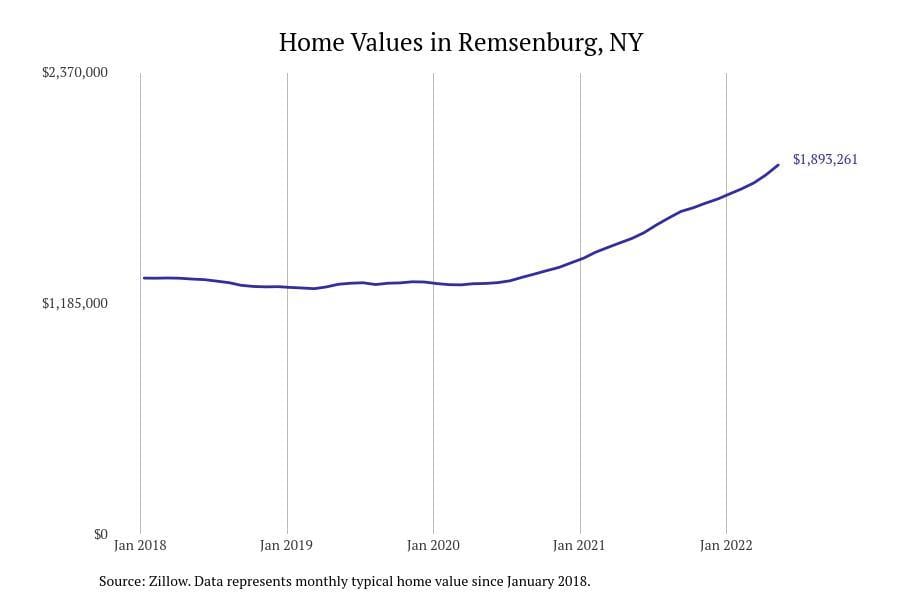
#20. Remsenburg
– Typical home value: $1,784,609
– 1-year price change: +6.8%
– 5-year price change: +62.1%
– Metro area: New York-Newark-Jersey City, NY-NJ-PA
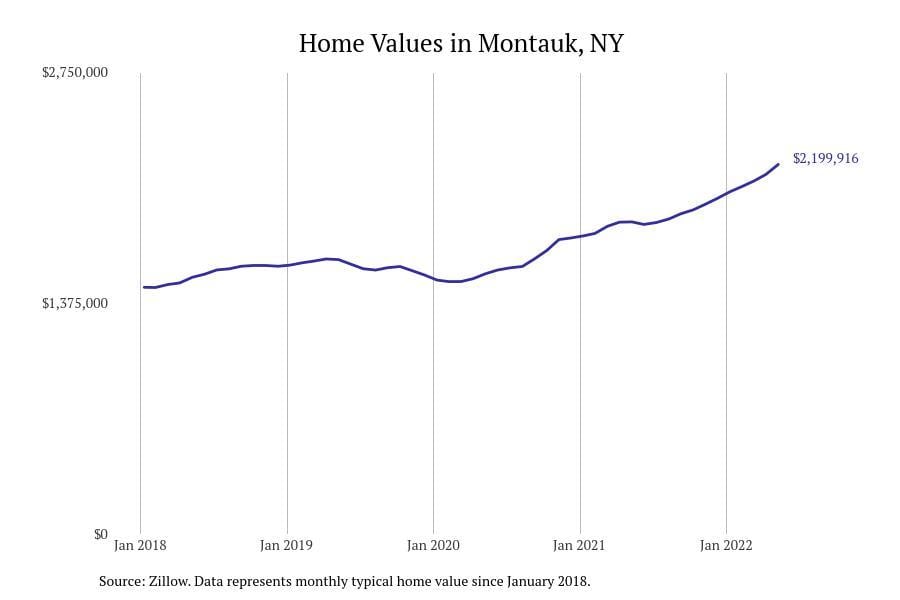
#19. Montauk
– Typical home value: $1,892,435
– 1-year price change: +4.5%
– 5-year price change: +52.8%
– Metro area: New York-Newark-Jersey City, NY-NJ-PA
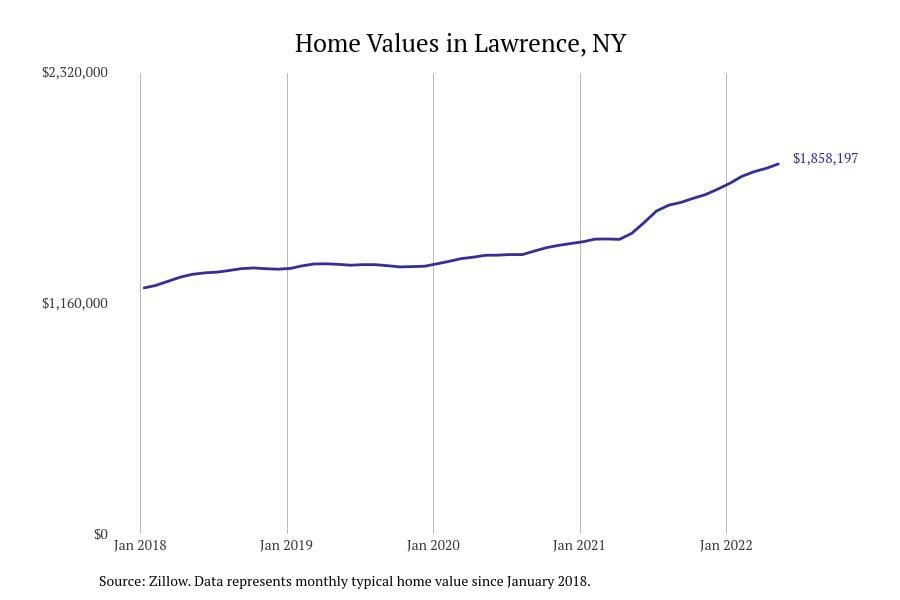
#18. Lawrence
– Typical home value: $1,936,766
– 1-year price change: +11.3%
– 5-year price change: +75.5%
– Metro area: New York-Newark-Jersey City, NY-NJ-PA
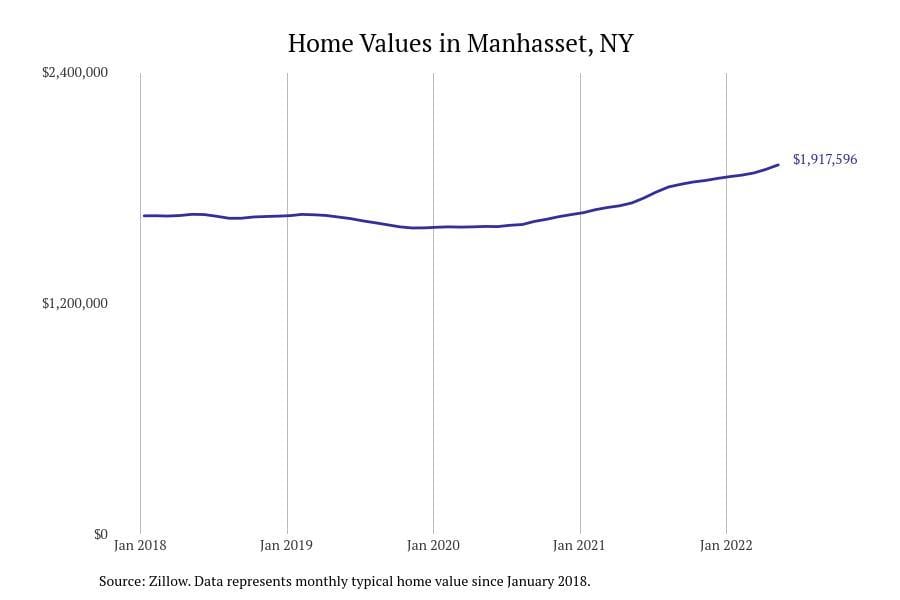
#17. Manhasset
– Typical home value: $2,001,564
– 1-year price change: +7.5%
– 5-year price change: +30.0%
– Metro area: New York-Newark-Jersey City, NY-NJ-PA
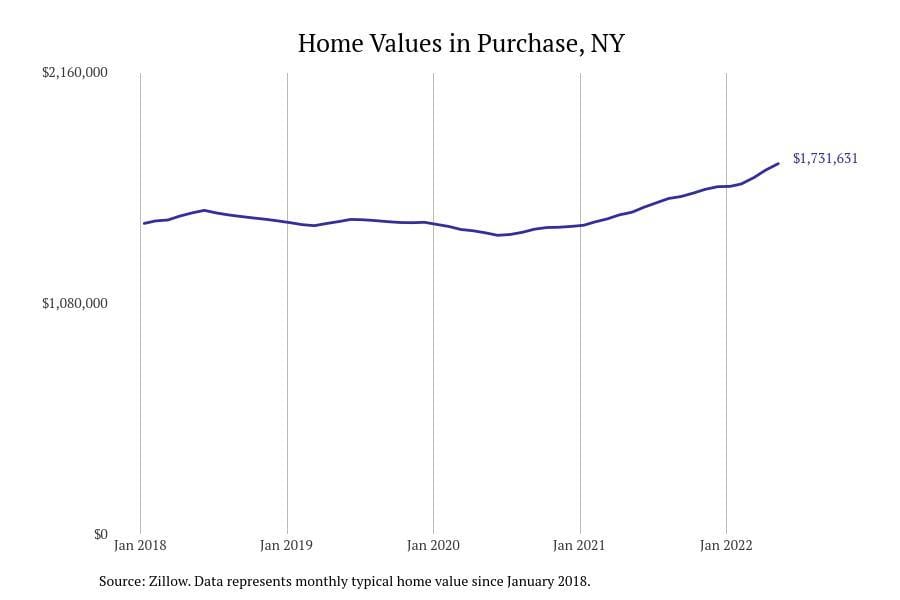
#16. Purchase
– Typical home value: $2,023,106
– 1-year price change: +8.1%
– 5-year price change: +39.1%
– Metro area: New York-Newark-Jersey City, NY-NJ-PA
You may also like: Counties receiving the most SBA loans in New York

#15. Laurel Hollow
– Typical home value: $2,061,185
– 1-year price change: +10.0%
– 5-year price change: +43.9%
– Metro area: New York-Newark-Jersey City, NY-NJ-PA
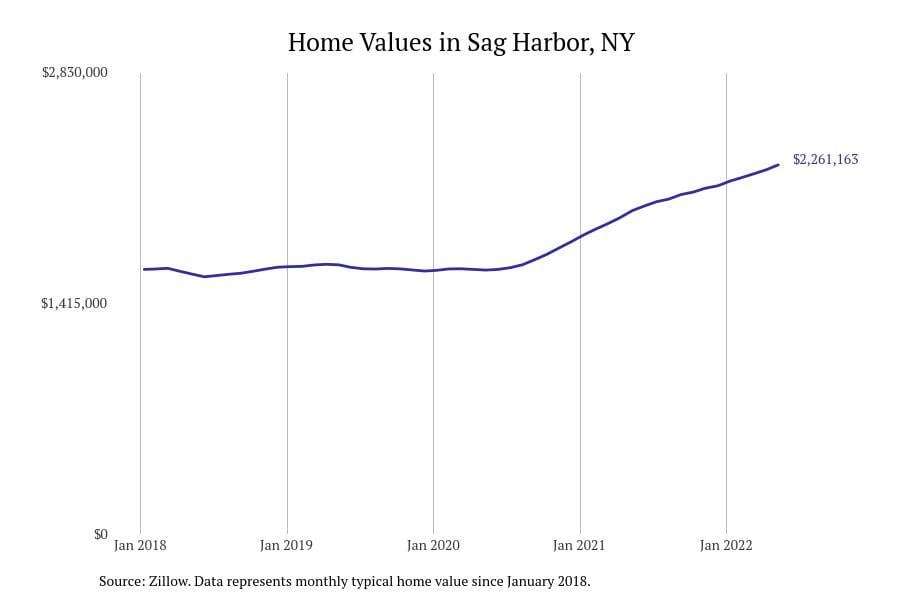
#14. Sag Harbor
– Typical home value: $2,072,914
– 1-year price change: +4.1%
– 5-year price change: +48.2%
– Metro area: New York-Newark-Jersey City, NY-NJ-PA
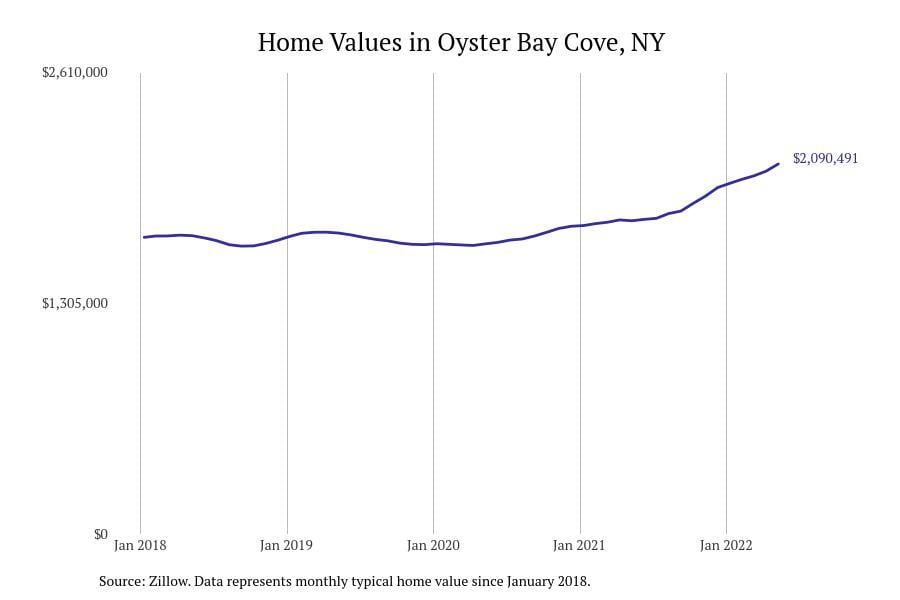
#13. Oyster Bay Cove
– Typical home value: $2,080,849
– 1-year price change: +11.0%
– 5-year price change: +49.3%
– Metro area: New York-Newark-Jersey City, NY-NJ-PA
Would you like to save this?
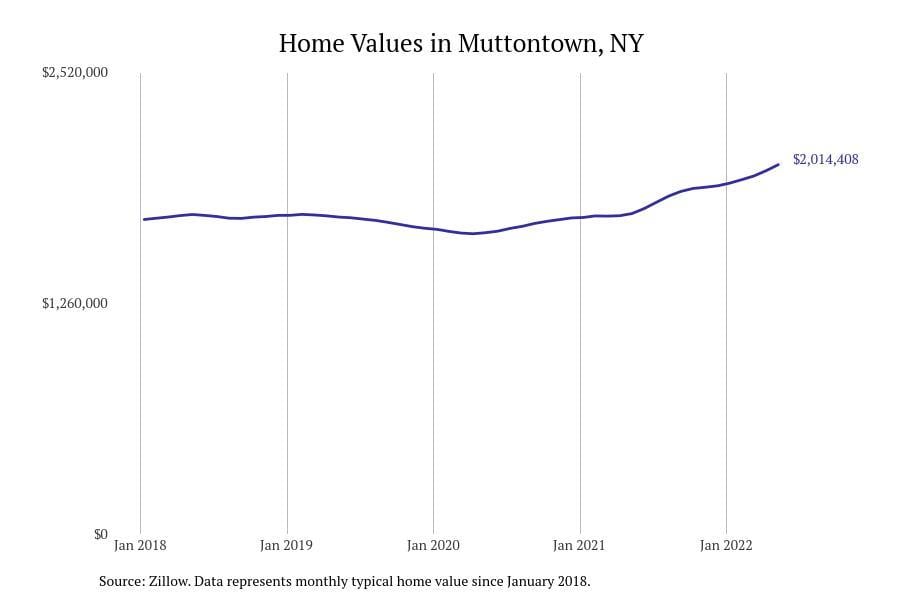
#12. Muttontown
– Typical home value: $2,081,649
– 1-year price change: +8.2%
– 5-year price change: +33.7%
– Metro area: New York-Newark-Jersey City, NY-NJ-PA
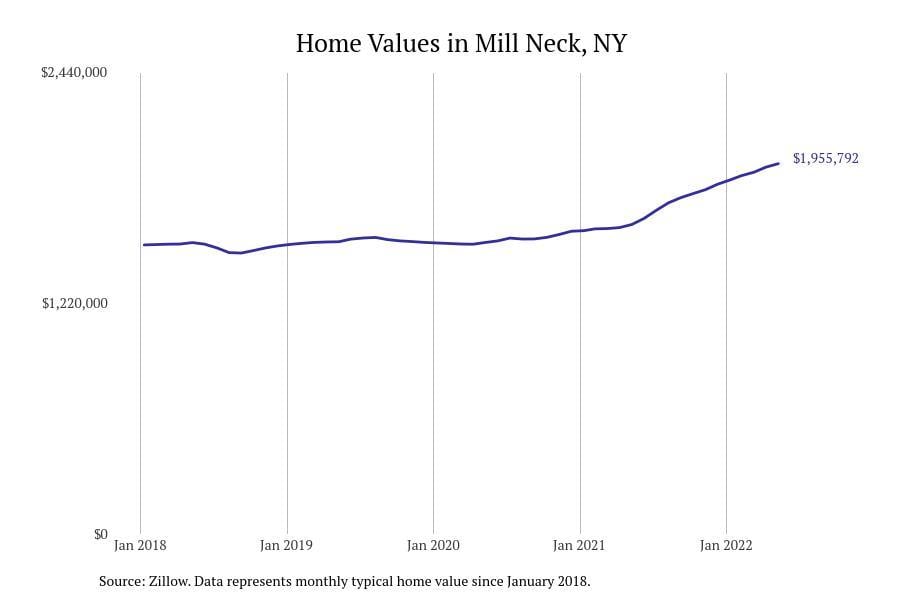
#11. Mill Neck
– Typical home value: $2,146,713
– 1-year price change: +9.6%
– 5-year price change: +42.2%
– Metro area: New York-Newark-Jersey City, NY-NJ-PA
You may also like: How much manufacturers in New York spend on equipment
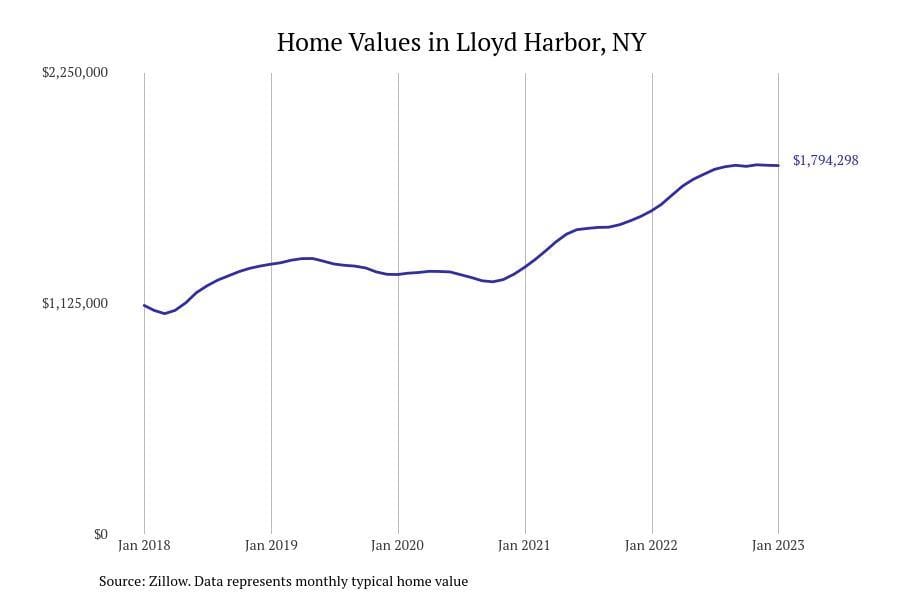
#10. Lloyd Harbor
– Typical home value: $2,221,064
– 1-year price change: -1.7%
– 5-year price change: +27.7%
– Metro area: New York-Newark-Jersey City, NY-NJ-PA

#9. Upper Brookville
– Typical home value: $2,294,178
– 1-year price change: +11.7%
– 5-year price change: +44.1%
– Metro area: New York-Newark-Jersey City, NY-NJ-PA
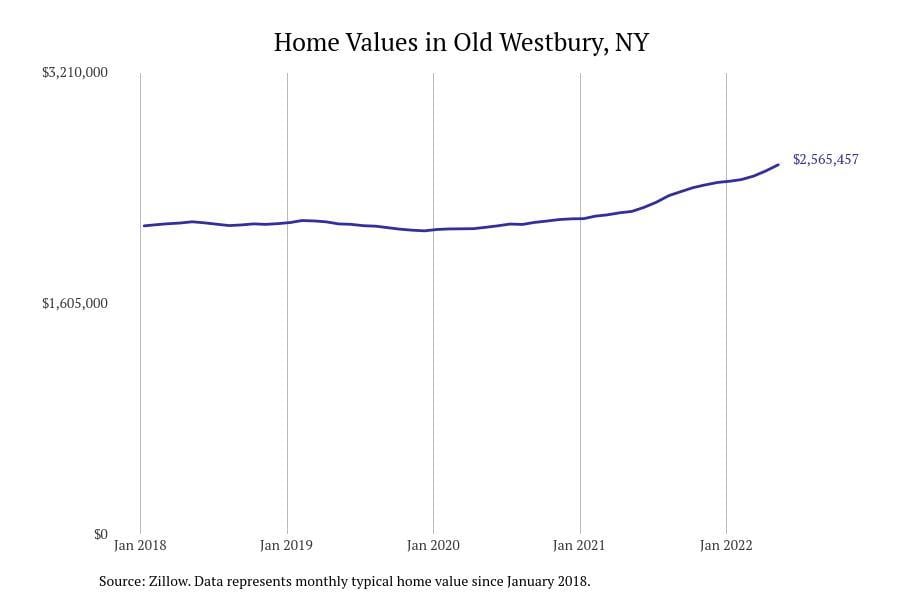
#8. Old Westbury
– Typical home value: $2,633,245
– 1-year price change: +10.6%
– 5-year price change: +46.5%
– Metro area: New York-Newark-Jersey City, NY-NJ-PA
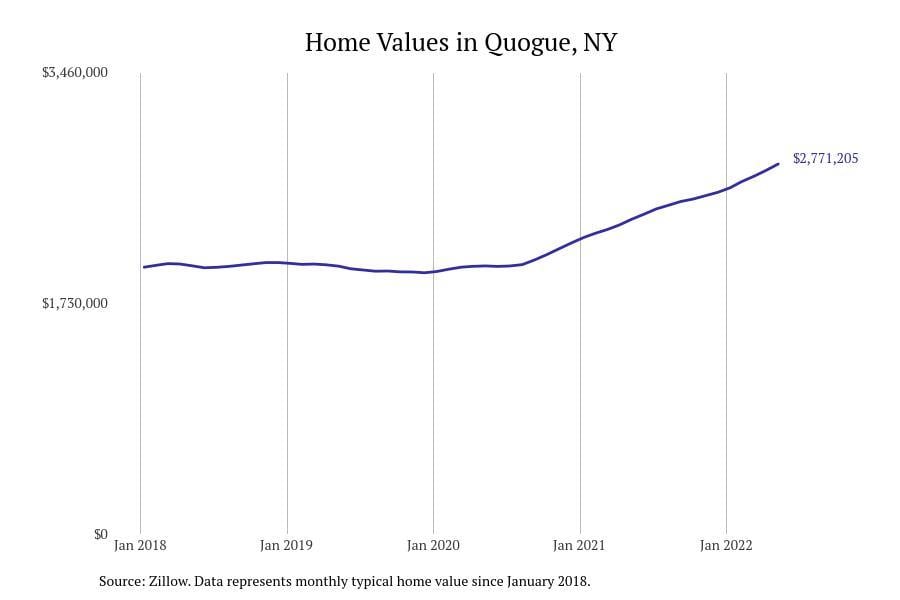
#7. Quogue
– Typical home value: $2,794,921
– 1-year price change: +4.3%
– 5-year price change: +55.0%
– Metro area: New York-Newark-Jersey City, NY-NJ-PA
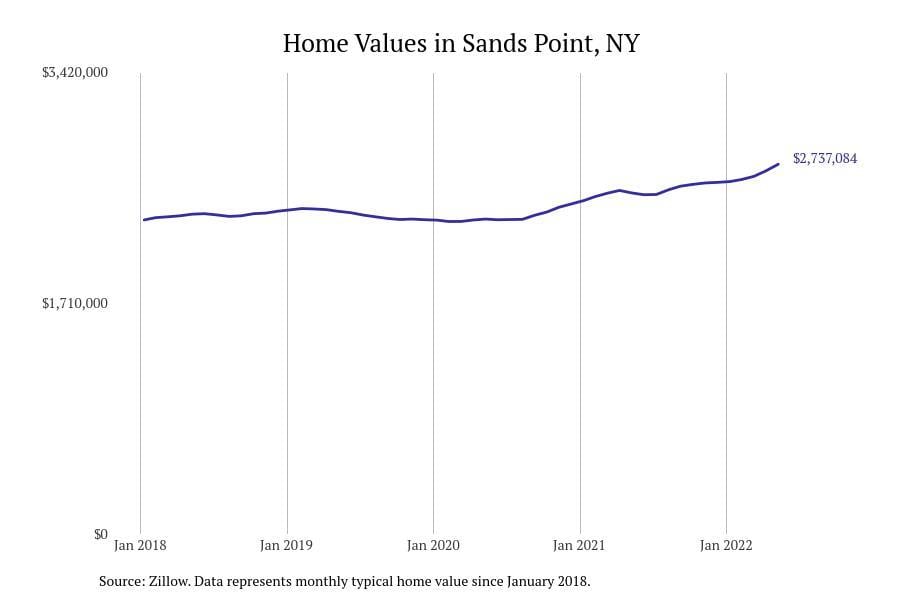
#6. Sands Point
– Typical home value: $3,001,722
– 1-year price change: +7.1%
– 5-year price change: +34.4%
– Metro area: New York-Newark-Jersey City, NY-NJ-PA
You may also like: Counties with the most prewar homes in New York
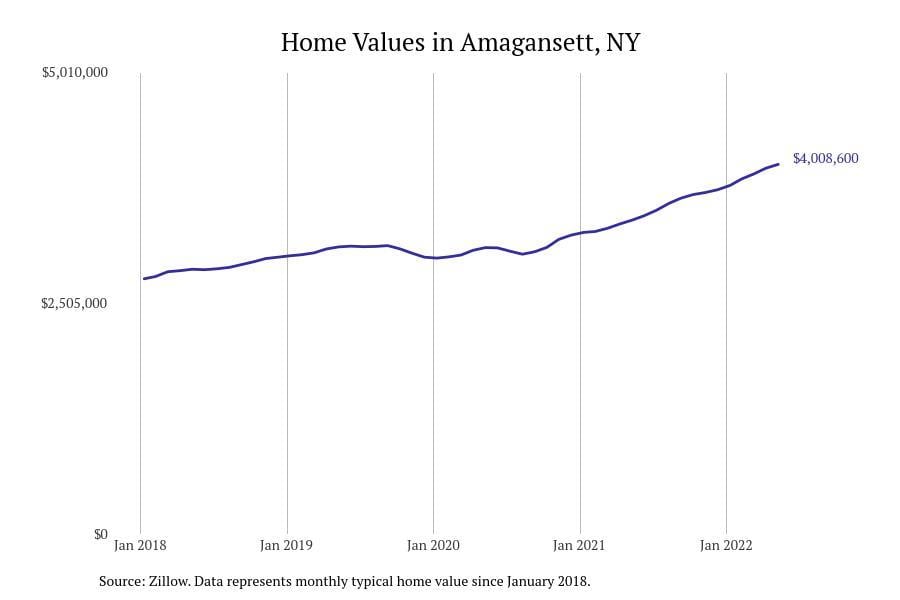
#5. Amagansett
– Typical home value: $3,102,867
– 1-year price change: -1.5%
– 5-year price change: +32.4%
– Metro area: New York-Newark-Jersey City, NY-NJ-PA
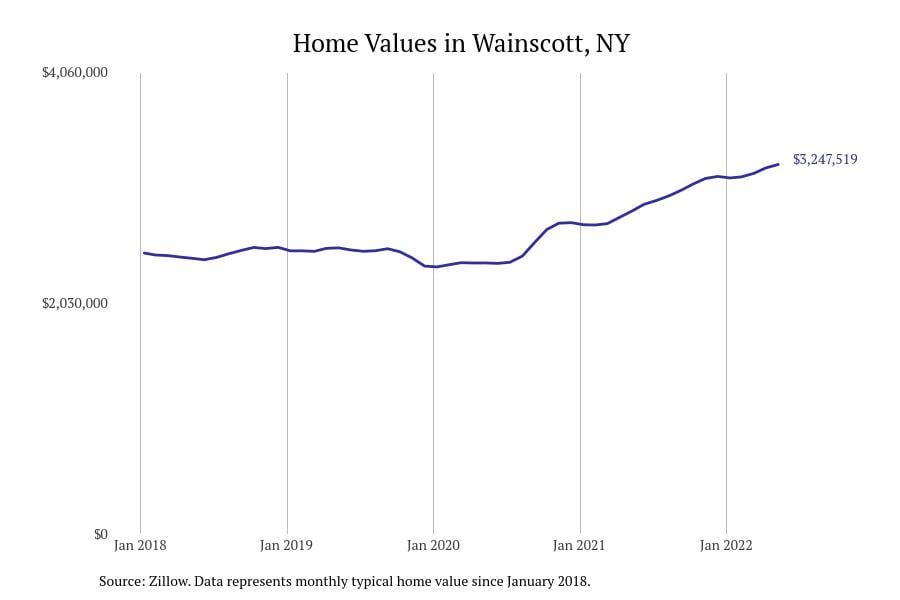
#4. Wainscott
– Typical home value: $3,869,403
– 1-year price change: +0.0%
– 5-year price change: +26.7%
– Metro area: New York-Newark-Jersey City, NY-NJ-PA
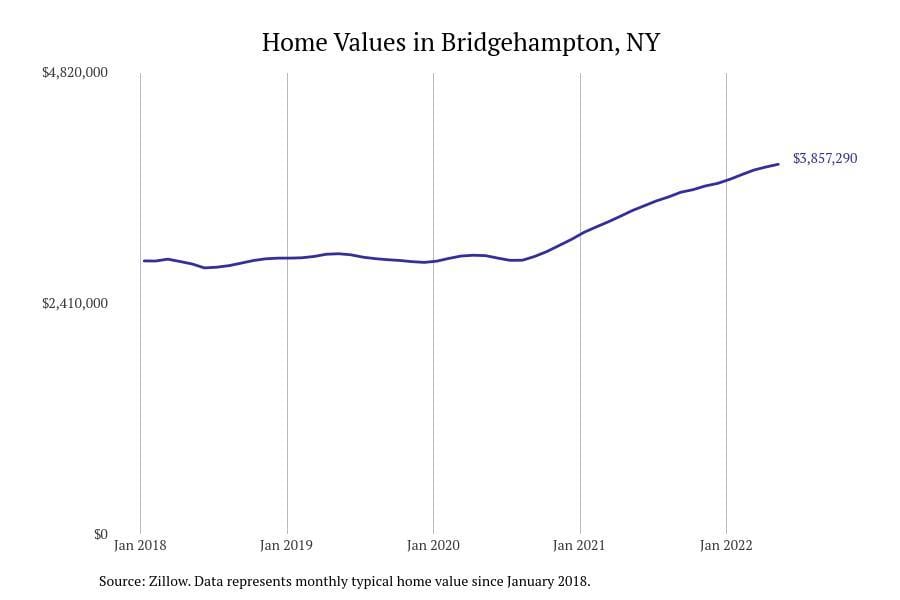
#3. Bridgehampton
– Typical home value: $4,100,688
– 1-year price change: +6.6%
– 5-year price change: +53.4%
– Metro area: New York-Newark-Jersey City, NY-NJ-PA
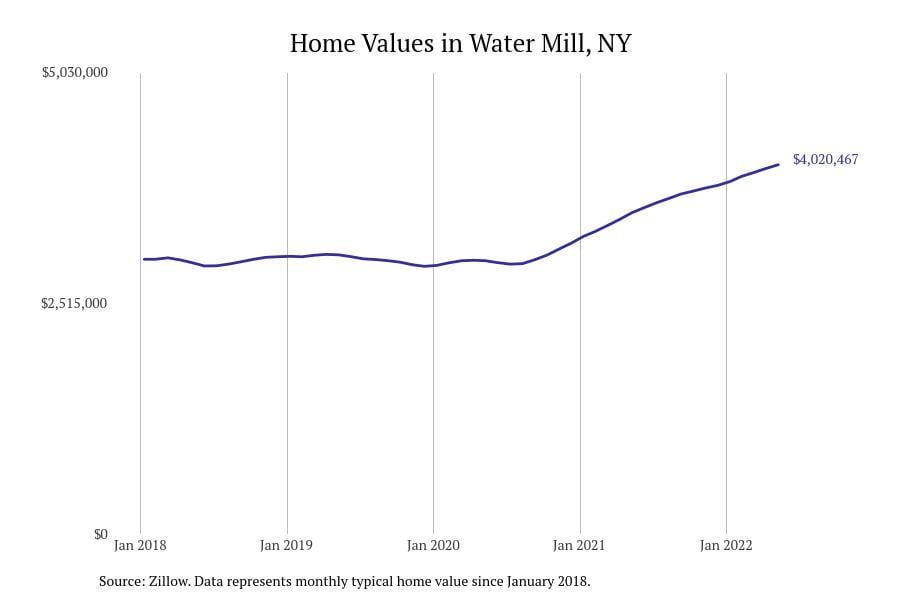
#2. Water Mill
– Typical home value: $4,354,991
– 1-year price change: +6.9%
– 5-year price change: +52.2%
– Metro area: New York-Newark-Jersey City, NY-NJ-PA
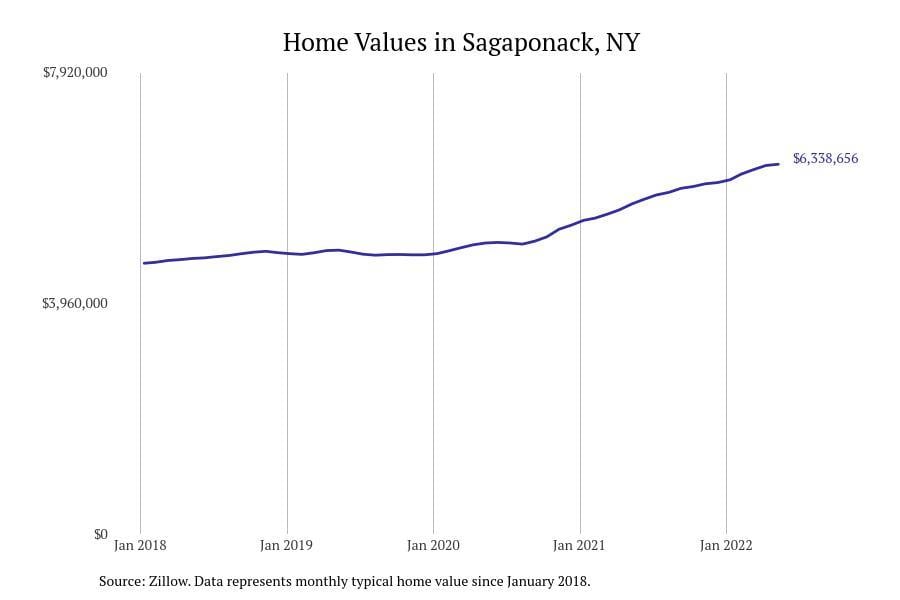
#1. Sagaponack
– Typical home value: $6,678,803
– 1-year price change: +9.5%
– 5-year price change: +51.8%
– Metro area: New York-Newark-Jersey City, NY-NJ-PA
You may also like: How syringe exchanges in New York reduce the spread of disease
By Stacker