
Connecticut is famous for its charming New England villages, prestigious universities, and affluent suburbs, but not every community enjoys the same level of safety. Across the Constitution State, some towns and cities struggle with crime rates that far exceed state averages, where residents face higher risks of becoming victims of theft, assault, or other serious offenses. From former industrial centers grappling with economic decline to urban areas dealing with persistent violence, these communities share one common challenge: safety remains a daily concern for those who call them home.
This ranking examines the 25 most dangerous towns in Connecticut based on the latest FBI crime data, arranged from least to most dangerous. Each location has been evaluated using both violent crime rates (including assault, robbery, and homicide) and property crime rates (covering theft, burglary, and vehicle crimes). The data reveals stark differences in crime patterns across the state, with some communities facing primarily property crime issues while others deal with more serious violent offenses.
In order to come up with the very specific design ideas, we create most designs with the assistance of state-of-the-art AI interior design software.
25. Naugatuck

Population: 31,790
Crime Rate: Violent – 94 per 100,000; Property – 1,302 per 100,000
Naugatuck sees significantly more theft than violence, with property crimes making up the vast majority of incidents. Robbery and assaults remain uncommon compared to larger cities nearby. The town’s crime profile is driven primarily by larceny and occasional burglary rather than violent offenses.
24. Branford

Population: 28,132
Crime Rate: Violent – 107 per 100,000; Property – 1,955 per 100,000
Crime risk in Branford leans heavily toward property offenses rather than violence. Local police focus much of their attention on shoplifting incidents and car break-ins along the town’s busy commercial corridors. The coastal community maintains relatively low violent crime rates while dealing with moderate property crime levels.
23. Norwalk

Population: 91,639
Crime Rate: Violent – 109 per 100,000; Property – 1,557 per 100,000
Despite being one of Connecticut’s larger cities, Norwalk maintains moderate violent crime levels. Property crimes make up the majority of police reports throughout the year. The city’s size and commercial activity contribute to steady theft and burglary numbers without reaching the violent crime rates seen in other urban areas.
22. Manchester

Population: 59,408
Crime Rate: Violent – 111 per 100,000; Property – 1,776 per 100,000
Theft drives Manchester’s crime totals, particularly around major retail hubs and shopping centers. Violent crime remains notably lower than in nearby Hartford, making property offenses the primary safety concern. The town’s commercial districts see most of the larceny and shoplifting incidents that push up overall crime numbers.
21. Orange
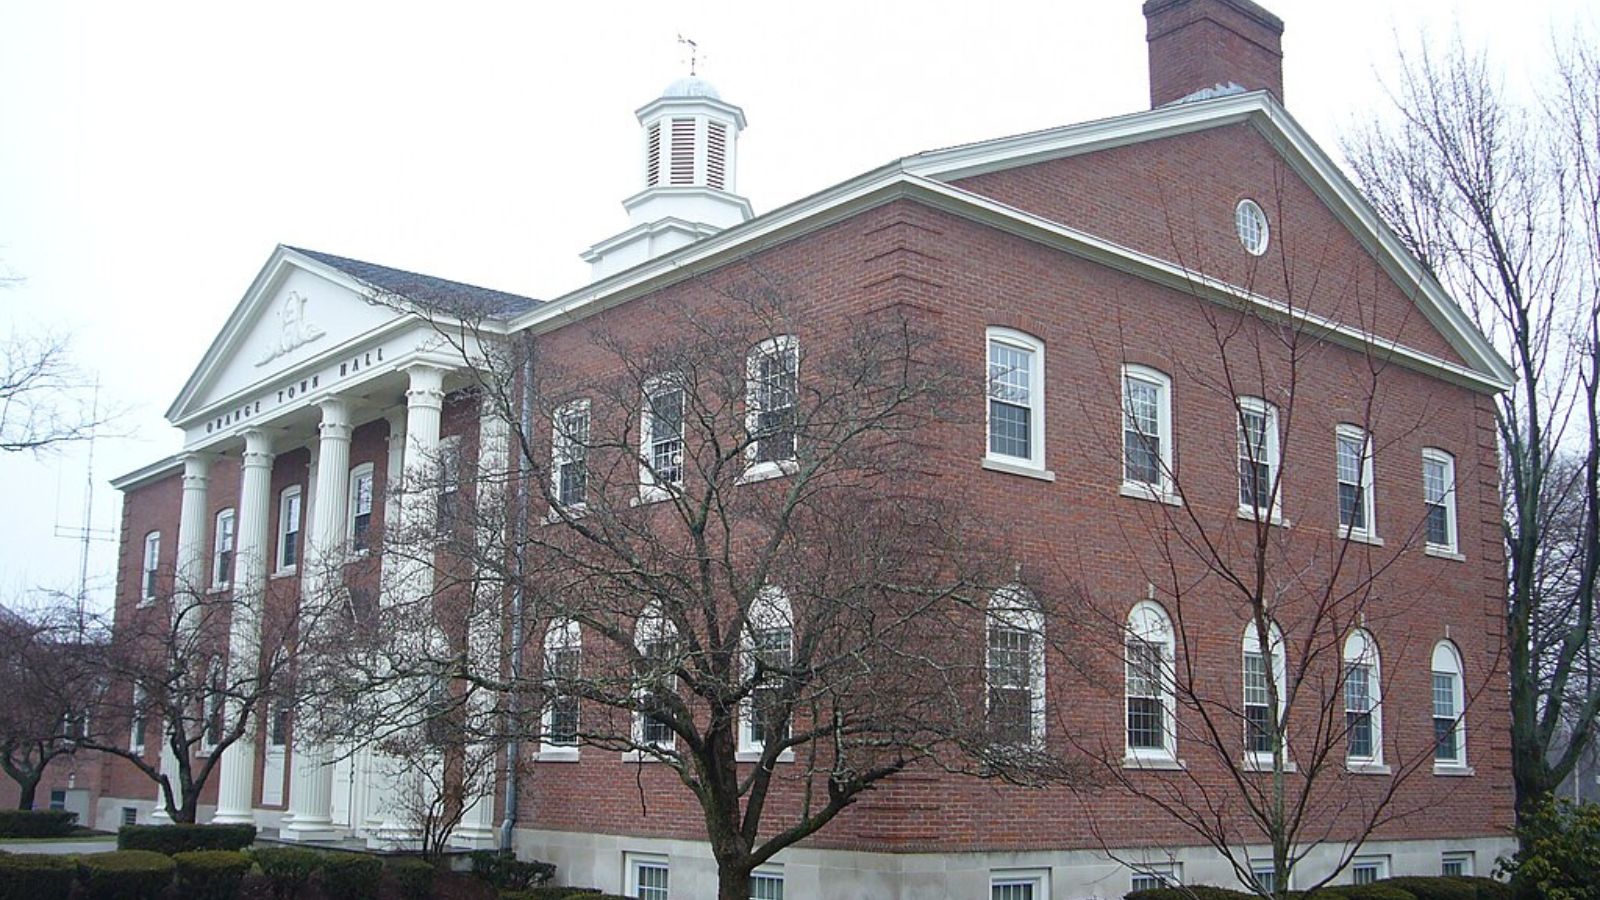
Population: 14,272
Crime Rate: Violent – 112 per 100,000; Property – 4,225 per 100,000
Orange posts an exceptionally high property crime rate for a town of its size, driven by shoplifting and vehicle break-ins near retail strips. The small community’s crime statistics are heavily influenced by commercial theft along major shopping corridors. Despite the high property crime numbers, violent incidents remain relatively rare.
20. Stratford

Population: 52,596
Crime Rate: Violent – 116 per 100,000; Property – 1,930 per 100,000
Most criminal incidents in Stratford involve property rather than personal violence. The town maintains violent crime rates well below those found in Connecticut’s major cities. Theft and burglary account for the bulk of police responses, while serious violent crimes occur infrequently.
19. Willimantic

Population: 24,416
Crime Rate: Violent – 118 per 100,000; Property – 976 per 100,000
Willimantic shows a relatively balanced crime profile with fewer property crimes than many comparable communities. Violent crime rates stay relatively low compared to other towns on this list. The smaller community maintains more manageable crime levels across both violent and property offense categories.
18. Torrington

Population: 35,633
Crime Rate: Violent – 118 per 100,000; Property – 1,341 per 100,000
Property offenses significantly outnumber violent incidents in Torrington throughout the year. Car thefts and larceny represent the main public safety challenges facing residents. The northwestern Connecticut city deals with moderate property crime levels while keeping violent crime relatively controlled.
17. Milford

Population: 53,011
Crime Rate: Violent – 119 per 100,000; Property – 2,396 per 100,000
Tourism and retail areas in Milford contribute to elevated theft numbers throughout the community. Violent crime remains comparatively limited despite the town’s size and commercial activity. The coastal location and shopping destinations create opportunities for property crime that drive overall statistics.
16. East Haven

Population: 27,614
Crime Rate: Violent – 120 per 100,000; Property – 2,633 per 100,000
East Haven experiences a higher property crime rate than most neighboring shoreline communities. Violent incidents occur much less frequently than theft and burglary cases. The town’s proximity to New Haven and commercial development contribute to property crime levels above typical suburban rates.
15. East Windsor

Population: 11,178
Crime Rate: Violent – 143 per 100,000; Property – 2,415 per 100,000
This small town posts a disproportionately high property crime rate relative to its population size. Retail corridors and commercial areas contribute significantly to larceny totals throughout the year. Despite being a smaller community, East Windsor faces property crime challenges similar to much larger towns.
14. East Hartford

Population: 50,625
Crime Rate: Violent – 148 per 100,000; Property – 2,278 per 100,000
Property offenses dominate East Hartford’s crime statistics while violent crime rates sit well below Hartford’s levels. The community experiences regular theft and burglary incidents across residential and commercial areas. Being adjacent to the state capital brings some urban crime pressures without reaching Hartford’s violent crime intensity.
13. Enfield

🔥 Would you like to save this?
Population: 41,271
Crime Rate: Violent – 167 per 100,000; Property – 1,868 per 100,000
Theft clearly dominates Enfield’s crime landscape, with property offenses far outpacing violent incidents. Police staffing levels and the town’s retail footprint help shape current crime patterns. The northern Connecticut community maintains manageable violent crime while addressing ongoing property crime challenges.
12. Stamford

Population: 136,512
Crime Rate: Violent – 171 per 100,000; Property – 1,167 per 100,000
For Connecticut’s second-largest city, Stamford maintains relatively low violent crime rates. Property crimes make up the bulk of police reports, though rates remain moderate given the city’s size. The urban center’s business district and residential areas see steady but manageable crime levels across most categories.
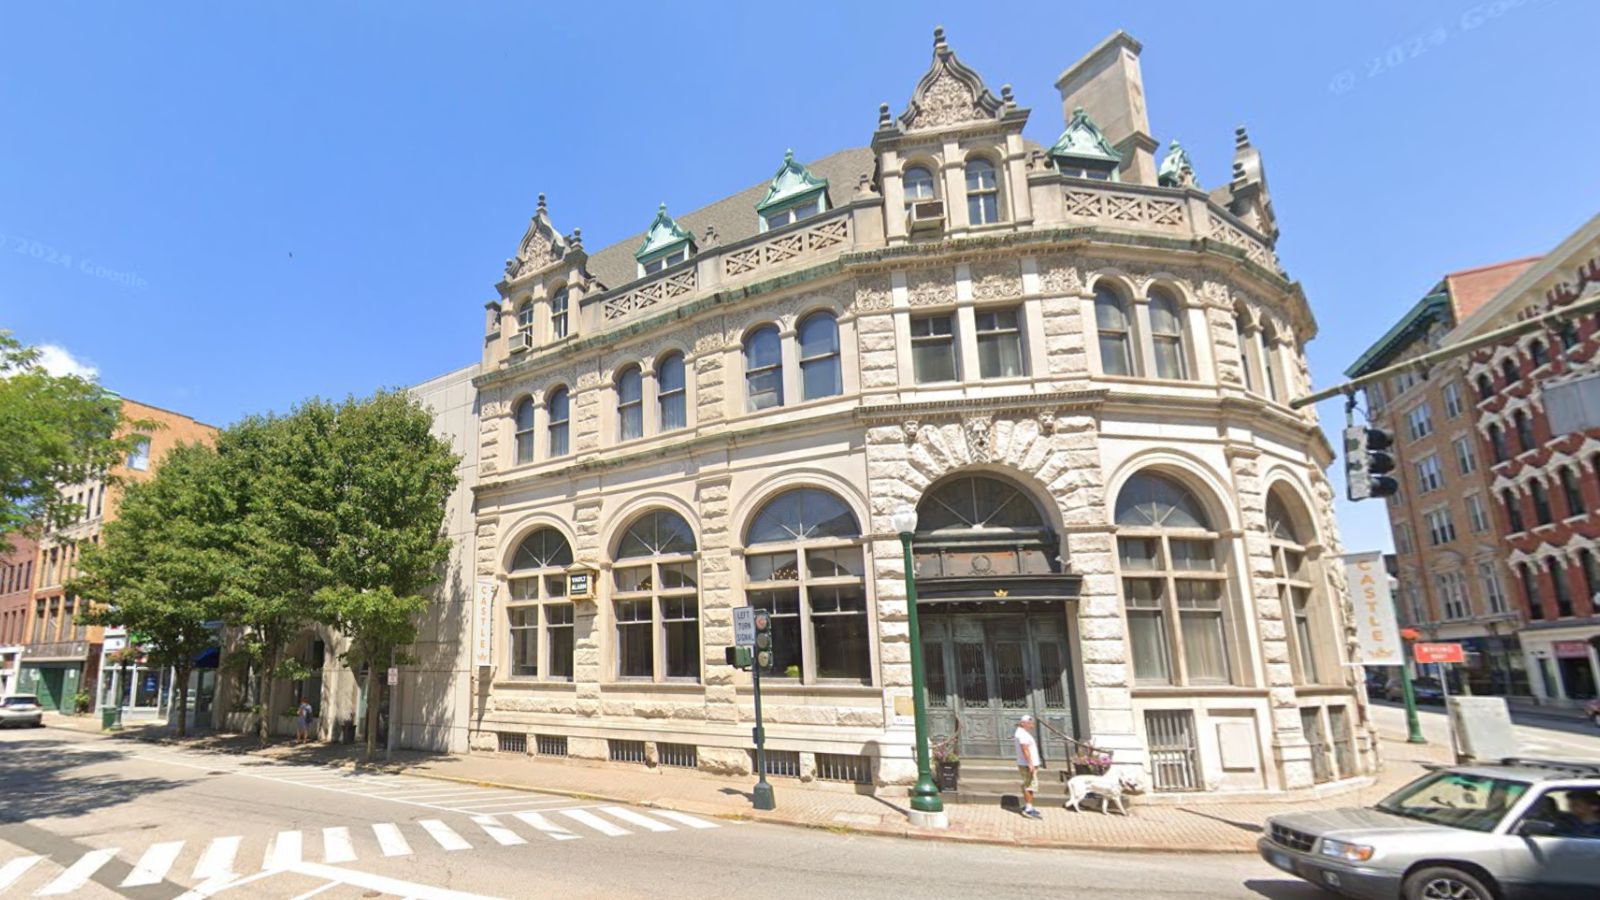
11. New London

Population: 28,317
Crime Rate: Violent – 191 per 100,000; Property – 1,384 per 100,000
This coastal city experiences more theft than violence, with downtown commercial activity contributing to overall totals. New London’s port location and urban density create conditions for moderate property crime levels. The community balances its historic character with ongoing public safety challenges typical of small cities.
10. Meriden

Population: 60,054
Crime Rate: Violent – 198 per 100,000; Property – 2,438 per 100,000
Property crime serves as the main driver of Meriden’s position on this list. Violent crime rates fall in the middle range among Connecticut cities of similar size. The central Connecticut location and mix of residential and commercial areas contribute to elevated property crime numbers.
9. Danbury

Population: 87,327
Crime Rate: Violent – 213 per 100,000; Property – 1,116 per 100,000
Danbury maintains a relatively low property crime rate for a city of its size. Violent crime tends to be concentrated in specific neighborhoods rather than spread citywide. The western Connecticut hub experiences more violent incidents than smaller communities while keeping property crime more controlled.
8. Norwich
Population: 40,000
Crime Rate: Violent – 215 per 100,000; Property – 1,310 per 100,000
Theft and car break-ins represent Norwich’s primary crime challenges rather than violent offenses. The southeastern Connecticut city maintains moderate violent crime levels while dealing with regular property incidents. Historic downtown areas and residential neighborhoods both contribute to the community’s overall crime statistics.
7. Derby

Population: 12,382
Crime Rate: Violent – 218 per 100,000; Property – 2,754 per 100,000
This small city posts elevated property crime rates that are unusual for a community of its size. Derby’s compact geography concentrates both residential and commercial activity, contributing to higher crime density. The Naugatuck Valley location brings urban-style crime challenges to a smaller population base.
6. Bridgeport
Population: 148,483
Crime Rate: Violent – 391 per 100,000; Property – 1,412 per 100,000
Connecticut’s largest city shows higher violent crime rates than surrounding suburbs but maintains mid-range property crime levels. Bridgeport’s urban challenges include gang activity and drug-related violence concentrated in specific neighborhoods. The city’s size and economic struggles contribute to crime rates well above state averages.
5. Waterbury
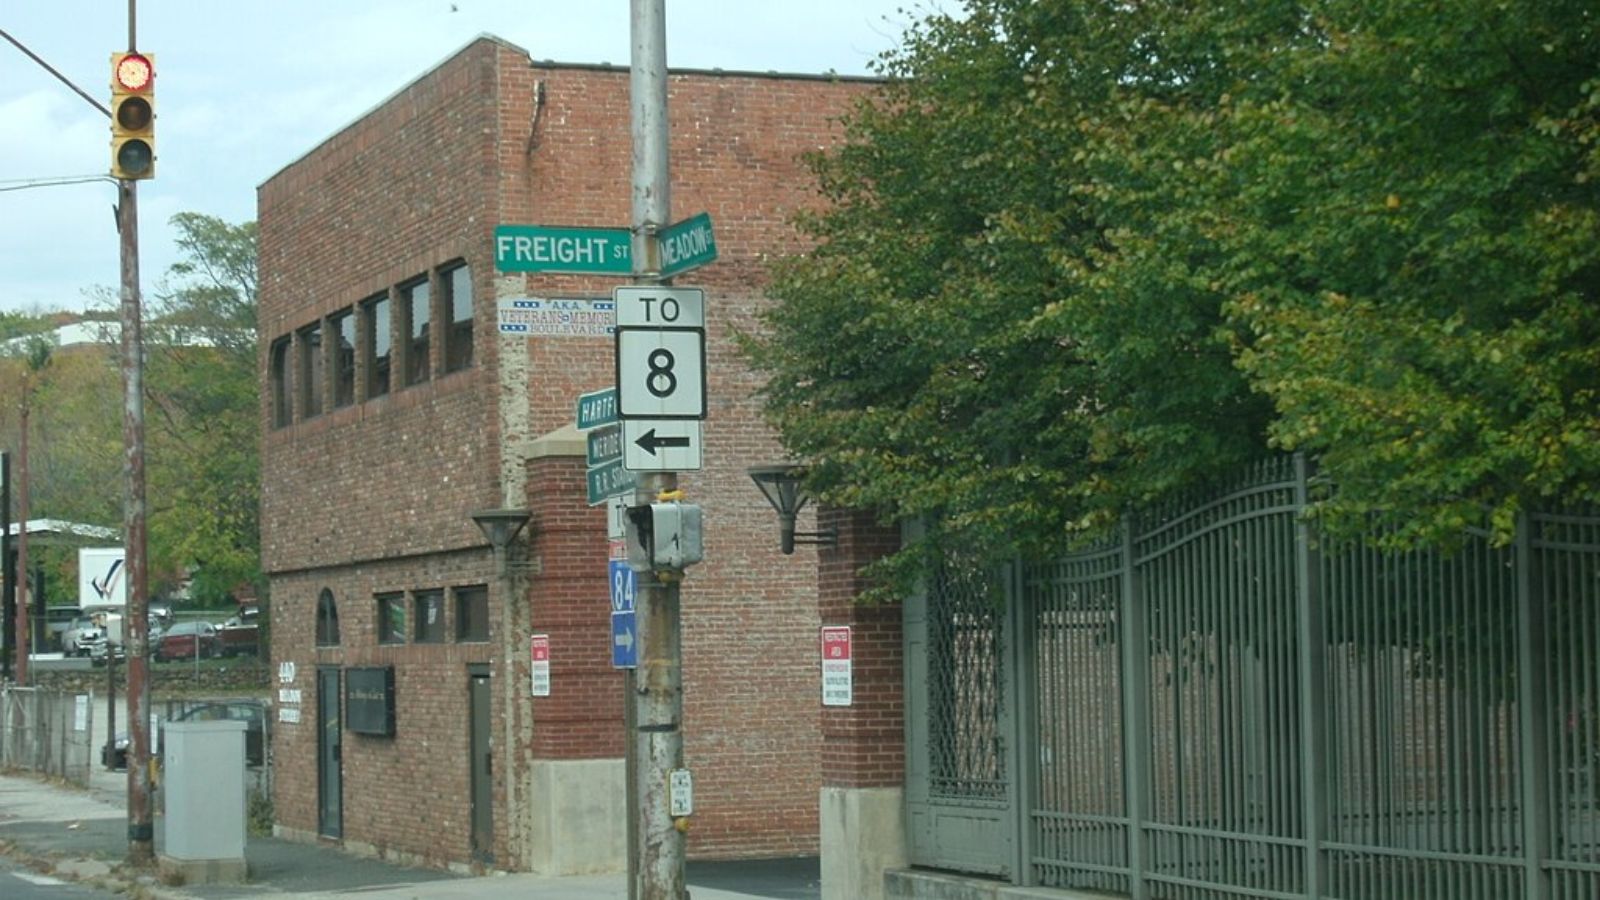
Population: 115,380
Crime Rate: Violent – 401 per 100,000; Property – 3,063 per 100,000
Waterbury combines high property crime rates with violent crime levels well above the state average. The former industrial city struggles with economic decline that contributes to both theft and violent incidents. Residents face elevated risks across multiple crime categories, making it one of Connecticut’s most challenging urban areas.
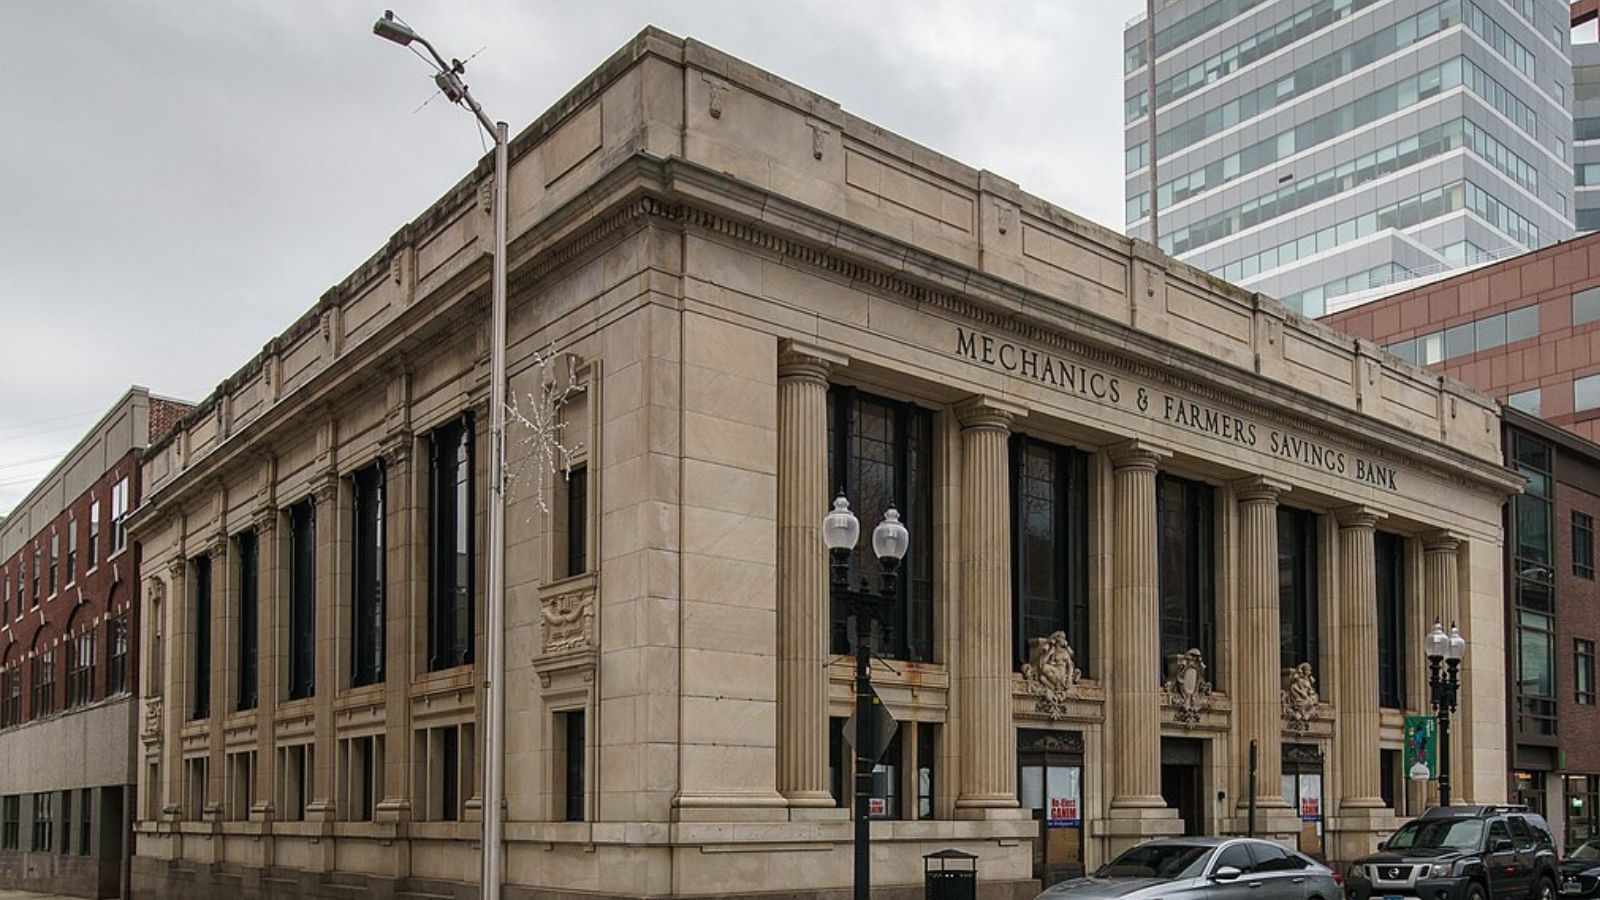
4. New Britain

Population: 74,609
Crime Rate: Violent – 489 per 100,000; Property – 2,309 per 100,000
Both violent and property crime rates in New Britain exceed those found in nearby suburban communities. The central Connecticut city deals with drug-related violence and property crimes linked to economic hardship. Manufacturing job losses have contributed to social problems that drive crime rates significantly above state norms.
3. New Haven

Population: 141,481
Crime Rate: Violent – 542 per 100,000; Property – 3,704 per 100,000
New Haven posts one of Connecticut’s highest property crime rates alongside elevated violent crime numbers. The home of Yale University experiences crime pressures from both urban decay and student-area incidents. Economic inequality and drug activity contribute to crime levels that make it one of the state’s most dangerous cities.
2. Hamden

Population: 60,691
Crime Rate: Violent – 557 per 100,000; Property – 2,966 per 100,000
Hamden combines elevated violent crime with high rates of theft and vehicle-related offenses. The suburban community adjacent to New Haven experiences spillover crime effects while facing its own public safety challenges. Both property and violent crime rates significantly exceed typical suburban Connecticut levels.
1. Hartford

🔥 Would you like to save this?
Population: 120,710
Crime Rate: Violent – 568 per 100,000; Property – 2,719 per 100,000
Connecticut’s capital city holds the state’s highest violent crime rate while also posting elevated property crime numbers. Hartford struggles with gang violence, drug trafficking, and economic problems that fuel both violent and property offenses. The combination of urban decay, poverty, and limited economic opportunities creates conditions for the state’s most serious crime challenges.
References
- Violent crime ranking and per‑100k figures come from the FBI UCR 2023 data aggregated by BeautifyData (updated Jan 9, 2025). Property crime per‑100k figures come from the corresponding 2023 BeautifyData ranking.
- NeighborhoodScout
- AreaVibes
Populations are from the Connecticut DESPP Crime in Connecticut 2023 (Table 52, “Law Enforcement Personnel by Agency,” which includes 2023 FBI population estimates).