🔥 Would you like to save this?
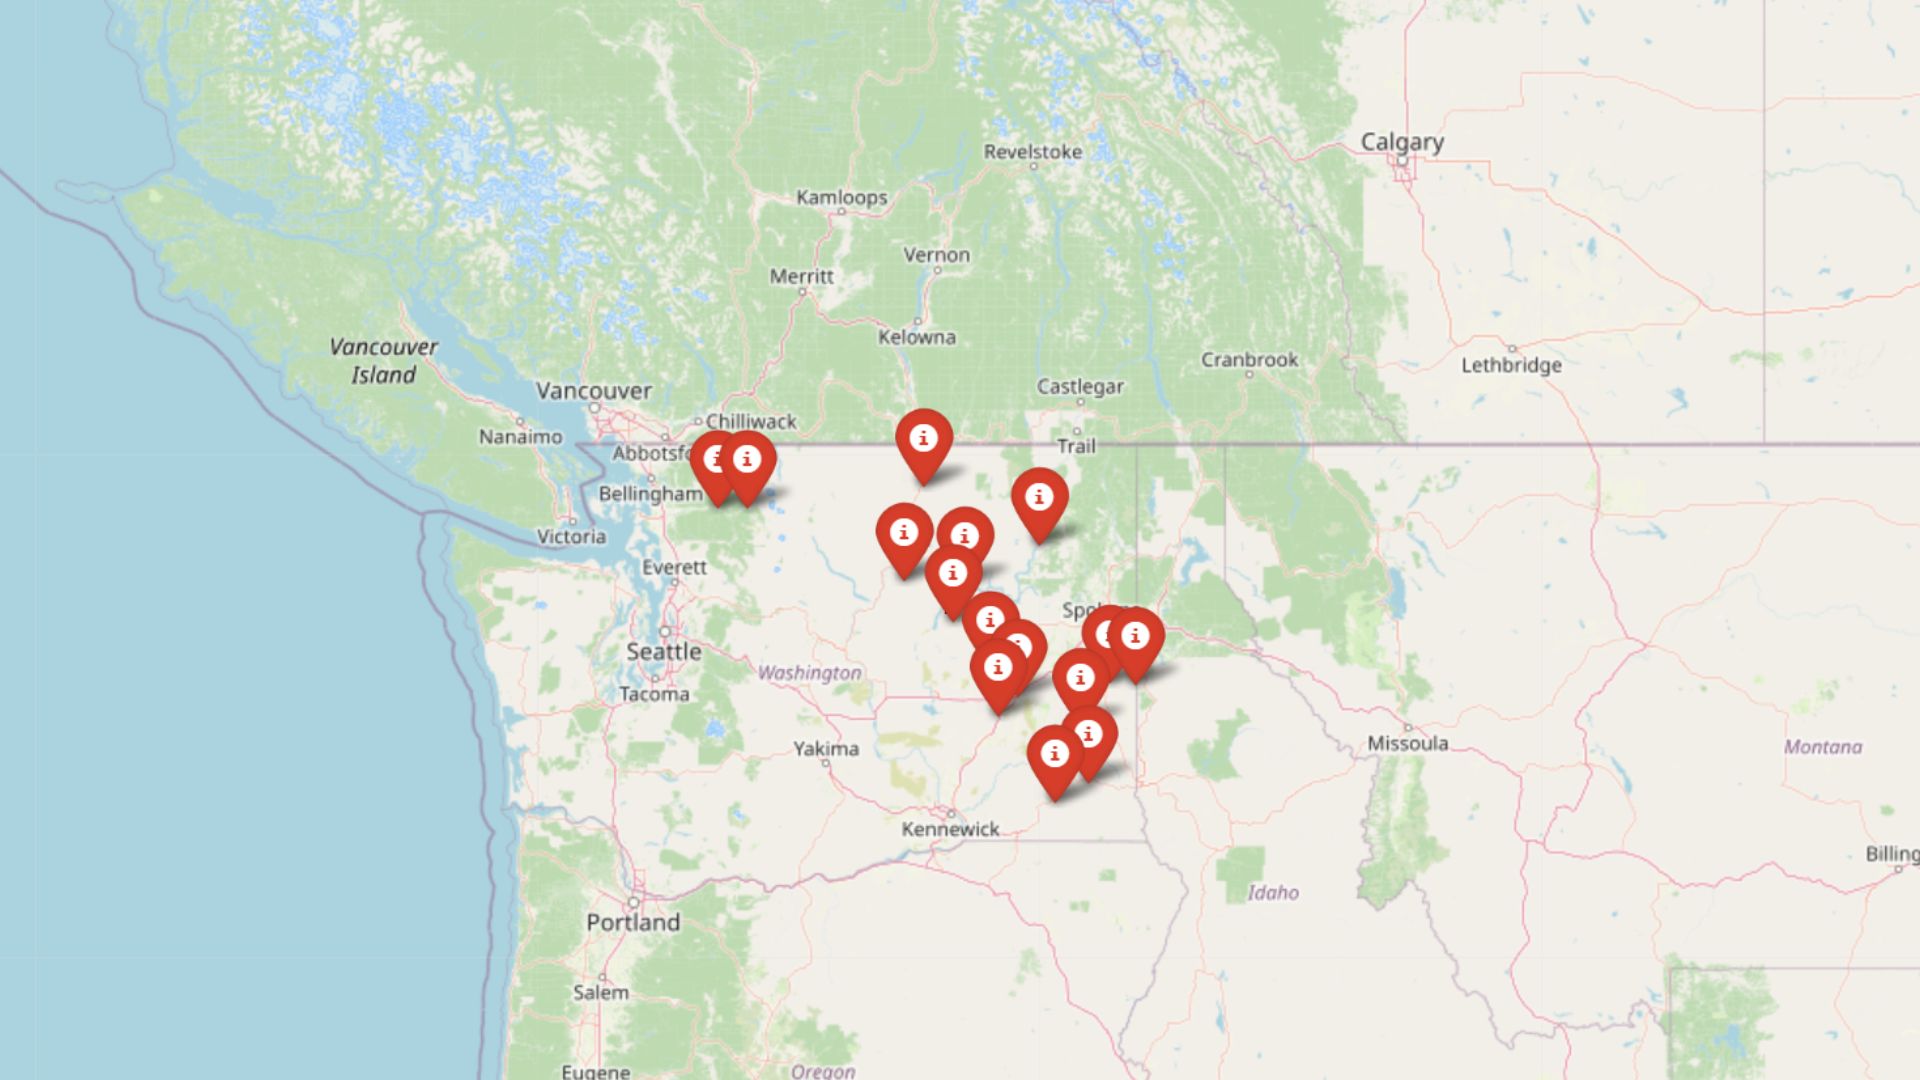
Washington’s urban housing markets may be climbing fast, but there are still towns where prices haven’t pushed buyers out. According to the Zillow Home Value Index, these 15 communities remain surprisingly affordable in 2025—offering a mix of rural charm, small-town living, and realistic price tags. From farming hubs to quiet inland retreats, they show where first-time buyers, budget-minded movers, and anyone seeking stability can still get a foothold in Washington’s market.
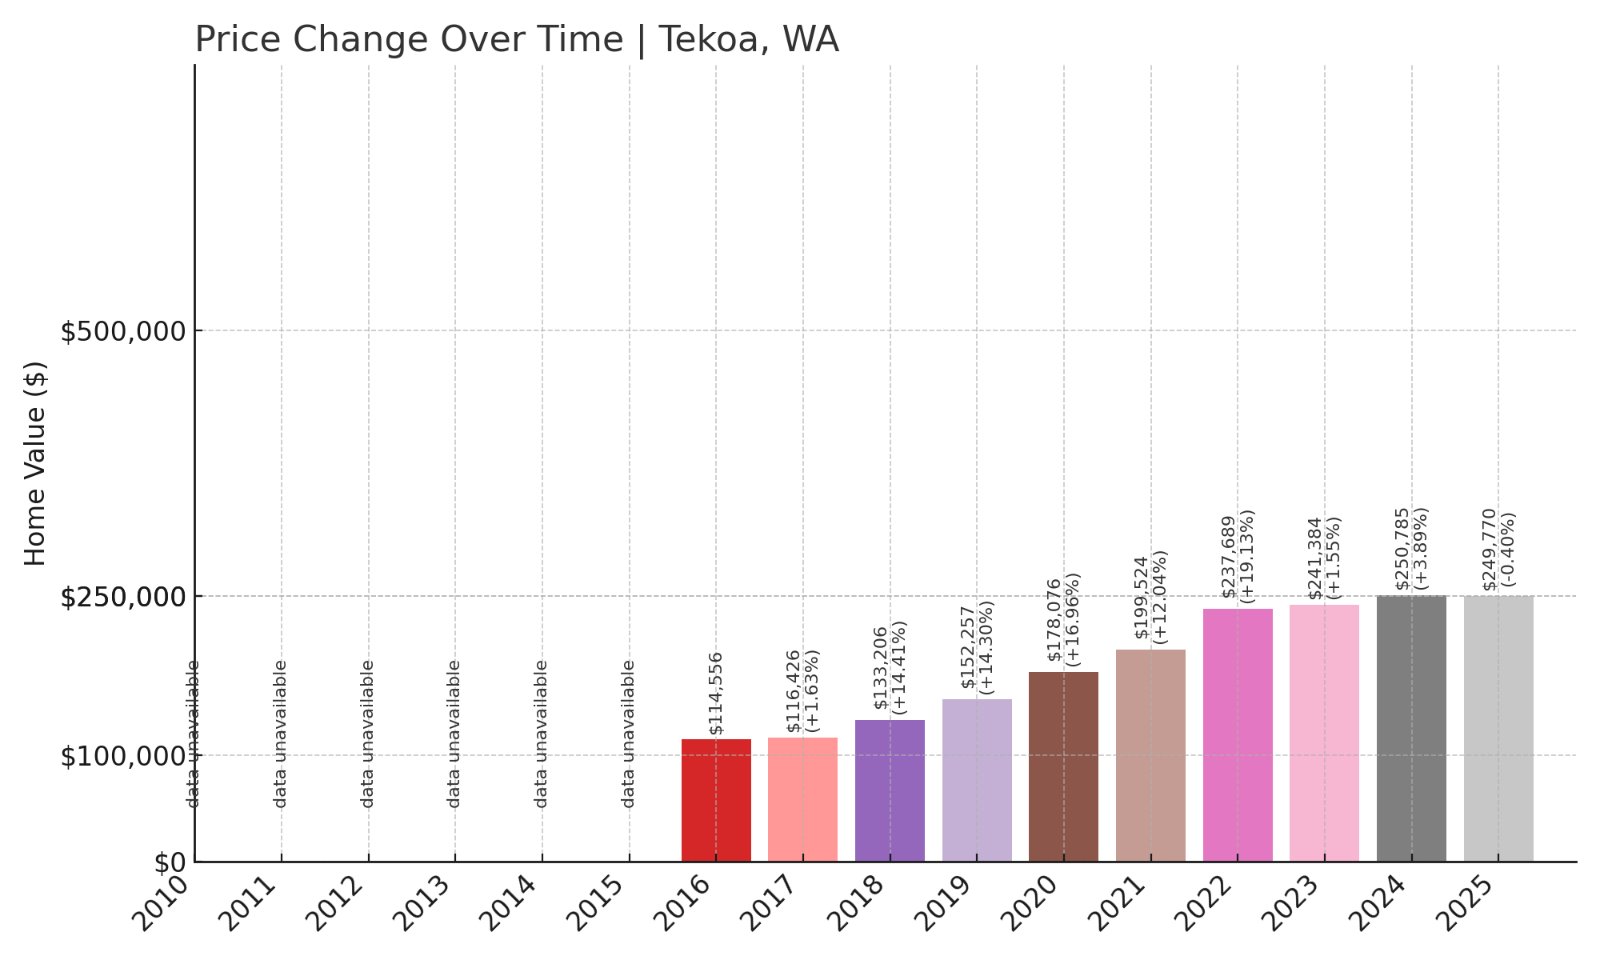
15. Tekoa – 118% Home Price Increase Since 2016
- 2010: N/A
- 2011: N/A
- 2012: N/A
- 2013: N/A
- 2014: N/A
- 2015: N/A
- 2016: $114,556
- 2017: $116,426 (+$1,870, +1.63% from previous year)
- 2018: $133,206 (+$16,780, +14.41% from previous year)
- 2019: $152,257 (+$19,051, +14.30% from previous year)
- 2020: $178,076 (+$25,818, +16.96% from previous year)
- 2021: $199,524 (+$21,449, +12.04% from previous year)
- 2022: $237,689 (+$38,165, +19.13% from previous year)
- 2023: $241,384 (+$3,695, +1.55% from previous year)
- 2024: $250,785 (+$9,401, +3.89% from previous year)
- 2025: $249,770 (-$1,016, -0.40% from previous year)
Tekoa’s home prices have increased by 118% since 2016, with the 2025 median at $249,770. Prices rose rapidly from 2016 to 2022, driven by new buyers entering this small town market, and have stabilized in recent years, showing only minor changes since 2023.
Tekoa – Small-Town Living in Whitman County
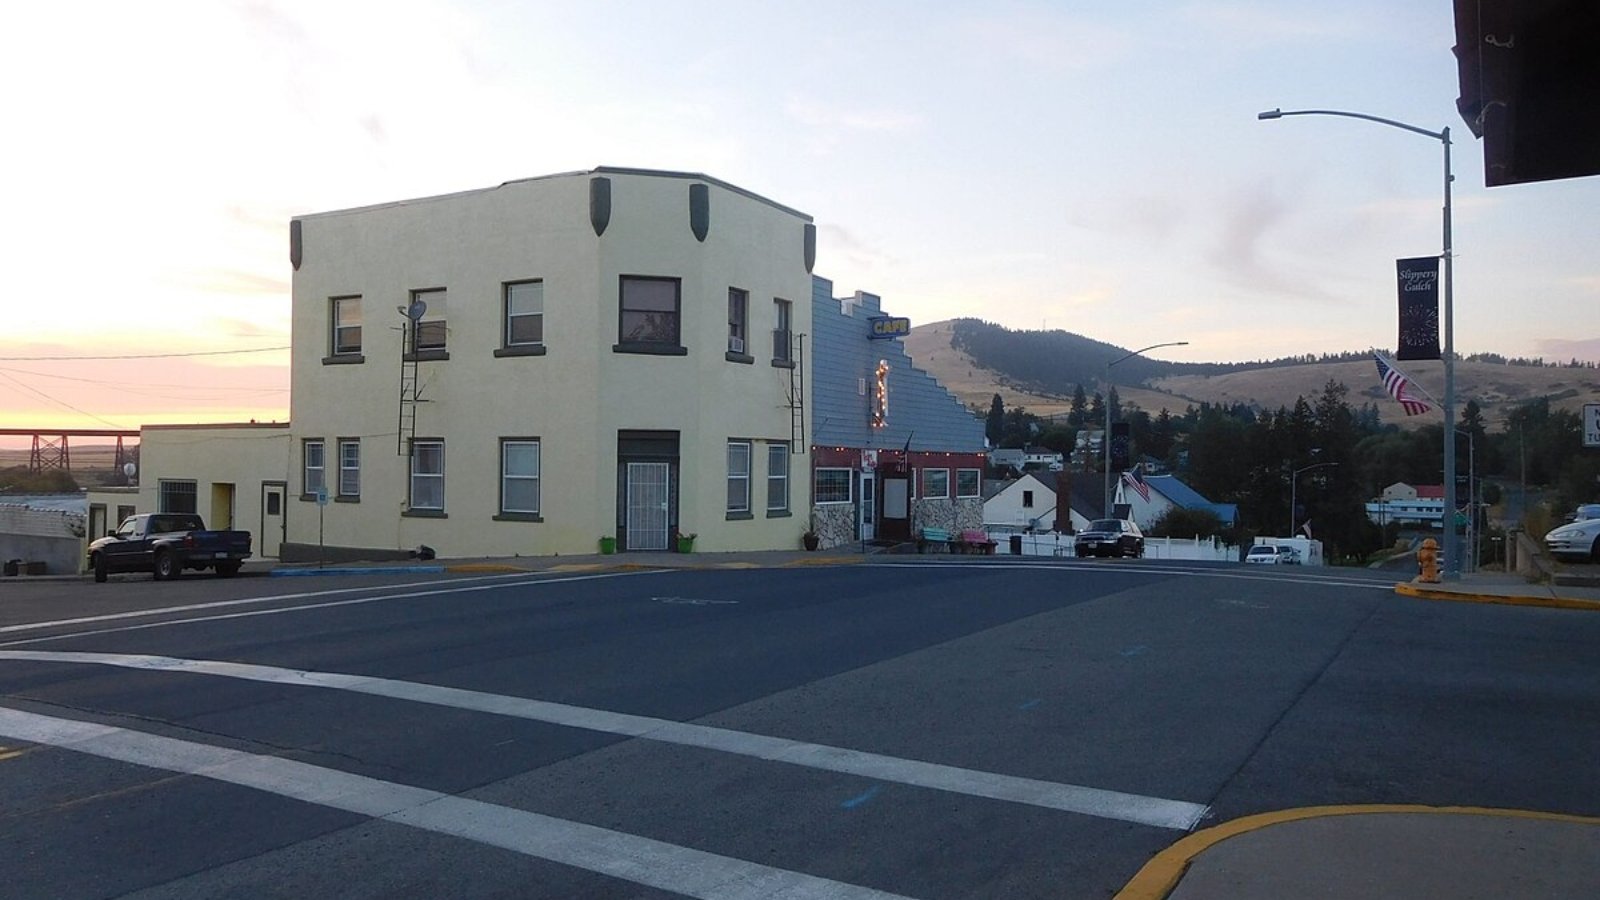
Tekoa is a quiet agricultural town in southeastern Washington near the Idaho border. Its proximity to Spokane makes it attractive to commuters looking for more affordable options. With a 2025 median home price just under $250,000, Tekoa remains more affordable than state averages while offering rolling hills, farmland views, and a welcoming community feel.
The town features basic amenities including schools and local shops, and it is near outdoor recreation opportunities like the John Wayne Pioneer Trail. Its recent price stability may attract homebuyers wanting rural life without volatile price swings seen elsewhere.
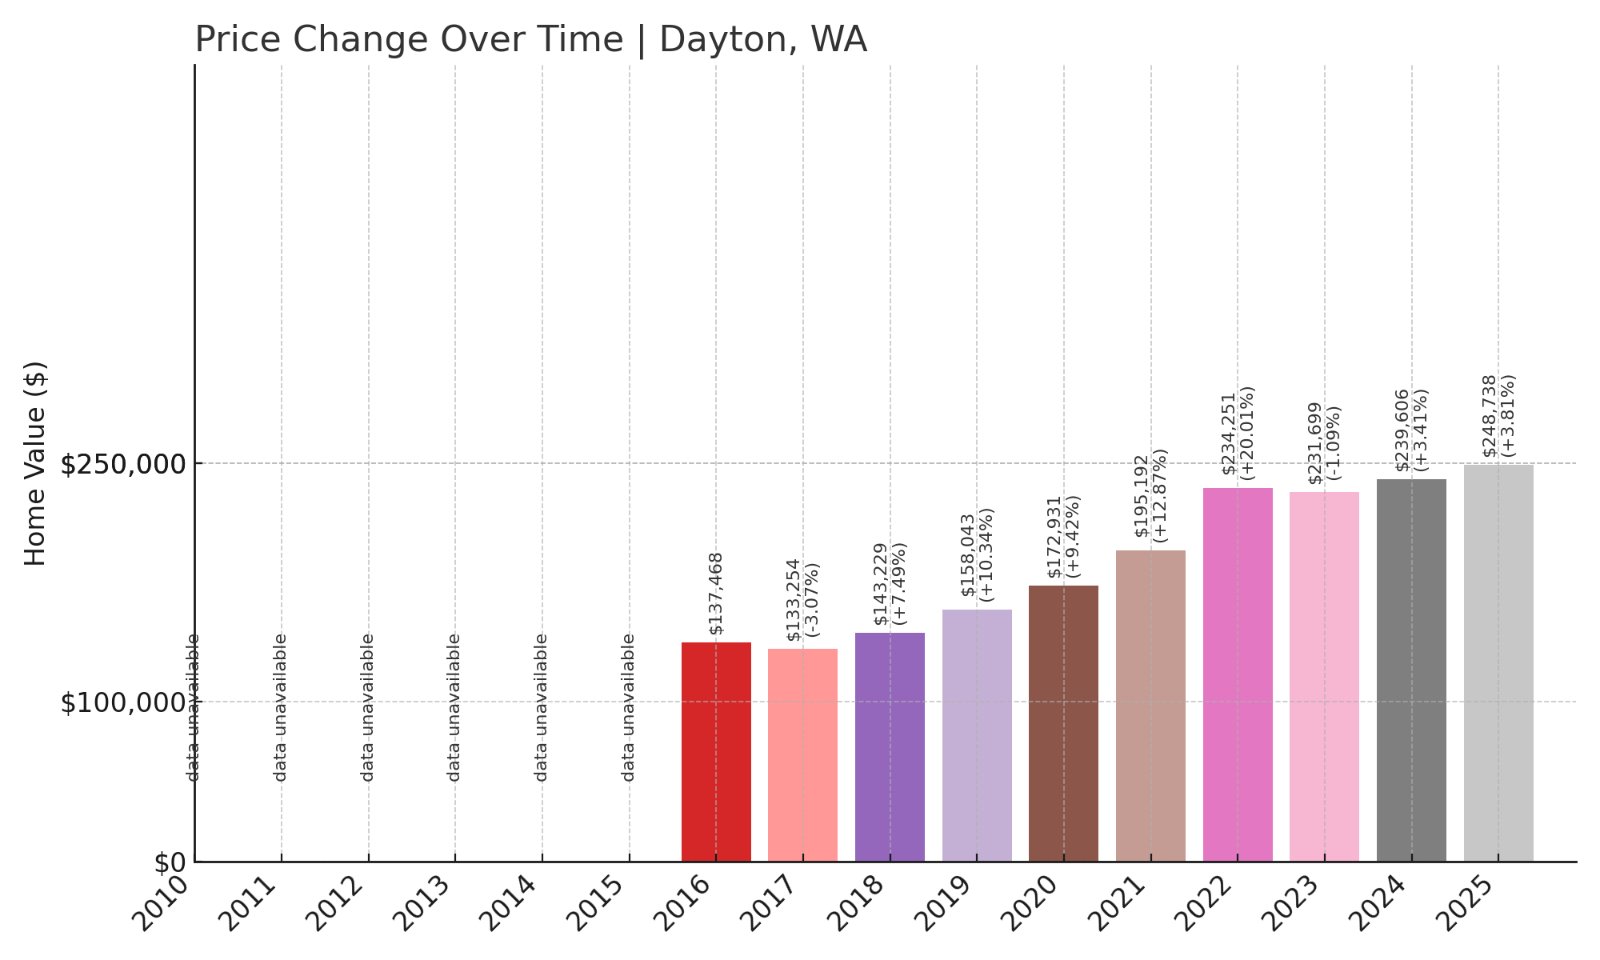
14. Dayton – 81% Home Price Increase Since 2016
- 2010: N/A
- 2011: N/A
- 2012: N/A
- 2013: N/A
- 2014: N/A
- 2015: N/A
- 2016: $137,468
- 2017: $133,254 (-$4,214, -3.07% from previous year)
- 2018: $143,229 (+$9,975, +7.49% from previous year)
- 2019: $158,043 (+$14,813, +10.34% from previous year)
- 2020: $172,931 (+$14,888, +9.42% from previous year)
- 2021: $195,192 (+$22,261, +12.87% from previous year)
- 2022: $234,251 (+$39,059, +20.01% from previous year)
- 2023: $231,699 (-$2,552, -1.09% from previous year)
- 2024: $239,606 (+$7,906, +3.41% from previous year)
- 2025: $248,738 (+$9,133, +3.81% from previous year)
Dayton’s home prices have climbed 81% since 2016, reaching $248,738 in 2025. After a slight decline in 2023, prices rebounded with steady growth over the last two years, reflecting its ongoing appeal to buyers seeking small-town life near southeastern Washington’s wine region.
Dayton – Historic Main Street and Agricultural Roots
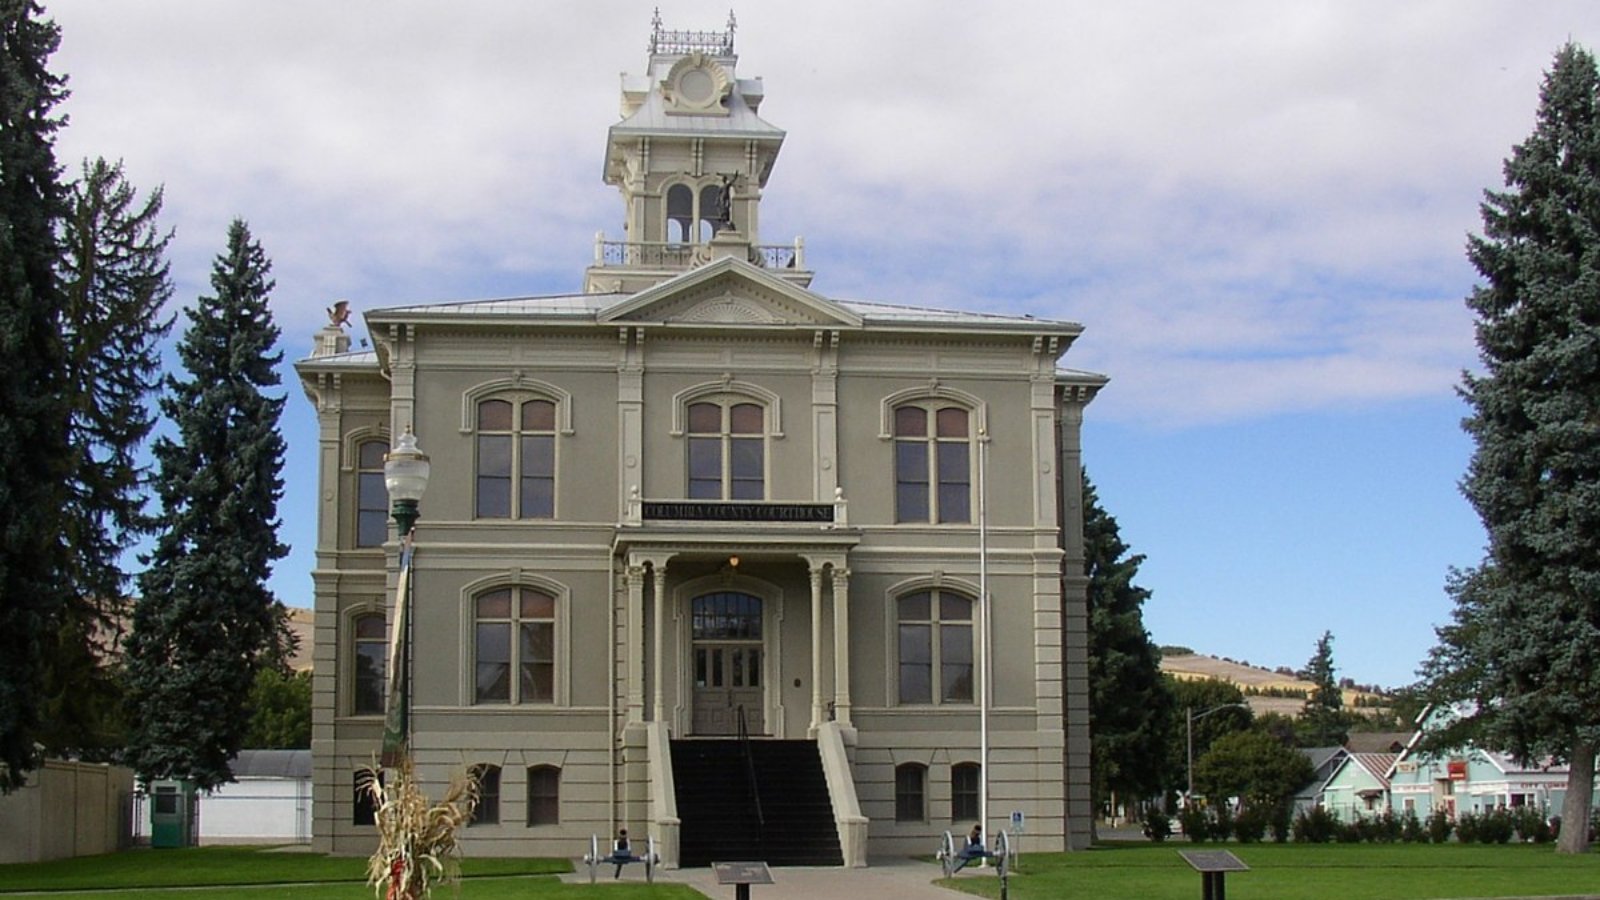
Dayton is located in Columbia County, known for its historic Main Street featuring preserved brick buildings and boutique shops. Its affordable housing market, with a median just under $250,000, draws both retirees and families looking for a quiet community setting.
The town offers schools, healthcare facilities, and easy access to the Blue Mountains for outdoor activities. Dayton’s strong housing growth in the late 2010s and early 2020s highlights its gradual transformation from an agricultural hub to a desirable small-town option for buyers priced out of larger markets.
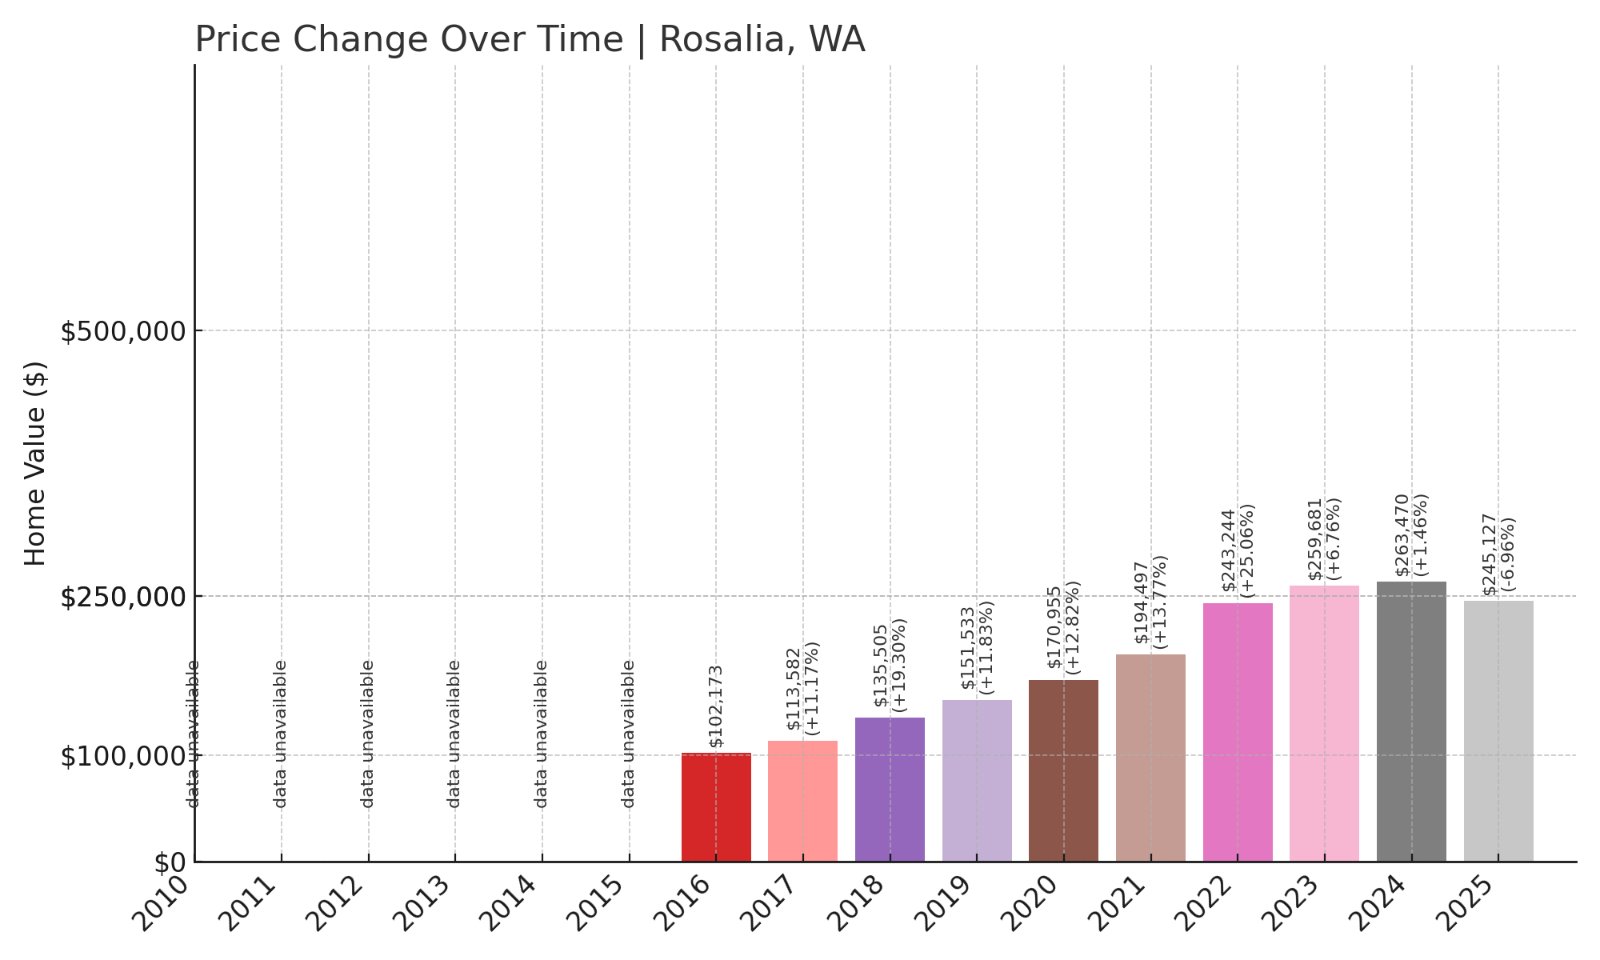
13. Rosalia – 140% Home Price Increase Since 2016
- 2010: N/A
- 2011: N/A
- 2012: N/A
- 2013: N/A
- 2014: N/A
- 2015: N/A
- 2016: $102,173
- 2017: $113,582 (+$11,409, +11.17% from previous year)
- 2018: $135,505 (+$21,922, +19.30% from previous year)
- 2019: $151,533 (+$16,028, +11.83% from previous year)
- 2020: $170,955 (+$19,422, +12.82% from previous year)
- 2021: $194,497 (+$23,542, +13.77% from previous year)
- 2022: $243,244 (+$48,746, +25.06% from previous year)
- 2023: $259,681 (+$16,437, +6.76% from previous year)
- 2024: $263,470 (+$3,789, +1.46% from previous year)
- 2025: $245,127 (-$18,342, -6.96% from previous year)
Rosalia’s home prices have surged by 140% since 2016, peaking at over $263,000 in 2024 before dropping nearly 7% to $245,127 in 2025. This decline may reflect market corrections after years of rapid increases.
Rosalia – Small Town with Fast Early Growth
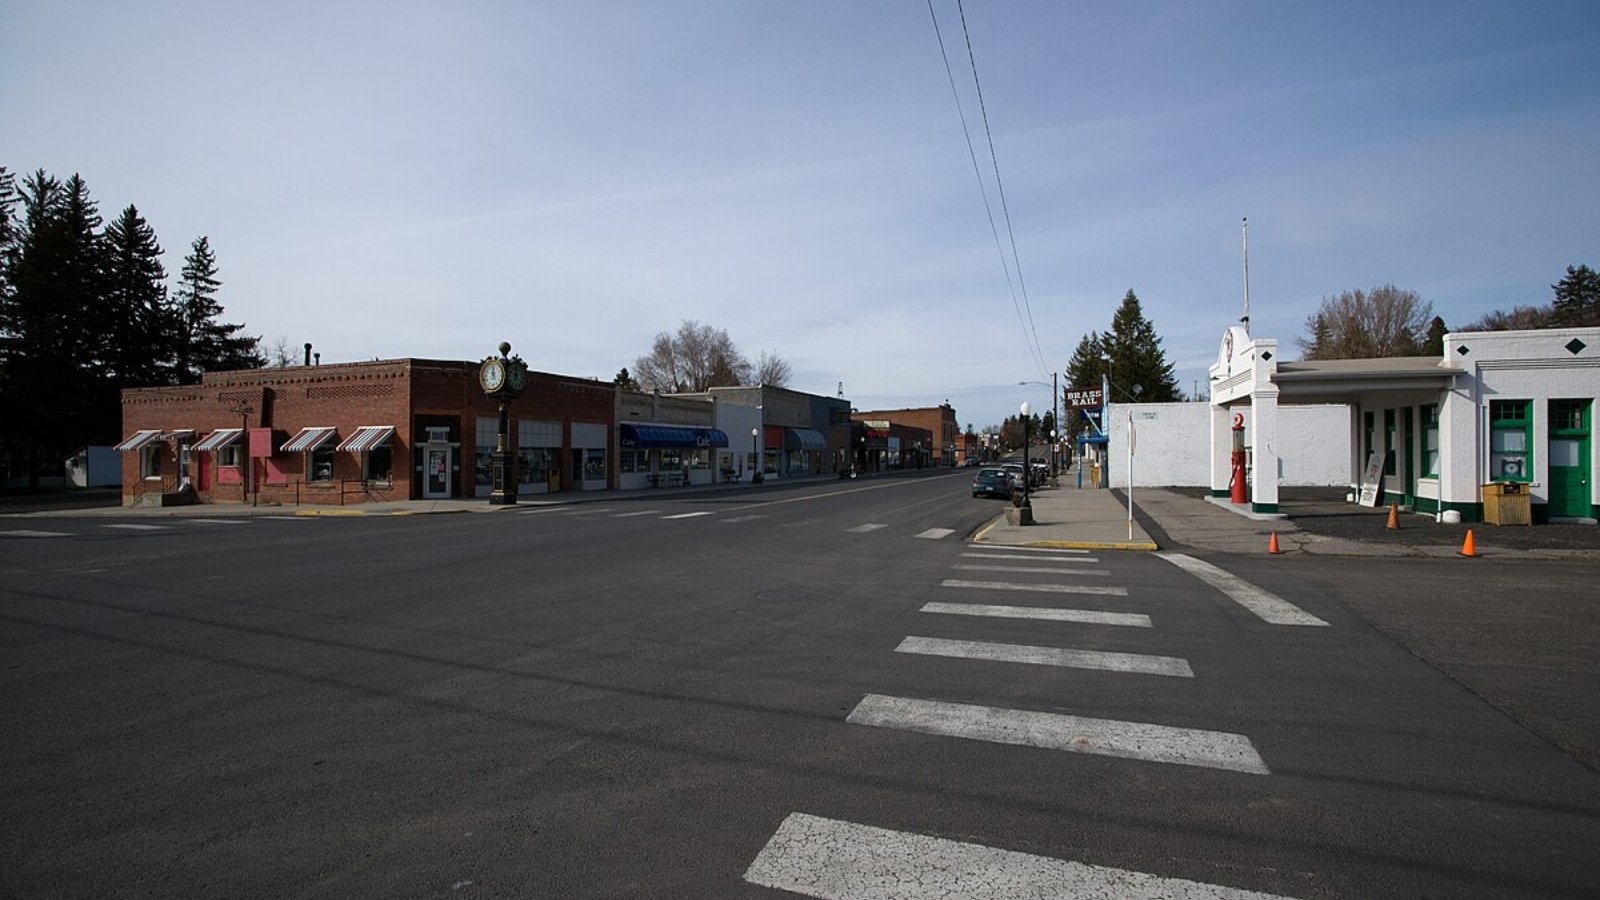
Rosalia is a rural community south of Spokane known for its historic railroad bridge and local wheat farms. Its housing market saw impressive growth from 2016 to 2022, driven by demand for affordable homes within commuting distance to Spokane.
Despite the recent price drop, Rosalia remains appealing to buyers looking for homes under $250,000 in a quiet farming community with basic amenities and strong local heritage. Its market may continue to adjust as prices stabilize following earlier rapid gains.
12. Ritzville – 145% Home Price Increase Since 2010
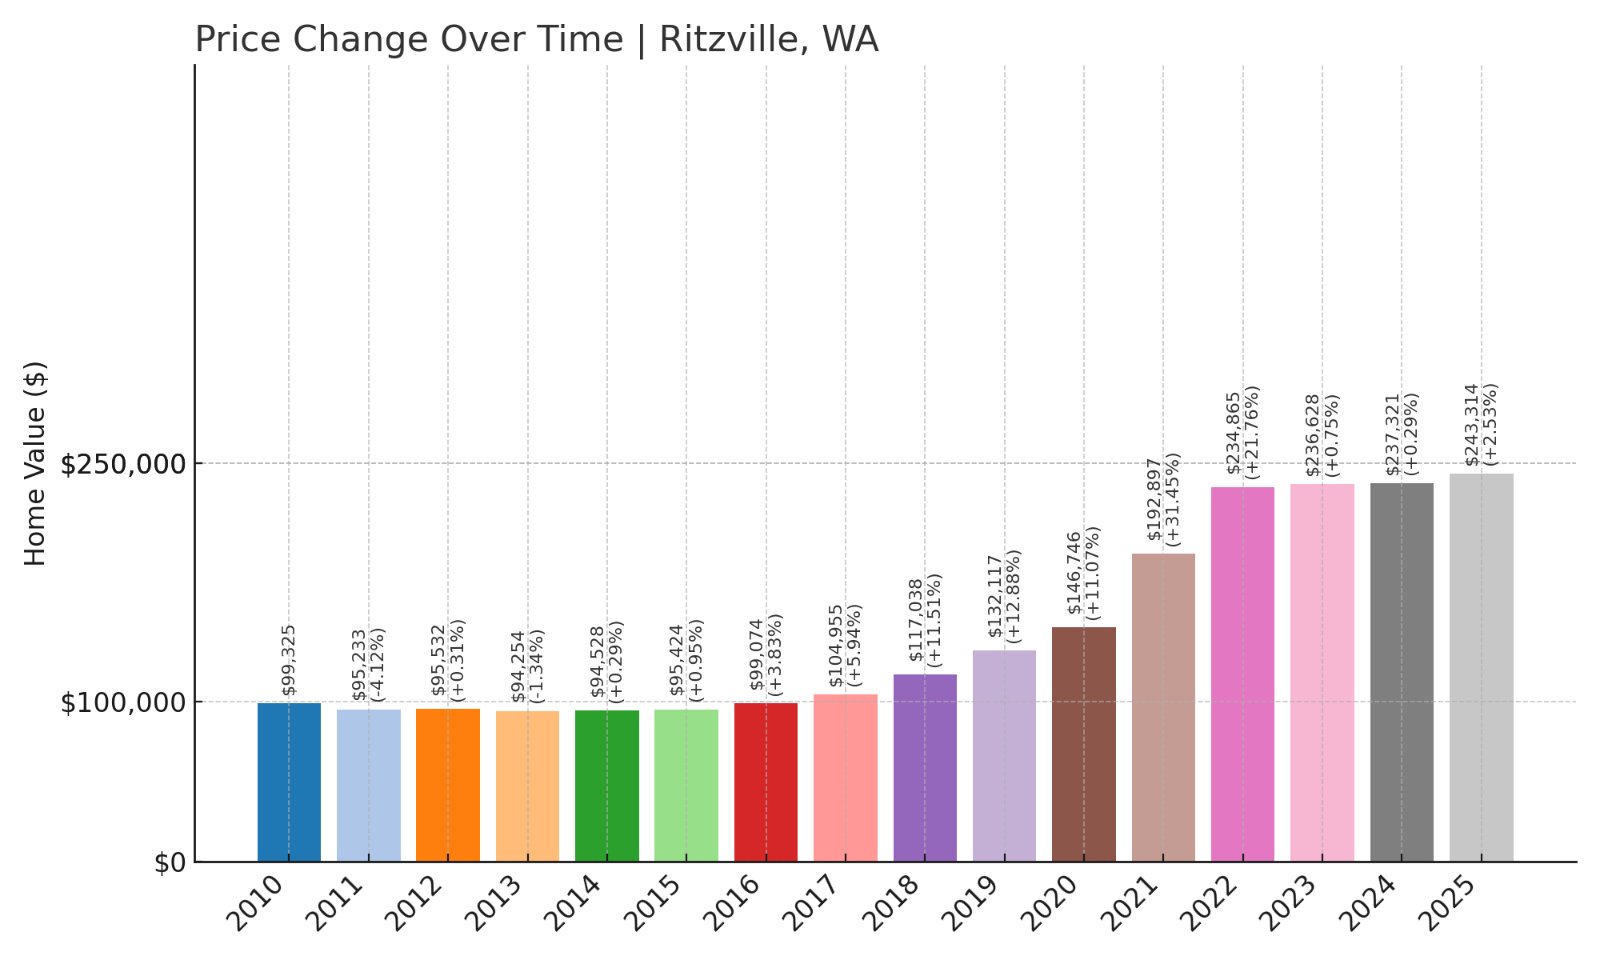
- 2010: $99,325
- 2011: $95,233 (-$4,092, -4.12% from previous year)
- 2012: $95,532 (+$299, +0.31% from previous year)
- 2013: $94,254 (-$1,278, -1.34% from previous year)
- 2014: $94,528 (+$274, +0.29% from previous year)
- 2015: $95,424 (+$896, +0.95% from previous year)
- 2016: $99,074 (+$3,651, +3.83% from previous year)
- 2017: $104,955 (+$5,881, +5.94% from previous year)
- 2018: $117,038 (+$12,083, +11.51% from previous year)
- 2019: $132,117 (+$15,078, +12.88% from previous year)
- 2020: $146,746 (+$14,629, +11.07% from previous year)
- 2021: $192,897 (+$46,151, +31.45% from previous year)
- 2022: $234,865 (+$41,968, +21.76% from previous year)
- 2023: $236,628 (+$1,763, +0.75% from previous year)
- 2024: $237,321 (+$693, +0.29% from previous year)
- 2025: $243,314 (+$5,993, +2.53% from previous year)
Ritzville’s home prices have climbed by 145% since 2010, reaching $243,314 in 2025. Rapid growth between 2020 and 2022 has slowed, suggesting a stabilizing market that remains accessible to budget-conscious buyers.
Ritzville – Interstate Access with Historic Downtown
Ritzville sits along I-90 in Adams County, providing a convenient location for travelers between Spokane and Seattle. Its economy is rooted in wheat farming, and its historic brick downtown offers shops and cafes that reflect its agricultural heritage.
The town’s housing market remains attractive, with prices under $250,000 despite its significant growth over the last decade. Buyers value Ritzville’s small-town atmosphere and strategic location for both rural living and regional travel connections.
11. Tonasket – 102% Home Price Increase Since 2010
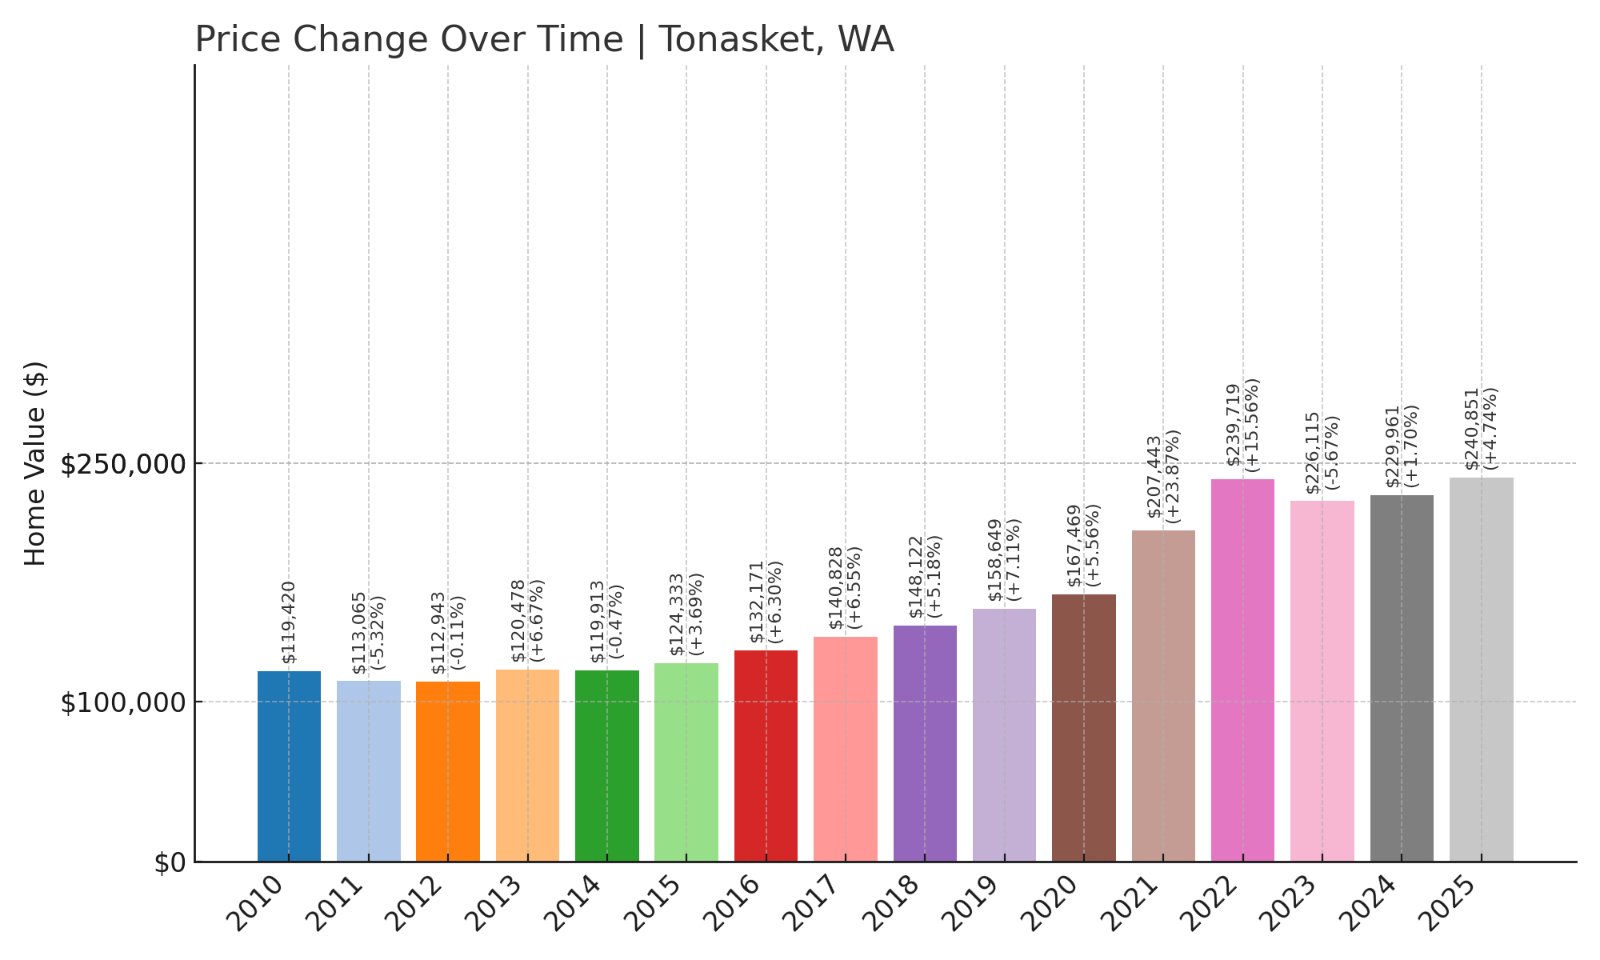
- 2010: $119,420
- 2011: $113,065 (-$6,355, -5.32% from previous year)
- 2012: $112,943 (-$122, -0.11% from previous year)
- 2013: $120,478 (+$7,534, +6.67% from previous year)
- 2014: $119,913 (-$564, -0.47% from previous year)
- 2015: $124,333 (+$4,420, +3.69% from previous year)
- 2016: $132,171 (+$7,838, +6.30% from previous year)
- 2017: $140,828 (+$8,657, +6.55% from previous year)
- 2018: $148,122 (+$7,295, +5.18% from previous year)
- 2019: $158,649 (+$10,527, +7.11% from previous year)
- 2020: $167,469 (+$8,820, +5.56% from previous year)
- 2021: $207,443 (+$39,974, +23.87% from previous year)
- 2022: $239,719 (+$32,276, +15.56% from previous year)
- 2023: $226,115 (-$13,603, -5.67% from previous year)
- 2024: $229,961 (+$3,846, +1.70% from previous year)
- 2025: $240,851 (+$10,890, +4.74% from previous year)
Tonasket’s home prices have risen 102% since 2010, ending at $240,851 in 2025. After a dip in 2023, prices recovered, reflecting solid market interest in this northern Washington community.
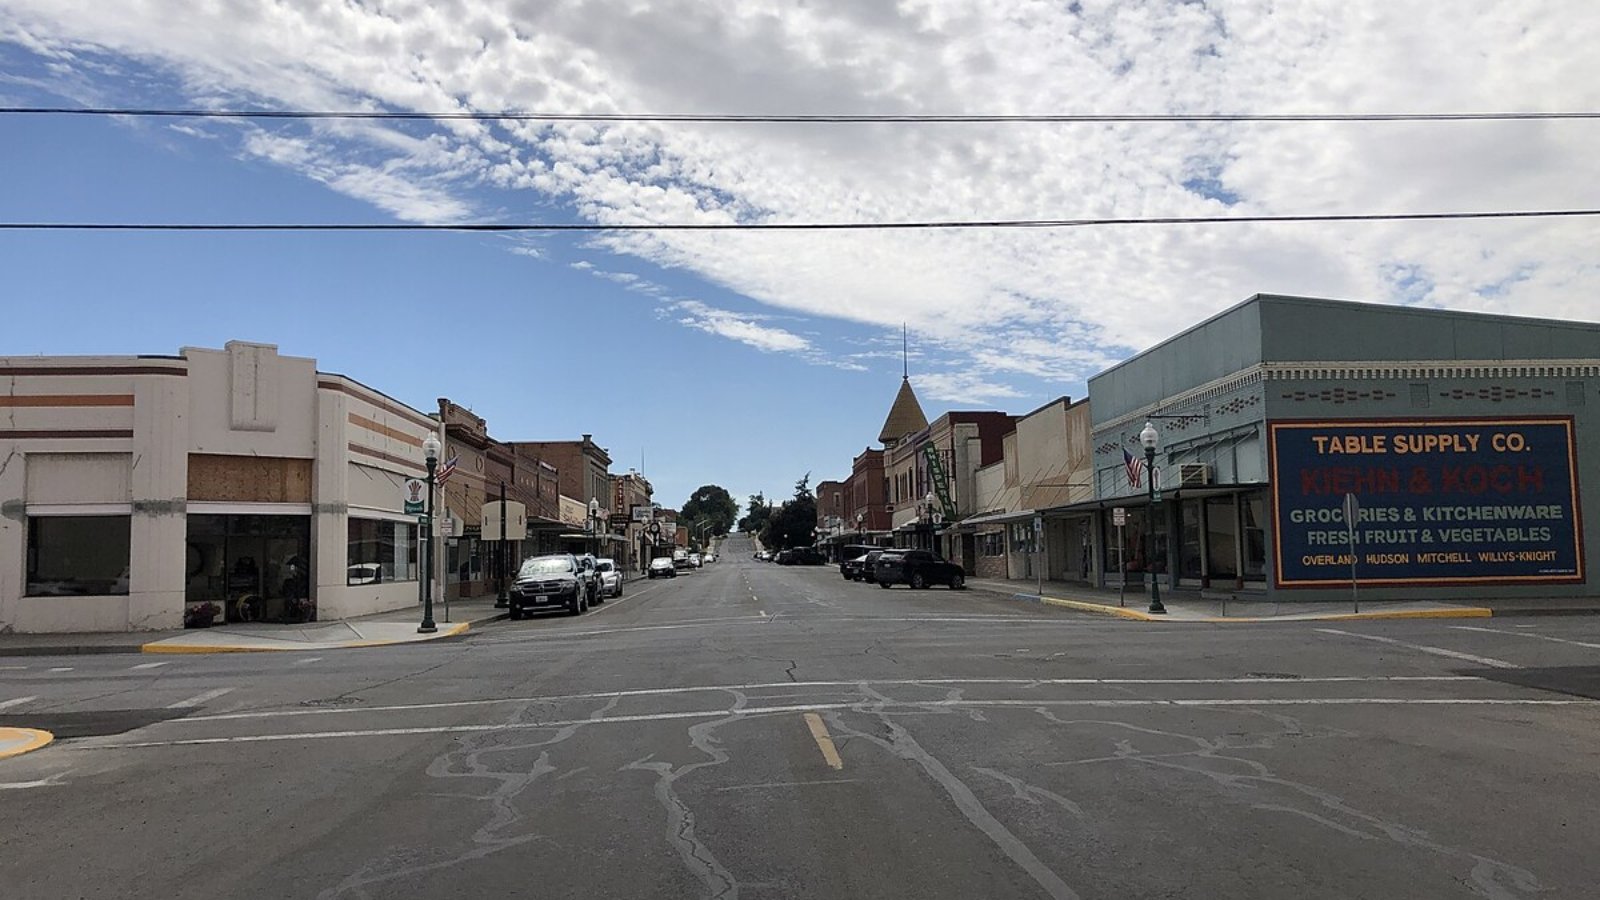
Tonasket – Northern Orchards and River Views
Tonasket is located along the Okanogan River in north-central Washington. Its economy is driven by agriculture, including apples and cherries, and it is surrounded by mountain and river scenery. The town’s housing prices peaked in 2022 before dropping slightly and recovering this year.
With a median price under $250,000, Tonasket remains affordable for families and retirees seeking a rural home base. Its amenities include local schools, parks, and access to national forest areas, offering both practicality and outdoor living opportunities.
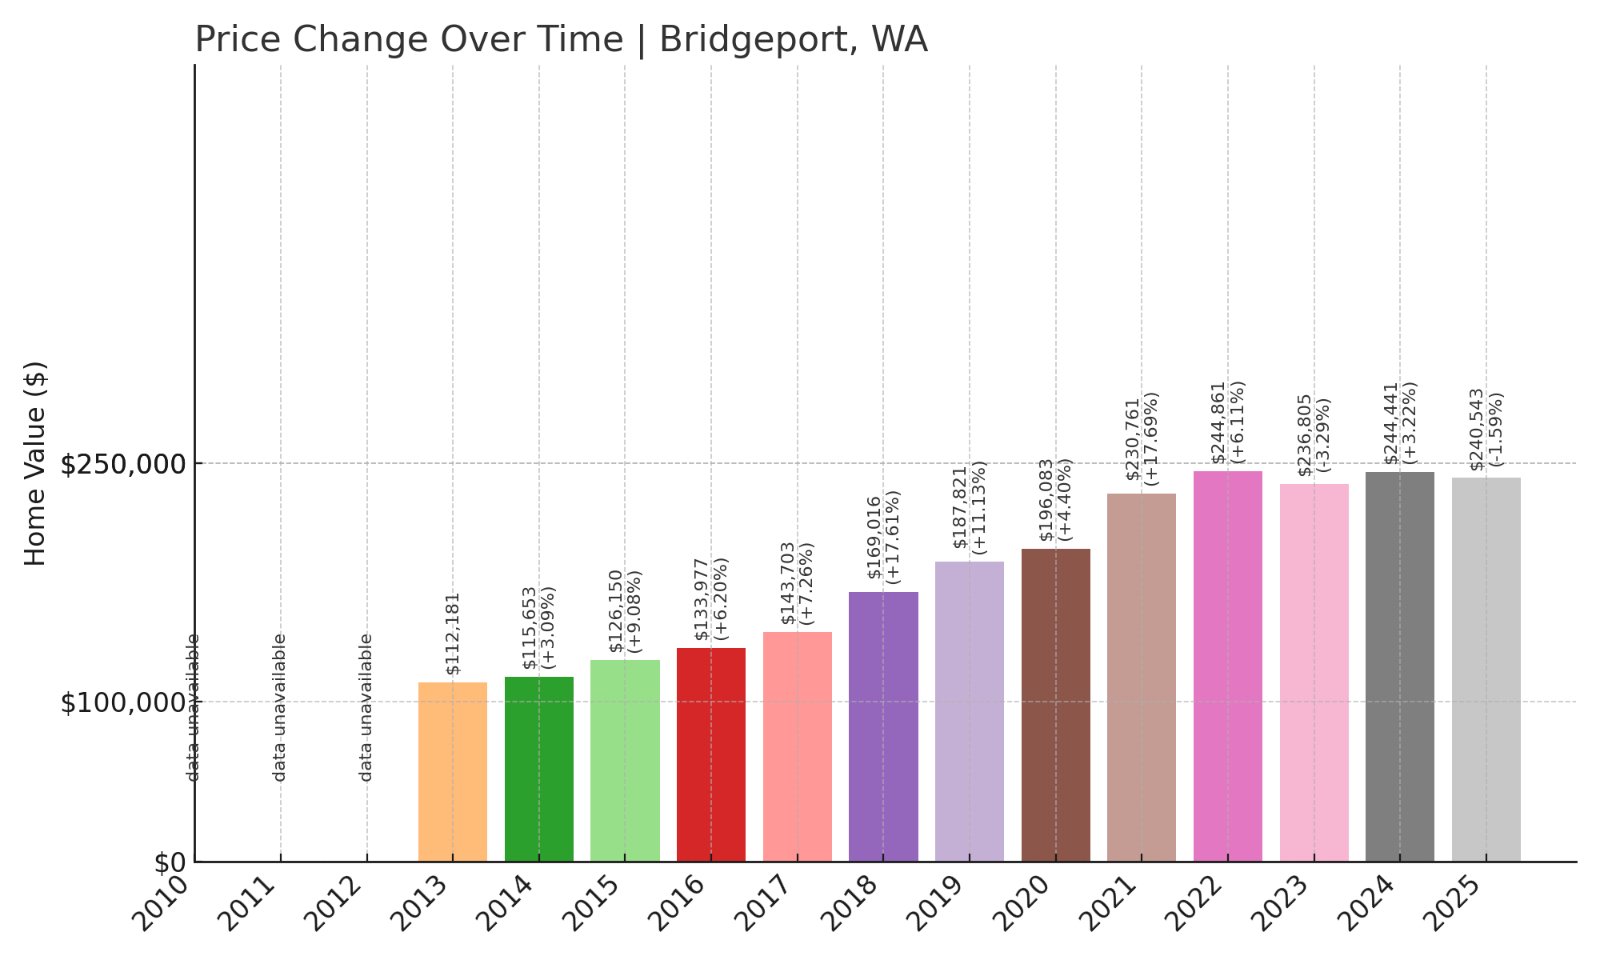
10. Bridgeport – 114% Home Price Increase Since 2013
- 2010: N/A
- 2011: N/A
- 2012: N/A
- 2013: $112,181
- 2014: $115,653 (+$3,472, +3.10% from previous year)
- 2015: $126,150 (+$10,497, +9.08% from previous year)
- 2016: $133,977 (+$7,827, +6.20% from previous year)
- 2017: $143,703 (+$9,727, +7.26% from previous year)
- 2018: $169,016 (+$25,312, +17.61% from previous year)
- 2019: $187,821 (+$18,805, +11.13% from previous year)
- 2020: $196,083 (+$8,262, +4.40% from previous year)
- 2021: $230,761 (+$34,678, +17.69% from previous year)
- 2022: $244,861 (+$14,100, +6.11% from previous year)
- 2023: $236,805 (-$8,055, -3.29% from previous year)
- 2024: $244,441 (+$7,636, +3.22% from previous year)
- 2025: $240,543 (-$3,898, -1.59% from previous year)
Bridgeport’s home prices have increased by 114% since 2013, reaching $240,543 in 2025. After peaking in 2021, prices dipped slightly but have generally remained stable, keeping this small Douglas County town accessible to buyers.
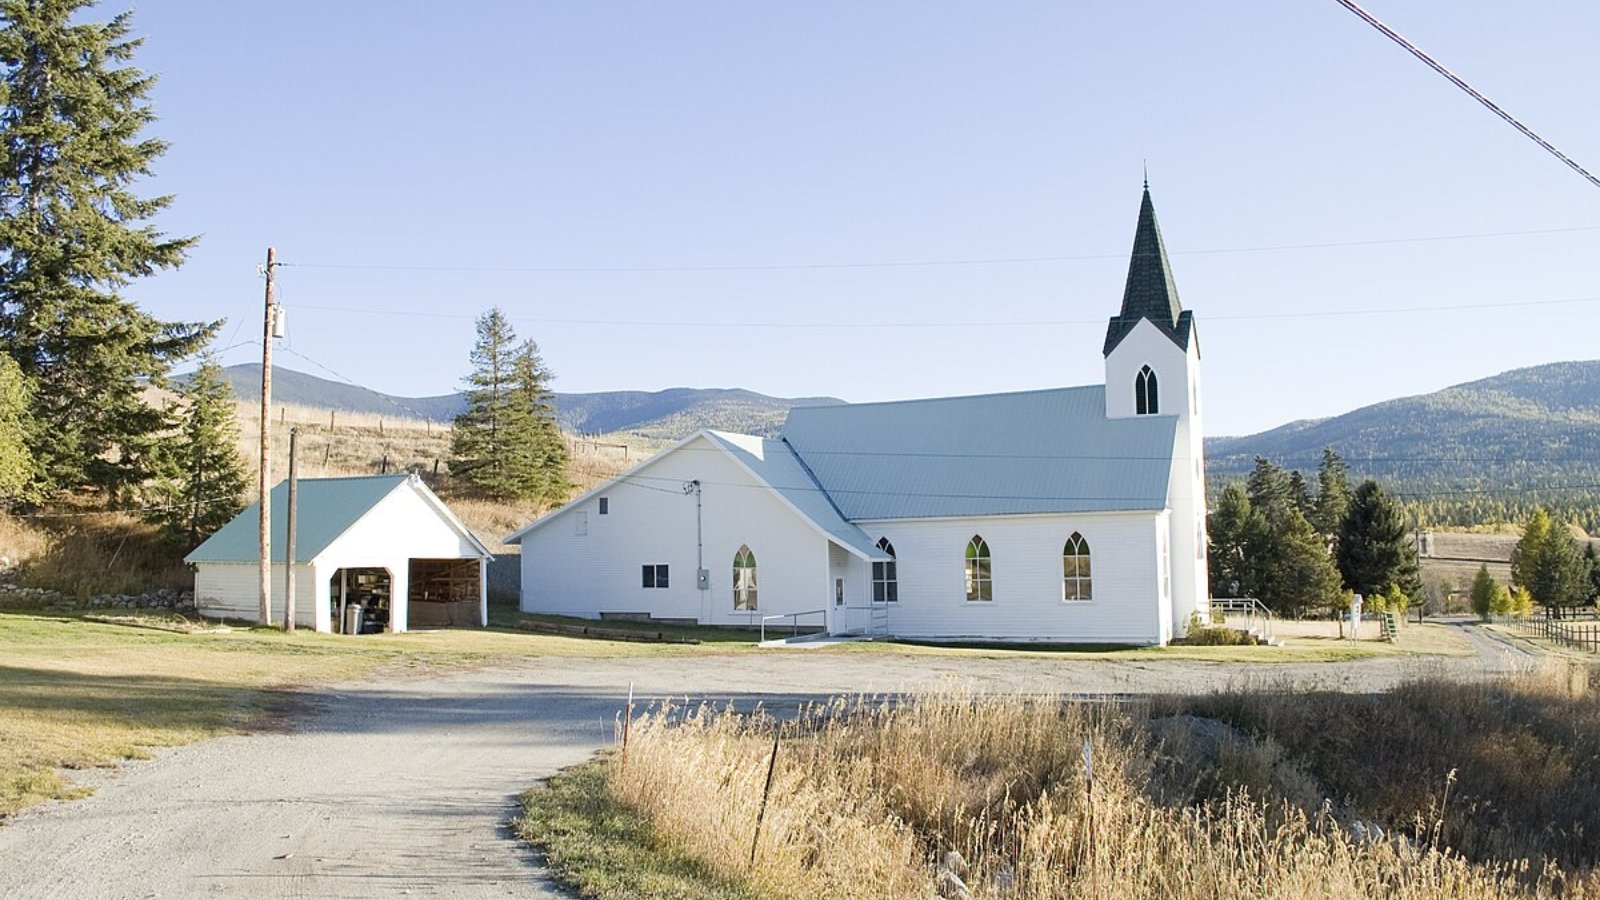
Bridgeport – Affordable Homes Along the Columbia River
Bridgeport is located on the Columbia River in north-central Washington, near Chief Joseph Dam. The town has a strong agricultural presence, with orchards and farms providing local employment. Its housing market grew rapidly from 2013 through 2021 before flattening out in recent years.
Bridgeport’s 2025 median price of around $241,000 remains lower than many other river communities. Residents value the quiet atmosphere, local schools, and outdoor activities such as fishing, boating, and camping nearby. Recent stabilization of prices may make it an attractive long-term choice for homebuyers seeking affordable riverside living.
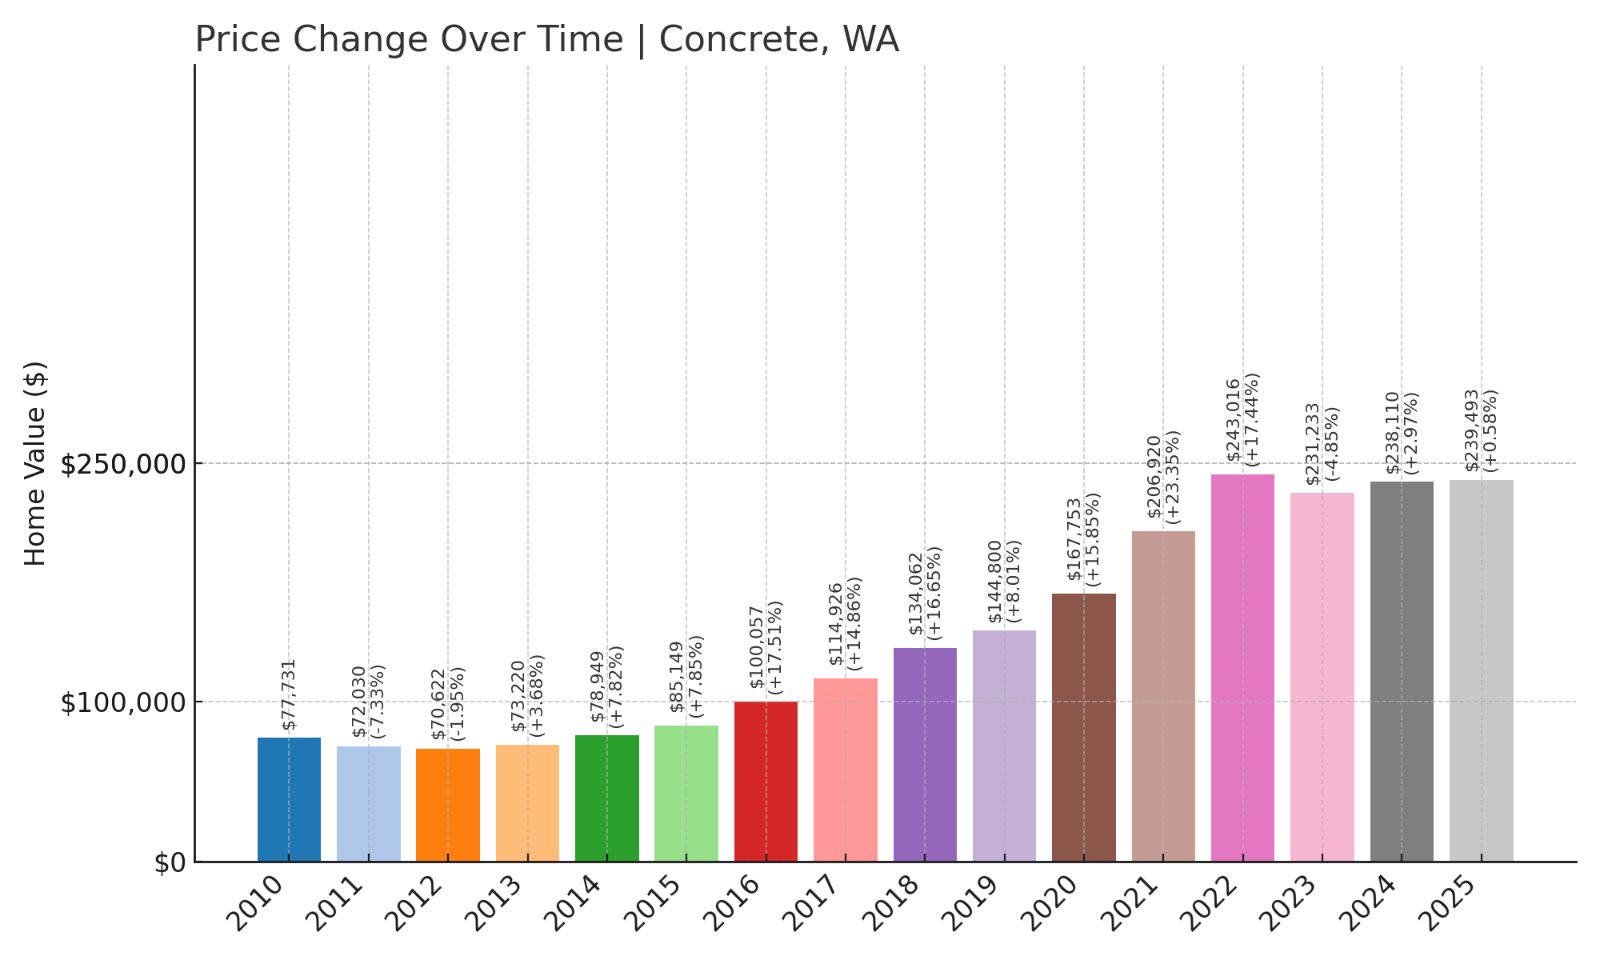
9. Concrete – 208% Home Price Increase Since 2010
🔥 Would you like to save this?
- 2010: $77,731
- 2011: $72,030 (-$5,701, -7.33% from previous year)
- 2012: $70,622 (-$1,407, -1.95% from previous year)
- 2013: $73,220 (+$2,598, +3.68% from previous year)
- 2014: $78,949 (+$5,728, +7.82% from previous year)
- 2015: $85,149 (+$6,200, +7.85% from previous year)
- 2016: $100,057 (+$14,908, +17.51% from previous year)
- 2017: $114,926 (+$14,869, +14.86% from previous year)
- 2018: $134,062 (+$19,136, +16.65% from previous year)
- 2019: $144,800 (+$10,738, +8.01% from previous year)
- 2020: $167,753 (+$22,953, +15.85% from previous year)
- 2021: $206,920 (+$39,167, +23.35% from previous year)
- 2022: $243,016 (+$36,096, +17.44% from previous year)
- 2023: $231,233 (-$11,783, -4.85% from previous year)
- 2024: $238,110 (+$6,877, +2.97% from previous year)
- 2025: $239,493 (+$1,384, +0.58% from previous year)
Concrete’s home prices have surged 208% since 2010, reaching $239,493 in 2025. After years of strong gains, the market has stabilized recently, with smaller annual increases in the last two years.
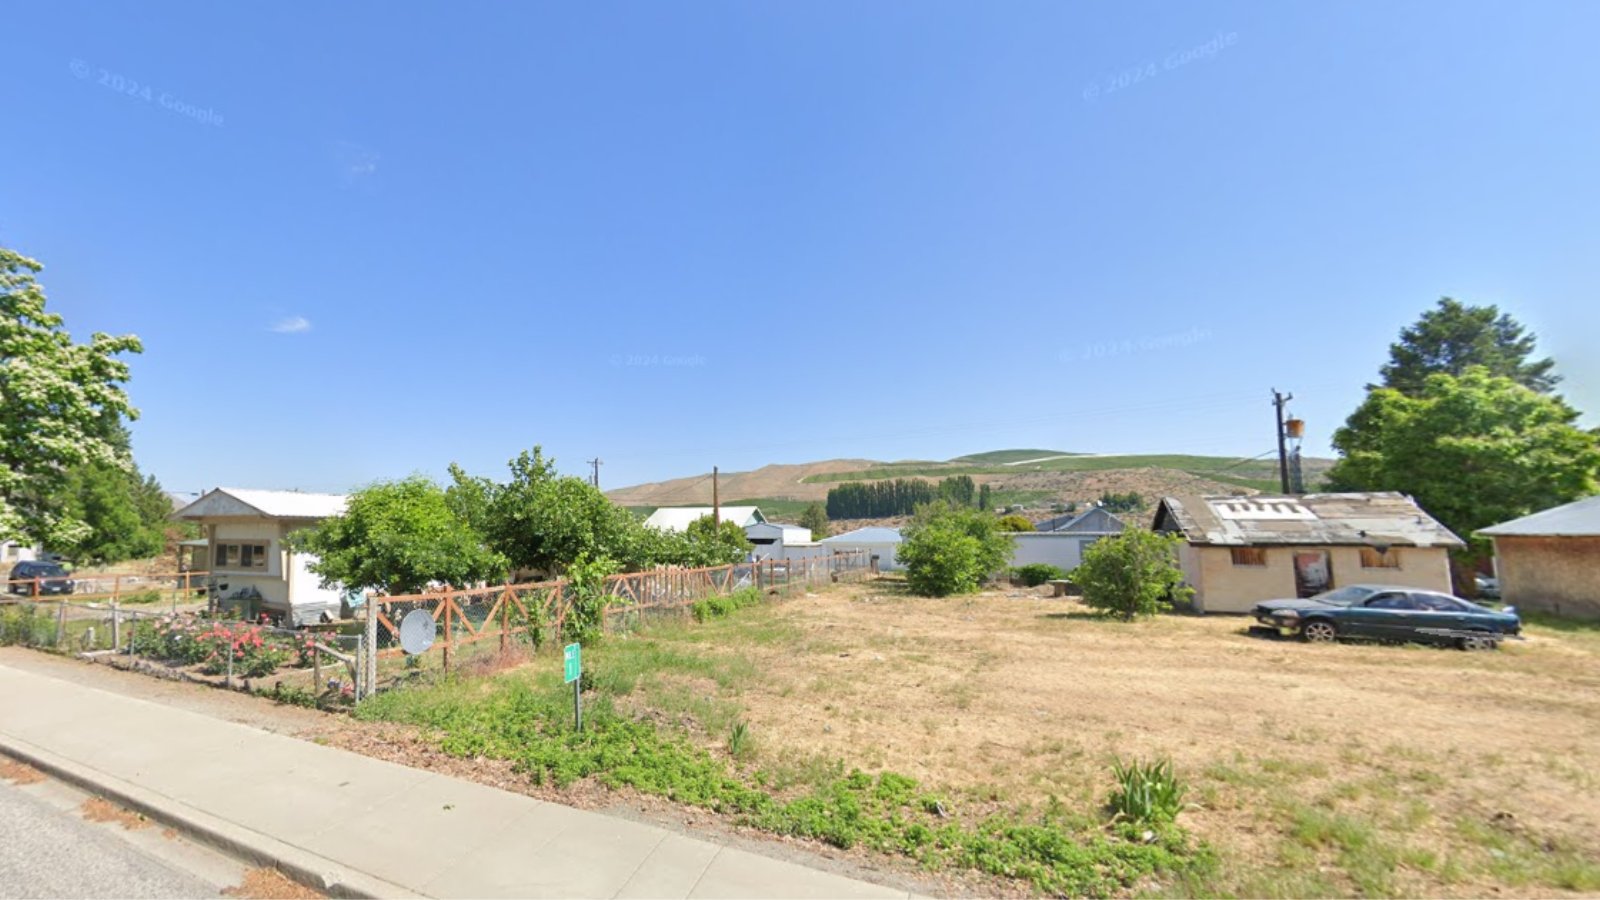
Concrete – Skagit County’s Historic Mill Town
Concrete sits in Skagit County along the Skagit River, near the foothills of the North Cascades. Known for its cement production history, Concrete offers small-town living surrounded by forests and rivers. The housing market grew steadily from 2010, driven by buyers seeking affordable homes near outdoor recreation areas.
With a 2025 median home price under $240,000, Concrete remains accessible compared to coastal communities. Its downtown features historic buildings, while the surrounding area provides camping, hiking, and fishing opportunities. Recent stability in prices may attract buyers seeking budget-friendly homes with natural beauty nearby.
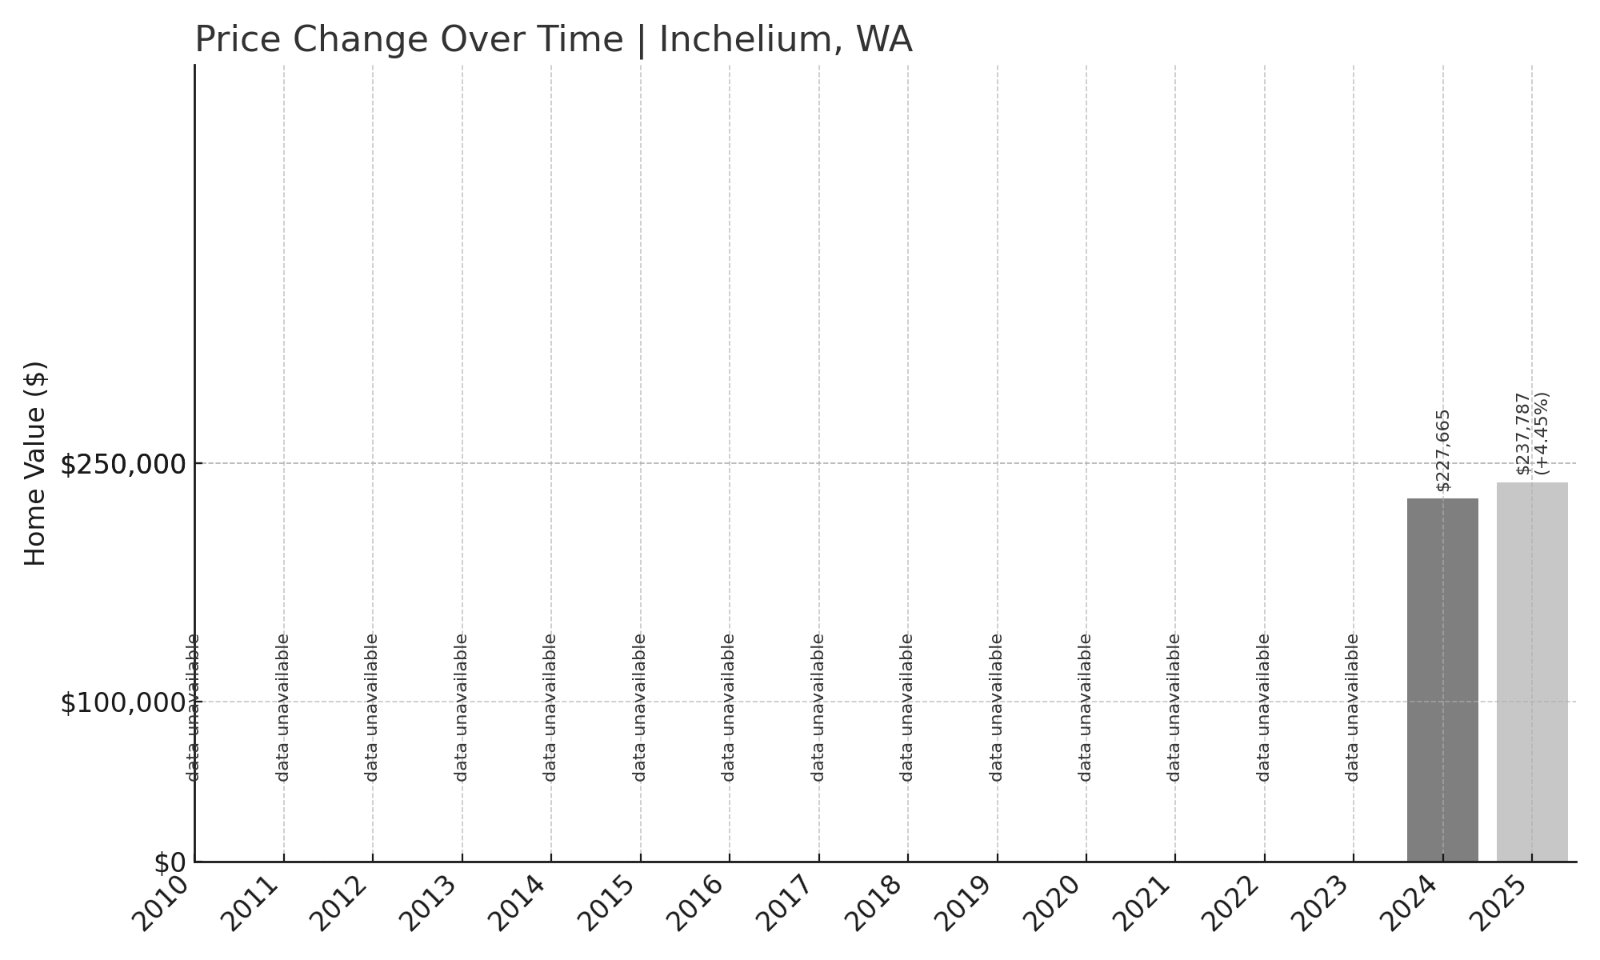
8. Inchelium – 4% Home Price Increase Since 2024
- 2010: N/A
- 2011: N/A
- 2012: N/A
- 2013: N/A
- 2014: N/A
- 2015: N/A
- 2016: N/A
- 2017: N/A
- 2018: N/A
- 2019: N/A
- 2020: N/A
- 2021: N/A
- 2022: N/A
- 2023: N/A
- 2024: $227,665
- 2025: $237,787 (+$10,123, +4.45% from previous year)
Inchelium’s available data shows a 4% home price increase from 2024 to 2025, reaching $237,787. With only two years of data, trends are limited, but current prices remain among the most affordable in the state.
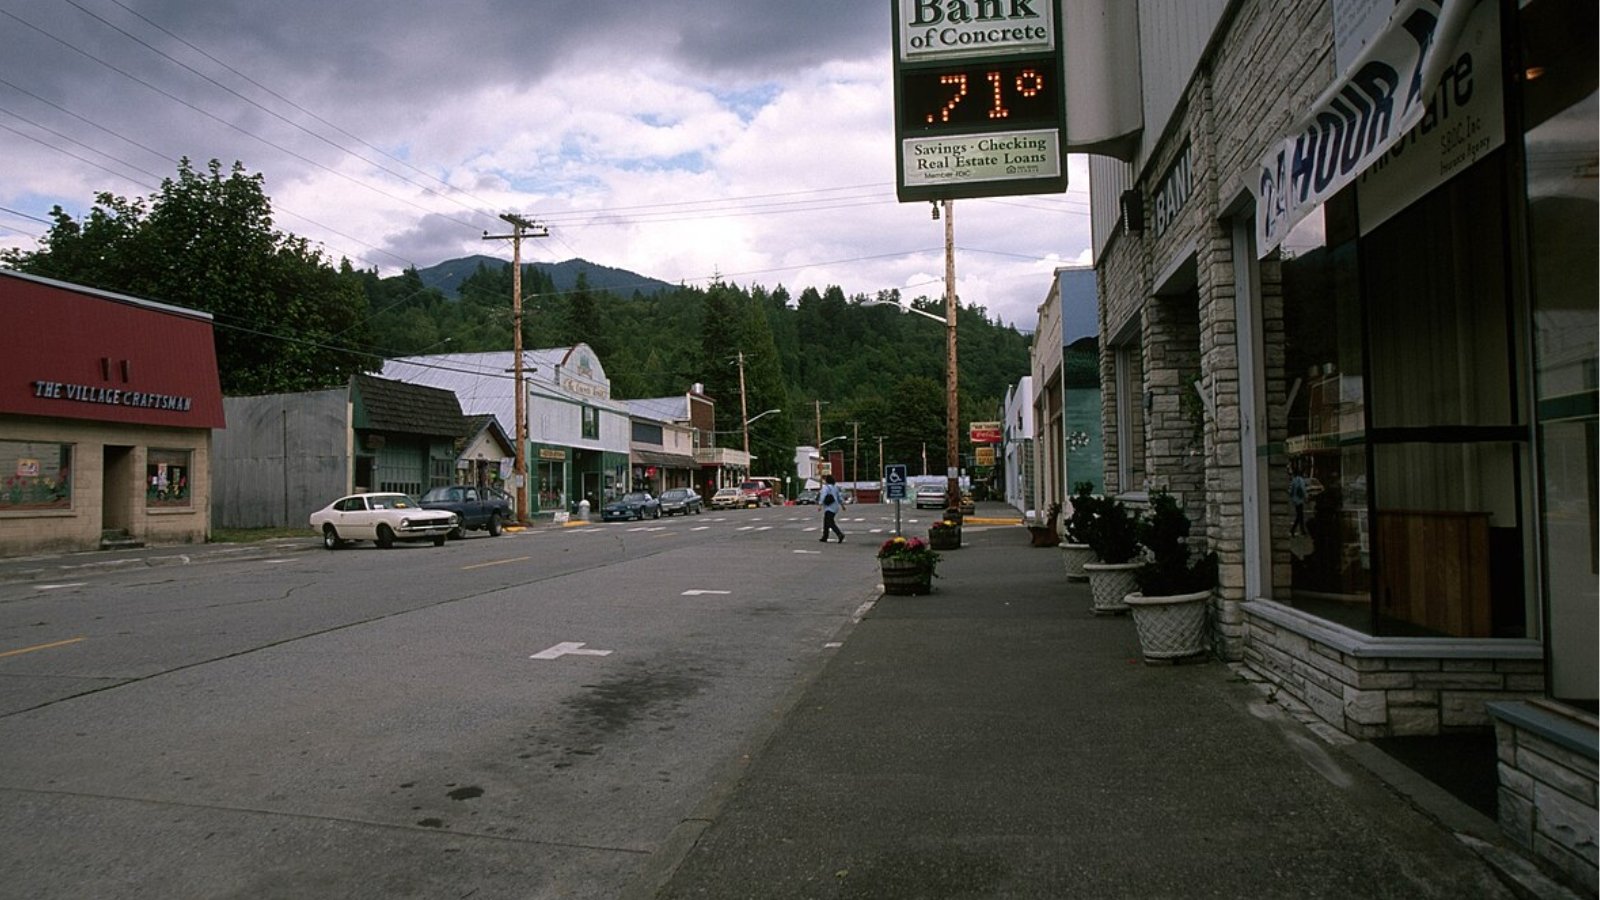
Inchelium – Remote Living on the Colville Reservation
Inchelium is a small community within the Colville Indian Reservation, located near the Columbia River in northeastern Washington. Its remote setting offers residents quiet surroundings and cultural heritage connected to the Confederated Tribes of the Colville Reservation.
Median home prices under $240,000 provide affordable housing for families living and working locally. The community is served by Inchelium School District and features local facilities and stores. Buyers attracted to Inchelium often seek cultural ties, rural living, and proximity to natural areas including Lake Roosevelt and the surrounding forests.
7. Coulee Dam – 111% Home Price Increase Since 2010
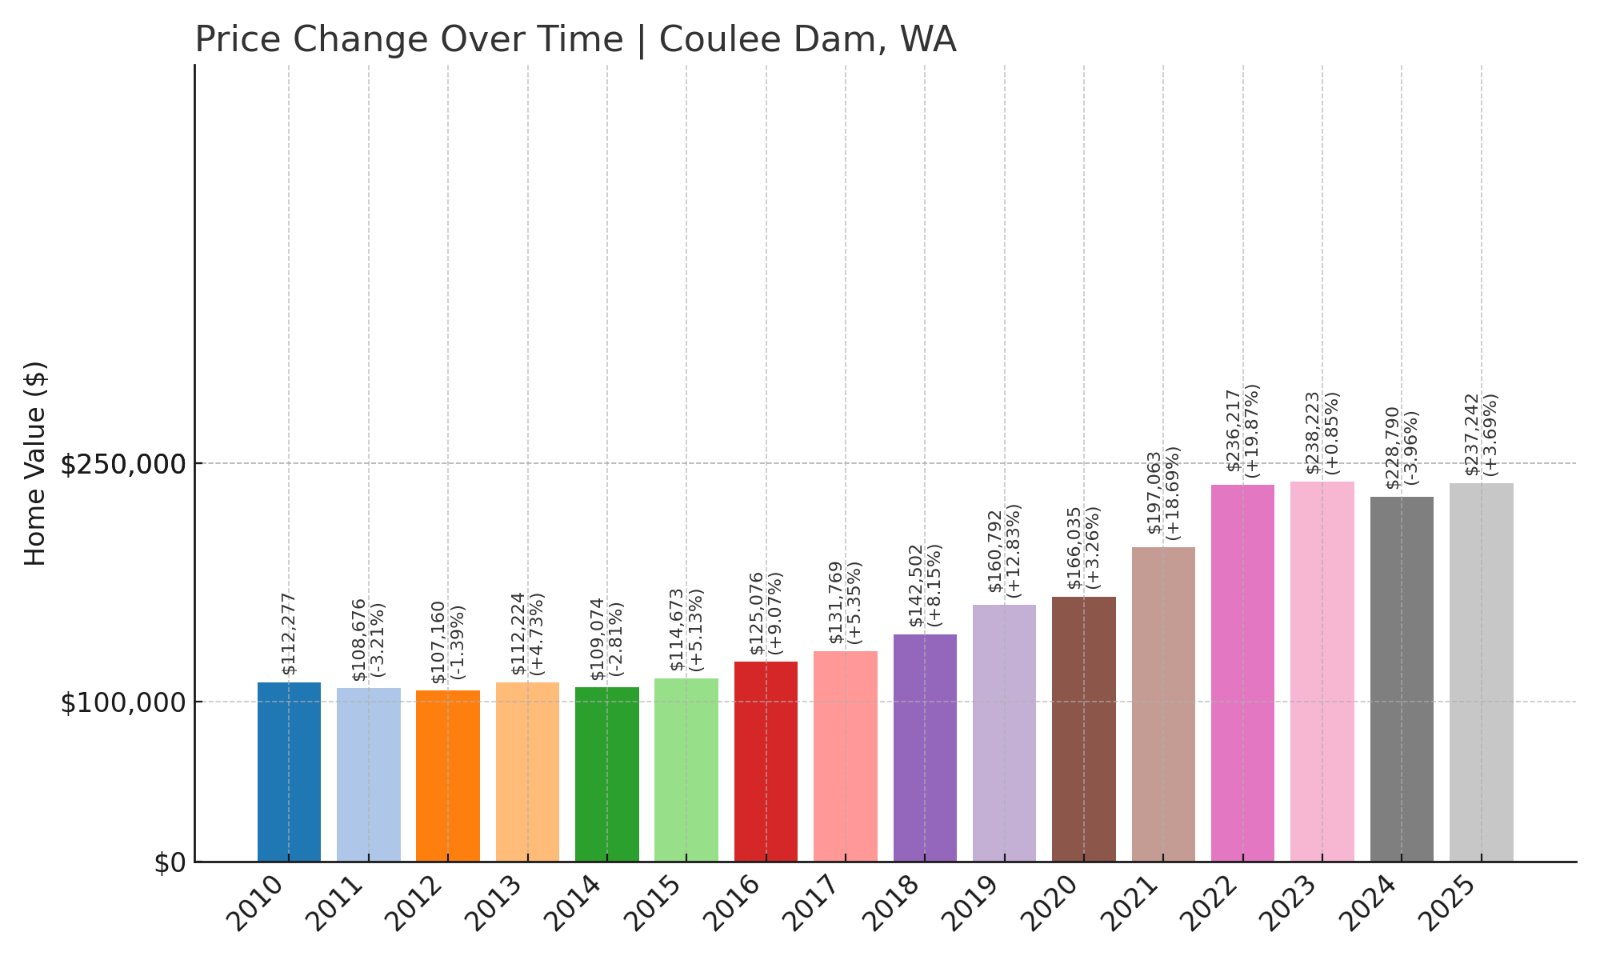
- 2010: $112,277
- 2011: $108,676 (-$3,601, -3.21% from previous year)
- 2012: $107,160 (-$1,516, -1.39% from previous year)
- 2013: $112,224 (+$5,063, +4.73% from previous year)
- 2014: $109,074 (-$3,150, -2.81% from previous year)
- 2015: $114,673 (+$5,599, +5.13% from previous year)
- 2016: $125,076 (+$10,404, +9.07% from previous year)
- 2017: $131,769 (+$6,693, +5.35% from previous year)
- 2018: $142,502 (+$10,733, +8.15% from previous year)
- 2019: $160,792 (+$18,290, +12.83% from previous year)
- 2020: $166,035 (+$5,243, +3.26% from previous year)
- 2021: $197,063 (+$31,028, +18.69% from previous year)
- 2022: $236,217 (+$39,154, +19.87% from previous year)
- 2023: $238,223 (+$2,006, +0.85% from previous year)
- 2024: $228,790 (-$9,433, -3.96% from previous year)
- 2025: $237,242 (+$8,452, +3.69% from previous year)
Coulee Dam’s home prices have risen 111% since 2010, reaching $237,242 in 2025. After a small drop in 2024, prices grew again this year, showing resilience in this unique hydroelectric town.
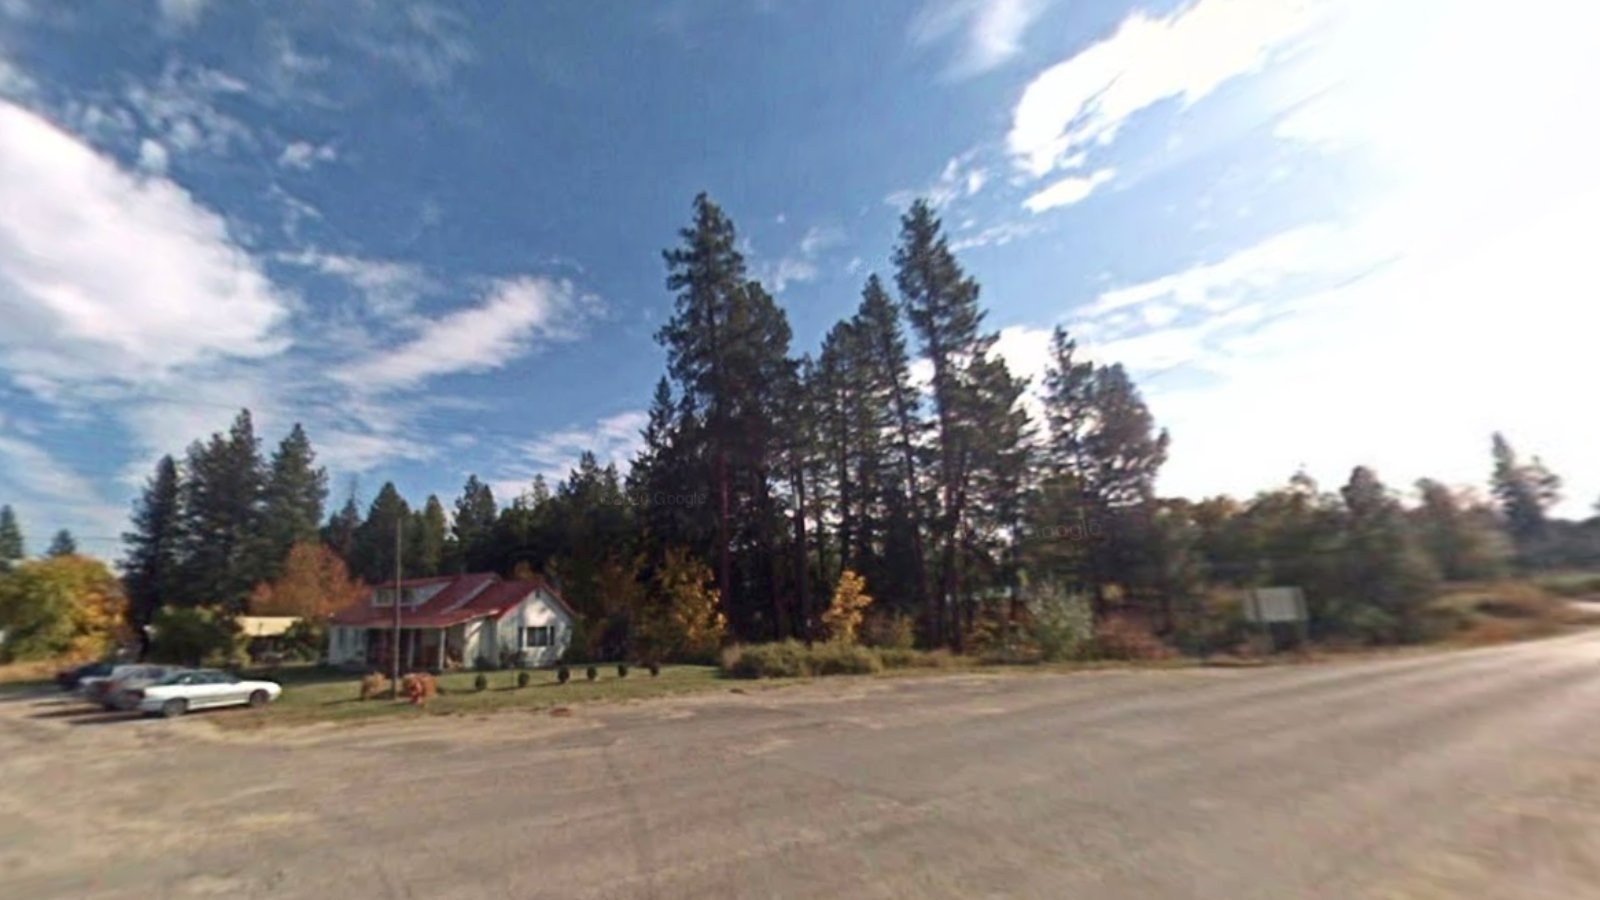
Coulee Dam – Home of the Historic Grand Coulee Dam
Coulee Dam straddles Okanogan and Grant counties, best known for the Grand Coulee Dam that provides hydropower and irrigation to the region. The town grew alongside the dam’s construction and remains an important center for dam operations and tourism today.
Home prices under $240,000 keep it affordable compared to state averages. Residents enjoy river views, proximity to Lake Roosevelt, and access to recreation areas. The town also offers local schools, health services, and small businesses supporting the community. Housing stability in Coulee Dam reflects steady employment and the enduring significance of the dam to Washington’s economy.
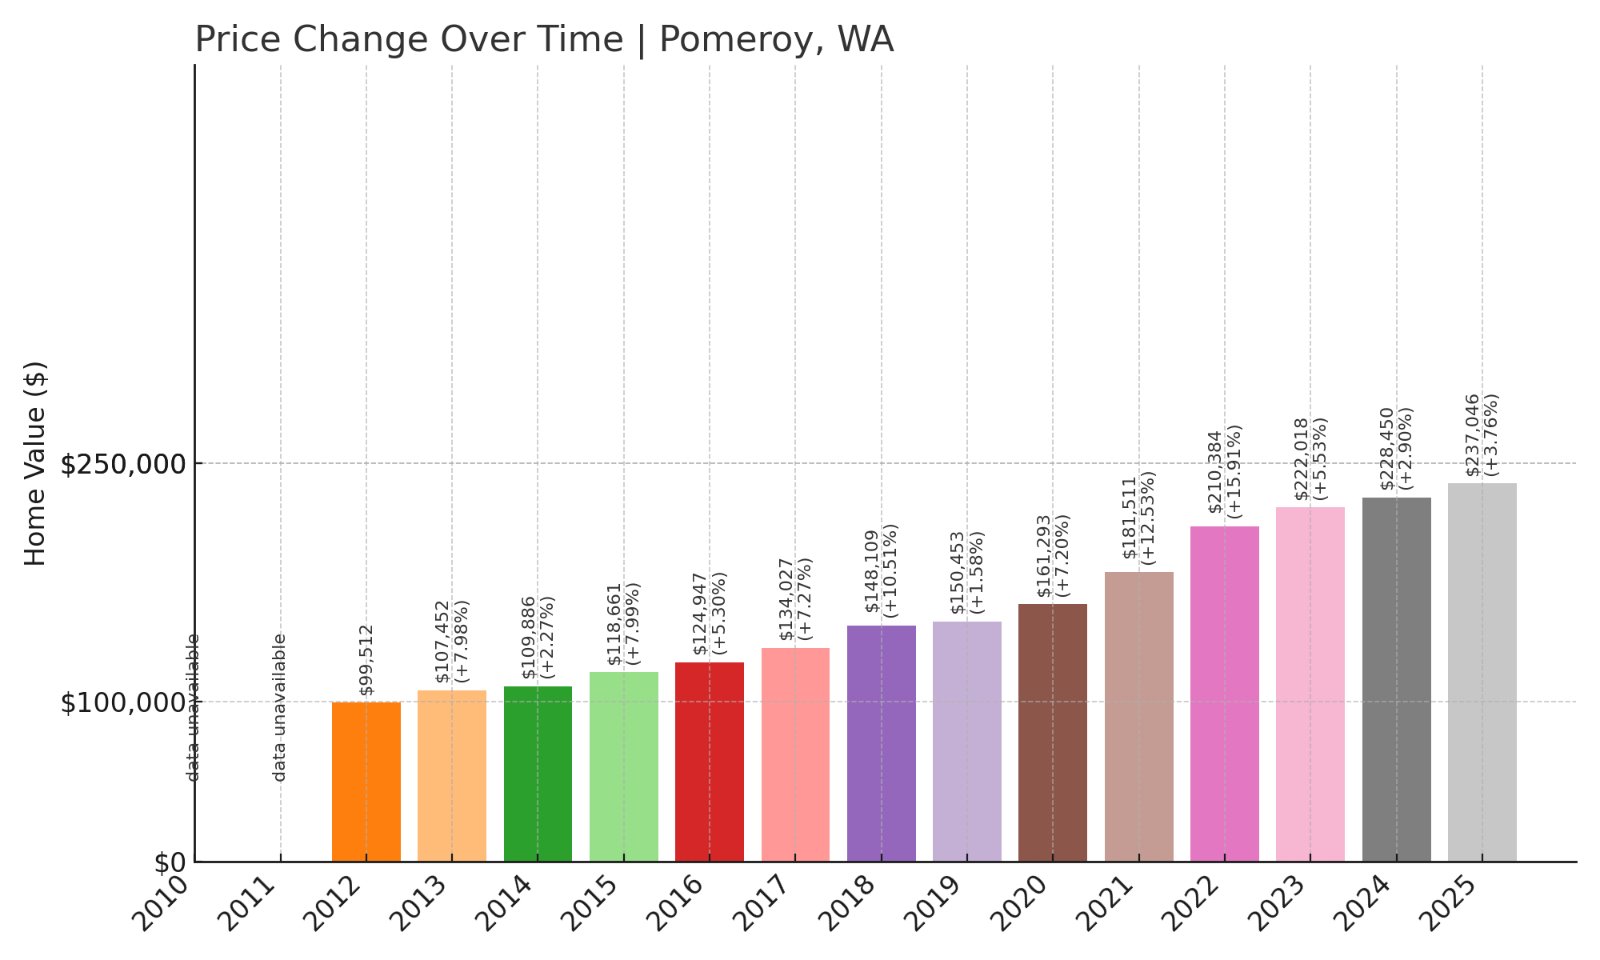
6. Pomeroy – 138% Home Price Increase Since 2012
- 2010: N/A
- 2011: N/A
- 2012: $99,512
- 2013: $107,452 (+$7,940, +7.98% from previous year)
- 2014: $109,886 (+$2,435, +2.27% from previous year)
- 2015: $118,661 (+$8,775, +7.99% from previous year)
- 2016: $124,947 (+$6,286, +5.30% from previous year)
- 2017: $134,027 (+$9,079, +7.27% from previous year)
- 2018: $148,109 (+$14,082, +10.51% from previous year)
- 2019: $150,453 (+$2,344, +1.58% from previous year)
- 2020: $161,293 (+$10,839, +7.20% from previous year)
- 2021: $181,511 (+$20,218, +12.54% from previous year)
- 2022: $210,384 (+$28,873, +15.91% from previous year)
- 2023: $222,018 (+$11,635, +5.53% from previous year)
- 2024: $228,450 (+$6,431, +2.90% from previous year)
- 2025: $237,046 (+$8,597, +3.76% from previous year)
Pomeroy’s home prices have increased by 138% since 2012, reaching $237,046 in 2025. The market saw steady growth each year, reflecting demand for affordable housing within this agricultural town in Garfield County.
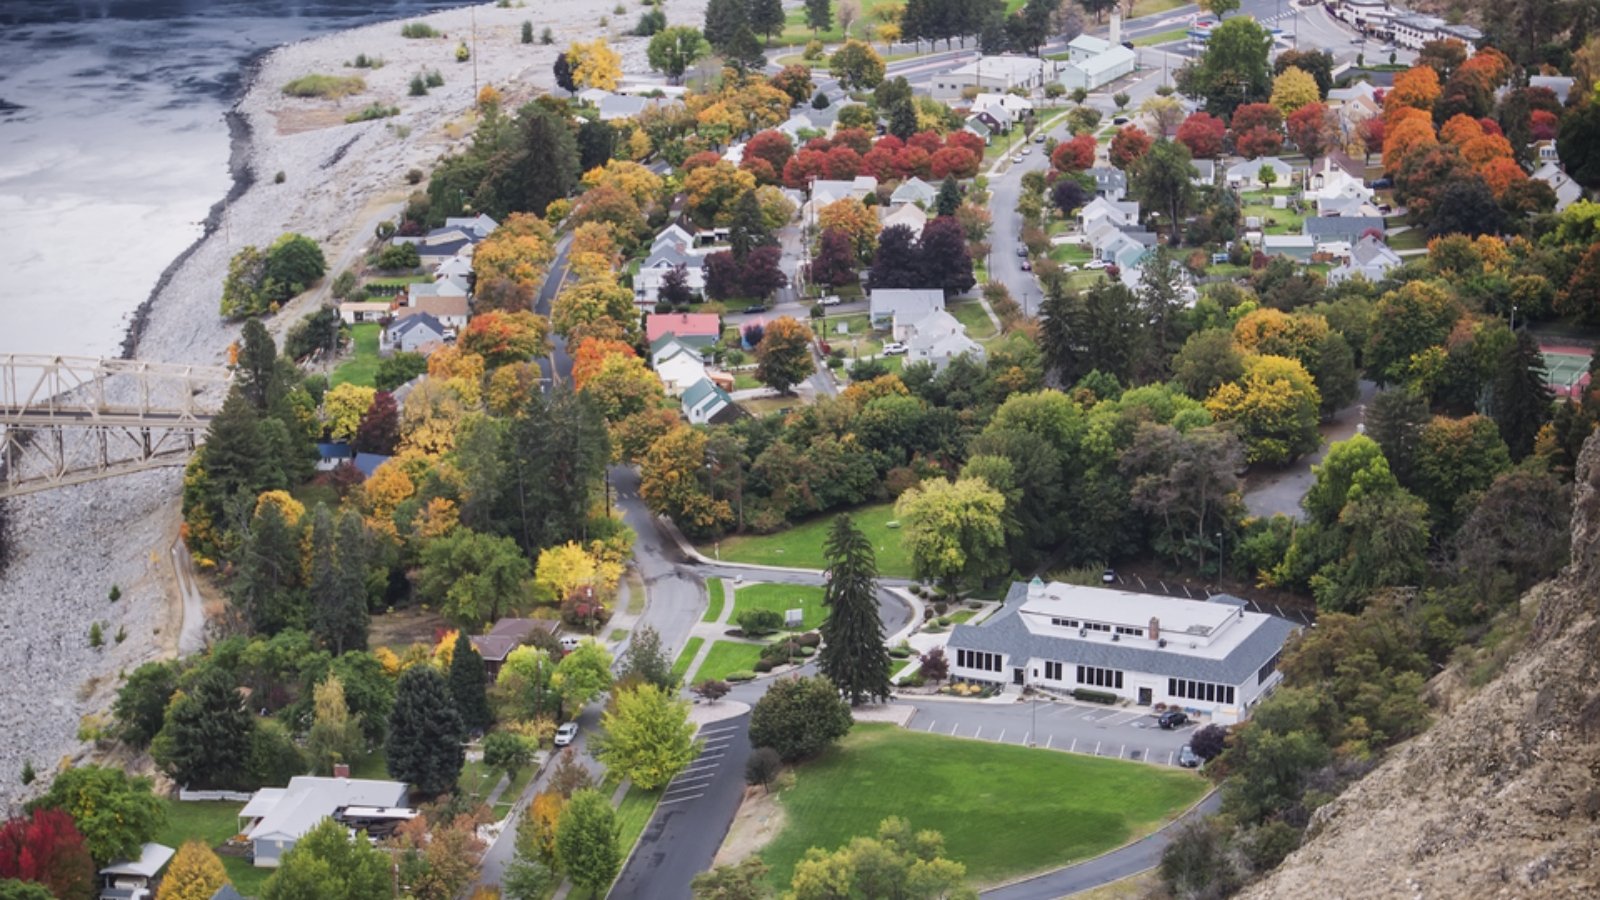
Pomeroy – Wheat Country Affordability
Pomeroy is located in southeastern Washington along Highway 12, serving as the only incorporated city in Garfield County. Known for wheat farming and open rolling hills, it offers a quiet lifestyle with essential services like schools, shops, and a hospital. Its housing market has steadily grown, with the median price rising from under $100,000 in 2012 to about $237,000 in 2025.
Residents value the small-town atmosphere, friendly community, and local events like the Garfield County Fair. The combination of affordability and rural character continues to attract buyers looking for a peaceful, agricultural lifestyle away from busy urban centers.
5. Hartline – 10% Home Price Increase Since 2021
- 2010: N/A
- 2011: N/A
- 2012: N/A
- 2013: N/A
- 2014: N/A
- 2015: N/A
- 2016: N/A
- 2017: N/A
- 2018: N/A
- 2019: N/A
- 2020: N/A
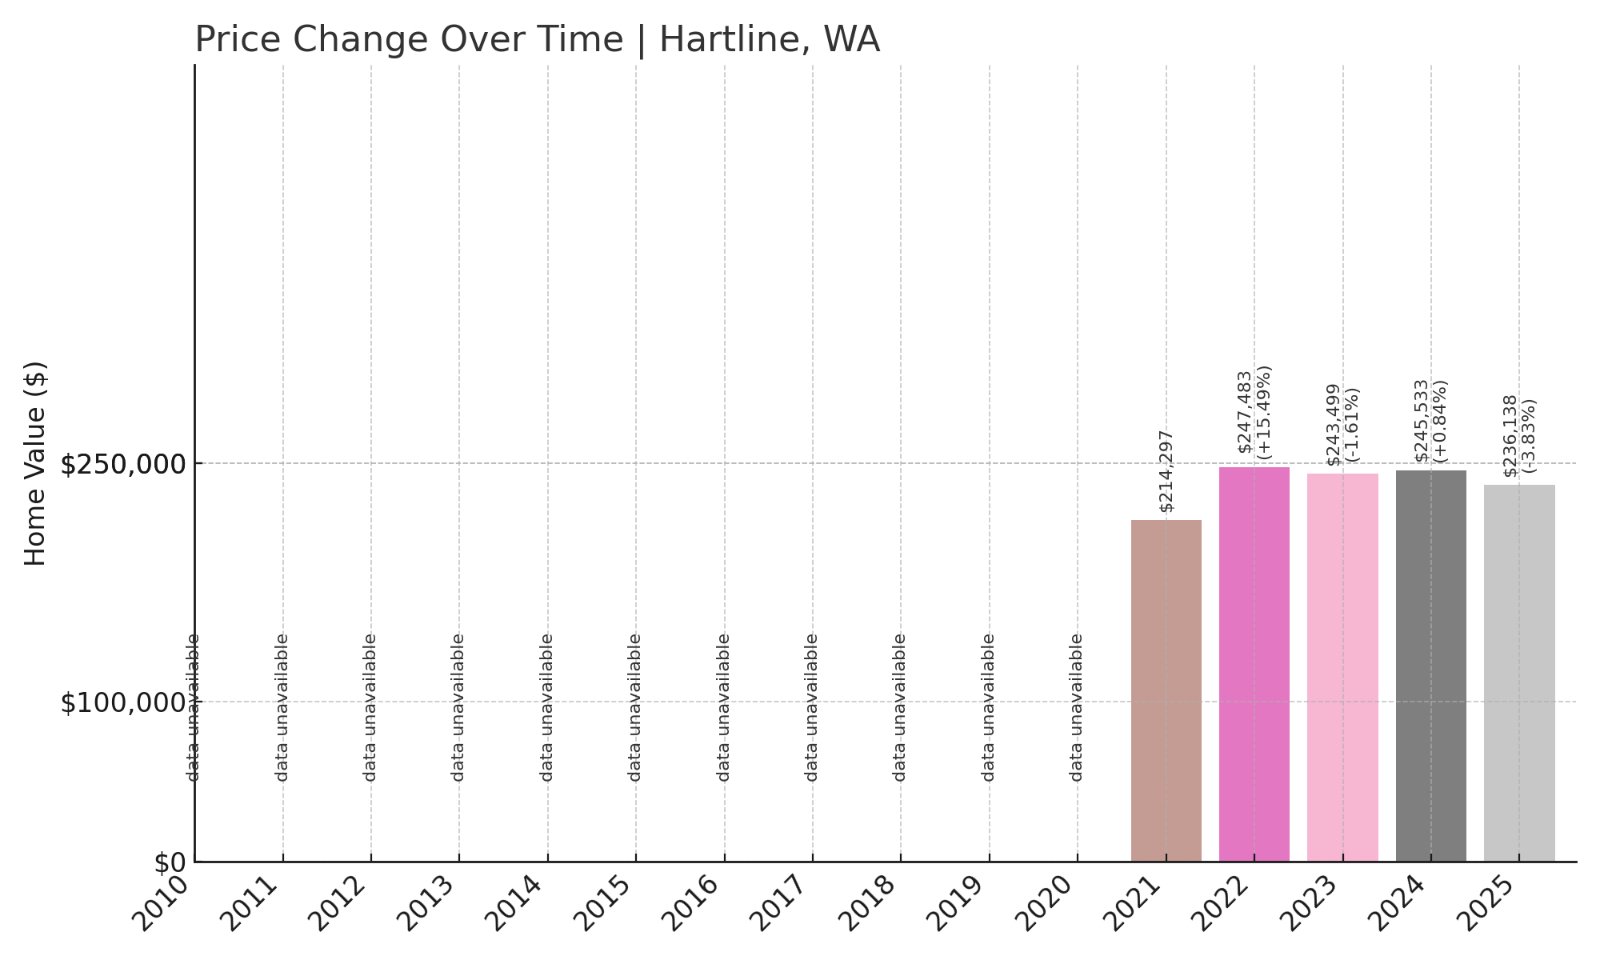
- 2021: $214,297
- 2022: $247,483 (+$33,186, +15.49% from previous year)
- 2023: $243,499 (-$3,985, -1.61% from previous year)
- 2024: $245,533 (+$2,035, +0.84% from previous year)
- 2025: $236,138 (-$9,396, -3.83% from previous year)
Hartline’s home prices have grown by 10% since 2021, with the current median at $236,138 in 2025. After peaking in 2022, prices declined slightly, suggesting a market correction in this small Grant County community.
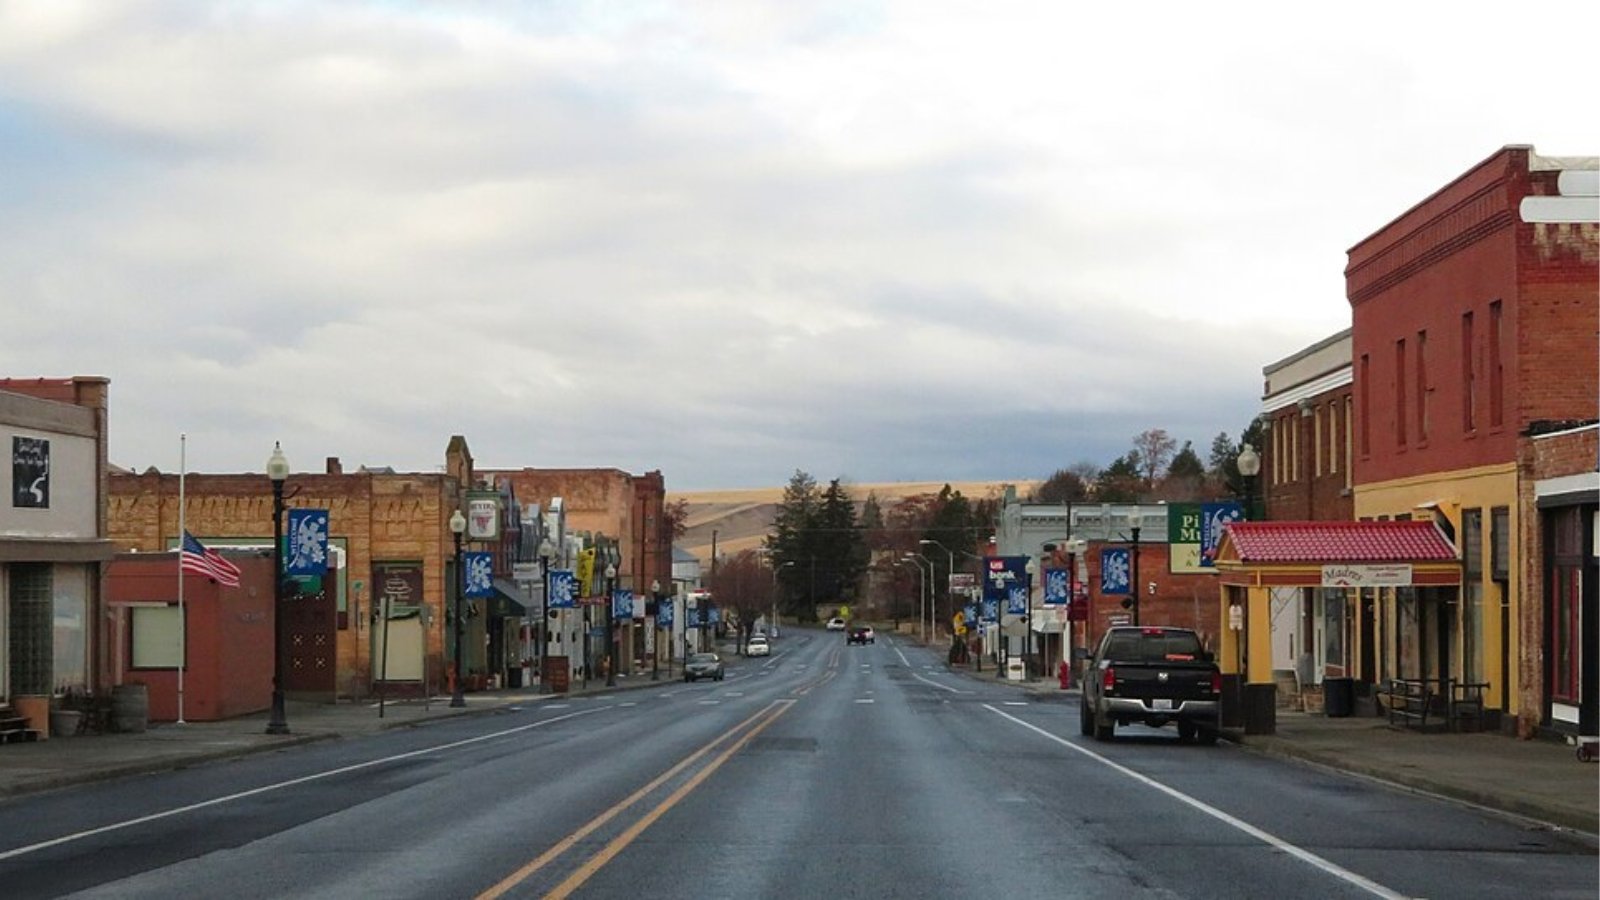
Hartline – Quiet Farming Town on the Columbia Plateau
Hartline is a tiny agricultural town in Grant County with a population under 200. Its economy is rooted in dryland wheat and barley farming, and the community is known for its close-knit feel and historic schoolhouse listed on the National Register of Historic Places.
Home prices peaked at nearly $247,500 in 2022 before dropping slightly over the past two years. The current median of $236,138 remains affordable by Washington standards. Buyers seeking rural life and spacious properties at lower costs may find Hartline appealing despite its limited amenities, with larger towns accessible within an hour’s drive.
4. Endicott – 118% Home Price Increase Since 2017
- 2010: N/A
- 2011: N/A
- 2012: N/A
- 2013: N/A
- 2014: N/A
- 2015: N/A
- 2016: N/A
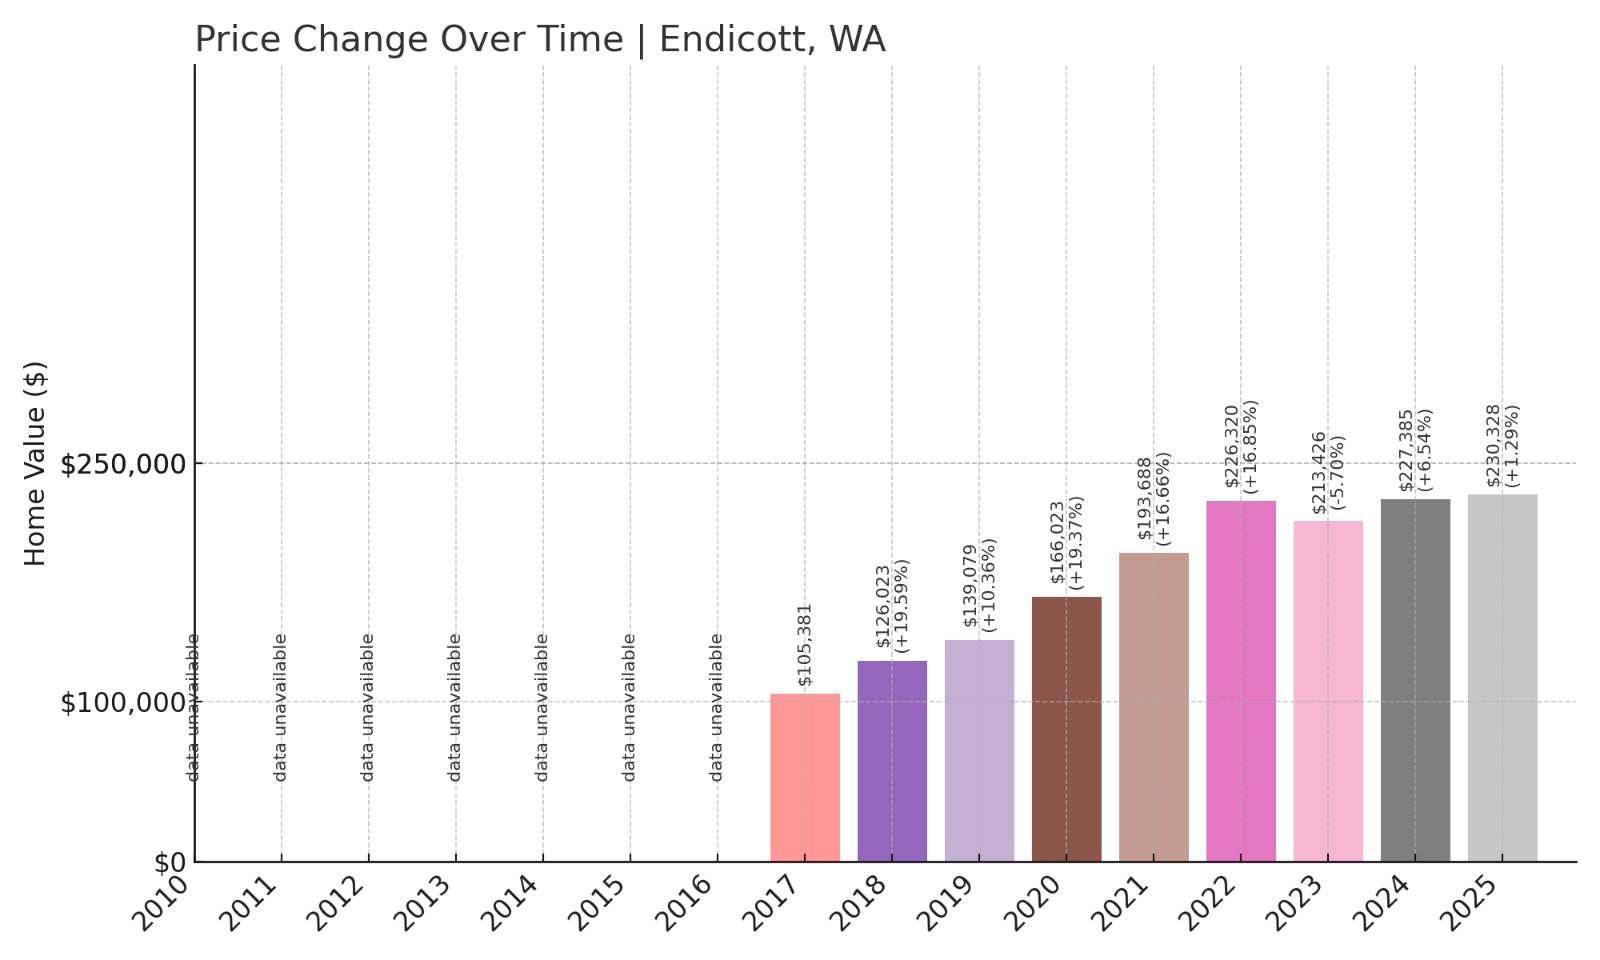
- 2017: $105,381
- 2018: $126,023 (+$20,642, +19.59% from previous year)
- 2019: $139,079 (+$13,056, +10.36% from previous year)
- 2020: $166,023 (+$26,944, +19.37% from previous year)
- 2021: $193,688 (+$27,666, +16.66% from previous year)
- 2022: $226,320 (+$32,631, +16.85% from previous year)
- 2023: $213,426 (-$12,893, -5.70% from previous year)
- 2024: $227,385 (+$13,959, +6.54% from previous year)
- 2025: $230,328 (+$2,943, +1.29% from previous year)
Endicott’s home prices have risen 118% since 2017, with a current median of $230,328 in 2025. Growth slowed in recent years after sharp increases from 2017 through 2022, reflecting a stabilizing market in this Palouse farming town.
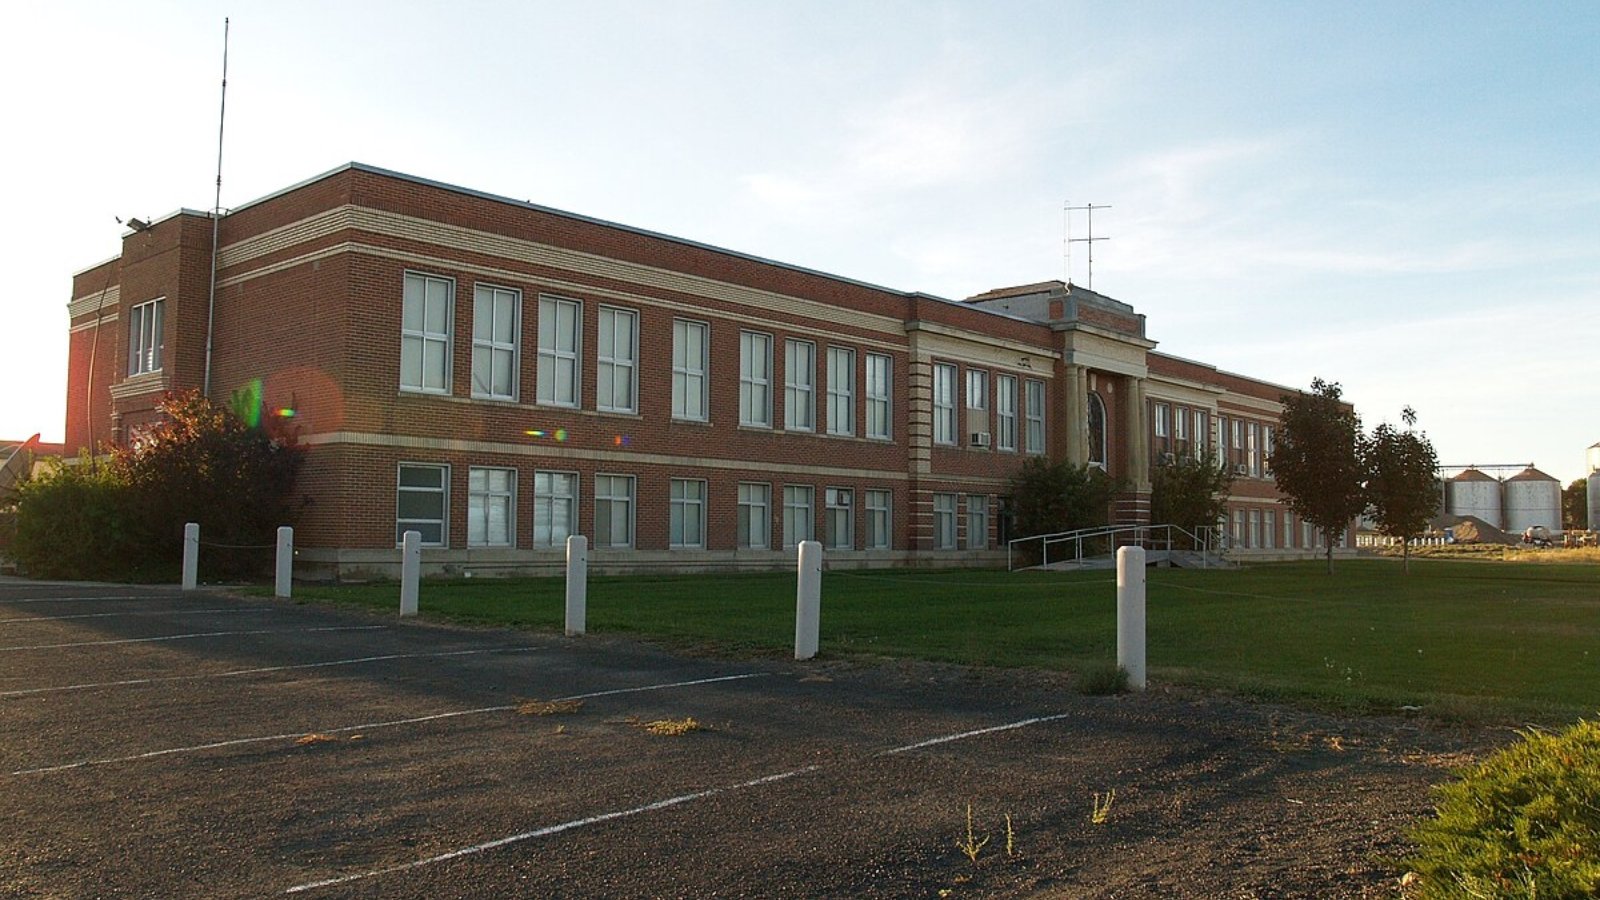
Endicott – Palouse Farming Community Stability
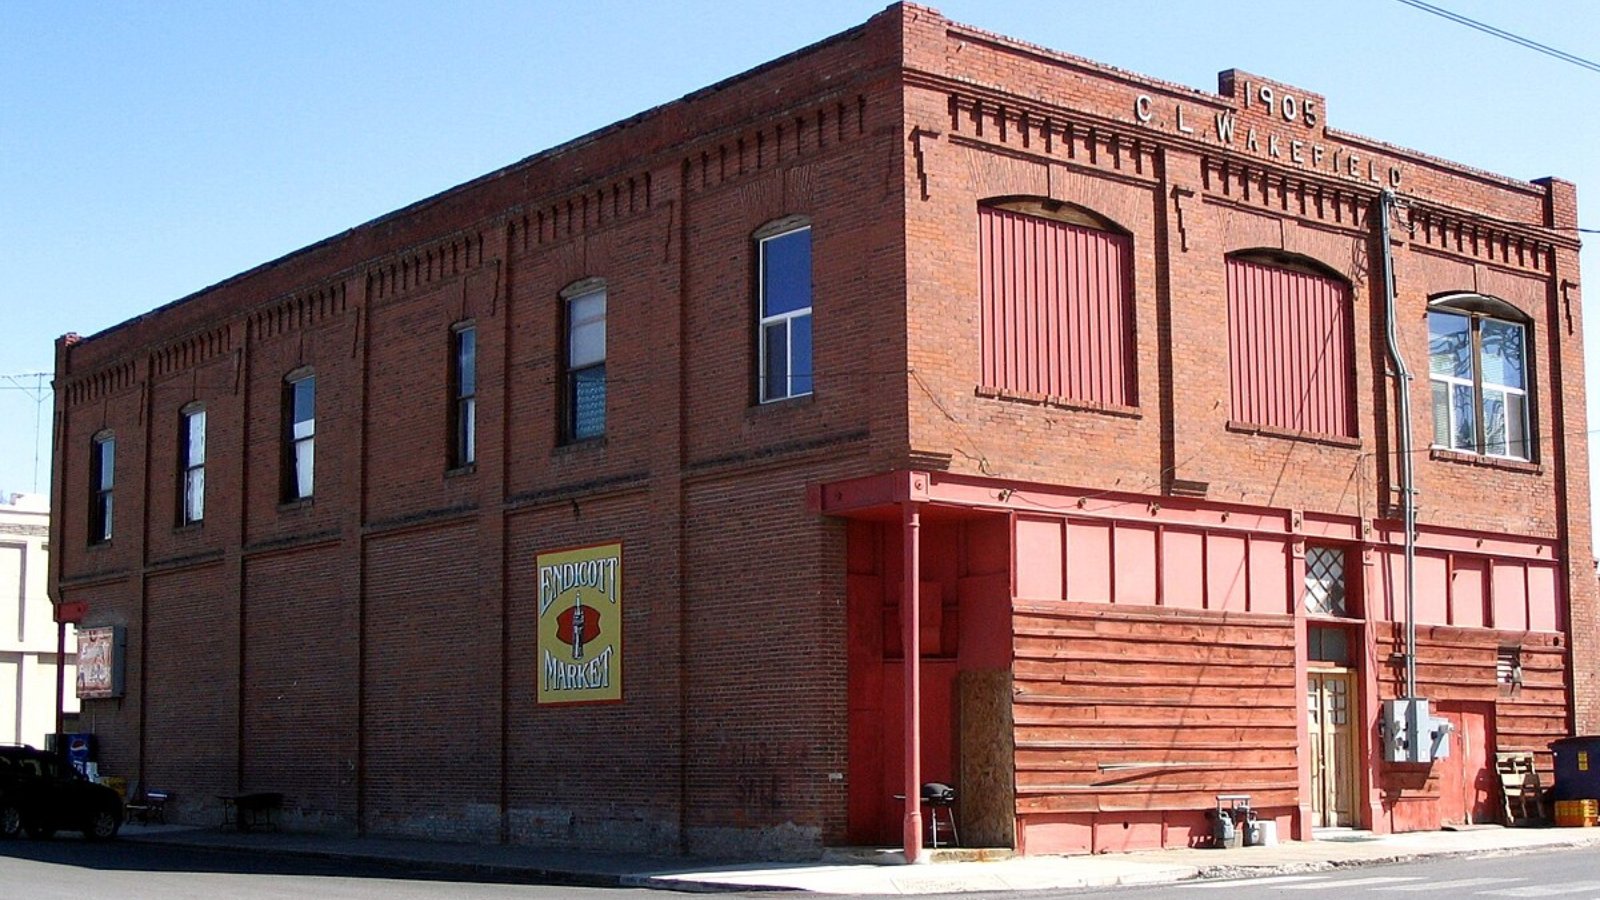
Endicott is a small farming town in Whitman County with fewer than 300 residents. Surrounded by wheat fields and rolling hills characteristic of the Palouse region, it offers peaceful rural living. The housing market boomed between 2017 and 2022, with prices more than doubling before recent leveling off.
Homebuyers value Endicott’s quiet environment, strong agricultural heritage, and proximity to Colfax and Pullman for additional services. Its current median price just over $230,000 keeps it among the most affordable towns in Washington, appealing to those seeking simplicity and small-town connections.
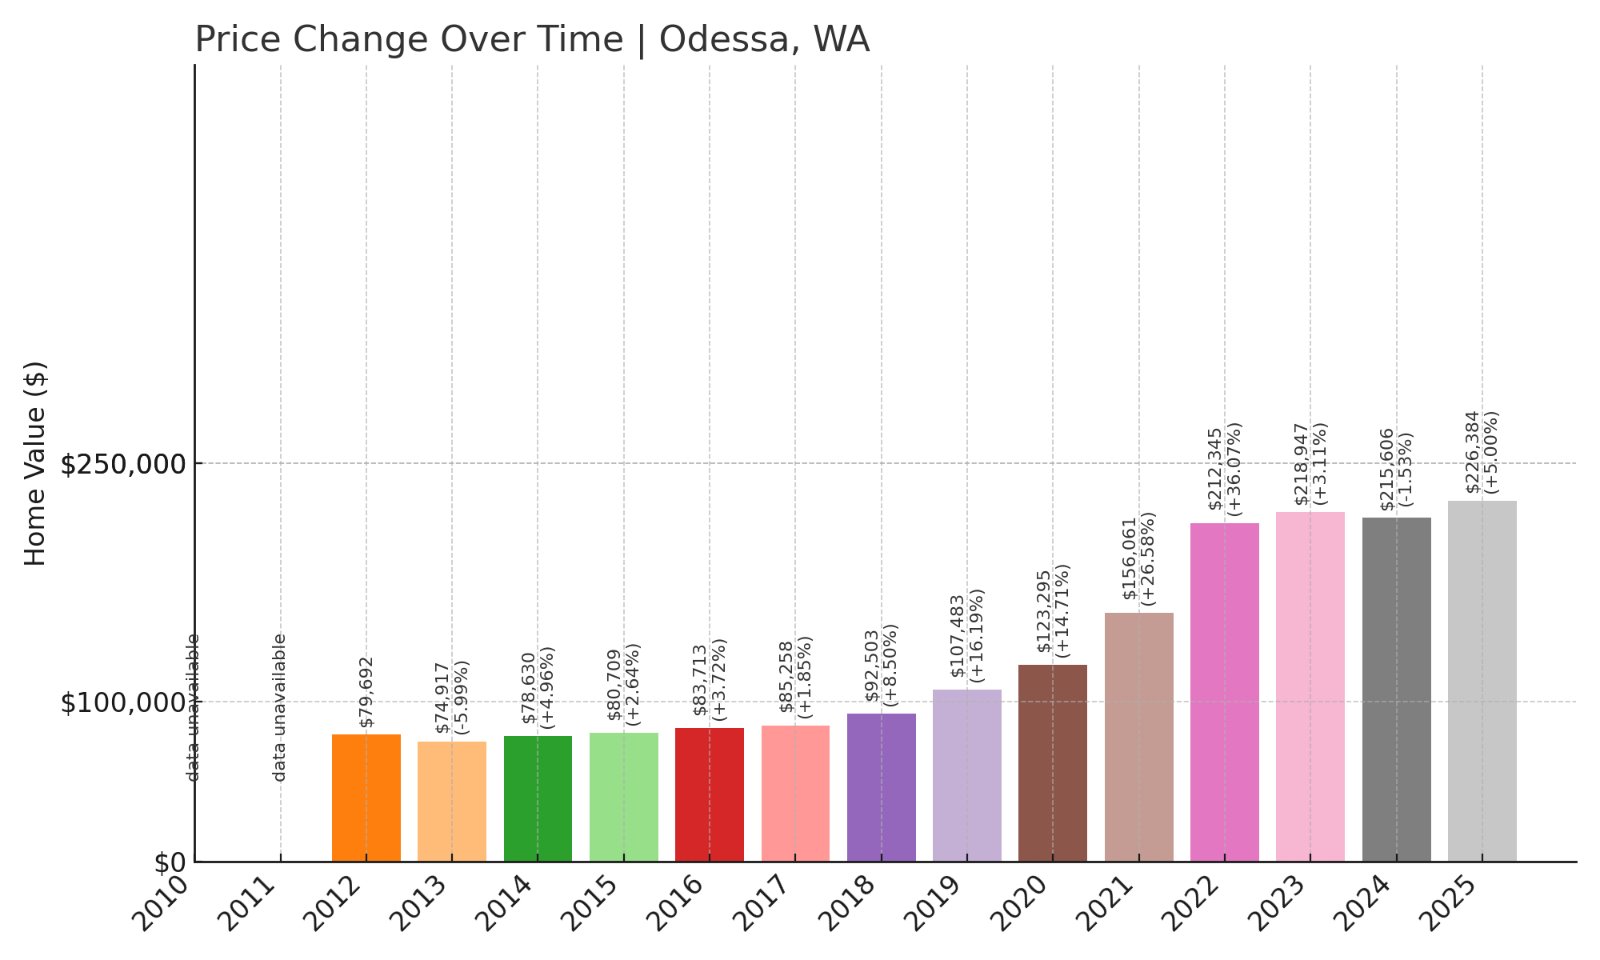
3. Odessa – 184% Home Price Increase Since 2012
🔥 Would you like to save this?
- 2010: N/A
- 2011: N/A
- 2012: $79,692
- 2013: $74,917 (-$4,775, -5.99% from previous year)
- 2014: $78,630 (+$3,713, +4.96% from previous year)
- 2015: $80,709 (+$2,079, +2.64% from previous year)
- 2016: $83,713 (+$3,004, +3.72% from previous year)
- 2017: $85,258 (+$1,544, +1.84% from previous year)
- 2018: $92,503 (+$7,246, +8.50% from previous year)
- 2019: $107,483 (+$14,980, +16.19% from previous year)
- 2020: $123,295 (+$15,812, +14.71% from previous year)
- 2021: $156,061 (+$32,766, +26.58% from previous year)
- 2022: $212,345 (+$56,284, +36.07% from previous year)
- 2023: $218,947 (+$6,602, +3.11% from previous year)
- 2024: $215,606 (-$3,340, -1.53% from previous year)
- 2025: $226,384 (+$10,777, +5.00% from previous year)
Odessa’s home prices have increased 184% since 2012, reaching $226,384 in 2025. Prices rose sharply from 2019 onwards, reflecting stronger demand for affordable housing in this Lincoln County farming hub.
Odessa – Rural Community with German Heritage
Odessa is located in central Washington’s wheat-growing region and is known for its strong German cultural heritage, celebrated annually with Deutschesfest. The town’s population is under 1,000, and it offers amenities including schools, clinics, and local businesses supporting the agricultural economy.
Housing prices have grown significantly over the last decade but remain affordable, with a current median under $230,000. Odessa appeals to buyers seeking rural life, cultural traditions, and affordable homes with room for gardens or small-scale farming ventures.
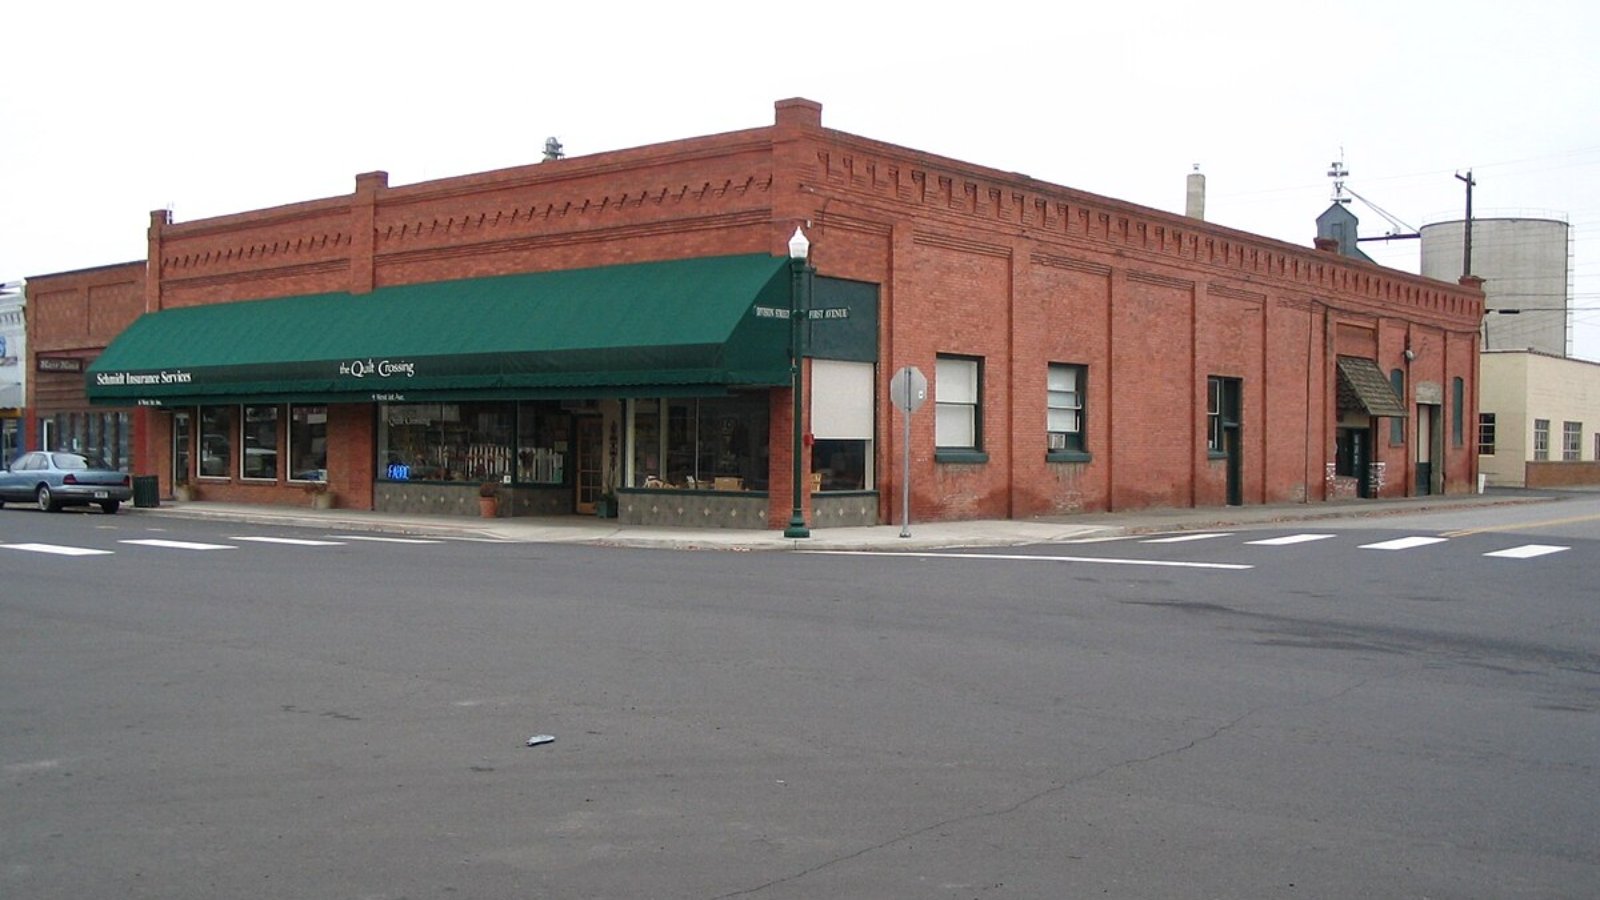
2. Marblemount – 171% Home Price Increase Since 2010
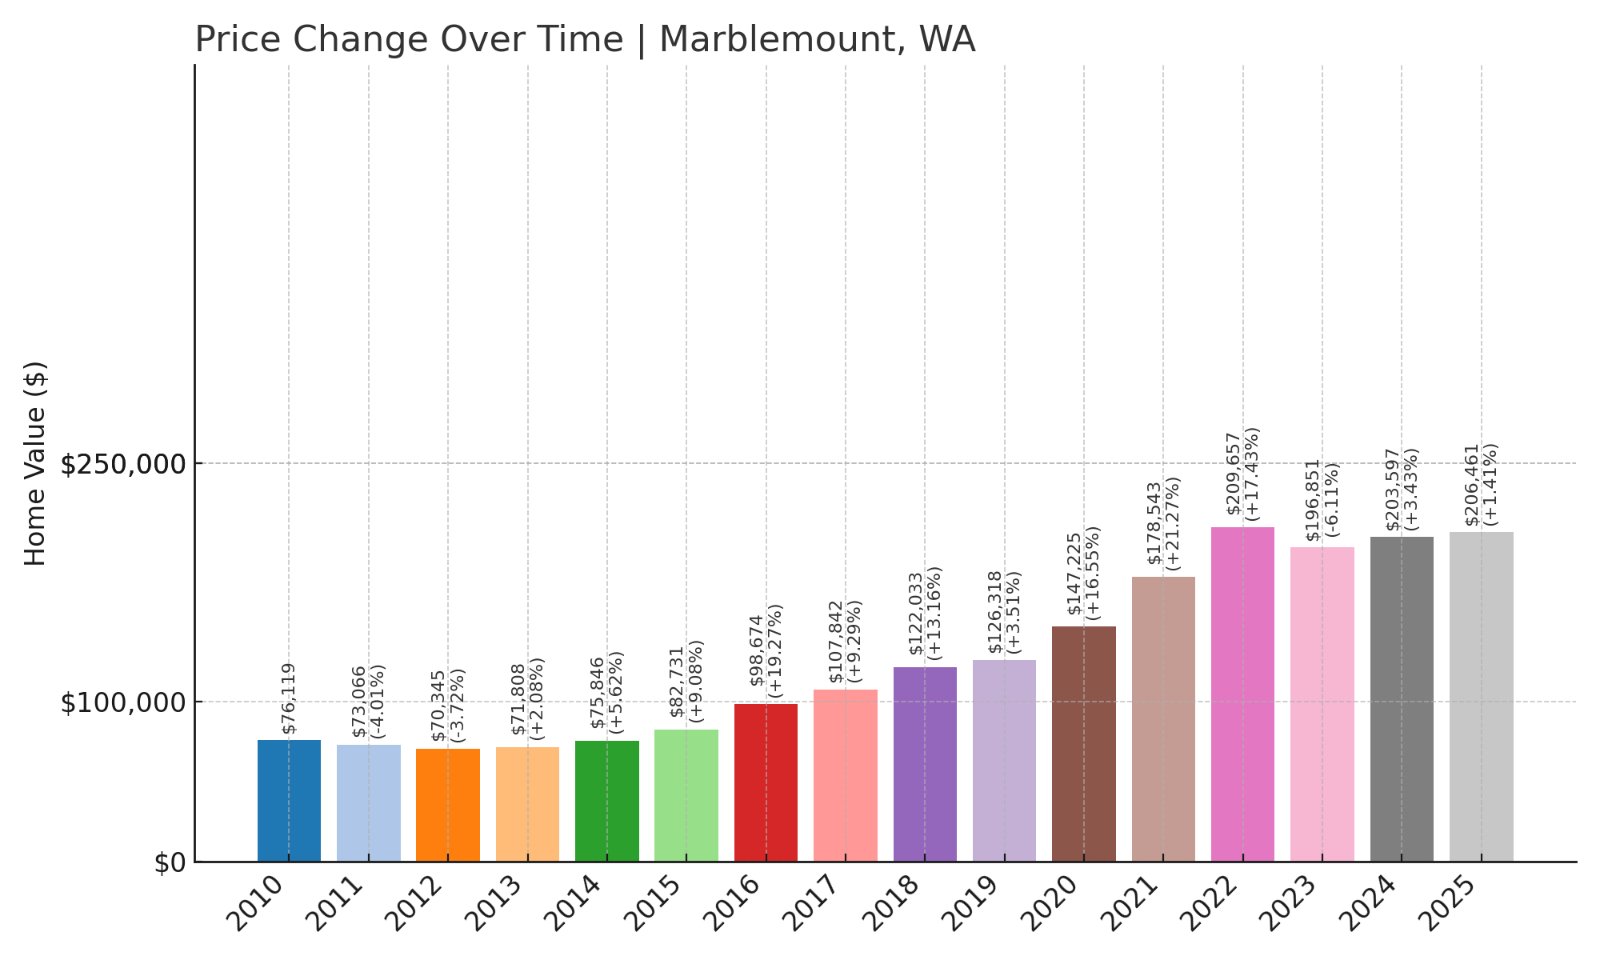
- 2010: $76,119
- 2011: $73,066 (-$3,053, -4.01% from previous year)
- 2012: $70,345 (-$2,721, -3.72% from previous year)
- 2013: $71,808 (+$1,464, +2.08% from previous year)
- 2014: $75,846 (+$4,038, +5.62% from previous year)
- 2015: $82,731 (+$6,885, +9.08% from previous year)
- 2016: $98,674 (+$15,942, +19.27% from previous year)
- 2017: $107,842 (+$9,169, +9.29% from previous year)
- 2018: $122,033 (+$14,191, +13.16% from previous year)
- 2019: $126,318 (+$4,285, +3.51% from previous year)
- 2020: $147,225 (+$20,907, +16.55% from previous year)
- 2021: $178,543 (+$31,318, +21.27% from previous year)
- 2022: $209,657 (+$31,115, +17.43% from previous year)
- 2023: $196,851 (-$12,806, -6.11% from previous year)
- 2024: $203,597 (+$6,745, +3.43% from previous year)
- 2025: $206,461 (+$2,864, +1.41% from previous year)
Marblemount’s home prices have increased 171% since 2010, reaching $206,461 in 2025. Prices grew steadily through 2022 before a slight decline and modest recovery in the past two years.
Marblemount – Gateway to the North Cascades
Marblemount is located along Highway 20 in Skagit County, serving as the last major service stop before entering North Cascades National Park. It attracts visitors for hiking, rafting, and camping, while offering residents a quiet mountain lifestyle.
Despite price increases over the last decade, homes remain affordable with the current median just over $206,000. Marblemount appeals to those seeking remote living surrounded by forests, rivers, and mountain vistas, along with a small community of residents and outdoor enthusiasts.
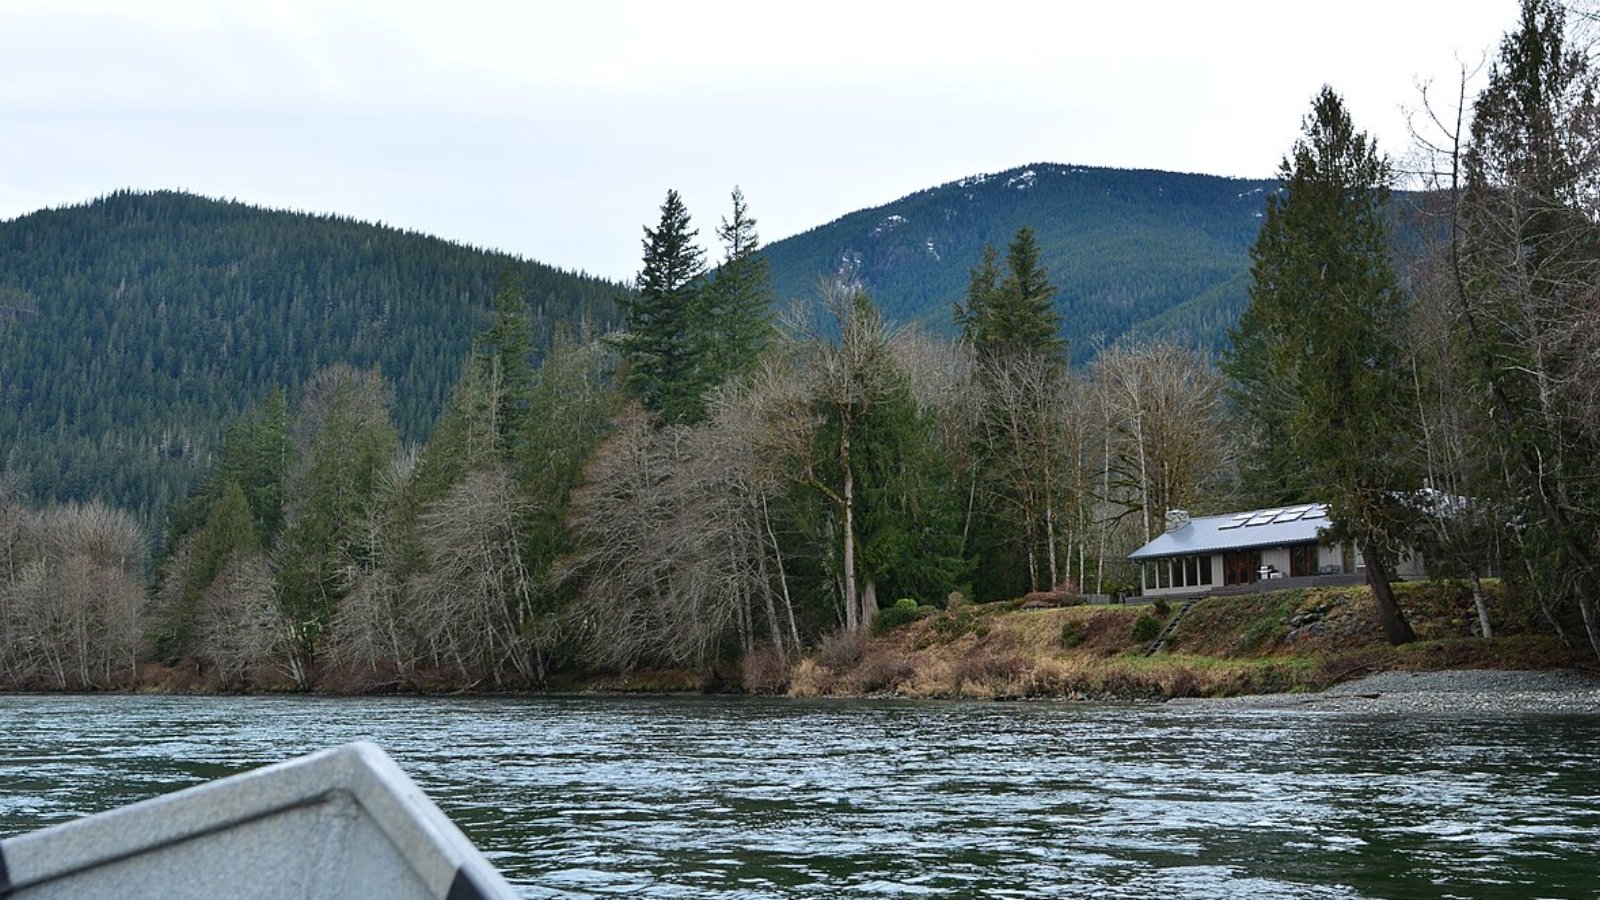
1. Lind – 181% Home Price Increase Since 2010
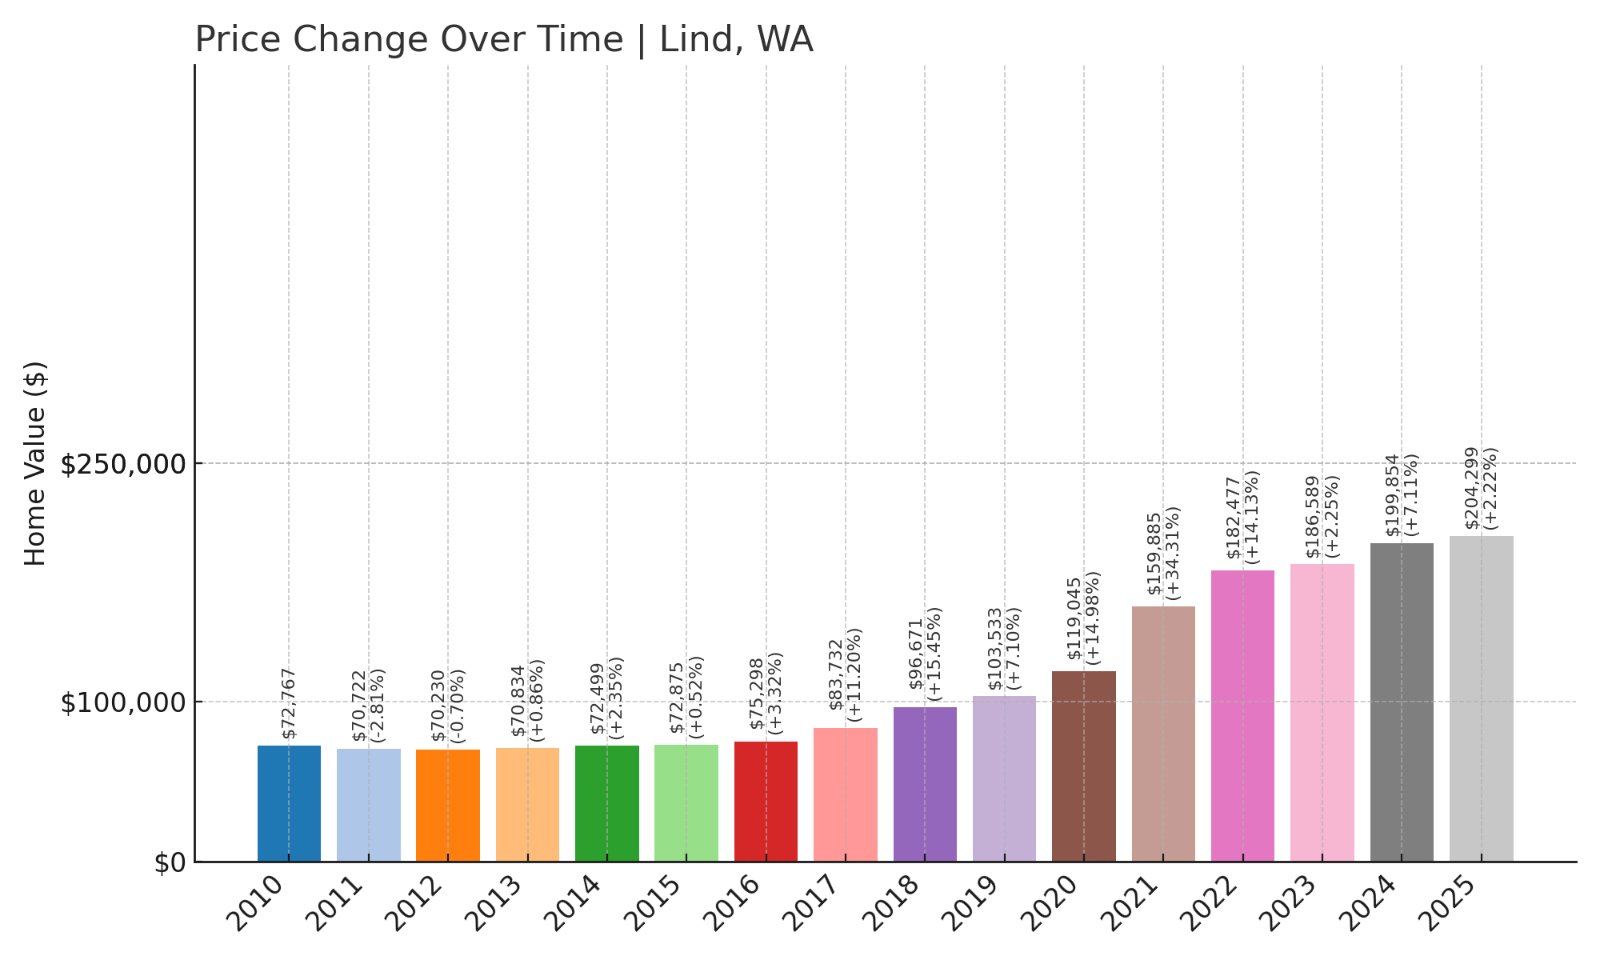
- 2010: $72,767
- 2011: $70,722 (-$2,045, -2.81% from previous year)
- 2012: $70,230 (-$492, -0.70% from previous year)
- 2013: $70,834 (+$604, +0.86% from previous year)
- 2014: $72,499 (+$1,665, +2.35% from previous year)
- 2015: $72,875 (+$377, +0.52% from previous year)
- 2016: $75,298 (+$2,423, +3.32% from previous year)
- 2017: $83,732 (+$8,434, +11.20% from previous year)
- 2018: $96,671 (+$12,939, +15.45% from previous year)
- 2019: $103,533 (+$6,862, +7.10% from previous year)
- 2020: $119,045 (+$15,513, +14.98% from previous year)
- 2021: $159,885 (+$40,840, +34.31% from previous year)
- 2022: $182,477 (+$22,592, +14.13% from previous year)
- 2023: $186,589 (+$4,112, +2.25% from previous year)
- 2024: $199,854 (+$13,265, +7.11% from previous year)
- 2025: $204,299 (+$4,444, +2.22% from previous year)
Lind’s home prices have grown 181% since 2010, ending at $204,299 in 2025. Growth was especially strong between 2020 and 2021, and prices have continued to rise moderately in recent years.
Lind – Affordable Wheat Town Living
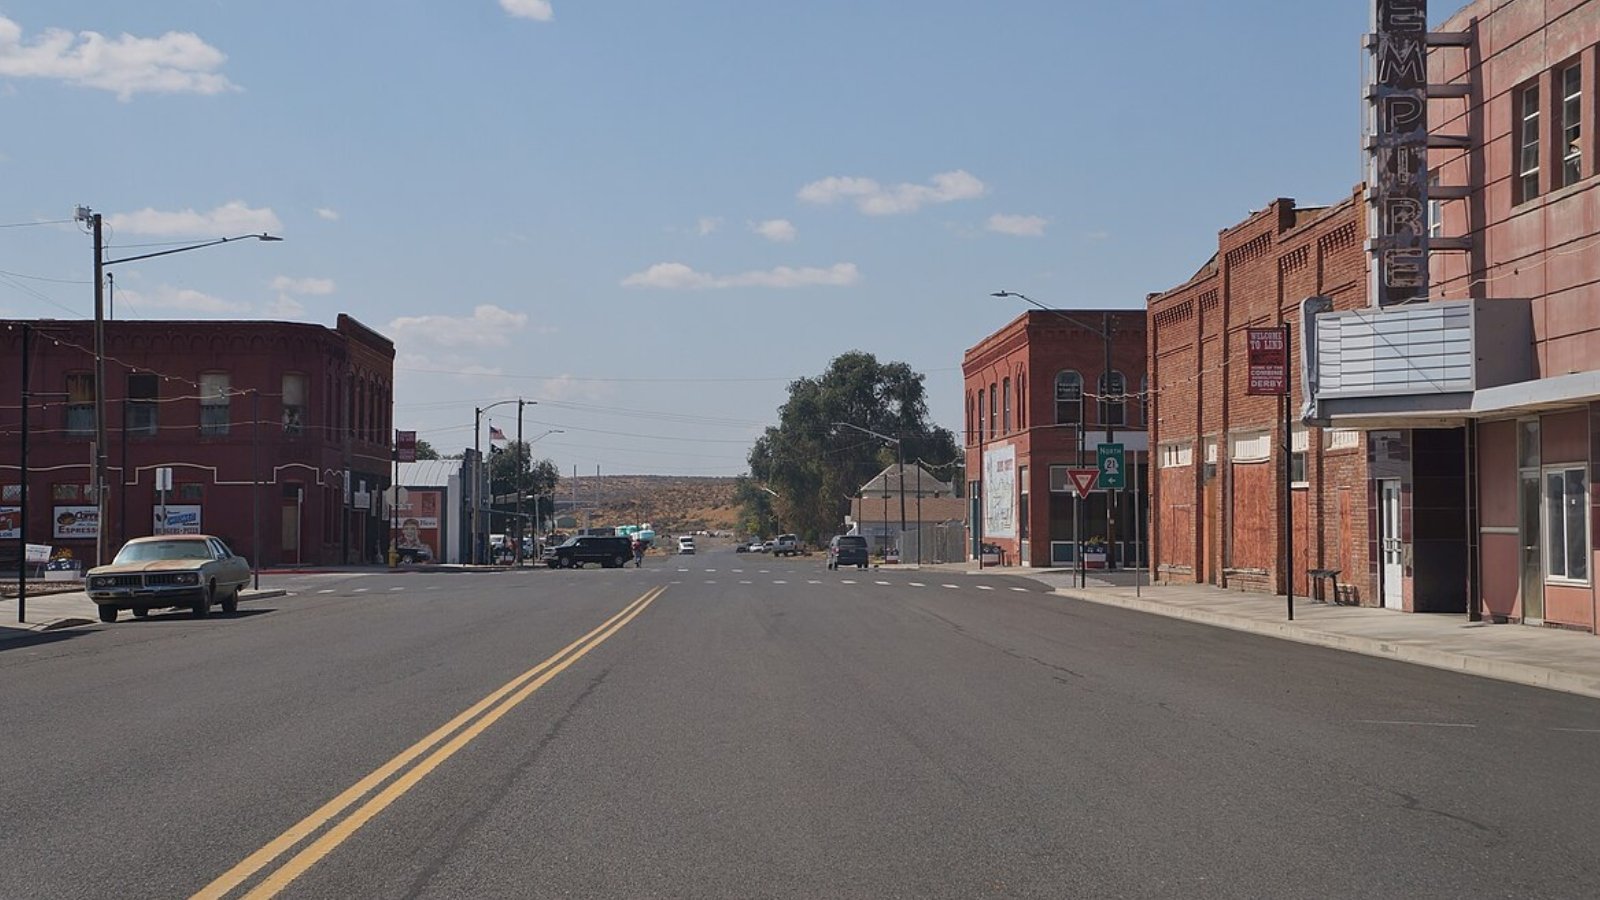
Lind is a small town in Adams County known for wheat farming and its annual Combine Demolition Derby, which draws visitors from across eastern Washington. Its population is under 600, offering a quiet rural lifestyle with basic services and strong community connections.
Homes remain highly affordable, with the median just over $204,000 this year. Lind’s steady growth reflects broader trends in agricultural regions where buyers seek affordable properties away from urban markets, maintaining its place among Washington’s most affordable towns.


