Would you like to save this?
California’s housing market may be famous for its sky-high prices, but not every town has joined the $750,000 club. According to the latest Zillow Home Value Index, 21 communities across the state are still surprisingly affordable—offering a rare shot at homeownership without the sticker shock. From sun-soaked desert outposts to tucked-away mountain towns, these places stand out for their livability, charm, and price tags that haven’t gone off the rails. If you’re looking for value in the Golden State, these are the towns still playing nice with your budget.
21. Weldon – 136% Home Price Increase Since 2010
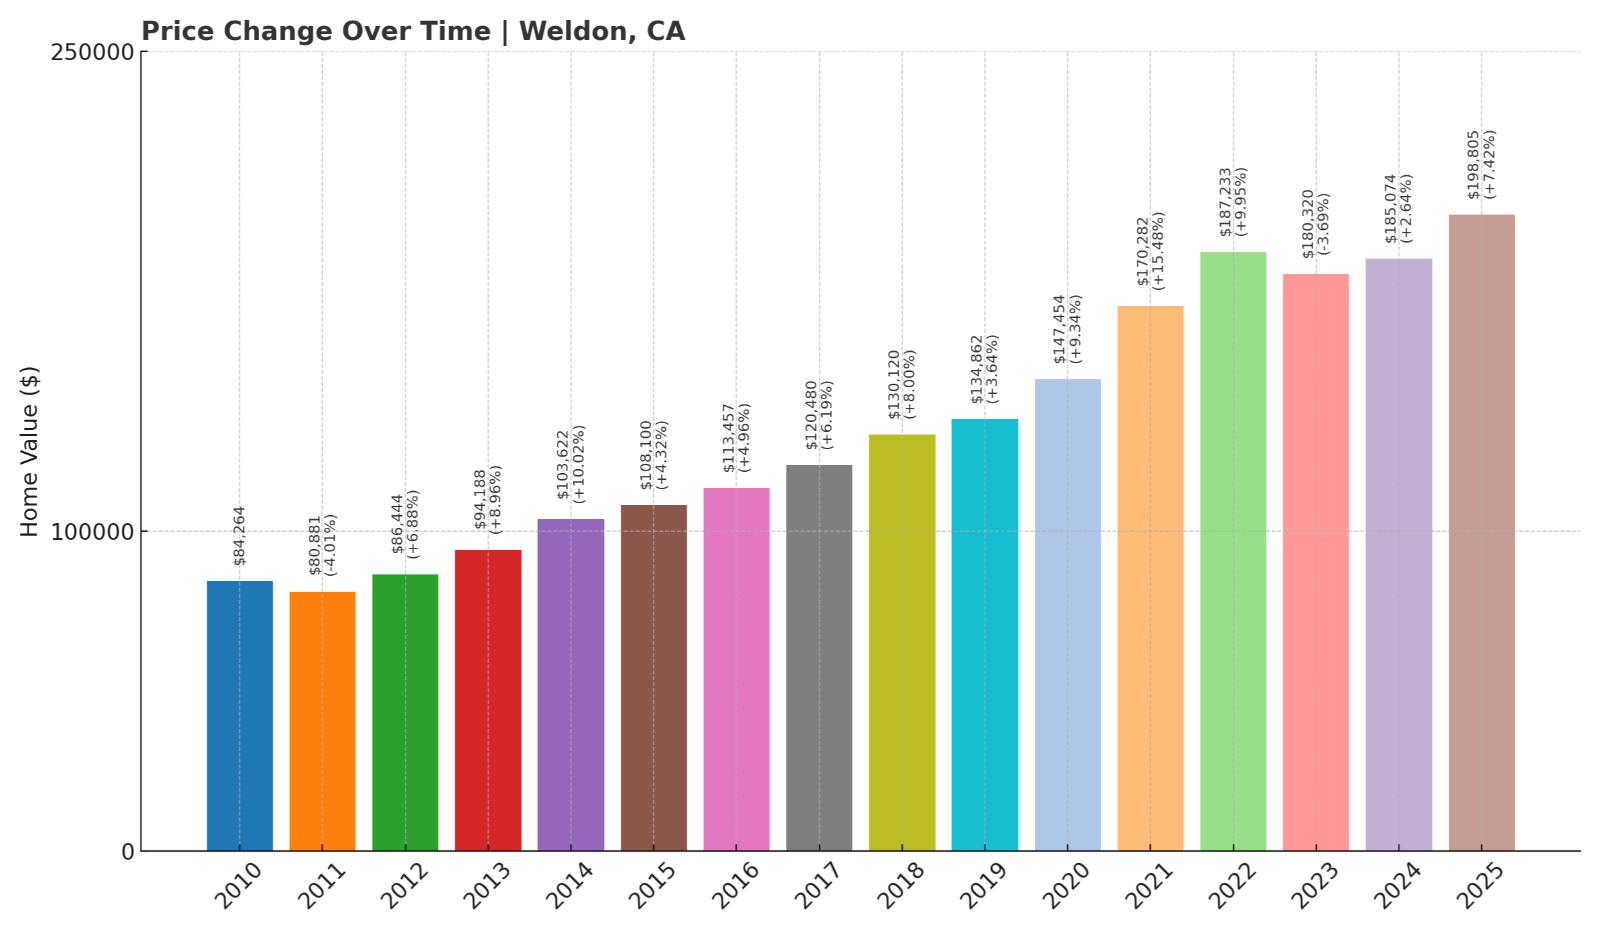
- 2010: $84,264
- 2011: $80,881 (-$3,383, -4.01% from previous year)
- 2012: $86,444 (+$5,563, +6.88% from previous year)
- 2013: $94,188 (+$7,744, +8.96% from previous year)
- 2014: $103,622 (+$9,434, +10.02% from previous year)
- 2015: $108,100 (+$4,479, +4.32% from previous year)
- 2016: $113,457 (+$5,356, +4.95% from previous year)
- 2017: $120,480 (+$7,024, +6.19% from previous year)
- 2018: $130,120 (+$9,640, +8.00% from previous year)
- 2019: $134,862 (+$4,742, +3.64% from previous year)
- 2020: $147,454 (+$12,592, +9.34% from previous year)
- 2021: $170,282 (+$22,828, +15.48% from previous year)
- 2022: $187,233 (+$16,951, +9.95% from previous year)
- 2023: $180,320 (-$6,913, -3.69% from previous year)
- 2024: $185,074 (+$4,754, +2.64% from previous year)
- 2025: $198,805 (+$13,731, +7.42% from previous year)
Weldon’s home prices have climbed significantly since 2010, rising from just over $84,000 to nearly $199,000 in 2025 — a 136% increase. Despite some mild fluctuations, including a slight dip in 2023, the town has experienced consistent upward momentum, particularly after 2020 when growth accelerated. Even with recent appreciation, Weldon remains one of the most affordable places to buy property in the state.
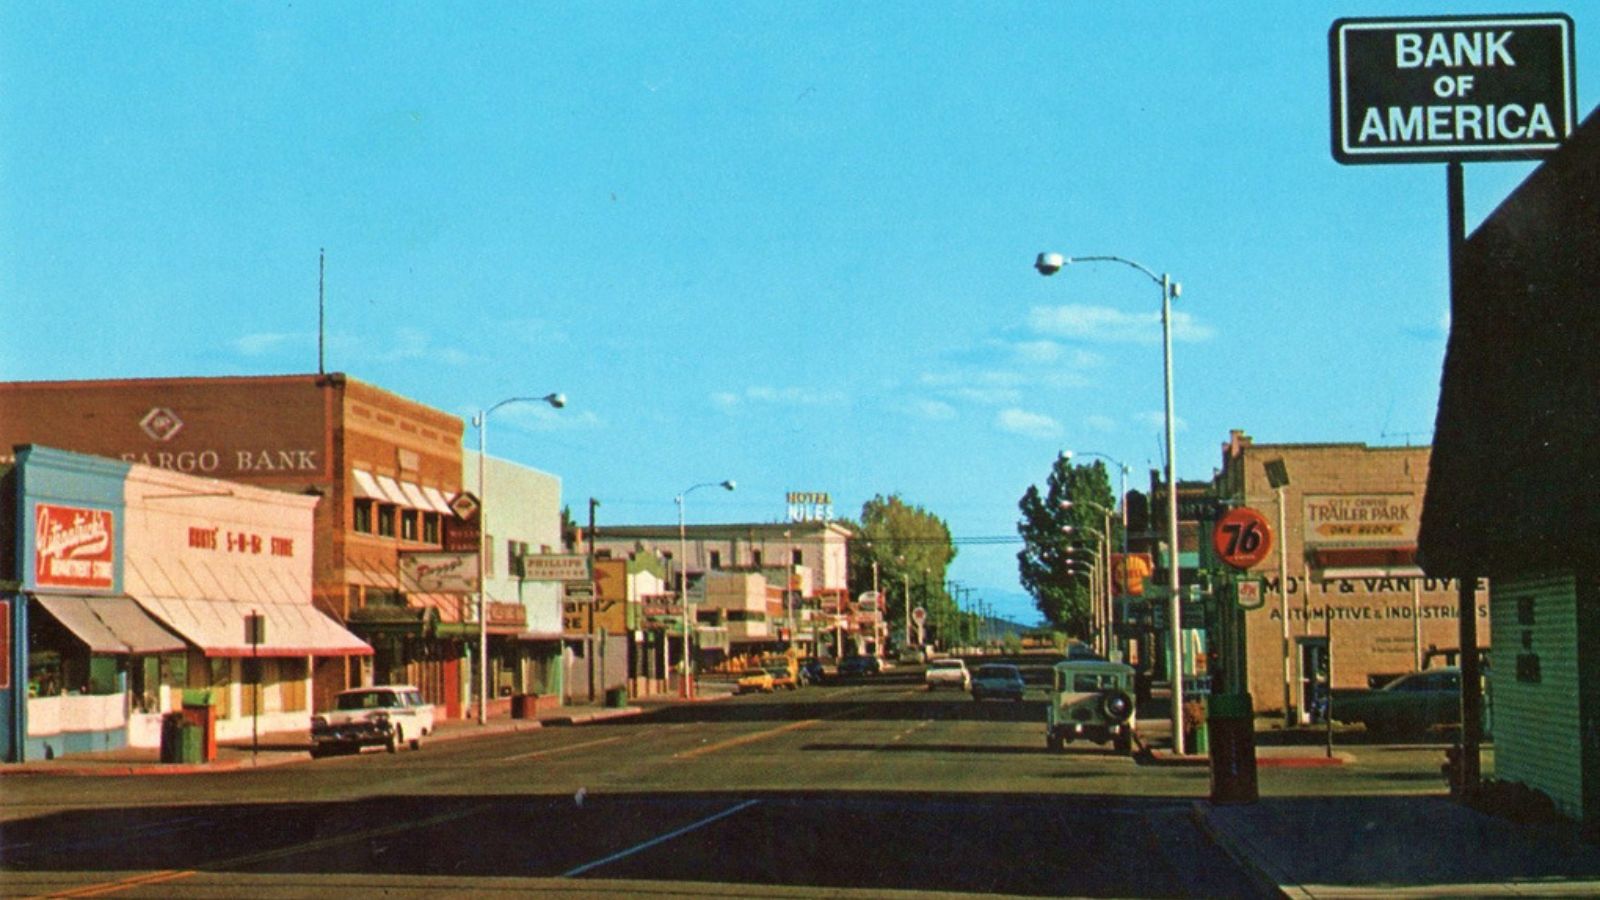
Weldon – Affordable Lakeside Living in Kern County

Located in the southern Sierra Nevada foothills, Weldon sits along the southeastern edge of Lake Isabella in Kern County. Its remote location and small-town atmosphere contribute to its affordability, making it a draw for retirees and outdoor enthusiasts alike. The community is known for its access to hiking, boating, and birdwatching opportunities — especially in nearby Audubon Kern River Preserve.
Weldon’s relatively low housing stock and limited commercial development have helped keep prices down. However, as more buyers look to escape California’s urban centers, interest in this area has been slowly growing. The town’s steady value gains over the past decade reflect this shift, although home values still remain far below state averages.
20. Maricopa – 129% Home Price Increase Since 2012
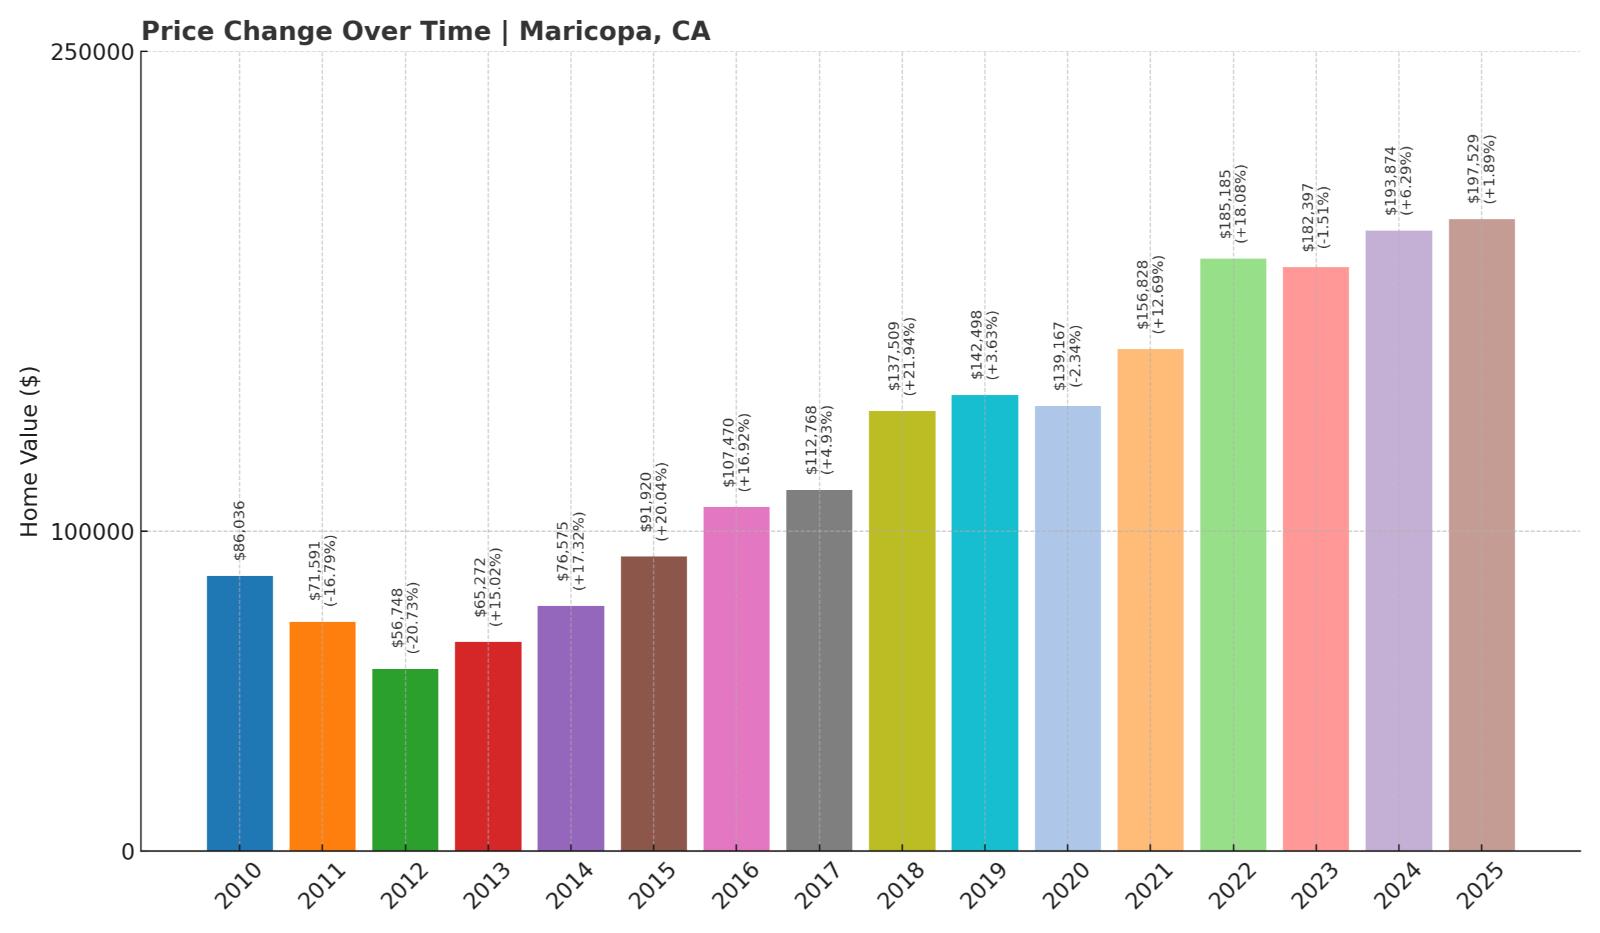
- 2010: $86,036
- 2011: $71,591 (-$14,446, -16.79% from previous year)
- 2012: $56,748 (-$14,843, -20.73% from previous year)
- 2013: $65,272 (+$8,524, +15.02% from previous year)
- 2014: $76,575 (+$11,304, +17.32% from previous year)
- 2015: $91,920 (+$15,345, +20.04% from previous year)
- 2016: $107,470 (+$15,550, +16.92% from previous year)
- 2017: $112,768 (+$5,298, +4.93% from previous year)
- 2018: $137,509 (+$24,741, +21.94% from previous year)
- 2019: $142,498 (+$4,989, +3.63% from previous year)
- 2020: $139,167 (-$3,331, -2.34% from previous year)
- 2021: $156,828 (+$17,661, +12.69% from previous year)
- 2022: $185,185 (+$28,358, +18.08% from previous year)
- 2023: $182,397 (-$2,788, -1.51% from previous year)
- 2024: $193,874 (+$11,476, +6.29% from previous year)
- 2025: $197,529 (+$3,656, +1.89% from previous year)
Home values in Maricopa dropped steeply during the early 2010s but have since made a remarkable recovery. Since bottoming out at just under $57,000 in 2012, prices have more than doubled, reaching nearly $198,000 in 2025. The growth has slowed somewhat in recent years, but values remain well above pre-recession lows.
Maricopa – Rural Community with Steady Gains

Maricopa is a small city nestled in southwestern Kern County, surrounded by oil fields and agricultural land. Once a booming oil town in the early 20th century, it’s now a quiet rural community with a population of under 1,200 residents. Limited development and infrastructure have kept prices low, but its location near the intersection of Highways 33 and 166 offers regional access for those willing to commute.
The town’s real estate market has shown surprising resilience, with major growth phases occurring after 2015. Its affordability continues to attract value-conscious buyers, especially those looking for investment properties or starter homes in a low-density setting.
19. Needles – 107% Home Price Increase Since 2012
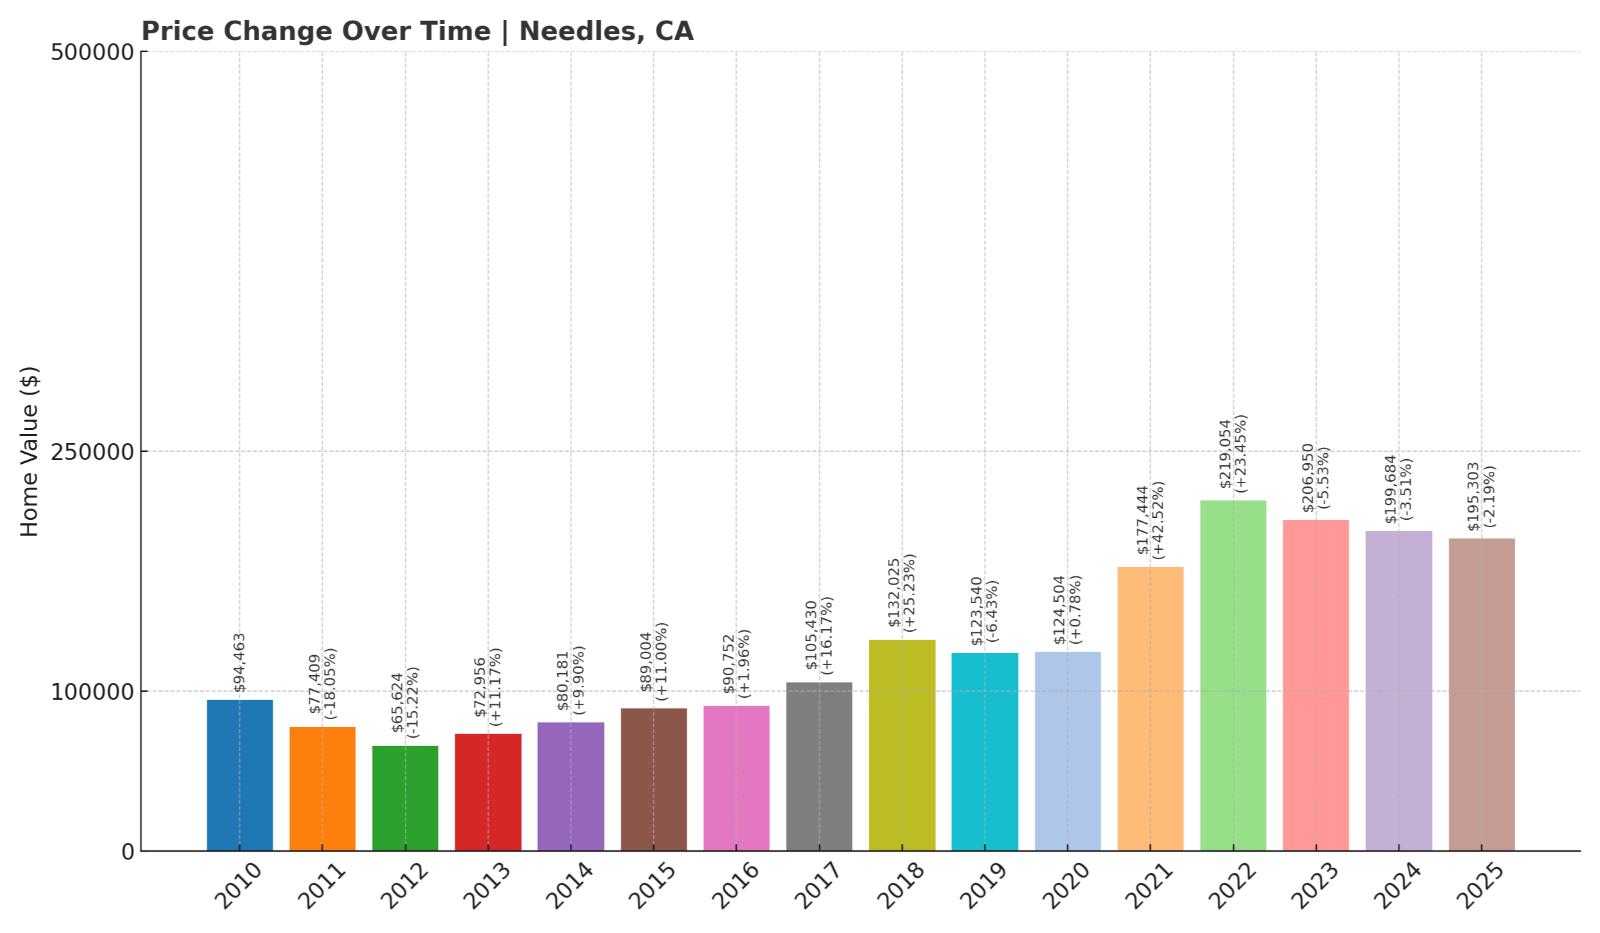
- 2010: $94,463
- 2011: $77,409 (-$17,053, -18.05% from previous year)
- 2012: $65,624 (-$11,786, -15.23% from previous year)
- 2013: $72,956 (+$7,332, +11.17% from previous year)
- 2014: $80,181 (+$7,225, +9.90% from previous year)
- 2015: $89,004 (+$8,823, +11.00% from previous year)
- 2016: $90,752 (+$1,748, +1.96% from previous year)
- 2017: $105,430 (+$14,678, +16.17% from previous year)
- 2018: $132,025 (+$26,596, +25.23% from previous year)
- 2019: $123,540 (-$8,486, -6.43% from previous year)
- 2020: $124,504 (+$964, +0.78% from previous year)
- 2021: $177,444 (+$52,941, +42.52% from previous year)
- 2022: $219,054 (+$41,609, +23.45% from previous year)
- 2023: $206,950 (-$12,104, -5.53% from previous year)
- 2024: $199,684 (-$7,266, -3.51% from previous year)
- 2025: $195,303 (-$4,381, -2.19% from previous year)
Needles saw home values plummet through the Great Recession before rebounding sharply in the late 2010s. Since hitting a low in 2012, prices have risen 107% despite some declines in the past few years. In 2025, the median home value is just under $200,000.
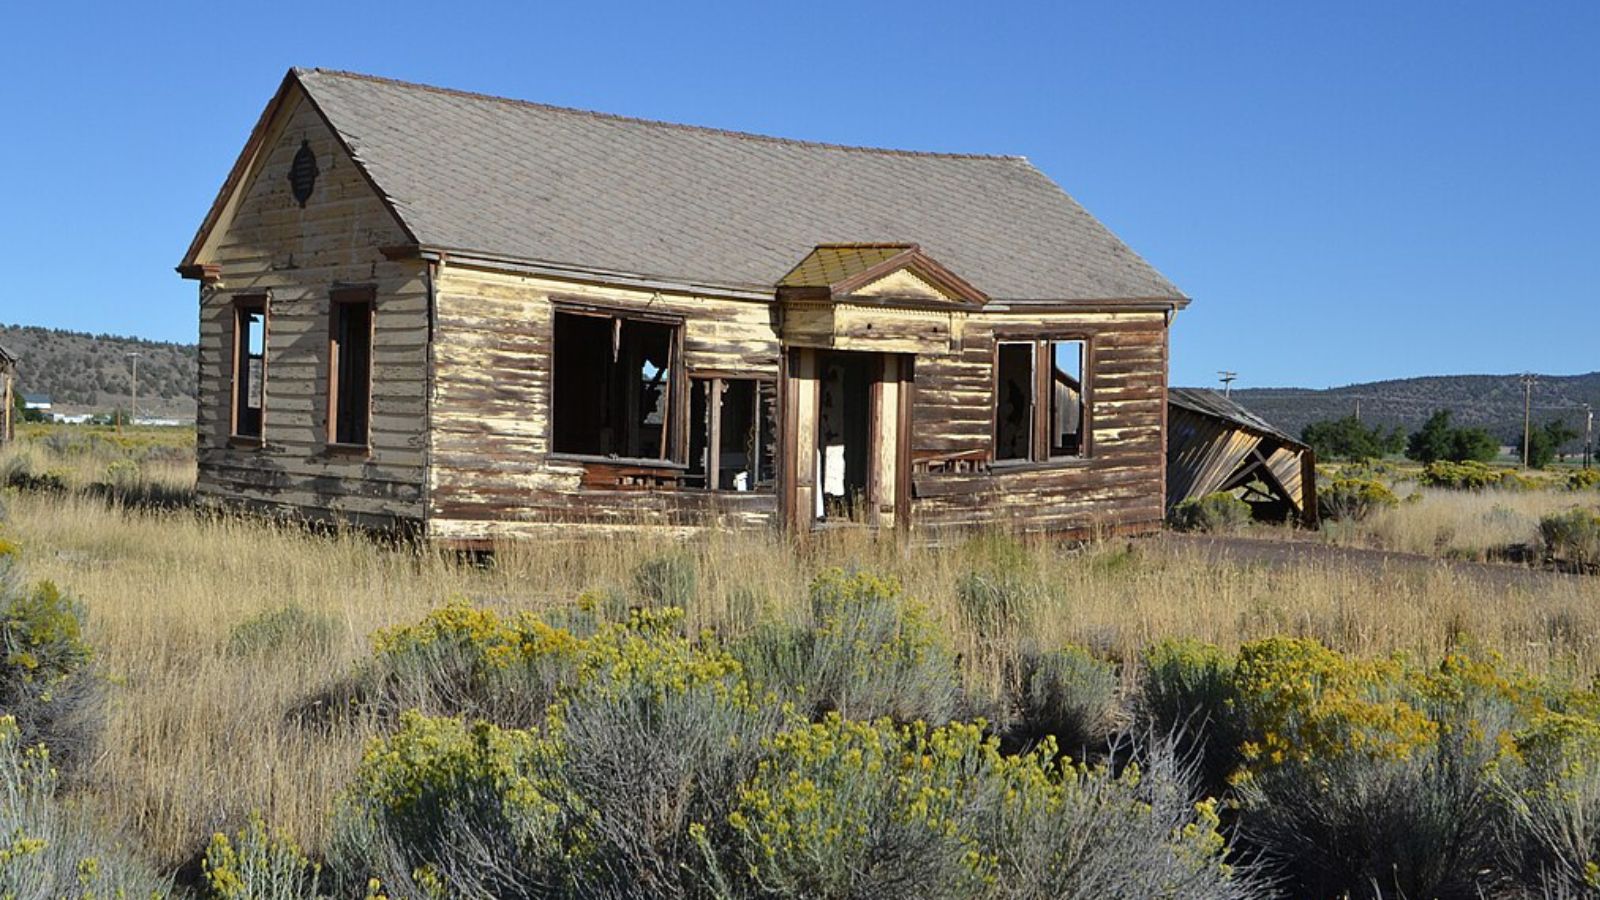
Needles – Desert Outpost on the Colorado River
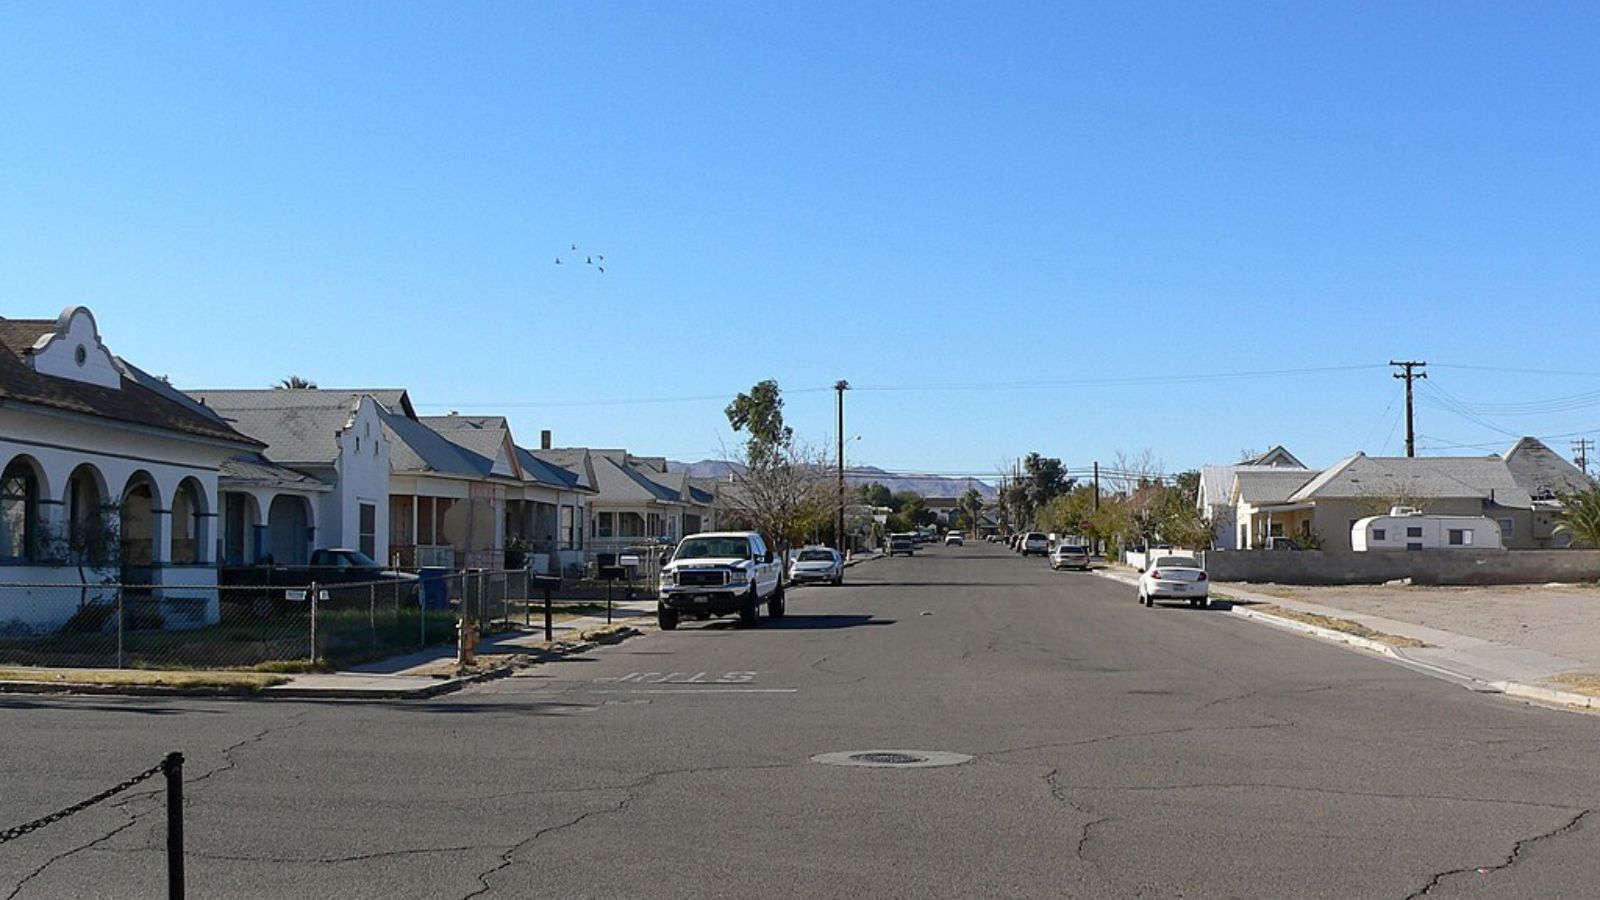
Stan Shebs, CC BY-SA 3.0, via Wikimedia Commons
Positioned along the Colorado River in San Bernardino County, Needles is the easternmost city in California. It’s a desert town known for its extreme summer temperatures and proximity to Route 66. Needles has historically been one of the state’s most affordable markets, partly due to its isolated location and limited amenities.
The town’s sharp value gains in 2021 and 2022 reflect increased interest in riverfront living and recreational access to nearby Lake Havasu. Despite that, demand has cooled slightly, and prices have edged down in recent years, keeping Needles firmly on this list of least expensive places to live in California.
18. Bodfish – 176% Home Price Increase Since 2010
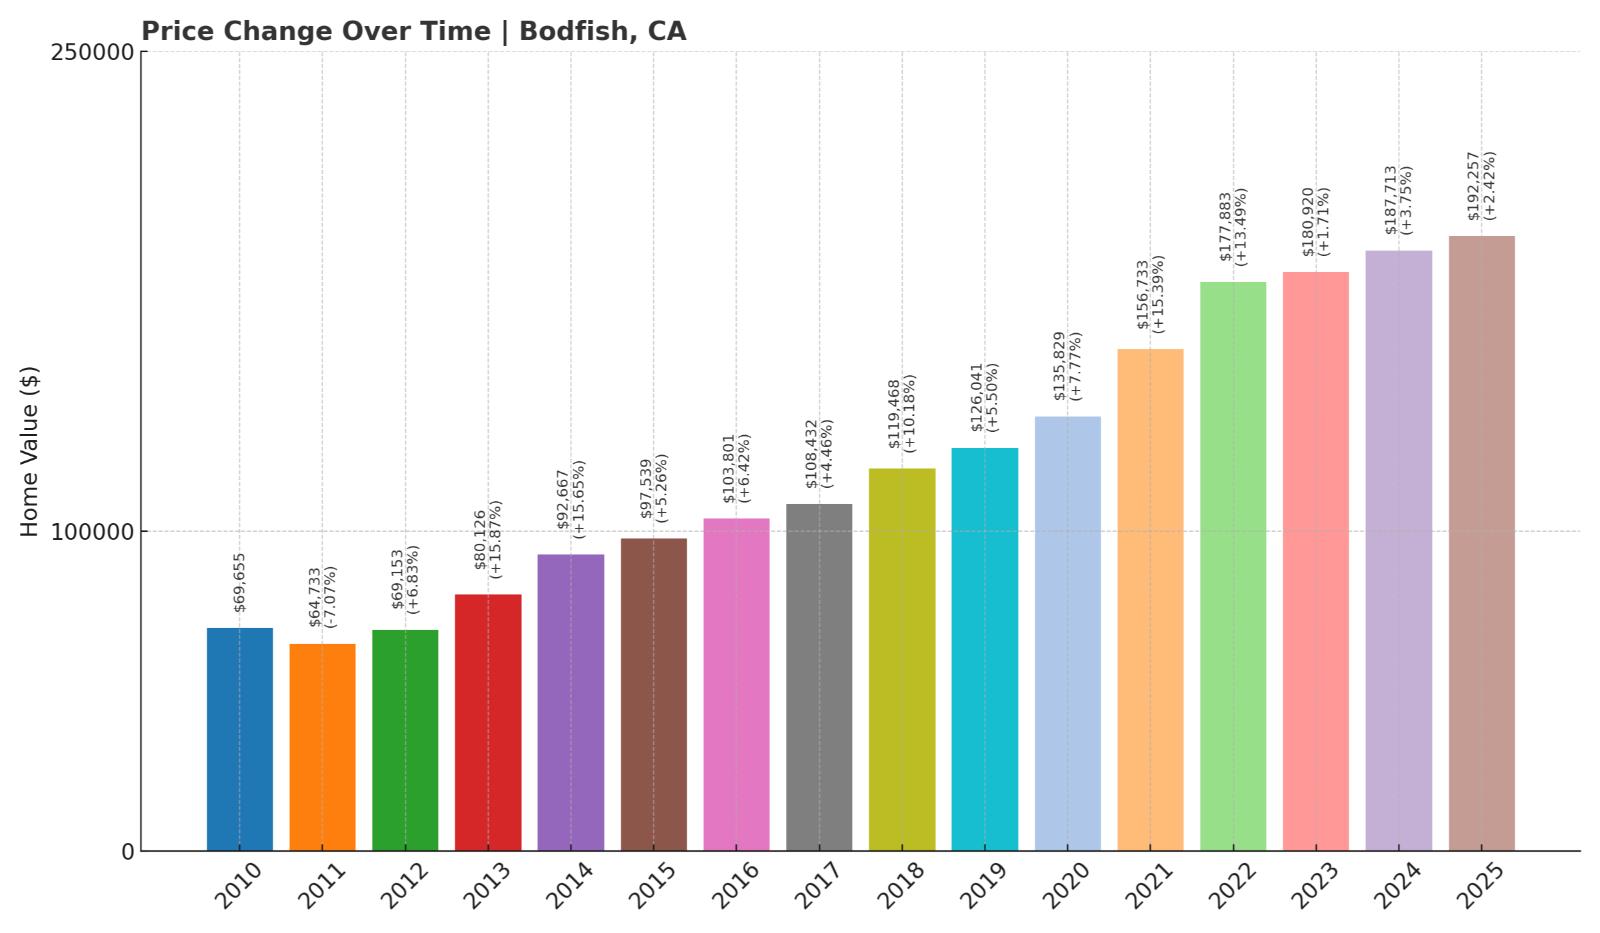
- 2010: $69,655
- 2011: $64,733 (-$4,922, -7.07% from previous year)
- 2012: $69,153 (+$4,420, +6.83% from previous year)
- 2013: $80,126 (+$10,973, +15.87% from previous year)
- 2014: $92,667 (+$12,541, +15.65% from previous year)
- 2015: $97,539 (+$4,872, +5.26% from previous year)
- 2016: $103,801 (+$6,262, +6.42% from previous year)
- 2017: $108,432 (+$4,630, +4.46% from previous year)
- 2018: $119,468 (+$11,037, +10.18% from previous year)
- 2019: $126,041 (+$6,572, +5.50% from previous year)
- 2020: $135,829 (+$9,788, +7.77% from previous year)
- 2021: $156,733 (+$20,904, +15.39% from previous year)
- 2022: $177,883 (+$21,149, +13.49% from previous year)
- 2023: $180,920 (+$3,037, +1.71% from previous year)
- 2024: $187,713 (+$6,794, +3.76% from previous year)
- 2025: $192,257 (+$4,543, +2.42% from previous year)
Bodfish has seen its home values climb from under $70,000 in 2010 to over $192,000 by 2025 — a 176% increase. While year-over-year growth has slowed more recently, the upward trend has remained largely consistent for more than a decade.
Bodfish – Mountain Town with Modest Prices
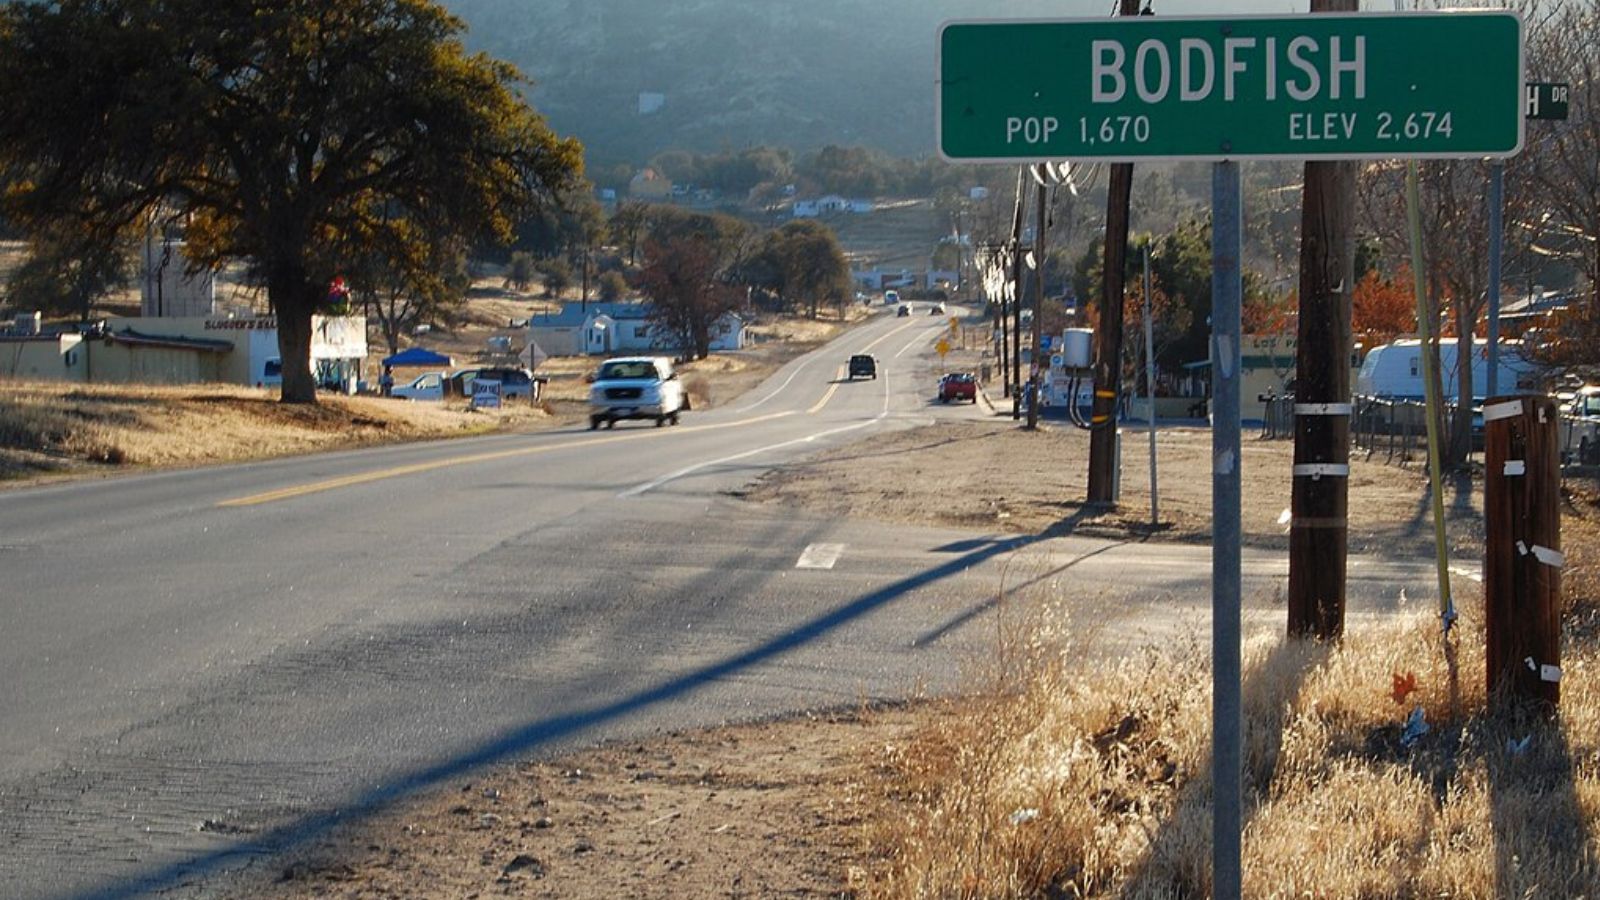
Bodfish is a small Kern County town located near Lake Isabella and the Sequoia National Forest. It’s a popular retirement spot due to its mild weather, slow pace, and scenic mountain surroundings. With fewer than 2,000 residents, Bodfish has maintained a low housing inventory and a relatively static population.
The area’s affordability and proximity to outdoor attractions have kept demand steady. Although prices remain low by California standards, the strong upward trend suggests that buyers are increasingly seeing value in its remote yet beautiful setting.
17. Earp – 16% Home Price Drop Since 2022
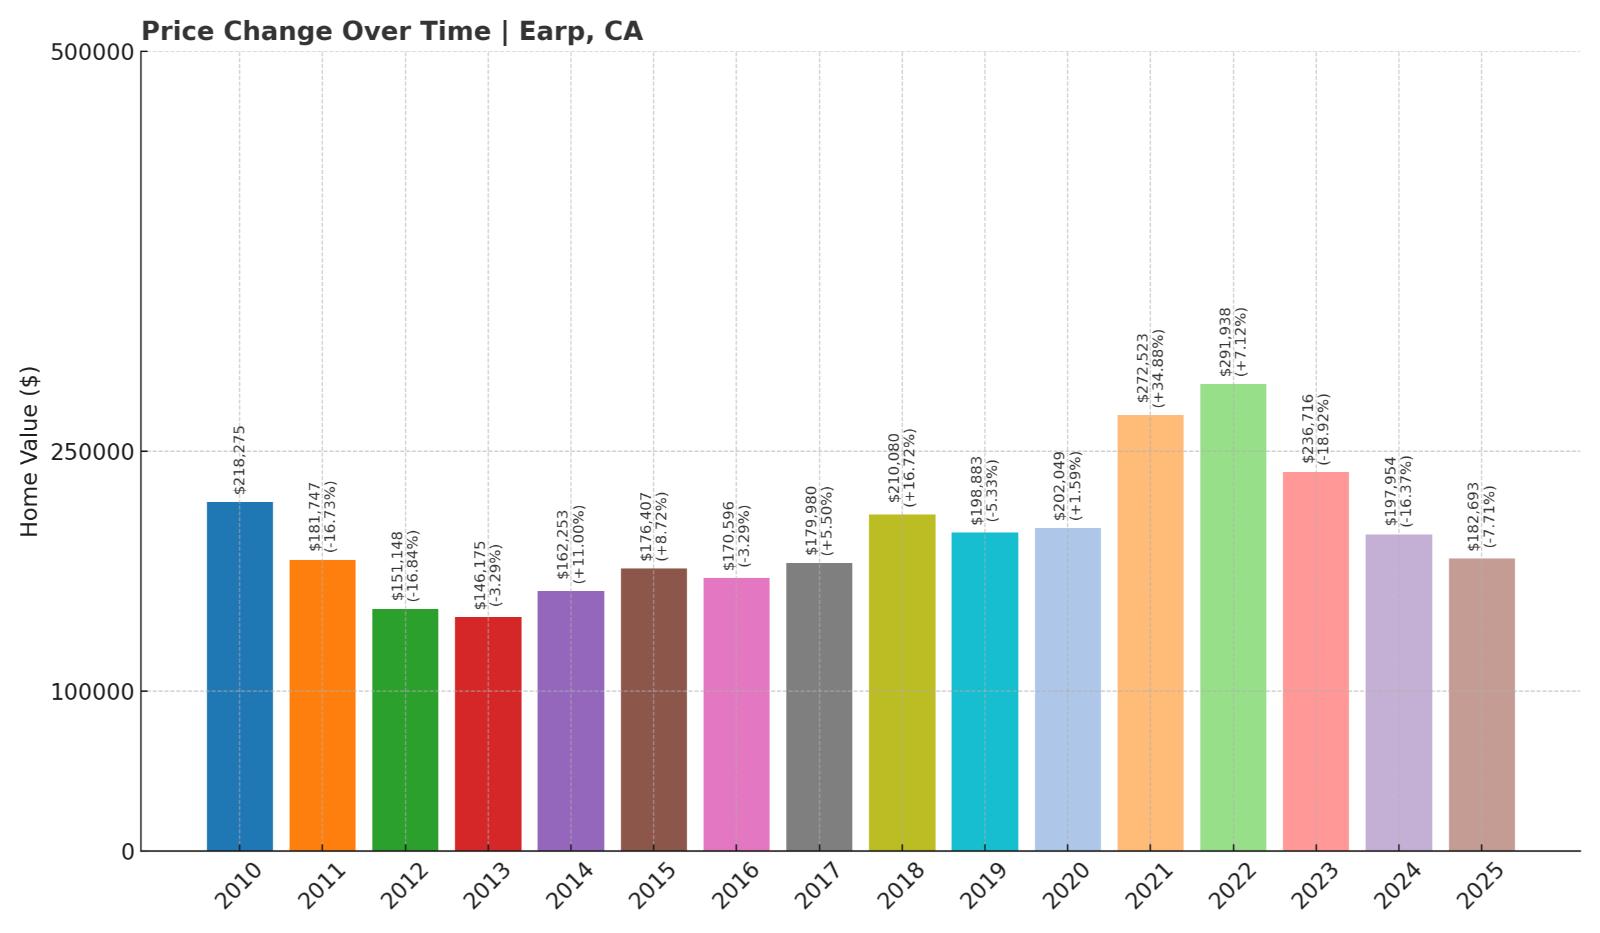
- 2010: $218,275
- 2011: $181,747 (-$36,529, -16.74% from previous year)
- 2012: $151,148 (-$30,599, -16.84% from previous year)
- 2013: $146,175 (-$4,972, -3.29% from previous year)
- 2014: $162,253 (+$16,078, +11.00% from previous year)
- 2015: $176,407 (+$14,154, +8.72% from previous year)
- 2016: $170,596 (-$5,810, -3.29% from previous year)
- 2017: $179,980 (+$9,383, +5.50% from previous year)
- 2018: $210,080 (+$30,101, +16.72% from previous year)
- 2019: $198,883 (-$11,197, -5.33% from previous year)
- 2020: $202,049 (+$3,166, +1.59% from previous year)
- 2021: $272,523 (+$70,474, +34.88% from previous year)
- 2022: $291,938 (+$19,415, +7.12% from previous year)
- 2023: $236,716 (-$55,222, -18.92% from previous year)
- 2024: $197,954 (-$38,762, -16.37% from previous year)
- 2025: $182,693 (-$15,260, -7.71% from previous year)
Earp’s housing market has taken a steep downward turn since peaking in 2022. After years of dramatic gains — including a spike in 2021 — home prices have dropped more than 16% over the last two years, settling at $182,693 in 2025.
Earp – River Town with Volatile Values
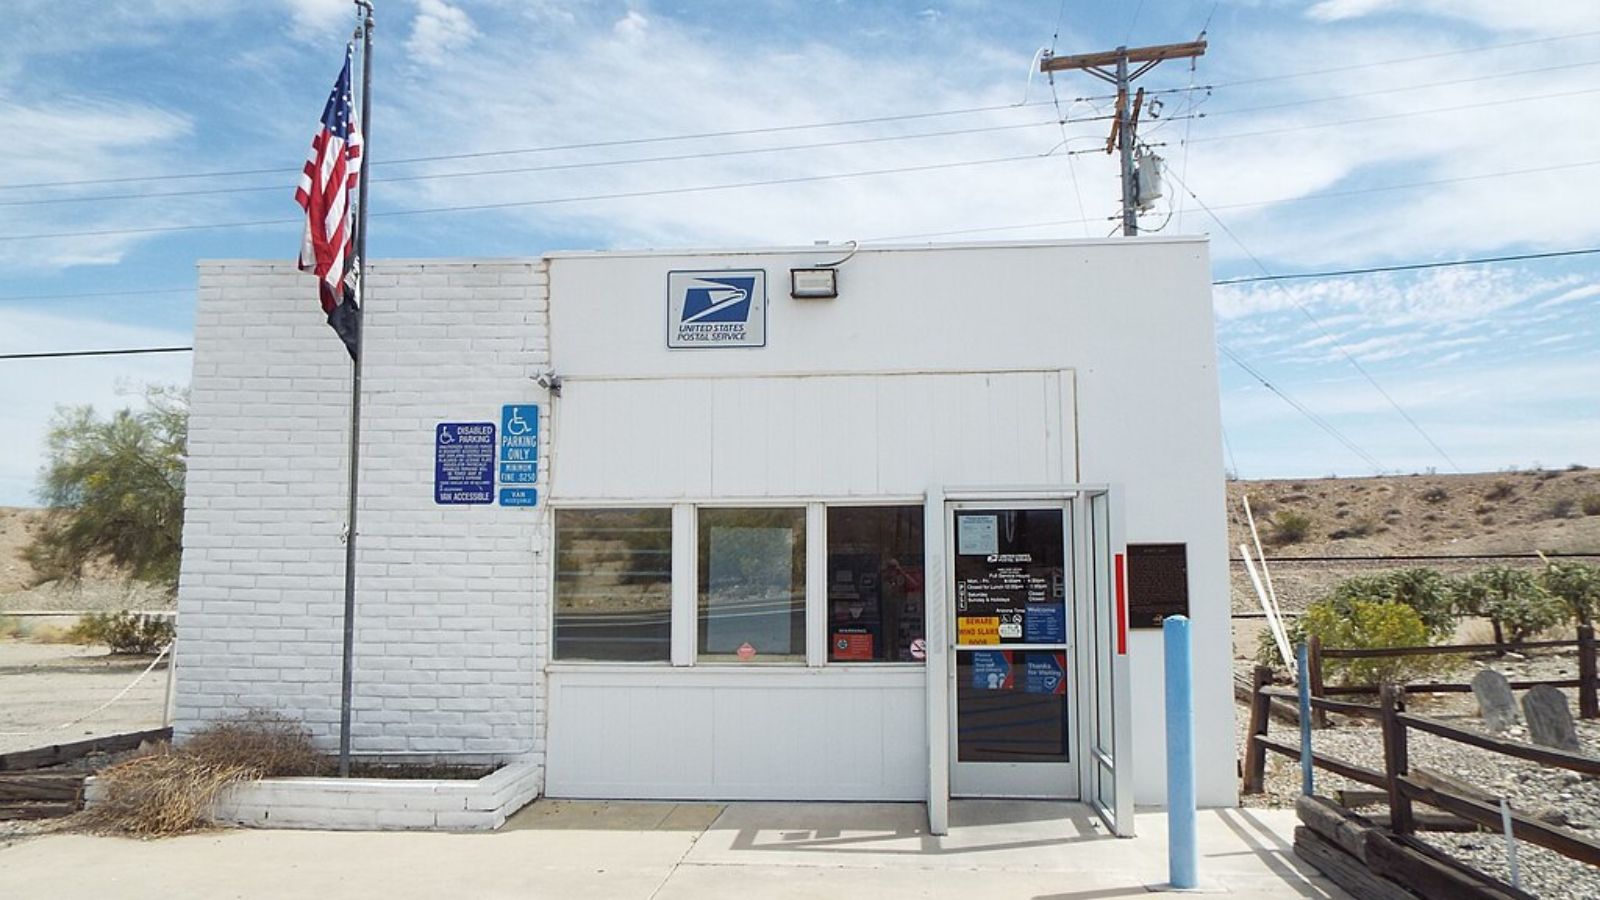
Situated just across the Colorado River from Parker, Arizona, Earp is a tiny border town in eastern San Bernardino County. Its appeal lies in recreational access to the river, off-roading trails, and low cost of living. For a time, these factors drove prices sharply upward — especially during the housing rush of 2021.
But as interest cooled and pandemic-era demand receded, the market corrected. Earp’s recent price declines reflect its small housing market’s susceptibility to larger economic shifts. Despite the drop, homes here remain relatively affordable compared to much of the state.
16. Bieber – 127% Home Price Increase Since 2010

- 2010: $77,601
- 2011: $74,685 (-$2,916, -3.76% from previous year)
- 2012: $79,384 (+$4,699, +6.29% from previous year)
- 2013: $84,357 (+$4,974, +6.27% from previous year)
- 2014: $86,059 (+$1,702, +2.02% from previous year)
- 2015: $97,674 (+$11,615, +13.50% from previous year)
- 2016: $109,088 (+$11,415, +11.69% from previous year)
- 2017: $119,492 (+$10,404, +9.54% from previous year)
- 2018: $140,658 (+$21,166, +17.71% from previous year)
- 2019: $146,161 (+$5,503, +3.91% from previous year)
- 2020: $140,817 (-$5,344, -3.66% from previous year)
- 2021: $187,216 (+$46,399, +32.95% from previous year)
- 2022: $179,382 (-$7,834, -4.18% from previous year)
- 2023: $180,466 (+$1,083, +0.60% from previous year)
- 2024: $177,561 (-$2,905, -1.61% from previous year)
- 2025: $176,361 (-$1,200, -0.68% from previous year)
Bieber’s home values have more than doubled since 2010, even with recent modest declines. After hitting a high of nearly $187,000 in 2021, prices have hovered slightly below that mark, landing at $176,361 in 2025. Growth was particularly steep between 2015 and 2021.
Bieber – Remote Living in Northern California
Bieber is a quiet community in Lassen County, part of northeastern California’s rugged, sparsely populated region. With fewer than 400 residents, it offers a remote, rural lifestyle that appeals to buyers looking for seclusion and affordability. The town sits near the Pit River and is surrounded by forests and open space.
The surge in prices during the late 2010s likely stemmed from increased interest in rural homes as people looked to leave more expensive metro areas. But recent slight price declines indicate that demand may be stabilizing, helping Bieber retain its status as one of California’s least expensive towns.
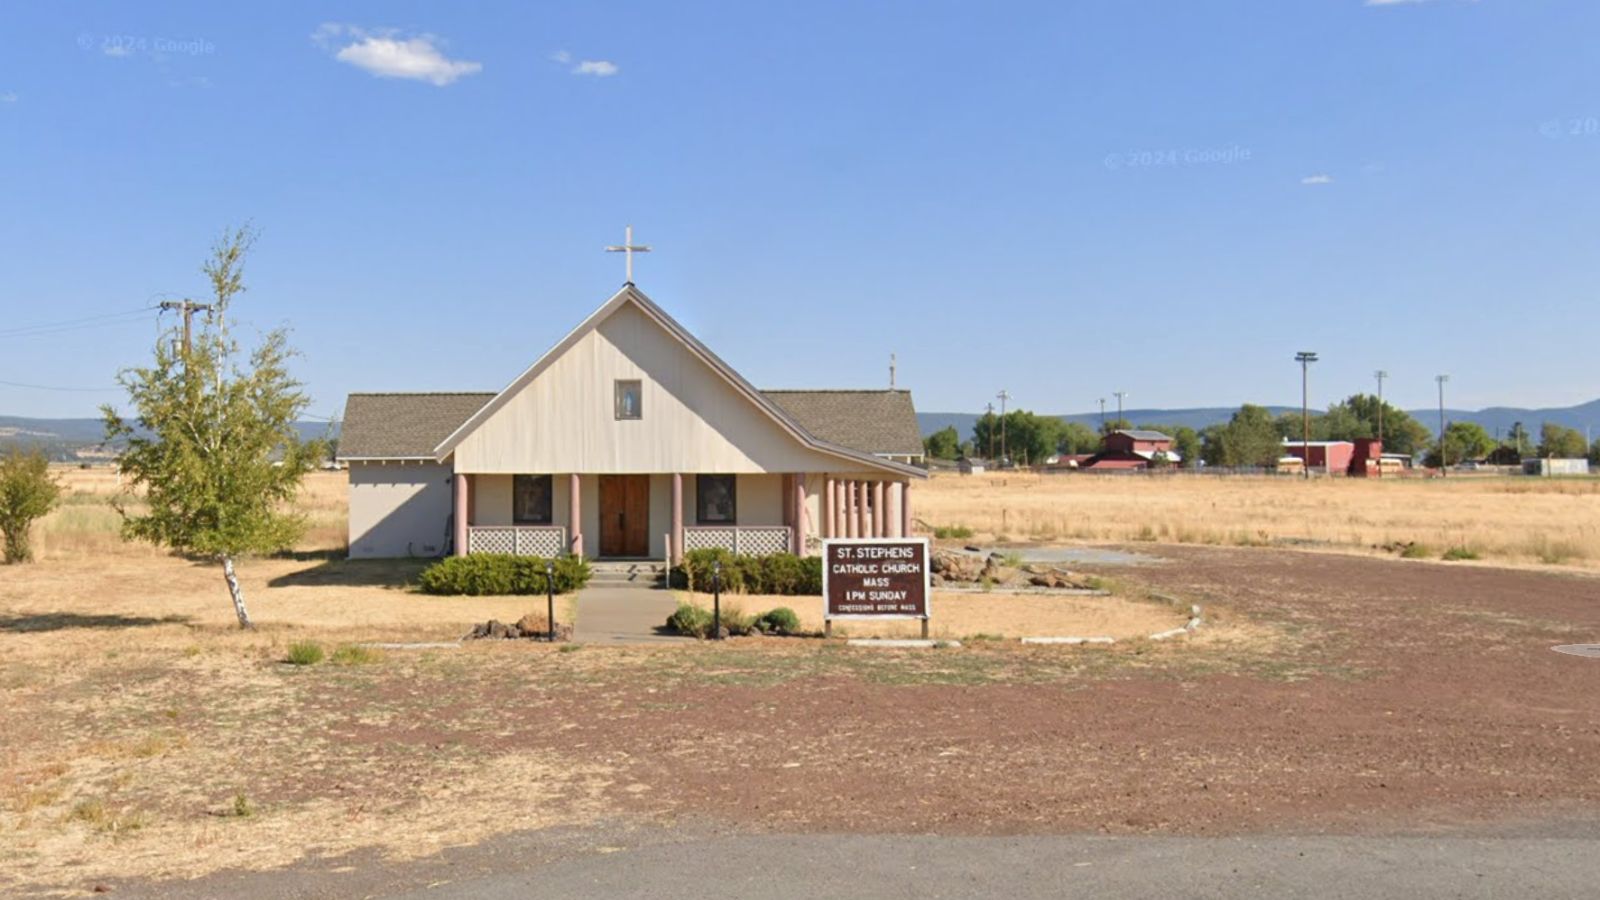
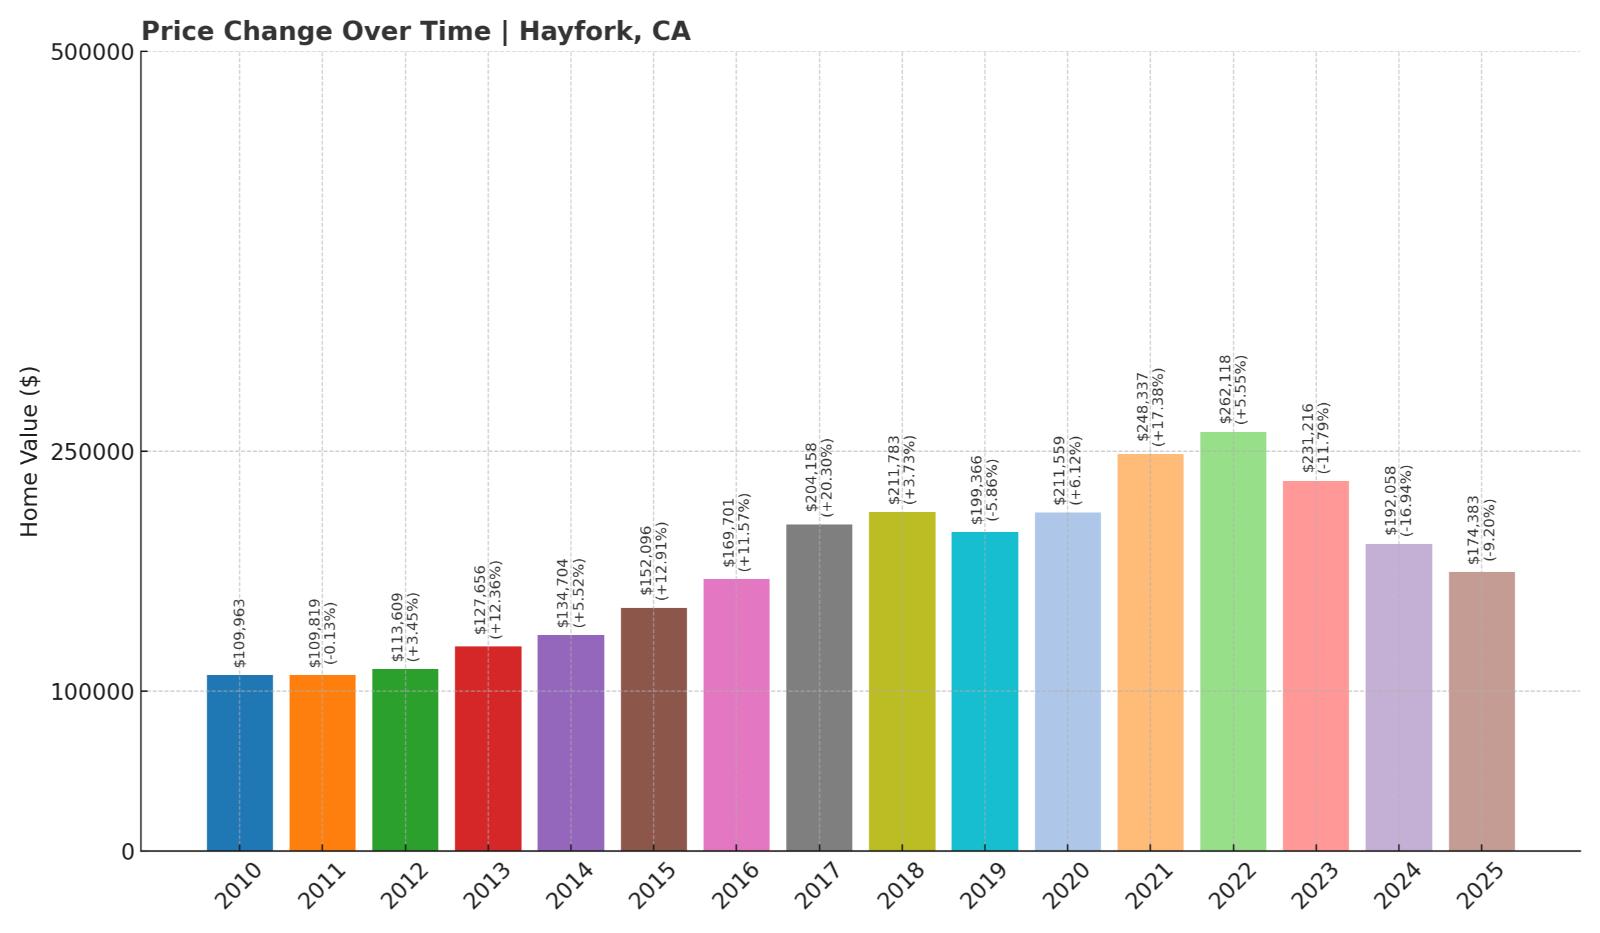
15. Hayfork – 58% Home Price Increase Since 2010
Would you like to save this?
- 2010: $109,963
- 2011: $109,819 (-$143, -0.13% from previous year)
- 2012: $113,609 (+$3,789, +3.45% from previous year)
- 2013: $127,656 (+$14,047, +12.36% from previous year)
- 2014: $134,704 (+$7,048, +5.52% from previous year)
- 2015: $152,096 (+$17,392, +12.91% from previous year)
- 2016: $169,701 (+$17,605, +11.57% from previous year)
- 2017: $204,158 (+$34,457, +20.30% from previous year)
- 2018: $211,783 (+$7,625, +3.74% from previous year)
- 2019: $199,366 (-$12,418, -5.86% from previous year)
- 2020: $211,559 (+$12,194, +6.12% from previous year)
- 2021: $248,337 (+$36,777, +17.38% from previous year)
- 2022: $262,118 (+$13,781, +5.55% from previous year)
- 2023: $231,216 (-$30,902, -11.79% from previous year)
- 2024: $192,058 (-$39,157, -16.94% from previous year)
- 2025: $174,383 (-$17,675, -9.20% from previous year)
Hayfork’s housing market soared in the late 2010s and early 2020s, but prices have dropped sharply in the past three years. From a peak of $262,000 in 2022, values have slid to about $174,000 in 2025, bringing the town back to a much lower price tier.
Hayfork – Post-Boom Correction in Trinity County
Located in Trinity County, Hayfork is a remote town in the Shasta-Trinity National Forest. It’s historically been a logging and agricultural hub, and more recently has attracted homesteaders and off-grid buyers due to its secluded location. The housing boom of the early 2020s may have been driven by pandemic-era migration trends.
Now, with that wave receding, prices are correcting. While still more expensive than some towns on this list, Hayfork’s dramatic recent price declines underscore the volatility in rural real estate markets across California.
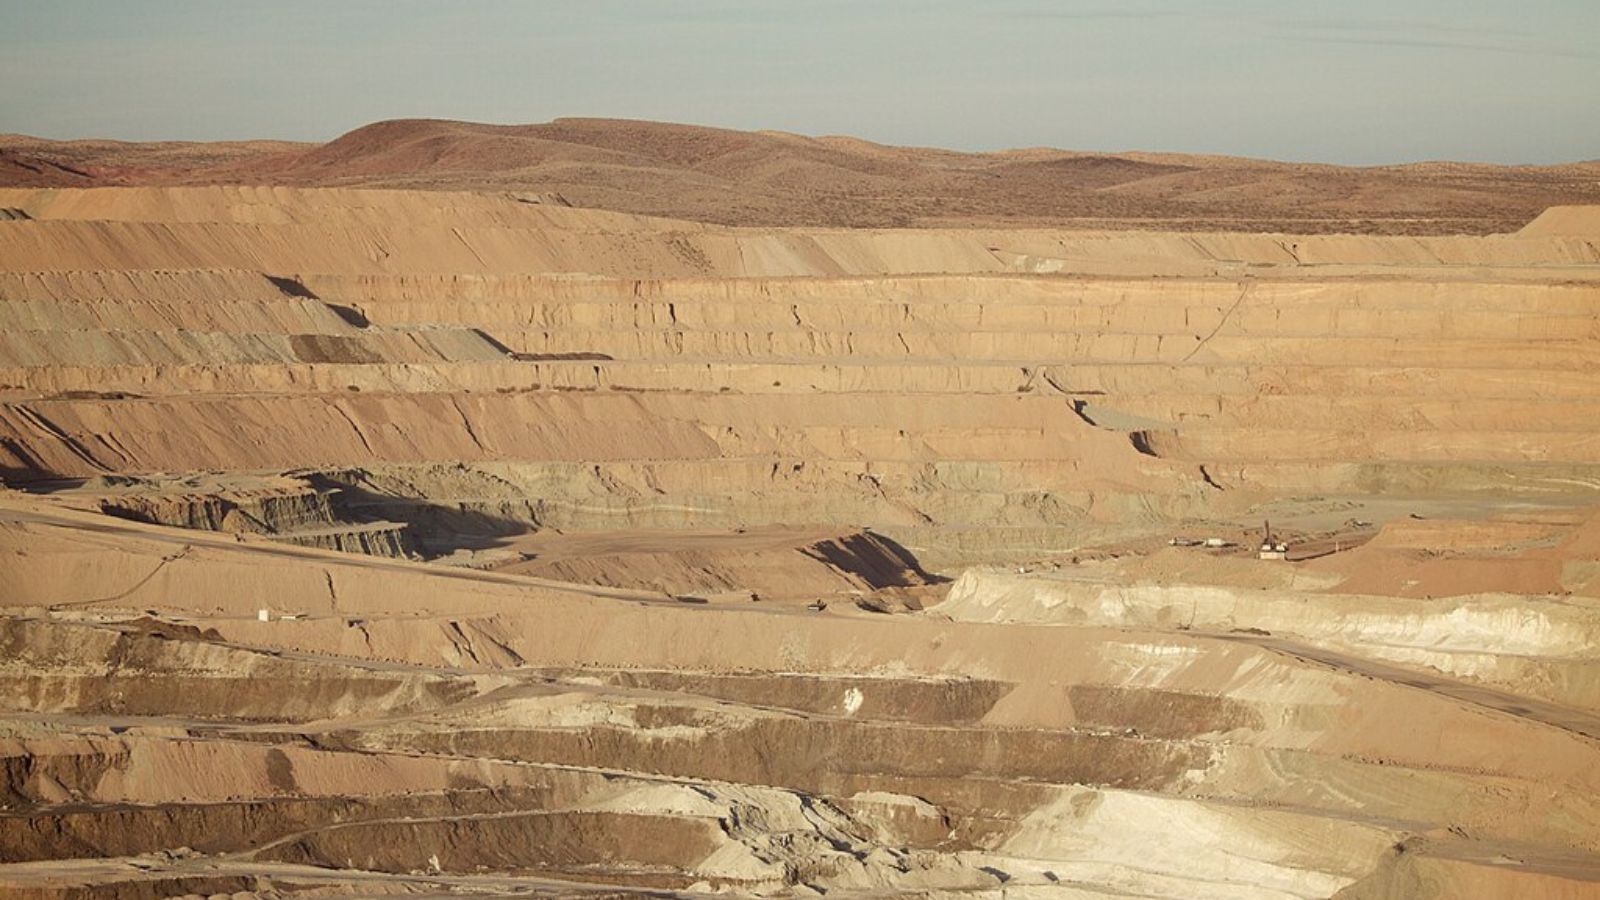
14. Boron – 263% Home Price Increase Since 2012
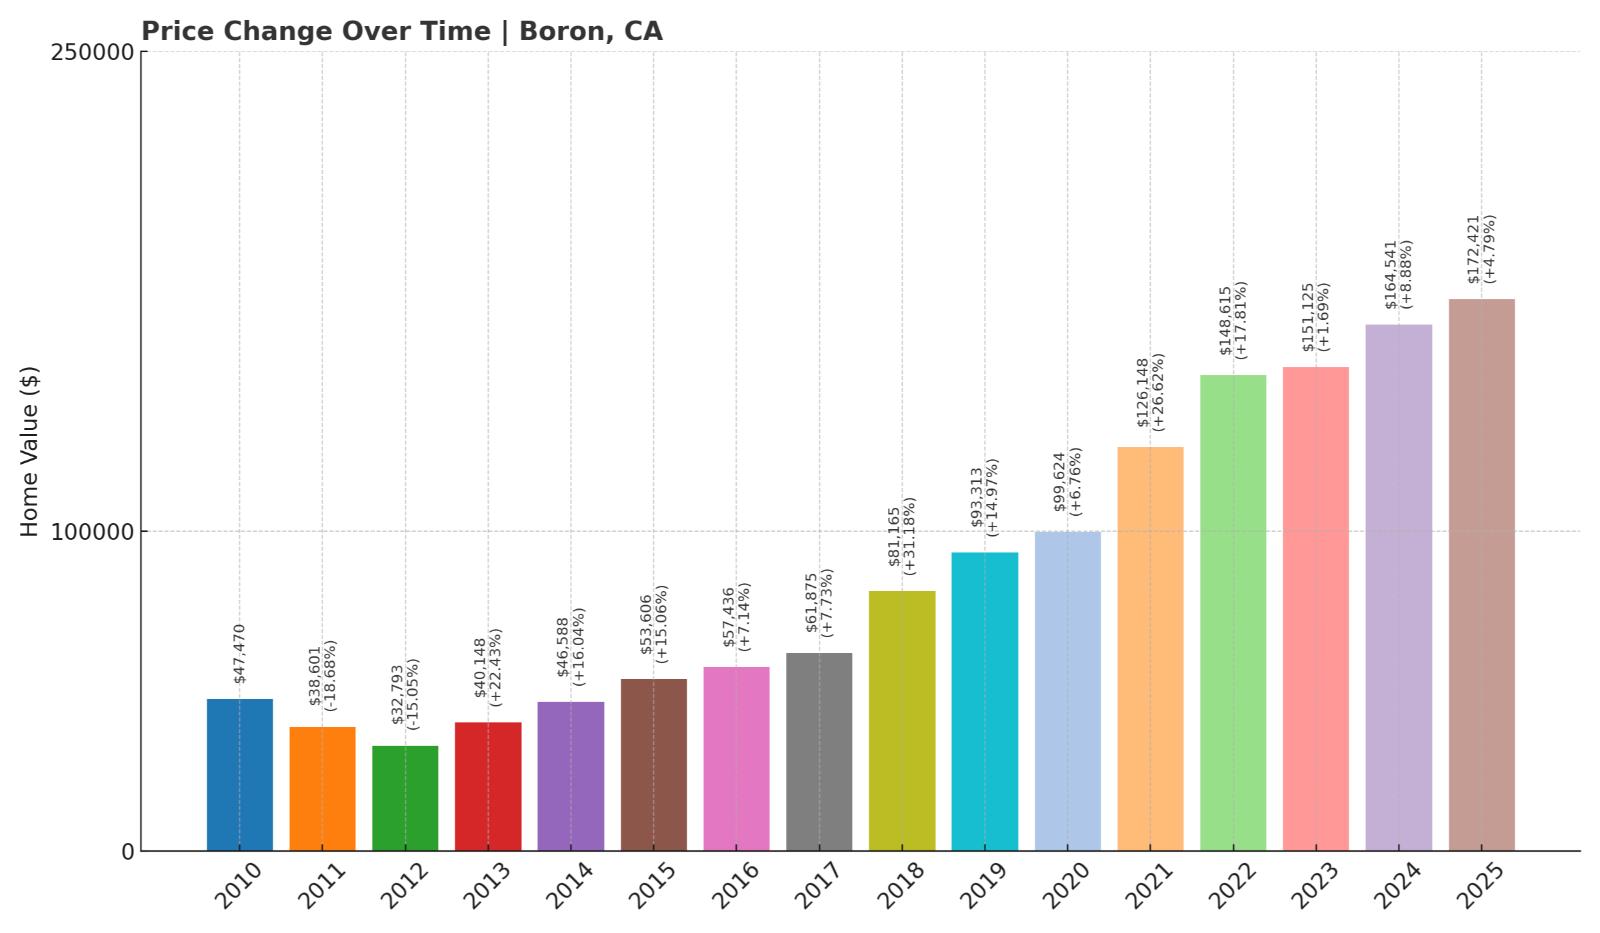
- 2010: $47,470
- 2011: $38,601 (-$8,869, -18.68% from previous year)
- 2012: $32,793 (-$5,808, -15.05% from previous year)
- 2013: $40,148 (+$7,355, +22.43% from previous year)
- 2014: $46,588 (+$6,440, +16.04% from previous year)
- 2015: $53,606 (+$7,018, +15.06% from previous year)
- 2016: $57,436 (+$3,830, +7.15% from previous year)
- 2017: $61,875 (+$4,439, +7.73% from previous year)
- 2018: $81,165 (+$19,290, +31.18% from previous year)
- 2019: $93,313 (+$12,148, +14.97% from previous year)
- 2020: $99,624 (+$6,310, +6.76% from previous year)
- 2021: $126,148 (+$26,524, +26.62% from previous year)
- 2022: $148,615 (+$22,467, +17.81% from previous year)
- 2023: $151,125 (+$2,510, +1.69% from previous year)
- 2024: $164,541 (+$13,417, +8.88% from previous year)
- 2025: $172,421 (+$7,879, +4.79% from previous year)
Boron saw some of the sharpest gains among California’s cheapest towns, with values increasing 263% since their 2012 low. The market has continued to rise steadily, reaching $172,421 in 2025 — still affordable, but significantly higher than a decade ago.
Boron – Space-Age History, Budget-Friendly Prices
Marcin Wichary, CC BY 2.0, via Wikimedia Commons
Boron is located in the Mojave Desert and is best known as the site of one of the world’s largest borax mines. It’s also near Edwards Air Force Base and the Mojave Air & Space Port, giving it a unique identity tied to aerospace and mining. Despite that, it remains an inexpensive place to live.
Housing prices bottomed out in 2012 but have rebounded due to modest local investment and broader interest in rural living. With fewer than 3,000 residents and limited development, it remains one of the most affordable communities in the state, even after dramatic percentage growth.
13. Alturas – 91% Home Price Increase Since 2012

- 2010: $90,237
- 2011: $90,051 (-$187, -0.21% from previous year)
- 2012: $82,580 (-$7,470, -8.30% from previous year)
- 2013: $85,639 (+$3,059, +3.70% from previous year)
- 2014: $90,789 (+$5,149, +6.01% from previous year)
- 2015: $93,279 (+$2,490, +2.74% from previous year)
- 2016: $96,221 (+$2,942, +3.15% from previous year)
- 2017: $102,133 (+$5,911, +6.14% from previous year)
- 2018: $109,272 (+$7,140, +6.99% from previous year)
- 2019: $117,167 (+$7,895, +7.22% from previous year)
- 2020: $114,353 (-$2,814, -2.40% from previous year)
- 2021: $137,697 (+$23,344, +20.41% from previous year)
- 2022: $156,544 (+$18,847, +13.69% from previous year)
- 2023: $163,426 (+$6,883, +4.40% from previous year)
- 2024: $166,839 (+$3,413, +2.09% from previous year)
- 2025: $172,191 (+$5,352, +3.21% from previous year)
Alturas’s home values have climbed steadily since 2012, with an overall increase of 91%. Growth accelerated in 2021 and 2022, with the market settling around $172,000 in 2025 — still well below California’s average.
Alturas – Northern Outpost with Room to Grow
Alturas is the county seat of Modoc County and sits in the far northeastern corner of the state. It’s surrounded by high desert, forests, and lakes, and is one of the most isolated towns in California. This remoteness has helped keep real estate prices low for years.


The area offers a quiet, outdoors-oriented lifestyle and appeals to buyers priced out of more populous regions. Recent gains suggest a growing recognition of its value, but its distance from major cities will likely keep Alturas among the state’s most affordable markets for the foreseeable future.
12. Doyle – 98% Home Price Increase Since 2010
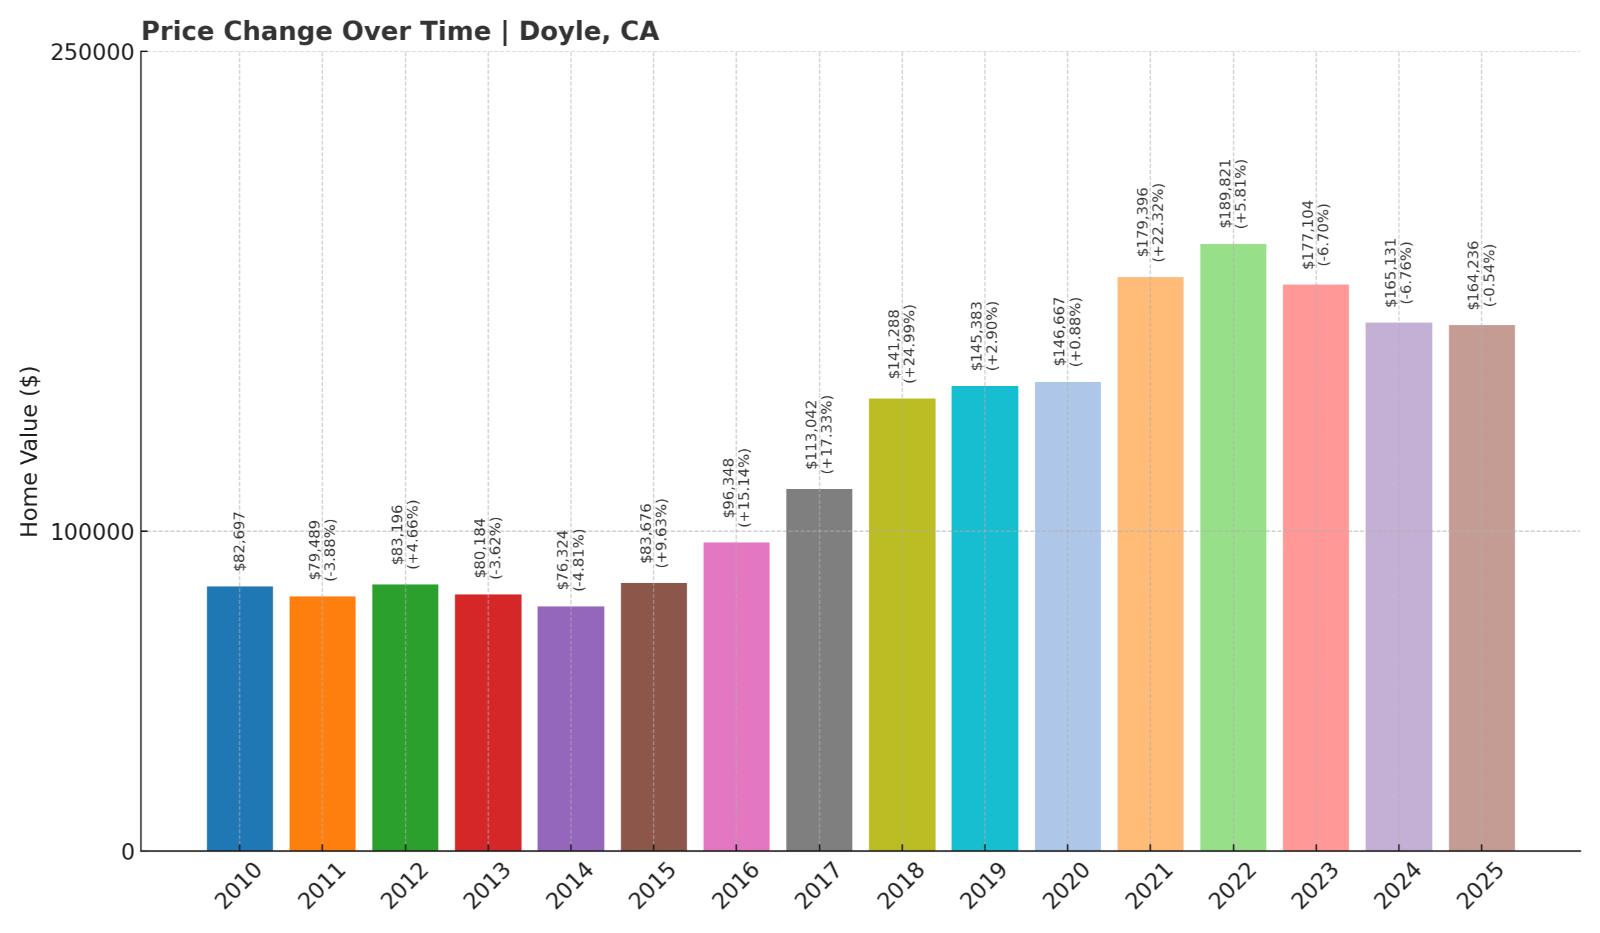
- 2010: $82,697
- 2011: $79,489 (-$3,208, -3.88% from previous year)
- 2012: $83,196 (+$3,707, +4.66% from previous year)
- 2013: $80,184 (-$3,012, -3.62% from previous year)
- 2014: $76,324 (-$3,860, -4.81% from previous year)
- 2015: $83,676 (+$7,352, +9.63% from previous year)
- 2016: $96,348 (+$12,672, +15.14% from previous year)
- 2017: $113,042 (+$16,694, +17.33% from previous year)
- 2018: $141,288 (+$28,246, +24.99% from previous year)
- 2019: $145,383 (+$4,096, +2.90% from previous year)
- 2020: $146,667 (+$1,284, +0.88% from previous year)
- 2021: $179,396 (+$32,729, +22.31% from previous year)
- 2022: $189,821 (+$10,424, +5.81% from previous year)
- 2023: $177,104 (-$12,716, -6.70% from previous year)
- 2024: $165,131 (-$11,973, -6.76% from previous year)
- 2025: $164,236 (-$895, -0.54% from previous year)
Despite some recent cooling, Doyle’s home prices have nearly doubled since 2010. The market surged between 2015 and 2022, before experiencing two consecutive years of decline. As of 2025, values are just under $165,000 — still making Doyle one of California’s most affordable housing markets.
Doyle – Gateway to the Eastern Sierra
Located in southern Lassen County, Doyle is a small town situated along U.S. Route 395, just north of Reno. This rural area appeals to those who want open land, mountain views, and low real estate prices. Its proximity to Nevada has drawn some cross-border interest in recent years.
While Doyle saw a significant housing boom during the pandemic, prices have tapered off slightly since. The town remains a practical option for buyers seeking acreage or a quiet retreat within striking distance of Northern Nevada and the Sierra Nevada range.
11. Tulelake – 102% Home Price Increase Since 2010
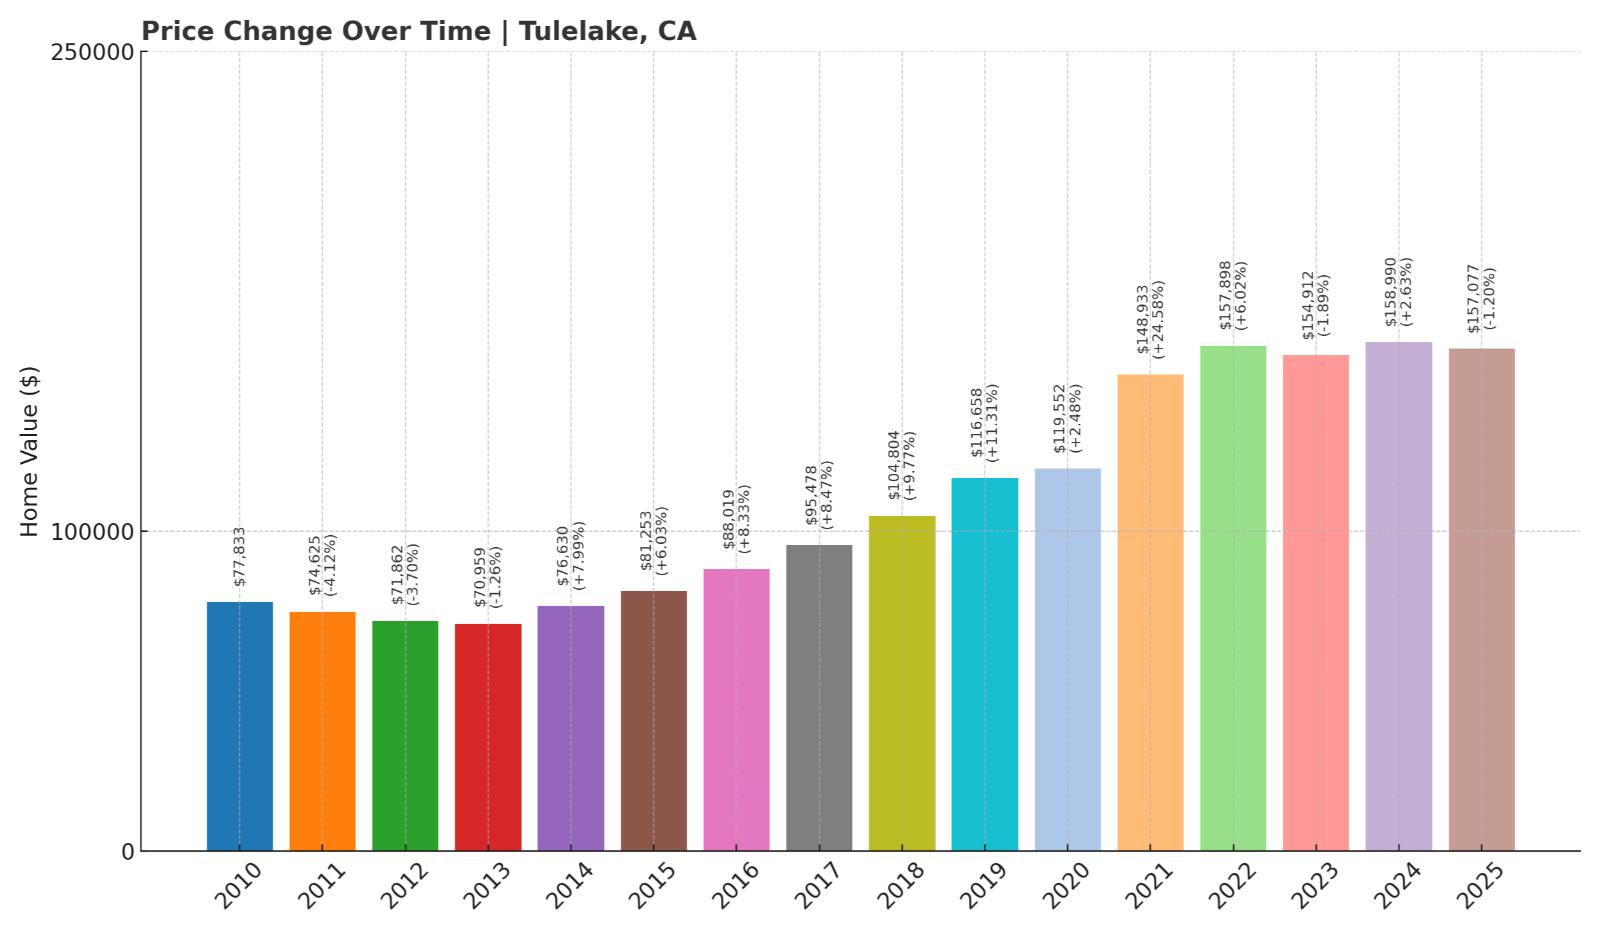
- 2010: $77,833
- 2011: $74,625 (-$3,208, -4.12% from previous year)
- 2012: $71,862 (-$2,763, -3.70% from previous year)
- 2013: $70,959 (-$903, -1.26% from previous year)
- 2014: $76,630 (+$5,670, +7.99% from previous year)
- 2015: $81,253 (+$4,623, +6.03% from previous year)
- 2016: $88,019 (+$6,766, +8.33% from previous year)
- 2017: $95,478 (+$7,459, +8.47% from previous year)
- 2018: $104,804 (+$9,326, +9.77% from previous year)
- 2019: $116,658 (+$11,854, +11.31% from previous year)
- 2020: $119,552 (+$2,894, +2.48% from previous year)
- 2021: $148,933 (+$29,381, +24.58% from previous year)
- 2022: $157,898 (+$8,965, +6.02% from previous year)
- 2023: $154,912 (-$2,987, -1.89% from previous year)
- 2024: $158,990 (+$4,079, +2.63% from previous year)
- 2025: $157,077 (-$1,913, -1.20% from previous year)
Tulelake’s housing prices have more than doubled since 2010, climbing from $77,833 to just over $157,000 by 2025. Though the past few years have seen some ups and downs, overall growth has been steady, especially during the 2020–2022 period.
Tulelake – Quiet Border Town with Agricultural Roots
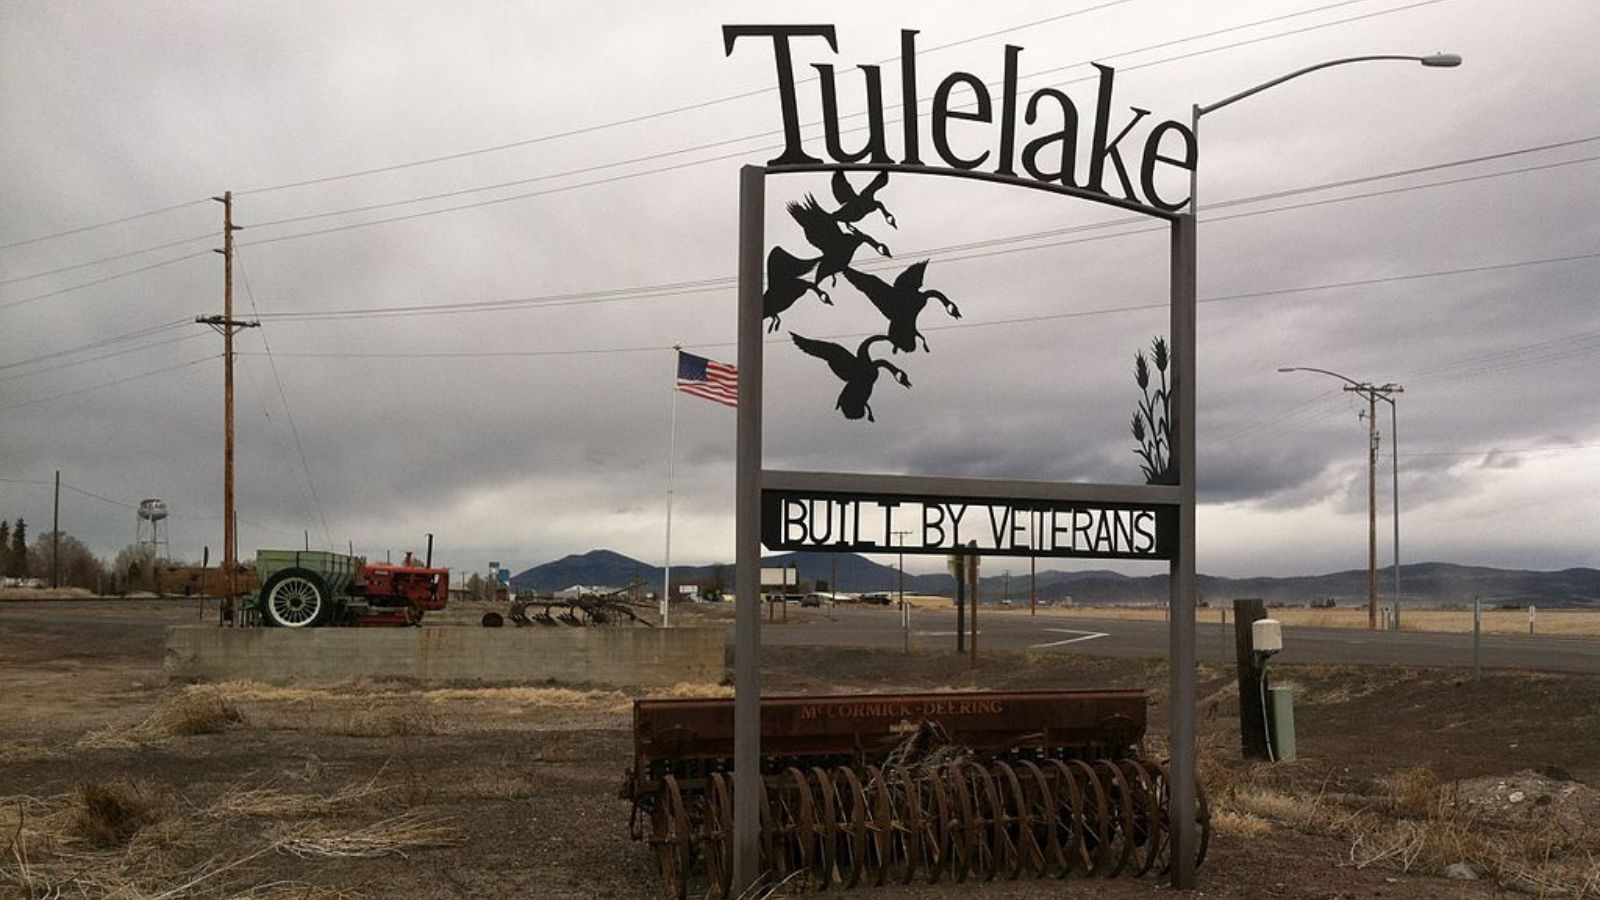
Tulelake is located near the Oregon border in Siskiyou County. It’s a small agricultural town surrounded by farmland and volcanic landscapes. Nearby Lava Beds National Monument adds recreational appeal for hikers and history enthusiasts.
Despite its remote location, Tulelake saw strong housing growth during the early 2020s. With farming as its economic base and limited residential development, the town’s market has remained modest, affordable, and relatively stable in recent years.
10. Happy Camp – 105% Home Price Increase Since 2010
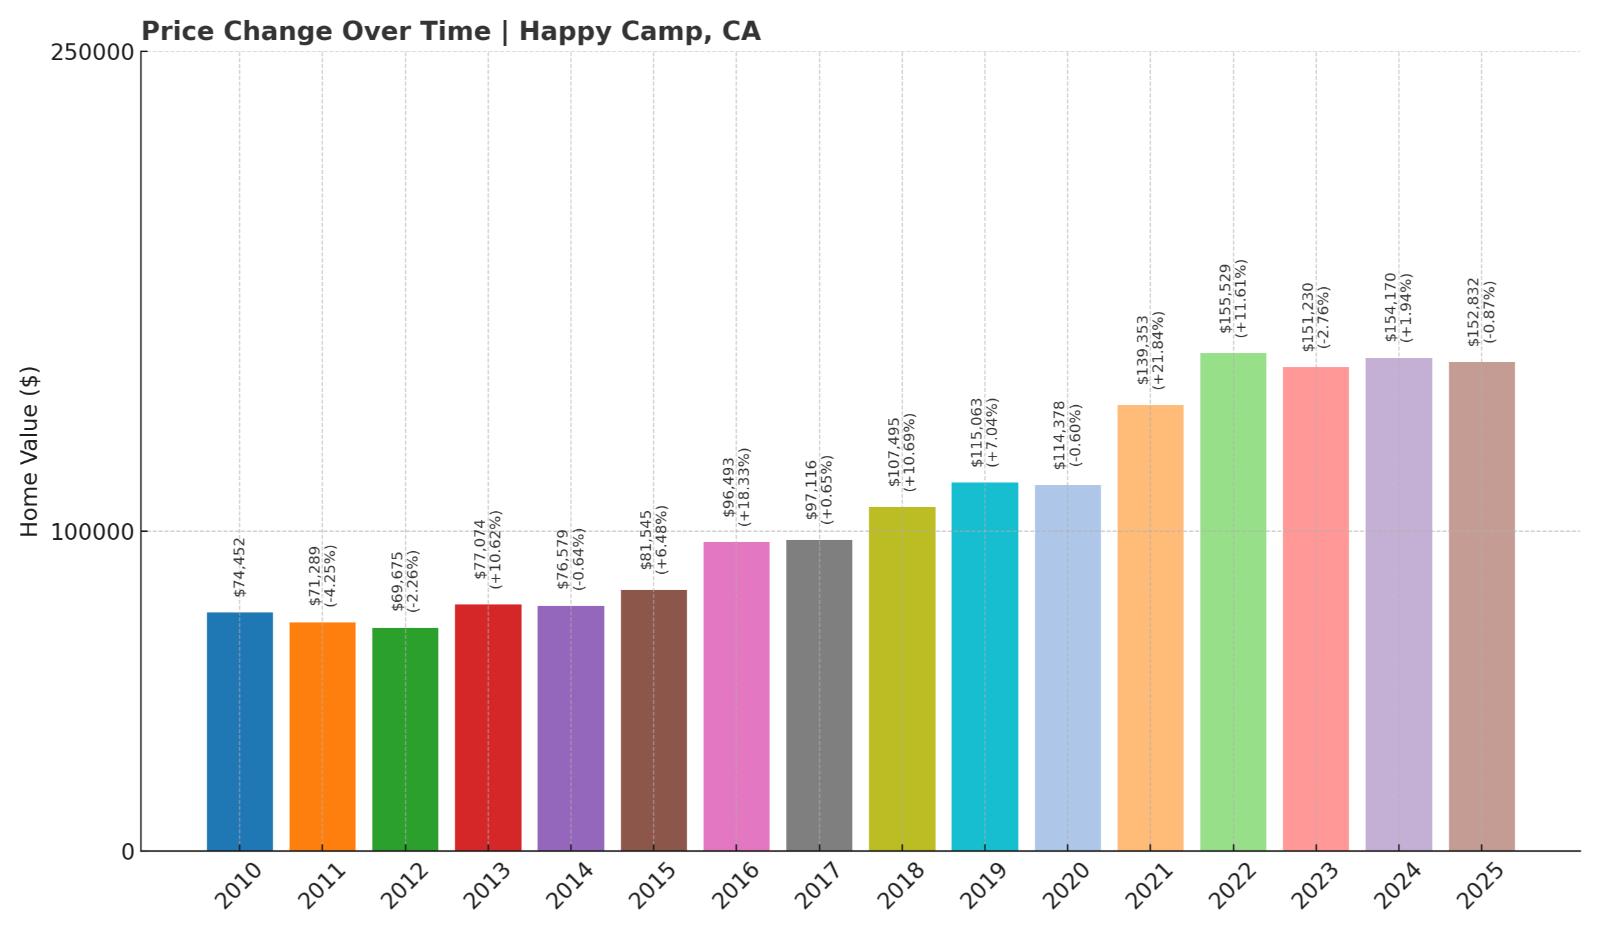
- 2010: $74,452
- 2011: $71,289 (-$3,163, -4.25% from previous year)
- 2012: $69,675 (-$1,614, -2.26% from previous year)
- 2013: $77,074 (+$7,399, +10.62% from previous year)
- 2014: $76,579 (-$495, -0.64% from previous year)
- 2015: $81,545 (+$4,966, +6.48% from previous year)
- 2016: $96,493 (+$14,947, +18.33% from previous year)
- 2017: $97,116 (+$623, +0.65% from previous year)
- 2018: $107,495 (+$10,379, +10.69% from previous year)
- 2019: $115,063 (+$7,568, +7.04% from previous year)
- 2020: $114,378 (-$685, -0.60% from previous year)
- 2021: $139,353 (+$24,975, +21.84% from previous year)
- 2022: $155,529 (+$16,177, +11.61% from previous year)
- 2023: $151,230 (-$4,299, -2.76% from previous year)
- 2024: $154,170 (+$2,940, +1.94% from previous year)
- 2025: $152,832 (-$1,338, -0.87% from previous year)
Happy Camp’s home prices have increased 105% since 2010, with major growth occurring between 2015 and 2022. More recent fluctuations have slightly reduced values, but the town still remains a highly affordable option in California real estate.
Happy Camp – Forest Living in Siskiyou County
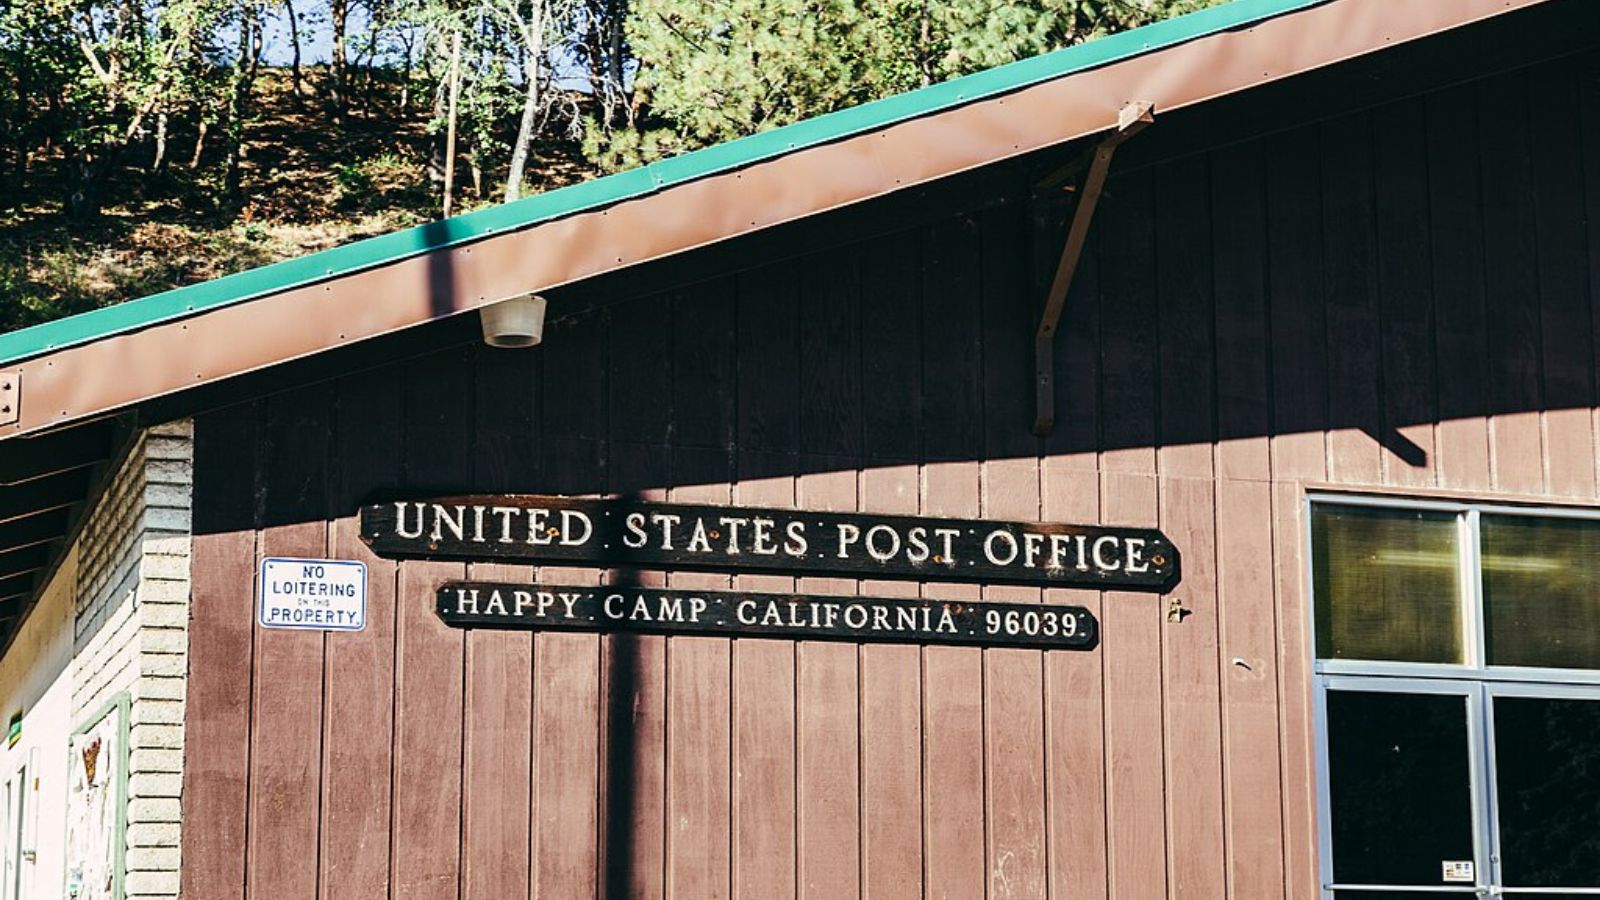
Happy Camp is a remote forest town in Siskiyou County, nestled in the Klamath Mountains near the Klamath River. It’s known for outdoor recreation, particularly fishing, rafting, and hiking. With a population of under 1,000, it’s a tight-knit and quiet community.
Homebuyers were drawn to its seclusion and natural beauty during the pandemic, helping fuel a rise in home values. Though prices have cooled slightly since 2022, Happy Camp remains one of the least expensive towns in California — ideal for buyers seeking peace, nature, and low costs.
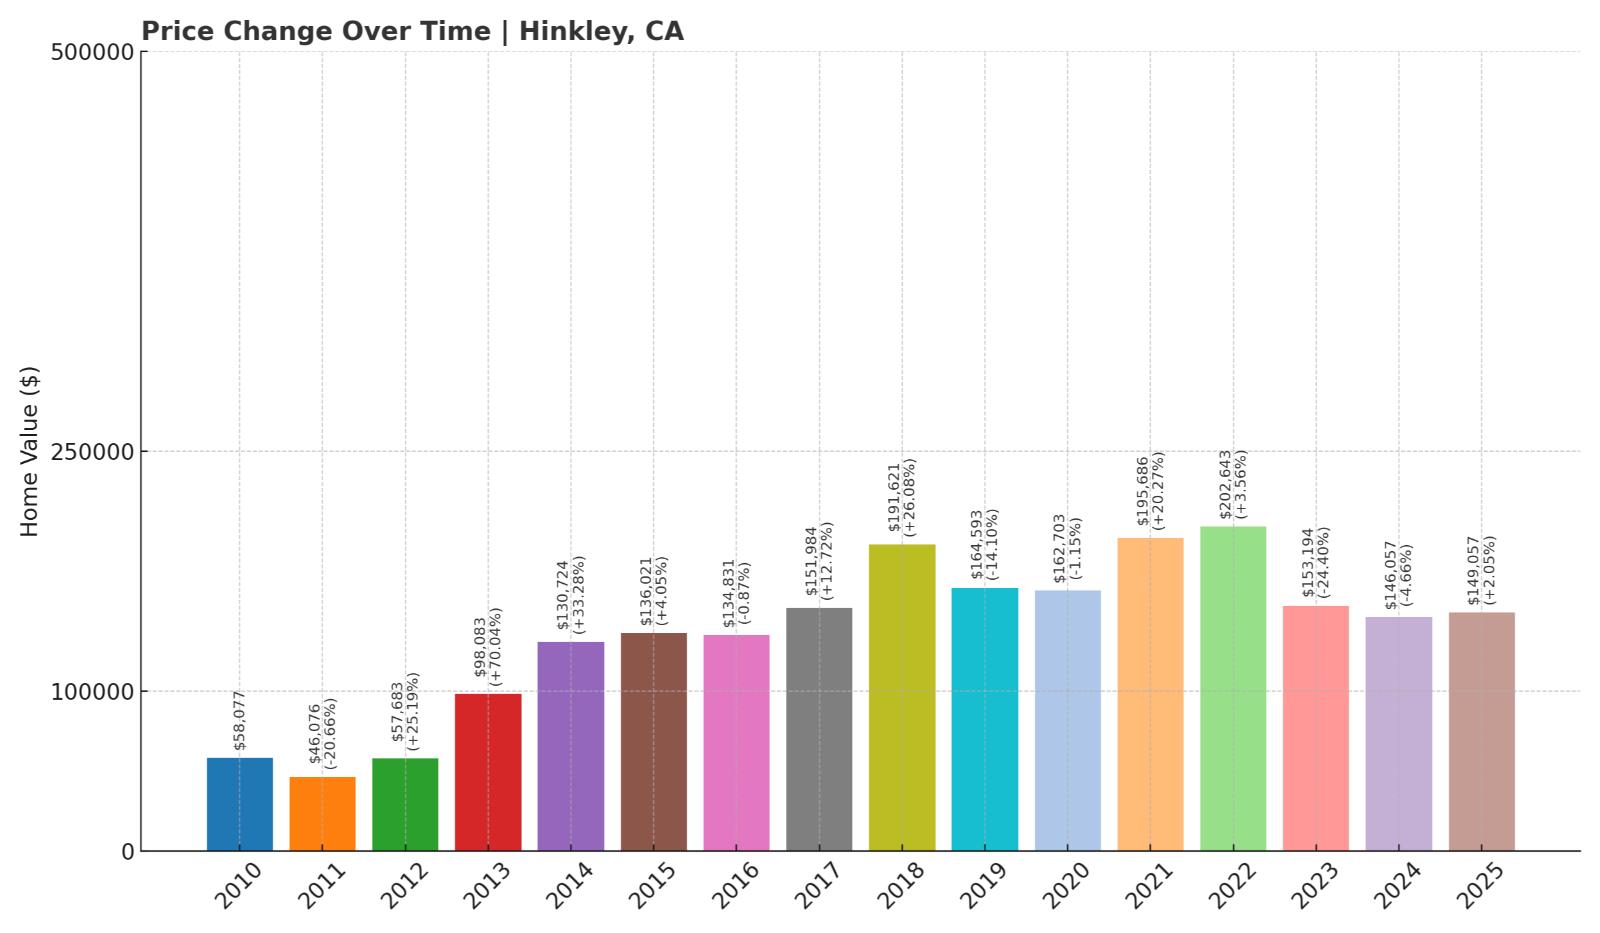
9. Hinkley – 157% Home Price Increase Since 2010
Would you like to save this?
- 2010: $58,077
- 2011: $46,076 (-$12,001, -20.66% from previous year)
- 2012: $57,683 (+$11,608, +25.19% from previous year)
- 2013: $98,083 (+$40,400, +70.04% from previous year)
- 2014: $130,724 (+$32,641, +33.28% from previous year)
- 2015: $136,021 (+$5,297, +4.05% from previous year)
- 2016: $134,831 (-$1,190, -0.88% from previous year)
- 2017: $151,984 (+$17,153, +12.72% from previous year)
- 2018: $191,621 (+$39,637, +26.08% from previous year)
- 2019: $164,593 (-$27,028, -14.11% from previous year)
- 2020: $162,703 (-$1,890, -1.15% from previous year)
- 2021: $195,686 (+$32,983, +20.27% from previous year)
- 2022: $202,643 (+$6,956, +3.55% from previous year)
- 2023: $153,194 (-$49,449, -24.40% from previous year)
- 2024: $146,057 (-$7,137, -4.66% from previous year)
- 2025: $149,057 (+$3,000, +2.05% from previous year)
Hinkley’s home values rose dramatically between 2012 and 2022, hitting a peak above $200,000. However, sharp corrections since 2023 have brought prices down to $149,057 in 2025 — still more than double where they stood in 2010.
Hinkley – High Desert Affordability with a Complicated Past
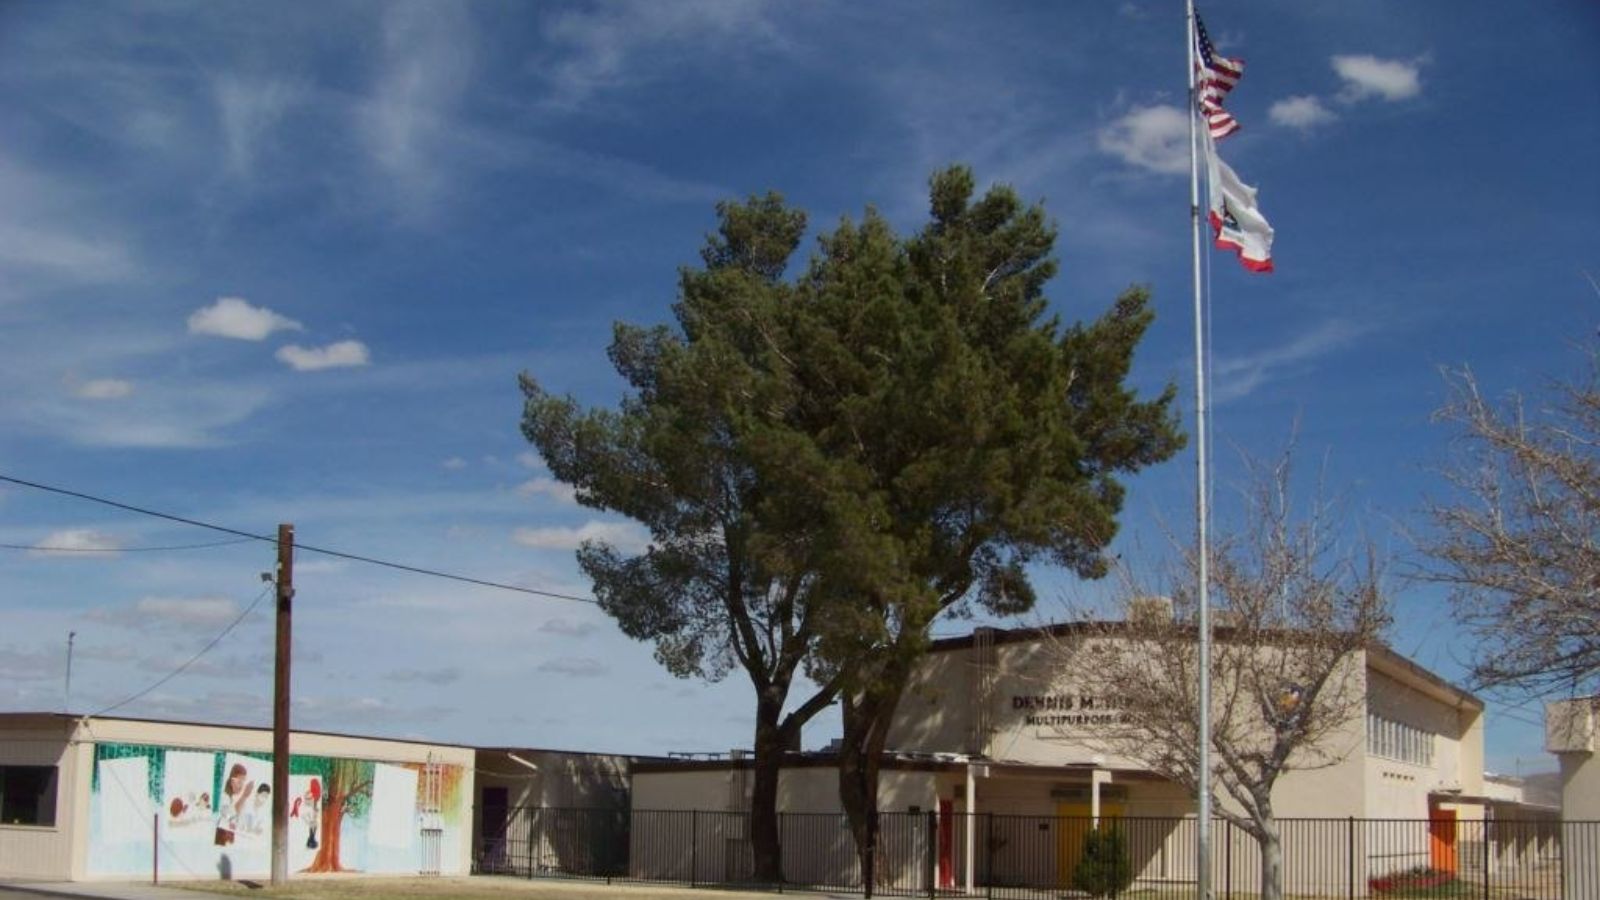
Located in San Bernardino County’s Mojave Desert, Hinkley gained national attention in the 1990s due to groundwater contamination, a story made famous by the movie Erin Brockovich. Despite its troubled past, the town saw significant housing growth in the last decade as demand spread to cheaper rural areas.
Today, Hinkley remains sparsely populated and economically limited, but its low home prices appeal to buyers looking for inexpensive desert property. Price volatility in recent years may reflect investor caution and limited infrastructure, yet the long-term trend is still one of growth.
8. Stirling City – 289% Home Price Increase Since 2010
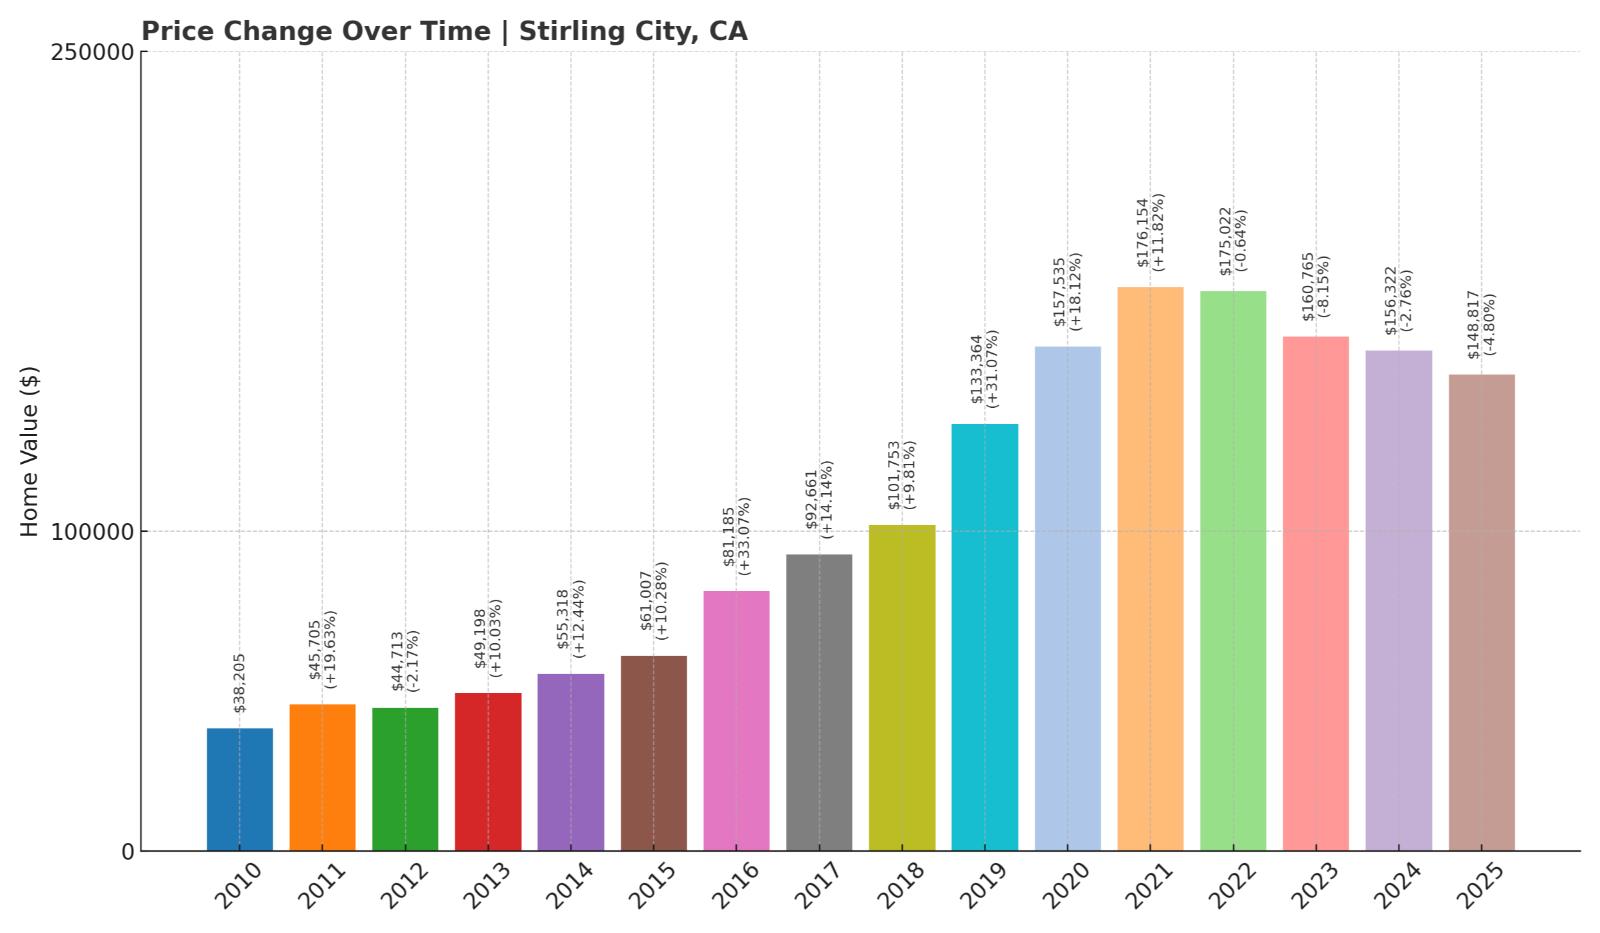
- 2010: $38,205
- 2011: $45,705 (+$7,500, +19.63% from previous year)
- 2012: $44,713 (-$993, -2.17% from previous year)
- 2013: $49,198 (+$4,485, +10.03% from previous year)
- 2014: $55,318 (+$6,121, +12.44% from previous year)
- 2015: $61,007 (+$5,688, +10.28% from previous year)
- 2016: $81,185 (+$20,178, +33.08% from previous year)
- 2017: $92,661 (+$11,476, +14.14% from previous year)
- 2018: $101,753 (+$9,093, +9.81% from previous year)
- 2019: $133,364 (+$31,611, +31.07% from previous year)
- 2020: $157,535 (+$24,171, +18.12% from previous year)
- 2021: $176,154 (+$18,619, +11.82% from previous year)
- 2022: $175,022 (-$1,132, -0.64% from previous year)
- 2023: $160,765 (-$14,257, -8.15% from previous year)
- 2024: $156,322 (-$4,443, -2.76% from previous year)
- 2025: $148,817 (-$7,506, -4.80% from previous year)
Stirling City’s home prices have surged since 2010, jumping nearly 290%. Although prices peaked in 2021 and have since declined somewhat, the 2025 median still sits at $148,817 — far above its sub-$40,000 levels of the early 2010s.
Stirling City – Logging Town with Elevated Views
Perched in the Sierra Nevada foothills of Butte County, Stirling City was originally built as a logging camp in the early 20th century. Its elevated location offers cooler weather and forested surroundings, drawing interest from those seeking rustic charm at an affordable price.
The town experienced intense price appreciation between 2015 and 2021, likely tied to increased remote work and rural migration trends. Though prices have fallen in recent years, they remain significantly higher than a decade ago — a reflection of lingering demand and limited housing supply.
7. Dorris – 141% Home Price Increase Since 2010
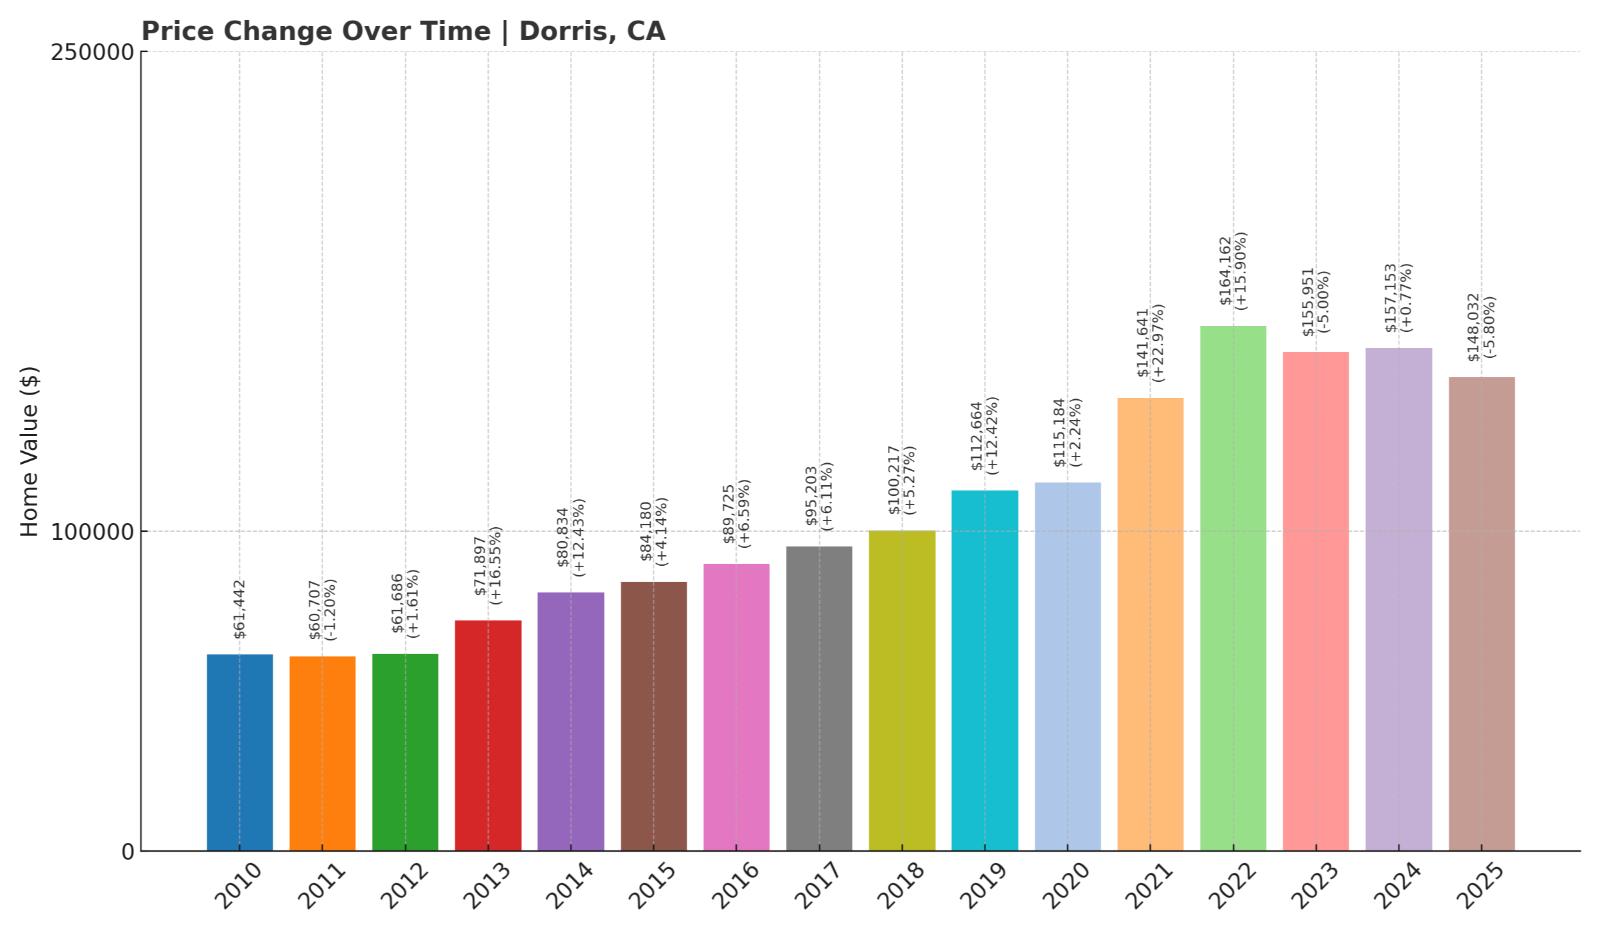
- 2010: $61,442
- 2011: $60,707 (-$734, -1.20% from previous year)
- 2012: $61,686 (+$979, +1.61% from previous year)
- 2013: $71,897 (+$10,210, +16.55% from previous year)
- 2014: $80,834 (+$8,937, +12.43% from previous year)
- 2015: $84,180 (+$3,346, +4.14% from previous year)
- 2016: $89,725 (+$5,546, +6.59% from previous year)
- 2017: $95,203 (+$5,478, +6.11% from previous year)
- 2018: $100,217 (+$5,013, +5.27% from previous year)
- 2019: $112,664 (+$12,447, +12.42% from previous year)
- 2020: $115,184 (+$2,521, +2.24% from previous year)
- 2021: $141,641 (+$26,457, +22.97% from previous year)
- 2022: $164,162 (+$22,522, +15.90% from previous year)
- 2023: $155,951 (-$8,211, -5.00% from previous year)
- 2024: $157,153 (+$1,202, +0.77% from previous year)
- 2025: $148,032 (-$9,122, -5.80% from previous year)
Home values in Dorris have climbed from about $61,000 in 2010 to over $148,000 in 2025 — a 141% increase. Growth peaked in 2022, but recent years have seen a pullback in prices, suggesting the market is stabilizing.
Dorris – Affordable Living Near the Oregon Border
Dorris sits in northern Siskiyou County, just minutes from the Oregon border. It’s a tiny community with views of Mount Shasta, offering affordability and natural beauty in equal measure. Known for having one of the tallest flagpoles west of the Mississippi, the town has a laid-back, small-town atmosphere.
While Dorris has seen price fluctuations in the past few years, its long-term growth remains strong. The town remains a draw for those seeking a quieter lifestyle in Northern California’s high country, with real estate prices that still rank among the lowest in the state.
6. Daggett – 230% Home Price Increase Since 2012

- 2010: $43,088
- 2011: $33,670 (-$9,418, -21.86% from previous year)
- 2012: $31,059 (-$2,611, -7.76% from previous year)
- 2013: $37,811 (+$6,752, +21.74% from previous year)
- 2014: $47,291 (+$9,480, +25.07% from previous year)
- 2015: $54,434 (+$7,142, +15.10% from previous year)
- 2016: $56,763 (+$2,330, +4.28% from previous year)
- 2017: $65,819 (+$9,056, +15.95% from previous year)
- 2018: $91,843 (+$26,025, +39.54% from previous year)
- 2019: $98,082 (+$6,239, +6.79% from previous year)
- 2020: $108,562 (+$10,480, +10.68% from previous year)
- 2021: $166,061 (+$57,500, +52.97% from previous year)
- 2022: $195,267 (+$29,206, +17.59% from previous year)
- 2023: $152,772 (-$42,494, -21.76% from previous year)
- 2024: $145,763 (-$7,009, -4.59% from previous year)
- 2025: $142,404 (-$3,360, -2.30% from previous year)
Daggett’s housing market took off between 2012 and 2022, with prices rising more than 230%. But since peaking, values have dipped for three straight years, bringing the 2025 median to $142,404 — still well above earlier levels.
Daggett – Desert Real Estate with Historical Roots
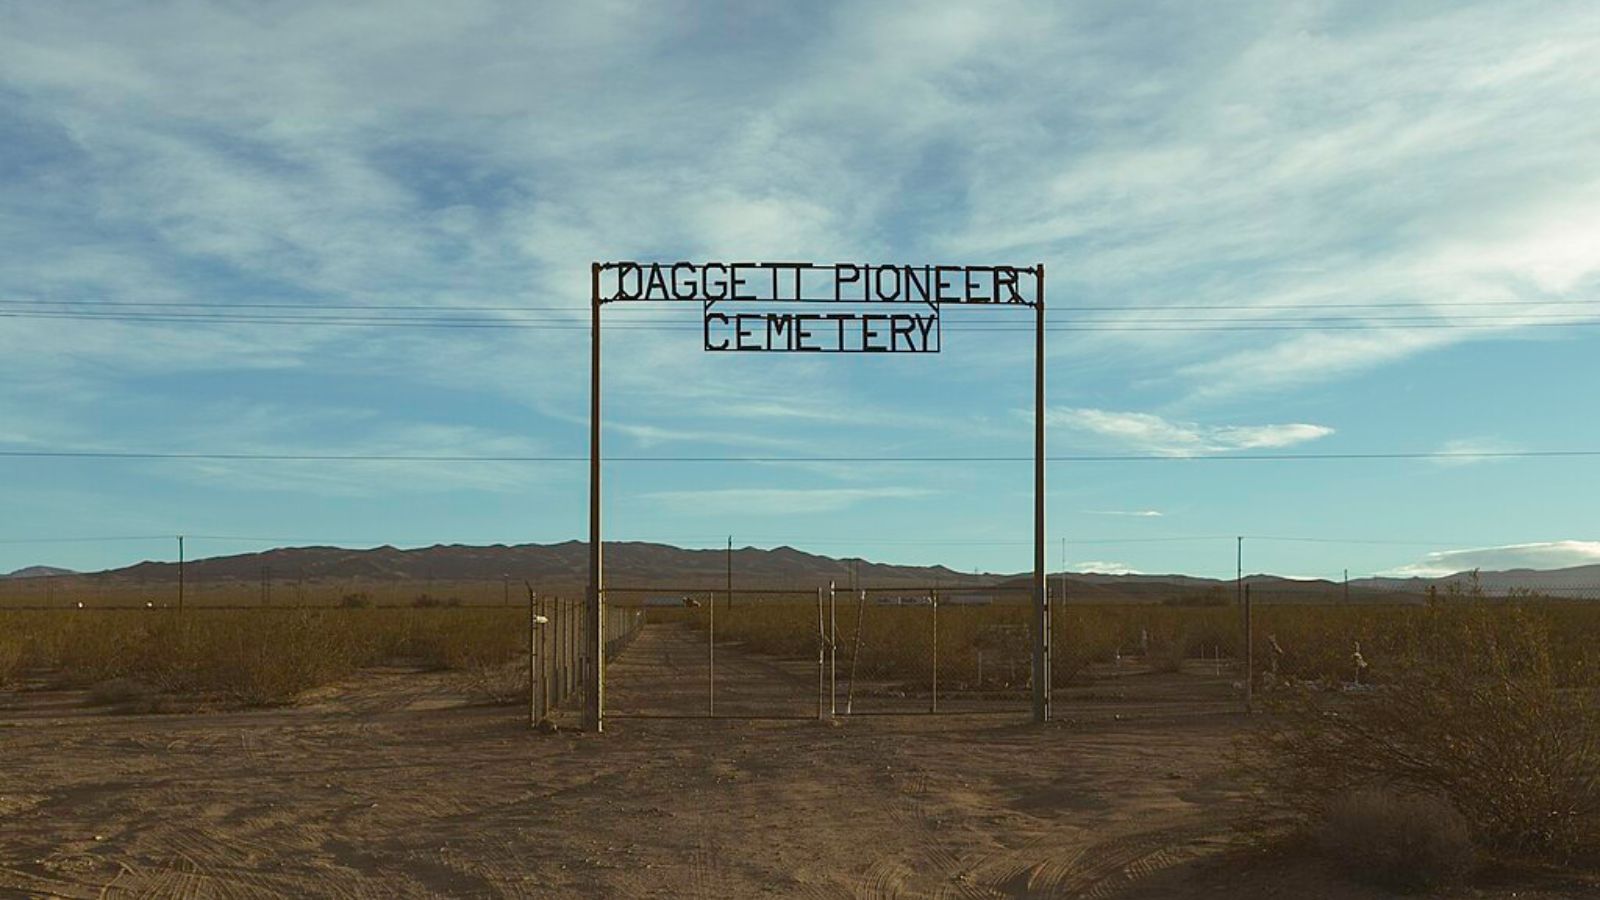
Located along Interstate 40 in San Bernardino County, Daggett is a small, dry desert town near Barstow. Once a bustling railroad stop, it’s now a quiet and sparsely populated place where homes are inexpensive and land is plentiful.
The town’s affordability and proximity to Barstow and Fort Irwin have helped drive up prices in recent years. While values have pulled back from their 2022 highs, Daggett remains one of California’s cheapest housing markets — and still appeals to off-grid and low-cost buyers.
5. Yermo – 180% Home Price Increase Since 2012
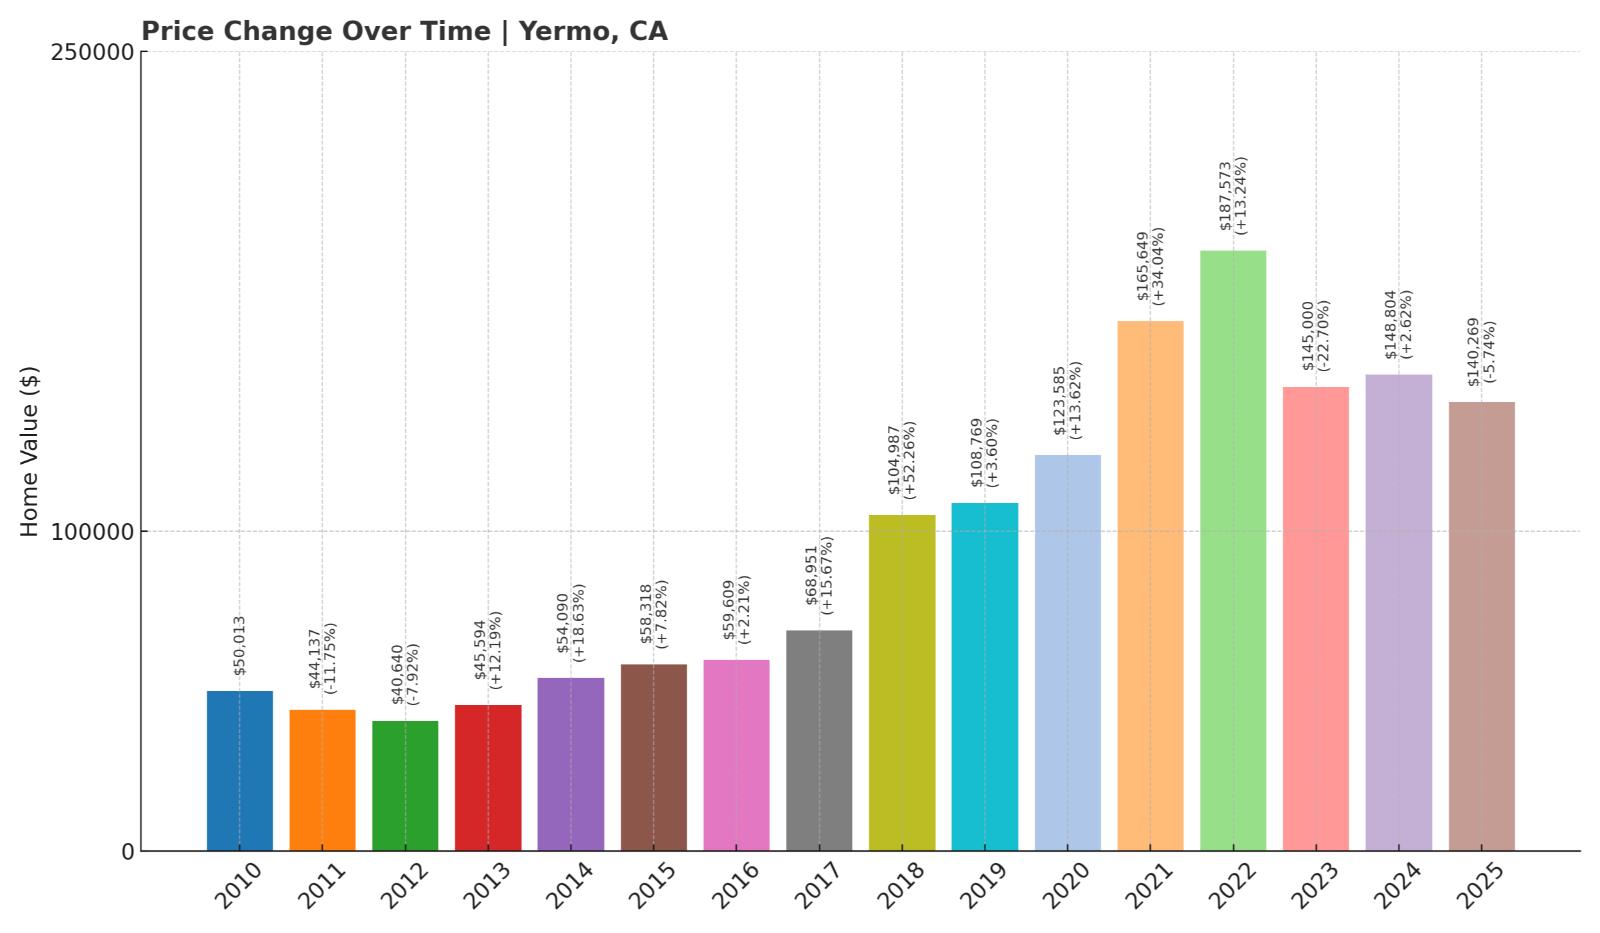
- 2010: $50,013
- 2011: $44,137 (-$5,876, -11.75% from previous year)
- 2012: $40,640 (-$3,497, -7.92% from previous year)
- 2013: $45,594 (+$4,954, +12.19% from previous year)
- 2014: $54,090 (+$8,495, +18.63% from previous year)
- 2015: $58,318 (+$4,228, +7.82% from previous year)
- 2016: $59,609 (+$1,291, +2.21% from previous year)
- 2017: $68,951 (+$9,343, +15.67% from previous year)
- 2018: $104,987 (+$36,036, +52.26% from previous year)
- 2019: $108,769 (+$3,782, +3.60% from previous year)
- 2020: $123,585 (+$14,816, +13.62% from previous year)
- 2021: $165,649 (+$42,065, +34.04% from previous year)
- 2022: $187,573 (+$21,924, +13.24% from previous year)
- 2023: $145,000 (-$42,573, -22.70% from previous year)
- 2024: $148,804 (+$3,804, +2.62% from previous year)
- 2025: $140,269 (-$8,536, -5.74% from previous year)
Yermo’s home prices have grown sharply since bottoming out in 2012. Despite a major dip after 2022, the 2025 median of $140,269 still reflects an increase of 180% over 13 years.
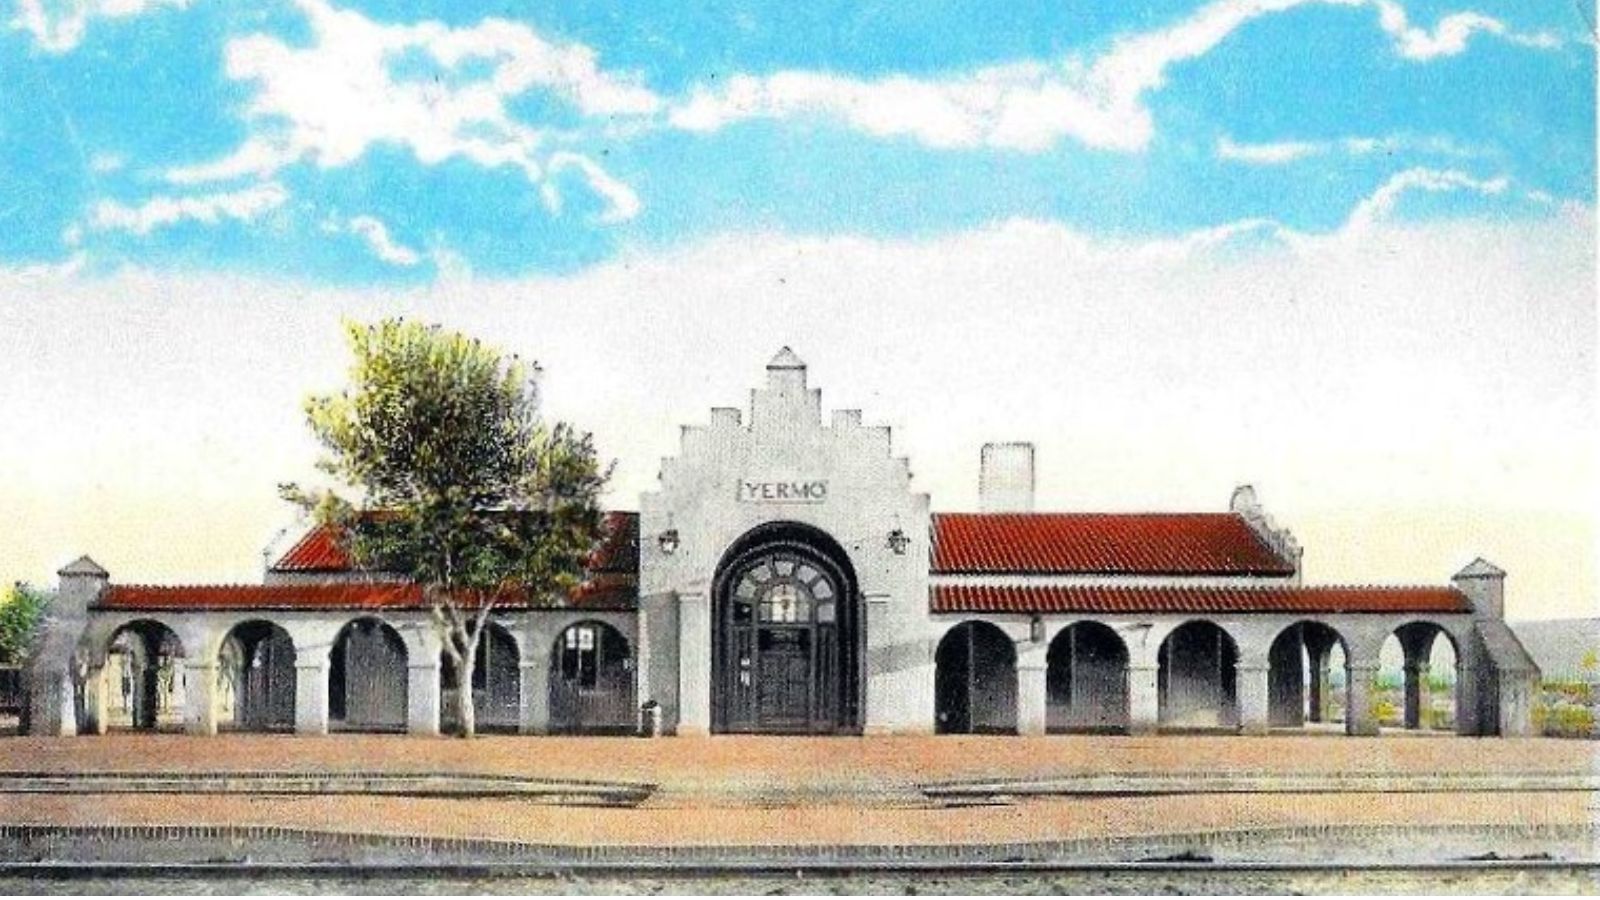
Yermo – Desert Gateway to Calico Ghost Town
Would you like to save this?
Yermo lies in the Mojave Desert northeast of Barstow, known largely as the gateway to Calico Ghost Town and the entrance to the Calico Mountains. The town’s low cost of living and historic character make it attractive to budget-conscious buyers.
Rapid price growth in the early 2020s likely stemmed from surging interest in rural, affordable communities. But values have cooled more recently, reflecting broader shifts in the housing market. Still, Yermo remains one of the most inexpensive towns in California for homebuyers.
4. Macdoel – 76% Home Price Increase Since 2012

- 2010: $75,017
- 2011: $72,310 (-$2,707, -3.61% from previous year)
- 2012: $73,442 (+$1,132, +1.57% from previous year)
- 2013: $78,131 (+$4,689, +6.38% from previous year)
- 2014: $83,220 (+$5,090, +6.51% from previous year)
- 2015: $94,431 (+$11,210, +13.47% from previous year)
- 2016: $105,662 (+$11,231, +11.89% from previous year)
- 2017: $104,239 (-$1,423, -1.35% from previous year)
- 2018: $113,403 (+$9,164, +8.79% from previous year)
- 2019: $124,449 (+$11,046, +9.74% from previous year)
- 2020: $121,274 (-$3,175, -2.55% from previous year)
- 2021: $161,824 (+$40,550, +33.44% from previous year)
- 2022: $175,766 (+$13,942, +8.62% from previous year)
- 2023: $163,087 (-$12,679, -7.21% from previous year)
- 2024: $154,326 (-$8,761, -5.37% from previous year)
- 2025: $132,004 (-$22,322, -14.46% from previous year)
Macdoel’s home prices climbed steadily from 2012 through 2022, increasing by 76% over that period. However, the past three years have seen sharp declines, with values falling nearly $44,000 since 2022 alone. In 2025, the average home price has dropped to $132,004 — making it one of the most affordable places in the state once again.
Macdoel – Rural Retreat with Boom and Bust Trends
Macdoel is a tiny town in Siskiyou County’s Butte Valley, not far from the Oregon border. Surrounded by agricultural fields and flanked by the Cascade Range, it offers quiet living with striking natural views. Despite its remote location and minimal development, Macdoel saw significant price growth during the pandemic housing surge.
That growth appears to have peaked in 2022, followed by a swift correction that pushed values downward. The town’s small population and low housing turnover make it sensitive to even minor market shifts. Still, with 2025 prices hovering just above $130,000, it remains one of California’s most attainable housing markets.
3. Herlong – 120% Home Price Increase Since 2012
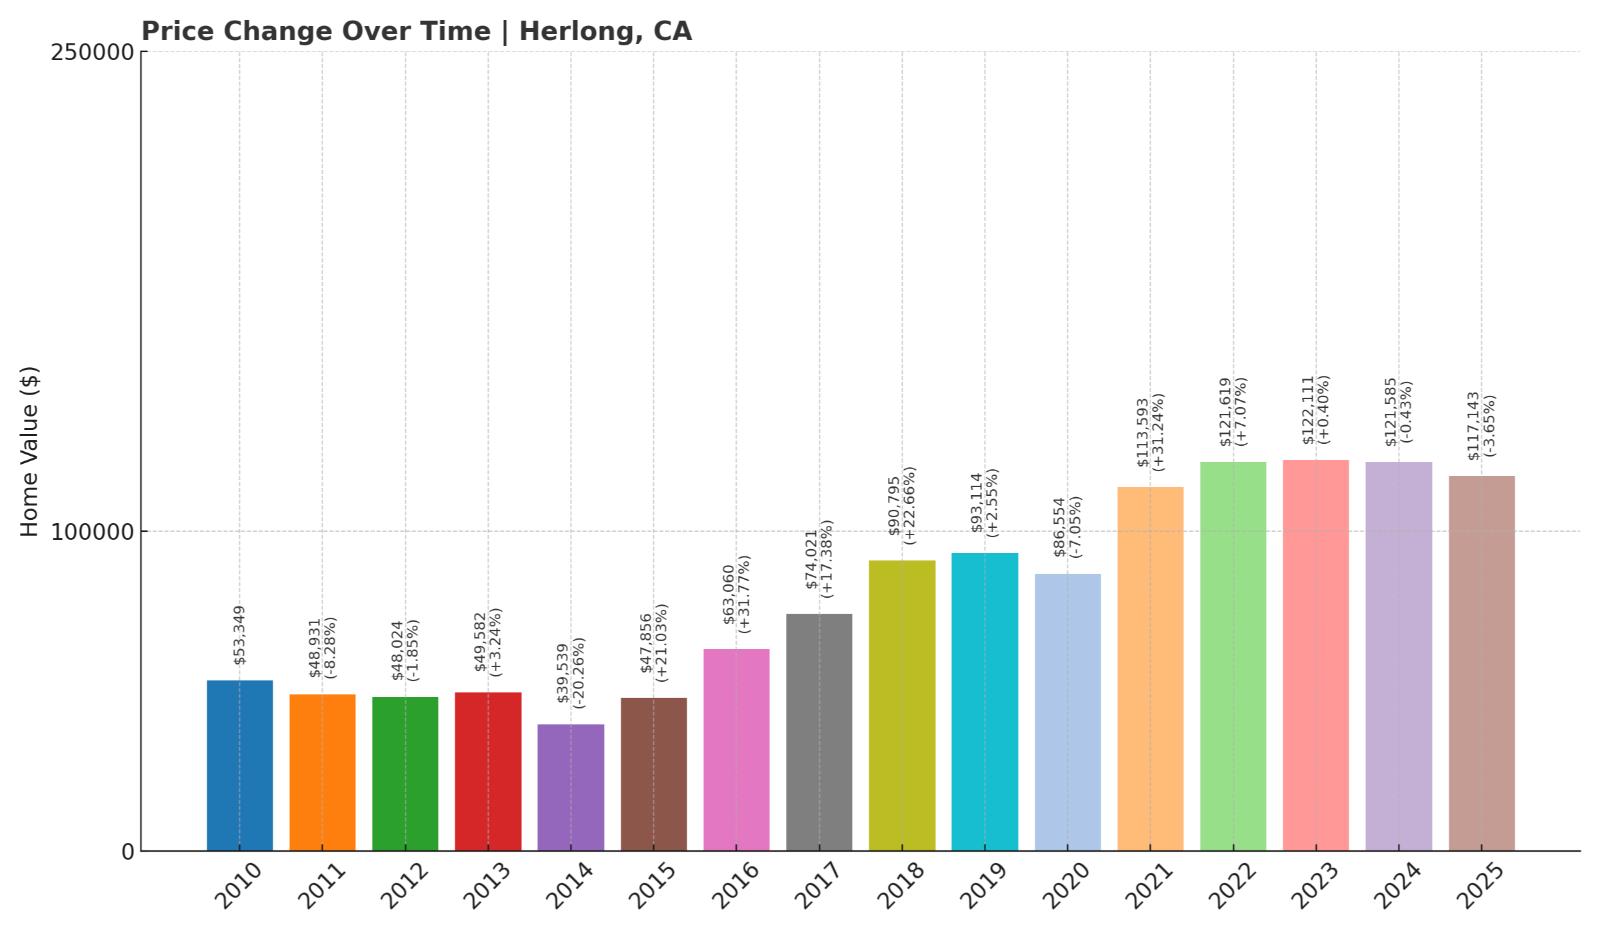
- 2010: $53,349
- 2011: $48,931 (-$4,417, -8.28% from previous year)
- 2012: $48,024 (-$908, -1.86% from previous year)
- 2013: $49,582 (+$1,559, +3.25% from previous year)
- 2014: $39,539 (-$10,043, -20.26% from previous year)
- 2015: $47,856 (+$8,317, +21.04% from previous year)
- 2016: $63,060 (+$15,204, +31.77% from previous year)
- 2017: $74,021 (+$10,961, +17.38% from previous year)
- 2018: $90,795 (+$16,775, +22.66% from previous year)
- 2019: $93,114 (+$2,319, +2.55% from previous year)
- 2020: $86,554 (-$6,560, -7.05% from previous year)
- 2021: $113,593 (+$27,040, +31.24% from previous year)
- 2022: $121,619 (+$8,025, +7.06% from previous year)
- 2023: $122,111 (+$492, +0.40% from previous year)
- 2024: $121,585 (-$526, -0.43% from previous year)
- 2025: $117,143 (-$4,442, -3.65% from previous year)
Herlong’s home prices have more than doubled since 2012, despite recent stagnation. After peaking around 2023, values have gently declined, settling at $117,143 in 2025. The growth in earlier years was fueled by large single-year jumps, particularly in 2016 and 2021.
Herlong – Remote Military History and Affordable Homes
Located in Lassen County, Herlong was originally developed to house workers at the nearby Sierra Army Depot. Though the town has shrunk significantly from its mid-century peak, its legacy as a defense community remains part of its identity.
Today, Herlong offers some of the lowest home prices in California. With vast open land, military surplus buildings, and minimal development, it appeals to those looking for cheap housing and solitude. The recent cooling in prices reflects market normalization after several years of rapid growth.
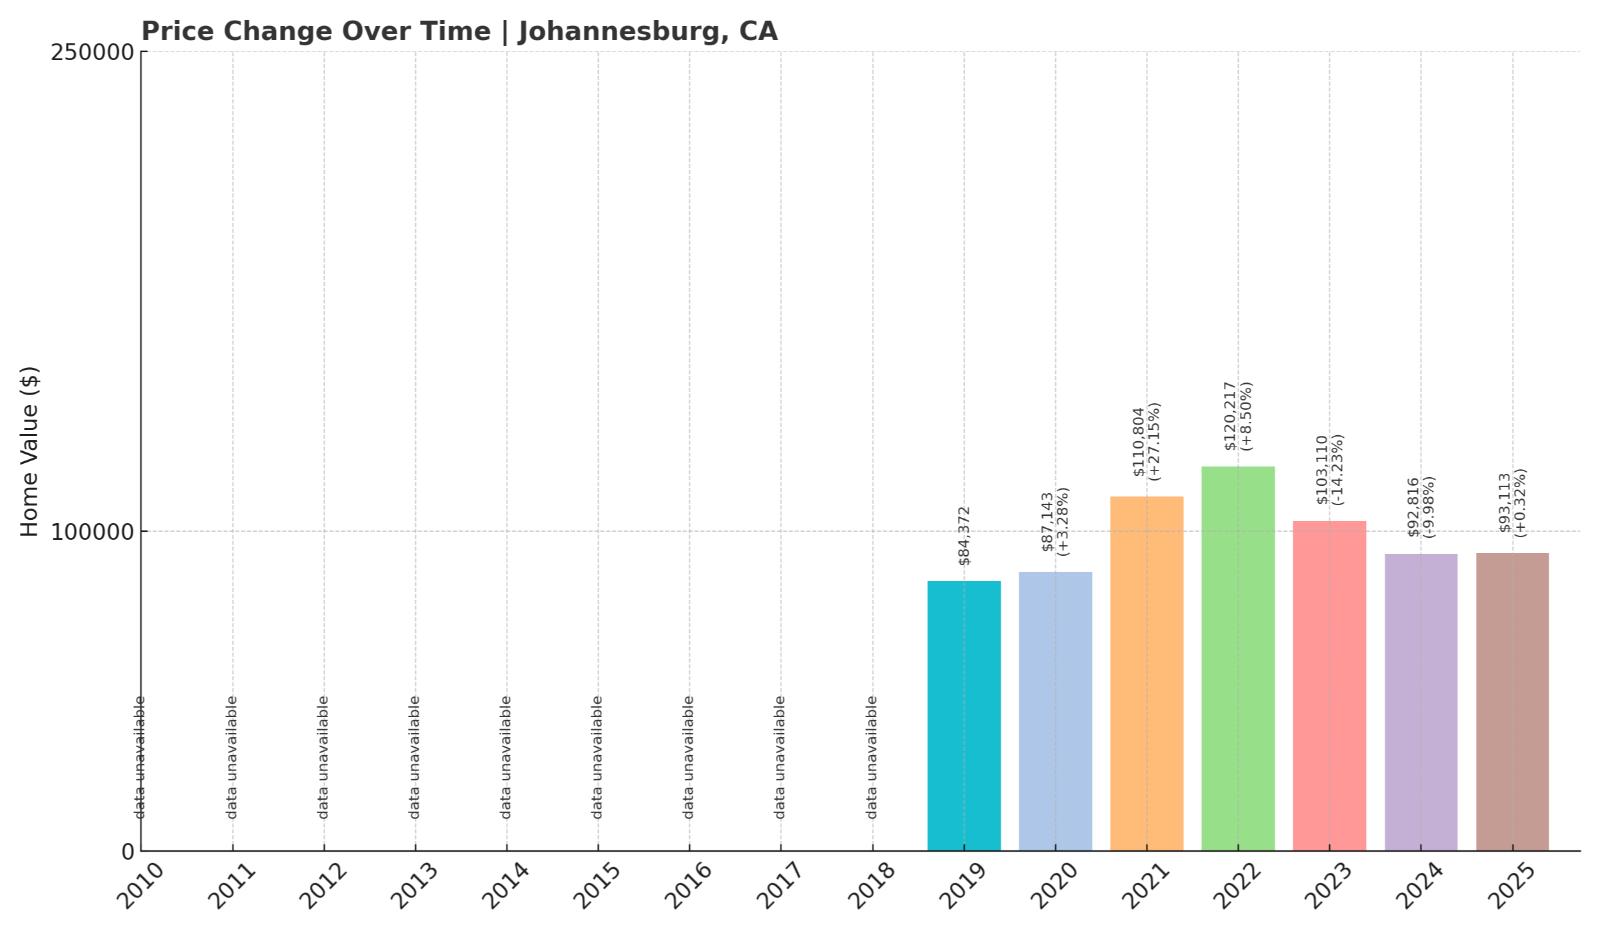
2. Johannesburg – 10% Home Price Increase Since 2019
- 2010: N/A
- 2011: N/A
- 2012: N/A
- 2013: N/A
- 2014: N/A
- 2015: N/A
- 2016: N/A
- 2017: N/A
- 2018: N/A
- 2019: $84,372
- 2020: $87,143 (+$2,770, +3.28% from previous year)
- 2021: $110,804 (+$23,662, +27.15% from previous year)
- 2022: $120,217 (+$9,413, +8.50% from previous year)
- 2023: $103,110 (-$17,108, -14.23% from previous year)
- 2024: $92,816 (-$10,293, -9.98% from previous year)
- 2025: $93,113 (+$297, +0.32% from previous year)
Johannesburg has experienced a turbulent market in recent years. After rapid growth between 2019 and 2022, prices declined for two years in a row before leveling off slightly in 2025. The current value of $93,113 is only 10% above its 2019 level, despite significant volatility in between.
Johannesburg – Historic Mining Hamlet in the High Desert
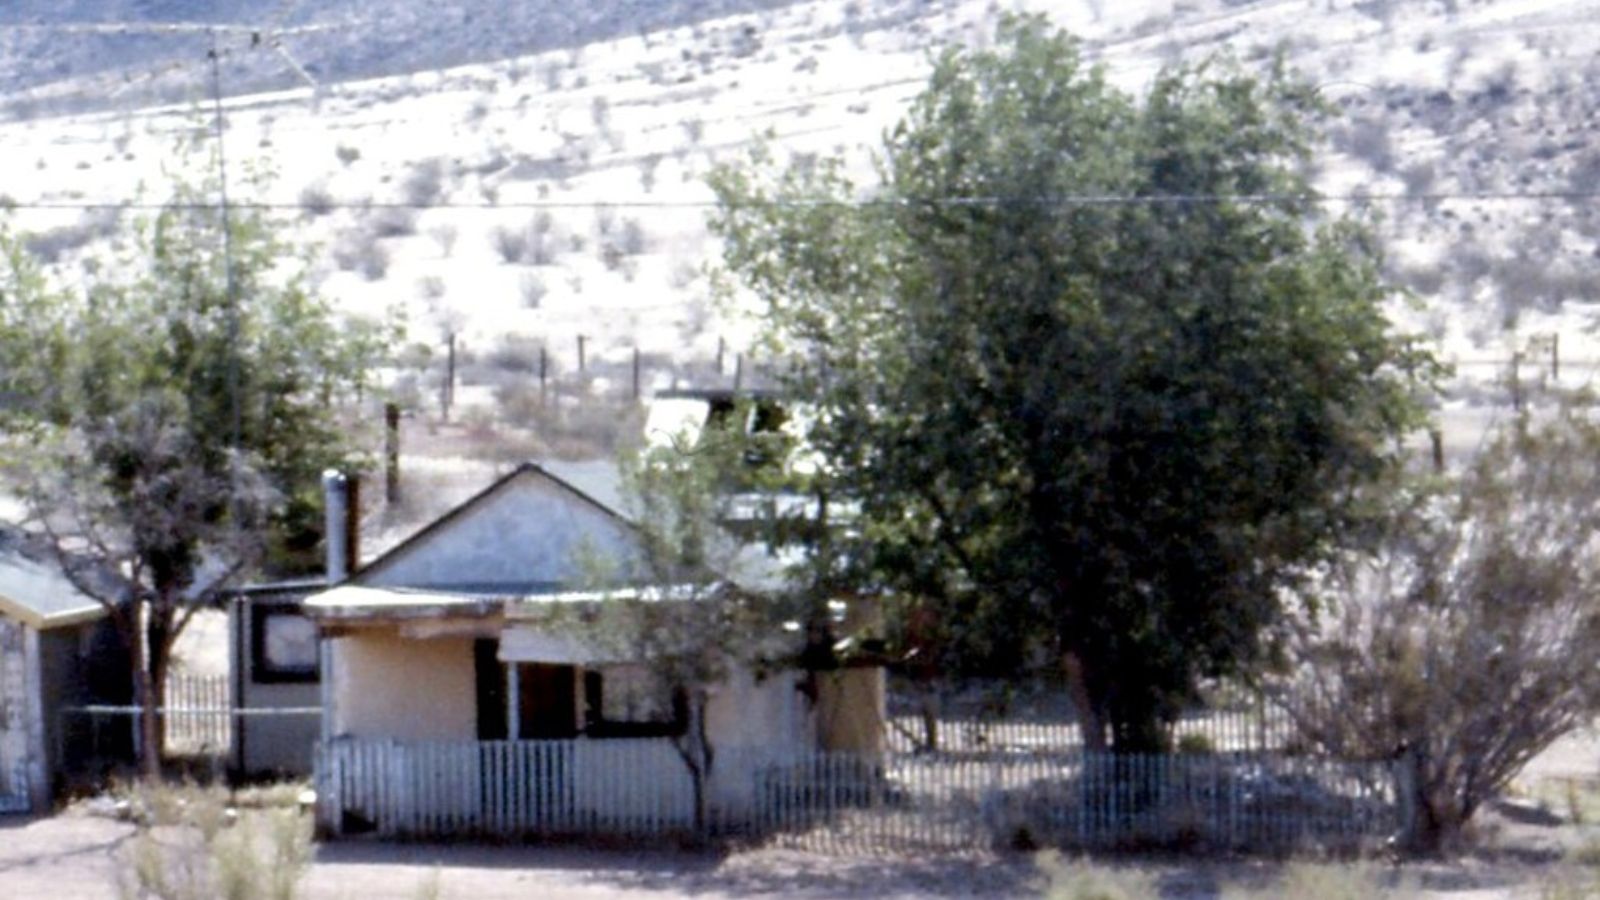
Johannesburg is an old mining town in San Bernardino County, located just off Highway 395 in the Mojave Desert. It was once part of a gold rush-era boom with nearby Randsburg and retains a rustic, frontier feel today. The town is small, dry, and isolated — factors that have kept prices low for years.
While prices surged during the pandemic, likely due to speculative interest, recent declines suggest a return to long-term affordability. With minimal infrastructure and few services, Johannesburg remains one of California’s cheapest places to buy a home, especially for those seeking desert solitude.
1. Trona – 154% Home Price Increase Since 2010
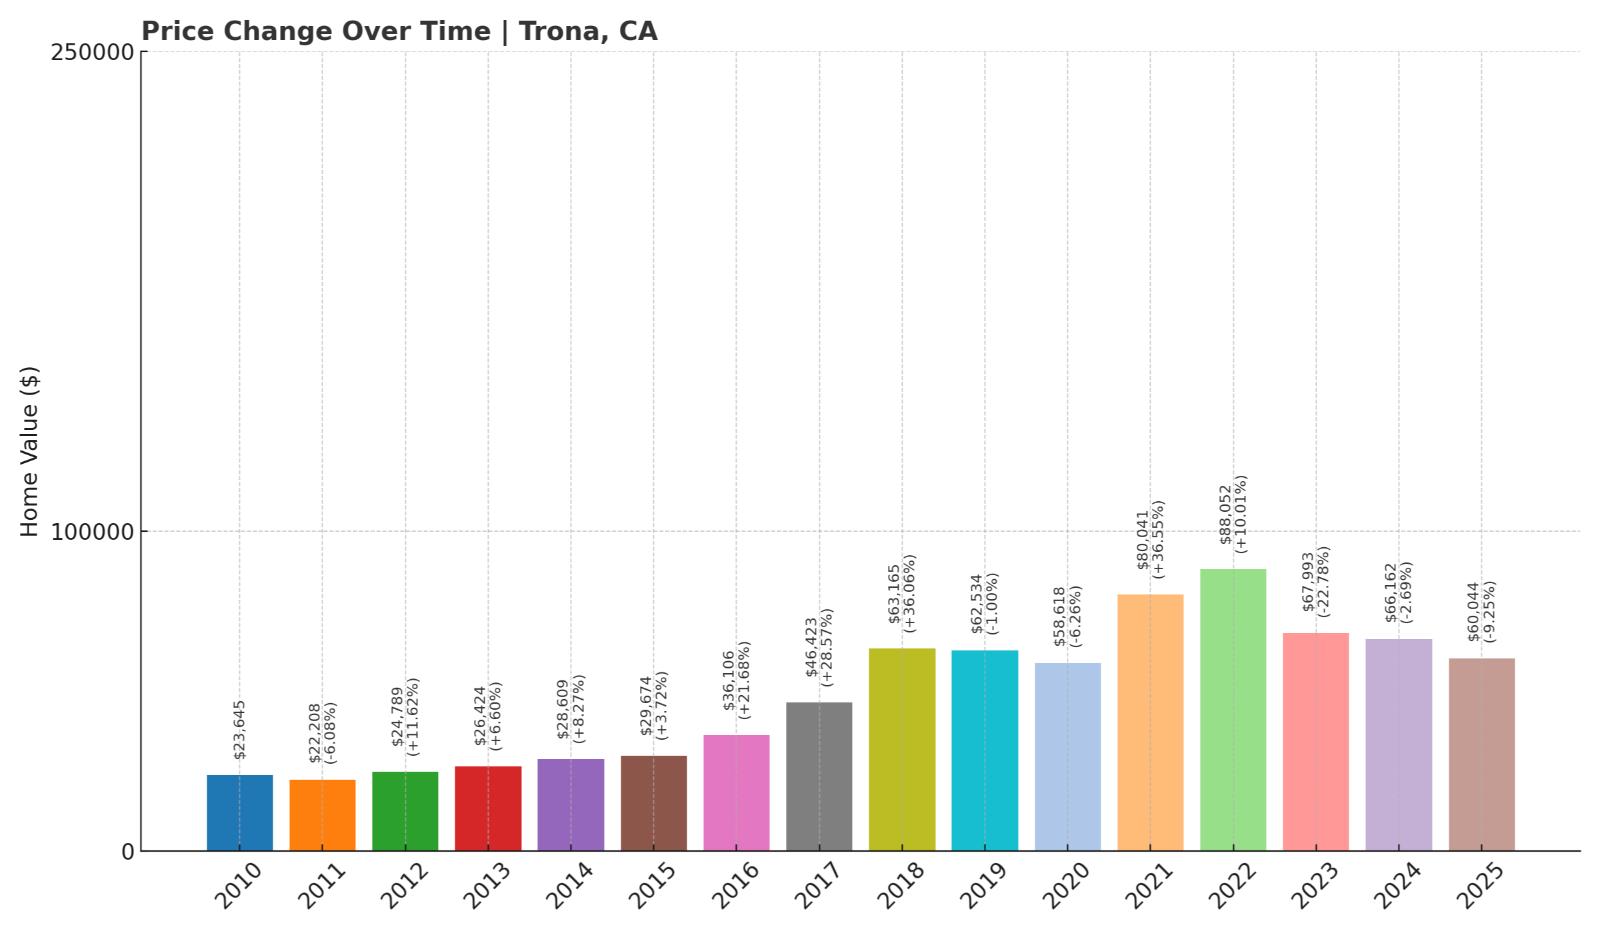
- 2010: $23,645
- 2011: $22,208 (-$1,437, -6.08% from previous year)
- 2012: $24,789 (+$2,581, +11.62% from previous year)
- 2013: $26,424 (+$1,635, +6.59% from previous year)
- 2014: $28,609 (+$2,185, +8.27% from previous year)
- 2015: $29,674 (+$1,065, +3.72% from previous year)
- 2016: $36,106 (+$6,433, +21.68% from previous year)
- 2017: $46,423 (+$10,316, +28.57% from previous year)
- 2018: $63,165 (+$16,743, +36.07% from previous year)
- 2019: $62,534 (-$631, -1.00% from previous year)
- 2020: $58,618 (-$3,917, -6.26% from previous year)
- 2021: $80,041 (+$21,424, +36.55% from previous year)
- 2022: $88,052 (+$8,011, +10.01% from previous year)
- 2023: $67,993 (-$20,059, -22.78% from previous year)
- 2024: $66,162 (-$1,831, -2.69% from previous year)
- 2025: $60,044 (-$6,118, -9.25% from previous year)
Trona has experienced dramatic price swings over the past 15 years. After surging to a peak of over $88,000 in 2022, home prices have dropped sharply, settling at $60,044 in 2025. Even so, that’s still a 154% increase since 2010 — the highest percentage gain on this list.
Trona – California’s Most Affordable Town with a Storied Past
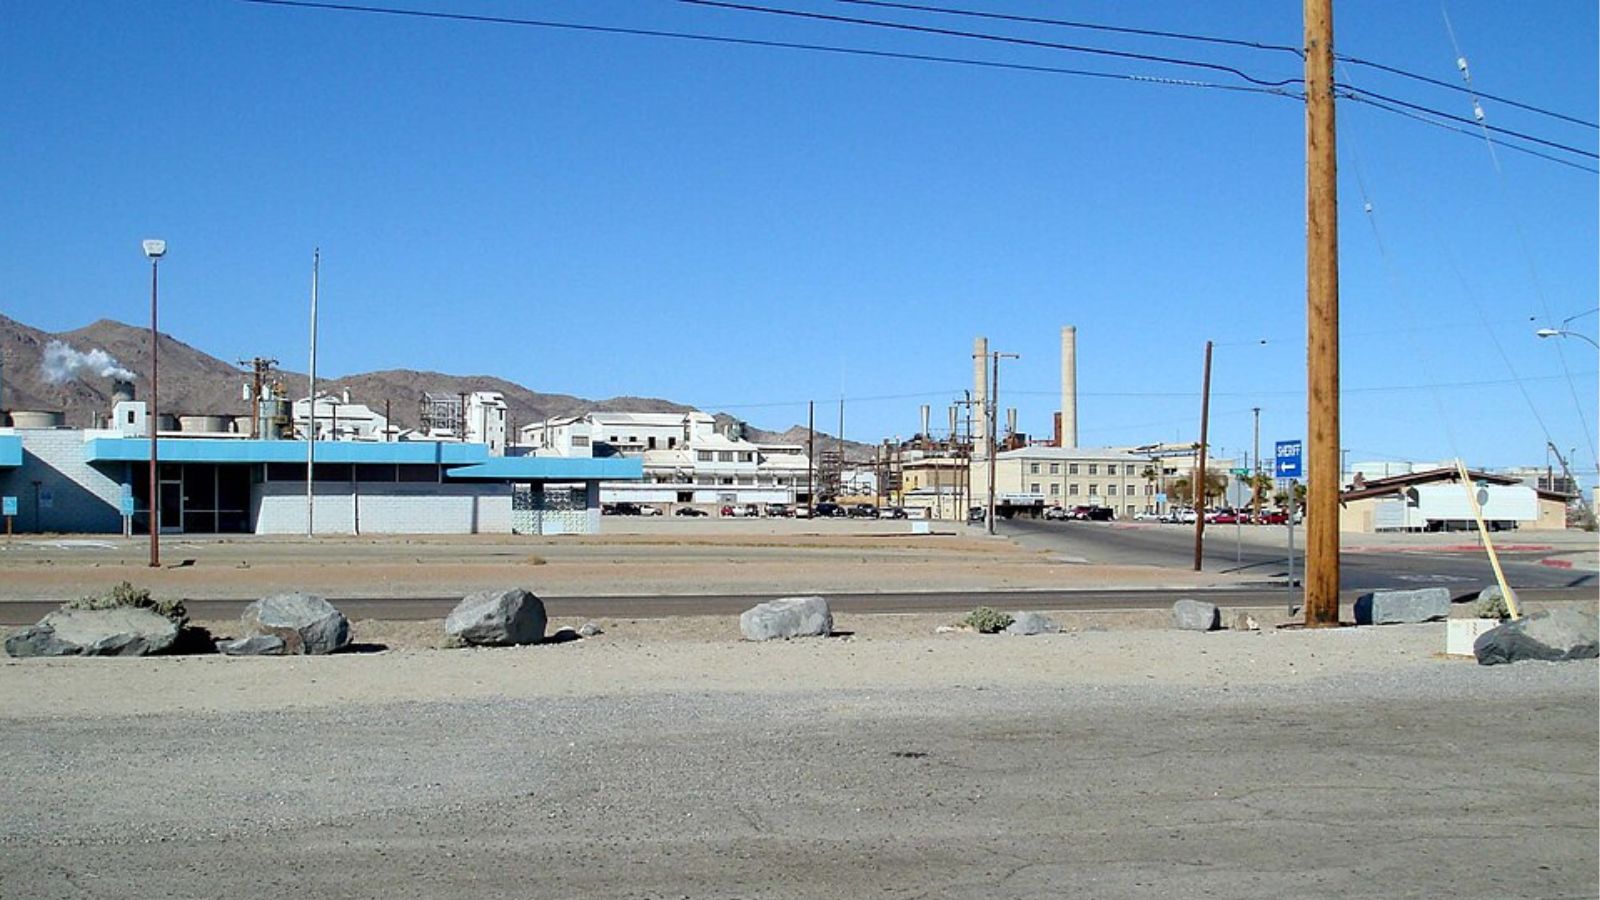
Located near the desolate Searles Lake in the Mojave Desert, Trona is known for its mineral mining history and harsh desert climate. It’s one of the most isolated towns in California, home to fewer than 2,000 residents. Earthquakes and economic challenges have shaped the town’s past, but its real estate remains remarkably cheap.
Despite some volatility, Trona consistently ranks as California’s least expensive housing market. The price drop since 2022 may open new opportunities for buyers interested in ultra-low-cost properties — and willing to live on the state’s arid, remote frontier.