Would you like to save this?
Alaska isn’t known for cheap living, but a few towns still offer homes that won’t wreck your budget—or your view. According to the Zillow Home Value Index, property prices in much of the state have stayed surprisingly steady, with some towns even seeing drops in recent years. From coastal fishing hubs to off-the-grid enclaves, these 24 places combine real affordability with serious natural beauty.
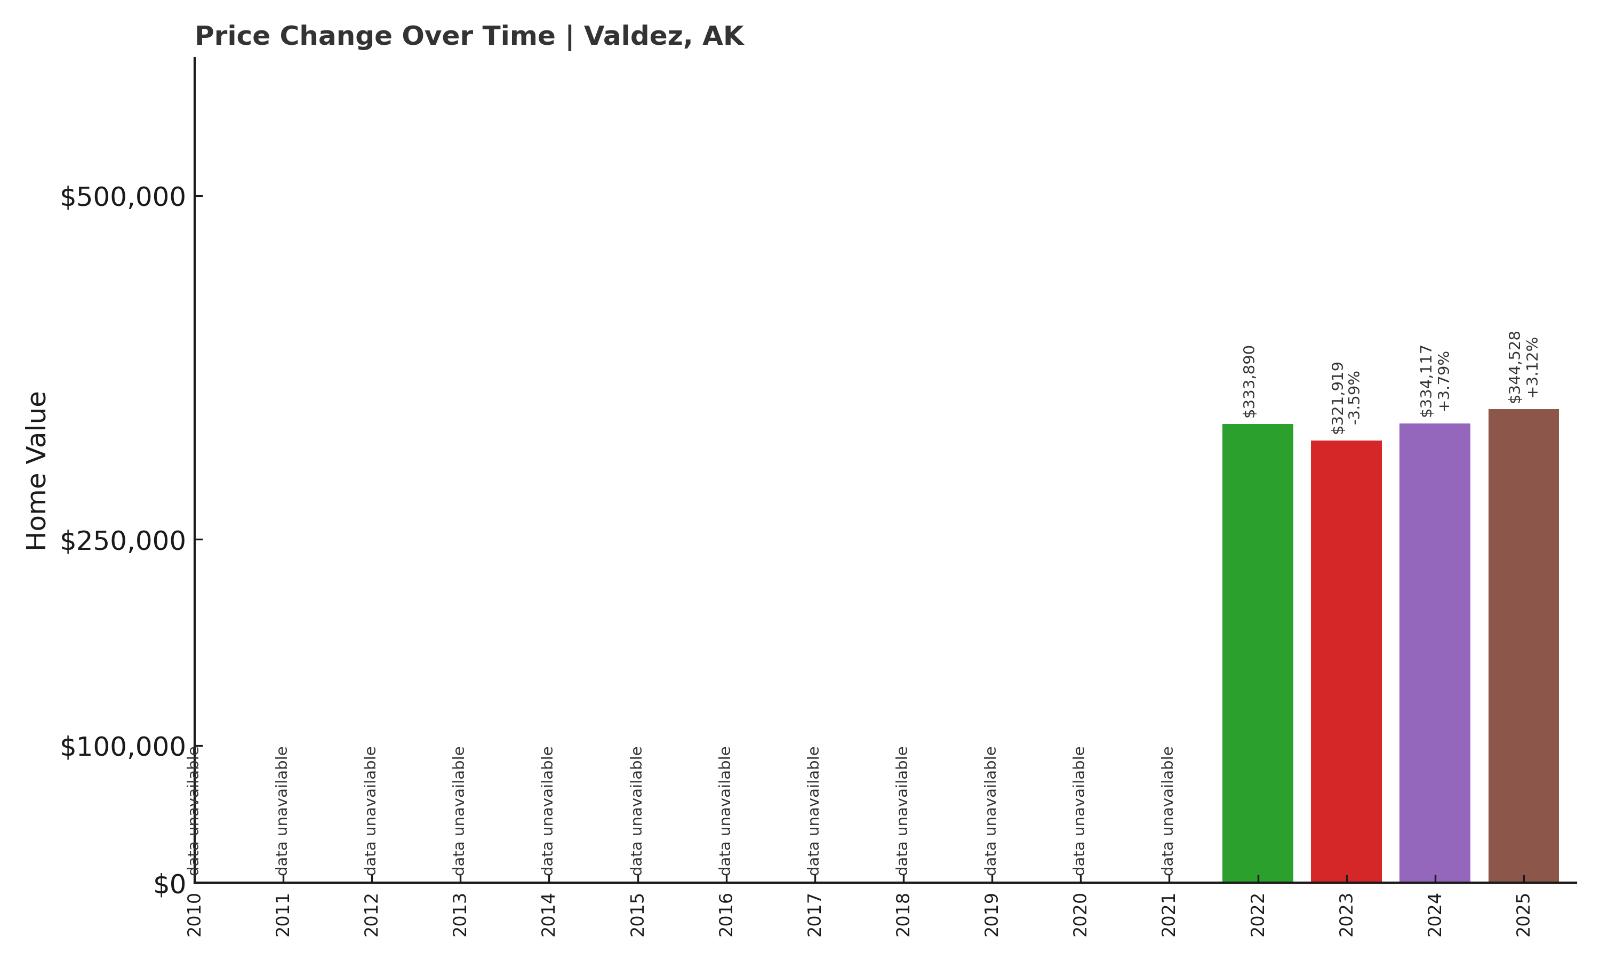
24. Valdez – 3.16% Home Price Increase Since June 2022
- 2010: N/A
- 2011: N/A
- 2012: N/A
- 2013: N/A
- 2014: N/A
- 2015: N/A
- 2016: N/A
- 2017: N/A
- 2018: N/A
- 2019: N/A
- 2020: N/A
- 2021: N/A
- 2022: $333,890
- 2023: $321,919 (-$11,971, -3.59% from previous year)
- 2024: $334,117 (+$12,198, +3.79% from previous year)
- 2025: $344,528 (+$10,411, +3.12% from previous year)
Valdez home prices saw modest growth of just over 3% since mid-2022, with some fluctuation along the way. After dipping in 2023, values rebounded to surpass earlier levels by 2025, reaching $344,528. Limited data prior to 2022 makes it hard to assess long-term trends, but the recent rise suggests renewed buyer interest.
Valdez – Slow and Steady in Prince William Sound

Valdez sits along the northeastern arm of Prince William Sound and is best known for its deep-water port and access to breathtaking wilderness. While the town has faced economic hurdles tied to oil and shipping, it remains one of the more affordable options along Alaska’s southern coast. Its relative isolation—accessible by boat, plane, or a long drive—helps keep prices lower than in more connected towns.
Despite limited housing turnover, values have inched upward recently, possibly spurred by increased interest in outdoor-centric living and telework flexibility. With reliable amenities and scenic surroundings, Valdez presents a slower-paced alternative to pricier Alaskan cities.
23. Seward – 84.3% Home Price Increase Since June 2010
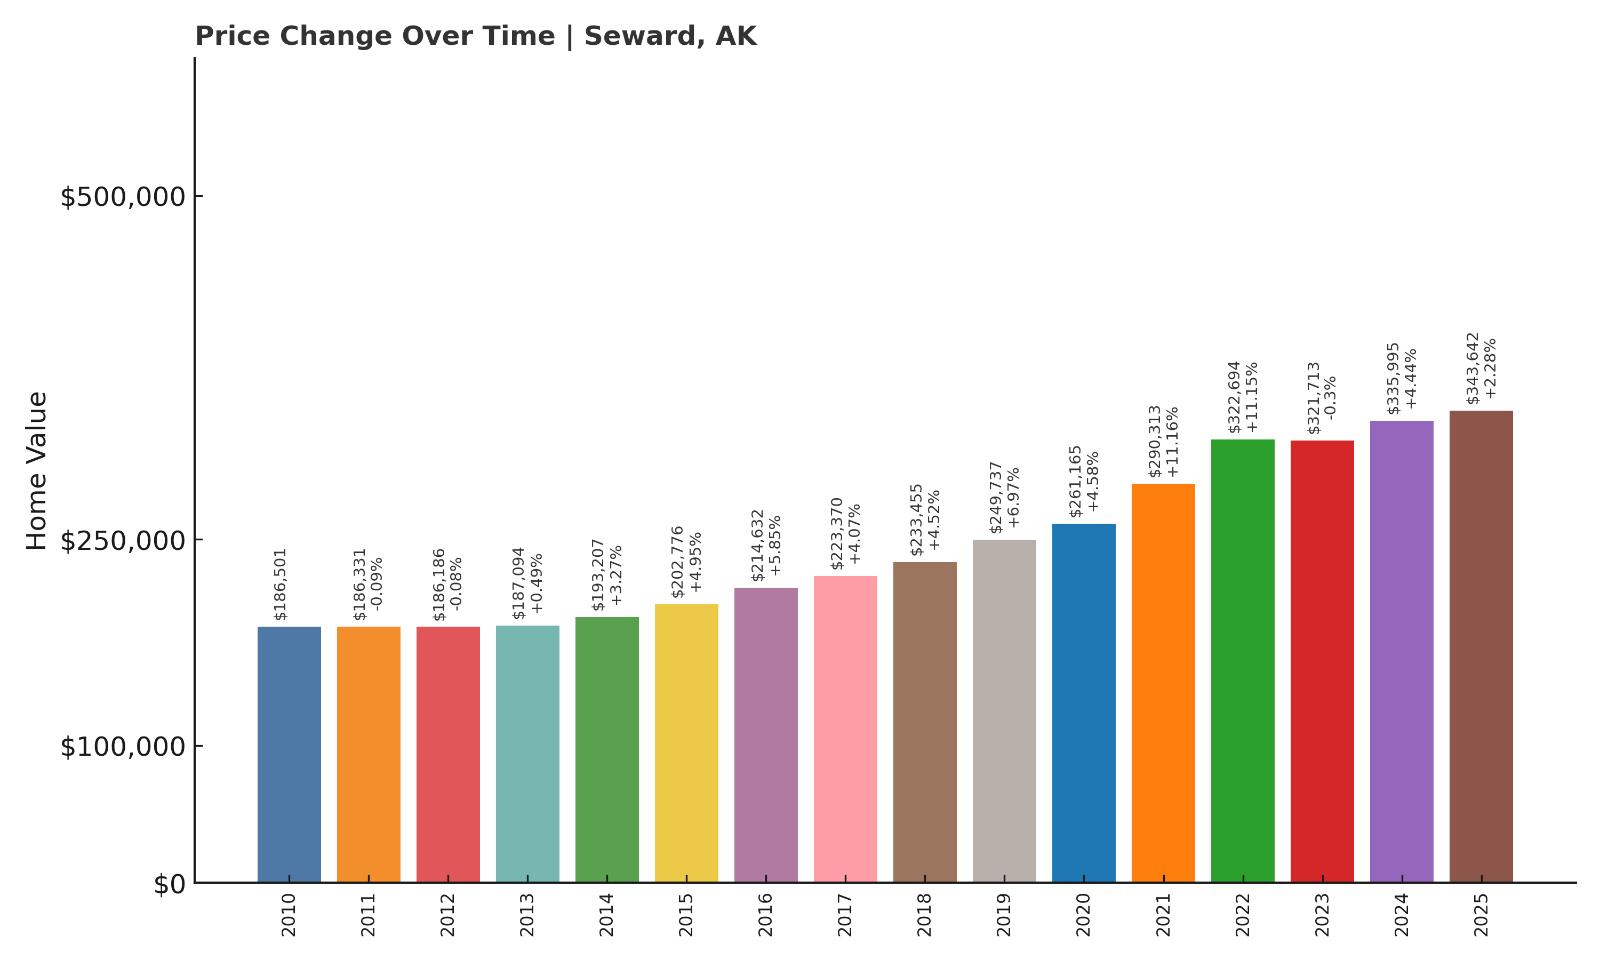
- 2010: $186,501
- 2011: $186,331 (-$170, -0.09% from previous year)
- 2012: $186,186 (-$145, -0.08% from previous year)
- 2013: $187,094 (+$908, +0.49% from previous year)
- 2014: $193,207 (+$6,114, +3.27% from previous year)
- 2015: $202,776 (+$9,568, +4.95% from previous year)
- 2016: $214,632 (+$11,856, +5.85% from previous year)
- 2017: $223,370 (+$8,738, +4.07% from previous year)
- 2018: $233,455 (+$10,085, +4.52% from previous year)
- 2019: $249,737 (+$16,282, +6.97% from previous year)
- 2020: $261,165 (+$11,429, +4.58% from previous year)
- 2021: $290,313 (+$29,147, +11.16% from previous year)
- 2022: $322,694 (+$32,381, +11.15% from previous year)
- 2023: $321,713 (-$981, -0.3% from previous year)
- 2024: $335,995 (+$14,282, +4.44% from previous year)
- 2025: $343,642 (+$7,647, +2.28% from previous year)
Seward home prices have steadily climbed for over a decade, rising more than 84% since 2010. Despite a brief dip in 2023, values continued trending upward, reaching $343,642 in 2025. Growth has been especially strong since 2020, with significant jumps during the pandemic-era housing rush.
Seward – Port Access and Rising Demand

Nestled at the southern end of the Kenai Peninsula, Seward combines small-town charm with important infrastructure. It’s a port of call for cruise ships, home to the Alaska SeaLife Center, and the gateway to Kenai Fjords National Park. That access to tourism and outdoor activities has bolstered its real estate appeal in recent years.
Although it’s not as remote as other towns on this list, Seward’s balance of amenities and rugged coastal beauty has drawn a steady flow of buyers. Continued development and a growing short-term rental market could help explain the upward price pressure since 2020.
22. Haines – 14.6% Home Price Increase Since June 2021
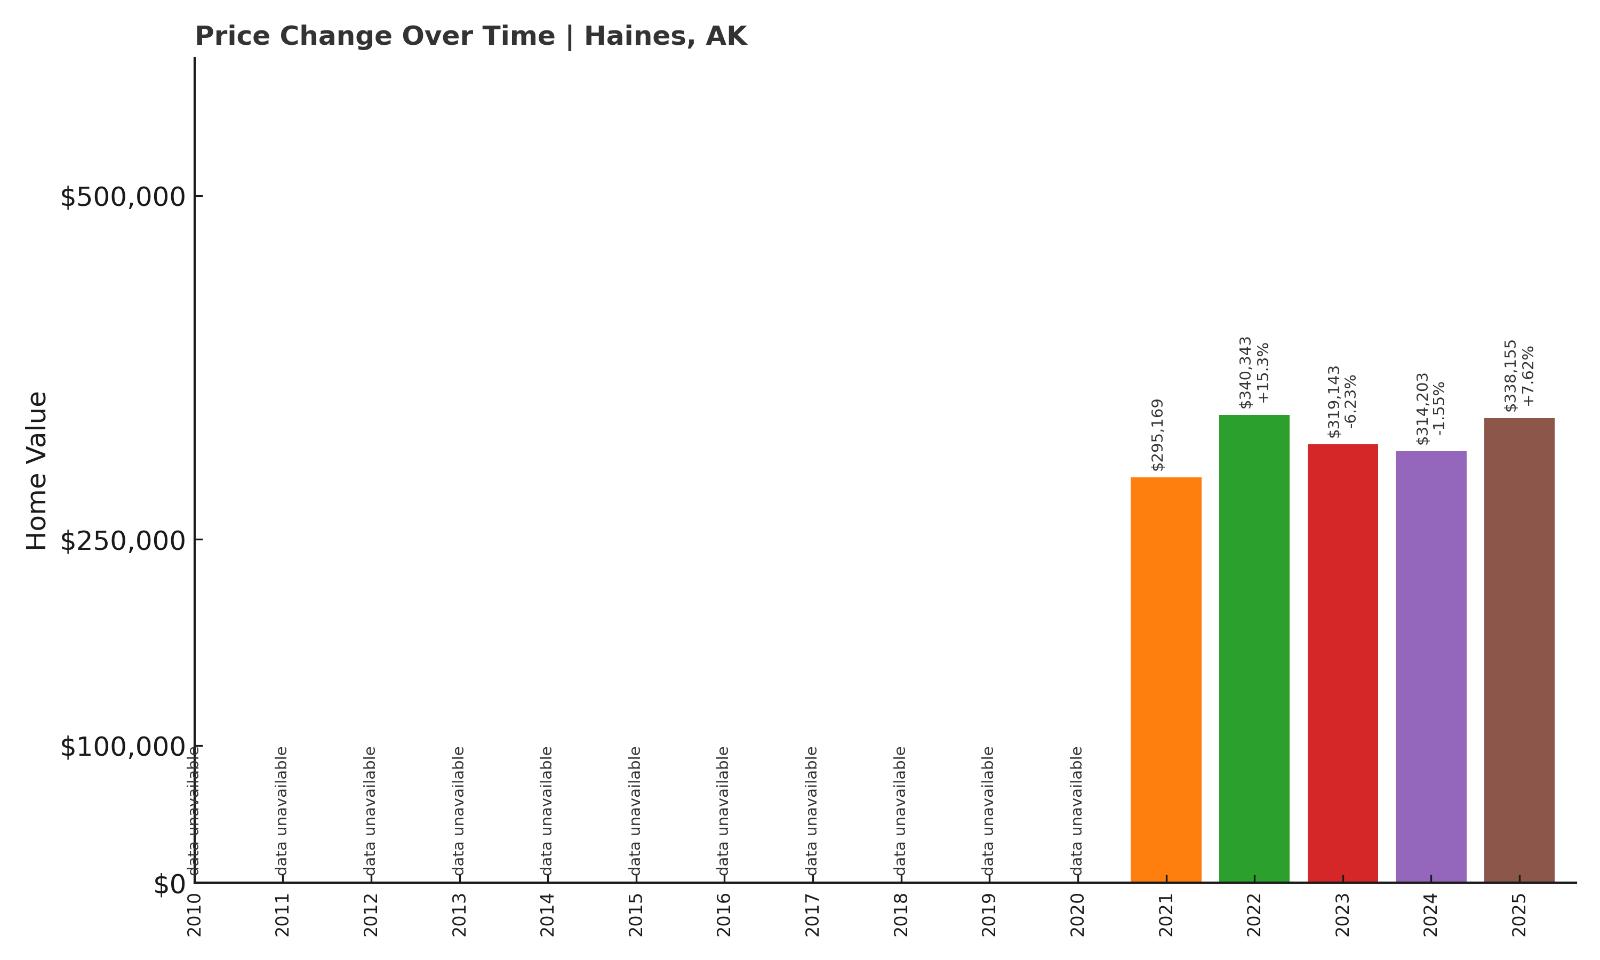
- 2010: N/A
- 2011: N/A
- 2012: N/A
- 2013: N/A
- 2014: N/A
- 2015: N/A
- 2016: N/A
- 2017: N/A
- 2018: N/A
- 2019: N/A
- 2020: N/A
- 2021: $295,169
- 2022: $340,343 (+$45,174, +15.3% from previous year)
- 2023: $319,143 (-$21,200, -6.23% from previous year)
- 2024: $314,203 (-$4,939, -1.55% from previous year)
- 2025: $338,155 (+$23,951, +7.62% from previous year)
Haines prices jumped sharply in 2022, followed by two years of mixed movement. Despite a dip in 2023 and a slight loss in 2024, prices recovered by 2025. Compared to 2021, the overall gain sits at 14.6%, with a final average home price of $338,155.
Haines – Scenic But Volatile

Would you like to save this?
Located along the Lynn Canal, Haines is known for its sweeping mountain views and strong arts community. It’s a quieter alternative to nearby Skagway but shares the same cruise ship access and deep heritage. Home values here have been more volatile than in similar towns, with recent drops hinting at softer demand or affordability ceilings being reached.
The remote nature of Haines—and its susceptibility to seasonal swings—may have also contributed to the market’s uneven performance. Still, the strong rebound in 2025 suggests renewed optimism among buyers seeking affordable but scenic coastal living.
21. Petersburg – 13.4% Home Price Increase Since June 2017
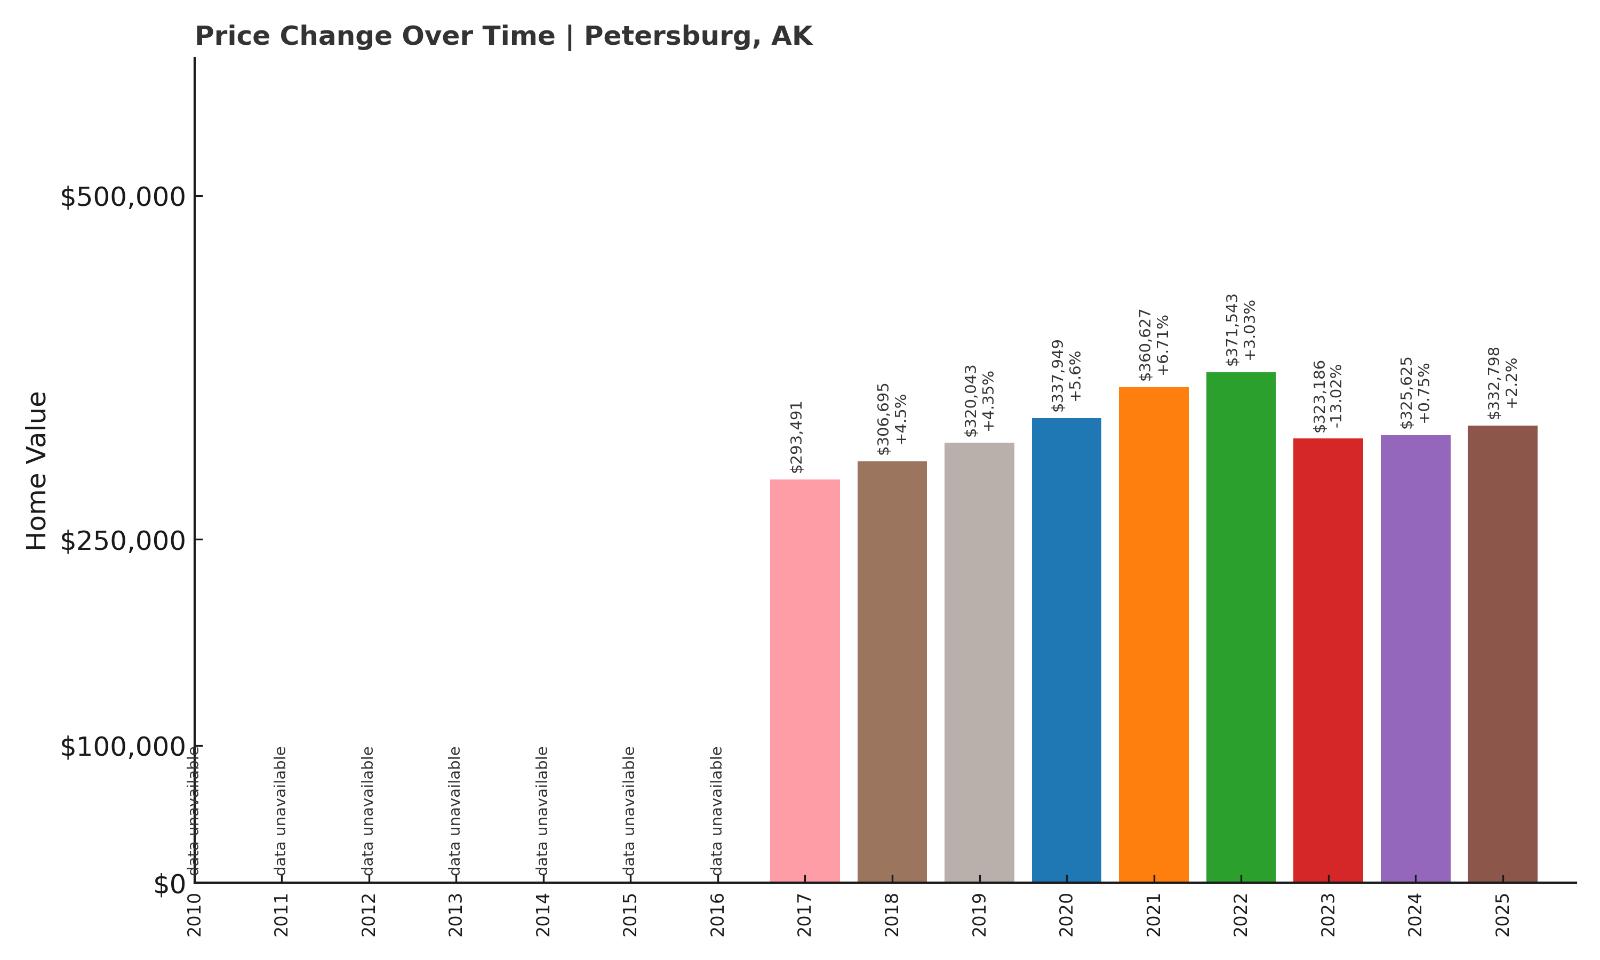
- 2010: N/A
- 2011: N/A
- 2012: N/A
- 2013: N/A
- 2014: N/A
- 2015: N/A
- 2016: N/A
- 2017: $293,491
- 2018: $306,695 (+$13,204, +4.5% from previous year)
- 2019: $320,043 (+$13,347, +4.35% from previous year)
- 2020: $337,949 (+$17,906, +5.6% from previous year)
- 2021: $360,627 (+$22,678, +6.71% from previous year)
- 2022: $371,543 (+$10,916, +3.03% from previous year)
- 2023: $323,186 (-$48,357, -13.02% from previous year)
- 2024: $325,625 (+$2,439, +0.75% from previous year)
- 2025: $332,798 (+$7,173, +2.2% from previous year)
Since 2017, Petersburg home values have risen 13.4%, despite a dramatic price correction in 2023. Prices recovered somewhat through 2025, ending at $332,798. The town experienced its peak in 2022, before a steep drop shaved off over $48,000 in a single year.
Petersburg – Fishing Industry and Price Fluctuations

Petersburg is a working town on Mitkof Island with deep roots in commercial fishing. It’s not a major tourist draw, which helps keep prices more grounded—but that same reliance on industry can introduce volatility. Local job shifts or economic downturns can ripple through the housing market.
The sharp decline in 2023 suggests either a correction from overheated values or broader cooling in demand. Still, Petersburg’s unique blend of affordability, community, and access to the Inside Passage keeps it on the radar for buyers seeking value in southeast Alaska.
20. Sterling – 72.8% Home Price Increase Since June 2010
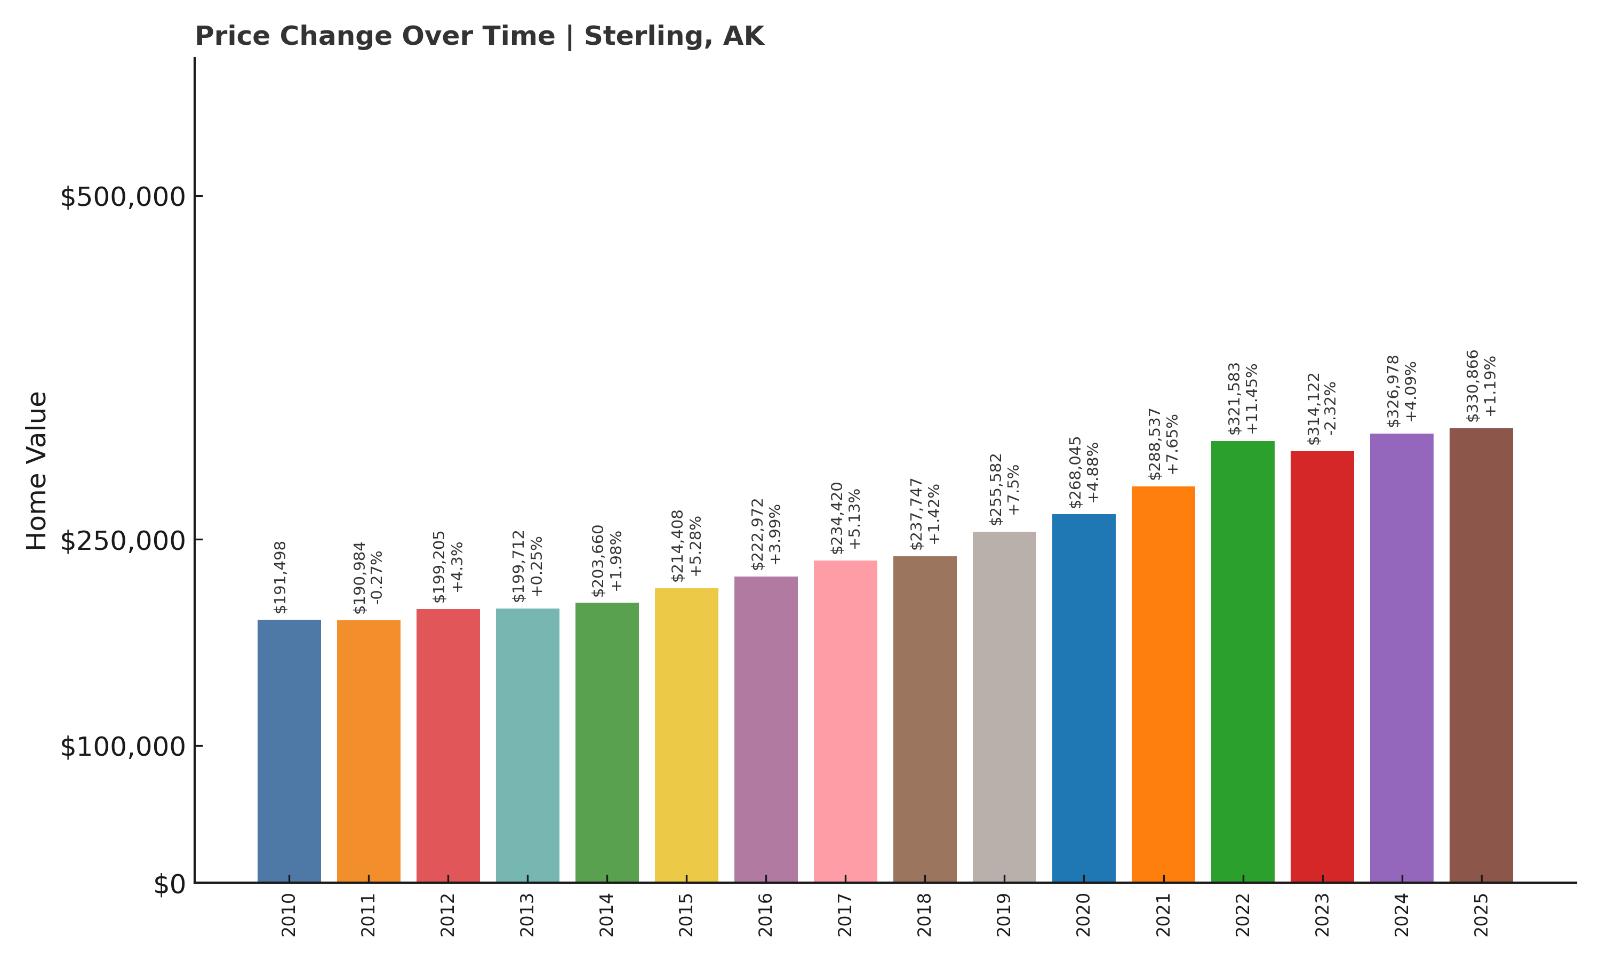
- 2010: $191,498
- 2011: $190,984 (-$513, -0.27% from previous year)
- 2012: $199,205 (+$8,221, +4.3% from previous year)
- 2013: $199,712 (+$507, +0.25% from previous year)
- 2014: $203,660 (+$3,948, +1.98% from previous year)
- 2015: $214,408 (+$10,748, +5.28% from previous year)
- 2016: $222,972 (+$8,563, +3.99% from previous year)
- 2017: $234,420 (+$11,448, +5.13% from previous year)
- 2018: $237,747 (+$3,327, +1.42% from previous year)
- 2019: $255,582 (+$17,835, +7.5% from previous year)
- 2020: $268,045 (+$12,462, +4.88% from previous year)
- 2021: $288,537 (+$20,493, +7.65% from previous year)
- 2022: $321,583 (+$33,046, +11.45% from previous year)
- 2023: $314,122 (-$7,461, -2.32% from previous year)
- 2024: $326,978 (+$12,856, +4.09% from previous year)
- 2025: $330,866 (+$3,888, +1.19% from previous year)
Home values in Sterling have grown by nearly 73% since 2010, though recent years have seen mixed results. After a small decline in 2023, prices rebounded and reached $330,866 in 2025. Overall, the long-term trend remains firmly upward.
Sterling – Steady Growth on the Kenai Peninsula

Sterling lies along the Sterling Highway on the western Kenai Peninsula, a region popular with fishers, retirees, and seasonal workers. While it’s not as flashy as Homer or Soldotna, it offers access to the Kenai River and wide open spaces at a lower price point.
Prices here have seen stable, predictable growth over the last 15 years, reflecting moderate demand and new construction. While the town remains affordable, proximity to natural beauty and infrastructure keeps it from being overlooked entirely.
19. North Pole – 34.7% Home Price Increase Since June 2010
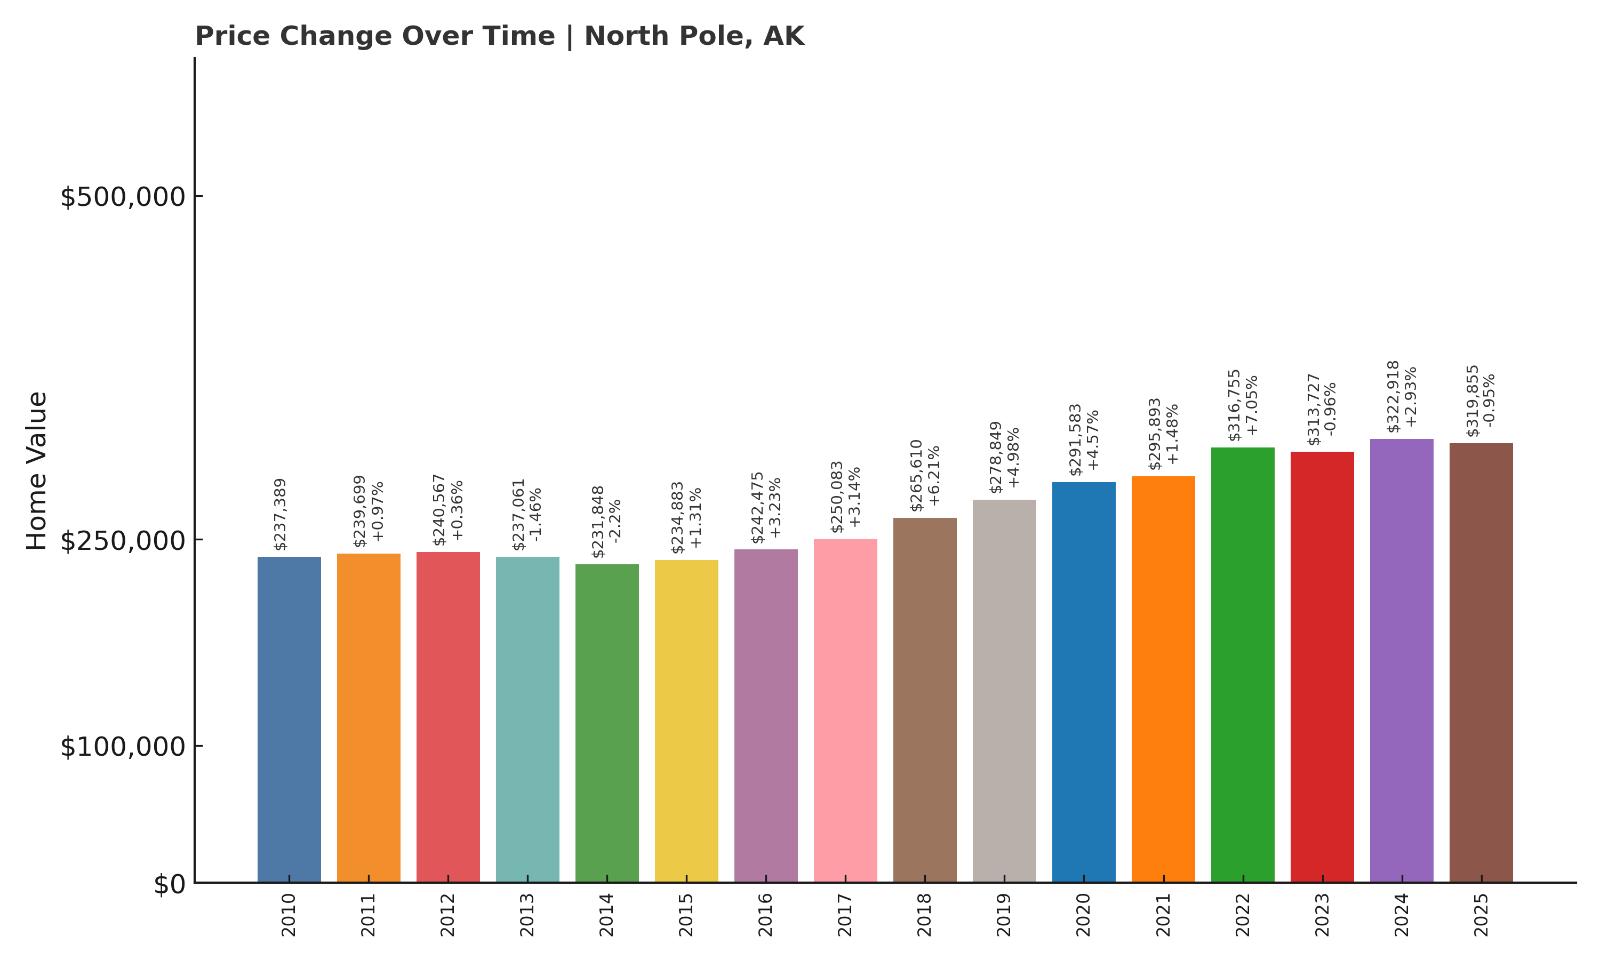
- 2010: $237,389
- 2011: $239,699 (+$2,310, +0.97% from previous year)
- 2012: $240,567 (+$868, +0.36% from previous year)
- 2013: $237,061 (-$3,506, -1.46% from previous year)
- 2014: $231,848 (-$5,213, -2.2% from previous year)
- 2015: $234,883 (+$3,035, +1.31% from previous year)
- 2016: $242,475 (+$7,592, +3.23% from previous year)
- 2017: $250,083 (+$7,608, +3.14% from previous year)
- 2018: $265,610 (+$15,527, +6.21% from previous year)
- 2019: $278,849 (+$13,239, +4.98% from previous year)
- 2020: $291,583 (+$12,734, +4.57% from previous year)
- 2021: $295,893 (+$4,310, +1.48% from previous year)
- 2022: $316,755 (+$20,862, +7.05% from previous year)
- 2023: $313,727 (-$3,028, -0.96% from previous year)
- 2024: $322,918 (+$9,191, +2.93% from previous year)
- 2025: $319,855 (-$3,064, -0.95% from previous year)
Home prices in North Pole are up nearly 35% since 2010, though growth has flattened recently. The town peaked in 2022 before a mild decline over the last two years, settling at $319,855 in 2025. Most of the appreciation happened between 2015 and 2022.
North Pole – Affordability Near Fairbanks

Located just 15 miles southeast of Fairbanks, North Pole blends suburban convenience with a quirky identity. Known for its year-round Christmas decorations and themed street names, it attracts both families and military personnel from nearby Eielson Air Force Base.
While the market here has cooled slightly since 2022, the area remains popular thanks to decent amenities, easy highway access, and relatively low prices compared to larger urban centers. Its appeal as a quieter, commuter-friendly hub has helped keep values above many rural alternatives.
18. Wrangell – 41.6% Home Price Increase Since June 2016
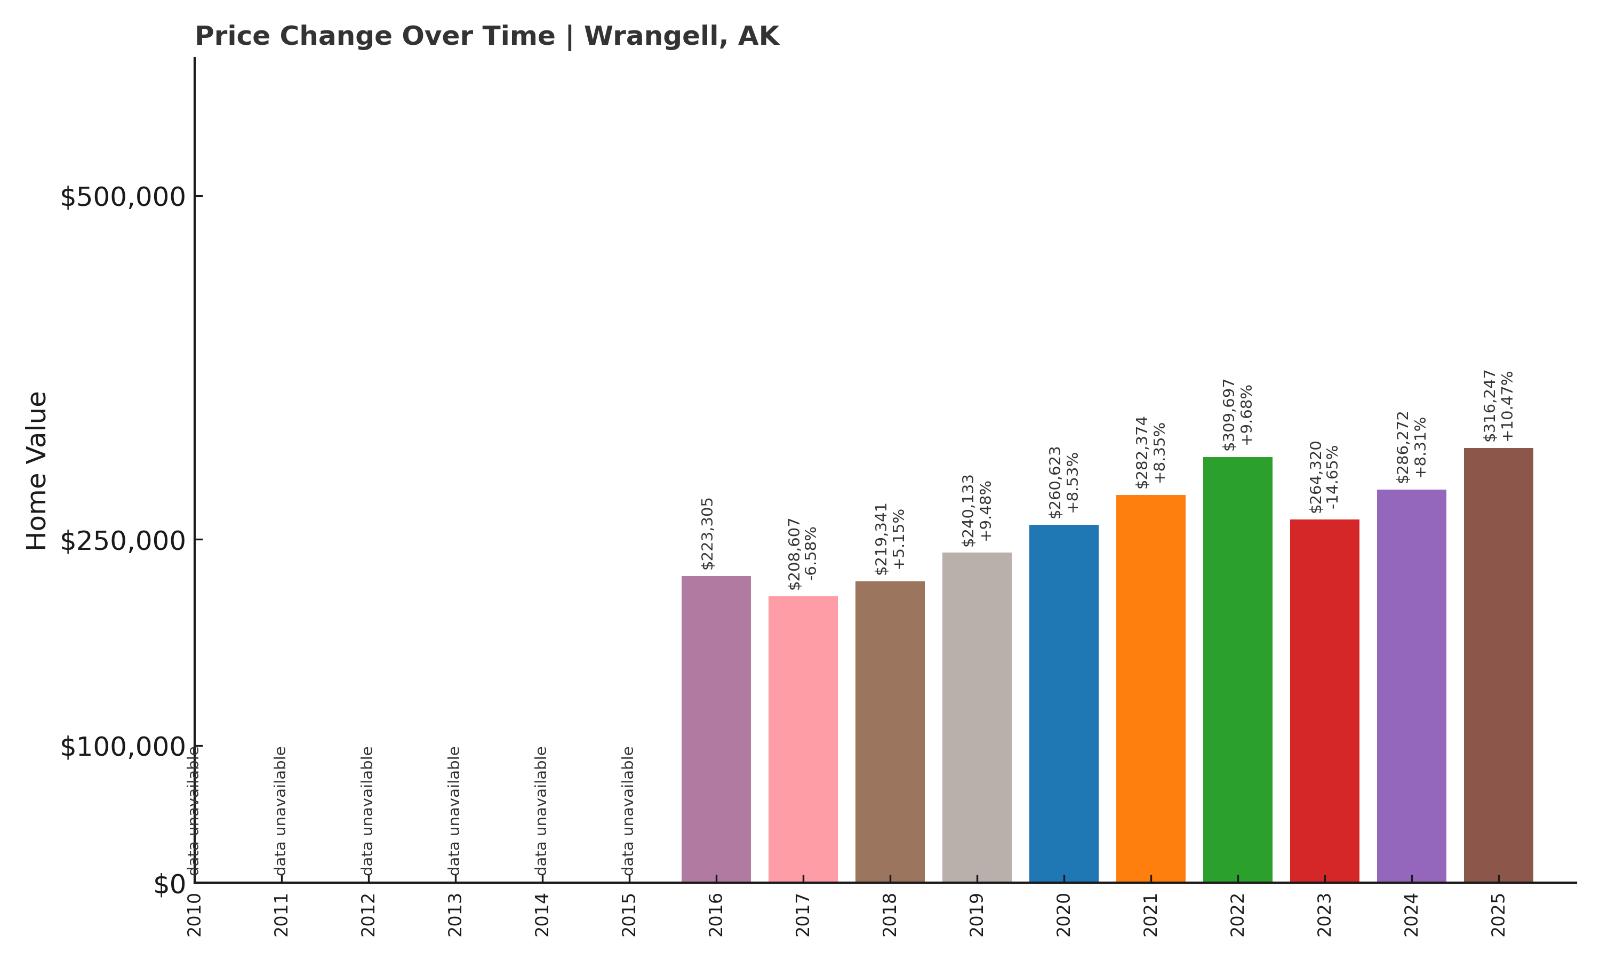
- 2010: N/A
- 2011: N/A
- 2012: N/A
- 2013: N/A
- 2014: N/A
- 2015: N/A
- 2016: $223,305
- 2017: $208,607 (-$14,699, -6.58% from previous year)
- 2018: $219,341 (+$10,734, +5.15% from previous year)
- 2019: $240,133 (+$20,792, +9.48% from previous year)
- 2020: $260,623 (+$20,491, +8.53% from previous year)
- 2021: $282,374 (+$21,751, +8.35% from previous year)
- 2022: $309,697 (+$27,322, +9.68% from previous year)
- 2023: $264,320 (-$45,377, -14.65% from previous year)
- 2024: $286,272 (+$21,952, +8.31% from previous year)
- 2025: $316,247 (+$29,975, +10.47% from previous year)
Wrangell’s housing market has seen dramatic swings. After a steep decline in 2023, home values surged again in the following two years. The town has gained over 41% in value since 2016, with prices currently averaging $316,247.
Wrangell – Remote, Scenic, and Price-Sensitive

Located on Wrangell Island in southeast Alaska, Wrangell is one of the oldest towns in the state. It’s surrounded by Tongass National Forest and relies heavily on fishing, timber, and tourism. That mix of industries—and relative remoteness—makes its housing market more sensitive to economic shifts.
The recent price recovery may reflect renewed buyer interest after values dropped in 2023. As a port community with a slower pace and plenty of natural beauty, Wrangell appeals to buyers seeking affordability without sacrificing scenery.
17. Kenai – 56.9% Home Price Increase Since June 2010
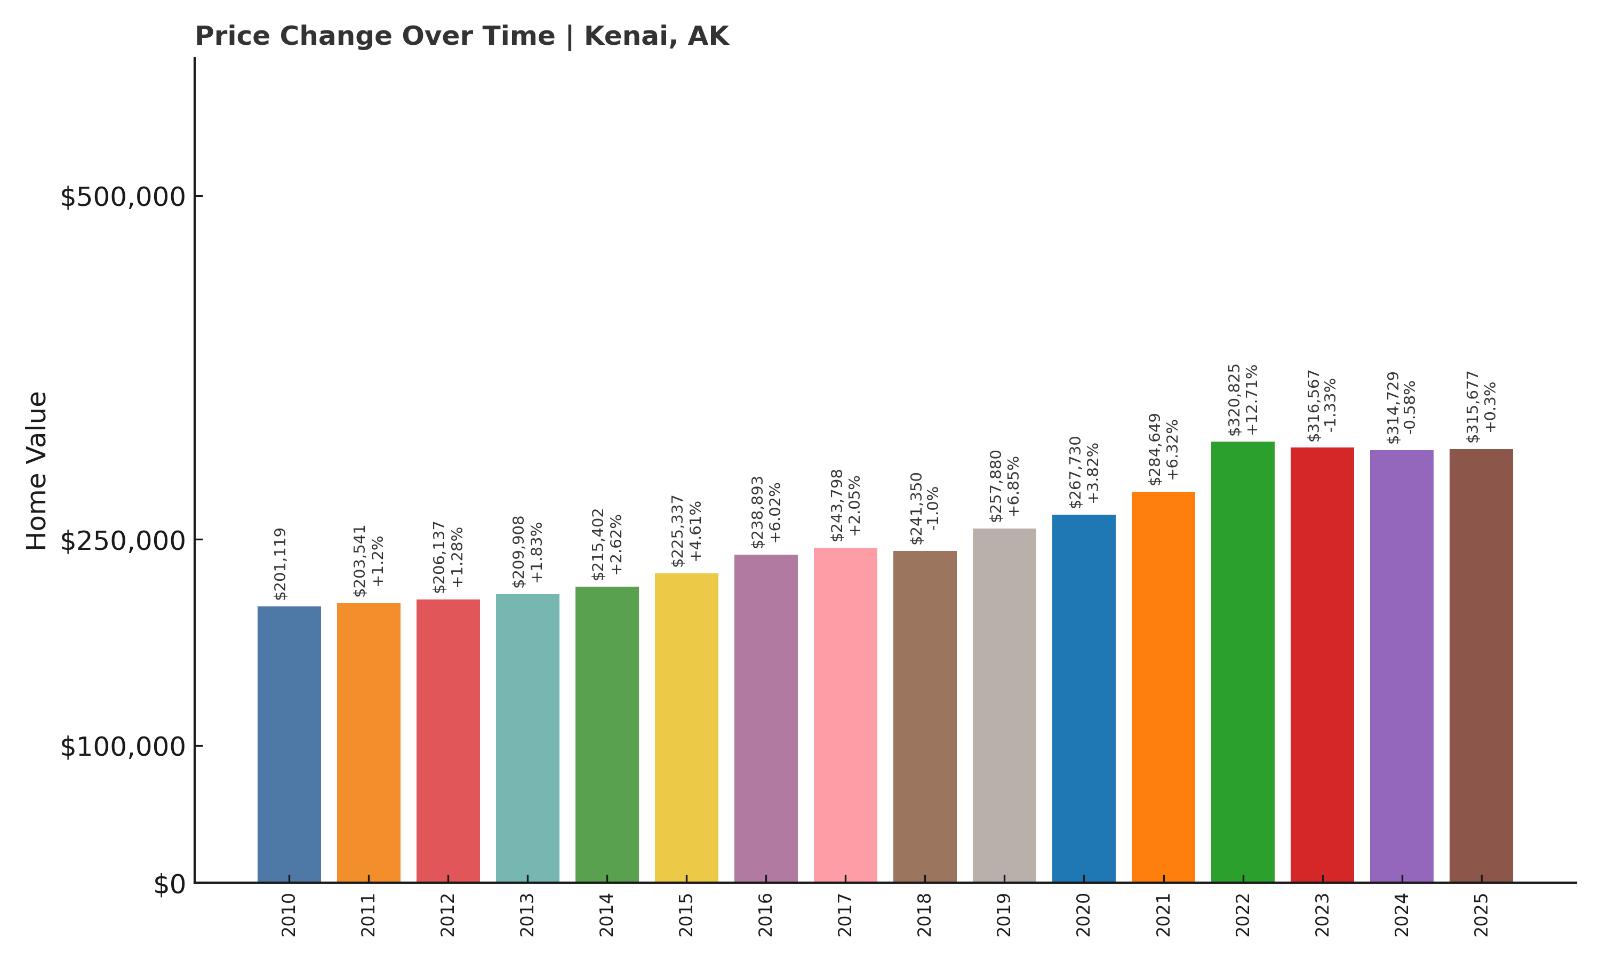
- 2010: $201,119
- 2011: $203,541 (+$2,422, +1.2% from previous year)
- 2012: $206,137 (+$2,596, +1.28% from previous year)
- 2013: $209,908 (+$3,771, +1.83% from previous year)
- 2014: $215,402 (+$5,494, +2.62% from previous year)
- 2015: $225,337 (+$9,935, +4.61% from previous year)
- 2016: $238,893 (+$13,557, +6.02% from previous year)
- 2017: $243,798 (+$4,905, +2.05% from previous year)
- 2018: $241,350 (-$2,448, -1.0% from previous year)
- 2019: $257,880 (+$16,529, +6.85% from previous year)
- 2020: $267,730 (+$9,850, +3.82% from previous year)
- 2021: $284,649 (+$16,919, +6.32% from previous year)
- 2022: $320,825 (+$36,176, +12.71% from previous year)
- 2023: $316,567 (-$4,258, -1.33% from previous year)
- 2024: $314,729 (-$1,838, -0.58% from previous year)
- 2025: $315,677 (+$948, +0.3% from previous year)
Kenai home values have increased by almost 57% since 2010. Most of that growth occurred after 2019, culminating in a 2022 peak. While prices dipped slightly afterward, they stabilized by 2025 at $315,677.
Kenai – Affordable Living on Cook Inlet
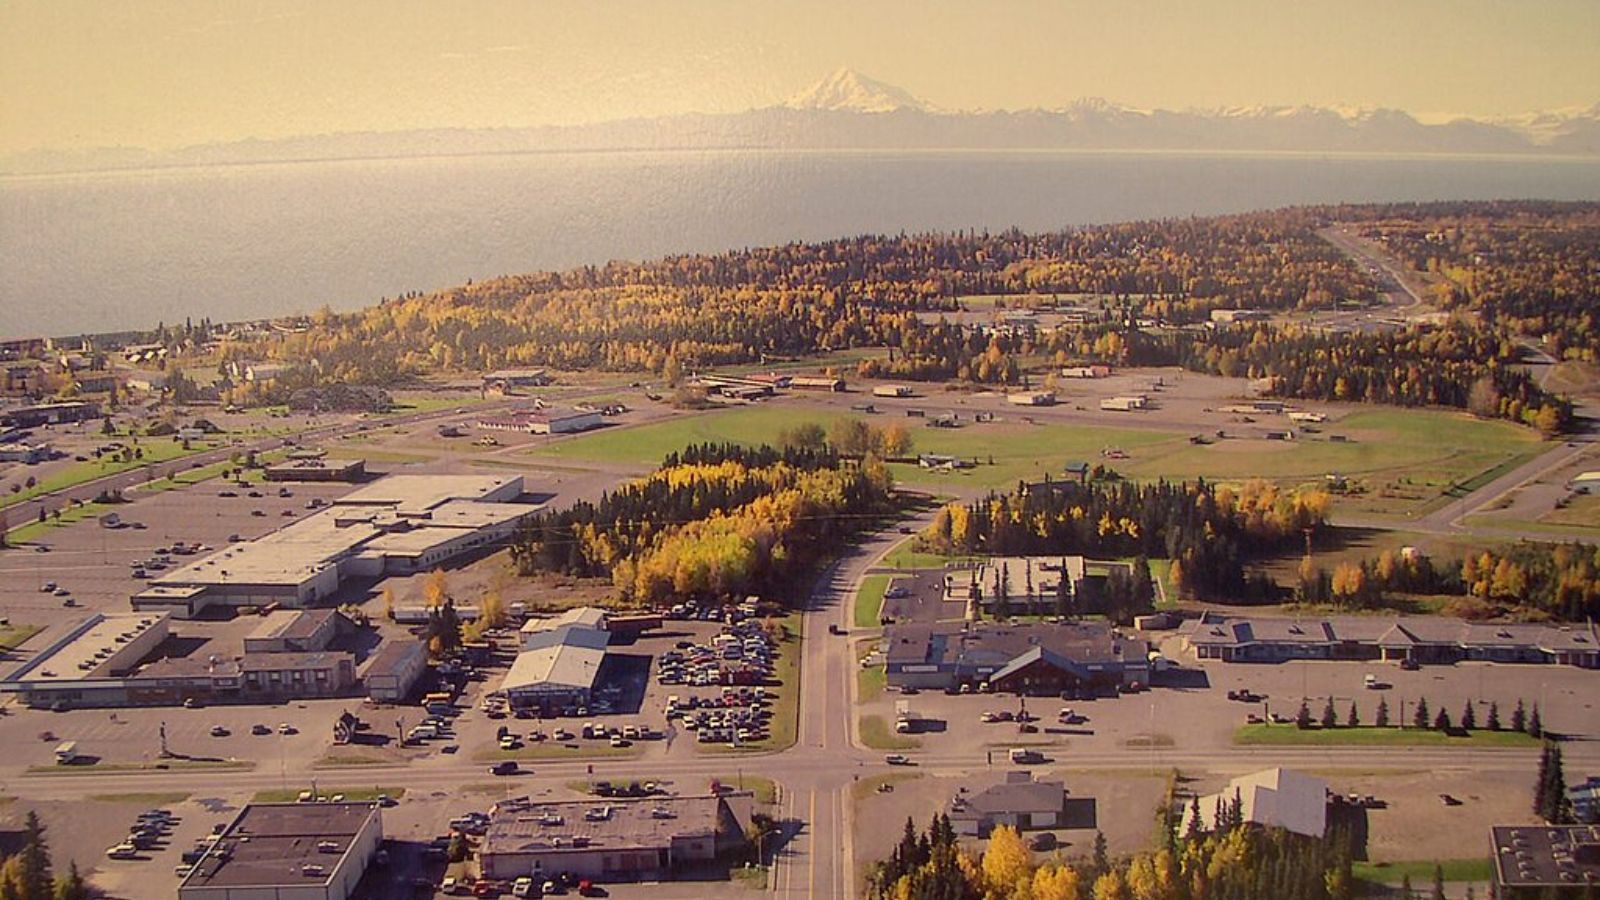
Kenai sits along the western shore of the Kenai Peninsula and offers year-round recreation, airport access, and proximity to the Kenai River. With a mix of full-time residents and seasonal visitors, it strikes a balance between affordability and livability.
The sharp rise in values during the early 2020s was followed by a mild correction, which has since leveled off. Kenai continues to draw interest from both retirees and working families looking for lower costs and strong community infrastructure.
16. Barrow – 92.8% Home Price Increase Since June 2016
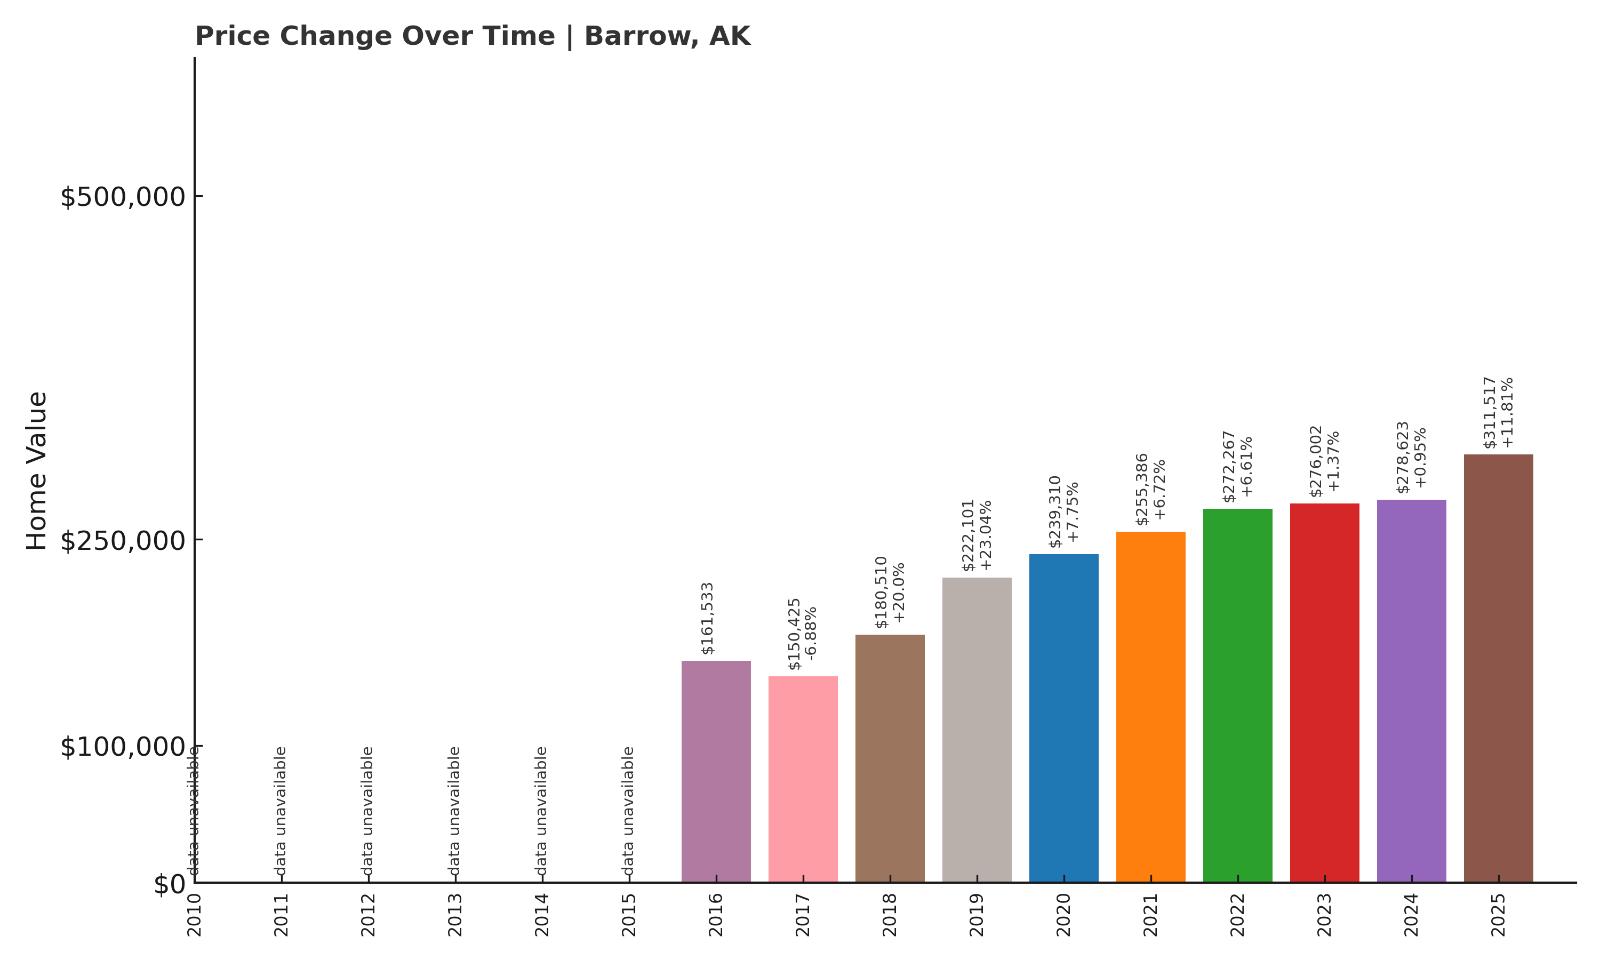
- 2010: N/A
- 2011: N/A
- 2012: N/A
- 2013: N/A
- 2014: N/A
- 2015: N/A
- 2016: $161,533
- 2017: $150,425 (-$11,107, -6.88% from previous year)
- 2018: $180,510 (+$30,085, +20.0% from previous year)
- 2019: $222,101 (+$41,591, +23.04% from previous year)
- 2020: $239,310 (+$17,209, +7.75% from previous year)
- 2021: $255,386 (+$16,076, +6.72% from previous year)
- 2022: $272,267 (+$16,882, +6.61% from previous year)
- 2023: $276,002 (+$3,735, +1.37% from previous year)
- 2024: $278,623 (+$2,621, +0.95% from previous year)
- 2025: $311,517 (+$32,894, +11.81% from previous year)
Barrow (also known as Utqiaġvik) has seen nearly a 93% jump in home prices since 2016. After modest gains from 2020 through 2024, the town experienced a large increase in 2025, bringing average home values to $311,517.
Barrow – Northernmost Real Estate in the U.S.

Barrow is the northernmost city in the United States and sits above the Arctic Circle, making it one of the most remote housing markets in the country. Harsh winters, logistical challenges, and limited inventory contribute to its unique price dynamics.
The 2025 surge may reflect infrastructure improvements or renewed investment in the region. Despite its isolation, Barrow has a permanent population and cultural significance, which sustains a tight but active housing market.
15. Diamond Ridge – 68.3% Home Price Increase Since June 2010
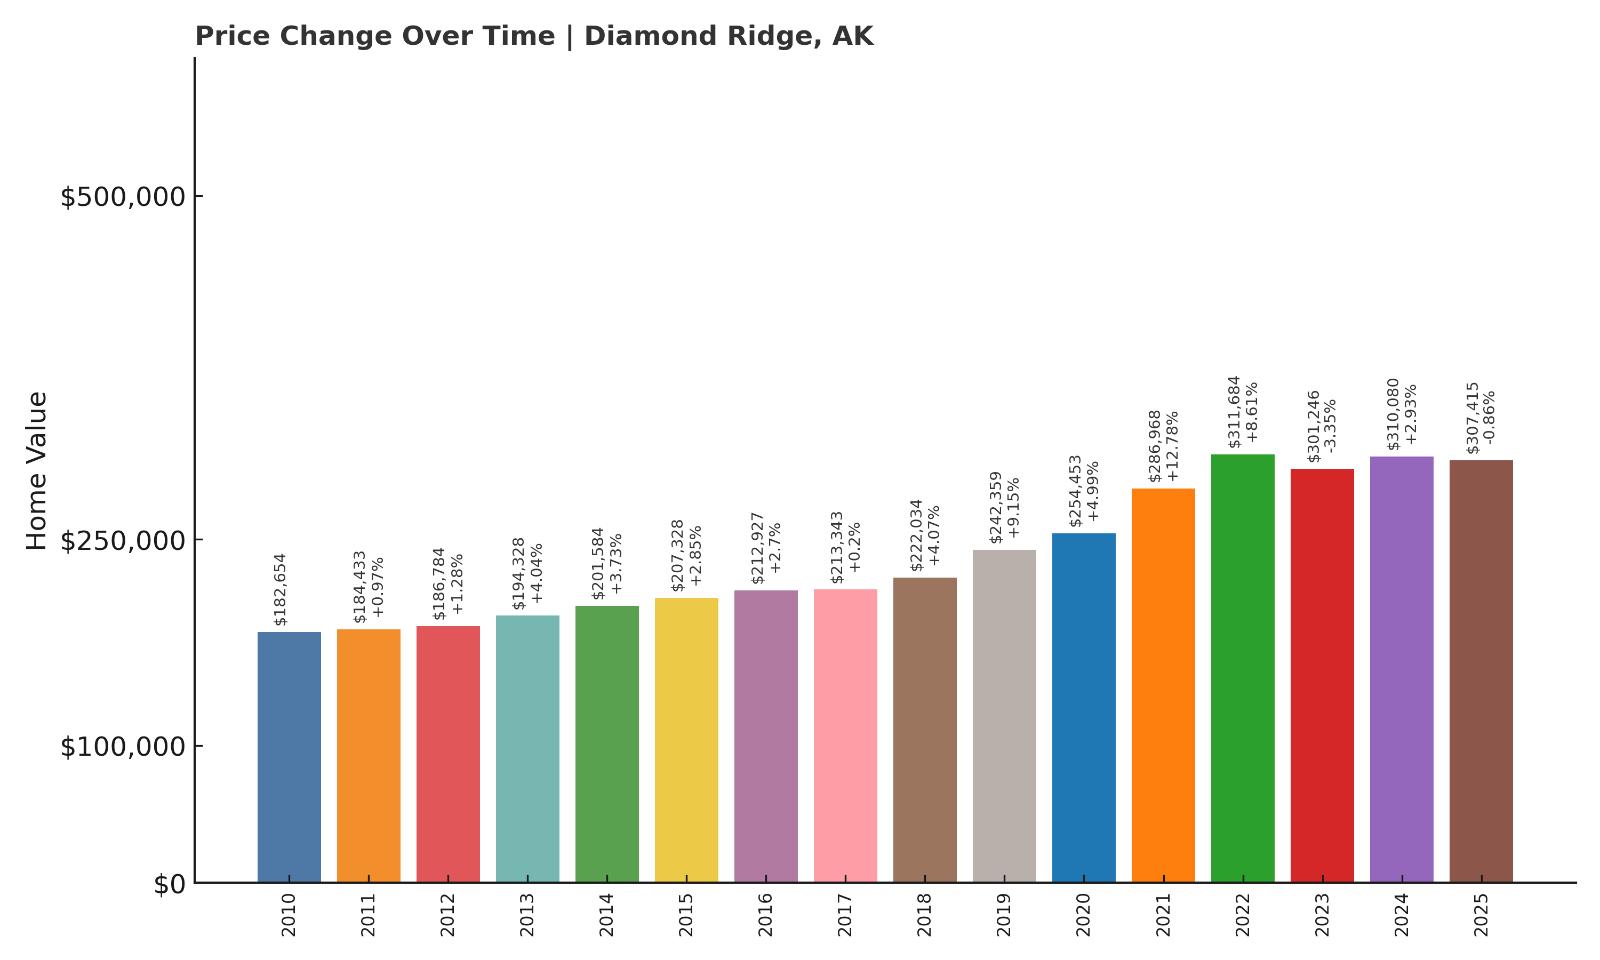
Would you like to save this?
- 2010: $182,654
- 2011: $184,433 (+$1,778, +0.97% from previous year)
- 2012: $186,784 (+$2,352, +1.28% from previous year)
- 2013: $194,328 (+$7,543, +4.04% from previous year)
- 2014: $201,584 (+$7,257, +3.73% from previous year)
- 2015: $207,328 (+$5,744, +2.85% from previous year)
- 2016: $212,927 (+$5,599, +2.7% from previous year)
- 2017: $213,343 (+$416, +0.2% from previous year)
- 2018: $222,034 (+$8,691, +4.07% from previous year)
- 2019: $242,359 (+$20,325, +9.15% from previous year)
- 2020: $254,453 (+$12,095, +4.99% from previous year)
- 2021: $286,968 (+$32,515, +12.78% from previous year)
- 2022: $311,684 (+$24,716, +8.61% from previous year)
- 2023: $301,246 (-$10,438, -3.35% from previous year)
- 2024: $310,080 (+$8,834, +2.93% from previous year)
- 2025: $307,415 (-$2,665, -0.86% from previous year)
Diamond Ridge’s home prices have increased more than 68% since 2010, though recent years show signs of leveling off. After peaking in 2022, values dipped slightly in 2023 and again in 2025, ending at $307,415. Despite the recent volatility, the long-term trend remains positive.
Diamond Ridge – Hillside Living Near Homer

Located just above the town of Homer on the Kenai Peninsula, Diamond Ridge offers sweeping views of Kachemak Bay and space to spread out. The area is known for its artistic community and off-grid properties, attracting residents who value privacy and scenery over convenience.
Its hillside location keeps demand high among certain buyers, though prices remain lower than those in more urbanized parts of the peninsula. The recent plateau may reflect broader affordability limits or a slight cooldown after years of strong appreciation.
14. Fairbanks – 32.4% Home Price Increase Since June 2010
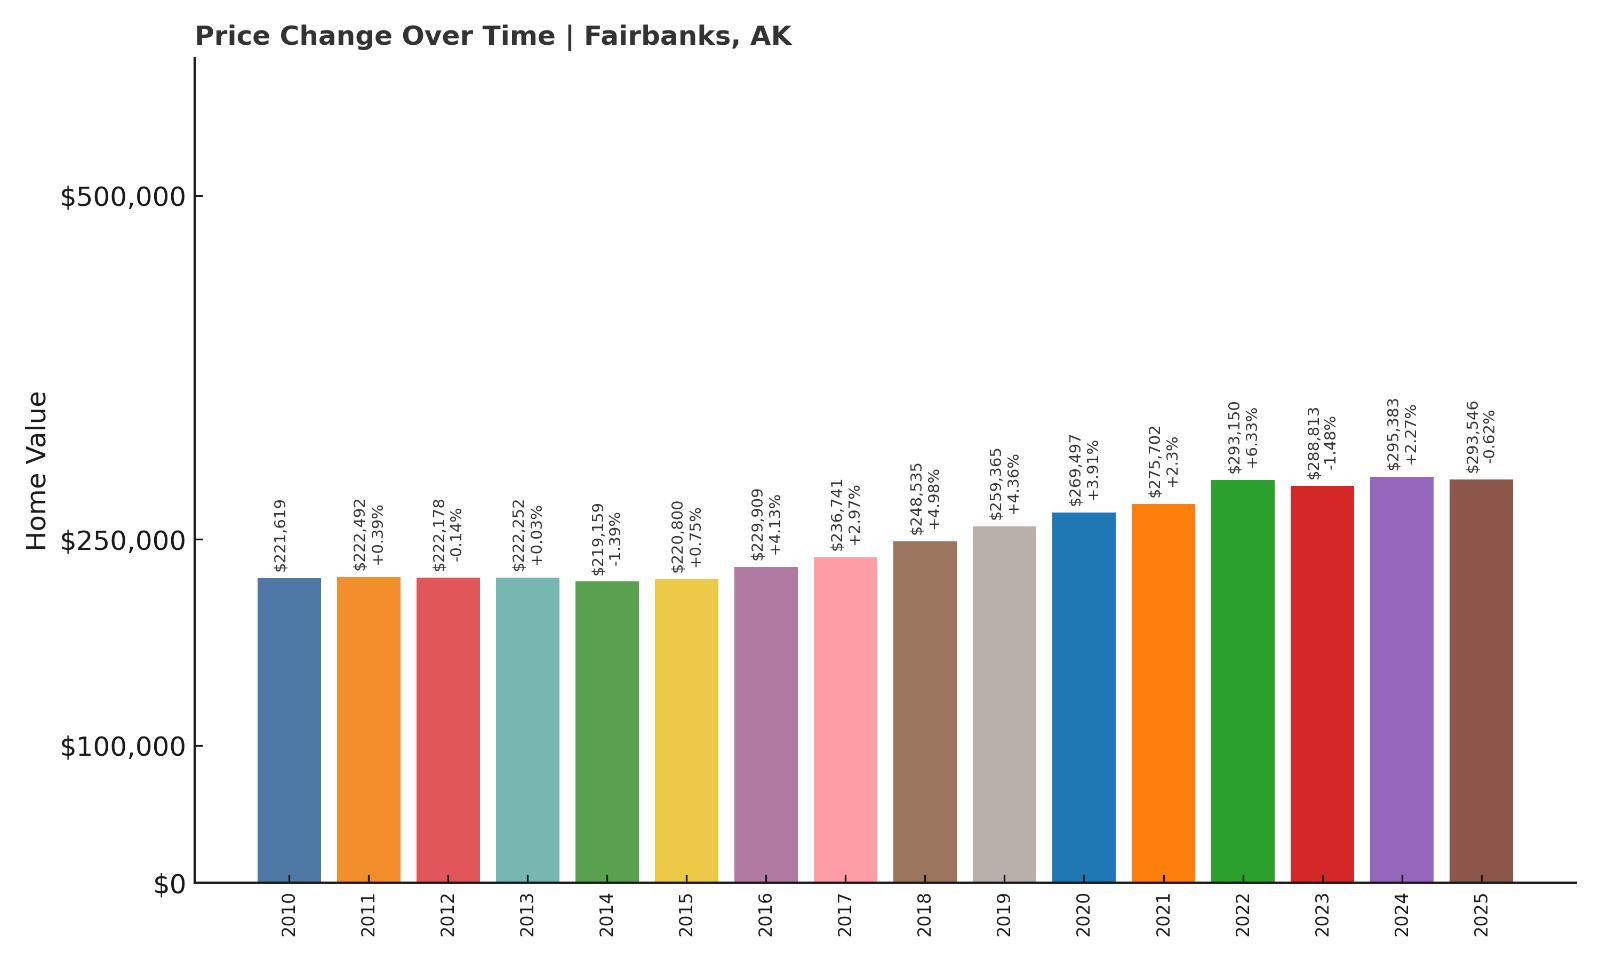
- 2010: $221,619
- 2011: $222,492 (+$872, +0.39% from previous year)
- 2012: $222,178 (-$314, -0.14% from previous year)
- 2013: $222,252 (+$74, +0.03% from previous year)
- 2014: $219,159 (-$3,093, -1.39% from previous year)
- 2015: $220,800 (+$1,641, +0.75% from previous year)
- 2016: $229,909 (+$9,109, +4.13% from previous year)
- 2017: $236,741 (+$6,832, +2.97% from previous year)
- 2018: $248,535 (+$11,794, +4.98% from previous year)
- 2019: $259,365 (+$10,830, +4.36% from previous year)
- 2020: $269,497 (+$10,132, +3.91% from previous year)
- 2021: $275,702 (+$6,205, +2.3% from previous year)
- 2022: $293,150 (+$17,448, +6.33% from previous year)
- 2023: $288,813 (-$4,337, -1.48% from previous year)
- 2024: $295,383 (+$6,570, +2.27% from previous year)
- 2025: $293,546 (-$1,837, -0.62% from previous year)
Fairbanks has seen a 32% increase in home values since 2010. After climbing steadily through 2022, prices dipped slightly in 2023 and 2025, with the current average sitting at $293,546. Despite recent flattening, the market has proven resilient.
Fairbanks – Interior Alaska’s Urban Center

Fairbanks is Alaska’s second-largest city and the cultural and economic hub of the Interior. It offers a full range of services, a university, and direct access to wilderness, making it a magnet for residents who want the benefits of city life without the price tag of Anchorage or coastal towns.
The housing market has cooled slightly since 2022, but the city’s broad appeal and employment base continue to support relatively strong property values. Its mix of affordable housing and reliable infrastructure keeps it an important market statewide.
13. Saxman – 61.5% Home Price Increase Since June 2012
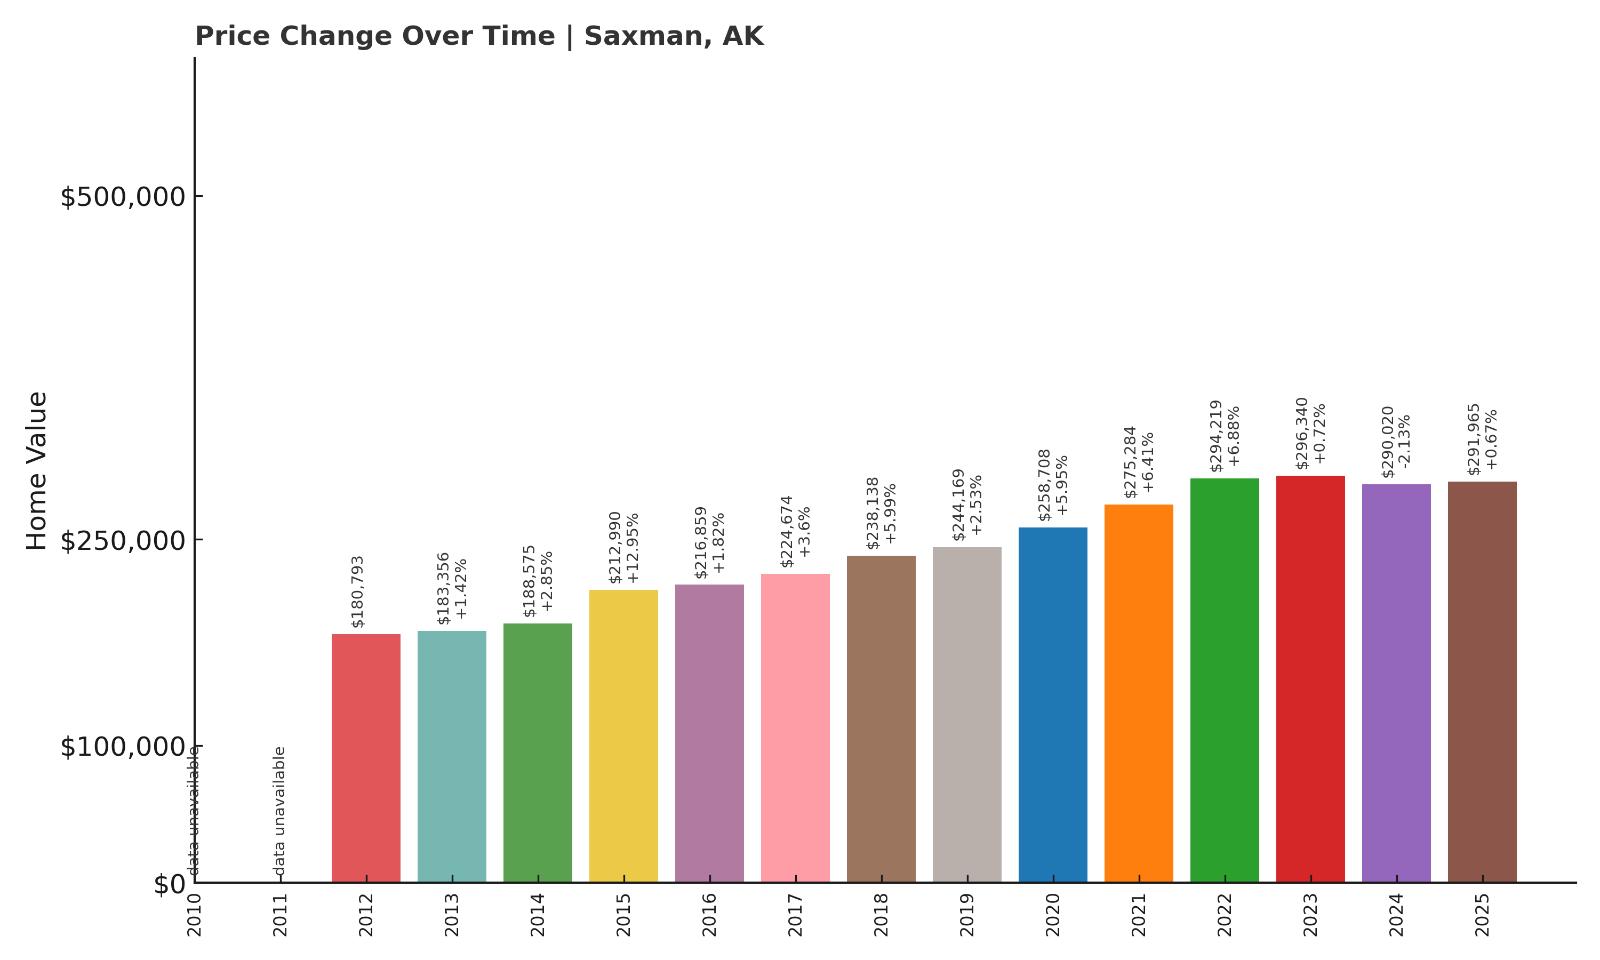
- 2010: N/A
- 2011: N/A
- 2012: $180,793
- 2013: $183,356 (+$2,563, +1.42% from previous year)
- 2014: $188,575 (+$5,219, +2.85% from previous year)
- 2015: $212,990 (+$24,415, +12.95% from previous year)
- 2016: $216,859 (+$3,869, +1.82% from previous year)
- 2017: $224,674 (+$7,815, +3.6% from previous year)
- 2018: $238,138 (+$13,464, +5.99% from previous year)
- 2019: $244,169 (+$6,031, +2.53% from previous year)
- 2020: $258,708 (+$14,539, +5.95% from previous year)
- 2021: $275,284 (+$16,576, +6.41% from previous year)
- 2022: $294,219 (+$18,936, +6.88% from previous year)
- 2023: $296,340 (+$2,121, +0.72% from previous year)
- 2024: $290,020 (-$6,320, -2.13% from previous year)
- 2025: $291,965 (+$1,945, +0.67% from previous year)
Saxman’s home prices have grown 61.5% since 2012, with values hitting $291,965 in 2025. Most of that increase happened in the mid-2010s, with prices leveling off in recent years. The town remains one of the more affordable spots in southeast Alaska.
Saxman – Small Town Next to Ketchikan

Saxman is located just south of Ketchikan and is part of the broader metropolitan area that includes Alaska’s southeastern ferry and cruise gateway. Known for its strong Indigenous culture and historic totem poles, Saxman offers quiet neighborhoods and easy access to nearby amenities.
Its close proximity to Ketchikan has likely helped support home values, while Saxman’s smaller footprint and limited development may explain its slower growth since 2022. It remains one of the more accessible towns for buyers priced out of larger southeast communities.
12. Kasilof – 65.4% Home Price Increase Since June 2010
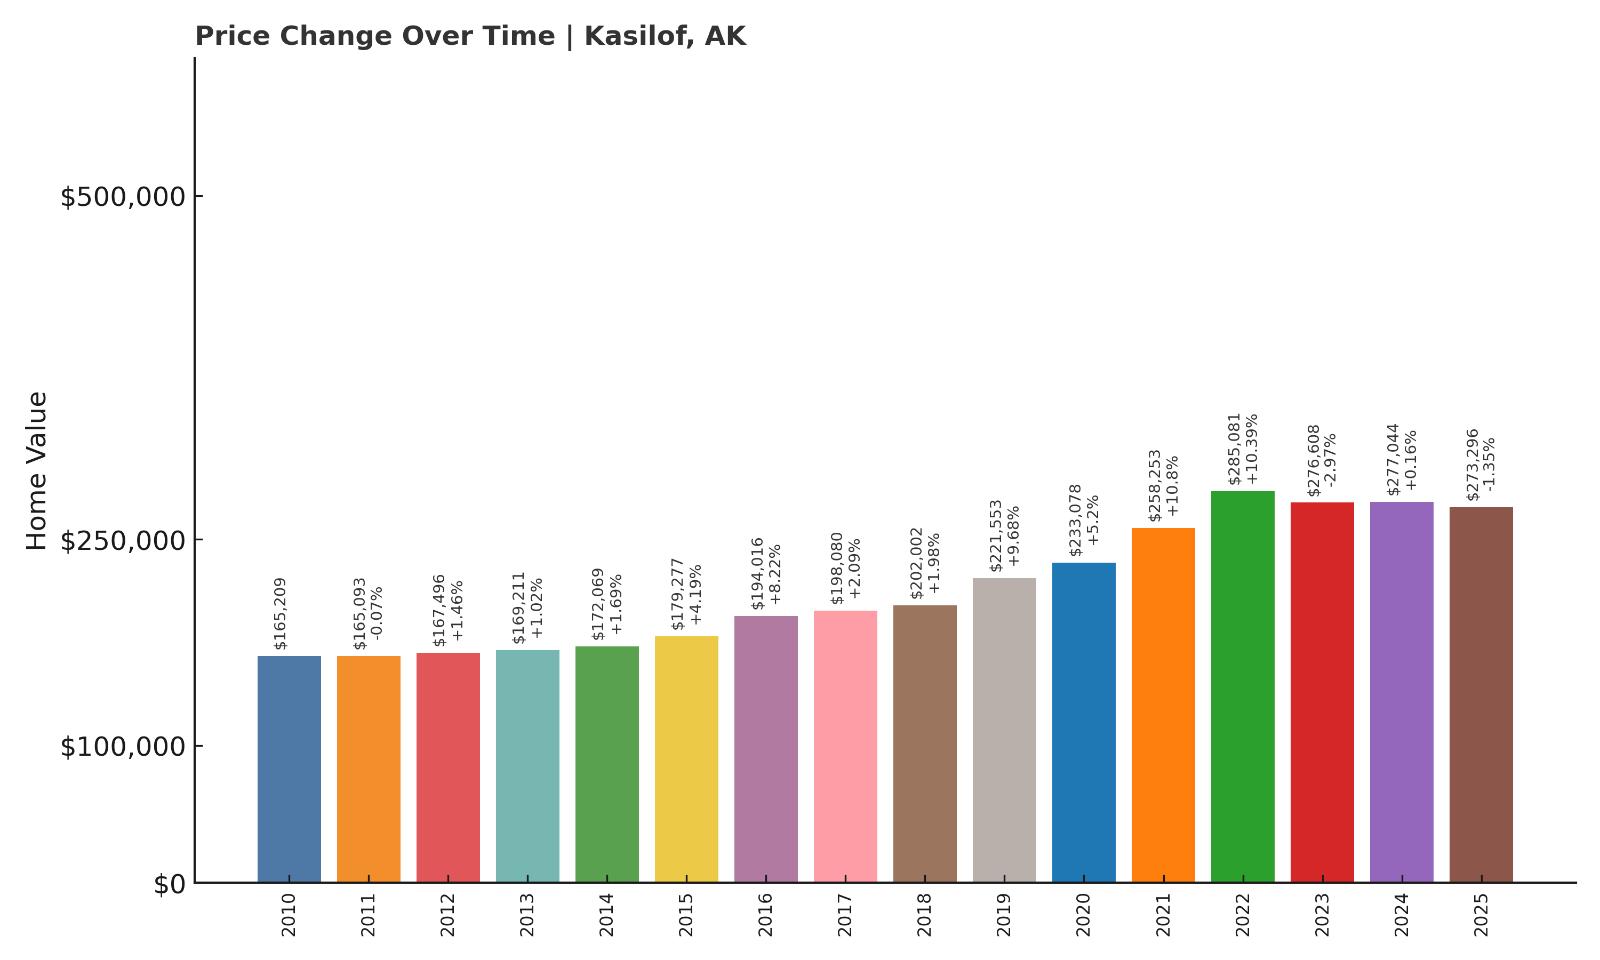
- 2010: $165,209
- 2011: $165,093 (-$116, -0.07% from previous year)
- 2012: $167,496 (+$2,403, +1.46% from previous year)
- 2013: $169,211 (+$1,715, +1.02% from previous year)
- 2014: $172,069 (+$2,858, +1.69% from previous year)
- 2015: $179,277 (+$7,208, +4.19% from previous year)
- 2016: $194,016 (+$14,739, +8.22% from previous year)
- 2017: $198,080 (+$4,064, +2.09% from previous year)
- 2018: $202,002 (+$3,922, +1.98% from previous year)
- 2019: $221,553 (+$19,551, +9.68% from previous year)
- 2020: $233,078 (+$11,525, +5.2% from previous year)
- 2021: $258,253 (+$25,175, +10.8% from previous year)
- 2022: $285,081 (+$26,828, +10.39% from previous year)
- 2023: $276,608 (-$8,473, -2.97% from previous year)
- 2024: $277,044 (+$436, +0.16% from previous year)
- 2025: $273,296 (-$3,748, -1.35% from previous year)
Kasilof’s home values have grown by over 65% since 2010, although prices have softened slightly in the last two years. The town peaked in 2022, and the 2025 figure of $273,296 remains well above historical averages.
Kasilof – River Views and Rural Tranquility

Kasilof sits along the Kasilof River and offers fishing, space, and a quiet pace of life on Alaska’s Kenai Peninsula. While smaller and less developed than nearby towns, its affordability and access to nature have kept demand steady.
Its market saw explosive growth in the early 2020s, before tapering slightly—a trend that mirrors the wider post-pandemic adjustment seen in rural housing markets. For buyers looking to stay near Soldotna or Kenai without paying a premium, Kasilof remains attractive.
11. Seldovia – 42.4% Home Price Increase Since June 2011
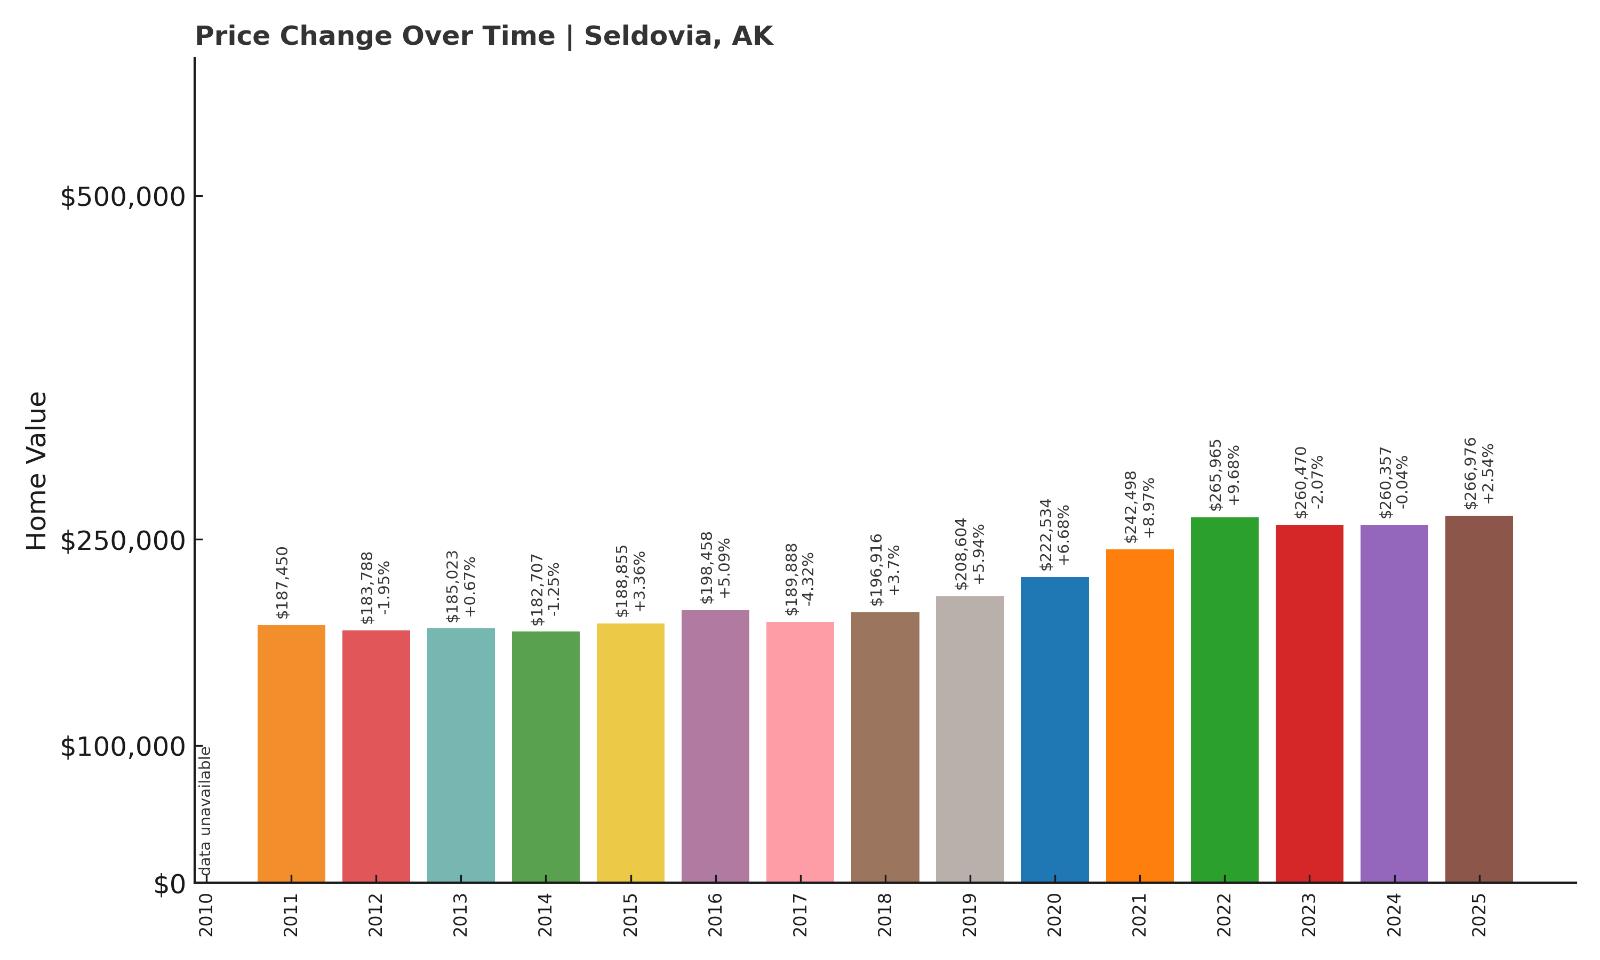
- 2010: N/A
- 2011: $187,450
- 2012: $183,788 (-$3,661, -1.95% from previous year)
- 2013: $185,023 (+$1,235, +0.67% from previous year)
- 2014: $182,707 (-$2,316, -1.25% from previous year)
- 2015: $188,855 (+$6,148, +3.36% from previous year)
- 2016: $198,458 (+$9,603, +5.09% from previous year)
- 2017: $189,888 (-$8,571, -4.32% from previous year)
- 2018: $196,916 (+$7,028, +3.7% from previous year)
- 2019: $208,604 (+$11,688, +5.94% from previous year)
- 2020: $222,534 (+$13,930, +6.68% from previous year)
- 2021: $242,498 (+$19,964, +8.97% from previous year)
- 2022: $265,965 (+$23,468, +9.68% from previous year)
- 2023: $260,470 (-$5,496, -2.07% from previous year)
- 2024: $260,357 (-$113, -0.04% from previous year)
- 2025: $266,976 (+$6,620, +2.54% from previous year)
Seldovia home prices have climbed over 42% since 2011. While recent growth has been slower, prices are back near their peak, reaching $266,976 in 2025 after small fluctuations in the prior two years.
Seldovia – Off the Road System, Big on Charm

Seldovia is accessible only by boat or plane, which helps preserve its low-key character. Located across Kachemak Bay from Homer, the town is known for its boardwalks, harbor views, and strong community ties.
The housing market has seen moderate appreciation, though geographic constraints and limited inventory have kept prices relatively stable. It’s a popular choice for those seeking a quieter, more remote lifestyle without completely leaving services behind.
10. Sutton – 48.8% Home Price Increase Since June 2018
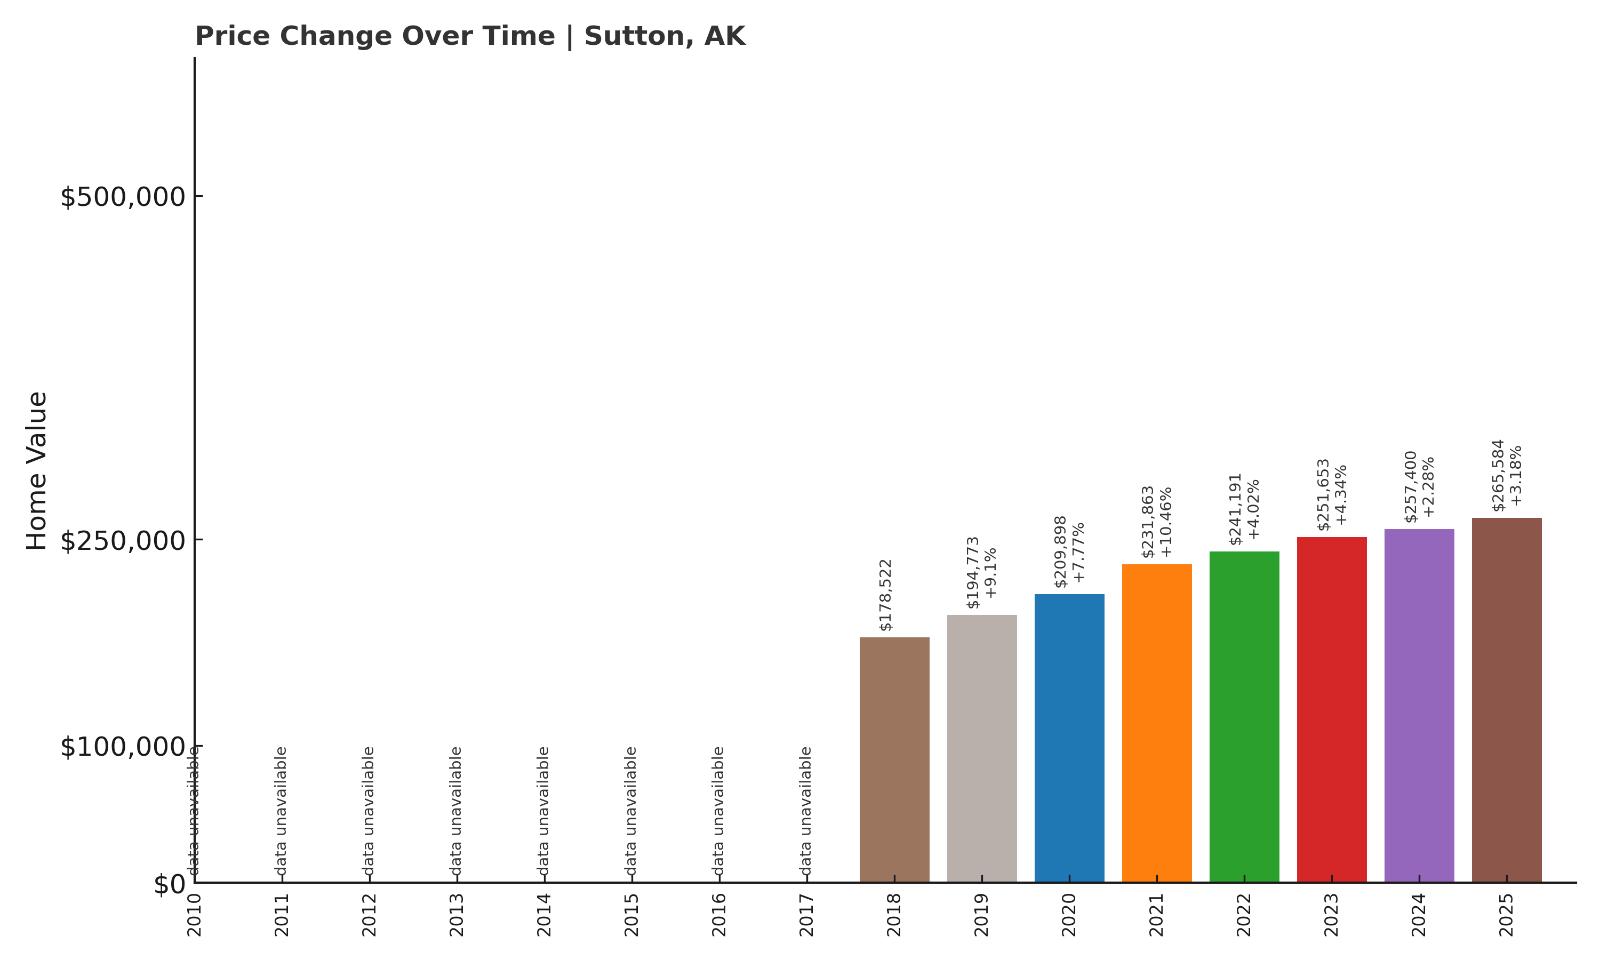
- 2010: N/A
- 2011: N/A
- 2012: N/A
- 2013: N/A
- 2014: N/A
- 2015: N/A
- 2016: N/A
- 2017: N/A
- 2018: $178,522
- 2019: $194,773 (+$16,251, +9.1% from previous year)
- 2020: $209,898 (+$15,125, +7.77% from previous year)
- 2021: $231,863 (+$21,964, +10.46% from previous year)
- 2022: $241,191 (+$9,328, +4.02% from previous year)
- 2023: $251,653 (+$10,462, +4.34% from previous year)
- 2024: $257,400 (+$5,747, +2.28% from previous year)
- 2025: $265,584 (+$8,183, +3.18% from previous year)
Since 2018, home prices in Sutton have jumped by nearly 49%, ending at $265,584 in 2025. Growth has been steady and positive every year, with no down years reported in the available data.
Sutton – Mountain Views and Commuter Appeal

Sutton is located north of Palmer in the Matanuska-Susitna Borough, along the Glenn Highway. It offers incredible mountain scenery and serves as a quieter outpost for those working in Palmer or even Anchorage.
The area’s affordability, access to outdoor recreation, and gradual suburban spillover have likely helped sustain consistent price gains. For buyers looking to stay within commuting distance of bigger job markets, Sutton is a logical—and still budget-friendly—option.
9. Moose Pass – 77.9% Home Price Increase Since June 2012
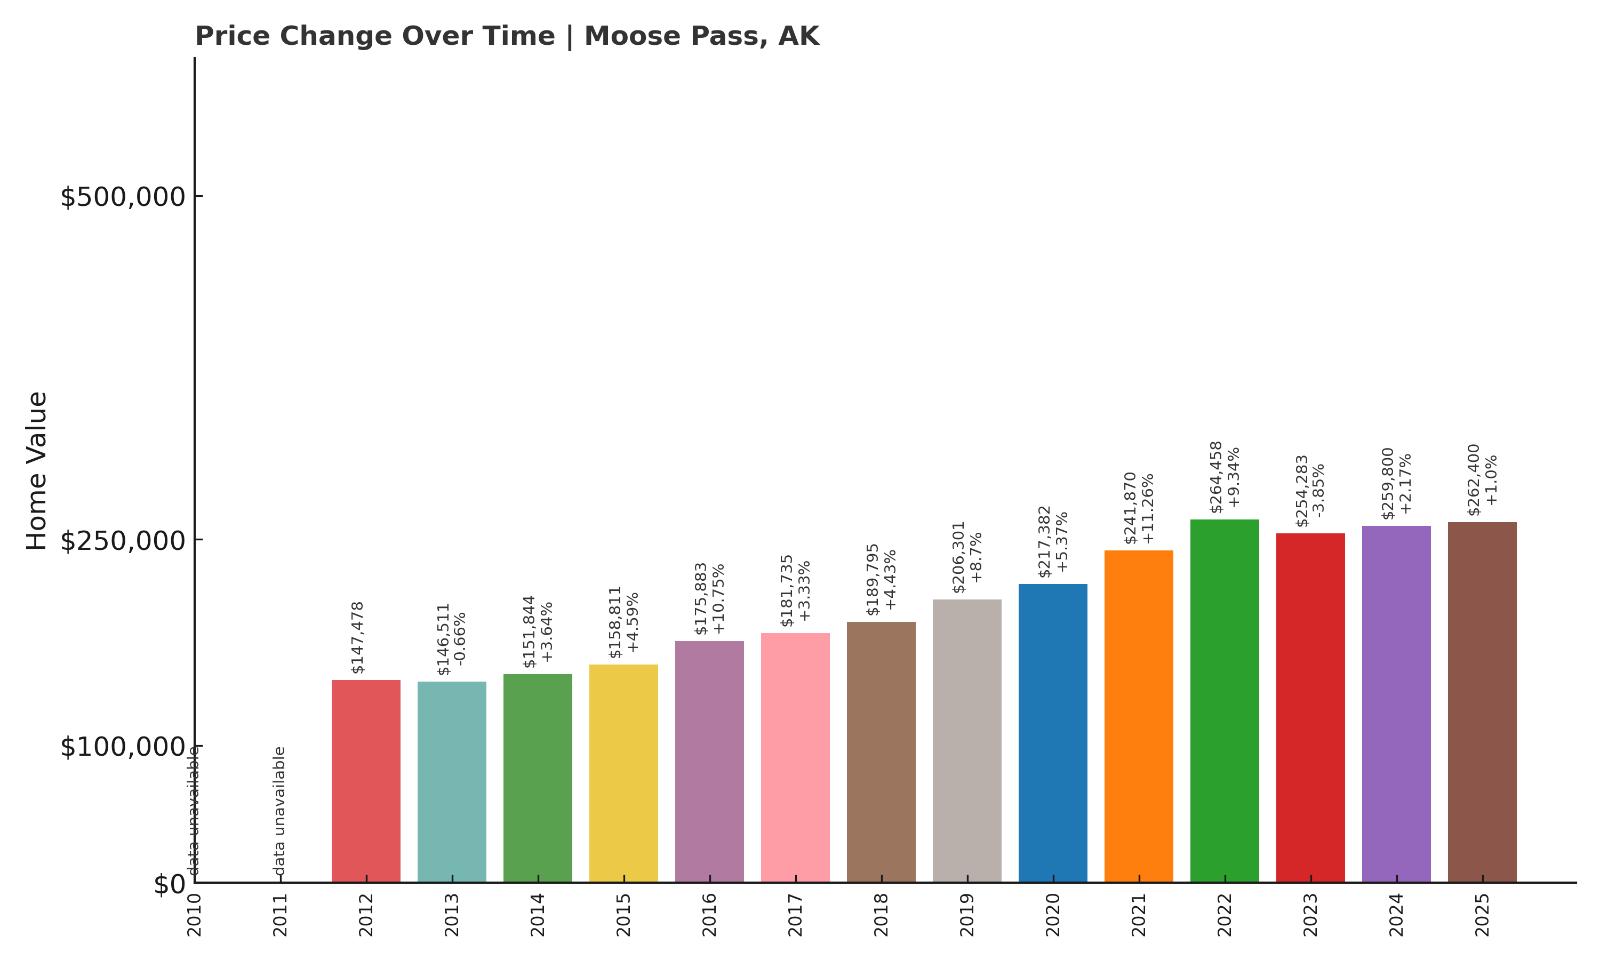
- 2010: N/A
- 2011: N/A
- 2012: $147,478
- 2013: $146,511 (-$967, -0.66% from previous year)
- 2014: $151,844 (+$5,333, +3.64% from previous year)
- 2015: $158,811 (+$6,967, +4.59% from previous year)
- 2016: $175,883 (+$17,071, +10.75% from previous year)
- 2017: $181,735 (+$5,853, +3.33% from previous year)
- 2018: $189,795 (+$8,059, +4.43% from previous year)
- 2019: $206,301 (+$16,506, +8.7% from previous year)
- 2020: $217,382 (+$11,081, +5.37% from previous year)
- 2021: $241,870 (+$24,488, +11.26% from previous year)
- 2022: $264,458 (+$22,588, +9.34% from previous year)
- 2023: $254,283 (-$10,175, -3.85% from previous year)
- 2024: $259,800 (+$5,517, +2.17% from previous year)
- 2025: $262,400 (+$2,600, +1.0% from previous year)
Moose Pass has experienced strong appreciation of nearly 78% since 2012. Home prices cooled slightly after 2022 but resumed modest gains by 2025, finishing at $262,400.
Moose Pass – Glacier Country for Less

Located off the Seward Highway and surrounded by Chugach National Forest, Moose Pass is as scenic as it is secluded. The town’s proximity to Kenai Lake and hiking routes makes it a hidden favorite for outdoor lovers.
Its small size and seasonal economy help keep values in check, though its natural appeal means there’s always some demand. It continues to attract second-home seekers and long-term residents looking for quiet and natural beauty at a reasonable price.
8. Talkeetna – 50.7% Home Price Increase Since June 2018
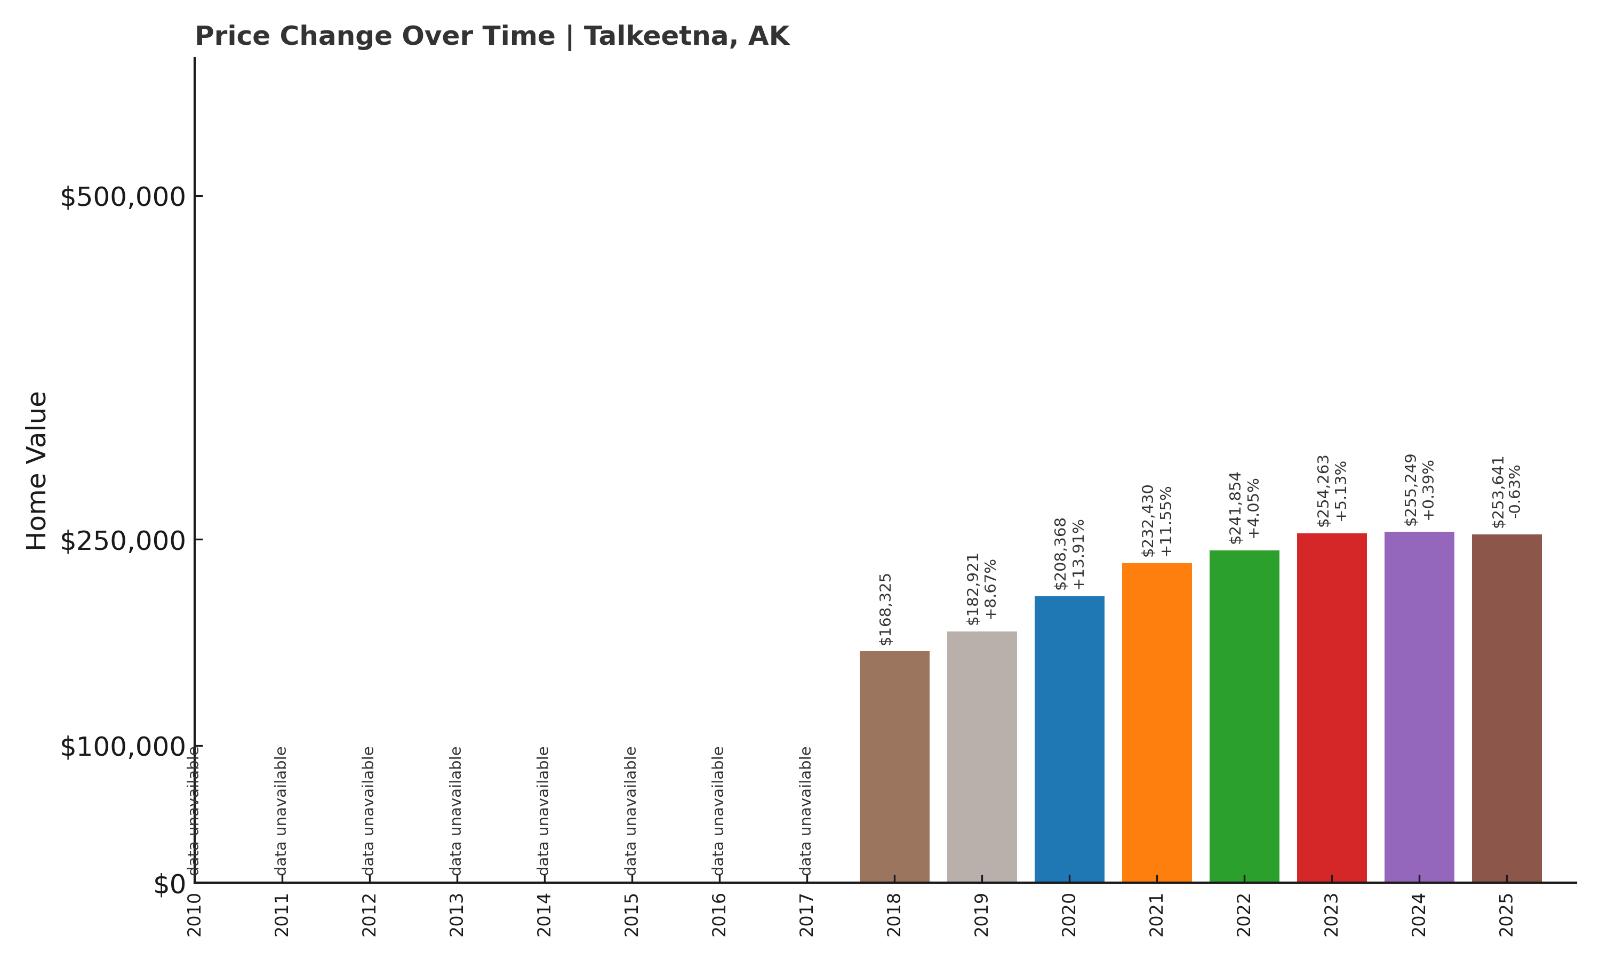
- 2010: N/A
- 2011: N/A
- 2012: N/A
- 2013: N/A
- 2014: N/A
- 2015: N/A
- 2016: N/A
- 2017: N/A
- 2018: $168,325
- 2019: $182,921 (+$14,596, +8.67% from previous year)
- 2020: $208,368 (+$25,447, +13.91% from previous year)
- 2021: $232,430 (+$24,062, +11.55% from previous year)
- 2022: $241,854 (+$9,423, +4.05% from previous year)
- 2023: $254,263 (+$12,409, +5.13% from previous year)
- 2024: $255,249 (+$986, +0.39% from previous year)
- 2025: $253,641 (-$1,608, -0.63% from previous year)
Home prices in Talkeetna rose more than 50% since 2018, peaking in 2024 before a small decline in 2025. The current value of $253,641 reflects a market that has grown steadily, though recent gains have cooled.
Talkeetna – Artsy Outpost with Denali Views

Talkeetna is a quirky, scenic town north of Anchorage and popular with tourists heading toward Denali. Known for its colorful downtown and aviation history, it has a strong creative community and a growing appeal as a lifestyle destination.
The housing market reflects its charm—prices rose quickly from 2020 through 2023, likely due to demand from remote workers and second-home buyers. While values dipped slightly this past year, interest in Talkeetna remains strong for those seeking small-town culture with stunning mountain backdrops.
7. Willow – 71.3% Home Price Increase Since June 2012
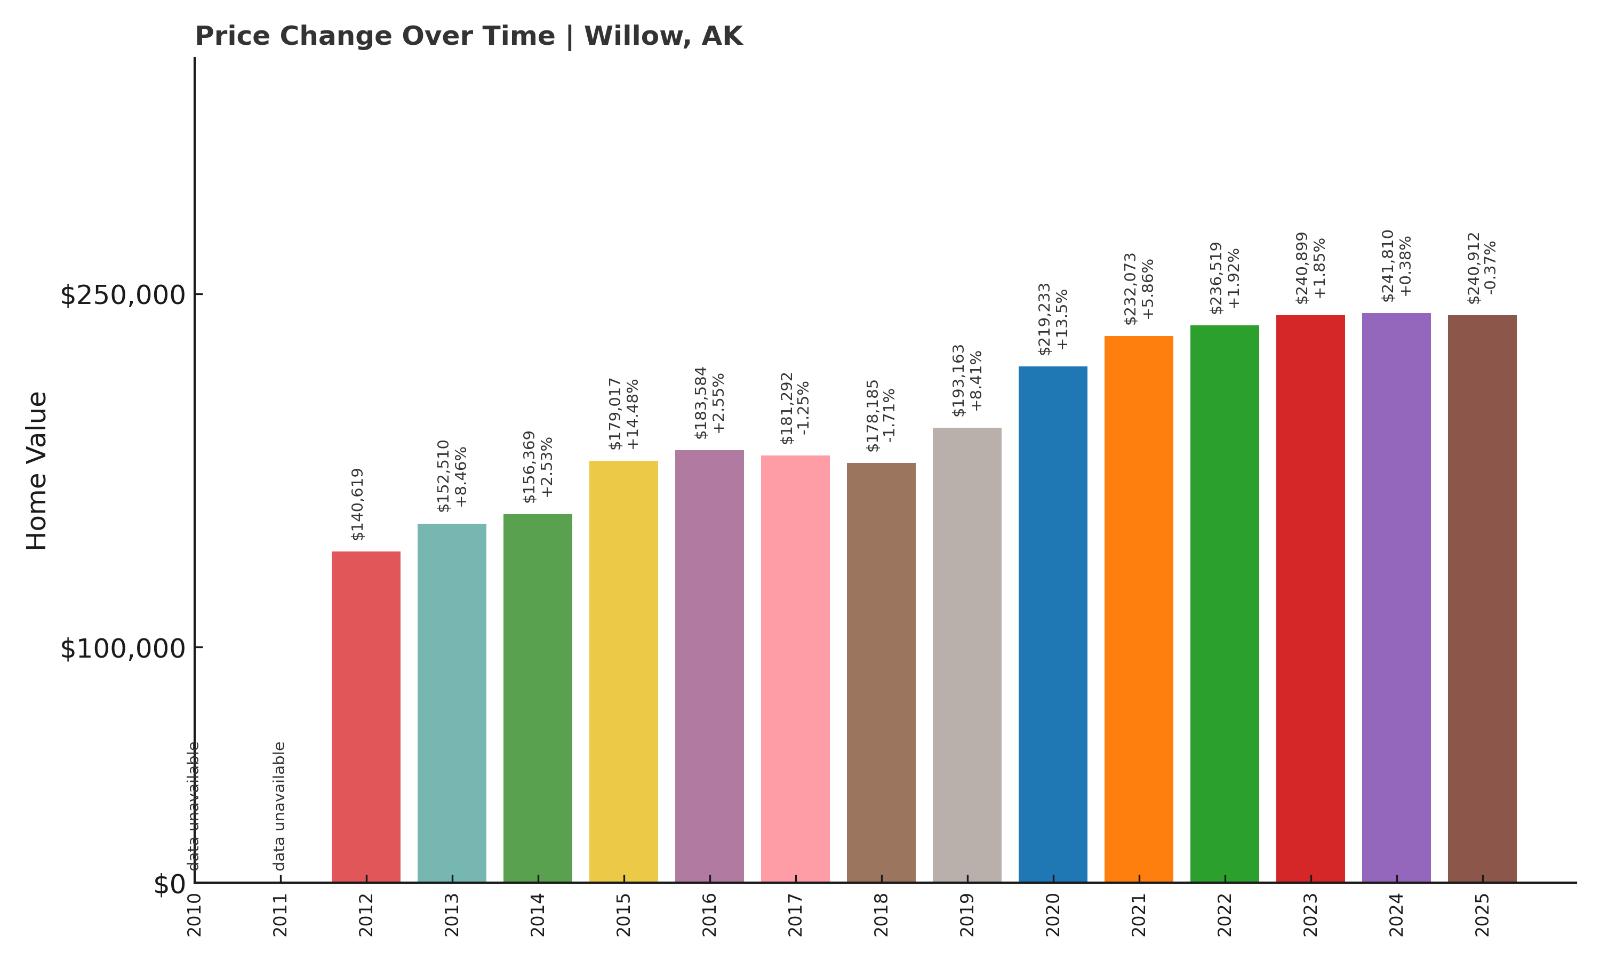
- 2010: N/A
- 2011: N/A
- 2012: $140,619
- 2013: $152,510 (+$11,891, +8.46% from previous year)
- 2014: $156,369 (+$3,859, +2.53% from previous year)
- 2015: $179,017 (+$22,648, +14.48% from previous year)
- 2016: $183,584 (+$4,567, +2.55% from previous year)
- 2017: $181,292 (-$2,292, -1.25% from previous year)
- 2018: $178,185 (-$3,107, -1.71% from previous year)
- 2019: $193,163 (+$14,979, +8.41% from previous year)
- 2020: $219,233 (+$26,070, +13.5% from previous year)
- 2021: $232,073 (+$12,840, +5.86% from previous year)
- 2022: $236,519 (+$4,445, +1.92% from previous year)
- 2023: $240,899 (+$4,380, +1.85% from previous year)
- 2024: $241,810 (+$911, +0.38% from previous year)
- 2025: $240,912 (-$898, -0.37% from previous year)
Willow’s home prices have increased by more than 71% since 2012. After a particularly strong rise between 2019 and 2021, growth has slowed and slightly reversed by 2025, with current values at $240,912.
Willow – Cabin Country Near the Parks Highway

Willow is popular for its recreational cabins, off-grid living, and access to fishing and trails. Located about 70 miles north of Anchorage, it’s close enough for weekend trips but far enough for peace and quiet.
As more buyers sought solitude during the pandemic, Willow saw notable price growth. Though the market has cooled, the area still offers affordability with big-lot properties and access to Alaska’s wild heartland.
6. Anchor Point – 57.3% Home Price Increase Since June 2010
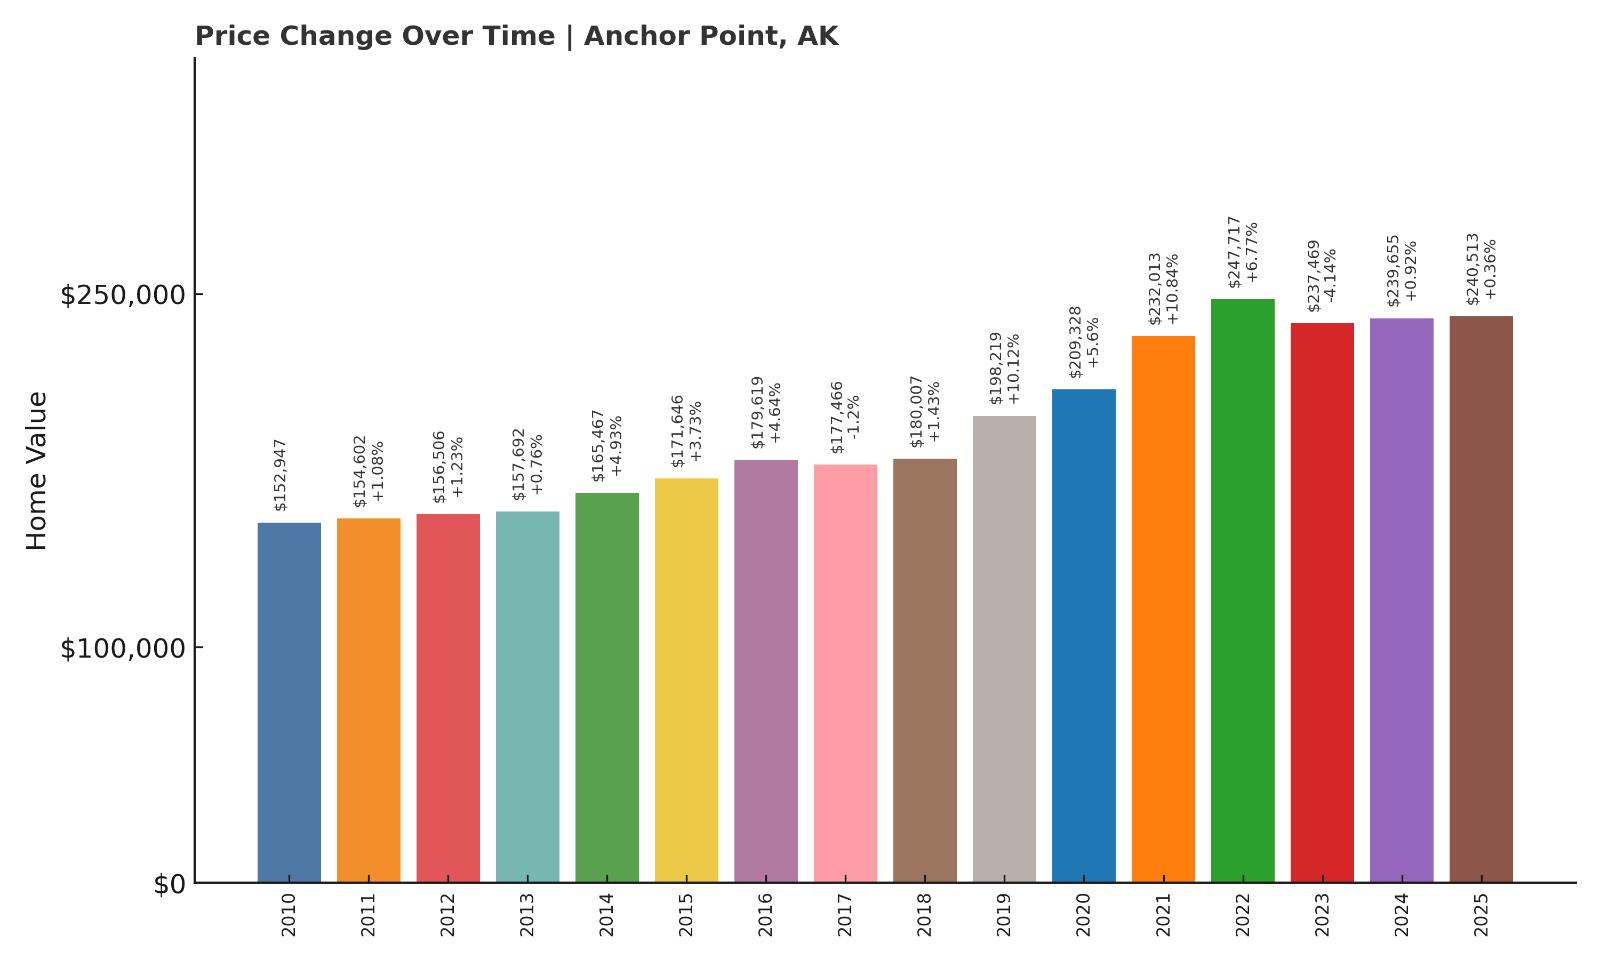
- 2010: $152,947
- 2011: $154,602 (+$1,655, +1.08% from previous year)
- 2012: $156,506 (+$1,904, +1.23% from previous year)
- 2013: $157,692 (+$1,186, +0.76% from previous year)
- 2014: $165,467 (+$7,774, +4.93% from previous year)
- 2015: $171,646 (+$6,180, +3.73% from previous year)
- 2016: $179,619 (+$7,972, +4.64% from previous year)
- 2017: $177,466 (-$2,153, -1.2% from previous year)
- 2018: $180,007 (+$2,541, +1.43% from previous year)
- 2019: $198,219 (+$18,212, +10.12% from previous year)
- 2020: $209,328 (+$11,109, +5.6% from previous year)
- 2021: $232,013 (+$22,684, +10.84% from previous year)
- 2022: $247,717 (+$15,704, +6.77% from previous year)
- 2023: $237,469 (-$10,248, -4.14% from previous year)
- 2024: $239,655 (+$2,185, +0.92% from previous year)
- 2025: $240,513 (+$858, +0.36% from previous year)
Anchor Point prices have climbed over 57% since 2010, but growth has slowed in recent years. The market peaked in 2022 and has hovered near that level since, ending 2025 at $240,513.
Anchor Point – Where the Road Ends (and the Fishing Begins)

As the westernmost point on the U.S. highway system, Anchor Point is a small community known for halibut fishing and off-the-beaten-path living. It’s located north of Homer and offers affordability and big views of Cook Inlet.
While it saw brisk price appreciation during the early 2020s, the market has since stabilized. Anchor Point remains a budget-friendly option for those willing to live a bit more rugged and remote.
5. Fox River – 57.9% Home Price Increase Since June 2012
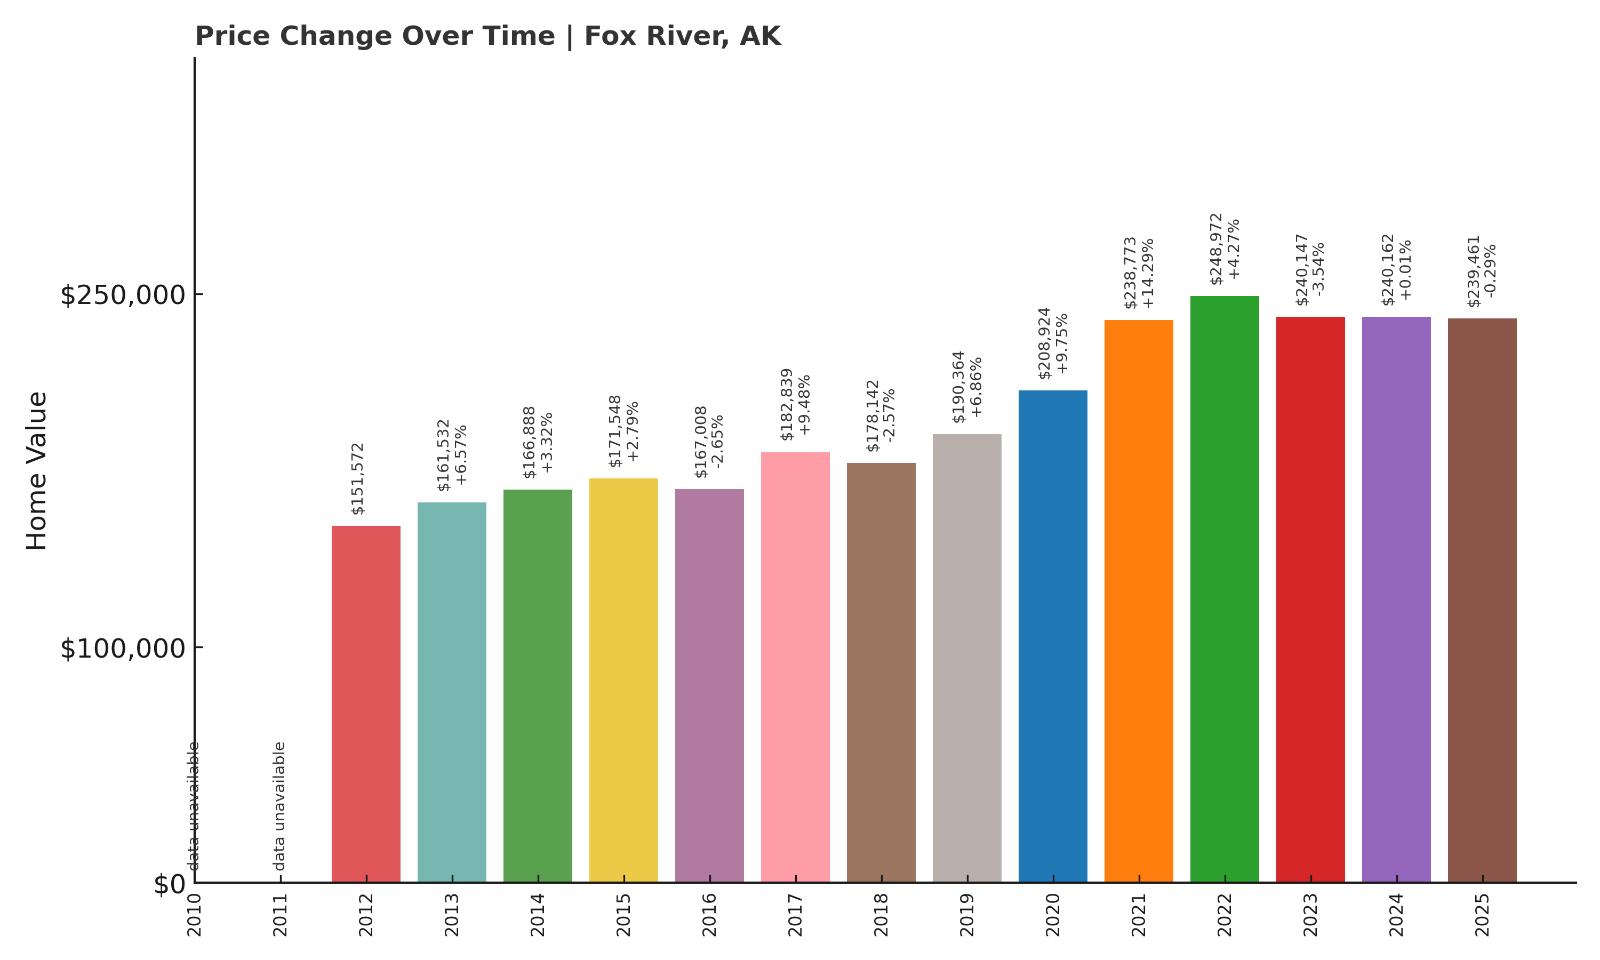
- 2010: N/A
- 2011: N/A
- 2012: $151,572
- 2013: $161,532 (+$9,960, +6.57% from previous year)
- 2014: $166,888 (+$5,357, +3.32% from previous year)
- 2015: $171,548 (+$4,659, +2.79% from previous year)
- 2016: $167,008 (-$4,539, -2.65% from previous year)
- 2017: $182,839 (+$15,830, +9.48% from previous year)
- 2018: $178,142 (-$4,696, -2.57% from previous year)
- 2019: $190,364 (+$12,222, +6.86% from previous year)
- 2020: $208,924 (+$18,560, +9.75% from previous year)
- 2021: $238,773 (+$29,849, +14.29% from previous year)
- 2022: $248,972 (+$10,200, +4.27% from previous year)
- 2023: $240,147 (-$8,825, -3.54% from previous year)
- 2024: $240,162 (+$15, +0.01% from previous year)
- 2025: $239,461 (-$701, -0.29% from previous year)
Home prices in Fox River have grown nearly 58% since 2012, though the market appears to have hit a plateau. After peaking in 2022, prices have hovered in the $239K–$248K range.
Fox River – Off-Grid and Affordable

Located east of Homer at the end of the road system, Fox River is mostly undeveloped land with scattered cabins and homesteads. It’s ideal for buyers seeking independence, seclusion, and low property costs.
The market here is unique—prices rise with interest in rural living, but swing down just as fast with reduced demand or tighter lending conditions. That said, Fox River remains one of the least expensive towns in Alaska in 2025.
4. Clam Gulch – 58.3% Home Price Increase Since June 2012
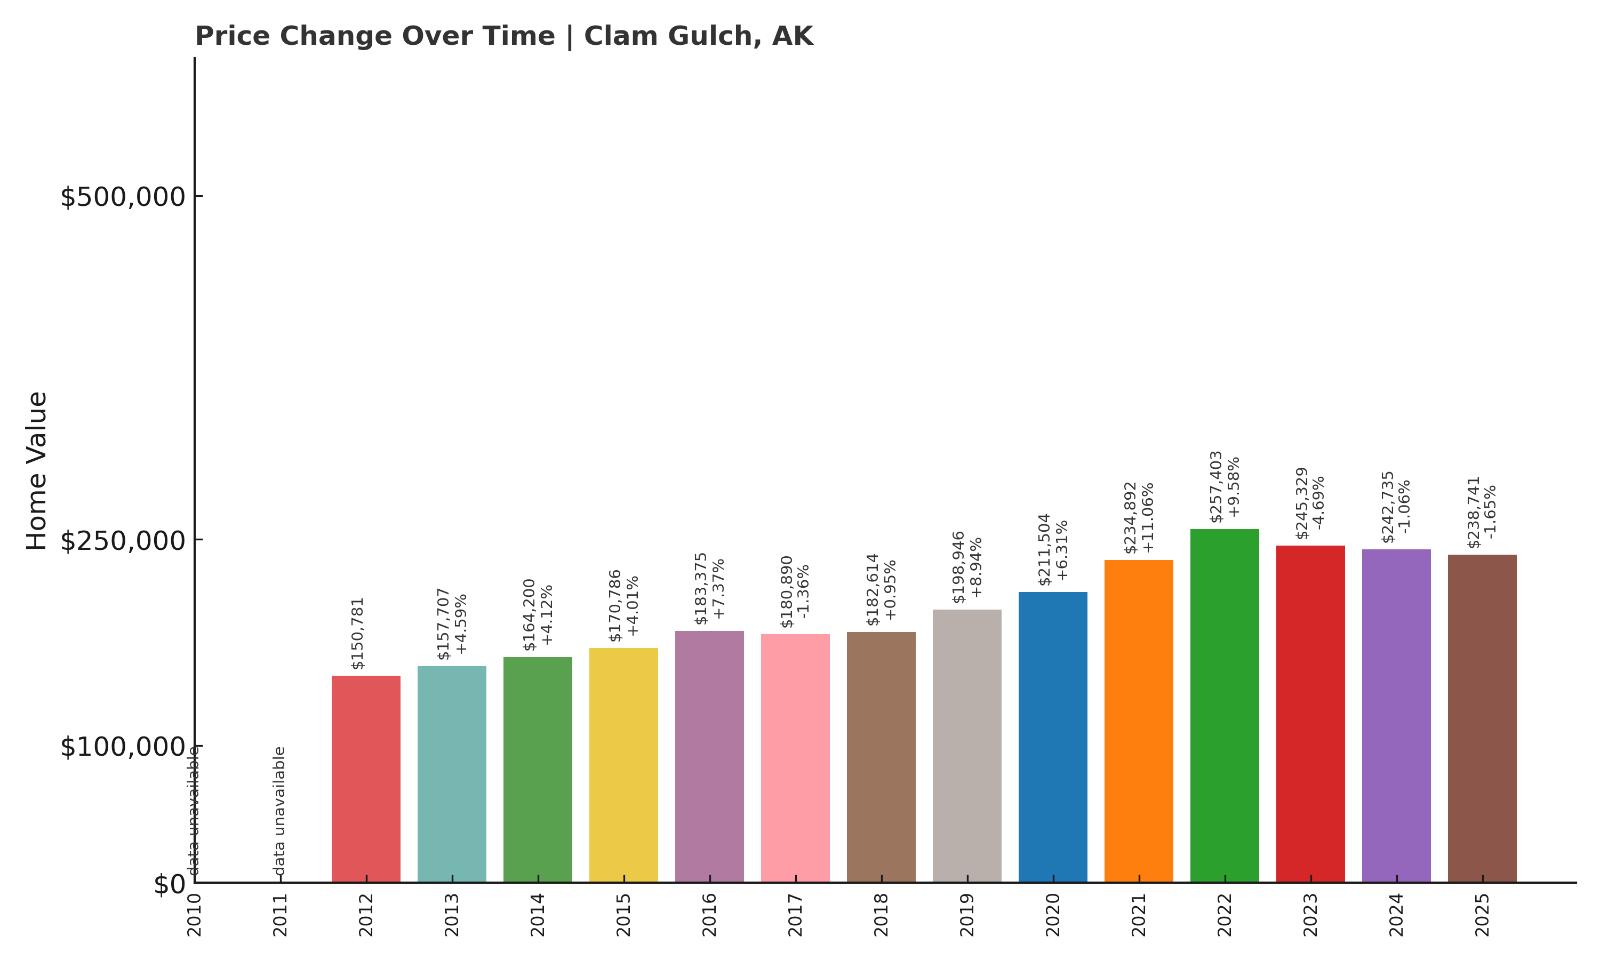
- 2010: N/A
- 2011: N/A
- 2012: $150,781
- 2013: $157,707 (+$6,926, +4.59% from previous year)
- 2014: $164,200 (+$6,493, +4.12% from previous year)
- 2015: $170,786 (+$6,586, +4.01% from previous year)
- 2016: $183,375 (+$12,589, +7.37% from previous year)
- 2017: $180,890 (-$2,485, -1.36% from previous year)
- 2018: $182,614 (+$1,724, +0.95% from previous year)
- 2019: $198,946 (+$16,332, +8.94% from previous year)
- 2020: $211,504 (+$12,558, +6.31% from previous year)
- 2021: $234,892 (+$23,388, +11.06% from previous year)
- 2022: $257,403 (+$22,511, +9.58% from previous year)
- 2023: $245,329 (-$12,074, -4.69% from previous year)
- 2024: $242,735 (-$2,594, -1.06% from previous year)
- 2025: $238,741 (-$3,994, -1.65% from previous year)
Clam Gulch home values rose more than 58% over the last decade, with the biggest gains from 2016 to 2022. Prices have declined slightly since then, dropping to $238,741 in 2025.
Clam Gulch – Bluffs, Beaches, and Budget Homes

Clam Gulch sits along the western edge of the Kenai Peninsula and is known for its beach access and long views across Cook Inlet. Though the clamming itself has been suspended, the town still draws people seeking quiet, coastal living.
Most homes are small cabins or seasonal-use dwellings, which helps keep the market affordable. It’s a niche market, but one that still has room to grow if infrastructure expands or tourism returns more strongly.
3. Hope – 92.3% Home Price Increase Since June 2012
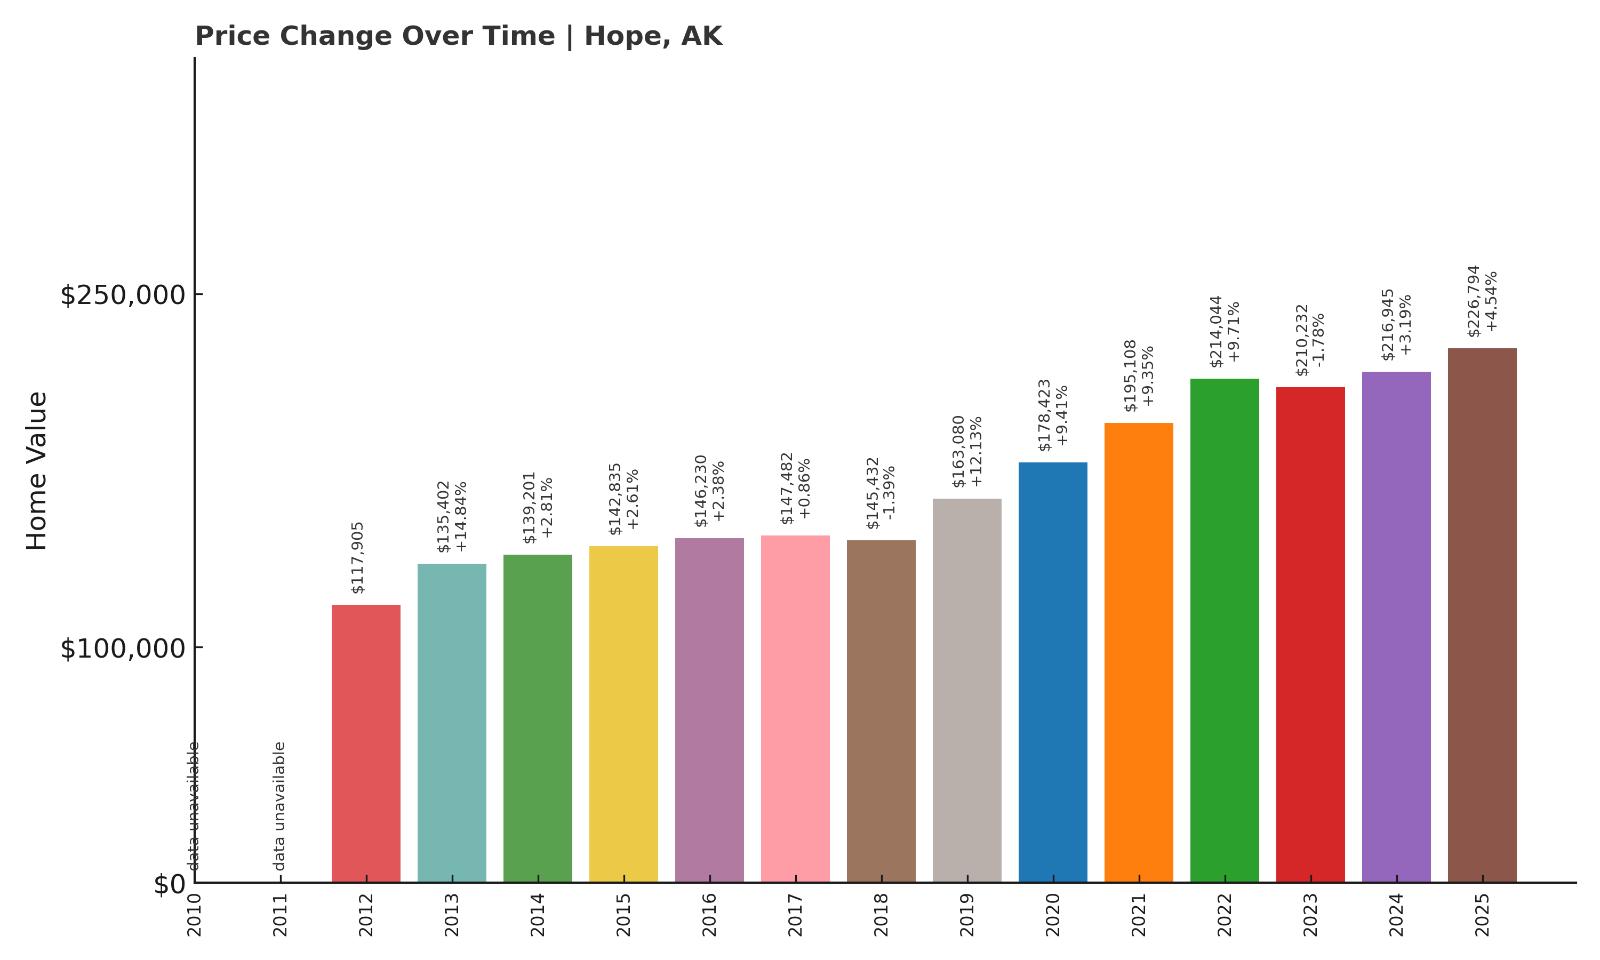
- 2010: N/A
- 2011: N/A
- 2012: $117,905
- 2013: $135,402 (+$17,496, +14.84% from previous year)
- 2014: $139,201 (+$3,799, +2.81% from previous year)
- 2015: $142,835 (+$3,635, +2.61% from previous year)
- 2016: $146,230 (+$3,395, +2.38% from previous year)
- 2017: $147,482 (+$1,252, +0.86% from previous year)
- 2018: $145,432 (-$2,050, -1.39% from previous year)
- 2019: $163,080 (+$17,648, +12.13% from previous year)
- 2020: $178,423 (+$15,343, +9.41% from previous year)
- 2021: $195,108 (+$16,686, +9.35% from previous year)
- 2022: $214,044 (+$18,936, +9.71% from previous year)
- 2023: $210,232 (-$3,812, -1.78% from previous year)
- 2024: $216,945 (+$6,713, +3.19% from previous year)
- 2025: $226,794 (+$9,849, +4.54% from previous year)
Hope’s home prices have increased 92.3% since 2012, with some of the sharpest jumps occurring between 2019 and 2022. After a brief dip in 2023, prices resumed climbing, reaching $226,794 in 2025.
Hope – Historic Hamlet with Steady Growth

Tucked at the end of the Seward Highway on the Turnagain Arm, Hope is one of Alaska’s oldest communities. Once a mining boomtown, it now draws visitors for its log cabins, river fishing, and peaceful setting far from city noise.
Its housing market reflects growing interest over the past decade, particularly during the pandemic when remote and rural living gained appeal. Despite limited inventory and seasonal access challenges, Hope’s charm and proximity to Anchorage have helped it steadily gain in value.
2. Salcha – 33.2% Home Price Increase Since June 2012
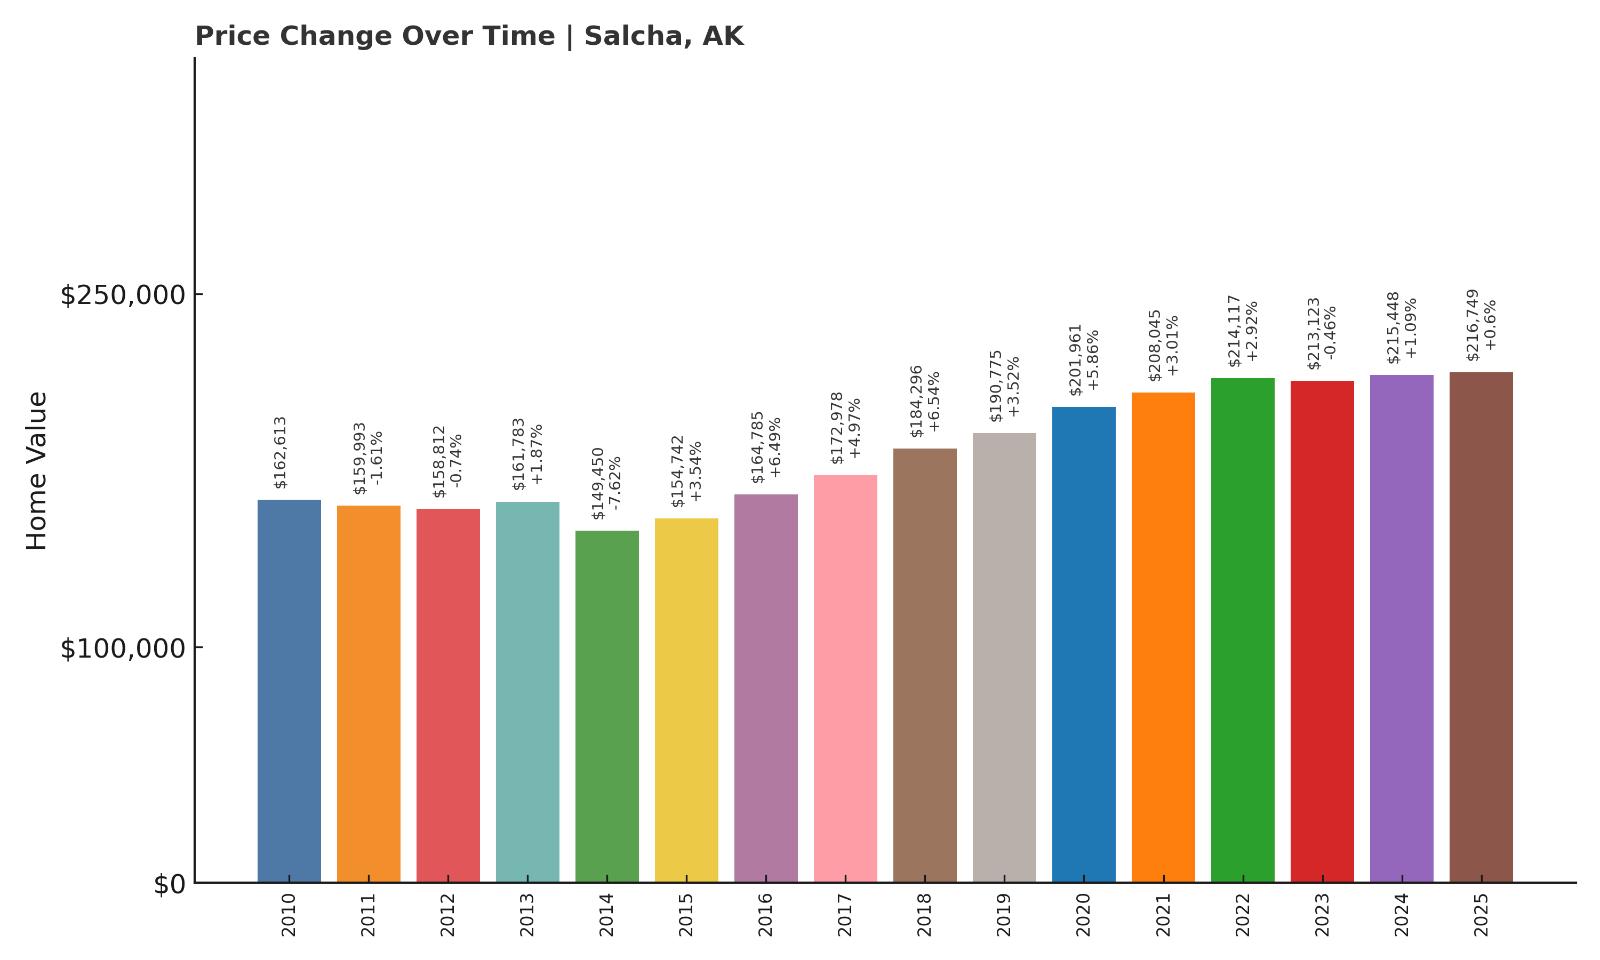
- 2010: $162,613
- 2011: $159,993 (-$2,621, -1.61% from previous year)
- 2012: $158,812 (-$1,180, -0.74% from previous year)
- 2013: $161,783 (+$2,971, +1.87% from previous year)
- 2014: $149,450 (-$12,333, -7.62% from previous year)
- 2015: $154,742 (+$5,292, +3.54% from previous year)
- 2016: $164,785 (+$10,043, +6.49% from previous year)
- 2017: $172,978 (+$8,194, +4.97% from previous year)
- 2018: $184,296 (+$11,318, +6.54% from previous year)
- 2019: $190,775 (+$6,479, +3.52% from previous year)
- 2020: $201,961 (+$11,186, +5.86% from previous year)
- 2021: $208,045 (+$6,084, +3.01% from previous year)
- 2022: $214,117 (+$6,072, +2.92% from previous year)
- 2023: $213,123 (-$994, -0.46% from previous year)
- 2024: $215,448 (+$2,324, +1.09% from previous year)
- 2025: $216,749 (+$1,301, +0.6% from previous year)
Salcha has seen a modest but steady rise in home prices over the last decade, growing 33.2% since 2012. Despite some minor dips along the way, 2025’s average home value stands at $216,749.
Salcha – Budget-Friendly Rural Life Near Fairbanks

Situated southeast of Fairbanks along the Tanana River, Salcha offers quiet living with access to both wilderness and major infrastructure. It’s also close to Eielson Air Force Base, which supports local demand for housing.
While price increases have been moderate, the area’s affordability and open space continue to attract buyers looking to escape city prices. Its consistency and low volatility make it one of Alaska’s more stable affordable markets.
1. Ninilchik – 37.8% Home Price Increase Since June 2012
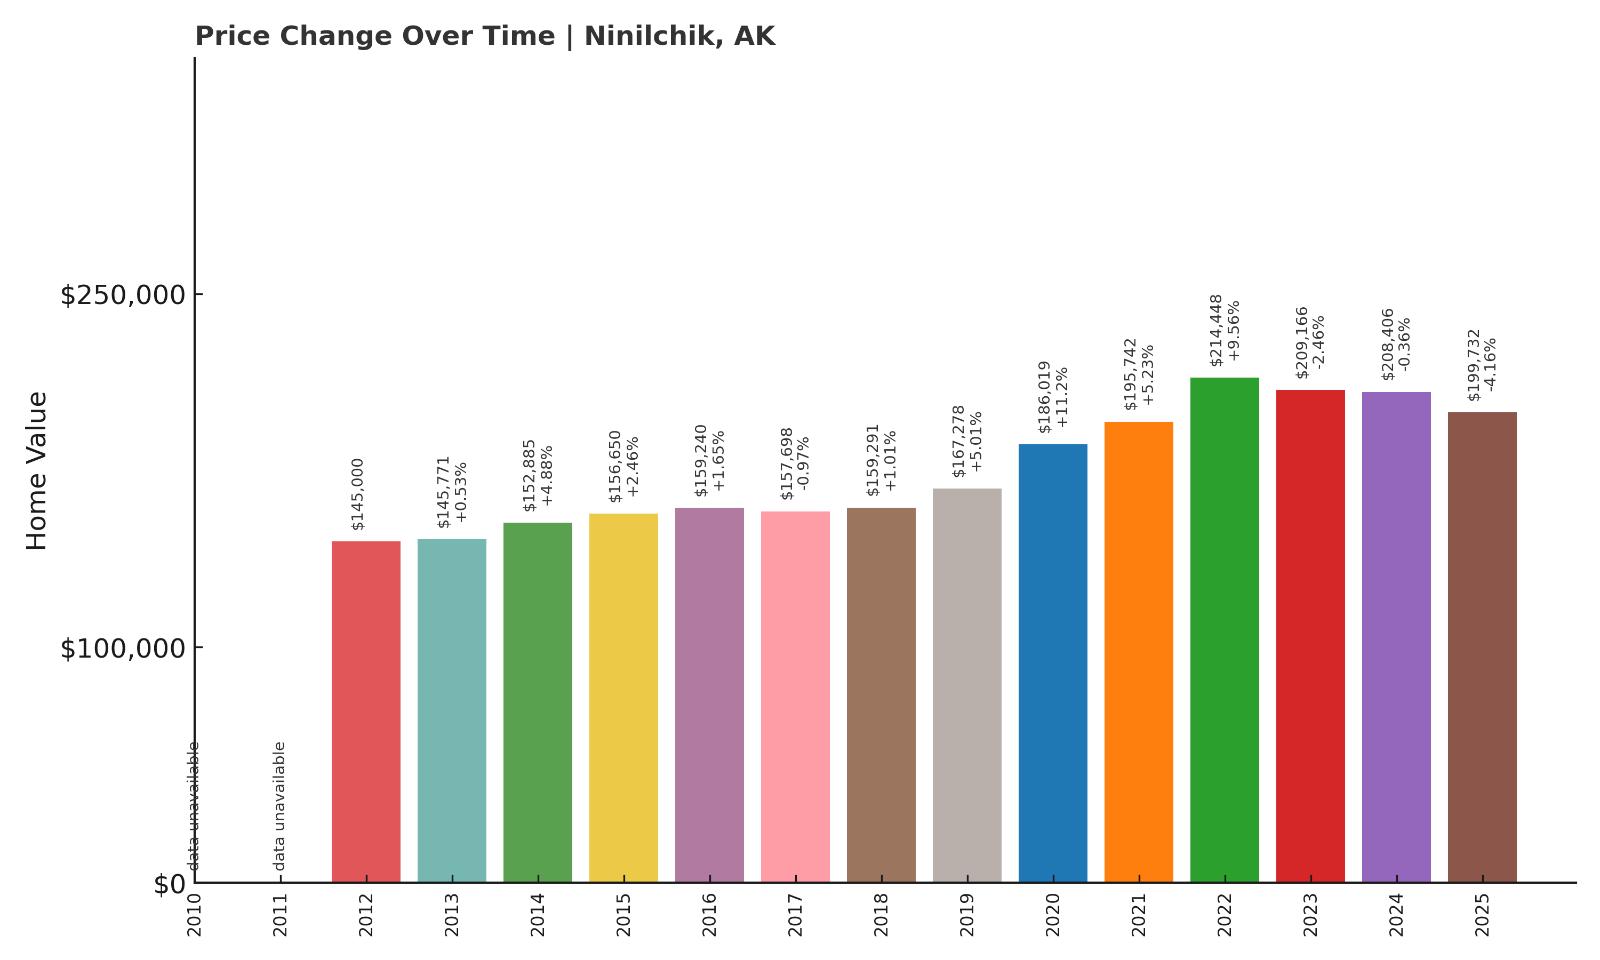
- 2010: N/A
- 2011: N/A
- 2012: $145,000
- 2013: $145,771 (+$771, +0.53% from previous year)
- 2014: $152,885 (+$7,114, +4.88% from previous year)
- 2015: $156,650 (+$3,765, +2.46% from previous year)
- 2016: $159,240 (+$2,590, +1.65% from previous year)
- 2017: $157,698 (-$1,541, -0.97% from previous year)
- 2018: $159,291 (+$1,593, +1.01% from previous year)
- 2019: $167,278 (+$7,986, +5.01% from previous year)
- 2020: $186,019 (+$18,741, +11.2% from previous year)
- 2021: $195,742 (+$9,723, +5.23% from previous year)
- 2022: $214,448 (+$18,706, +9.56% from previous year)
- 2023: $209,166 (-$5,282, -2.46% from previous year)
- 2024: $208,406 (-$760, -0.36% from previous year)
- 2025: $199,732 (-$8,674, -4.16% from previous year)
Ninilchik saw a total home price increase of 37.8% since 2012, with prices peaking in 2022 before declining over the past three years. By 2025, values had dipped to $199,732—still above pre-2020 levels, but softening.
Ninilchik – Affordable Coastal Living on the Kenai Peninsula

Ninilchik is a historic fishing village on the western edge of the Kenai Peninsula, popular for its scenic views, salmon runs, and relaxed pace. It retains its small-town feel with a mix of older homes, cabins, and seasonal properties.
Home prices rose quickly from 2020 to 2022 but have cooled off since then. Despite the recent drop, it remains the least expensive town in Alaska as of June 2025—an appealing option for buyers looking for affordability and coastal access.