🔥 Would you like to save this?
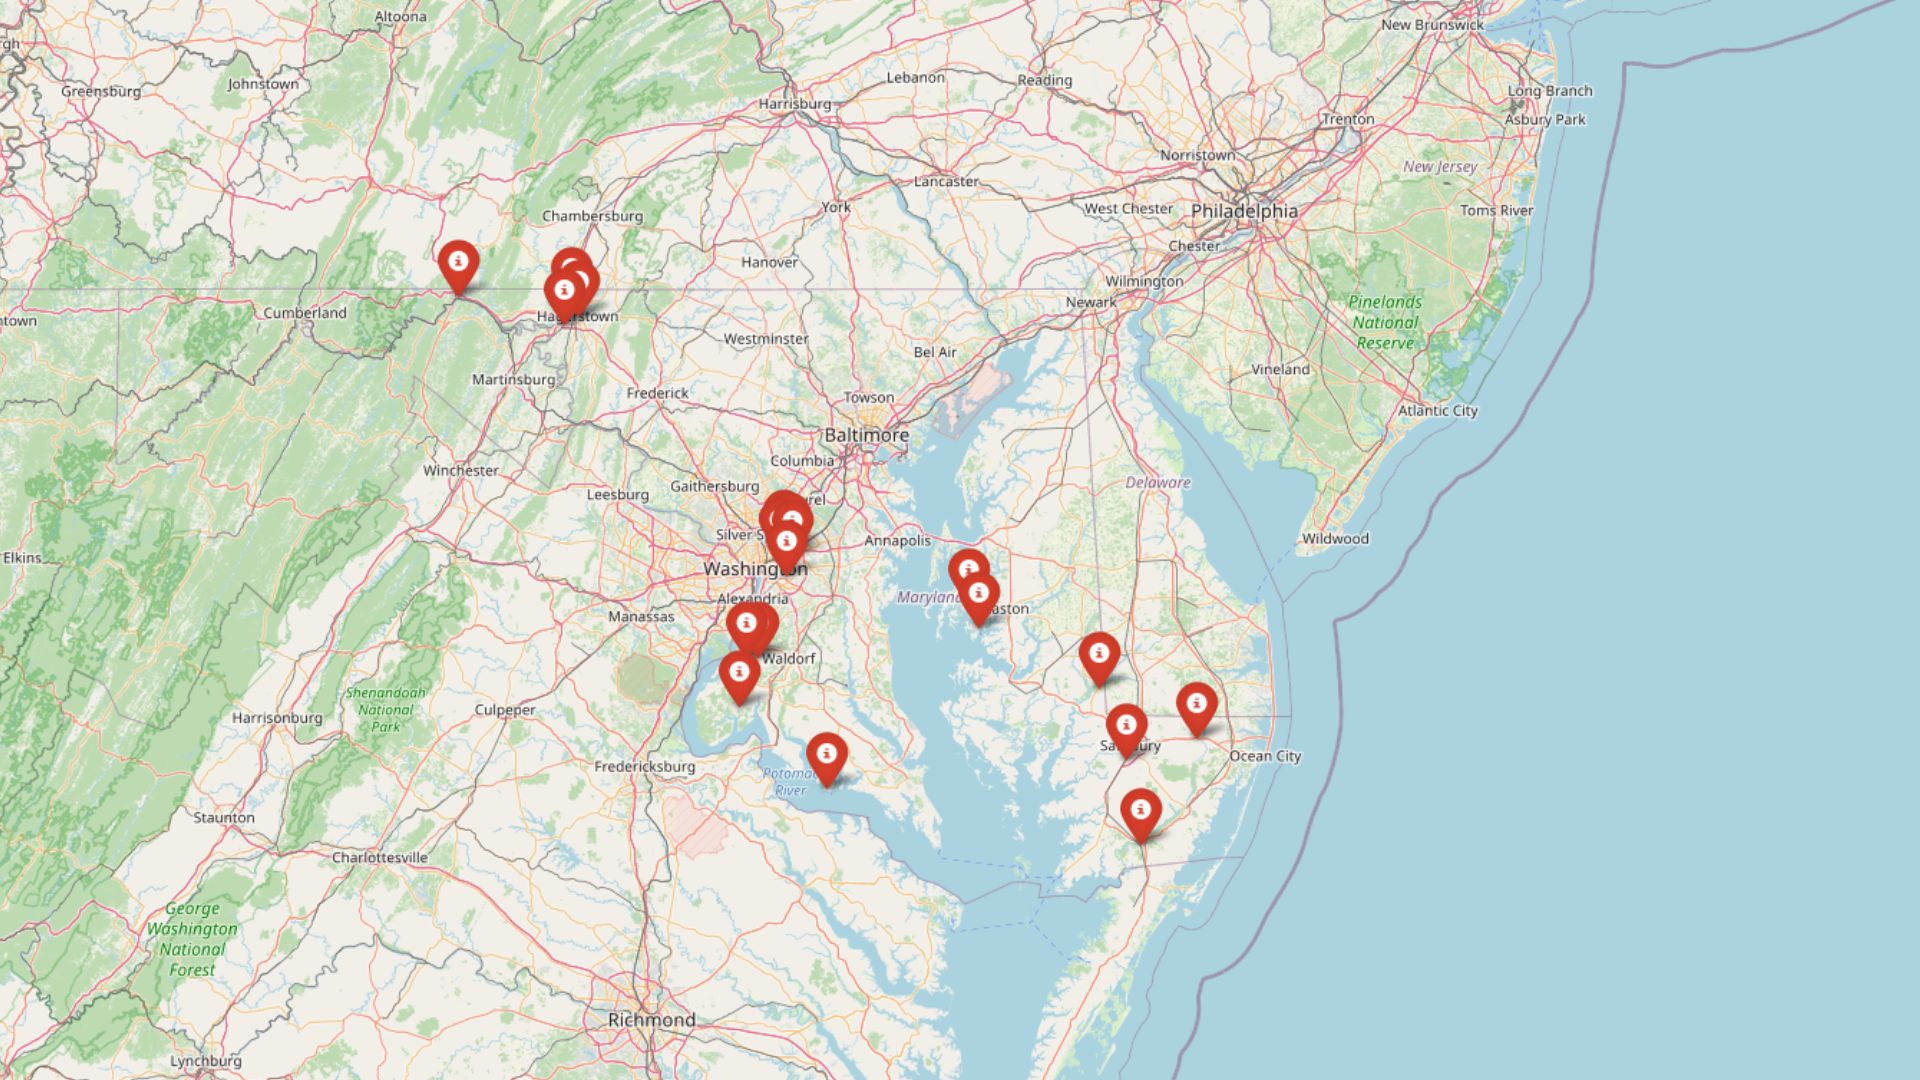
Not every property boom in Maryland is built to last. Using the Zillow Home Values Index, analysts have pinpointed 20 towns showing troubling signs that a price correction could be looming. These communities share key warning signals: home values stretched far above historical trends, heavy price volatility, and market patterns that echo past crashes. Whether you’re planning to buy, invest, or wait it out, knowing where markets look unstable could help you avoid costly surprises.
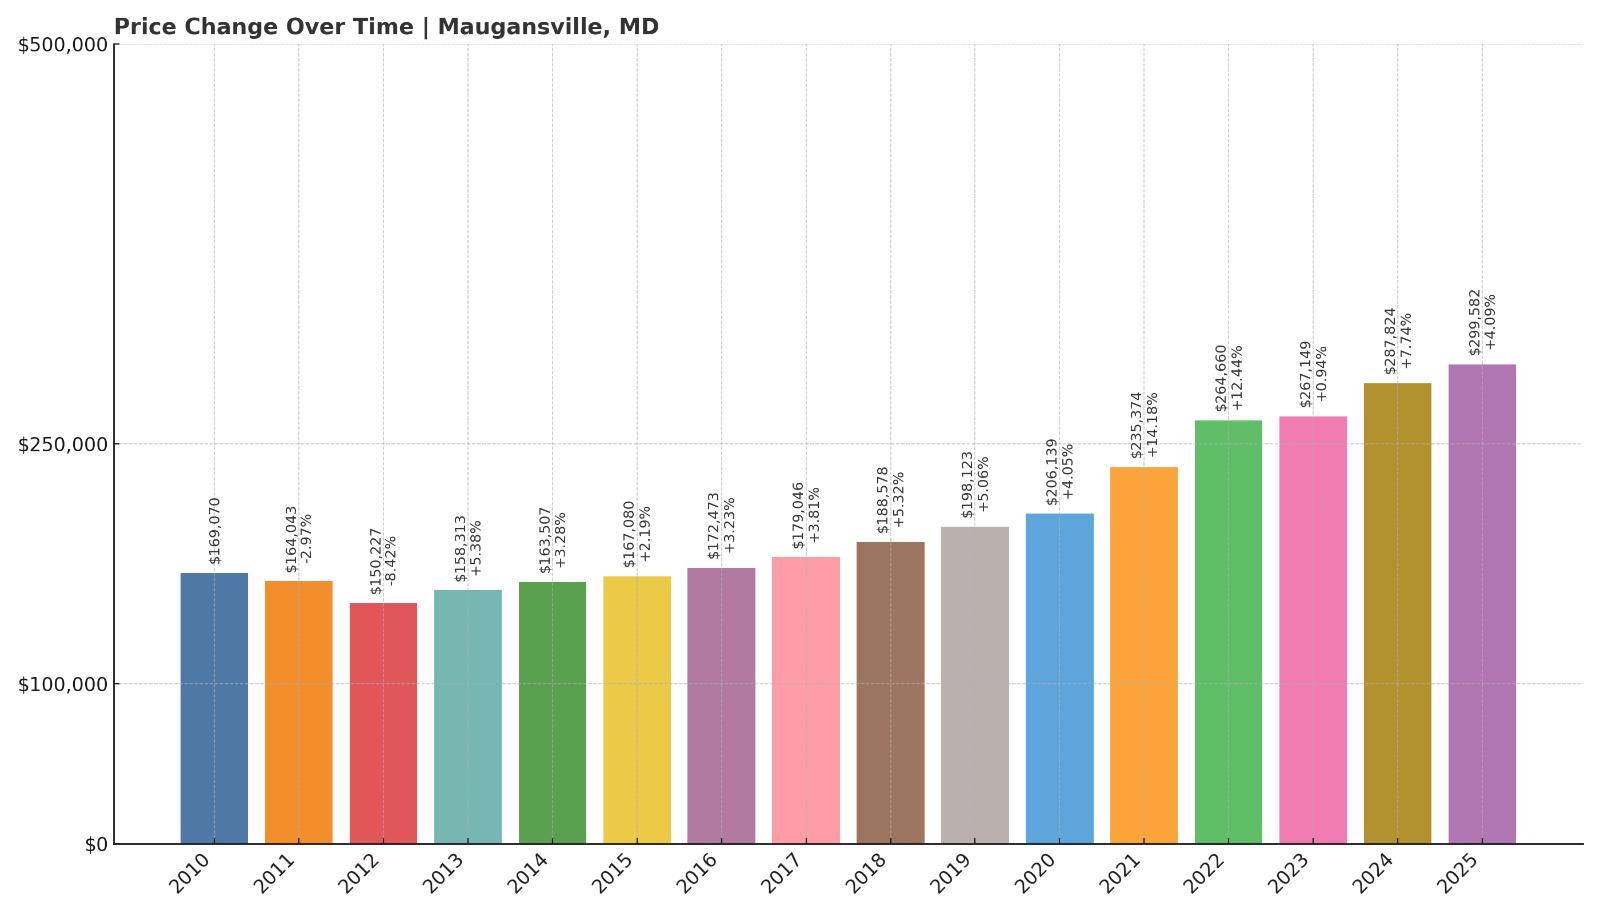
20. Maugansville – Crash Risk Percentage: 41.52%
- Crash Risk Percentage: 41.52%
- Historical crashes (8%+ drops): 1
- Worst historical crash: -8.4% (2012)
- Total price increase since 2010: 77.2%
- Overextended above long-term average: 46.5%
- Price volatility (annual swings): 5.2%
- Current 2025 price: $299,582
Maugansville shows a notable 46.5% overextension above its long-term price trend, paired with a price volatility of 5.2%—a signal that this market may be less stable than it appears. Despite a respectable 77.2% total increase in prices since 2010, the town has seen at least one significant crash in recent memory: a drop of 8.4% in 2012. Current prices hover just under $300,000, raising concerns about how long they can remain elevated without another correction.
In order to come up with the very specific design ideas, we create most designs with the assistance of state-of-the-art AI interior design software.
Maugansville – Rising Prices Meet Familiar Risks
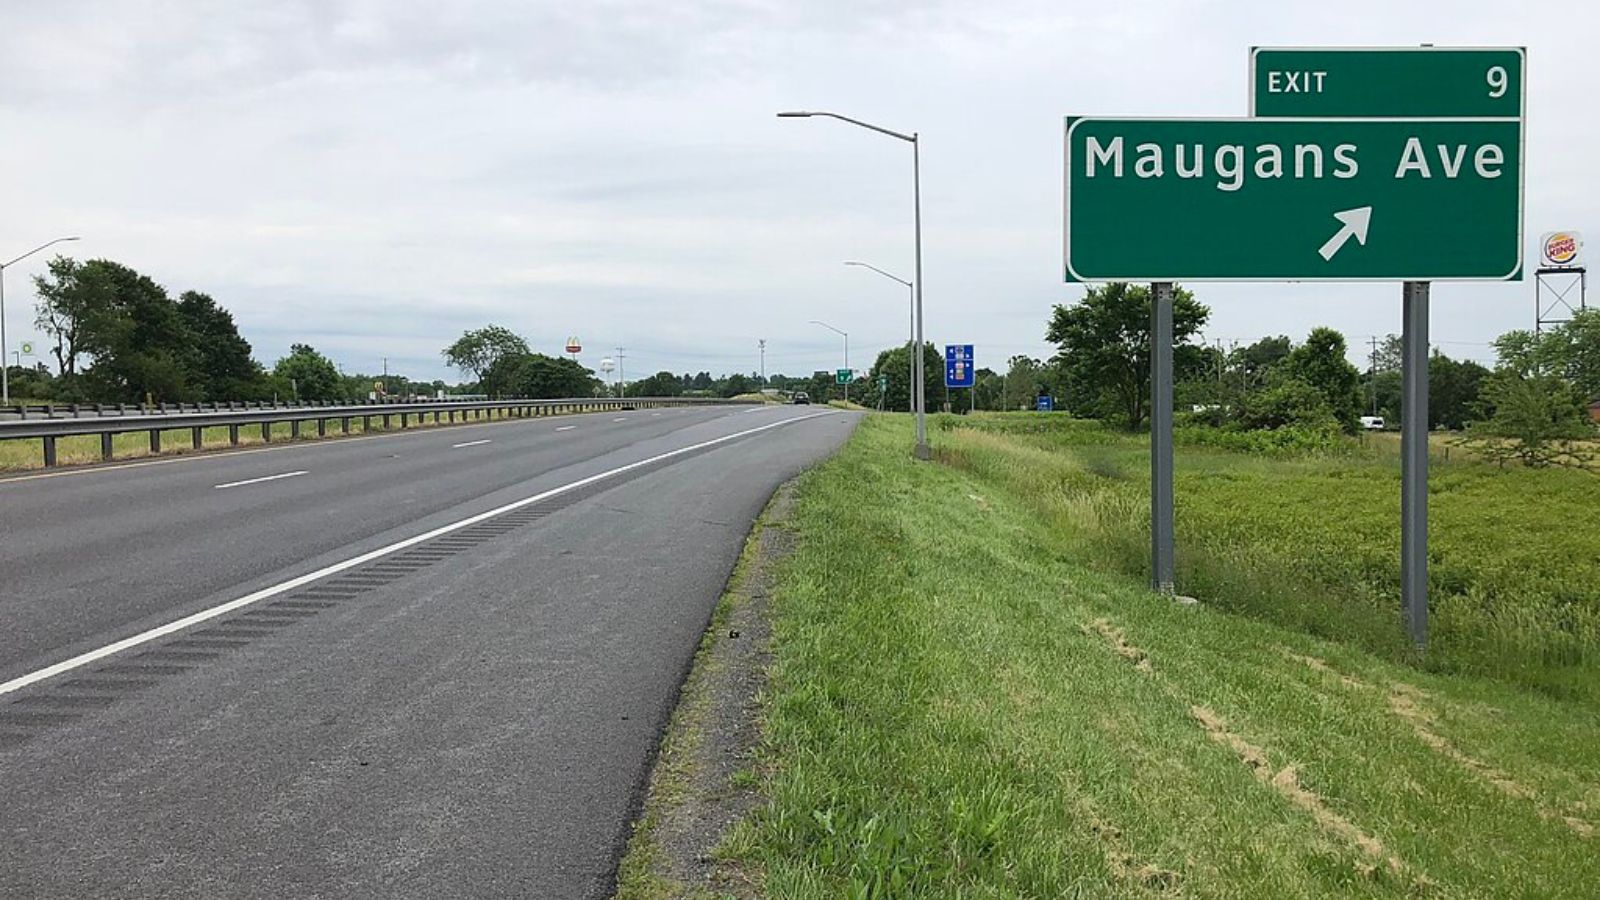
Located in Washington County near the Pennsylvania border, Maugansville offers small-town appeal and commuter access to Hagerstown and the broader I-81 corridor. Home values have grown steadily in recent years, but the pace may now be exceeding sustainable levels. With a near 50% overextension above historical norms, buyers may be paying more than what long-term trends would support.
The town’s relatively low volatility compared to some others on this list may provide a cushion, but the lingering memory of its 2012 dip shows that price drops aren’t off the table. If broader market conditions tighten or if regional demand cools, Maugansville could face renewed price pressure. At just under $300K, affordability may help, but it’s no guarantee against a slide.
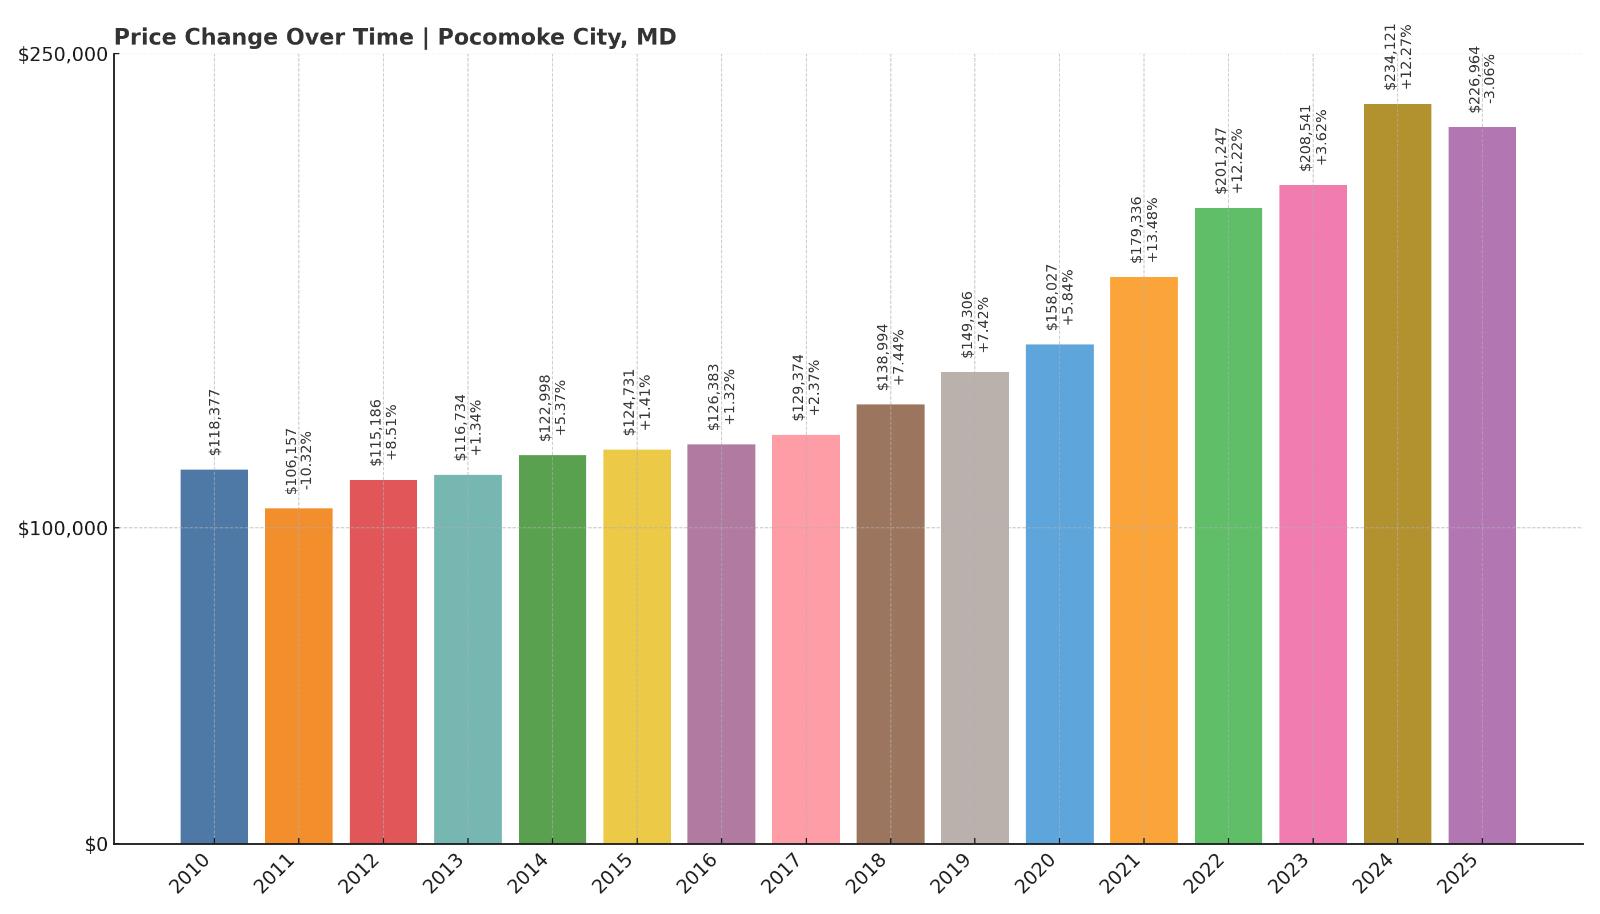
19. Pocomoke City – Crash Risk Percentage: 42.77%
- Crash Risk Percentage: 42.77%
- Historical crashes (8%+ drops): 1
- Worst historical crash: -10.3% (2011)
- Total price increase since 2010: 91.7%
- Overextended above long-term average: 47.8%
- Price volatility (annual swings): 6.0%
- Current 2025 price: $226,964
Pocomoke City’s housing market has seen nearly 92% growth since 2010, but it’s now sitting nearly 48% above its long-term price average — a red flag for sustainability. Its crash risk score of 42.77% is compounded by a significant 10.3% decline back in 2011. With moderate price volatility and sub-$230K prices, the town looks affordable on the surface, but its trajectory suggests that prices could retrace if demand softens.
Pocomoke City – Elevated Growth in a Price-Sensitive Market
Situated along the banks of the Pocomoke River near the Virginia border, this town is often praised for its historic downtown and natural beauty. But its housing market has outpaced fundamentals, with current prices far above historical norms. While still one of the more affordable towns in the state, that may not shield it from correction, especially given its past vulnerability to sharp downturns.
Pocomoke’s modest volatility and relatively low entry prices may attract buyers, but with a 2011 crash on record and current pricing detached from long-term averages, there’s a clear risk that values could slip. A cooling off period may already be underway.
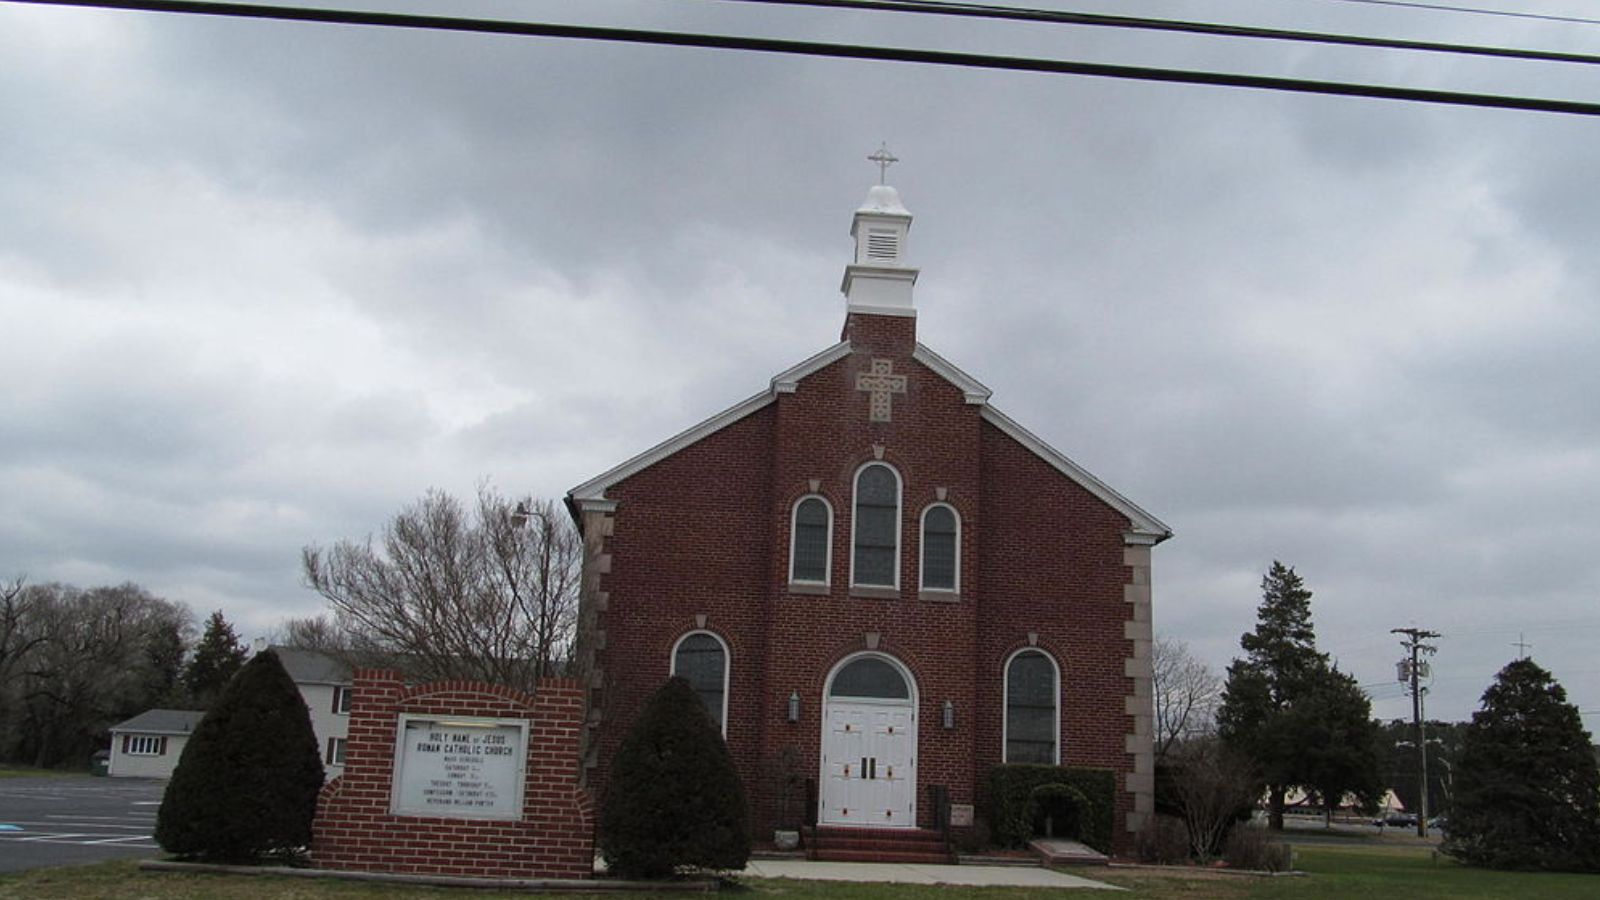
18. Hancock – Crash Risk Percentage: 43.27%
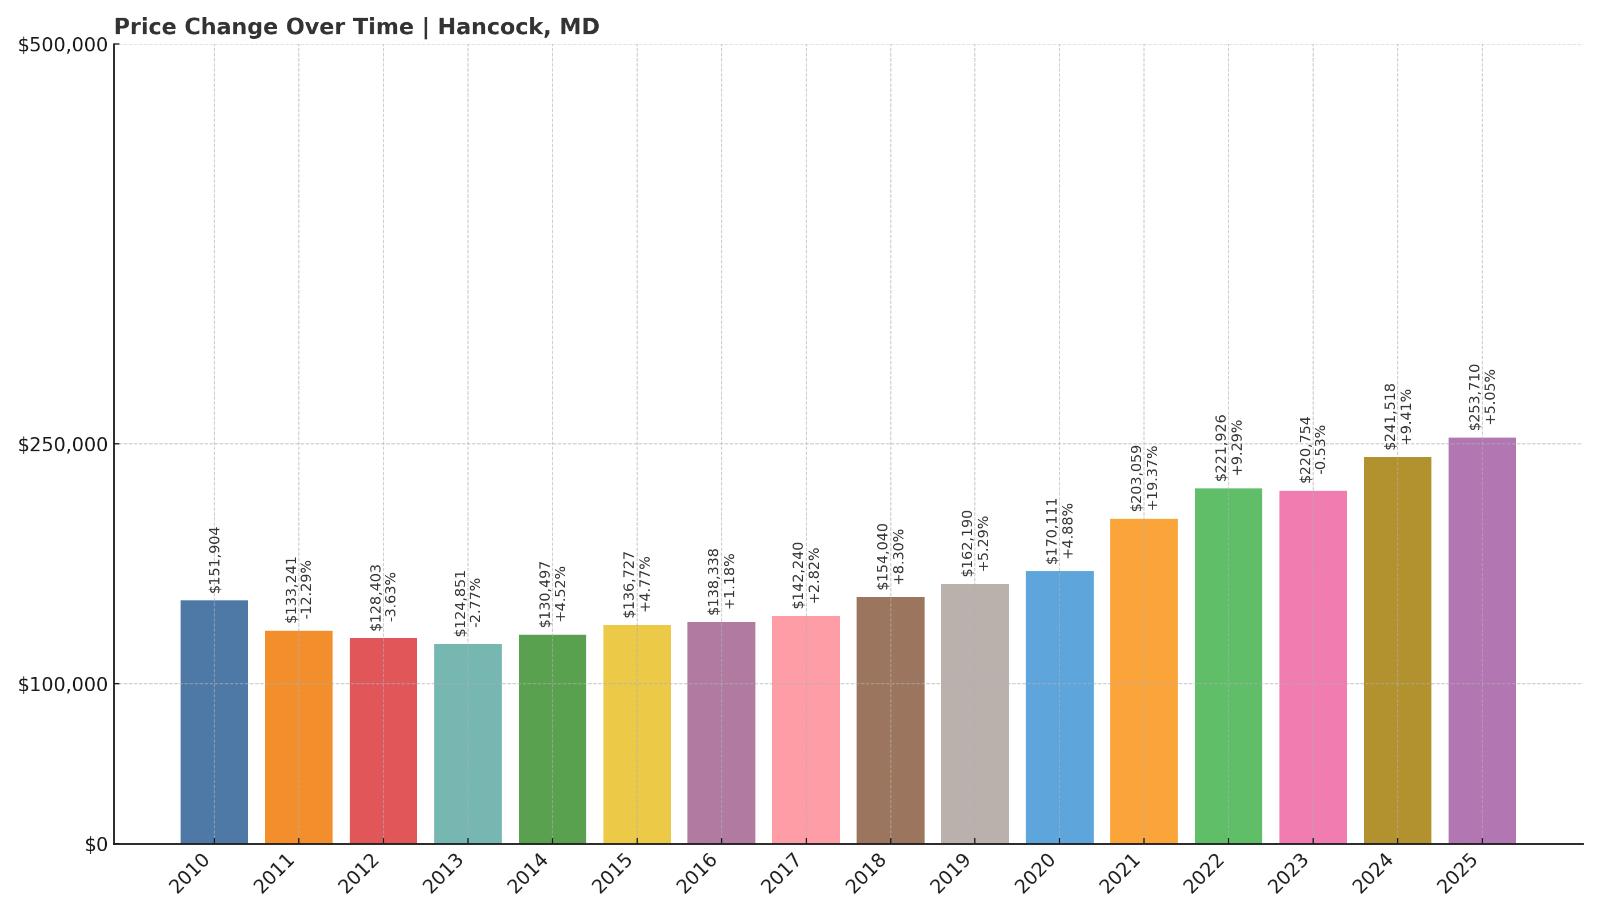
- Crash Risk Percentage: 43.27%
- Historical crashes (8%+ drops): 1
- Worst historical crash: -12.3% (2011)
- Total price increase since 2010: 67.0%
- Overextended above long-term average: 49.6%
- Price volatility (annual swings): 6.9%
- Current 2025 price: $253,710
Hancock’s price gains have been more modest than some others on the list, but that hasn’t stopped the town from becoming nearly 50% overextended relative to its long-term trend. A 12.3% crash in 2011 still stands out as a reminder of its past fragility. With prices now around $254K, the town sits in a vulnerable position, particularly given a near-7% annual volatility rate.
Hancock – High Risk Despite Modest Growth
Tucked in Maryland’s narrow western panhandle along the Potomac River, Hancock is a small town with a rich colonial history. Its market avoided the eye-popping appreciation seen in coastal counties, but prices have still risen enough to raise concerns about sustainability.
The 2011 crash marked the town’s susceptibility to wider economic pressures, and now, elevated volatility and steep overextension suggest Hancock may again be due for a pullback. Its remote location and aging housing stock could also slow demand if the market cools statewide.
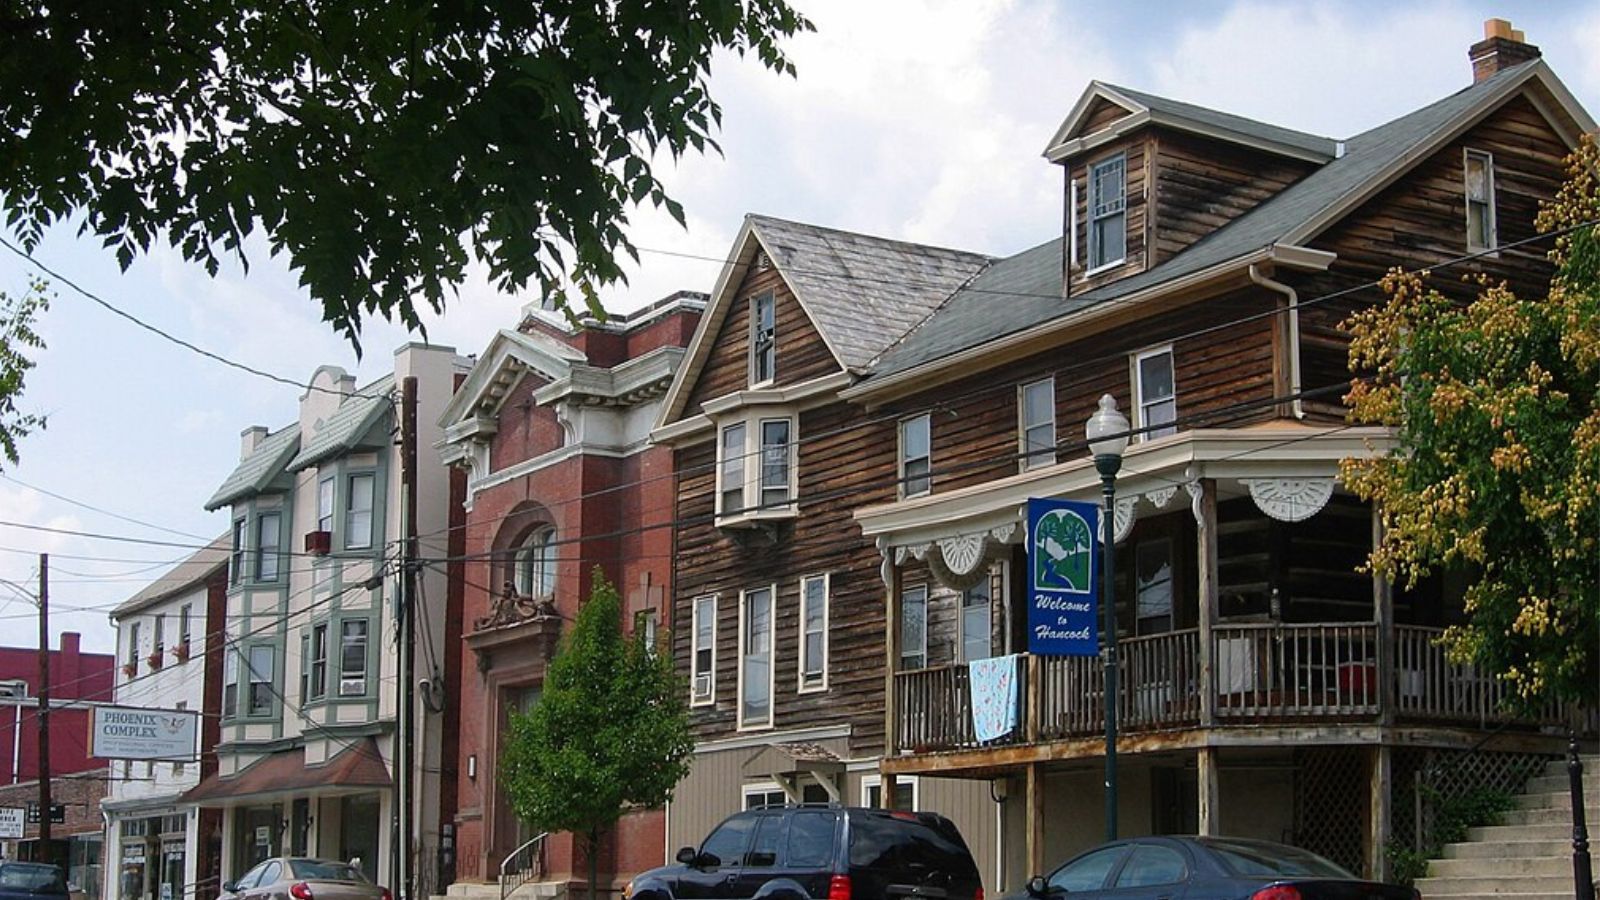
17. Hagerstown – Crash Risk Percentage: 44.53%
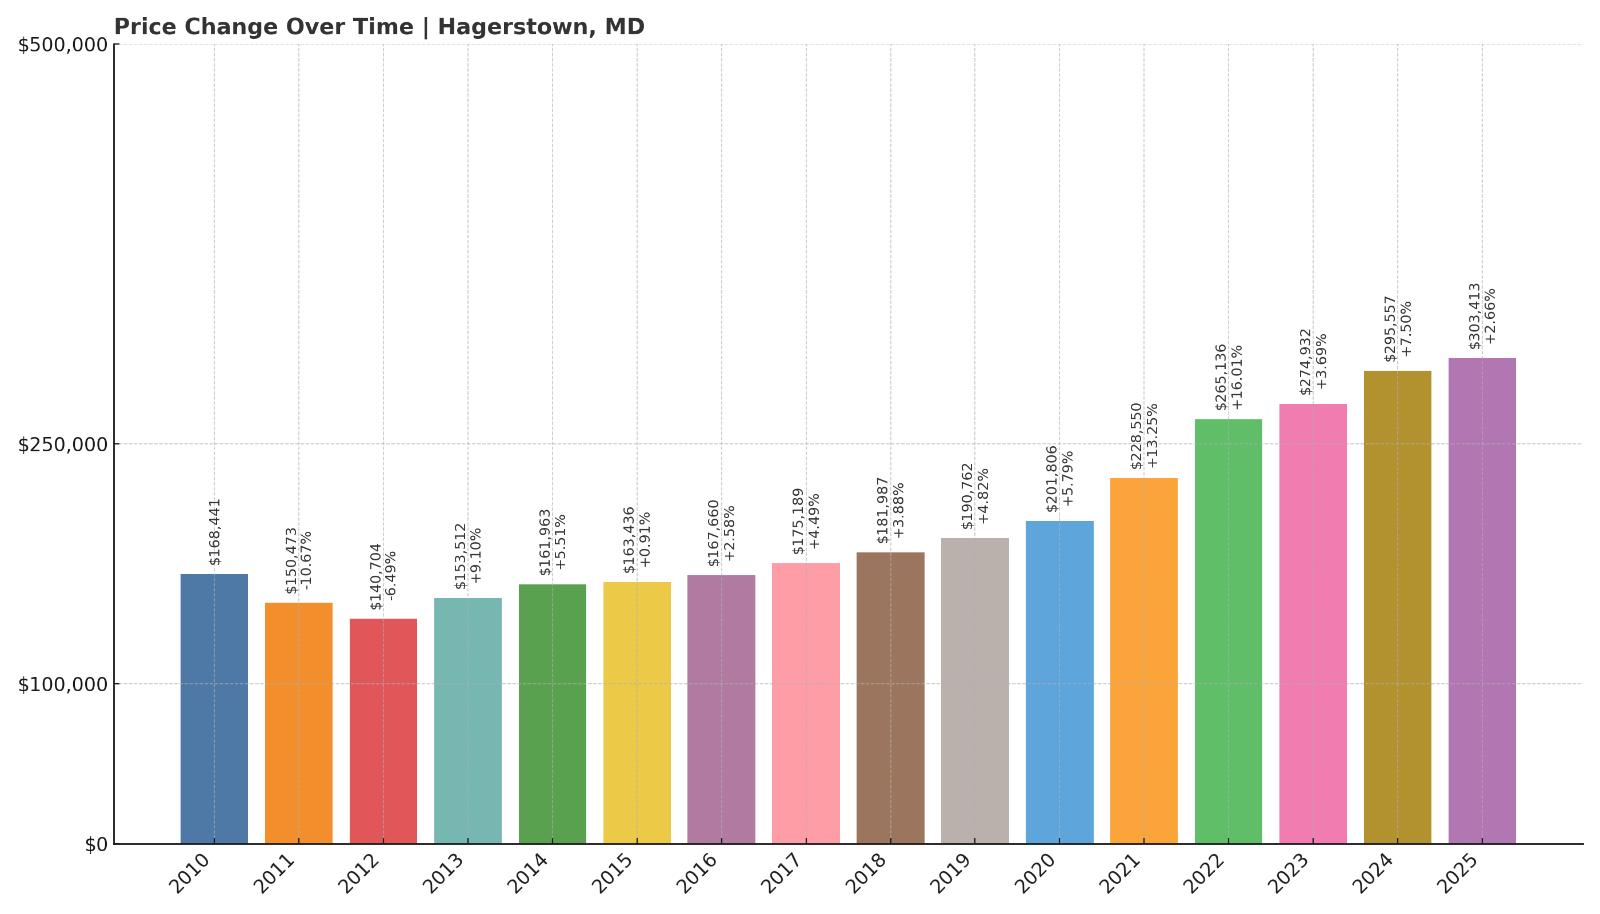
- Crash Risk Percentage: 44.53%
- Historical crashes (8%+ drops): 1
- Worst historical crash: -10.7% (2011)
- Total price increase since 2010: 80.1%
- Overextended above long-term average: 50.6%
- Price volatility (annual swings): 6.4%
- Current 2025 price: $303,413
With home values rising more than 80% since 2010, Hagerstown is now 50.6% above its long-term pricing trend. A 10.7% drop during the 2011 correction underscores the market’s potential for volatility, and the town’s current price level of just over $300,000 places it near the middle of the Maryland market. Still, its vulnerability score of 44.53% indicates notable downside risk.
Hagerstown – Regional Hub with Shaky Pricing Ground

As one of the larger towns in western Maryland, Hagerstown plays a key role in the state’s economy. But that hasn’t insulated it from housing risk. After a big dip in 2011, prices have steadily rebounded — perhaps too much. The current 50% overextension above trend suggests a disconnect from fundamentals.
While Hagerstown’s size and infrastructure may help cushion against abrupt downturns, it doesn’t eliminate the risk. If the market slows or affordability becomes a larger concern, a repeat of past price declines isn’t out of the question.
16. Willards – Crash Risk Percentage: 45.68%
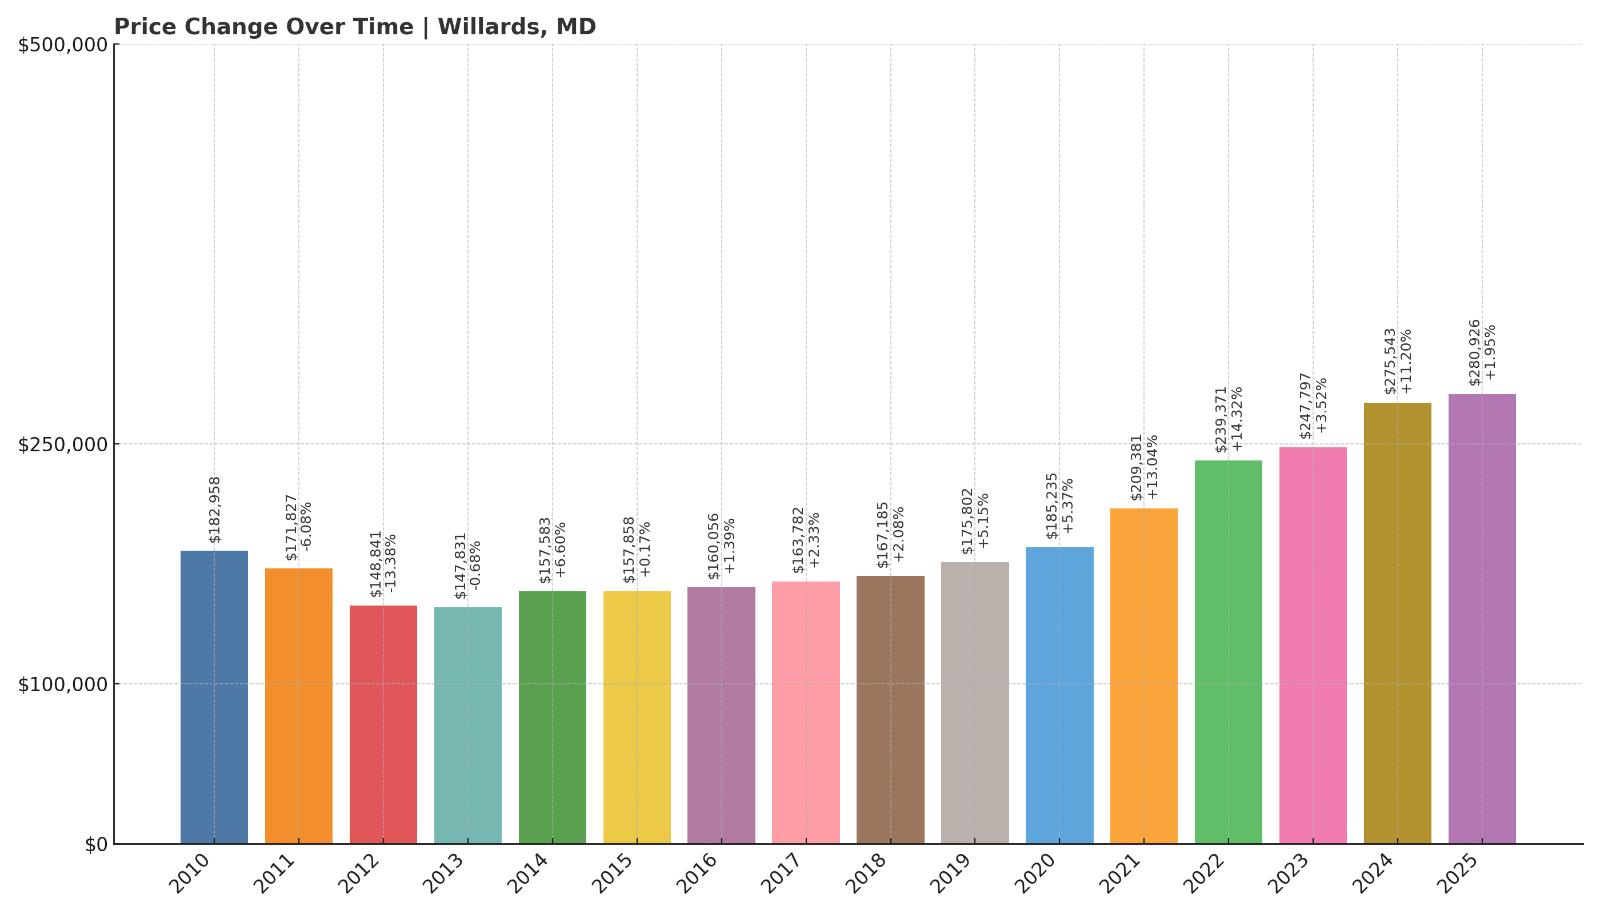
- Crash Risk Percentage: 45.68%
- Historical crashes (8%+ drops): 1
- Worst historical crash: -13.4% (2012)
- Total price increase since 2010: 53.5%
- Overextended above long-term average: 46.3%
- Price volatility (annual swings): 6.8%
- Current 2025 price: $280,926
Willards saw prices climb just over 50% since 2010, a more moderate gain compared to many towns on this list. However, it’s still more than 46% over its long-term average, and its crash risk score approaches 46%. The town’s sharp 13.4% drop in 2012 remains the worst among its peers at this level of the ranking, showing that corrections can happen quickly and deeply.
Willards – Quiet Market, Big Past Crash
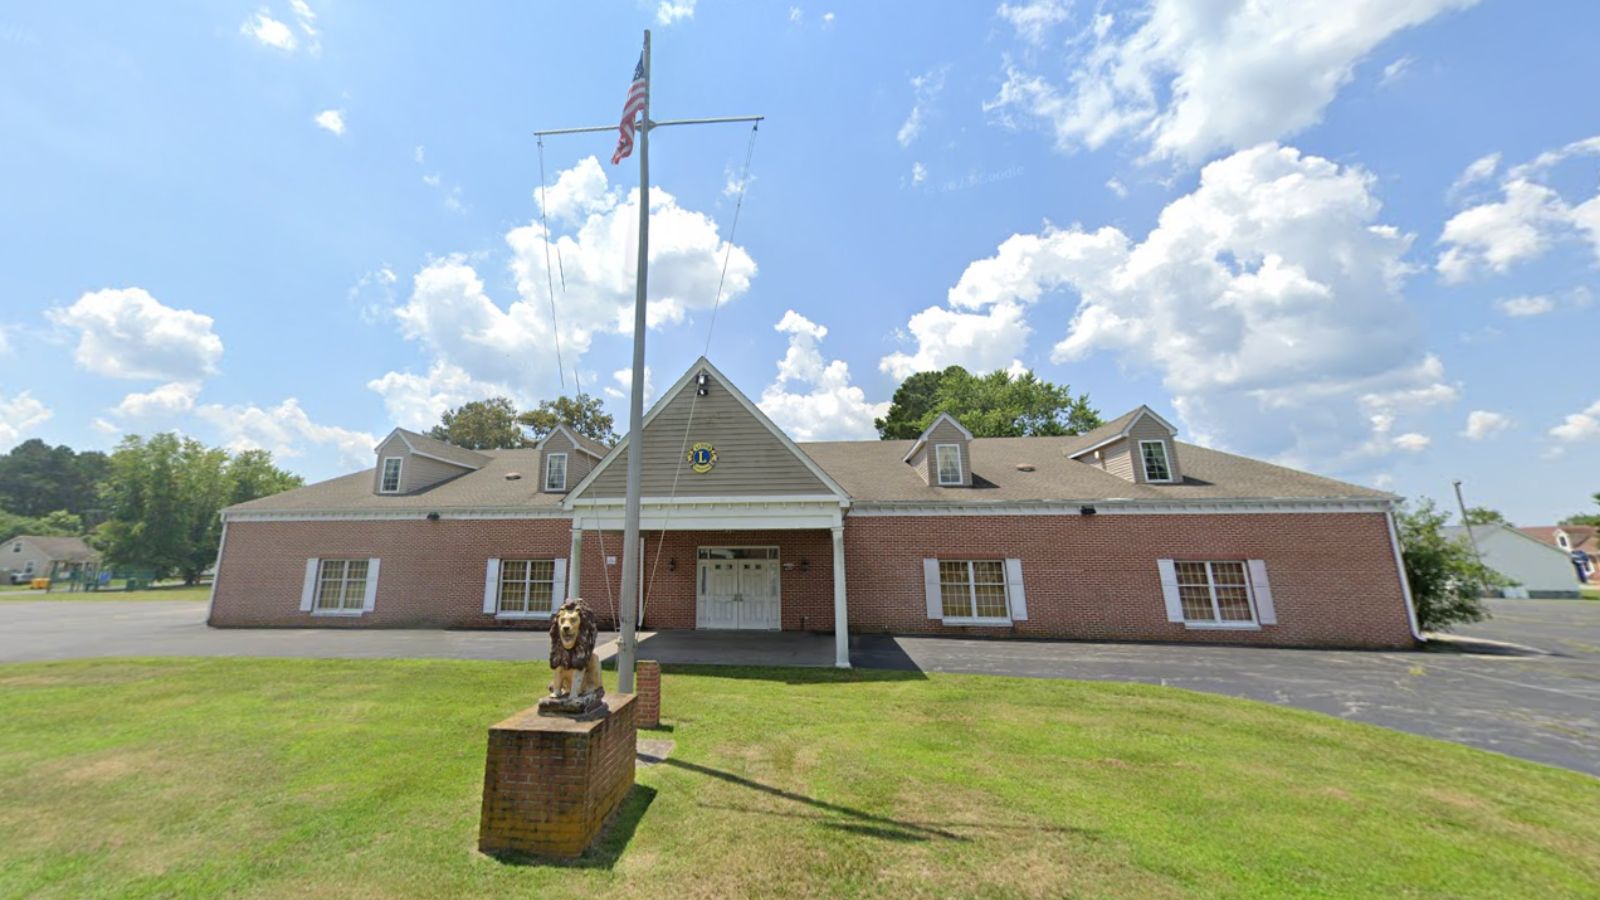
Located in Wicomico County on Maryland’s Eastern Shore, Willards is a small town with a calm exterior but a turbulent housing history. The 2012 downturn left a lasting mark, and despite years of modest recovery, its price trajectory now shows signs of overheating once again.
Willards’ lower price point near $281K may offer relative accessibility, but that doesn’t eliminate the underlying risk. With volatility close to 7% and prices nearly 50% above trend, it wouldn’t take much to push this market into another cycle of decline.
15. Halfway – Crash Risk Percentage: 46.02%
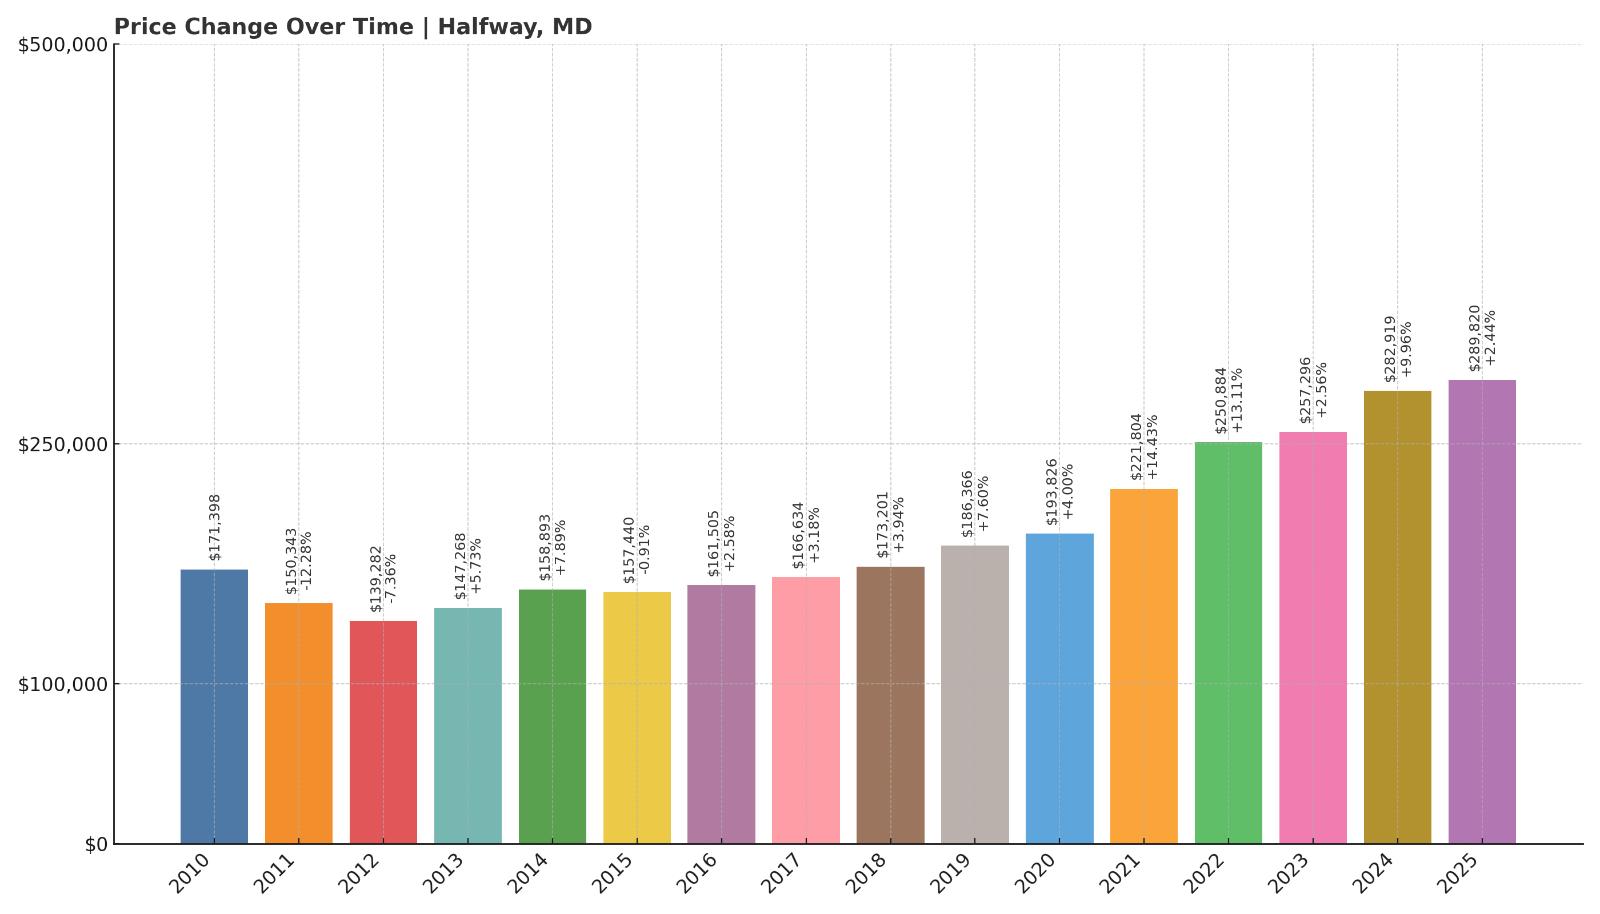
- Crash Risk Percentage: 46.02%
- Historical crashes (8%+ drops): 1
- Worst historical crash: -12.3% (2011)
- Total price increase since 2010: 69.1%
- Overextended above long-term average: 49.2%
- Price volatility (annual swings): 6.7%
- Current 2025 price: $289,820
Halfway’s home values have climbed 69.1% since 2010 and are now sitting nearly 50% above their long-term trend. Combined with a historical 12.3% drop in 2011 and annual price swings of 6.7%, the town’s risk profile is concerning. At just under $290K, current prices may seem reasonable, but they are inflated relative to historical patterns, suggesting potential exposure if demand wanes.
Halfway – Mid-Sized Market With a History of Volatility
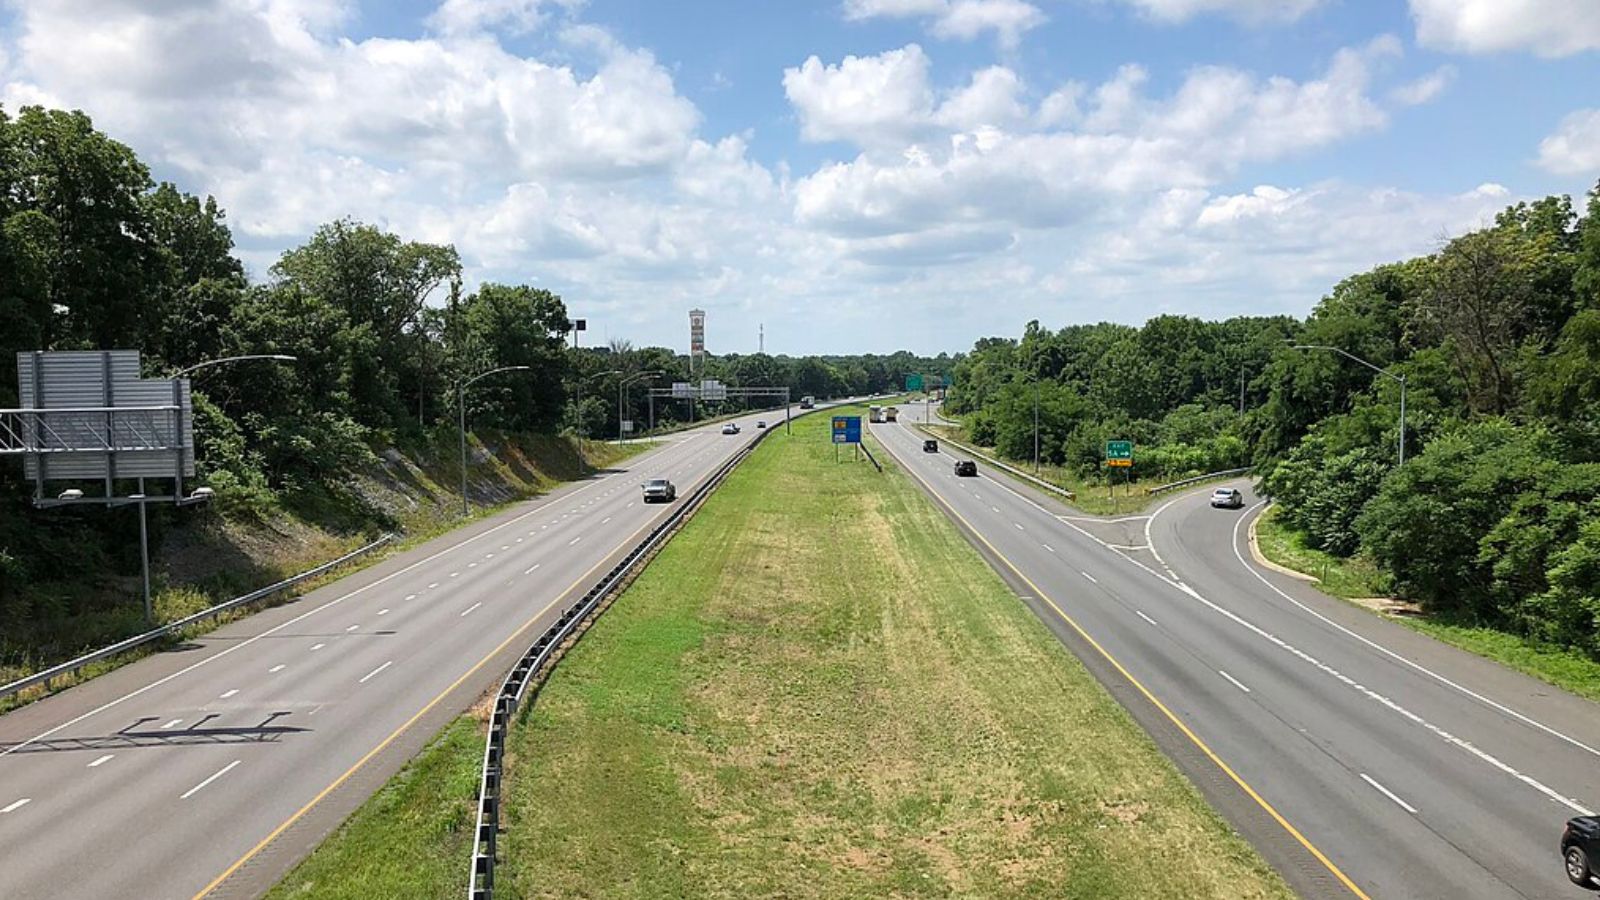
Positioned just southwest of Hagerstown in Washington County, Halfway offers proximity to regional jobs and commuter routes, but that hasn’t made its market immune to instability. In 2011, prices took a steep dive, and today’s elevated pricing puts the town in similar danger if the broader market starts to cool.
Price increases have outpaced fundamentals, and volatility remains high enough to cause concern. With a nearly 50% overextension and relatively moderate growth, Halfway is walking a fine line between stability and susceptibility to correction.
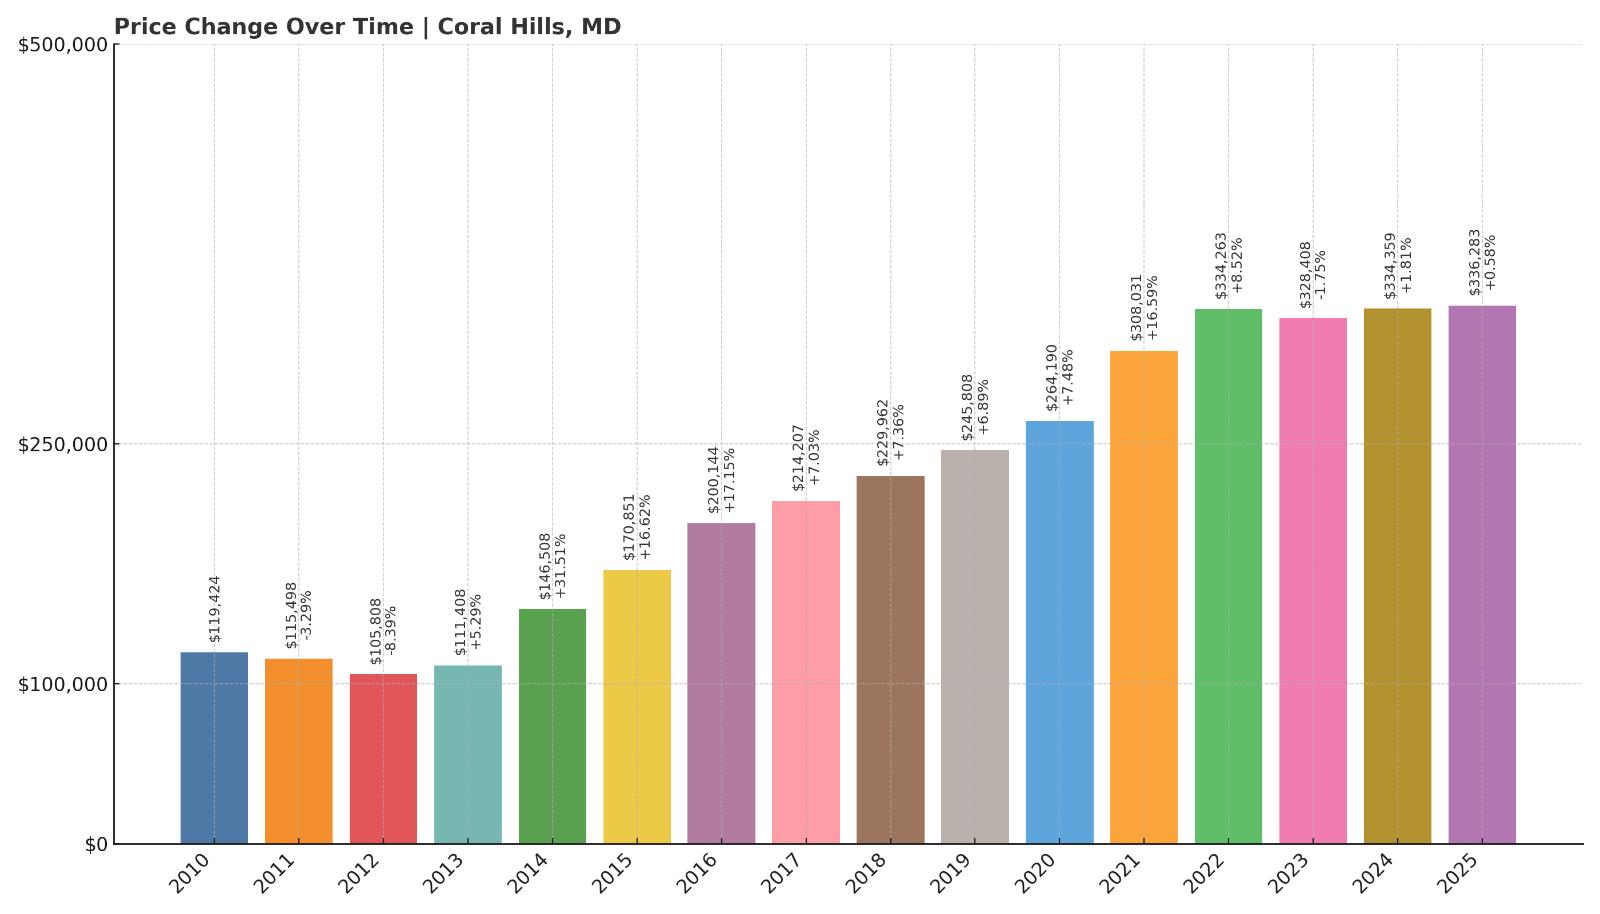
14. Coral Hills – Crash Risk Percentage: 46.43%
🔥 Would you like to save this?
- Crash Risk Percentage: 46.43%
- Historical crashes (8%+ drops): 1
- Worst historical crash: -8.4% (2012)
- Total price increase since 2010: 181.6%
- Overextended above long-term average: 50.9%
- Price volatility (annual swings): 9.6%
- Current 2025 price: $336,283
Coral Hills stands out for its massive 181.6% price gain since 2010, yet it’s also one of the most volatile towns in this group, with nearly 10% average annual swings. That combination of sharp growth and high variability increases its vulnerability, particularly as it sits over 50% above its historical pricing trend. A prior 8.4% drop in 2012 remains the town’s most significant correction on record.
Coral Hills – Surging Growth With Little Cushion

Located just outside Washington, D.C., Coral Hills has seen explosive price growth over the past decade, driven by urban spillover and strong demand for housing near the capital. But that growth may have overshot fundamentals. With high volatility and limited historical stability, the risk of correction is substantial.
At around $336K, homes are still moderately priced compared to nearby markets, but the pace of appreciation and deviation from long-term trends suggest buyers may be on shakier ground than they realize. Any slowdown in D.C.-area demand could hit Coral Hills hard.
13. Greater Landover – Crash Risk Percentage: 46.53%
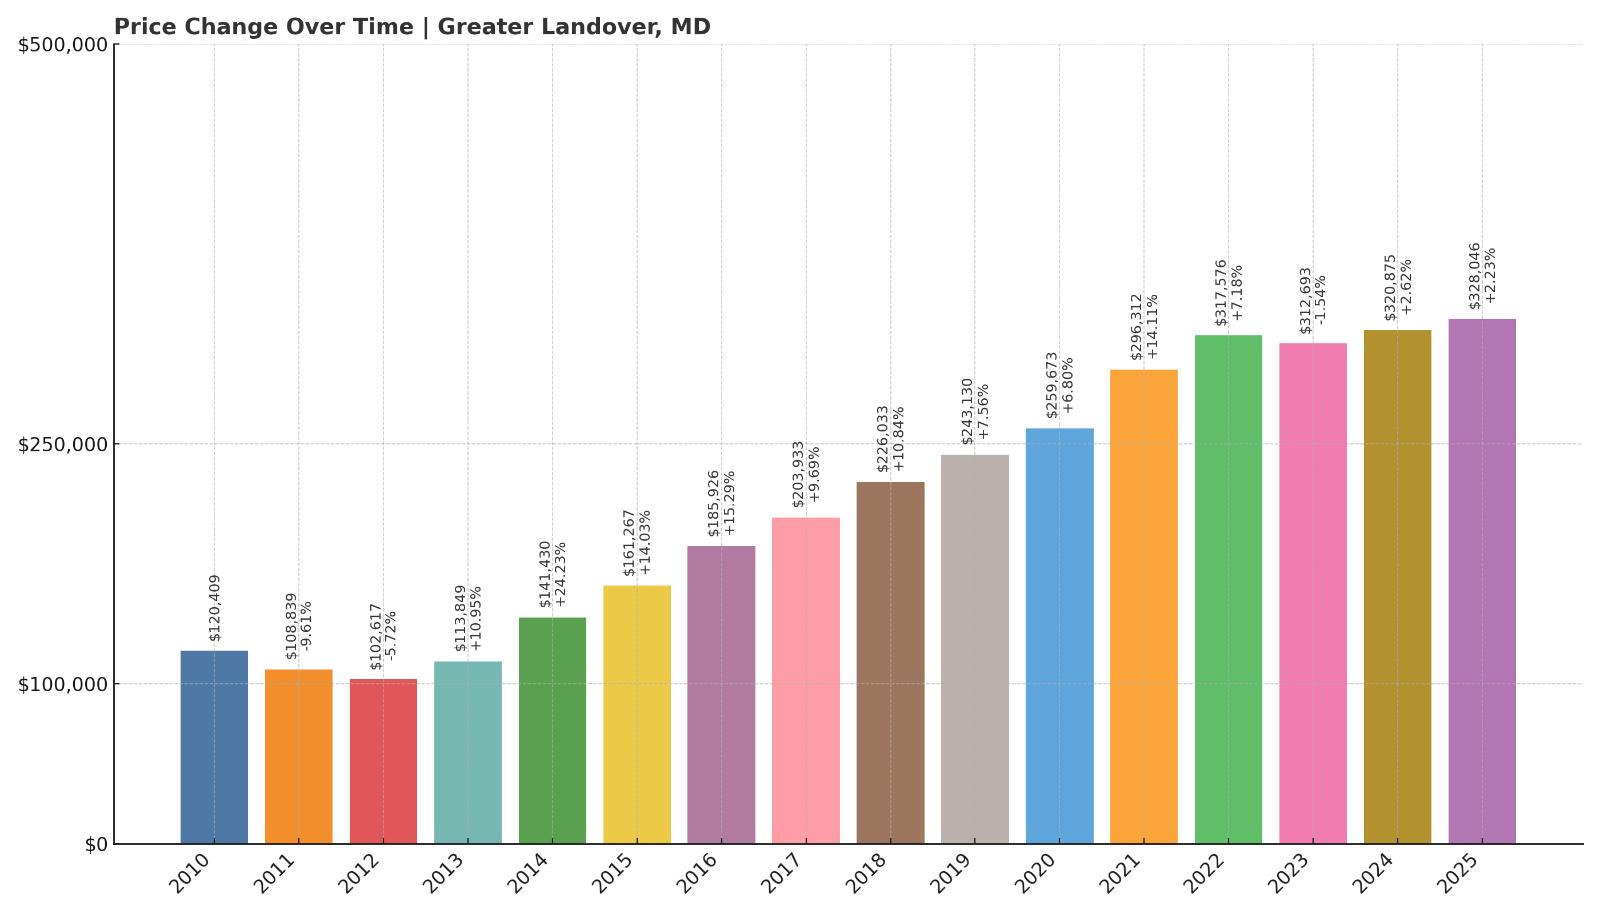
- Crash Risk Percentage: 46.53%
- Historical crashes (8%+ drops): 1
- Worst historical crash: -9.6% (2011)
- Total price increase since 2010: 172.4%
- Overextended above long-term average: 52.5%
- Price volatility (annual swings): 8.4%
- Current 2025 price: $328,046
Greater Landover has seen home values jump by over 170% since 2010, and prices are now more than 52% above their long-term average. Volatility sits at 8.4%, adding to the concern. A nearly 10% crash back in 2011 shows this market can turn quickly. With a current price just over $328K, Greater Landover could be at risk if regional affordability pressures intensify.
Greater Landover – Growth-Powered Gains Facing Correction Pressure

As part of Prince George’s County near the Capital Beltway, Greater Landover has long benefited from its access to jobs and transit. That proximity helped push prices upward over the last decade, but the scale of overextension makes those gains vulnerable.
The area’s volatility and prior crash history show that Landover isn’t immune to price resets. With affordability becoming a concern for buyers, especially first-timers, this market could feel the effects first if interest rates remain elevated or demand cools across the region.
12. East Riverdale – Crash Risk Percentage: 48.03%
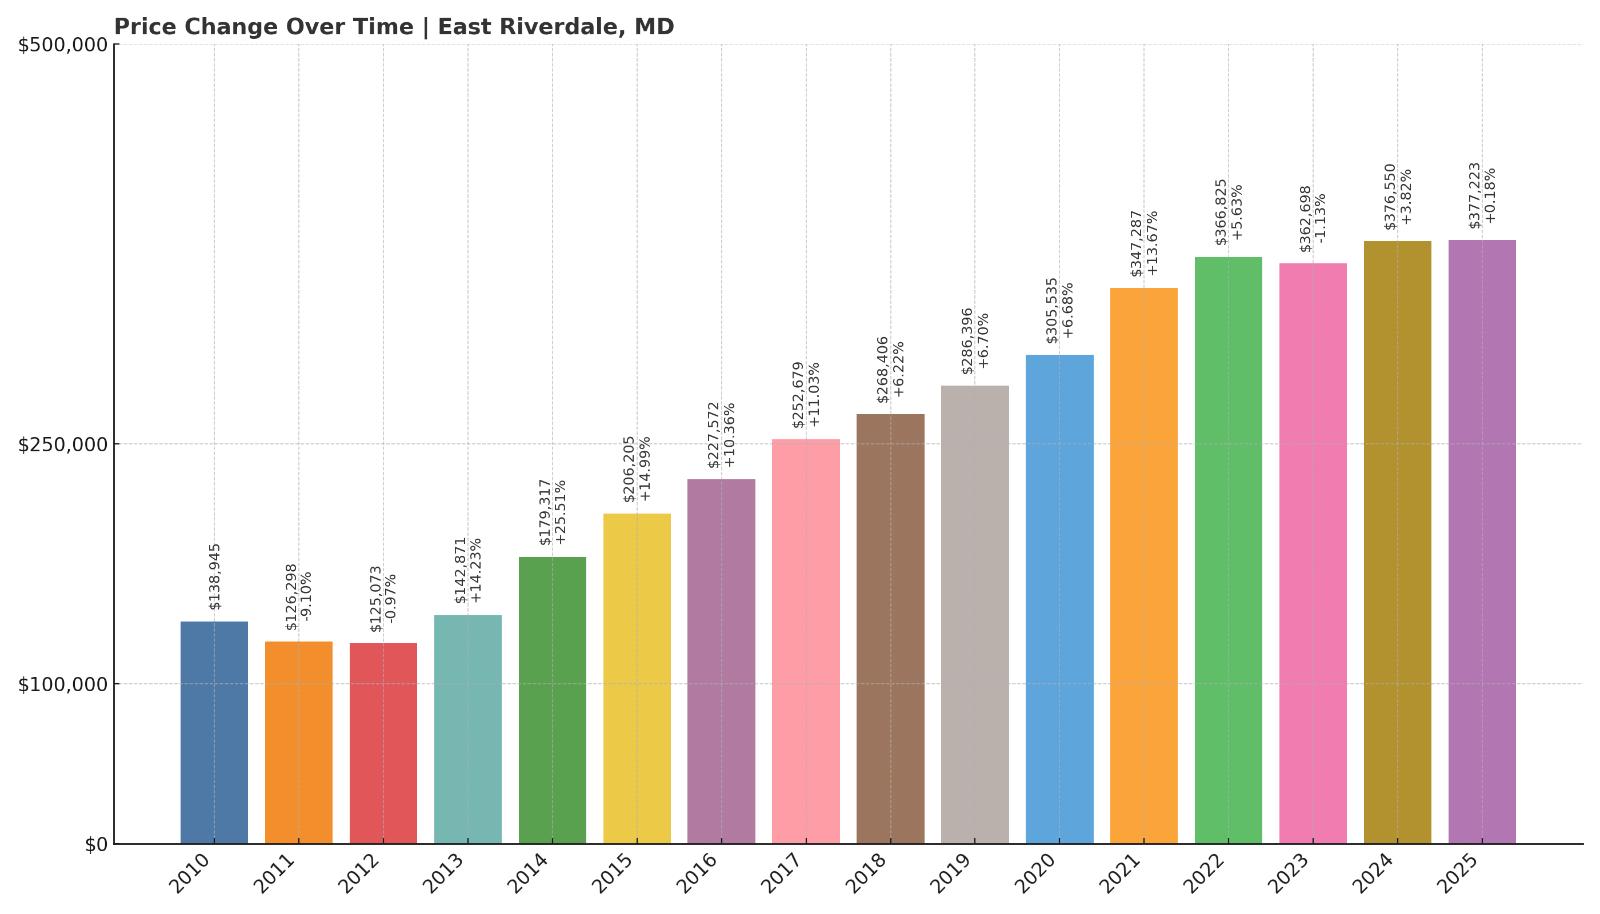
- Crash Risk Percentage: 48.03%
- Historical crashes (8%+ drops): 1
- Worst historical crash: -9.1% (2011)
- Total price increase since 2010: 171.5%
- Overextended above long-term average: 47.6%
- Price volatility (annual swings): 8.1%
- Current 2025 price: $377,223
East Riverdale has experienced massive home price appreciation — over 171% since 2010 — and is now nearly 48% above its historical trend line. With volatility over 8% and a past crash in 2011, the town ranks high on vulnerability. Its current median price of $377K puts it above many nearby towns, raising questions about whether further growth is sustainable.
East Riverdale – Outpacing the Fundamentals
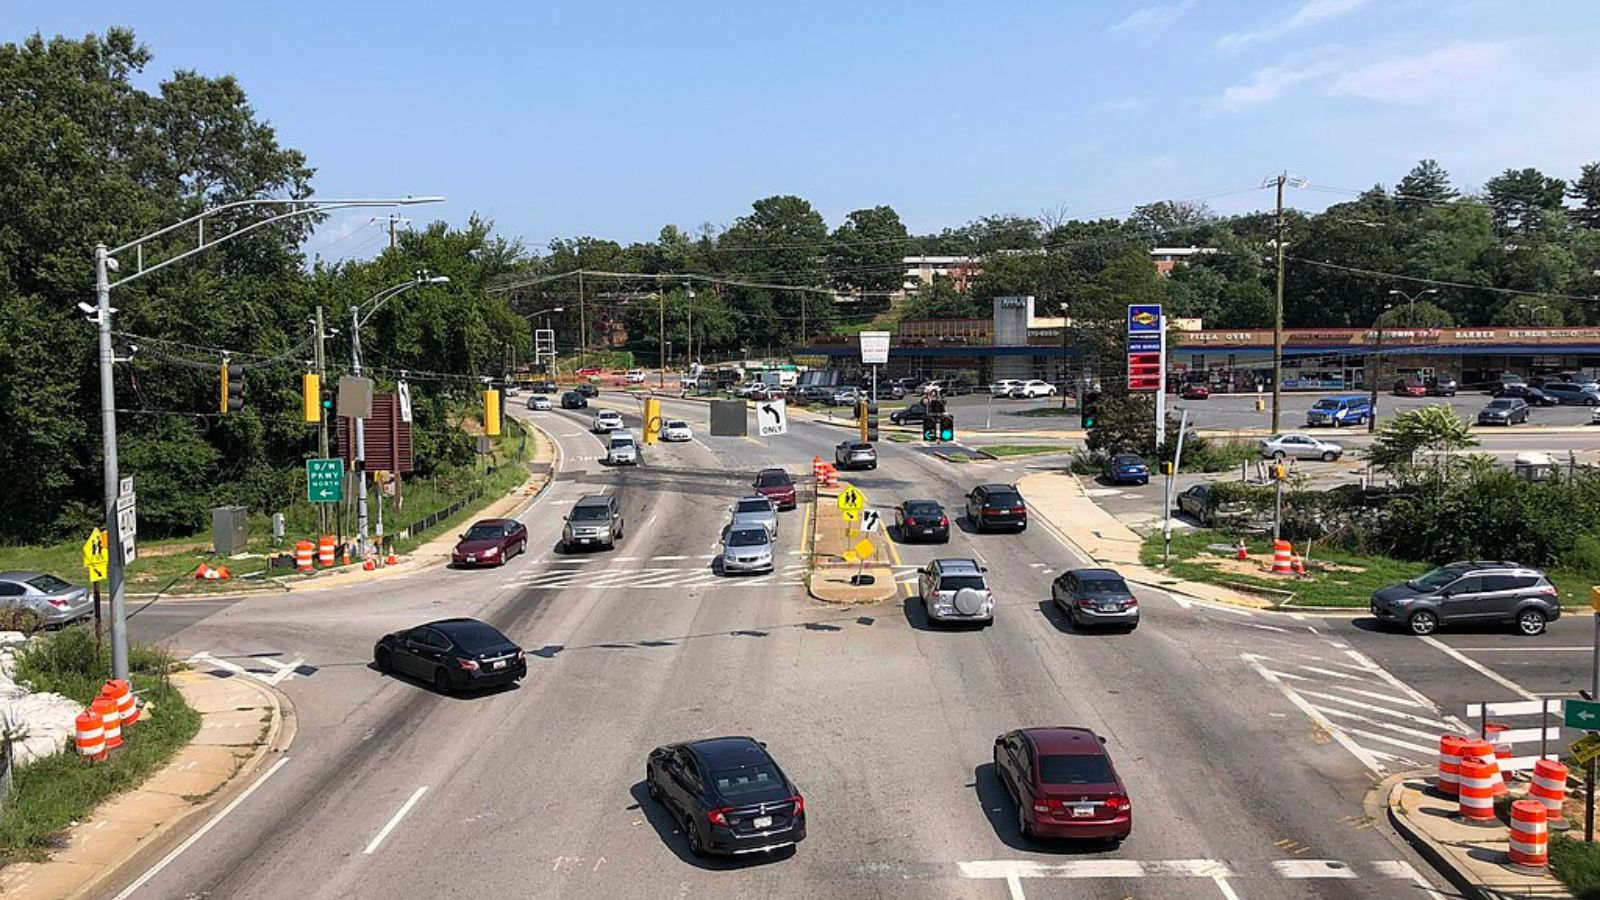
Famartin, CC BY-SA 4.0, via Wikimedia Commons
Also located in Prince George’s County, East Riverdale shares many of the same strengths and risks as its neighboring markets. Convenient access to D.C. and a growing population have driven prices up fast, but those gains may be outstripping the area’s long-term economic footing.
A high volatility rate and strong overextension suggest this is a market running hot — and ripe for a slowdown. If buyer activity pulls back even slightly, East Riverdale could see a more abrupt correction than towns with steadier fundamentals.
11. Coltons Point – Crash Risk Percentage: 50.00%

- Crash Risk Percentage: 50.00%
- Historical crashes (8%+ drops): 2
- Worst historical crash: -14.6% (2011)
- Total price increase since 2010: 20.0%
- Overextended above long-term average: 31.1%
- Price volatility (annual swings): 6.7%
- Current 2025 price: $418,660
Coltons Point stands out for its relatively low long-term growth — just 20% since 2010 — yet it carries a 50% crash risk score and has experienced two significant historical crashes, including a steep 14.6% drop in 2011. Despite mild appreciation, the town is still over 30% above its long-term average, with a current median price above $418K. This combination of weak fundamentals and past instability puts it on shaky ground.
Coltons Point – Pricey and Historically Prone to Declines
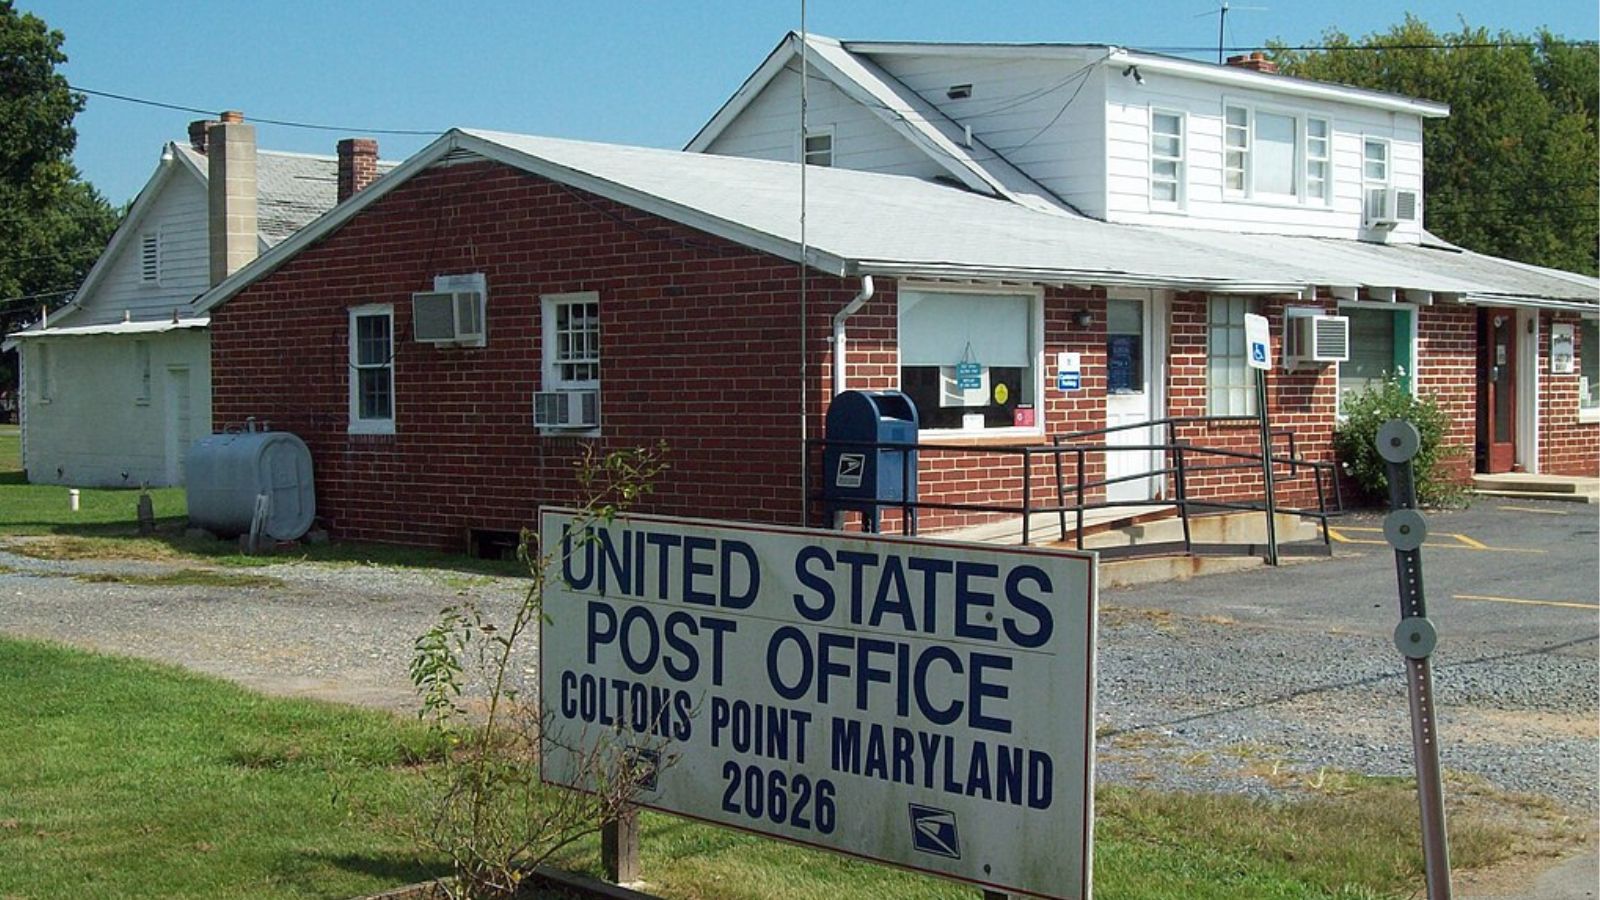
Located at the southern tip of St. Mary’s County on the Potomac River, Coltons Point is known for its water access, rural setting, and historical sites. But its housing market has lagged in terms of growth compared to other parts of the state — and that might be a red flag. With two major price crashes in recent memory and only modest appreciation over 15 years, there’s limited long-term strength underpinning today’s valuations.
Prices here have crept higher in recent years, but without strong demand drivers or sustained growth trends, Coltons Point appears vulnerable. At over $400K, homes may now be overpriced relative to what the local economy can support.
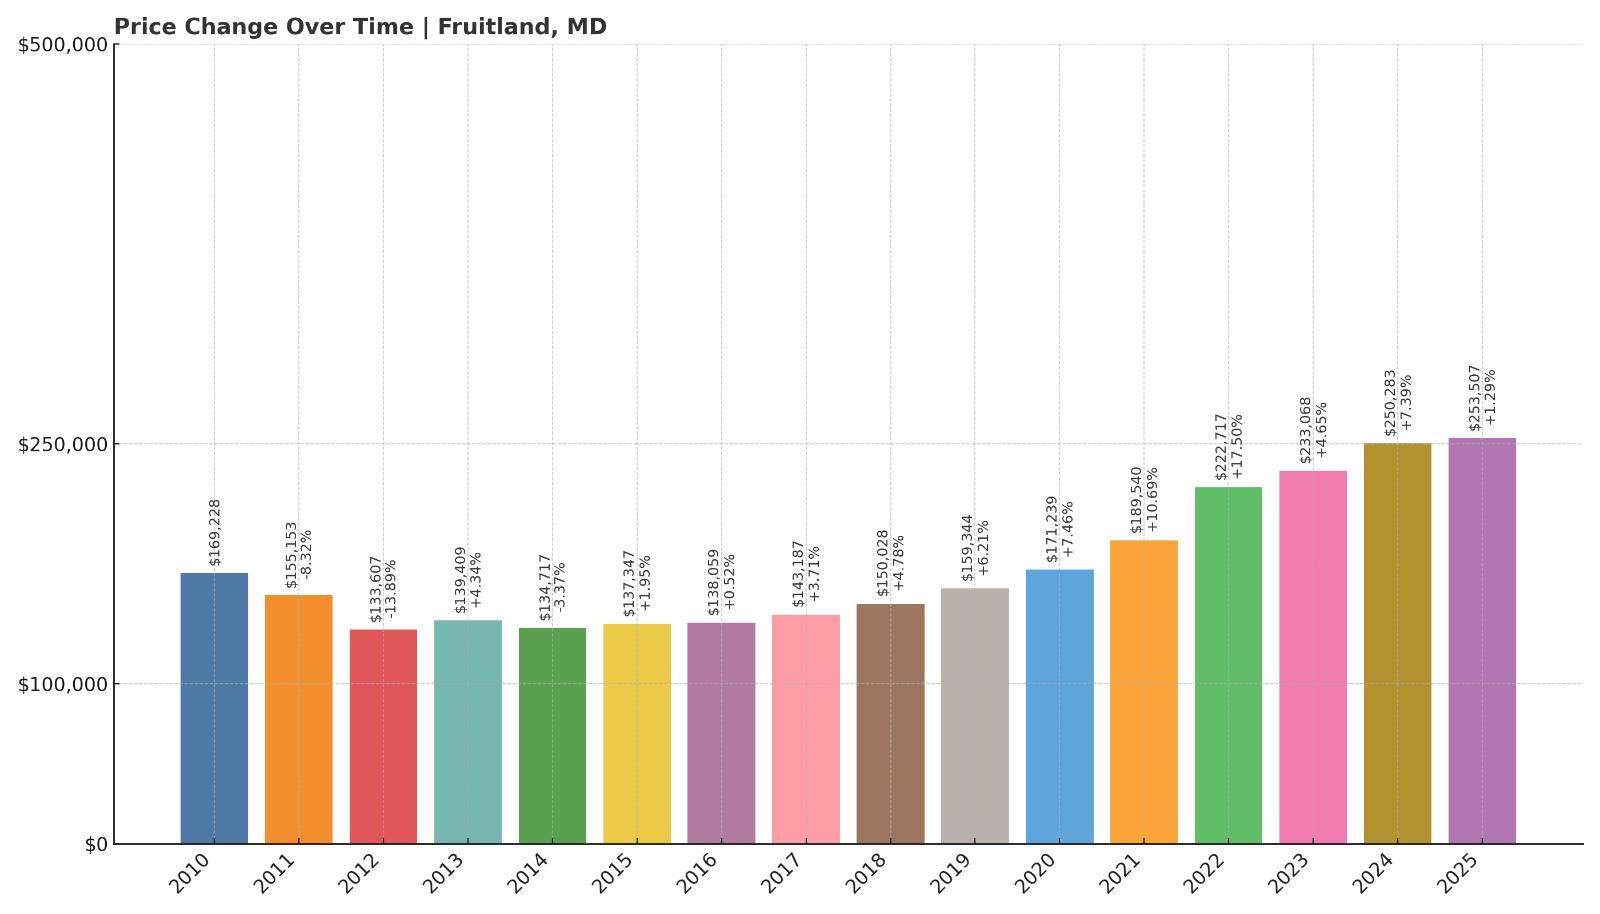
10. Fruitland – Crash Risk Percentage: 50.83%
- Crash Risk Percentage: 50.83%
- Historical crashes (8%+ drops): 2
- Worst historical crash: -13.9% (2012)
- Total price increase since 2010: 49.8%
- Overextended above long-term average: 45.9%
- Price volatility (annual swings): 7.3%
- Current 2025 price: $253,507
Fruitland has experienced two market crashes since 2010, including a sharp 13.9% drop in 2012. Prices have increased just under 50% over the long term, yet homes are now nearly 46% over their historical trend — a disconnect that raises concerns. The town’s current price of roughly $254K might look modest, but that doesn’t mean it’s immune from risk. Its volatility and overextension combine for a crash risk above 50%.
Fruitland – History Repeating in a Stretched Market
Situated just south of Salisbury on Maryland’s Eastern Shore, Fruitland is a quiet suburb with a largely residential makeup. While affordability has traditionally drawn buyers, the town’s repeated history of price dips shows how quickly values can fall here when the market shifts.
Recent price gains haven’t been especially dramatic, but the overextension relative to past norms suggests that the current market may not be sustainable. If interest rates remain high or buyer demand wanes, Fruitland could easily revisit past correction territory.
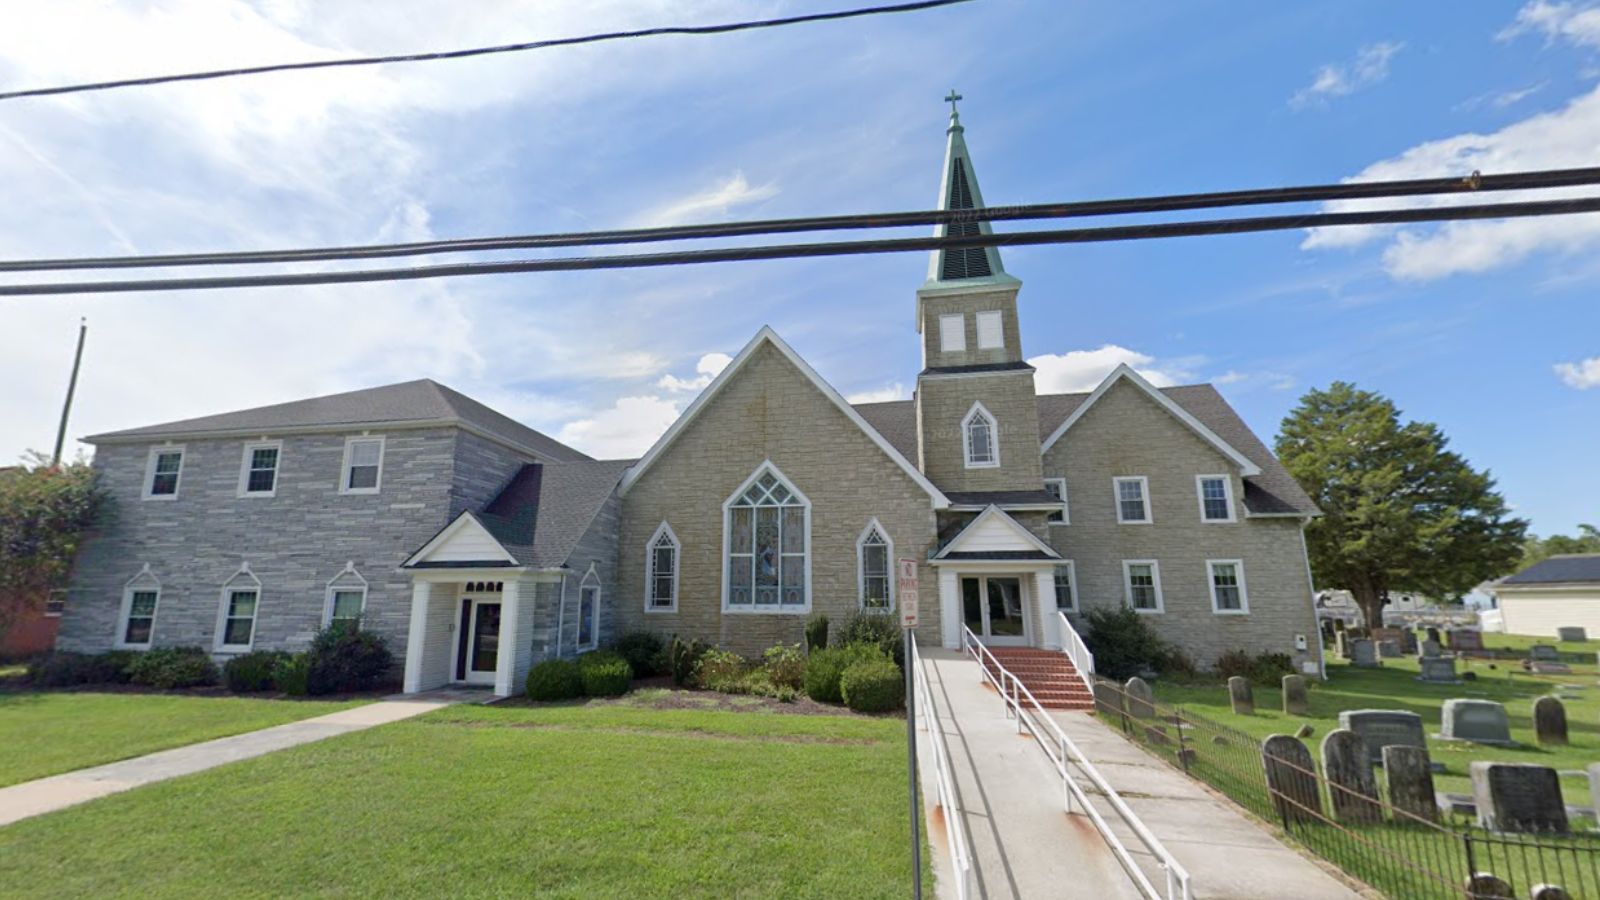
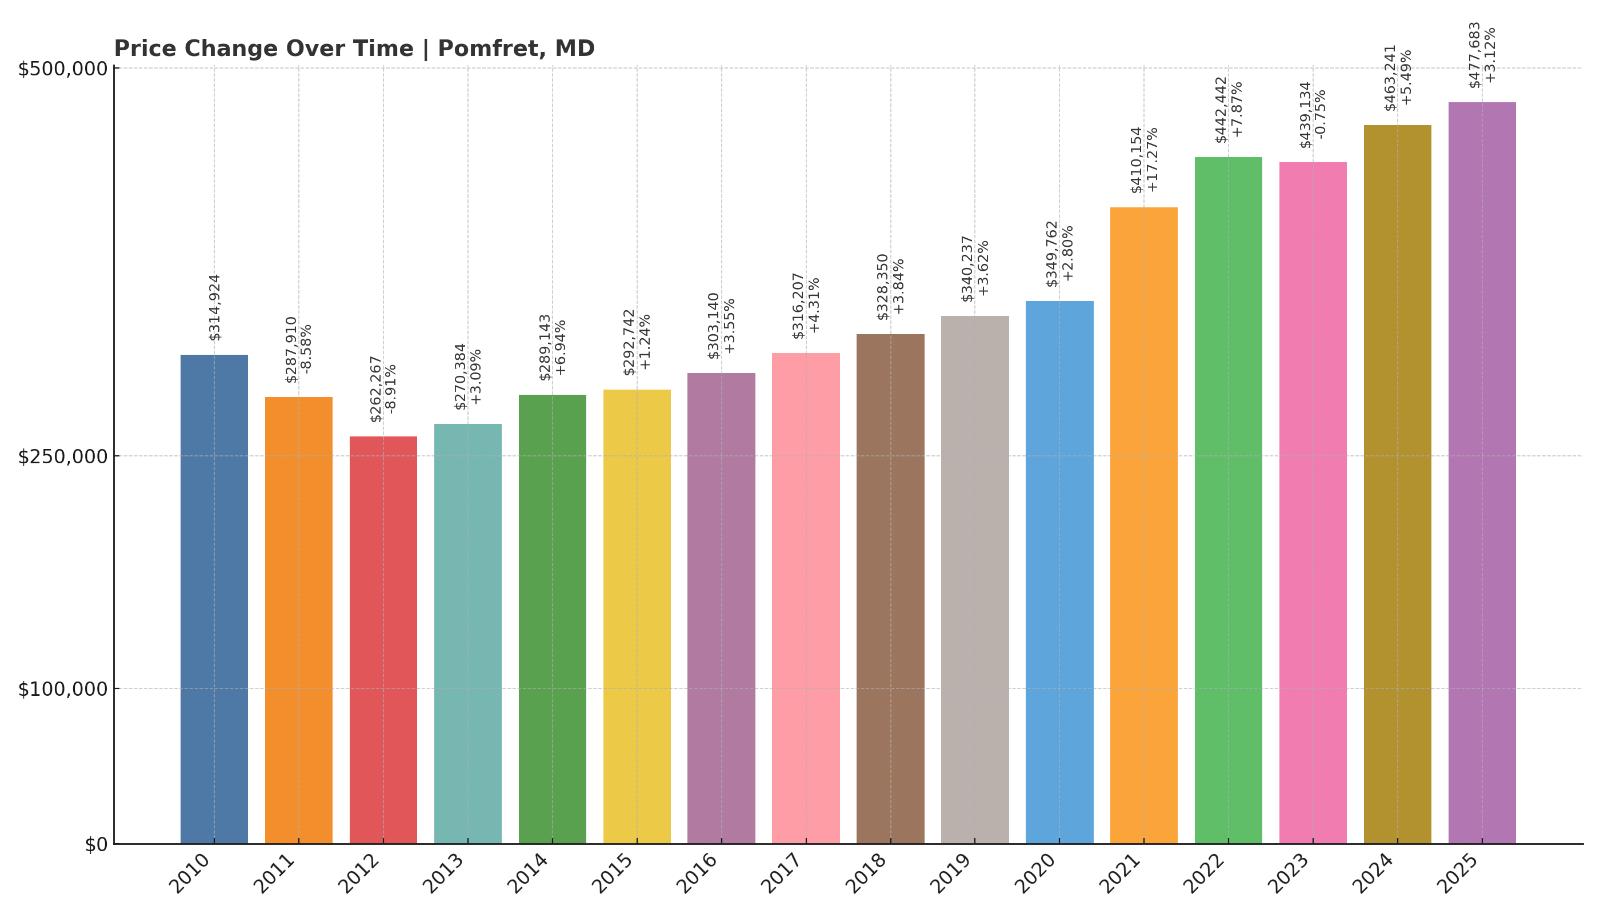
9. Pomfret – Crash Risk Percentage: 51.47%
- Crash Risk Percentage: 51.47%
- Historical crashes (8%+ drops): 2
- Worst historical crash: -8.9% (2012)
- Total price increase since 2010: 51.7%
- Overextended above long-term average: 36.8%
- Price volatility (annual swings): 6.0%
- Current 2025 price: $477,683
Pomfret has experienced two notable housing downturns since 2010, and prices are now nearly 37% over their long-term trend. With only a 51.7% increase in home values over 15 years, it hasn’t kept up with hotter markets — yet it now finds itself with a median price nearing $478K. The disconnect between slow growth and relatively high prices may be setting the stage for a correction.
Pomfret – High Prices Without the Growth to Back It Up
Pomfret is a small, semi-rural community in Charles County, close to Waldorf and within reach of D.C. commuter corridors. But unlike many suburban hotspots, it hasn’t experienced runaway appreciation. That slower growth might seem like a stabilizing factor, but the town has still crashed twice and is now priced well above its historical trend.
The elevated pricing likely reflects demand spillover from pricier neighboring towns. But without strong local economic drivers or sustained demand, Pomfret could be exposed to a reversal — particularly if buyers grow more cautious.
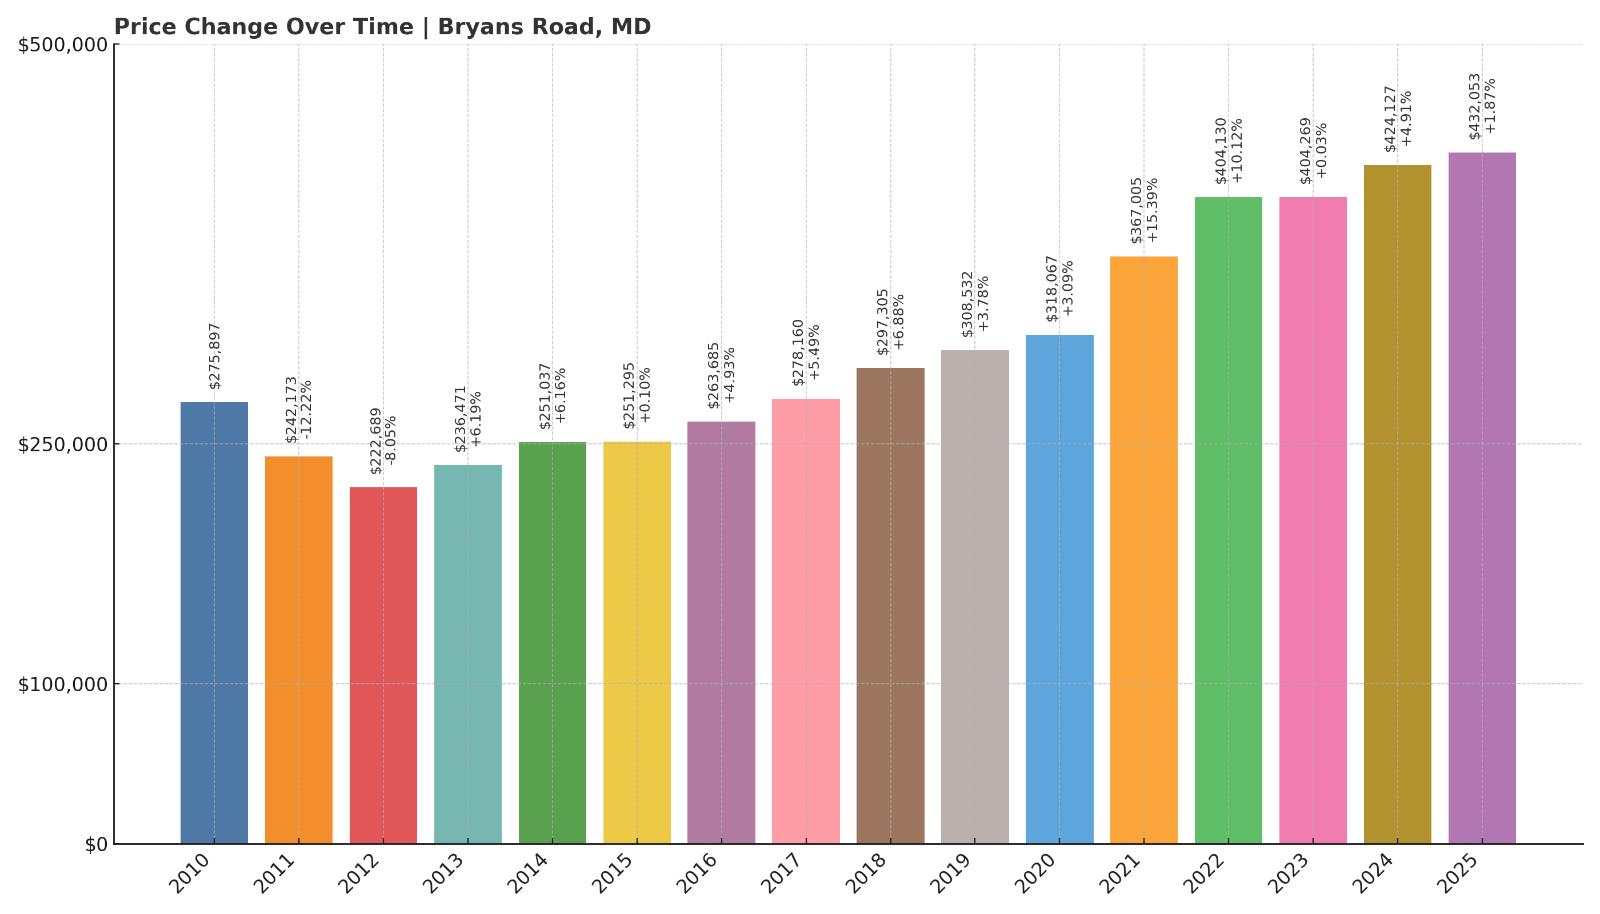
8. Bryans Road – Crash Risk Percentage: 51.69%
🔥 Would you like to save this?
- Crash Risk Percentage: 51.69%
- Historical crashes (8%+ drops): 2
- Worst historical crash: -12.2% (2011)
- Total price increase since 2010: 56.6%
- Overextended above long-term average: 38.9%
- Price volatility (annual swings): 6.5%
- Current 2025 price: $432,053
Bryans Road has experienced two substantial price declines since 2010 and remains nearly 39% overextended above its long-term average. While prices have grown 56.6% over the past 15 years, the current median home value of $432K seems to be testing affordability ceilings. A crash risk of over 51% reflects this imbalance, combined with moderately high price swings.
Bryans Road – A Commuter Market With a Risky Profile
Located in Charles County, Bryans Road serves as a commuter town for those working in Washington, D.C. and Northern Virginia. That proximity has helped support price growth, but the area lacks the job base and infrastructure to justify a $400K+ median price on its own.
The town’s historical crashes — including a 12.2% drop in 2011 — reveal its past vulnerability. With growth moderating and prices outpacing long-term norms, Bryans Road could face a correction if buyer demand weakens or financing conditions tighten further.
7. Riverdale – Crash Risk Percentage: 52.03%
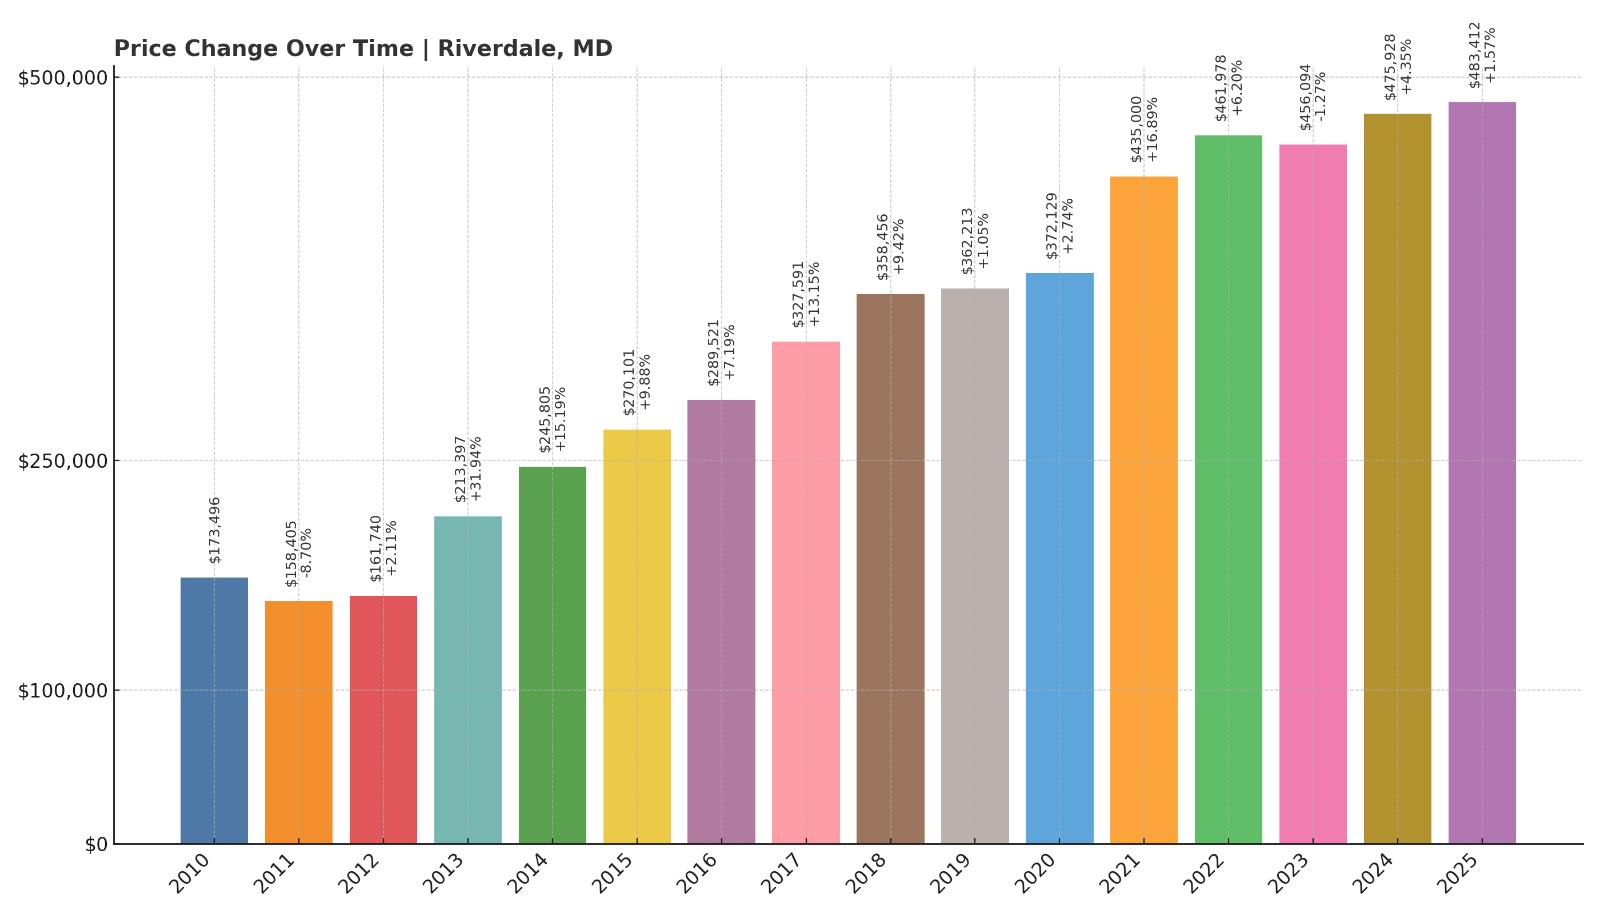
- Crash Risk Percentage: 52.03%
- Historical crashes (8%+ drops): 1
- Worst historical crash: -8.7% (2011)
- Total price increase since 2010: 178.6%
- Overextended above long-term average: 47.5%
- Price volatility (annual swings): 9.2%
- Current 2025 price: $483,412
Riverdale’s home prices have surged by nearly 179% since 2010, far exceeding statewide averages. But that growth has come with significant volatility — annual swings average over 9% — and home values are now almost 48% above long-term trends. A past 8.7% crash in 2011 shows this isn’t new territory. At nearly $483K, the current price point leaves little room for error.
Riverdale – Big Gains, Big Risk

Riverdale sits in Prince George’s County with direct Metro access into D.C., making it a popular spot for urban professionals. That demand has pushed prices sharply upward over the last decade, but now the market appears stretched.
High volatility and rapid gains have left it exposed if regional employment or affordability shifts. The town’s historical correction and current overvaluation suggest that recent price levels might not be durable. If demand slows or investors pull back, Riverdale could see a retreat toward its long-term average.
6. Colmar Manor – Crash Risk Percentage: 52.52%
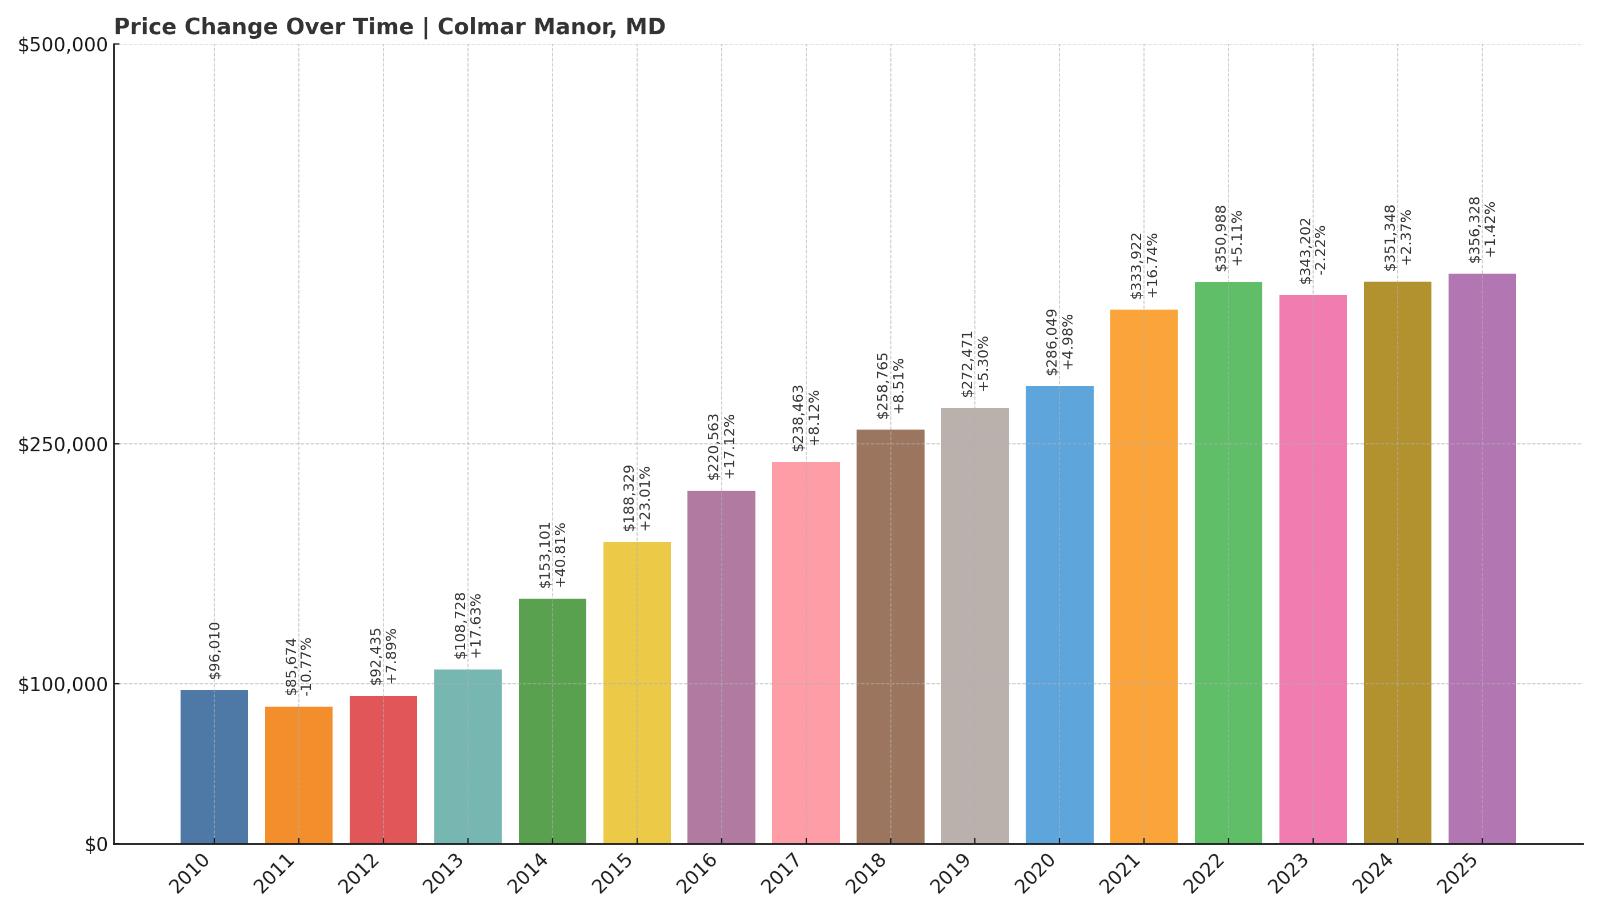
- Crash Risk Percentage: 52.52%
- Historical crashes (8%+ drops): 1
- Worst historical crash: -10.8% (2011)
- Total price increase since 2010: 271.1%
- Overextended above long-term average: 52.6%
- Price volatility (annual swings): 11.7%
- Current 2025 price: $356,328
Colmar Manor has one of the sharpest appreciation rates in Maryland, with home values up 271.1% since 2010. But this rapid rise comes with high volatility — nearly 12% annual swings — and the town now sits over 52% above its long-term pricing average. The last correction, a 10.8% drop in 2011, may offer a preview of what could come if prices reverse.
Colmar Manor – Booming Prices on Shaky Foundations
Nestled just outside the D.C. line, Colmar Manor is a compact residential enclave in Prince George’s County. Demand has skyrocketed due to its proximity to the capital and relative affordability — at least compared to inner D.C. markets. However, this boom may have overshot what the area can support long term.
With the most extreme growth of any town in this ranking, Colmar Manor appears dangerously overheated. If investors or first-time buyers pull back, the town could be at serious risk of a fast correction.
5. Cottage City – Crash Risk Percentage: 53.83%
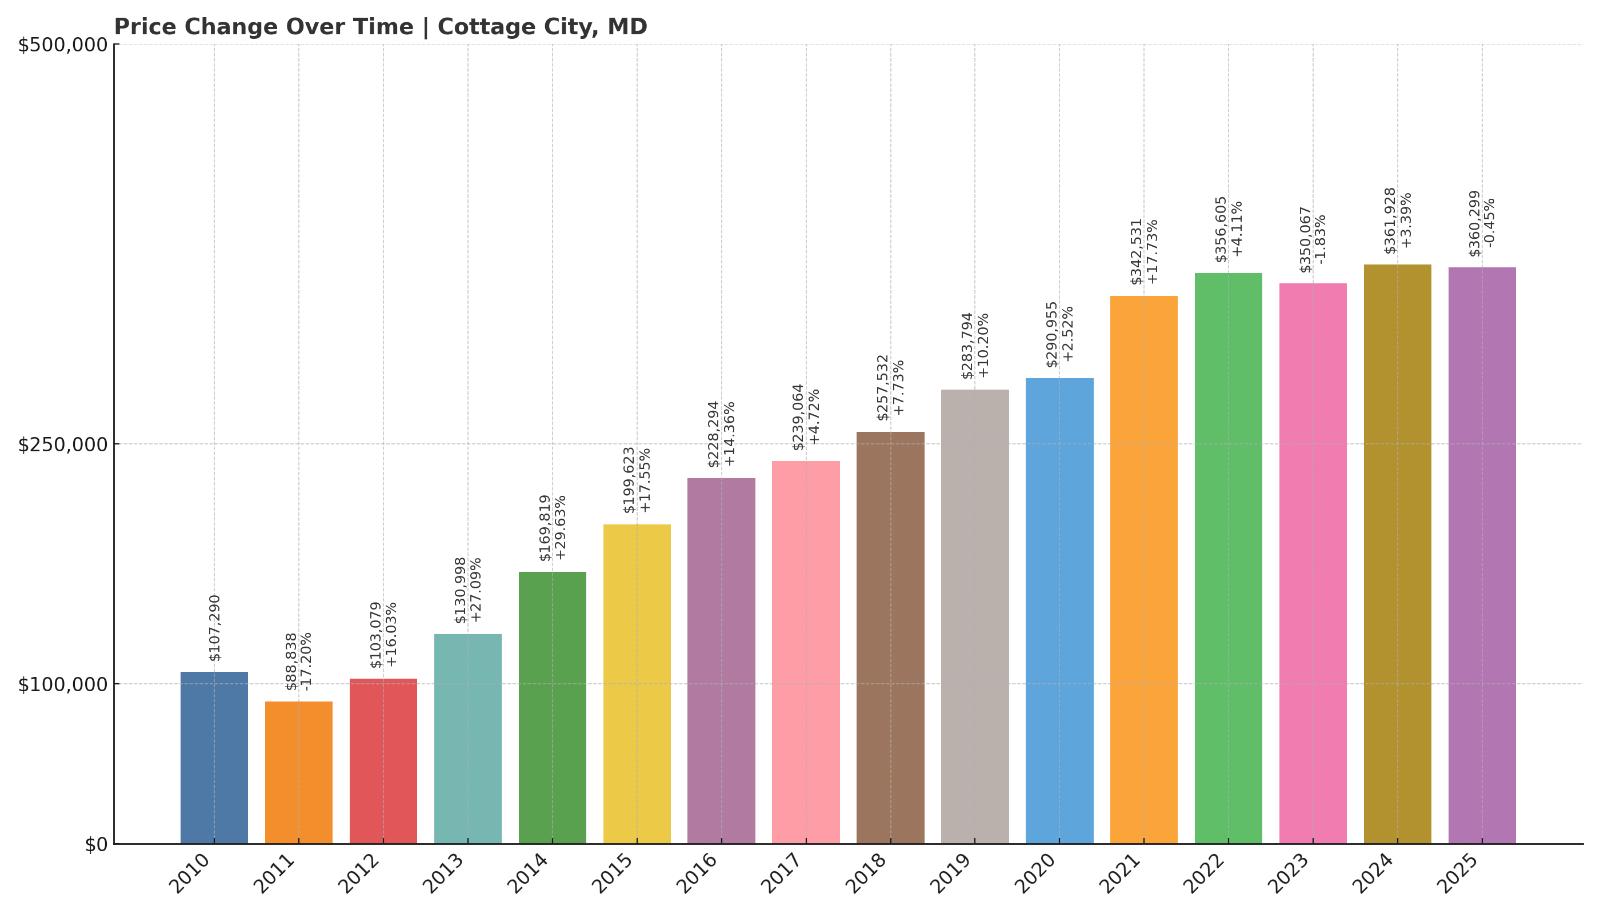
- Crash Risk Percentage: 53.83%
- Historical crashes (8%+ drops): 1
- Worst historical crash: -17.2% (2011)
- Total price increase since 2010: 235.8%
- Overextended above long-term average: 48.9%
- Price volatility (annual swings): 11.5%
- Current 2025 price: $360,299
Cottage City experienced one of the most severe historical drops in this group — a 17.2% price plunge in 2011. Since then, values have rebounded with a vengeance, rising more than 235%, but they now sit nearly 49% above the long-term trend. Price swings remain extreme at 11.5%, pushing its crash risk close to 54%.
Cottage City – A Whiplash Market With Major Swings

Located along the Anacostia River in Prince George’s County, Cottage City is a compact town with a tight housing supply and fast-changing prices. Its small size and location near the D.C. border have fueled explosive gains, but also leave it vulnerable to sharp corrections when demand slows.
The 2011 crash was the steepest among comparable towns and offers a cautionary tale. With high volatility and outsized recent gains, Cottage City may be especially prone to another dip — especially if affordability becomes a sticking point for buyers.
4. Welcome – Crash Risk Percentage: 55.46%
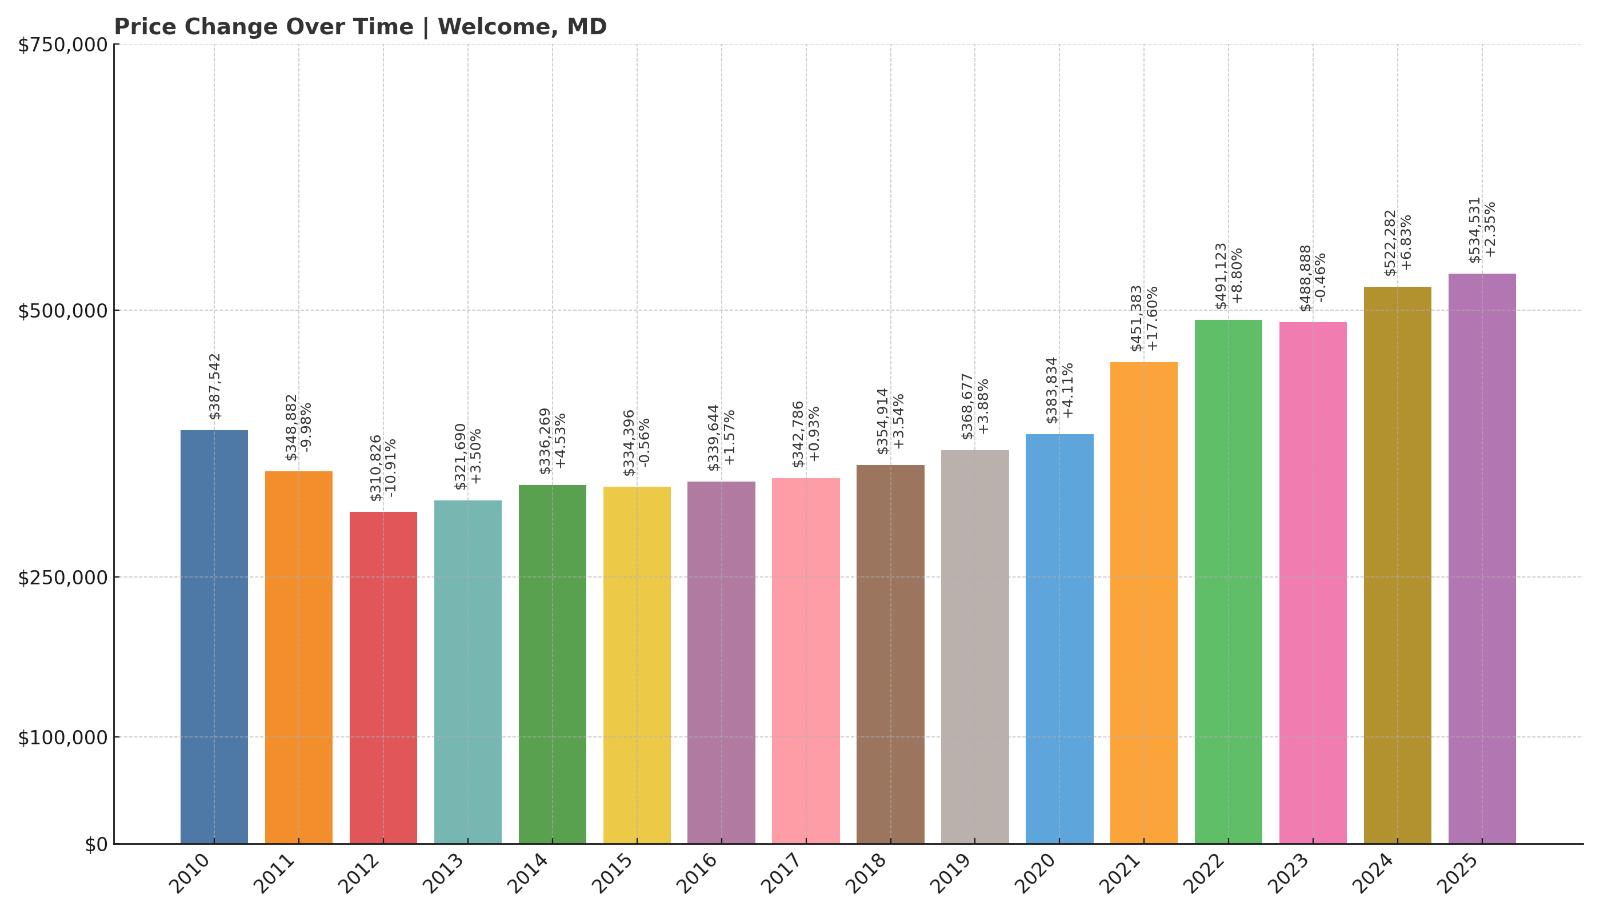
- Crash Risk Percentage: 55.46%
- Historical crashes (8%+ drops): 2
- Worst historical crash: -10.9% (2012)
- Total price increase since 2010: 37.9%
- Overextended above long-term average: 35.4%
- Price volatility (annual swings): 6.6%
- Current 2025 price: $534,531
Welcome has a relatively modest 37.9% price increase since 2010, but its current home values are still 35.4% above long-term trends. Two past crashes, including a 10.9% dip in 2012, and a current median price of over $534K raise serious concerns. With little sustained upward growth to justify high prices, the town has limited insulation if the market turns.
Welcome – High Prices, Low Support
🔥 Would you like to save this?
A rural community in Charles County, Welcome lives up to its name with scenic charm and a peaceful setting — but not necessarily a resilient housing market. Its price trajectory has been bumpy, with two significant crashes and only modest long-term gains.
The town’s current pricing looks disconnected from its economic fundamentals, and the lack of strong upward pressure in the past 15 years adds to the risk. At over half a million dollars per home, Welcome could face steep adjustments if demand eases.
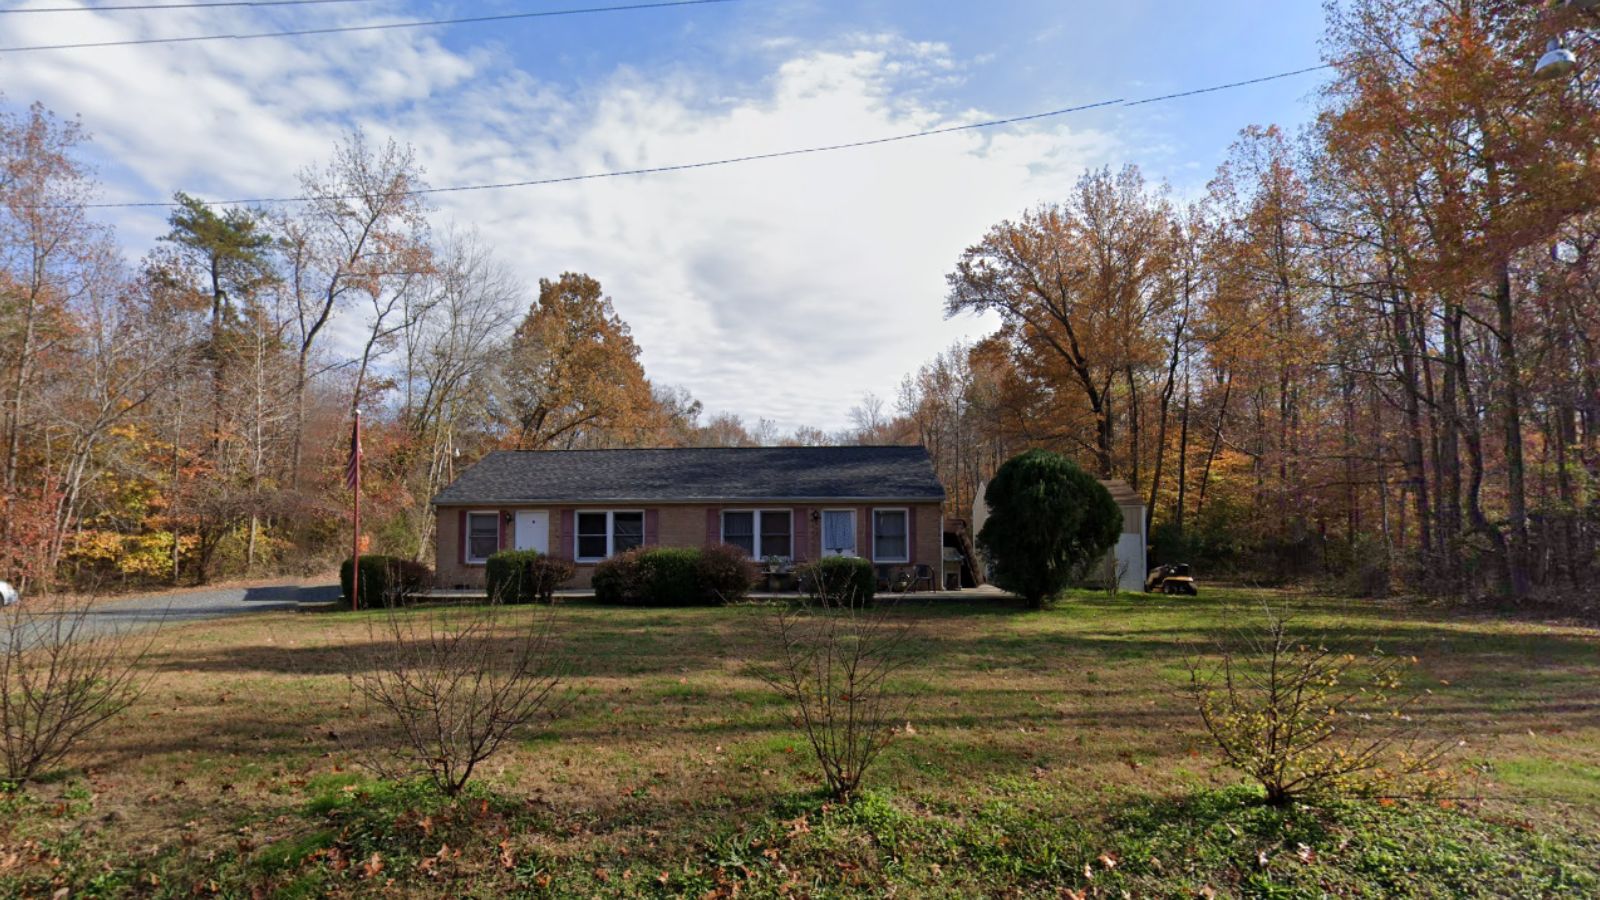
3. Saint Michaels – Crash Risk Percentage: 56.18%
- Crash Risk Percentage: 56.18%
- Historical crashes (8%+ drops): 1
- Worst historical crash: -11.5% (2012)
- Total price increase since 2010: 60.5%
- Overextended above long-term average: 46.6%
- Price volatility (annual swings): 7.4%
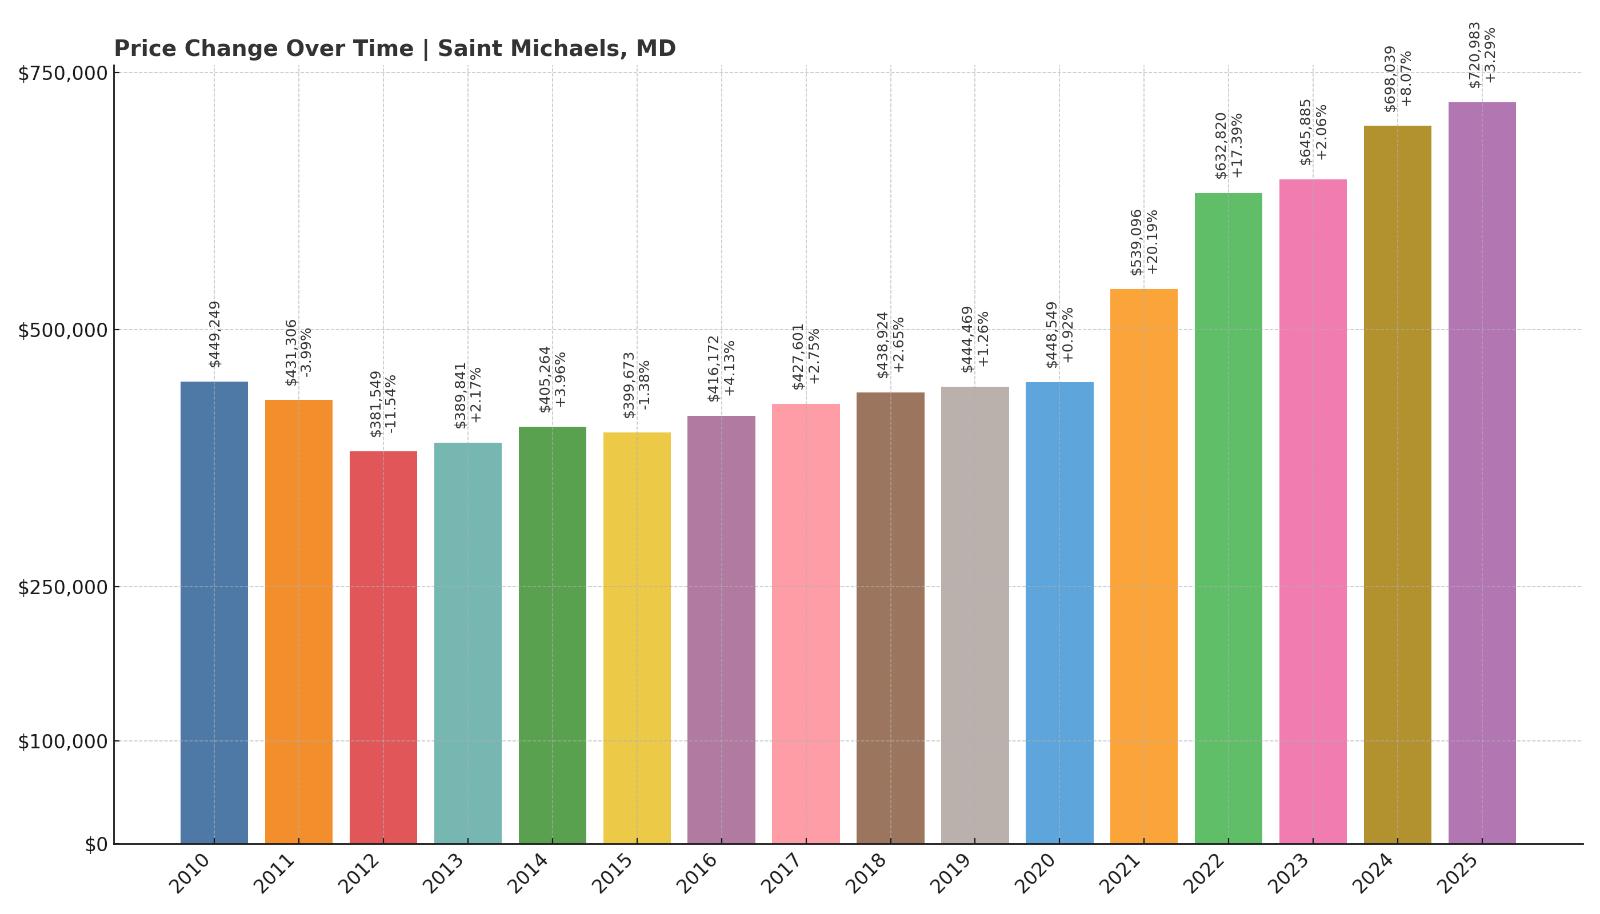
- Current 2025 price: $720,983
Saint Michaels stands as one of Maryland’s priciest small towns, with home values nearing $721K in 2025. Yet the town has a history of sharp corrections — including an 11.5% drop in 2012 — and is now 46.6% over its long-term average. Price volatility remains moderately high at 7.4%, and overall growth since 2010 has been a steady but unspectacular 60.5%. That imbalance between current pricing and long-term performance helps explain its elevated 56.18% crash risk.
Saint Michaels – Luxury Demand Meets Long-Term Risk
This historic harbor town in Talbot County is known for its maritime charm, upscale dining, and status as a weekend destination for D.C. and Baltimore residents. Tourism and second-home demand have fueled its housing market, sending prices to some of the highest levels on the Eastern Shore. But Saint Michaels’ reliance on discretionary and vacation-driven demand adds risk.
In downturns, second-home markets tend to correct faster and deeper — a pattern seen in 2012. With prices now well above historical trendlines, the town could again be vulnerable, particularly if higher interest rates or a slowdown in wealth-driven migration cool off luxury markets statewide.
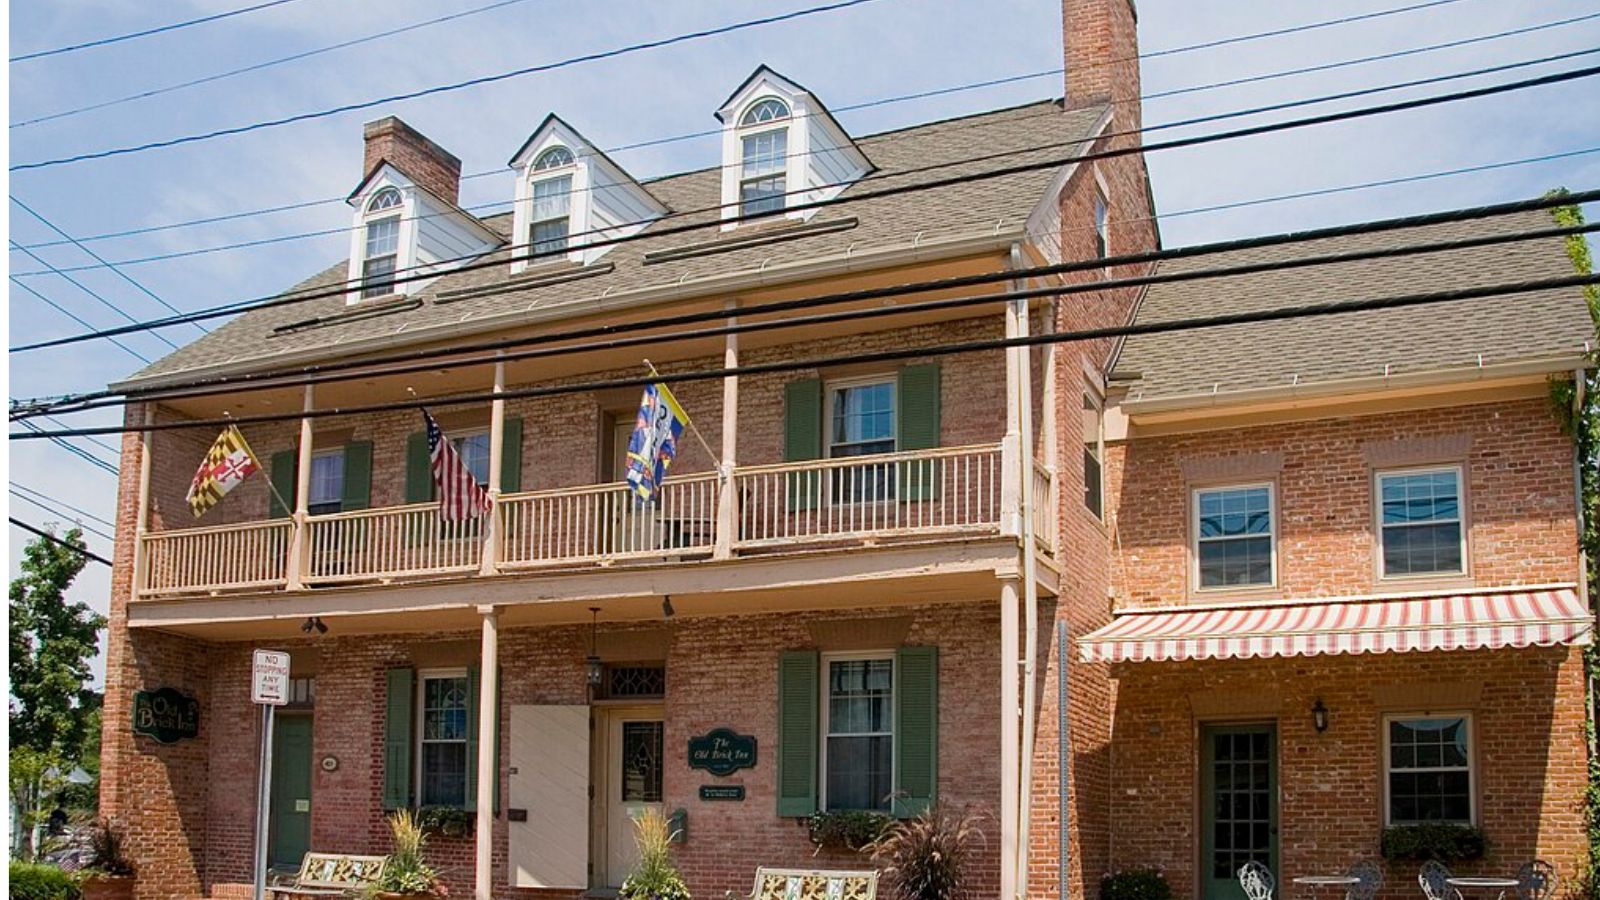
2. Sharptown – Crash Risk Percentage: 58.59%
- Crash Risk Percentage: 58.59%
- Historical crashes (8%+ drops): 2
- Worst historical crash: -15.9% (2013)
- Total price increase since 2010: 61.9%
- Overextended above long-term average: 55.2%
- Price volatility (annual swings): 9.9%
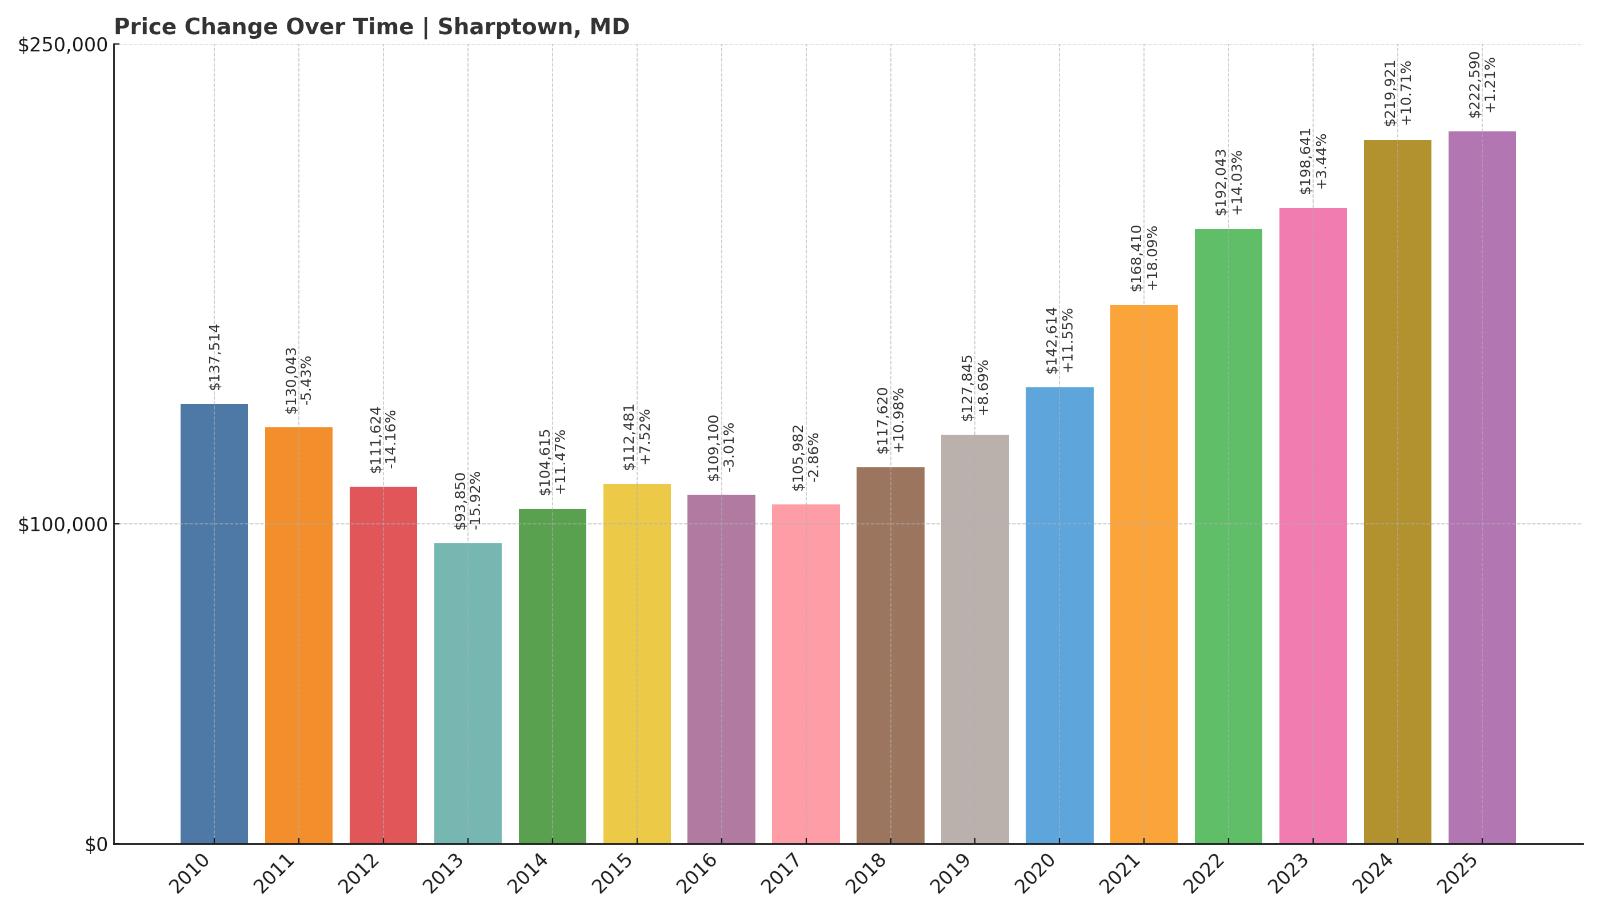
- Current 2025 price: $222,590
Sharptown may have one of the lowest current home values on this list — just $222,590 — but that doesn’t mean it’s low risk. In fact, it’s the opposite. The town has suffered two major crashes since 2010, including a brutal 15.9% drop in 2013. Prices are now over 55% above their long-term average, and annual volatility is among the highest in the state at nearly 10%. These factors combine for a 58.59% crash risk — the second highest in Maryland.
Sharptown – Small Town, Big Swings

Perched along the Nanticoke River in Wicomico County, Sharptown is a compact, working-class town with a limited housing base and very little new construction. That small size amplifies both the upswings and the crashes. The town’s affordability makes it appealing to some buyers, but it also lacks the economic engine or demand depth to support pricing that is so far above trend.
The last housing correction hit Sharptown especially hard, and the current market setup — high volatility, overextension, and limited local drivers — suggests it could happen again. If statewide conditions weaken, this is one of the first places where prices may respond sharply.
1. Royal Oak – Crash Risk Percentage: 65.88%
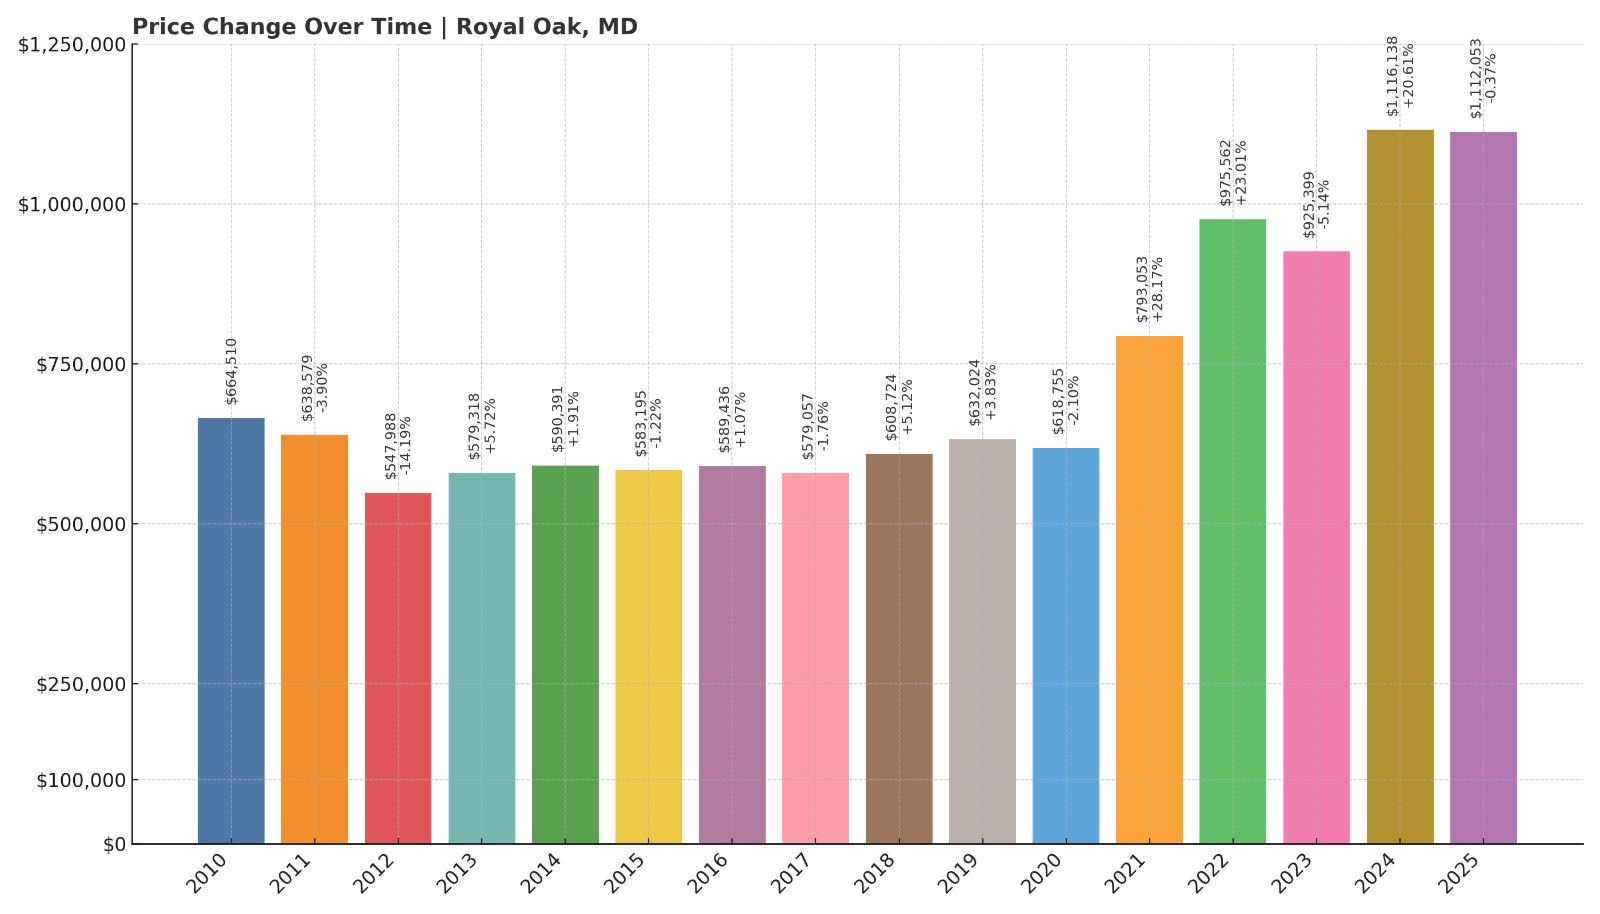
- Crash Risk Percentage: 65.88%
- Historical crashes (8%+ drops): 1
- Worst historical crash: -14.2% (2012)
- Total price increase since 2010: 67.3%
- Overextended above long-term average: 54.0%
- Price volatility (annual swings): 11.1%
- Current 2025 price: $1,112,053
Royal Oak tops this list with the highest crash risk in Maryland — nearly 66%. That score reflects a convergence of red flags: extreme overextension (54% above trend), a prior crash of 14.2% in 2012, and steep annual price swings of 11.1%. The current home value of over $1.1 million is wildly out of step with the town’s historical performance, having grown just 67.3% since 2010. The math here suggests a correction is not just possible — it may be overdue.
Royal Oak – Million-Dollar Prices With Fragile Footing
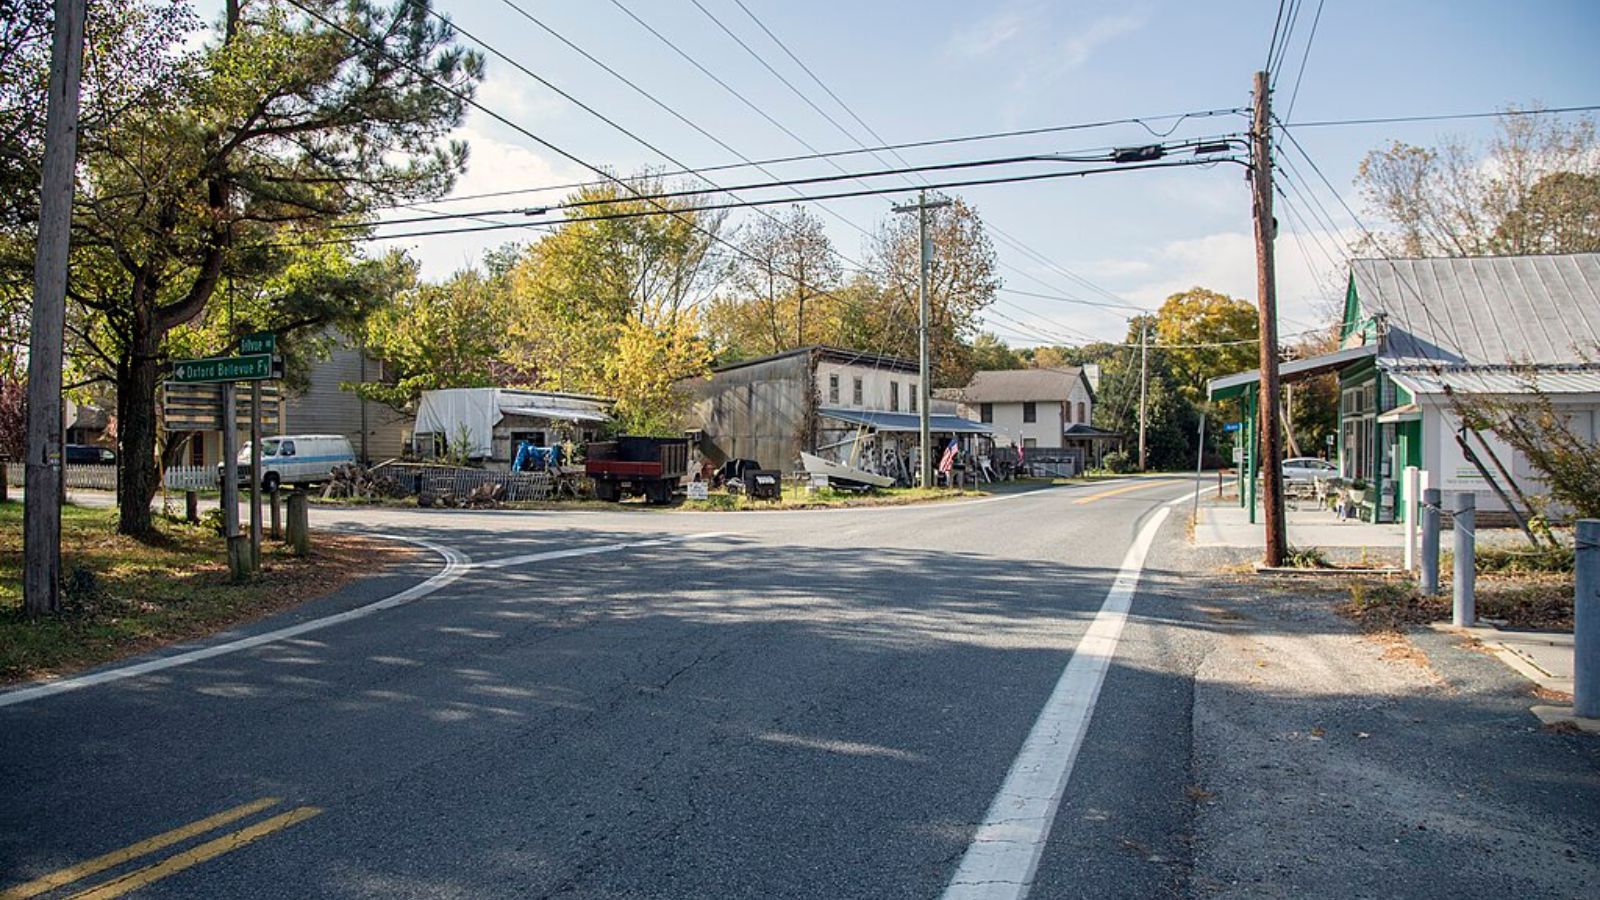
Located just outside Saint Michaels in Talbot County, Royal Oak has attracted affluent buyers seeking water access, privacy, and Eastern Shore charm. But its luxury market is built on a narrow base of demand, and like many high-end coastal communities, it’s sensitive to shifts in wealth, interest rates, and second-home trends.
With the highest median price on this list and some of the most aggressive swings in the state, Royal Oak is highly exposed. In the event of a broader market cooldown, there’s limited room for error — and a high chance that prices could retreat significantly from today’s lofty levels.


