🔥 Would you like to save this?
I’ve been analyzing the Zillow Home Value Index for Connecticut towns, and the results are truly eye-opening. Connecticut’s housing ma/……. rket has undergone remarkable transformation in the past five years, with even the most affordable towns seeing an average value increase of 68.96% since 2020. What’s particularly fascinating is how cities like Waterbury have experienced explosive growth of 108.25% since 2020, more than doubling their home values in just five years.
The data reveals a clear geographic pattern in affordability. Hartford County dominates the list with 9 of the 25 most affordable towns, while Windham and New Haven counties tie for second place with 4 towns each. This concentration suggests that economic factors are definitely not evenly distributed across Connecticut’s eight counties. Most striking is that Hartford, the state capital, remains the most affordable city in Connecticut despite experiencing a 56.13% increase in home values since 2020.
In order to come up with the very specific design ideas, we create most designs with the assistance of state-of-the-art AI interior design software.
Looking deeper into the numbers, I discovered that the average home value among these 25 least expensive towns is now $287,448, significantly higher than the $166,998 average from 2020. This dramatic rise suggests that even Connecticut’s traditionally affordable areas are becoming increasingly expensive, potentially impacting housing accessibility for many residents. The question remains: will this trend continue, or are we reaching a plateau?
Here’ the list.
1. Plainfield
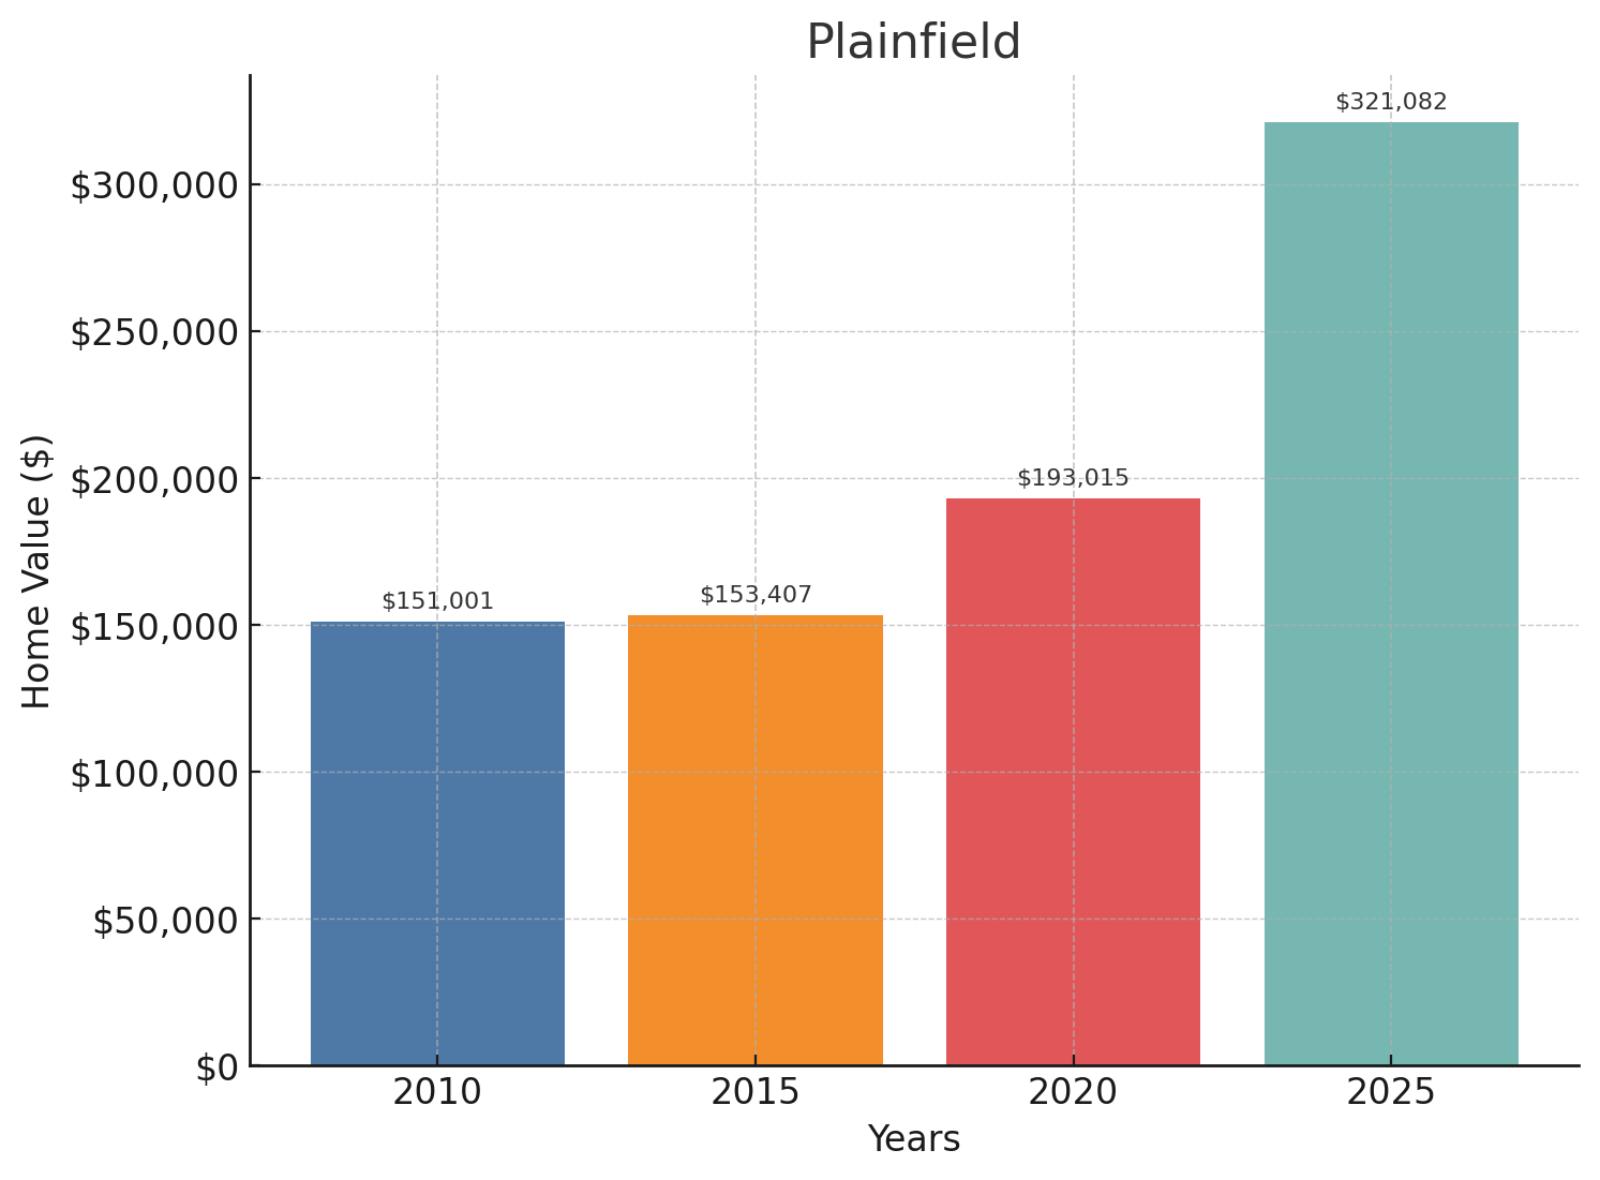
- 2025 Value: $321,082
- 2020 Value: $193,015
- 2015 Value: $153,407
- 2010 Value: $151,001
- Change 2010-2025: 112.64%
- Change 2015-2025: 109.30%
- Change 2020-2025: 66.35%
Topping our list of affordable Connecticut towns, Plainfield has more than doubled in value since 2010, jumping 112.64% from $151,001 to $321,082 in 2025, with similarly impressive growth of 109.30% since 2015’s $153,407 and 66.35% from 2020’s $193,015.
This rural town in Windham County in northeastern Connecticut includes four distinct villages (Plainfield, Moosup, Wauregan, and Central Village) and offers countryside living with convenient access to both Providence, Rhode Island and Worcester, Massachusetts metropolitan areas.
2. Montville
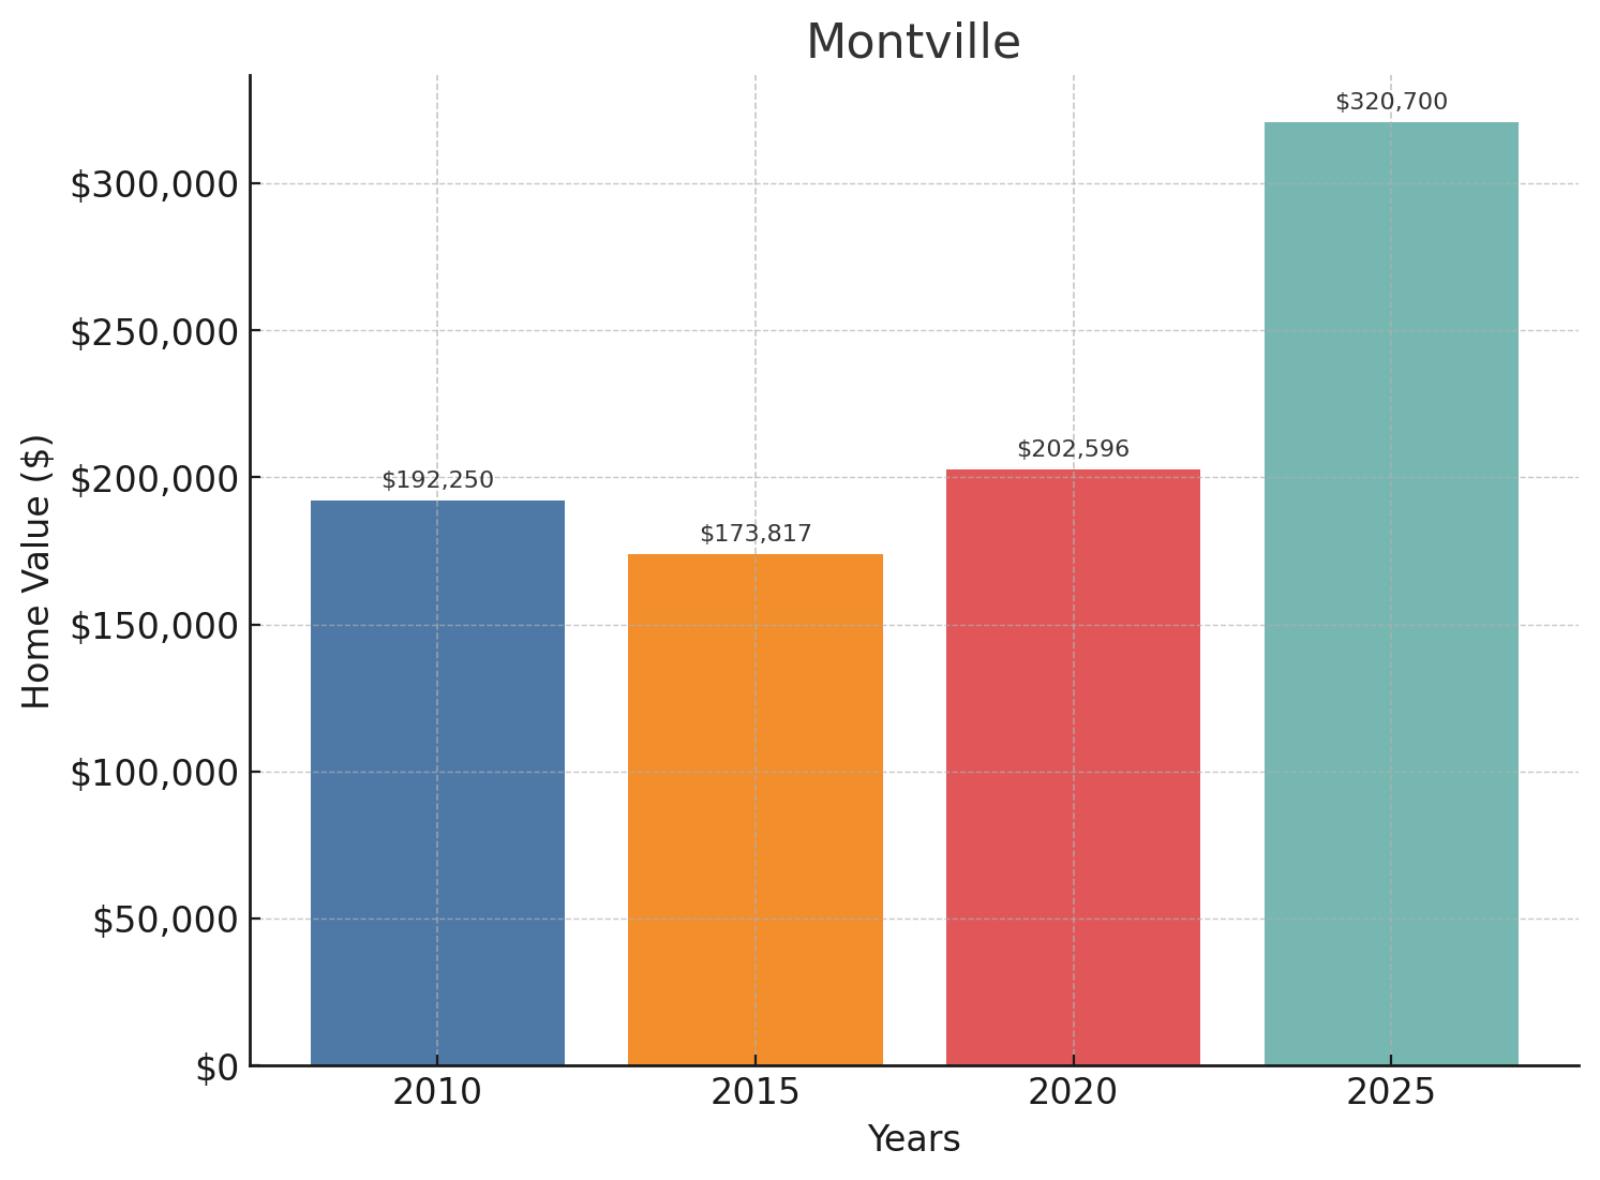
- 2025 Value: $320,700
- 2020 Value: $202,596
- 2015 Value: $173,817
- 2010 Value: $192,250
- Change 2010-2025: 66.81%
- Change 2015-2025: 84.50%
- Change 2020-2025: 58.30%
Montville’s casino proximity has helped values increase 58.30% from $202,596 in 2020 to $320,700 in 2025, continuing a trend that saw 84.50% growth from 2015’s $173,817 and 66.81% from 2010’s $192,250.
Located in New London County near the Mohegan Sun casino, this collection of villages includes Uncasville, Oakdale, and Chesterfield, offering diverse housing options from rural settings to more developed neighborhoods within easy reach of southeastern Connecticut’s major employers.
3. Derby
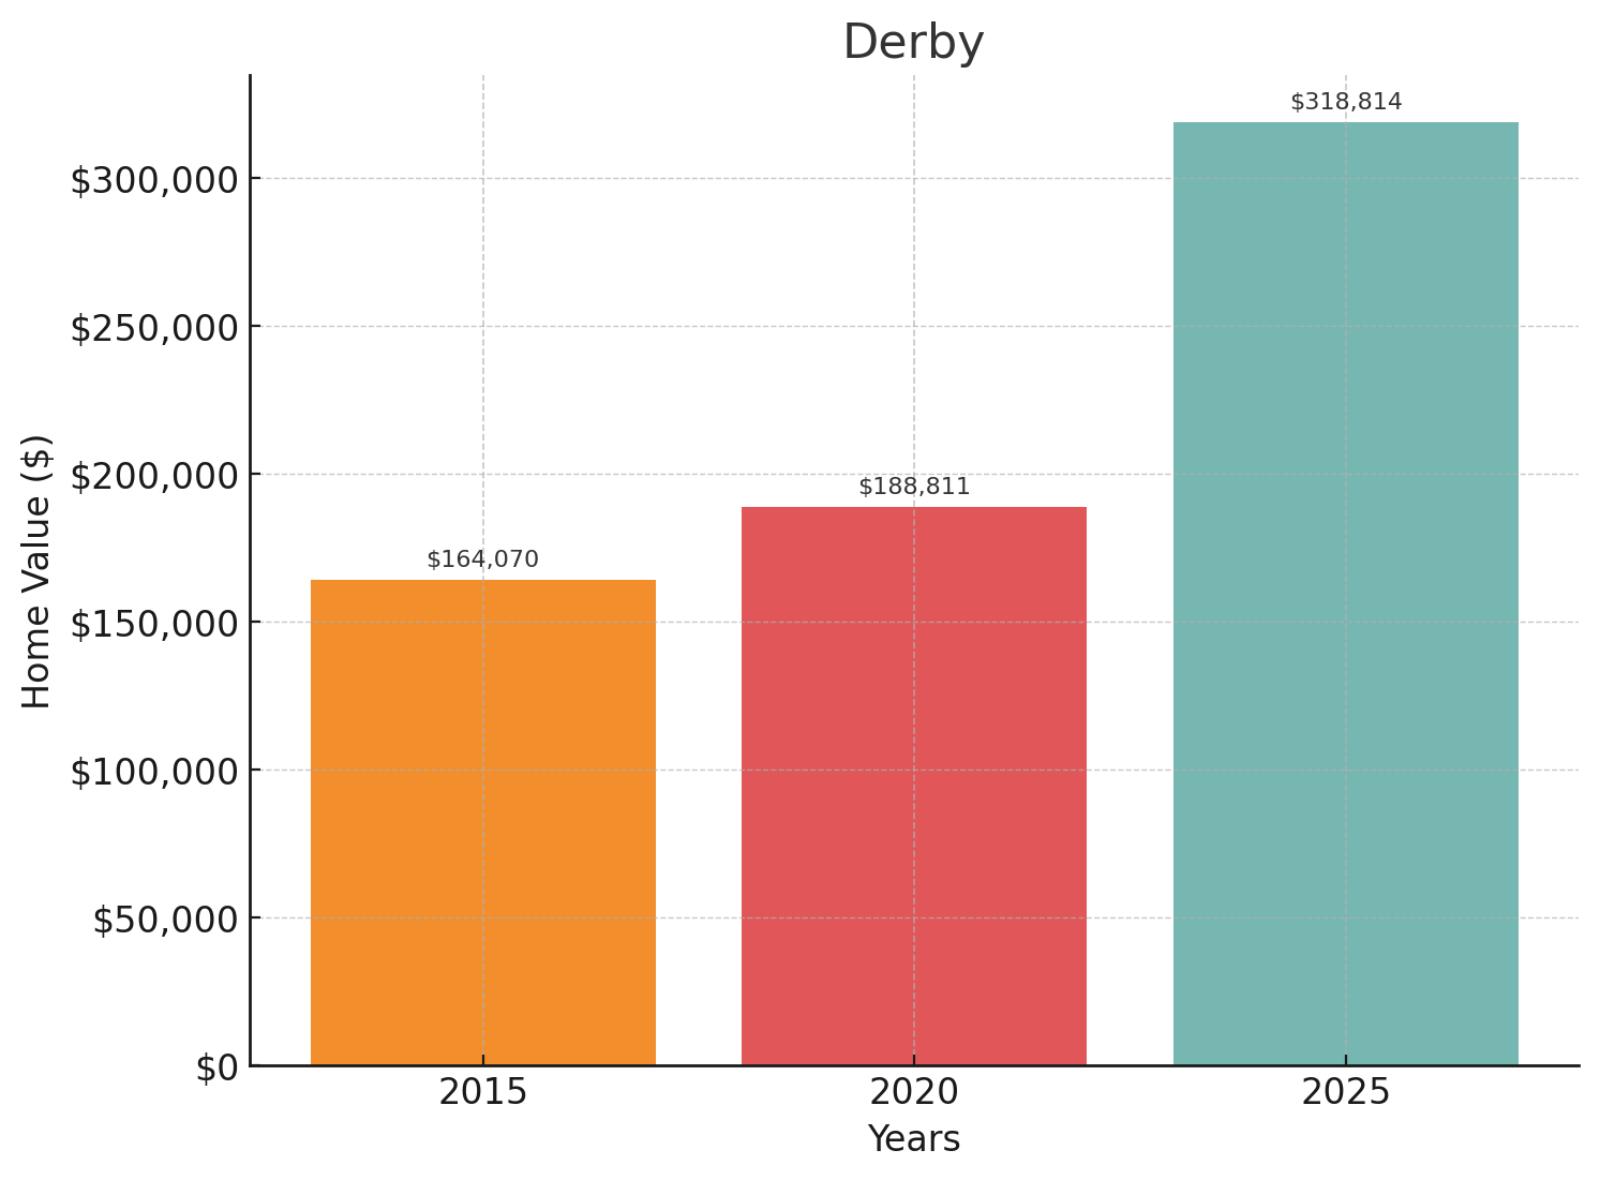
- 2025 Value: $318,814
- 2020 Value: $188,811
- 2015 Value: $164,070
- 2010 Value: No data
- Change 2010-2025: N/A
- Change 2015-2025: 94.32%
- Change 2020-2025: 68.85%
Connecticut’s smallest city has seen substantial growth, with Derby’s home values increasing 68.85% from $188,811 in 2020 to $318,814 in 2025, and nearly doubling (94.32%) since 2015’s $164,070.
Situated at the confluence of the Housatonic and Naugatuck Rivers in New Haven County, this historic industrial city played a pivotal role in American manufacturing history and now offers affordable housing options within the greater New Haven metropolitan area.
4. Vernon Rockville
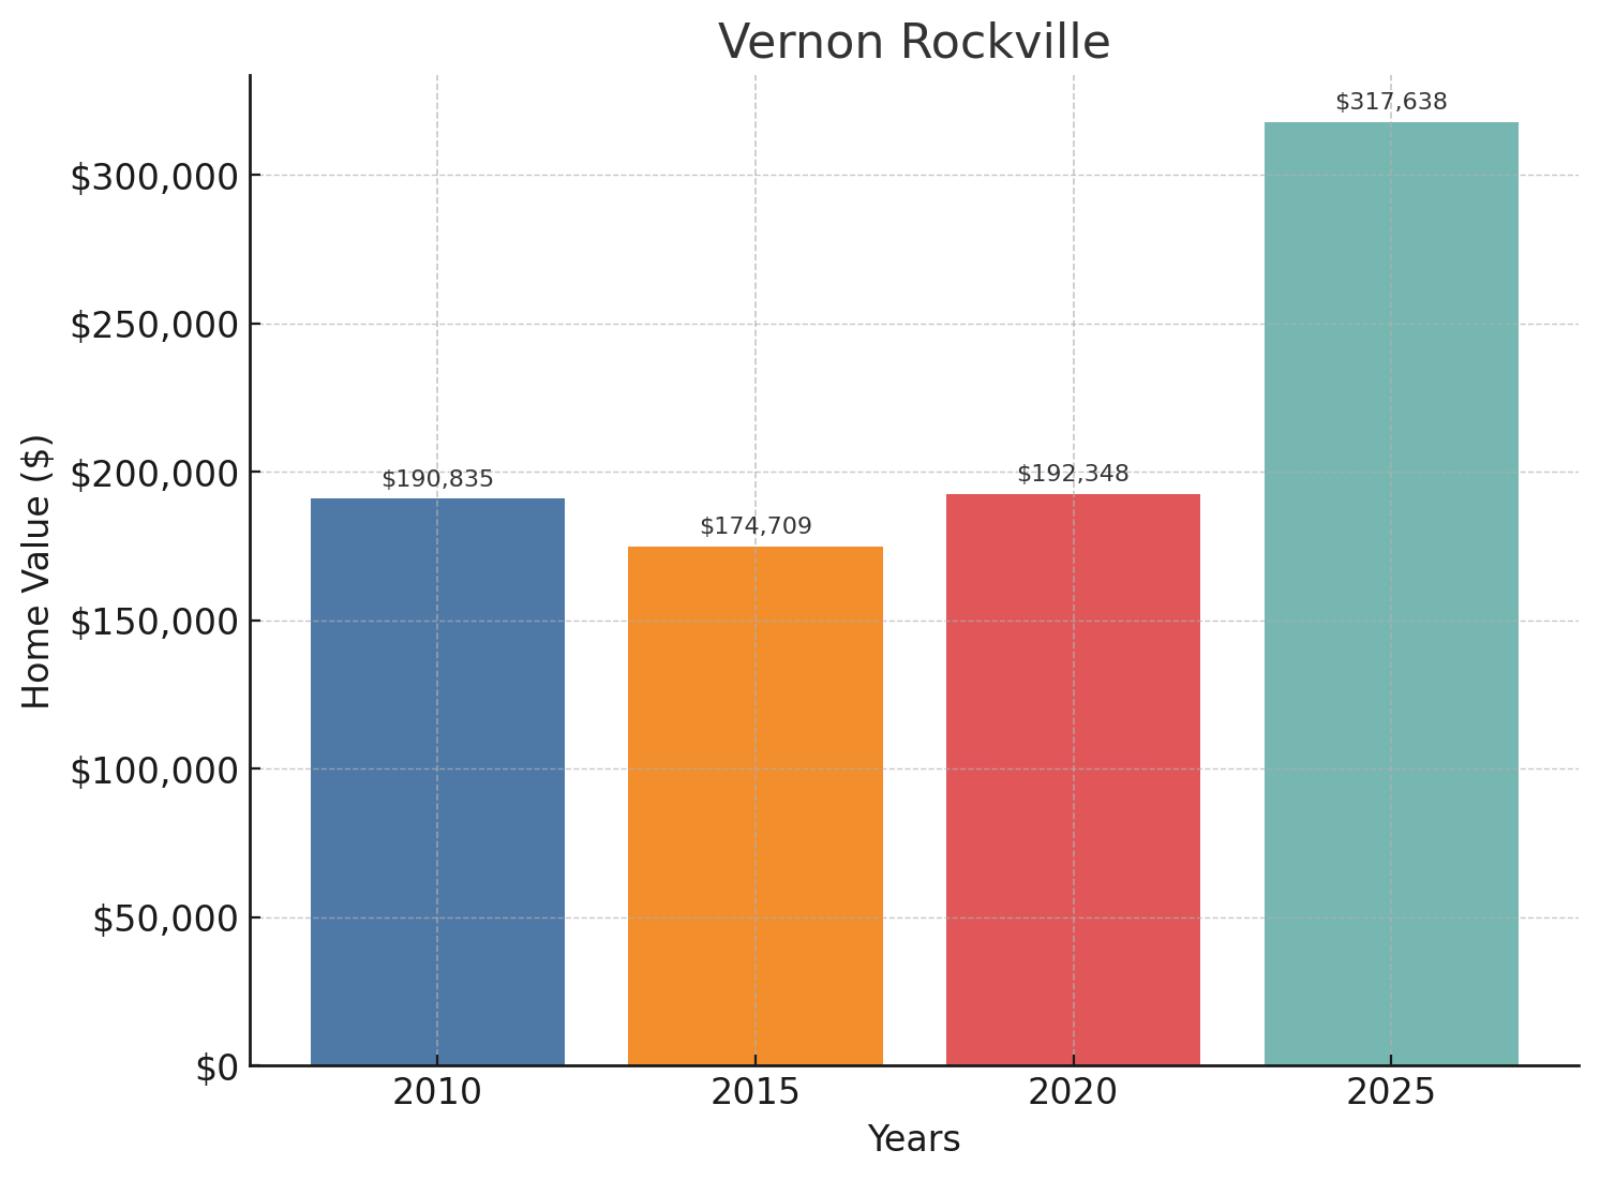
- 2025 Value: $317,638
- 2020 Value: $192,348
- 2015 Value: $174,709
- 2010 Value: $190,835
- Change 2010-2025: 66.45%
- Change 2015-2025: 81.81%
- Change 2020-2025: 65.14%
Vernon’s housing market has experienced solid growth with values increasing 65.14% from $192,348 in 2020 to $317,638 in 2025, building on an 81.81% rise from 2015’s $174,709 and 66.45% from 2010’s $190,835.
This diverse community in Tolland County includes the historic Rockville section with its impressive Victorian architecture alongside more suburban neighborhoods, all benefiting from convenient access to both Hartford and the University of Connecticut in nearby Storrs.
5. Bristol

- 2025 Value: $312,625
- 2020 Value: $185,794
- 2015 Value: $162,754
- 2010 Value: $174,754
- Change 2010-2025: 78.89%
- Change 2015-2025: 92.08%
- Change 2020-2025: 68.26%
The Mum City has blossomed with real estate growth of 68.26% from $185,794 in 2020 to $312,625 in 2025, nearly doubling (92.08%) from 2015’s $162,754 and climbing 78.89% from 2010’s $174,754.
Located in Hartford County, Bristol combines industrial heritage as the former home of ESPN and American clock manufacturing with family-friendly amenities, including Lake Compounce, America’s oldest continuously operating amusement park.
6. Stafford Springs
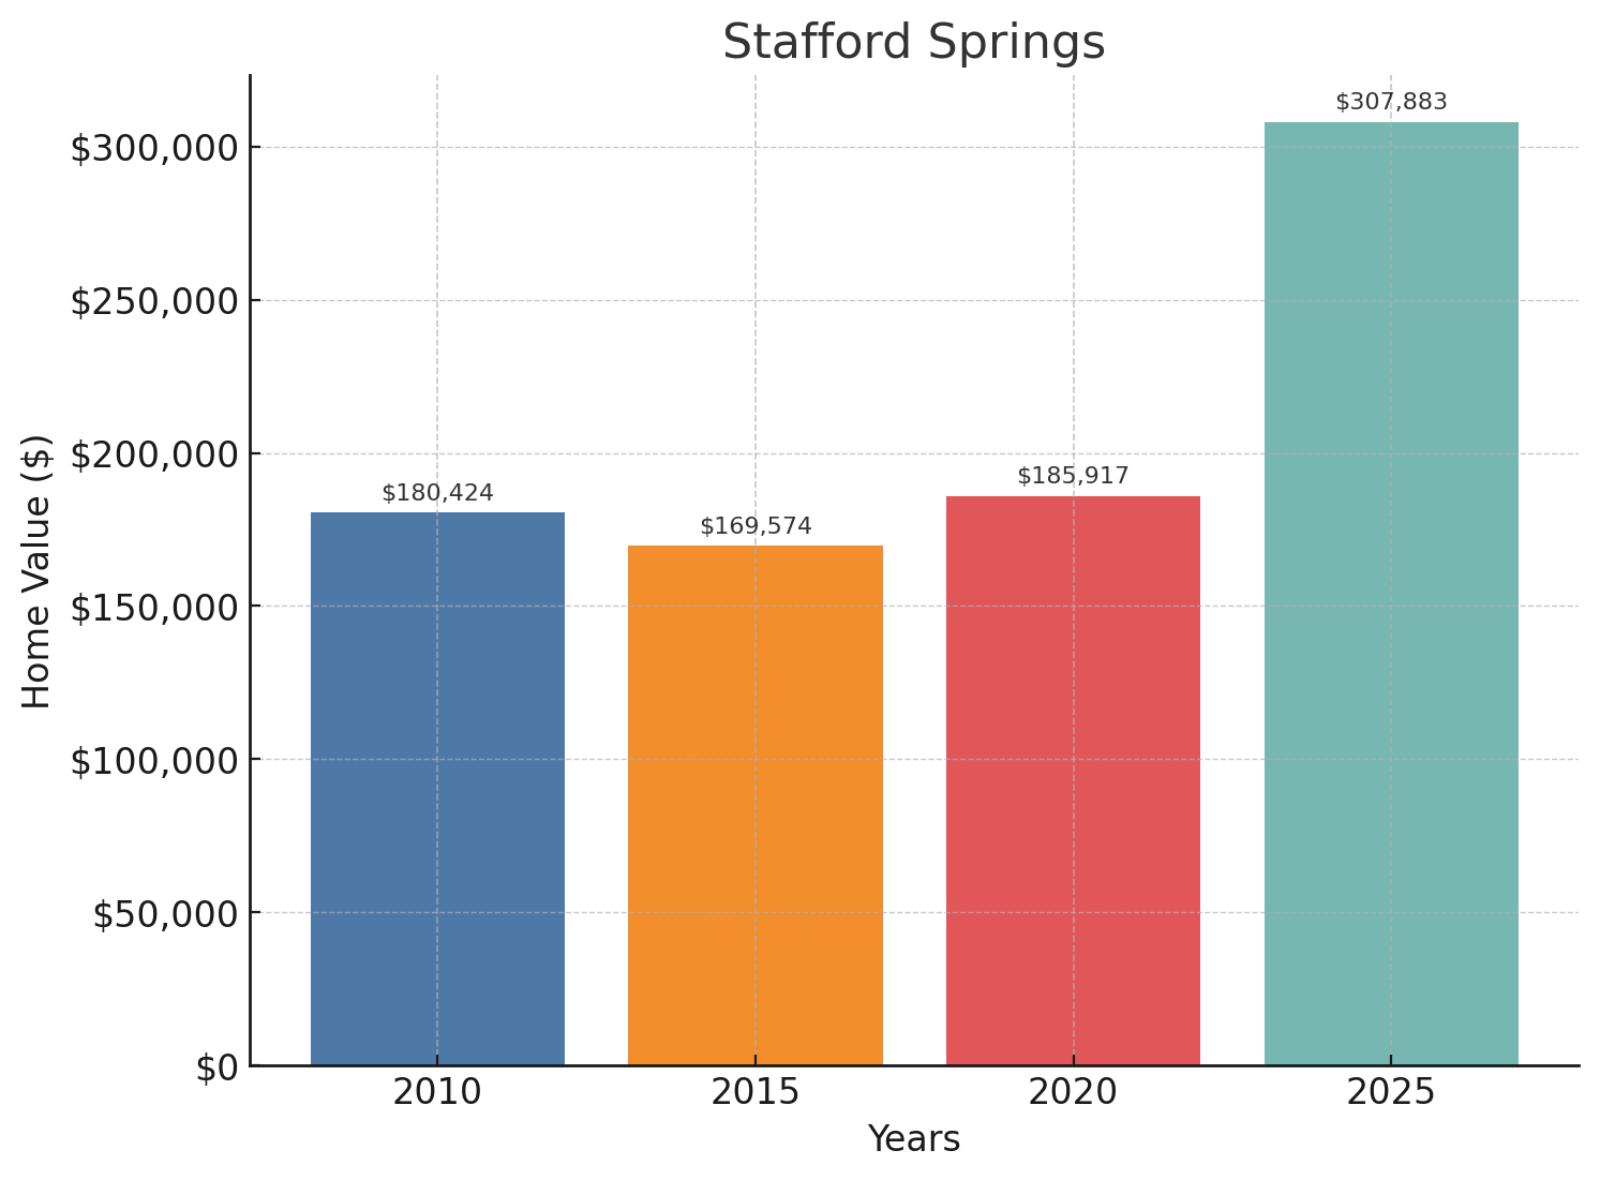
- 2025 Value: $307,883
- 2020 Value: $185,917
- 2015 Value: $169,574
- 2010 Value: $180,424
- Change 2010-2025: 70.64%
- Change 2015-2025: 81.56%
- Change 2020-2025: 65.60%
The mineral springs that once attracted visitors to Stafford Springs have been replaced by housing affordability, with values climbing 65.60% from $185,917 in 2020 to $307,883 in 2025, part of a consistent pattern showing 81.56% growth from 2015’s $169,574 and 70.64% from 2010’s $180,424.
Nestled in the northeastern corner of Connecticut in Tolland County, this historic mill village offers authentic New England charm with its picturesque Main Street and surrounding rural landscapes providing a genuine small-town experience.
7. Enfield

- 2025 Value: $307,483
- 2020 Value: $190,824
- 2015 Value: $166,009
- 2010 Value: No data
- Change 2010-2025: N/A
- Change 2015-2025: 85.22%
- Change 2020-2025: 61.13%
Enfield’s border location has attracted steady investment, pushing values up 61.13% from $190,824 in 2020 to $307,483 in 2025, with an 85.22% increase since 2015’s $166,009.
Positioned at Connecticut’s northern edge in Hartford County along the Massachusetts border, this strategic town offers residents the unique advantage of easy access to both Springfield’s employment opportunities and Hartford’s urban amenities while maintaining its own distinct community character.
8. Plymouth
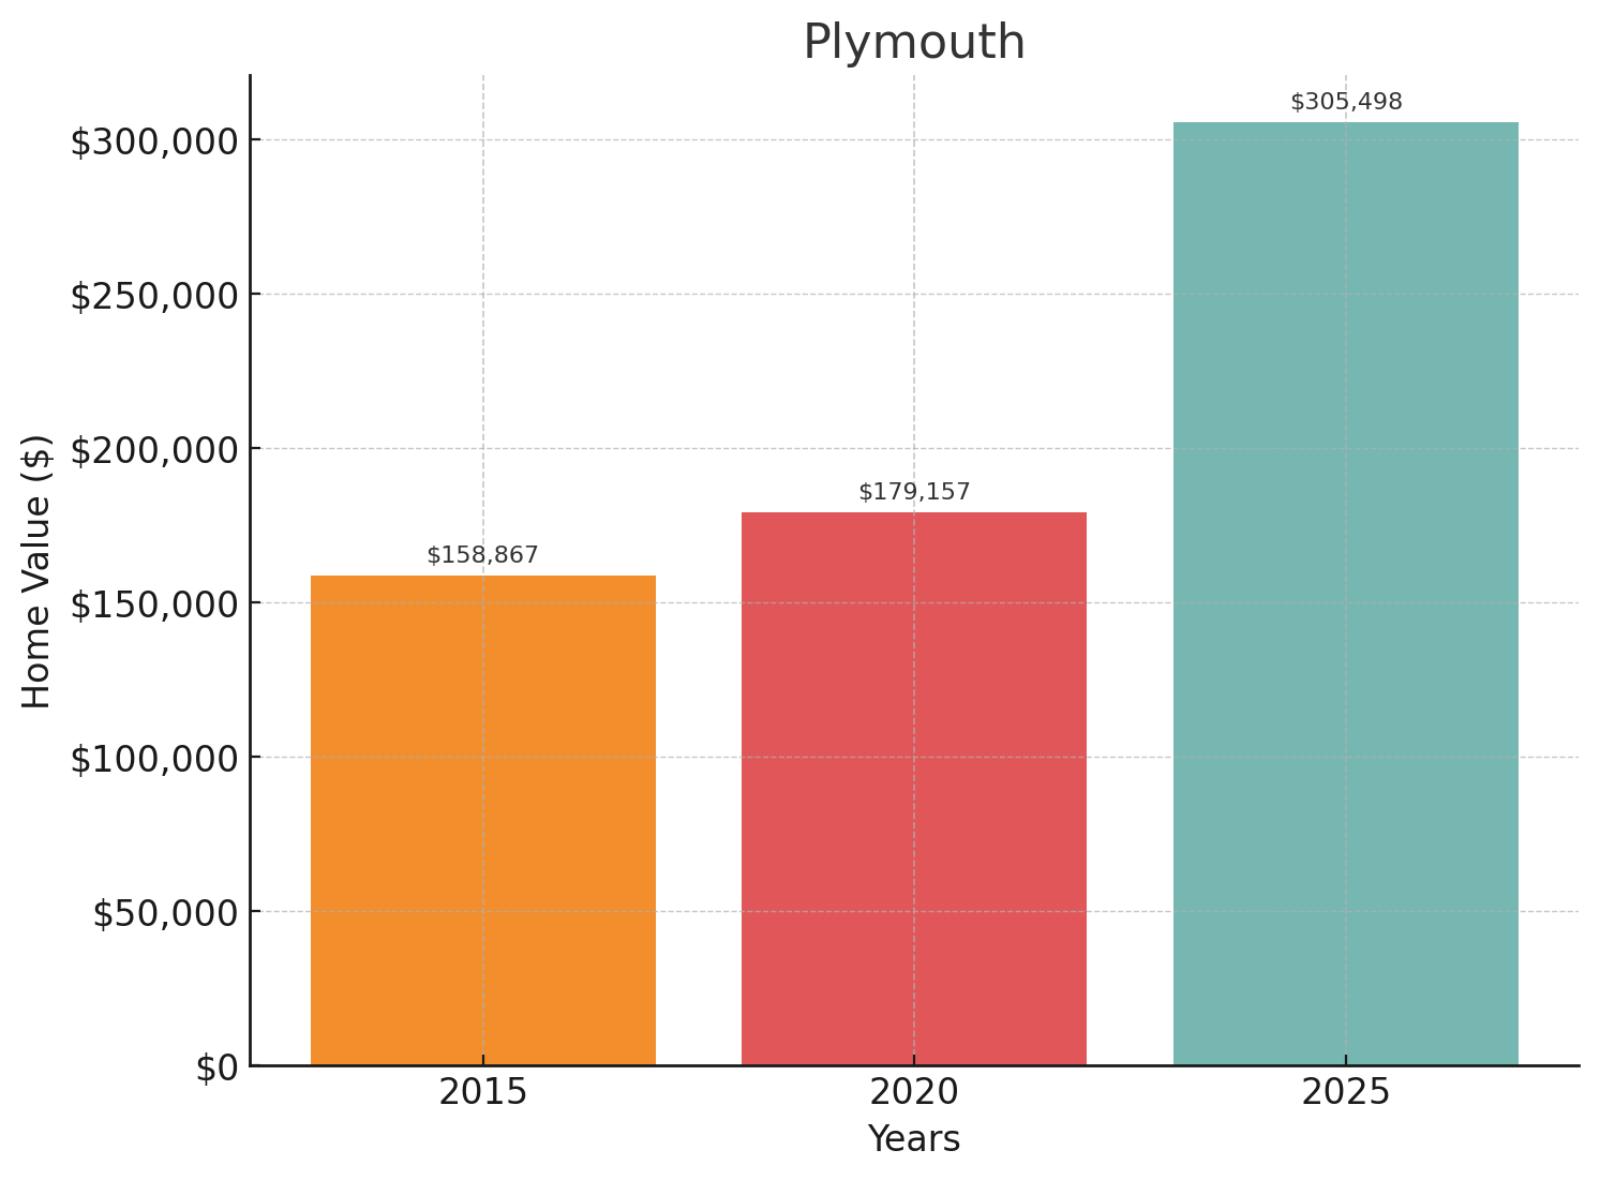
- 2025 Value: $305,498
- 2020 Value: $179,157
- 2015 Value: $158,867
- 2010 Value: No data
- Change 2010-2025: N/A
- Change 2015-2025: 92.30%
- Change 2020-2025: 70.52%
Plymouth’s serene setting hasn’t prevented considerable growth, with values rising 70.52% from $179,157 in 2020 to $305,498 in 2025, and nearly doubling (92.30%) since 2015’s average of $158,867.
This historic town in Litchfield County encompasses the village of Terryville and features rolling hills and pristine lakes, offering a peaceful retreat within reasonable commuting distance to Bristol, Waterbury, and Hartford.
9. Plainville
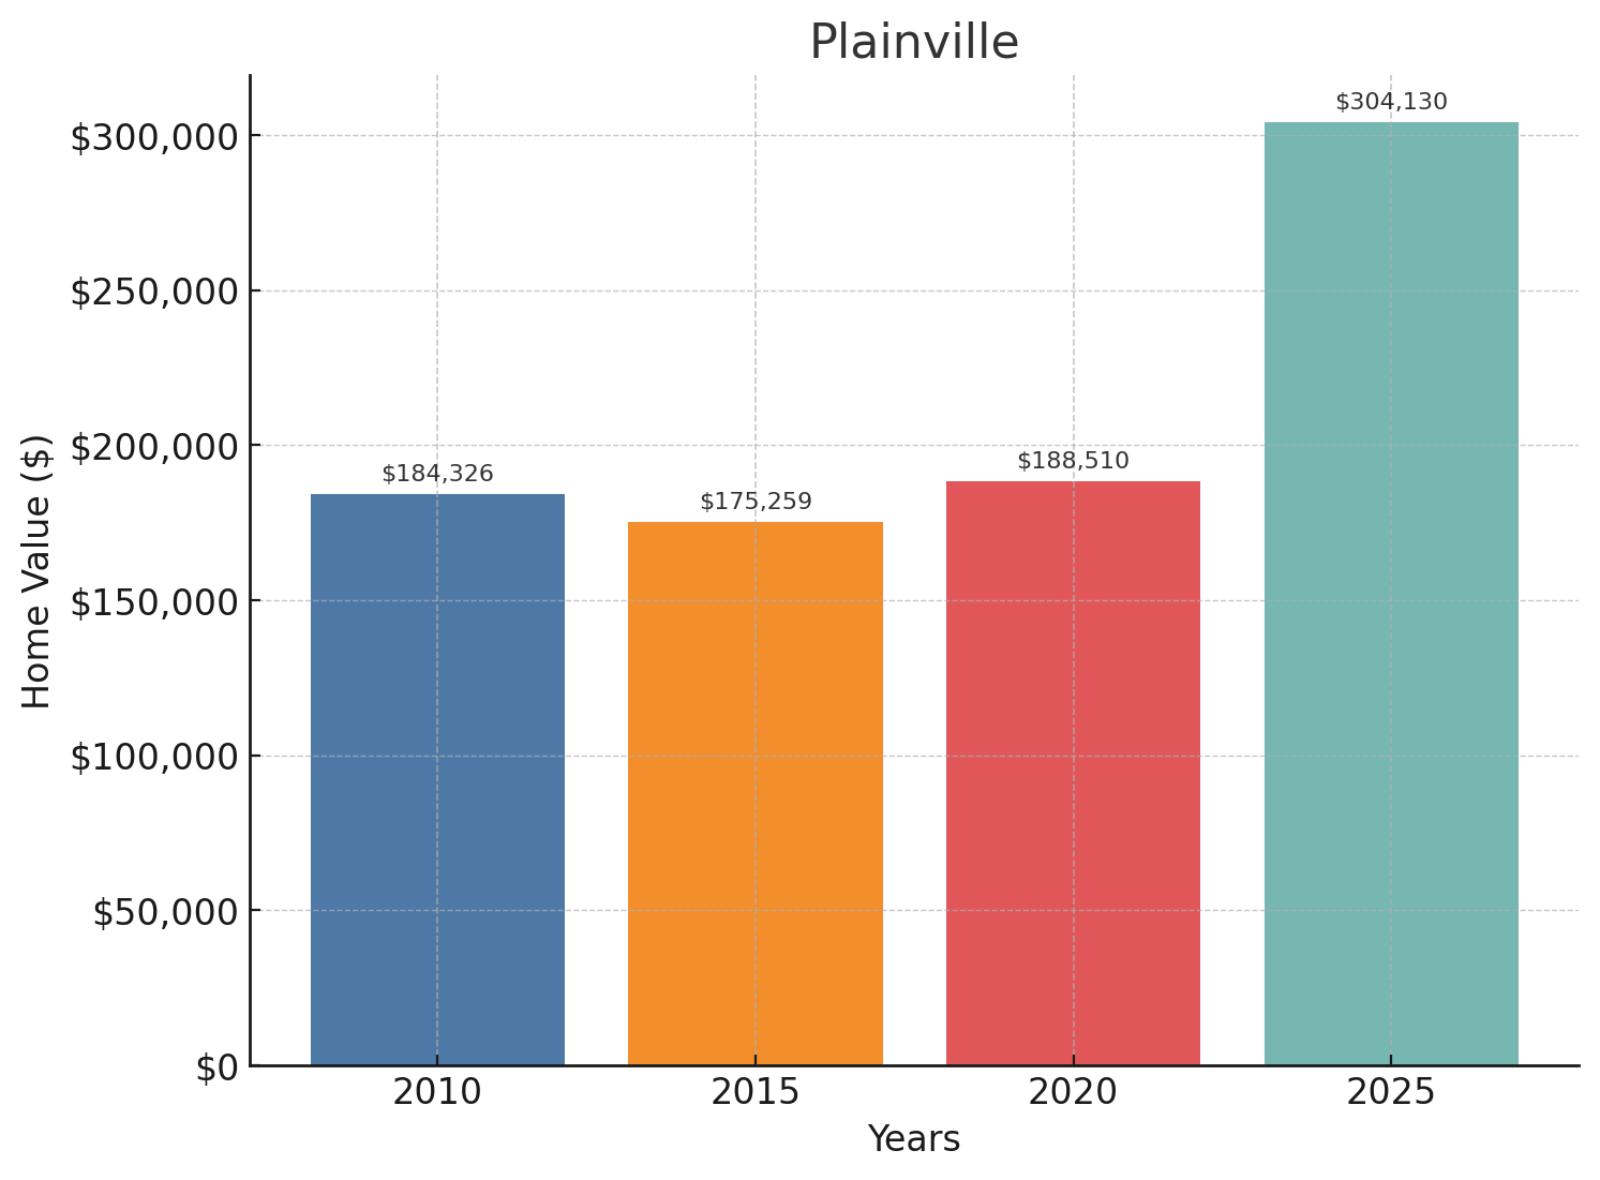
- 2025 Value: $304,130
- 2020 Value: $188,510
- 2015 Value: $175,259
- 2010 Value: $184,326
- Change 2010-2025: 65.00%
- Change 2015-2025: 73.53%
- Change 2020-2025: 61.33%
Plainville’s real estate has appreciated steadily with homes climbing 61.33% from $188,510 in 2020 to $304,130 in 2025, part of a longer trend showing 73.53% growth from 2015’s $175,259 and 65.00% from 2010’s $184,326.
This compact community in Hartford County sits at the geographical center of Connecticut, offering the perfect blend of small-town atmosphere with excellent highway access to major employment centers in Hartford, New Britain, and Bristol.
10. Manchester
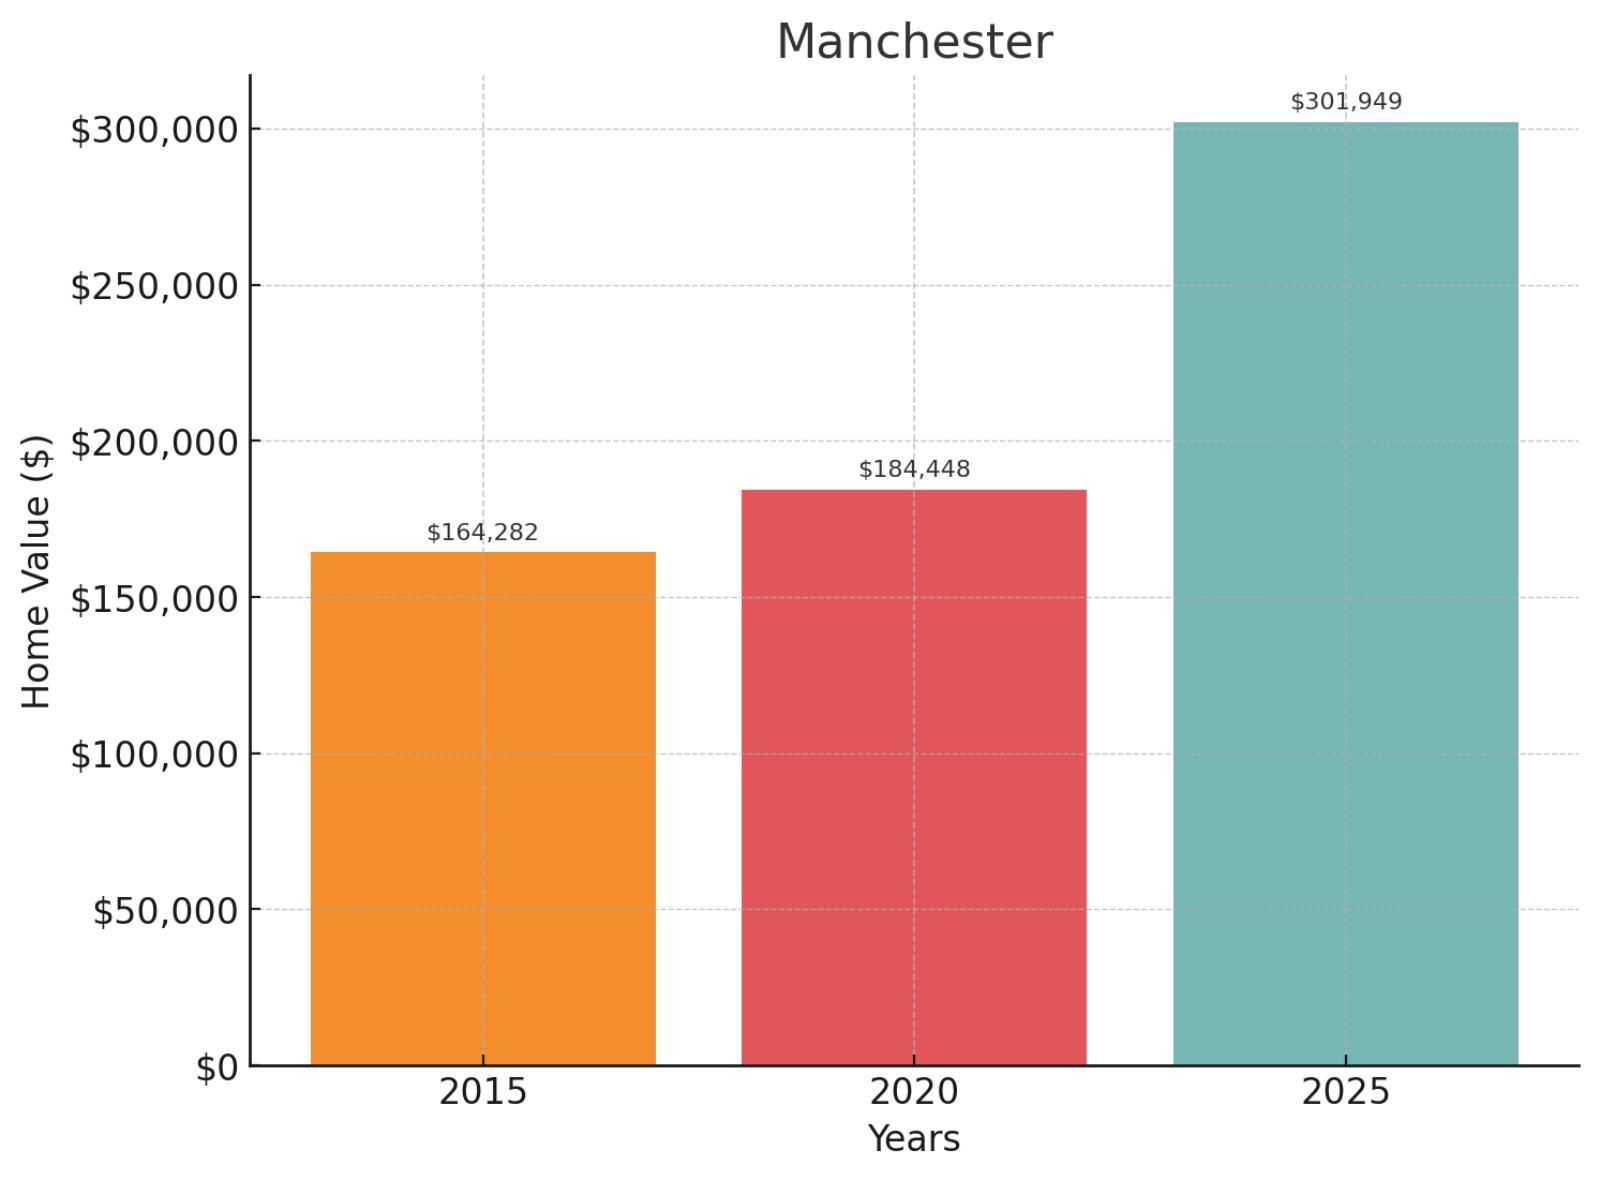
- 2025 Value: $301,949
- 2020 Value: $184,448
- 2015 Value: $164,282
- 2010 Value: No data
- Change 2010-2025: N/A
- Change 2015-2025: 83.80%
- Change 2020-2025: 63.70%
Manchester’s suburban appeal has driven values up 63.70% from $184,448 in 2020 to $301,949 in 2025, building on an 83.80% increase since 2015’s $164,282.
Once known as the “Silk City” for its historic textile industry, this Hartford County town east of the capital blends commercial vitality with residential comfort, featuring Connecticut’s largest shopping mall alongside historic mill buildings repurposed for modern living.
11. New Haven
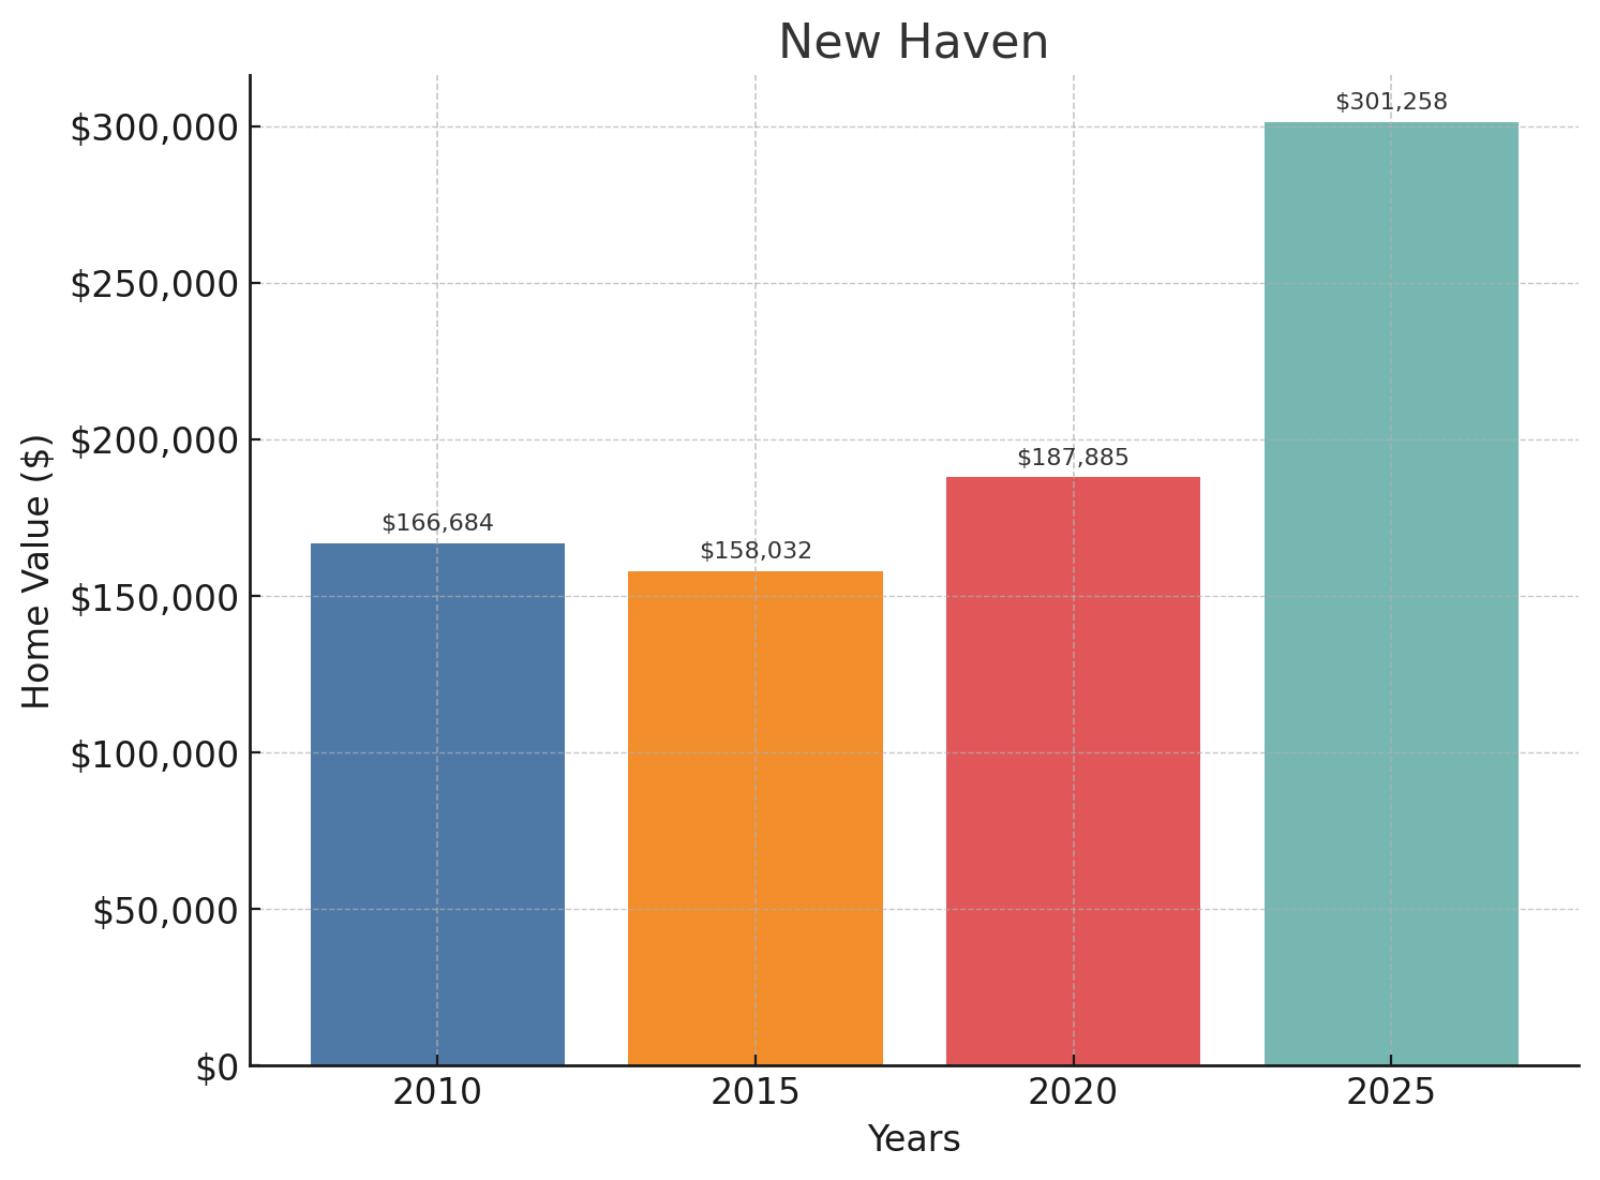
- 2025 Value: $301,258
- 2020 Value: $187,885
- 2015 Value: $158,032
- 2010 Value: $166,684
- Change 2010-2025: 80.74%
- Change 2015-2025: 90.63%
- Change 2020-2025: 60.34%
Yale University’s presence hasn’t prevented New Haven from maintaining relatively affordable housing, with values increasing 60.34% from $187,885 in 2020 to $301,258 in 2025. This cultural hub has seen 90.63% growth since 2015’s average of $158,032 and an 80.74% increase from 2010’s $166,684.
Connecticut’s second-largest city sits on New Haven Harbor in New Haven County, offering an unmatched combination of world-class education, medical facilities, and cultural attractions that typically command much higher housing costs.
12. Meriden

- 2025 Value: $294,796
- 2020 Value: $171,653
- 2015 Value: $149,519
- 2010 Value: $166,839
- Change 2010-2025: 76.69%
- Change 2015-2025: 97.16%
- Change 2020-2025: 71.74%
The Silver City has seen impressive real estate growth with values rising 71.74% from $171,653 in 2020 to $294,796 in 2025, nearly doubling (97.16%) from $149,519 in 2015 and increasing 76.69% from 2010’s $166,839.
Located at the geographic center of Connecticut in New Haven County, Meriden offers a mix of urban and suburban environments with its position midway between New Haven and Hartford making it a practical option for commuters to either city.
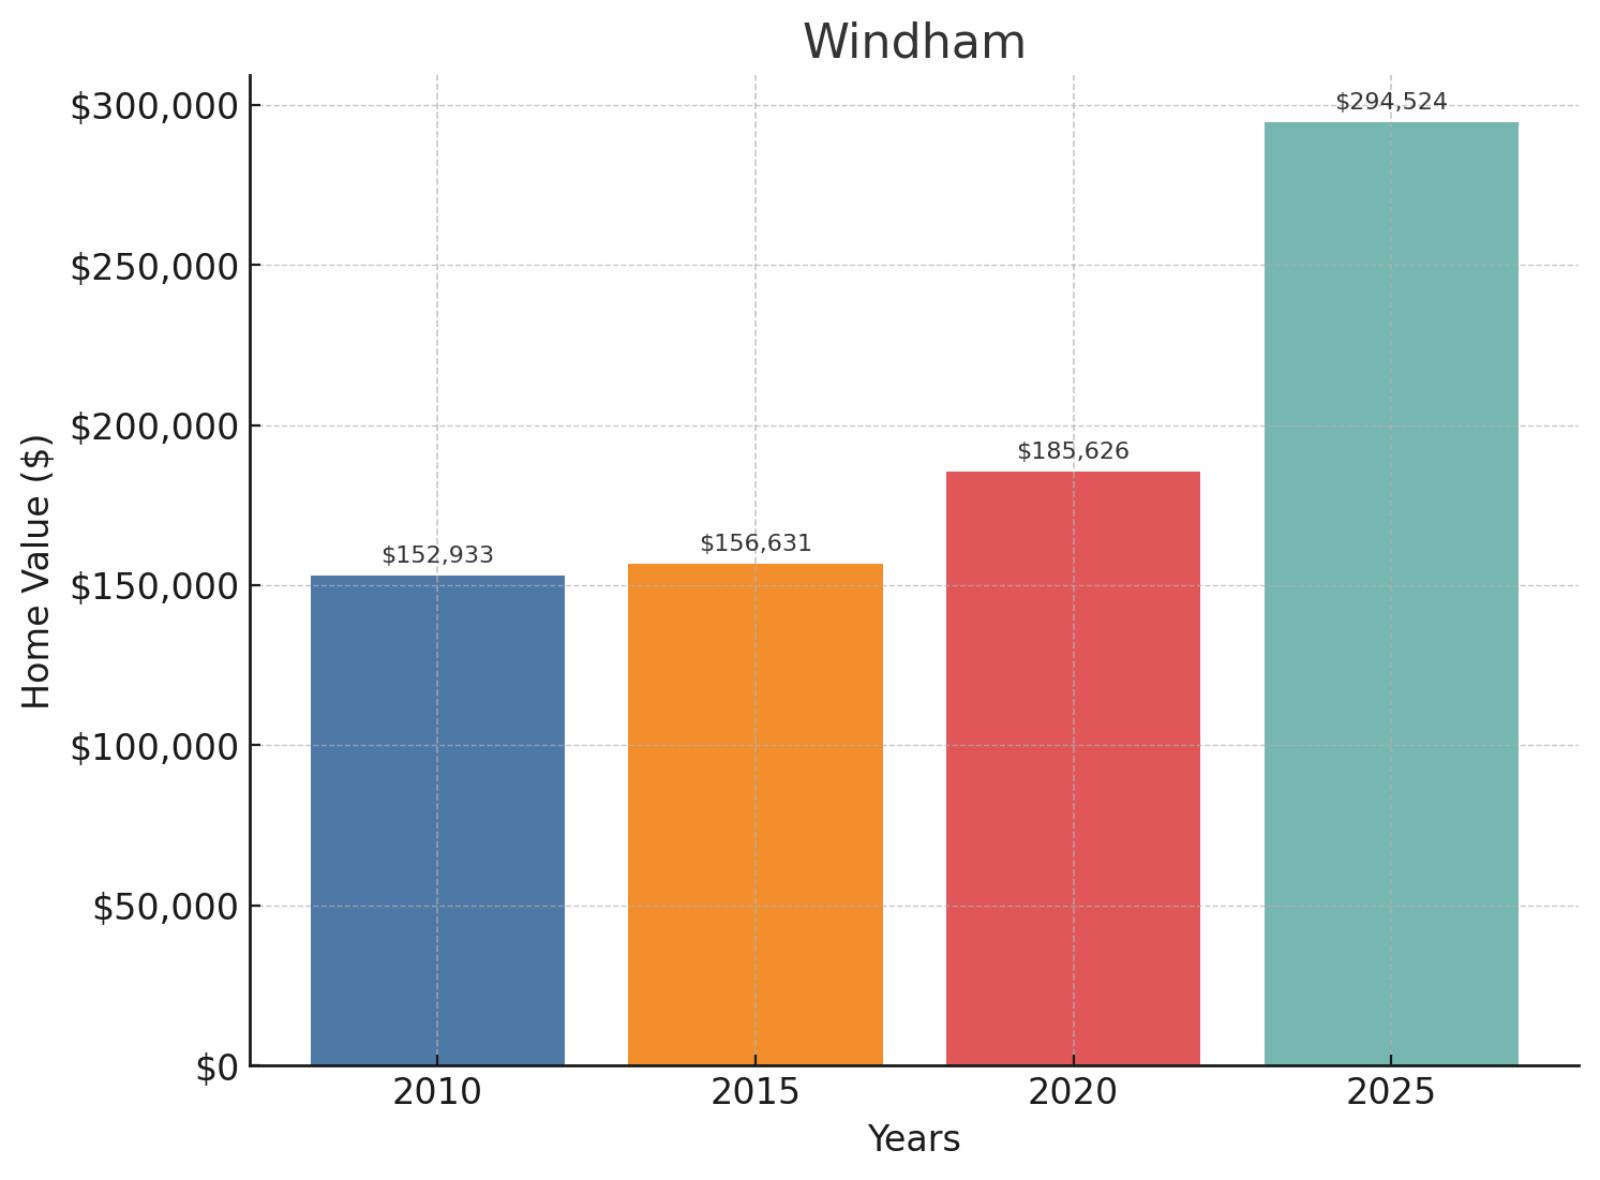
13. Windham
🔥 Would you like to save this?
- 2025 Value: $294,524
- 2020 Value: $185,626
- 2015 Value: $156,631
- 2010 Value: $152,933
- Change 2010-2025: 92.58%
- Change 2015-2025: 88.04%
- Change 2020-2025: 58.67%
Windham’s housing market has shown respectable growth with values climbing 58.67% from $185,626 in 2020 to $294,524 in 2025, part of a longer trend that saw 88.04% growth from 2015’s $156,631 and 92.58% from 2010’s $152,933.
This historic mill town in eastern Connecticut includes the village of Willimantic and sits in Windham County, where its textile manufacturing heritage and Eastern Connecticut State University combine to create a community that balances industrial past with educational future.
14. East Windsor
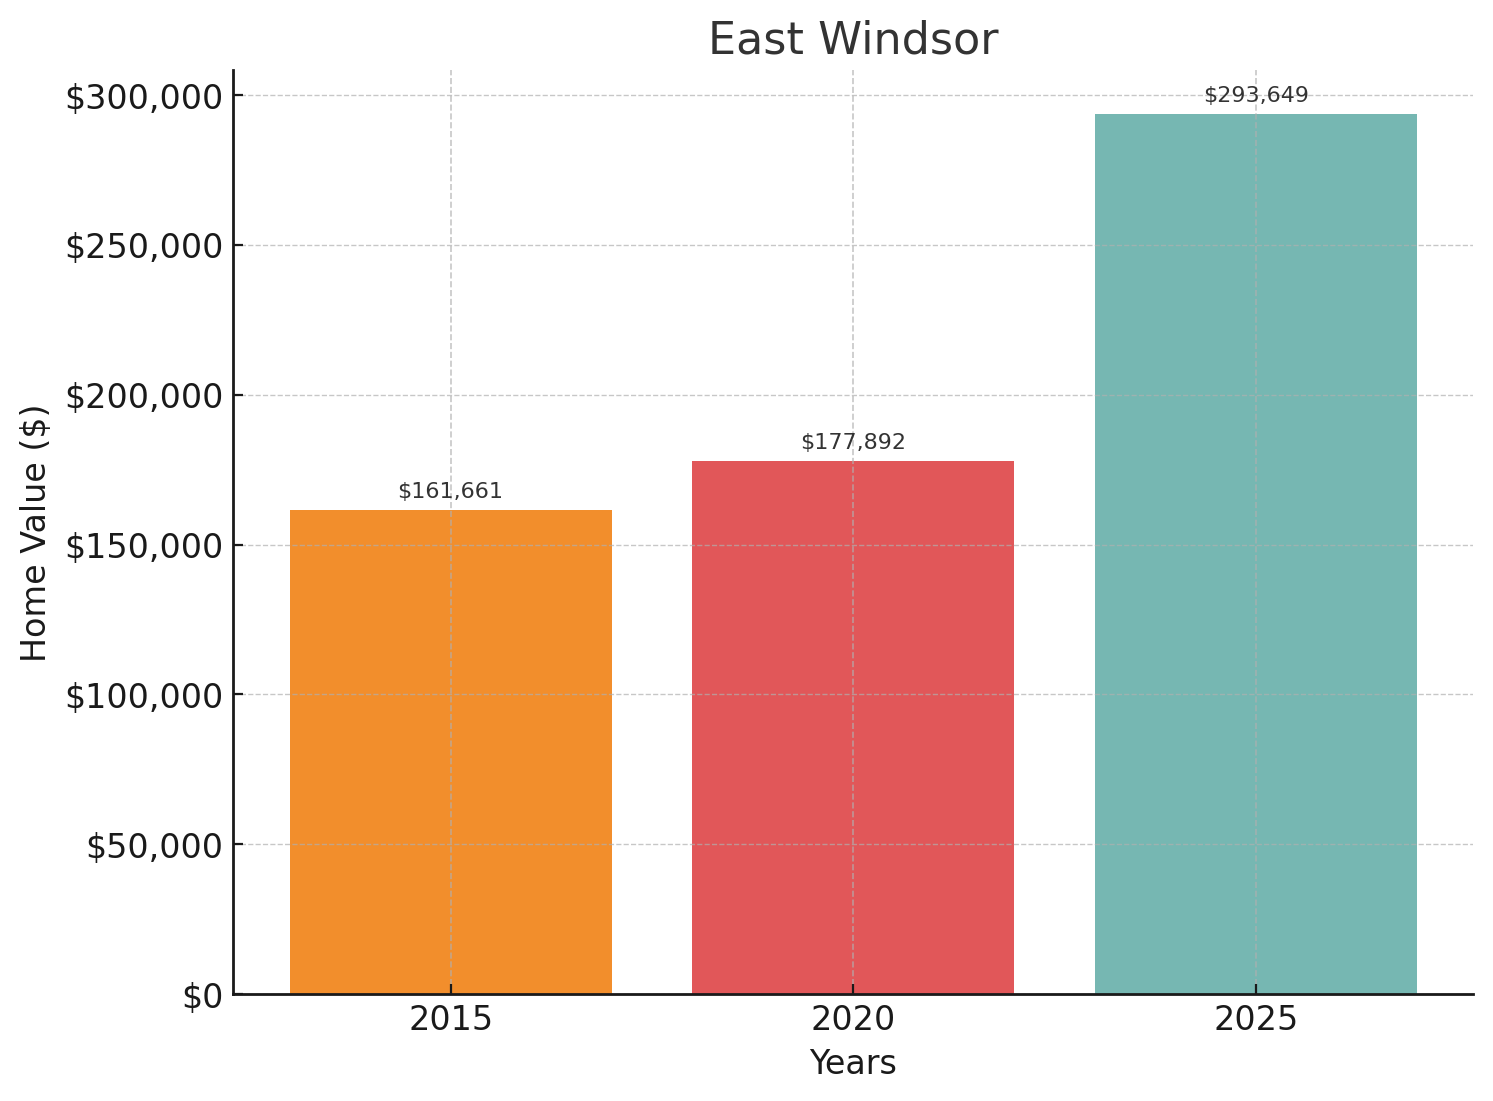
- 2025 Value: $293,649
- 2020 Value: $177,892
- 2015 Value: $161,661
- 2010 Value: No data
- Change 2010-2025: N/A
- Change 2015-2025: 81.65%
- Change 2020-2025: 65.07%
East Windsor’s rural charm has attracted enough buyers to push values up 65.07% from $177,892 in 2020 to $293,649 in 2025, with an 81.65% increase since 2015’s average of $161,661.
This peaceful agricultural community straddles the Connecticut River in Hartford County, offering a blend of historic tobacco farms, outlet shopping, and convenient access to both Hartford and Springfield, making it an increasingly attractive option for those seeking small-town living with metropolitan conveniences.
15. Windsor Locks
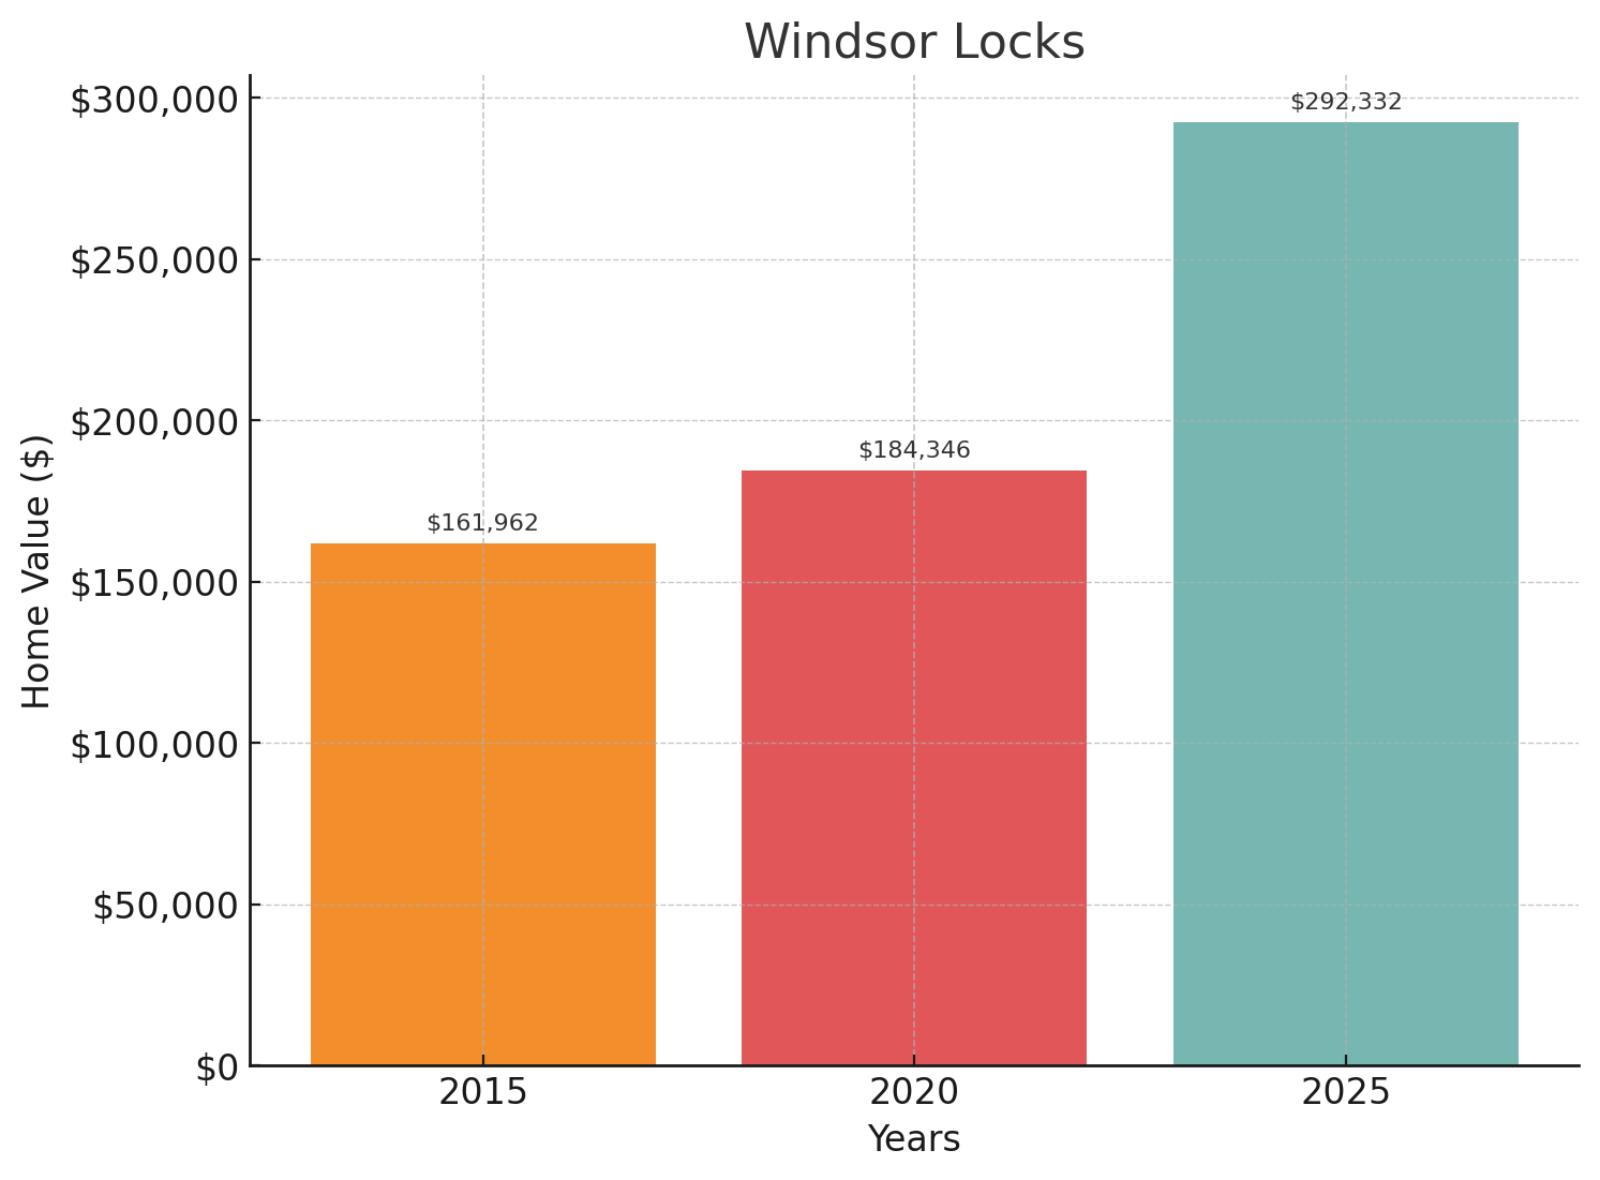
- 2025 Value: $292,332
- 2020 Value: $184,346
- 2015 Value: $161,962
- 2010 Value: No data
- Change 2010-2025: N/A
- Change 2015-2025: 80.49%
- Change 2020-2025: 58.58%
Windsor Locks has experienced moderate but consistent growth over the past decade, with home values increasing 58.58% from $184,346 in 2020 to $292,332 in 2025. The growth since 2015 is more substantial at 80.49% from $161,962, reflecting a steady appreciation trend.
Home to Bradley International Airport in Hartford County, this small town offers a strategic location for commuters with easy access to both Springfield, Massachusetts and Hartford, making it a convenient gateway community for the entire region.
16. New London
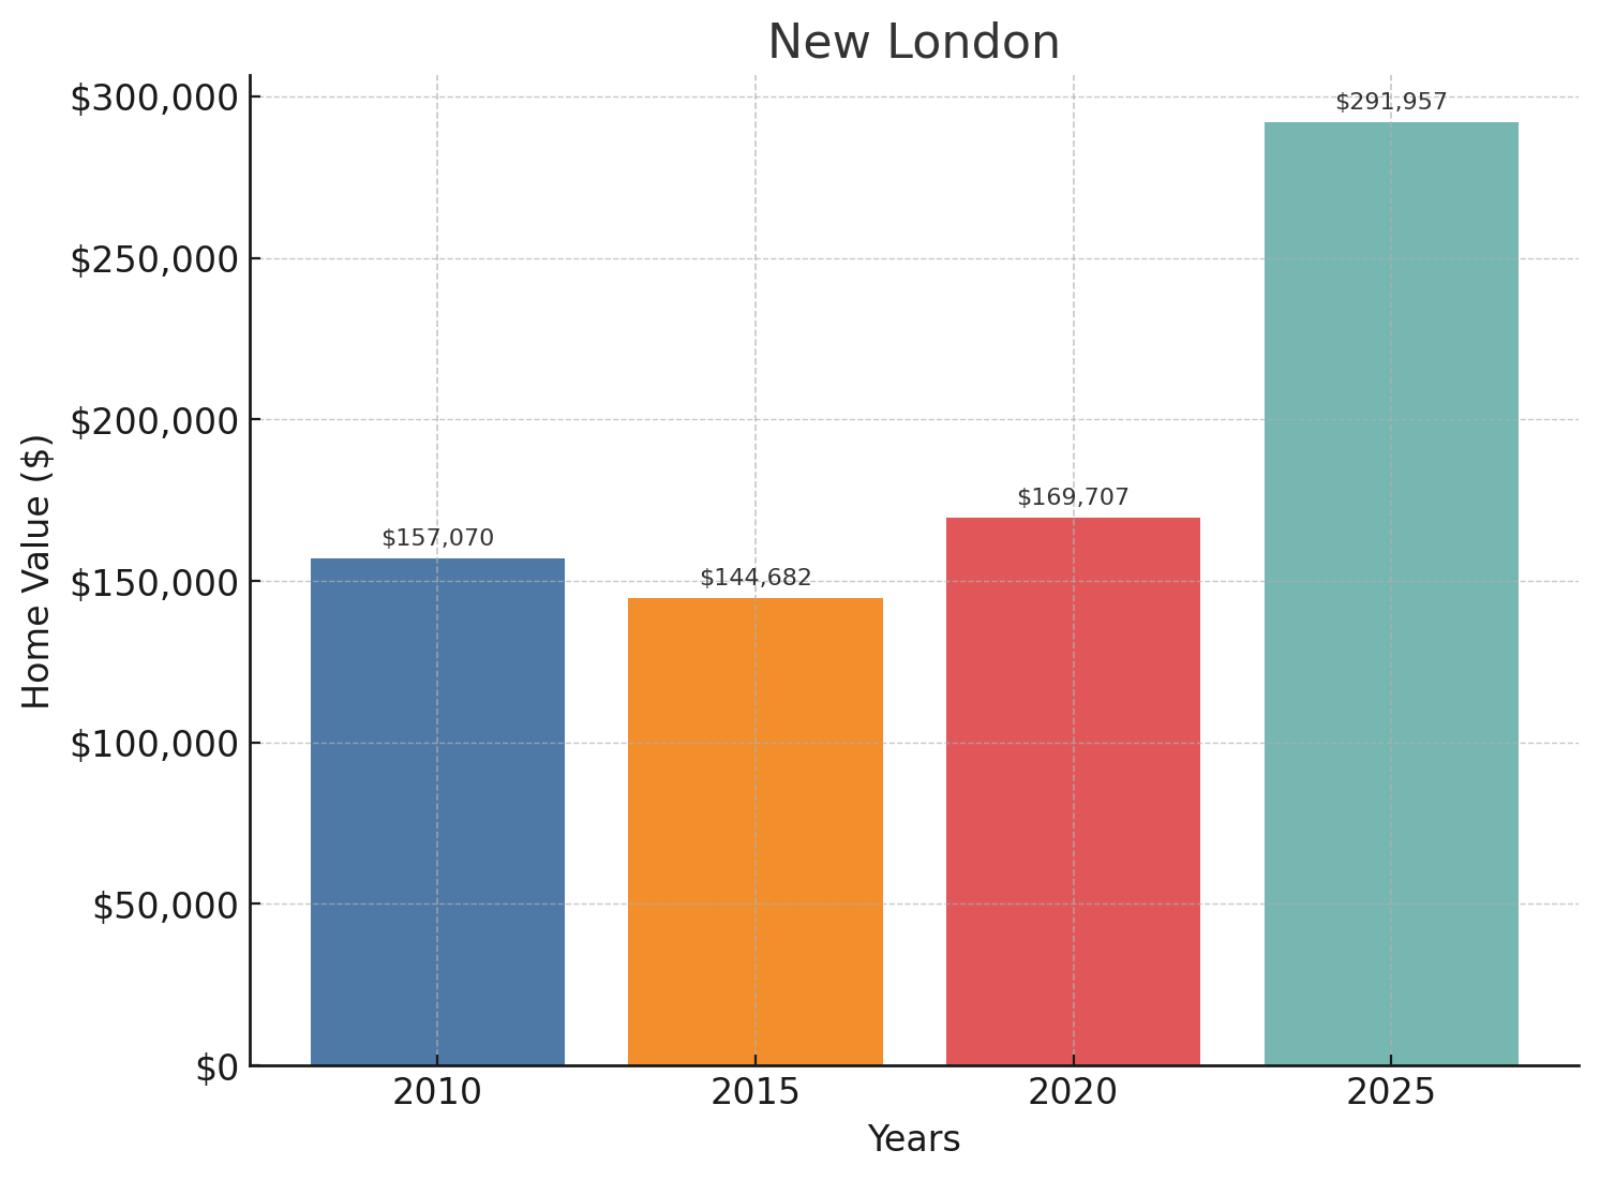
- 2025 Value: $291,957
- 2020 Value: $169,707
- 2015 Value: $144,682
- 2010 Value: $157,070
- Change 2010-2025: 85.88%
- Change 2015-2025: 101.79%
- Change 2020-2025: 72.04%
The whaling city’s maritime heritage hasn’t prevented modern growth, with home values increasing 72.04% from $169,707 in 2020 to $291,957 in 2025. New London’s values have doubled since 2015 (101.79% increase from $144,682) and grown 85.88% since 2010’s $157,070.
Located on the Thames River in southeastern Connecticut, this historic port city in New London County hosts the U.S. Coast Guard Academy and Connecticut College, creating a unique blend of military precision, academic influence, and seafaring tradition.
17. East Hartford
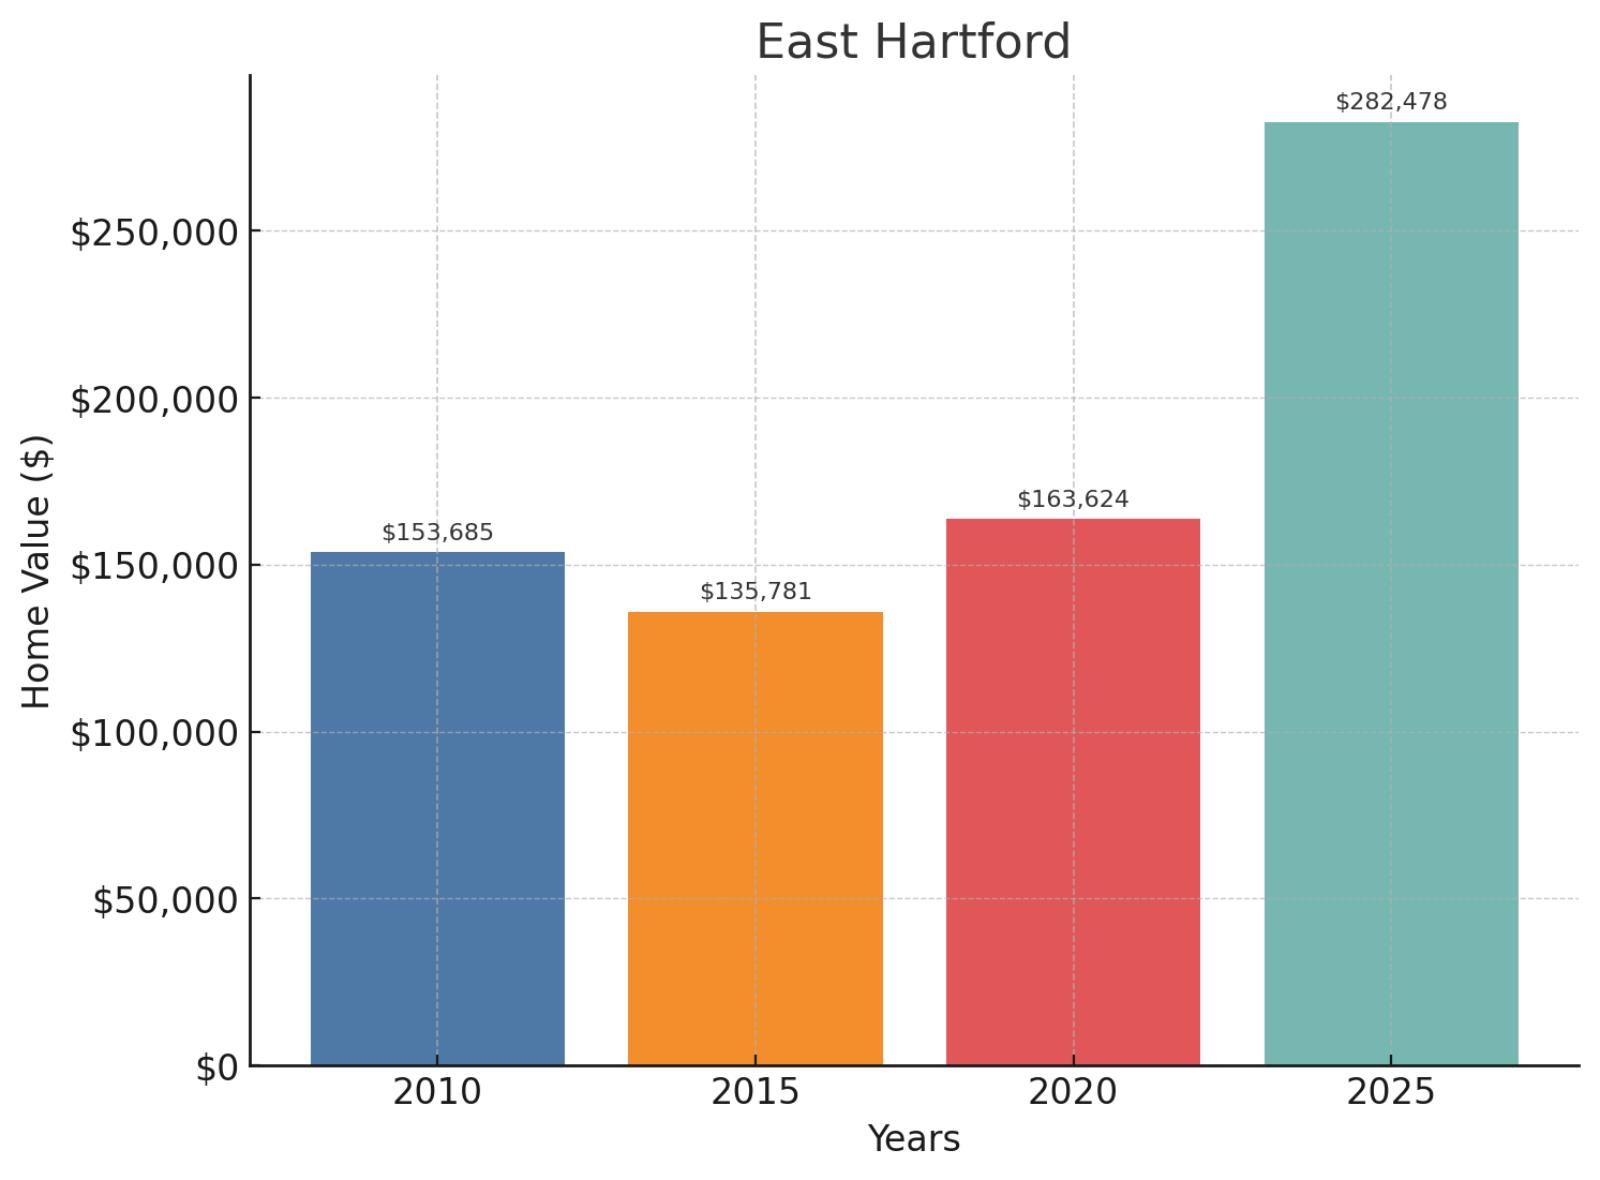
- 2025 Value: $282,478
- 2020 Value: $163,624
- 2015 Value: $135,781
- 2010 Value: $153,685
- Change 2010-2025: 83.80%
- Change 2015-2025: 108.04%
- Change 2020-2025: 72.64%
East Hartford’s proximity to the capital has helped drive values up 72.64% in just five years, from $163,624 in 2020 to $282,478 in 2025. The town’s growth trajectory shows a 108.04% increase since 2015 when values averaged $135,781, and an 83.80% rise from 2010’s $153,685.
Situated directly across the Connecticut River from Hartford in Hartford County, East Hartford is home to aerospace giant Pratt & Whitney and offers more affordable housing options than many surrounding communities.
18. New Britain

- 2025 Value: $272,877
- 2020 Value: $159,084
- 2015 Value: $135,410
- 2010 Value: $115,639
- Change 2010-2025: 135.97%
- Change 2015-2025: 101.52%
- Change 2020-2025: 71.53%
The Hardware City has witnessed remarkable growth over 15 years, with home values climbing 135.97% from $115,639 in 2010 to $272,877 in 2025. Central Connecticut State University’s presence has helped drive values up 71.53% since 2020’s $159,084 and exactly double (101.52%) from 2015’s $135,410.
Located just southwest of Hartford in Hartford County, New Britain combines industrial heritage with educational opportunities, creating an affordable urban alternative with Polish and Puerto Rican cultural influences.
19. Torrington

- 2025 Value: $269,549
- 2020 Value: $139,114
- 2015 Value: $141,762
- 2010 Value: No data
- Change 2010-2025: N/A
- Change 2015-2025: 90.14%
- Change 2020-2025: 93.76%
Torrington’s housing market has nearly doubled in value since 2020, with prices surging 93.76% from $139,114 to $269,549 in 2025. Interestingly, this represents a slight recovery and acceleration, as the 2020 value was actually lower than 2015’s $141,762, with the overall 10-year growth reaching 90.14%.
Located in Litchfield County in northwest Connecticut, Torrington serves as an important economic and cultural center for the region, offering a blend of small-city amenities with access to the state’s most scenic rural landscapes.
20. Norwich

- 2025 Value: $268,829
- 2020 Value: $154,069
- 2015 Value: $134,176
- 2010 Value: $154,795
- Change 2010-2025: 73.67%
- Change 2015-2025: 100.36%
- Change 2020-2025: 74.49%
Norwich home values have climbed steadily to $268,829 in 2025, representing a solid 74.49% increase from 2020’s average of $154,069. The growth trajectory is particularly interesting as values have exactly doubled since 2015 (100.36% increase from $134,176) while showing a 73.67% gain from 2010’s $154,795.
Known as “The Rose of New England,” this historic seaport city in New London County sits at the confluence of three rivers, offering both maritime charm and proximity to the region’s casino resorts.
21. Winsted

- 2025 Value: $262,441
- 2020 Value: $147,830
- 2015 Value: $126,725
- 2010 Value: $147,759
- Change 2010-2025: 77.61%
- Change 2015-2025: 107.09%
- Change 2020-2025: 77.53%
The value of Winsted homes has grown remarkably from $147,830 in 2020 to $262,441 in 2025, a robust 77.53% increase that matches its 15-year growth rate of 77.61% from 2010’s $147,759. Most impressive is the 107.09% surge since 2015, when values averaged $126,725.
Nestled in the picturesque northwestern corner of Connecticut in Litchfield County, this historic mill town offers scenic beauty with the Highland Lake and surrounding Berkshire foothills providing an attractive setting for homebuyers.
22. South Windham

- 2025 Value: $260,982
- 2020 Value: $156,427
- 2015 Value: $122,836
- 2010 Value: $116,975
- Change 2010-2025: 123.11%
- Change 2015-2025: 112.46%
- Change 2020-2025: 66.84%
South Windham’s quaint village appeal has contributed to its substantial growth, with values rising 66.84% since 2020 to reach $260,982 in 2025. The trajectory shows consistent appreciation, more than doubling from $116,975 in 2010 (a 123.11% increase) and growing 112.46% from $122,836 in 2015.
This charming community sits along the Shetucket River in Windham County, offering a balance of rural character and accessibility to larger towns in eastern Connecticut.
23. Waterbury

- 2025 Value: $255,638
- 2020 Value: $122,757
- 2015 Value: $91,964
- 2010 Value: $115,973
- Change 2010-2025: 120.43%
- Change 2015-2025: 177.98%
- Change 2020-2025: 108.25%
The Brass City has experienced the most dramatic growth on our list, with home values exploding by 108.25% in just five years, from $122,757 in 2020 to $255,638 in 2025. Even more impressive is Waterbury’s 177.98% surge since 2015, when homes averaged just $91,964, outpacing its 120.43% growth since 2010’s value of $115,973.
Situated in New Haven County in western Connecticut, Waterbury’s industrial heritage and strategic location between Hartford and New York have fueled its remarkable transformation.
24. Willimantic

- 2025 Value: $247,749
- 2020 Value: $148,086
- 2015 Value: $127,260
- 2010 Value: $119,924
- Change 2010-2025: 106.59%
- Change 2015-2025: 94.68%
- Change 2020-2025: 67.30%
Willimantic’s housing market has doubled in value since 2010, climbing from $119,924 to $247,749 in 2025, representing a 106.59% jump over 15 years. The college town atmosphere created by Eastern Connecticut State University has helped drive a 67.30% increase since 2020 when values averaged $148,086, and a 94.68% rise from 2015’s $127,260.
Located in Windham County in northeastern Connecticut, this former mill town combines historic charm with the vibrancy of a university community.
25. Hartford

🔥 Would you like to save this?
- 2025 Value: $179,349
- 2020 Value: $114,872
- 2015 Value: $95,612
- 2010 Value: $101,970
- Change 2010-2025: 75.88%
- Change 2015-2025: 87.58%
- Change 2020-2025: 56.13%
Hartford stands as Connecticut’s most affordable major city in 2025, with home values averaging just $179,349, a remarkable 56.13% increase from 2020’s $114,872. As the state capital and insurance industry hub, Hartford has seen steady growth from its 2015 value of $95,612 and 2010 value of $101,970, resulting in a 75-year growth rate of 75.88%.
Nestled in Hartford County along the Connecticut River, this historic city combines urban amenities with surprising affordability compared to surrounding communities.