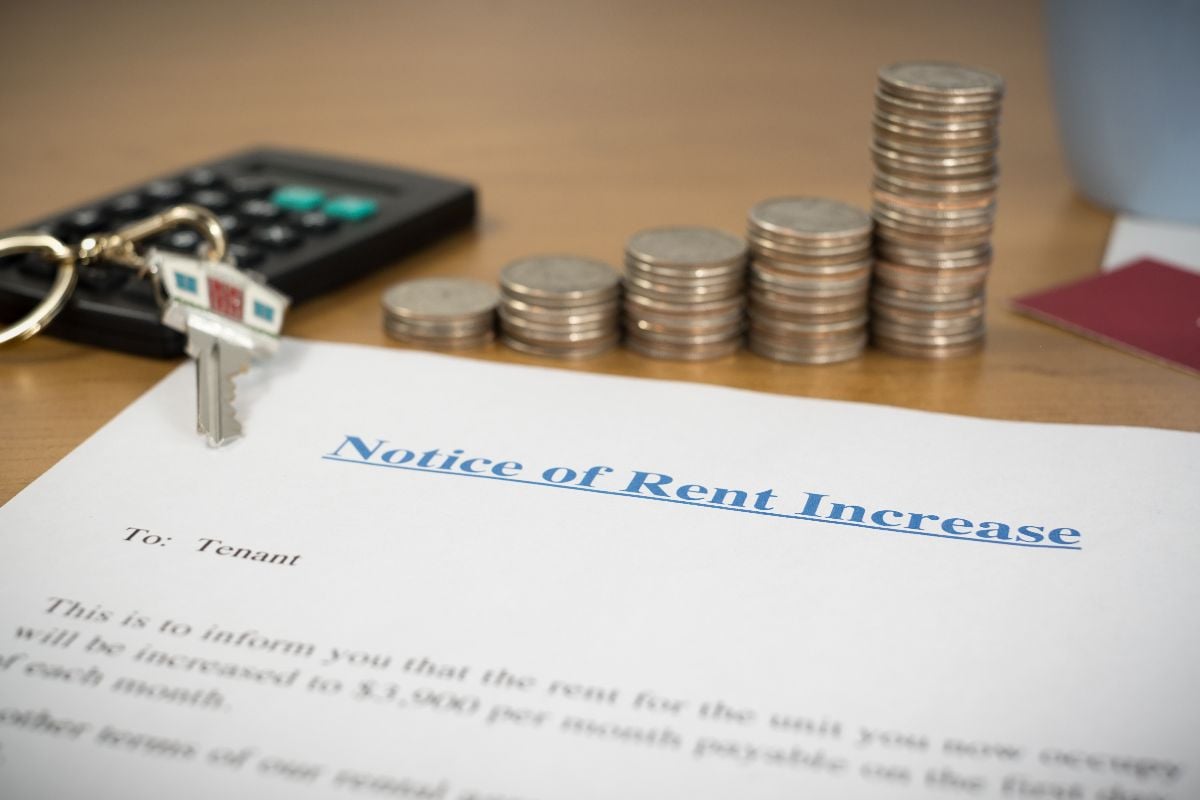
Kentucky rents aren’t “cheap”—they’re moving. Beneath the calm of mid-pack prices is a market that’s quietly accelerated this summer, with two-thirds of KY cities setting record highs, several metros re-heating after a spring lull, and the state’s post-2019 surge outpacing the U.S. Add in border-metro pressure from Cincinnati and Louisville spillovers and you’ve got a market where both investors and renters can get caught off-side fast.
In order to come up with the very specific design ideas, we create most designs with the assistance of state-of-the-art AI interior design software. Also, assume links that take you off the site are affiliate links such as links to Amazon. this means we may earn a commission if you buy something.
25. Two-thirds of Kentucky cities just printed record highs
66% of KY cities in your dataset hit their all-time high rent in July 2025. That’s a broad-based breakout, not a one-off spike. For renters, it means fewer bargains and tougher renewals. For investors, it signals momentum—but also higher entry prices and thinner buy-box options.
24. Summer surge: short-term heat outruns the annual pace

KY’s 3-month annualized rent growth is running ~11.4%, beating its own YoY ~4.3%. When the short-term pace outruns the 12-month pace, it often means acceleration—and another leg higher if nothing breaks. Great if you already own; rough if you’re shopping or renewing.
23. Since 2019, KY rents have exploded ~46% (U.S. ~35%)
Kentucky’s post-pandemic rent climb (~+46% since 2019) beats the national ~+35% increase. The state may feel affordable versus coastal hubs, but the trajectory says affordability has deteriorated faster than the U.S. baseline—a structural squeeze for local incomes.
22. The “hot right now” signal: 39% of KY cities rose >0.5% MoM

Nearly 4 in 10 Kentucky cities posted >0.5% month-over-month growth in July—stronger than seasonal norm this late in the cycle. That kind of month-to-month heat compounds quickly into meaningful annual increases.
21. Acceleration under the hood in 1 out of 5 markets

21% of KY cities show 3-month annualized growth at least 1 point above YoY, a classic “getting hotter” signature. Those are the places where rent pressure tends to surprise on renewals and where investors most often underestimate forward rent growth.
20. Statewide rent levels are lower than U.S., but moving faster lately

Average KY city rent sits near $1,538, versus the U.S. average near $2,195. Yet KY’s short-term momentum (~11.4% 3-month annualized) crushes the U.S. (~1.2%) in your files—an alarm bell for anyone assuming the Midwest/South are sleepy.
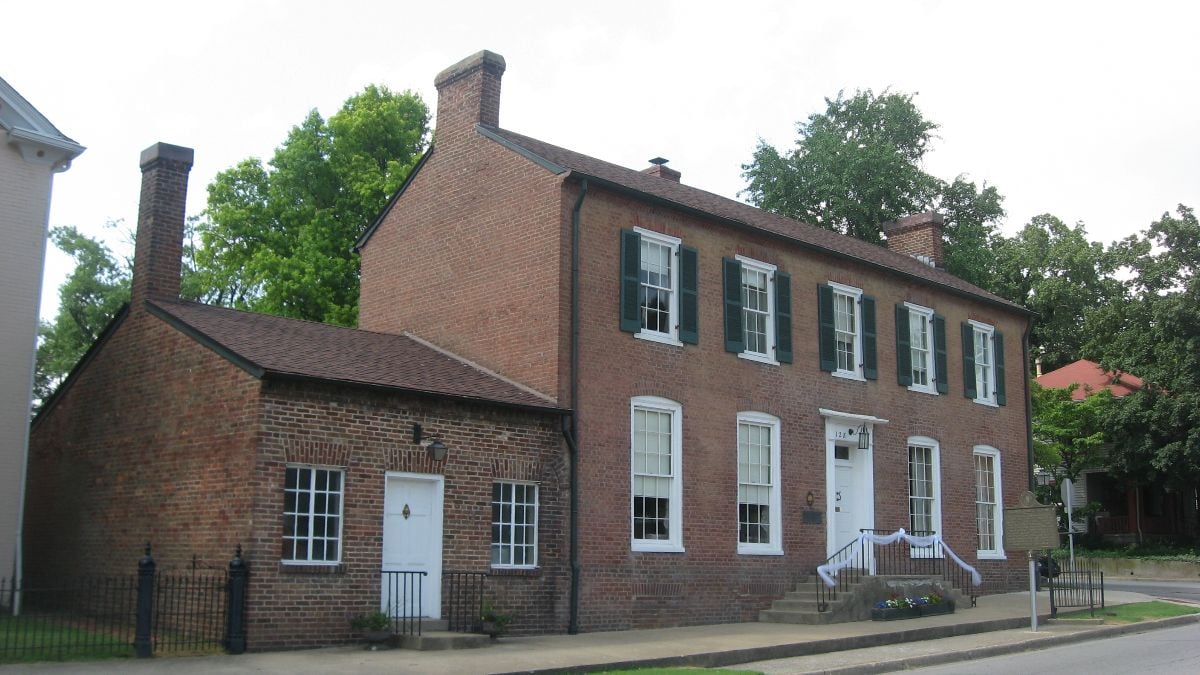
19. Frankfort is the bellwether of breakout growth
City: Frankfort shows ~+10.0% YoY and ~14.1% 3-month annualized, ~+53% since 2019.
Metro: Frankfort, KY metro is ~+9.8% YoY, ~16.5% 3-month annualized, ~+58% since 2019.
Policy caps? No. Renewals? Painful. For investors, this is a strong-trend market—with rising tenant churn risk if wages lag.
18. Lexington is heating back up
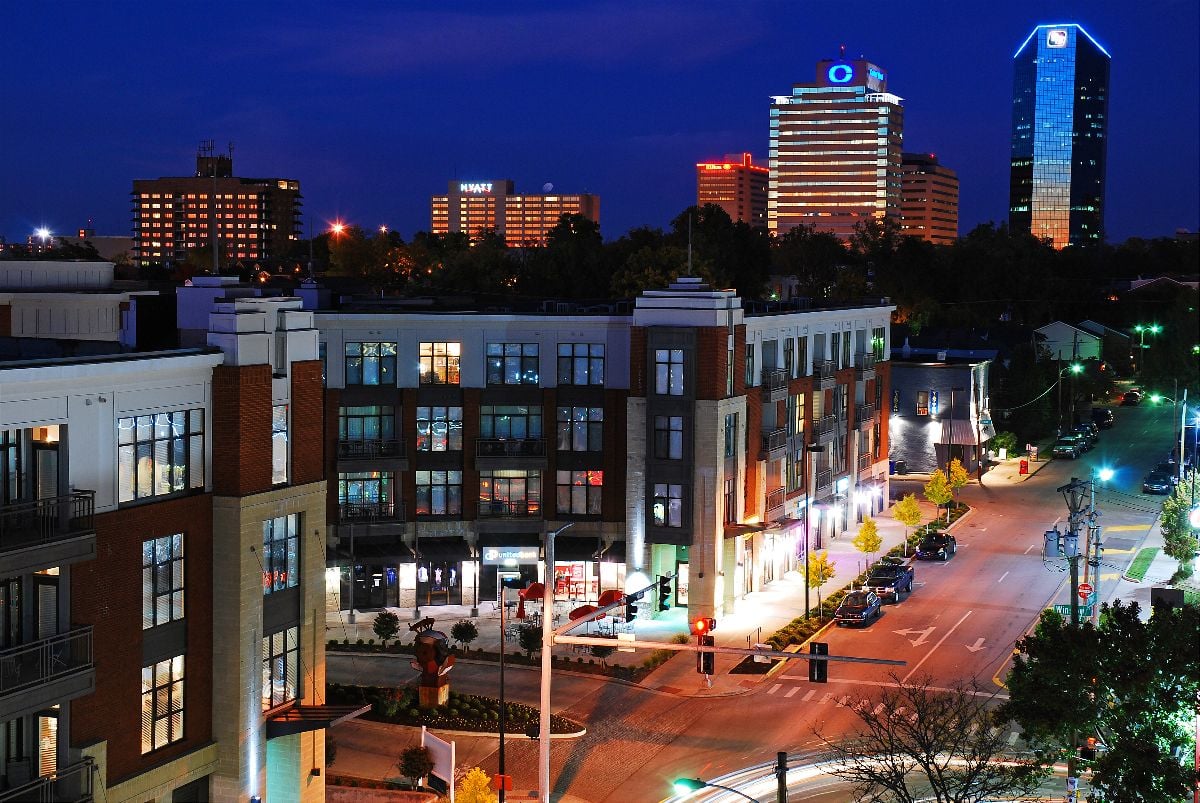
Lexington city: ~+5.3% YoY, ~10.9% 3-month annualized, ~+50% since 2019.
That short-term speed says last year’s cooling phase is over. Expect tighter concessions and firmer asking rents into fall lease cycles.
17. Louisville’s steady climb masks a big 5-year reset

Louisville city: ~+2.9% YoY, ~+41% since 2019.
Metro: Louisville/Jefferson County, KY-IN ~+3.0% YoY, ~5.4% 3-month annualized, ~+41% since 2019.
Even “moderate” YoY increases on top of a ~40% five-year gain still bend budgets.
16. Owensboro popped—then paused (danger of misreading cool-offs)
Owensboro city: ~+8.6% YoY, but ~0.18% 3-month annualized—momentum slowed.
Investors: don’t extrapolate last year’s winners in a straight line. Renters: a short window may exist before the next push if fundamentals stay tight.
15. Northern KY is feeling Cincinnati’s gravity
Counties tied to Cincinnati, OH-KY-IN—Kenton (~+5.8% YoY), Boone (~+4.7%), Campbell (~+4.4%)—are all still climbing, with strong 3-month runs. Cross-border job growth and migration keep pressure elevated just south of the river.
14. Elizabethtown & Bullitt County: quiet re-acceleration risk
Elizabethtown metro shows mild YoY (~+2.2%) but a ~14.7% 3-month annualized pop. Bullitt County (Louisville metro) posted a ~19.5% 3-month annualized burst. Those short-term ramps often lead the headlines.
13. Bowling Green is near flat YoY—but don’t get complacent
🔥 Would you like to save this?
Bowling Green city: ~+0.12% YoY, yet ~+34% since 2019. A flat year after a giant move isn’t “cheap”—it just means the new baseline is expensive relative to pre-COVID incomes.
12. Frankfort & Covington: five-year leaders

Covington ~+53% since 2019; Frankfort ~+53%. These legacy-market gains lock in a higher floor for rents, which can reprice what “affordable” means for first-time renters and essential workers.
11. Lexington-Fayette county-level strength confirms city trend

Fayette County (Lexington metro) clocks ~+5.3% YoY and ~10.9% 3-month annualized, ~+50% since 2019. When city + county + metro move together, you get broad rent discipline—fewer weak pockets to negotiate.
10. Louisville’s core county still climbing
Jefferson County: ~+2.9% YoY, ~5.1% 3-month annualized, ~+41% since 2019. Even at “only” +3% YoY, layered on a big five-year base, renewals still sting.
9. Georgetown & Erlanger: micro-volatility under the surface
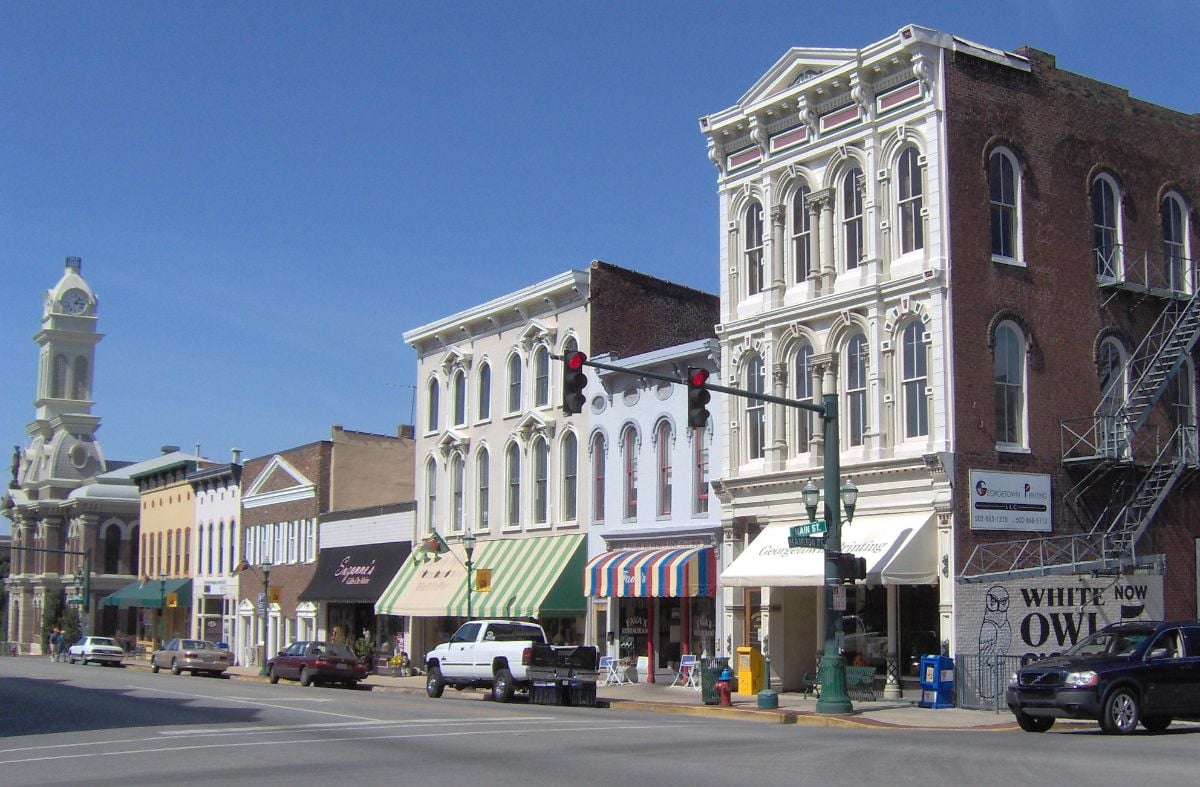
Georgetown rose ~+2.5% YoY but logged a -3.8% 3-month annualized—that whipsaw makes pricing/renewals hard to time. Erlanger shows ~+6.1% YoY but a -4.8% 3-month pace—reminding investors that entry cap rates can drift if submarkets cool suddenly.
8. Newport & Florence: steady northern strength

Newport ~+6.3% YoY; Florence ~+6.4% YoY with ~8.1% 3-month annualized. Northern KY continues to outperform on both investor rent growth and renter cost pressure.
7. A summer of surprise: Nicholasville, Bellevue, Dayton, Radcliff pop MoM
Last month movers:
-
Nicholasville ~+3.46% MoM
-
Bellevue ~+2.85% MoM
-
Dayton ~+2.80% MoM
-
Radcliff ~+2.61% MoM
These are shock-to-budget jumps at renewal time and often lead local comps up.
6. Paducah’s metro 3-month pace is eye-popping
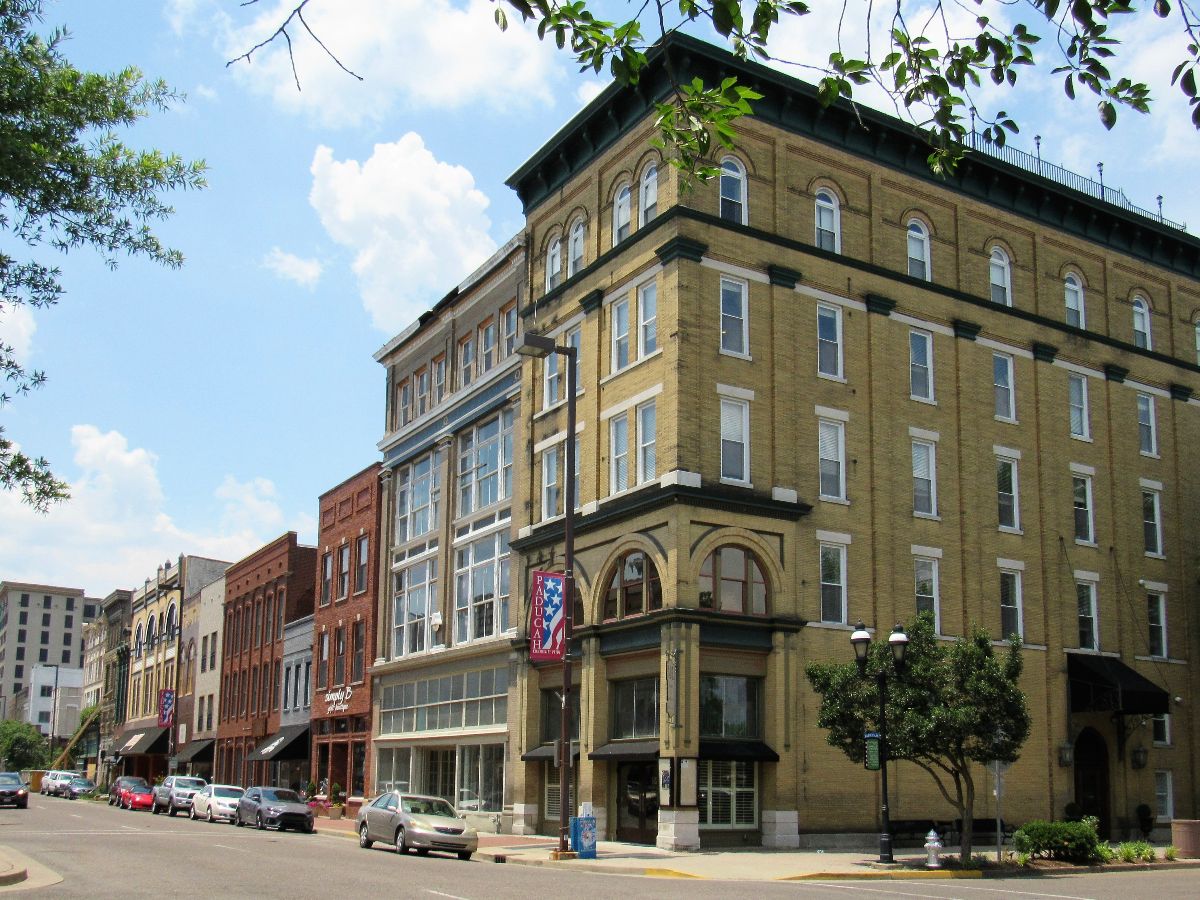
Paducah, KY metro prints a ~58.7% 3-month annualized rate in your file. Likely noisy/low-base, but directionally it screams “don’t assume stasis” in smaller markets; a few large moves can reset comps quickly.
5. Investor takeaway: KY momentum > U.S. momentum (short-term)

In your data, KY’s short-term growth (~11.4% 3-month ann.) vs the U.S. ~1.2% suggests better near-term rent lifts—but at the cost of timing risk. If financing resets higher, today’s aggressive rent projections can turn into tomorrow’s compressed cash flows.
4. Renter takeaway: the “middle” is moving away from you

Even if your city’s YoY looks modest, remember the five-year layer cake: many KY cities are ~40–53% above 2019. The new floor means higher application filters, higher deposits, and fewer upgrades in your price band.
3. Policy vacuum: no caps, faster repricing
Without meaningful rent caps, KY markets reprice quickly to demand shocks (jobs, migration, unit absorption). That’s great for stabilization if you’re a landlord—and a budget hazard if you’re between leases.
2. Border-metro pressure is real and persistent

Northern KY counties leveraged to Cincinnati plus Louisville-adjacent counties (e.g., Bullitt) are a structural conduit for rent pressure. Cross-border commuting and wage differentials prop up KY rent floors.
1. The big picture: Kentucky’s trajectory is more alarming than its level
🔥 Would you like to save this?
Yes, Kentucky remains cheaper than the U.S. average—but the direction matters more.
- Record highs in two-thirds of cities
- Short-term acceleration outpacing year-over-year
- ~+46% since 2019 vs. ~+35% U.S.
That combination signals a market re-tightening, not normalizing.
Quick Reference
Latest month in data: July 31, 2025
Kentucky (KY)
- Average city rent: ~$1,538
- YoY (avg across KY cities): ~+4.3%
- 3-month annualized: ~+11.4%
- Since 2019: ~+46%
United States (U.S.)
- Average city rent: ~$2,195
- YoY: ~+5.2%
- 3-month annualized: ~+1.2%
- Since 2019: ~+35%
Market Indicators (KY cities)
- Record-high share: ~66%
- Acceleration share (3m ann > YoY +1pp): ~21%
- Hot MoM share (>0.5% MoM): ~39%
Top KY YoY cities
- Frankfort (~+10.0%)
- Owensboro (~+8.6%)
- Florence (~+6.4%)
- Newport (~+6.3%)
Soft YoY cities
- Bowling Green (~+0.1%)
- Oak Grove (~+0.5%)
- Radcliff (~+1.5%)
- Elizabethtown (~+1.5%)