According to the latest Zillow Home Value Index data from May 2025, these 18 Iowa towns now have the highest home prices in the state—and they’re not slowing down. Long known for affordability, Iowa is starting to surprise, with some houses fetching prices that rival coastal hotspots. Whether it’s a lakefront escape in Dickinson County or a polished driveway just outside Des Moines, these towns are where the real estate market has gone full glow-up.
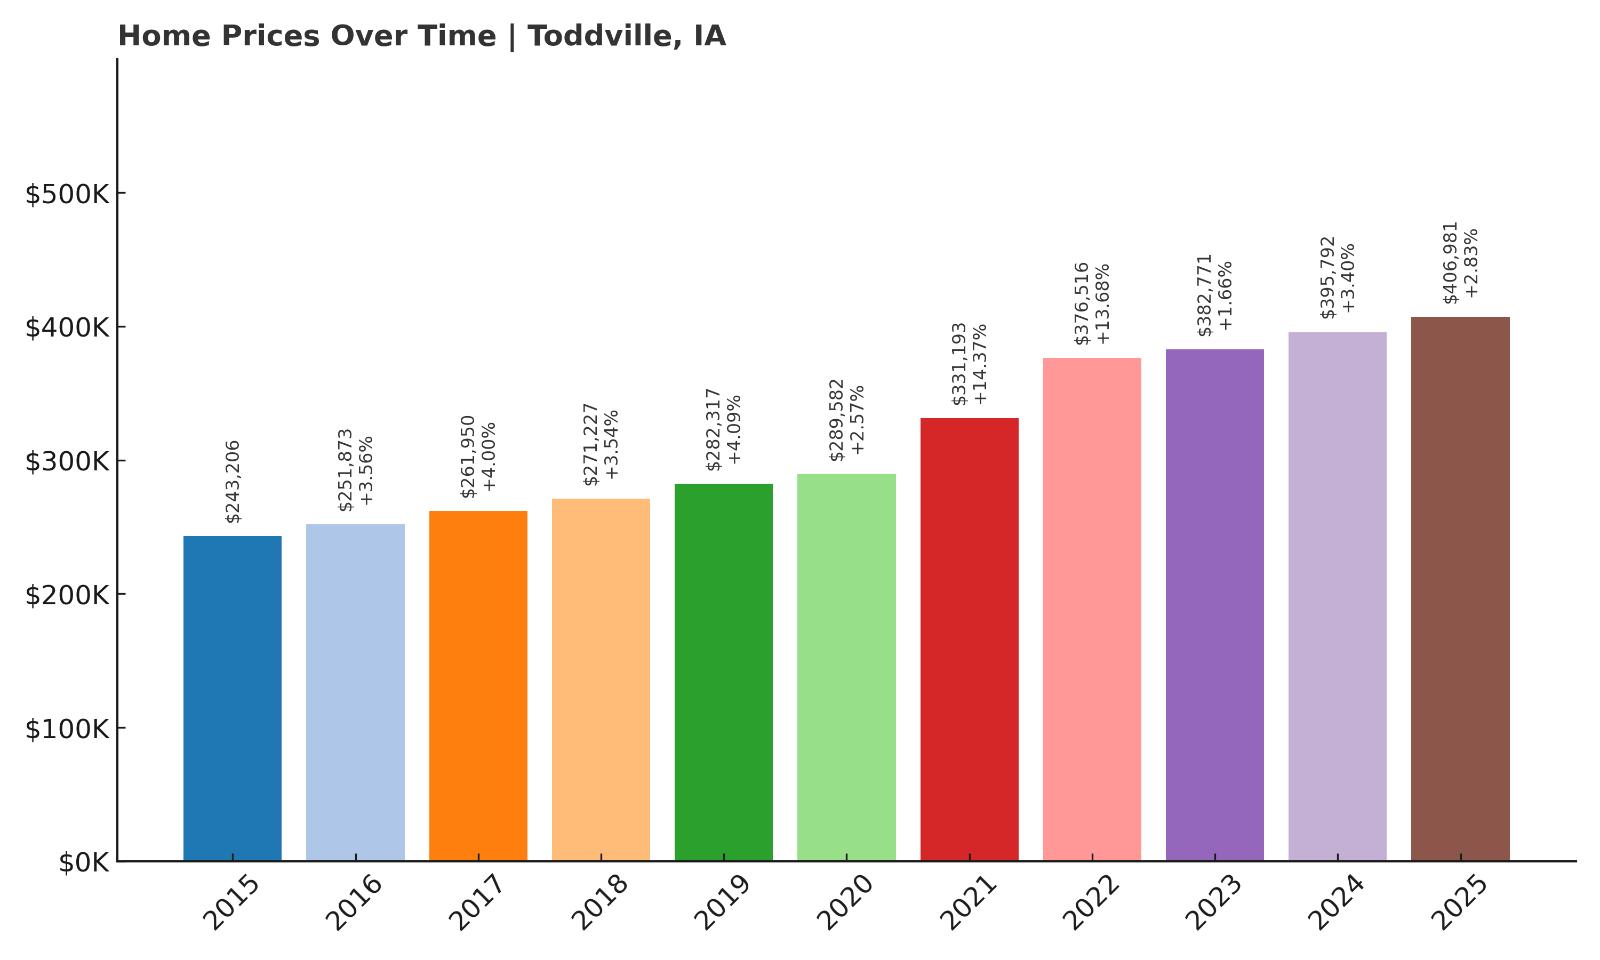
18. Toddville – 67% Home Price Increase Since May 2015
- 2010: N/A
- 2011: N/A
- 2012: N/A
- 2013: N/A
- 2014: N/A
- 2015: $243,206
- 2016: $251,873 (+$8,667, +3.56% from previous year)
- 2017: $261,950 (+$10,078, +4.00% from previous year)
- 2018: $271,227 (+$9,277, +3.54% from previous year)
- 2019: $282,317 (+$11,090, +4.09% from previous year)
- 2020: $289,582 (+$7,265, +2.57% from previous year)
- 2021: $331,193 (+$41,611, +14.37% from previous year)
- 2022: $376,516 (+$45,323, +13.68% from previous year)
- 2023: $382,771 (+$6,255, +1.66% from previous year)
- 2024: $395,792 (+$13,021, +3.40% from previous year)
- 2025: $406,981 (+$11,189, +2.83% from previous year)
Toddville’s home prices have increased by nearly 67% since Zillow began tracking values in 2015. The steepest jump came between 2020 and 2022, when values rose more than $85,000 in just two years. While the growth has tapered slightly in recent years, it remains consistent, with 2025’s average sitting at $406,981. The town saw a notable surge during the post-pandemic real estate wave, but price growth has remained relatively steady since. Compared to other small towns in Linn County, Toddville’s appreciation rate stands out due to its quiet residential setting and access to Cedar Rapids amenities.
Toddville – Strong Price Gains Amid Rural Appeal
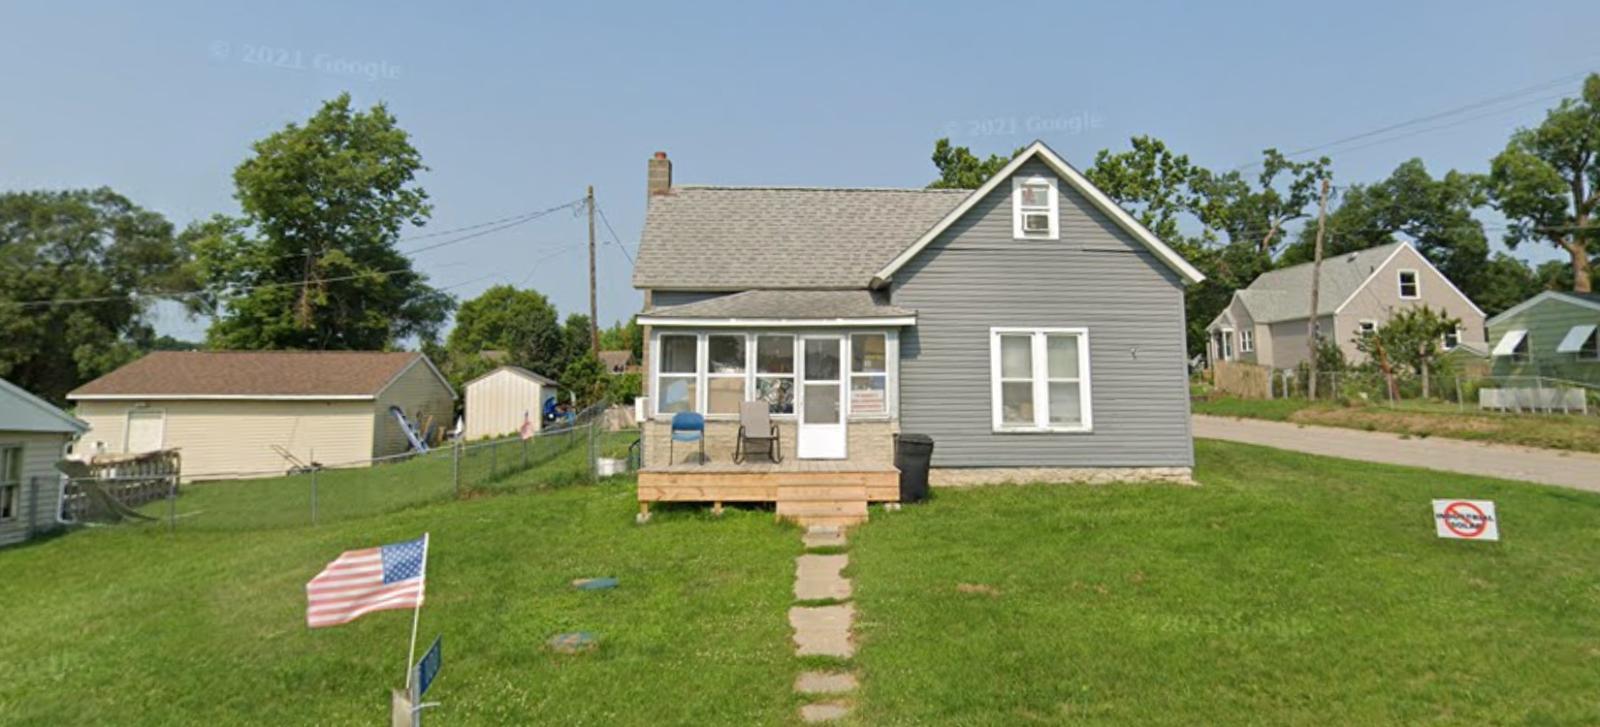
Located just north of Cedar Rapids, Toddville is a small unincorporated community in Linn County. Despite its modest size, it’s emerged as a surprisingly high-value housing market in recent years. Residents enjoy a more rural lifestyle while remaining close to major employment centers and shopping in Cedar Rapids. The town lacks a municipal government but benefits from the county’s infrastructure and proximity to larger cities. This balance of space and convenience may explain the area’s steady home value climb.
The town’s appeal lies in its large lots, quieter roads, and low-density housing. There’s also growing interest in properties that offer space for outbuildings or hobby farming, which are more common in Toddville than in more suburban parts of the county. As housing demand spreads out from Cedar Rapids, small towns like Toddville are drawing interest from buyers looking for more space without giving up access to urban services. That steady, data-backed price climb since 2015 suggests demand is here to stay.
17. Van Meter – 96% Home Price Increase Since May 2010
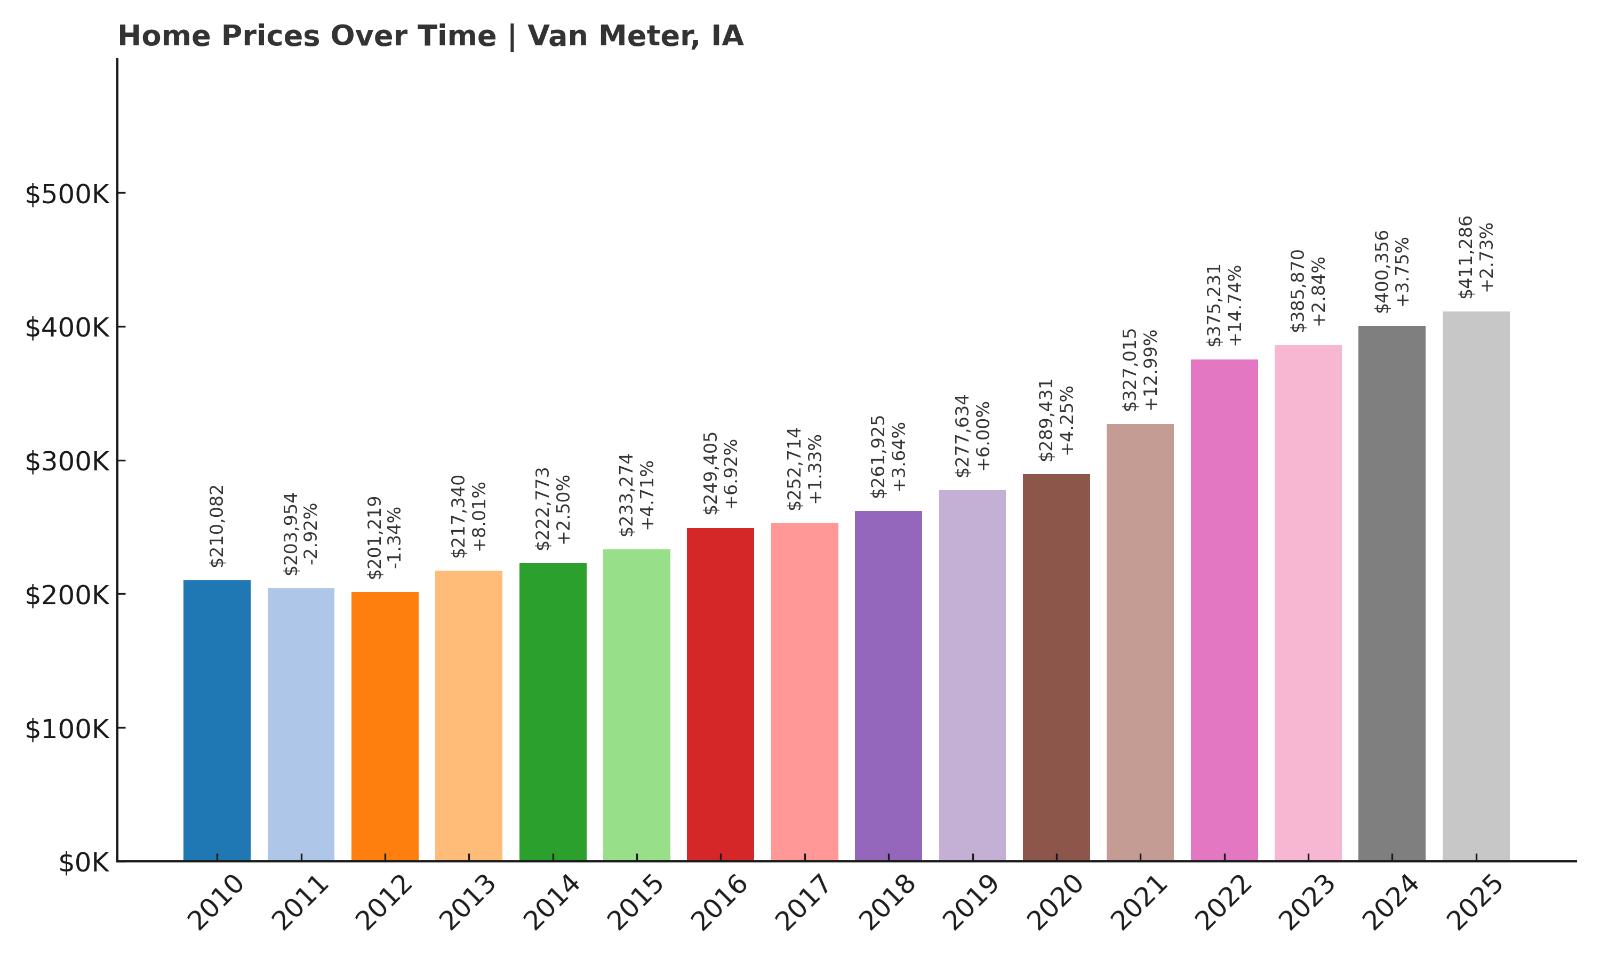
- 2010: $210,082
- 2011: $203,954 (-$6,128, -2.92% from previous year)
- 2012: $201,219 (-$2,735, -1.34% from previous year)
- 2013: $217,340 (+$16,121, +8.01% from previous year)
- 2014: $222,773 (+$5,432, +2.50% from previous year)
- 2015: $233,274 (+$10,501, +4.71% from previous year)
- 2016: $249,405 (+$16,131, +6.92% from previous year)
- 2017: $252,714 (+$3,309, +1.33% from previous year)
- 2018: $261,925 (+$9,210, +3.64% from previous year)
- 2019: $277,634 (+$15,710, +6.00% from previous year)
- 2020: $289,431 (+$11,797, +4.25% from previous year)
- 2021: $327,015 (+$37,583, +12.99% from previous year)
- 2022: $375,231 (+$48,216, +14.74% from previous year)
- 2023: $385,870 (+$10,639, +2.84% from previous year)
- 2024: $400,356 (+$14,486, +3.75% from previous year)
- 2025: $411,286 (+$10,929, +2.73% from previous year)
Van Meter has experienced a nearly 96% increase in home values since 2010, with current prices reaching $411,286. Price growth was modest in the early 2010s, but starting in 2015, the market began gaining traction. Post-2020 saw significant upward momentum, with double-digit appreciation during both 2021 and 2022. Although growth has eased slightly, values remain on an upward trajectory, suggesting solid demand and resilience in the local housing market.
Van Meter – Des Moines Suburb with Room to Grow
Van Meter is a western suburb of Des Moines that combines small-town charm with easy metro access via I-80. Located in Dallas County, one of the fastest-growing counties in Iowa, the town offers newer subdivisions, good schools, and peaceful surroundings. With many families and professionals priced out of central Des Moines, Van Meter has become a prime spot for those seeking more space without sacrificing commute times.
The town has benefited from new residential developments and infrastructure investment. It also boasts cultural heritage attractions like the Bob Feller Museum and views of the Raccoon River Valley. Newer homes and modern amenities have pushed values upward, particularly in the past five years. As the metro continues expanding westward, Van Meter is likely to remain on buyers’ radars and maintain its upward price momentum.
16. Runnells – 111% Home Price Increase Since May 2010
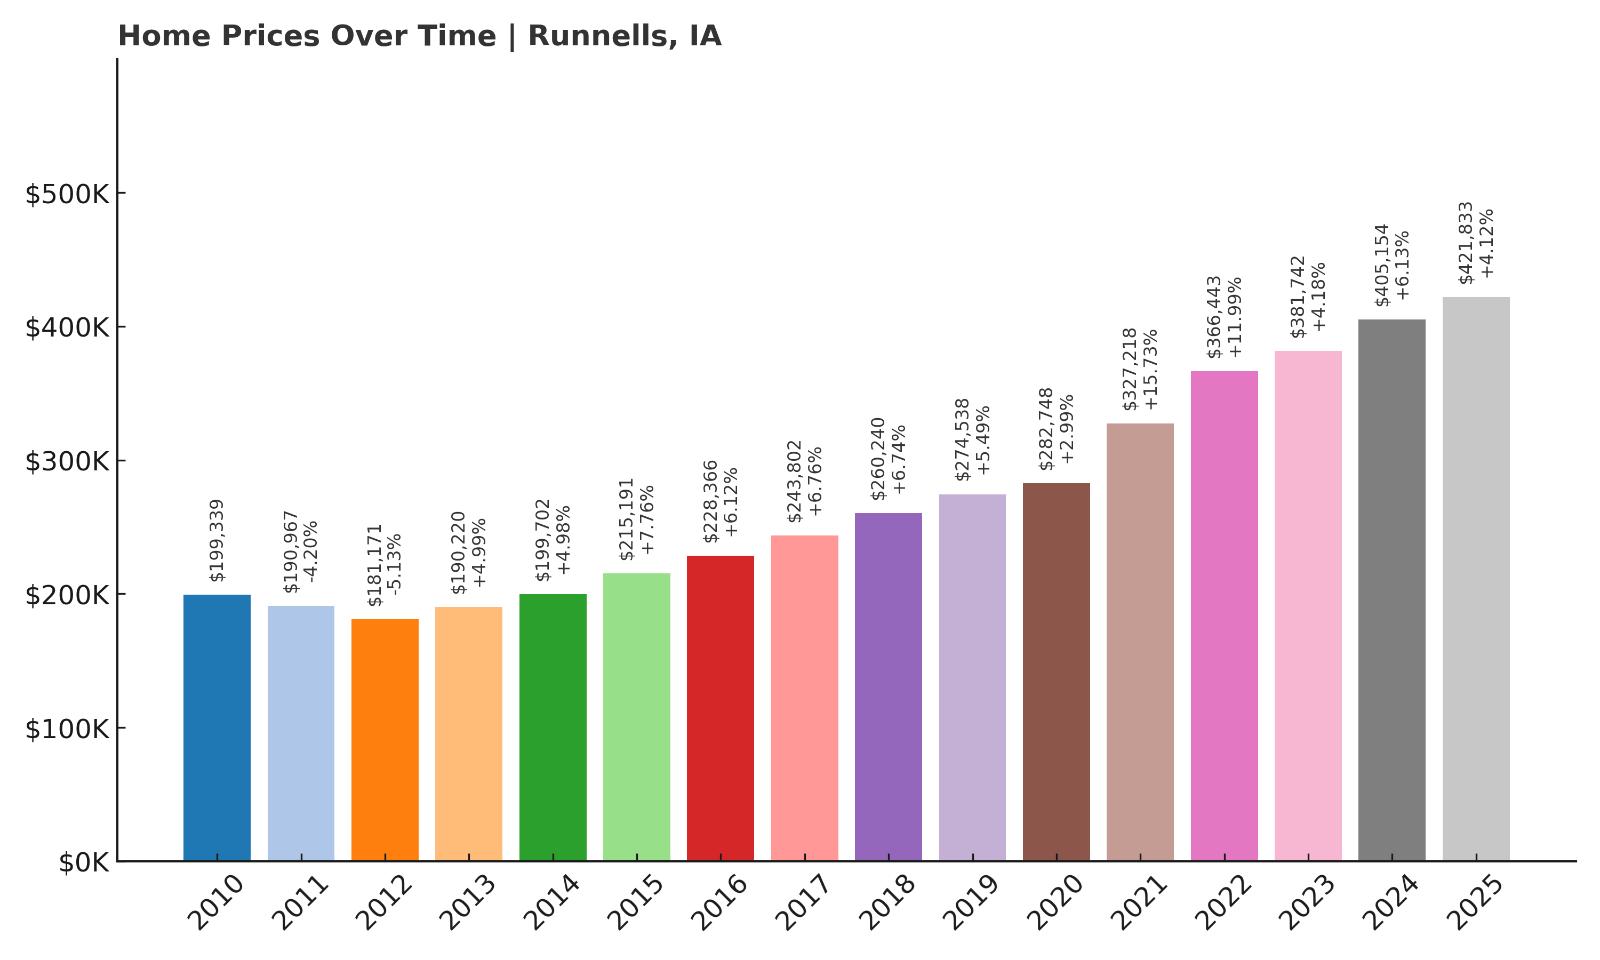
- 2010: $199,339
- 2011: $190,967 (-$8,372, -4.20% from previous year)
- 2012: $181,171 (-$9,796, -5.13% from previous year)
- 2013: $190,220 (+$9,049, +4.99% from previous year)
- 2014: $199,702 (+$9,482, +4.98% from previous year)
- 2015: $215,191 (+$15,489, +7.76% from previous year)
- 2016: $228,366 (+$13,174, +6.12% from previous year)
- 2017: $243,802 (+$15,436, +6.76% from previous year)
- 2018: $260,240 (+$16,438, +6.74% from previous year)
- 2019: $274,538 (+$14,298, +5.49% from previous year)
- 2020: $282,748 (+$8,210, +2.99% from previous year)
- 2021: $327,218 (+$44,470, +15.73% from previous year)
- 2022: $366,443 (+$39,225, +11.99% from previous year)
- 2023: $381,742 (+$15,299, +4.18% from previous year)
- 2024: $405,154 (+$23,411, +6.13% from previous year)
- 2025: $421,833 (+$16,679, +4.12% from previous year)
Runnells has more than doubled in home value since 2010, boasting a 111% increase. The biggest gains occurred from 2020 through 2022, where values jumped by over $80,000. Even as price acceleration has moderated, values continue trending upward, hitting $421,833 in 2025. Its consistent appreciation suggests ongoing demand, likely driven by its position as a semi-rural alternative to the Des Moines suburbs.
Runnells – Quiet Country Living with Big Value Growth
Located southeast of Des Moines in Polk County, Runnells is a quiet town that’s managed to attract sustained interest from buyers seeking rural serenity near the city. The area is surrounded by farmland and nature, offering peace and privacy while still being within 30 minutes of Iowa’s capital. This strategic location helps explain why values have risen so sharply despite the town’s small size.
With much of Runnells made up of single-family homes on large lots, buyers are often drawn to the space and flexibility. New construction and upgrades to older homes have also contributed to rising values. As metro sprawl continues, Runnells offers a compelling value proposition for those who want out-of-town living with in-town access. Its strong value gains in recent years reflect that trend.
15. Peosta – 84% Home Price Increase Since May 2010

- 2010: $229,120
- 2011: $230,817 (+$1,697, +0.74% from previous year)
- 2012: $233,928 (+$3,111, +1.35% from previous year)
- 2013: $237,556 (+$3,628, +1.55% from previous year)
- 2014: $242,820 (+$5,264, +2.22% from previous year)
- 2015: $253,444 (+$10,624, +4.38% from previous year)
- 2016: $264,709 (+$11,265, +4.44% from previous year)
- 2017: $273,168 (+$8,459, +3.20% from previous year)
- 2018: $278,526 (+$5,358, +1.96% from previous year)
- 2019: $289,205 (+$10,679, +3.83% from previous year)
- 2020: $309,707 (+$20,502, +7.09% from previous year)
- 2021: $333,704 (+$23,997, +7.75% from previous year)
- 2022: $379,723 (+$46,019, +13.79% from previous year)
- 2023: $389,106 (+$9,384, +2.47% from previous year)
- 2024: $405,265 (+$16,158, +4.15% from previous year)
- 2025: $422,310 (+$17,046, +4.21% from previous year)
Peosta has experienced a steady 84% increase in home prices over the last 15 years. From 2010 to 2025, values climbed from $229,120 to $422,310, with larger jumps beginning in 2020. The town saw a particularly sharp uptick in 2022 with a $46,000+ increase in just one year. While the pace has normalized since, appreciation continues at a healthy rate, placing Peosta firmly in Iowa’s upper tier of home values.
Peosta – Small Town Charm with Big Growth Near Dubuque
Peosta is located in Dubuque County and is part of the Dubuque metropolitan area. It’s a growing community known for its family-friendly environment, low crime, and expanding amenities. Over the past decade, infrastructure investments and residential developments have helped boost its profile. Peosta also benefits from access to major employers and educational institutions in Dubuque, making it an appealing home base for commuters.
The town has focused on managed growth, offering newer subdivisions while preserving its small-town character. Peosta’s appeal to families and professionals seeking newer housing stock with convenient city access has kept demand strong. The data backs that up, showing steady price gains year after year, even during slower periods in the broader Iowa market.
14. Polk City – 102% Home Price Increase Since May 2010
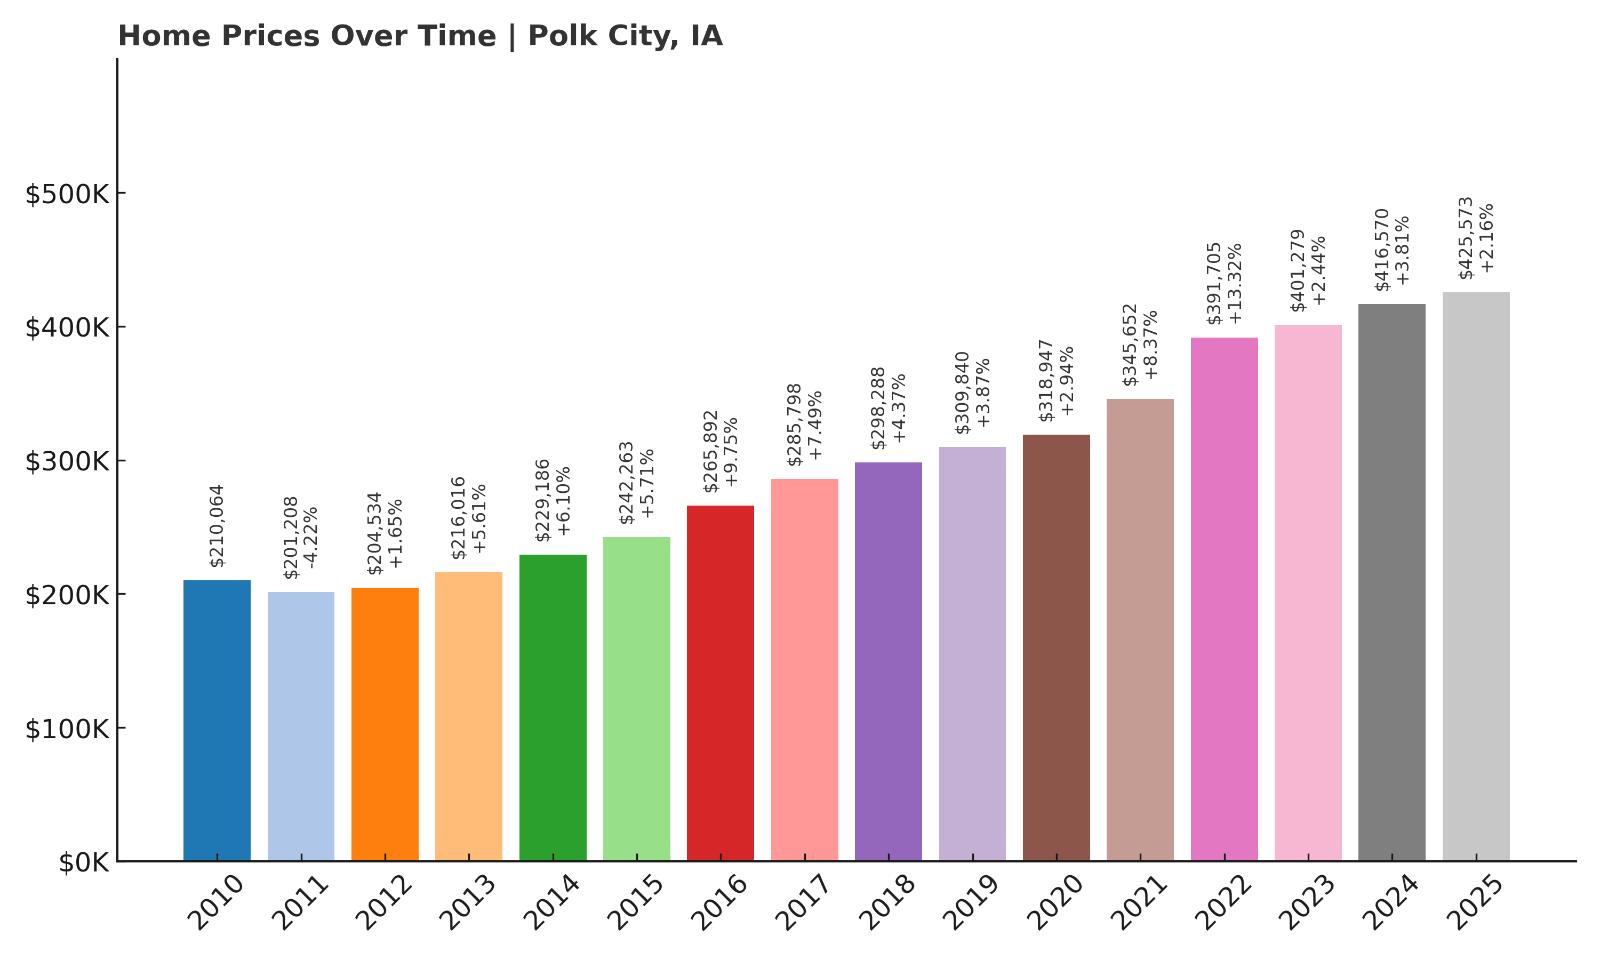
- 2010: $210,064
- 2011: $201,208 (-$8,856, -4.22% from previous year)
- 2012: $204,534 (+$3,326, +1.65% from previous year)
- 2013: $216,016 (+$11,483, +5.61% from previous year)
- 2014: $229,186 (+$13,170, +6.10% from previous year)
- 2015: $242,263 (+$13,077, +5.71% from previous year)
- 2016: $265,892 (+$23,629, +9.75% from previous year)
- 2017: $285,798 (+$19,906, +7.49% from previous year)
- 2018: $298,288 (+$12,490, +4.37% from previous year)
- 2019: $309,840 (+$11,552, +3.87% from previous year)
- 2020: $318,947 (+$9,107, +2.94% from previous year)
- 2021: $345,652 (+$26,705, +8.37% from previous year)
- 2022: $391,705 (+$46,053, +13.32% from previous year)
- 2023: $401,279 (+$9,575, +2.44% from previous year)
- 2024: $416,570 (+$15,291, +3.81% from previous year)
- 2025: $425,573 (+$9,002, +2.16% from previous year)
Polk City home values have doubled since 2010, with an impressive 102% increase. Although appreciation slowed slightly in 2023 and 2025, the long-term trajectory remains strong. The town’s steepest gains came during the 2015–2022 stretch, when prices surged by over $140,000. With a current median home value of $425,573, Polk City continues to be one of Iowa’s pricier residential destinations.
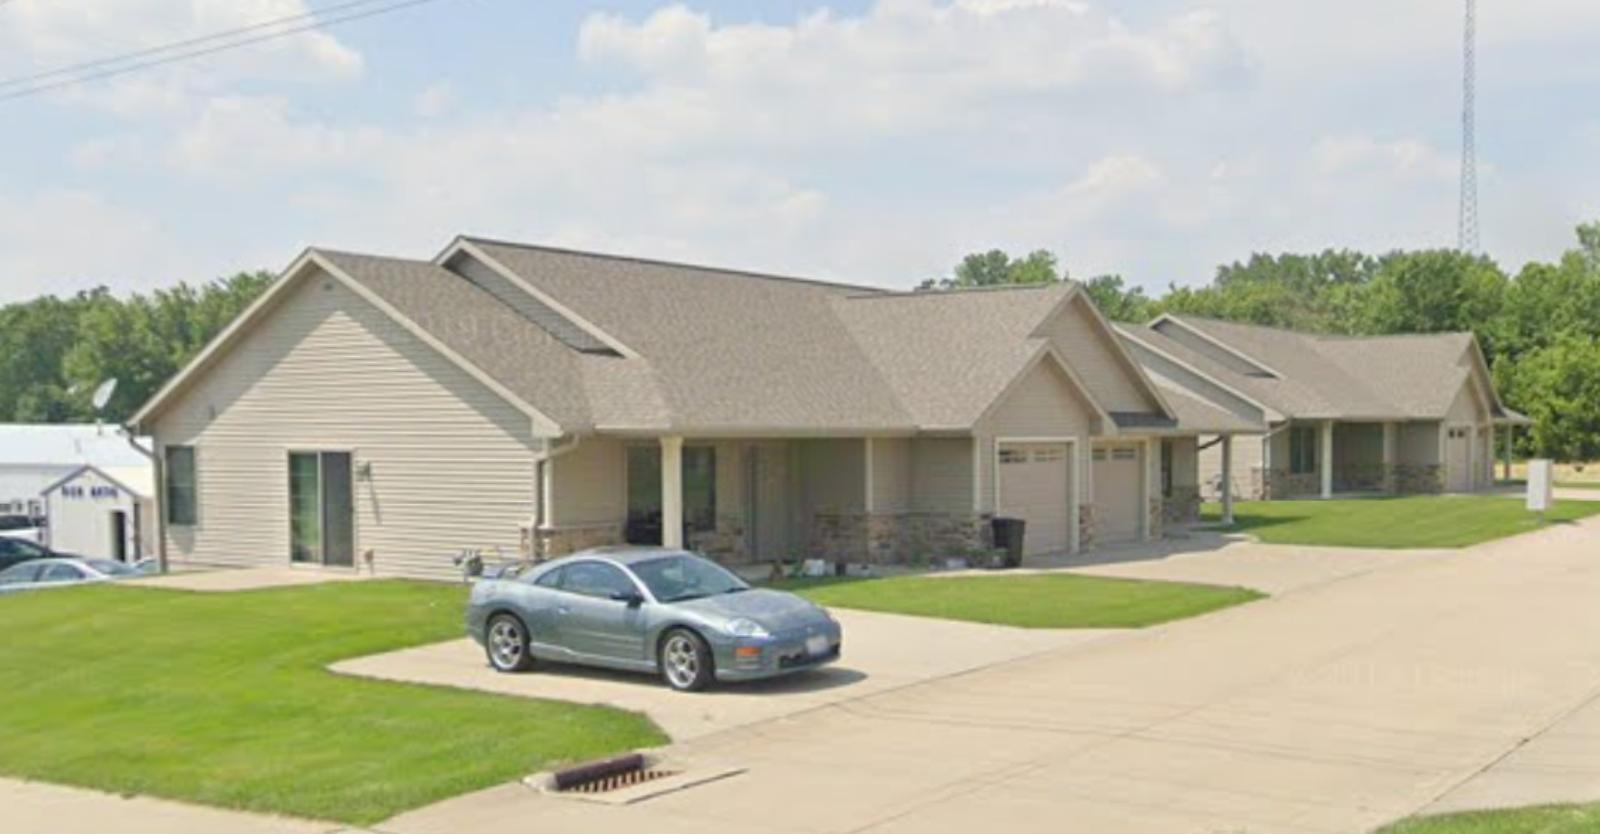
Polk City – Lakeside Living Near Des Moines
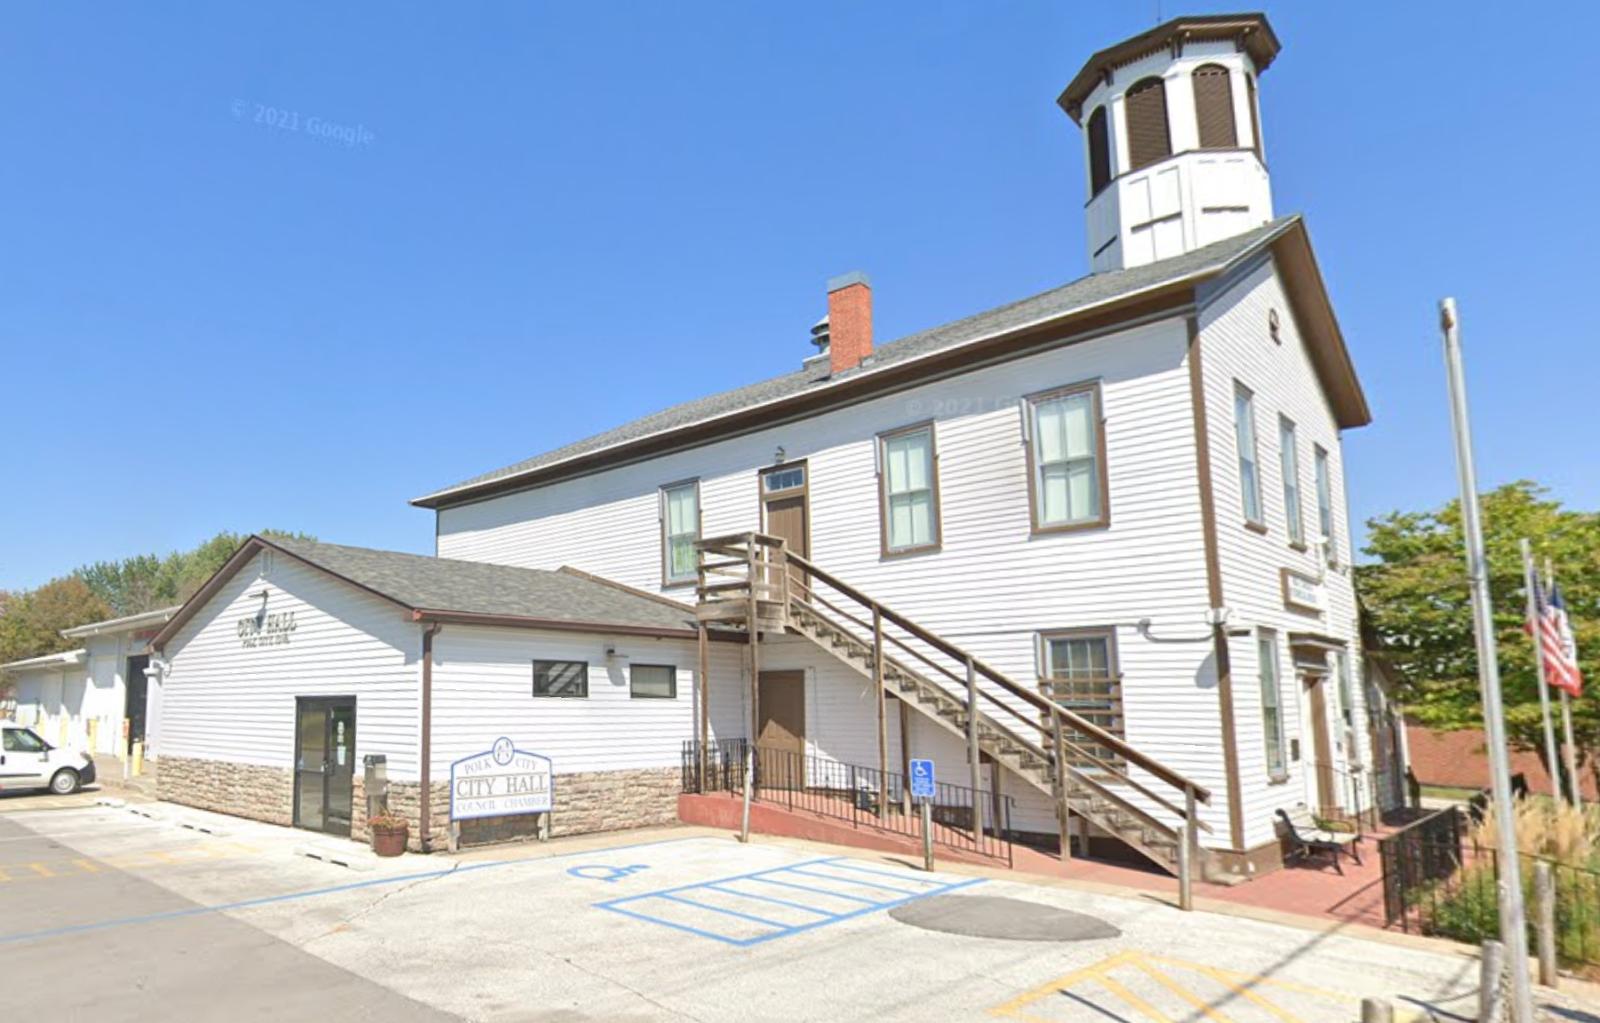
Polk City sits between Big Creek State Park and Saylorville Lake, giving it a unique blend of suburban and recreational appeal. Located in Polk County and within the Des Moines metropolitan area, it attracts buyers looking for proximity to the capital along with access to nature and water. Its location offers scenic views, parks, trails, and strong school options — all factors that continue to drive demand.
In recent years, residential construction has expanded the town’s housing options, while maintaining a quieter, outdoorsy feel. Homebuyers seeking space and lifestyle upgrades — such as waterfront lots or easy boating access — often see Polk City as a premium choice. The town’s impressive price increases reflect that growing appeal and suggest continued interest in outdoor-oriented communities near urban hubs.
13. Okoboji – 117% Home Price Increase Since May 2010
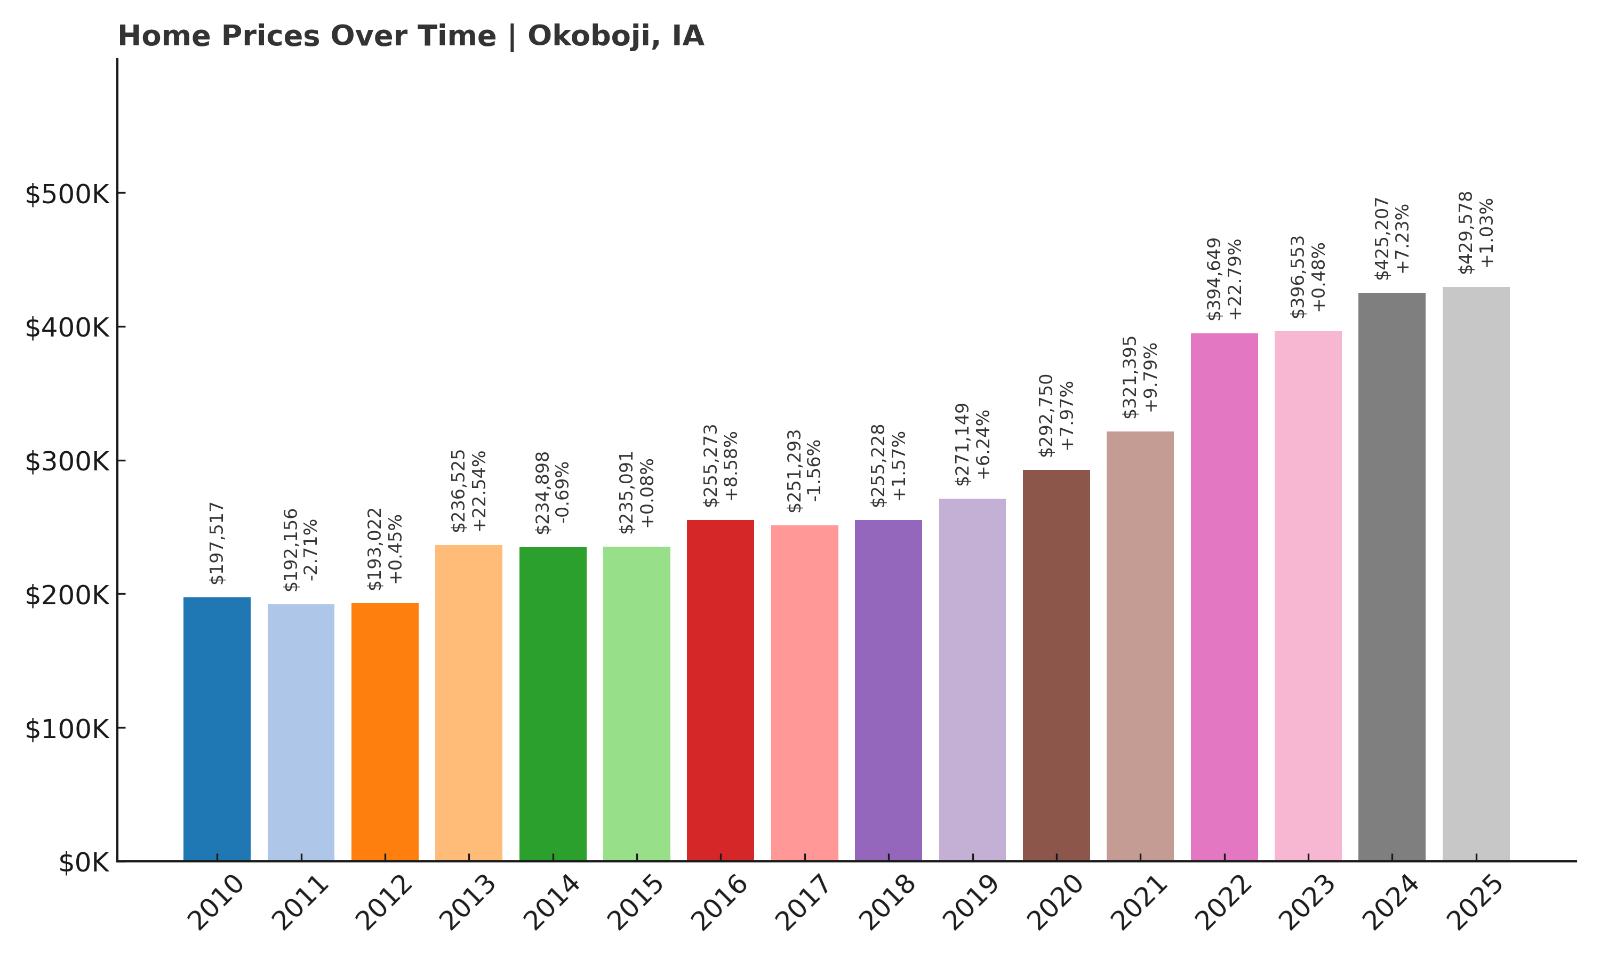
- 2010: $197,517
- 2011: $192,156 (-$5,362, -2.71% from previous year)
- 2012: $193,022 (+$866, +0.45% from previous year)
- 2013: $236,525 (+$43,504, +22.54% from previous year)
- 2014: $234,898 (-$1,627, -0.69% from previous year)
- 2015: $235,091 (+$192, +0.08% from previous year)
- 2016: $255,273 (+$20,182, +8.58% from previous year)
- 2017: $251,293 (-$3,980, -1.56% from previous year)
- 2018: $255,228 (+$3,936, +1.57% from previous year)
- 2019: $271,149 (+$15,921, +6.24% from previous year)
- 2020: $292,750 (+$21,600, +7.97% from previous year)
- 2021: $321,395 (+$28,646, +9.79% from previous year)
- 2022: $394,649 (+$73,254, +22.79% from previous year)
- 2023: $396,553 (+$1,904, +0.48% from previous year)
- 2024: $425,207 (+$28,654, +7.23% from previous year)
- 2025: $429,578 (+$4,371, +1.03% from previous year)
Home prices in Okoboji have more than doubled since 2010, climbing 117% overall. The biggest surge came in 2022, when values jumped over $73,000 in a single year. Although appreciation has slowed in the last two years, the town remains one of Iowa’s most expensive, with a 2025 median value of $429,578. Price growth has generally tracked with increased demand for lakefront and vacation-style homes in northwest Iowa. A few years, such as 2014 and 2017, saw minor dips, but they were short-lived and followed by strong rebounds. That overall trajectory reflects a durable real estate market driven by lifestyle preferences and long-term desirability. Okoboji stands out on this list because it combines strong seasonal tourism with stable, year-round ownership appeal. The town’s value growth shows no major signs of reversal, even after a cooling period post-2022.
Okoboji – Lakefront Living with Statewide Appeal

Okoboji is a scenic town in Dickinson County, famous for its access to the Iowa Great Lakes, especially West Lake Okoboji, one of the state’s most pristine and desirable bodies of water. Its appeal as a recreational hub has made it a destination not only for vacationers but also for year-round residents who want the charm of waterfront living without leaving the state. The town features a mix of luxury homes, seasonal cottages, and modern condos — offering a range of options for those seeking views and access to the water. Even though the population is relatively small, tourism infrastructure is well-developed, with shops, marinas, trails, and entertainment venues drawing people throughout the year.
Okoboji’s location contributes significantly to its elevated home prices. The region is isolated enough to remain exclusive, yet it benefits from regional traffic during summer months, including visitors from Minnesota, Nebraska, and South Dakota. Real estate in Okoboji tends to be limited in supply, particularly near the shoreline, which puts upward pressure on prices. In recent years, high demand for remote-friendly living has attracted more buyers interested in scenic, low-stress environments like this. Investment in lakefront upgrades and community development has further elevated the town’s profile. As families and retirees continue to prioritize lifestyle in their homebuying decisions, Okoboji remains one of Iowa’s strongest markets for long-term value growth.
12. Swisher – 61% Home Price Increase Since May 2010
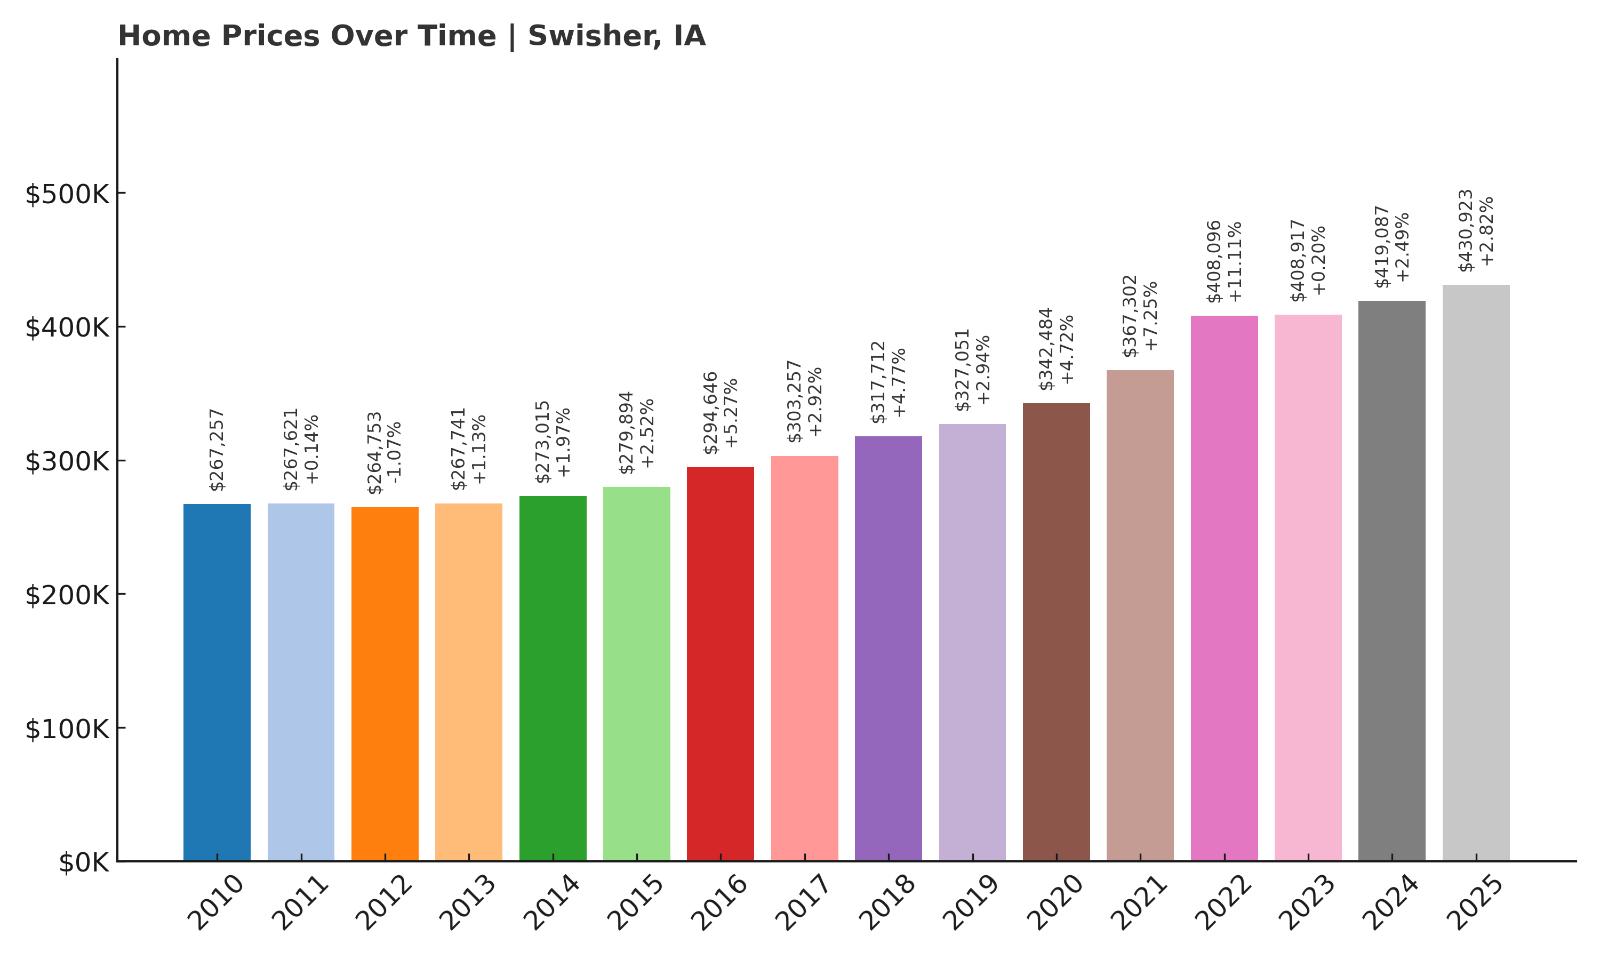
- 2010: $267,257
- 2011: $267,621 (+$364, +0.14% from previous year)
- 2012: $264,753 (-$2,869, -1.07% from previous year)
- 2013: $267,741 (+$2,988, +1.13% from previous year)
- 2014: $273,015 (+$5,274, +1.97% from previous year)
- 2015: $279,894 (+$6,879, +2.52% from previous year)
- 2016: $294,646 (+$14,752, +5.27% from previous year)
- 2017: $303,257 (+$8,611, +2.92% from previous year)
- 2018: $317,712 (+$14,455, +4.77% from previous year)
- 2019: $327,051 (+$9,339, +2.94% from previous year)
- 2020: $342,484 (+$15,432, +4.72% from previous year)
- 2021: $367,302 (+$24,818, +7.25% from previous year)
- 2022: $408,096 (+$40,794, +11.11% from previous year)
- 2023: $408,917 (+$822, +0.20% from previous year)
- 2024: $419,087 (+$10,170, +2.49% from previous year)
- 2025: $430,923 (+$11,836, +2.82% from previous year)
Home prices in Swisher have risen steadily over the past 15 years, with a total increase of 61% since 2010. While growth was fairly slow during the early part of the decade, things accelerated notably between 2016 and 2022. In 2022 alone, values rose by over $40,000, highlighting strong buyer activity and tight supply. As of 2025, the median home price is $430,923, a clear indication that Swisher has moved into the upper echelon of Iowa’s residential markets. Unlike towns with erratic jumps or price dips, Swisher’s price curve has remained smooth and reliable, signaling consistent demand. This reliability may be especially appealing to families or buyers looking to invest in a stable, growing area. Even the minor slowdown in 2023 was followed by strong gains in 2024 and 2025. Overall, Swisher’s trajectory suggests that demand is tied to deeper regional desirability rather than market fads or short-term hype.
Swisher – Small Town, Big Appeal Between Iowa Cities
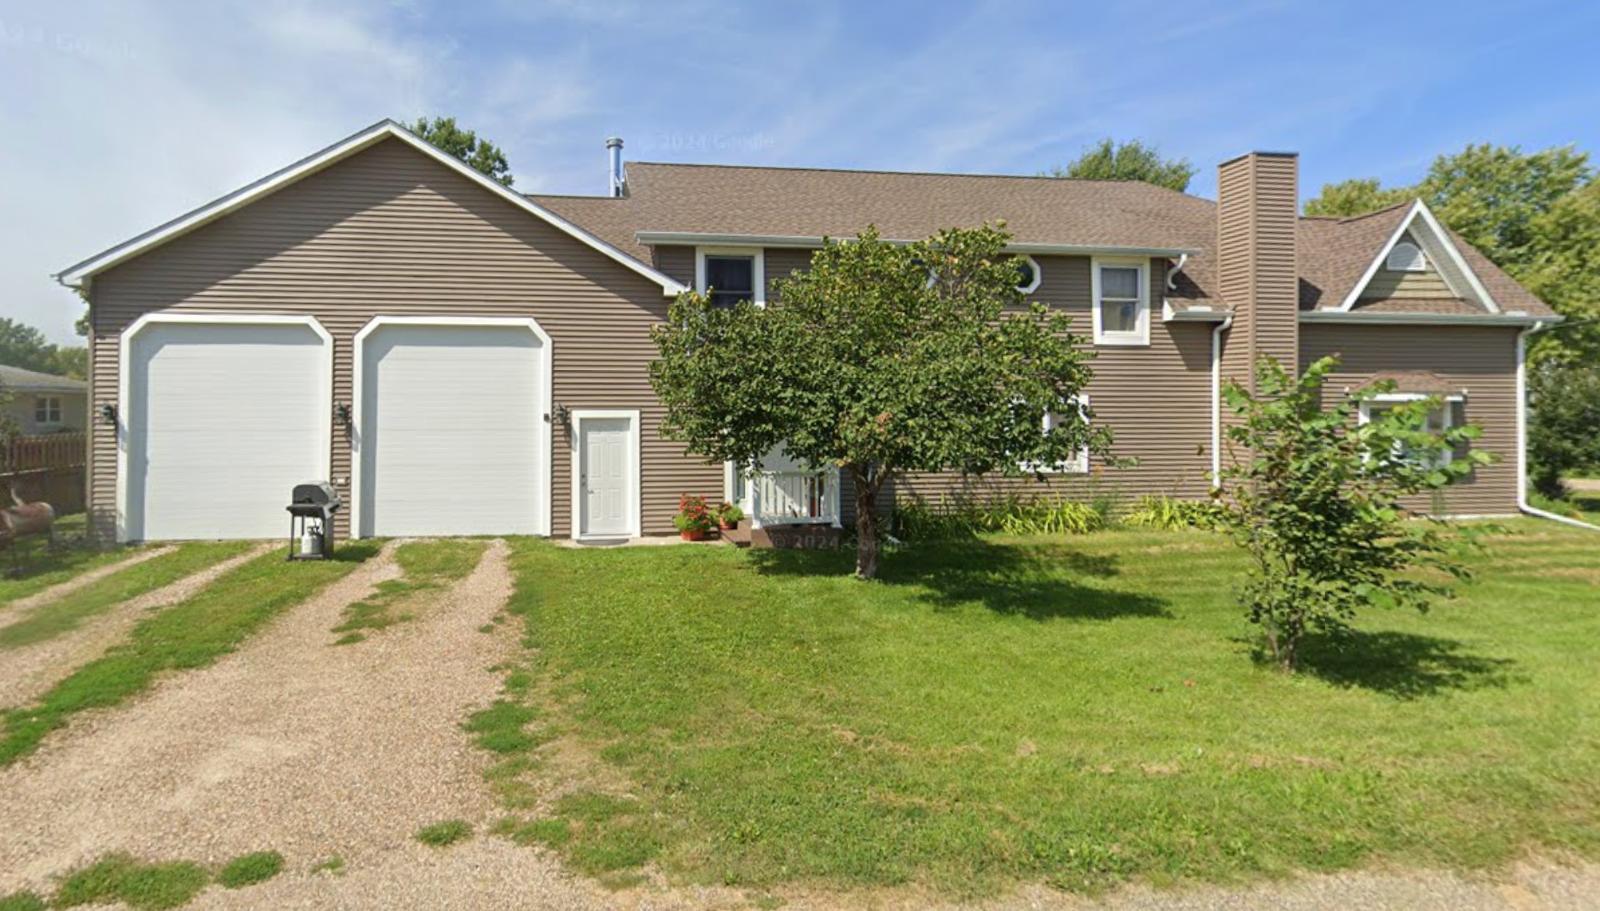
Swisher is a well-located town in Johnson County, positioned between the growing urban centers of Cedar Rapids and Iowa City. This prime location makes it a commuter-friendly option for professionals working in either city while providing the atmosphere of a rural community. The town offers large lots, scenic surroundings, and a peaceful environment — all of which appeal to families and retirees alike. With a population of under 1,000, Swisher maintains a tightly knit community vibe, but it’s close enough to major highways and commercial hubs to provide the convenience many buyers want.
Home construction in Swisher has increased over the past decade, often with a focus on upscale single-family homes and custom builds. This trend has helped elevate average home values steadily. The proximity to the University of Iowa and major health and tech employers in the area ensures consistent housing demand. Swisher also benefits from being in a high-performing school district, which adds to its family-friendly reputation. The town’s clean, orderly layout and open landscapes are attractive to those who want space without sacrificing access to jobs, healthcare, and higher education. Altogether, Swisher offers a blend of serenity and opportunity that continues to drive its real estate market upward.
11. Clive – 73% Home Price Increase Since May 2010

- 2010: $249,601
- 2011: $242,315 (-$7,286, -2.92% from previous year)
- 2012: $239,908 (-$2,407, -0.99% from previous year)
- 2013: $251,608 (+$11,700, +4.88% from previous year)
- 2014: $266,431 (+$14,823, +5.89% from previous year)
- 2015: $279,524 (+$13,093, +4.91% from previous year)
- 2016: $292,543 (+$13,019, +4.66% from previous year)
- 2017: $302,490 (+$9,948, +3.40% from previous year)
- 2018: $309,452 (+$6,962, +2.30% from previous year)
- 2019: $316,127 (+$6,674, +2.16% from previous year)
- 2020: $322,864 (+$6,737, +2.13% from previous year)
- 2021: $350,857 (+$27,993, +8.67% from previous year)
- 2022: $398,632 (+$47,775, +13.62% from previous year)
- 2023: $409,207 (+$10,575, +2.65% from previous year)
- 2024: $425,624 (+$16,417, +4.01% from previous year)
- 2025: $431,006 (+$5,382, +1.26% from previous year)
Clive has seen a 73% rise in home prices since 2010, with strong gains during the pandemic years and steady appreciation throughout the last decade. From a base of $249,601 in 2010, values have grown to $431,006 in 2025, including particularly sharp jumps in 2021 and 2022. Those years alone added nearly $76,000 in value. While recent years have seen more modest increases, the upward momentum has remained intact, with no years of negative growth since 2012. Clive’s real estate market is driven by consistent local demand, proximity to employment centers, and a high quality of life. Even during years when other towns saw flattening values, Clive kept pushing forward, offering reliable long-term value for homeowners and investors.
Clive – High-Income Suburb with Steady Growth
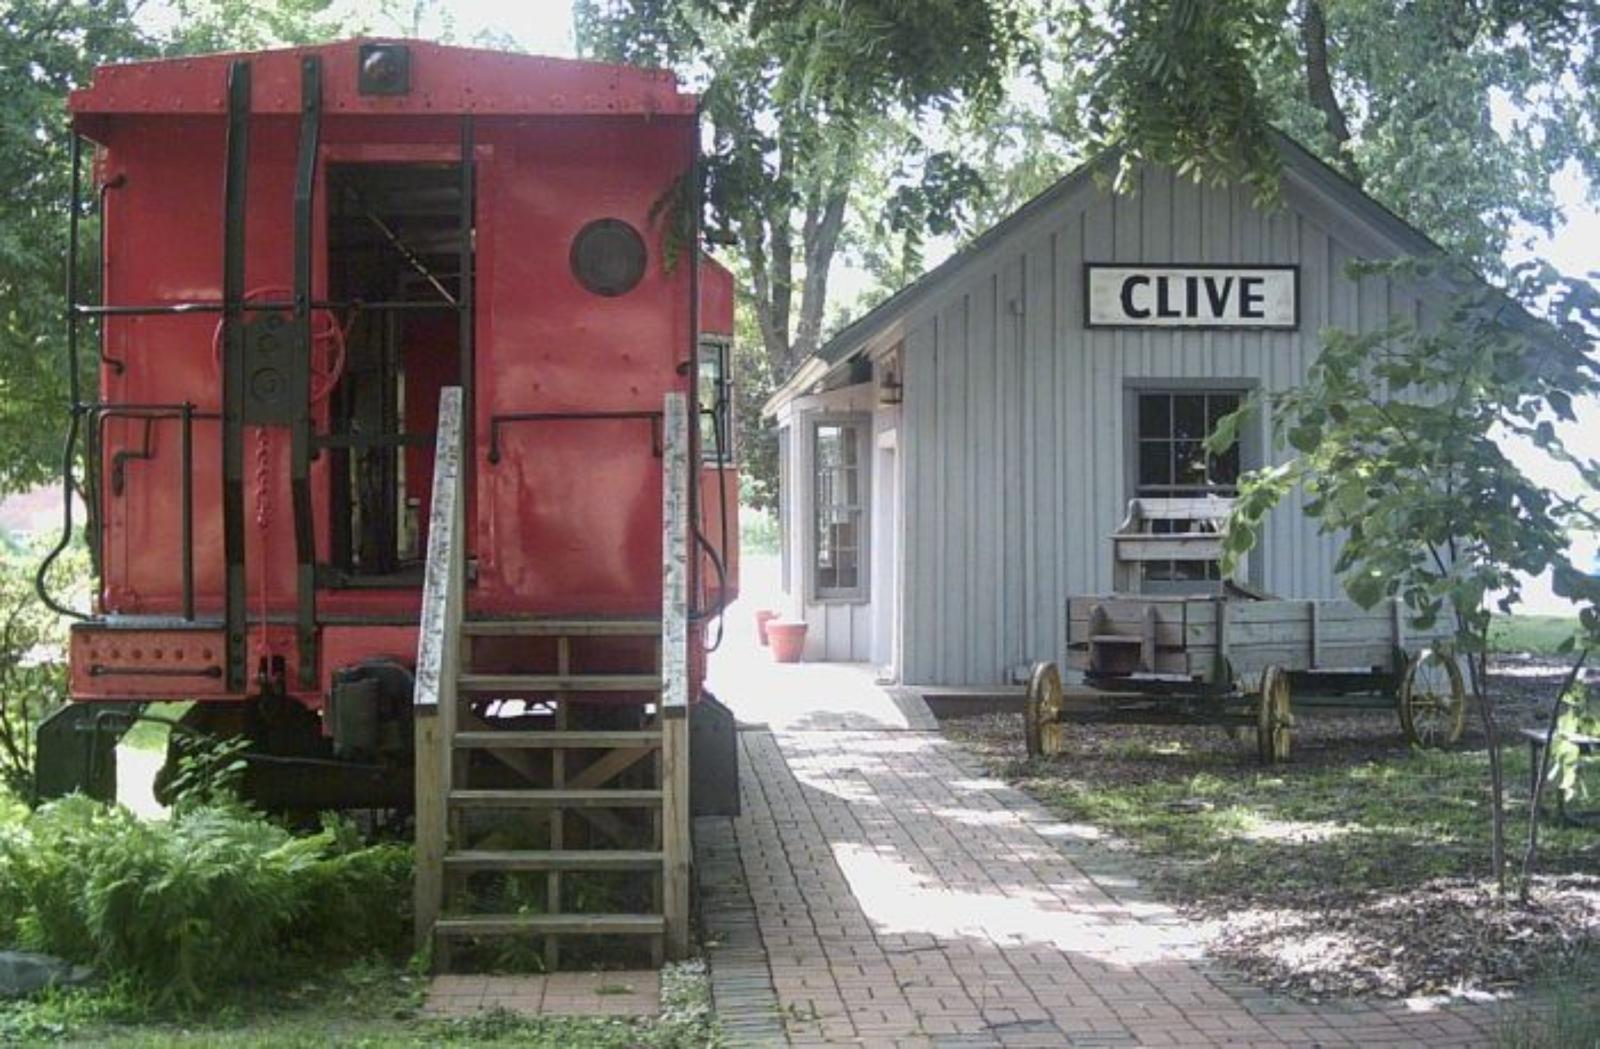
Clive is a well-established suburb of Des Moines located primarily in Polk County, with a portion extending into Dallas County. Known for its affluence, excellent schools, and proximity to shopping, healthcare, and corporate offices, Clive is one of the metro’s most desirable residential areas. The city is home to numerous parks and trails, including the popular Clive Greenbelt Trail, which weaves through neighborhoods and natural spaces. These features have helped Clive maintain strong appeal for families, professionals, and retirees looking for high-quality suburban living.
Over the past 15 years, Clive has seen major residential and commercial development, including new subdivisions and upgrades to existing infrastructure. Its location along the I-80/I-235 corridor allows for quick access to downtown Des Moines, making it a favorite among commuters who want space and comfort without long drive times. Demand has been especially strong for newer homes and townhomes, which are often priced at a premium. As one of the metro’s top-tier housing markets, Clive continues to attract consistent demand, which is clearly reflected in its steady appreciation curve. Despite national fluctuations, Clive’s market remains resilient and continues to climb at a sustainable pace.
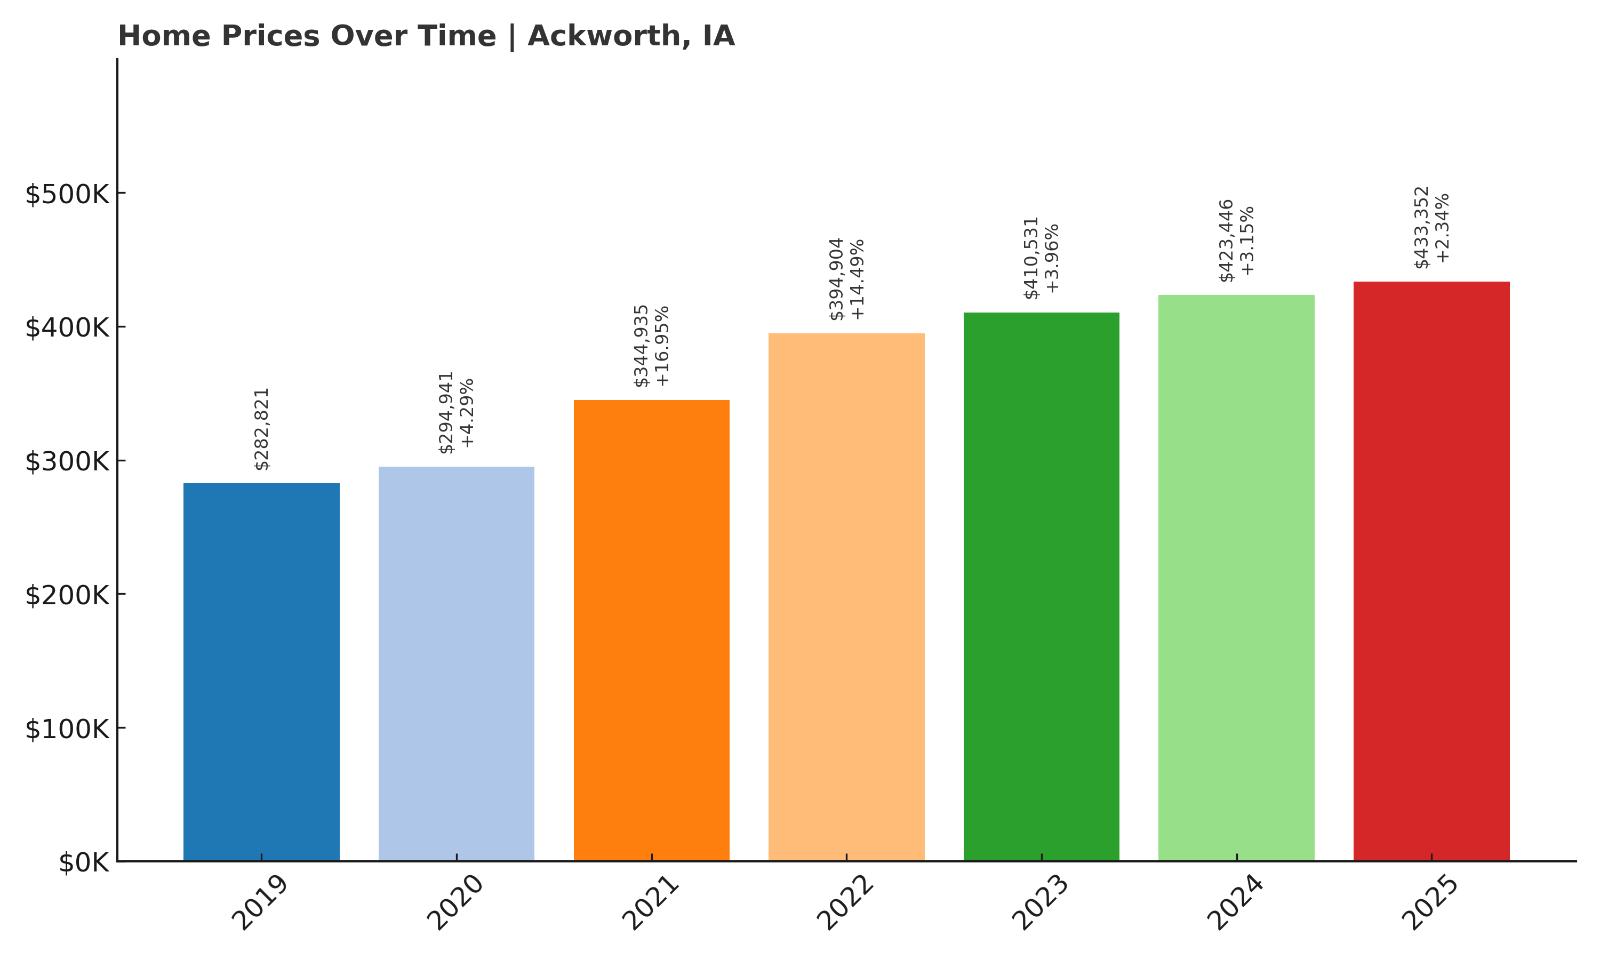
10. Ackworth – 53% Home Price Increase Since May 2019
- 2010: N/A
- 2011: N/A
- 2012: N/A
- 2013: N/A
- 2014: N/A
- 2015: N/A
- 2016: N/A
- 2017: N/A
- 2018: N/A
- 2019: $282,821
- 2020: $294,941 (+$12,120, +4.29% from previous year)
- 2021: $344,935 (+$49,994, +16.95% from previous year)
- 2022: $394,904 (+$49,970, +14.49% from previous year)
- 2023: $410,531 (+$15,626, +3.96% from previous year)
- 2024: $423,446 (+$12,916, +3.15% from previous year)
- 2025: $433,352 (+$9,906, +2.34% from previous year)
Ackworth’s recorded home price data begins in 2019, but even in that short window, the town has seen a substantial 53% increase. Prices climbed from $282,821 in 2019 to $433,352 by 2025, with the sharpest appreciation happening during the pandemic years of 2021 and 2022. In those two years alone, values increased by nearly $100,000. Since then, Ackworth’s price trajectory has continued to trend upward, though the rate of growth has moderated. These gains point to sustained buyer interest and reflect a broader shift in housing demand toward smaller, more rural towns with easy access to urban jobs. Even with limited data before 2019, the recent consistency and scale of price gains firmly place Ackworth among Iowa’s top-performing towns by value.
Ackworth – Rapid Rise on the Metro Edge
Ackworth is a small community in Warren County located just southeast of Des Moines. Although tiny in size, its location near Indianola and within commuting distance of the metro area has made it a strategic spot for buyers looking to balance space, price, and proximity. Over the past few years, more people have moved to communities like Ackworth as remote work has taken hold and families seek larger properties with lower density. That shift has fueled rising prices, especially in towns with easy access to Des Moines and Highway 65.
New housing activity in the surrounding area, combined with low housing inventory, has helped push values higher in Ackworth. Residents are attracted to the peaceful rural setting and the ability to buy larger lots for less than comparable suburban areas. While services within the town itself are limited, essential amenities in Indianola and Carlisle are only a short drive away. Buyers seem willing to trade a bit of commute time for quiet surroundings and rising property values. As more development creeps outward from Des Moines, towns like Ackworth are positioned to benefit from both their affordability and their appeal to value-focused buyers.
9. Arnolds Park – 137% Home Price Increase Since May 2010
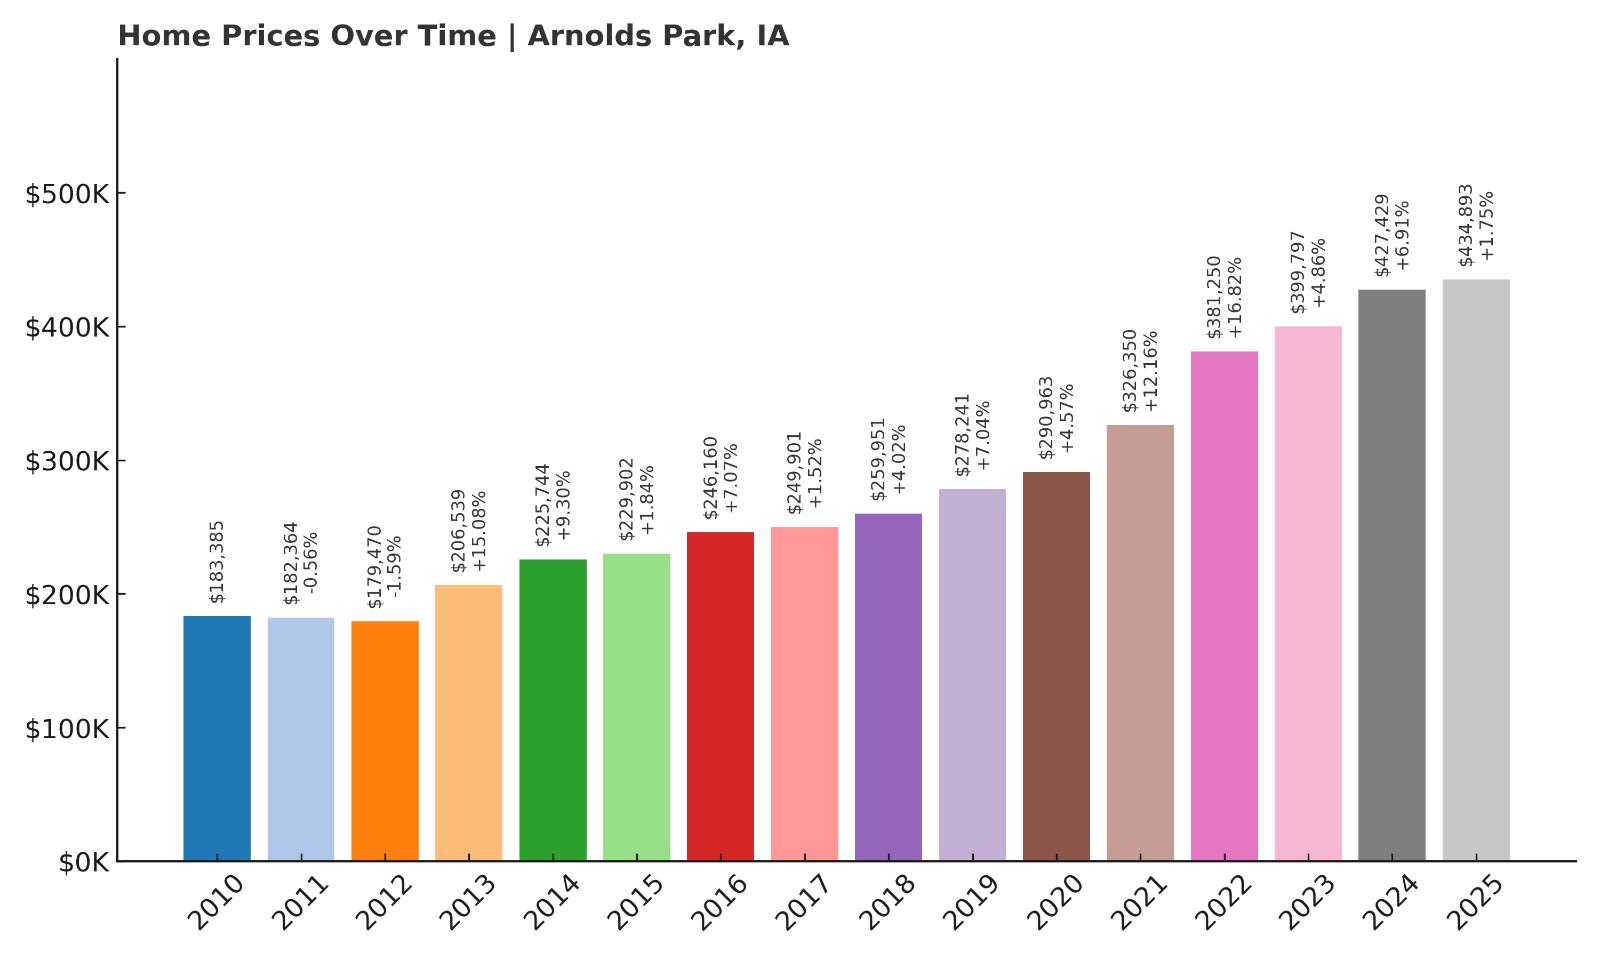
- 2010: $183,385
- 2011: $182,364 (-$1,022, -0.56% from previous year)
- 2012: $179,470 (-$2,894, -1.59% from previous year)
- 2013: $206,539 (+$27,070, +15.08% from previous year)
- 2014: $225,744 (+$19,204, +9.30% from previous year)
- 2015: $229,902 (+$4,158, +1.84% from previous year)
- 2016: $246,160 (+$16,258, +7.07% from previous year)
- 2017: $249,901 (+$3,742, +1.52% from previous year)
- 2018: $259,951 (+$10,049, +4.02% from previous year)
- 2019: $278,241 (+$18,290, +7.04% from previous year)
- 2020: $290,963 (+$12,722, +4.57% from previous year)
- 2021: $326,350 (+$35,387, +12.16% from previous year)
- 2022: $381,250 (+$54,900, +16.82% from previous year)
- 2023: $399,797 (+$18,546, +4.86% from previous year)
- 2024: $427,429 (+$27,633, +6.91% from previous year)
- 2025: $434,893 (+$7,464, +1.75% from previous year)
Arnolds Park has experienced one of the largest long-term increases on this list — a remarkable 137% growth in home prices since 2010. Values nearly doubled between 2013 and 2022, with several years of double-digit growth. The pandemic housing boom pushed prices up sharply, and even in 2024, the town added nearly $28,000 in value. By 2025, home values reached $434,893, putting Arnolds Park firmly into Iowa’s top-tier housing markets. The town’s appeal has remained consistent over time, driven by its location near West Okoboji Lake and its status as a premier summer destination. Even as price growth cooled somewhat in 2025, Arnolds Park remains a magnet for second-home buyers and retirees alike, keeping housing demand elevated.
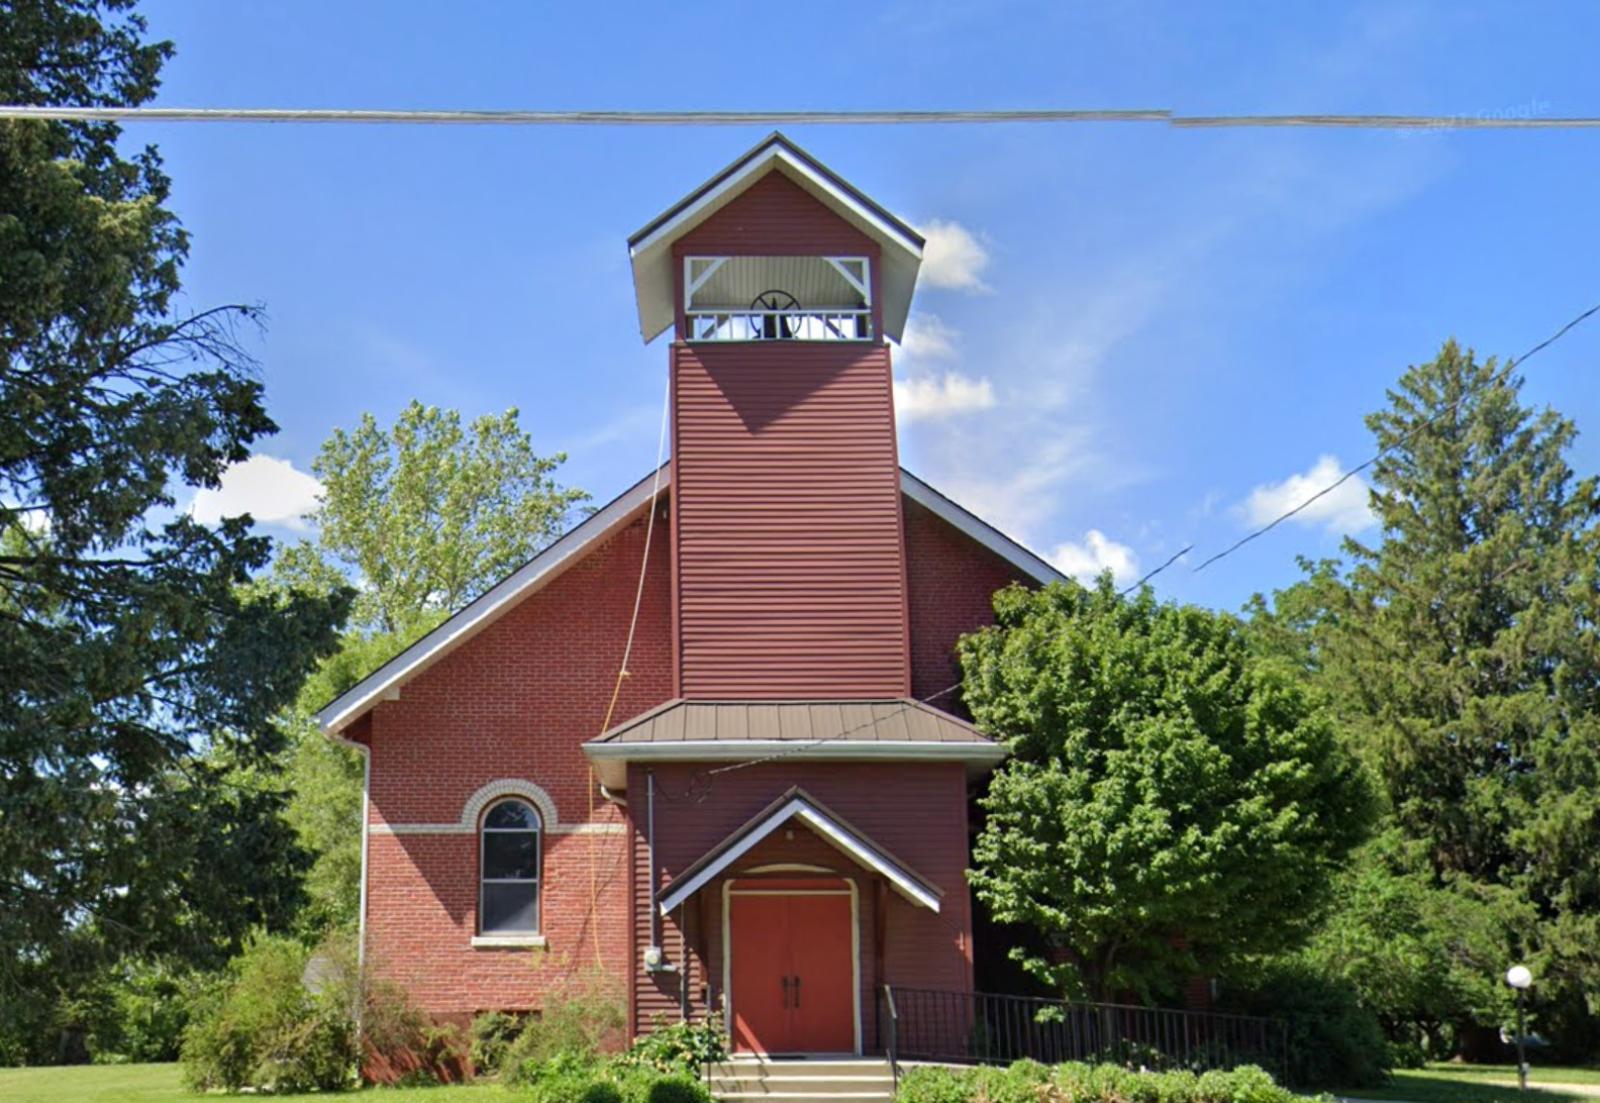
Arnolds Park – Lake Tourism Powers a Hot Market
Located in Dickinson County, Arnolds Park is a resort town that draws visitors from all over the Midwest. The town is part of the broader Iowa Great Lakes region, sitting right along the shores of West Okoboji Lake — a deep, spring-fed body of water known for its clarity and recreation. With beaches, boating, concerts, and lakeside restaurants, Arnolds Park has long been a tourist haven. This seasonal economy supports high home values, especially for waterfront properties and vacation homes. Many buyers in the area are investing in second homes or retirement retreats, further fueling demand and limiting inventory.
The town is also home to the historic Arnolds Park Amusement Park, a central attraction for generations of Iowa families. This sense of nostalgia and strong regional identity gives the town lasting appeal, while infrastructure and real estate development have continued to modernize in recent years. Unlike some other lake towns, Arnolds Park has managed to maintain a high level of interest across economic cycles. As remote work has made location less important for many homeowners, areas like Arnolds Park — which offer lifestyle advantages and natural beauty — have gained popularity well beyond their seasonal appeal. That continued desirability is reflected in its sustained home price climb year after year.
8. Solon – 88% Home Price Increase Since May 2010
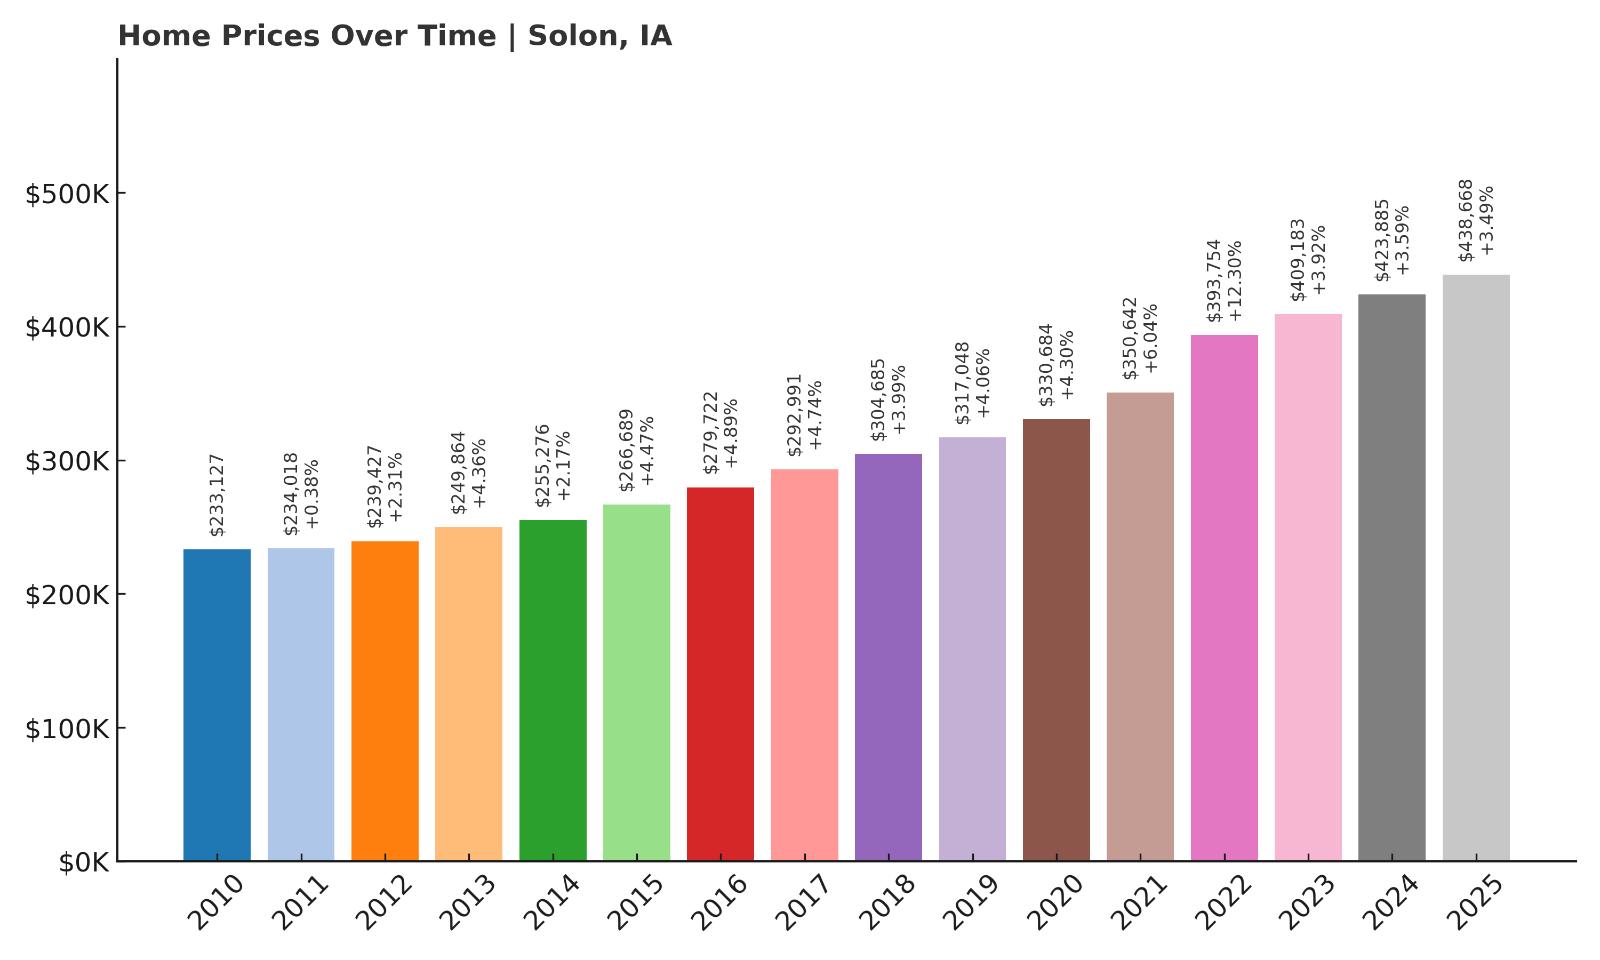
- 2010: $233,127
- 2011: $234,018 (+$891, +0.38% from previous year)
- 2012: $239,427 (+$5,409, +2.31% from previous year)
- 2013: $249,864 (+$10,436, +4.36% from previous year)
- 2014: $255,276 (+$5,413, +2.17% from previous year)
- 2015: $266,689 (+$11,413, +4.47% from previous year)
- 2016: $279,722 (+$13,033, +4.89% from previous year)
- 2017: $292,991 (+$13,268, +4.74% from previous year)
- 2018: $304,685 (+$11,694, +3.99% from previous year)
- 2019: $317,048 (+$12,364, +4.06% from previous year)
- 2020: $330,684 (+$13,635, +4.30% from previous year)
- 2021: $350,642 (+$19,959, +6.04% from previous year)
- 2022: $393,754 (+$43,112, +12.30% from previous year)
- 2023: $409,183 (+$15,428, +3.92% from previous year)
- 2024: $423,885 (+$14,702, +3.59% from previous year)
- 2025: $438,668 (+$14,783, +3.49% from previous year)
Solon has seen a steady and substantial rise in home prices since 2010, growing by 88% over 15 years. The town’s strongest growth period came between 2020 and 2022, adding over $63,000 in value during that time. Each year in the last decade has brought additional gains, with no annual declines recorded. Even in 2025, values rose by nearly $15,000, showing sustained momentum. What sets Solon apart is the balance between strong value appreciation and predictable, measured growth — making it a particularly attractive market for families, long-term residents, and real estate investors alike. The consistency of Solon’s market performance is a sign of deep-rooted local demand and a strong foundation of regional appeal.
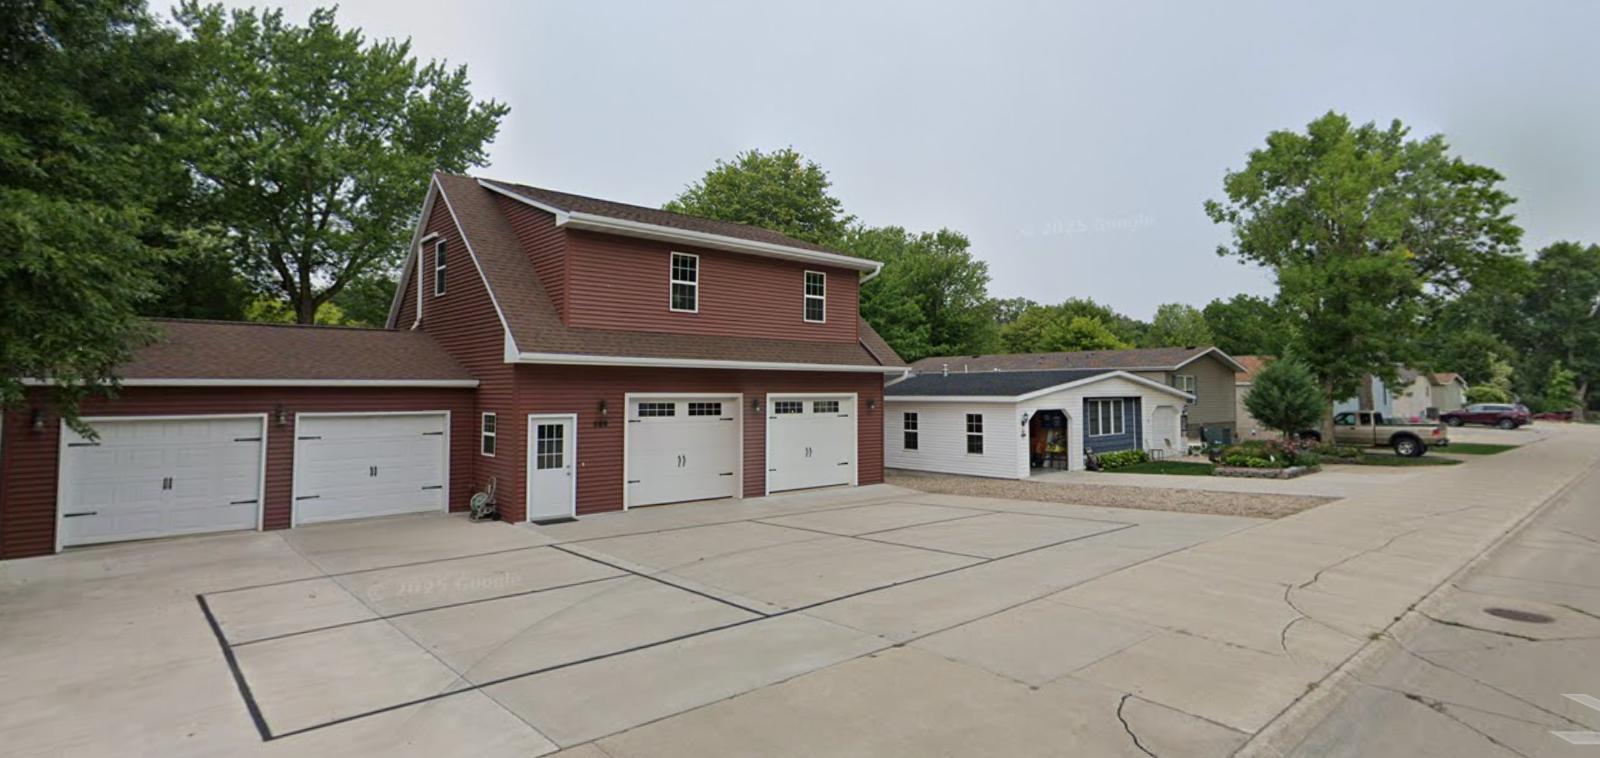
Solon – Growth Hub Between Iowa City and Cedar Rapids
Solon is a fast-growing town in Johnson County located directly between Iowa City and Cedar Rapids. This prime location has turned it into one of the most desirable communities in eastern Iowa. With top-rated schools, scenic trails, Lake Macbride State Park, and a historic downtown, Solon offers an appealing mix of natural charm and urban access. Many professionals who work in Iowa City or Cedar Rapids choose to live in Solon for its peaceful environment and new housing developments. As demand for high-quality suburban living has grown, Solon has seen steady investment in both public amenities and residential neighborhoods.
Solon’s growth has been managed strategically, with an emphasis on preserving its small-town feel while expanding its housing and infrastructure. New construction has contributed to rising home values, especially as more buyers look for homes in the corridor between Iowa’s two major eastern cities. Its excellent school district draws families from across the region, adding pressure to a housing market that already has limited inventory. With its desirable location, strong community identity, and consistent upward trend in prices, Solon stands out as one of the most balanced and resilient housing markets in the state.
5. Shueyville – 66% Home Price Increase Since May 2010
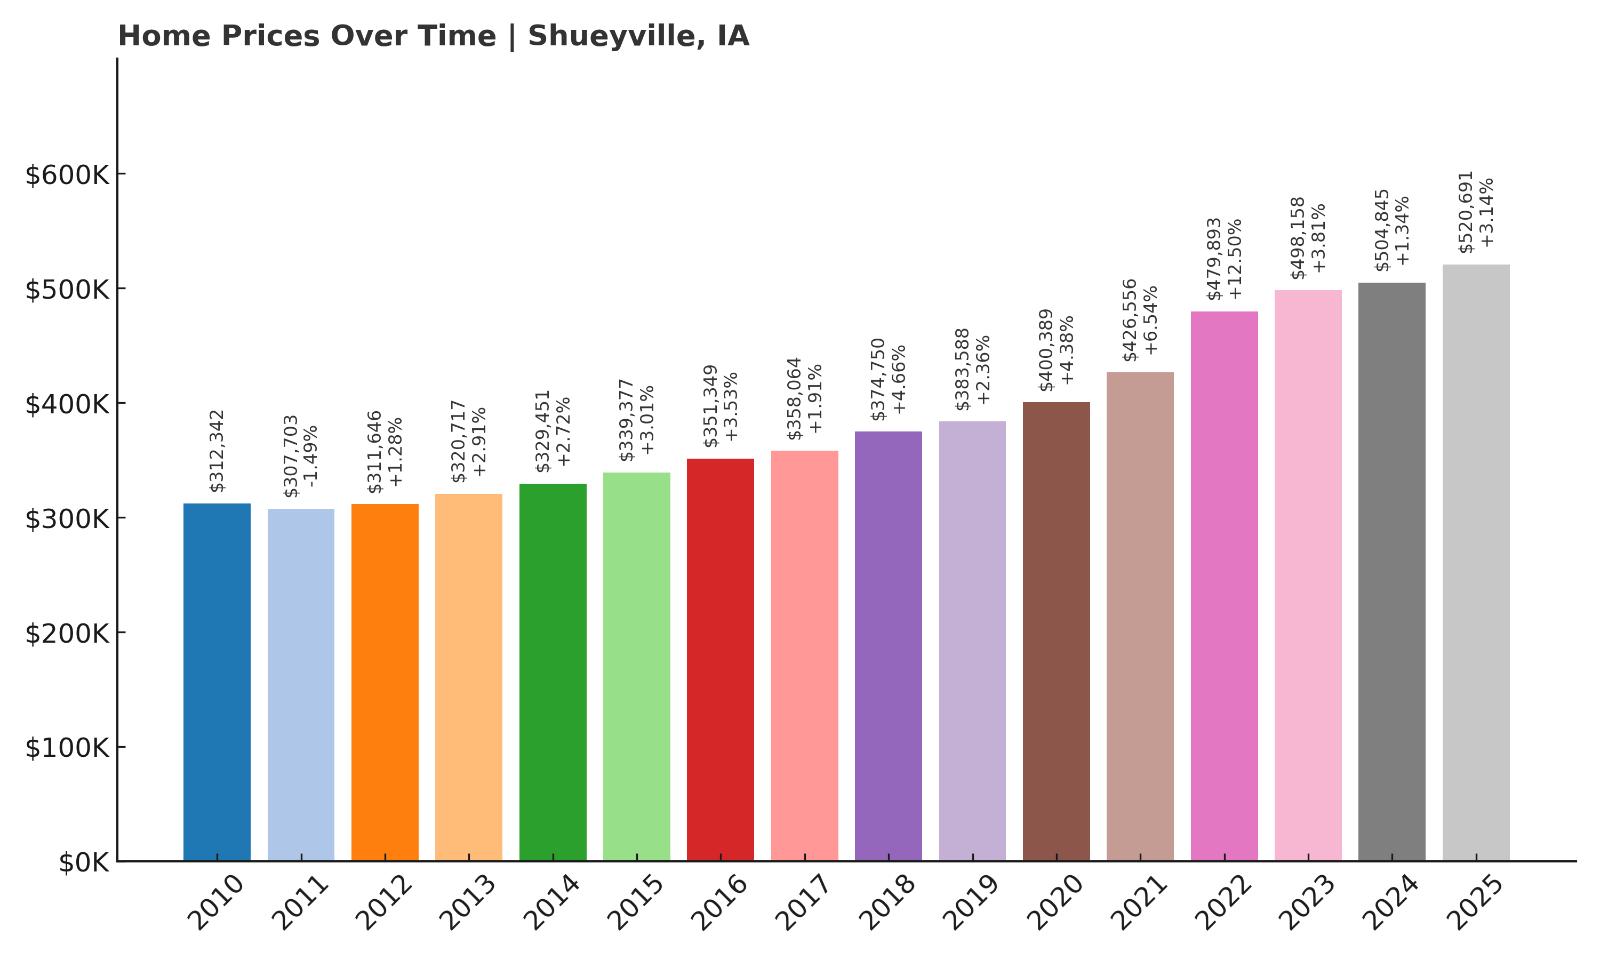
- 2010: $312,342
- 2011: $307,703 (-$4,640, -1.49% from previous year)
- 2012: $311,646 (+$3,943, +1.28% from previous year)
- 2013: $320,717 (+$9,071, +2.91% from previous year)
- 2014: $329,451 (+$8,733, +2.72% from previous year)
- 2015: $339,377 (+$9,926, +3.01% from previous year)
- 2016: $351,349 (+$11,972, +3.53% from previous year)
- 2017: $358,064 (+$6,715, +1.91% from previous year)
- 2018: $374,750 (+$16,686, +4.66% from previous year)
- 2019: $383,588 (+$8,838, +2.36% from previous year)
- 2020: $400,389 (+$16,801, +4.38% from previous year)
- 2021: $426,556 (+$26,167, +6.54% from previous year)
- 2022: $479,893 (+$53,337, +12.50% from previous year)
- 2023: $498,158 (+$18,264, +3.81% from previous year)
- 2024: $504,845 (+$6,687, +1.34% from previous year)
- 2025: $520,691 (+$15,846, +3.14% from previous year)
Home values in Shueyville have grown 66% since 2010, with particularly strong gains during the post-pandemic boom. From 2020 to 2022, the town saw a jump of nearly $80,000 in just two years — a signal of intense buyer activity and tightening supply. Even after that peak, prices continued to climb steadily, reaching $520,691 in 2025. While not the highest growth rate on this list, Shueyville’s price trend has been impressively stable, with consistent increases nearly every year since 2012. This steadiness, combined with high base values, makes Shueyville one of Iowa’s most dependable upper-market communities. Even smaller annual increases like those in 2023 and 2024 suggest a market that has matured rather than cooled. Its mix of high-value homes, rural charm, and proximity to urban job centers positions it well for continued long-term demand.
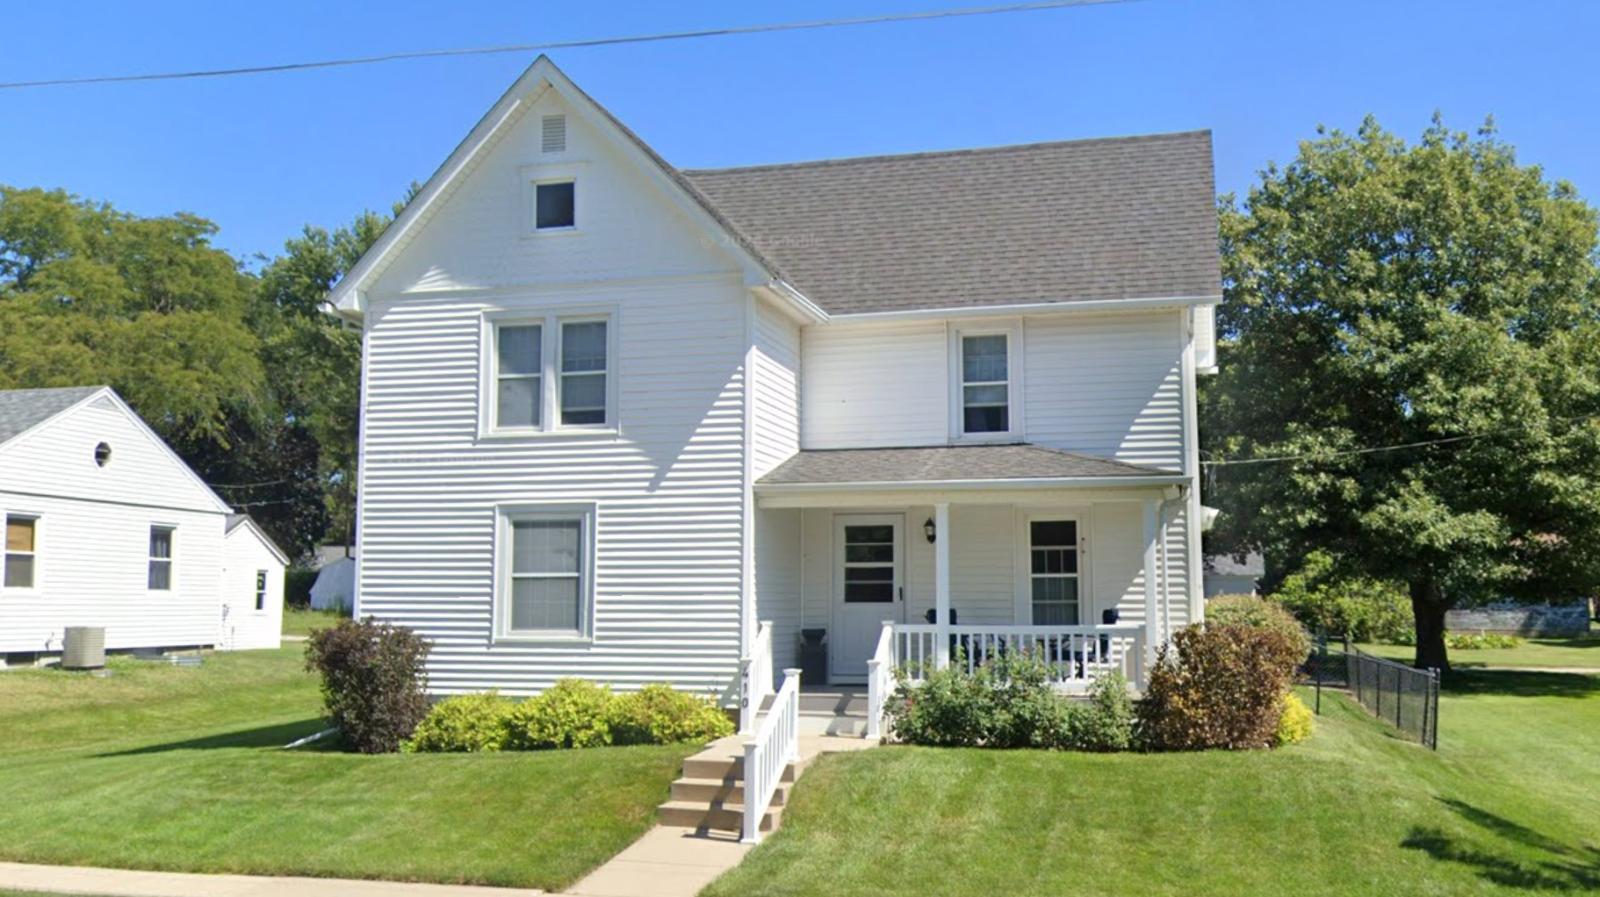
Shueyville – Affluent Enclave Between Cedar Rapids and Iowa City
Shueyville is located in Johnson County, nestled in the corridor between Cedar Rapids and Iowa City. It’s one of the most affluent small towns in eastern Iowa and consistently ranks among the highest in home values. The town has a quiet, semi-rural character with large-lot custom homes, modern subdivisions, and excellent access to both major cities. For professionals working at the University of Iowa or in Cedar Rapids’ tech and healthcare sectors, Shueyville offers a peaceful, upscale living environment without sacrificing convenience. It’s also part of the College Community School District, which attracts families looking for strong educational opportunities just outside the urban core.
Shueyville has limited commercial development, which helps preserve its residential appeal and quiet streetscapes. Newer developments emphasize quality over density, with homes that often exceed $500,000 in value. The town’s proximity to major highways makes it ideal for commuters, while its limited size and zoning preserve its exclusivity. Residents value the privacy, natural beauty, and clean layout, all of which help maintain high property values. With steady price appreciation, strong infrastructure, and no signs of overbuilding, Shueyville remains a top choice for buyers looking for long-term value in eastern Iowa’s high-end housing market.
4. Cumming – 122% Home Price Increase Since May 2010
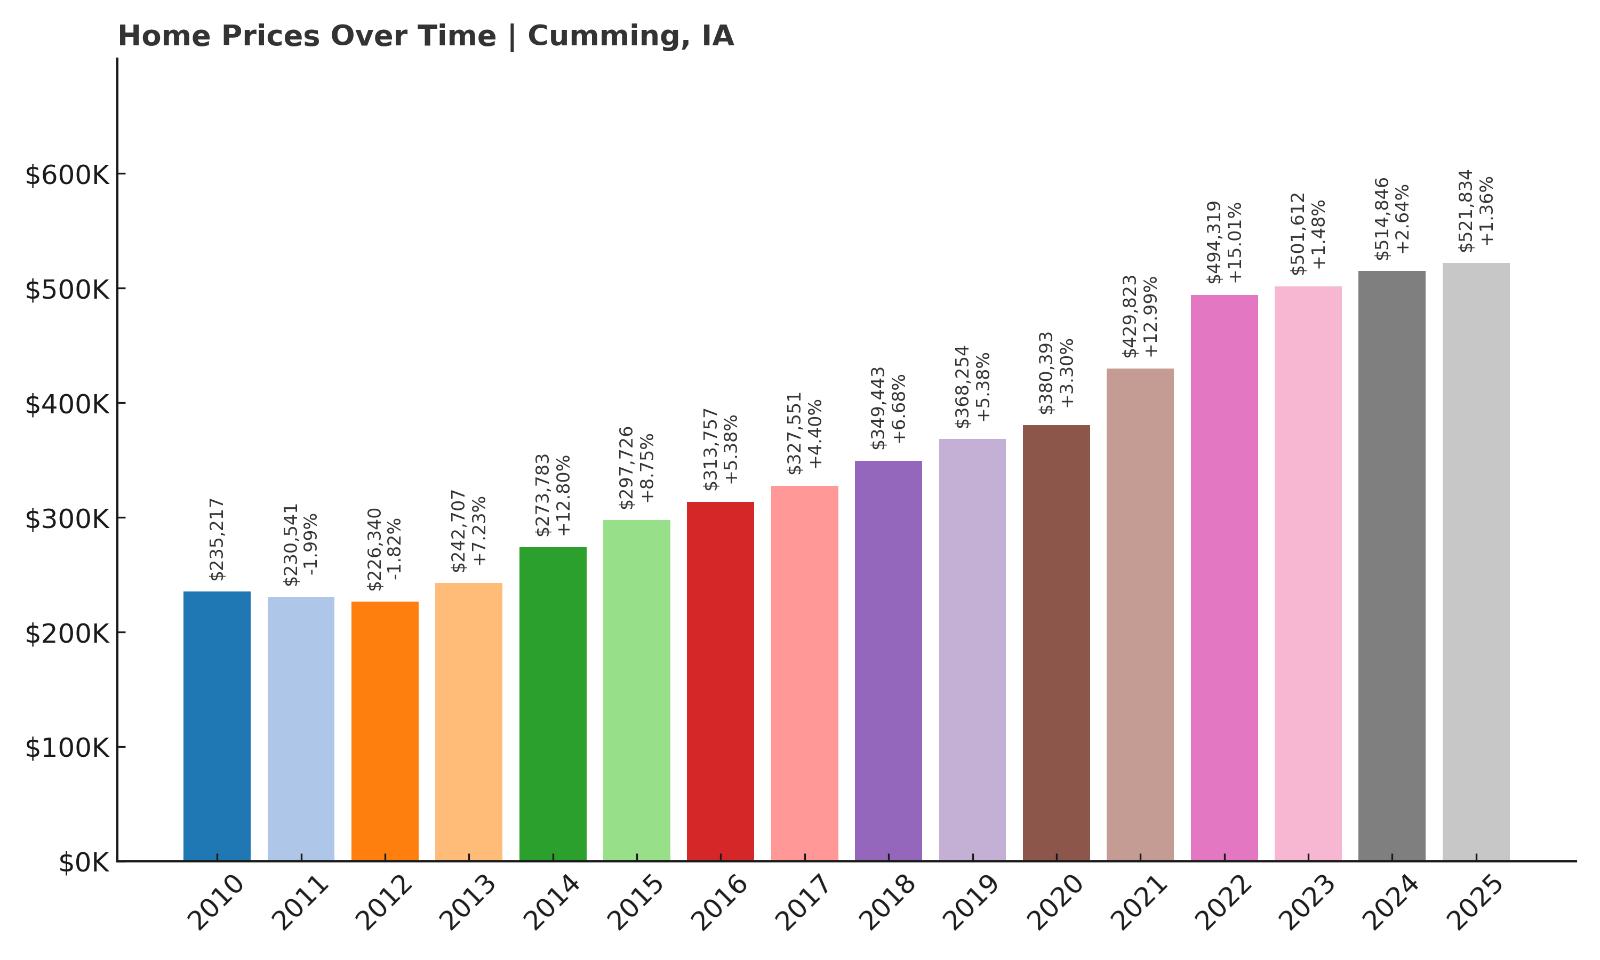
- 2010: $235,217
- 2011: $230,541 (-$4,675, -1.99% from previous year)
- 2012: $226,340 (-$4,201, -1.82% from previous year)
- 2013: $242,707 (+$16,366, +7.23% from previous year)
- 2014: $273,783 (+$31,076, +12.80% from previous year)
- 2015: $297,726 (+$23,944, +8.75% from previous year)
- 2016: $313,757 (+$16,030, +5.38% from previous year)
- 2017: $327,551 (+$13,795, +4.40% from previous year)
- 2018: $349,443 (+$21,892, +6.68% from previous year)
- 2019: $368,254 (+$18,811, +5.38% from previous year)
- 2020: $380,393 (+$12,139, +3.30% from previous year)
- 2021: $429,823 (+$49,430, +12.99% from previous year)
- 2022: $494,319 (+$64,497, +15.01% from previous year)
- 2023: $501,612 (+$7,293, +1.48% from previous year)
- 2024: $514,846 (+$13,233, +2.64% from previous year)
- 2025: $521,834 (+$6,988, +1.36% from previous year)
Home prices in Cumming have surged 122% since 2010, making it one of the fastest-growing housing markets in Iowa. The biggest price increases came between 2020 and 2022, when values rose by over $110,000 in just two years. While appreciation has slowed somewhat in the past three years, values still climbed in every single year tracked, with no interruptions. This consistent growth, combined with a high-end housing base, has propelled Cumming to the top tier of Iowa’s most expensive communities. The current median price sits at $521,834, a sharp rise from its 2010 level of just $235,217. Cumming’s appeal is tied not only to its proximity to Des Moines but also to its lifestyle-focused developments and rural feel. Despite a relatively small population, demand in Cumming remains strong and deeply rooted in the town’s careful growth strategy.
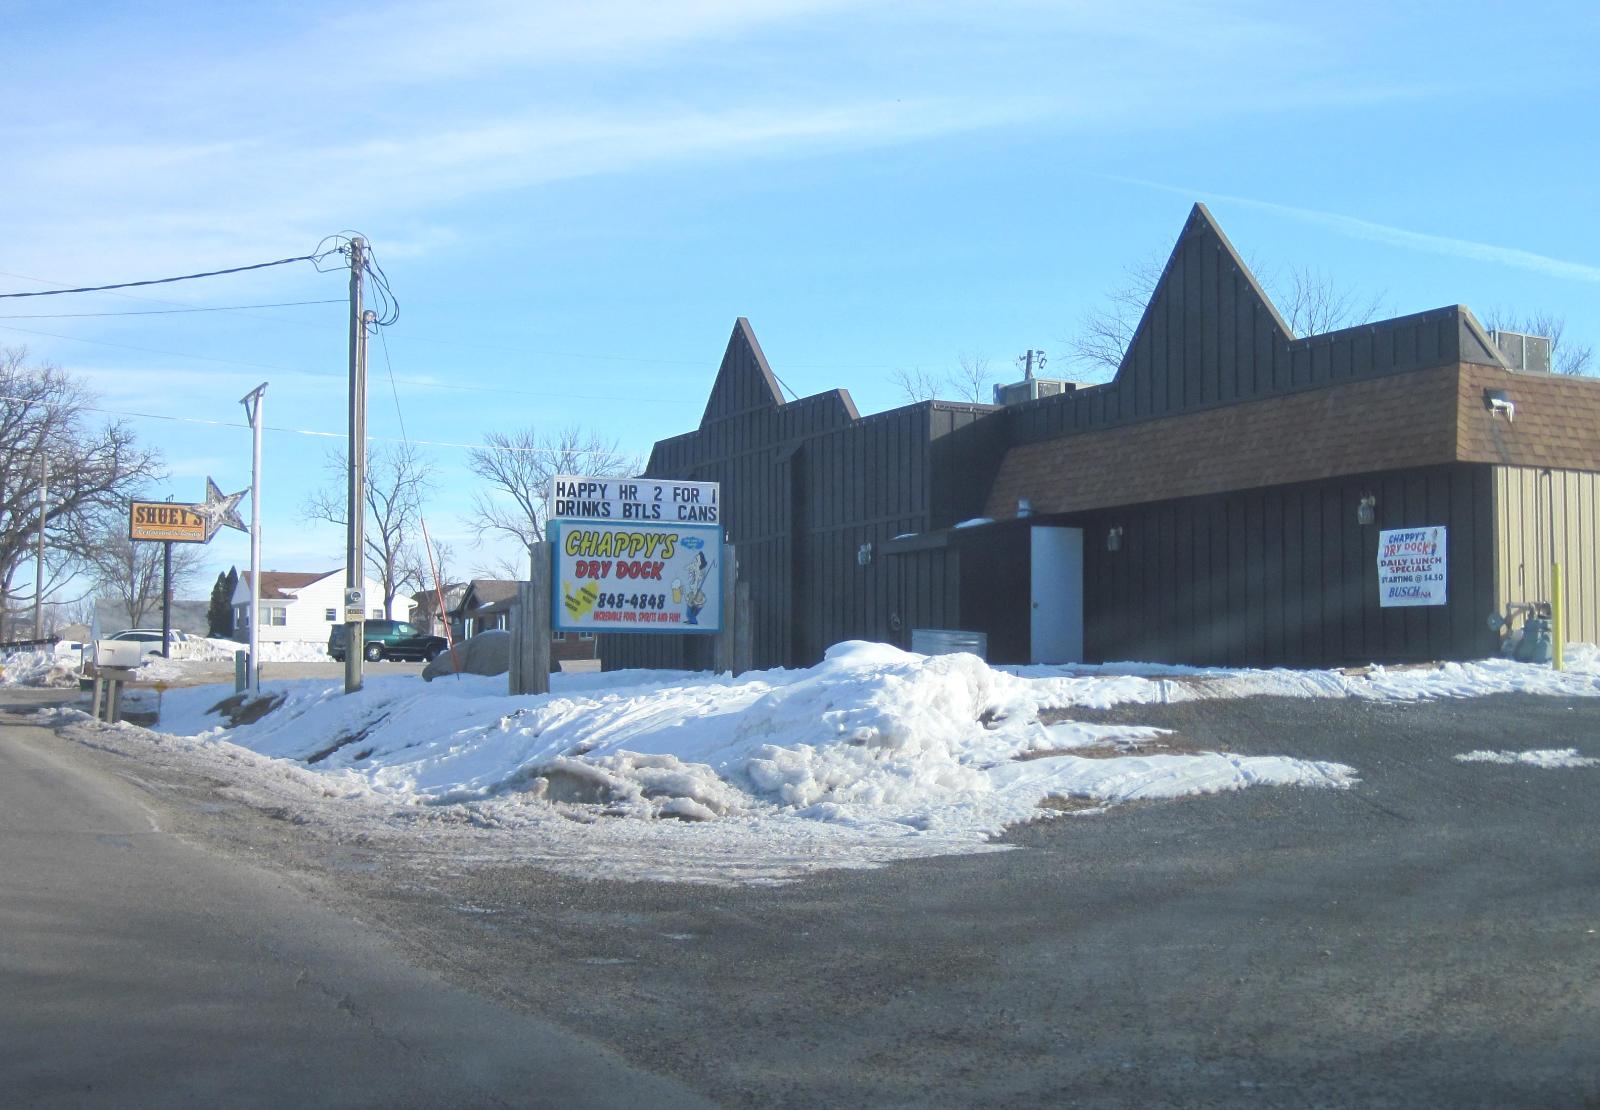
Cumming – Luxury Growth Meets Metro Access
Cumming is a small but fast-developing town in Warren County, southwest of Des Moines. What once was a quiet farming community has become one of the region’s most sought-after luxury housing areas. The town is known for its large custom homes, low-density zoning, and high-end developments such as Great Western Crossing. This master-planned neighborhood has attracted attention for its walkability, modern design, and community focus — rare features for rural Iowa towns. Cumming offers a unique blend of country calm and city convenience, sitting just 20 minutes from downtown Des Moines and near major highways like I-35.
Despite its growth, Cumming has remained committed to a development philosophy that emphasizes quality and sustainability. New construction follows careful design standards, and community amenities are expanding to match demand. Buyers include both local professionals and out-of-state transplants looking for something different — a quiet, upscale environment that still offers access to jobs, healthcare, and culture. Cumming’s commitment to walkable design and long-term planning is helping it stand out among Iowa’s wealthiest communities. With no sign of oversupply and continued interest in high-end housing, Cumming is well-positioned for continued, stable appreciation.
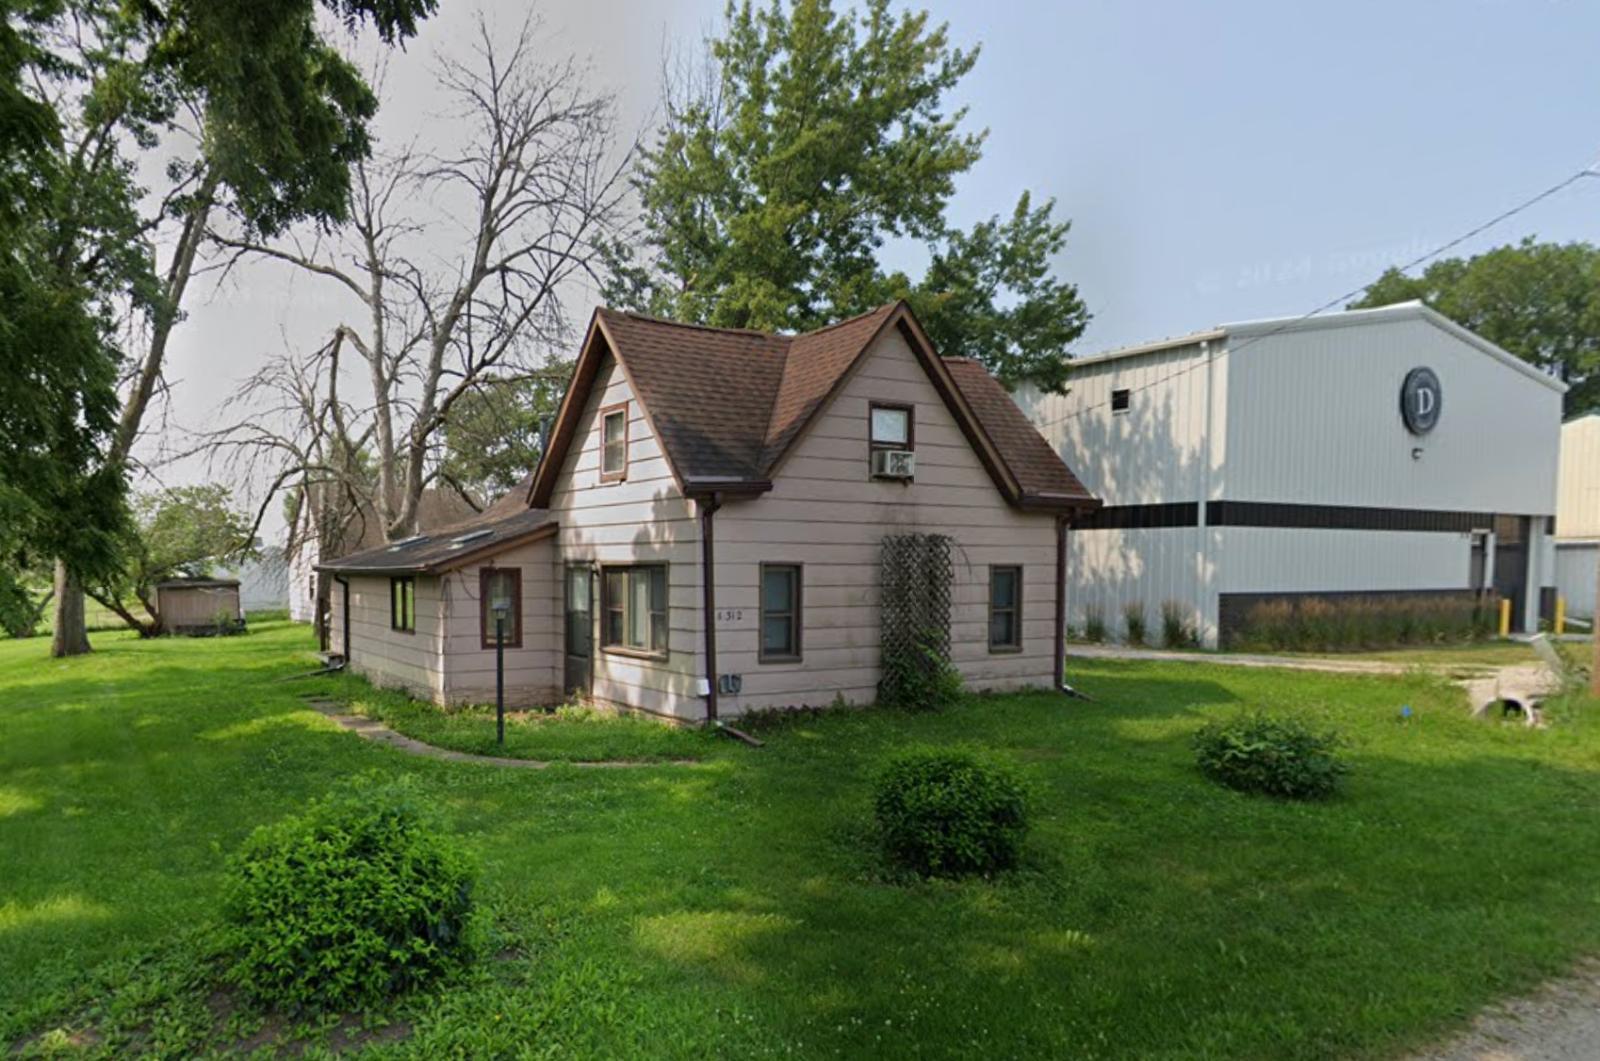
3. Wahpeton – 78% Home Price Increase Since May 2017
- 2010: N/A
- 2011: N/A
- 2012: N/A
- 2013: N/A
- 2014: N/A
- 2015: N/A
- 2016: N/A
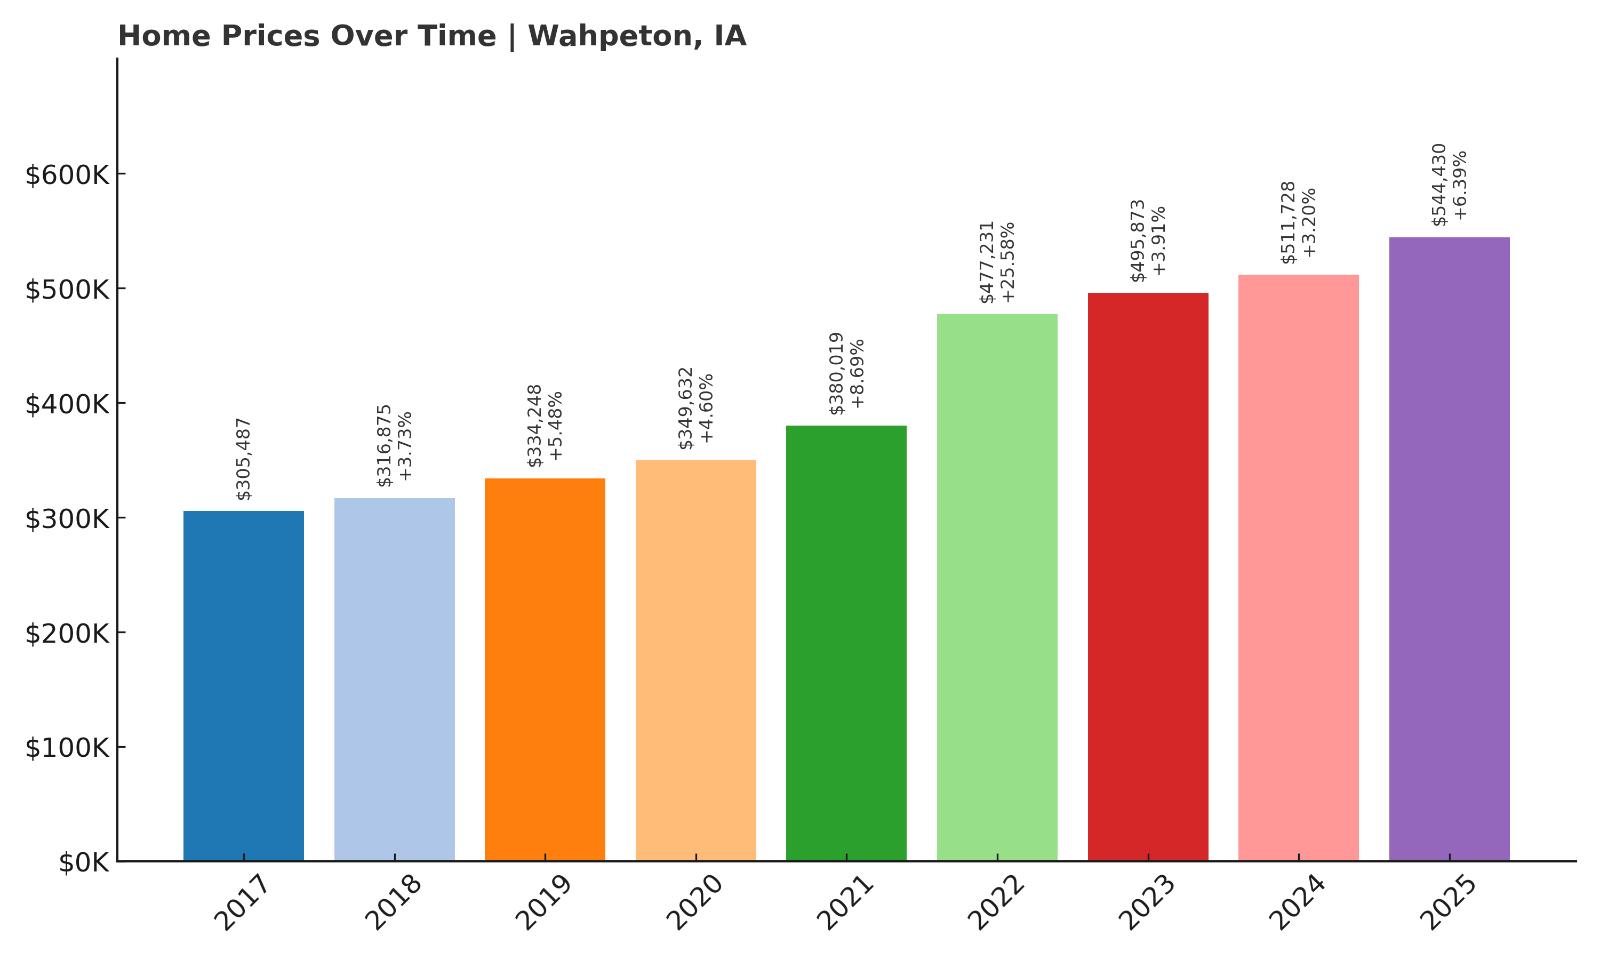
- 2017: $305,487
- 2018: $316,875 (+$11,389, +3.73% from previous year)
- 2019: $334,248 (+$17,372, +5.48% from previous year)
- 2020: $349,632 (+$15,384, +4.60% from previous year)
- 2021: $380,019 (+$30,387, +8.69% from previous year)
- 2022: $477,231 (+$97,213, +25.58% from previous year)
- 2023: $495,873 (+$18,641, +3.91% from previous year)
- 2024: $511,728 (+$15,855, +3.20% from previous year)
- 2025: $544,430 (+$32,702, +6.39% from previous year)
Wahpeton home prices have climbed 78% since 2017, reflecting fast-paced growth over a relatively short period. Between 2021 and 2022 alone, values surged nearly $100,000 — one of the largest single-year gains on this entire list. With consistent year-over-year increases and no market pullbacks, Wahpeton’s housing market has proven both resilient and highly attractive. The 2025 median home value stands at $544,430, significantly above the state average and among the highest in Iowa. Despite having a limited inventory of homes, demand remains robust thanks to the town’s location and its appeal to vacationers and long-term investors alike. Price momentum has remained strong even post-2022, which suggests continued confidence in the market.
Wahpeton – Small Lake Town with Skyrocketing Values
Wahpeton is a quiet lakeside town located in Dickinson County, along the southern edge of West Lake Okoboji. It’s part of the broader Iowa Great Lakes region, which includes some of the highest-valued real estate in the state. With a population under 400, Wahpeton’s charm lies in its exclusivity, natural beauty, and access to one of Iowa’s most treasured recreational lakes. The town offers a mix of seasonal and permanent residences, many of which are waterfront or within walking distance to the lake. High-end builds, limited land availability, and sustained buyer interest have all combined to keep prices elevated and climbing year after year.
Wahpeton’s appeal isn’t just seasonal. More buyers are turning to lake towns for year-round living, drawn by tranquil settings and high quality of life. While its small size limits growth in housing stock, this also keeps competition high for existing properties. The area is well-served by nearby Arnolds Park and Okoboji, which provide shops, restaurants, and attractions that support full-time living. As long as lakefront demand continues — and there’s no sign of that slowing — Wahpeton will likely remain one of Iowa’s top-value towns for years to come. The recent sharp gains suggest a limited market reacting to intense interest, especially among affluent buyers and investors.
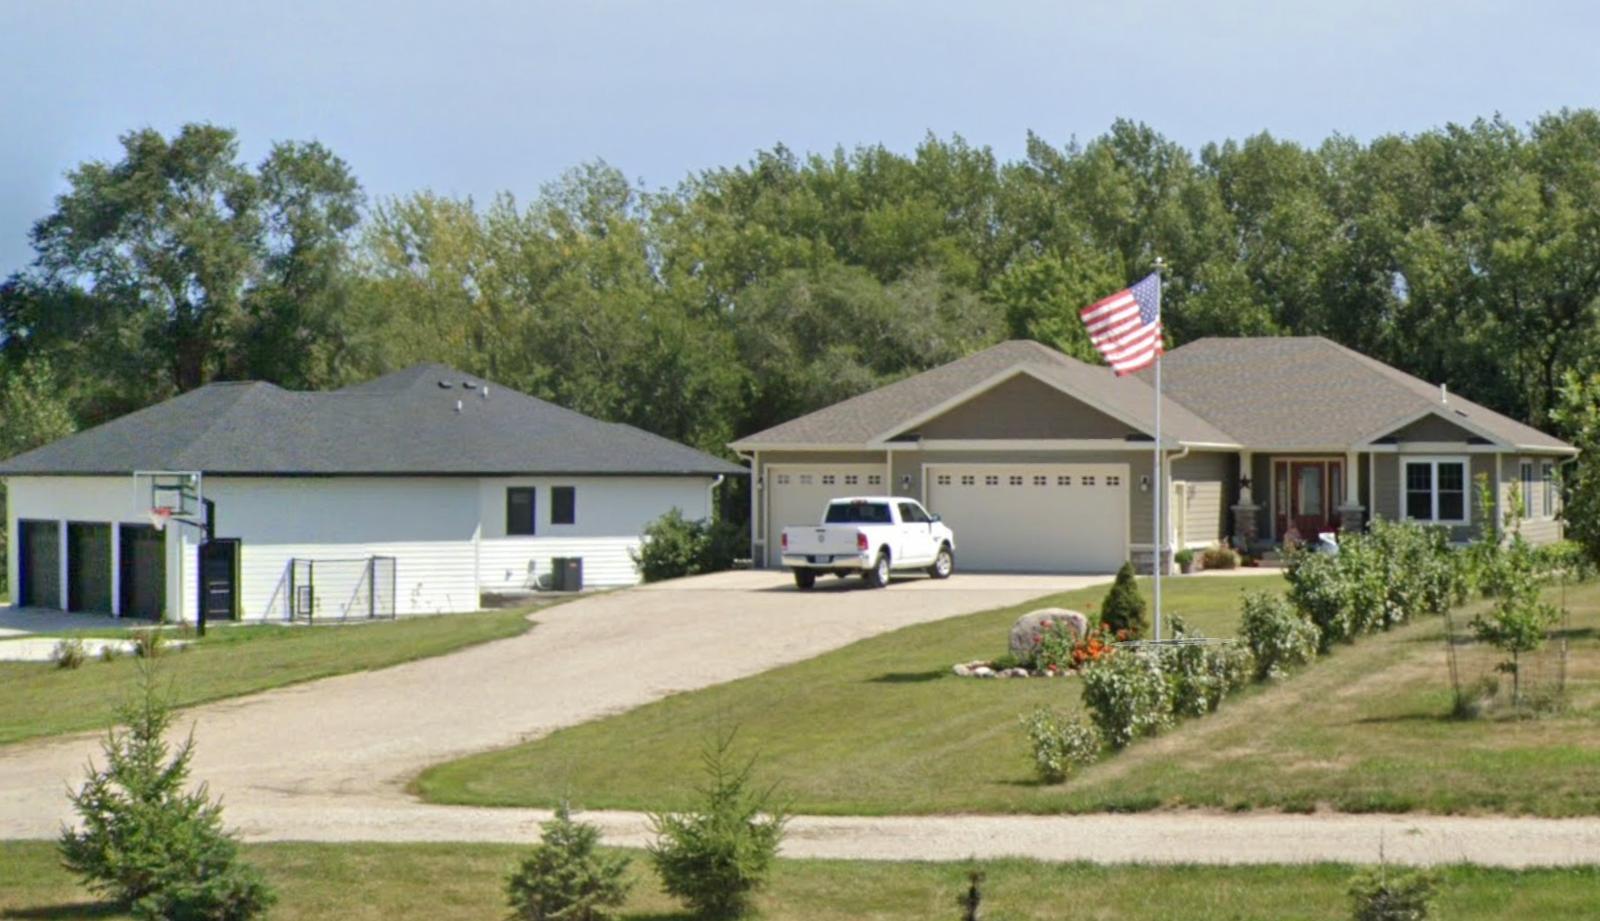
2. Orleans – 248% Home Price Increase Since May 2010
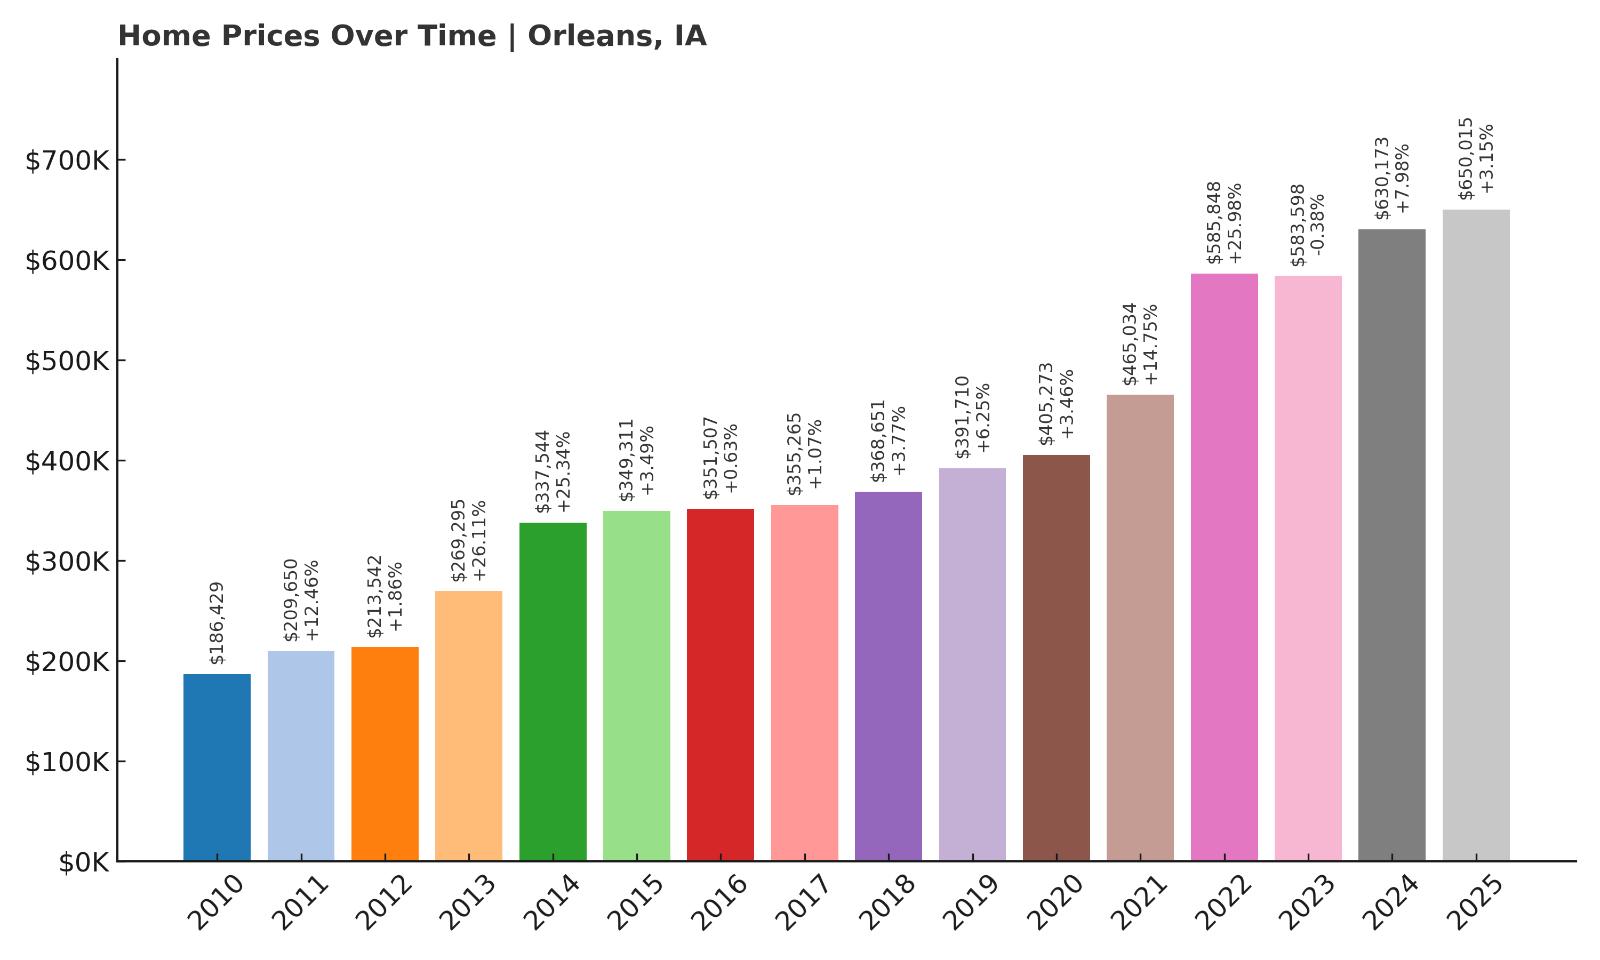
- 2010: $186,429
- 2011: $209,650 (+$23,221, +12.46% from previous year)
- 2012: $213,542 (+$3,892, +1.86% from previous year)
- 2013: $269,295 (+$55,752, +26.11% from previous year)
- 2014: $337,544 (+$68,249, +25.34% from previous year)
- 2015: $349,311 (+$11,767, +3.49% from previous year)
- 2016: $351,507 (+$2,195, +0.63% from previous year)
- 2017: $355,265 (+$3,758, +1.07% from previous year)
- 2018: $368,651 (+$13,387, +3.77% from previous year)
- 2019: $391,710 (+$23,059, +6.25% from previous year)
- 2020: $405,273 (+$13,563, +3.46% from previous year)
- 2021: $465,034 (+$59,761, +14.75% from previous year)
- 2022: $585,848 (+$120,814, +25.98% from previous year)
- 2023: $583,598 (-$2,250, -0.38% from previous year)
- 2024: $630,173 (+$46,575, +7.98% from previous year)
- 2025: $650,015 (+$19,842, +3.15% from previous year)
With a massive 248% increase in home values since 2010, Orleans has seen some of the most explosive price growth in the entire state. The town’s housing market went from a modest $186,429 in 2010 to a staggering $650,015 in 2025. Much of this appreciation came in bursts — particularly during the mid-2010s and the post-pandemic boom — with prices jumping more than $120,000 in 2022 alone. That single-year gain represents one of the most dramatic on this list. Even with a brief pause in 2023, the market rebounded quickly, gaining another $66,000 across the next two years. This suggests a high level of demand paired with constrained inventory. Orleans’ overall trajectory points to sustained long-term value appreciation, even as annual growth fluctuates. Its pricing trend is among the most aggressive in Iowa, putting it well into luxury territory and reflecting its popularity as a lakefront community with limited housing stock.
Orleans – Scenic Shores, Soaring Prices
Orleans is located along the eastern edge of Big Spirit Lake, just north of the more heavily trafficked Okoboji area in Dickinson County. While it doesn’t receive as much tourist buzz as its neighbors, Orleans is known for its calm, residential feel and high-value lakefront properties. The town attracts homeowners who want all the natural beauty of the Iowa Great Lakes region without the traffic and crowds found in surrounding towns. That exclusivity is part of why Orleans has seen such a dramatic rise in home values over the last 15 years. Homes here are typically high-end, and many sit directly on or within walking distance to Big Spirit Lake, Iowa’s largest natural lake.
Real estate in Orleans is dominated by custom builds and renovated seasonal homes, with very few new construction opportunities. This tight inventory keeps pressure on the market and contributes to large price spikes whenever demand surges. The area also benefits from proximity to public beaches, fishing spots, and state parks, which support both year-round living and second-home ownership. Unlike many parts of the state, Orleans caters to a higher-income buyer segment, including retirees and out-of-state investors looking for serene waterfront living. That has made the town resilient to economic fluctuations that may impact other rural Iowa markets. With its pristine setting, limited development, and close proximity to Okoboji amenities, Orleans offers a mix of privacy and access that continues to attract serious interest — and drive serious price growth.
1. West Okoboji – 89% Home Price Increase Since May 2017
- 2010: N/A
- 2011: N/A
- 2012: N/A
- 2013: N/A
- 2014: N/A
- 2015: N/A
- 2016: N/A
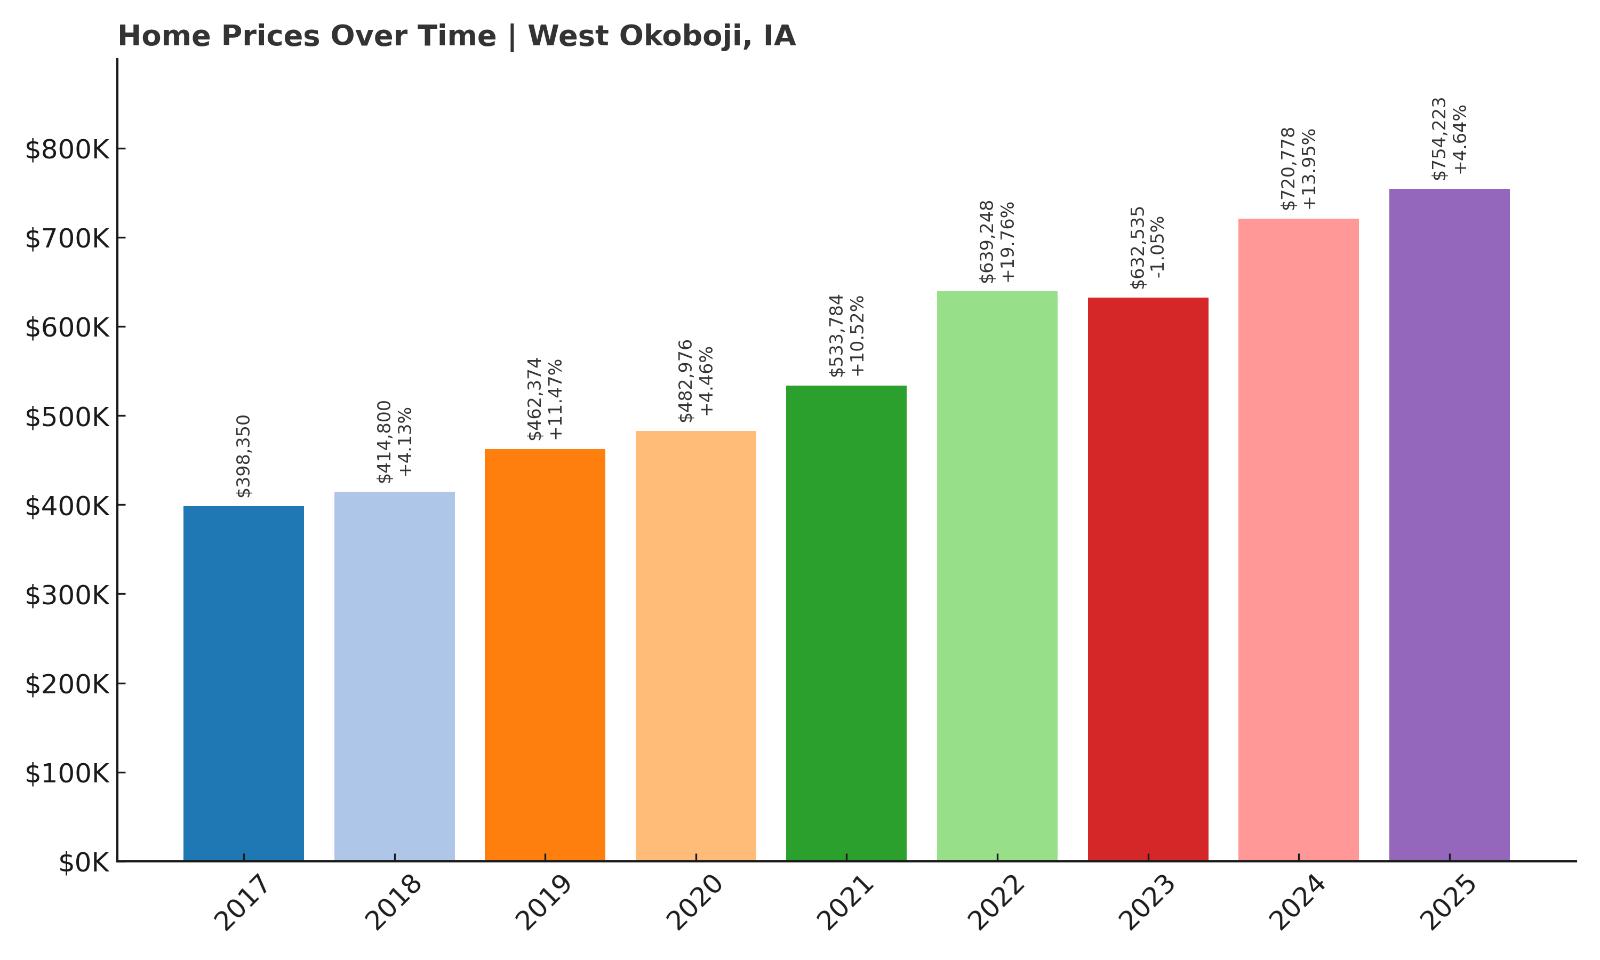
- 2017: $398,350
- 2018: $414,800 (+$16,450, +4.13% from previous year)
- 2019: $462,374 (+$47,574, +11.47% from previous year)
- 2020: $482,976 (+$20,602, +4.46% from previous year)
- 2021: $533,784 (+$50,807, +10.52% from previous year)
- 2022: $639,248 (+$105,465, +19.76% from previous year)
- 2023: $632,535 (-$6,713, -1.05% from previous year)
- 2024: $720,778 (+$88,243, +13.95% from previous year)
- 2025: $754,223 (+$33,444, +4.64% from previous year)
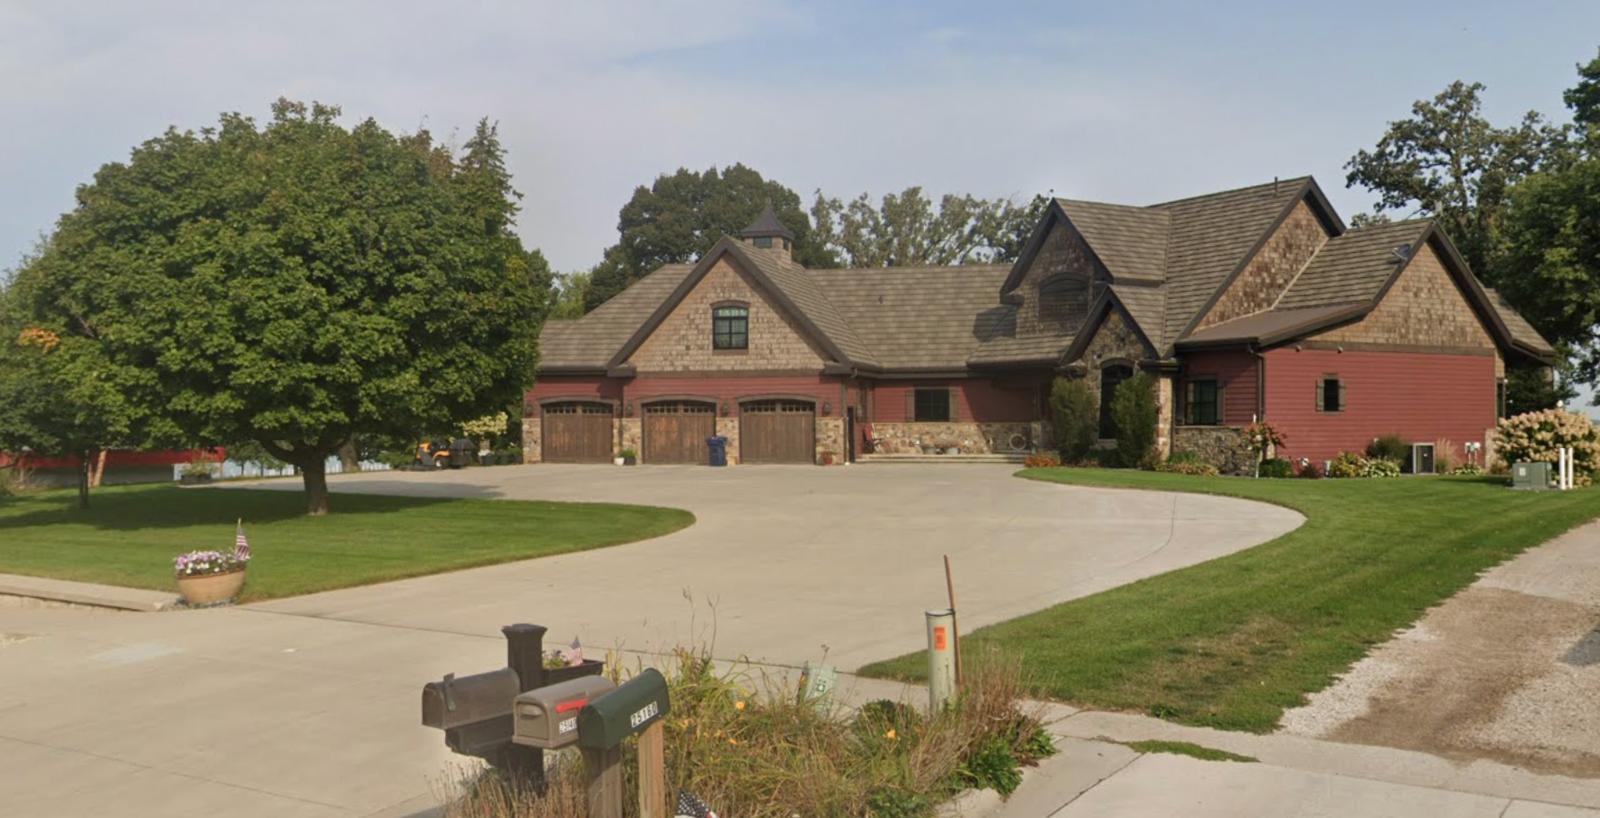
West Okoboji ranks as the most expensive town in Iowa, with home prices reaching $754,223 in 2025 — a massive leap from its $398,350 starting point in 2017. That’s an 89% increase in just eight years, fueled by intense interest in lakefront property and a limited number of homes for sale. The market saw especially sharp appreciation in 2022 and 2024, with gains exceeding $100,000 and $88,000, respectively. Even with a minor decline in 2023, prices rebounded quickly and continued to climb. These swings are a reflection of the town’s high-end, low-supply market dynamics, where even small shifts in inventory can produce major changes in valuation. The overall trajectory shows no sign of a long-term slowdown, making West Okoboji the pinnacle of Iowa luxury real estate. Its market performance stands out not just in Iowa, but also in the broader Midwest lake region.
West Okoboji – Iowa’s Premier Lakefront Real Estate Market
West Okoboji sits at the heart of the Iowa Great Lakes and is widely regarded as the most prestigious location in the state for lakefront living. Its namesake lake, West Lake Okoboji, is a deep, spring-fed body of water prized for its clarity, recreational opportunities, and elite shoreline communities. Properties here are among the most expensive in Iowa, often featuring private docks, panoramic views, and custom architectural design. Unlike surrounding towns with more seasonal homes, West Okoboji caters to high-net-worth buyers who frequently invest in second homes or generational properties. These buyers have pushed the market steadily upward, with price spikes tied closely to limited inventory and strong regional demand.
The town itself is quiet, low-density, and residential by design, with zoning policies that restrict overdevelopment and preserve the exclusivity of the area. That strategy has worked — homes in West Okoboji are now valued well above even high-growth metro suburbs elsewhere in Iowa. While many small towns struggle with affordability or demand volatility, West Okoboji continues to enjoy sustained interest from affluent buyers across the Midwest. Whether it’s for retirement, investment, or vacation, the appeal of the lake — paired with the prestige of a West Okoboji address — ensures ongoing value growth. For those who own here, the combination of lifestyle, scenery, and financial performance makes it one of the most desirable places in Iowa to own property.