Illinois is no stranger to rough weather. The state sits squarely in the battleground between warm, humid Gulf air and cooler, drier Canadian air, with the flat landscape giving storm systems free rein to build and move. Severe thunderstorms are a regular spring and summer feature, bringing damaging winds, hail, flash flooding, and occasionally tornadoes. While every part of Illinois sees storms, some towns are right in the path of the most frequent and intense activity due to their geography, prevailing wind patterns, and proximity to storm-fueling boundaries.
Below are 30 towns where severe thunderstorms are most common, ranked from 30 to 1. Data is based on NOAA Storm Events records, National Weather Service archives, and climatology reports, considering the frequency of severe thunderstorm warnings, hail/wind reports, and historical storm tracks.
In order to come up with the very specific design ideas, we create most designs with the assistance of state-of-the-art AI interior design software.
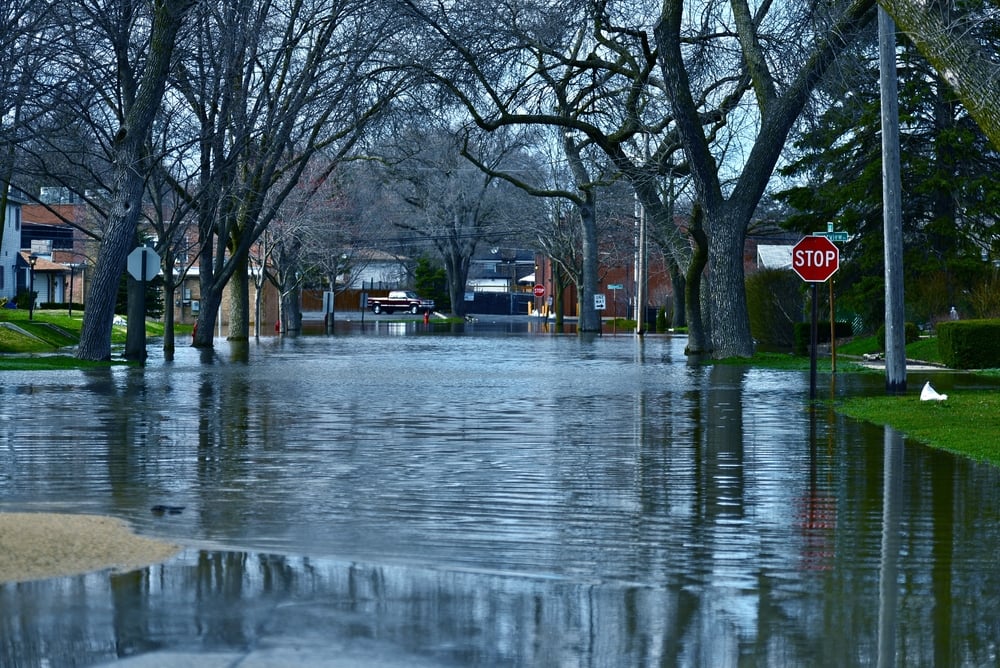
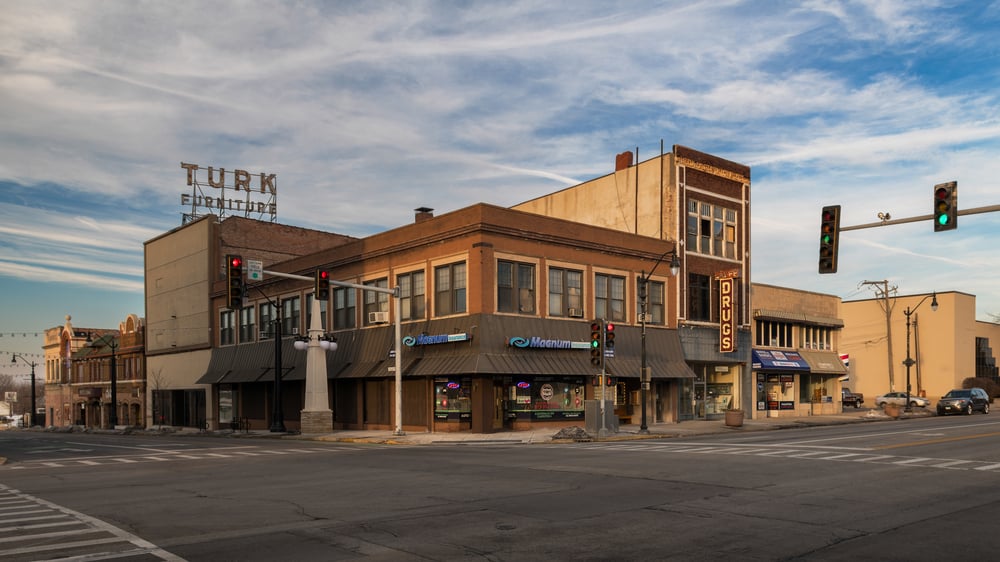
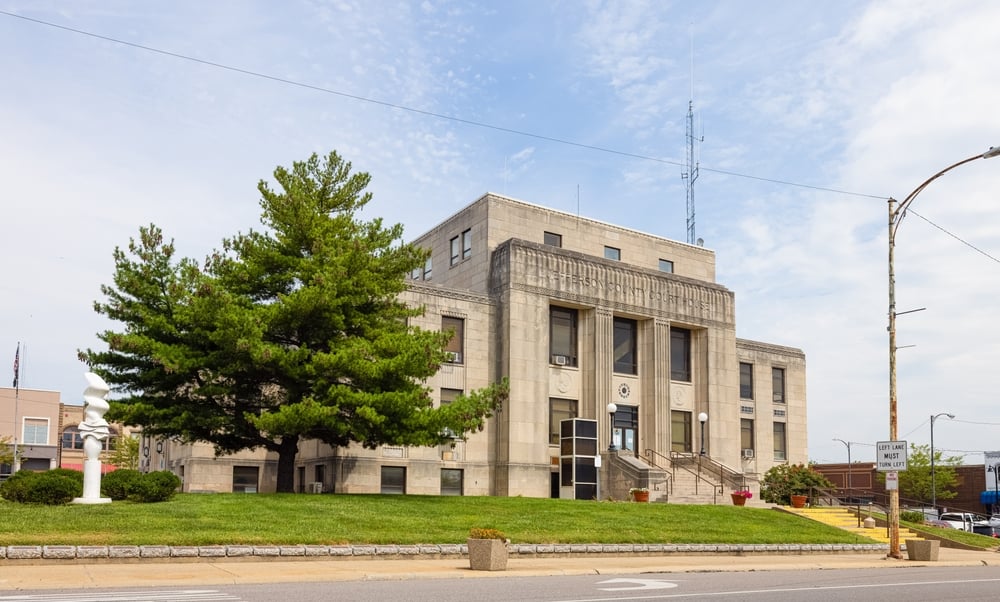
30. Quincy
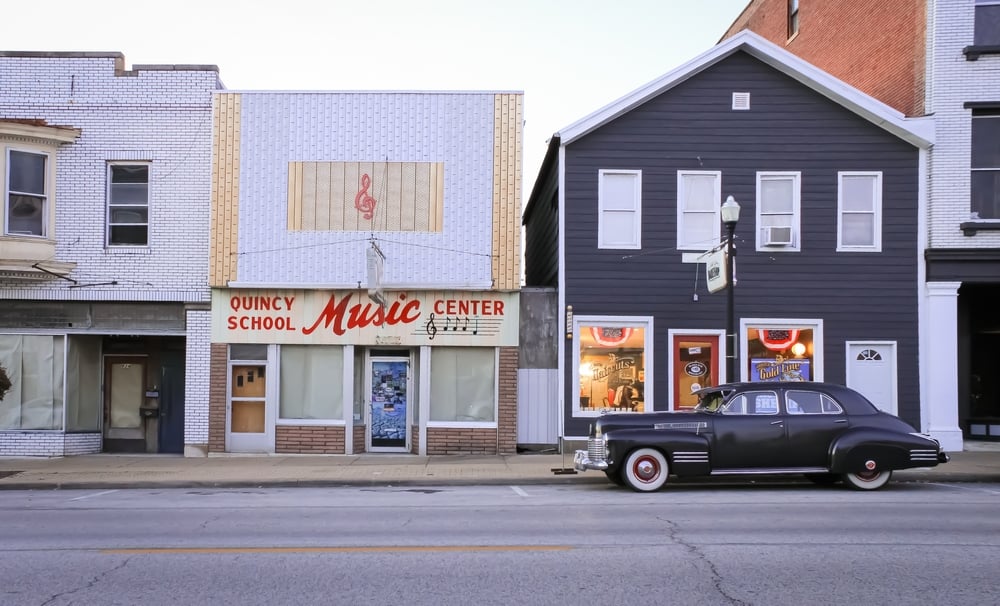
Average severe thunderstorm events per year: 25–28
Location: Western Illinois on the Mississippi River.
Why so many storms: Quincy’s position along the river valley makes it a natural corridor for storm complexes drifting in from Missouri and Iowa. The wide, open floodplain offers no obstructions, so lines of thunderstorms can sweep through quickly with damaging straight-line winds.
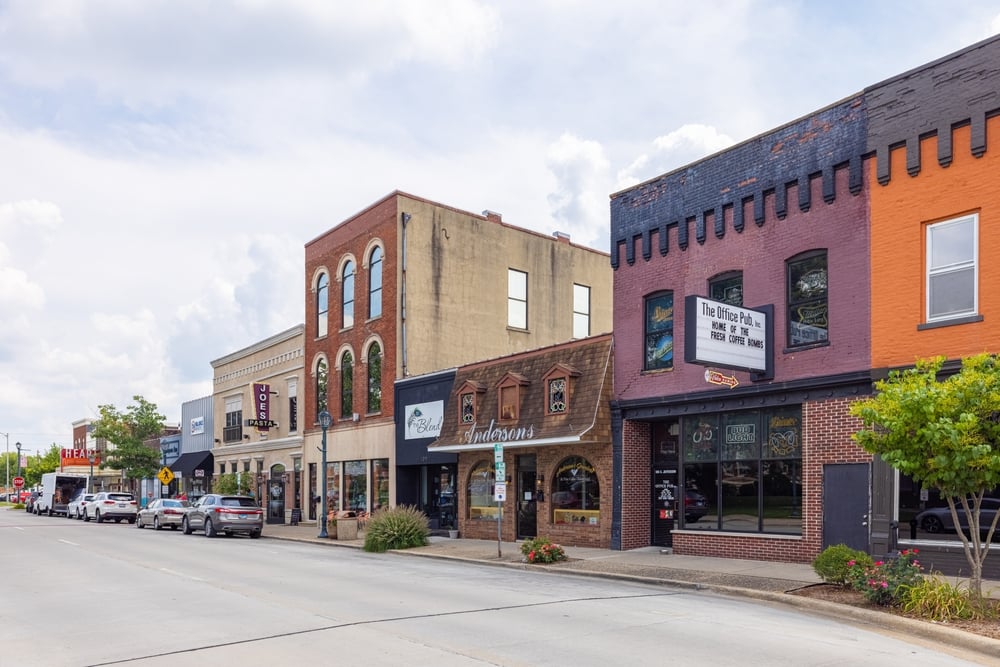
29. Pontiac

Average severe thunderstorm events per year: 26–29
Location: Central Illinois along I-55, north of Bloomington.
Why so many storms: Surrounded by flat farmland, Pontiac is fully exposed to approaching storm systems. It frequently catches fast-moving supercells in spring and bow echoes in summer.
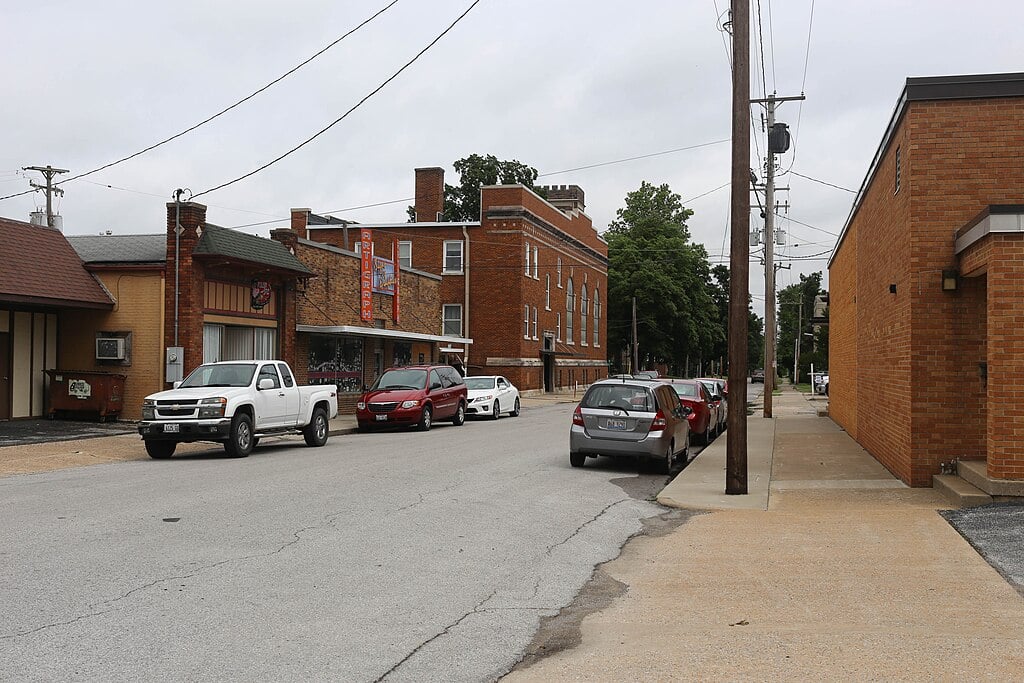
28. Mattoon
Average severe thunderstorm events per year: 27–30
Location: East-central Illinois along I-57.
Why so many storms: Mattoon lies in a zone where warm, moist air from the south meets cooler air from the Great Lakes. This boundary often serves as a focus for severe weather development.
27. Springfield

Average severe thunderstorm events per year: 27–31
Location: Central Illinois, west of I-55.
Why so many storms: As the state capital, Springfield sits in the open plains where frontal boundaries stall. This leads to repeated rounds of storms, some producing hail and localized flooding.
26. Paris

Average severe thunderstorm events per year: 28–31
Location: East-central Illinois near the Indiana border.
Why so many storms: Proximity to the Wabash Valley storm corridor means Paris often sees severe weather clusters drifting in from Indiana or forming overhead.
25. Carlinville
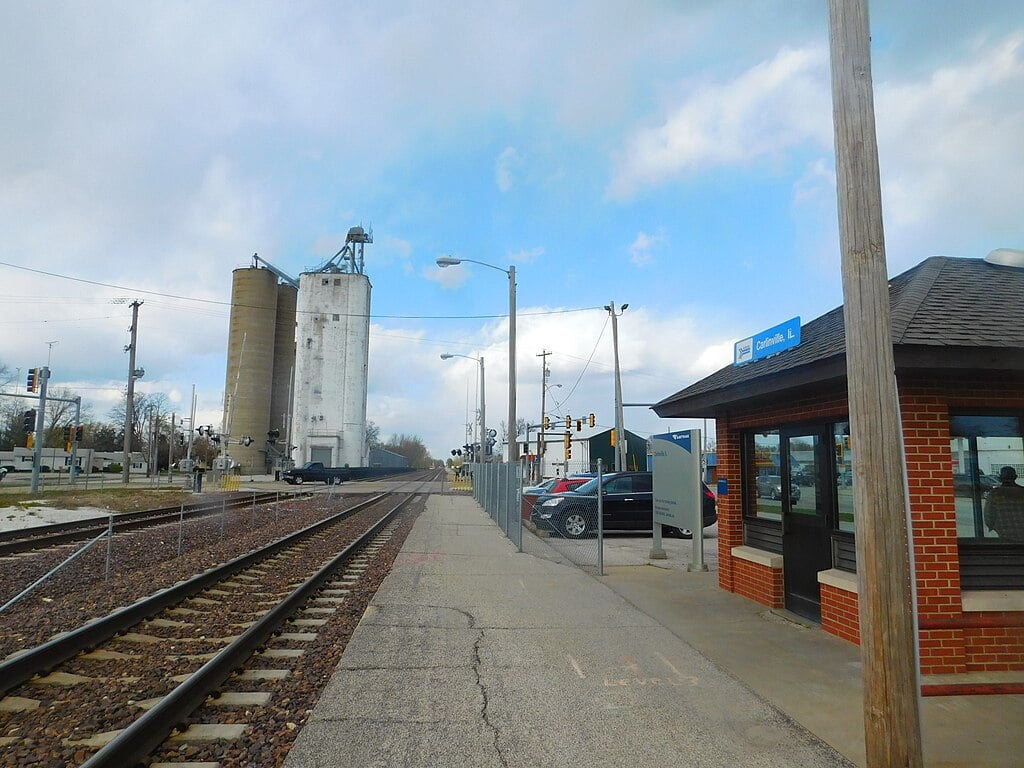
Average severe thunderstorm events per year: 29–32
Location: South-central Illinois between St. Louis and Springfield.
Why so many storms: Carlinville’s location puts it directly under the track of springtime low-pressure systems moving northeast out of the southern Plains.
24. Peoria

Average severe thunderstorm events per year: 29–33
Location: Central Illinois on the Illinois River.
Why so many storms: The river valley here tends to channel storm movement, and Peoria frequently experiences severe lines developing along or just ahead of cold fronts.
23. Vandalia

Average severe thunderstorm events per year: 29–34
Location: South-central Illinois along I-70.
Why so many storms: Vandalia sits in an area that sees both west-to-east moving storm lines and northbound storms from the Ozarks, boosting its annual severe storm count.
22. Kankakee
Average severe thunderstorm events per year: 30–34
Location: Northeastern Illinois south of Chicago.
Why so many storms: Kankakee is often in the path of organized squall lines that race across the state from Iowa, as well as lake-enhanced boundaries that can trigger severe cells.
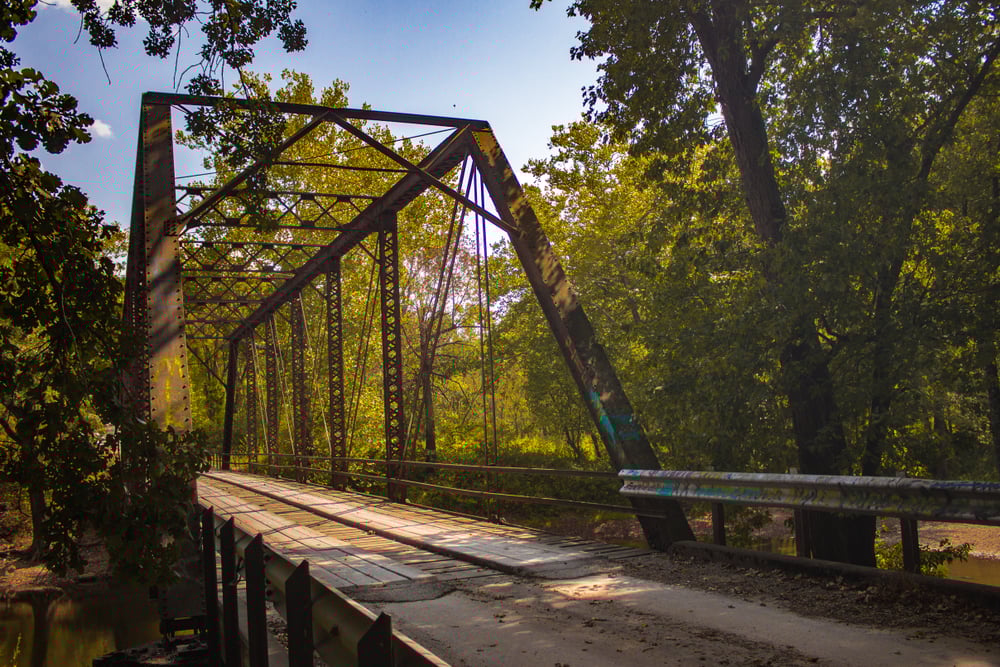
21. Robinson

Average severe thunderstorm events per year: 30–34
Location: Southeastern Illinois near the Wabash River.
Why so many storms: Robinson sits in a favored spot for storm redevelopment along moisture-rich air masses arriving from Kentucky and Tennessee.
20. Litchfield
Average severe thunderstorm events per year: 31–35
Location: South-central Illinois along I-55.
Why so many storms: Positioned between the Mississippi River and the Illinois River valleys, Litchfield is exposed to converging wind patterns that fuel severe convection.
19. Bloomington

Average severe thunderstorm events per year: 31–35
Location: Central Illinois at the junction of I-39, I-55, and I-74.
Why so many storms: The crossroads location often places Bloomington under the path of mesoscale convective systems rolling through overnight in summer.
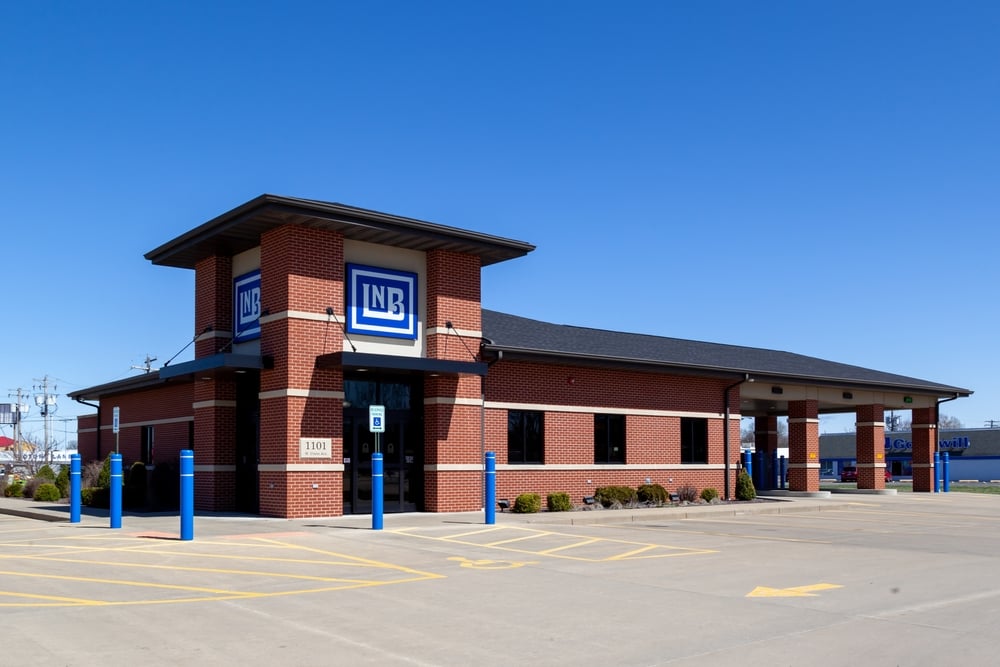
18. Lincoln

🔥 Would you like to save this?
Average severe thunderstorm events per year: 31–35
Location: Central Illinois along I-55, northwest of Springfield.
Why so many storms: Lincoln is in a corridor favored for training storms — repeated cells moving over the same area — leading to both wind damage and flooding events.
17. Macomb

Average severe thunderstorm events per year: 31–36
Location: Western Illinois, inland from the Mississippi River.
Why so many storms: Macomb frequently gets the remnants of organized thunderstorm clusters that form over Kansas and Missouri and travel east into Illinois.
16. Jacksonville

Average severe thunderstorm events per year: 31–36
Location: West-central Illinois between Springfield and the Illinois River.
Why so many storms: The region’s rolling farmland allows strong winds to hit unimpeded, and it often sees hail-producing storms form along cold front boundaries.
15. Charleston
Average severe thunderstorm events per year: 32–36
Location: East-central Illinois near Lake Charleston.
Why so many storms: Charleston’s location east of the Illinois River valley allows it to catch storms traveling along the I-72 and I-70 corridors.
14. Effingham
Average severe thunderstorm events per year: 32–37
Location: South-central Illinois where I-70 meets I-57.
Why so many storms: This intersection of travel corridors mirrors its storm history — Effingham gets systems from multiple directions, increasing severe storm frequency.
13. Galesburg
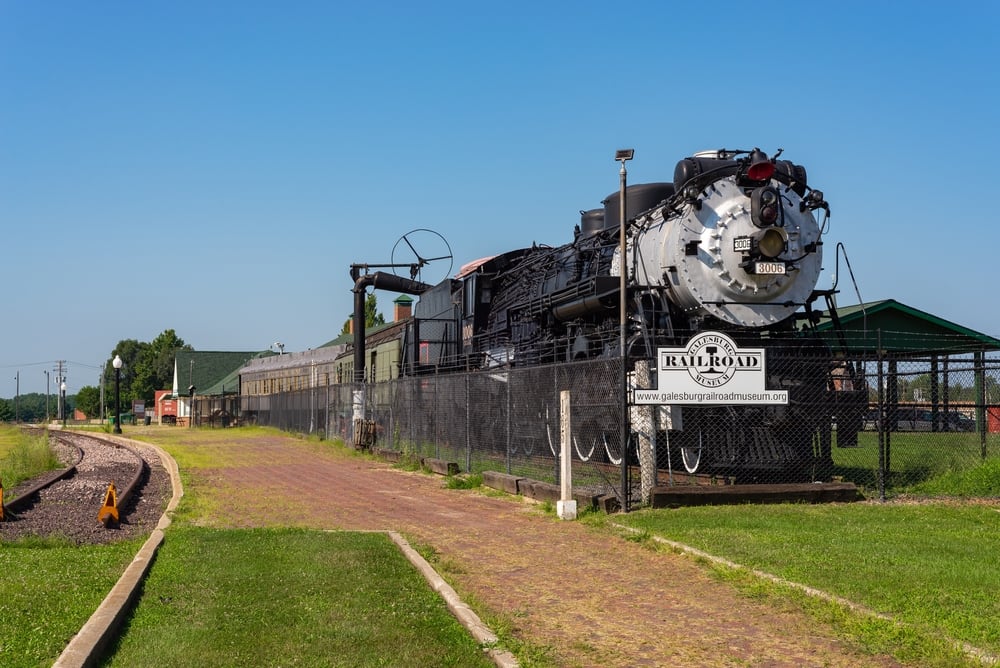
Average severe thunderstorm events per year: 33–37
Location: West-central Illinois along I-74.
Why so many storms: Galesburg is a common waypoint for eastbound derecho events and strong storm complexes moving out of Iowa.
12. Fairfield
Average severe thunderstorm events per year: 33–37
Location: Southeastern Illinois along Illinois Route 15.
Why so many storms: Fairfield lies in a moist air corridor feeding north from the Gulf, making it primed for severe weather when cold fronts approach.
11. Taylorville

Average severe thunderstorm events per year: 33–38
Location: Central Illinois southeast of Springfield.
Why so many storms: Taylorville frequently sees hail and wind events as storms track along a boundary zone that often sets up across central Illinois.
10. Alton
Average severe thunderstorm events per year: 34–38
Location: Southwestern Illinois where the Illinois and Mississippi rivers meet.
Why so many storms: Converging river valleys can locally enhance lift, which helps storm formation. Alton also sits in the corridor for strong complexes from Missouri.
9. Mount Vernon
Average severe thunderstorm events per year: 34–39
Location: Southern Illinois along I-57.
Why so many storms: Mount Vernon is in a sweet spot for severe weather ingredients, with Gulf moisture, frequent frontal passages, and storm tracks from the Ozarks.
8. Belleville
Average severe thunderstorm events per year: 35–40
Location: Southwestern Illinois near St. Louis.
Why so many storms: Belleville benefits from the same storm corridor that fuels St. Louis’s active severe weather season, including hailstorms and high-wind squall lines.
7. Carbondale
Average severe thunderstorm events per year: 35–40
Location: Southern Illinois near the Shawnee National Forest.
Why so many storms: Proximity to the confluence of the Mississippi and Ohio rivers means rich moisture and instability, often producing explosive thunderstorm growth.
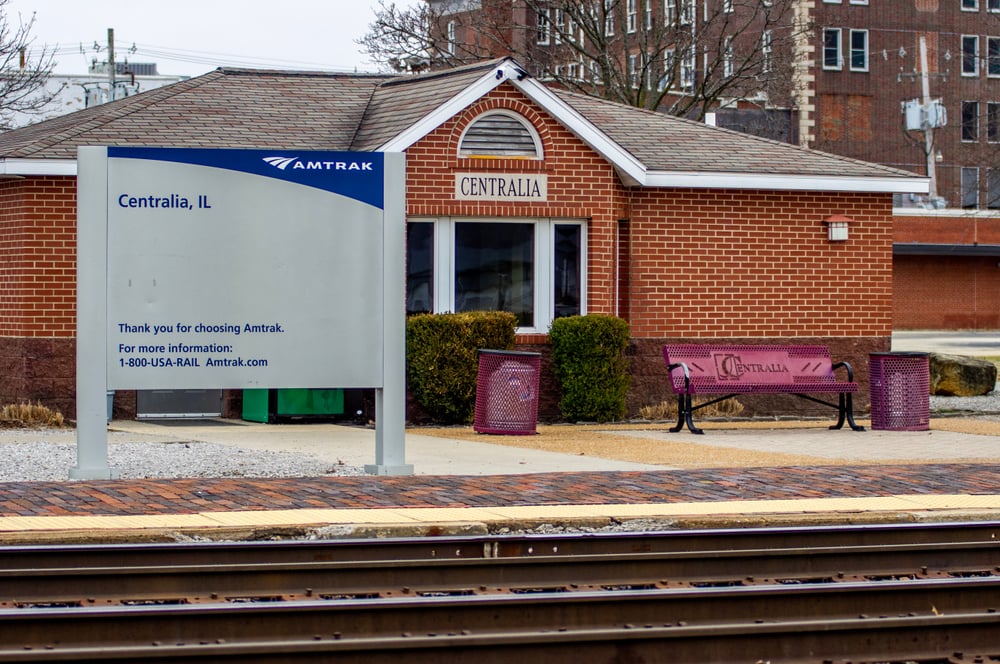
6. Centralia
🔥 Would you like to save this?
Average severe thunderstorm events per year: 35–40
Location: South-central Illinois along I-57.
Why so many storms: Centralia sits in a crossroads of storm tracks from both west and southwest, leading to repeated rounds of damaging winds and hail.
5. Harrisburg
Average severe thunderstorm events per year: 36–41
Location: Southeastern Illinois near the Ohio River.
Why so many storms: Harrisburg’s location near major river valleys and within reach of Gulf moisture makes it a frequent target for severe supercells and lines.
4. Marion
Average severe thunderstorm events per year: 36–41
Location: Southern Illinois along I-57, west of Harrisburg.
Why so many storms: Warm, humid air often pools here ahead of cold fronts, creating ideal conditions for severe thunderstorms with large hail and damaging winds.
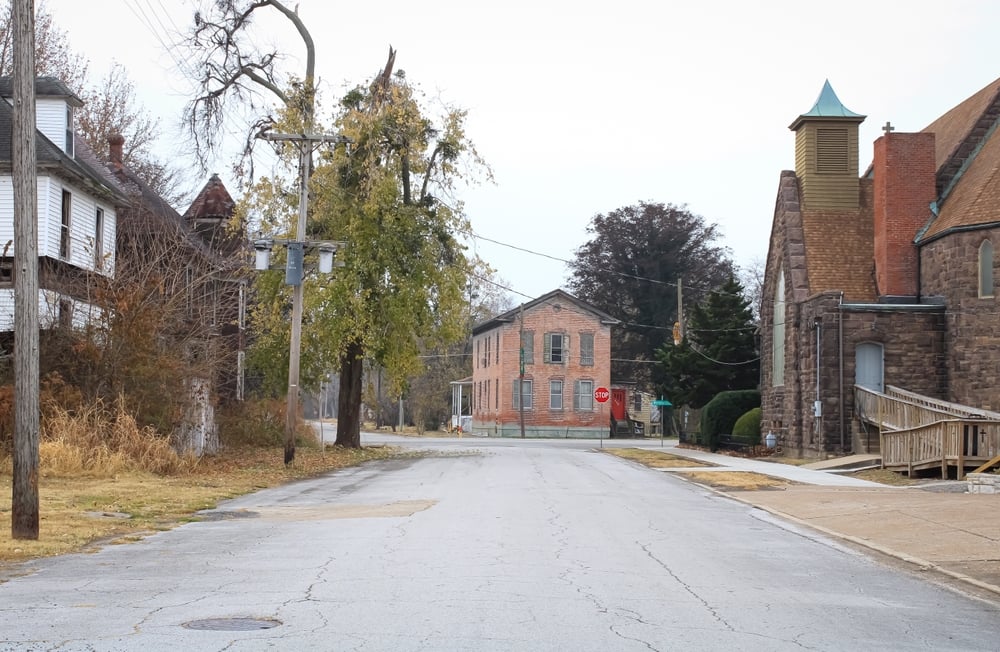
3. Murphysboro
Average severe thunderstorm events per year: 36–42
Location: Southern Illinois along the Big Muddy River.
Why so many storms: Murphysboro’s location west of the Shawnee National Forest exposes it to incoming systems from the Ozarks and Mississippi River Valley.
2. Cairo
Average severe thunderstorm events per year: 37–43
Location: Southern tip of Illinois at the confluence of the Mississippi and Ohio rivers.
Why so many storms: Cairo is surrounded by waterways and sits at a natural convergence zone for storm systems traveling from multiple directions, leading to a high frequency of severe weather.
1. Metropolis
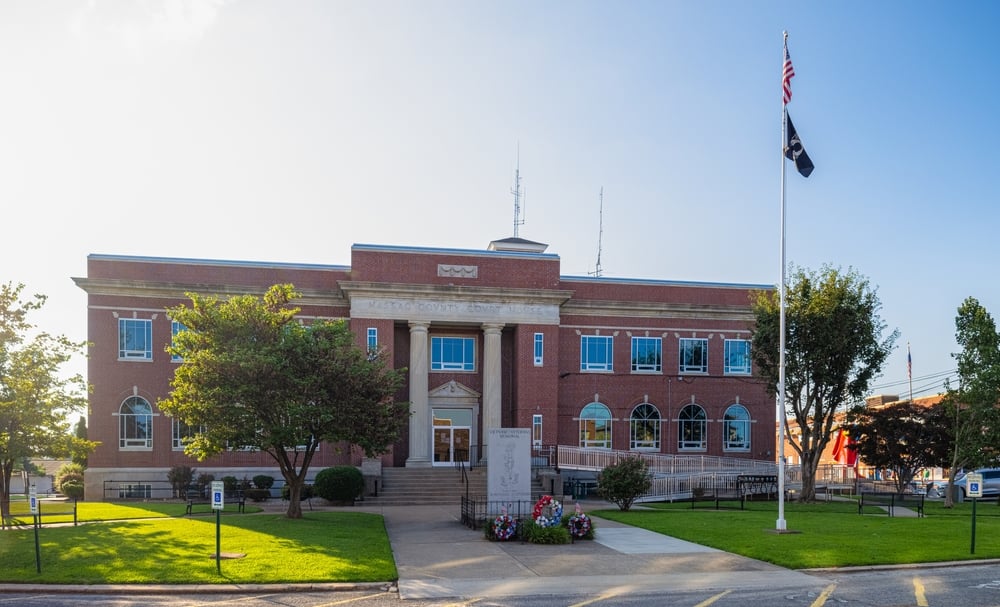
Average severe thunderstorm events per year: 38–44
Location: Southeastern tip of Illinois on the Ohio River.
Why so many storms: Metropolis’ location in the heart of the Ohio River Valley keeps it bathed in Gulf moisture, and incoming cold fronts frequently trigger intense, long-lived thunderstorms.
References
- Illinois Severe Weather Climatology – NOAA NWS Lincoln
- Storm Events Database – NOAA NCEI
- Illinois State Climatologist – Severe Weather Trends
- BestPlaces – Illinois Climate Averages
- U.S. Climate Data – Illinois Cities
- Weather Spark – Average Weather in Illinois Towns
- Climate-Data.org – Illinois
- NOAA SPC – Severe Weather Reports
- Midwestern Regional Climate Center – Illinois Storm Climatology